UNITED STATES
SECURITIES AND EXCHANGE COMMISSION
WASHINGTON, D.C. 20549
| FORM |
| | ANNUAL REPORT PURSUANT TO SECTION 13 OR 15(d) OF THE SECURITIES EXCHANGE ACT OF 1934 |
|
|
|
| For the fiscal year ended | |
|
|
|
| OR | |
|
| |
| | TRANSITION REPORT PURSUANT TO SECTION 13 OR 15(d) OF THE SECURITIES EXCHANGE ACT OF 1934 |
|
| |
| For the transition period from_________to__________ | |
Commission File Number:
(Exact name of registrant as specified in its charter)
| (State or other jurisdiction of incorporation or organization) | (IRS Employer Identification No.) |
|
| |
| (Address of Principal Executive Offices) | (Zip Code) |
|
| |
| | |
| Registrant’s telephone number, including area code Securities registered pursuant to Section 12(b) of the Act: | |
| Title of each class | Trading Symbol | Name of each exchange on which registered |
| | | |
|
| ||
| Securities registered pursuant to Section 12(g) of the Act: None | ||
Indicate by check mark if the registrant is a well-known seasoned issuer, as defined in Rule 405 of the Securities Act
| |
Indicate by check mark if the registrant is not required to file reports pursuant to Section 13 or Section 15(d) of the Act.
| Yes ☐ |
Indicate by check mark whether the registrant: (1) has filed all reports required to be filed by Section 13 or 15(d) of the Securities Exchange Act of 1934 during the preceding 12 months (or for such shorter period that the registrant was required to file such reports), and (2) has been subject to such filing requirements for the past 90 days.
| |
Indicate by check mark whether the registrant has submitted electronically every Interactive Data File required to be submitted pursuant to Rule 405 of Regulation S-T (§232.405 of this chapter) during the preceding 12 months (or for such shorter period that the registrant was required to submit such files).
| |
Indicate by check mark whether the registrant is a large accelerated filer, an accelerated filer, a non-accelerated filer, a smaller reporting company, or “emerging growth company”. See the definitions of “large accelerated filer,” “accelerated filer,” “smaller reporting company” and “emerging growth company” in Rule 12b-2 of the Exchange Act (check one):
| ☒ | ☐ Accelerated filer | ☐ Non-accelerated filer | ☐ Smaller reporting company | ☐ Emerging growth company |
If an emerging growth company, indicate by check mark if the registrant has elected not to use the extended transition period for complying with any new or revised financial accounting standards provided pursuant to Section 13(a) of the Exchange Act.
Indicate by check mark whether the registrant is a shell company (as defined in Rule 12b-2 of the Act).
| Yes |
The aggregate market value of the registrant’s voting and non-voting common stock held by non-affiliates of the registrant on June 30, 2019, the last business day of the registrant’s most recently completed second fiscal quarter was approximately $
As of February 26, 2020, there were
DOCUMENTS INCORPORATED BY REFERENCE
The information required by Part III of this report, to the extent not set forth herein, is incorporated herein by reference from our definitive proxy statement relating to the Annual Meeting of Stockholders to be held in 2020, which definitive proxy statement shall be filed with the Securities and Exchange Commission within 120 days after the end of the annual period to which this report relates.
TABLE OF CONTENTS
SPECIAL NOTE REGARDING FORWARD-LOOKING STATEMENTS
This Annual Report on Form 10-K and the documents incorporated herein by reference contain forward-looking statements that are based on our management’s expectations, estimates, projections, beliefs and assumptions and on information currently available to our management. The forward-looking statements are contained principally in “Item 1. Business,” “Item 1A. Risk Factors” “Item 7. Management’s Discussion and Analysis of Financial Condition and Results of Operations.” and “Item 7A. Quantitative and Qualitative Disclosures About Market Risk”. Forward-looking statements include information concerning our possible or assumed future results of operations, business strategies, technology developments, new product developments, financing and investment plans, competitive position, industry and regulatory environment, effects of acquisition, growth opportunities, and the effects of competition. Forward-looking statements include statements that are not historical facts and can be identified by terms such as “anticipate,” “believe,” “could,” “seek,” “estimate,” “expect,” “intend,” “may,” “plan,” “potential,” “predict,” “project,” “should,” “will,” “would,” or similar expressions and the negatives of those terms.
Forward-looking statements involve known and unknown risks, uncertainties and other factors that may cause our actual results, performance or achievements to be materially different from any future results, performance or achievements expressed or implied by the forward-looking statements. Given these uncertainties, you should not place undue reliance on forward-looking statements. Also, forward-looking statements represent our management’s beliefs and assumptions only as of the date of this filing. Important factors that could cause actual results to differ materially from our expectations include those discussed in Item 1A, Risk Factors, as well as those discussed elsewhere in this Annual Report on Form 10-K:
•
future demand for renewable energy including solar energy solutions;
•
changes to net metering policies or the reduction, elimination or expiration of government subsidies and economic incentives for on-grid solar energy applications;
•
changes in the U.S. trade environment, including the recent imposition of import tariffs;
•
federal, state, and local regulations governing the electric utility industry with respect to solar energy;
•
the retail price of electricity derived from the utility grid or alternative energy sources;
•
interest rates and supply of capital in the global financial markets in general and in the solar market specifically;
•
competition, including introductions of power optimizer, inverter and solar photovoltaic (“PV”) system monitoring products by our competitors;
•
developments in alternative technologies or improvements in distributed solar energy generation;
•
historic cyclicality of the solar industry and periodic downturns;
•
defects or performance problems in our products;
•
our ability to forecast demand for our products accurately and to match production with demand;
•
our dependence on ocean transportation to deliver our products in a cost-effective manner;
•
our dependence upon a small number of outside contract manufacturers and suppliers;
•
capacity constraints, delivery schedules, manufacturing yields, and costs of our contract manufacturers and availability of components;
•
delays, disruptions, and quality control problems in manufacturing;
•
shortages, delays, price changes, or cessation of operations or production affecting our suppliers of key components;
1
•
business practices and regulatory compliance of our raw material suppliers;
•
performance of distributors and large installers in selling our products;
•
our customer's financial stability, creditworthiness, and debt leverage ratio;
•
our ability to retain key personnel and attract additional qualified personnel;
•
our ability to effectively design, launch, market, and sell new generations of our products and services;
•
our ability to maintain our brand and to protect and defend our intellectual property;
•
our ability to retain, and events affecting, our major customers;
•
our ability to manage effectively the growth of our organization and expansion into new markets;
•
our ability to integrate acquired businesses;
•
fluctuations in global currency exchange rates;
•
unrest, terrorism, or armed conflict in Israel;
•
general economic conditions in our domestic and international markets;
•
consolidation in the solar industry among our customers and distributors; and
the other factors set forth under “Item 1A. Risk Factors.” Except as required by law, we assume no obligation to update these forward-looking statements, or to update the reasons actual results could differ materially from those anticipated in these forward-looking statements, even if new information becomes available in the future.
2
PART I
ITEM 1.BUSINESS
Introduction
Established in 2006, SolarEdge developed a DC optimized inverter solution that changed the way power is harvested and managed in photovoltaic, known as PV systems. Our direct current, or DC optimized inverter system maximizes power generation while lowering the cost of energy produced by the PV system, for improved return on investment, or RoI. Additional benefits of the DC optimized inverter system include providing comprehensive and advanced safety features, improved design flexibility, and improved operating and maintenance, or O&M with module-level and remote monitoring. The typical SolarEdge optimized inverter system consists of our inverters, power optimizers, a communication device which enables access to a cloud based monitoring platform and in many cases, additional smart energy management solutions. Our solutions address a broad range of solar market segments, from residential solar installations to commercial and small utility‑scale solar installations. Since we began commercial shipments in 2010, we have shipped approximately 16.2 gigawatts (“GW”) of our DC optimized inverter systems and our products have been installed in solar PV systems in 133 countries.
Since introducing the optimized inverter solution in 2010, SolarEdge has expanded its activity to other areas of smart energy technology, both through organic growth and through acquisitions. By leveraging world-class engineering capabilities and with a relentless focus on innovation, SolarEdge now offers energy solutions which include not only residential, commercial and large scale PV systems but also product offerings in the areas of energy storage systems, or ESS, and backup, electric vehicle, or EV components and charging capabilities, home energy management, grid services and virtual power plants, lithium-ion batteries and uninterrupted power supply, known as UPS solutions.
Our technology and system architecture are protected by 179 awarded patents and 247 patent applications filed worldwide as of December 31, 2019. We also have protection for some of our battery-related technology through Kokam with 151 awarded patents and 5 pending applications. In addition, we have patents related to our e-mobility solutions through SMRE and its subsidiary I.E.T spa with 18 awarded patents and 14 patent applications world-wide.
We primarily sell our products indirectly to thousands of solar installers through large distributors and electrical equipment wholesalers and directly to large solar installers and engineering, procurement, and construction firms (“EPCs”). Our customers include leading providers of solar PV systems to residential and commercial end users, key solar distributors and electrical equipment wholesalers as well as several PV module manufacturers that offer PV modules with our power optimizer physically embedded into their modules.
The PV industry is surveyed by IHS, Market, an analytics company, that ranked SolarEdge as the top PV inverter supplier world-wide, by revenues and the top single phase PV inverter supplier world-wide based on MegaWatt shipments, as of their published “IHS PV Inverter Market Tracker Q3, 2019”. As of December 31, 2019, we have shipped in the aggregate approximately 49.9 million power optimizers and 2.1 million inverters. More than 1.38 million PV installations, many of which may include multiple inverters, are currently connected to, and monitored through, our cloud based monitoring platform.
As part of our non-organic growth, we have completed three acquisitions during 2018 and 2019, each of which address our growth in the area of smart energy technology and power optimization.
In July 2018, we acquired the assets of a business for the development, manufacturing and sale of UPSs, for the aggregate amount of $12.1 million. We purchased substantially all of the assets of Gamatronic Electronic Ltd.’s (“Gamatronic”), including its intellectual property, brand and tangible assets. In October 2018, we also purchased the shares of Gamatronic (UK) Limited, a UK wholly owned subsidiary of Gamatronic responsible for the sale of these UPS products in the UK for approximately $1.0 million, net of cash acquired (jointly the “Gamatronic Acquisition”).
In October 2018, we closed an acquisition (the “Kokam Acquisition”) of 74.5% of Kokam Co., Ltd. (“Kokam”), a provider of Lithium-ion cells, batteries and energy storage solutions for approximately $82.5 million USD, net of cash acquired. Since the Kokam Acquisition and to date, we have increased our shareholdings in Kokam to 100% at a cost of approximately $21 million. Headquartered in South Korea, Kokam was founded in 1989, and has been manufacturing lithium-ion cells and providing reliable, safe, high-performance solutions for the past twenty-nine years. Kokam provides battery solutions for a wide-variety of industries, including ESS, UPS, EV, and the marine market.
In January 2019, we completed the acquisition (the “SMRE Acquisition”) of a majority stake (approximately 57%) of S.M.R.E. Spa (“SMRE”) for a total of approximately $73 million, net of cash acquired, out of which approximately $42 million was paid in cash and approximately $35 million was paid in shares of SolarEdge common stock. Since the SMRE Acquisition and as of December 31, 2019, we have increased our shareholdings in SMRE to approximately 99.9% at a cost of approximately $67 million. Founded in 1999 and headquartered in Italy, SMRE provides innovative integrated powertrain technology and electronics for light goods vehicles and light commercial vehicles, as well as for e-motorcycles . SMRE has more than fifteen years of experience developing end-to-end e-Mobility solutions for electric and hybrid vehicles used in motorcycles, commercial vehicles and trucks. These solutions include integrated, high-performing powertrains with e-motor, motor drive, gearbox, battery, BMS, chargers, vehicle control unit sand software for electric vehicles.
3
Limitations of Traditional PV System Technologies and the Value Proposition of Our Optimized Inverter Technology
Historically, the solar PV industry used traditional string and central inverter architectures to harvest PV solar power. However, traditional inverter architectures result in energy losses as well as systemic challenges in design flexibility, safety, and monitoring. Over the years, microinverter technology was introduced in an attempt to resolve these challenges, but this technology has certain inherent limitations. We believe that our DC optimized inverter system, consisting of an inverter and distributed power optimizers, best addresses all of these challenges.
Our system allows for superior power harvesting and module management relative to traditional inverter systems by deploying power optimizers at each PV module while maintaining a competitive system cost by keeping the AC inversion and grid interaction centralized using a simplified DC‑AC inverter. The entire system is monitored through our cloud‑based monitoring platform that enables reduced system O&M costs. Our system enables each PV module to operate at its own maximum power point, known as MPP, rather than a system‑wide average, enabling dynamic response to real‑world conditions, such as atmospheric conditions, PV module aging, soiling and shading and offering improved energy yield relative to traditional inverter systems. In addition to higher efficiency, our system’s installed cost per watt is competitive with traditional inverter systems of leading manufacturers and generally, lower than comparable microinverter systems of leading manufacturers. Furthermore, our architecture allows for complex rooftop system designs, reliability and enhanced safety capabilities which meets applicable safety regulations, known as rapid shutdown in the United States.
Traditional Inverter Architecture. A solar PV system consists of PV modules, which produce direct current (“DC”) power when exposed to sunlight; an inverter, which transforms the DC power into alternating current (“AC”) power that is required by the electricity grid; and associated cabling, fuse boxes and mounting hardware. Traditionally, solar PV systems connected strings of solar PV modules to one or more inverters for this energy conversion.
Traditional inverter architecture still constitutes the vast majority of the PV inverter market, especially for larger commercial and utility installations. However, traditional inverter architecture suffers from significant inefficiencies leading to suboptimal power generation. These challenges include:
•
Module mismatch. Traditional inverter systems are unable to consistently produce maximum energy from PV modules. Each PV module in a system has a unique power production profile driven by differences in manufacturing and installation parameters. The architecture of traditional inverter systems does not allow each PV module to operate at its unique MPP. When PV modules are wired in series in a traditional inverter architecture, the entire string’s output is reduced, sometimes correlated directly to the output of the lowest‑performing PV module on the string. Output reduction can result from subtle variations in PV module composition, atmospheric conditions, soiling, individual PV module locations and orientations, or varying levels of PV module degradation over time.
•
Partial shading. Many real‑world factors can cause a subset of the PV modules in a system to be partially shaded, which can significantly affect the power output of the entire string. For instance, electric wires, a chimney or even adjacent solar panels may cast a shadow during particular hours of the day, or debris may accumulate. This partial shading reduces the yield of a traditional solar PV system by decreasing, or in extreme cases eliminating, power output from the shaded modules. Overall losses to system production from such partial shading can range from small to substantial.
•
Dynamic maximum power point tracking loss. The MPP of a PV module shifts constantly throughout the day as a result of atmospheric conditions. A traditional inverter system’s inability to coordinate output on a module‑by‑module basis makes it difficult for the system to respond dynamically to the shifting MPP. This inability to respond to the shifting MPP can reduce the potential power output of a traditional solar PV system by 3‑10%.
In addition to power losses, the traditional inverter architecture also has system design, installation and operational challenges, including:
•
Rooftop system design complexities. A traditional inverter system requires each string to be of the same length, use the same type of PV modules and be positioned at the same angle toward the sun. Consequently, rooftop asymmetries and obstructions result in either wasted roof space or inefficient duplication of system components.
•
Safety hazards. Traditional inverter systems cannot shut down the DC output voltage at the PV module level. The DC cables from these modules carry high voltages as long as the sun is shining, even when the traditional inverter or the grid connection has been shut down. This poses serious risks to installers, fire fighters and anyone else who performs work on or around the installation. Such safety hazards have recently prompted heightened safety installation and operation procedures and regulations in a growing number of geographies, compliance with which increases the cost of traditional PV systems.
•
No module level monitoring. A traditional inverter system cannot track power output, temperature or any other attribute of a single PV module. Consequently, a system operator cannot perform remote diagnostics, track performance of PV system components or receive alerts about individual PV module status, and may be unaware of specific module‑level problems or breakdowns.
4
The first generation of module level power electronics (“MLPE”) was the microinverter. This technology scaled down the traditional inverter to a size and power appropriate to a single PV module. By creating control and monitoring at the module level, microinverters solved certain challenges of the traditional inverter system architecture. However, microinverter architecture has its own limitations, such as:
•
Higher initial cost per watt and limited economies of scale. Microinverters perform all the functionality of the traditional inverter, but at each PV module, and consequently a microinverter system has a higher initial upfront cost of components relative to traditional inverter architecture. In addition, as every PV module must have its own microinverter, the cost per watt of a microinverter system does not decrease with scale. As such, microinverters are generally more expensive than traditional inverter systems on a cost per watt basis for residential installations and not economically viable relative to traditional inverter systems for large commercial and utility installations.
•
Energy Storage. PV solar energy systems are increasingly being paired with batteries either to offer backup functionalities due to grid instability or to provide increased self-consumption with the evolution of subsidies. This is leading to the inverter becoming an important factor in managing and controlling energy storage. Batteries store energy only in its DC form, but due to their architecture, standard string inverters and microinverters require multiple inversions from DC to AC and then back to DC power before storing energy into the battery. This not only results in energy loss during the conversion process, but also means the inverter acts as a bottleneck and limiting factor for energy storage.
•
Grid Code Compliance. With the growing penetration of solar energy, many utilities in individual U.S. states and Europe have adopted new sets of grid codes to preserve the stability of the electric grid. These grid codes require solar PV inverters to respond dynamically to variances in grid‑wide voltage, which typically requires inverter hardware and software to be reengineered. In most cases, adaptation to these new grid codes would require added costs and complexities, limiting the ability of microinverters to address some markets.
The SolarEdge Solution. Our DC optimized inverter system maximizes power generation at the individual PV module level while lowering the cost of energy produced by the solar PV system and providing comprehensive and advanced safety features. Our solution consists of inverters, power optimizers, a communication device which enables access to our cloud based monitoring platform and addresses a broad range of solar market segments, from residential solar installations to commercial and small utility‑scale solar installations. Additional smart energy features and hardware that can be added to our solution includes a battery pack for storage of energy and a home energy automation system which enables greater savings for the system owner.
The key advantages of our solution include:
•
Maximized PV module power output. Our power optimizers provide module‑level MPP tracking and real‑time adjustments of current and voltage to the optimal working point of each individual PV module. This enables each PV module to continuously produce its maximum power potential independent of other modules in the same string, thus minimizing module mismatch and partial shading losses. By performing these adjustments at a very high rate, our power optimizers also solve the dynamic MPP losses associated with traditional inverters.
•
Optimized architecture with economies of scale. Our system shifts certain functions of the traditional inverter to our power optimizers while keeping the DC to AC function and grid interaction in our inverter. As a result, our inverter is smaller, more efficient, more reliable and less expensive than inverters used in traditional inverter systems. The cost savings that we have achieved on the inverter enable our system to be priced at a cost per watt that is comparable with traditional inverter systems of leading manufacturers. As a PV system grows in size, our inverter benefits from economies of scale, making our technology viable for large commercial and utility‑scale applications.
•
Enhanced system design flexibility. Unlike a traditional inverter system that requires each string to be the same length, use the same type of PV modules and be positioned at the same angle toward the sun, our system allows significant design flexibility by enabling the installer to place PV modules in uneven string lengths and on multiple roof facets. This design flexibility:
•
increases the amount of the available roof that can be utilized for power production. Unlike traditional inverter systems, our system does not require each string to be the same length, use the same type of PV modules or be positioned at the same angle toward the sun. As a result, our system is significantly less prone to wasted roof space resulting from rooftop asymmetries and obstructions.
•
reduces the number of field change orders. For example, some installers use remote tools to estimate the size and configuration of an installation in connection with the customer acquisition process. This is especially common for high‑volume residential arrays, where an exhaustive survey of rooftop obstructions would be uneconomical. In some cases, installers discover that their preliminary design, based on remote tools, cannot be implemented due to unexpected shading or other obstructions. With traditional inverter system designs, an obstructed module may require a significant system redesign and a modification of the customer contract to take into account the changed system design. Our DC optimized inverter solution enables an installer to compensate or adjust for most obstructions without materially changing the original design or requiring a modification to the customer contract.
5
•
Reduced balance of system costs. Our DC optimized inverter system allows significantly longer strings to be connected to the same inverter (as compared to a traditional inverter system). This minimizes the cost of cabling, fuse boxes and other ancillary electric components. These factors together result in easier installation with shorter design times and a lower initial cost per watt, while enabling larger installations per rooftop.
•
Continuous monitoring and control to reduce operation and maintenance costs. Our cloud‑based monitoring platform provides full data visibility at the module level, string level, inverter level and system level. The data can be accessed remotely by any web‑enabled device, allowing comprehensive analysis, immediate fault detection and alerts. These monitoring features reduce O&M costs for the system owner by identifying and locating faults, enabling remote testing and reducing field visits.
•
Enhanced safety. We have incorporated module‑level safety mechanisms in our system to protect installers, electricians and firefighters. Each power optimizer is configured to reduce output to 1 volt unless the power optimizer receives a fail‑safe signal from a functioning inverter. As a result, if the inverter is shut down (e.g., for system maintenance, due to malfunction, in the event of a fire or otherwise), the DC voltage throughout the system is reduced to a safe level. Our DC optimized inverters comply with the applicable safety requirements of the areas in which they are sold, providing incremental cost savings to installers by eliminating the need for additional hardware such as DC breakers, switches or fire‑proof ducts required by traditional inverter systems. In the U.S., the SolarEdge SafeDC feature is compliant with NEC 2014 & NEC 2017 Rapid Shutdown functionality, section 690.12. SolarEdge inverters also have a built-in protection designed to mitigate the effects of some arcing faults that may pose a risk of fire, in compliance with the UL1699B arc detection standard.
•
High reliability. Solar PV systems are typically expected to operate for at least 25 years under harsh outdoor conditions. High reliability is critical and is facilitated by systems and components that have low heat generation, solid and stable materials, and an absence of moving parts. We have designed our system to meet these stringent requirements. Our power optimizers dissipate much less heat than microinverters because no DC‑AC inversion occurs at the module level. As a result, less heat is dissipated beneath the PV module, which improves lifetime expectancy and reliability of our power optimizers. Our power optimizers’ high switching frequency allows the use of ceramic capacitors with a low, fixed rate of aging and a proven life expectancy in excess of 25 years. Further, we use automotive‑grade application specific integrated circuits (“ASICs”) that embed many of the required electronics into the ASIC. This reduces the number of components and consequently the potential points of failure.
•
Energy Storage. Our DC optimized inverter system allows solar energy to be directly stored in batteries without any conversion, thereby eliminating energy losses that are associated with such conversions and improving the RoI of PV associated battery systems.
•
Energy Management. Strategically located at the intersection between PV, home usage, and the grid, inverters are well positioned to act as smart energy managers. Our smart inverters incorporate the management of PV energy, battery storage, smart devices, and grid interaction. By enabling smart energy management in our inverter, system owners can not only store solar energy but also control the timing of their PV energy consumption in order to increase their energy independence, take advantage of lower time-of-use rates, reduce electric bills, and improve overall system RoI.
•
Distributed Energy Generation. As the electric grid transitions from one based on centralized power stations to a network of distributed, renewable energy sources, our inverter acts as a local control system that can manage the energy resources underlying such distributed network. Our inverters are a key part of developing a distributed and interactive grid that can help support grid stability. One such example is inverter-enabled charging and discharging of batteries as part of a virtual power plant to help manage the load on the grid and grid stability.
Our PV Products Offering
SolarEdge began its commercial sales with a product offering of a simplified inverter, power optimizers, and cloud-based monitoring platform. As the solar energy industry has evolved. SolarEdge has developed innovative solutions to further enhance smart energy technology including inverters that include compatibility with batteries for increased self-consumption and storage, inverters that allow EV charging, smart meters, smart energy devices (sockets, water heater controllers, wireless relay) and smart PV modules. This product expansion has enabled us to increase average revenue per installation, or ARPI.
SolarEdge Power Optimizer. Our DC power optimizer is a highly reliable and efficient DC‑to‑DC converter which is connected by installers to each PV module or embedded by PV module manufacturers into their modules as part of the manufacturing process. Our power optimizer increases energy output from the PV module to which it is connected by continuously tracking the MPP of each module and controlling its working point. The power optimizer’s ability to track the MPP of each PV module and its ability to increase or decrease its output voltage, enables the inverter’s input voltage to remain fixed under a large variety of string configurations. This feature enhances flexibility in PV system designs, enabling use of different string lengths in a single PV system connected to the same inverter, use of PV panels situated on multiple orientations connected to the same inverter and using varied PV module types in the same string. In addition, our power optimizers monitor the performance of each PV module and communicates this data to our inverter using our proprietary power line communication. In turn, the inverter transmits this information to our monitoring server. Each power optimizer is equipped with our proprietary safety mechanism which automatically reduces the output voltage of each power optimizer to 1V unless the power optimizer receives a fail‑safe signal from a functioning inverter. As a result, if the inverter is shut down (e.g., for system maintenance, due to malfunction, in the event of a fire or otherwise), the DC voltage throughout the system is reduced to a safe level.
6
Our power optimizers are designed to withstand high temperatures and harsh environmental conditions, and contain multiple bypass features that localize failures and enable continued system operation in the vast majority of cases of power optimizer failure. Our power optimizers are compatible with the vast majority of modules on the market today and carry a 25‑year product warranty. Our power optimizers are designed to be used with our inverters as well as third party inverters to provide power optimization. Monitoring and safety features can also be achieved with third party inverters by adding supplemental communications hardware. During the year ended December 31, 2017, the year ended December 31, 2018 and the year ended December 31, 2019 revenues derived from the sale of power optimizers represented 47.3%, 46.1% and 44.5% of total revenues, respectively.
SolarEdge Inverter. Our DC-to-AC inverters contain sophisticated digital control technology with efficient power conversion architecture resulting in superior solar power harvesting and high reliability and are designed to work exclusively with our DC power optimizers. A proprietary power line communication receiver is integrated into each inverter, receiving data from our power optimizers, storing this data and transmitting it to our monitoring server when an internet connection exists. Since each string which is equipped with our power optimizers provides fixed input voltage to our inverter, the inverter is able to operate at its highest efficiency at all times and therefore is more cost‑efficient, energy efficient and reliable. Like our power optimizers, our inverters are designed to withstand harsh environmental conditions. Since the power rating of an inverter determines how many PV modules it can serve, larger installations require inverters with higher power ratings. We currently offer our second generation of inverters which come in two models: a one‑phase inverter designed to address the residential market (1 kilowatt (“kW”) to 11.4 kW) which includes our HD-Wave technology and our newly introduced inverter-integrated electric vehicle (EV) charger and a three‑phase inverter designed to address the residential market in certain European countries and the commercial market (4 kW to 100 kW). In June 2017, we introduced an extended commercial solution that consists of various inverters, sized 55kW, 82.5kW, and 100kW. In 2019, we announced the development of a 120kW three phase inverter with synergy technology that is designed to enable quick and easy installation and inventory management. These inverters are designed for commercial installations, reduce the number of required inverters and increase the system return on investment. The vast majority of our inverters are sold with a 12‑year warranty that is extendable to 20 or 25 years for an additional cost. During the year ended December 31, 2017, the year ended December 31, 2018 and the year ended December 31, 2019 revenues derived from the sale of inverters represented 47.9%, 44.5% and 43.9% of total revenues, respectively.
EV Charging Inverter. SolarEdge's EV charging inverter offers homeowners the ability to charge electric vehicles up to six times faster than a standard Level 1 charger through an innovative solar boost mode that utilizes grid and PV charging simultaneously. This inverter is the world's first EV charger with an integrated PV inverter. Reducing the burden of installing separately a standalone EV charger and a PV inverter, the EV charging inverter eliminates the need for additional wiring, conduit and a breaker installation. By installing an inverter that has an integrated EV charge, no additional dedicated circuit breaker is needed, saving space and ruling out a potential upgrade to the main distribution panel.
StorEdge Solutions. Our StorEdge solution is a DC coupled solution that is used to increase energy independence and maximize self-consumption for homeowners by utilizing a battery which is sold separately by third party manufacturers, to store and supply power as needed. The solution is based on a single inverter for both solar PV and storage. Our StorEdge solution is designed to provide smart energy functions such as maximizing self-consumption, Time-of-Use programming for desired hours of the day, and home energy backup solutions. To optimize self-consumption, the battery is charged and discharged to meet consumption needs and reduce the amount of power purchased from the grid. With a backup solution, unused solar PV power is stored in a battery and used during a power outage or when solar PV production is insufficient. When there is a power outage, a combination of solar PV power and battery is used to power important sources such as the refrigerator, communication devices, lighting, and AC outlets. Our proprietary monitoring platform provides visibility into battery status, solar PV production, and self-consumption, while offering easy maintenance with remote access to inverter and battery software. Existing SolarEdge systems can be upgraded to our StorEdge solution. We recently announced the upgrading of our StorEdge inverter by transitioning to HD-Wave technology and providing a new backup interface. HD-Wave StorEdge is expected to launch by the end of the first quarter of 2020. The new StorEdge inverter is designed to support connection to backup generators or up to three StorEdge inverters with each DC coupled to two batteries. In the first quarter of 2020 SolarEdge launched a new backup StorEdge interface that raises available backup power and eliminates pre-defining loads for simplified energy management.
SolarEdge Software. We offer a variety of professional software tools from system design to monitoring:
Our “Designer app” is a free web-based tool that helps solar professionals to plan, build and validate our residential and commercial systems from inception to installation.
Our “Mapper app” provides SolarEdge installers with an efficient, streamlined process for registering the physical layout of new PV sites in the SolarEdge monitoring platform. Installers use the Mapper app to scan SolarEdge power optimizer and inverter barcodes, creating a virtual map of the PV site in the monitoring platform to help facilitate remote diagnostics.
Making installations quick and simple, our “SetApp” is used to activate and configure SolarEdge inverters during commissioning directly through a smartphone.
Our cloud‑based monitoring platform collects power, voltage, current and system data sent from our inverters and power optimizers and allows users to view the data at the module level, string level, inverter level and system level from any browser or from most smart phones and tablets. The monitoring software continuously analyzes data and flags potential problems. The monitoring software includes features which are used on a routine basis by integrators, installers, maintenance staff, and system owners to improve a solar PV system’s performance by maximizing solar power harvesting and reducing O&M costs by increasing system up‑time and detecting PV module performance issues more effectively. Connection to the monitoring server is completed during installation by the installer. The installer then receives full access to system data through the monitoring software and can select the amount of data to be shared with the system owner.
7
Smart Energy Management. There are currently two separate energy technology industries that exist today, solar energy production and automation technology. Inverters are taking on an expanded role in energy management and automation, and in order to address these market needs, we are developing and providing automation products. This line of products, when used with the SolarEdge solution, is designed to allow system owners to increase self-consumption by shifting energy usage to match peak solar PV production as well as offer a convenient, wireless control option over various building and/or home devices. An example of this solution, would be using excess solar PV energy to heat water or the ability to remotely turn on or off certain power sources such as lighting or electrical appliances. The introduction of these products is dependent upon certification and region specific needs and as such, these products are not yet available in all of the geographies in which SolarEdge operates.
Grid Services. As PV and storage continue to proliferate around the world, energy production is transitioning from a centralized system to a distributed network model, where energy is produced close to the location in which it is consumed and stored. This model creates an opportunity for new interconnected and decentralized energy networks offering improved grid reliability and stability, new energy services and reduction of grid infrastructure costs. SolarEdge grid services deliver near real-time aggregative control and data reporting, enabling the pooling of distributed energy resources — photovoltaic systems, battery storage, electric vehicle chargers, and loads — in the cloud for the creation of virtual power plants. The SolarEdge grid services and VPP solution provides sophisticated management platforms to enable real-time, aggregated control of available energy resources to meet ever-changing supply needs and demand. In 2019, SolarEdge generated revenues from selling grid services in the U.S., Europe and Australia, including services provided to independent system operators, energy retailers, national installers and others.
Product Roadmap
Our products reflect the innovation focus and capabilities of our technology departments. Our core product roadmap is divided into five categories: power optimizers, inverters, software, energy storage, and smart energy management.
Power Optimizers. We currently sell our third generation power optimizer which was designed for fully automated assembly and which is based on our third generation ASIC. A key element of our reliability strategy, and a significant differentiator relative to our competitors, is our use of proprietary ASICs to control, among other things, our power optimizer’s power conversion, safety features, and PV module monitoring. Instead of using large numbers of discrete components, our power optimizer uses a single proprietary ASIC, thus reducing the total number of components in an electrical circuit and thereby improving reliability. In June 2017, we unveiled our fourth generation power optimizer which uses fourth generation ASIC and incorporates a new safety mechanism for PV systems. In addition, we are also continuing to develop the necessary subsystems for the fifth generation ASIC which will be used in our fifth generation power optimizer. Each new ASIC generation reduces the number of components required and meaningfully improved the efficiency of the power optimizer. The efficiency improvement reduces the energy losses which in turn reduces the amount of heat dissipation. This enables design of a more cost-effective and usually smaller enclosure and also keeps the electronics cooler, thereby improving the power optimizer’s reliability.
Inverters. Our inverter roadmap is intended to serve three purposes: (i) expand addressable market by developing new and larger inverters designed specifically for larger commercial installations and utility‑scale projects; (ii) improve the electronics to increase the total power throughput without changing the existing enclosure, thereby reducing the actual cost per watt and increasing economies of scale and (iii) improve ease of installation by integrating additional functionality required in certain installations in order to reduce costs of additional hardware and subcontractors’ labor costs.
Software. We continue to expand our software offering with introduction of new tools and new features to our current tools. This includes both professional web-based software and system owner applications such as the site designer application and the mapper application.
Our cloud‑based monitoring platform is continuously growing by the amount of data aggregated. We are continuously developing tools to accommodate our growth and further enhance our service offering. Specifically, we plan to increase data compression in order to enable support for a rapidly increasing number of field systems while using low‑cost equipment. In addition, we plan to improve our reporting systems and enable users to obtain self‑generated customized reports. We also expect to expand algorithms that detect and pinpoint problems that can affect power production in field systems. We further plan to add more capabilities through our public application program interface to allow users to build and integrate our system into their own systems and to allow users to build and share useful applications based on monitoring data gathered by our software.
8
Energy Storage. We are working to continue to expand our third-party battery compatibility for the residential market, while also developing our own batteries for both the residential and C&I market segments.
Smart Energy Management
Our smart energy suite controls PV production, energy storage and grid interaction, and is designed to automatically use excess PV power to increase self-consumption of solar energy and reduce energy bills and carbon footprints. The suite controls electrical loads such as, pool pumps, fans, lighting and other home appliances, is able to divert solar energy to heat water and also includes several accessories such as a smart energy socket and smart energy switch. We are developing new features and capabilities for the smart energy suite which is constantly evolving. Specifically, we have current plans to add the ability to control additional energy loads and are developing capabilities for the commercial segment. We also plan on expanding the availability of our smart energy products, including smart energy management devices, to new geographies.
Products from Acquisitions
During the year ended December 31, 2018, we expanded our product offering by completing the Gamatronic Acquisition and the Kokam Acquisition and in January 2019, we further expanded our product offering by completing the SMRE Acquisition. This allows us to offer a variety of products and solutions in addition to the SolarEdge solution, in adjacent markets.
UPS products. Our UPS business has offered power protection solutions for power dependent and critical applications around the world for almost five decades. The UPS product offering includes a full range of UPS and power supply solutions for use in various applications including datacenters, communications, defense, healthcare, industrial, financial, marine, transportation, government and, retail. The products include Modular UPS solutions ranging from 10 kW to 1.2 MW, modular power systems for the telecommunications market, modular DC/AC inverters, modular DC/DC converters and different control and management solutions.
Lithium-ion batteries and related products. Founded in 1989, Kokam, develops premium lithium-ion battery cells, batteries and energy storage solutions . Kokam’s patented cell manufacturing technology allows us to provide energy solutions of improved performance, safety, and reliability which can integrate with a wide-variety of industries, including Energy Storage Systems known as ESS, UPS, EVs, aerospace and marine. We have plans to expand our manufacturing capabilities of cells and batteries by building a new factory in South Korea.
Products for e-Mobility. Through the SMRE Acquisition, SolarEdge has added to its product offering e-Mobility, automated production machines and telematics software. These solutions include innovative powertrain technology integrated with the gearbox, engine, battery, BMS, software, electronics and batteries for light goods vehicles, light commercial vehicles and e-motorcycles.
New Products or Product Categories
We continuously evaluate opportunities to expand our product offerings and services to our customers. We may from time to time develop new products or services that are a natural extension of our existing business, or may engage in acquisitions of businesses or product lines with the potential to strengthen our market position, enable us to enter attractive markets, expand our technological capabilities, or provide synergy opportunities.
Sales and Marketing Strategy
Our solar business strategy is to focus on penetrating new geographic regions and increasing our market share. More specifically, we focus on markets where electricity prices, irradiance and government policies make solar PV installations economically viable. Our solar products have been installed in 133 countries, including the U.S., Canada, Germany, Italy, Poland, Brazil, the Netherlands, the United Kingdom, Israel, Australia, Japan, Singapore, India, Taiwan, Korea, South Africa, Belgium, France, and China.
We target our sales and marketing efforts to the largest distributors, electrical equipment wholesalers, EPC contractors and installers in each of the countries where we operate. In the U.S., Germany, Italy, the United Kingdom, and Australia, our products are carried and actively sold by most of the top solar PV distributors as well as the largest electrical distribution companies that are active in solar PV. We anticipate that an increasing percentage of solar PV equipment sales will also occur through electrical equipment wholesalers who sell to a broad range of electrical contractors, and we are focused on cultivating these global relationships. As of December 31, 2019, according to data available on our monitoring platform, over 28,500 installers around the world have installed SolarEdge solar PV systems. We also sell our power optimizers pre-installed onto several PV modules for manufacturers that offer PV modules with our power optimizer physically embedded into their modules.
Additionally, we have a number of programs focused on educating installers and other industry professionals about our technology, and we use a combination of road shows, webinars, and partner trainings to show them how best to design, sell, and implement our technology in their projects.
Our battery business strategy focuses on combining Kokam’s technology with our residential and commercial solar products and using any remaining manufacturing capacity for transactions that combine our batteries and solar products in the ESS market. In the near future we intend to further integrate our batteries into the UPS market.
Our Customers
We derive a significant portion of our revenues from key solar distributors, electrical equipment wholesalers and large installers in the U.S. and worldwide. In 2019, one of our customers, Consolidated Electrical Distributors Inc. (CED), represented 20.4% of our revenues. None of our other customers accounted for more than ten percent of our revenues in the year ended December 31, 2019.
Training and Customer Support
We offer our installer base a comprehensive package of customer support and training services which include pre‑sales support, ongoing trainings, and technical support before, during, and after installation. We also provide customized support programs to PV module manufacturers, large installers and distributors to help prioritize and track support issues, thereby enabling short cycle times for issue resolution. In 2019, we conducted approximately 308 training events in 26 countries, with an aggregate of approximately 7,851 attendees.
9
We offer a wide variety of training, including hands‑on and on‑demand video sessions and online product and training materials. We support our commercial system customers with design consulting throughout their sales process and installation. Our technical support organization includes local expert teams, call centers mainly in the U.S., Australia, Japan, India, Israel and Bulgaria, an online service portal and live chat service. Our toll‑free call and live chat centers are open Monday through Friday at least from 9:00 a.m. to 6:00 p.m. in every region in which we sell our products. In addition, customers can open and track support cases 24/7 utilizing our online portal. All support cases are monitored via a customer relationship management system in order to ensure service, track closure of all customer issues and further improve our customer service. Our call centers have access to our cloud‑based monitoring platform database, which enables real‑time remote diagnostics.
Customer service and satisfaction continues to be a key component of our business and we consider it integral to our success in the future. We maintain high levels of customer engagement through our call centers in California, Australia, Japan, Israel and Bulgaria. In addition to our call centers, we have field service engineers located in the geographies where we are active, and support our customers with commissioning of large projects, introduction of new technologies and features and on‑the‑job training of new installers. As of December 31, 2019, our customer support and training organization consisted of 389 full time employees worldwide.
Our Technology
We have drawn on our expertise in the fields of power electronics, magnetic design, mechanical and heat dissipation capabilities, control loops and algorithms and power line communications to design and develop what we believe to be the most advanced commercial solutions for harvesting power from solar PV systems. Our advanced technologies are explained in more detail below.
As part of our growth strategy, we have acquired companies that have technologies that can leverage our expertise in power electronics and power optimization. By combining acquired resources with our current research and development teams, we are expanding our activity into other essential areas such as e-Mobility, battery storage and energy storage systems.
Power optimizers
Our power optimizers are DC/DC step up/step down (buck‑boost) converters designed and developed to operate in harsh outdoor environments at very high conversion efficiency. Our power optimizers include proprietary power electronics customized to efficiently convert power from the PV module to the inverter. The components are selected and the conversion topology is designed for the power optimizer specifications, and the power optimizer design is verified for consistent performance and reliability in numerous lab tests and simulations.
A key factor in the performance of our power optimizer is determined by the digital control algorithms and closed‑loop control mechanism. The power optimizer’s control is built into our advanced ASIC which is responsible for all critical digital control functions of the power optimizer, including detailed power analysis, digital control of the power conversion subsystem, power line communications and networking. Since each power optimizer handles the power and voltage of a single module, we are able to reach a high degree of semiconductor integration by leveraging low cost silicon in standard semiconductor packages. As a result, much of the functionality of our power optimizer can be integrated into a standard ASIC instead of use of discrete electronic components, resulting in lower costs and higher reliability.
The ASIC performs the critical power analysis and power conversion control functions of the power optimizer. The power analysis functions process the state and working parameters at the power optimizer’s input and output, and together with advanced digital control and state machine logic, control the power conversion function. In addition, our digital control system uses technology that allows the solar PV installation to anticipate and adapt to changing operating conditions, and to protect itself against system anomalies.
Each power optimizer in the array is connected to the inverter by a power line communications networking link. Our power line communications link uses a proprietary networking technology that we developed, utilizing the existing DC wiring between the power optimizers and the inverter to transmit and receive data between these devices.
Inverters
Our inverter is designed for single‑stage DC/AC conversion. Using our inverter in combination with the power optimizers allows the inverter control loop to maintain a regulated DC voltage level at its input, thereby allowing for long, uneven, and multi‑faceted strings while also enabling custom, cost–efficient, and reliable inverter design and component selection. All of the power components, as well as the main magnetic components for our inverters, can then be optimized for DC/AC inversion at high efficiency.
Our inverters’ digital control algorithms are implemented using programmable digital signal processors which allow for flexibility and adaptation of control loops for various grids and for the requirements and standards of different grid operators across geographies. We have already implemented the control mechanisms necessary to support advanced grid codes and standards that are required to support high penetration of solar energy into utility grids.
10
Manufacturing
We have designed our manufacturing processes to produce high quality products at competitive costs. The strategy is threefold: outsource, automate, and localize. We currently contract to have our solar products manufactured by two of the world’s leading global electronics manufacturing service providers, Jabil Circuit, Inc. (“Jabil”) and Flex Ltd. (“Flex”). By using contract manufacturers rather than building our own manufacturing infrastructure, we are able to access advanced manufacturing equipment, processes, skills and capacity on a “capital light” budget. Our contract manufacturers are responsible for funding the capital expenses incurred in connection with the manufacture of our products, except with regard to end-of-line testing equipment and other specific manufacturing equipment utilized in assembling our products or sub-components which are financed and owned by the company. We expect to continue this funding arrangement in the future, with respect to any expansions to such existing lines. Further, contracting with global providers such as Jabil, and Flex gives us added flexibility to manufacture certain products in China and Vietnam, closer to target markets in Asia and the North American west coast as well as other products in Hungary, closer to target markets in Europe and the North American east coast, potentially increasing responsiveness to customers while reducing costs and delivery times. During the year ended December 31, 2019 we opened a new manufacturing site in Vietnam which is expected to reach full production capacity in the second quarter of 2020. In July 2017, we executed a long term lease agreement for 10,000 square meters in Israel, intended for the establishment of a manufacturing facility for the production of product prototypes, manufacturing and the development of proprietary manufacturing and testing equipment. The facility is anticipated to reach full production capacity in the third quarter of 2020.
We have developed propriety automated assembly lines for the manufacturing of our power optimizers. These assembly lines, currently operating in all of our manufacturing facilities enable the manufacturing of more than 4,000 optimizers per machine per day. We invest resources in additional automated assembly lines as well as in automated machinery for subassembly and self-manufacturing of certain components used in our products, and we own and are responsible for funding all of the capital expenses related thereto. The current and expected capital expenses associated with these automated assembly lines and other machinery is funded out of our cash flows.
We source our raw materials through various component manufacturers and invest resources in continued cost-reduction efforts as well as verifying second and third sources so as to limit dependence on sole suppliers.
Our Korean subsidiary, Kokam has a manufacturing facility for lithium-ion cells and batteries that has the capacity to manufacture up to 150 MWH per annum.
Reliability and Quality Control
Our power optimizers are either connected to each PV module by installers, or embedded in each PV module by PV module manufacturers. Our power optimizers are designed to be as reliable as the PV module itself and capable of withstanding the same operating and environmental conditions.
Our reliability methodology includes a multi‑level plan with design analysis, sub‑system testing of critical components by Accelerated Life Testing, and integrative testing of design prototypes by Highly Accelerated Life Testing and large sample groups. As part of our reliability efforts, we subject components to industry standard conditions and tests including in accelerated life chambers that simulate burn‑in, thermal cycling, damp‑heat, and other stresses. We also conduct out of box audits (OBA) on our finished products, on-line reliability tests (ORT) are conducted on our optimizers and we test complete products in stress tests and in the field. Our rigorous testing processes have helped us to develop highly reliable products.
In order to verify the quality of each of our products when it leaves the manufacturing plant, each component, sub‑assembly, and final product are tested multiple times during production. These tests include Automatic Optical Inspection, In‑Circuit Testing, Board‑ Functional Testing, Safety Testing, and Integrative Stress Testing. We employ a serial number‑driven manufacturing process auditing and traceability system that allows us to control production line activities, verify correct manufacturing processes and to achieve item‑specific traceability.
As a part of our quality and reliability approach, failed products from the field are returned and subjected to root cause analysis, the results of which are used to improve our product and manufacturing processes and design and further reduce our field failure rate.
11
Certifications
Our products and systems comply with the applicable regulatory requirements of the jurisdictions in which they are sold as well as all other major markets around the world. These include safety regulations, electromagnetic compatibility standards and grid compliance.
Research and Development
We devote substantial resources to research and development with the objective of developing new products and systems, adding new features to existing products and systems and reducing unit costs of our products and systems. Our development strategy is to identify features, products, and systems for both software and hardware that reduce the cost and improve the effectiveness of our solutions for our customers. We measure the effectiveness of our research and development by metrics including product unit cost, efficiency, reliability, power output, and ease of use.
We have a strong research and development team with wide‑ranging experience in power electronics, semiconductors, power line communications and networking, and software engineering. In addition, many members of our team have expertise in solar technologies. As of December 31, 2019, our research and development organization had a headcount of 755 employees.
Intellectual Property
The success of our business depends, in part, on our ability to maintain and protect our proprietary technologies, information, processes, and know‑how. We rely primarily on patent, trademark, copyright and trade secrets laws in the U.S. and similar laws in other countries, confidentiality agreements and procedures and other contractual arrangements to protect our technology. As of December 31, 2019, SolarEdge had 348 issued patents, world-wide and 266 patent applications pending for examination. A majority of our patents relate to DC power optimization and DC to AC conversion for alternative energy power systems, power system monitoring and control, and management systems. Our issued patents are scheduled to expire between 2020 and 2036.
We continually assess opportunities to seek patent protection for those aspects of our technology, designs, and methodologies and processes that we believe provide significant competitive advantages.
We rely on trade secret protection and confidentiality agreements to safeguard our interests with respect to proprietary know‑how that is not patentable and processes for which patents are difficult to enforce. We believe that many elements of our manufacturing processes involve proprietary know‑how, technology, or data that are not covered by patents or patent applications, including technical processes, test equipment designs, algorithms, and procedures.
All of our research and development personnel are required to enter into confidentiality and proprietary information agreements with us. These agreements address intellectual property protection issues and require our employees to assign to us all of the inventions, designs, and technologies they develop during the course of employment with us.
Our customers and business partners are required to enter into confidentiality agreements before we disclose any sensitive aspects of our technology or business plans.
Competition
The markets for our solar products are competitive, and we compete with manufacturers of traditional inverters and manufacturers of other MLPE. The principal areas in which we compete with other companies include:
•
product and system performance and features;
•
total cost of ownership;
•
PV module compatibility and interoperability;
•
reliability and duration of product warranty;
•
customer service and support;
12
•
breadth of product line;
•
local sales and distribution capabilities;
•
compliance with applicable certifications and grid codes;
•
size and financial stability of operations; and
•
size of installed base.
Our DC optimized inverter system competes principally with products from traditional inverter manufacturers, such as SMA Solar Technology AG, ABB Ltd. and Huawei Technologies Co. Ltd. as well as from other Chinese inverter manufacturers. In the North American residential market, we compete with traditional inverter manufacturers, as well as microinverter manufacturers such as Enphase Energy, Inc. In addition, several new entrants to the MLPE market, including low‑cost Asian manufacturers, have recently announced plans to ship or have already shipped similar products. We believe that our DC optimized inverter system offers significant technology and cost advantages that reflect a competitive differentiation over traditional inverter systems and microinverter technologies.
The markets for our lithium-ion products are competitive as well, and we compete with global cell and battery manufacturers in the ESS market. Our energy storage solutions compete with products from global manufactures such as LG Chem, Samsung SDI, BYD and Panasonic.
In the UPS market, our UPS products compete with products and solutions from global UPS providers such as Schneider Electric, Eaton and Vertiv.
The vehicle e-Mobility market is dominated primarily by significant manufacturers, such as Robert Bosch GmbH, ZF Friedrichshafen AG, Dana Incorporated and Magna International. As the global e-Mobility market expands, major automotive manufacturers, such as Toyota, Honda, Tesla, General Motors, and Ford, have increased their investments in the electric and hybrid vehicle components in order to increase their market share.
Government Incentives
U.S. federal, state, and local government bodies, as well as non-U.S. government bodies, provide incentives to owners, end users, distributors, and manufacturers of solar PV systems to promote solar electricity in the form of rebates, tax credits, lower VAT rate and other financial incentives such as system performance payments, payments for renewable energy credits associated with renewable energy generation, and exclusion of solar PV systems from property tax assessments. The market for on‑grid applications, where solar power is used to supplement a customer’s electricity purchased from the utility network or sold to a utility under tariff, often depends in large part on the availability and size of these government subsidies and economic incentives, which vary by geographic market and from time to time. In general, the amount and availability of these incentives and subsidies to encourage the development of solar PV energy have been declining and are expected to continue to decline.
Import Tariffs
Escalating trade tensions between the United States and China have led to increased tariffs and trade restrictions, including tariffs applicable to some of our products. In January 2018, a tariff on imported solar modules and cells was adopted in the United States. The tariff, which does not apply directly to our products, except possibly with respect to power optimizers that are embedded onto solar panels in China, was initially set at 30%, with a gradual reduction over four years to 15%. In addition, in July 2018, a 10% tariff on a long list of products imported from China, including inverters and power optimizers was adopted in the United States under Section 301 of the Trade Act of 1974, and became effective on September 24, 2018. In June 2019, the U.S. trade representative (“USTR”) increased the rate of such tariffs from 10% to 25%. On January 15, 2020, the United States and China entered into an initial trade deal, which preserves the 2018 tariffs and indicates additional sanctions may be imposed if China breaches the terms of the deal.
In order to mitigate the negative effect of increased tariffs, in the third quarter of 2019 we raised the price of our products sold in the U.S. Despite the price increases, the tariffs had a net negative effect on our gross margins. In response to the increased tariffs, we increased our manufacturing capabilities at our Vietnam manufacturing facility during the fourth quarter of 2019, and we expect to continue to increase the capacity during 2020.
13
Seasonality
The solar energy market is subject to seasonal and quarterly fluctuations affected by weather. For example, during the winter months in Europe and the northeastern U.S. where the climate is particularly cold and snowy, it is typical to see a decline in PV installations and this decline can impact the timing of orders for our products.
Employees
As of December 31, 2019, we had 2,431 full‑time employees. Of these full‑time employees, 755 were engaged in research and development, 416 in sales and marketing, 1,031 in operations, production and support, and 229 in general and administrative capacities. Of our employees, 1,161 were based in Israel, 295 were based in Korea, 235 were based in the U.S., 185 were based in China, 197 were based in Italy, and an additional 358 were based elsewhere.
Except for our SMRE employees and the employees of its subsidiary IET, none of our employees are represented by a labor union. We have not experienced any employment-related work stoppages, and we consider relations with our employees to be good.
Corporate Information
We were incorporated in Delaware in 2006. Our principal executive offices are located at 1 HaMada Street, Herziliya Pituach 4673335, Israel and our telephone number at this address is 972 (9) 957-6620. Our website is www.solaredge.com.
We file annual, quarterly and current reports, proxy statements and other documents with the Securities and Exchange Commission (the “SEC”), pursuant to the Securities Exchange Act of 1934 (the “Exchange Act”). Our reports, proxy statements and other documents filed electronically with the SEC are available at the website maintained by the SEC at www.sec.gov.
We use the Investor Relations portion of our website at www.solaredge.com, as a routine channel of distribution of important information such as press releases, analyst presentations, corporate governance practices and corporate responsibility information, financial information including our annual, quarterly, and current reports, our proxy statements, and, if applicable, amendments to those reports, filed or furnished pursuant to Section 13(a) or 15(d) of the Exchange Act as soon as reasonably practicable after we electronically file such reports with, or furnish them to, the SEC. We also make available on the Investor Relations portion of our website at www.solaredge.com our earnings presentation and other important information, which we encourage you to review. All such postings and filings are available on our Investor Relations website free of charge.
14
ITEM 1A.RISK FACTORS
Risk factors which could cause actual results to differ from our expectations and which could negatively impact our financial condition and results of operations are discussed below and elsewhere in this Annual Report. The risks and uncertainties described below are not the only ones we face. If any of the risks or uncertainties described below or any additional risks and uncertainties actually occur, our business, results of operations and financial condition could be materially and adversely affected. In particular, forward-looking statements are inherently subject to risks and uncertainties, some of which cannot be predicted or quantified. See “Special Note Regarding Forward-Looking Statements.”
Risks Related to Our Business and Our Industry
We cannot be certain that we will sustain our current level of profitability in the future.
We achieved a net profit of $84.2 million, $128.0 million and $145.0 million in the years ended December 31, 2017, 2018 and 2019, respectively. This high growth rate in profitability may not be sustainable over time. While we continue to grow our market share, our revenue growth is not expected to grow at the same pace that it has in past years. In addition, our revenue may decline for a number of possible reasons, many of which are outside our control, including a decline in demand for our products, increased competition, a decrease in the growth of the solar industry, or our failure to continue to capitalize on growth opportunities. If we fail to maintain sufficient revenue to support our operations, we may not be able to sustain profitability.
In addition, we expect to incur additional costs and expenses related to the continued development and expansion of our business, including in connection with recent or future acquisitions as well as ongoing marketing and developing our products, development of our own manufacturing facilities, expanding into new product markets and geographies, maintaining and enhancing our research and development operations and hiring additional personnel. We do not know whether our revenues will grow rapidly enough to absorb these costs or the extent of these expenses or their impact on our results of operations.
The rapidly evolving and competitive nature of the solar industry makes it difficult to evaluate our future prospects. Our entry into other adjacent markets through recent acquisitions is new and highly competitive and it is difficult to evaluate our future in these new markets as well.
Much of our growth has occurred in recent periods. The rapidly evolving and competitive nature of the solar industry makes it difficult to evaluate our current business and future prospects. In addition, we have limited insight into emerging trends that may adversely affect our business, financial condition, results of operations and prospects. Our recent acquisitions in adjacent markets, such as UPSs, ESS and e-Mobility are new to us and these are highly competitive markets in which we will need to compete. We have encountered and will continue to encounter risks and difficulties frequently experienced by growing companies in rapidly changing industries, including unpredictable and volatile revenues and increased expenses as we continue to grow our business.
The viability and demand for solar energy solutions, UPS solutions, ESS and e-Mobility products, and in turn, our products, may be affected by many factors outside of our control, including:
•
cost competitiveness, reliability and performance of solar PV systems compared to conventional and non-solar renewable energy sources and products;
•
availability and amount of government subsidies and incentives to support the development and deployment of solar energy solutions;
•
the extent to which the electric power industry and broader energy industries are deregulated to permit broader adoption of solar electricity generation;
•
prices of traditional carbon-based energy sources;
•
levels of investment by end-users of solar energy products, which tend to decrease when economic growth slows; and
•
the emergence, continuance or success of, or increased government support for, other alternative energy generation technologies and products.
If we do not manage these risks and overcome these difficulties successfully, our business and results of operations will suffer.
15
If demand for solar energy solutions does not continue to grow or grows at a slower rate than we anticipate, our business and results of operations will suffer.
Our solution is utilized in solar PV installations. As a result, our future success depends on continued demand for solar energy solutions and the ability of solar equipment vendors to meet this demand. The solar industry is an evolving industry that has experienced substantial changes in recent years, and we cannot be certain that consumers and businesses, with respect to distributed solar solutions, or utilities, with respect to utility-scale solar projects, will adopt solar PV systems as an alternative energy source at levels sufficient to grow our business. If demand for solar energy solutions fails to develop sufficiently, demand for our products will decrease, which would have an adverse impact on our ability to increase our revenue and grow our business.
The reduction, elimination or expiration of government subsidies and economic incentives for on-grid solar electricity applications could reduce demand for solar PV systems and harm our business.
Federal, state, local and foreign government bodies provide incentives to owners, end users, distributors, system integrators and manufacturers of solar PV systems to promote solar electricity in the form of rebates, tax credits and other financial incentives such as system performance payments, payments of renewable energy credits associated with renewable energy generation and exclusion of solar PV systems from property tax assessments. The market for on-grid applications, where solar power is used to supplement a customer’s electricity purchased from the utility network or sold to a utility under tariff, often depends in large part on the availability and size of government and economic incentives that vary by geographic market. Because our customers’ sales are typically into the on-grid market, the reduction, elimination or expiration of government subsidies and economic incentives for on-grid solar electricity may negatively affect the competitiveness of solar electricity relative to conventional and non-solar renewable sources of electricity, and could harm or halt the growth of the solar electricity industry and our business. For example, in 2015 the U.S congress passed a multi-year extension to the solar Investment Tax Credit (ITC), such extension helped exponentially grow the U.S solar market. As of January 1, 2020 the ITC is being gradually reduced from 30 percent to 26 percent for both residential and commercial in 2020 and is expected to reach 10 percent for commercial only in 2023. The reduction in the ITC could reduce the demand for solar energy solutions in the U.S which would have an adverse impact on our business, financial condition, and results of operations.
In general subsidies and incentives may expire on a particular date, end when the allocated funding is exhausted or be reduced or terminated as solar energy adoption rates increase or as a result of legal challenges, the adoption of new statutes or regulations or the passage of time. These reductions or terminations often occur without warning.
In addition, several jurisdictions have adopted renewable portfolio standards, which mandate that a certain portion of electricity delivered by utilities to customers come from a set of eligible renewable energy resources by a certain compliance date. Some programs further specify that a portion of the renewable energy quota must be from solar electricity. Under some programs, a utility can receive a “credit” for renewable energy produced by a third party by either purchasing the electricity directly from the producer or paying a fee to obtain the right to renewable energy generated but used by the generator or sold to another party. A renewable energy credit allows the utility to add this electricity to its renewable portfolio requirement total without actually expending the capital for generating facilities. However, there can be no assurances that such policies will continue. For example, in December 2015, Nevada's Public Utilities Commission increased the fixed service charge for net-metered solar customers and lowered compensation for net excess solar generation Proposals to extend compliance deadlines, reduce targets or repeal standards have also been introduced in a number of states. Reduction or elimination of renewable portfolio standards or successful efforts to meet current standards could harm or halt the growth of the solar PV industry and our business.
Changes in the U.S. trade environment, including the recent imposition of import tariffs, could adversely affect the amount or timing of our revenues, results of operations or cash flows.
Escalating trade tensions between the United States and China have led to increased tariffs and trade restrictions, including tariffs applicable to certain of our products. In January 2018, a tariff on imported solar modules and cells was adopted in the United States. The tariff, which does not apply directly to our products, except possibly with respect to power optimizers that are embedded onto solar panels in China, was initially set at 30%, with a gradual reduction over four years to 15%. In addition, in July 2018, a 10% tariff on a long list of products imported from China, including inverters and power optimizers was adopted in the United States under Section 301 of the Trade Act of 1974, and became effective on September 24, 2018. In June 2019, the USTR increased the rate of such tariffs from 10% to 25%.
On January 15, 2020, the United States and China entered into an initial trade deal which preserves the bulk of the tariffs placed in 2018 and maintains a threat of additional sanctions should China breach the terms of the deal.
16
In order to mitigate the negative effect of increased tariffs, we raised the price of our products sold in the United States in the third quarter of 2019. Despite the price increases, the tariffs had a negative effect on our gross margins. In response to the increased tariffs, we focused efforts and resources on opening an additional manufacturing facility in Vietnam. The tariffs and the possibility of additional tariffs in the future have created uncertainty in the industry. If the price of solar systems in the United States increases, the use of solar systems could become less economically feasible and could reduce our gross margins or reduce the demand of solar systems manufactured and sold, which in turn may decrease demand for our products. Additionally, existing or future tariffs may negatively affect key customers, suppliers, and manufacturing partners. Such outcomes could adversely affect the amount or timing of our revenues, results of operations or cash flows, and continuing uncertainty could cause sales volatility, price fluctuations or supply shortages or cause our customers to advance or delay their purchase of our products. It is difficult to predict what further trade-related actions governments may take, which may include additional or increased tariffs and trade restrictions, and we may be unable to quickly and effectively react to such actions.
Changes to net metering policies may significantly reduce demand for electricity from solar PV systems and harm our business.
Our business benefits from favorable net metering policies in most U.S. states and some European countries in which our customers operate. Net metering allows a solar PV system owner to pay his or her local electric utility only for power usage net of production from the solar PV system, transforming the conventional relationship between customers and traditional utilities. System owners receive credit for the energy that the solar installation generates to offset energy usage at times when the solar installation is not generating energy. Under a net metering program, the customer typically pays for the net energy used or receives a credit against future bills at the retail rate if more energy is produced than consumed. In some locations, customers are also reimbursed by the electric utility for net excess generation on a periodic basis.
Most U.S. states have adopted some form of net metering. However, net metering programs have recently come under regulatory scrutiny in some U.S. states due to challenges alleging that net metering policies inequitably shift costs onto non-solar ratepayers by allowing solar ratepayers to sell electricity at rates that are too high for utilities to recoup their fixed costs. We cannot assure you that the programs will not be significantly modified going forward.
If the value of the credit that customers receive for net metering is significantly reduced, end-users may be unable to recognize the same level of cost savings associated with net metering that current end-users enjoy. The absence of favorable net metering policies or of net metering entirely, or the imposition of new charges that only or disproportionately affect end-users that use net metering would significantly limit demand for solar PV systems that are sold by our customers and could have a material adverse effect on our business, financial condition, results of operations and future growth.
Existing electric utility industry regulations, and changes to regulations, may present technical, regulatory, and economic barriers to the purchase and use of solar PV systems that may significantly reduce demand for our products or harm our ability to compete.
Federal, state, local and foreign government regulations and policies concerning the electric utility industry, and internal policies and regulations promulgated by electric utilities, heavily influence the market for electricity generation products and services. These regulations and policies often relate to electricity pricing and the interconnection of customer-owned electricity generation, and governments and utilities continuously modify these regulations and policies. These regulations and policies could deter purchases of renewable energy products, including solar PV systems sold by our customers. This could result in a significant reduction in the potential demand for our products. For example, utilities commonly charge fees to larger, industrial customers for disconnecting from the electric grid or for having the capacity to use power from the electric grid for back-up purposes. These fees could increase the cost to use solar PV systems sold by our customers and make them less desirable, thereby harming our business, prospects, financial condition and results of operations. In addition, depending on the region, electricity generated by solar PV systems competes most effectively with expensive peak-hour electricity from the electric grid, rather than the less expensive average price of electricity. Modifications to the utilities’ peak hour pricing policies or rate design, such as to a flat rate, could require the price of solar PV systems and their component parts to be lower in order to compete with the price of electricity from the electric grid.
17
Changes in current laws or regulations applicable to us or the imposition of new laws and regulations in the U.S., Europe, or other jurisdictions in which we do business could have a material adverse effect on our business, financial condition and results of operations. Any changes to government or internal utility regulations and policies that favor electric utilities could reduce the competitiveness of solar PV systems sold by our customers and cause a significant reduction in demand for our products and services. For example, regulators in certain U.S. states have been asked to consider proposals to assess fees on consumers purchasing energy from solar PV systems or imposing a new charge that would disproportionately impact solar PV system owners who utilize net metering, either of which would increase the cost of solar PV energy to those consumers and could reduce demand for our products. Any similar government or utility policies adopted in the future that discourage the growth of solar PV systems could reduce demand for our products and services and adversely impact our growth. In addition, changes in our products or changes in export and import laws and implementing regulations may create delays in the introduction of new products in international markets, prevent our customers from deploying our products internationally or, in some cases, prevent the export or import of our products to certain countries altogether. Any such event could have a material adverse effect on our business, financial condition, and results of operations.
A drop in the retail price of electricity derived from the utility grid or from alternative energy sources may harm our business, financial condition, results of operations, and prospects.
Decreases in the retail prices of electricity from the utility grid or other renewable energy resources, would make the purchase of solar PV systems less economically attractive and would likely lower sales of our products. The price of electricity derived from the utility grid could decrease as a result of:
•
construction of a significant number of new power generation plants, including plants utilizing natural gas, nuclear, coal, renewable energy, or other generation technologies;
•
relief of transmission constraints that enable local centers to generate energy less expensively;
•
reductions in the price of natural gas;
•
utility rate adjustment and customer class cost reallocation;
•
energy conservation technologies and public initiatives to reduce electricity consumption;
•
development of smart-grid technologies that lower the peak energy requirements of a utility generation facility;
•
development of new or lower-cost energy storage technologies that have the ability to reduce a customer’s average cost of electricity by shifting load to off-peak times; and
•
development of new energy generation technologies that provide less expensive energy.
Moreover, technological developments in the solar components industry could allow our competitors and their customers to offer electricity at costs lower than those that can be achieved by us and our customers, which could result in reduced demand for our products.
If the cost of electricity generated by solar PV installations incorporating our systems is high relative to the cost of electricity from other sources, our business, financial condition, and results of operations may be harmed.
An increase in interest rates or tightening of the supply of capital in the global financial markets could make it difficult for end-users to finance the cost of a solar PV system and could reduce the demand for smart energy products and thus demand for our products.
Many end-users depend on financing to fund the initial capital expenditure required to develop, build, or purchase a solar PV system. As a result, an increase in interest rates or a reduction in the supply of project debt financing or tax equity investments, could reduce the number of solar projects that receive financing or otherwise make it difficult for our customers or their customers, the end-users, to secure the financing necessary to develop, build, purchase, or install a solar PV system on favorable terms, or at all, and thus lower demand for our products which could limit our growth or reduce our net sales. In addition, we believe that a significant percentage of end-users install solar PV systems as an investment, funding the initial capital expenditure through financing. An increase in interest rates could lower such end-user’s return on investment on a solar PV system, increase equity return requirements or make alternative investments more attractive relative to solar PV systems, and, in each case, could cause such end-users to seek alternative investments.
18
The market for our products is highly competitive and we expect to face increased competition as new and existing competitors introduce power optimizers, inverters, solar PV system monitoring and other smart energy products, which could negatively affect our results of operations and market share.
The market for solar PV solutions is highly competitive. We principally compete with traditional inverter manufacturers as well as microinverter manufacturers. Currently, our DC optimized inverter system competes with products from traditional inverter manufacturers, and microinverter manufacturers, as well as emerging technology companies offering alternative MLPE products. Over the past few years, several new entrants to the inverter and MLPE market including low-cost Asian manufacturers, have recently announced plans to ship or have already shipped products in markets in which we sell our products, including most recently, with respect to sales in Australia and in Europe. We expect competition to intensify as new and existing competitors enter the market. In addition, there are several new entrants that are proposing solution to the rapid shutdown functionality which has become a regulatory requirement for PV rooftop solar systems in the United States. If these new technologies are successful in offering a price competitive and technological attractive solution to the residential solar PV market, this could make it more difficult for us to maintain market share.
Several of our existing and potential competitors have the financial resources to offer competitive products at aggressive or below-market pricing levels, which could cause us to lose sales or market share or require us to lower prices for our products in order to compete effectively. If we have to reduce our prices by more than we anticipated, or if we are unable to offset any future reductions in our average selling prices by increasing our sales volume, reducing our costs and expenses or introducing new products, our revenues and gross profit would suffer.
In addition, competitors may be able to develop new products more quickly than us, may partner with other competitors to provide combined technologies and competing solutions and may be able to develop products that are more reliable or that provide more functionality than ours.
Developments in alternative technologies or improvements in distributed solar energy generation may have a material adverse effect on demand for our offerings.
Significant developments in alternative technologies, such as advances in other forms of distributed solar PV power generation, storage solutions, such as batteries, the widespread use or adoption of fuel cells for residential or commercial properties or improvements in other forms of centralized power production, may have a material adverse effect on our business and prospects. Any failure by us to adopt new or enhanced technologies or processes, or to react to changes in existing technologies, could result in product obsolescence, the loss of competitiveness of our products, decreased revenue and a loss of market share to competitors.
The solar industry has historically been cyclical and experienced periodic downturns.
Our future success partly depends on continued demand for solar PV systems in the end-markets we serve, including the residential and commercial sectors in the United States and Europe. The solar industry has historically been cyclical and has experienced periodic downturns which may affect the demand for equipment that we manufacture. The solar industry has undergone challenging business conditions in past years, including downward pricing pressure for PV modules, mainly as a result of overproduction, and reductions in applicable governmental subsidies, contributing to demand decreases. Although the solar industry has recovered from this downturn, there is no assurance that the solar industry will not suffer significant downturns in the future, which will adversely affect demand for our solar products and our results of operations.
Defects or performance problems in our products could result in loss of customers, reputational damage, and decreased revenue, and we may face warranty, indemnity, and product liability claims arising from defective products.
Although our products meet our stringent quality requirements, they may contain undetected errors or defects, especially when first introduced or when new generations are released. Errors, defects, or poor performance can arise due to design flaws, defects in raw materials or components or manufacturing difficulties, which can affect both the quality and the yield of the product. In the first three quarters of 2019, we indeed experienced an increased number of single-phase inverter failures and heightened call center activity which we attributed to releasing new products and capabilities which is typically characterized by an initial period of stabilization until manufacturing processes are fully mature. Any actual or perceived errors, defects, or poor performance in our products could result in the replacement or recall of our products, shipment delays, rejection of our products, damage to our reputation, lost revenue, diversion of our engineering personnel from our product development efforts, and increases in customer service and support costs, all of which could have a material adverse effect on our business, financial condition, and results of operations.
Furthermore, defective components may give rise to warranty, indemnity, or product liability claims against us that exceed any revenue or profit we receive from the affected products. We offer a minimum 12-year limited warranty for our inverters, extendable to twenty five years for an additional cost, and a 25-year limited warranty for our power optimizers. Our limited warranties cover defects in materials and workmanship of our products under normal use and service conditions. As a result, we bear the risk of warranty claims long after we have sold products and recognized revenue. While we do have accrued reserves for warranty claims, our estimated warranty costs for previously sold products may change to the extent future products are not compatible with earlier generation products under warranty. Our warranty accruals are based on our assumptions and we do not have a long history of making such assumptions. As a result, these assumptions could prove to be materially different from the actual performance of our systems, causing us to incur substantial unanticipated expense to repair or replace defective products in the future or to compensate customers for defective products. Our failure to accurately predict future claims could result in unexpected volatility in, and have a material adverse effect on, our financial condition.
19
If one of our products were to cause injury to someone or cause property damage, including as a result of product malfunctions, defects, or improper installation, then we could be exposed to product liability claims. We could incur significant costs and liabilities if we are sued and if damages are awarded against us. Further, any product liability claim we face could be expensive to defend and could divert management’s attention. The successful assertion of a product liability claim against us could result in potentially significant monetary damages, penalties or fines, subject us to adverse publicity, damage our reputation and competitive position, and adversely affect sales of our products. In addition, product liability claims, injuries, defects, or other problems experienced by other companies in the residential solar industry could lead to unfavorable market conditions for the industry as a whole, and may have an adverse effect on our ability to attract new customers, thus harming our growth and financial performance.
If we do not forecast demand for our products accurately, we may experience product shortages, delays in product shipment, excess product inventory, or difficulties in planning expenses, which will adversely affect our business and financial condition.
Our products are manufactured according to our estimates of customer demand, which requires us to make multiple forecasts and assumptions relating to demand from solar PV installers and distributors, their end customers, and general market conditions. Because we sell a large portion of our products to larger solar installers and various distributors, who in turn sell to local installers, who in turn sell to their end customers, the system owner, we have limited visibility as to end customer demand and it is difficult to forecast future end-user demand to plan our operations. If we overestimate demand for our products, or if purchase orders are cancelled or shipments are delayed, we may have excess inventory that we cannot sell. Conversely, if we underestimate demand, we may not have sufficient inventory to meet end customer demand or to ramp up production at our contract manufacturers in a timely manner, or we could incur additional costs, lose market share, damage relationships with our distributors and end customers and forego potential revenue opportunities. For example, in late 2017, and during the years ended December 31, 2018 and 2019, we had high customer demand and certain component shortages which forced us to shorten transportation time from our factories in China by using air freight rather than less expensive ocean freight.
We face risks related to actual or threatened health epidemics and other outbreaks, which could significantly disrupt our manufacturing and operations.
Our business could be adversely impacted by the effects of a widespread outbreak of contagious disease, including the recent outbreak of respiratory illness caused by a novel coronavirus first identified in Wuhan, China. Any widespread outbreak of contagious diseases, and other adverse public health developments, could cause disruption to our suppliers and contract manufacturers located in China and elsewhere and have a material and adverse effect on our business operations. Our suppliers and manufacturers could be disrupted by worker absenteeism, quarantines, office and factory closures, disruptions to ports and other shipping infrastructure, or other travel or health-related restrictions. If our suppliers or manufacturers are so affected, our supply chain, manufacturing and product shipments will be delayed, which could adversely affect our business, operations and customer relationships. In addition, the macroeconomic effects of the coronavirus outbreak in China and other markets could result in a widespread health crisis that could adversely affect the economies and financial markets of many countries, resulting in an economic downturn that could affect demand for our products and likely impact our operating results. Our business is also highly dependent on travel of our sales, operations, quality and reliability and other managers and employees. Limitations placed on travel, both to China and other regions in Asia or elsewhere could significantly limit our ability to continue to market our products, establish relationships with new customers, lead training of installers and oversee and maintain quality control of our manufacturing lines. Although the impact of the coronavirus outbreak on our business and operations remains uncertain, the continued spread of the coronavirus or the occurrence of other epidemics and the imposition of related public health measures and travel restrictions may adversely impact our business, financial condition, operating results and cash flows.
We are dependent on ocean transportation to deliver our products in a cost efficient manner. If we are unable to use ocean transportation to deliver our products, our business and financial condition could be materially and adversely impacted.
We rely on commercial ocean transportation for the delivery of a large percentage of our products to our customers. We also rely on more expensive air transportation when ocean transportation is not available or compatible with the delivery time requirements of our customers or when we are unable to meet the growing volume demands of our customers and need to accelerate delivery times. Our ability to deliver our products via ocean transportation could be adversely impacted by shortages in available cargo capacity, changes by carriers and transportation companies in policies and practices, such as scheduling, pricing, payment terms and frequency of service or increases in the cost of fuel, taxes and labor, disruptions to ports and other shipping facilities as a result of the coronavirus or other epidemics, and other factors, such as labor strikes and work stoppages, not within our control. If we are unable to use ocean transportation and are required to substitute more expensive air transportation, our financial condition and results of operations could be materially and adversely impacted.
We depend upon a small number of outside contract manufacturers. Our operations could be disrupted if we encounter problems with these contract manufacturers.
While we are developing our own internal manufacturing capabilities, we rely upon our contract manufacturers to manufacture all of our products. We mainly rely on two contract manufacturers. Any change in our relationship with our contract manufacturers or changes to contractual terms of our agreements with the contract manufacturers could adversely affect our financial condition and results of operations. Our reliance on a small number of contract manufacturers makes us vulnerable to possible capacity constraints and reduced control over component availability, delivery schedules, manufacturing yields and costs. Even once we begin manufacturing in our facility in northern Israel, the expected production volumes will not be sufficient to relive our significant dependence on our contract manufacturers. In addition, we will remain heavily dependent on suppliers of the components needed for our manufacturing.
The revenues that our contract manufacturers generate from our orders represent a relatively small percentage of their overall revenues. As a result, fulfilling our orders may not be considered a priority in the event of constrained ability to fulfill all of their customer obligations in a timely manner. In addition, the facilities in which our products are manufactured are located outside of the U.S., currently in China, Vietnam and Hungary. The location of these facilities outside of key markets such as the U.S. increases shipping time, thereby causing a long lead time between manufacturing and delivery.
If any of our contract manufacturers were unable or unwilling to manufacture our products in required volumes and at high quality levels or renew existing terms under supply agreements, we would have to identify, qualify, and select acceptable alternative contract manufacturers. An alternative contract manufacturer may not be available to us when needed or may not be in a position to satisfy our quality or production requirements on commercially reasonable terms, including price. Any significant interruption in manufacturing would require us to reduce our supply of products to our customers or increase our shipping costs to make up for delays in manufacturing, which in turn could reduce our revenues, harm our relationships with our customers and damage our reputation with local installers and potential end-users, and cause us to forego potential revenue opportunities.
20
We may experience delays, disruptions, or quality control problems in our manufacturing operations.
Our product development, manufacturing, and testing processes are complex and require significant technological and production process expertise. Such processes involve a number of precise steps from design to production. Any change in our processes could cause one or more production errors, requiring a temporary suspension or delay in our production line until the errors can be researched, identified, and properly addressed and rectified. This may occur particularly as we introduce new products, modify our engineering and production techniques, and/or expand our capacity. In addition, our failure to maintain appropriate quality assurance processes could result in increased product failures, loss of customers, increased warranty reserve, increased production, and logistical costs and delays. Any of these developments could have a material adverse effect on our business, financial condition, and results of operations.
We depend on a limited number of suppliers for key components and raw materials in our products to adequately meet anticipated demand. Due to the limited number of such suppliers, any cessation of operations or production or any shortage, delay, price change, imposition of tariffs or duties, or other limitation on our ability to obtain the components and raw materials we use could result in sales delays, higher costs associated with air shipments, cancellations, and loss of market share.
We depend on limited or single source suppliers for certain key components and raw materials used to manufacture our products, making us susceptible to quality issues, shortages, and price changes. Any of these limited or single source suppliers could stop producing our components or supplying our raw materials, cease operations or be acquired by, or enter into exclusive arrangements with, one or more of our competitors. As a result, these suppliers could stop selling to us at commercially reasonable prices, or at all. Because there are a limited number of suppliers of solar PV system components, e-Mobility components and raw materials used to manufacture our products, including for manufacturing lithium-ion batteries, it may be difficult to quickly identify alternate suppliers or to qualify alternative components or raw materials on commercially reasonable terms, and our ability to satisfy customer demand may be adversely affected. Transitioning to a new supplier or redesigning a product to accommodate a new component manufacturer would result in additional costs and delays. These outcomes could harm our business or financial performance.
Managing our supplier and contractor relationships is particularly difficult when we are introducing new products and when demand for our products is increasing, especially if demand increases more quickly than we expect.
Any interruption in the supply of limited source components or raw materials for our products would adversely affect our ability to meet scheduled product deliveries to our customers, could result in lost revenue or higher expenses associated with increased air shipments required to meet customer demand in a timely manner, and would harm our business.
For example, during 2017, 2018 and to a lesser extent in 2019, the solar industry suffered from component shortages which affected our ability to timely receive components within lead time and caused an extension of certain lead times by our suppliers. This shortages resulted in a delay in cost reduction activities, which negatively impacted our gross margin, as well as necessitated expedited air shipments that had an impact on our operating margins.
Failure by our contract manufacturers or our component or raw material suppliers to use ethical business practices and comply with applicable laws and regulations may adversely affect our business.
We do not control our contract manufacturers or suppliers or their business practices. Accordingly, we cannot guarantee that they follow ethical business practices such as fair wage practices and compliance with environmental, safety, and other local laws. A lack of demonstrated compliance could lead us to seek alternative manufacturers or suppliers, which could increase our costs and result in delayed delivery of our products, product shortages, or other disruptions of our operations. Violation of labor or other laws by our manufacturers or suppliers or the divergence of a supplier’s labor or other practices from those generally accepted as ethical in the U.S. or other markets in which we do business could also attract negative publicity for us and harm our business.
21
Our results of operations may fluctuate from quarter to quarter, which could make our future performance difficult to predict and could cause our results of operations for a particular period to fall below expectations, resulting in a decline in the price of our common stock.
Our quarterly results of operations are difficult to predict and may fluctuate significantly in the future. We have experienced seasonal and quarterly fluctuations in the past as a result of seasonal fluctuations in our customers’ business. For example, our customers’ and end-users’ ability to install solar energy systems is affected by weather, as for example during the winter months in Europe and the northeastern U.S. Such installation delays can impact the timing of orders for our products. Further, given that we are operating in an industry that is affected by fluctuations as a result of economic factors such as tariff changes, the true extent of these fluctuations may have been masked by our recent growth rates and consequently may not be readily apparent from our historical results of operations and may be difficult to predict. Our financial performance, sales, working capital requirements, and cash flow may fluctuate, and our past quarterly results of operations may not be good indicators of future performance. Any substantial decrease in revenues would have an adverse effect on our financial condition, results of operations, cash flows, and stock price.
We rely on distributors and large installers to assist in selling our products, and the failure of these customers to perform as expected could reduce our future revenue.
We currently sell a substantial percentage of our products through distributors, who in turn sell to local installers, and through direct sales to large installers. We do not have exclusive arrangements with these third party distributors and large installers. Many of our distributors also market and sell products from our competitors, and all of our large installer customers also use products from our competitors. These distributors and large installers may terminate their relationships with us at any time and with little or no notice. Further, these distributors and large installers may fail to devote resources necessary to sell our products at the prices, in the volumes, and within the time frames that we expect, or may focus their marketing and sales efforts on products of our competitors. Termination of agreements with current distributors or large installers, failure by these distributors or large installers to perform as expected, or failure by us to cultivate new distributor or large installer relationships, could hinder our ability to expand our operations and harm our revenue and results of operations.
The loss of one or more members of our senior management team or other key personnel or our failure to attract additional qualified personnel may adversely affect our business and our ability to achieve our anticipated level of growth.
We depend on the continued services of our senior management team, including our chief executive officer and chief financial officer, and other key personnel, each of whom would be difficult to replace. The loss of any such personnel could have a material adverse effect on our business and ability to implement our business strategy. In August 2019, we announced the untimely death of Mr. Guy Sella, our chairman, chief executive officer and co-founder. While the Company’s short term performance has continued as planned and on target, we cannot ensure that his loss will not negatively impact the long term strategy execution and continued innovative planning of our Company, which was led in large part by him.
All of our employees, including our senior management, are free to terminate their employment relationships with us at any time. We do not maintain key-person insurance for any of our employees, including senior management.
Additionally, our ability to attract qualified personnel, including senior management and key technical personnel, is critical to the execution of our growth strategy. Competition for qualified senior management personnel and highly skilled individuals with technical expertise is extremely intense, and we face challenges identifying, hiring, and retaining qualified personnel in all areas of our business. In addition, integrating new employees into our team could prove disruptive to our operations, require substantial resources and management attention, and ultimately prove unsuccessful. Our failure to attract and retain qualified senior management and other key technical personnel could limit or delay our strategic efforts, which could have a material adverse effect on our business, financial condition, results of operations, and prospects.
If we fail to protect, or incur significant costs in defending our intellectual property and other proprietary rights, our business and results of operations could be materially harmed.
Our success depends to a significant degree on our ability to protect our intellectual property and other proprietary rights. We rely on a combination of patent, trademark, copyright, trade secret, and unfair competition laws, as well as confidentiality and license agreements and other contractual provisions with our customers, suppliers, employees, and others, to establish and protect our intellectual property and other proprietary rights. Our ability to enforce these rights is subject to general litigation risks, as well as uncertainty as to the enforceability of our IP rights in various countries. When we seek to enforce our rights, we may be subject to claims that our IP rights are invalid or not enforceable. Our assertion of IP rights may result in another party seeking to assert claims against us, which could harm our business. Our inability to enforce our IP rights under any of these circumstances can harm our competitive position and business.
We have applied for patents in the U.S., Europe, and China, some of which have been issued. We cannot guarantee that any of our pending applications will be approved or that our existing and future intellectual property rights will be sufficiently broad to protect our proprietary technology, and any failure to obtain such approvals or finding that our intellectual property rights are invalid or unenforceable could force us to, among other things, rebrand or re-design our affected products. In countries where we have not applied for patent protection or where effective intellectual property protection is not available to the same extent as in the U.S., we may be at greater risk that our proprietary rights will be misappropriated, infringed, or otherwise violated.
Our intellectual property may be stolen or infringed upon. In fact, as further detailed in Item 3 – “Legal Proceedings” we are engaged in a number of legal proceedings related to intellectual property. Litigation proceedings are inherently uncertain, and adverse rulings may occur, including monetary damages, or injunction stopping us from manufacturing or selling certain products, or requiring other remedies. These lawsuits are intended to protect our significant investment in our intellectual property but they also may consume management and financial resources for long periods of time and may not result in favorable outcome for us, which may adversely affect our business, results of operations or financial condition.
22
Third parties may assert that we are infringing upon their intellectual property rights, which could divert management’s attention, cause us to incur significant costs, and prevent us from selling or using the technology to which such rights relate.
Our competitors and other third parties hold numerous patents related to technology used in our industry. From time to time, we may also be subject to claims of intellectual property right infringement and related litigation, and, if we gain greater recognition in the market, we face a higher risk of being the subject of claims that we have violated others’ intellectual property rights. For example, in September 2018, our German subsidiary, SolarEdge Technologies GmbH received a complaint filed by SMA Solar Technology AG. The complaint, filed in the District Court Düsseldorf, Germany, alleges that SolarEdge's 12.5kW - 27.6kW inverters infringe two of plaintiff’s patents. In November 2019, the first instance court accepted the claim of infringement for one of the two patents and we have filed an appeal to the Appeals Court Dusseldorf and are challenging the validity of the allegedly infringed patent in the German Patent Court. Also, in November 2019 the first instance court stayed the infringement proceedings regarding the other one of the two patents since it considered it to be highly likely that the patent would be invalid. Although we are certain that we have meritorious defenses to the claims, responding to such claims can be time consuming, can divert management’s attention and resources and may cause us to incur significant expenses in litigation or settlement. While we believe that our products and technology do not infringe in any material respect upon any valid intellectual property rights of third parties, we cannot be certain that we would be successful in defending against any such claims. If we do not successfully defend or settle an intellectual property claim, we could be liable for significant monetary damages and could be prohibited from continuing to use certain technology, business methods, content, or brands. To avoid a prohibition, we could seek a license from the applicable third party, which could require us to pay significant royalties, increasing our operating expenses. If a license is not available at all or not available on reasonable terms, we may be required to develop or license a non-violating alternative, either of which could require significant effort and expense. If we cannot license or develop a non-violating alternative, we would be forced to limit or stop sales of our offerings and may be unable to effectively compete. Any of these results would adversely affect our business, financial condition, and results of operations.
We may become subject to claims for remuneration or royalties for assigned service invention rights by our employees, which could result in litigation and adversely affect our business.
We enter into agreements with our employees pursuant to which they agree that any inventions created in the scope of their employment or engagement are assigned to us or owned exclusively by us, depending on the jurisdiction, without the employee retaining any rights. A significant portion of our intellectual property has been developed by our employees in the course of their employment for us. Under the Israeli Patent Law, 5727-1967 (the “Patent Law”), inventions conceived by an employee during the scope of his or her employment with a company are regarded as “service inventions,” which belong to the employer, absent a specific agreement between the employee and employer giving the employee service invention rights. The Patent Law also provides that if there is no such agreement between an employer and an employee, the Israeli Compensation and Royalties Committee (the “Committee”), a body constituted under the Patent Law, shall determine whether the employee is entitled to remuneration for his or her inventions. Recent decisions by the Committee and the Israeli Supreme Court have created uncertainty in this area, as the Israeli Supreme Court held that employees may be entitled to remuneration for their service inventions despite having specifically waived any such rights. Further, the Committee has not yet determined the method for calculating this Committee-enforced remuneration. Although our employees have agreed that any rights related to their inventions are owned exclusively by us, we may face claims demanding remuneration in consideration for such acknowledgement. As a consequence of such claims, we could be required to pay additional remuneration or royalties to our current and/or former employees, or be forced to litigate such claims, which could negatively affect our business.
The loss of, or events affecting, one of our major customer could reduce our sales and have a material adverse effect on our business, financial condition, and results of operations.
For the year ended December 31, 2019, our major customer, which is also our largest customer was Consolidated Electrical Distributors Inc. (CED), and accounted for 20.4% of our revenues. Our next five largest customers for the year ended December 31, 2019 together accounted for 29.1% of our revenues. Our customers’ decisions to purchase our products are influenced by a number of factors outside of our control, including retail energy prices and government regulation and incentives, among others. In addition, these customers may decide to no longer use our products and services for other reasons which may be out of our control. Although we have agreements with some of our largest customers, these agreements do not have long-term purchase commitments and are generally terminable by either party after a relatively short notice period. The loss of, or events affecting, one or more of these customers could have a material adverse effect on our business, financial condition, and results of operations.
23
Consolidations in the solar industry among our current or potential customers or distributors may adversely affect our competitive position.
There has been an increase in consolidation activity among distributors, large installers, and other strategic partners in the solar industry. For example, in June 2016, Tesla Motors (TSLA) announced that it had submitted a proposal to acquire all of the outstanding shares of common stock of SolarCity Corporation. In June 2018, Enphase Energy (ENPH) announced its acquisition of SunPower’s (SPWR) microinverter business. This trend could further increase our reliance on a small number of customers for a significant portion of our sales and may negatively impact our competitive position in the solar market.
Our planned expansion into new geographic markets or new product lines or services could subject us to additional business, financial, and competitive risks.
In the year ended December 31, 2019, we sold our products in different countries, including the U.S., Belgium, France, Germany, Israel, Italy, the Netherlands, the United Kingdom, Australia, Japan, Korea, Sweden, Poland and Brazil among others. We have in the past, and may in the future, evaluate opportunities to expand into new geographic markets and introduce new product offerings and services that are a natural extension of our existing business. We also may from time to time engage in acquisitions of businesses or product lines with the potential to strengthen our market position, enable us to enter attractive markets, expand our technological capabilities, or provide synergy opportunities. For example, we intend to continue to introduce new products targeted at large commercial and utility-scale installations and to continue to expand into other international markets.
Our success operating in these new geographic or product markets, or in operating any acquired business, will depend on a number of factors, including our ability to develop solutions to address the requirements of the large commercial and utility-scale solar PV markets, timely qualification and certification of new products for large commercial and utility-scale solar PV installations, acceptance of power optimizers in solar PV markets in which they have not traditionally been used, our ability to manage increased manufacturing capacity and production, and our ability to identify and integrate any acquired businesses.
Further, we expect these new solar PV markets and the additional markets we have entered as a result of our recent acquisitions to have different characteristics from the markets in which we currently sell products, and our success will depend on our ability to adapt properly to these differences. These differences may include differing regulatory requirements, including tax laws, trade laws, labor regulations, tariffs, export quotas, customs duties, or other trade restrictions, limited or unfavorable intellectual property protection, international, political or economic conditions, restrictions on the repatriation of earnings, longer sales cycles, warranty expectations, product return policies and cost, performance and compatibility requirements. In addition, expanding into new geographic markets will increase our exposure to presently existing risks, such as fluctuations in the value of foreign currencies and difficulties and increased expenses in complying with U.S. and foreign laws, regulations and trade standards, including the Foreign Corrupt Practices Act of 1977, as amended (the “FCPA”).
Failure to develop and introduce these new products successfully, to successfully integrate acquired businesses or to otherwise manage the risks and challenges associated with our potential expansion into new product and geographic markets, could adversely affect our revenues and our ability to sustain profitability.
If we fail to manage our recent and future growth effectively, we may be unable to execute our business plan, maintain high levels of customer service, or adequately address competitive challenges.
We have experienced significant growth in recent periods with our annual product sales growing rapidly from approximately 152,500 inverters and approximately 3.6 million power optimizers in the fiscal year ending June 30, 2015, to annual product sales exceeding 664,000 inverters and 15.7 million power optimizers in the year ended December 31, 2019. We intend to continue to expand our business significantly within existing and new markets. This growth has placed, and any future growth may place, a significant strain on our management, operational, and financial infrastructure. In particular, we will be required to expand, train, and manage our growing employee base and scale and otherwise improve our IT infrastructure in tandem with that headcount growth. Our management will also be required to maintain and expand our relationships with customers, suppliers, and other third parties and attract new customers and suppliers, as well as manage multiple geographic locations.
Our current and planned operations, personnel, customer support, IT, information systems, and other systems and procedures might be inadequate to support our future growth and may require us to make additional unanticipated investment in our infrastructure. Our success and ability to further scale our business will depend, in part, on our ability to manage these changes in a cost-effective and efficient manner. If we cannot manage our growth, we may be unable to take advantage of market opportunities, execute our business strategies, or respond to competitive pressures. This could also result in declines in quality or customer satisfaction, increased costs, difficulties in introducing new offerings, or other operational difficulties. Any failure to effectively manage growth could adversely impact our business and reputation.
24
Fluctuations in currency exchange rates may negatively impact our financial condition and results of operations.
Although our financial results are reported in U.S. dollars, 48.7% of our revenues in the year ended December 31, 2019 were generated in currencies other than the U.S. Dollar. In addition, a significant portion of our operating expenses are accrued in New Israeli Shekels (primarily related to payroll) and, to a lesser extent, the Euro and other currencies. Our profitability is affected by movements of the U.S. dollar against the Euro, and, to a lesser extent, the New Israeli Shekel, Korean Won and other currencies in which we generate revenues, incur expenses, and maintain cash balances. Foreign currency fluctuations may also affect the prices of our products. Our prices are denominated primarily in U.S. dollars. If there is a significant devaluation of a particular currency, the prices of our products will increase relative to the local currency and may be less competitive. Despite our efforts to minimize foreign currency risks, primarily by maintaining cash balances in New Israeli Shekels, significant long-term fluctuations in relative currency values, in particular a significant change in the relative values of the Euro and, to a lesser extent, the New Israeli Shekel, Korean Won and other currencies, against the U.S. dollar could have an adverse effect on our profitability and financial condition.
From time to time, we may enter into forward contracts to hedge the exchange impacts on assets and liabilities denominated in Israeli Shekels, Euros and other currencies. As of December 31, 2019, we had no derivative instruments. We may use derivative financial instruments, such as foreign exchange forward contracts and put and call options, to mitigate the risk of changes in foreign exchange rates on accounts receivable and forecast cash flows denominated in certain foreign currencies. We may not be able to purchase derivative instruments adequate to fully insulate ourselves from foreign currency exchange risks.
Additionally, our hedging activities may also contribute to increased losses as a result of volatility in foreign currency markets. If foreign exchange currency markets continue to be volatile, such fluctuations in foreign currency exchange rates could materially and adversely affect our profit margins and results of operations in future periods. Also, the volatility in the foreign currency markets may make it difficult to hedge our foreign currency exposures effectively.
We may have exposure to greater than anticipated tax liabilities.
The determination of our worldwide provision for income taxes and other tax liabilities requires estimation and significant judgment, and there are many transactions and calculations where the ultimate tax determination is uncertain. Like many other multinational corporations, we are subject to tax in multiple jurisdictions, both in the U.S. and outside the U.S. Our determination of our tax liability may be subject to audit and review by applicable tax authorities. Any adverse outcome of any such audit or review could affect our business, and the ultimate tax outcome may differ from the amounts recorded in our financial statements and may materially affect our financial results in the periods for which such determination is made. While we have established reserves based on assumptions and estimates that we believe are reasonable to cover such eventualities, these reserves may prove to be insufficient.
In addition, our future income taxes could be adversely affected by earnings being lower than anticipated, or by the incurrence of losses, in jurisdictions that have lower statutory tax rates and higher than anticipated in jurisdictions that have higher statutory tax rates, by changes in the valuation of our deferred tax assets and liabilities, as a result of gains on our foreign exchange risk management program, or changes in tax laws, regulations, or accounting principles, as well as certain discrete items.
Various levels of government, such as U.S. federal and state legislatures, and international organizations, such as the Organization for Economic Co-operation and Development (“OECD”) and the European Union, are increasingly focused on tax reform and other legislative or regulatory action to increase tax revenue. Any such tax reform or other legislative or regulatory actions could increase our effective tax rate and may even create a double taxation event.
Any unauthorized access to, or disclosure or theft of personal information we gather, store, or use could harm our reputation and subject us to claims or litigation.
Our business and operations may be impacted by data security breaches and cybersecurity attacks, including attempts to gain unauthorized access to confidential data. We receive, store, and use certain personal information of our customers, and the end-users of our customers’ solar PV systems, including names, addresses, e-mail addresses, credit information, and energy production statistics. We also store and use personal information of our employees. We take steps to protect the security, integrity, and confidentiality of the personal information we collect, store, and transmit, however, we have been subject to cybersecurity attacks and other information technology system disruptions in the past and, there is no guarantee that inadvertent or unauthorized use or disclosure will not occur or that third parties will not gain unauthorized access to this information despite our efforts. Because techniques used to obtain unauthorized access or sabotage systems change frequently and generally are not identified until they are launched against a target, we and our suppliers or vendors may be unable to anticipate these techniques or to implement adequate preventative or mitigation measures.
25
Unauthorized use or disclosure of, or access to, any personal information maintained by us or on our behalf, whether through breach of our systems, breach of the systems of our suppliers or vendors by an unauthorized party, or through employee or contractor error, theft or misuse, or otherwise, could harm our business, particularly in light of the European General Data Protection Regulation and the California Consumer Privacy Act which came into effect January 1, 2020. If any such unauthorized use or disclosure of, or access to, such personal information were to occur, our operations could be seriously disrupted and we could be subject to demands, claims and litigation by private parties, and investigations, related actions, and penalties by regulatory authorities. In addition, we could incur significant costs in notifying affected persons and entities and otherwise complying with the multitude of foreign, federal, state, and local laws and regulations relating to the unauthorized access to, or use or disclosure of, personal information. Finally, any perceived or actual unauthorized access to, or use or disclosure of, such information could harm our reputation, substantially impair our ability to attract and retain customers, and have an adverse impact on our business, financial condition, and results of operations.
We could be adversely affected by any violations of the FCPA, the U.K. Bribery Act, and other foreign anti-bribery laws.
The FCPA generally prohibits companies and their intermediaries from making improper payments to foreign government officials for the purpose of obtaining or retaining business. Other countries in which we operate also have anti-bribery laws, some of which prohibit improper payments to government and non-government persons and entities. Our policies mandate compliance with these anti-bribery laws. However, we currently operate in and intend to further expand into, many parts of the world that have experienced governmental corruption to some degree and, in certain circumstances, strict compliance with anti-bribery laws may conflict with local customs and practices. In addition, due to the level of regulation in our industry, our entry into certain jurisdictions requires substantial government contact where norms can differ from U.S. standards. It is possible that our employees, subcontractors, agents, and partners may take actions in violation of our policies and anti-bribery laws. Any such violation, even if prohibited by our policies, could subject us to criminal or civil penalties or other sanctions, which could have a material adverse effect on our business, financial condition, cash flows, and reputation.
Third parties might attempt to gain unauthorized access to our network or seek to compromise our products and services.
From time to time, we face attempts by others to gain unauthorized access through the Internet or to introduce malicious software to our information technology (IT) systems. Additionally, malicious hackers may attempt to gain unauthorized access and corrupt the processes of hardware and software products that we manufacture and services we provide. We or our products may be a target of computer hackers, organizations or malicious attackers who attempt to gain access to our network or data centers or those of our customers or end users; steal proprietary information related to our business, products, employees, and customers; or interrupt our systems or those of our customers or others. From time to time, we encounter intrusions or attempts at gaining unauthorized access to our network. To date, none have resulted in any material adverse impact to our business or operations; however, there can be no guarantee that such impacts will not be material in the future. While we seek to detect and investigate all unauthorized attempts and attacks against our network and products, and to prevent their recurrence where practicable through changes to our internal processes and tools and/or changes to our products, we remain potentially vulnerable to additional known or unknown threats. In addition to intentional third-party cyber-security breaches, the integrity and confidentiality of Company and customer data may be compromised as a result of human error, product defects, or technological failures. Cyber-security breaches, whether successful or unsuccessful, and other IT system interruptions, including those resulting from human error and technological failures, could result in our incurring significant costs related to, for example, rebuilding internal systems, reduced inventory value, providing modifications to our products and services, defending against litigation, responding to regulatory inquiries or actions, paying damages, or taking other remedial steps with respect to third parties.
Our entry into business engagements with military bodies as our customers in the lithium-ion battery and energy storage business embodies a risk for potentially large-scale and uncapped liability.
As a result of the Kokam Acquisition, a small portion of our business involves the sale of products to military customers. Our sales to military customers often involve standard form contracts, which are less subject to negotiation than the agreements we enter into in our ordinary course of business. In particular, certain of these contracts involve unlimited damages provisions that could result in large-scale liabilities.
We may not have sufficient insurance coverage to cover business continuity.
We rely on a limited number of contracted manufacturers to manufacture our products as well as on component manufacturers which are sometimes a single source. As a result, a sustained or repeated interruption in the manufacturing of our products by such outsourced providers due to fire, flood, war, pandemic or nature disasters, and/or an interruption in the provision of the required components for our business by these components manufacturers may interfere with our ability to sell our products to our customers in a timely manner. The described nature of our business and our size, makes it difficult to insure some or all of such possible loss of profit, which may adversely affect our financial results.
26
Our business could be materially adversely affected as a result of the risks associated with acquisitions and investments. In particular, we may not succeed in making additional acquisitions or be effective in integrating such acquisitions.
As part of our growth strategy, we have made a significant number of acquisitions. We may continue to make acquisitions and investments in the future as part of our growth strategy. We frequently evaluate the tactical or strategic opportunities available related to complementary businesses, products or technologies. There can be no assurance that we will be successful in making additional acquisitions. Even if we are successful in making additional acquisitions, integrating an acquired company’s business into our operations or investing in new technologies may (1) result in unforeseen operating difficulties and large expenditures and (2) absorb significant management attention that would otherwise be available for the ongoing development of our business, both of which may result in the loss of key customers or personnel and expose us to unanticipated liabilities. Further, we may not be able to retain the key employees that may be necessary to operate the business we acquire and we may not be able to attract, in a timely manner, new skilled employees and management to replace them.
We may not be able to consummate acquisitions or investments that we have identified as crucial to the implementation of our strategy for other commercial or economic reasons. Further, we may not be able to obtain the necessary regulatory approvals, including those of competition authorities and foreign investment authorities, in countries where we seek to consummate acquisitions or make investments. For those and other reasons, we may ultimately fail to consummate an acquisition, even if we announce the intended acquisition.
If our goodwill or other intangible assets become impaired, our financial condition and results of operations could be negatively affected.
Due to our latest acquisitions, goodwill and other intangible assets totaled approximately $203.7 million, or approximately 13.6% of our total assets, as of December 31, 2019. We test our goodwill for impairment at least annually, or more frequently if an event occurs indicating the potential for impairment, and we assess on an as-needed basis whether there have been impairments in our other intangible assets. We make assumptions and estimates in this assessment which are complex and often subjective. These assumptions and estimates can be affected by a variety of factors, including external factors such as industry and economic trends, and internal factors such as changes in our business strategy or our internal forecasts. To the extent that the factors described above change, we could be required to record additional non-cash impairment charges in the future, which could negatively affect our financial condition and results of operations.
Environmental obligations and liabilities could have a substantial negative impact on our business, financial condition, and results of operations.
The manufacturing, assembly storage, transportation and disposal of our products require the use of hazardous materials that are subject to a broad array of environmental, health, and safety laws and regulations in the jurisdictions in which we operate such as RoHS (Restriction of Hazardous Substance), REACH (Registration, Evaluation, Authorization and Restriction of Chemicals), WEEE (Waste Electrical and Electronic Equipment) Directive, Conflict Minerals Regulation, California’s Proposition 65 (known as the Safe Drinking Water and Toxic Enforcement Act of 1986), K-REACH (Korean REACH) and more. Failure to comply with these laws and regulations may result in regulatory fines, penalties and legal liabilities, suspension of production of our products, adjustments or alterations to our manufacturing processes and damage to our reputation all of which may adversely impact our business and financial condition and result of operations.
Lithium-Ion used in our battery cells and packs can potentially catch fire or vent smoke and cause damage or injury
The battery cells and packs produced by our subsidiary, Kokam make use of lithium-ion cells. We regularly test our products and take safety measures when manufacturing, selling and installing battery cells and packs. However, due to the high energy density of lithium-ion cells, mishandling, inappropriate storage, non-compliance with safety instructions or field failures can potentially cause a battery cell to rapidly release its stored energy, which may in turn cause a thermal event that can ignite nearby materials, including other lithium-ion cells. As the use of lithium-ion batteries becomes more widespread, these events may occur more often, causing damage to property, injury, lawsuits and adverse publicity, which may adversely affect our reputation, results of operations or financial condition.
Risks Related to Operations in Israel
Conditions in Israel affect our operations and may limit our ability to develop, produce and sell our products.
Although we are incorporated in Delaware, our headquarters and research and development center are located in Israel. Accordingly, political, economic, and military conditions in Israel directly affect us. Israel has been involved in a number of armed conflicts and has been the target of terrorist activity. Ongoing state of hostility, varying in degree such as rocket fire from the Gaza Strip, including against civilian targets, has occurred on an irregular basis, disrupting day-to-day civilian activity and negatively affecting business conditions. Israel also faces threats from Hezbollah militants in Lebanon, and others. We cannot predict whether or when such armed conflicts or attacks may occur or the extent to which such events may impact us. Any future armed conflict, political instability or violence in the region may impede our ability to manage our business effectively or to engage in research and development, or may otherwise adversely affect our business or operations. In the event of war, we may be forced to cease operations, which may cause delays in the distribution and sale of our products. Some of our directors, executive officers, and employees in Israel are obligated to perform annual reserve duty in the Israeli military and are subject to being called for additional active duty under emergency circumstances. In the event that our principal executive office is damaged as a result of hostile action, or hostilities otherwise disrupting the ongoing operation of our offices, our ability to operate could be materially adversely affected.
Additionally, several countries, principally in the Middle East, restrict doing business with Israeli companies, and additional countries and groups may impose similar restrictions if hostilities in Israel or political instability in the region continue or increase. If recent regime changes and civil wars in neighboring states result in the establishment of fundamentalist Islamic regimes or governments more hostile to Israel, or if Egypt or Jordan abrogates its respective peace treaty with Israel, Israel could be subject to additional political, economic, and military confines, and our operations and ability to sell our products to countries in the region could be materially adversely affected. These restrictions may limit materially our ability to obtain manufactured components and raw materials or to sell our products.
27
Any hostilities involving Israel or the interruption or curtailment of trade between Israel and its present trading partners, or significant downturn in the economic or financial condition of Israel, could have a material adverse effect on our business, financial condition, and results of operations.
The tax benefits that are available to us under Israeli law require us to meet various conditions and may be terminated or reduced in the future, which could increase our costs and taxes.
Our Israeli subsidiary was eligible for certain tax benefits provided to “Benefited Enterprises” under the Israeli Law for the Encouragement of Capital Investments, 1959 (the “Investments Law”). Beginning in January 2019, and with respect to its taxable results from 2019 onwards, our Israeli subsidiary further elected to apply the terms of the Investments Law as per “Preferred Enterprise” or “Preferred Technological Enterprise” (“PTE”). In order to remain eligible for the tax benefits for “Benefited Enterprises” with respect to our Israeli subsidiary’s taxable results until 2018 and with respect to its taxable results from 2019 for “Preferred Enterprise” or “Preferred Technological Enterprise”, we must continue to meet certain conditions stipulated in the Investments Law and its regulations, as amended. If these tax benefits are reduced, cancelled, or discontinued, our Israeli taxable income would be subject to regular Israeli corporate tax rates and we may be required to refund any tax benefits that we have already received, plus interest and penalties thereon. The standard corporate tax rate for Israeli companies was 24% in 2017 and decreased further to 23% as of January 1, 2018 and onward. Additionally, if we increase our activities outside of Israel through acquisitions or otherwise through our Israeli subsidiary, our existing or expanded activities might not be eligible for inclusion in existing or future Israeli tax benefit programs. The Israeli government may furthermore independently determine to reduce, phase out, or eliminate entirely the benefit programs under the Investments Law, regardless of whether we then qualify for benefits under those programs at the time, which would also adversely affect our global tax rate and our results of operations.
It may be difficult to enforce a judgment of a U.S. court against our officers and directors, to assert U.S. securities laws claims in Israel, or to serve process on our officers and directors.
The majority of our directors and executive officers reside outside of the U.S., and most of our assets and most of the assets of these persons are located outside of the U.S. Consequently, a judgment obtained against any of these persons, including a judgment based on the civil liability provisions of the U.S. federal securities laws, may not be collectible in the U.S. It also may be difficult for you to effect service of process on these persons in the U.S. or to assert U.S. securities law claims in original actions instituted in Israel. Israeli courts may refuse to hear a claim based on an alleged violation of U.S. securities laws on the grounds that Israel is not the most appropriate forum in which to bring such a claim. In addition, even if an Israeli court hears a claim, it may determine that Israeli law and not U.S. law is applicable to the claim. If U.S. law is found to be applicable, the content of applicable U.S. law must be proven as a fact by expert witnesses, which can be a time consuming and costly process. Further, an Israeli court may not enforce a judgment awarded by a U.S. or other non-Israeli court. Certain matters of procedure will also be governed by Israeli law. There is little binding case law in Israel that addresses these matters. As a result of the difficulty associated with enforcing a judgment against any of these persons in Israel, you may not be able to obtain or enforce a judgment against many of our directors and executive officers.
Risks Related to the Ownership of Our Common Stock
We cannot assure you that our stock price will not decline or not be subject to significant volatility.
Shares of our common stock were sold in our initial public offering in March 2015 at a price of $18.00 per share, and during the year ended December 31, 2019, the reported high and low prices of our common stock ranged from $34.05 to $96.69 per share. The price of our stock may change in response to fluctuations in our results of operations in future periods and also may change in response to other factors, including factors specific to companies in our industry, many of which are beyond our control. As a result, our share price may experience significant volatility and may not necessarily reflect the value of our expected performance. Among other factors that could affect our stock price are:
•
the addition or loss of significant customers;
•
changes in laws or regulations applicable to our industry, products or services;
•
speculation about our business in the press or the investment community;
•
price and volume fluctuations in the overall stock market;
•
volatility in the market price and trading volume of companies in our industry or companies that investors consider comparable;
•
share price and volume fluctuations attributable to inconsistent trading levels of our shares;
28
•
our ability to protect our intellectual property and other proprietary rights;
•
sales of our common stock by us or our significant stockholders, officers and directors;
•
the expiration of contractual lock-up agreements;
•
the development and sustainability of an active trading market for our common stock;
•
success of competitive products or services;
•
the public’s response to press releases or other public announcements by us or others, including our filings with the Securities and Exchange Commission (the “SEC”), announcements relating to litigation or significant changes to our key personnel;
•
the effectiveness of our internal controls over financial reporting;
•
changes in our capital structure, such as future issuances of debt or equity securities;
•
our entry into new markets;
•
tax developments in the U.S., Europe, or other markets;
•
strategic actions by us or our competitors, such as acquisitions or restructurings; and
•
changes in accounting principles.
Further, the stock markets have experienced extreme price and volume fluctuations that have affected and continue to affect the market prices of equity securities of many companies. These fluctuations often have been unrelated or disproportionate to the operating performance of those companies. In addition, the stock prices of many renewable energy companies have experienced wide fluctuations that have often been unrelated to the operating performance of those companies. These broad market and industry fluctuations, as well as general economic, political, and market conditions such as recessions, interest rate changes, or international currency fluctuations, may cause the market price of our common stock to decline. In the past, many companies that have experienced volatility in the market price of their stock have been subject to securities class action litigation. We may be the target of this type of litigation in the future. Securities litigation against us could result in substantial cost and divert our management’s attention from other business concerns, which could seriously harm our business.
The price of our common stock could decline if securities analysts or other third parties publish inaccurate or unfavorable research about us or if one or more of our analysts ceases to cover us or to regularly publish reports about us.
The trading of our common stock is likely to be influenced by the reports and research that industry or securities analysts publish about us, our business, our market, or our competitors. If one or more securities or industry analysts downgrades our common stock or publishes inaccurate or unfavorable research about our business, our stock price would likely decline. If one or more securities or industry analysts ceases to cover the Company or fails to regularly publish reports on us, we could lose visibility in the financial markets, which in turn could cause our stock price or trading volume to decline.
Provisions in our certificate of incorporation and by-laws may have the effect of delaying or preventing a change of control or changes in our management.
Our certificate of incorporation and by-laws contain provisions that could depress the trading price of our common stock by discouraging, delaying, or preventing a change of control of our Company or changes in our management that the stockholders of our Company may believe advantageous. These provisions include:
•
authorizing “blank check” preferred stock that our board of directors could issue to increase the number of outstanding shares to discourage a takeover attempt;
•
providing for a classified board of directors with staggered, three-year terms, which could delay the ability of stockholders to change the membership of a majority of our board of directors;
29
•
not providing for cumulative voting in the election of directors, which limits the ability of minority stockholders to elect director candidates;
•
limiting the ability of stockholders to call a special stockholder meeting;
•
prohibiting stockholders from acting by written consent;
•
establishing advance notice requirements for nominations for election to our board of directors or for proposing matters that can be acted upon by stockholders at stockholder meetings;
•
the removal of directors only for cause and only upon the affirmative vote of the holders of at least 66⅔% in voting power of all the then-outstanding shares of common stock of the Company entitled to vote thereon, voting together as a single class;
•
providing that our board of directors is expressly authorized to amend, alter, rescind or repeal our by-laws; and
•
requiring the affirmative vote of holders of at least 66⅔% of the voting power of all of the then outstanding shares of common stock, voting as a single class, to amend provisions of our certificate of incorporation relating to the management of our business, our board of directors, stockholder action by written consent, advance notification of stockholder nominations and proposals, calling special meetings of stockholders, forum selection and the liability of our directors, or to amend, alter, rescind, or repeal our by-laws.
In addition, we are governed by the provisions of Section 203 of the Delaware General Corporation Law (“DGCL”), which generally prohibits a Delaware corporation from engaging in a broad range of business combinations with any “interested” stockholder for a period of three years following the date on which the stockholder becomes an “interested” stockholder.
Our certificate of incorporation includes a forum selection clause, which could limit our stockholders’ ability to obtain a favorable judicial forum for disputes with us.
Our certificate of incorporation provides that, unless we consent in writing to the selection of an alternative forum, the sole and exclusive forum for any stockholder (including any beneficial owner) to bring (i) any derivative action or proceeding brought on our behalf, (ii) any action asserting a claim of breach of a fiduciary duty owed by any of our directors, officers, or employees to us or to our stockholders, (iii) any action asserting a claim arising pursuant to any provision of the DGCL or our certificate of incorporation or by-laws, or (iv) any action asserting a claim governed by the internal affairs doctrine, will be a state court located within the State of Delaware (or, if no state court located within the State of Delaware has jurisdiction, the federal district court for the District of Delaware); in all cases subject to the court’s having personal jurisdiction over the indispensable parties named as defendants. Any person or entity purchasing or otherwise acquiring any interest in shares of our capital stock is deemed to have notice of and consented to the foregoing provisions. This forum selection provision may limit our stockholders’ ability to obtain a favorable judicial forum for disputes with us. It is also possible that, notwithstanding the forum selection clause that is included in our certificate of incorporation, a court outside of Delaware could rule that such a provision is inapplicable or unenforceable.
We do not intend to pay any cash dividends on our common stock in the foreseeable future.
We have never declared or paid any dividends on our common stock. We currently intend to retain any future earnings and do not expect to pay any dividends in the foreseeable future. Any future determination to declare cash dividends will be made at the discretion of our board of directors, subject to applicable laws and organizational documents, after taking into account our financial condition, results of operations, capital requirements, general business conditions, and other factors that our board of directors may deem relevant. As a result, capital appreciation in the price of our common stock, if any, may be your only source of gain on an investment in our common stock.
ITEM 1B.Unresolved Staff Comments
Not applicable.
ITEM 2.PROPERTIES
Our corporate headquarters are located in Herzliya Pituach, Israel.
Leased Offices and R&D Laboratories
As of December 31, 2019 we leased approximately 267,000 square feet of office, testing, and product design facilities in the aggregate in Israel.
In addition to our leased properties in Israel, we lease approximately 186,400 square feet of office, sales, support and lab space in the aggregate in California, China, Germany, Netherlands, Italy, France, Australia, UK, Japan, Turkey, Romania, India, Bulgaria, Belgium, Taiwan and Korea, as well as an R&D center in Bulgaria.
Manufacturing
We outsource most of our manufacturing to our manufacturing partners. We have a factory in which we manufacture lithium-ion batteries for Kokam’s operations (the “Kokam Factories”). In July 2017, we executed a long-term lease agreement for 103,400 square feet in Israel, intended for the establishment of a manufacturing facility for our solar products. That facility is anticipated to reach its full production capacity in the third quarter of 2020.
Owned Properties
In addition to our leased properties, we also own properties in Italy, the UK and Korea, which include an office space of approximately 5,600 square feet in the UK, 212,700 square feet of offices and manufacturing facilities in South Korea, and 61,000 square feet of offices and manufacturing facilities in Italy.
We believe that our existing properties are in good condition and are sufficient and suitable for the conduct of our business for the foreseeable future. To the extent our needs change as our business grows, we expect that additional space and facilities will be available on commercially reasonable terms.
30
ITEM 3.LEGAL PROCEEDINGS
In June and July 2018, we filed three lawsuits for patent infringement against Huawei Technologies Co., Ltd., a Chinese entity, Huawei Technologies Düsseldorf GmbH, a German entity, and WATTKRAFT Solar GmbH, a German distributor for Huawei. The lawsuits, filed in the Mannheim District Court in Germany, assert unauthorized use of patented technology, and are intended to protect SolarEdge’s significant investment in its innovative DC optimized inverter technology. Seeking monetary damages, an injunction, and recall of infringing Huawei inverters from the German market, the lawsuit is intended to prevent the defendants from selling any multi-level inverters infringing upon SolarEdge’s PV inverter technology protected in the asserted patents in Germany. In November 2019, one of the patents underlying one of the lawsuits was revoked by the European Patent Office and as such the relevant parallel infringement proceedings have been stayed. In the other two lawsuits hearings were held and in one of the proceedings the claim was dismissed and we have appealed to a higher court. The third lawsuit is pending a court appointed expert opinion. We intend to continue to vigorously fight to protect our patented technology.
In May 2019, we were served with three lawsuits by Huawei Technologies Co., Ltd., a Chinese entity (“Huawei”), against the Company's two Chinese subsidiaries and its equipment manufacturer in China. The lawsuits, filed in the Guangzhou Intellectual property court, allege infringement of three patents and ask for an injunction of manufacture, use, sale and offer for sale, and damage awards of approximately $4.3 million. We believe that we have meritorious defenses to the claims asserted by Huawei and intend to continue to vigorously defend against these lawsuits.
In October 2019, we announced that we filed three lawsuits in China against Huawei. The lawsuits, filed in the Regional Courts of Jinan and Shenzhen in China, cite unauthorized use of patented technology, and are intended to protect SolarEdge’s significant investment in its innovative DC optimized inverter technology. Seeking damages and an injunction, the lawsuits are intended to prevent Huawei from manufacturing and selling any products infringing upon SolarEdge’s patented PV inverter and power optimizer technology.
In September, 2018, our German subsidiary, SolarEdge Technologies GmbH received a complaint filed by a competitor, SMA Solar Technology AG (“SMA”). The complaint, filed in the District Court Düsseldorf, Germany, alleges that SolarEdge's 12.5kW - 27.6kW inverters infringe two of plaintiff’s patents. In its complaint, SMA requests inter alia an injunction and a determination for a claim for damages for sales in Germany. SMA also asserts a value in dispute of five million Euros for both patents. In November 2019, the first instance court accepted the claim of infringement for one of the two patents and we have filed an appeal to the Appeals Court Dusseldorf and are challenging the validity of the allegedly infringed patent in the German Patent Court. Also, in November 2019 the first instance court stayed the infringement proceedings regarding the other one of the two patents since it considered it to be highly likely that the patent would be invalid. We believe that we have meritorious defenses to the claims asserted and intend to vigorously defend against this lawsuit.
In August 2019, we were served with a lawsuit by certain former shareholders of SMRE, against the Company’s Italian subsidiary that purchased the shares of SMRE in the tender offer which followed the SMRE Acquisition. The lawsuit asks for damages of approximately $3 million, representing the difference between the amount for which they tendered their shares (6 Euro per share) and 6.7 Euros per share. We believe we have meritorious defenses to the claims asserted and intend to vigorously defend against this lawsuit.
In addition, in the normal course of business, we may from time to time be named as a party to various legal claims, actions and complaints (including as a result of initiating such legal claims, action or complaints on behalf of the Company). It is impossible to predict with certainty whether any resulting liability would have a material adverse effect on our financial position, results of operations or cash flows.
ITEM 4.MINE SAFETY DISCLOSURES
Not applicable.
31
PART II
ITEM 5.MARKET FOR REGISTRANT’S COMMON EQUITY, RELATED STOCKHOLDER MATTERS AND ISSUER PURCHASES OF EQUITY SECURITIES
Market Information
Our common stock, par value $0.0001 per share, trades on the NASDAQ Global Select Market, where prices are quoted under the symbol “SEDG”.
Holders of Record
As of December 31, 2019, there were 20 holders of record of our common stock. Because many of our shares of common stock are held by brokers and other institutions on behalf of stockholders, we are unable to estimate the total number of stockholders represented by these record holders.
Purchases of Equity Securities by the Issuer and Affiliated Purchases
As part of the SMRE Acquisition, we issued to a certain shareholder who also served as an executive in SMRE, Performance Stock Units or PSUs that were subject to certain performance goals and a vesting period. In December 2019, in connection with a separation agreement between the parties, the Company and the certain shareholder signed on an amendment to the original agreement that resulted, among other things, in the exercising of a call option by the Company with respect to 183,395 shares out of the granted PSUs, for a price per share equal to €0.01.
Performance Graph
The following graph compares the cumulative total shareholder return on our common stock from March 26, 2015 (using the price of which our shares of common stock were initially sold to the public) to December 31, 2019 to that of the total return of the Nasdaq Composite Index (INDEXNASDAQ.IXIC) and the MAC Global Solar Energy Index (SUNIDX). The comparison illustrates the relative change in stock price since our initial public offering on March 26, 2015. This graph is furnished and not “filed” with the Securities and Exchange Commission or “soliciting material” under the Securities Exchange Act of 1934 and shall not be incorporated by reference into any such filings, irrespective of any general incorporation contained in such filing.
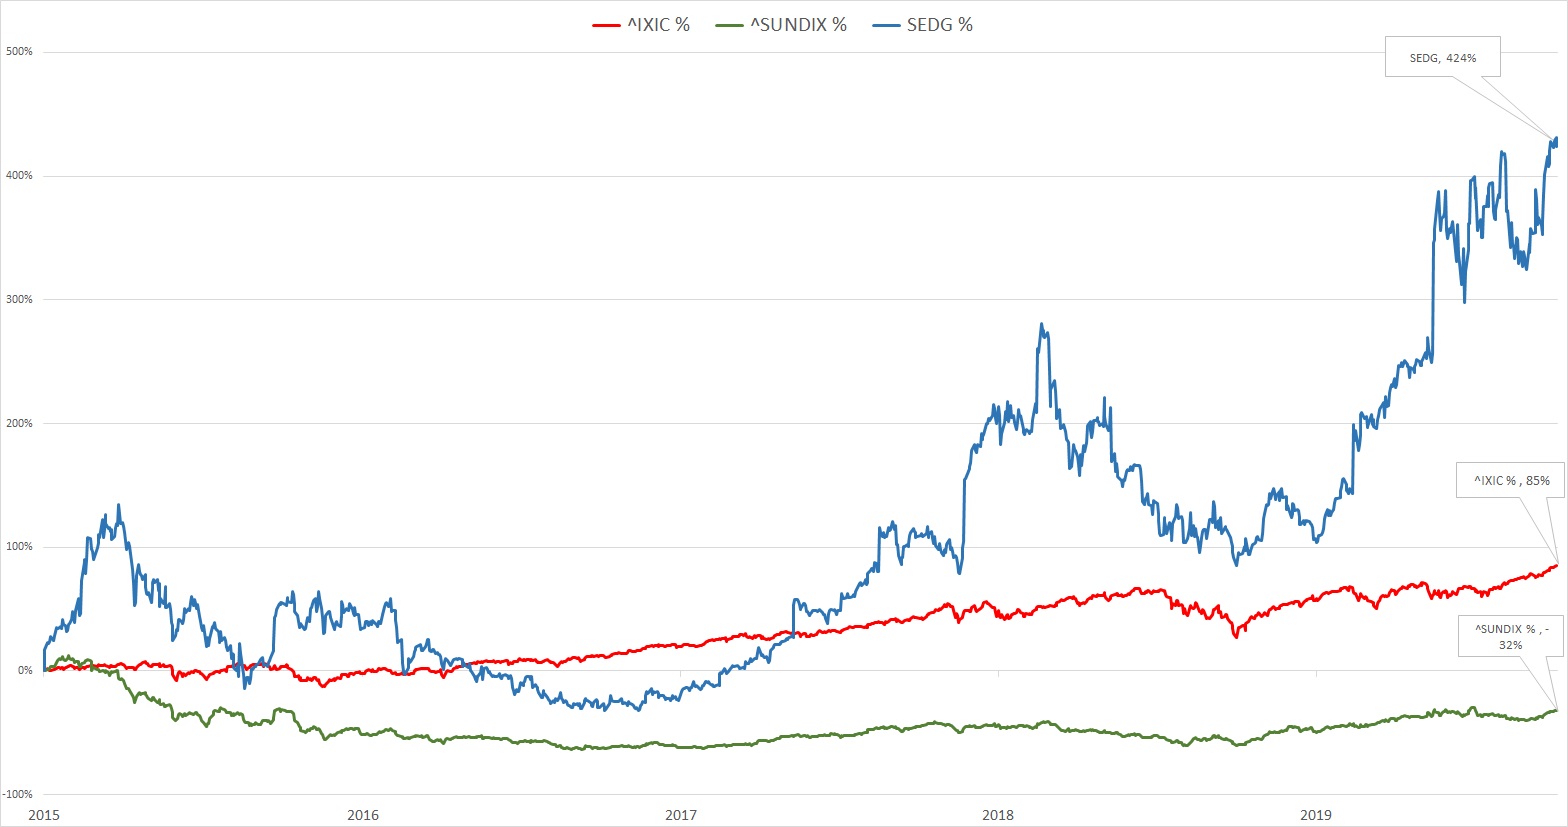
32
ITEM 6.SELECTED FINANCIAL DATA
Change in Fiscal Year
In 2016, our Board of Directors approved a change to our fiscal year end from June 30 to December 31. We made this change to align our fiscal year end with other companies within our industry. We refer to the period beginning July 1, 2015 and ending June 30, 2016 as “fiscal 2016”. We previously filed a Form 10-KT to cover the transition period for the six-month period of July 1, 2016 through December 31, 2016. Following Fiscal 2016 all of our fiscal reporting periods begin January 1 and end December 31,
Selected Financial Data
The selected consolidated statement of operations data for the years ended December 31, 2017, 2018 and 2019 and the selected consolidated balance sheet data as of December 31, 2017, December 31, 2018 and December 31, 2019, are derived from our audited consolidated financial statements included elsewhere in this Annual Report. The selected consolidated statements of operations data for the fiscal years ended June 30, 2015 and 2016 and the six months ended December 31, 2016 and the selected consolidated balance sheet data as of June 30, 2015 and 2016 and December 31, 2016 are derived from our audited financial statements not included in this Annual Report. Our historical results are not necessarily indicative of our results to be expected in any future period. These selected financial data should be read together with our consolidated financial statements and the related notes, as well as the section captioned “Management’s Discussion and Analysis of Financial Condition and Results of Operations” appearing elsewhere in this Annual Report.
| Twelve Months Ended June 30, | Six Months Ended December 31, | Years Ended December 31, | ||||||||||||||||||||||
| 2015 | 2016 | 2016 | 2017 | 2018 | 2019 | |||||||||||||||||||
| (In thousands) | ||||||||||||||||||||||||
| Consolidated Statements of Operations Data: | ||||||||||||||||||||||||
| Revenues | $ | 325,078 | $ | 489,843 | $ | 239,997 | $ | 607,045 | $ | 937,237 | $ | 1,425,660 | ||||||||||||
| Cost of revenues | 243,295 | 337,887 | 159,097 | 392,279 | 618,001 | 946,322 | ||||||||||||||||||
| Gross profit | 81,783 | 151,956 | 80,900 | 214,766 | 319,236 | 479,338 | ||||||||||||||||||
| Operating expenses: | ||||||||||||||||||||||||
| Research and development, net | 22,018 | 33,231 | 20,279 | 54,966 | 82,245 | 121,351 | ||||||||||||||||||
| Sales and marketing | 24,973 | 34,833 | 20,444 | 50,032 | 68,307 | 87,984 | ||||||||||||||||||
| General and administrative | 6,535 | 12,133 | 6,790 | 18,682 | 29,264 | 49,361 | ||||||||||||||||||
| Other | — | — | — | — | — | 30,696 | ||||||||||||||||||
| Total operating expenses | 53,526 | 80,197 | 47,513 | 123,680 | 179,816 | 289,392 | ||||||||||||||||||
| Operating income | 28,257 | 71,759 | 33,387 | 91,086 | 139,420 | 189,946 | ||||||||||||||||||
| Financial income (expenses) | (5,077 | ) | 471 | (2,789 | ) | 9,158 | (2,297 | ) | (11,343 | ) | ||||||||||||||
| Other expenses | 104 | — | — | — | — | — | ||||||||||||||||||
| Income before taxes on income | 23,076 | 72,230 | 30,598 | 100,244 | 137,123 | 178,603 | ||||||||||||||||||
| Taxes on income (tax benefit) | 1,955 | (4,379 | ) | 5,217 | 16,072 | 9,077 | 33,646 | |||||||||||||||||
| Net Income | $ | 21,121 | $ | 76,609 | $ | 25,381 | $ | 84,172 | $ | 128,046 | $ | 144,957 | ||||||||||||
| Net loss attributable to non-controlling interests | $ | — | $ | — | $ | — | $ | — | $ | 787 | $ | 1,592 | ||||||||||||
| Net income attributable to SolarEdge Technologies Inc. | $ | — | $ | — | $ | — | $ | — | $ | 128,833 | $ | 146,549 | ||||||||||||
| Net basic earnings per share of common stock attributable to SolarEdge Technologies, Inc. | $ | 0.30 | $ | 1.92 | $ | 0.62 | $ | 1.99 | $ | 2.85 | $ | 3.06 | ||||||||||||
| Net diluted earnings per share of common stock attributable to SolarEdge Technologies, Inc. | $ | 0.27 | $ | 1.73 | $ | 0.58 | $ | 1.85 | $ | 2.69 | $ | 2.90 | ||||||||||||
| Weighted average number of shares used in computing net basic earnings per share of common stock | 11,902,911 | 39,987,935 | 41,026,926 | 42,209,238 | 45,235,310 | 47,918,938 | ||||||||||||||||||
| Weighted average number of shares used in computing net diluted earnings per share of common stock | 15,269,448 | 44,376,075 | 43,839,342 | 45,425,307 | 47,980,002 | 50,195,661 | ||||||||||||||||||
33
| As of June 30, | As of December 31, | |||||||||||||||||||||||
| 2015 | 2016 | 2016 | 2017 | 2018 | 2019 | |||||||||||||||||||
| (In thousands) | ||||||||||||||||||||||||
| Consolidated Balance Sheet Data: | ||||||||||||||||||||||||
| Cash and cash equivalents | $ | 144,750 | $ | 74,032 | $ | 104,683 | $ | 163,163 | $ | 187,764 | $ | 223,901 | ||||||||||||
| Available-for-sale marketable securities | - | 111,609 | 118,727 | 180,384 | 192,936 | 211,021 | ||||||||||||||||||
| Total assets | 305,658 | 397,438 | 424,743 | 641,305 | 964,472 | 1,494,624 | ||||||||||||||||||
| Total debt | - | - | - | - | 20,149 | 15,846 | ||||||||||||||||||
| Total stockholders’ equity | $ | 166,944 | $ | 256,108 | $ | 288,778 | $ | 397,467 | $ | 570,726 | $ | 811,670 | ||||||||||||
Key Operating Metrics
We regularly review a number of metrics, including the key operating metrics set forth in the table below, to evaluate our business, measure our performance, identify trends affecting our business, formulate projections, and make strategic decisions.
| Years Ended December 31, | ||||||||||
| 2017 | 2018 | 2019 | ||||||||
| Inverters shipped | 317,288 | 455,793 | 665,520 | |||||||
| Power optimizers shipped | 7,367,921 | 11,351,678 | 15,801,378 | |||||||
| Megawatts shipped (1) | 2,461 | 3,919 | 5,618 | |||||||
| | |
| (1) | Calculated based on the aggregate nameplate capacity of inverters shipped during the applicable period. Nameplate capacity is the maximum rated power output capacity of an inverter as specified by the manufacturer. See “Management’s Discussion and Analysis of Financial Condition and Results of Operations—Performance Measures”. |
34
ITEM 7.MANAGEMENT’S DISCUSSION AND ANALYSIS OF FINANCIAL CONDITION AND RESULTS OF OPERATIONS
The following discussion and analysis of our financial condition and results of operations should be read in conjunction with the sections of this Annual Report on Form 10-K captioned “Selected Financial Data” and “Business” and our consolidated financial statements and the related notes to those statements included elsewhere in this Form 10-K. In addition to historical financial information, the following discussion and analysis contains forward‑looking statements that involve risks, uncertainties, and assumptions. Our actual results and timing of selected events may differ materially from those anticipated in these forward‑looking statements as a result of many factors, including those discussed under the sections of this Annual Report captioned “Special Note Regarding Forward‑Looking Statements” and “Risk Factors”.
Overview
Established in 2006, we developed a DC optimized inverter solution that changed the way power is harvested and managed in photovoltaic, known as PV systems. Our direct current, or DC optimized inverter system maximizes power generation while lowering the cost of energy produced by the PV system, for improved return on investment, or RoI. Additional benefits of the DC optimized inverter system include providing comprehensive and advanced safety features, improved design flexibility, and improved operating and maintenance, or O&M with module-level and remote monitoring. The typical SolarEdge optimized inverter system consists of our inverters, power optimizers, a communication device which enables access to a cloud based monitoring platform and in many cases, additional smart energy management solutions. Our solutions address a broad range of solar market segments, from residential solar installations to commercial and small utility‑scale solar installations. Since we began commercial shipments in 2010, we have shipped approximately 16.2 gigawatts (“GW”) of our DC optimized inverter systems and our products have been installed in solar PV systems in 133 countries.
Since introducing the optimized inverter solution in 2010, SolarEdge has expanded its activity to other areas of smart energy technology, both through organic growth and through acquisitions. By leveraging world-class engineering capabilities and with a relentless focus on innovation, SolarEdge now offers energy solutions which include not only residential, commercial and large scale PV systems but also product offerings in the areas of energy storage systems, or ESS, and backup, electric vehicle, or EV components and charging capabilities, home energy management, grid services and virtual power plants, lithium-ion batteries and uninterrupted power supply, known as UPS solutions.
We are a leader in the global module-level power electronics market according to IHS and as of December 31, 2019, we have shipped approximately 49.9 million power optimizers and 2.1 million inverters. More than 1.38 million installations, many of which may include multiple inverters, are currently connected to, and monitored through, our cloud‑based monitoring platform. As of December 31, 2019, we have shipped approximately 16.2 GW of our DC optimized inverter systems.
We primarily sell our products directly to large solar installers, EPCs, and indirectly to thousands of smaller solar installers through large distributors and electrical equipment wholesalers. Our sales strategy focuses on top‑tier customers in markets where electricity prices, irradiance (amount of sunlight), and government policies make solar PV installations economically viable. We also sell our power optimizers to several PV module manufacturers that offer PV modules with our power optimizer physically embedded into their modules.
In the year ended December 31, 2019, one customer accounted for 20.4% of our revenues and our top three customers (all distributors) together represented 35.4% of our revenues. Today, we address a broad range of energy market segments through our diversified product offering, including residential, commercial and large scale PV, energy storage and backup solutions, e-Mobility, home energy management, grid services and virtual power plants, batteries and uninterrupted power supply (UPS) solutions.
Our revenues were $607.0 million, $937.2 million, and $1,425.7 million for fiscal 2017, fiscal 2018, and fiscal 2019 respectively. Gross margins were 35.4%, 34.1%, and, 33.6% for fiscal 2017, fiscal 2018, and fiscal 2019 respectively. Net profits were $84.2 million, $128.8 million, and $146.5 million fiscal 2017, fiscal 2018, and fiscal 2019 respectively.
We continue to focus on our long‑term growth and profitability. We believe that our market opportunity is large and that the transition from traditional inverter architecture to DC optimized inverter architecture will continue as the architecture of choice for distributed solar installations globally. We believe that we are well positioned to benefit from this market trend. Additionally, we are expanding our offering with products such as storage inverters for increased self-consumption and backup, EV-charging inverters, smart meters, smart energy devices (sockets, water heater controllers, wireless relay), aimed to increase our average revenue per installation (ARPI). We intend to continue to invest in sales and marketing to acquire new customers in our existing markets and in adjacent markets, grow internationally and drive additional revenue. We aim to increase market share in the C&I segment and penetrate the utility segment through specialized product development. We expect to continue to invest in research and development to enhance our product offerings and develop new, cost-effective solutions.
We believe that our strategy for continued growth in the solar market results in an efficient operating base with relatively low expenses that will enable profitability on lower revenues relative to our competitors. We believe that our sales and marketing, research and development, and general and administrative costs will decrease as a percentage of revenue in the long‑term as we continue to grow due to economies of scale. With this increased operating leverage, we expect our gross and operating margins to increase in the long-term. With respect to our penetration of non-solar businesses in which we have invested, we expect that we will need to make significant research and development, sales and marketing investments before making those businesses profitable.
Performance Measures
In managing our business and assessing financial performance, we supplement the information provided by the financial statements with other operating metrics. These operating metrics are utilized by our management to evaluate our business, measure our performance, identify trends affecting our business, and formulate projections. We use metrics relating to yearly shipments (inverters shipped, power optimizers shipped, and megawatts shipped) to evaluate our sales performance and to track market acceptance of our products from year to year. We use metrics relating to monitoring (systems monitored and megawatts monitored) to evaluate market acceptance of our products and usage of our solution.
35
We provide the “megawatts shipped” metric, which is calculated based on nameplate capacity shipped, to show adoption of our system on a nameplate capacity basis. Nameplate capacity shipped is the maximum rated power output capacity of an inverter and corresponds to our financial results in that higher total capacities shipped are generally associated with higher total revenues. However, revenues increase with each additional unit, not necessarily each additional MW of capacity, sold. Accordingly, we also provide the “inverters shipped” and “power optimizers shipped” operating metrics.
Key Components of Our Results of Operations
The following discussion describes certain line items in our Consolidated Statements of Operations.
Revenues
We generate revenues from the sale of DC optimized inverter systems for solar PV installations which include power optimizers, inverters, EV chargers, smart energy devices, our cloud‑based monitoring platform as well as grid services. Our customer base mainly includes distributors, large solar installers, wholesalers, EPCs, and PV module manufacturers. In addition, following our recent acquisitions, we also generate revenues from the sale of lithium-ion cells, batteries and energy storage solutions, UPS systems, machinery and EV powertrain solutions for electric vehicles.
Our revenues from the sale of solar-related products are affected by changes in the volume and average selling prices of our DC optimized inverter systems. The volume and average selling price of our systems is driven by the supply and demand for our products, changes in the product mix between our residential and commercial products, the customer mix between large and small customers, the geographical mix of our sales, sales incentives, end‑user government incentives, seasonality, and competitive product offerings. Revenues from the sale of Kokam’s products are affected by the type of product sold (cell, battery or system) and the type of the battery that is sold. Revenues from the sale of UPS products and SMRE products are affected by the changes in the volumes, customers’ size and average selling prices of the products we sell.
Our revenue growth is dependent on our ability to expand our market share in each of the geographies in which we compete, expand our global footprint to new evolving markets, grow our production capabilities to meet demand, continue to develop and introduce new and innovative products that address the changing technology and performance requirements of our customers and expansion of the new businesses we acquired.
Cost of Revenues and Gross Profit
Cost of revenues consists primarily of product costs, including purchases from our contract manufacturers and other suppliers, as well as costs related to shipping, customer support, product warranty, personnel, depreciation of test and manufacturing equipment, hosting services for our cloud‑based monitoring platform, and other logistics services. Our product costs are affected by technological innovations, such as advances in semiconductor integration and new product introductions, economies of scale resulting in lower component costs, and improvements in production processes and automation. Some of these costs, primarily personnel and depreciation of test and manufacturing equipment, are not directly affected by sales volume.
With respect to Li-Ion batteries, cost of revenues consists primarily of materials costs, labor costs associated with the manufacturing, variable utility, and operational costs related to the cell and battery factories, depreciation and other fixed costs.
Except for the manufacturing and assembly activities related to our newly acquired businesses, we outsource our manufacturing to third‑party manufacturers and negotiate product pricing on a quarterly basis. Our third‑party manufacturers are responsible for funding the capital expenses incurred in connection with the manufacture of our products, except with regard to end-of-line testing equipment and the automated assembly lines for our power optimizers and the equipment for the manufacturing of sub-assemblies, as further described below (which resulted in capital expenditures of $13.6 million, $9.0 million and $23.2 million for the year ended December 31, 2017, the year ended December 31, 2018, and the year ended December 31, 2019 respectively). We expect to continue this funding arrangement in the future, with respect to any expansions to such existing lines. We also procure strategic and critical components from various approved vendors on behalf of our contract manufacturers. In fiscal 2019, higher than anticipated demand for our solar products has exceeded the production capacities of these manufacturers and we were required to use air freight, rather than less expensive ocean freight, to deliver the majority of our products. The expansion of current manufacturing sites by our contract manufacturers as well as our own manufacturing site, is anticipated to allow us to reduce these expenses in 2020 as well as to build sufficient inventory to continue our growth without the need to ship substantial amounts of products by air.
36
In 2017, 2018 and 2019 global shortages in power components used in our products and in other industries, such as electrical motor drives and uninterrupted power systems (UPS) caused disruptions to our ongoing manufacturing. This phenomenon combined with increased demand for our products required us to use expensive air shipments in order to meet our delivery schedule, which negatively affected our gross profit. We expect component shortages to continue to affect us in upcoming quarters, a combination of increased component safety stocks, qualification of additional suppliers, and increased capacity of our existing vendors coupled with continued expansion of the current manufacturing sites by our contract manufacturers, and the development and deployment of our proprietary automated assembly line (described below), will provide sufficient manufacturing capacity to meet our forecasted demands with lower shipment volumes of products by air freight.
We completed development and manufacturing our proprietary automated assembly lines for our power optimizers. Additionally, we manufacture sub-assemblies such as cables, and magnetics and own significant amounts of equipment in connection with such manufacturing activities. We expect to continue to invest in additional automated assembly lines in the future. We have designed and are responsible for funding all of the capital expenses associated with existing and future automated assembly lines. The current and expected capital expenses associated with these automated assembly lines will be funded out of our cash flows generation.
Key components of our logistics supply channel consist of third party distribution centers in the U.S., Europe, Australia, and Japan. Finished goods are either shipped to our customers directly from our contract manufacturers or shipped to third-party distribution centers and then, finally, shipped to our customers.
Cost of revenues also includes our operations and support department costs. The operations department is responsible for production management such as planning, procurement, supply chain, production methodologies, and machinery planning, logistics management and manufacturing support to our contract manufacturers, as well as the quality assurance of our products. Our support department provides customer and technical support at various levels through our call centers around the world as well as second and third-level support services which are provided by support personnel located in our headquarters. Our full‑time employee headcount in our operations, production and support departments has grown from 348 as of December 31, 2017 to 663 as of December 31, 2018 and to 1,031 as of December 31, 2019.
Part of the increase in our cost of revenues is derived from an increase in tariffs on Chinese made products sold in the U.S.
Gross profit may vary from quarter to quarter and is primarily affected by our average selling prices, product costs, product mix, customer mix, geographical mix, shipping method, warranty costs, and seasonality.
Operating Expenses
Operating expenses consist of research and development, sales and marketing, general and administrative and other expenses. Personnel‑related costs are the most significant component of each of these expense categories and include salaries, benefits, payroll taxes, commissions and stock‑based compensation. Our full‑time employee headcount in our research and development, sales and marketing, and general and administrative departments has grown from 660 as of December 31, 2017 to 1,074 to as of December 31, 2018 and to 1,400 as of December 31, 2019. We expect to continue to hire significant numbers of new employees to support our growth. The timing of these additional hires could materially affect our operating expenses in any particular period, both in absolute dollars and as a percentage of revenue. We expect to continue to invest substantial resources to support our growth and anticipate that each of the following categories of operating expenses will increase in absolute dollar amounts for the foreseeable future.
Research and development expenses
Research and development expenses include personnel‑related expenses such as salaries, benefits, stock‑based compensation, and payroll taxes. Our research and development employees are engaged in the design and development of power electronics, semiconductors, software, power line communications, networking and chemistry. Our research and development expenses also include third‑party design and consulting costs, materials for testing and evaluation, ASIC development and licensing costs, depreciation expense, and other indirect costs. We devote substantial resources to ongoing research and development programs that focus on enhancements to and cost efficiencies in our existing products and timely development of new products that utilize technological innovation, thereby maintaining our competitive position.
37
Sales and marketing expenses
Sales and marketing expenses consist primarily of personnel‑related expenses such as salaries, sales commissions, benefits, payroll taxes, and stock‑based compensation. These expenses also include travel, fees of independent consultants, trade shows, marketing, costs associated with the operation of our sales offices, and other indirect costs. The expected increase in sales and marketing expenses is due to an expected increase in the number of sales and marketing personnel and the expansion of our global sales and marketing footprint, enabling us to increase our penetration of new markets. In the year ended December 31, 2019, 38.2% of our revenues were generated from Europe, 47.6% of our revenues are generated from the USA and 14.2% of our revenues are generated from ROW. In the year ended December 31, 2018, 32% of our revenues were generated from Europe, 53.9% of our revenues are generated from the USA and 14.1% of our revenues were generated from ROW. In the year ended December 31, 2017, 32.7% of our revenues were generated from Europe, 57.5% of our revenues were generated from the USA and 9.8% of our revenues were generated from ROW. We currently have a sales presence in the U.S., Canada, France, Germany, Italy, the Netherlands, the United Kingdom, Israel, Turkey, Japan, Australia, China, Sweden, Poland, India, Belgium, Korea, Brazil and Taiwan. We intend to continue to expand our sales presence to additional countries.
General and administrative expenses
General and administrative expenses consist primarily of salaries, employee benefits, and stock‑based compensation related to our executives, finance, human resources, information technology, and legal organizations, travel expenses, facilities costs, fees for professional services, and registration fees related to being a publicly-traded company. Professional services consist of audit and legal costs, remuneration to board members, insurance, information technology, and other costs. General and administrative expenses also include allowance for doubtful accounts in the event of uncollectable account receivables balances.
Other expenses
Other expenses consist primarily of losses related to the sale of an SMRE subsidiary originally acquired as part of the SMRE Acquisition, stock‑based compensation related to the untimely death of Mr. Guy Sella, our Founder, who had served as CEO and Chairman of the Board of Directors until shortly before his passing On August 25, 2019, modification of PSUs terms originally granted as part of the SMRE Acquisition and a legal claim acquired as part of the Kokam Acquisition which was settled in arbitration.
Non-Operating Expenses
Financial income (expenses)
Financial income (expenses) consists primarily of interest income, interest expense, gains or losses from foreign currency fluctuations and hedging transactions.
Interest income consists of interest from our investment in available for sale marketable securities.
Interest expense consists of interest related to loans taken by Kokam and SMRE, advance payments received for performance obligations that extend for a period greater than one year, as part of the adoption of Accounting Standard Codification 606, “Revenue from Contracts with Customers” (ASC 606) and interest related to the adoption of Accounting Standard Codification 842, “Leases” (ASC 842).
Our functional currency is the U.S. Dollar. With respect to certain of our subsidiaries, the functional currency is the applicable local currency. Financial expenses, net is net of financial income which consists primarily of the effect of foreign exchange differences between the U.S. Dollar and the New Israeli Shekel, the Euro, the Korean Won and other currencies, related to our monetary assets and liabilities, and the realization of gain from hedging transactions.
Taxes on income
We are subject to income taxes in the countries where we operate.
In the year ended December 31, 2017, we recorded net income tax expenses of $19.8 million for federal and state tax in the U.S., which consists of $19.9 million current income tax expenses and $0.1 million deferred tax. In the year ended December 31, 2018, we recorded net income tax expenses of $12.6 million for federal and state tax in the U.S., which consists of $13.9 million current income tax expenses and $1.3 million deferred tax benefit. In the year ended December 31, 2019, we recorded net income tax expenses of $6.7 million for federal and state tax in the U.S., which consists of $10.1 million current income tax expenses and $3.4 million deferred tax benefit.
38
On December 22, 2017, the Tax Cuts and Jobs Act (the "Tax Act") was signed into law making significant changes to U.S. income tax law. These changes include, but are not limited to, a corporate tax rate decrease from 35% to 21% effective for tax years 2018 onwards, created new taxes on certain foreign-sourced earnings and certain related-party payments.
Due to the timing of the enactment and the complexity involved in applying the provisions of the Tax Act, we made reasonable estimates of the effects and recorded provisional amounts in our consolidated financial statements as of December 31, 2017. As we collected and prepared necessary data, and interpreted the additional guidance issued by the U.S. Treasury Department, the IRS, and other standard-setting bodies, we made adjustments, over the course of 2018, to the provisional amounts including refinements to deferred taxes. The accounting for the tax effects of the Tax Act was completed as of December 31, 2018.
The Tax Act required us to pay U.S. income taxes on accumulated foreign subsidiary earnings not previously subject to U.S. income tax at a rate of 15.5% to the extent of foreign cash and certain other net current assets and 8% on the remaining earnings. The Company has elected to pay its transition tax over an eight-year period as provided in the Tax Act.
SolarEdge Technologies Ltd., our Israeli subsidiary, is taxed under Israeli law. Income not eligible for benefits under the Investments Law is taxed at the corporate tax rate. Amendments of the Israeli Income Tax Ordinance (New Version), 1961 (the “Tax Ordinance”) decreased the corporate tax rate to 23% command 24% starting January 1, 2018.
Our Israeli subsidiary elected tax year 2012 as a "Year of Election" for “Benefited Enterprise” under the Israeli Investments Law, which provides certain benefits, including tax exemptions and reduced tax rates. Income not eligible for Benefited Enterprise benefits is taxed at the then prevailing regular corporate tax rate. Upon meeting the requirements under the Israeli Investments Law, income derived from productive activity under the Benefited Enterprise status, would subject to certain terms and limits, will be exempt from tax for two years from the year in which the Israeli subsidiary first generated taxable income. Because SolarEdge Technologies Ltd. utilized all of its losses carryforwards in the six months ended in December 31, 2016, and as it was granted an approval by the Israeli Tax Authorities (“ITA”) in this regard, the two-year tax exemption has ended on December 31, 2018.
The Investment Law was amended in 2005 and was further amended as of January 1, 2011 and in August 2013 (the “2011 Amendment”). The 2011 Amendment canceled the availability of the benefits granted in accordance with the provisions of the Investments Law prior to 2011 and, instead, introduced new benefits for income generated by a “Preferred Company” through its “Preferred Enterprise” (both as defined in the 2011 Amendment). Under the 2011 Amendment, income derived by Preferred Companies from Preferred Enterprise would be subject to a uniform rate of corporate tax for an unlimited period as opposed to the incentives prior to the 2011 Amendment that were limited to income from Approved or Benefited Enterprise during the respective benefits period. According to the 2011 Amendment (considering the rates as amended in the 2017 Amendment as defined herein), the tax rate applicable to such income, referred to as “Preferred Income”, would be 7.5% in areas in Israel that are designated as Development Zone A and 16% elsewhere in Israel in the year 2017 and thereafter. Under the transitional provisions of the 2011 Amendment, companies may elect to irrevocably implement the 2011 Amendment while waiving benefits provided under the legislation prior to the 2011 Amendment or keep implementing the legislation prior to the 2011 Amendment.
In December 2016, Amendment 73 to the Investments Law (the “2017 Amendment") was published. According to the 2017 Amendment, special tax tracks for technological enterprises have been introduced, which are subject to rules that were issued by the Israeli Ministry of Finance. A Technological Preferred Enterprise, as defined in the 2017 Amendment, that is located in the central region of Israel, will be subject to tax at a rate of 12% on profits deriving from intellectual property (in Development Zone A - a tax rate of 7.5%).
39
On June 14, 2017, the Encouragement of Capital Investments Regulations (Preferred Technological Income and Capital Gain for Technological Enterprise), 2017 (the “Regulations”) were published. The Regulations describe, inter alia, the mechanism used to determine the calculation of the benefits under the PTE regime and determine certain requirements relating to documentation of intellectual property for the purpose of the PTE. According to these provisions, a company that complies with the terms under the PTE regime may be entitled to certain tax benefits with respect to certain income generated during the company’s regular course of business and derived from the preferred intangible asset (as determined in the Investments Law), excluding certain portion of income as prescribed therein.
As of January 2019, SolarEdge Technologies Ltd. elected to implement the 2011 and 2017 Amendments, starting as of tax year 2019. Under the PTE regime with respect to our business activities in Israel we expect that SolarEdge Technologies Ltd. will be entitled to an effective tax at a rate of 12.3%.
Our production facilities in Israel are not located in Development Zone A. SolarEdge Technologies Ltd. is in the final stages of developing its own manufacturing facilities in Israel, which will be located in a Development Zone A.
The Law for the Encouragement of Industry (Taxes), 1969, (the “Industry Encouragement Law”), provides certain tax benefits for an ‘Industrial Company’ as such term is defined in the Industry Encouragement Law. An Industrial Company is entitled to certain tax benefits including, inter alia: (i) amortization over an eight-year period of the cost of purchased know-how and patents and rights to use a patent and know-how which are used for the development or advancement of the company; and (ii) accelerated depreciation rates on equipment and buildings. Eligibility for benefits under the Industry Encouragement Law is not subject to receipt of prior approval from any governmental authority. We believe that our Israeli subsidiary currently qualifies as an Industrial Company; however, there can be no assurance that it will continue to so qualify or that the benefits described above will be available to it in the future. Furthermore, the ITA may determine that we do not qualify as an Industrial Company, which could entail a loss of the benefits that relate to that status.
Israeli tax law (Section 20A of the Tax Ordinance) allows, under certain conditions, a tax deduction for certain research and development expenses as prescribed in the Tax Ordinance for the year in which they are paid, subject to appropriate approval by the relevant Israeli government ministry, determined by the field of research. Expenses incurred in scientific research that are not approved by the relevant Israeli government ministry will be deductible over a three-year period commencing from the tax year in which they are paid. Our Israeli subsidiary did not obtain to date such approval.
Results of Operations
The following tables set forth our consolidated statements of operations for the years ended December 31, 2017, 2018 and 2019. We have derived this data from our consolidated financial statements included elsewhere in this Annual Report. This information should be read in conjunction with our consolidated financial statements and related notes included elsewhere in this this Annual Report. The results of historical periods are not necessarily indicative of the results of operations for any future period.
Comparison of year ended December 31, 2018 and year ended December 31, 2019
| Year ended December 31, | 2018 to 2019 | |||||||||||||||
| 2018 | 2019 | Change | ||||||||||||||
| (In thousands) | ||||||||||||||||
| Revenues | $ | 937,237 | $ | 1,425,660 | $ | 488,423 | 52.1 | % | ||||||||
| Cost of revenues | 618,001 | 946,322 | 328,321 | 53.1 | % | |||||||||||
| Gross profit | 319,236 | 479,338 | 160,102 | 50.2 | % | |||||||||||
| Operating expenses: | ||||||||||||||||
| Research and development | 82,245 | 121,351 | 39,106 | 47.5 | % | |||||||||||
| Sales and marketing | 68,307 | 87,984 | 19,677 | 28.8 | % | |||||||||||
| General and administrative | 29,264 | 49,361 | 20,097 | 68.7 | % | |||||||||||
| Other operating expenses | - | 30,696 | 30,696 | N/A | ||||||||||||
| Total operating expenses | 179,816 | 289,392 | 109,576 | 60.9 | % | |||||||||||
| Operating income | 139,420 | 189,946 | 50,526 | 36.2 | % | |||||||||||
| Financial expenses | 2,297 | 11,343 | 9,046 | 393.8 | % | |||||||||||
| Income before taxes on income | 137,123 | 178,603 | 41,480 | 30.3 | % | |||||||||||
| Taxes on income | 9,077 | 33,646 | 24,569 | 270.7 | % | |||||||||||
| Net income | $ | 128,046 | $ | 144,957 | $ | 16,911 | 13.2 | % | ||||||||
| Net loss attributable to Non-controlling interests | 787 | 1,592 | 805 | 102.3 | % | |||||||||||
| Net income attributable to SolarEdge Technologies Inc. | $ | 128,833 | $ | 146,549 | $ | 17,716 | 13.8 | % | ||||||||
40
Revenues
| Year Ended December 31, | 2018 to 2019 | |||||||||||||||
| 2018 | 2019 | Change | ||||||||||||||
| (In thousands) | ||||||||||||||||
| Revenues | $ | 937,237 | $ | 1,425,660 | $ | 488,423 | 52.1 | % | ||||||||
Revenues increased by $488.4 million, or 52.1%, in 2019 as compared to 2018 primarily due to (i) an increase in the number of inverters and power optimizers sold, with significant growth in revenues coming from Europe, the U.S. and Israel; (ii) price increases on products sold in the U.S. intended to offset the newly imposed tariffs on China made products; and (iii) revenues from the new businesses we acquired, which includes sales of UPS units, batteries, storage systems, and products sold by SMRE, in an aggregate amount of $89.0 million in the year ended December 31, 2019, compared to $23.0 million in the year ended December 31, 2018. Revenues from outside of the U.S. comprised 52.4% of our revenues in 2019 as compared to 46.1% in 2018.
The number of power optimizers sold increased by approximately 4.3 million units, or 38.2%, from approximately 11.4 million units in 2018 to approximately 15.7 million units in 2019. The number of inverters sold increased by approximately 210,000 units, or 46.3%, from approximately 454,000 units in 2018 to approximately 664,000 units in 2019. In addition, we increased prices in the U.S. in 2019, in order to offset the impact of the increase in tariffs on goods made in China that became effective June 1, 2019. This increase in selling prices was partially offset by the devaluation of the Euro and the Australian Dollar compared to the U.S. Dollar, negatively impacting our U.S. Dollar denominated average selling price (“ASP”). Overall, and primarily due to the factors detailed above, our ASP per watt for units shipped increased by $0.005, or 2.3%, in 2019 compared to 2018.
Cost of Revenues and Gross Profit
| Year Ended December 31, | 2018 to 2019 | |||||||||||||||
| 2018 | 2019 | Change | ||||||||||||||
| (In thousands) | ||||||||||||||||
| Cost of revenues | $ | 618,001 | $ | 946,322 | $ | 328,321 | 53.1 | % | ||||||||
| Gross profit | $ | 319,236 | $ | 479,338 | $ | 160,102 | 50.2 | % | ||||||||
41
Cost of revenues increased by $328.3 million, or 53.1%, in 2019 as compared to 2018, primarily due to:
•
an increase in the volume of products sold;
•
increased customs tariffs, shipment and logistics costs of $67.7 million attributed to the change in tariff rates on Chinese made products imported into the U.S. from 10% to 25% as well as an increase in air shipments due to increased product demand which required us to increase manufacturing capacity and expedite shipments for timely delivery;
•
an increase in warranty expenses and warranty accruals of $24.3 million associated primarily with the rapid increase of products in our install base; this increase was partially offset by various cost reductions on the different elements of our warranty expenses which include the cost of the products, shipment and other related expenses;
•
inclusion of variable costs related to the assembly of UPS products, manufacturing of Kokam and SMRE products in an aggregate amount of $56.9 million in 2019, compared to $19.7 million for 2018 as Gamatronic and Kokam were partially represented in our results for the year ended December 31, 2018 and SMRE was acquired in January of 2019;
•
an increase in personnel-related costs of $20.4 million related to the expansion of our operations and support headcount which is growing in parallel to our growing install base worldwide and in connection with entering into the UPS, storage, machinery and integrated powertrain technology businesses; and
•
an increase in amortization of intangible assets and cost of product adjustment of $8.3 million related to the Gamatronic Acquisition, the Kokam Acquisition and the SMRE Acquisition;
Gross profit as a percentage of revenue decreased from 34.1% in 2018 to 33.6% in 2019, primarily due to:
•
increased shipment and logistics costs resulted from our expedited growth and heavy reliance on air-shipments, new customs tariff rules in the U.S. and an increase in air shipments;
•
the arithmetic effect from the increase in selling prices in the U.S. intended to offset the increase in tariffs on Chinese made products and the same increase in cost of goods sold as a result of the increased tariffs;
•
lower gross profit from our UPS products, battery solutions and SMRE products and underutilization of Kokam’s manufacturing facilities;
•
increased actual support costs related to our warranty obligations; and
•
amortization of intangible assets and cost of product adjustment related to the Gamatronic Acquisition, the Kokam Acquisition and the SMRE Acquisition;
These were partially offset by:
•
general economies of scale in our personnel-related costs and other costs associated with our support and operations departments.
•
increased profit on the units sold due to a combination of stable average selling prices and cost reductions in the manufacturing process of these products; and
•
decreased warranty accruals due to various cost reductions on the different elements of our warranty expenses which include the cost of the products, shipment and other related expenses;
Operating Expenses:
Research and Development
| Year Ended December 31 | 2018 to 2019 | |||||||||||||||
| 2018 | 2019 | Change | ||||||||||||||
| (In thousands) | ||||||||||||||||
| Research and development | $ | 82,245 | $ | 121,351 | $ | 39,106 | 47.5 | % | ||||||||
Research and development increased by $39.1 million, or 47.5%, in 2019 as compared to 2018, primarily due to:
•
increased personnel-related costs of $31.0 million resulting from an increase in our research and development headcount as well as salary expenses associated with employee equity-based compensation. The increase in headcount reflects the inclusion of personnel costs from acquired businesses as well as our continued investment in enhancements of existing products and research and development expenses associated with bringing new products to the market;
•
increased expenses related to consultants and sub‑contractors in an amount of $4.5 million.
•
increased expenses related to material consumption costs in an amount of $1.6 million;
42
•
increased expenses related to other overhead costs and other expenses in an amount of $1.2 million; and
•
increased expenses related to amortization and depreciation expenses $0.8 million;
Sales and Marketing
| Year Ended December 31, | 2018 to 2019 | |||||||||||||||
| 2018 | 2019 | Change | ||||||||||||||
| (In thousands) | ||||||||||||||||
| Sales and marketing | $ | 68,307 | $ | 87,984 | $ | 19,677 | 28.8 | % | ||||||||
Sales and marketing expenses increased by $19.7 million, or 28.8%, in 2019 as compared to 2018, primarily due to:
•
increased personnel-related costs of $15.4 million as a result of the inclusion of personnel costs from acquired businesses and an increase in headcount supporting our growth in the U.S., Europe and Asia, as well as salary expenses associated with employee equity-based compensation;
•
increased expenses related to other overhead costs and travel expenses in an amount of $1.5 million;
•
increased expenses related to amortization and depreciation expenses in an amount of $1.4 million;
•
increased expenses related to marketing activity in an amount of $0.9 million; and
•
increased expenses related to external consultants and sub-contractors, material consumption costs and other expenses in an amount of $0.5 million.
General and Administrative
| Year Ended December 31, | 2018 to 2019 | |||||||||||||||
| 2018 | 2019 | Change | ||||||||||||||
| (In thousands) | ||||||||||||||||
| General and administrative | $ | 29,264 | $ | 49,361 | $ | 20,097 | 68.7 | % | ||||||||
General and administrative expenses increased by $20.1 million, or 68.7%, in 2019 as compared to 2018, primarily due to:
•
increased personnel costs of $10.8 million related to (i) increased headcount resulting from the acquisitions of Gamatronic, Kokam and SMRE and the expansion of our legal, finance, human resources and information technology departments; and (ii) increased expenses related to equity-based compensation and changes in management compensation;
•
increased expenses related to consultants and sub‑contractors in an amount of $5.9 million due to legal proceedings in which we are involved in and other legal expenses in relation to SMRE Acquisition costs;
•
increased expenses related to other overhead costs, other expenses and travel costs in an amount of $1.5 million;
•
increased expenses related to depreciation expenses and public company related expenses in an amount of $1.0 million; and
•
increased expenses related to doubtful debt in an amount of $0.9 million;
43
Other operating expenses
| Year Ended December 31, | 2018 to 2019 | |||||||||||||||
| 2018 | 2019 | Change | ||||||||||||||
| (in thousands) | ||||||||||||||||
| Other operating expenses | - | $ | 30,696 | $ | 30,696 | N/A | ||||||||||
Other expenses increased by $30.7 million, in 2019 as compared to 2018, primarily due to:
For the year ended December 31, 2019, we recognized compensation expenses resulting from a modification in PSU terms originally granted as part of the SMRE Acquisition in an amount of $12.2 million. This modification was part of a separation agreement with a former SMRE executive as further detailed in Item 5 – “Purchases of Equity Securities by the Issuer and Affiliated Purchases”. In addition, we recognized the following (i) $8.3 million expense related to payroll, bonus and employees equity-based compensation acceleration related to the untimely passing of Mr. Guy Sella, our founder, Chairman and CEO, (ii) $5.3 million loss related to the sale of an SMRE subsidiary originally acquired as part of the SMRE acquisition and (iii) $4.9 million expenses related to an acquired legal claim under the Kokam Acquisition which was settled in arbitration.
Financial expenses, net
| Year Ended December 31, | 2018 to 2019 | |||||||||||||||
| 2018 | 2019 | Change | ||||||||||||||
| (In thousands) | ||||||||||||||||
| Financial expenses, net | $ | (2,297 | ) | $ | (11,343 | ) | (9,046 | ) | 393.8 | % | ||||||
Financial expenses were $11.3 million in 2019 as compared to financial expenses of $2.3 million in 2018, primarily due to:
•
an increase of $3.0 million in foreign exchange fluctuations, mainly between the Euro, the New Israeli Shekel, the Australian Dollar and the South Korean Won against the U.S. Dollar;
•
an increase of $2.6 million in foreign exchange fluctuations of lease agreements’ liabilities as part of the adoption of Accounting Standards Update No. 2016-02, (Topic 842) "Leases";
•
an increase of $1.7 million in interest expenses related to advance payments received for performance obligations that extend for a period greater than one year, as part of the adoption of ASC 606;
•
an increase of $0.8 million in other financial expenses and bank charges;
•
a decrease of $0.7 million in finance income related to hedging transactions; and
•
an increase of $0.6 million in interest expenses related to bank loans which were acquired as part of the Kokam Acquisition and the SMRE Acquisition;
The increase in these expenses was partially offset by an increase of $0.4 million in interest income and accretion (amortization) of discount (premium) on marketable securities.
Taxes on Income
| Year Ended December 31, | 2018 to 2019 | |||||||||||||||
| 2018 | 2019 | Change | ||||||||||||||
| (In thousands) | ||||||||||||||||
| Taxes on income | $ | 9,077 | $ | 33,646 | $ | 24,569 | 270.7 | % | ||||||||
Tax on income increased by $24.6 million, or 270.7%, in 2019 as compared to 2018, primarily due to:
•
an increase of $26.2 million of current tax in 2019 as compared to 2018 related to the entitlement of SolarEdge Technologies Ltd. to a preferred effective tax rate of 12.3% under the PTE, ;
•
an increase of $6.1 million in current tax expenses worldwide (with the exclusion of SolarEdge Technologies Ltd);
•
an increase of $1.1 million in deferred tax assets, net; and
These taxes on income were offset by:
•
a decrease of $8.8 million in Global Intangible Low Taxed Income or GILTI and E&P taxes
Net Income
| Year Ended December 31, | 2018 to 2019 | |||||||||||||||
| 2018 | 2019 | Change | ||||||||||||||
| (In thousands) | ||||||||||||||||
| Net income | $ | 128,046 | $ | 144,957 | $ | 16,911 | 13.2 | % | ||||||||
As a result of the factors discussed above, net income increased by $16.9 million, or 13.2%, in 2019 as compared to 2018.
44
Comparison of year ended December 31, 2017 and year ended December 31, 2018
| Year ended December 31, | 2017 to 2018 | |||||||||||||||
| 2017 | 2018 | Change | ||||||||||||||
| (In thousands) | ||||||||||||||||
| Revenues | $ | 607,045 | $ | 937,237 | $ | 330,192 | 54.4 | % | ||||||||
| Cost of revenues | 392,279 | 618,001 | 225,722 | 57.5 | % | |||||||||||
| Gross profit | 214,766 | 319,236 | 104,470 | 48.6 | % | |||||||||||
| Operating expenses: | ||||||||||||||||
| Research and development | 54,966 | 82,245 | 27,279 | 49.6 | % | |||||||||||
| Sales and marketing | 50,032 | 68,307 | 18,275 | 36.5 | % | |||||||||||
| General and administrative | 18,682 | 29,264 | 10,582 | 56.6 | % | |||||||||||
| Total operating expenses | 123,680 | 179,816 | 56,136 | 45.4 | % | |||||||||||
| Operating income | 91,086 | 139,420 | 48,334 | 53.1 | % | |||||||||||
| Financial income (expenses) | 9,158 | (2,297 | ) | 11,455 | N/A | |||||||||||
| Income before taxes on income | 100,244 | 137,123 | 36,879 | 36.8 | % | |||||||||||
| Taxes on income | 16,072 | 9,077 | (6,995 | ) | (43.5 | )% | ||||||||||
| Net income | $ | 84,172 | $ | 128,046 | $ | 43,874 | 52.1 | % | ||||||||
| Net loss attributable to Non-controlling interests | - | 787 | 787 | N/A | ||||||||||||
| Net income attributable to SolarEdge Technologies Inc. | $ | 84,172 | $ | 128,833 | $ | 44,661 | 53.1 | % | ||||||||
Revenues
| Year Ended December 31, | 2017 to 2018 | |||||||||||||||
| 2017 | 2018 | Change | ||||||||||||||
| (In thousands) | ||||||||||||||||
| Revenues | $ | 607,045 | $ | 937,237 | $ | 330,192 | 54.4 | % | ||||||||
Revenues increased by $330.2 million, or 54.4%, in 2018 as compared to 2017, primarily due to an increase in the number of systems sold, with significant growth in revenues coming from the United States, Europe, Australia, Japan and Israel. Non-U.S. revenues comprised 46.1% of our revenues in 2018 as compared to 42.5% in 2017. In addition, the Gamatronic Acquisition and the Kokam Acquisition increased our revenues over the last months of 2018, which included sales of UPS units, batteries and storage systems in the aggregate amount of $23.0 million.
The number of power optimizers sold increased by approximately 4.0 million units, or 54.1%, from approximately 7.4 million units in 2017 to approximately 11.4 million units in 2018. The number of inverters sold increased by approximately 139,000 units, or 43.7%, from approximately 317,000 units in 2017 to approximately 456,000 units in 2018. Overall, our blended ASP of solar products per watt decreased by $0.018, or 6.8%, in 2018 as compared to 2017, primarily due to:
•
a change in the mix of products, yielding a higher portion of sales of commercial products that are characterized with lower ASP per Watt in comparison to residential products;
•
we initiated price reductions of our commercial products in order to increase market share in this segment;
•
the introduction of new commercial products with higher capacity which carry a lower ASP per watt; and
•
selective price decreases of our residential products
45
Cost of Revenues and Gross Profit
| Year Ended December 31, | 2017 to 2018 | |||||||||||||||
| 2017 | 2018 | Change | ||||||||||||||
| (In thousands) | ||||||||||||||||
| Cost of revenues | $ | 392 ,279 | $ | 618,001 | $ | 225,722 | 57.5 | % | ||||||||
| Gross profit | $ | 214,766 | $ | 319,236 | $ | 104,470 | 48.6 | % | ||||||||
Cost of revenues increased by $225.7 million, or 57.5%, in 2018 as compared to 2017, primarily due to:
•
an increase in the volume of products sold;
•
increased warranty expenses of $35.1 million associated with the rapid increase in our install base;
•
increased shipment and logistical costs of $16.1 million attributed, in part, to the growth in volumes shipped, an increase of customs tariff in the US and an increase in air shipments due to power component shortages;
•
increased fixed and variable costs related to the manufacturing of Kokam related products and the assembly of UPS products in the amount of $14.7 million; and
•
increased personnel-related costs of $13.1 million related to the expansion of our operations and support headcount which is growing in parallel to our growing install base worldwide and as result of the acquisition of our UPS and battery divisions ;
Gross profit as a percentage of revenue decreased from 35.4% in 2017 to 34.1% in 2018, primarily due to:
•
increased warranty and support services expenses and accruals;
•
price reduction to customers at a rate higher than our cost reduction;
•
lower gross profit on UPS and battery products due to underutilization of production facilities, as well as certain transactions for the sale of batteries with low gross profit, which had been entered into prior to closing the Kokam Acquisition; and
•
amortization of intangible assets and cost of product adjustment related to the UPS assets acquisition and Kokam Acquisition;
These were partially offset by:
•
reductions in per-unit production costs that exceeded price erosion of our products;
•
increased efficiency in our supply chain; and
•
general economies of scale in our personnel-related costs and other costs associated with our support and operations departments.
Operating Expenses:
Research and Development, Net
| Year Ended December 31 | 2017 to 2018 | |||||||||||||||
| 2017 | 2018 | Change | ||||||||||||||
| (In thousands) | ||||||||||||||||
| Research and development | $ | 54,966 | $ | 82,245 | $ | 27,279 | 49.6 | % | ||||||||
Research and development increased by $27.3 million, or 49.6%, in 2018 as compared to 2017, primarily due to:
•
an increase in personnel-related costs of $21.2 million as a result of an increased headcount of engineers, as well as hiring Gamatronic's employees and the consolidation of Kokam's employees. The increase in headcount reflects our continuing investment in enhancements of existing products as well as development associated with bringing new products to market;
•
depreciation expenses related to lab equipment and amortization expenses related to intangible assets increased by $2.1 million;
•
materials consumption for development increased by $1.5 million, part of it related to Kokam activities;
•
expenses related to other directly related overhead costs that increased by $1.1 million;
•
expenses related to consultants and sub‑contractors that increased by $1.1 million; and
•
Other expenses, including travel expenses increased by $0.3 million.
46
Sales and Marketing
| Year Ended December 31, | 2017 to 2018 | |||||||||||||||
| 2017 | 2018 | Change | ||||||||||||||
| (In thousands) | ||||||||||||||||
| Sales and marketing | $ | 50,032 | $ | 68,307 | $ | 18,275 | 36.5 | % | ||||||||
Sales and marketing expenses increased by $18.3 million, or 36.5%, in 2018 as compared to 2017, primarily due to:
•
an increase in personnel-related costs of $14.6 million as a result of (i) an increase in headcount supporting our growth in the U.S., Europe Asia and the rest of the world, (ii) salary expenses associated with employee equity compensation resulting from the impact of the increase in our stock price affecting the fair value of any share award, and (iii) hiring Gamatronic's employees and the consolidation of Kokam's employees;
•
expenses related to travel increased by $1.0 million;
•
expenses related to trade shows and marketing activities increased by $1.0 million;
•
expenses related to other overhead costs increased by $0.6 million;
•
depreciation expenses related to tangible assets and amortization expenses related to intangible assets increased by $0.6 million; and
•
expenses related to consultants and sub‑contractors increased by $0.5 million.
General and Administrative
| Year Ended December 31, | 2017 to 2018 | |||||||||||||||
| 2017 | 2018 | Change | ||||||||||||||
| (In thousands) | ||||||||||||||||
| General and administrative | $ | 18,682 | $ | 29,264 | $ | 10,582 | 56.6 | % | ||||||||
General and administrative expenses increased by $10.6 million, or 56.6%, in 2018 as compared to 2017, primarily due to:
•
an increase in personnel-related costs of $5.8 million related to (i) higher headcount in the legal, finance, human resources, and information technology department, functions required of a fast-growing public company, (ii) changes in management compensation and increased expenses related to equity-based compensation resulting from the impact of the increase in our stock price affecting the fair value of any share award and (iii) hiring Gamatronic's employees and the consolidation of Kokam's employees;
•
expenses related to external consultants and sub-contractors increased by $3.9 million due to legal proceedings initiated by us and other consulting expenses in relation to the Gamatronic Acquisition and the Kokam Acquisition;
•
expenses related to other overhead costs increased by $0.6 million;
•
expenses related to travel increased by $0.5 million;
•
increase of $0.4 million in 2018 due to the disposal of fixed assets; and
•
depreciation expenses increased by $0.3 million.
This increase was offset by a decrease in costs related to the accrual of doubtful and bad debts of $0.9 million.
Financial Income (Expenses)
| Year Ended December 31, | 2017 to 2018 | |||||||||||||||
| 2017 | 2018 | Change | ||||||||||||||
| (In thousands) | ||||||||||||||||
| Financial Income (Expenses) | $ | 9,158 | $ | (2,297 | ) | $ | (11,455 | ) | N/A | |||||||
Financial income was $9.2 million in 2018 as compared to financial expenses of $2.3 million in 2017, primarily due to:
•
an increase of $13.3 million in foreign exchange fluctuations mostly between the Euro and the New Israeli Shekel against the U.S. Dollar; and
•
an increase of $2.4 million in interest expenses, mainly related to advance payments received for performance obligations that extend for a period greater than one year, as part of the adoption of Accounting Standards Codification 606, Revenue from Contracts with Customers (ASC 606).
These increases in financial expenses were offset by:
•
an increase of $2.2 million in interest income and accretion (amortization) of discount (premium) on marketable securities; and
•
a decrease of $2.0 million in costs related to hedging transactions in 2018, as compared to 2017.
47
Taxes on Income
| Year Ended December 31, | 2017 to 2018 | |||||||||||||||
| 2017 | 2018 | Change | ||||||||||||||
| (In thousands) | ||||||||||||||||
| Taxes on income | $ | 16,072 | $ | 9,077 | $ | (6,995 | ) | (43.5 | )% | |||||||
Tax on income decreased by $7.0 million, or 43.5 %, in 2018 as compared to 2017, primarily due to
•
a one-time transition tax net decrease of $1.3 million in 2018 as compared to an increase of $18.7 million in 2017 on the federal mandatory deemed repatriation of cumulative foreign earnings; and
•
a decrease of $1.6 million in deferred tax assets (presented as tax income).
These taxes on income were offset by:
•
a tax provision of $12.0 million in the year ended December 31, 2018, with respect to Global Intangible Low Taxed Income inclusion;
•
an increase of $1.7 million in other current tax expenses in the US; and
•
an increase of $0.9 million in current tax expenses in all jurisdictions.
Net Income
| Year Ended December 31, | 2017 to 2018 | |||||||||||||||
| 2017 | 2018 | Change | ||||||||||||||
| (In thousands) | ||||||||||||||||
| Net income | $ | 84,172 | $ | 128,046 | $ | 43,874 | 52.1 | % | ||||||||
As a result of the factors discussed above, net income increased by $43.9 million, or 52.1%, in 2018 as compared to 2017.
Liquidity and Capital Resources
The following table shows our cash flows from operating activities, investing activities, and financing activities for the stated periods:
| Fiscal Year ended December 31, | ||||||||||||
| 2017 | 2018 | 2019 | ||||||||||
| (In thousands) | ||||||||||||
| Net cash provided by operating activities | $ | 136,665 | $ | 189,079 | $ | 259,000 | ||||||
| Net cash used in investing activities | (85,407 | ) | (156,609 | ) | (152,853 | ) | ||||||
| Net cash provided by (used in) financing activities | 7,240 | (7,955 | ) | (73,021 | ) | |||||||
| Increase (decrease) in cash, cash equivalents and restricted cash | $ | 58,498 | $ | 24,515 | $ | 33,126 | ||||||
48
As of December 31, 2019, our cash, cash equivalents and restricted cash were $223.9 million. This amount does not include $211.0 million invested in available for sale marketable securities, $27.6 million invested in restricted bank deposits and $5.0 million invested in short-term bank deposits. Our principal uses of cash are funding our operations and other working capital requirements. As of December 31, 2019, we have open commitments for capital expenditures in an amount of approximately $60.6 million. These commitments reflect purchases of automated assembly lines and other machinery related to our manufacturing. We believe that cash provided by operating activities as well as our cash and cash equivalents will be sufficient to meet our anticipated cash needs for at least the next 12 months and to fund our capital expenditure commitments.
Operating Activities
During 2019, cash provided by operating activities was $259.0 million derived mainly from net income of $145.0 million that included $87.3 million of non-cash expenses. An increase of $50.8 million in warranty obligations, $83.1 million in deferred revenues, $47.8 million in trade payables, $38.1 in accrued expenses and other accounts payable, $18.6 million accruals for employees and $2.2 million in operating lease liabilities. This was offset by an increase of $124.1 million in trade receivables, $22.5 million in inventories and $67.3 million in prepaid expenses and other accounts receivable.
During 2018, cash provided by operating activities was $189.1 million derived mainly from net income of $128.0 million that included $38.0 million of non-cash expenses. An increase of $41.9 million warranty obligations, $37.0 million in deferred revenues, $31.5 million in trade payables and $4.6 million accruals for employees. This was offset by an increase of $60.5 million in trade receivables, $20.2 million in inventories, $2.7 million in prepaid expenses and other accounts receivable and a decrease of $8.5 in accrued expenses and other accounts payable.
During 2017, cash provided by operating activities was $136.7 million derived mainly from net income of $84.2 million that included $21.3 million of non-cash expenses. An increase of $63.0 million in trade payables and other accounts payable, $20.4 million warranty obligations, $14.1 million in deferred revenues and $9.4 million accruals for employees. This was offset by an increase of $38.1 million in trade receivables, $21.9 million in prepaid expenses and other accounts receivable and $15.7 million in inventories.
49
Investing Activities
During 2019, net cash used in investing activities was $152.9 million, of which $160.1 million was invested in available-for-sale marketable securities, $38.4 million was utilized for the SMRE Acquisition, $72.6 million related to capital investments in laboratory equipment, end of line testing equipment, automated assembly lines, manufacturing tools and leasehold improvements, $26.1 million was invested in restricted bank deposits and $3.3 million were decreased in relation to the sale of an SMRE subsidiary originally acquired as part of the SMRE Acquisition. This was offset by $142.7 million from sales and maturities of available-for-sale marketable securities and $4.9 million decrease in short-term bank deposits.
During 2018, net cash used in investing activities was $156.6 million, of which $142.6 million was invested in available-for-sale marketable securities, $94.7 million was utilized for the acquisitions of the assets of Gamatronic and the Kokam Acquisition, $38.6 million related to capital investments in laboratory equipment, end of line testing equipment, automated assembly lines, manufacturing tools and leasehold improvements and $10.0 million was invested in bank deposits. This was offset by $129.3 million from sales and maturities of available-for-sale marketable securities.
During 2017, net cash used in investing activities was $85.4 million, of which $143.7 million was invested in available-for-sale marketable securities, $21.4 million related to capital investments in laboratory equipment, end of line testing equipment, automated assembly lines, manufacturing tools and leasehold improvements and $0.6 million related to an increase in restricted cash. This was offset by $80.3 million from the maturities of available-for-sale marketable securities.
Financing Activities
During 2019, net cash used in financing activities was $73.0 million, of which $71.5 million was related to the purchase of non-controlling interests, $9.2 million was used for repayment of loans we acquired as part of the Kokam Acquisition and the SMRE Acquisition and $1.4 million related to the purchase of land and building formerly leased under a financial lease. This was offset by $9.1 million attributed to cash received from the exercise of employee and non-employee stock-base awards.
During 2018, net cash used in financing activities was $8.0 million, of which $14.2 million related to the purchase of non-controlling interests and $3.8 million was used for repayment of loans we acquired as part of Kokam's Acquisition. This was offset by $10.0 million attributed to cash received from the exercise of employee and non-employee stock-base awards.
During 2017, net cash provided by financing activities was $7.2 million, all of which is attributed to cash received from the exercise of employee and non-employee stock-base awards.
Debt Obligations
In October 2018, as part of the Kokam Acquisition, we acquired a number of bank loan obligations in an aggregate amount of $20.1 million (the “Kokam Loans”). The Kokam Loans mature in various installments through May 2021 and their annual interest rates are variable. As of December 31, 2019, the interest rates on the Kokam Loans ranged from 2.7% to 3.4% and the aggregate outstanding Kokam Loans were $15.7 million.
In January 2019, as part of the SMRE Acquisition, we acquired a number of bank loans in an aggregate amount of $7.2 million (the “SMRE Loans”). The SMRE Loans mature in various installments through June 2026 and their annual interest rates are variable. As of December 31, 2019, the interest rates on the SMRE Loans ranged from 2.6% to 3.5% and the aggregate outstanding SMRE Loans were $0.1 million.
50
Contractual Obligations
The following table summarizes our outstanding contractual obligations as of December 31, 2019:
| Payment Due By Period | ||||||||||||||||||||
| Total | Less Than 1 Year | 1 – 3 Years | 4 – 5 Years | More Than 5 Years | ||||||||||||||||
| (In thousands) | ||||||||||||||||||||
| Operating and finance leases(1) | $ | 44,666 | $ | 10,839 | $ | 25,464 | $ | 4,317 | $ | 4,046 | ||||||||||
| Purchase commitments under agreements(2) | $ | 472,086 | $ | 472,086 | - | - | - | |||||||||||||
| Capital expenditures(3) | $ | 60,634 | $ | 60,634 | - | - | - | |||||||||||||
| Total | $ | 577,386 | $ | 543,582 | $ | 25,464 | $ | 4,317 | $ | 4,046 | ||||||||||
|
| |
| | |
| (1) | Represents future minimum lease commitments under non‑cancellable operating lease agreements through which we lease our operating facilities. |
|
| |
| (2) | Represents non‑cancelable amounts associated with our manufacturing contracts. Such purchase commitments are based on our forecasted manufacturing requirements and typically provide for fulfillment within agreed‑upon or commercially standard lead‑times for the particular part or product. The timing and amounts of payments represent our best estimates and may change due to business needs and other factors. |
|
| |
| (3) | Represents non‑cancelable amounts associated with purchases of automated assembly lines and other machinery related to our manufacturing. |
Off‑Balance Sheet Arrangements
We did not have any off‑balance sheet arrangements in the year ended December 31, 2017, the year ended December 31, 2018 or the year ended December 31, 2019.
Critical Accounting Policies and Significant Management Estimates
We prepare our consolidated financial statements in accordance with generally accepted accounting principles in the U.S. (“GAAP”) The preparation of consolidated financial statements also requires us to make estimates and assumptions that affect the reported amounts of assets, liabilities, revenues, costs and expenses, and related disclosures. We base our estimates on historical experience and on various other assumptions that we believe to be reasonable under the circumstances. Actual results could differ significantly from the estimates made by our management. To the extent that there are differences between our estimates and actual results, our future financial statement presentation, financial condition, results of operations, and cash flows will be affected. We believe that the accounting policies discussed below are critical to understanding our historical and future performance, as these policies relate to the more significant areas involving management’s judgments and estimates. Critical accounting policies and estimates are those that we consider the most important to the portrayal of our financial condition and results of operations because they require our most difficult, subjective or complex judgments, often as a result of the need to make estimates about the effects of matters that are inherently uncertain.
Revenue Recognition
Effective January 1, 2018, we adopted the Accounting Standards Codification 606, Revenue from Contracts with Customers (ASC 606) using the modified retrospective method applied to those contracts which were not substantially completed as of January 1, 2018. As a result of this adoption, we revised our accounting policy for revenue recognition as detailed below.
We generate revenues from the sale of DC optimized inverter systems for solar PV installations which include our power optimizers, inverters, and cloud‑based monitoring platform as well as other solar related products, UPS systems, Lithium-ion cells, batteries, energy storage solutions, EV powertrain solutions and machinery. Our worldwide customer base includes large solar installers, distributors, EPCs, PV module manufacturers, utility companies and other customers. Our products are fully functional at the time of shipment to the customer and do not require production, modification, or customization with the exception of some UPS and ESS systems that require installation and commissioning. We recognize revenue under the core principle that transfer of control to the customers should be depicted in an amount reflecting the consideration we expect to receive in revenue. In order to achieve that core principle, we apply the following five-step approach: (1) identify the contract with a customer, (2) identify the performance obligations in the contract, (3) determine the transaction price, (4) allocate the transaction price to the performance obligations in the contract, and (5) recognize revenue when a performance obligation is satisfied. Provisions for rebates, sales incentives, and discounts to customers are accounted for as reductions in revenue in the same period that the related sales are recorded.
We generally sell our products to our customers pursuant to a customer’s standard purchase order and our customary terms and conditions. We do not offer rights to return our products other than for normal warranty conditions, and as such, revenue is recorded upon shipment of products to customers and transfer of title and risk of loss under standard commercial terms. We evaluate the creditworthiness of our customers to determine that appropriate credit limits are established prior to the acceptance and shipment of an order.
We provide our full web‑based monitoring platform for our solar products free of charge and revenues associated with the service since that date are being recognized ratably over 25 years. In the absence of third party comparable pricing for such service, management determines the revenue levels of this service based on the costs associated with providing the service plus appropriate margins that reflect management’s best estimate of the selling price. These revenues are minimal and we do not expect this to become a significant source of revenue in the near future.
51
The most significant impact of the standard on our financial statements relates to advance payments received for performance obligations that extend for a period greater than one year. Applying the new standard, such performance obligations are those that include a financing component, specifically: (i) warranty extension services, (ii) cloud-based monitoring, and (iii) communication services.
We recognize financing component expenses in our consolidated statement of income in relation to advance payments for performance obligations that extend for a period greater than one year. These financing component expenses are reflected in our deferred revenues balance. The cumulative adjustments have decreased the retained earnings by $3.9 million while increasing the deferred revenues by the same amount.
Product Warranty
We provide a standard limited product warranty for our solar products against defects in materials and workmanship under normal use and service conditions. Our standard warranty period is 25 years for our power optimizers, 12 years for our inverters, and 10 years for our storage interface. Other products are sold with standard limited warranties that typically range in duration from one to ten years, and in some cases for a longer period. In certain cases, customers can purchase an extended warranty for UPS products and our battery storage products that exceed the standard warranty period. In addition, customers can purchase extended warranties for inverters that increase the warranty period to up to 25 years.
Our products are designed to meet the warranty periods and our reliability procedures cover component selection, design, accelerated life cycle tests, and end-of-manufacturing line testing. However, since our history in selling power optimizers and inverters is substantially shorter than the warranty period, the calculation of warranty provisions is inherently uncertain.
We accrue for estimated warranty costs at the time of sale based on anticipated warranty claims and actual historical warranty claims experience. Warranty provisions, computed on a per‑unit sold basis, are based on our best estimate of such costs and are included in our cost of revenues. The warranty obligation is determined based on actual and predicted failure rates of the products, cost of replacement and service and delivery costs incurred to correct a product failure. Our warranty obligation requires management to make assumptions regarding estimated failure rates and replacement costs.
In order to predict the failure rate of each of our products, we have established a reliability model based on the estimated mean time between failures (“MTBF”). The MTBF represents the average elapsed time predicted for each product unit between failures during operation. Applying the MTBF failure rate over our install base for each product type and generation allows us to predict the number of failed units over the warranty period and estimates the costs associated with the product warranty. Predicted failure rates are updated periodically based on data returned from the field and new product versions, as are replacement costs which are updated to reflect changes in our actual production costs for our products, subcontractors’ labor costs, and actual logistics costs.
Since the MTBF model does not take into account additional non‑systematic failures such as failures caused by workmanship or manufacturing or design‑related issues, and since warranty claims are at times opened for cases in which the error has been triggered by an improper installation, we have developed a supplemental model to predict such cases and recognize the associated expenses ratably over the expected claim period. This model, which is based on actual root cause analysis of returned products, identification of the causes of claims and time until each identified problem is revealed, allows us to better predict actual warranty expenses and is updated periodically based on our experience, taking into account the installed base of approximately 49.8 million power optimizers and approximately 2.1 million inverters as of December 31, 2019.
If actual warranty costs differ significantly from these estimates, adjustments may be required in the future, which could adversely affect our gross profit and results of operations. Warranty obligations are classified as short-term and long-term warranty obligations based on the period in which the warranty is expected to be claimed. The warranty provision (short and long-term) was $78.8 million as of December 31, 2017, $121.8 million as of December 31, 2018 and $172.6 million as of December 31, 2019.
Inventory Valuation
Our inventories comprise sellable finished goods, raw materials bought for own manufacturing or on behalf of our contract manufacturers, and faulty units returned under our warranty policy.
Sellable finished goods and raw material inventories are valued at the lower of cost or market, based on the moving average cost method. Certain factors could affect the realizable value of our inventories, including market and economic conditions, technological changes, existing product changes (mainly due to cost reduction activities), and new product introductions. We consider historic usage, expected demand, anticipated sales price, the effect of new product introductions, product obsolescence, product merchantability, and other factors when evaluating the value of inventories. Inventory write‑downs are equal to the difference between the cost of inventories and their estimated fair market value. Inventory write‑downs are recorded as cost of revenues in the accompanying statements of operations and were $1.4 million, $0.9 million and $4.5 million, in the year ended December 31, 2017, 2018 and 2019, respectively.
52
Faulty products returned under our warranty policy are often refurbished and used as replacement units. Such products are written off upon receipt.
We do not believe that there is a reasonable likelihood that there will be a material change in future estimates or assumptions that we use to record inventory at the lower of cost or market. However, if estimates regarding customer demand are inaccurate or changes in technology affect demand for certain products in an unforeseen manner, we may be exposed to losses that could be material.
Business Combination
We allocate the fair value of purchase consideration to the tangible assets acquired, liabilities assumed and intangible assets acquired based on their estimated fair value. The excess of the fair value of purchase consideration over the fair values of these identifiable assets and liabilities is recorded as goodwill. Such valuations require our management to make significant estimates and assumptions, especially with respect to intangible assets. Significant estimates in valuing certain intangible assets include, but are not limited to, future expected cash flows from acquired technology and other intangible assets, their useful lives and discount rates. Our management’s estimates of fair value are based upon assumptions believed to be reasonable, but which are inherently uncertain and unpredictable and, as a result, actual results may differ from estimates. During the measurement period, which is not to exceed one year from the acquisition date, we may record adjustments to the assets acquired and liabilities assumed, with the corresponding offset to goodwill. Upon the conclusion of the measurement period, any subsequent adjustments are recorded to earnings.
Intangible and other long lived assets
We evaluate the recoverability of finite-lived intangible assets for possible impairment whenever events or circumstances indicate that the carrying amount of such assets may not be recoverable. The evaluation is performed at the lowest level for which identifiable cash flows are largely independent of the cash flows of other assets and liabilities. Recoverability of these assets is measured by a comparison of the carrying amounts to the future undiscounted cash flows the assets are expected to generate. If such review indicates that the carrying amount of intangible assets is not recoverable, the carrying amount of such assets is reduced to fair value. We have not recorded any impairment charges during the year ended December 31, 2019.
Acquired identifiable finite-lived intangible assets are amortized on a straight-line basis or accelerated method over the estimated useful lives of the assets. We believe the basis of amortization approximates the pattern in which the assets are utilized, over their estimated useful lives. We routinely review the remaining estimated useful lives of finite-lived intangible assets. In case we reduce the estimated useful life assumption for any asset, the remaining unamortized balance is amortized or depreciated over the revised estimated useful life.
Goodwill
Goodwill reflects the excess of the consideration transferred, including the fair value of any contingent consideration and any non-controlling interest in the acquiree, over the assigned fair values of the identifiable net assets acquired. Goodwill is not amortized, and is assigned to reporting units and tested for impairment at least on an annual basis, in the fourth quarter of the fiscal year.
The goodwill impairment test is performed according to the following principles:
(1) An initial qualitative assessment may be performed to determine whether it is more likely than not that the fair value of the reporting unit is less than its carrying amount.
(2)If the Company concludes it is more likely than not that the fair value of the reporting unit is less than its carrying mount, a quantitative fair value test is performed. An impairment charge for the amount by which the carrying amount exceeds the reporting unit’s fair value is recognized.
We complete the required annual testing of goodwill for impairment for the reporting unit on October 1 of each year and accordingly, determines whether goodwill should be impaired. As of December 31, 2019, no impairment of goodwill has been identified.
53
Income taxes
We account for income taxes in accordance with ASC 740, “Income Taxes.” ASC 740, which prescribes the use of the liability method, whereby deferred tax asset and liability account balances are determined based on differences between financial reporting and tax basis of assets and liabilities, and are measured using the enacted tax rates that will be in effect when the differences are expected to reverse.
We account for uncertain tax positions in accordance with ASC 740. ASC 740-10 contains a two-step approach to recognizing and measuring uncertain tax positions. The first step is to evaluate the tax position taken or expected to be taken in a tax return by determining if the weight of available evidence indicates that it is more likely than not that, on an evaluation of the technical merits, the tax position will be sustained on audit, including resolution of any related appeals or litigation processes. The second step is to measure the tax benefit as the largest amount that is more than 50% (cumulative probability) likely to be realized upon ultimate settlement.
ITEM 7A.QUANTITATIVE AND QUALITATIVE DISCLOSURES ABOUT MARKET RISK
We are exposed to market risk in the ordinary course of our business. Market risk represents the risk of loss that may impact our financial position due to adverse changes in financial market prices and rates. Our market risk exposure is primarily a result of fluctuations in foreign currency exchange rates, customer concentrations, and interest rates. We do not hold or issue financial instruments for trading purposes.
Foreign Currency Exchange Risk
Approximately 37.4% 41.2% and 48.7% of our revenues for the year ended December 31, 2017, the year ended December 31, 2018 and the year ended December 31, 2019, respectively, were earned in non‑U.S. dollar denominated currencies, principally the Euro. Our expenses are generally denominated in the currencies in which our operations are located, primarily the U.S. dollar and New Israeli Shekel, and to a lesser extent, the Euro and Korean Won. Our New Israeli Shekel‑denominated expenses consist primarily of personnel and overhead costs. Our consolidated results of operations and cash flows are, therefore, subject to fluctuations due to changes in foreign currency exchange rates and may be adversely affected in the future due to changes in foreign exchange rates. A hypothetical 10% change in foreign currency exchange rates between the Euro and the U.S. dollar would increase or decrease our net income by $42.7 million for the year ended December 31, 2019. A hypothetical 10% change in foreign currency exchange rates between the New Israeli Shekel and the U.S. dollar would increase or decrease our net income by $13.5 million for the year ended December 31, 2019. A hypothetical 10% change in foreign currency exchange rates during the year ended December 31, 2019, between the Korean Won and the U.S. Dollar would increase or decrease our net income by $1.2 million for the year ended December 31, 2019.
For purposes of our consolidated financial statements, local currency assets and liabilities are translated at the rate of exchange to the U.S. dollar on the balance sheet date and local currency revenues and expenses are translated at the exchange rate as of the date of the transaction or at the average exchange rate to the U.S. dollar during the reporting period.
To date, we have used derivative financial instruments, specifically foreign currency forward contracts, to manage exposure to foreign currency risks by hedging a portion of our account receivable balances denominated in Euros expected to be paid within six months. Our foreign currency forward contracts are expected to mitigate exchange rate changes related to the hedged assets. We do not use derivative financial instruments for speculative or trading purposes.
We had cash, cash equivalents and restricted cash of $187.8 million and $223.8 at the end of the year ending December 31, 2018 and the year ended December 31, 2019, respectively, which was held for working capital purposes. We had available-for-sale marketable securities with an estimated fair value of $192.9 million and $211.0 million on December 31, 2018 and December 31, 2019, respectively. In addition, we had bank deposits of $9.8 million and $5.0 million as of December 31, 2018 and December 31, 2019, respectively. We had restricted bank deposits of $1.6 million and $27.6 million as of December 31, 2018 December 31, 2019, respectively.
As of December 31, 2019, we had no outstanding forward contracts or put and call options or derivative financial instruments, such as foreign exchange forward contracts, to mitigate the risk of changes in foreign exchange rates on accounts receivable and forecast cash flows denominated in certain foreign currencies. We may not be able to purchase derivative instruments adequate to fully insulate ourselves from foreign currency exchange risks and over the past year we have incurred losses as a result of exchange rate fluctuations on exposures that have not been covered by our hedging strategy.
54
Additionally, our hedging activities may also contribute to increased losses as a result of volatility in foreign currency markets. If foreign exchange currency markets continue to be volatile, such fluctuations in foreign currency exchange rates could materially and adversely affect our profit margins and results of operations in future periods. Also, the volatility in the foreign currency markets may make it difficult to hedge our foreign currency exposures effectively.
Concentrations of Major Customers
Our trade accounts receivables potentially expose us to a concentration of credit risk with our major customers. For the year ended December 31, 2019, one major customer accounted for 20.4% of our total revenues, and as of December 31, 2019, one major customer accounted for approximately 32.1% of our consolidated trade receivables balance. For the year ended December 31, 2018, one major customer accounted for 19.4% of total revenues, and as of December 31, 2018, two major customers accounted for approximately 41.3% of our consolidated trade receivables balance. We currently do not foresee a credit risk associated with these receivables.
Inflation
We do not believe that inflation had a material effect on our business, financial condition, or results of operations in the last three years. If our costs were to become subject to significant inflationary pressures, we may not be able to fully offset such higher costs through price increases. Our inability or failure to do so could harm our business, financial condition, and results of operations.
Commodity Price Risk
We are subject to risk from fluctuating market prices of certain commodity raw materials, including copper, which are used in our products. Prices of these raw materials may be affected by supply restrictions or other market factors from time to time, and we do not enter into hedging arrangements to mitigate commodity risk. Significant price changes for these raw materials could reduce our operating margins if we are unable to recover such increases from our customers, and could harm our business, financial condition, and results of operations.
55
ITEM 8.FINANCIAL STATEMENTS AND SUPPLEMENTARY DATA.
INDEX TO CONSOLIDATED FINANCIAL STATEMENTS
Consolidated Financial Statements
56
Unaudited Quarterly Results of Operations
The following table sets forth our unaudited quarterly consolidated statements of operations data for each of the fiscal years covered by the financial statements provided with this filing. The data presented below has been prepared on the same basis as the audited consolidated financial statements included elsewhere in this Annual Report and, in the opinion of management, reflects all adjustments, consisting only of normal recurring adjustments, necessary for a fair presentation of this data. This information should be read in conjunction with our consolidated financial statements and related notes included elsewhere in this Annual Report. The results of historical periods are not necessarily indicative of the results of operations for a full year or any future period.
| Mar. 31, 2018 | June 30, 2018 | Sept. 30, 2018 | Dec. 31, 2018 | Mar. 31, 2019 | June 30, 2019 | Sept. 30, 2019 | Dec. 31, 2019 | |||||||||||||||||||||||||
| (In thousands, unaudited) | ||||||||||||||||||||||||||||||||
| Revenues | $ | 209,871 | $ | 227,118 | $ | 236,578 | $ | 263,670 | $ | 271,871 | $ | 325,010 | $ | 410,556 | $ | 418,223 | ||||||||||||||||
| Cost of revenues | 130,274 | 145,172 | 158,596 | 183,959 | 185,761 | 214,340 | 271,247 | 274,974 | ||||||||||||||||||||||||
| Gross profit | 79,597 | 81,946 | 77,982 | 79,711 | 86,110 | 110,670 | 139,309 | 143,249 | ||||||||||||||||||||||||
| Operating expense | ||||||||||||||||||||||||||||||||
| Research and development | 17,875 | 19,551 | 20,109 | 24,710 | 26,199 | 29,505 | 30,747 | 34,900 | ||||||||||||||||||||||||
| Sales and marketing | 16,205 | 15,954 | 16,938 | 19,210 | 20,172 | 22,127 | 22,026 | 23,659 | ||||||||||||||||||||||||
| General and administrative | 4,753 | 5,776 | 6,898 | 11,837 | 11,691 | 13,685 | 12,214 | 11,771 | ||||||||||||||||||||||||
| Other | - | - | - | - | - | - | 8,305 | 22,391 | ||||||||||||||||||||||||
| Total operating expenses | 38,833 | 41,281 | 43,945 | 55,757 | 58,062 | 65,317 | 73,292 | 92,721 | ||||||||||||||||||||||||
| Operating income | 40,764 | 40,665 | 34,037 | 23,954 | 28,048 | 45,353 | 66,017 | 50,528 | ||||||||||||||||||||||||
| Financial income (expenses) | 584 | (2,480 | ) | (689 | ) | 288 | (6,151 | ) | 773 | (17,023 | ) | 11,058 | ||||||||||||||||||||
| Income before taxes on income | 41,348 | 38,185 | 33,348 | 24,242 | 21,897 | 46,126 | 48,994 | 61,586 | ||||||||||||||||||||||||
| Taxes on income (tax benefit) | 5,662 | 3,617 | (12,295 | ) | 12,093 | 3,922 | 13,213 | 7,270 | 9,241 | |||||||||||||||||||||||
| Net income | $ | 35,686 | $ | 34,568 | $ | 45,643 | $ | 12,149 | $ | 17,975 | $ | 32,913 | $ | 41,724 | $ | 52,345 | ||||||||||||||||
| Net income (loss) attributable to noncontrolling interests | - | - | - | (787 | ) | (1,041 | ) | (215 | ) | 97 | (433 | ) | ||||||||||||||||||||
| Net income attributable to SolarEdge Technologies Inc. | $ | 35,686 | $ | 34,568 | $ | 45,643 | $ | 12,936 | $ | 19,016 | $ | 33,128 | $ | 41,627 | $ | 52,778 | ||||||||||||||||
Subsequent Events
None.
57
ITEM 9.CHANGES IN AND DISAGREEMENTS WITH ACCOUNTANTS ON ACCOUNTING AND FINANCIAL DISCLOSURE
None.
ITEM 9A.CONTROLS AND PROCEDURES
Disclosure Controls and Procedures
Our management, with the participation of our chief executive officer and chief financial officer, evaluated the effectiveness of our disclosure controls and procedures pursuant to Rule 13a-15 under the Securities Exchange Act of 1934, as amended (the “Exchange Act”), as of December 31, 2019. In designing and evaluating the disclosure controls and procedures, management recognized that any controls and procedures, no matter how well designed and operated, can provide only reasonable assurance of achieving the desired control objectives. In addition, the design of disclosure controls and procedures must reflect the fact that there are resource constraints and that management is required to apply its judgment in evaluating the benefits of possible controls and procedures relative to their costs.
Based on that evaluation, our chief executive officer and chief financial officer concluded that our disclosure controls and procedures are effective to provide reasonable assurance that information we are required to disclose in reports that we file or submit under the Exchange Act is recorded, processed, summarized, and reported within the time periods specified in SEC rules and forms, and that such information is accumulated and communicated to our management, including our chief executive officer and chief financial officer, as appropriate, to allow timely decisions regarding required disclosure.
Management’s Report on Internal Control Over Financial Reporting
Our management is responsible for establishing and maintaining adequate internal control over financial reporting (as defined in Rules 13a-15(f) and 15d-15(f) under the Exchange Act) to provide reasonable assurance regarding the reliability of our financial reporting and the preparation of consolidated financial statements for external purposes in accordance with U.S. generally accepted accounting principles.
Management assessed our internal control over financial reporting as of December 31, 2019. Management based its assessment on criteria established in Internal Control—Integrated Framework issued by the Committee of Sponsoring Organizations of the Treadway Commission (2013 framework). Management’s assessment included evaluation of elements such as the design and operating effectiveness of key financial reporting controls, process documentation, accounting policies, and our overall control environment.
Management’s assessment of and conclusion on the effectiveness of internal control over financial reporting did not include the internal controls of the purchased SMRE business, that was acquired during 2019 and included in the 2019 consolidated financial statements of the Company and constituted 2.4% and 3.1% of total and net assets respectively, as of December 31, 2019 and 1.4% of revenues for the year then ended. Our audit of internal control over financial reporting of the Company also did not include an evaluation of the internal control over financial reporting of the purchased SMRE business.
Based on this assessment, management has concluded that our internal control over financial reporting was effective as of the end of the year to provide reasonable assurance regarding the reliability of financial reporting and the preparation of consolidated financial statements for external reporting purposes in accordance with U.S. generally accepted accounting principles. We reviewed the results of management’s assessment with the Audit Committee of our Board of Directors.
Our independent registered public accounting firm, Kost Forer Gabbay & Kasierer, a member of Ernst & Young, independently assessed the effectiveness of the company’s internal control over financial reporting, as stated in the firm’s attestation report, which is incorporated by reference into Part II, Item 8 of this Form 10-K.
Our management, including our chief executive officer and chief financial officer, does not expect that our disclosure controls and procedures or our internal control over financial reporting will prevent or detect all errors and all fraud. A control system, no matter how well-designed and operated, can provide only reasonable, not absolute, assurance that the control system’s objectives will be met. The design of a control system must reflect the fact that there are resource constraints, and the benefits of controls must be considered relative to their costs. Further, because of the inherent limitations in all control systems, no evaluation of controls can provide absolute assurance that misstatements due to error or fraud will not occur or that all control issues and instances of fraud, if any, have been detected. The design of any system of controls is based in part on certain assumptions about the likelihood of future events, and there can be no assurance that any design will succeed in achieving its stated goals under all potential future conditions. Projections of any evaluation of the effectiveness of controls to future periods are subject to risks. Over time, controls may become inadequate because of changes in conditions or deterioration in the degree of compliance with policies or procedures.
Changes in Internal Control over Financial Reporting
There have been no changes in our internal control over financial reporting (as defined in Rule 13a-15(f) of the Exchange Act) that occurred during the fourth fiscal quarter of 2019 that have materially affected, or are reasonably likely to materially affect, our internal control over financial reporting.
ITEM 9B.OTHER INFORMATION
None.
58
PART III
ITEM 10.DIRECTORS, EXECUTIVE OFFICERS AND CORPORATE GOVERNANCE
The information required by Item 10 will be included under the captions “Directors and Corporate Governance”, “The Board’s Role in Risk Oversight”, “Board Committees”, “Director Compensation”, “Compensation Committee Report”, and “Section 16(a) Beneficial Ownership Reporting Compliance” in our definitive Proxy Statement for the 2020 Annual Meeting of Stockholders to be filed with the SEC within 120 days of the year ending December 31, 2019 (the "2020 Proxy Statement") and is incorporated herein by reference.
ITEM 11.EXECUTIVE COMPENSATION
The information required by Item 11 will be included under the captions “Executive Compensation” in our 2020 Proxy Statement and is incorporated herein by reference.
ITEM 12.SECURITY OWNERSHIP OF CERTAIN BENEFICIAL OWNERS AND MANAGEMENT AND RELATED STOCKHOLDER MATTERS
Except as set forth below, the information required by Item 12 will be included under the captions “Security Ownership of Certain Beneficial Owners and Management” in our 2020 Proxy Statement and is incorporated herein by reference.
Equity Compensation Plan Information
The following table summarizes information as of December 31, 2019, about shares of common stock that may be issued under our equity compensation plans.
| Plan Category | Number of securities to be issued upon exercise of outstanding stock awards(a) | Weighted-average exercise price of outstanding stock awards (b) | Number of securities remaining available for future issuance under equity compensation plans (excluding securities reflected in column (a)) (c) | |||||||||
| Equity compensation plans approved by security holders (1) | 4,916,115 | $ | 6.65 | 5,095,591 | ||||||||
| Equity compensation plans not approved by security holders | — | — | — | |||||||||
| Total | 4,916,115 | $ | 6.65 | 5,095,591 | ||||||||
| | |
| (1) | Includes in column (a) 3,916,361 shares of common stock issuable upon exercise of stock awards outstanding under the Company’s 2015 Global Incentive Plan, 999,754 shares of common stock issuable upon exercise of options outstanding under the Company’s 2007 Global Incentive Plan. Includes in column (c) 3,424,142 shares of common stock available for future issuance under the Company’s 2015 Global Incentive Plan and 1,671,449 shares of common stock available for future issuance under the Company’s Employee Stock Purchase Plan. Upon consummation of our initial public offering, the Company’s 2007 Global Incentive Plan was terminated and no further awards can be granted under this plan. |
Employee Stock Purchase Plan
We have adopted an employee stock purchase plan (“ESPP”), pursuant to which our eligible employees and eligible employees of our subsidiaries may elect to have payroll deductions made during the offering period in an amount not exceeding 10% of the compensation which the employees receive on each pay day during the offering period. In the second quarter of calendar 2016, we started granting eligible employees the right to purchase our common stock under the ESPP. As of December 31, 2019, a total of 2,199,808 shares were reserved for issuance under the ESPP. The number of shares of common stock reserved for issuance under the ESPP will increase annually on January 1st, for ten years, by the lesser of 1% of the total number of shares of the Company’s common stock outstanding on December 31st of the preceding calendar year or 487,643 shares. Our board of directors may reduce the number of shares to be added to the share reserve for the ESPP in any particular year at their discretion.
ITEM 13.CERTAIN RELATIONSHIPS AND RELATED TRANSACTIONS, AND DIRECTOR INDEPENDENCE
The information required by Item 13 will be included under the captions “Transactions with Related Persons” in our 2020 Proxy Statement and is incorporated herein by reference.
ITEM 14.PRINCIPAL ACCOUNTING FEES AND SERVICES
The information required by Item 14 will be included under the captions “Audit and Related Fees” in our 2020 Proxy Statement and is incorporated herein by reference.
59
PART IV
ITEM 15.EXHIBITS, FINANCIAL STATEMENT SCHEDULES
Our Consolidated Financial Statements and Notes thereto are included in ITEM 8 of this Annual Report on Form 10-K. See Index to ITEM 8 for more detail.
All financial schedules have been omitted either because they are not applicable or because the required information is provided in our Consolidated Financial Statements and Notes thereto, included in ITEM 8 of this Annual Report on Form 10-K.
Index to Exhibits
| Exhibit No. | Description | Incorporation by Reference | ||
| Incorporated by reference to Exhibit 4.1 to Form S-8 (Registration No. 333-203193) filed with the SEC on April 2, 2015 | ||||
|
| ||||
| Incorporated by reference to Exhibit 4.2 to Form S-8 (Registration No. 333-203193) filed with the SEC on April 2, 2015 | ||||
|
| ||||
| Filed with this report. | ||||
|
| ||||
| Incorporated by reference to Exhibit 4.1 of Amendment No. 1 to Form S-1 (Registration No. 333-202159) filed with the SEC on March 11, 2015 | ||||
|
| ||||
| Employment Agreement, dated August 20, 2019 between SolarEdge Technologies Ltd. and Uri Bechor | Incorporated by reference to Exhibit 10.1 to Form 8-K filed with the SEC on August 21, 2019 | |||
|
| ||||
| Employment Agreement, dated December 1, 2010, between SolarEdge Technologies, Inc. and Ronen Faier | Incorporated by reference to Exhibit 10.3 of Amendment No. 1 to Form S-1 (Registration No. 333-202159) filed with the SEC on March 11, 2015 | |||
|
| ||||
| Employment Agreement, dated May 17, 2009, between SolarEdge Technologies, Inc. and Zvi Lando | Incorporated by reference to Exhibit 10.3 of Amendment No. 1 to Form S-1 (Registration No. 333-202159) filed with the SEC on March 11, 2015 | |||
|
| ||||
| Incorporated by reference to Exhibit 99.3 to Form S-8 (Registration No. 333-203193) filed with the SEC on April 2, 2015 | ||||
|
| ||||
| Incorporated by reference to Exhibit 99.1 to Form S-8 (Registration No. 333-203193) filed with the SEC on April 2, 2015 | ||||
|
| ||||
| SolarEdge Technologies, Inc. 2015 Employee Stock Purchase Plan | Incorporated by reference to Exhibit 99.2 to Form S-8 (Registration No. 333-203193) filed with the SEC on April 2, 2015 | |||
|
|
60
| Incorporated by reference to Exhibit 10.11 to Form 10-K filed with the SEC on August 20, 2015 | ||||
|
| ||||
| Incorporated by reference to Exhibit 10.12 to Form 10-K filed with the SEC on August 20, 2015 | ||||
|
| ||||
| Incorporated by reference to Exhibit 10.13 to Form 10-K filed with the SEC on August 20, 2015 | ||||
|
| ||||
| Incorporated by reference to Exhibit 10.14 to Form 10-K filed with the SEC on August 20, 2015 | ||||
|
| ||||
| Share Purchase Agreement, dated January 7, 2019, between SolarEdge Technologies Ltd. and MTI Holding s.r.l., Mr. Gabriele Amati and Mr. Giampaolo Giammarioli. | Incorporated by reference to Exhibit 2.1 to Form 8-K filed with the SEC on January 7, 2019 | |||
|
| ||||
| Share Purchase Agreement with Mr. Ji Jun Hong with respect to Kokam Co., Ltd. | Incorporated by reference to Exhibit 10.16 to Form 10-K filed with the SEC on February 28, 2019 | |||
|
| ||||
| Form of Ancillary Purchase Agreement with respect to Kokam Co., Ltd. | Incorporated by reference to Exhibit 10.17 to Form 10-K filed with the SEC on February 28, 2019 | |||
|
| ||||
| Filed with this report. | ||||
|
| ||||
| Consent of Kost Forer Gabbay & Kasierer, independent registered public accounting firm | Filed with this report. | |||
|
| ||||
| Filed with this report. | ||||
|
| ||||
| Certification of Chief Executive Officer Pursuant to Rules 13a-14(a) and15d-14(a) of the Securities Exchange Act of 1934, as amended | Filed with this report. | |||
|
| ||||
| Certification of Chief Financial Officer Pursuant to Rules 13a-14(a) and15d-14(a) of the Securities Exchange Act of 1934, as amended | Filed with this report. | |||
|
| ||||
| Certification of Chief Executive Officer, pursuant to 18 U.S.C. Section 1350, as adopted pursuant to Section 906 of the Sarbanes-Oxley Act of 2002 | Filed with this report. | |||
|
| ||||
| Certification of Chief Financial Officer, pursuant to 18 U.S.C. Section 1350, as adopted pursuant to Section 906 of the Sarbanes-Oxley Act of 2002 | Filed with this report. | |||
|
| ||||
| 101.INS | XBRL Instance Document - - embedded within the Inline XBRL document | Filed with this report. | ||
|
| ||||
| 101.SCH | XBRL Taxonomy Extension Schema Document | Filed with this report. | ||
|
| ||||
| 101.CAL | XBRL Taxonomy Extension Calculation Linkbase Document | Filed with this report. | ||
|
| ||||
| 101.DEF | XBRL Taxonomy Extension Definition Linkbase Document | Filed with this report. | ||
|
| ||||
| 101.LAB | XBRL Taxonomy Extension Label Linkbase Document | Filed with this report. | ||
|
| ||||
| 101.PRE | XBRL Taxonomy Extension Presentation Linkbase Document | Filed with this report. | ||
|
| ||||
| 104 | Cover Page Interactive Data File - the cover page XBRL tags are embedded within the Inline XBRL document. | Filed with this report. |
† Management contract or compensatory plan or arrangement.
# Confidential treatment has been requested with respect to certain portions of this exhibit. Omitted portions have been filed separately with the Securities and Exchange Commission.
61
SOLAREDGE TECHNOLOGIES, INC.
AND ITS SUBSIDIARIES.
CONSOLIDATED FINANCIAL STATEMENTS
AS OF DECEMBER 31, 2019
AUDITED
INDEX
REPORT OF INDEPENDENT REGISTERED PUBLIC ACCOUNTING FIRM
To the Stockholders and the Board of Directors of
SOLAREDGE TECHNOLOGIES, INC.
Opinion on the Financial Statements
We have audited the accompanying consolidated balance sheets of SolarEdge Technologies, Inc. and subsidiaries (the “Company”) as of December 31, 2019 and 2018, the related consolidated statements of income, comprehensive income, stockholders’ equity and cash flows for each of the three years in the period ended December 31, 2019, and the related notes (collectively referred to as the “consolidated financial statements”). In our opinion, the consolidated financial statements present fairly, in all material respects, the financial position of the Company as of December 31, 2019 and 2018, and the results of its operations and its cash flows for each of the three years in the period ended December 31, 2019, in conformity with U.S. generally accepted accounting principles.
We also have audited, in accordance with the standards of the Public Company Accounting Oversight Board (United States) (PCAOB), the Company’s internal control over financial reporting as of December 31, 2019, based on criteria established in Internal Control - Integrated Framework issued by the Committee of Sponsoring Organizations of the Treadway Commission (2013 framework) and our report dated February 27, 2020 expressed an unqualified opinion thereon.
Basis for Opinion
These financial statements are the responsibility of the Company’s management. Our responsibility is to express an opinion on the Company's financial statements based on our audits. We are a public accounting firm registered with the Public Company Accounting Oversight Board (United States) (PCAOB) and are required to be independent with respect to the Company in accordance with the U.S. federal securities laws and the applicable rules and regulations of the Securities and Exchange Commission and the PCAOB.
We conducted our audits in accordance with the standards of the PCAOB. Those standards require that we plan and perform the audit to obtain reasonable assurance about whether the financial statements are free of material misstatement, whether due to error or fraud. Our audits included performing procedures to assess the risks of material misstatement of the financial statements, whether due to error or fraud, and performing procedures that respond to those risks. Such procedures included examining, on a test basis, evidence regarding the amounts and disclosures in the financial statements. Our audits also included evaluating the accounting principles used and significant estimates made by management, as well as evaluating the overall presentation of the financial statements. We believe that our audits provide a reasonable basis for our opinion.
Critical Audit Matters
The critical audit matters communicated below are matters arising from the current period audit of the financial statements that were communicated or required to be communicated to the audit committee and that: (1) relate to accounts or disclosures that are material to the financial statements and (2) involved our especially challenging, subjective or complex judgments. The communication of critical audit matters does not alter in any way our opinion on the consolidated financial statements, taken as a whole, and we are not, by communicating the critical audit matters below, providing separate opinions on the critical audit matters or on the accounts or disclosures to which they relate.
F - 2
| Valuation of Warranty Obligations | ||
|
| ||
| Description of the Matter | As of December 31, 2019, the warranty obligation was $172,563 thousands, as more fully described in Notes 2.r and 12 to the consolidated financial statements. Substantially all of the Company’s warranty obligations are related to the solar business. The calculation of such warranty obligations requires significant judgment due to the inherent complexity in estimating the amount and timing of future warranty costs. The Company's products include a warranty of up to 12 years for its inverters and up to 25 year for its power optimizers. In order to predict the failure rate of each product, the Company established a reliability model based on the estimated mean time between failures (“MTBF”) and an additional model to capture non-systematic failures. Predicted failure rates are updated periodically based on new product versions and analysis of the root cause of actual failures, as are warranty related replacement costs. Auditing the management’s valuation of warranty obligation was complex and highly judgmental due to the significant estimation required in determining its amount. In particular, the warranty obligation is subject to significant assumptions such as product failure rates, the average cost of products replacements and other warranty related costs. | |
|
| ||
| How We Addressed the Matter in Our Audit | We obtained an understanding, evaluated the design and tested the operating effectiveness of internal controls over the accounting of warranty, including management's assessment of the assumptions and data underlying the warranty valuation. Our substantive audit procedures included, among others, look back analysis and testing the accuracy and completeness of the underlying data used in management's warranty valuation assessment. We assessed the accuracy of historical data as the best estimate for forecasted failure rates, repair replacement ratios and other warranty related costs and compared them to actual warranty claims. In addition, we involved a specialist to assess the assumptions and the precision of the inputs underlying the MTBF model, including, evaluating the appropriateness of the MTBF model and its consistency with data obtained from external sources. |
F - 3
| Acquisition accounting for S.M.R.E S.p.A business combination | ||
|
| ||
| Description of the Matter | As described in Notes 2.k and 3 to the consolidated financial statements, on January 24, 2019, the Company acquired 56.8% of the outstanding common shares and voting rights of S.M.R.E S.p.A for a net consideration of $73 million (the “SMRE Acquisition”). The SMRE Acquisition was accounted for as a business combination in accordance with ASC 805 “Business Combinations”. Auditing the Company’s accounting for the SMRE Acquisition was complex due to the significant estimation required in determining the fair value of the current technology intangible asset in the amount of $44 million. The significant estimation was primarily due to the complexity of the valuation model used to measure the fair value of such asset, as well as the sensitivity of the respective fair value to the underlying significant assumptions. The Company used a discounted cash flow model to measure the intangible asset. The significant assumptions used to estimate the fair value of the intangible asset included discount rates and certain assumptions that form the basis of the forecasted results, such as revenue growth rates and profitability margins. These significant assumptions are forward-looking and could be affected by future economic and market conditions. | |
|
| ||
| How We Addressed the Matter in Our Audit | We obtained an understanding, evaluated the design and tested the operating effectiveness of internal controls over the accounting for acquisitions, such as controls over the measurement of current technology intangible asset, including the valuation models and underlying assumptions used to develop such estimates. To test the estimated fair value of the intangible asset, we performed audit procedures that included, among others, evaluating the Company’s selection of the valuation methodology, evaluating the methods and significant assumptions used by the Company’s valuation specialist and evaluating the completeness and accuracy of the underlying data supporting the significant assumptions and estimates. Specifically, when assessing the key assumptions effecting the current technology intangible asset, we focused on forecasted revenue, weighted average cost of capital rate, market benchmarks assumptions and long-term revenue growth rates. We involved our valuation specialists to assist with our evaluation of the methodology used by the Company and significant assumptions included in the fair value estimates. We also evaluated the appropriateness of the related disclosures included in Note 3 to the consolidated financial statements in relation to SMRE Acquisition. |
/s/ Kost Forer Gabbay & Kasierer
A Member of Ernst & Young Global
We have served as the Company’s auditor since 2007.
Tel-Aviv, Israel
February 27, 2020
F - 4
REPORT OF INDEPENDENT REGISTERED PUBLIC ACCOUNTING FIRM
To the Stockholders and the Board of Directors of
SOLAREDGE TECHNOLOGIES, INC.
Opinion on Internal Control over Financial Reporting
We have audited SolarEdge Technologies, Inc. and subsidiaries internal control over financial reporting as of December 31, 2019, based on criteria established in Internal Control - Integrated Framework issued by the Committee of Sponsoring Organizations of the Treadway Commission (2013 framework) (the COSO criteria). In our opinion, SolarEdge Technologies, Inc. and subsidiaries (the “Company”) maintained, in all material respects, effective internal control over financial reporting as of December 31, 2019, based on the COSO criteria.
As indicated in the accompanying Management's Report on Internal Control Over Financial Reporting, management’s assessment of and conclusion on the effectiveness of internal control over financial reporting did not include the internal controls of the business of S.M.R.E S.p.A, that was acquired during 2019 and included in the 2019 consolidated financial statements of the Company and constituted 2.4% and 3.1% of total and net assets, respectively, as of December 31, 2019 and 1.4% of revenues for the year then ended. Our audit of internal control over financial reporting of the Company also did not include an evaluation of the internal control over financial reporting of the business of S.M.R.E S.p.A.
We also have audited, in accordance with the standards of the Public Company Accounting Oversight Board (United States) (PCAOB), the consolidated balance sheets of the Company as of December 31, 2019, and 2018, the related consolidated statements of income, comprehensive income, stockholders’ equity and cash flows for each of the three years in the period ended December 31, 2019, and the related notes and our report dated February 27, 2020 expressed an unqualified opinion thereon.
Basis for Opinion
The Company’s management is responsible for maintaining effective internal control over financial reporting and for its assessment of the effectiveness of internal control over financial reporting included in the accompanying Management’s Report on Internal Control over Financial Reporting.
Our responsibility is to express an opinion on the Company’s internal control over financial reporting based on our audit. We are a public accounting firm registered with the PCAOB and are required to be independent with respect to the Company in accordance with the U.S. federal securities laws and the applicable rules and regulations of the Securities and Exchange Commission and the PCAOB.
We conducted our audit in accordance with the standards of the PCAOB. Those standards require that we plan and perform the audit to obtain reasonable assurance about whether effective internal control over financial reporting was maintained in all material respects.
Our audit included obtaining an understanding of internal control over financial reporting, assessing the risk that a material weakness exists, testing and evaluating the design and operating effectiveness of internal control based on the assessed risk, and performing such other procedures, as we considered necessary in the circumstances. We believe that our audit provides a reasonable basis for our opinion.
F - 5
Definition and Limitations of Internal Control over Financial Reporting
A company’s internal control over financial reporting is a process designed to provide reasonable assurance regarding the reliability of financial reporting and the preparation of financial statements for external purposes in accordance with generally accepted accounting principles. A company’s internal control over financial reporting includes those policies and procedures that (1) pertain to the maintenance of records that, in reasonable detail, accurately and fairly reflect the transactions and dispositions of the assets of the company; (2) provide reasonable assurance that transactions are recorded as necessary to permit preparation of financial statements in accordance with generally accepted accounting principles, and that receipts and expenditures of the company are being made only in accordance with authorizations of management and directors of the company; and (3) provide reasonable assurance regarding prevention or timely detection of unauthorized acquisition, use, or disposition of the company’s assets that could have a material effect on the financial statements.
Because of its inherent limitations, internal control over financial reporting may not prevent or detect misstatements. Also, projections of any evaluation of effectiveness to future periods are subject to the risk that controls may become inadequate because of changes in conditions, or that the degree of compliance with the policies or procedures may deteriorate.
/s/ Kost Forer Gabbay & Kasierer
A Member of Ernst & Young Global
Tel-Aviv, Israel
February 27, 2020
F - 6
SOLAREDGE TECHNOLOGIES, INC.
AND ITS SUBSIDIARIES
| CONSOLIDATED BALANCE SHEETS | ||||||||
| U.S. dollars in thousands (except share and per share data) | ||||||||
|
| ||||||||
| December 31, | ||||||||
| 2019 | 2018 | |||||||
| ASSETS | ||||||||
|
| ||||||||
| CURRENT ASSETS: | ||||||||
| Cash and cash equivalents | $ | | $ | | ||||
| Short-term bank deposits | | | ||||||
| Restricted bank deposits | | | ||||||
| Marketable securities | | | ||||||
| Trade receivables, net | | | ||||||
| Prepaid expenses and other current assets | | | ||||||
| Inventories, net | | | ||||||
|
| ||||||||
| Total current assets | | | ||||||
|
| ||||||||
| LONG-TERM ASSETS: | ||||||||
| Marketable securities | | | ||||||
| Operating lease right-of-use assets, net | | | ||||||
| Property, plant and equipment, net | | | ||||||
| Deferred tax assets, net | | | ||||||
| Intangible assets, net | | | ||||||
| Goodwill | | | ||||||
| Other long-term assets | | | ||||||
|
| ||||||||
| Total long-term assets | | | ||||||
|
| ||||||||
| Total assets | $ | | $ | | ||||
The accompanying notes are an integral part of the consolidated financial statements.
F - 7
SOLAREDGE TECHNOLOGIES, INC.
AND ITS SUBSIDIARIES
| CONSOLIDATED BALANCE SHEETS (Cont.) | ||||||||
| U.S. dollars in thousands (except share and per share data) | ||||||||
|
| ||||||||
| December 31, | ||||||||
| 2019 | 2018 | |||||||
|
| ||||||||
| LIABILITIES AND STOCKHOLDERS’ EQUITY | ||||||||
|
| ||||||||
| CURRENT LIABILITIES: | ||||||||
| Trade payables, net | $ | | $ | | ||||
| Employees and payroll accruals | | | ||||||
| Current maturities of bank loans and accrued interest | | | ||||||
| Warranty obligations | | | ||||||
| Deferred revenues | | | ||||||
| Accrued expenses and other current liabilities | | | ||||||
|
| ||||||||
| Total current liabilities | | | ||||||
|
| ||||||||
| LONG-TERM LIABILITIES: | ||||||||
| Bank loans | | | ||||||
| Warranty obligations | | | ||||||
| Deferred revenues | | | ||||||
| Operating lease liabilities | | | ||||||
| Deferred tax liabilities, net | | | ||||||
| Other long-term liabilities | | | ||||||
|
| ||||||||
| Total long-term liabilities | | | ||||||
|
| ||||||||
| COMMITMENTS AND CONTINGENT LIABILITIES | ||||||||
|
| ||||||||
| STOCKHOLDERS’ EQUITY: | ||||||||
| Common stock of $ | | | ||||||
| Additional paid-in capital | | | ||||||
| Accumulated other comprehensive loss | ( | ) | ( | ) | ||||
| Retained earnings | | | ||||||
|
| ||||||||
| Total SolarEdge Technologies, Inc. stockholders’ equity | | | ||||||
|
| ||||||||
| Non-controlling interests | | | ||||||
|
| ||||||||
| Total stockholders’ equity | | | ||||||
|
| ||||||||
| Total liabilities and stockholders’ equity | $ | | $ | | ||||
The accompanying notes are an integral part of the consolidated financial statements.
F - 8
SOLAREDGE TECHNOLOGIES, INC.
AND ITS SUBSIDIARIES
| CONSOLIDATED STATEMENTS OF INCOME |
| U.S. dollars in thousands (except share and per share data) |
| Year ended December 31, | ||||||||||||
| 2019 | 2018 | 2017 | ||||||||||
|
| ||||||||||||
| Revenues | $ | | $ | | $ | | ||||||
| Cost of revenues | | | | |||||||||
|
| ||||||||||||
| Gross profit | | | | |||||||||
|
| ||||||||||||
| Operating expenses: | ||||||||||||
|
| ||||||||||||
| Research and development | | | | |||||||||
| Sales and marketing | | | | |||||||||
| General and administrative | | | | |||||||||
| Other operating expenses | | | | |||||||||
|
| ||||||||||||
| Total operating expenses | | | | |||||||||
|
| ||||||||||||
| Operating income | | | | |||||||||
|
| ||||||||||||
| Financial expenses (income), net | | | ( | ) | ||||||||
|
| ||||||||||||
| Income before income taxes | | | | |||||||||
|
| ||||||||||||
| Income taxes | | | | |||||||||
|
| ||||||||||||
| Net income | $ | | $ | | $ | | ||||||
|
| ||||||||||||
| Net loss attributable to Non-controlling interests | | | | |||||||||
|
| ||||||||||||
| Net income attributable to SolarEdge Technologies, Inc. | $ | | $ | | $ | | ||||||
|
| ||||||||||||
| Net basic earnings per share of common stock attributable to SolarEdge Technologies, Inc. | $ | | $ | | $ | | ||||||
|
| ||||||||||||
| Net diluted earnings per share of common stock attributable to SolarEdge Technologies, Inc. | $ | | $ | | $ | | ||||||
|
| ||||||||||||
| Weighted average number of shares used in computing net basic earnings per share of common stock | | | | |||||||||
|
| ||||||||||||
| Weighted average number of shares used in computing net diluted earnings per share of common stock | | | | |||||||||
The accompanying notes are an integral part of the consolidated financial statements.
F - 9
SOLAREDGE TECHNOLOGIES, INC.
AND ITS SUBSIDIARIES
| CONSOLIDATED STATEMENTS OF COMPREHENSIVE INCOME | ||||||||||||
| U.S. dollars in thousands (except share and per share data) | ||||||||||||
|
| ||||||||||||
| Year ended December 31, | ||||||||||||
| 2019 | 2018 | 2017 | ||||||||||
|
| ||||||||||||
| Net income | $ | | $ | | $ | | ||||||
|
| ||||||||||||
| Other comprehensive income (loss): | ||||||||||||
|
| ||||||||||||
| Available-for-sale securities: | ||||||||||||
| Changes in unrealized gains (losses), net of tax | | ( | ) | ( | ) | |||||||
| Reclassification adjustments for losses included in net income | | | | |||||||||
| Net change | | ( | ) | ( | ) | |||||||
|
| ||||||||||||
| Cash flow hedges: | ||||||||||||
| Changes in unrealized gains, net of tax | | | | |||||||||
| Reclassification adjustments for gains, net of tax included in net income | | ( | ) | ( | ) | |||||||
| Net change | | | ( | ) | ||||||||
|
| ||||||||||||
| Foreign currency translation adjustments, net | ( | ) | | | ||||||||
|
| ||||||||||||
| Total other comprehensive income (loss) | ( | ) | | ( | ) | |||||||
|
| ||||||||||||
| Comprehensive income | $ | | $ | | $ | | ||||||
|
| ||||||||||||
| Comprehensive loss attributable to Non-controlling interests | | | | |||||||||
|
| ||||||||||||
| Comprehensive income attributable to SolarEdge Technologies, Inc. | $ | | $ | | $ | | ||||||
The accompanying notes are an integral part of the consolidated financial statements.
F - 10
SOLAREDGE TECHNOLOGIES, INC.
AND ITS SUBSIDIARIES
| CONSOLIDATED STATEMENTS OF STOCKHOLDERS’ EQUITY |
| U.S. dollars in thousands (except share and per share data) |
|
|
| SolarEdge Technologies, Inc. Stockholders’ Equity | |||||||||||||||||||||||||||||
| Common stock | Additional paid in Capital | Accumulated Other comprehensive Income (loss) | Retained earnings (Accumulated Deficit) | Total | Non- controlling interests | Total stockholders’ equity | |||||||||||||||||||||||
| Number | Amount | ||||||||||||||||||||||||||||
|
| |||||||||||||||||||||||||||||
| Balance as of December 31, 2016 | | $ | | $ | | $ | ( | ) | $ | ( | ) | $ | | $ | - | $ | | ||||||||||||
|
| |||||||||||||||||||||||||||||
| Issuance of Common Stock upon exercise of employee and non-employees stock-based awards | | * | | - | - | | - | | |||||||||||||||||||||
| Issuance of Common stock under employee stock purchase plan | | * | | - | - | | - | | |||||||||||||||||||||
| Equity based compensation expenses to employees and nonemployees | - | - | | - | - | | - | | |||||||||||||||||||||
| Other comprehensive loss adjustments | - | - | - | ( | ) | - | ( | ) | - | ( | ) | ||||||||||||||||||
| Net income | - | - | - | - | | | - | | |||||||||||||||||||||
|
| |||||||||||||||||||||||||||||
| Balance as of December 31, 2017 | | $ | | $ | | $ | ( | ) | $ | | $ | | $ | - | $ | | |||||||||||||
|
| |||||||||||||||||||||||||||||
| Cumulative effect of adopting ASC 606 | - | - | - | - | ( | ) | ( | ) | - | ( | ) | ||||||||||||||||||
| Issuance of Common Stock upon exercise of employee and non-employees stock-based awards | | | | - | - | | - | | |||||||||||||||||||||
| Issuance of Common stock under employee stock purchase plan | | * | | - | - | | - | | |||||||||||||||||||||
| Equity based compensation expenses to employees and nonemployees | - | - | | - | - | | - | | |||||||||||||||||||||
| Non-controlling interests related to business combination | - | - | - | - | - | - | | | |||||||||||||||||||||
| Change in non-controlling interests | - | - | ( | ) | - | - | (746 | ) | ( | ) | ( | ) | |||||||||||||||||
| Other comprehensive loss adjustments | - | - | - | | - | | | | |||||||||||||||||||||
| Net income | - | - | - | - | | | ( | ) | | ||||||||||||||||||||
|
| |||||||||||||||||||||||||||||
| Balance as of December 31, 2018 | | $ | | $ | | $ | ( | ) | $ | | $ | | $ | | $ | | |||||||||||||
| * | Represents an amount less than $1. |
F - 11
SOLAREDGE TECHNOLOGIES, INC.
AND ITS SUBSIDIARIES
| CONSOLIDATED STATEMENTS OF STOCKHOLDERS’ EQUITY (Cont.) |
| U.S. dollars in thousands (except share and per share data) |
|
|
| SolarEdge Technologies, Inc. Stockholders’ Equity | |||||||||||||||||||||||||||||
| Common stock | Additional paid in Capital | Accumulated Other comprehensive Income (loss) | Retained earnings (Accumulated Deficit) | Total | Non- controlling interests | Total stockholders’ equity | |||||||||||||||||||||||
| Number | Amount | ||||||||||||||||||||||||||||
|
| |||||||||||||||||||||||||||||
| Balance as of December 31, 2018 | | $ | | $ | | $ | ( | ) | $ | | $ | | $ | | $ | | |||||||||||||
|
| |||||||||||||||||||||||||||||
| Issuance of Common Stock upon exercise of employee and non-employees stock-based awards | | * | | - | - | | - | | |||||||||||||||||||||
| Issuance of Common stock under employee stock purchase plan | | * | | - | - | | - | | |||||||||||||||||||||
| Equity based compensation expenses to employees and nonemployees | | - | | - | - | | - | | |||||||||||||||||||||
| Treasury Stock | ( | ) | * | ( | ) | | | ( | ) | | ( | ) | |||||||||||||||||
| Issuance of Common stock upon business combination | | * | | | | | | | |||||||||||||||||||||
| Non-controlling interests related to business combination | - | - | - | - | - | - | | | |||||||||||||||||||||
| Change in non-controlling interests | - | - | ( | ) | - | - | (20 | ) | ( | ) | ( | ) | |||||||||||||||||
| Other comprehensive loss adjustments | - | - | - | ( | ) | - | ( | ) | ( | ) | ( | ) | |||||||||||||||||
| Net income | - | - | - | - | | | ( | ) | | ||||||||||||||||||||
|
| |||||||||||||||||||||||||||||
| Balance as of December 31, 2019 | | $ | | $ | | $ | ( | ) | $ | | $ | | $ | | $ | | |||||||||||||
| * | |
The accompanying notes are an integral part of the consolidated financial statements.
F - 12
SOLAREDGE TECHNOLOGIES, INC.
AND ITS SUBSIDIARIES
| CONSOLIDATED STATEMENTS OF CASH FLOWS |
| U.S. dollars in thousands (except share and per share data) |
|
|
| Year ended December 31, | ||||||||||||
| 2019 | 2018 | 2017 | ||||||||||
|
| ||||||||||||
| Cash flows provided by operating activities: | ||||||||||||
| Net income | $ | | $ | | $ | | ||||||
| Adjustments to reconcile net income to net cash provided by operating activities: | ||||||||||||
| Depreciation of property, plant and equipment | | | | |||||||||
| Amortization of intangible assets | | | | |||||||||
| Amortization of premium and accretion of discount on available-for-sale marketable securities, net | | | | |||||||||
| Stock-based compensation expenses | | | | |||||||||
| Deferred income tax benefit, net | ( | ) | ( | ) | ( | ) | ||||||
| Loss from sale of business | | | | |||||||||
| Other expenses (income), net | | | ( | ) | ||||||||
| Changes in assets and liabilities: | ||||||||||||
| Inventories, net | ( | ) | ( | ) | ( | ) | ||||||
| Prepaid expenses and other assets | ( | ) | ( | ) | ( | ) | ||||||
| Trade receivables, net | ( | ) | ( | ) | ( | ) | ||||||
| Operating lease right-of-use assets and liabilities, net and effect of exchange rate differences | | | | |||||||||
| Trade payables, net | | | | |||||||||
| Employees and payroll accruals | | | | |||||||||
| Warranty obligations | | | | |||||||||
| Deferred revenues | | | | |||||||||
| Other liabilities | | ( | ) | | ||||||||
|
| ||||||||||||
| Net cash provided by operating activities | | | | |||||||||
|
| ||||||||||||
| Cash flows from investing activities: | ||||||||||||
| Business combinations, net of cash acquired | ( | ) | ( | ) | | |||||||
| Purchase of property, plant and equipment | ( | ) | ( | ) | ( | ) | ||||||
| Withdrawal from (investment in) bank deposits | | ( | ) | | ||||||||
| Investment in restricted bank deposits | ( | ) | ( | ) | ( | ) | ||||||
| Investment in available-for-sale marketable securities | ( | ) | ( | ) | ( | ) | ||||||
| Proceed from sales and maturities of available-for-sale marketable securities | | | | |||||||||
| Other investing activities | ( | ) | | | ||||||||
|
| ||||||||||||
| Net cash used in investing activities | $ | ( | ) | $ | ( | ) | $ | ( | ) | |||
The accompanying notes are an integral part of the consolidated financial statements.
F - 13
SOLAREDGE TECHNOLOGIES, INC.
AND ITS SUBSIDIARIES
| CONSOLIDATED STATEMENTS OF CASH FLOWS (Cont.) |
| U.S. dollars in thousands (except share and per share data) |
|
|
| Year ended December 31, | ||||||||||||
| 2019 | 2018 | 2017 | ||||||||||
|
| ||||||||||||
| Cash flows from financing activities: | ||||||||||||
| Repayment of bank loans, net | $ | ( | ) | $ | ( | ) | $ | | ||||
| Proceeds from issuance of shares under stock purchase plan and upon exercise of stock-based awards | | | | |||||||||
| Change in non-controlling interests | ( | ) | ( | ) | | |||||||
| Other financing activities | ( | ) | | | ||||||||
|
| ||||||||||||
| Net cash provided (used in) by financing activities | ( | ) | ( | ) | | |||||||
|
| ||||||||||||
| Increase in cash and cash equivalents | | | | |||||||||
| Cash and cash equivalents at the beginning of the period | | | | |||||||||
| Effect of exchange rate differences on cash and cash equivalents | | | ( | ) | ||||||||
|
| ||||||||||||
| Cash and cash equivalents at the end of the period | $ | | $ | | $ | | ||||||
|
| ||||||||||||
| Supplemental disclosure of non-cash activities: | ||||||||||||
| Operating lease, right of use assets | $ | | $ | | $ | | ||||||
| Issuance of common stock upon business combination | $ | | $ | | $ | | ||||||
| Goodwill | $ | | $ | | $ | | ||||||
|
| ||||||||||||
| Supplemental disclosure of cash flow information: | ||||||||||||
|
| ||||||||||||
| Cash paid for income taxes | $ | | $ | | $ | | ||||||
| Cash paid for interest on bank loans | $ | | $ | | $ | | ||||||
The accompanying notes are an integral part of the consolidated financial statements.
F - 14
SOLAREDGE TECHNOLOGIES, INC.
AND ITS SUBSIDIARIES
NOTES TO CONSOLIDATED FINANCIAL STATEMENTS
U.S. dollars in thousands (except share and per share data)
NOTE 1:-GENERAL
a.SolarEdge Technologies, Inc. (the “Company”) and its subsidiaries design, develop, and sell an intelligent inverter solution designed to maximize power generation at the individual photovoltaic (“PV”) module level while lowering the cost of energy produced by the solar PV system and providing comprehensive and advanced safety features. The Company’s products consist mainly of (i) power optimizers designed to maximize energy throughput from each and every module through constant tracking of Maximum Power Point individually per module, (ii) inverters which invert direct current (DC) from the PV module to alternating current (AC), (iii) a related cloud-based monitoring platform, that collects and processes information from the power optimizers and inverters of a solar PV system to enable customers and system owners as applicable, to monitor and manage the solar PV systems and (iv) a storage solution that is used to increase energy independence and maximize self-consumption for homeowners by utilizing a battery that is sold separately by third party manufacturers, to store and supply power as needed (the “StorEdge solution”).
The Company and its subsidiaries sell their products worldwide through large distributors and electrical equipment wholesalers to smaller solar installers as, well as directly to large solar installers and engineering, procurement and construction firms (“EPCs”).
In 2018, the Company completed the acquisitions of substantially all of the assets and activities of Gamatronic Electronic Industries Ltd (“Gamatronic IL”) and all of the outstanding shares of its wholly owned subsidiary Gamatronic (UK) Limited (“Gamatronic UK”), respectively (together, the “Gamatronic Acquisition”). Together, this activity is referred to as the UPS division which provides and manufactures Uninterruptible Power Supplies (“UPS”) devices.
On October 17, 2018, the Company completed the acquisition of
On January 24, 2019, the Company completed the acquisition of
The Company organizes its operations into five operating segments: solar, UPS, energy storage, e-Mobility and machinery (see Note 22).
F - 15
SOLAREDGE TECHNOLOGIES, INC.
AND ITS SUBSIDIARIES
NOTES TO CONSOLIDATED FINANCIAL STATEMENTS
U.S. dollars in thousands (except share and per share data)
NOTE 2:-SIGNIFICANT ACCOUNTING POLICIES
The consolidated financial statements are prepared according to United States generally accepted accounting principles (“U.S. GAAP”).
a.Principles of consolidation:
The consolidated financial statements include the accounts of the Company and its subsidiaries. Intercompany transactions and balances including profit from intercompany sales not yet realized outside the Company have been eliminated upon consolidation.
b.Use of estimates:
The preparation of financial statements, in conformity with U.S. GAAP requires management to make estimates and assumptions that affect the amounts reported in the financial statements and accompanying notes. The Company evaluates its assumptions on an ongoing basis. The Company’s management believes that the estimates, judgment, and assumptions used are reasonable based upon information available at the time they are made. These estimates, judgments and assumptions can affect the reported amounts of assets and liabilities and disclosure of contingent assets and liabilities at the dates of the consolidated financial statements, and the reported amounts of revenue and expenses during the reporting periods. Actual results could differ from those estimates.
c.Financial statements in U.S. dollars:
A major part of the Company’s operations is carried out in the United States, Israel and certain other countries. The functional currency of these entities is the U.S. dollar.
Financing activities, including cash investments are primarily made in U.S. dollars.
Accordingly, monetary accounts maintained in currencies other than the U.S. dollar are translated into U.S. dollars in accordance with Financial Accounting Standards Board Accounting Standards Codification (“ASC”) No. 830 “Foreign Currency Matters”. All transaction gains and losses of the re-measurement of monetary balance sheet items are reflected in the statements of income as financial income or expenses, as appropriate.
The financial statements of other Company’s subsidiaries whose functional currency is other than the U.S. dollar have been translated into U.S dollars. Assets and liabilities have been translated using the exchange rates in effect as of the balance sheet date. Statements of income amounts have been translated using the average exchange rate for the relevant periods.
The resulting translation adjustments are reported as a component of stockholders’ equity in accumulated other comprehensive loss.
Accumulated other comprehensive gains (losses) related to foreign currency translation adjustments, net amounted to $(
F - 16
SOLAREDGE TECHNOLOGIES, INC.
AND ITS SUBSIDIARIES
NOTES TO CONSOLIDATED FINANCIAL STATEMENTS
U.S. dollars in thousands (except share and per share data)
NOTE 2:-SIGNIFICANT ACCOUNTING POLICIES (Cont.)
d.Cash and cash equivalents:
Cash equivalents are short-term, highly liquid investments that are readily convertible to cash, with original maturities of three months or less at the date acquired.
e.Short-term bank deposits:
Short-term bank deposits are deposits with an original maturity of more than three months and less than a year from the date of investment and which do not meet the definition of cash equivalents. The deposits are presented according to their term deposits.
f.Restricted bank deposits:
Restricted bank deposits are primarily invested in short-term bank deposits, with an original maturity of more than three months and less than a year from the date of investment and which are primarily used as collateral for a letter of credit for the Company’s customers and security for the Company’s office leases and credit cards.
g.Marketable Securities:
Marketable securities consist of corporate and governmental bonds. The Company determines the appropriate classification of marketable securities at the time of purchase and re-evaluates such designation at each balance sheet date. In accordance with FASB ASC No. 320 “Investments - Debt and Equity Securities”, the Company classifies marketable securities as available-for-sale.
Available-for-sale securities are stated at fair value, with unrealized gains and losses reported in accumulated other comprehensive income (loss), a separate component of stockholders’ equity, net of taxes.
Realized gains and losses on sales of marketable securities, as determined on a specific identification basis, are included in financial income (expenses), net. The amortized cost of marketable securities is adjusted for amortization of premium and accretion of discount to maturity, both of which, together with interest, are included in financial income (expenses), net.
The Company classifies its marketable securities as either short-term or long-term based on each instrument’s underlying contractual maturity date. Marketable securities with maturities of 12 months or less are classified as short-term and marketable securities with maturities greater than 12 months are classified as long-term.
F - 17
SOLAREDGE TECHNOLOGIES, INC.
AND ITS SUBSIDIARIES
NOTES TO CONSOLIDATED FINANCIAL STATEMENTS
U.S. dollars in thousands (except share and per share data)
NOTE 2:-SIGNIFICANT ACCOUNTING POLICIES (Cont.)
The Company recognizes an impairment charge when a decline in the fair value of its investments in debt securities below the cost basis of such securities is judged to be other-than-temporary. Factors considered in making such a determination include the duration and severity of the impairment, the reason for the decline in value, the potential recovery period, and the Company’s intent to sell, including whether it is more likely than not that the Company will be required to sell the investment before recovery of cost basis. If the Company does not intend to sell the security or it is not more likely than not that it will be required to sell the security before it recovers in value, the Company must estimate the net present value of cash flows expected to be collected. If the amortized cost exceeds the net present value of cash flows, such excess is considered a credit loss and an other-than-temporary impairment (“OTTI”) has occurred.
For securities that are deemed OTTI, the amount of impairment is recognized in the statement of income and is limited to the amount related to credit losses, while impairment related to other factors is recognized in other comprehensive income (loss).
The Company did not recognize OTTI on its marketable securities during the years ended December 31, 2019, 2018, and 2017.
h.Inventories:
Inventories are stated at the lower of cost or net realizable value. Cost includes depreciation, labor, material and overhead costs. Inventory reserves are provided to cover risks arising from slow-moving items or technological obsolescence.
The Company periodically evaluates the quantities on hand relative to historical, current, and projected sales volume. Based on this evaluation, an impairment charge is recorded when required to write-down inventory to its net realizable value. Cost of finished goods and raw materials is determined using the moving average cost method.
i.Property, plant and equipment:
Property, plant and equipment are stated at cost, net of accumulated depreciation. Machinery and equipment in progress represent the construction or development stage of property and equipment that have not yet been placed in service for the Company's intended use. Depreciation is calculated by the straight-line method over the estimated useful live of the assets, at the following rates:
F - 18
SOLAREDGE TECHNOLOGIES, INC.
AND ITS SUBSIDIARIES
NOTES TO CONSOLIDATED FINANCIAL STATEMENTS
U.S. dollars in thousands (except share and per share data)
NOTE 2:-SIGNIFICANT ACCOUNTING POLICIES (Cont.)
| % | ||
|
| ||
| Buildings and plants | | |
| Computers and peripheral equipment | | |
| Office furniture and equipment | | |
| Machinery and equipment | | |
| Laboratory and testing equipment | | |
| Leasehold improvements | over the shorter of the lease term or useful economic life |
j.Leases:
The Company determines if an arrangement is a lease at inception. Operating leases are included in operating lease right-of-use (“ROU”) assets, other current liabilities and operating lease liabilities in the Company’s consolidated balance sheets. Finance leases are included in property, plant and equipment, net, other current liabilities, and other long-term liabilities in the Company’s consolidated balance sheets.
ROU assets represent the right to use an underlying asset for the lease term and lease liabilities represent the Company’s obligation to make lease payments arising from the lease. Operating lease ROU assets and liabilities are recognized at commencement date based on the present value of lease payments over the lease term.
The Company uses incremental borrowing rates based on the estimated rate of interest for collateralized borrowing over a similar term of the lease payments at commencement date. The operating lease ROU asset also includes any lease payments made and excludes lease incentives. Lease terms may include options to extend or terminate the lease when it is reasonably certain that the Company will exercise that option. Lease expenses for lease payments are recognized on a straight-line basis over the lease term.
k.Business Combination:
The Company allocates the fair value of the purchase price to the tangible assets acquired, liabilities assumed and intangible assets acquired based on their estimated fair value. The excess of the fair value of the purchase price over the fair values of these identifiable assets and liabilities is recorded as goodwill. Such valuations require management to make significant estimates and assumptions, especially with respect to intangible assets. Significant estimates in valuing certain intangible assets include, but are not limited to, future expected cash flows from acquired technology and discount rates.
Management’s estimates of fair value are based upon assumptions believed to be reasonable, but which are inherently uncertain and unpredictable and, as a result, actual results may differ from estimates. During the measurement period, which does not exceed one year from the acquisition date, the Company may record adjustments to the assets acquired and liabilities assumed, with the corresponding offset to goodwill. Upon the finalization of the measurement period, any subsequent adjustments are recorded to earnings.
F - 19
SOLAREDGE TECHNOLOGIES, INC.
AND ITS SUBSIDIARIES
NOTES TO CONSOLIDATED FINANCIAL STATEMENTS
U.S. dollars in thousands (except share and per share data)
NOTE 2:-SIGNIFICANT ACCOUNTING POLICIES (Cont.)
l.Intangible Assets:
The Company evaluates the recoverability of finite-lived intangible assets for possible impairment whenever events or circumstances indicate that the carrying amount of such assets may not be recoverable.
The evaluation is performed at the lowest level for which identifiable cash flows are largely independent of the cash flows of other assets and liabilities. Recoverability of these group of assets is measured by a comparison of the carrying amounts to the future undiscounted cash flows the group of assets is expected to generate.
If such review indicates that the carrying amount of intangible assets is not recoverable, the carrying amount of such assets is reduced to fair value. The Company has not recorded any impairment charges of finite-lived intangible assets during the years ended December 31, 2019 and 2018.
Acquired identifiable finite-lived intangible assets are amortized on a straight-line basis or accelerated method over the estimated useful lives of the assets. The basis of amortization approximates the pattern in which the assets are utilized, over their estimated useful lives. The Company routinely reviews the remaining estimated useful lives of finite-lived intangible assets. In case the Company reduces the estimated useful life for any asset, the remaining unamortized balance is amortized or depreciated over the revised estimated useful life (see Note 9).
m.Goodwill:
Goodwill reflects the excess of the consideration transferred, including the fair value of any contingent consideration and any non-controlling interest in the acquiree, over the assigned fair values of the identifiable net assets acquired. Goodwill is not amortized, and is assigned to reporting units and tested for impairment at least on an annual basis, in the fourth quarter of the fiscal year.
The goodwill impairment test is performed according to the following principles:
(1) An initial qualitative assessment may be performed to determine whether it is more likely than not that the fair value of the reporting unit is less than its carrying amount.
(2) If the Company concludes it is more likely than not that the fair value of the reporting unit is less than its carrying mount, a quantitative fair value test is performed. An impairment charge for the amount by which the carrying amount exceeds the reporting unit’s fair value is recognized.
The Company has not recorded any impairment charges of goodwill during the years ended December 31, 2019 and 2018.
F - 20
SOLAREDGE TECHNOLOGIES, INC.
AND ITS SUBSIDIARIES
NOTES TO CONSOLIDATED FINANCIAL STATEMENTS
U.S. dollars in thousands (except share and per share data)
NOTE 2:-SIGNIFICANT ACCOUNTING POLICIES (Cont.)
n.Impairment of long-lived assets:
The Company’s long-lived assets to be held or used, including right-of-use assets and intangible assets that are subject to amortization, are reviewed for impairment in accordance with ASC 360 “Property, Plants and Equipment”, whenever events or changes in circumstances indicate that the carrying amount of an asset (or asset group) may not be recoverable. Recoverability of assets to be held and used is measured by a comparison of the carrying amount of an asset (or asset group) to the future undiscounted cash flows expected to be generated by the assets (or asset group).
If such assets are considered to be impaired, the impairment to be recognized is measured by the amount by which the carrying amount of the assets exceeds their fair value. For the years ended December 31, 2019, 2018 and 2017, no impairment losses have been identified.
o.Severance pay:
The employees of the Company’s Israeli subsidiary are included under Section 14 of the Severance Pay Law, 1963, under which these employees are entitled only to monthly deposits made in their name with insurance companies, at a rate of 8.33% of their monthly salary. These payments cause the Company to be released from any future obligation under the Israeli Severance Pay Law to make severance payments in respect of those employees; therefore, related assets and liabilities are not presented in the consolidated balance sheets.
For the years ended December 31, 2019, 2018 and 2017, the Company recorded $
p.Revenue recognition:
Revenues are recognized in accordance with ASC 606, revenue from contracts with customers when control of the promised goods or services is transferred to the customers, in an amount that the Company expects in exchange for those goods or services.
The Company’s products consist mainly of (i) power optimizers, (ii) inverters, (iii) a related cloud-based monitoring platform, (iv) a storage solution, (v) UPS units (vi) Lithium-ion cells, batteries and energy storage solutions (vii) powertrains solutions for the e-Mobility segment and (viii) machinery for manufacturing lines.
The Company recognizes revenue under the core principle that transfer of control to the Company’s customers should be depicted in an amount reflecting the consideration the Company expects to receive in revenue. In order to achieve that core principle, the Company applies the following five-step approach: (1) identify the contract with a customer, (2) identify the performance obligations in the contract, (3) determine the transaction price, (4) allocate the transaction price to the performance obligations in the contract, and (5) recognize revenue when the performance obligation is satisfied.
F - 21
SOLAREDGE TECHNOLOGIES, INC.
AND ITS SUBSIDIARIES
NOTES TO CONSOLIDATED FINANCIAL STATEMENTS
U.S. dollars in thousands (except share and per share data)
NOTE 2:-SIGNIFICANT ACCOUNTING POLICIES (Cont.)
(1) Identify the contract with a customer
A contract is an agreement between two or more parties that creates enforceable rights and obligations. In evaluating the contract, the Company analyzes the customer’s intent and ability to pay the amount of promised consideration (credit risk) and considers the probability of collecting substantially all of the consideration.
The Company determines whether collectability is reasonably assured on a customer-by-customer basis pursuant to its credit review policy.
The Company typically sells to customers with whom it has a long-term business relationship and a history of successful collection. For a new customer, or when an existing customer substantially expands its commitments, the Company evaluates the customer’s financial position, the number of years the customer has been in business, the history of collection with the customer, and the customer’s ability to pay, and typically assigns a credit limit based on that review.
(2) Identify the performance obligations in the contract
At a contract’s inception, the Company assesses the goods or services promised in a contract with a customer and identifies the performance obligations.
The main performance obligations are the provisions of the following: delivery of the Company’s products; cloud based monitoring services; extended warranty services and communication services.
(3) Determine the transaction price
The transaction price is the amount of consideration to which the Company is entitled in exchange for transferring promised goods or services to a customer, excluding amounts collected on behalf of third parties.
Generally, the Company does not provide price protection, stock rotation, and/or right of return. The Company determines the transaction price for all satisfied and unsatisfied performance obligations identified in the contract from contract inception to the beginning of the earliest period presented.
Rebates or discounts on goods or services are accounted for as variable consideration. The rebate or discount program is applied retrospectively for future purchases. Provisions for rebates, sales incentives, and discounts to customers are accounted for as reductions in revenue in the same period the related sales are recorded.
The accrual for rebates is allocated to specific receivables. The Company accrued $
F - 22
SOLAREDGE TECHNOLOGIES, INC.
AND ITS SUBSIDIARIES
NOTES TO CONSOLIDATED FINANCIAL STATEMENTS
U.S. dollars in thousands (except share and per share data)
NOTE 2:-SIGNIFICANT ACCOUNTING POLICIES (Cont.)
When a contract provides a customer with payment terms of more than a year, the Company considers whether those terms create variability in the transaction price and whether a significant financing component exists.
As of December 31, 2019, the Company has not provided payment terms of more than a year.
The performance obligations that extend for a period greater than one year are those that include a financial component: (i) warranty extension services, (ii) cloud-based monitoring, and (iii) communication services.
The Company recognizes financing component expenses in its consolidated statement of income in relation to advance payments for performance obligations that extend for a period greater than one year. These financing component expenses are reflected in the Company’s deferred revenues balance.
(4) Allocate the transaction price to the performance obligations in the contract
The Company performs an allocation of the transaction price to each separate performance obligation, in proportion to their relative standalone selling prices.
(5) Recognize revenue when a performance obligation is satisfied
Revenue is recognized when or as performance obligations are satisfied by transferring control of a promised good or service to a customer. Control either transfers over time or at a point in time, which affects when revenue is recorded.
Revenues from sales of products are recognized when control is transferred (based on the agreed International Commercial terms, or “INCOTERMS”). Revenues related to warranty extension services, cloud-based monitoring, and communication services are recognized over time on a straight-line basis.
Deferred revenues consist of deferred cloud-based monitoring services, communication services, warranty extension services and advance payments received from customers for the Company’s products. Deferred revenues are classified as short-term and long-term deferred revenues based on the period in which revenues are expected to be recognized.
F - 23
SOLAREDGE TECHNOLOGIES, INC.
AND ITS SUBSIDIARIES
NOTES TO CONSOLIDATED FINANCIAL STATEMENTS
U.S. dollars in thousands (except share and per share data)
NOTE 2:-SIGNIFICANT ACCOUNTING POLICIES (Cont.)
q.Cost of revenues:
Cost of revenues includes the following: product costs consisting of purchases from contract manufacturers and other suppliers, direct and indirect manufacturing costs, shipping and handling, support, warranty expenses and changes in warranty provision, provision for losses related to slow moving and dead inventory, personnel and logistics costs.
Shipping and handling costs, which amounted to $
r.Warranty obligations:
The Company provides a product warranty for its solar related products as follows: a 10-year limited warranty for StorEdge products, a standard
In certain cases, the Company provides an extended warranty for inverters that increases the warranty period for up to
The Company maintains reserves to cover the expected costs that could result from the standard warranty. The warranty liability is in the form of product replacement and associated costs. Warranty reserves are based on the Company’s best estimate of such costs and are included in cost of revenues. The reserve for the related warranty expenses is based on various factors including assumptions about the frequency of warranty claims on product failures, derived from results of accelerated lab testing, field monitoring, analysis of the history of product field failures, and the Company’s reliability estimates.
The Company has established a reliability measurement system based on the units’ estimated mean time between failure, or MTBF, a metric that equates to a steady-state failure rate per year for each product generation. The MTBF predicts the expected failure rate of each product within the Company's products installed base during the expected product warranted lifetime.
The Company performs accelerated life cycle testing, which simulates the service life of the product in a short period of time.
The accelerated life cycle tests incorporate test methodologies derived from standard tests used by solar module vendors to evaluate the period over which solar modules wear out. Corresponding replacement costs are updated periodically to reflect changes in the Company’s actual and estimated production costs for its products, rate of usage of refurbished units as a replacement of faulty units, and other costs related to logistic and subcontractors’ services associated with the replacement products.
F - 24
SOLAREDGE TECHNOLOGIES, INC.
AND ITS SUBSIDIARIES
NOTES TO CONSOLIDATED FINANCIAL STATEMENTS
U.S. dollars in thousands (except share and per share data)
NOTE 2:-SIGNIFICANT ACCOUNTING POLICIES (Cont.)
In addition, through the collection of actual field failure statistics, the Company has identified several additional failure causes that are not included in the MTBF model. Such causes, which mostly consist of design errors, workmanship errors caused during the manufacturing process and, to a lesser extent, replacement of non-faulty units by installers, result in generating additional replacement costs to the replacement costs projected under the MTBF model.
For other products, the Company accrues for warranty costs based on the Company’s best estimate of product and associated costs. The Company’s other products are sold with a standard limited warranty that typically range in duration from one to ten years.
Warranty obligations are classified as short-term and long-term obligations based on the period in which the warranty is expected to be claimed.
s.Research and development costs:
Research and development costs, are charged to the consolidated statement of income as incurred.
t.Concentrations of credit risks:
Financial instruments that potentially subject the Company to concentrations of credit risk consist principally of cash and cash equivalents, short-term bank deposits, restricted bank deposits, marketable securities, trade receivables and other accounts receivable.
Cash and cash equivalents, short-term bank deposits and restricted bank deposits are mainly invested in major banks in the U.S., Israel and Korea. Management believes that the financial institutions that hold the Company’s investments are financially sound and, accordingly, minimal credit risk exists with respect to these investments.
The Company's marketable securities include investments in highly-rated corporate debentures (mainly of U.S., UK, Canada, France, Australia, New Zealand and other countries) and governmental bonds. The financial institutions that hold the Company's marketable securities are major financial institutions located in the United States. Management believes that the Company's marketable securities portfolio is a diverse portfolio of highly-rated securities and the Company's investment policy limits the amount the Company may invest in each issuer, and accordingly, management believes that minimal credit risk exists from geographic or credit concentration with respect to these securities.
The trade receivables of the Company derive from sales to customers located primarily in North America, Europe, Korea and Australia.
F - 25
SOLAREDGE TECHNOLOGIES, INC.
AND ITS SUBSIDIARIES
NOTES TO CONSOLIDATED FINANCIAL STATEMENTS
U.S. dollars in thousands (except share and per share data)
NOTE 2:-SIGNIFICANT ACCOUNTING POLICIES (Cont.)
The Company generally does not require collateral, however, in certain circumstances, the Company may require letters of credit, other collateral, or additional guarantees.
An allowance for doubtful accounts is determined with respect to specific receivables that are doubtful of collection. The Company accrued $
The Company had one major customer (customer with attributable revenues that represents more than 10% of total revenues) that accounted for approximately
The Company had one major customer (customer with a balance that represents more than 10% of total trade receivables, net) as of December 31, 2019 and two major customers as of December 31, 2018 that accounted in the aggregate for approximately
u.Concentrations of supply risks:
The Company depends on two contract manufacturers and several limited or single source component suppliers. Reliance on these vendors makes the Company vulnerable to possible capacity constraints and reduced control over component availability, delivery schedules, manufacturing yields, and costs.
As of December 31, 2019 and 2018, two and three contract manufacturers collectively accounted for
v.Fair value of financial instruments:
The following methods and assumptions were used by the Company in estimating the fair value of its financial instruments:
The carrying value of cash and cash equivalents, short-term bank deposits, restricted bank deposits, trade receivables, net, long term bank loans and current maturities, prepaid expenses and other current assets, trade payables, net, employee and payroll accruals and accrued expenses and other current liabilities approximate their fair values due to the short-term maturities of such instruments.
Assets measured at fair value on a recurring basis as of December 31, 2019 and 2018 are comprised of money market funds and marketable securities (see Note 4).
The Company applies ASC 820 “Fair Value Measurements and Disclosures”, with respect to fair value measurements of all financial assets and liabilities.
F - 26
SOLAREDGE TECHNOLOGIES, INC.
AND ITS SUBSIDIARIES
NOTES TO CONSOLIDATED FINANCIAL STATEMENTS
U.S. dollars in thousands (except share and per share data)
NOTE 2:-SIGNIFICANT ACCOUNTING POLICIES (Cont.)
Fair value is an exit price, representing the amount that would be received for the sale of an asset or paid to transfer a liability in an orderly transaction between market participants. As such, fair value is a market-based measurement that should be determined based on assumptions that market participants would use in pricing an asset or a liability.
A three-tiered fair value hierarchy is established as a basis for considering such assumptions and for inputs used in the valuation methodologies in measuring fair value:
Level 1-Observable inputs that reflect quoted prices (unadjusted) for identical assets or liabilities in active markets.
Level 2- Include other inputs that are directly or indirectly observable in the marketplace.
Level 3-Unobservable inputs which are supported by little or no market activity.
The fair value hierarchy also requires an entity to maximize the use of observable inputs and minimize the use of unobservable inputs when measuring fair value.
w.Accounting for stock-based compensation:
The Company accounts for stock-based compensation in accordance with ASC 718 “Compensation-Stock Compensation”.
ASC 718 requires companies to estimate the fair value of equity-based payment awards on the date of grant using an Option-Pricing Model (“OPM”). The value of the portion of the award that is ultimately expected to vest is recognized as an expense over the requisite service periods in the Company’s consolidated statements of income.
The Company recognizes compensation expenses for the value of its awards granted based on the straight-line method over the requisite service period of each of the awards, net of estimated forfeitures. ASC 718 requires forfeitures to be estimated at the time of grant and revised, if necessary, in subsequent periods if actual forfeitures differ from those estimates. Estimated forfeitures are based on actual historical pre-vesting forfeitures.
The Company selected the Black-Scholes-Merton option-pricing model as the most appropriate fair value method for its stock-option awards and Employee Stock Purchase Plan (“ESPP”). The option-pricing model requires a number of assumptions, of which the most significant are the fair market value of the underlying common stock, expected stock price volatility, and the expected option term. Expected volatility for stock-option awards was calculated until December 31, 2017 based upon certain peer companies that the Company considered to be comparable and starting January 1, 2018 based upon the Company’s actual historical stock price movements over the most recent periods. Expected volatility for ESPP was calculated based upon the Company’s stock prices. The expected term of options granted is based upon historical experience and represents the period between the options’ grant date and the expected exercise or expiration date.
F - 27
SOLAREDGE TECHNOLOGIES, INC.
AND ITS SUBSIDIARIES
NOTES TO CONSOLIDATED FINANCIAL STATEMENTS
U.S. dollars in thousands (except share and per share data)
NOTE 2:-SIGNIFICANT ACCOUNTING POLICIES (Cont.)
The risk-free interest rate is based on the yield from U.S. treasury bonds with an equivalent term.
The Company doesn't use dividend yield rate since the Company has not declared or paid any dividends on its common stock and does not expect to pay any dividends in the foreseeable future.
The fair value for options granted to employees and ESPP in the years ended December 31, 2019, 2018 and 2017, are estimated at the date of grant using a Black-Scholes-Merton option-pricing model with the following assumptions:
| Year ended December 31, | ||||||||||||
| 2019 | 2018 | 2017 | ||||||||||
|
| ||||||||||||
| Employee Stock Options | ||||||||||||
| Risk-free interest | | % | | % | | % | ||||||
| Dividend yields | | % | | % | | % | ||||||
| Volatility | | % | | % | | % | ||||||
| Expected option term in years | | | | |||||||||
| Estimated forfeiture rate | | % | | % | | % | ||||||
|
| ||||||||||||
| ESPP | ||||||||||||
| Risk-free interest | | % | | % | | % | ||||||
| Dividend yields | | % | | % | | % | ||||||
| Volatility | | % | | % | | % | ||||||
| Expected term | | | | |||||||||
The Company recognizes compensation expenses for the value of its restricted stock unit (“RSU”) awards, based on the straight-line method over the requisite service period of each of the awards, net of estimated forfeitures. The fair value of each RSU is the market value of the Company’s stock as determined by the closing price of the common stock on the day of grant.
x.Income taxes:
The Company and its subsidiaries account for income taxes in accordance with ASC 740, “Income Taxes”. ASC 740 prescribes the use of the liability method, whereby deferred tax asset and liability account balances are determined based on differences between financial reporting and tax bases of assets and liabilities and are measured using the enacted tax rates that will be in effect when the differences are expected to reverse.
Deferred income tax balances reflect the effects of temporary differences between the carrying amounts of assets and liabilities and their tax bases and are stated at enacted tax rates expected to be in effect when taxes are actually paid or recovered.
F - 28
SOLAREDGE TECHNOLOGIES, INC.
AND ITS SUBSIDIARIES
NOTES TO CONSOLIDATED FINANCIAL STATEMENTS
U.S. dollars in thousands (except share and per share data)
NOTE 2:-SIGNIFICANT ACCOUNTING POLICIES (Cont.)
Deferred tax assets are evaluated for future realization and reduced by a valuation allowance to the extent the Company believes they will not be realized.
The Company accounts for uncertain tax positions in accordance with ASC 740. ASC 740-10 contains a two-step approach to recognizing and measuring uncertain tax positions. The first step is to evaluate the tax position taken or expected to be taken in a tax return by determining if the weight of available evidence indicates that it is more likely than not that, on an evaluation of the technical merits, the tax position will be sustained on audit, including resolution of any related appeals or litigation processes. The second step is to measure the tax benefit as the largest amount that is more than 50% (cumulative probability) likely to be realized upon ultimate settlement.
y.Comprehensive income:
The Company reports comprehensive income in accordance with ASC 220 (“Comprehensive Income”). ASC 220 establishes standards for the reporting and presentation of comprehensive income and its components in a full set of general purpose financial statements.
Total comprehensive income and the components of accumulated other comprehensive income are presented in the consolidated statements of stockholders’ equity. Accumulated other comprehensive income consists of foreign currency translation effects, unrealized gains and losses on available-for-sale marketable securities and hedging contracts.
z.New accounting pronouncements not yet effective:
In June 2016, the FASB issued ASU 2016-13, Financial Instruments - Credit Losses (Topic 326): Measurement of Credit Losses on Financial Instruments. ASU 2016-13 amends the impairment model to utilize an expected loss methodology in place of the currently used incurred loss methodology, which will result in the more timely recognition of losses. The new accounting standard will be effective for the fiscal year beginning on January 1, 2020, including interim periods within that year. The Company does not expect that adoption of this standard will have a material impact on its consolidated financial statements.
F - 29
SOLAREDGE TECHNOLOGIES, INC.
AND ITS SUBSIDIARIES
NOTES TO CONSOLIDATED FINANCIAL STATEMENTS
U.S. dollars in thousands (except share and per share data)
NOTE 2:-SIGNIFICANT ACCOUNTING POLICIES (Cont.)
aa.Recently issued and adopted pronouncements:
In February 2016, the Financial Accounting Standards Board (FASB) issued Accounting Standards Update No. 2016-02 (Topic 842) "Leases". Topic 842 supersedes the lease requirements in Accounting Standards Codification (ASC) Topic 840, "Leases". Under Topic 842, lessees are required to recognize assets and liabilities on the balance sheet for most leases and provide enhanced disclosures. ASU No. 2016-02 is effective for interim and annual reporting periods beginning after December 15, 2018. In July 2018, the FASB issued amendments in ASU 2018-11, which provide a transition election to not restate comparative periods for the effects of applying the new standard. This transition election permits entities to change the date of initial application to the beginning of the earliest comparative period presented, or retrospectively at the beginning of the period of adoption through a cumulative-effect adjustment. The Company has elected to apply the standard retrospectively at the beginning of the period of adoption through a cumulative-effect adjustment. The new lease standard provides a number of optional practical expedients in transition. The Company elected the transition practical expedients, which permits the Company not to reassess its prior conclusions regarding lease identification, lease classification and initial direct costs under the new standard and the use of hindsight in determining the lease term. The Company also elected the short-term lease recognition exemption for all leases with a term shorter than 12 months. The Company adopted Topic 842 effective January 1, 2019. The Consolidated Financial Statements for the year ended December 31, 2019 are presented under the new standard, while comparative periods presented are not adjusted and continue to be reported under ASC 840 (See Note 15).
On October 1, 2019, the Company early adopted Accounting Standards Update No. 2017-04, Intangibles-Goodwill and Other (Topic 350): Simplifying the Test for Goodwill Impairment (ASU 2017-04) using the prospective approach, which eliminates step two from the goodwill impairment test. Under ASU 2017-04, an entity should recognize an impairment charge for the amount by which the carrying amount of a reporting unit exceeds its fair value up to the amount of goodwill allocated to that reporting unit. This guidance was effective beginning January 1, 2020, with early adoption permitted. The adoption of this new standard did not have a material impact on the Company's consolidated financial statements.
ab.Certain prior period amounts have been reclassified to conform to the current period presentation.
NOTE 3:-BUSINESS COMBINATION
On January 24, 2019, the Company completed the acquisition of
As of January 24, 2019, the fair value of the
F - 30
SOLAREDGE TECHNOLOGIES, INC.
AND ITS SUBSIDIARIES
NOTES TO CONSOLIDATED FINANCIAL STATEMENTS
U.S. dollars in thousands (except share and per share data)
NOTE 3:-BUSINESS COMBINATION (Cont.)
The primary reason for the SMRE Acquisition was to acquire technology and customer relationships and to expand and diversify the Company’s business by entering into the e-Mobility market. The SMRE Acquisition was accounted for as a business combination in accordance with ASC 805 "Business Combinations”.
During the period from the SMRE Acquisition through December 31, 2019, the Company purchased additional common shares of SMRE in the open market and through a tender offer in a total amount of $
The following table summarizes the purchase price allocation of SMRE Acquisition:
| Components of Purchase Price: | ||||
|
| ||||
| Cash | $ | | ||
| Less cash acquired | ( | ) | ||
| Common shares | | |||
| Total purchase price | | |||
|
| ||||
| Allocation of Purchase Price: | ||||
|
| ||||
| Net tangible assets (liabilities): | ||||
| Trade receivables, net | | |||
| Prepaid expenses and other current assets | | |||
| Inventories, net | | |||
| Property, plant and equipment, net | | |||
| Other non-current assets | | |||
| Trade payables | ( | ) | ||
| Loans | ( | ) | ||
| Accrued expenses and other current liabilities | ( | ) | ||
| Other non-current liabilities | ( | ) | ||
| Total net tangible assets | | |||
|
| ||||
| Identifiable intangible assets (1): | ||||
| Technology | | |||
| Customer relationships | | |||
| Backlog | | |||
| Tradename | | |||
| Deferred tax liabilities | ( | ) | ||
| Total identifiable intangible assets acquired | | |||
|
| ||||
| Goodwill (2) | | |||
|
| ||||
| Non-controlling interests | ( | ) | ||
|
| ||||
| Total purchase price allocation | $ | |
F - 31
SOLAREDGE TECHNOLOGIES, INC.
AND ITS SUBSIDIARIES
NOTES TO CONSOLIDATED FINANCIAL STATEMENTS
U.S. dollars in thousands (except share and per share data)
NOTE 3:-BUSINESS COMBINATION (Cont.)
(1)
(2)
The amounts of revenue and net loss of SMRE included in the Company’s consolidated statements of income for the period from January 24, 2019 to December 31, 2019 are $
The Company recognized $
The following table represents the pro-forma (unaudited) consolidated revenues and net income of the Company as if SMRE Acquisition had occurred as of the beginning of 2018:
| Year ended December 31, | ||||||||
| 2019 | 2018 | |||||||
|
| Unaudited | |||||||
| Revenue | $ | | $ | | ||||
| Net income | $ | | $ | | ||||
These amounts have been calculated after applying the Company’s accounting policies and adjusting the results of SMRE to reflect the additional depreciation and amortization that would have been charged assuming the fair value adjustments to tangible and intangible assets had been applied since the acquisition date, together with the consequential tax effects.
These pro-forma results (unaudited) are based on estimates and assumptions, which the Company believe are reasonable. They are not the results that would have been realized had the acquisitions actually occurred on January 1, 2018 and 2019 and are not necessarily indicative of the Company consolidated statements of income in future periods. The pro-forma results (unaudited) include adjustments related to purchase accounting, primarily amortization of intangible assets.
As of December 31, 2019, the purchase price allocation for all acquisitions was finalized.
F - 32
SOLAREDGE TECHNOLOGIES, INC.
AND ITS SUBSIDIARIES
NOTES TO CONSOLIDATED FINANCIAL STATEMENTS
U.S. dollars in thousands (except share and per share data)
NOTE 4:-MARKETABLE SECURITIES
The following is a summary of available-for-sale marketable securities at December 31, 2019:
| Amortized cost | Gross unrealized gains | Gross unrealized losses | Fair value | |||||||||||||
|
| ||||||||||||||||
| Available-for-sale – matures within one year: | ||||||||||||||||
| Corporate bonds | $ | | $ | | $ | ( | ) | $ | | |||||||
|
| ||||||||||||||||
| Available for-sale – matures after one year: | ||||||||||||||||
| Corporate bonds | | | ( | ) | | |||||||||||
| Governmental bonds | | | | | ||||||||||||
|
| | | ( | ) | | |||||||||||
|
| ||||||||||||||||
| Total | $ | | $ | | $ | ( | ) | $ | | |||||||
The following is a summary of available-for-sale marketable securities at December 31, 2018:
| Amortized cost | Gross unrealized gains | Gross unrealized losses | Fair value | |||||||||||||
|
| ||||||||||||||||
| Available-for-sale – matures within one year: | ||||||||||||||||
| Corporate bonds | $ | | $ | | $ | ( | ) | $ | | |||||||
| Governmental bonds | | | ( | ) | | |||||||||||
| | | ( | ) | | ||||||||||||
|
| ||||||||||||||||
| Available for-sale – matures after one year: | ||||||||||||||||
| Corporate bonds | | | ( | ) | | |||||||||||
|
| ||||||||||||||||
| Total | $ | | $ | | $ | ( | ) | $ | | |||||||
F - 33
SOLAREDGE TECHNOLOGIES, INC.
AND ITS SUBSIDIARIES
NOTES TO CONSOLIDATED FINANCIAL STATEMENTS
U.S. dollars in thousands (except share and per share data)
NOTE 4:-MARKETABLE SECURITIES (Cont.)
As of December 31, 2019, 2018 and 2017, the unrealized losses are not other than temporary and therefore such unrealized losses were recorded in accumulated other comprehensive loss.
Proceeds from maturity of available-for-sale marketable securities during the years ended December 31, 2019, 2018 and 2017, were $120,834, $84,497 and $
NOTE 5:-FAIR VALUE MEASUREMENTS
In accordance with ASC 820, the Company measures its cash equivalents and marketable securities, at fair value using the market approach valuation technique. Cash equivalents and marketable securities are classified within Level 1 and Level 2, respectively, because these assets are valued using quoted market prices or alternative pricing sources and models utilizing market observable inputs.
The following table sets forth the Company’s assets that were measured at fair value as of December 31, 2019, 2018 and 2017 by level within the fair value hierarchy:
| Fair Value | Fair value measurements as of December 31, | |||||||||||||
| Description | Hierarchy | 2019 | 2018 | 2017 | ||||||||||
|
| ||||||||||||||
| Measured at fair value on a recurring basis: | ||||||||||||||
|
| ||||||||||||||
| Assets: | ||||||||||||||
| Cash equivalents: | ||||||||||||||
| Money market mutual funds | Level 1 | $ | | $ | | $ | | |||||||
|
| ||||||||||||||
| Short-term marketable securities: | ||||||||||||||
| Corporate bonds | Level 2 | $ | | $ | | $ | | |||||||
| Governmental bonds | Level 2 | $ | | $ | | $ | | |||||||
| Long-term marketable securities: | ||||||||||||||
| Corporate bonds | Level 2 | $ | | $ | | $ | | |||||||
| Governmental bonds | Level 2 | $ | | $ | | $ | | |||||||
|
| ||||||||||||||
| Liabilities | ||||||||||||||
| Long-term earn-out provision | Level 3 | $ | | $ | ( | ) | $ | | ||||||
| Derivative instruments liability | Level 2 | $ | | $ | | $ | ( | ) |
F - 34
SOLAREDGE TECHNOLOGIES, INC.
AND ITS SUBSIDIARIES
NOTES TO CONSOLIDATED FINANCIAL STATEMENTS
U.S. dollars in thousands (except share and per share data)
NOTE 6:-PREPAID EXPENSES AND OTHER CURRENT ASSETS
| As of December 31, | ||||||||
| 2019 | 2018 | |||||||
|
| ||||||||
| Vendor non-trade receivables (*) | $ | | $ | | ||||
| Government authorities | | | ||||||
| Prepaid expenses and other | | | ||||||
|
| ||||||||
| $ | | $ | | |||||
(*)
NOTE 7:-INVENTORIES
| As of December 31, | ||||||||
| 2019 | 2018 | |||||||
|
| ||||||||
| Raw materials | $ | | $ | | ||||
| Work in process | | | ||||||
| Finished goods | | | ||||||
|
| ||||||||
| $ | | $ | | |||||
The Company recorded inventory write-downs of $
F - 35
SOLAREDGE TECHNOLOGIES, INC.
AND ITS SUBSIDIARIES
NOTES TO CONSOLIDATED FINANCIAL STATEMENTS
U.S. dollars in thousands (except share and per share data)
NOTE 8:-PROPERTY, PLANT AND EQUIPMENT, NET
| As of December 31, | ||||||||
| 2019 | 2018 | |||||||
|
| ||||||||
| Cost: | ||||||||
| Land | $ | | $ | | ||||
| Buildings and plants | | | ||||||
| Computers and peripheral equipment | | | ||||||
| Office furniture and equipment | | | ||||||
| Laboratory and testing equipment | | | ||||||
| Machinery and equipment | | | ||||||
| Leasehold improvements | | | ||||||
|
| ||||||||
| Gross property, plant and equipment | | | ||||||
|
| ||||||||
| Less - accumulated depreciation | | | ||||||
|
| ||||||||
| Total property, plant and equipment, net | $ | | $ | | ||||
Property, plant and equipment in progress under construction and development with a cost basis of $
Depreciation expenses for the years ended December 31, 2019, 2018 and 2017, were $
NOTE 9:-INTANGIBLE ASSETS AND GOODWILL
a.Intangible assets:
Acquired intangible assets consisted of the following as of December 31, 2019, and 2018:
| As of December 31, | ||||||||
| 2019 | 2018 | |||||||
|
| ||||||||
| Intangible assets with finite lives: | ||||||||
|
| ||||||||
| Current Technology | $ | | $ | | ||||
| Customer relationships | | | ||||||
| Trade names | | | ||||||
| Patents | | | ||||||
| Backlog | | | ||||||
|
| ||||||||
| Gross intangible assets | | | ||||||
|
| ||||||||
| Less - accumulated amortization | ( | ) | ( | ) | ||||
|
| ||||||||
| Total intangible assets, net | $ | | $ | | ||||
Amortization expenses for the years ended December 31, 2019, 2018 and 2017, were $9,634, $
F - 36
SOLAREDGE TECHNOLOGIES, INC.
AND ITS SUBSIDIARIES
NOTES TO CONSOLIDATED FINANCIAL STATEMENTS
U.S. dollars in thousands (except share and per share data)
NOTE 9:-INTANGIBLE ASSETS AND GOODWILL (Cont.)
Expected future amortization expenses of intangible assets as of December 31, 2019 are as follows:
| 2020 | $ | | ||
| 2021 | | |||
| 2022 | | |||
| 2023 | | |||
| 2024 | | |||
| 2025 and thereafter | | |||
|
| ||||
| $ | |
b.Goodwill:
The following summarizes the goodwill activity for the year ended December 31, 2019, and 2018:
| Solar | All other | Total | ||||||||||
|
| ||||||||||||
| Goodwill at January 1, 2018 | $ | | $ | | $ | | ||||||
| Business combinations | | | | |||||||||
| Foreign currency translation | | | | |||||||||
| Goodwill at December 31, 2018 | | | | |||||||||
|
| ||||||||||||
| Business combination | | | | |||||||||
| Other changes related to measurement period and disposals | | ( | ) | (354 | ) | |||||||
| Foreign currency translation | ( | ) | ( | ) | ( | ) | ||||||
| Goodwill at December 31, 2019 | $ | | $ | | $ | | ||||||
NOTE 10:-ACCRUED EXPENSES AND OTHER CURRENT LIABILITIES
| As of December 31, | ||||||||
| 2019 | 2018 | |||||||
|
| ||||||||
| Accrued expenses | $ | | $ | | ||||
| Government authorities | | | ||||||
| Operating lease liabilities | | | ||||||
| Other | | | ||||||
|
| ||||||||
| $ | | $ | | |||||
F - 37
SOLAREDGE TECHNOLOGIES, INC.
AND ITS SUBSIDIARIES
NOTES TO CONSOLIDATED FINANCIAL STATEMENTS
U.S. dollars in thousands (except share and per share data)
NOTE 11:-BANK LOANS
The following table summarizes the Company’s bank loans:
| As of December 31, 2019 | Effective interest rate | |||||||||
|
| ||||||||||
| Maturities calendar year: | ||||||||||
| Current maturities of bank loans | $ | 15,653 | | |||||||
| Long-term bank loans |
| |
| | ||||||
| | ||||||||||
|
| ||||||||||
| Accrued interest of bank loans | | |||||||||
|
| ||||||||||
| $ | | |||||||||
All bank loans are denominated in KRW except for two loans, which are denominated in USD and in EUR in the amount of $
During the years ended December 31, 2019 and 2018, the Company recognized $
As of December 31, 2019, the Company secured certain bank loans with an aggregate principal amount of $
NOTE 12:-WARRANTY OBLIGATIONS
Changes in the Company’s product warranty obligations for the years ended December 31, 2019 and 2018, were as follows:
| December 31, | ||||||||
| 2019 | 2018 | |||||||
|
| ||||||||
| Balance, at the beginning of the year | $ | | $ | | ||||
| Additions and adjustments to cost of revenues | | | ||||||
| Usage and current warranty expenses | ( | ) | ( | ) | ||||
|
| ||||||||
| Balance, at the end of the year | | | ||||||
| Less current portion | ( | ) | ( | ) | ||||
|
| ||||||||
| Long term portion | $ | | $ | | ||||
F - 38
SOLAREDGE TECHNOLOGIES, INC.
AND ITS SUBSIDIARIES
NOTES TO CONSOLIDATED FINANCIAL STATEMENTS
U.S. dollars in thousands (except share and per share data)
NOTE 13:-OTHER LONG TERM LIABILITIES
| As of December 31, | ||||||||
| 2019 | 2018 | |||||||
| Tax liabilities | $ | | $ | | ||||
| Accrued severance pay, net | | | ||||||
| Other | | | ||||||
|
| ||||||||
| $ | | $ | | |||||
NOTE 14:-ACCUMULATED OTHER COMPREHENSIVE LOSS
The following table summarizes the changes in accumulated balances of other comprehensive loss, net of taxes, for the year ended December 31, 2019:
| Unrealized gains (losses) on available-for-sale marketable securities | Unrealized gains on cash flow hedges | Unrealized gains (losses) on foreign currency translation | Total | |||||||||||||
|
| ||||||||||||||||
| Beginning balance | $ | ( | ) | $ | | $ | | $ | ( | ) | ||||||
| Other comprehensive income (loss) before reclassifications | | | ( | ) | ( | ) | ||||||||||
| Loses reclassified from accumulated other comprehensive income | | | | | ||||||||||||
| Net current period other comprehensive income (loss) | | | ( | ) | ( | ) | ||||||||||
|
| ||||||||||||||||
| Ending balance | $ | | $ | | $ | ( | ) | $ | ( | ) | ||||||
F - 39
SOLAREDGE TECHNOLOGIES, INC.
AND ITS SUBSIDIARIES
NOTES TO CONSOLIDATED FINANCIAL STATEMENTS
U.S. dollars in thousands (except share and per share data)
NOTE 14:-ACCUMULATED OTHER COMPREHENSIVE LOSS (Cont.)
The following table summarizes the changes in accumulated balances of other comprehensive loss, net of taxes, for the year ended December 31, 2018:
| Unrealized losses on available-for-sale marketable securities | Unrealized gains on cash flow hedges | Unrealized gains (losses) on foreign currency translation | Total | |||||||||||||
|
| ||||||||||||||||
| Beginning balance | $ | ( | ) | $ | | $ | ( | ) | $ | ( | ) | |||||
| Other comprehensive income (loss) before reclassifications | ( | ) | | | ( | ) | ||||||||||
| Loses (gains) reclassified from accumulated other comprehensive income | | ( | ) | | | |||||||||||
| Net current period other comprehensive income (loss) | ( | ) | | | | |||||||||||
|
| ||||||||||||||||
| Ending balance | $ | ( | ) | $ | | $ | | $ | ( | ) | ||||||
The following table summarizes the changes in accumulated balances of other comprehensive, net of taxes, for the year ended December 31, 2017:
| Unrealized losses on available-for-sale marketable securities | Unrealized gains on cash flow hedges | Unrealized losses on foreign currency translation | Total | |||||||||||||
|
| ||||||||||||||||
| Beginning balance | $ | ( | ) | $ | | $ | ( | ) | $ | ( | ) | |||||
| Other comprehensive income (loss) before reclassifications | ( | ) | | | | |||||||||||
| Gains reclassified from accumulated other comprehensive income | | ( | ) | | ( | ) | ||||||||||
| Net current period other comprehensive income (loss) | ( | ) | ( | ) | | ( | ) | |||||||||
|
| ||||||||||||||||
| Ending balance | $ | ( | ) | $ | | $ | ( | ) | $ | ( | ) | |||||
F - 40
SOLAREDGE TECHNOLOGIES, INC.
AND ITS SUBSIDIARIES
NOTES TO CONSOLIDATED FINANCIAL STATEMENTS
U.S. dollars in thousands (except share and per share data)
NOTE 15:-LEASES
The Company leases offices, plants and vehicles under operating and finance leases. For leases with terms greater than 12 months, the Company records the related asset and liability at the present value of lease payments according to their term. Several of the Company’s leases include renewal options and some have termination options that are factored into the Company’s determination of the lease payments when appropriate. The Company estimates the incremental borrowing rate in order to discount the lease payments based on the information available at the lease commencement date.
The following table presents certain information related to the operating and finance leases:
| Year ended December 31, 2019 | ||||
| Finance leases: | ||||
| Finance lease cost | $ | | ||
| Weighted average remaining lease term in years | | |||
| Weighted average annual discount rate | | % | ||
| Operating leases: | ||||
| Operating lease cost | $ | | ||
| Weighted average remaining lease term in years | | |||
| Weighted average annual discount rate | | % | ||
The following table presents supplemental cash flows information related to the lease costs for operating and finance leases:
| Year ended December 31, 2019 | ||||
| Cash paid for amounts included in measurement of lease liabilities: | ||||
| Operating cash flows for operating and finance leases | $ | | ||
| Financing cash flows for finance leases | $ | | ||
F - 41
SOLAREDGE TECHNOLOGIES, INC.
AND ITS SUBSIDIARIES
NOTES TO CONSOLIDATED FINANCIAL STATEMENTS
U.S. dollars in thousands (except share and per share data)
NOTE 15:-LEASES (Cont.)
The following table reconciles the undiscounted cash flows for each of the first five years and the total of the remaining years of the operating and finance lease liabilities recorded on the consolidated balance sheets:
| Operating Lease | Finance Leases | |||||||
|
| ||||||||
| 2020 | $ | | $ | | ||||
| 2021 | | | ||||||
| 2022 | | | ||||||
| 2023 | | | ||||||
| 2024 | | | ||||||
| Thereafter |
| |
| | ||||
| Total lease payments | | | ||||||
|
| ||||||||
| Less amount of lease payments representing interest |
| ( | ) |
| ( | ) | ||
|
| ||||||||
| Present value of future lease payments | | | ||||||
|
| ||||||||
| Less current lease liabilities |
| ( | ) |
| ( | ) | ||
|
| ||||||||
| Long-term lease liabilities | $ | | $ | | ||||
NOTE 16:-COMMITMENTS AND CONTINGENT LIABILITIES
a.Guarantees:
As of December 31, 2019, contingent liabilities exist regarding guarantees in the amounts of $
b.Contractual purchase obligations:
The Company has contractual obligations to purchase goods and raw materials. These contractual purchase obligations relate to inventories held by contract manufacturers and purchase orders initiated by the contract manufacturers, which cannot be canceled without penalty. The Company utilizes third parties to manufacture its products.
In addition, the Company acquires raw materials or other goods and services, including product components, by issuing authorizations to its suppliers to purchase materials based on its projected demand and manufacturing needs. As of December 31, 2019, the Company had non-cancelable purchase obligations totaling approximately $
F - 42
SOLAREDGE TECHNOLOGIES, INC.
AND ITS SUBSIDIARIES
NOTES TO CONSOLIDATED FINANCIAL STATEMENTS
U.S. dollars in thousands (except share and per share data)
NOTE 16:-COMMITMENTS AND CONTINGENT LIABILITIES (Cont.)
As of December 31, 2019, the Company had contractual obligations for capital expenditures totaling approximately $
c.Legal claims:
From time to time, the Company may be involved in various claims and legal proceedings. The Company reviews the status of each matter and assesses its potential financial exposure. If the potential loss from any claim or legal proceeding is considered probable and the amount can be reasonably estimated, the Company accrues a liability for the estimated loss. These accruals are reviewed at least quarterly and adjusted to reflect the impact of negotiations, settlements, rulings, advice of legal counsel and other information and events pertaining to a particular matter.
In September, 2018, the Company’s German subsidiary, SolarEdge Technologies GmbH received a complaint filed by competitor SMA Solar Technology AG (“SMA”). The complaint, filed in the District Court Düsseldorf, Germany, alleges that SolarEdge's 12.5kW - 27.6kW inverters infringe two of plaintiff’s patents. In its complaint, SMA requests inter alia an injunction and a determination for a claim for damages for sales in Germany. Plaintiff also asserts a value in dispute of
In May 2019, the Company was served with three lawsuits by Huawei Technologies Co., Ltd., a Chinese entity (“Huawei”), against the Company's two Chinese subsidiaries and its equipment manufacturer in China. The lawsuits, filed in the Guangzhou intellectual property court, allege infringement of three patents and ask for an injunction of manufacture, use, sale and offer for sale, and damage awards of
F - 43
SOLAREDGE TECHNOLOGIES, INC.
AND ITS SUBSIDIARIES
NOTES TO CONSOLIDATED FINANCIAL STATEMENTS
U.S. dollars in thousands (except share and per share data)
NOTE 16:-COMMITMENTS AND CONTINGENT LIABILITIES (Cont.)
In August 2019, the Company was served with a lawsuit by certain former shareholders of SMRE, against its Italian subsidiary that purchased the shares of SMRE in the tender offer which followed the SMRE Acquisition. The shareholders who tendered their shares are asking for the difference between
In December 2019, the Company received a lawsuit filed by a former consultant of the Company and its Israeli subsidiary in the amount of
NOTE 17:-STOCK CAPITAL
a.Composition of common stock capital of the Company:
| Number of shares | ||||||||||||||||||||||||
| Authorized as of December 31, | Issued as of December 31, | Outstanding as of December 31, | ||||||||||||||||||||||
| 2019 | 2018 | 2019 | 2018 | 2019 | 2018 | |||||||||||||||||||
|
| ||||||||||||||||||||||||
| Stock of $ | ||||||||||||||||||||||||
| Common stock | | | | | | | ||||||||||||||||||
b.Common stock rights:
Common stock confers upon its holders the right to receive notice of, and to participate in, all general meetings of the Company, where each share of common stock shall have vote for all purposes; to share equally, on a per share basis, in bonuses, profits, or distributions out of fund legally available therefor; and to participate in the distribution of the surplus assets of the Company in the event of liquidation of the Company.
c.Stock option plans:
The Company’s 2007 Global Incentive Plan (the “2007 Plan”) was adopted by the board of directors on August 30, 2007. The 2007 Plan terminated upon the Company’s IPO on March 31, 2015 and no further awards may be granted thereunder. All outstanding awards will continue to be governed by their existing terms and
F - 44
SOLAREDGE TECHNOLOGIES, INC.
AND ITS SUBSIDIARIES
NOTES TO CONSOLIDATED FINANCIAL STATEMENTS
U.S. dollars in thousands (except share and per share data)
NOTE 17:-STOCK CAPITAL (Cont.)
The Share Reserve will automatically increase on January 1st of each year during the term of the 2015 Plan, commencing on January 1st of the year following the year in which the 2015 Plan becomes effective, in an amount equal to
The aggregate maximum number of shares of common stock that may be issued on the exercise of incentive stock options is
A summary of the activity in the stock options granted to employees and members of the board of directors for the year ended December 31, 2019 and related information are as follows:
| Weighted | ||||||||||||||||
| average | ||||||||||||||||
| Weighted | remaining | |||||||||||||||
| Number | average | contractual | Aggregate | |||||||||||||
| of | exercise | term | intrinsic | |||||||||||||
| options | price | in years | Value | |||||||||||||
|
| ||||||||||||||||
| Outstanding as of December 31, 2018 | | | | | ||||||||||||
| Granted | | | ||||||||||||||
| Exercised | ( | ) | | |||||||||||||
| Forfeited or expired | ( | ) | | |||||||||||||
| Outstanding as of December 31, 2019 | | | | | ||||||||||||
|
| ||||||||||||||||
| Vested and expected to vest as of December 31, 2019 | | | | | ||||||||||||
|
| ||||||||||||||||
| Exercisable as of December 31, 2019 | | | | | ||||||||||||
The aggregate intrinsic value in the tables above represents the total intrinsic value (the difference between the fair value of the Company’s common stock as of the last day of each period and the exercise price, multiplied by the number of in-the-money options) that would have been received by the option holders had all option holders exercised their options on the last day of each period.
The total intrinsic value of options exercised during the years ended December 31, 2019, 2018 and 2017 was $
The weighted average grant date fair value of options granted to employees and directors during the years ended December 31, 2019, 2018, and 2017, was $
F - 45
SOLAREDGE TECHNOLOGIES, INC.
AND ITS SUBSIDIARIES
NOTES TO CONSOLIDATED FINANCIAL STATEMENTS
U.S. dollars in thousands (except share and per share data)
NOTE 17:-STOCK CAPITAL (Cont.)
A summary of the activity in the RSUs granted to employees and directors for the year ended December 31, 2019, is as follows:
| Number of RSUs | Weighted average grant date fair value | |||||||
| Unvested as of January 1, 2019 | | | ||||||
| Granted | | | ||||||
| Vested | ( | ) | | |||||
| Forfeited | ( | ) | | |||||
| Unvested as of December 31, 2019 | | | ||||||
The weighted-average grant-date fair value of RSUs granted during the years ended December 31, 2019, 2018 and 2017, was $
d.Employee Stock Purchase Plan:
The Company adopted an ESPP effective upon the consummation of the IPO. As of December 31, 2019, total of
However, the Company’s board of directors may reduce the amount of the increase in any particular year at their discretion, including a reduction to zero.
The ESPP is implemented through an offering every six months. According to the ESPP, eligible employees may use up to
As of December 31, 2019,
As of December 31, 2019,
In accordance with ASC No. 718, the ESPP is compensatory and, as such, results in recognition of compensation cost.
F - 46
SOLAREDGE TECHNOLOGIES, INC.
AND ITS SUBSIDIARIES
NOTES TO CONSOLIDATED FINANCIAL STATEMENTS
U.S. dollars in thousands (except share and per share data)
NOTE 17:-STOCK CAPITAL (Cont.)
e.Stock-based compensation expenses for employees and non-employees:
The Company recognized stock-based compensation expenses related to stock options and RSUs granted to employees and nonemployees and ESPP in the consolidated statement of income for the years ended December 31, 2019, 2018 and 2017, as follows:
| Year ended December 31, | ||||||||||||
| 2019 | 2018 | 2017 | ||||||||||
|
| ||||||||||||
| Cost of revenues | $ | | $ | | $ | | ||||||
| Research and development | | | | |||||||||
| Selling and marketing | | | | |||||||||
| General and administrative | | | | |||||||||
| Other operating expenses | | | | |||||||||
|
| ||||||||||||
| Total stock-based compensation expenses | $ | | $ | | $ | | ||||||
As of December 31, 2019, there were total unrecognized compensation expenses in the amount of $
NOTE 18:-EARNINGS PER SHARE
Basic net Earnings Per Share (“EPS”) is computed by dividing the net earnings attributable to SolarEdge Technologies, Inc. by the weighted-average number of shares of common stock outstanding during the period.
Diluted net EPS is computed by giving effect to all potential shares of common stock, including stock options, to the extent dilutive, all in accordance with ASC No. 260, “Earnings Per Share.”
No shares were excluded from the calculation for the year ended December 31, 2018.
The total weighted average number of shares related to the outstanding stock options, excluded from the calculation of diluted net EPS due to their anti-dilutive effect was
F - 47
SOLAREDGE TECHNOLOGIES, INC.
AND ITS SUBSIDIARIES
NOTES TO CONSOLIDATED FINANCIAL STATEMENTS
U.S. dollars in thousands (except share and per share data)
NOTE 18:-EARNINGS PER SHARE (Cont.)
The following table presents the computation of basic and diluted EPS attributable to SolarEdge Technologies, Inc.:
| Year ended December 31, | ||||||||||||
| 2019 | 2018 | 2017 | ||||||||||
|
| ||||||||||||
| Basic EPS: | ||||||||||||
| Numerator: | ||||||||||||
| Net income | $ | | $ | | $ | | ||||||
| Net loss attributable to Non-controlling interests | | | | |||||||||
| Net income attributable to SolarEdge Technologies, Inc. | $ | | $ | | $ | | ||||||
|
| ||||||||||||
| Denominator: | ||||||||||||
| Shares used in computing net earnings per share of common stock, basic | | | | |||||||||
|
| ||||||||||||
| Diluted EPS: | ||||||||||||
| Numerator: | ||||||||||||
| Net income | $ | | $ | | $ | | ||||||
| Net loss attributable to Non-controlling interests | | 787 | | |||||||||
| Undistributed earnings reallocated to non-vested stockholders | ( | ) | | | ||||||||
| Net income attributable to SolarEdge Technologies, Inc. | $ | | $ | | $ | | ||||||
|
| ||||||||||||
| Denominator: | ||||||||||||
| Shares used in computing net earnings per share of common stock, basic | | | | |||||||||
| Weighted average effect of dilutive securities: | ||||||||||||
| Non-vested PSUs | ( | ) | | | ||||||||
| Effect of stock-based awards | | | | |||||||||
| Shares used in computing net earnings per share of common stock, diluted | | | | |||||||||
F - 48
SOLAREDGE TECHNOLOGIES, INC.
AND ITS SUBSIDIARIES
NOTES TO CONSOLIDATED FINANCIAL STATEMENTS
U.S. dollars in thousands (except share and per share data)
NOTE 19:-OTHER OPERATING EXPENSES
| Year ended December 31, 2019 | ||||
| Compensation package related to the passing of the former Founder, CEO and Chairman (1) | $ | | ||
| Termination of SMRE’s former executive (2) | | |||
| Sale of SMRE’s subsidiary (3) | | |||
| A settlement of pre-acquisition legal claim against Kokam (4) | | |||
| Total other operating expenses | $ | | ||
(1)
(2)
(3)
(4)
F - 49
SOLAREDGE TECHNOLOGIES, INC.
AND ITS SUBSIDIARIES
NOTES TO CONSOLIDATED FINANCIAL STATEMENTS
U.S. dollars in thousands (except share and per share data)
NOTE 20:-INCOME TAXES
a. Tax rates in U.S:
The Company is subject to U.S. federal tax at the rate of
On December 22, 2017, the Tax Cuts and Jobs Act (the "Tax Act") was signed into law making significant changes to U.S. income tax law. These changes include, but are not limited to, a corporate tax rate decrease from 35% to 21% effective for tax years 2018 onwards and created new taxes on certain foreign-sourced earnings and certain related-party payments.
Due to the timing of the enactment and the complexity involved in applying the provisions of the Tax Act, the Company made reasonable estimates of the effects and recorded provisional amounts in our consolidated financial statements as of December 31, 2017. As the Company collected and prepared necessary data, and interpreted the additional guidance issued by the U.S. Treasury Department, the IRS, and other standard-setting bodies, it made adjustments, over the course of 2018, to the provisional amounts including refinements to deferred taxes. The accounting for the tax effects of the Tax Act was completed as of December 31, 2018.
Transition tax:
The Tax Act required the Company to pay U.S. income taxes on accumulated foreign subsidiaries earnings not previously subject to U.S. income tax at a rate of
b.Kokam is subject to Korean tax on progressive tax rates of up to
SMRE is subject to Italian corporate tax rate of
c.Corporate tax in Israel:
Taxable income of Israeli companies is subject to corporate tax at the rate of
In December 2016, the Israeli Parliament approved the Economic Efficiency Law 2016 (Legislative Amendments for Applying the Economic Policy for the 2017 and 2018 Budget Years), which reduces the corporate income tax rate to
The Israeli subsidiary is also eligible for tax benefits as further described in note 20k.
F - 50
SOLAREDGE TECHNOLOGIES, INC.
AND ITS SUBSIDIARIES
NOTES TO CONSOLIDATED FINANCIAL STATEMENTS
U.S. dollars in thousands (except share and per share data)
NOTE 20:-INCOME TAXES (Cont.)
d.Carryforward tax losses:
As of December 31, 2019, Kokam has carryforward tax losses of $
As of December 31, 2019, SMRE has carryforward tax losses of approximately $
e.Deferred taxes:
Deferred taxes reflect the net tax effect of temporary differences between the carrying amounts of assets and liabilities for financial reporting purposes and the amounts used for income tax purposes.
The Company’s Israeli subsidiary’s tax-exempt profit from Benefited Enterprises (as defined in in note 20k) is permanently reinvested, as the Company’s management and the Board of Directors has determined that the Company does not currently intend to distribute dividends. Therefore, deferred taxes have not been provided for such tax-exempt income. The Company intends to continue to reinvest these profits and does not currently foresee a need to distribute dividends out of such tax-exempt income. Therefore, no deferred taxes have been provided in respect of such tax-exempt income as the undistributed tax-exempt income is essentially permanent in duration.
The Company may incur additional tax liability in the event of intercompany dividend distributions by some of its subsidiaries. Such additional tax liability in respect of these subsidiaries has not been provided for in the Financial Statements as the Company’s management and the Board of Directors has determined that the Company intends to reinvest earnings of its subsidiaries indefinitely.
Taxes that would apply in the event of disposal of investments in subsidiaries have not been taken into account in computing deferred income taxes, as the Company’s management and the Board of Directors has determined that the Company’s intention to hold, and not to realize, these investments.
F - 51
SOLAREDGE TECHNOLOGIES, INC.
AND ITS SUBSIDIARIES
NOTES TO CONSOLIDATED FINANCIAL STATEMENTS
U.S. dollars in thousands (except share and per share data)
NOTE 20:-INCOME TAXES (Cont.)
Significant components of the Company’s deferred tax liabilities and assets are as follows:
| December 31, | ||||||||||||
| 2019 | 2018 | 2017 | ||||||||||
|
| ||||||||||||
| Deferred tax assets, net: | ||||||||||||
|
| ||||||||||||
| Research and Development carryforward expenses | $ | | $ | | $ | | ||||||
| Carryforward tax losses | | | | |||||||||
| Stock based compensation expenses | | | | |||||||||
| Deferred revenue | | | | |||||||||
| Inventory Impairment | | | | |||||||||
| Allowance and other reserves | | | | |||||||||
|
| ||||||||||||
| Total Gross deferred tax assets, net | $ | | $ | | $ | | ||||||
|
| ||||||||||||
| Less, Valuation Allowance (1) | ( | ) | | | ||||||||
|
| ||||||||||||
| Total deferred tax assets, net | $ | | $ | | $ | | ||||||
|
| ||||||||||||
| Deferred tax liabilities, net: | ||||||||||||
| Purchase price allocation | ( | ) | ( | ) | | |||||||
|
| ||||||||||||
| Total deferred tax liabilities, net | $ | ( | ) | $ | ( | ) | $ | | ||||
|
| ||||||||||||
| Recorded as: | ||||||||||||
| Deferred tax assets, net | $ | | $ | | $ | | ||||||
| Deferred tax liabilities, net | ( | ) | ( | ) | | |||||||
| Net deferred tax assets | $ | | $ | | $ | | ||||||
(1)
F - 52
SOLAREDGE TECHNOLOGIES, INC.
AND ITS SUBSIDIARIES
NOTES TO CONSOLIDATED FINANCIAL STATEMENTS
U.S. dollars in thousands (except share and per share data)
NOTE 20:-INCOME TAXES (Cont.)
f.Uncertain tax positions:
| December 31, | ||||||||||||
| 2019 | 2018 | 2017 | ||||||||||
| Balance at January 1, | $ | | $ | | $ | | ||||||
| Increases related to current year tax positions | | | | |||||||||
| Decreases related to prior year tax positions | | ( | ) | | ||||||||
| Balance at December 31, | $ | | $ | | $ | | ||||||
The total amount of gross unrecognized tax benefits was $
The Company accrues interest and penalties related to unrecognized tax benefits in its provision for income taxes. The total amount of penalties and interest were not material as of December 31, 2019, 2018 and 2017. The Company does not expect a material change in its unrecognized tax benefits within the next 12 months.
g.Income before taxes are comprised as follows:
| Year ended December 31, | ||||||||||||
| 2019 | 2018 | 2017 | ||||||||||
|
| ||||||||||||
| Domestic | $ | | $ | | $ | | ||||||
| Foreign | | | | |||||||||
|
| ||||||||||||
| $ | | $ | | $ | | |||||||
h.Income taxes (tax benefit) are comprised as follows:
| Year ended December 31, | ||||||||||||
| 2019 | 2018 | 2017 | ||||||||||
| Current taxes: | ||||||||||||
| U.S. Federal & State | $ | | $ | | $ | | ||||||
| Foreign | | | | |||||||||
| Total current taxes | | | | |||||||||
|
| ||||||||||||
| Deferred taxes: | ||||||||||||
| U.S. Federal & State | ( | ) | ( | ) | ( | ) | ||||||
| Foreign | ( | ) | ( | ) | ( | ) | ||||||
| Total deferred taxes | ( | ) | ( | ) | (5,455 | ) | ||||||
|
| ||||||||||||
| Income taxes, net | $ | | $ | | $ | | ||||||
F - 53
SOLAREDGE TECHNOLOGIES, INC.
AND ITS SUBSIDIARIES
NOTES TO CONSOLIDATED FINANCIAL STATEMENTS
U.S. dollars in thousands (except share and per share data)
NOTE 20:-INCOME TAXES (Cont.)
i.Reconciliation of theoretical tax expense to actual tax expense:
The differences between the statutory tax rate of the Company and the effective tax rate are primarily accounted for by the non-recognition of tax benefits from accumulated net carryforward tax losses among the Company and various subsidiaries due to uncertainty of the realization of such tax benefits.
A reconciliation between the theoretical tax expense, assuming all income is taxed at the statutory tax rate applicable to income of the Company, and the actual tax expense (benefit) as reported in the consolidated statements of income is as follows:
| Year ended December 31, | ||||||||||||
| 2019 | 2018 | 2017 | ||||||||||
|
| ||||||||||||
| Income before taxes, as reported in the consolidated statements of income | $ | | $ | | $ | | ||||||
|
| ||||||||||||
| Statutory tax rate | | % | | % | | % | ||||||
| Theoretical tax expenses on the above amount at the US statutory tax rate | | | | |||||||||
| Income tax at rate other than the U.S. statutory tax rate | ( | ) | ( | ) | ( | ) | ||||||
| Losses and timing differences for which valuation allowance was provided | | | | |||||||||
| Tax Cuts and Jobs Act of 2017 | ( | ) | ( | ) | | |||||||
| Non-deductible expenses | | ( | ) | ( | ) | |||||||
| Other individually immaterial income tax items, net | ( | ) | ( | ) | ( | ) | ||||||
|
| ||||||||||||
| Actual tax expense (tax benefit) | $ | | $ | | $ | | ||||||
|
| ||||||||||||
| Effective tax rate | | % | | % | | % | ||||||
j.Tax assessments:
As of December 31, 2019, the Company and certain of its subsidiaries filed U.S. federal and various state and foreign income tax returns. The statute of limitations relating to the consolidated U.S. federal income tax return is closed for all tax years up to and including 2015. Net operating losses generated in years prior to 2016 and carried forward are available to adjustment and subject to the statute of limitation provisions of such year when the net operating losses were utilized.
The statute of limitations related to tax returns of the Company’s Israeli subsidiary for all tax years up to and including 2013 has lapsed.
The statute of limitations related to tax returns of the Company’s other subsidiaries has lapsed for part of the tax years, which differs between the different subsidiaries.
F - 54
SOLAREDGE TECHNOLOGIES, INC.
AND ITS SUBSIDIARIES
NOTES TO CONSOLIDATED FINANCIAL STATEMENTS
U.S. dollars in thousands (except share and per share data)
NOTE 20:-INCOME TAXES (Cont.)
The Company believes that it has adequately provided for reasonably foreseeable outcomes related to tax audits and settlements. The final tax outcome of any Company tax audits could be different from that which is reflected in the Company’s income tax provisions and accruals. Such differences could have a material effect on the Company’s income tax provision and net income (loss) in the period in which such determination is made.
k.Tax benefits for Israeli companies under the Law for the Encouragement of Capital Investments, 1959 (the “Investments Law”):
The Israeli subsidiary elected tax year 2012 as a "Year of Election" for “Benefited Enterprise” status under the Investments Law. According to the Investments Law, the Israeli subsidiary elected to participate in the alternative benefits program which provides certain benefits, including tax exemptions and reduced tax rates (which depend on, inter alia, the geographic location in Israel). Income not eligible for Benefited Enterprise benefits is taxed at a regular corporate tax rate.
Upon meeting the requirements under the Investments Law, undistributed income derived from Benefited Enterprise from productive activity will be exempt from tax for two years from the year in which the Israeli subsidiary first has taxable income, provided that 12 years have not passed from the beginning of the year of election.
By December 31, 2016, the Israeli subsidiary utilized all of its operating loss carryforwards in Israel and became profitable for tax purposes.
On October 24, 2018, the Company’s Israeli subsidiary received an approval from the Israeli Tax Authorities confirming the applicability of the two-year tax exemption as provided in the Investments Law until December 31, 2018.
As of December 31, 2018, approximately $
If the Israeli subsidiary retained tax-exempt income is distributed, the income would be taxed at the applicable corporate tax rate which depends on the foreign ownership in each tax year, and the tax rate can range between 10% (when foreign ownership exceeds 90%) to 25% (when foreign ownership is below 49%).
The dividend recipient is subject to withholding tax at the rate of
F - 55
SOLAREDGE TECHNOLOGIES, INC.
AND ITS SUBSIDIARIES
NOTES TO CONSOLIDATED FINANCIAL STATEMENTS
U.S. dollars in thousands (except share and per share data)
NOTE 20:-INCOME TAXES (Cont.)
Through December 31, 2019, the Israeli subsidiary had generated income under the provision of the Investments Law.
Amendment to the Law for the Encouragement of Capital Investments, 1959 (Amendment 73) - In December 2016, the Economic Efficiency Law (Legislative Amendments for Applying the Economic Policy for the 2017 and 2018 Budget Years), 2016 which includes Amendment 73 to the Investments Law (the “2017 Amendment") was published. According to the 2017 Amendment, a preferred enterprise located in development area A will be subject to a tax rate of 7.5% instead of 9% effective from January 1, 2017 and thereafter (the tax rate applicable to preferred enterprises located in other areas remains at 16%). The 2017 Amendment also prescribes special tax tracks for preferred technological enterprises (“PTE”), which are subject to rules that were issued by the Ministry of Finance.
On June 14, 2017, the Encouragement of Capital Investments Regulations (Preferred Technological Income and Capital Gain for Technological Enterprise), 2017 (the “Regulations”) were published.
The Regulations applied Action 5 under the Action Plan on Base Erosion and Profit Shifting (BEPS). The Regulations describe, inter alia, the mechanism used to determine the calculation of the benefits under the PTE regime and determine certain requirements relating to documentation of intellectual property for the purpose of the PTE. According to these provisions, a company that complies with the terms under the PTE regime may be entitled to certain tax benefits with respect to income generated during the company’s regular course of business and derived from the preferred intangible asset (as determined in the Investment Law), excluding income derived from intangible assets used for marketing and income attributed to production activity. In the event that intangible assets used for marketing purposes generate over 10% of the PTE’s income, the relevant portion, calculated using a transfer pricing study, would be subject to regular corporate income tax. If such income does not exceed 10%, the PTE will not be required to exclude the marketing income from the PTE’s total income.
The Regulations establish a presumption of direct production expenses plus 10% with respect to income related to production, which can be countered by the results of a supporting transfer pricing study. Tax rates applicable to such production income expenses will be similar to the tax rates under the Preferred Enterprise regime to the extent such income would be considered as eligible. In order to calculate the preferred income, the PTE is required to take into account the income and the research and development expenses that are attributed to each single preferred intangible asset. Nevertheless, it should be noted that the transitional provisions allow companies to take into account the income and research and development expenses attributed to all of the preferred intangible assets they have.
F - 56
SOLAREDGE TECHNOLOGIES, INC.
AND ITS SUBSIDIARIES
NOTES TO CONSOLIDATED FINANCIAL STATEMENTS
U.S. dollars in thousands (except share and per share data)
NOTE 20:-INCOME TAXES (Cont.)
A PTE, which is located in the center of Israel will be subject to tax at a rate of 12% on profits deriving from intellectual property (in development area A - a tax rate of 7.5%).
The Israeli subsidiary’s PTE facilities in Israel are not located in Development Zone A. SolarEdge Technologies Ltd. is in the final stages of building its own manufacturing facilities in Israel, which is located in a Development Zone A.
The Company notified the ITA of its election to implement the PTE with effect from January 1, 2019.
A Preferred Company distributing dividends from Preferred Income or income derived from its PTE, would subject the recipient to a tax at the rate of 20% (or lower, if so provided under an applicable tax treaty). In certain circumstances, a dividend distributed to a corporate shareholder who is not an Israeli resident for tax purposes, would be subject to a tax at the rate of 4%. Such taxes would generally be withheld at source by the distributing company. To benefit from any lower tax rates under an applicable tax treaty, a non-resident of Israel would need to receive in advance a valid certificate from the ITA allowing for a reduced tax rate, or to file an appropriate tax return with the ITA claiming a refund based on the lower rate under the applicable tax treaty.
Tax Benefits for Research and Development:
Israeli tax law (section 20A to the Israeli Tax Ordinance (New Version), 1961) allows, a tax deduction for research and development expenses, including capital expenses, for the year in which they are paid. Such expenses must relate to scientific research in industry, agriculture, transportation or energy, and must be approved by the relevant Israeli government ministry, determined by the field of research. Furthermore, the research and development must be for the promotion of the company’s business and carried out by or on behalf of the company seeking such tax deduction. However, the amount of such deductible expenses is reduced by the sum of any funds received through government grants for the finance of such scientific research and development projects. As for expenses incurred in scientific research that is not approved by the relevant Israeli government ministry, they will be deductible over a three-year period starting from the tax year in which they are paid. The Company’s Israeli subsidiary intends to submit a formal request to the relevant Israeli government ministry in order to obtain such approval for 2019.
l.Tax benefits under the Law for the Encouragement of Industry (Taxes), 1969:
The Company’s Israeli subsidiary claims currently to be qualified as ‘industrial company’ as defined by this law and as such, is entitled to certain tax benefits, consisting mainly of accelerated depreciation and amortization of patents and certain other intangible property.
F - 57
SOLAREDGE TECHNOLOGIES, INC.
AND ITS SUBSIDIARIES
NOTES TO CONSOLIDATED FINANCIAL STATEMENTS
U.S. dollars in thousands (except share and per share data)
NOTE 21:-FINANCIAL EXPENSES (INCOME), NET
| Year ended December 31, | ||||||||||||
| 2019 | 2018 | 2017 | ||||||||||
|
| ||||||||||||
| Interest income on marketable securities | $ | ( | ) | $ | ( | ) | $ | ( | ) | |||
| Exchange rate loss (income), net | | | ( | ) | ||||||||
| Interest expenses | | | | |||||||||
| Bank charges | | | | |||||||||
| Amortization of marketable securities premium and accretion of discount, net | | | | |||||||||
| Other financial income, net | ( | ) | ( | ) | | |||||||
|
| ||||||||||||
| $ | | $ | | $ | ( | ) | ||||||
NOTE 22:-SEGMENT, GEOGRAPHIC, MAJOR CUSTOMER AND PRODUCT INFORMATION
a.Segment Information:
Following the acquisitions of Gamatronic, Kokam, and SMRE, the Company has changed its segments measurement, beginning in 2019. The purpose of the new measurement is to provide the Company’s chief operating decision maker (“CODM”) better information to asses’ segment performance and to make resource allocation decisions. The Company now operates in five different operating segments: Solar, UPS, energy storage, e-Mobility and machinery.
The Company's CODM is our Chief Executive Officer who makes resource allocation decisions and assesses performance based on financial information presented on a consolidated basis, accompanied by disaggregated information about revenues and contributed profit by the operating segments.
Segment profit is comprised of gross profit for the segment less operating expenses that do not include amortization, stock based compensation expenses and certain other items.
The Company manages its assets on a group basis, not by segments, as many of its assets are shared or commingled. The Company’s CODM does not regularly review asset information by segments and, therefore, the Company does not report asset information by segment.
The Company identified operating segment as reportable – the solar segment. The other operating segments are insignificant individually and in aggregate and therefore their results are presented together under “All other”.
F - 58
SOLAREDGE TECHNOLOGIES, INC.
AND ITS SUBSIDIARIES
NOTES TO CONSOLIDATED FINANCIAL STATEMENTS
U.S. dollars in thousands (except share and per share data)
NOTE 22:-SEGMENT, GEOGRAPHIC, MAJOR CUSTOMER AND PRODUCT INFORMATION (Cont.)
The solar segment includes the design, development, manufacturing, and sales of an intelligent inverter solution designed to maximize power generation at the individual PV module level. The solution consists mainly of the Company’s power optimizers, inverters and cloud‑based monitoring platform.
The All other category includes the design, development, manufacturing and sales of UPS products, energy storage products, e-Mobility products, and special machines for automatic and semi-automatic linear sewing, digital welding and digital cutting.
Information on reportable segments and reconciliation to consolidated operating income is as follows:
| As of December 31, 2019 | ||||||||
| Solar | All other | |||||||
| Revenues | $ | | $ | | ||||
| Cost of revenues | | | ||||||
| Gross profit | | | ||||||
| Research and development | | | ||||||
| Sales and marketing | | | ||||||
| General and administrative | | | ||||||
| Segments profit (loss) | $ | | $ | ( | ) | |||
| As of December 31, | ||||
| 2019 | ||||
|
| ||||
| Solar profit | $ | | ||
| All other loss | | |||
| Segments operating profit | | |||
| Expenses not allocated to segments: | ||||
| Stock based compensation expenses | | |||
| Amortization | | |||
| Sale of SMRE’s subsidiary | | |||
| Legal settlement | | |||
| Cost of products adjustments | | |||
| Other unallocated expenses | | |||
| Consolidated operating income | $ | | ||
The All other Segment results were immaterial for the year ended December 31, 2018. For the year ended December 31, 2017, the Company operated in the solar segment only.
F - 59
SOLAREDGE TECHNOLOGIES, INC.
AND ITS SUBSIDIARIES
NOTES TO CONSOLIDATED FINANCIAL STATEMENTS
U.S. dollars in thousands (except share and per share data)
NOTE 22:-SEGMENT, GEOGRAPHIC, MAJOR CUSTOMER AND PRODUCT INFORMATION (Cont.)
b.Revenues by geographic location:
| Year ended December 31, | ||||||||||||
| 2019 | 2018 | 2017 | ||||||||||
|
| ||||||||||||
| Revenues based on Customers’ location: | ||||||||||||
| United States | $ | | $ | | $ | | ||||||
| Europe (*) | | | | |||||||||
| Netherlands | | | | |||||||||
| Rest of the world | | | | |||||||||
|
| ||||||||||||
| Total revenues | $ | | $ | | $ | | ||||||
(*)
c.Revenues by product:
| Year ended December 31, | ||||||||||||
| 2019 | 2018 | 2017 | ||||||||||
|
| ||||||||||||
| Inverters | $ | | $ | | $ | | ||||||
| Optimizers | | | | |||||||||
| Others | | | | |||||||||
| Total revenues | $ | | $ | | $ | | ||||||
d.Long-lived assets by geographic location:
| As of December 31, | ||||||||
| 2019 | 2018 | |||||||
|
| ||||||||
| Israel | $ | | $ | | ||||
| Asia | | | ||||||
| Europe | | | ||||||
| Other | | | ||||||
|
| ||||||||
| Total long-lived assets (*) | $ | | $ | | ||||
(*)
F - 60
SIGNATURES
Pursuant to the requirements of Section 13 or 15(d) of the Securities Exchange Act of 1934, as amended, the registrant has duly caused this report to be signed on its behalf by the undersigned, thereunto duly authorized.
| SOLAREDGE TECHNOLOGIES, INC.
| ||
| By: | /s/Zvi Lando | |
| Name: Zvi Lando | ||
| Title: Chief Executive Officer | ||
| Date: | February 27, 2020 | |
62
POWER OF ATTORNEY
Know all persons by these presents, that each person whose signature appears below constitutes and appoints Zvi Lando, Ronen Faier, and Rachel Prishkolnik, or any of them, as such person’s true and lawful attorney-in-fact and agent, with full power of substitution and resubstitution, for such person and in such person’s name, place, and stead, in any and all capacities, to sign any and all amendments to this Annual Report on Form 10-K, and to file the same, with all exhibits thereto, and other documents in connection therewith, with the Securities and Exchange Commission, granting unto said attorney-in-fact and agent, and each of them, full power and authority to do and perform each and every act and thing requisite and necessary to be done in connection therewith, as fully to all intents and purposes as such person might or could do in person, hereby ratifying and confirming all that said attorney-in-fact and agent, or any of them or their or such person’s substitute or substitutes, may lawfully do or cause to be done by virtue thereof.
Pursuant to the requirements of the Securities Exchange Act of 1934, as amended, this report has been signed by the following persons on behalf of the registrant and in the capacities and on the dates indicated below.
| Signature | Title | Date |
|
| ||
| /s/Zvi Lando Zvi Lando
| Chief Executive Officer (Principal Executive Officer) | February 27, 2020 |
| /s/Ronen Faier Ronen Faier
| Chief Financial Officer (Principal Financial and Accounting Officer) | February 27, 2020 |
| /s/Nadav Zafrir Nadav Zafrir
| Chairman of the Board | February 27, 2020 |
| /s/Dan Avida Dan Avida
| Director | February 27, 2020 |
| /s/Yoni Cheifetz Yoni Cheifetz
| Director | February 27, 2020 |
| /s/Marcel Gani Marcel Gani
| Director | February 27, 2020 |
| /s/Doron Inbar Doron Inbar
| Director | February 27, 2020 |
| /s/Avery More Avery More
| Director | February 27, 2020 |
| /s/Tal Payne Tal Payne
| Director | February 27, 2020 |
63