0001418135FALSE2021Q3December 3100014181352021-01-012021-09-30xbrli:shares00014181352021-10-26iso4217:USD00014181352021-07-012021-09-3000014181352020-07-012020-09-3000014181352020-01-012020-09-30iso4217:USDxbrli:shares00014181352021-09-3000014181352020-12-3100014181352019-12-3100014181352020-09-300001418135us-gaap:CommonStockMember2020-12-310001418135us-gaap:AdditionalPaidInCapitalMember2020-12-310001418135us-gaap:RetainedEarningsMember2020-12-310001418135us-gaap:AccumulatedOtherComprehensiveIncomeMember2020-12-310001418135us-gaap:RetainedEarningsMember2021-01-012021-03-3100014181352021-01-012021-03-310001418135us-gaap:AccumulatedOtherComprehensiveIncomeMember2021-01-012021-03-310001418135us-gaap:CommonStockMember2021-01-012021-03-310001418135us-gaap:AdditionalPaidInCapitalMember2021-01-012021-03-310001418135us-gaap:CommonStockMember2021-03-310001418135us-gaap:AdditionalPaidInCapitalMember2021-03-310001418135us-gaap:RetainedEarningsMember2021-03-310001418135us-gaap:AccumulatedOtherComprehensiveIncomeMember2021-03-3100014181352021-03-310001418135us-gaap:RetainedEarningsMember2021-04-012021-06-3000014181352021-04-012021-06-300001418135us-gaap:AccumulatedOtherComprehensiveIncomeMember2021-04-012021-06-300001418135us-gaap:CommonStockMember2021-04-012021-06-300001418135us-gaap:AdditionalPaidInCapitalMember2021-04-012021-06-300001418135us-gaap:CommonStockMember2021-06-300001418135us-gaap:AdditionalPaidInCapitalMember2021-06-300001418135us-gaap:RetainedEarningsMember2021-06-300001418135us-gaap:AccumulatedOtherComprehensiveIncomeMember2021-06-3000014181352021-06-300001418135us-gaap:RetainedEarningsMember2021-07-012021-09-300001418135us-gaap:AccumulatedOtherComprehensiveIncomeMember2021-07-012021-09-300001418135us-gaap:CommonStockMember2021-07-012021-09-300001418135us-gaap:AdditionalPaidInCapitalMember2021-07-012021-09-300001418135us-gaap:CommonStockMember2021-09-300001418135us-gaap:AdditionalPaidInCapitalMember2021-09-300001418135us-gaap:RetainedEarningsMember2021-09-300001418135us-gaap:AccumulatedOtherComprehensiveIncomeMember2021-09-300001418135us-gaap:CommonStockMember2019-12-310001418135us-gaap:AdditionalPaidInCapitalMember2019-12-310001418135us-gaap:RetainedEarningsMember2019-12-310001418135us-gaap:AccumulatedOtherComprehensiveIncomeMember2019-12-310001418135us-gaap:RetainedEarningsMember2020-01-012020-03-3100014181352020-01-012020-03-310001418135us-gaap:AccumulatedOtherComprehensiveIncomeMember2020-01-012020-03-310001418135us-gaap:CommonStockMember2020-01-012020-03-310001418135us-gaap:AdditionalPaidInCapitalMember2020-01-012020-03-310001418135us-gaap:CommonStockMember2020-03-310001418135us-gaap:AdditionalPaidInCapitalMember2020-03-310001418135us-gaap:RetainedEarningsMember2020-03-310001418135us-gaap:AccumulatedOtherComprehensiveIncomeMember2020-03-3100014181352020-03-310001418135us-gaap:RetainedEarningsMember2020-04-012020-06-3000014181352020-04-012020-06-300001418135us-gaap:AccumulatedOtherComprehensiveIncomeMember2020-04-012020-06-300001418135us-gaap:AdditionalPaidInCapitalMember2020-04-012020-06-300001418135us-gaap:CommonStockMember2020-04-012020-06-300001418135us-gaap:CommonStockMember2020-06-300001418135us-gaap:AdditionalPaidInCapitalMember2020-06-300001418135us-gaap:RetainedEarningsMember2020-06-300001418135us-gaap:AccumulatedOtherComprehensiveIncomeMember2020-06-3000014181352020-06-300001418135us-gaap:RetainedEarningsMember2020-07-012020-09-300001418135us-gaap:AccumulatedOtherComprehensiveIncomeMember2020-07-012020-09-300001418135us-gaap:AdditionalPaidInCapitalMember2020-07-012020-09-300001418135us-gaap:ParentMember2020-07-012020-09-300001418135us-gaap:NoncontrollingInterestMember2020-07-012020-09-300001418135us-gaap:CommonStockMember2020-07-012020-09-300001418135us-gaap:CommonStockMember2020-09-300001418135us-gaap:AdditionalPaidInCapitalMember2020-09-300001418135us-gaap:RetainedEarningsMember2020-09-300001418135us-gaap:AccumulatedOtherComprehensiveIncomeMember2020-09-300001418135us-gaap:SeniorNotesMember2021-09-300001418135us-gaap:SeniorNotesMember2020-12-310001418135us-gaap:MediumTermNotesMemberus-gaap:LineOfCreditMember2021-09-300001418135us-gaap:MediumTermNotesMemberus-gaap:LineOfCreditMember2020-12-310001418135us-gaap:CommercialPaperMember2021-09-300001418135us-gaap:CommercialPaperMember2020-12-310001418135kdp:KDPCreditAgreementsMemberus-gaap:RevolvingCreditFacilityMemberus-gaap:LineOfCreditMember2021-09-300001418135kdp:KDPCreditAgreementsMemberus-gaap:RevolvingCreditFacilityMemberus-gaap:LineOfCreditMember2020-12-310001418135us-gaap:LineOfCreditMember2021-09-300001418135us-gaap:LineOfCreditMember2020-12-31xbrli:pure0001418135us-gaap:SeniorNotesMemberkdp:A2021MergerNotesMember2021-09-300001418135us-gaap:SeniorNotesMemberkdp:A2021MergerNotesMember2020-12-310001418135kdp:A2021ANotesMemberus-gaap:SeniorNotesMember2021-09-300001418135kdp:A2021ANotesMemberus-gaap:SeniorNotesMember2020-12-310001418135us-gaap:SeniorNotesMemberkdp:A2021BNotesMember2021-09-300001418135us-gaap:SeniorNotesMemberkdp:A2021BNotesMember2020-12-310001418135kdp:SeniorNotes2022Memberus-gaap:SeniorNotesMember2021-09-300001418135kdp:SeniorNotes2022Memberus-gaap:SeniorNotesMember2020-12-310001418135us-gaap:SeniorNotesMemberkdp:A2023MergerNotesMember2021-09-300001418135us-gaap:SeniorNotesMemberkdp:A2023MergerNotesMember2020-12-310001418135kdp:A2023NotesMemberus-gaap:SeniorNotesMember2021-09-300001418135kdp:A2023NotesMemberus-gaap:SeniorNotesMember2020-12-310001418135us-gaap:SeniorNotesMemberkdp:A2024NotesMember2021-09-300001418135us-gaap:SeniorNotesMemberkdp:A2024NotesMember2020-12-310001418135kdp:A2025MergerNotesMemberus-gaap:SeniorNotesMember2021-09-300001418135kdp:A2025MergerNotesMemberus-gaap:SeniorNotesMember2020-12-310001418135kdp:SeniorNotes2025Memberus-gaap:SeniorNotesMember2021-09-300001418135kdp:SeniorNotes2025Memberus-gaap:SeniorNotesMember2020-12-310001418135us-gaap:SeniorNotesMemberkdp:A2026NotesMember2021-09-300001418135us-gaap:SeniorNotesMemberkdp:A2026NotesMember2020-12-310001418135kdp:A2027NotesMemberus-gaap:SeniorNotesMember2021-09-300001418135kdp:A2027NotesMemberus-gaap:SeniorNotesMember2020-12-310001418135kdp:A2028MergerNotesMemberus-gaap:SeniorNotesMember2021-09-300001418135kdp:A2028MergerNotesMemberus-gaap:SeniorNotesMember2020-12-310001418135us-gaap:SeniorNotesMemberkdp:A2030NotesMember2021-09-300001418135us-gaap:SeniorNotesMemberkdp:A2030NotesMember2020-12-310001418135kdp:A2031NotesMemberus-gaap:SeniorNotesMember2021-09-300001418135kdp:A2031NotesMemberus-gaap:SeniorNotesMember2020-12-310001418135us-gaap:SeniorNotesMemberkdp:SeniorNotes2038Member2021-09-300001418135us-gaap:SeniorNotesMemberkdp:SeniorNotes2038Member2020-12-310001418135us-gaap:SeniorNotesMemberkdp:A2038MergerNotesMember2021-09-300001418135us-gaap:SeniorNotesMemberkdp:A2038MergerNotesMember2020-12-310001418135us-gaap:SeniorNotesMemberkdp:SeniorNotes2045Member2021-09-300001418135us-gaap:SeniorNotesMemberkdp:SeniorNotes2045Member2020-12-310001418135kdp:A2046NotesMemberus-gaap:SeniorNotesMember2021-09-300001418135kdp:A2046NotesMemberus-gaap:SeniorNotesMember2020-12-310001418135us-gaap:SeniorNotesMemberkdp:A2048MergerNotesMember2021-09-300001418135us-gaap:SeniorNotesMemberkdp:A2048MergerNotesMember2020-12-310001418135us-gaap:SeniorNotesMemberkdp:A2050NotesMember2021-09-300001418135us-gaap:SeniorNotesMemberkdp:A2050NotesMember2020-12-310001418135kdp:A2051NotesMemberus-gaap:SeniorNotesMember2021-09-300001418135kdp:A2051NotesMemberus-gaap:SeniorNotesMember2020-12-310001418135kdp:SeniorNotesIssuedMarch2021Member2021-03-150001418135kdp:A2023MergerNotesMember2021-03-152021-03-150001418135us-gaap:SeniorSubordinatedNotesMember2021-01-012021-09-300001418135us-gaap:FairValueInputsLevel2Memberkdp:A2019KDPTermLoanMember2021-09-300001418135kdp:A2019KDPTermLoanMember2020-12-310001418135us-gaap:RevolvingCreditFacilityMember2021-09-300001418135us-gaap:RevolvingCreditFacilityMemberus-gaap:LineOfCreditMember2021-09-300001418135us-gaap:RevolvingCreditFacilityMemberus-gaap:LineOfCreditMember2020-12-310001418135kdp:A2020364DayCreditAgreementMember2021-09-300001418135kdp:A2020364DayCreditAgreementMember2020-12-310001418135kdp:A2021364DayCreditAgreementMember2021-09-300001418135kdp:A2021364DayCreditAgreementMember2020-12-310001418135kdp:KDPCreditAgreementsMember2021-09-300001418135kdp:KDPCreditAgreementsMember2020-12-310001418135us-gaap:LetterOfCreditMember2021-09-300001418135kdp:A2019KDPTermLoanMember2021-01-012021-09-300001418135us-gaap:LondonInterbankOfferedRateLIBORMemberkdp:A2021364DayCreditAgreementMembersrt:MinimumMember2021-03-242021-03-240001418135srt:MaximumMemberus-gaap:LondonInterbankOfferedRateLIBORMemberkdp:A2021364DayCreditAgreementMember2021-03-242021-03-240001418135kdp:A2021364DayCreditAgreementMemberus-gaap:BaseRateMembersrt:MinimumMember2021-03-242021-03-240001418135srt:MaximumMemberkdp:A2021364DayCreditAgreementMemberus-gaap:BaseRateMember2021-03-242021-03-240001418135kdp:A2021364DayCreditAgreementMember2021-03-242021-03-240001418135us-gaap:CommercialPaperMember2021-07-012021-09-300001418135us-gaap:CommercialPaperMember2020-07-012020-09-300001418135us-gaap:CommercialPaperMember2021-01-012021-09-300001418135us-gaap:CommercialPaperMember2020-01-012020-09-300001418135us-gaap:LetterOfCreditMemberus-gaap:LineOfCreditMember2021-09-300001418135us-gaap:FairValueMeasurementsNonrecurringMemberus-gaap:SeniorNotesMember2021-09-300001418135us-gaap:FairValueMeasurementsNonrecurringMemberus-gaap:SeniorNotesMember2020-12-310001418135kdp:CoffeeSystemsMember2020-12-310001418135kdp:PackagedBeveragesMember2020-12-310001418135kdp:BeverageConcentratesMember2020-12-310001418135kdp:LatinAmericaBeveragesMember2020-12-310001418135kdp:CoffeeSystemsMember2021-01-012021-09-300001418135kdp:PackagedBeveragesMember2021-01-012021-09-300001418135kdp:BeverageConcentratesMember2021-01-012021-09-300001418135kdp:LatinAmericaBeveragesMember2021-01-012021-09-300001418135kdp:CoffeeSystemsMember2021-09-300001418135kdp:PackagedBeveragesMember2021-09-300001418135kdp:BeverageConcentratesMember2021-09-300001418135kdp:LatinAmericaBeveragesMember2021-09-300001418135kdp:BrandsMember2021-09-300001418135kdp:BrandsMember2020-12-310001418135us-gaap:ContractualRightsMember2021-09-300001418135us-gaap:TradeNamesMember2020-12-310001418135us-gaap:TradeNamesMember2021-09-300001418135us-gaap:ContractualRightsMember2020-12-310001418135us-gaap:DistributionRightsMember2021-09-300001418135us-gaap:DistributionRightsMember2020-12-310001418135kdp:BrandsMember2021-01-012021-09-300001418135us-gaap:TechnologyBasedIntangibleAssetsMember2021-09-300001418135us-gaap:TechnologyBasedIntangibleAssetsMember2020-12-310001418135us-gaap:CustomerRelationshipsMember2021-09-300001418135us-gaap:CustomerRelationshipsMember2020-12-310001418135us-gaap:TradeNamesMember2021-09-300001418135us-gaap:TradeNamesMember2020-12-310001418135us-gaap:ContractualRightsMember2021-09-300001418135us-gaap:ContractualRightsMember2020-12-310001418135kdp:BrandsMember2021-09-300001418135kdp:BrandsMember2020-12-310001418135us-gaap:DistributionRightsMember2021-09-300001418135us-gaap:DistributionRightsMember2020-12-310001418135srt:ScenarioForecastMember2018-07-092021-12-310001418135srt:ScenarioForecastMember2021-12-3100014181352018-07-092021-09-300001418135kdp:IntegrationProgramMember2021-07-012021-09-300001418135kdp:IntegrationProgramMember2020-07-012020-09-300001418135kdp:IntegrationProgramMember2021-01-012021-09-300001418135kdp:IntegrationProgramMember2020-01-012020-09-300001418135us-gaap:EmployeeSeveranceMember2020-12-310001418135us-gaap:EmployeeSeveranceMember2021-09-300001418135us-gaap:InterestRateContractMemberus-gaap:DesignatedAsHedgingInstrumentMember2021-09-300001418135us-gaap:InterestRateContractMemberus-gaap:DesignatedAsHedgingInstrumentMember2020-12-310001418135kdp:ReceiveVariablePayFixedInterestRateSwapsMemberus-gaap:NondesignatedMember2021-09-300001418135kdp:ReceiveVariablePayFixedInterestRateSwapsMemberus-gaap:NondesignatedMember2020-12-310001418135kdp:ReceiveFixedPayVariableInterestRateSwapsMemberus-gaap:NondesignatedMember2021-09-300001418135kdp:ReceiveFixedPayVariableInterestRateSwapsMemberus-gaap:NondesignatedMember2020-12-310001418135us-gaap:SwaptionMemberus-gaap:NondesignatedMember2021-09-300001418135us-gaap:SwaptionMemberus-gaap:NondesignatedMember2020-12-310001418135us-gaap:ForeignExchangeForwardMemberus-gaap:NondesignatedMember2021-09-300001418135us-gaap:ForeignExchangeForwardMemberus-gaap:NondesignatedMember2020-12-310001418135us-gaap:ForeignExchangeForwardMemberus-gaap:DesignatedAsHedgingInstrumentMember2021-09-300001418135us-gaap:ForeignExchangeForwardMemberus-gaap:DesignatedAsHedgingInstrumentMember2020-12-310001418135us-gaap:CommodityContractMemberus-gaap:NondesignatedMember2021-09-300001418135us-gaap:CommodityContractMemberus-gaap:NondesignatedMember2020-12-310001418135us-gaap:FairValueMeasurementsRecurringMemberus-gaap:InterestRateContractMemberus-gaap:NondesignatedMemberus-gaap:FairValueInputsLevel2Memberus-gaap:PrepaidExpensesAndOtherCurrentAssetsMember2021-09-300001418135us-gaap:FairValueMeasurementsRecurringMemberus-gaap:InterestRateContractMemberus-gaap:NondesignatedMemberus-gaap:FairValueInputsLevel2Memberus-gaap:PrepaidExpensesAndOtherCurrentAssetsMember2020-12-310001418135us-gaap:FairValueMeasurementsRecurringMemberus-gaap:ForeignExchangeForwardMemberus-gaap:NondesignatedMemberus-gaap:FairValueInputsLevel2Memberus-gaap:PrepaidExpensesAndOtherCurrentAssetsMember2021-09-300001418135us-gaap:FairValueMeasurementsRecurringMemberus-gaap:ForeignExchangeForwardMemberus-gaap:NondesignatedMemberus-gaap:FairValueInputsLevel2Memberus-gaap:PrepaidExpensesAndOtherCurrentAssetsMember2020-12-310001418135us-gaap:CommodityContractMemberus-gaap:FairValueMeasurementsRecurringMemberus-gaap:NondesignatedMemberus-gaap:FairValueInputsLevel2Memberus-gaap:PrepaidExpensesAndOtherCurrentAssetsMember2021-09-300001418135us-gaap:CommodityContractMemberus-gaap:FairValueMeasurementsRecurringMemberus-gaap:NondesignatedMemberus-gaap:FairValueInputsLevel2Memberus-gaap:PrepaidExpensesAndOtherCurrentAssetsMember2020-12-310001418135us-gaap:FairValueMeasurementsRecurringMemberus-gaap:InterestRateContractMemberus-gaap:NondesignatedMemberus-gaap:FairValueInputsLevel2Memberus-gaap:OtherNoncurrentAssetsMember2021-09-300001418135us-gaap:FairValueMeasurementsRecurringMemberus-gaap:InterestRateContractMemberus-gaap:NondesignatedMemberus-gaap:FairValueInputsLevel2Memberus-gaap:OtherNoncurrentAssetsMember2020-12-310001418135us-gaap:CommodityContractMemberus-gaap:FairValueMeasurementsRecurringMemberus-gaap:NondesignatedMemberus-gaap:FairValueInputsLevel2Memberus-gaap:OtherNoncurrentAssetsMember2021-09-300001418135us-gaap:CommodityContractMemberus-gaap:FairValueMeasurementsRecurringMemberus-gaap:NondesignatedMemberus-gaap:FairValueInputsLevel2Memberus-gaap:OtherNoncurrentAssetsMember2020-12-310001418135us-gaap:FairValueMeasurementsRecurringMemberus-gaap:InterestRateContractMemberus-gaap:NondesignatedMemberus-gaap:FairValueInputsLevel2Memberus-gaap:OtherCurrentLiabilitiesMember2021-09-300001418135us-gaap:FairValueMeasurementsRecurringMemberus-gaap:InterestRateContractMemberus-gaap:NondesignatedMemberus-gaap:FairValueInputsLevel2Memberus-gaap:OtherCurrentLiabilitiesMember2020-12-310001418135us-gaap:FairValueMeasurementsRecurringMemberus-gaap:ForeignExchangeForwardMemberus-gaap:NondesignatedMemberus-gaap:FairValueInputsLevel2Memberus-gaap:OtherCurrentLiabilitiesMember2021-09-300001418135us-gaap:FairValueMeasurementsRecurringMemberus-gaap:ForeignExchangeForwardMemberus-gaap:NondesignatedMemberus-gaap:FairValueInputsLevel2Memberus-gaap:OtherCurrentLiabilitiesMember2020-12-310001418135us-gaap:CommodityContractMemberus-gaap:FairValueMeasurementsRecurringMemberus-gaap:NondesignatedMemberus-gaap:FairValueInputsLevel2Memberus-gaap:OtherCurrentLiabilitiesMember2021-09-300001418135us-gaap:CommodityContractMemberus-gaap:FairValueMeasurementsRecurringMemberus-gaap:NondesignatedMemberus-gaap:FairValueInputsLevel2Memberus-gaap:OtherCurrentLiabilitiesMember2020-12-310001418135us-gaap:FairValueMeasurementsRecurringMemberus-gaap:InterestRateContractMemberus-gaap:NondesignatedMemberus-gaap:FairValueInputsLevel2Memberus-gaap:OtherNoncurrentLiabilitiesMember2021-09-300001418135us-gaap:FairValueMeasurementsRecurringMemberus-gaap:InterestRateContractMemberus-gaap:NondesignatedMemberus-gaap:FairValueInputsLevel2Memberus-gaap:OtherNoncurrentLiabilitiesMember2020-12-310001418135us-gaap:FairValueMeasurementsRecurringMemberus-gaap:ForeignExchangeForwardMemberus-gaap:NondesignatedMemberus-gaap:FairValueInputsLevel2Memberus-gaap:OtherNoncurrentLiabilitiesMember2021-09-300001418135us-gaap:FairValueMeasurementsRecurringMemberus-gaap:ForeignExchangeForwardMemberus-gaap:NondesignatedMemberus-gaap:FairValueInputsLevel2Memberus-gaap:OtherNoncurrentLiabilitiesMember2020-12-310001418135us-gaap:CommodityContractMemberus-gaap:FairValueMeasurementsRecurringMemberus-gaap:NondesignatedMemberus-gaap:FairValueInputsLevel2Memberus-gaap:OtherNoncurrentLiabilitiesMember2021-09-300001418135us-gaap:CommodityContractMemberus-gaap:FairValueMeasurementsRecurringMemberus-gaap:NondesignatedMemberus-gaap:FairValueInputsLevel2Memberus-gaap:OtherNoncurrentLiabilitiesMember2020-12-310001418135us-gaap:FairValueMeasurementsRecurringMemberus-gaap:ForeignExchangeForwardMemberus-gaap:FairValueInputsLevel2Memberus-gaap:DesignatedAsHedgingInstrumentMemberus-gaap:PrepaidExpensesAndOtherCurrentAssetsMember2021-09-300001418135us-gaap:FairValueMeasurementsRecurringMemberus-gaap:ForeignExchangeForwardMemberus-gaap:FairValueInputsLevel2Memberus-gaap:DesignatedAsHedgingInstrumentMemberus-gaap:PrepaidExpensesAndOtherCurrentAssetsMember2020-12-310001418135us-gaap:FairValueMeasurementsRecurringMemberus-gaap:ForeignExchangeForwardMemberus-gaap:FairValueInputsLevel2Memberus-gaap:OtherNoncurrentAssetsMemberus-gaap:DesignatedAsHedgingInstrumentMember2021-09-300001418135us-gaap:FairValueMeasurementsRecurringMemberus-gaap:ForeignExchangeForwardMemberus-gaap:FairValueInputsLevel2Memberus-gaap:OtherNoncurrentAssetsMemberus-gaap:DesignatedAsHedgingInstrumentMember2020-12-310001418135us-gaap:FairValueMeasurementsRecurringMemberus-gaap:ForeignExchangeForwardMemberus-gaap:FairValueInputsLevel2Memberus-gaap:OtherCurrentLiabilitiesMemberus-gaap:DesignatedAsHedgingInstrumentMember2021-09-300001418135us-gaap:FairValueMeasurementsRecurringMemberus-gaap:ForeignExchangeForwardMemberus-gaap:FairValueInputsLevel2Memberus-gaap:OtherCurrentLiabilitiesMemberus-gaap:DesignatedAsHedgingInstrumentMember2020-12-310001418135us-gaap:FairValueMeasurementsRecurringMemberus-gaap:InterestRateContractMemberus-gaap:FairValueInputsLevel2Memberus-gaap:DesignatedAsHedgingInstrumentMemberus-gaap:OtherNoncurrentLiabilitiesMember2021-09-300001418135us-gaap:FairValueMeasurementsRecurringMemberus-gaap:InterestRateContractMemberus-gaap:FairValueInputsLevel2Memberus-gaap:DesignatedAsHedgingInstrumentMemberus-gaap:OtherNoncurrentLiabilitiesMember2020-12-310001418135us-gaap:InterestExpenseMemberus-gaap:InterestRateContractMemberus-gaap:NondesignatedMember2021-07-012021-09-300001418135us-gaap:InterestExpenseMemberus-gaap:InterestRateContractMemberus-gaap:NondesignatedMember2020-07-012020-09-300001418135us-gaap:InterestExpenseMemberus-gaap:InterestRateContractMemberus-gaap:NondesignatedMember2021-01-012021-09-300001418135us-gaap:InterestExpenseMemberus-gaap:InterestRateContractMemberus-gaap:NondesignatedMember2020-01-012020-09-300001418135us-gaap:CostOfSalesMemberus-gaap:ForeignExchangeForwardMemberus-gaap:NondesignatedMember2021-07-012021-09-300001418135us-gaap:CostOfSalesMemberus-gaap:ForeignExchangeForwardMemberus-gaap:NondesignatedMember2020-07-012020-09-300001418135us-gaap:CostOfSalesMemberus-gaap:ForeignExchangeForwardMemberus-gaap:NondesignatedMember2021-01-012021-09-300001418135us-gaap:CostOfSalesMemberus-gaap:ForeignExchangeForwardMemberus-gaap:NondesignatedMember2020-01-012020-09-300001418135us-gaap:OtherNonoperatingIncomeExpenseMemberus-gaap:ForeignExchangeForwardMemberus-gaap:NondesignatedMember2021-07-012021-09-300001418135us-gaap:OtherNonoperatingIncomeExpenseMemberus-gaap:ForeignExchangeForwardMemberus-gaap:NondesignatedMember2020-07-012020-09-300001418135us-gaap:OtherNonoperatingIncomeExpenseMemberus-gaap:ForeignExchangeForwardMemberus-gaap:NondesignatedMember2021-01-012021-09-300001418135us-gaap:OtherNonoperatingIncomeExpenseMemberus-gaap:ForeignExchangeForwardMemberus-gaap:NondesignatedMember2020-01-012020-09-300001418135us-gaap:CommodityContractMemberus-gaap:CostOfSalesMemberus-gaap:NondesignatedMember2021-07-012021-09-300001418135us-gaap:CommodityContractMemberus-gaap:CostOfSalesMemberus-gaap:NondesignatedMember2020-07-012020-09-300001418135us-gaap:CommodityContractMemberus-gaap:CostOfSalesMemberus-gaap:NondesignatedMember2021-01-012021-09-300001418135us-gaap:CommodityContractMemberus-gaap:CostOfSalesMemberus-gaap:NondesignatedMember2020-01-012020-09-300001418135us-gaap:CommodityContractMemberus-gaap:SellingGeneralAndAdministrativeExpensesMemberus-gaap:NondesignatedMember2021-07-012021-09-300001418135us-gaap:CommodityContractMemberus-gaap:SellingGeneralAndAdministrativeExpensesMemberus-gaap:NondesignatedMember2020-07-012020-09-300001418135us-gaap:CommodityContractMemberus-gaap:SellingGeneralAndAdministrativeExpensesMemberus-gaap:NondesignatedMember2021-01-012021-09-300001418135us-gaap:CommodityContractMemberus-gaap:SellingGeneralAndAdministrativeExpensesMemberus-gaap:NondesignatedMember2020-01-012020-09-300001418135us-gaap:InterestRateContractMember2021-07-012021-09-300001418135us-gaap:InterestRateContractMember2020-07-012020-09-300001418135us-gaap:InterestRateContractMember2021-01-012021-09-300001418135us-gaap:InterestRateContractMember2020-01-012020-09-300001418135us-gaap:ForeignExchangeForwardMember2021-07-012021-09-300001418135us-gaap:ForeignExchangeForwardMember2020-07-012020-09-300001418135us-gaap:ForeignExchangeForwardMember2021-01-012021-09-300001418135us-gaap:ForeignExchangeForwardMember2020-01-012020-09-300001418135srt:MinimumMember2021-09-300001418135srt:MaximumMember2021-09-300001418135kdp:CoffeeSystemsMember2021-07-012021-09-300001418135kdp:CoffeeSystemsMember2020-07-012020-09-300001418135kdp:CoffeeSystemsMember2020-01-012020-09-300001418135kdp:PackagedBeveragesMember2021-07-012021-09-300001418135kdp:PackagedBeveragesMember2020-07-012020-09-300001418135kdp:PackagedBeveragesMember2020-01-012020-09-300001418135kdp:BeverageConcentratesMember2021-07-012021-09-300001418135kdp:BeverageConcentratesMember2020-07-012020-09-300001418135kdp:BeverageConcentratesMember2020-01-012020-09-300001418135kdp:LatinAmericaBeveragesMember2021-07-012021-09-300001418135kdp:LatinAmericaBeveragesMember2020-07-012020-09-300001418135kdp:LatinAmericaBeveragesMember2020-01-012020-09-300001418135us-gaap:OperatingSegmentsMemberkdp:CoffeeSystemsMember2021-07-012021-09-300001418135us-gaap:OperatingSegmentsMemberkdp:CoffeeSystemsMember2020-07-012020-09-300001418135us-gaap:OperatingSegmentsMemberkdp:CoffeeSystemsMember2021-01-012021-09-300001418135us-gaap:OperatingSegmentsMemberkdp:CoffeeSystemsMember2020-01-012020-09-300001418135kdp:PackagedBeveragesMemberus-gaap:OperatingSegmentsMember2021-07-012021-09-300001418135kdp:PackagedBeveragesMemberus-gaap:OperatingSegmentsMember2020-07-012020-09-300001418135kdp:PackagedBeveragesMemberus-gaap:OperatingSegmentsMember2021-01-012021-09-300001418135kdp:PackagedBeveragesMemberus-gaap:OperatingSegmentsMember2020-01-012020-09-300001418135kdp:BeverageConcentratesMemberus-gaap:OperatingSegmentsMember2021-07-012021-09-300001418135kdp:BeverageConcentratesMemberus-gaap:OperatingSegmentsMember2020-07-012020-09-300001418135kdp:BeverageConcentratesMemberus-gaap:OperatingSegmentsMember2021-01-012021-09-300001418135kdp:BeverageConcentratesMemberus-gaap:OperatingSegmentsMember2020-01-012020-09-300001418135us-gaap:OperatingSegmentsMemberkdp:LatinAmericaBeveragesMember2021-07-012021-09-300001418135us-gaap:OperatingSegmentsMemberkdp:LatinAmericaBeveragesMember2020-07-012020-09-300001418135us-gaap:OperatingSegmentsMemberkdp:LatinAmericaBeveragesMember2021-01-012021-09-300001418135us-gaap:OperatingSegmentsMemberkdp:LatinAmericaBeveragesMember2020-01-012020-09-300001418135us-gaap:CorporateNonSegmentMember2021-07-012021-09-300001418135us-gaap:CorporateNonSegmentMember2020-07-012020-09-300001418135us-gaap:CorporateNonSegmentMember2021-01-012021-09-300001418135us-gaap:CorporateNonSegmentMember2020-01-012020-09-300001418135us-gaap:RestrictedStockUnitsRSUMember2020-12-310001418135us-gaap:RestrictedStockUnitsRSUMember2020-01-012020-12-310001418135us-gaap:RestrictedStockUnitsRSUMember2021-01-012021-09-300001418135us-gaap:RestrictedStockUnitsRSUMember2021-09-300001418135kdp:CoffeeSystemsMemberkdp:CSDMember2021-07-012021-09-300001418135kdp:PackagedBeveragesMemberkdp:CSDMember2021-07-012021-09-300001418135kdp:BeverageConcentratesMemberkdp:CSDMember2021-07-012021-09-300001418135kdp:LatinAmericaBeveragesMemberkdp:CSDMember2021-07-012021-09-300001418135kdp:CSDMember2021-07-012021-09-300001418135kdp:CoffeeSystemsMemberkdp:PodsMember2021-07-012021-09-300001418135kdp:PackagedBeveragesMemberkdp:PodsMember2021-07-012021-09-300001418135kdp:BeverageConcentratesMemberkdp:PodsMember2021-07-012021-09-300001418135kdp:LatinAmericaBeveragesMemberkdp:PodsMember2021-07-012021-09-300001418135kdp:PodsMember2021-07-012021-09-300001418135kdp:CoffeeSystemsMemberkdp:NCBMember2021-07-012021-09-300001418135kdp:PackagedBeveragesMemberkdp:NCBMember2021-07-012021-09-300001418135kdp:BeverageConcentratesMemberkdp:NCBMember2021-07-012021-09-300001418135kdp:LatinAmericaBeveragesMemberkdp:NCBMember2021-07-012021-09-300001418135kdp:NCBMember2021-07-012021-09-300001418135kdp:AppliancesMemberkdp:CoffeeSystemsMember2021-07-012021-09-300001418135kdp:PackagedBeveragesMemberkdp:AppliancesMember2021-07-012021-09-300001418135kdp:BeverageConcentratesMemberkdp:AppliancesMember2021-07-012021-09-300001418135kdp:AppliancesMemberkdp:LatinAmericaBeveragesMember2021-07-012021-09-300001418135kdp:AppliancesMember2021-07-012021-09-300001418135kdp:CoffeeSystemsMemberkdp:OtherProductsMember2021-07-012021-09-300001418135kdp:PackagedBeveragesMemberkdp:OtherProductsMember2021-07-012021-09-300001418135kdp:BeverageConcentratesMemberkdp:OtherProductsMember2021-07-012021-09-300001418135kdp:OtherProductsMemberkdp:LatinAmericaBeveragesMember2021-07-012021-09-300001418135kdp:OtherProductsMember2021-07-012021-09-300001418135kdp:CoffeeSystemsMemberkdp:CSDMember2020-07-012020-09-300001418135kdp:PackagedBeveragesMemberkdp:CSDMember2020-07-012020-09-300001418135kdp:BeverageConcentratesMemberkdp:CSDMember2020-07-012020-09-300001418135kdp:LatinAmericaBeveragesMemberkdp:CSDMember2020-07-012020-09-300001418135kdp:CSDMember2020-07-012020-09-300001418135kdp:CoffeeSystemsMemberkdp:PodsMember2020-07-012020-09-300001418135kdp:PackagedBeveragesMemberkdp:PodsMember2020-07-012020-09-300001418135kdp:BeverageConcentratesMemberkdp:PodsMember2020-07-012020-09-300001418135kdp:LatinAmericaBeveragesMemberkdp:PodsMember2020-07-012020-09-300001418135kdp:PodsMember2020-07-012020-09-300001418135kdp:CoffeeSystemsMemberkdp:NCBMember2020-07-012020-09-300001418135kdp:PackagedBeveragesMemberkdp:NCBMember2020-07-012020-09-300001418135kdp:BeverageConcentratesMemberkdp:NCBMember2020-07-012020-09-300001418135kdp:LatinAmericaBeveragesMemberkdp:NCBMember2020-07-012020-09-300001418135kdp:NCBMember2020-07-012020-09-300001418135kdp:AppliancesMemberkdp:CoffeeSystemsMember2020-07-012020-09-300001418135kdp:PackagedBeveragesMemberkdp:AppliancesMember2020-07-012020-09-300001418135kdp:BeverageConcentratesMemberkdp:AppliancesMember2020-07-012020-09-300001418135kdp:AppliancesMemberkdp:LatinAmericaBeveragesMember2020-07-012020-09-300001418135kdp:AppliancesMember2020-07-012020-09-300001418135kdp:CoffeeSystemsMemberkdp:OtherProductsMember2020-07-012020-09-300001418135kdp:PackagedBeveragesMemberkdp:OtherProductsMember2020-07-012020-09-300001418135kdp:BeverageConcentratesMemberkdp:OtherProductsMember2020-07-012020-09-300001418135kdp:OtherProductsMemberkdp:LatinAmericaBeveragesMember2020-07-012020-09-300001418135kdp:OtherProductsMember2020-07-012020-09-300001418135kdp:CoffeeSystemsMemberkdp:CSDMember2021-01-012021-09-300001418135kdp:PackagedBeveragesMemberkdp:CSDMember2021-01-012021-09-300001418135kdp:BeverageConcentratesMemberkdp:CSDMember2021-01-012021-09-300001418135kdp:LatinAmericaBeveragesMemberkdp:CSDMember2021-01-012021-09-300001418135kdp:CSDMember2021-01-012021-09-300001418135kdp:CoffeeSystemsMemberkdp:PodsMember2021-01-012021-09-300001418135kdp:PackagedBeveragesMemberkdp:PodsMember2021-01-012021-09-300001418135kdp:BeverageConcentratesMemberkdp:PodsMember2021-01-012021-09-300001418135kdp:LatinAmericaBeveragesMemberkdp:PodsMember2021-01-012021-09-300001418135kdp:PodsMember2021-01-012021-09-300001418135kdp:CoffeeSystemsMemberkdp:NCBMember2021-01-012021-09-300001418135kdp:PackagedBeveragesMemberkdp:NCBMember2021-01-012021-09-300001418135kdp:BeverageConcentratesMemberkdp:NCBMember2021-01-012021-09-300001418135kdp:LatinAmericaBeveragesMemberkdp:NCBMember2021-01-012021-09-300001418135kdp:NCBMember2021-01-012021-09-300001418135kdp:AppliancesMemberkdp:CoffeeSystemsMember2021-01-012021-09-300001418135kdp:PackagedBeveragesMemberkdp:AppliancesMember2021-01-012021-09-300001418135kdp:BeverageConcentratesMemberkdp:AppliancesMember2021-01-012021-09-300001418135kdp:AppliancesMemberkdp:LatinAmericaBeveragesMember2021-01-012021-09-300001418135kdp:AppliancesMember2021-01-012021-09-300001418135kdp:CoffeeSystemsMemberkdp:OtherProductsMember2021-01-012021-09-300001418135kdp:PackagedBeveragesMemberkdp:OtherProductsMember2021-01-012021-09-300001418135kdp:BeverageConcentratesMemberkdp:OtherProductsMember2021-01-012021-09-300001418135kdp:OtherProductsMemberkdp:LatinAmericaBeveragesMember2021-01-012021-09-300001418135kdp:OtherProductsMember2021-01-012021-09-300001418135kdp:CoffeeSystemsMemberkdp:CSDMember2020-01-012020-09-300001418135kdp:PackagedBeveragesMemberkdp:CSDMember2020-01-012020-09-300001418135kdp:BeverageConcentratesMemberkdp:CSDMember2020-01-012020-09-300001418135kdp:LatinAmericaBeveragesMemberkdp:CSDMember2020-01-012020-09-300001418135kdp:CSDMember2020-01-012020-09-300001418135kdp:CoffeeSystemsMemberkdp:PodsMember2020-01-012020-09-300001418135kdp:PackagedBeveragesMemberkdp:PodsMember2020-01-012020-09-300001418135kdp:BeverageConcentratesMemberkdp:PodsMember2020-01-012020-09-300001418135kdp:LatinAmericaBeveragesMemberkdp:PodsMember2020-01-012020-09-300001418135kdp:PodsMember2020-01-012020-09-300001418135kdp:CoffeeSystemsMemberkdp:NCBMember2020-01-012020-09-300001418135kdp:PackagedBeveragesMemberkdp:NCBMember2020-01-012020-09-300001418135kdp:BeverageConcentratesMemberkdp:NCBMember2020-01-012020-09-300001418135kdp:LatinAmericaBeveragesMemberkdp:NCBMember2020-01-012020-09-300001418135kdp:NCBMember2020-01-012020-09-300001418135kdp:AppliancesMemberkdp:CoffeeSystemsMember2020-01-012020-09-300001418135kdp:PackagedBeveragesMemberkdp:AppliancesMember2020-01-012020-09-300001418135kdp:BeverageConcentratesMemberkdp:AppliancesMember2020-01-012020-09-300001418135kdp:AppliancesMemberkdp:LatinAmericaBeveragesMember2020-01-012020-09-300001418135kdp:AppliancesMember2020-01-012020-09-300001418135kdp:CoffeeSystemsMemberkdp:OtherProductsMember2020-01-012020-09-300001418135kdp:PackagedBeveragesMemberkdp:OtherProductsMember2020-01-012020-09-300001418135kdp:BeverageConcentratesMemberkdp:OtherProductsMember2020-01-012020-09-300001418135kdp:OtherProductsMemberkdp:LatinAmericaBeveragesMember2020-01-012020-09-300001418135kdp:OtherProductsMember2020-01-012020-09-300001418135kdp:BASportsNutritionLLCMember2021-09-300001418135kdp:BASportsNutritionLLCMember2020-12-310001418135kdp:DylaLLCMember2021-09-300001418135kdp:DylaLLCMember2020-12-310001418135kdp:ForceHoldingLLCMember2021-09-300001418135kdp:ForceHoldingLLCMember2020-12-310001418135kdp:BeveragestartupcompaniesMember2021-09-300001418135kdp:BeveragestartupcompaniesMember2020-12-310001418135kdp:OtherEquityMethodInvestmentsMember2021-09-300001418135kdp:OtherEquityMethodInvestmentsMember2020-12-310001418135kdp:SuppliersUtilizingThirdPartyServicesSoldThroughToFinancialInstitutionsMember2021-09-300001418135kdp:SuppliersUtilizingThirdPartyServicesSoldThroughToFinancialInstitutionsMember2020-12-310001418135us-gaap:AccumulatedTranslationAdjustmentMember2021-06-300001418135us-gaap:AccumulatedDefinedBenefitPlansAdjustmentMember2021-06-300001418135us-gaap:AccumulatedGainLossCashFlowHedgeIncludingNoncontrollingInterestMember2021-06-300001418135us-gaap:AccumulatedTranslationAdjustmentMember2021-07-012021-09-300001418135us-gaap:AccumulatedDefinedBenefitPlansAdjustmentMember2021-07-012021-09-300001418135us-gaap:AccumulatedGainLossCashFlowHedgeIncludingNoncontrollingInterestMember2021-07-012021-09-300001418135us-gaap:AccumulatedTranslationAdjustmentMember2021-09-300001418135us-gaap:AccumulatedDefinedBenefitPlansAdjustmentMember2021-09-300001418135us-gaap:AccumulatedGainLossCashFlowHedgeIncludingNoncontrollingInterestMember2021-09-300001418135us-gaap:AccumulatedTranslationAdjustmentMember2020-06-300001418135us-gaap:AccumulatedDefinedBenefitPlansAdjustmentMember2020-06-300001418135us-gaap:AccumulatedGainLossCashFlowHedgeIncludingNoncontrollingInterestMember2020-06-300001418135us-gaap:AccumulatedTranslationAdjustmentMember2020-07-012020-09-300001418135us-gaap:AccumulatedDefinedBenefitPlansAdjustmentMember2020-07-012020-09-300001418135us-gaap:AccumulatedGainLossCashFlowHedgeIncludingNoncontrollingInterestMember2020-07-012020-09-300001418135us-gaap:AccumulatedTranslationAdjustmentMember2020-09-300001418135us-gaap:AccumulatedDefinedBenefitPlansAdjustmentMember2020-09-300001418135us-gaap:AccumulatedGainLossCashFlowHedgeIncludingNoncontrollingInterestMember2020-09-300001418135us-gaap:AccumulatedTranslationAdjustmentMember2020-12-310001418135us-gaap:AccumulatedDefinedBenefitPlansAdjustmentMember2020-12-310001418135us-gaap:AccumulatedGainLossCashFlowHedgeIncludingNoncontrollingInterestMember2020-12-310001418135us-gaap:AccumulatedTranslationAdjustmentMember2021-01-012021-09-300001418135us-gaap:AccumulatedDefinedBenefitPlansAdjustmentMember2021-01-012021-09-300001418135us-gaap:AccumulatedGainLossCashFlowHedgeIncludingNoncontrollingInterestMember2021-01-012021-09-300001418135us-gaap:AccumulatedOtherComprehensiveIncomeMember2021-01-012021-09-300001418135us-gaap:AccumulatedTranslationAdjustmentMember2019-12-310001418135us-gaap:AccumulatedDefinedBenefitPlansAdjustmentMember2019-12-310001418135us-gaap:AccumulatedGainLossCashFlowHedgeIncludingNoncontrollingInterestMember2019-12-310001418135us-gaap:AccumulatedTranslationAdjustmentMember2020-01-012020-09-300001418135us-gaap:AccumulatedDefinedBenefitPlansAdjustmentMember2020-01-012020-09-300001418135us-gaap:AccumulatedGainLossCashFlowHedgeIncludingNoncontrollingInterestMember2020-01-012020-09-300001418135us-gaap:AccumulatedOtherComprehensiveIncomeMember2020-01-012020-09-300001418135us-gaap:AccumulatedGainLossNetCashFlowHedgeParentMemberus-gaap:InterestRateContractMember2021-07-012021-09-300001418135us-gaap:AccumulatedGainLossNetCashFlowHedgeParentMemberus-gaap:InterestRateContractMember2020-07-012020-09-300001418135us-gaap:AccumulatedGainLossNetCashFlowHedgeParentMemberus-gaap:InterestRateContractMember2021-01-012021-09-300001418135us-gaap:AccumulatedGainLossNetCashFlowHedgeParentMemberus-gaap:InterestRateContractMember2020-01-012020-09-300001418135us-gaap:AccumulatedGainLossNetCashFlowHedgeParentMemberus-gaap:ForeignExchangeForwardMember2021-07-012021-09-300001418135us-gaap:AccumulatedGainLossNetCashFlowHedgeParentMemberus-gaap:ForeignExchangeForwardMember2020-07-012020-09-300001418135us-gaap:AccumulatedGainLossNetCashFlowHedgeParentMemberus-gaap:ForeignExchangeForwardMember2021-01-012021-09-300001418135us-gaap:AccumulatedGainLossNetCashFlowHedgeParentMemberus-gaap:ForeignExchangeForwardMember2020-01-012020-09-300001418135us-gaap:AccumulatedGainLossNetCashFlowHedgeParentMember2021-07-012021-09-300001418135us-gaap:AccumulatedGainLossNetCashFlowHedgeParentMember2020-07-012020-09-300001418135us-gaap:AccumulatedGainLossNetCashFlowHedgeParentMember2021-01-012021-09-300001418135us-gaap:AccumulatedGainLossNetCashFlowHedgeParentMember2020-01-012020-09-300001418135kdp:AntitrustLitigationMember2020-01-012020-09-300001418135kdp:JABandaffiliatesMember2021-09-300001418135kdp:BedfordMember2021-09-300001418135kdp:BedfordMember2021-01-012021-09-300001418135us-gaap:SubsequentEventMember2021-10-252021-10-25
SECURITIES AND EXCHANGE COMMISSION
WASHINGTON, D.C. 20549
FORM 10-Q
☒ QUARTERLY REPORT PURSUANT TO SECTION 13 OR 15(d) OF THE SECURITIES EXCHANGE ACT OF 1934
FOR THE QUARTERLY PERIOD ENDED September 30, 2021
OR
☐ TRANSITION REPORT PURSUANT TO SECTION 13 OR 15(d) OF THE SECURITIES EXCHANGE ACT OF 1934
FOR THE TRANSITION PERIOD FROM TO
Commission file number 001-33829
Keurig Dr Pepper Inc.
(Exact name of registrant as specified in its charter)
| | | | | | | | | | | |
| Delaware | 98-0517725 |
| (State or other jurisdiction of incorporation or organization) | (I.R.S. employer identification number) |
53 South Avenue
Burlington, Massachusetts
01803
(Address of principal executive offices)
(781) 418-7000
(Registrant's telephone number, including area code)
Securities registered pursuant to Section 12(b) of the Act:
| | | | | | | | | | | | | | |
| Title of each class | | Trading Symbol | | Name of each exchange on which registered |
| Common stock | | KDP | | The Nasdaq Stock Market LLC |
Indicate by check mark whether the registrant (1) has filed all reports required to be filed by Section 13 or 15(d) of the Securities Exchange Act of 1934 during the preceding 12 months (or for such shorter period that the registrant was required to file such reports), and (2) has been subject to such filing requirements for the past 90 days. Yes ☒ No ☐
Indicate by check mark whether the registrant has submitted electronically every Interactive Data File required to be submitted pursuant to Rule 405 of Regulation S-T (§232.405 of this chapter) during the preceding 12 months (or for such shorter period that the registrant was required to submit such files). Yes ☒ No ☐
Indicate by check mark whether the registrant is a large accelerated filer, an accelerated filer, a non-accelerated filer, a smaller reporting company, or an emerging growth company. See the definitions of "large accelerated filer", "accelerated filer", "smaller reporting company", and "emerging growth company" in Rule 12b-2 of the Securities Exchange Act of 1934.
Large Accelerated Filer ☒ Accelerated Filer ☐ Non-Accelerated Filer ☐ Smaller Reporting Company ☐ Emerging Growth Company ☐
If an emerging growth company, indicate by check mark if the registrant has elected not to use the extended transition period for complying with any new or revised financial accounting standards provided pursuant to Section 13(a) of the Exchange Act. ☐
Indicate by check mark whether the registrant is a shell company (as defined in Rule 12b-2 of the Securities Exchange Act of 1934). Yes ☐ No ☒
As of October 26, 2021, there were 1,417,961,594 shares of the registrant's common stock, par value $0.01 per share, outstanding.
KEURIG DR PEPPER INC.
FORM 10-Q
TABLE OF CONTENTS
| | | | | | | | | | | | | | |
| | | | | Page |
| | |
| | | | |
| | | | |
| | | |
| | | | |
| | | | |
| | | |
| | | | |
| | | | |
| | | | |
| | | | |
| | | | |
| | | | |
| | | | |
| | | | |
| | | | |
| | | | |
| | | | |
| | | | |
| | 12 | Investments in Unconsolidated Affiliates | |
| | | | |
| | | | |
| | | | |
| | | | |
| | | | |
| | | | |
| | | | |
| | | | |
| | | | |
| | |
| | | | |
| | | |
| | | |
| | | | |
KEURIG DR PEPPER INC.
MASTER GLOSSARY
| | | | | | | | |
| Term | | Definition |
| | |
| | |
| 2019 KDP Term Loan | | $2 billion aggregate principal amount, with the ability to make voluntary and mandatory prepayments, due on February 8, 2023 |
| 2020 364-Day Credit Agreement | | The Company's $1,500 million credit agreement, which was entered into on April 12, 2020 and terminated on March 26, 2021 |
| 2021 364-Day Credit Agreement | | The Company's $1,500 million credit agreement, which was entered into on March 26, 2021 and contains a term-out option |
| A Shoc | | A Shoc Beverage LLC, an equity method investment of KDP, or Adrenaline Shoc energy drinks |
| ABC | | The American Bottling Company, a wholly-owned subsidiary of KDP |
| ABI | | Anheuser-Busch InBev SA/NV |
| Annual Report | | Annual Report on Form 10-K for the year ended December 31, 2020 |
| AOCI | | Accumulated other comprehensive income or loss |
| ASU | | Accounting Standards Update |
| Bedford | | Bedford Systems, LLC, an equity method investment of KDP and the maker of Drinkworks |
| BodyArmor | | BA Sports Nutrition, LLC, an equity method investment of KDP |
| bps | | basis points |
| CSD | | Carbonated soft drink |
| DIO | | Days inventory outstanding |
| DPO | | Days of payables outstanding |
| DPS | | Dr Pepper Snapple Group, Inc. |
| DPS Merger | | The combination of the business operations of Keurig and DPS that was consummated on July 9, 2018 through a reverse merger transaction, whereby a wholly-owned special purpose merger subsidiary of DPS merged with and into the direct parent of Keurig |
| DSD | | Direct Store Delivery, the operating segment whereby finished beverages are delivered directly to retailers |
| DSO | | Days sales outstanding |
| EPS | | Earnings per share |
| Exchange Act | | Securities Exchange Act of 1934, as amended |
| FFS | | Fountain Foodservice, an operating segment of KDP which serves the fountain channel, such as restaurants |
| FASB | | Financial Accounting Standards Board |
| FX | | Foreign exchange |
| GILTI | | Global intangible low-taxed income |
| Goldman | | Goldman Sachs & Co. LLC |
| IRi | | Information Resources, Inc. |
| JAB | | JAB Holding Company S.a.r.l. and affiliates |
| KDP | | Keurig Dr Pepper Inc. |
| KDP Credit Agreements | | Collectively, the KDP Revolver, the 2020 364-Day Credit Agreement, the 2021 364-Day Credit Agreement, and the 2019 KDP Term Loan |
| KDP Revolver | | The Company's $2,400 million revolving credit facility, which was entered into on February 28, 2018 |
| Keurig | | Keurig Green Mountain, Inc., and the brand of our brewers |
| LIBOR | | London Interbank Offered Rate |
| LifeFuels | | LifeFuels, Inc., an equity method investment |
| NCB | | Non-carbonated beverage |
| Notes | | Collectively, the Company's senior unsecured notes |
| Peet's | | Peet's Coffee & Tea, Inc. |
| PET | | Polyethylene terephthalate, which is used to make the Company's plastic bottles |
| Proposition 65 | | The State of California's Safe Drinking Water and Toxic Enforcement Act of 1986 |
| RSU | | Restricted share unit |
| RTD | | Ready to drink |
| SEC | | Securities and Exchange Commission |
| SG&A | | Selling, general and administrative |
| U.S. GAAP | | Accounting principles generally accepted in the U.S. |
| | |
| Vita Coco | | The Vita Coco Company, Inc. |
| WD | | Warehouse Direct, the operating segment whereby finished beverages are shipped to retailer warehouses, and then delivered by the retailer through its own delivery system to its stores |
PART I - FINANCIAL INFORMATION
ITEM 1.Financial Statements (Unaudited)
KEURIG DR PEPPER INC.
CONDENSED CONSOLIDATED STATEMENTS OF INCOME
(UNAUDITED)
| | | | | | | | | | | | | | | | | | | | | | | |
| | Third Quarter | | First Nine Months |
| (in millions, except per share data) | 2021 | | 2020 | | 2021 | | 2020 |
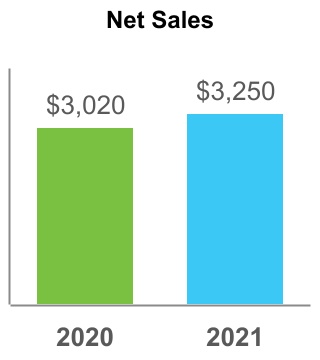
| Net sales | $ | 3,250 | | | $ | 3,020 | | | $ | 9,292 | | | $ | 8,497 | |
| Cost of sales | 1,415 | | | 1,316 | | | 4,087 | | | 3,779 | |
| Gross profit | 1,835 | | | 1,704 | | | 5,205 | | | 4,718 | |
| Selling, general and administrative expenses | 1,040 | | | 949 | | | 3,040 | | | 2,978 | |
| Other operating expense (income), net | — | | | 2 | | | (4) | | | (40) | |
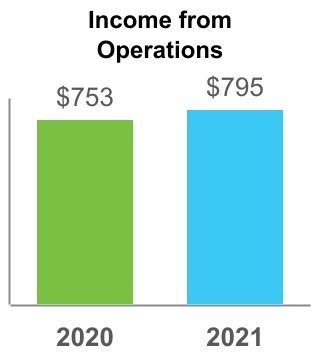
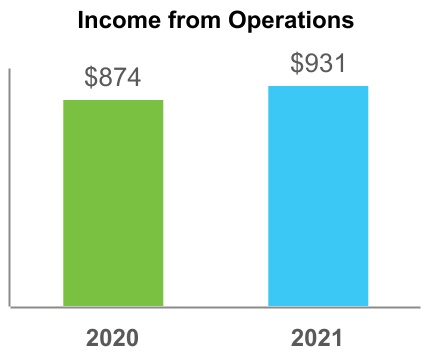
| Income from operations | 795 | | | 753 | | | 2,169 | | | 1,780 | |
| Interest expense | 116 | | | 148 | | | 381 | | | 458 | |
| Loss on early extinguishment of debt | — | | | — | | | 105 | | | 4 | |
| Impairment of investments and note receivable | — | | | 16 | | | — | | | 102 | |
| Other expense (income), net | 1 | | | 5 | | | (6) | | | 21 | |
| Income before provision for income taxes | 678 | | | 584 | | | 1,689 | | | 1,195 | |
| Provision for income taxes | 149 | | | 141 | | | 387 | | | 298 | |
| Net income including non-controlling interest | 529 | | | 443 | | | 1,302 | | | 897 | |
| Less: Net loss attributable to non-controlling interest | (1) | | | — | | | (1) | | | — | |
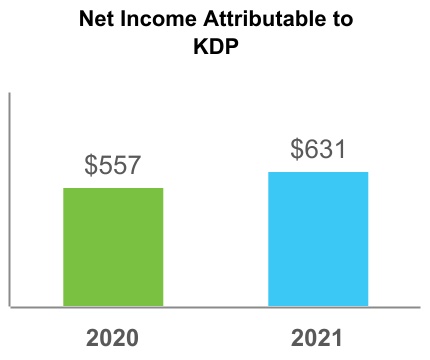
| Net income attributable to KDP | $ | 530 | | | $ | 443 | | | $ | 1,303 | | | $ | 897 | |
| | | | | | | |
| Earnings per common share: | | | | | | | |
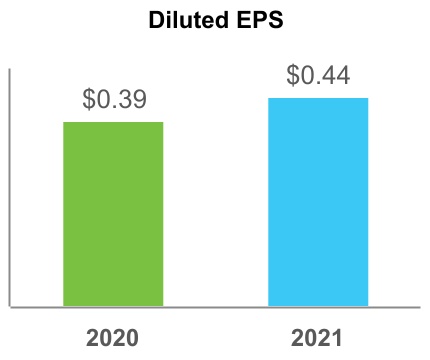
| Basic | $ | 0.37 | | | $ | 0.31 | | | $ | 0.92 | | | $ | 0.64 | |
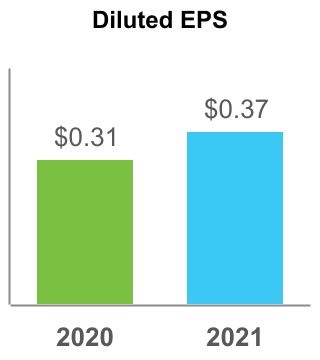
| Diluted | 0.37 | | | 0.31 | | | 0.91 | | | 0.63 | |
| Weighted average common shares outstanding: | | | | | | | |
| Basic | 1,417.6 | | | 1,407.3 | | | 1,414.9 | | | 1,407.2 | |
| Diluted | 1,428.5 | | | 1,422.9 | | | 1,427.5 | | | 1,421.5 | |
The accompanying notes are an integral part of these unaudited condensed consolidated financial statements.
KEURIG DR PEPPER INC.
CONDENSED CONSOLIDATED STATEMENTS OF COMPREHENSIVE INCOME
(UNAUDITED)
| | | | | | | | | | | | | | | | | | | | | | | |
| | Third Quarter | | First Nine Months |
| (in millions) | 2021 | | 2020 | | 2021 | | 2020 |
| Net income including non-controlling interest | $ | 529 | | | $ | 443 | | | $ | 1,302 | | | $ | 897 | |
| Other comprehensive income | | | | | | | |
| Foreign currency translation adjustments | (137) | | | 111 | | | (9) | | | (321) | |
Net change in pension and post-retirement liability, net of tax of $—, $—, $— and $—, respectively | — | | | (1) | | | — | | | (2) | |
Net change in cash flow hedges, net of tax of $4, $—, $(22) and $—, respectively | 15 | | | 1 | | | (62) | | | 2 | |
| Total other comprehensive income (loss) | (122) | | | 111 | | | (71) | | | (321) | |
| Comprehensive income including non-controlling interest | 407 | | | 554 | | | 1,231 | | | 576 | |
| Less: Comprehensive income attributable to non-controlling interest | — | | | — | | | — | | | — | |
| Comprehensive income attributable to KDP | $ | 407 | | | $ | 554 | | | $ | 1,231 | | | $ | 576 | |
The accompanying notes are an integral part of these unaudited condensed consolidated financial statements.
KEURIG DR PEPPER INC.
CONDENSED CONSOLIDATED BALANCE SHEETS
(UNAUDITED) | | | | | | | | | | | |
| | September 30, | | December 31, |
| (in millions, except share and per share data) | 2021 | | 2020 |
| Assets |
| Current assets: | | | |
| Cash and cash equivalents | $ | 200 | | | $ | 240 | |
| Restricted cash and restricted cash equivalents | 3 | | | 15 | |
| Trade accounts receivable, net | 1,138 | | | 1,048 | |
| Inventories | 972 | | | 762 | |
| Prepaid expenses and other current assets | 490 | | | 323 | |
| Total current assets | 2,803 | | | 2,388 | |
| Property, plant and equipment, net | 2,425 | | | 2,212 | |
| Investments in unconsolidated affiliates | 85 | | | 88 | |
| Goodwill | 20,193 | | | 20,184 | |
| Other intangible assets, net | 23,883 | | | 23,968 | |
| Other non-current assets | 901 | | | 894 | |
| Deferred tax assets | 40 | | | 45 | |
| Total assets | $ | 50,330 | | | $ | 49,779 | |
| Liabilities and Stockholders' Equity |
| Current liabilities: | | | |
| Accounts payable | $ | 4,072 | | | $ | 3,740 | |
| Accrued expenses | 1,121 | | | 1,040 | |
| Structured payables | 142 | | | 153 | |
| Short-term borrowings and current portion of long-term obligations | 998 | | | 2,345 | |
| Other current liabilities | 462 | | | 416 | |
| Total current liabilities | 6,795 | | | 7,694 | |
| Long-term obligations | 11,727 | | | 11,143 | |
| Deferred tax liabilities | 5,940 | | | 5,993 | |
| Other non-current liabilities | 1,463 | | | 1,119 | |
| Total liabilities | 25,925 | | | 25,949 | |
| Commitments and contingencies | | | |
| Stockholders' equity: | | | |
Preferred stock, $0.01 par value, 15,000,000 shares authorized, no shares issued | — | | | — | |
Common stock, $0.01 par value, 2,000,000,000 shares authorized, 1,417,914,437 and 1,407,260,676 shares issued and outstanding as of September 30, 2021 and December 31, 2020, respectively | 14 | | | 14 | |
| Additional paid-in capital | 21,764 | | | 21,677 | |
| Retained earnings | 2,621 | | | 2,061 | |
| Accumulated other comprehensive income | 6 | | | 77 | |
| Total stockholders' equity | 24,405 | | | 23,829 | |
| Non-controlling interest | — | | | 1 | |
| Total equity | 24,405 | | | 23,830 | |
| Total liabilities and equity | $ | 50,330 | | | $ | 49,779 | |
The accompanying notes are an integral part of these unaudited condensed consolidated financial statements.
KEURIG DR PEPPER INC.
CONDENSED CONSOLIDATED STATEMENTS OF CASH FLOWS
(UNAUDITED) | | | | | | | | | | | |
| | First Nine Months |
| (in millions) | 2021 | | 2020 |
| Operating activities: | | | |
| Net income attributable to KDP | $ | 1,303 | | | $ | 897 | |
| Adjustments to reconcile net income to net cash provided by operating activities: | | | |
| Depreciation expense | 304 | | | 272 | |
| Amortization of intangibles | 101 | | | 100 | |
| Other amortization expense | 118 | | | 118 | |
| Provision for sales returns | 48 | | | 36 | |
| Deferred income taxes | (21) | | | (27) | |
| Employee stock-based compensation expense | 68 | | | 62 | |
| Loss on early extinguishment of debt | 105 | | | 4 | |
| | | |
| Gain on disposal of property, plant and equipment | (5) | | | (39) | |
| Unrealized loss on foreign currency | 1 | | | 14 | |
| Unrealized (gain) loss on derivatives | (94) | | | 47 | |
| Equity in loss of unconsolidated affiliates | 2 | | | 19 | |
| Impairment on investments and note receivable of unconsolidated affiliate | — | | | 102 | |
| Other, net | 10 | | | 50 | |
| Changes in assets and liabilities: | | | |
| Trade accounts receivable | (126) | | | (1) | |
| Inventories | (210) | | | (175) | |
| Income taxes receivable and payables, net | (11) | | | (118) | |
| Other current and non-current assets | (181) | | | (387) | |
| Accounts payable and accrued expenses | 536 | | | 500 | |
| Other current and non-current liabilities | (15) | | | 192 | |
| Net change in operating assets and liabilities | (7) | | | 11 | |
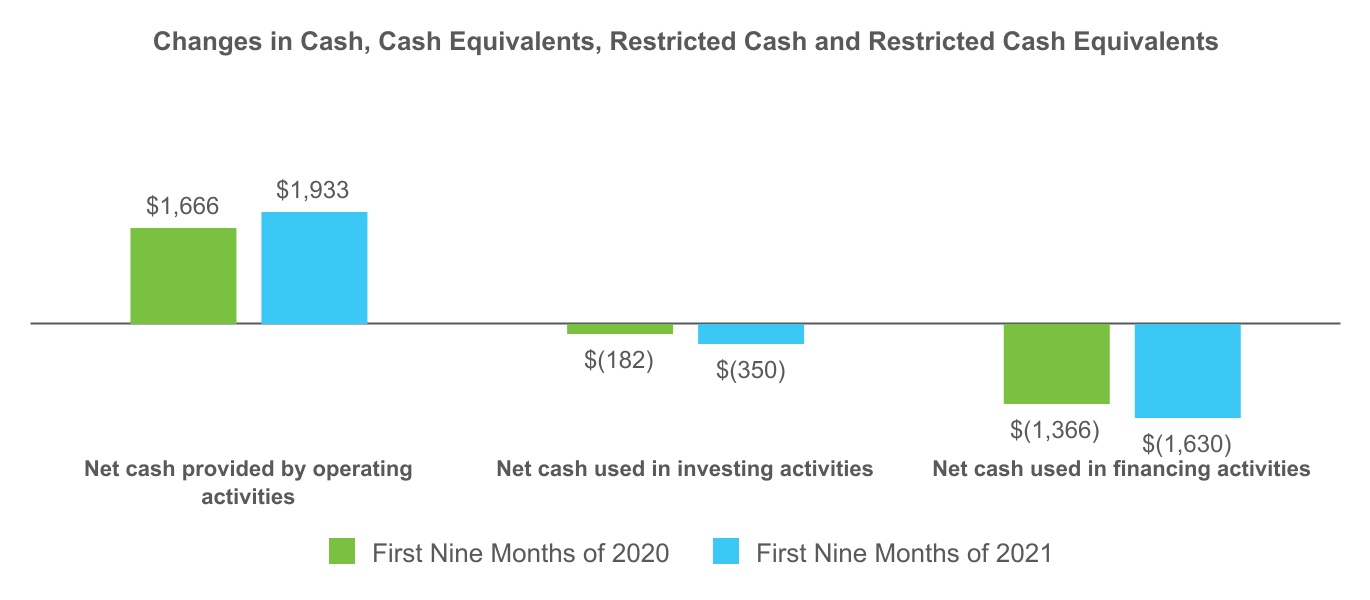
| Net cash provided by operating activities | 1,933 | | | 1,666 | |
| Investing activities: | | | |
| | | |
| | | |
| | | |
| Purchases of property, plant and equipment | (325) | | | (356) | |
| Proceeds from sales of property, plant and equipment | 18 | | | 203 | |
| Purchases of intangibles | (31) | | | (26) | |
| Issuance of related party note receivable | (17) | | | (6) | |
| Investments in unconsolidated affiliates | — | | | (4) | |
| Other, net | 5 | | | 7 | |
| Net cash used in investing activities | $ | (350) | | | $ | (182) | |
| | | |
| | | |
| | | |
| | | |
| | | |
| | | |
| | | |
| | | |
| | | |
| | | |
| | | |
| | | |
| | | |
| | | |
| | | |
| | | |
| | | |
| | | |
| | | |
| | | |
| | | |
| | | |
| | | |
| | | |
| | | |
| | | |
| | | |
| | | |
| | | |
The accompanying notes are an integral part of these unaudited condensed consolidated financial statements.
KEURIG DR PEPPER INC.
CONDENSED CONSOLIDATED STATEMENTS OF CASH FLOWS
(UNAUDITED, CONTINUED)
| | | | | | | | | | | |
| | First Nine Months |
| (in millions) | 2021 | | 2020 |
| Financing activities: | | | |
Proceeds from issuance of Notes | $ | 2,150 | | | $ | 1,500 | |
Repayments of Notes | (3,595) | | | (250) | |
| Proceeds from issuance of commercial paper | 4,756 | | | 6,843 | |
| Repayments of commercial paper | (3,758) | | | (7,754) | |
Proceeds from KDP Revolver | — | | | 1,850 | |
Repayments of KDP Revolver | — | | | (1,850) | |
| Proceeds from sale of stock by JAB | — | | | 29 | |
| | | |
Repayments of 2019 KDP Term Loan | (425) | | | (880) | |
| Proceeds from structured payables | 112 | | | 128 | |
| Repayments of structured payables | (123) | | | (290) | |
| Cash dividends paid | (687) | | | (635) | |
| Proceeds from issuance of common stock | 140 | | | — | |
| Tax withholdings related to net share settlements | (125) | | | — | |
| Payments on finance leases | (40) | | | (35) | |
| Other, net | (35) | | | (22) | |
| Net cash used in financing activities | (1,630) | | | (1,366) | |
| Cash, cash equivalents, restricted cash, and restricted cash equivalents: | | | |
| Net change from operating, investing and financing activities | (47) | | | 118 | |
| Effect of exchange rate changes | (5) | | | (11) | |
| Beginning balance | 255 | | | 111 | |
| Ending balance | $ | 203 | | | $ | 218 | |
| | | |
| Supplemental cash flow disclosures of non-cash investing activities: | | | |
| Capital expenditures included in accounts payable and accrued expenses | $ | 180 | | | $ | 255 | |
| Non-cash acquisition of controlling interest | — | | | 3 | |
| | | |
| Supplemental cash flow disclosures of non-cash financing activities: | | | |
| Dividends declared but not yet paid | 268 | | | 211 | |
| Finance lease additions | 309 | | | 30 | |
| Supplemental cash flow disclosures: | | | |
| Cash paid for interest | 284 | | | 250 | |
| Cash paid for income taxes | 408 | | | 448 | |
The accompanying notes are an integral part of these unaudited condensed consolidated financial statements.
KEURIG DR PEPPER INC.
CONDENSED CONSOLIDATED STATEMENT OF CHANGES IN STOCKHOLDERS' EQUITY
(UNAUDITED)
| | | | | | | | | | | | | | | | | | | | | | | | | | | | | | | | | | | | | | | | | | | | | | | |
| | Common Stock Issued | | Additional
Paid-In Capital | | Retained Earnings | | Accumulated Other Comprehensive Income (Loss) | | Total Stockholders' Equity | | Non-controlling Interest | | Total
Equity |
| (in millions, except per share data) | Shares | | Amount | | | | | | |
| Balance as of January 1, 2021 | 1,407.3 | | | $ | 14 | | | $ | 21,677 | | | $ | 2,061 | | | $ | 77 | | | $ | 23,829 | | | $ | 1 | | | $ | 23,830 | |
| Net income | — | | | — | | | — | | | 325 | | | — | | | 325 | | | — | | | 325 | |
| Other comprehensive income | — | | | — | | | — | | | — | | | 87 | | | 87 | | | — | | | 87 | |
Dividends declared, $0.15 per share | — | | | — | | | — | | | (212) | | | — | | | (212) | | | — | | | (212) | |
| Issuance of common stock | 4.3 | | | — | | | 140 | | | — | | | — | | | 140 | | | — | | | 140 | |
| Shares issued under employee stock-based compensation plans and other | 5.7 | | | — | | | — | | | — | | | — | | | — | | | — | | | — | |
| Stock-based compensation and stock options exercised | — | | | — | | | (99) | | | — | | | — | | | (99) | | | — | | | (99) | |
Balance as of March 31, 2021 | 1,417.3 | | | 14 | | | 21,718 | | | 2,174 | | | 164 | | | 24,070 | | | 1 | | | 24,071 | |
| Net income | — | | | — | | | — | | | 448 | | | — | | | 448 | | | — | | | 448 | |
| Other comprehensive income | — | | | — | | | — | | | — | | | (36) | | | (36) | | | — | | | (36) | |
Dividends declared, $0.1875 per share | — | | | — | | | — | | | (265) | | | — | | | (265) | | | — | | | (265) | |
| | | | | | | | | | | | | | | |
| Shares issued under employee stock-based compensation plans and other | 0.1 | | | — | | | — | | | — | | | — | | | — | | | — | | | — | |
| Stock-based compensation and stock options exercised | — | | | — | | | 25 | | | — | | | — | | | 25 | | | — | | | 25 | |
Balance as of June 30, 2021 | 1,417.4 | | | 14 | | | 21,743 | | | 2,357 | | | 128 | | | 24,242 | | | 1 | | | 24,243 | |
| Net income | — | | | — | | | — | | | 530 | | | — | | | 530 | | | (1) | | | 529 | |
| Other comprehensive income | — | | | — | | | — | | | — | | | (122) | | | (122) | | | — | | | (122) | |
Dividends declared, $0.1875 per share | — | | | — | | | — | | | (266) | | | — | | | (266) | | | — | | | (266) | |
| Shares issued under employee stock-based compensation plans and other | 0.5 | | | — | | | — | | | — | | | — | | | — | | | — | | | — | |
| Stock-based compensation and stock options exercised | — | | | — | | | 21 | | | — | | | — | | | 21 | | | — | | | 21 | |
Balance as of September 30, 2021 | 1,417.9 | | | $ | 14 | | | $ | 21,764 | | | $ | 2,621 | | | $ | 6 | | | $ | 24,405 | | | $ | — | | | $ | 24,405 | |
The accompanying notes are an integral part of these unaudited condensed consolidated financial statements.
KEURIG DR PEPPER INC.
CONDENSED CONSOLIDATED STATEMENT OF CHANGES IN STOCKHOLDERS' EQUITY
(UNAUDITED, CONTINUED)
| | | | | | | | | | | | | | | | | | | | | | | | | | | | | | | | | | | | | | | | | | | | | | | |
| | Common Stock Issued | | Additional
Paid-In Capital | | Retained Earnings | | Accumulated Other Comprehensive Income (Loss) | | Total Stockholders' Equity | | Non-controlling Interest | | Total Equity |
| (in millions, except per share data) | Shares | | Amount | | | | | | |
Balance as of January 1, 2020 | 1,406.8 | | | $ | 14 | | | $ | 21,557 | | | $ | 1,582 | | | $ | 104 | | | $ | 23,257 | | | $ | — | | | $ | 23,257 | |
| | | | | | | | | | | | | | | |
| Net income | — | | | — | | | — | | | 156 | | | — | | | 156 | | | — | | | 156 | |
| Other comprehensive loss | — | | | — | | | — | | | — | | | (584) | | | (584) | | | — | | | (584) | |
Dividends declared, $0.15 per share | — | | | — | | | — | | | (211) | | | — | | | (211) | | | — | | | (211) | |
| | | | | | | | | | | | | | | |
| Shares issued under stock-based compensation plans and other | 0.3 | | | — | | | — | | | — | | | — | | | — | | | — | | | — | |
| Stock-based compensation and stock options exercised | — | | | — | | | 22 | | | — | | | — | | | 22 | | | — | | | 22 | |
Balance as of March 31, 2020 | 1,407.1 | | | 14 | | | 21,579 | | | 1,527 | | | (480) | | | 22,640 | | | — | | | 22,640 | |
| Net income | — | | | — | | | — | | | 298 | | | — | | | 298 | | | — | | | 298 | |
| Other comprehensive income | — | | | — | | | — | | | — | | | 152 | | | 152 | | | — | | | 152 | |
Dividends declared, $0.15 per share | — | | | — | | | — | | | (212) | | | — | | | (212) | | | — | | | (212) | |
| Proceeds from sale of stock by JAB | — | | | — | | | 22 | | | — | | | — | | | 22 | | | — | | | 22 | |
| Shares issued under employee stock-based compensation plans and other | 0.1 | | | — | | | — | | | — | | | — | | | — | | | — | | | — | |
| Stock-based compensation and stock options exercised | — | | | — | | | 23 | | | — | | | — | | | 23 | | | — | | | 23 | |
Balance as of June 30, 2020 | 1,407.2 | | | 14 | | | 21,624 | | | 1,613 | | | (328) | | | 22,923 | | | — | | | 22,923 | |
| Net income | — | | | — | | | — | | | 443 | | | — | | | 443 | | | — | | | 443 | |
| Other comprehensive loss | — | | | — | | | — | | | — | | | 111 | | | 111 | | | — | | | 111 | |
Dividends declared, $0.15 per share | — | | | — | | | — | | | (211) | | | — | | | (211) | | | — | | | (211) | |
| Proceeds from sale of stock by JAB | — | | | — | | | 7 | | | — | | | — | | | 7 | | | — | | | 7 | |
| Non-cash acquisition of controlling interest | — | | | — | | | 3 | | | — | | | — | | | 3 | | | 1 | | | 4 | |
| Shares issued under employee stock-based compensation plans and other | 0.1 | | | — | | | — | | | — | | | — | | | — | | | — | | | — | |
| Stock-based compensation and stock options exercised | — | | | — | | | 20 | | | — | | | — | | | 20 | | | — | | | 20 | |
Balance as of September 30, 2020 | 1,407.3 | | | $ | 14 | | | $ | 21,654 | | | $ | 1,845 | | | $ | (217) | | | $ | 23,296 | | | $ | 1 | | | $ | 23,297 | |
The accompanying notes are an integral part of these unaudited condensed consolidated financial statements.
KEURIG DR PEPPER INC.
NOTES TO CONDENSED CONSOLIDATED FINANCIAL STATEMENTS
(UNAUDITED)
1. General
ORGANIZATION
References in this Quarterly Report on Form 10-Q to "KDP" or "the Company" refer to Keurig Dr Pepper Inc. and all entities included in the unaudited condensed consolidated financial statements. Definitions of terms used in this Quarterly Report on Form 10-Q are included within the Master Glossary.
This Quarterly Report on Form 10-Q refers to some of KDP's owned or licensed trademarks, trade names and service marks, which are referred to as the Company's brands. All of the product names included herein are either KDP registered trademarks or those of the Company's licensors.
BASIS OF PRESENTATION
The accompanying unaudited condensed consolidated financial statements have been prepared in accordance with U.S. GAAP for interim financial information and in accordance with the instructions to Form 10-Q and Article 10 of Regulation S-X. Accordingly, they do not include all of the information and footnotes required by U.S. GAAP for complete consolidated financial statements. In the opinion of management, all adjustments, consisting principally of normal recurring adjustments, considered necessary for a fair presentation have been included. These unaudited condensed consolidated financial statements should be read in conjunction with KDP's consolidated financial statements and accompanying notes, included in the Company's Annual Report.
Except as otherwise specified, references to the "third quarter" indicate the Company's quarterly periods ended September 30, 2021 and 2020.
PRINCIPLES OF CONSOLIDATION
KDP consolidates all wholly owned subsidiaries.
The Company consolidates investments in companies in which it holds the majority interest. In these cases, the third party equity interest is referred to as non-controlling interest. Non-controlling interest is presented as a separate component within equity in the unaudited Condensed Consolidated Balance Sheets, and net income attributable to the non-controlling interest is presented separately in the unaudited Condensed Consolidated Statements of Income.
The Company uses the equity method to account for investments in companies if the investment provides KDP with the ability to exercise significant influence over operating and financial policies of the investee. Consolidated net income includes KDP's proportionate share of the net income or loss of these companies. Judgment regarding the level of influence over each equity method investment includes considering key factors such as ownership interest, representation on the board of directors or similar governing body, participation in policy-making decisions and material intercompany transactions.
KDP eliminates from its financial results all intercompany transactions between entities included in the unaudited condensed consolidated financial statements.
USE OF ESTIMATES
The process of preparing KDP's unaudited condensed consolidated financial statements in conformity with U.S. GAAP requires the use of estimates and judgments that affect the reported amount of assets, liabilities, revenue and expenses. These estimates and judgments are based on historical experience, future expectations and other factors and assumptions the Company believes to be reasonable under the circumstances. These estimates and judgments are reviewed on an ongoing basis and are revised when necessary. Changes in estimates are recorded in the period of change. Actual amounts may differ from these estimates.
RECLASSIFICATIONS
KDP reclassified amounts in the Financing Activities section of the unaudited condensed consolidated Statement of Cash Flows for the first nine months of 2020 in order to conform to current year presentation. Refer to Note 2 for additional information about changes to the maturities of KDP’s commercial paper.
| | | | | | | | | | | | | | |
| (in millions) | | Prior Presentation | | First Nine Months of 2020 |
| Proceeds from commercial paper | | Net (repayment) issuance of commercial paper | | $ | 6,843 | |
| Repayments of commercial paper | | Net (repayment) issuance of commercial paper | | (7,754) | |
KEURIG DR PEPPER INC.
NOTES TO CONDENSED CONSOLIDATED FINANCIAL STATEMENTS
(UNAUDITED, CONTINUED)
RECENTLY ADOPTED PROVISIONS OF U.S. GAAP
As of January 1, 2021, the Company adopted ASU 2020-01, Investments—Equity Securities (Topic 321), Investments—Equity Method and Joint Ventures (Topic 323), and Derivatives and Hedging (Topic 815): Clarifying the Interactions between Topic 321, Topic 323, and Topic 815. The objective of the new standard is to clarify the interaction of the accounting for equity securities, investments accounted for under the equity method of accounting and the accounting for certain forward contracts and purchased options accounted for under different topics in U.S. GAAP. The adoption of the standard did not impact KDP's consolidated financial statements.
2. Long-term Obligations and Borrowing Arrangements
The following table summarizes the Company's long-term obligations:
| | | | | | | | | | | |
| (in millions) | September 30, 2021 | | December 31, 2020 |
Notes | $ | 11,727 | | | $ | 13,065 | |
| | | |
| Term loan | — | | | 423 | |
| Subtotal | 11,727 | | | 13,488 | |
| Less - current portion | — | | | (2,345) | |
| Long-term obligations | $ | 11,727 | | | $ | 11,143 | |
The following table summarizes the Company's short-term borrowings and current portion of long-term obligations:
| | | | | | | | | | | |
| (in millions) | September 30, 2021 | | December 31, 2020 |
| Commercial paper notes | $ | 998 | | | $ | — | |
| Revolving credit facilities | — | | | — | |
| Current portion of long-term obligations: | | | |
Notes | — | | | 2,246 | |
| Term loan | — | | | 99 | |
| Short-term borrowings and current portion of long-term obligations | $ | 998 | | | $ | 2,345 | |
KEURIG DR PEPPER INC.
NOTES TO CONDENSED CONSOLIDATED FINANCIAL STATEMENTS
(UNAUDITED, CONTINUED)
SENIOR UNSECURED NOTES
The Company's Notes consisted of the following:
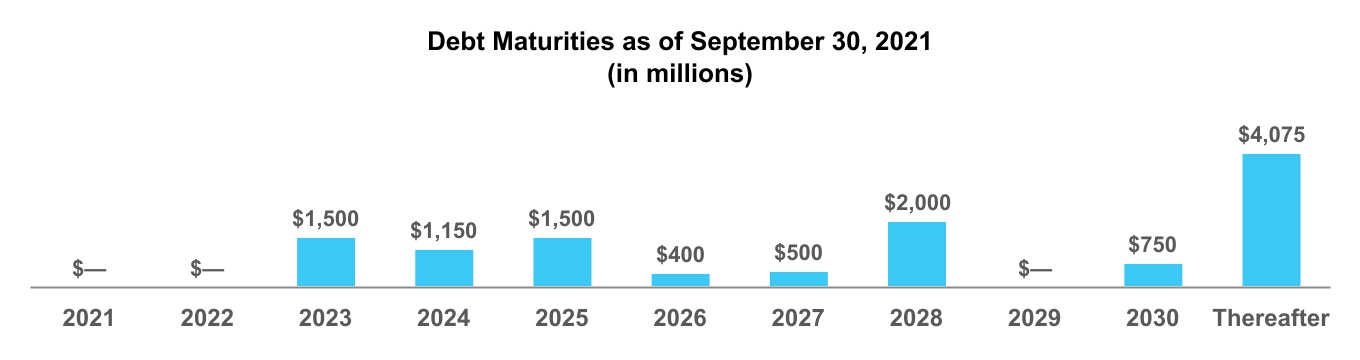
| | | | | | | | | | | | | | | | | | | | | | | | | | |
| (in millions, except %) | | | | | | | | |
| Issuance | | Maturity Date | | Rate | | September 30, 2021 | | December 31, 2020 |
| 2021 Merger Notes | | May 25, 2021 | | 3.551% | | $ | — | | | $ | 1,750 | |
| 2021-A Notes | | November 15, 2021 | | 3.200% | | — | | | 250 | |
| 2021-B Notes | | November 15, 2021 | | 2.530% | | — | | | 250 | |
| 2022 Notes | | November 15, 2022 | | 2.700% | | — | | | 250 | |
| 2023 Merger Notes | | May 25, 2023 | | 4.057% | | 1,000 | | | 2,000 | |
| 2023 Notes | | December 15, 2023 | | 3.130% | | 500 | | | 500 | |
2024 Notes(1) | | March 15, 2024 | | 0.750% | | 1,150 | | | — | |
| 2025 Merger Notes | | May 25, 2025 | | 4.417% | | 1,000 | | | 1,000 | |
| 2025 Notes | | November 15, 2025 | | 3.400% | | 500 | | | 500 | |
| 2026 Notes | | September 15, 2026 | | 2.550% | | 400 | | | 400 | |
| 2027 Notes | | June 15, 2027 | | 3.430% | | 500 | | | 500 | |
| 2028 Merger Notes | | May 25, 2028 | | 4.597% | | 2,000 | | | 2,000 | |
| 2030 Notes | | May 1, 2030 | | 3.200% | | 750 | | | 750 | |
| 2031 Notes | | March 15, 2031 | | 2.250% | | 500 | | | — | |
| 2038 Notes | | May 1, 2038 | | 7.450% | | 125 | | | 125 | |
| 2038 Merger Notes | | May 25, 2038 | | 4.985% | | 500 | | | 500 | |
| 2045 Notes | | November 15, 2045 | | 4.500% | | 550 | | | 550 | |
| 2046 Notes | | December 15, 2046 | | 4.420% | | 400 | | | 400 | |
| 2048 Merger Notes | | May 25, 2048 | | 5.085% | | 750 | | | 750 | |
| 2050 Notes | | May 1, 2050 | | 3.800% | | 750 | | | 750 | |
| 2051 Notes | | March 15, 2051 | | 3.350% | | 500 | | | — | |
| Principal amount | | | | | | $ | 11,875 | | | $ | 13,225 | |
Adjustment from principal amount to carrying amount(2) | | (148) | | | (160) | |
| Carrying amount | | | | | | $ | 11,727 | | | $ | 13,065 | |
(1)The 2024 Notes may be called anytime on or after March 15, 2022, in whole or in part, at the Company’s option, at a redemption price equal to 100% of the principal amount being redeemed, plus accrued and unpaid interest.
(2)The carrying amount includes unamortized discounts, debt issuance costs and fair value adjustments related to the DPS Merger.
On March 15, 2021, the Company completed the issuance of the 2024 Notes, the 2031 Notes, and the 2051 Notes. The discount associated with these notes was approximately $3 million and the Company incurred $13 million in debt issuance costs. The net proceeds from the issuance were used to repay the Company’s 2021-A Notes, 2021-B Notes, 2022 Notes, and approximately $1 billion of the 2023 Merger Notes, as well as to repay and terminate the 2019 KDP Term Loan as described below. As a result of the repayments of senior unsecured notes, the Company recorded losses on early extinguishment of debt of $104 million during the first quarter of 2021, comprised of a make-whole premium, fair market value adjustments and deferred financing fees written off.
On May 25, 2021, the Company repaid the 2021 Merger Notes at maturity using commercial paper.
KEURIG DR PEPPER INC.
NOTES TO CONDENSED CONSOLIDATED FINANCIAL STATEMENTS
(UNAUDITED, CONTINUED)
VARIABLE-RATE BORROWING ARRANGEMENTS
The KDP Credit Agreements consist of the following:
| | | | | | | | | | | | | | | | | | | | | | | | | | |
| (in millions) | | | | September 30, 2021 | | December 31, 2020 |
| Issuance | | Maturity Date | | Available Balances | | Carrying Value | | Carrying Value |
| 2019 KDP Term Loan | | February 8, 2023 | | $ | — | | | $ | — | | | $ | 425 | |
KDP Revolver(1) | | February 28, 2023 | | 2,400 | | | — | | | — | |
| 2020 364-Day Credit Agreement | | April 13, 2021 | | — | | | — | | | |
| 2021 364-Day Credit Agreement | | March 23, 2022 | | 1,500 | | | — | | | — | |
| Principal amount | | | | | | $ | — | | | $ | 425 | |
Unamortized discounts and debt issuance costs | | | — | | | (2) | |
| Carrying amount | | | | | | $ | — | | | $ | 423 | |
(1)The KDP Revolver has $200 million letters of credit availability and none utilized as of September 30, 2021.
As of September 30, 2021, KDP was in compliance with all financial covenant requirements relating to the KDP Credit Agreements.
2019 KDP Term Loan
In March 2021, KDP voluntarily prepaid and terminated the 2019 KDP Term Loan using proceeds from the aforementioned issuance of senior unsecured notes, which resulted in $1 million of loss on early extinguishment of debt for the first nine months of 2021.
364-Day Credit Agreements
In March 2021, KDP terminated its 2020 364-Day Credit Agreement, which was originally available through April 2021. No amounts were drawn under the 2020 364-Day Credit Agreement prior to termination.
KDP then entered into the 2021 364-Day Credit Agreement on March 24, 2021 among KDP, the banks party thereto and Bank of America, N.A. as administrative agent, pursuant to which KDP obtained a $1,500 million commitment. The interest rate applicable to borrowings under the 2021 364-Day Credit Agreement ranges from a rate equal to LIBOR plus a margin of 1.000% to 1.625% or a base rate plus a margin of 0.000% to 0.625%, depending on the rating of certain index debt of the Company. The 2021 364-Day Credit Agreement matures on March 23, 2022, and includes a term-out option which allows KDP to extend any outstanding amounts borrowed under the agreement for one year for a fee of 0.750% on the amounts borrowed.
Commercial Paper Program
The following table provides information about the Company's borrowings under its commercial paper program:
| | | | | | | | | | | | | | | | | | | | | | | |
| Third Quarter | | First Nine Months |
| (in millions, except %) | 2021 | | 2020 | | 2021 | | 2020 |
| Weighted average commercial paper borrowings | $ | 1,398 | | | $ | 597 | | | $ | 781 | | | $ | 919 | |
| Weighted average borrowing rates | 0.26 | % | | 0.31 | % | | 0.26 | % | | 1.38 | % |
In April 2021, KDP began issuing commercial paper notes with maturities greater than 90 days. KDP continues to classify its commercial paper notes as short-term, as maturities do not exceed one year.
Letter of Credit Facility
In addition to the portion of the KDP Revolver reserved for issuance of letters of credit, KDP has an incremental letter of credit facility. Under this facility, $100 million is available for the issuance of letters of credit, $44 million of which was utilized as of September 30, 2021 and $56 million of which remains available for use.
FAIR VALUE DISCLOSURES
The fair values of KDP's commercial paper approximate the carrying value and are considered Level 2 within the fair value hierarchy.
The fair values of KDP's Notes are based on current market rates available to KDP and are considered Level 2 within the fair value hierarchy. The difference between the fair value and the carrying value represents the theoretical net premium or discount that would be paid or received to retire all the Notes and related unamortized costs to be incurred at such date. The fair value of KDP's Notes was $13,268 million and $15,274 million as of September 30, 2021 and December 31, 2020, respectively.
KEURIG DR PEPPER INC.
NOTES TO CONDENSED CONSOLIDATED FINANCIAL STATEMENTS
(UNAUDITED, CONTINUED)
3. Goodwill and Other Intangible Assets
GOODWILL
Changes in the carrying amount of goodwill by reportable segment are as follows:
| | | | | | | | | | | | | | | | | | | | | | | | | | | | | | | |
| (in millions) | Coffee Systems | | Packaged Beverages | | Beverage Concentrates | | Latin America Beverages | | | | Total |
| Balance as of January 1, 2021 | $ | 9,795 | | | $ | 5,314 | | | $ | 4,536 | | | $ | 539 | | | | | $ | 20,184 | |
| Foreign currency translation | 19 | | | 3 | | | 2 | | | (15) | | | | | 9 | |
| | | | | | | | | | | |
| Balance as of September 30, 2021 | $ | 9,814 | | | $ | 5,317 | | | $ | 4,538 | | | $ | 524 | | | | | $ | 20,193 | |
INTANGIBLE ASSETS OTHER THAN GOODWILL
The net carrying amounts of intangible assets other than goodwill with indefinite lives are as follows:
| | | | | | | | | | | | | | |
| (in millions) | | September 30, 2021 | | December 31, 2020 |
Brands(1) | | $ | 19,858 | | | $ | 19,874 | |
| Trade names | | 2,480 | | | 2,480 | |
| Contractual arrangements | | 123 | | | 123 | |
Distribution rights(2) | | 85 | | | 57 | |
| Total | | $ | 22,546 | | | $ | 22,534 | |
(1)The decrease of $16 million in brands with indefinite lives was due to foreign currency translation during the first nine months of 2021.
(2)The Company executed nine agreements to acquire distribution rights during the first nine months of 2021, which resulted in an increase of $28 million.
The net carrying amounts of intangible assets other than goodwill with definite lives are as follows:
| | | | | | | | | | | | | | | | | | | | | | | | | | | | | | | | | | | |
| September 30, 2021 | | December 31, 2020 |
| (in millions) | Gross Amount | | Accumulated Amortization | | Net Amount | | Gross Amount | | Accumulated Amortization | | Net Amount |
| Acquired technology | $ | 1,146 | | | $ | (383) | | | $ | 763 | | | $ | 1,146 | | | $ | (328) | | | $ | 818 | |
| Customer relationships | 638 | | | (160) | | | 478 | | | 638 | | | (135) | | | 503 | |
| Trade names | 128 | | | (82) | | | 46 | | | 127 | | | (69) | | | 58 | |
| Contractual arrangements | 24 | | | (7) | | | 17 | | | 24 | | | (5) | | | 19 | |
| Brands | 21 | | | (7) | | | 14 | | | 21 | | | (5) | | | 16 | |
| Distribution rights | 29 | | | (10) | | | 19 | | | 26 | | | (6) | | | 20 | |
| Total | $ | 1,986 | | | $ | (649) | | | $ | 1,337 | | | $ | 1,982 | | | $ | (548) | | | $ | 1,434 | |
Amortization expense for intangible assets with definite lives was as follows:
| | | | | | | | | | | | | | | | | | | | | | | |
| | Third Quarter | | First Nine Months |
| (in millions) | 2021 | | 2020 | | 2021 | | 2020 |
| Amortization expense | $ | 34 | | | $ | 34 | | | $ | 101 | | | $ | 100 | |
Amortization expense of these intangible assets over the remainder of 2021 and the next five years is expected to be as follows:
| | | | | | | | | | | | | | | | | | | | | | | | | | | | | | | | | | | |
| Remainder of 2021 | | For the Years Ending December 31, |
| (in millions) | | 2022 | | 2023 | | 2024 | | 2025 | | 2026 |
| Expected amortization expense | $ | 34 | | | $ | 134 | | | $ | 132 | | | $ | 124 | | | $ | 109 | | | $ | 105 | |
KEURIG DR PEPPER INC.
NOTES TO CONDENSED CONSOLIDATED FINANCIAL STATEMENTS
(UNAUDITED, CONTINUED)
IMPAIRMENT TESTING
KDP conducts impairment tests on goodwill and all indefinite lived intangible assets annually, or more frequently if circumstances indicate that the carrying amount of an asset may not be recoverable. As a result of the changes to the Company’s operating segments effective January 1, 2021, as described in Note 7, which resulted in a change to the Company’s reporting units, management performed a step zero analysis as of the effective date of the goodwill for the impacted reporting units. The Company also performed an analysis as of September 30, 2021 to ensure that there were no additional triggering events which occurred during the quarter. As a result of these analyses, management did not identify any indications that the carrying amount of any goodwill or any intangible asset may not be recoverable.
4. Restructuring and Integration Costs
The Company implements restructuring programs from time to time and incurs costs that are designed to improve operating effectiveness and lower costs. When the Company implements these programs, the Company incurs expenses, such as employee separations, lease terminations and other direct exit costs, that qualify as exit and disposal costs under U.S. GAAP.
The Company also incurs expenses that are an integral component of, and directly attributable to, its restructuring activities, which do not qualify as exit and disposal costs, such as accelerated depreciation, asset impairments, implementation costs and other incremental costs. These costs are primarily recorded within SG&A expenses on the income statement and are held primarily within unallocated corporate costs.
DPS INTEGRATION PROGRAM
As part of the DPS Merger, the Company developed a program to deliver $600 million in synergies over a three-year period through supply chain optimization, reduction of indirect spend through new economies of scale, elimination of duplicative support functions and advertising and promotion optimization. The Company expects to incur total cash expenditures of $750 million, comprised of both capital expenditures and expense, and expects to complete the program in 2021. The restructuring and integration program resulted in cumulative pre-tax charges of approximately $732 million, primarily consisting of professional fees related to the integration and transformation and costs associated with severance and employee terminations, through September 30, 2021. Restructuring and integration charges on the DPS Integration Program were as follows:
| | | | | | | | | | | | | | | | | | | | | | | |
| Third Quarter | | First Nine Months |
| (in millions) | 2021 | | 2020 | | 2021 | | 2020 |
| Restructuring and integration charges | $ | 53 | | | $ | 38 | | | $ | 145 | | | $ | 143 | |
Restructuring liabilities that qualify as exit and disposal costs under U.S. GAAP are included in accounts payable and accrued expenses on the unaudited condensed consolidated financial statements. Restructuring liabilities for the DPS Integration Program, all of which were workforce reduction costs, were as follows for the period presented:
| | | | | | | | | |
| (in millions) | Restructuring Liabilities | | | | |
| Balance as of January 1, 2021 | $ | 14 | | | | | |
Charges to expense | 30 | | | | | |
Cash payments | (25) | | | | | |
| | | | | |
| Balance as of September 30, 2021 | $ | 19 | | | | | |
KEURIG DR PEPPER INC.
NOTES TO CONDENSED CONSOLIDATED FINANCIAL STATEMENTS
(UNAUDITED, CONTINUED)
5. Derivatives
KDP is exposed to market risks arising from adverse changes in interest rates, commodity prices, and FX rates. KDP manages these risks through a variety of strategies, including the use of interest rate contracts, FX forward contracts, commodity forward, future, swap and option contracts and supplier pricing agreements. KDP does not hold or issue derivative financial instruments for trading or speculative purposes.
KDP formally designates and accounts for certain foreign exchange forward contracts and interest rate contracts that meet established accounting criteria under U.S. GAAP as cash flow hedges. For such contracts, the effective portion of the gain or loss on the derivative instruments is recorded, net of applicable taxes, in AOCI. When net income is affected by the variability of the underlying transaction, the applicable offsetting amount of the gain or loss from the derivative instrument deferred in AOCI is reclassified to net income. Cash flows from derivative instruments designated in a qualifying hedging relationship are classified in the same category as the cash flows from the hedged items. If a cash flow hedge were to cease to qualify for hedge accounting, or were terminated, the derivatives would continue to be carried on the balance sheet at fair value until settled, and hedge accounting would be discontinued prospectively. If the underlying hedged transaction ceases to exist, any associated amounts reported in AOCI would be reclassified to earnings at that time.
For derivatives that are not designated or for which the designated hedging relationship is discontinued, the gain or loss on the instrument is recognized in earnings in the period of change.
The Company has exposure to credit losses from derivative instruments in an asset position in the event of nonperformance by the counterparties to the agreements. Historically, the Company has not experienced material credit losses as a result of counterparty nonperformance. The Company selects and periodically reviews counterparties based on credit ratings, limits its exposure to a single counterparty under defined guidelines and monitors the market position of the programs upon execution of a hedging transaction and at least on a quarterly basis.
INTEREST RATES
Economic Hedges
KDP is exposed to interest rate risk related to its borrowing arrangements and obligations. The Company enters into interest rate swaps to provide predictability in the Company's overall cost structure and to manage the balance of fixed-rate and variable-rate debt. KDP primarily enters into receive-fixed, pay-variable and receive-variable, pay-fixed swaps and swaption contracts. A natural hedging relationship exists in which changes in the fair value of the instruments act as an economic offset to changes in the fair value of the underlying items. Changes in the fair value of these instruments are recorded in earnings throughout the term of the derivative instrument and are reported in interest expense in the unaudited Condensed Consolidated Statements of Income. As of September 30, 2021, economic interest rate derivative instruments have maturities ranging from December 2021 to May 2028.
Cash Flow Hedges
In order to hedge the variability in cash flows from interest rate changes associated with the Company’s planned future issuances of long-term debt, during the first quarter of 2021, the Company entered into forward starting swaps and designated them as cash flow hedges. The forward starting swaps are planned to be unwound at the issuance of long-term debt. As of September 30, 2021, the forward starting swaps have mandatory termination dates ranging from June 2022 to May 2025.
FOREIGN EXCHANGE
KDP is exposed to foreign exchange risk in its international subsidiaries, which may transact in currencies that are different from the functional currencies of those subsidiaries. The balance sheets of each of these businesses are also subject to exposure from movements in exchange rates.
Economic Hedges
During the third quarter and first nine months of 2021 and 2020, KDP held FX forward contracts to economically manage the balance sheet exposures resulting from changes in the FX exchange rates described above. The intent of these FX contracts is to minimize the impact of FX risk associated with balance sheet positions not in local currency. In these cases, a hedging relationship exists in which changes in the fair value of the instruments act as an economic offset to changes in the fair value of the underlying items. Changes in the fair value of these instruments are recorded in earnings throughout the term of the derivative instrument and are reported in the same caption of the unaudited Condensed Consolidated Statements of Income as the associated risk. As of September 30, 2021, these FX contracts have maturities ranging from October 2021 to September 2024.
KEURIG DR PEPPER INC.
NOTES TO CONDENSED CONSOLIDATED FINANCIAL STATEMENTS
(UNAUDITED, CONTINUED)
Cash Flow Hedges
During 2020, KDP began to designate certain FX forward contracts related to inventory purchases of the Canadian and Mexican businesses as cash flow hedges in order to manage the exposures resulting from changes in the FX rates described above. The intent of these FX contracts is to provide predictability in the Company's overall cost structure. As of September 30, 2021, these FX contracts have maturities ranging from October 2021 to March 2023.
COMMODITIES
Economic Hedges
KDP centrally manages the exposure to volatility in the prices of certain commodities used in its production process and transportation through various derivative contracts. During the third quarter and first nine months of 2021 and 2020, the Company held forward, future, swap and option contracts that economically hedged certain of its risks. In these cases, a hedging relationship exists in which changes in the fair value of the instruments act as an economic offset to changes in the fair value of the underlying items. Changes in the fair value of these instruments are recorded in earnings throughout the term of the derivative instrument and are reported in the same line item of the unaudited Condensed Consolidated Statements of Income as the hedged transaction. Unrealized gains and losses are recognized as a component of unallocated corporate costs until the Company's operating segments are affected by the completion of the underlying transaction, at which time the gain or loss is reflected as a component of the respective segment's income from operations. As of September 30, 2021, these commodity contracts have maturities ranging from October 2021 to February 2023.
NOTIONAL AMOUNTS OF DERIVATIVE INSTRUMENTS
The following table presents the notional amounts of KDP's outstanding derivative instruments by type:
| | | | | | | | | | | |
| (in millions) | September 30, 2021 | | December 31, 2020 |
| Interest rate contracts | | | |
| Forward starting swaps, designated as cash flow hedges | $ | 2,500 | | | $ | — | |
| Receive-variable, pay-fixed interest rate swaps, not designated as hedging instruments | 450 | | | 450 | |
| Receive-fixed, pay-variable interest rate swaps, not designated as hedging instruments | 250 | | | — | |
| Swaptions, not designated as hedging instruments | 1,500 | | | — | |
| FX contracts | | | |
| Forward contracts, not designated as hedging instruments | 499 | | | 476 | |
| Forward contracts, designated as cash flow hedges | 380 | | | 333 | |
| Commodity contracts, not designated as hedging instruments | 440 | | | 450 | |
FAIR VALUE OF DERIVATIVE INSTRUMENTS
The fair values of commodity contracts, interest rate contracts and FX forward contracts are determined based on inputs that are readily available in public markets or can be derived from information available in publicly quoted markets. The fair value of commodity contracts are valued using the market approach based on observable market transactions, primarily underlying commodities futures or physical index prices, at the reporting date. Interest rate contracts are valued using models based primarily on readily observable market parameters, such as LIBOR forward rates, for all substantial terms of the Company's contracts and credit risk of the counterparties. The fair value of FX forward contracts are valued using quoted forward FX prices at the reporting date. Therefore, the Company has categorized these contracts as Level 2.
KEURIG DR PEPPER INC.
NOTES TO CONDENSED CONSOLIDATED FINANCIAL STATEMENTS
(UNAUDITED, CONTINUED)
Not Designated as Hedging Instruments
The following table summarizes the location of the fair value of the Company's derivative instruments which are not designated as hedging instruments within the unaudited Condensed Consolidated Balance Sheets. All such instruments are designated level 2 within the fair value hierarchy.
| | | | | | | | | | | | | | | | | |
| (in millions) | Balance Sheet Location | | September 30, 2021 | | December 31, 2020 |
| Assets: | | | | | |
| Interest rate contracts | Prepaid expenses and other current assets | | $ | 2 | | | $ | — | |
| FX contracts | Prepaid expenses and other current assets | | 2 | | | — | |
| Commodity contracts | Prepaid expenses and other current assets | | 144 | | | 45 | |
| Interest rate contracts | Other non-current assets | | 2 | | | — | |
| | | | | |
| Commodity contracts | Other non-current assets | | 15 | | | 12 | |
| | | | | |
| Liabilities: | | | | | |
| Interest rate contracts | Other current liabilities | | $ | 4 | | | $ | 2 | |
| FX contracts | Other current liabilities | | 2 | | | 6 | |
| Commodity contracts | Other current liabilities | | 25 | | | 5 | |
| Interest rate contracts | Other non-current liabilities | | 1 | | | 7 | |
| FX contracts | Other non-current liabilities | | 13 | | | 9 | |
| Commodity contracts | Other non-current liabilities | | 1 | | | 2 | |
Designated as Hedging Instruments
The following table summarizes the location of the fair value of the Company's derivative instruments which are designated as hedging instruments within the unaudited Condensed Consolidated Balance Sheets. All such instruments are designated level 2 within the fair value hierarchy.
| | | | | | | | | | | | | | | | | |
| (in millions) | Balance Sheet Location | | September 30, 2021 | | December 31, 2020 |
| Assets: | | | | | |
| FX contracts | Prepaid expenses and other current assets | | $ | 4 | | | $ | — | |
| FX contracts | Other non-current assets | | 1 | | | — | |
| Interest rate contracts | Prepaid expenses and other current assets | | 1 | | | — | |
| | | | | |
| | | | | |
| Liabilities: | | | | | |
| FX contracts | Other current liabilities | | $ | 3 | | | $ | 12 | |
| | | | | |
| | | | | |
| Interest rate contracts | Other non-current liabilities | | 99 | | | — | |
IMPACT OF DERIVATIVE INSTRUMENTS NOT DESIGNATED AS HEDGING INSTRUMENTS
The following table presents the amount of (gains) losses, net, recognized in the unaudited Condensed Consolidated Statements of Income related to derivative instruments not designated as hedging instruments under U.S. GAAP during the periods presented. Amounts include both realized and unrealized gains and losses.
| | | | | | | | | | | | | | | | | | | | | | | | | | | | | |
| | | | Third Quarter | | First Nine Months |
| (in millions) | Income Statement Location | | 2021 | | 2020 | | 2021 | | 2020 |
| Interest rate contracts | Interest expense | | $ | (7) | | | $ | — | | | $ | (20) | | | $ | 9 | |
| FX contracts | Cost of sales | | (4) | | | 5 | | | 5 | | | (15) | |
| FX contracts | Other expense (income), net | | (7) | | | 7 | | | 4 | | | (5) | |
| Commodity contracts | Cost of sales | | (71) | | | (45) | | | (127) | | | 6 | |
| Commodity contracts | SG&A expenses | | — | | | 5 | | | (56) | | | 41 | |
| | | | | | | | | |
KEURIG DR PEPPER INC.
NOTES TO CONDENSED CONSOLIDATED FINANCIAL STATEMENTS
(UNAUDITED, CONTINUED)
IMPACT OF CASH FLOW HEDGES
The following table presents the amount of (gains) losses, net, reclassified from AOCI into the unaudited Condensed Consolidated Statements of Income related to derivative instruments designated as cash flow hedging instruments during the periods presented:
| | | | | | | | | | | | | | | | | | | | | | | | | | | | | |
| | | Third Quarter | | First Nine Months |
| (in millions) | Income Statement Location | | 2021 | | 2020 | | 2021 | | 2020 |
| Interest rate contracts | Interest expense | | $ | — | | | $ | — | | | $ | — | | | $ | — | |
| FX contracts | Cost of sales | | 6 | | | (1) | | | 15 | | | (2) | |
KDP expects to reclassify approximately $3 million of pre-tax net losses from AOCI into net income during the next twelve months related to its FX contracts. KDP expects to reclassify $1 million of pre-tax net losses from AOCI into net income during the next twelve months related to its interest rate contracts.
6. Leases
KDP leases certain facilities and machinery and equipment, including fleet. These leases expire at various dates through 2044. Some lease agreements contain standard renewal provisions that allow the Company to renew the lease at rates equivalent to fair market value at the end of the lease term. KDP has lease agreements with lease and non-lease components, which are generally accounted for as a single lease component.
KDP's lease agreements do not contain any material residual value guarantees or restrictive covenants, except for leases of certain manufacturing properties and of our Frisco headquarters, which contain residual value guarantees at the end of the respective lease terms that approximate a percentage of the cost of the asset as of the inception of the lease. The Company considers the possibility of incurring costs associated with the residual value guarantees to be remote.
The following table presents the components of lease cost:
| | | | | | | | | | | | | | | | | | | | | | | |
| | Third Quarter | | First Nine Months |
| (in millions) | 2021 | | 2020 | | 2021 | | 2020 |
| Operating lease cost | $ | 29 | | | $ | 28 | | | $ | 92 | | | $ | 84 | |
| Finance lease cost | | | | | | | |
| Amortization of right-of-use assets | 15 | | | 12 | | | 45 | | | 34 | |
| Interest on lease liabilities | 5 | | | 3 | | | 12 | | | 10 | |
Variable lease cost(1) | 8 | | | 6 | | | 23 | | | 19 | |
| Short-term lease cost | — | | | — | | | — | | | 1 | |
| Sublease income | — | | | — | | | (1) | | | (1) | |
| Total lease cost | $ | 57 | | | $ | 49 | | | $ | 171 | | | $ | 147 | |
(1)Variable lease cost primarily consists of common area maintenance costs, property taxes, and adjustments for inflation.
The following table presents supplemental cash flow information about the Company's leases:
| | | | | | | | | | | |
| First Nine Months |
| (in millions) | 2021 | | 2020 |
| Cash paid for amounts included in the measurement of lease liabilities: | | | |
| Operating cash flows from operating leases | $ | 84 | | | $ | 75 | |
| Operating cash flows from finance leases | 12 | | | 11 | |
| Financing cash flows from finance leases | 40 | | | 35 | |
KEURIG DR PEPPER INC.
NOTES TO CONDENSED CONSOLIDATED FINANCIAL STATEMENTS
(UNAUDITED, CONTINUED)
The following table presents information about the Company's weighted average discount rate and remaining lease term:
| | | | | | | | | | | |
| September 30, 2021 | | December 31, 2020 |
| Weighted average discount rate | | | |
| Operating leases | 4.2 | % | | 4.3 | % |
| Finance leases | 4.0 | % | | 4.4 | % |
| Weighted average remaining lease term | | | |
| Operating leases | 11 years | | 12 years |
| Finance leases | 11 years | | 11 years |
Future minimum lease payments for non-cancellable leases that have commenced and are reflected on the unaudited Condensed Consolidated Balance Sheets as of September 30, 2021 were as follows:
| | | | | | | | | | | |
| (in millions) | Operating Leases | | Finance Leases |
| Remainder of 2021 | $ | 20 | | | $ | 18 | |
| 2022 | 96 | | | 89 | |
| 2023 | 83 | | | 88 | |
| 2024 | 79 | | | 83 | |
| 2025 | 71 | | | 79 | |
| 2026 | 60 | | | 101 | |
| Thereafter | 387 | | | 281 | |
| Total future minimum lease payments | 796 | | | 739 | |
| Less: imputed interest | (158) | | | (128) | |
| Present value of minimum lease payments | $ | 638 | | | $ | 611 | |
SIGNIFICANT LEASES THAT HAVE NOT YET COMMENCED
As of September 30, 2021, the Company has entered into leases that have not yet commenced with estimated aggregated future lease payments of approximately $296 million. These leases are expected to commence between the fourth quarter of 2021 and the third quarter of 2022, with initial lease terms ranging from 5 years to 10 years.
KEURIG DR PEPPER INC.
NOTES TO CONDENSED CONSOLIDATED FINANCIAL STATEMENTS
(UNAUDITED, CONTINUED)
7. Segments
Effective January 1, 2021, the Company modified its internal reporting and operating segments to reflect changes in the executive leadership team to further enhance speed-to-market and decision effectiveness. These modifications did not change the Company’s reportable segments. The Company's reportable segments consist of the following:
•The Coffee Systems segment reflects sales in the U.S. and Canada of the manufacture and distribution of finished goods relating to the Company's coffee system, K-Cup pods and brewers.
•The Packaged Beverages segment reflects sales in the U.S. and Canada from the manufacture and distribution of finished beverages and other products, including sales of the Company's own brands and third-party brands, through both the DSD and WD systems. DSD and WD have both been identified as operating segments that the Company aggregated into Packaged Beverages due to similar economic characteristics and similarities in the nature of finished goods sales and route-to-markets.
•The Beverage Concentrates segment reflects sales of the Company's branded concentrates and syrup to third-party bottlers primarily in the U.S. and Canada. Most of the brands in this segment are carbonated soft drink brands. Our FFS operating segment is aggregated with our Branded Concentrates operating segment into our Beverage Concentrates reportable segment due to similar economic characteristics and similarities in the nature of the product sold.
•The Latin America Beverages segment reflects sales primarily in Mexico and the Caribbean from the manufacture and distribution of concentrates, syrup and finished beverages.
Segment results are based on management reports. Net sales and income from operations are the significant financial measures used to assess the operating performance of the Company's operating segments. Intersegment sales are recorded at cost and are eliminated in the unaudited Condensed Consolidated Statements of Income. “Unallocated corporate costs” are excluded from the Company's measurement of segment performance and include unrealized commodity derivative gains and losses, and certain general corporate expenses.
Information about the Company's operations by reportable segment is as follows:
| | | | | | | | | | | | | | | | | | | | | | | |
| | Third Quarter | | First Nine Months |
| (in millions) | 2021 | | 2020 | | 2021 | | 2020 |
| Segment Results – Net sales | | | | | | | |
| Coffee Systems | $ | 1,155 | | | $ | 1,097 | | | $ | 3,398 | | | $ | 3,113 | |
| Packaged Beverages | 1,547 | | | 1,447 | | | 4,352 | | | 4,056 | |
| Beverage Concentrates | 392 | | | 352 | | | 1,095 | | | 967 | |
| Latin America Beverages | 156 | | | 124 | | | 447 | | | 361 | |
| Net sales | $ | 3,250 | | | $ | 3,020 | | | $ | 9,292 | | | $ | 8,497 | |
| | | | | | | | | | | | | | | | | | | | | | | |
| | Third Quarter | | First Nine Months |
| (in millions) | 2021 | | 2020 | | 2021 | | 2020 |
| Segment Results – Income from operations | | | | | | | |
| Coffee Systems | $ | 334 | | | $ | 320 | | | $ | 992 | | | $ | 882 | |
| Packaged Beverages | 288 | | | 260 | | | 721 | | | 657 | |
| Beverage Concentrates | 286 | | | 262 | | | 778 | | | 679 | |
| Latin America Beverages | 37 | | | 25 | | | 95 | | | 73 | |
| Unallocated corporate costs | (150) | | | (114) | | | (417) | | | (511) | |
| Income from operations | $ | 795 | | | $ | 753 | | | $ | 2,169 | | | $ | 1,780 | |
KEURIG DR PEPPER INC.
NOTES TO CONDENSED CONSOLIDATED FINANCIAL STATEMENTS
(UNAUDITED, CONTINUED)
8. Earnings Per Share
The following table presents the Company's basic and diluted EPS and shares outstanding. Anti-dilutive stock-based awards excluded from the calculations of diluted EPS were immaterial during the periods presented.
| | | | | | | | | | | | | | | | | | | | | | | |
| | Third Quarter | | First Nine Months |
| (in millions, except per share data) | 2021 | | 2020 | | 2021 | | 2020 |
| Net income attributable to KDP | $ | 530 | | | $ | 443 | | | $ | 1,303 | | | $ | 897 | |
| | | | | | | |
| Weighted average common shares outstanding | 1,417.6 | | | 1,407.3 | | | 1,414.9 | | | 1,407.2 | |
| Dilutive effect of stock-based awards | 10.9 | | | 15.6 | | | 12.6 | | | 14.3 | |
| Weighted average common shares outstanding and common stock equivalents | 1,428.5 | | | 1,422.9 | | | 1,427.5 | | | 1,421.5 | |
| | | | | | | |
| Basic EPS | $ | 0.37 | | | $ | 0.31 | | | $ | 0.92 | | | $ | 0.64 | |
| Diluted EPS | 0.37 | | | 0.31 | | | 0.91 | | | 0.63 | |
9. Stock-Based Compensation
Stock-based compensation expense is recorded in SG&A expenses in the unaudited Condensed Consolidated Statements of Income. The components of stock-based compensation expense are presented below:
| | | | | | | | | | | | | | | | | | | | | | | |
| Third Quarter | | First Nine Months |
| (in millions) | 2021 | | 2020 | | 2021 | | 2020 |
| Total stock-based compensation expense | $ | 20 | | | $ | 20 | | | $ | 68 | | | $ | 62 | |
| Income tax benefit | (4) | | | (3) | | | (12) | | | (11) | |
| Stock-based compensation expense, net of tax | $ | 16 | | | $ | 17 | | | $ | 56 | | | $ | 51 | |
RESTRICTED SHARE UNITS
The table below summarizes RSU activity:
| | | | | | | | | | | | | | | | | | | | | | | |
| | RSUs | | Weighted Average Grant Date Fair Value | | Weighted Average Remaining Contractual Term (Years) | | Aggregate Intrinsic Value (in millions) |
| Outstanding as of December 31, 2020 | 26,688,304 | | | $ | 19.66 | | | 2.0 | | $ | 854 | |
| Granted | 4,458,353 | | | 28.68 | | | | | |
| Vested and released | (9,799,213) | | | 10.76 | | | | | 330 | |
| Forfeited | (1,910,582) | | | 25.43 | | | | | |
| Outstanding as of September 30, 2021 | 19,436,862 | | | $ | 25.64 | | | 2.4 | | $ | 664 | |
As of September 30, 2021, there was $318 million of unrecognized compensation cost related to unvested RSUs that is expected to be recognized over a weighted average period of 2.3 years.
Total payments for the employees' tax obligations to the relevant taxing authorities were $125 million for the first nine months of 2021, which were funded through the issuance of shares in at-the-market offerings, known as an ATM program. There were no such payments made during the first nine months of 2020. This payment is reflected as a financing activity within the unaudited Condensed Consolidated Statements of Cash Flows.
KEURIG DR PEPPER INC.
NOTES TO CONDENSED CONSOLIDATED FINANCIAL STATEMENTS
(UNAUDITED, CONTINUED)
10. Revenue Recognition
KDP recognizes revenue when obligations under the terms of a contract with the customer are satisfied. Branded product sales, which include CSDs, NCBs, K-Cup pods and appliances, occur once control is transferred upon delivery to the customer. Revenue is measured as the amount of consideration that KDP expects to receive in exchange for transferring goods. The amount of consideration KDP receives and revenue KDP recognizes varies with changes in customer incentives that KDP offers to its customers and their customers. Sales taxes and other similar taxes are excluded from revenue. Costs associated with shipping and handling activities, such as merchandising, are included in SG&A expenses as revenue is recognized.
The following table disaggregates KDP's revenue by portfolio:
| | | | | | | | | | | | | | | | | | | | | | | | | | | | | |
| (in millions) | Coffee Systems | | Packaged Beverages | | Beverage Concentrates | | Latin America Beverages | | Total |
| For the third quarter of 2021: | | | | | | | | | |
CSD(1) | $ | — | | | $ | 728 | | | $ | 386 | | | $ | 115 | | | $ | 1,229 | |
K-Cup pods(2) | 848 | | | — | | | — | | | — | | | 848 | |
NCB(1) | — | | | 705 | | | 2 | | | 41 | | | 748 | |
| Appliances | 243 | | | — | | | — | | | — | | | 243 | |
| Other | 64 | | | 114 | | | 4 | | | — | | | 182 | |
| Net sales | $ | 1,155 | | | $ | 1,547 | | | $ | 392 | | | $ | 156 | | | $ | 3,250 | |
| | | | | | | | | |
| For the third quarter of 2020: | | | | | | | | | |
CSD(1) | $ | — | | | $ | 658 | | | $ | 345 | | | $ | 89 | | | $ | 1,092 | |
K-Cup pods(2) | 812 | | | — | | | — | | | — | | | 812 | |
NCB(1) | — | | | 689 | | | 4 | | | 35 | | | 728 | |
| Appliances | 230 | | | — | | | — | | | — | | | 230 | |
| Other | 55 | | | 100 | | | 3 | | | — | | | 158 | |
| Net sales | $ | 1,097 | | | $ | 1,447 | | | $ | 352 | | | $ | 124 | | | $ | 3,020 | |
| | | | | | | | | |
| For the first nine months of 2021: | | | | | | | | | |
CSD(1) | $ | — | | | $ | 2,063 | | | $ | 1,077 | | | $ | 324 | | | $ | 3,464 | |
K-Cup pods(2) | 2,582 | | | — | | | — | | | — | | | 2,582 | |
NCB(1) | — | | | 1,959 | | | 9 | | | 123 | | | 2,091 | |
| Appliances | 627 | | | — | | | — | | | — | | | 627 | |
| Other | 189 | | | 330 | | | 9 | | | — | | | 528 | |
| Net sales | $ | 3,398 | | | $ | 4,352 | | | $ | 1,095 | | | $ | 447 | | | $ | 9,292 | |
| | | | | | | | | |
| For the first nine months of 2020: | | | | | | | | | |
CSD(1) | $ | — | | | $ | 1,842 | | | $ | 951 | | | $ | 262 | | | $ | 3,055 | |
K-Cup pods(2) | 2,433 | | | — | | | — | | | — | | | 2,433 | |
NCB(1) | — | | | 1,913 | | | 8 | | | 98 | | | 2,019 | |
| Appliances | 530 | | | — | | | — | | | — | | | 530 | |
| Other | 150 | | | 301 | | | 8 | | | 1 | | | 460 | |
| Net sales | $ | 3,113 | | | $ | 4,056 | | | $ | 967 | | | $ | 361 | | | $ | 8,497 | |
(1)Represents net sales of owned and partner brands within our portfolio.
(2) Represents net sales from owned brands, partner brands and private label owners. Net sales for partner brands and private label owners are contractual and long-term in nature.
KEURIG DR PEPPER INC.
NOTES TO CONDENSED CONSOLIDATED FINANCIAL STATEMENTS
(UNAUDITED, CONTINUED)
11. Income Taxes
The Company’s effective tax rates were as follows:
| | | | | | | | | | | | | | | | | | | | | | | | | | |
| | Third Quarter | | First Nine Months |
| (in millions) | | 2021 | | 2020 | | 2021 | | 2020 |
| Effective tax rate | | 22.0 | % | | 24.1 | % | | 22.9 | % | | 24.9 | % |
For the third quarter of 2021, the provision for income taxes was lower than the third quarter of 2020, which was primarily driven by the decrease on the revaluation of state deferred tax liabilities due to state legislative and apportionment changes in 2021, as well as the benefit received from U.S. provision-to-return adjustments.
For the first nine months of 2021, the provision for income taxes was lower than the first nine months of 2020, which was primarily driven by the tax benefit received from excess tax deductions that were generated from the vesting of RSUs during the first nine months of 2021, as well as the benefits received from the Company’s election of the high-tax exception to the GILTI calculation and U.S. provision-to-return adjustments.
12. Investments in Unconsolidated Affiliates
The following table summarizes investments in unconsolidated affiliates as of September 30, 2021 and December 31, 2020:
| | | | | | | | | | | | | | | | | | | | |
| (in millions) | | Ownership Interest | | September 30, 2021 | | December 31, 2020 |
| BodyArmor | | 12.5 | % | | $ | 53 | | | $ | 51 | |
| | | | | | |
| Dyla LLC | | 12.4 | % | | 12 | | | 12 | |
Force Holdings LLC(1) | | 33.3 | % | | 5 | | | 5 | |
Beverage startup companies(2) | | (various) | | 10 | | | 15 | |
| Other | | (various) | | 5 | | | 5 | |
| Investments in unconsolidated affiliates | | | | $ | 85 | | | $ | 88 | |
(1)Force Holdings LLC has a 14.1% ownership interest in Dyla LLC.
(2)Beverage startup companies represent equity method investments in development stage entities and may include entities which are pre-revenue, in test markets, or in early operations.
13. Other Financial Information
CASH AND CASH EQUIVALENTS
The carrying value of cash, cash equivalents, restricted cash and restricted cash equivalents is valued as of the balance sheet date equating fair value and classified as Level 1. The following table provides a reconciliation of cash, cash equivalents, restricted cash and restricted cash equivalents reported with the unaudited Condensed Consolidated Balance Sheets to the total of the same amounts shown in the unaudited Condensed Consolidated Statements of Cash Flows:
| | | | | | | | | | | |
| (in millions) | September 30, 2021 | | December 31, 2020 |
| Cash and cash equivalents | $ | 200 | | | $ | 240 | |
Restricted cash and restricted cash equivalents(1) | 3 | | | 15 | |
| Total cash, cash equivalents, restricted cash and restricted cash equivalents shown in the unaudited Condensed Consolidated Statement of Cash Flows | $ | 203 | | | $ | 255 | |
(1)Restricted cash and cash equivalents as of September 30, 2021 primarily represent amounts held in escrow in connection with the acquisitions of Core Nutrition LLC and Big Red Group Holdings, LLC, which have a corresponding holdback liability recorded in other current liabilities, as shown below. The decrease during the first nine months of 2021 was primarily driven by the release of $10 million from escrow in April 2021 related to the 2017 acquisition of Bai Brands LLC.
ALLOWANCE FOR EXPECTED CREDIT LOSSES
Activity in the allowance for expected credit losses account during the periods presented was as follows:
| | | | | |
| (in millions) | Allowance for Expected Credit Losses |
| |
| |
| |
| Balance as of December 31, 2020 | $ | 21 | |
| Provision (reversal) for allowance for expected credit losses | (12) | |
| Write-offs and adjustments | — | |
| Balance as of September 30, 2021 | $ | 9 | |
KEURIG DR PEPPER INC.
NOTES TO CONDENSED CONSOLIDATED FINANCIAL STATEMENTS
(UNAUDITED, CONTINUED)
ACCOUNTS PAYABLE
KDP has agreements with third party administrators which allow participating suppliers to track payments from KDP, and if voluntarily elected by the supplier, to sell payment obligations from KDP to financial institutions. Suppliers can sell one or more of KDP's payment obligations at their sole discretion and the rights and obligations of KDP to its suppliers are not impacted. KDP has no economic interest in a supplier’s decision to enter into these agreements and no direct financial relationship with the financial institutions. KDP's obligations to its suppliers, including amounts due and scheduled payment terms, are not impacted. KDP has been informed by the third party administrators that as of September 30, 2021 and December 31, 2020, $3,027 million and $2,578 million, respectively, of KDP's outstanding payment obligations were voluntarily elected by the supplier and sold to financial institutions.
SELECTED BALANCE SHEET INFORMATION
The tables below provide selected financial information from the unaudited Condensed Consolidated Balance Sheets:
| | | | | | | | | | | |
| | September 30, | | December 31, |
| (in millions) | 2021 | | 2020 |
| Inventories: | | | |
| Raw materials | $ | 335 | | | $ | 260 | |
| Work-in-progress | 6 | | | 6 | |
| Finished goods | 651 | | | 520 | |
| Total | 992 | | | 786 | |
| Allowance for excess and obsolete inventories | (20) | | | (24) | |
| Total Inventories | $ | 972 | | | $ | 762 | |
| Prepaid expenses and other current assets: | | | |
| Other receivables | $ | 109 | | | $ | 85 | |
| Customer incentive programs | 49 | | | 34 | |
| Derivative instruments | 153 | | | 45 | |
| Prepaid marketing | 23 | | | 15 | |
| Spare parts | 66 | | | 55 | |
| Income tax receivable | 14 | | | 11 | |
| Assets held for sale | — | | | 2 | |
| Other | 76 | | | 76 | |
| Total prepaid expenses and other current assets | $ | 490 | | | $ | 323 | |
| Other non-current assets: | | | |
| Operating lease right-of-use assets | $ | 627 | | | $ | 645 | |
| Customer incentive programs | 68 | | | 70 | |
| Derivative instruments | 18 | | | 12 | |
| | | |
Equity securities(1) | 41 | | | 41 | |
| Equity securities without readily determinable fair values | 1 | | | 1 | |
| | | |
Related party notes receivable(2) | 15 | | | — | |
| Other | 131 | | | 125 | |
| Total other non-current assets | $ | 901 | | | $ | 894 | |
(1)Fair values of these equity securities are determined using quoted market prices from daily exchange traded markets, based on the closing price as of the balance sheet date, and are classified as Level 1. The fair value of marketable securities was $41 million and $41 million as of September 30, 2021 and December 31, 2020, respectively.
(2)Refer to Note 16 for additional information about the Company's related party note receivable from Bedford.
KEURIG DR PEPPER INC.
NOTES TO CONDENSED CONSOLIDATED FINANCIAL STATEMENTS
(UNAUDITED, CONTINUED)
| | | | | | | | | | | |
| | September 30, | | December 31, |
| (in millions) | 2021 | | 2020 |
| Accrued expenses: | | | |
| Customer rebates & incentives | $ | 375 | | | $ | 382 | |
| Accrued compensation | 211 | | | 215 | |
| Insurance reserve | 39 | | | 35 | |
| Accrued interest | 143 | | | 57 | |
| Accrued professional fees | 15 | | | 21 | |
| Other accrued expenses | 338 | | | 330 | |
| Total accrued expenses | $ | 1,121 | | | $ | 1,040 | |
| Other current liabilities: | | | |
| Dividends payable | $ | 268 | | | $ | 212 | |
| Income taxes payable | 17 | | | 39 | |
| Operating lease liability | 77 | | | 72 | |
| Finance lease liability | 56 | | | 44 | |
| Derivative instruments | 34 | | | 25 | |
| Holdback liabilities | 2 | | | 15 | |
| Other | 8 | | | 9 | |
| Total other current liabilities | $ | 462 | | | $ | 416 | |
| Other non-current liabilities: | | | |
| Pension and post-retirement liability | $ | 38 | | | $ | 38 | |
| Insurance reserves | 74 | | | 72 | |
| Operating lease liability | 561 | | | 580 | |
| Finance lease liability | 555 | | | 298 | |
| Derivative instruments | 114 | | | 18 | |
| Deferred compensation liability | 41 | | | 41 | |
| Other | 80 | | | 72 | |
| Total other non-current liabilities | $ | 1,463 | | | $ | 1,119 | |
KEURIG DR PEPPER INC.
NOTES TO CONDENSED CONSOLIDATED FINANCIAL STATEMENTS
(UNAUDITED, CONTINUED)
14. Accumulated Other Comprehensive Income (Loss)
The following table provides a summary of changes in AOCI, net of taxes:
| | | | | | | | | | | | | | | | | | | | | | | |
| (in millions) | Foreign Currency Translation Adjustments | | Pension and Post-Retirement Benefit Liabilities | | Cash Flow Hedges | | Accumulated Other Comprehensive Income (Loss) |
| For the third quarter of 2021: | | | | | | | |
| Beginning balance | $ | 223 | | | $ | (4) | | | $ | (91) | | | $ | 128 | |
| Other comprehensive income (loss) | (137) | | | — | | | 10 | | | (127) | |
| Amounts reclassified from AOCI | — | | | — | | | 5 | | | 5 | |
| Other comprehensive income, net | (137) | | | — | | | 15 | | | (122) | |
| Balance as of September 30, 2021 | $ | 86 | | | $ | (4) | | | $ | (76) | | | $ | 6 | |
| | | | | | | |
| For the third quarter of 2020: | | | | | | | |
| Beginning balance | $ | (328) | | | $ | (1) | | | $ | 1 | | | $ | (328) | |
| Other comprehensive income (loss) | 111 | | | (1) | | | 1 | | | 111 | |
| Balance as of September 30, 2020 | $ | (217) | | | $ | (2) | | | $ | 2 | | | $ | (217) | |
| | | | | | | |
| For the first nine months of 2021: | | | | | | | |
| Beginning balance | $ | 95 | | | $ | (4) | | | $ | (14) | | | $ | 77 | |
| Other comprehensive income (loss) | (9) | | | — | | | (74) | | | (83) | |
| Amounts reclassified from AOCI | — | | | — | | | 12 | | | 12 | |
| Other comprehensive income, net | (9) | | | — | | | (62) | | | (71) | |
| Balance as of September 30, 2021 | $ | 86 | | | $ | (4) | | | $ | (76) | | | $ | 6 | |
| | | | | | | |
| For the first nine months of 2020: | | | | | | | |
| Beginning balance | $ | 104 | | | $ | — | | | $ | — | | | $ | 104 | |
| Other comprehensive income (loss) | (321) | | | (2) | | | 2 | | | (321) | |
| | | | | | | |
| Balance as of September 30, 2020 | $ | (217) | | | $ | (2) | | | $ | 2 | | | $ | (217) | |
The following table presents the amount of losses reclassified from AOCI into the unaudited Condensed Consolidated Statements of Income:
| | | | | | | | | | | | | | | | | | | | | | | | | | | | | |
| | | Third Quarter | | First Nine Months |
| (in millions) | Income Statement Caption | | 2021 | | 2020 | | 2021 | | 2020 |
| Cash Flow Hedges: | | | | | | | | | |
| Interest rate contracts | Interest expense | | $ | — | | | $ | — | | | $ | — | | | $ | — | |
| FX contracts | Cost of sales | | 6 | | | — | | | 15 | | | — | |
| Total | | | 6 | | | — | | | 15 | | | — | |
| Income tax benefit | | | (1) | | | — | | | (3) | | | — | |
| Total, net of tax | | | $ | 5 | | | $ | — | | | $ | 12 | | | $ | — | |
KEURIG DR PEPPER INC.
NOTES TO CONDENSED CONSOLIDATED FINANCIAL STATEMENTS
(UNAUDITED, CONTINUED)
15. Commitments and Contingencies
LEGAL MATTERS
KDP is involved from time to time in various claims, proceedings, and litigation. KDP establishes reserves for specific legal proceedings when the Company determines that the likelihood of an unfavorable outcome is probable and the amount of loss can be reasonably estimated. KDP has also identified certain other legal matters where the Company believes an unfavorable outcome is reasonably possible and/or for which no estimate of possible losses can be made.
Antitrust Litigation
In February 2014, TreeHouse Foods, Inc. and certain affiliated entities filed suit against KDP’s wholly-owned subsidiary, Keurig, in the U.S. District Court for the Southern District of New York (“SDNY”) (TreeHouse Foods, Inc. et al. v. Green Mountain Coffee Roasters, Inc. et al). The TreeHouse complaint asserted claims under the federal antitrust laws and various state laws, contending that Keurig had monopolized alleged markets for single serve coffee brewers and single serve coffee pods. The TreeHouse complaint sought monetary damages, declaratory relief, injunctive relief and attorneys’ fees. In March 2014, JBR, Inc. filed suit against Keurig in the U.S. District Court for the Eastern District of California (JBR, Inc. v. Keurig Green Mountain, Inc.). The claims asserted and relief sought in the JBR, Inc. complaint were substantially similar to the claims asserted and relief sought in the TreeHouse complaint.
Beginning in March 2014, twenty-seven putative class actions asserting similar claims and seeking similar relief were filed on behalf of purported direct and indirect purchasers of Keurig’s products in various federal district courts. In June 2014, the Judicial Panel on Multidistrict Litigation granted a motion to transfer these various actions, including the TreeHouse and JBR actions, to a single judicial district for coordinated or consolidated pre-trial proceedings (the “Multidistrict Antitrust Litigation”). Consolidated putative class action complaints by direct purchaser and indirect purchaser plaintiffs were filed in July 2014. An additional class action on behalf of indirect purchasers, originally filed in the Circuit Court of Faulkner County, Arkansas (Julie Rainwater et al. v. Keurig Green Mountain, Inc.), was transferred into the Multidistrict Antitrust Litigation in November 2015. In January 2019, McLane Company, Inc. filed suit against Keurig (McLane Company, Inc. v. Keurig Green Mountain, Inc.) in the SDNY asserting similar claims and also was transferred into the Multidistrict Antitrust Litigation. In July 2021, BJ’s Wholesale Club, Inc. filed suit against Keurig (BJ’s Wholesale Club, Inc. v. Keurig Green Mountain, Inc.) in the U.S. District Court for the Eastern District of New York (“EDNY”) asserting similar claims and also was transferred into the Multidistrict Antitrust Litigation. These actions are now pending in the SDNY (In re: Keurig Green Mountain Single-Serve Coffee Antitrust Litigation). Discovery in the Multidistrict Antitrust Litigation commenced in December 2017. In August 2021, Winn-Dixie Stores, Inc. and Bi-Lo Holding LLC filed suit against Keurig (Winn-Dixie Stores, Inc. et. al. v. Keurig Green Mountain, Inc. et. al.) in the EDNY asserting similar claims and was transferred into the Multidistrict Antitrust Litigation; the complaint in this litigation has not been served.
Separately, a statement of claim was filed in September 2014 against Keurig and Keurig Canada Inc. in Ontario, Canada by Club Coffee L.P., a Canadian manufacturer of single serve beverage pods, asserting a breach of competition law and false and misleading statements by Keurig.
In July 2020, Keurig reached an agreement with the putative indirect purchaser class plaintiffs in the Multidistrict Antitrust Litigation to settle the claims asserted in their complaint for $31 million. The settlement class consists of individuals and entities in the United States that purchased, from persons other than Keurig and not for purposes of resale, Keurig manufactured or licensed single serve beverage portion packs during the applicable class period (beginning in September 2010 for most states). The court granted preliminary approval of the settlement in December 2020, and the Company paid the settlement amount in January 2021. Final approval of the settlement was granted by the court in June 2021.
KDP intends to vigorously defend the remaining lawsuits described above. At this time, the Company is unable to predict the outcome of these lawsuits, the potential loss or range of loss, if any, associated with the resolution of these lawsuits or any potential effect they may have on the Company or its operations.
Proposition 65 Litigation
In May 2011, CERT filed a lawsuit in the Superior Court of the State of California, County of Los Angeles, (Council for Education and Research on Toxics v. Brad Barry LLC, et al., Case No. BC461182), alleging that Keurig, and certain other defendants who manufacture, package, distribute or sell coffee, failed to warn persons in California that Keurig's coffee products expose persons to the chemical acrylamide in violation of Proposition 65.
KEURIG DR PEPPER INC.
NOTES TO CONDENSED CONSOLIDATED FINANCIAL STATEMENTS
(UNAUDITED, CONTINUED)
Keurig, as part of a joint defense group organized to defend against the lawsuit, disputed CERT's claims and asserted multiple affirmative defenses. The case was scheduled to proceed to a third phase for trial on damages, remedies and attorneys' fees, but such trial did not occur in light of California’s Office of Environmental Health Hazard Assessment proposal of a new Proposition 65 regulation clarifying that cancer warnings are not required for chemicals, such as acrylamide, that are present in coffee as a result of roasting coffee beans. After the regulation took effect in October 2019, the litigation continued based on, among other items, CERT’s contentions that the regulation is legally invalid and, alternatively, cannot be applied to its pending claims. In August 2020, the court granted the defendants' motion for summary judgment, effectively ending CERT's Proposition 65 litigation at the trial court level. CERT has filed its appeal brief, and the Company intends to continue vigorously defending itself in this action. However, the Company believes that the likelihood that it will incur a material loss in connection with the CERT litigation is remote and accordingly, no loss contingency has been recorded.
16. Related Parties
JAB AND ITS AFFILIATES
JAB holds a significant but non-controlling interest in KDP. As of September 30, 2021, JAB beneficially owned approximately 33% of KDP's outstanding common stock. JAB and its affiliates also hold investments in a number of other companies that have commercial relationships with the Company, including Peet's, Caribou Coffee Company, Inc., Panera Bread Company, Einstein Bros Bagels, and Krispy Kreme Doughnuts Inc.
•KDP purchases certain raw materials from Peet's and manufactures coffee and tea portion packs under Peet's brands for sale by KDP and Peet's in the U.S. and Canada.
•KDP exclusively manufactures, distributes and sells Peet's RTD beverage products in the U.S. and Canada.
•KDP licenses the Caribou Coffee, Panera Bread and Krispy Kreme trademarks for use in the manufacturing of portion packs for the Keurig brewing system.
•KDP sells various beverage concentrates and packaged beverages to Caribou Coffee Company, Inc., Panera Bread Company, Einstein Bros Bagels, and Krispy Kreme Doughnuts Inc. for resale to retail customers.
INVESTMENTS IN BRAND OWNERSHIP COMPANIES
KDP holds investments in certain brand ownership companies, and in certain instances, the Company also has rights in specified territories to bottle and/or distribute the brands owned by such companies. KDP purchases inventory from these brand ownership companies and sells finished product to third-party customers primarily in the U.S. Additionally, any transactions with significant partners in these investments, such as ABI, are considered related party transactions. ABI purchases Clamato from KDP and pays the Company a royalty for use of the brand name.
On July 15, 2021, KDP issued a convertible promissory note for $15 million to Bedford at an interest rate of 0.12% per year. The outstanding principal and any unpaid accrued interest will automatically convert to equity interests in Bedford during the fourth quarter of 2021.
Refer to Note 12 for additional information about KDP's investments in brand ownership companies.
17. Subsequent Event
On October 25, 2021, the Company acquired an ownership interest in Vita Coco for $20 million. The investment in equity securities will be recorded within the Other non-current assets caption of the unaudited Condensed Consolidated Balance Sheets, and unrealized gains and losses related to the investment will be recorded in Other non-operating expense (income, net).
ITEM 2. Management's Discussion and Analysis of Financial Condition and Results of Operations
The following discussion should be read in conjunction with our audited consolidated financial statements and notes thereto in our Annual Report, as filed on February 25, 2021.
This Quarterly Report on Form 10-Q contains forward-looking statements within the meaning of Section 27A of the Securities Act of 1933, as amended, and Section 21E of the Exchange Act, including, in particular, statements about the impact of the global COVID-19 pandemic, inflation, future events, future financial performance, plans, strategies, expectations, prospects, competitive environment, regulation, labor matters, supply chain issues and availability of raw materials. Forward-looking statements include all statements that are not historical facts and can be identified by the use of forward-looking terminology such as “outlook,” “guidance,” “anticipate,” “expect,” “believe,” “could,” “estimate,” “feel,” “forecast,” “intend,” “may,” “plan,” “potential,” “project,” “should,” “target,” “will,” “would,” and similar words, phrases or expressions and variations or negatives of these words in this Quarterly Report on Form 10-Q. We have based these forward-looking statements on our current views with respect to future events and financial performance. Our actual financial performance could differ materially from those projected in the forward-looking statements due to the inherent uncertainty of estimates, forecasts and projections, and our financial performance may be better or worse than anticipated. Given these uncertainties, you should not put undue reliance on any forward-looking statements. All of the forward-looking statements are qualified in their entirety by reference to the factors discussed under "Risk Factors" in Part I, Item 1A of our Annual Report, as well as our subsequent filings with the SEC. Forward-looking statements represent our estimates and assumptions only as of the date that they were made. We do not undertake any duty to update the forward-looking statements, and the estimates and assumptions associated with them, after the date of this Quarterly Report on Form 10-Q, except to the extent required by applicable securities laws.
This Quarterly Report on Form 10-Q contains the names of some of our owned or licensed trademarks, trade names and service marks, which we refer to as our brands. All of the product names included in this Quarterly Report on Form 10-Q are either our registered trademarks or those of our licensors.
OVERVIEW
KDP is a leading beverage company in North America, with a diverse portfolio of flavored (non-cola) CSDs, NCBs, including water (enhanced and flavored), ready-to-drink tea and coffee, juice, juice drinks, mixers and specialty coffee, and is a leading producer of innovative single serve brewing systems. With a wide range of hot and cold beverages that meet virtually any consumer need, KDP key brands include Keurig, Dr Pepper, Canada Dry, Snapple, Bai, Mott's, Core, Green Mountain and The Original Donut Shop. KDP has some of the most recognized beverage brands in North America, with significant consumer awareness levels and long histories that evoke strong emotional connections with consumers. KDP offers more than 125 owned, licensed, and partner brands, including the top ten best-selling coffee brands and Dr Pepper as a leading flavored CSD in the U.S., according to IRi, which are available nearly everywhere people shop and consume beverages.
KDP operates as an integrated brand owner, manufacturer and distributor. We believe our integrated business model strengthens our route-to-market and provides opportunities for net sales and profit growth through the alignment of the economic interests of our brand ownership and our manufacturing and distribution businesses through both our DSD system and our WD delivery system. KDP markets and sells its products to retailers, including supermarkets, mass merchandisers, club stores, pure-play e-commerce retailers, and office superstores; to restaurants, hotel chains, office product and coffee distributors, and partner brand owners; and directly to consumers through its websites. Our integrated business model enables us to be more flexible and responsive to the changing needs of our large retail customers and allows us to more fully leverage our scale and reduce costs by creating greater geographic manufacturing and distribution coverage.
The beverage market is subject to some seasonal variations. Our cold beverage sales are generally higher during the warmer months, while hot beverage sales are generally higher during the cooler months. Overall beverage sales can be influenced by the timing of holidays and weather fluctuations. Sales of brewing systems and related accessories are generally higher during the second half of the year due to the holiday shopping season.
COFFEE SYSTEMS
Our Coffee Systems segment is primarily a producer of innovative single serve brewers and specialty coffee in the U.S. and Canada. We manufacture over 75% of the pods in the single-serve K-Cup pod format in the U.S. We manufacture and sell 100% of the K-Cup pods of the following brands to retailers, away from home channel participants and end-use consumers: Green Mountain Coffee Roasters, The Original Donut Shop, McCafé, Laughing Man, REVV, and Van Houtte.
We manufacture and sell K-Cup pods for the following brands to our partners, who in turn sell them to retailers: Starbucks, Smuckers, Peet's, Dunkin', Folgers, Newman’s Own Organics, Caribou Coffee, Eight O’Clock, Maxwell House, and Tim Hortons, as well as private label arrangements. Generally, we are able to sell these brands to our away from home channel participants and end-use consumers. We also have agreements for manufacturing, distributing, and selling K-Cup pods for tea under brands such as Celestial Seasonings, Lipton and Tazo in addition to K-Cup pods of our own brand, Snapple. We also produce and sell K-Cup pods for cocoa, including through a licensing agreement for the Swiss Miss brand, and hot apple cider, including under our own brand, Mott's.
Our Coffee Systems segment manufactures its K-Cup pods in facilities in North America that include specialty designed proprietary high-speed packaging lines using freshly roasted and ground coffee as well as tea, cocoa and other products. We offer high-quality coffee, including certified single-origin, organic, flavored, limited edition and proprietary blends. We carefully select our coffee beans and appropriately roast the coffees to optimize their taste and flavor differences. We engineer and design most of our single serve brewers, where we then utilize third-party contract manufacturers located in various countries in Asia for brewer appliance manufacturing. We distribute our brewers using third-party distributors, retail partners and through our website at www.keurig.com.
PACKAGED BEVERAGES
Our Packaged Beverages segment is principally a brand ownership, manufacturing and distribution business. In this segment, we primarily manufacture and distribute packaged beverages of our brands. Additionally, in order to maximize the size and scale of our manufacturing and distribution operations, we also distribute packaged beverages for our partner brands and manufacture packaged beverages for other third parties in the U.S. and Canada.
The larger CSD brands in this segment include Dr Pepper, Canada Dry, A&W, 7UP, Sunkist, Squirt, Big Red, RC Cola, and Vernors. The larger NCB brands in this segment include Snapple, Mott's, Bai, Clamato, Hawaiian Punch, Core, Yoo-Hoo, ReaLemon, evian, Vita Coco and Mr and Mrs T mixers.
The majority of our Packaged Beverages net sales come from the manufacturing and distribution of our own brands and the contract manufacturing of certain private label and emerging brand beverages. We also recognize net sales in this segment from the distribution of our partner brands such as evian, Vita Coco, Peet's RTD Coffee, A Shoc energy drinks, Runa energy drinks and Polar sparkling seltzer waters. We provide a route-to-market for third party brand owners seeking effective distribution for their new and emerging brands. These brands give us exposure in certain markets to fast growing segments of the beverage industry with minimal capital investment.
Our Packaged Beverages products are manufactured in multiple facilities across the U.S. and are sold or distributed to retailers and their warehouses by our own distribution network through our DSD and our WD systems, or by third party distributors, to all major retail channels.
BEVERAGE CONCENTRATES
Our Beverage Concentrates segment is principally a brand ownership business where we manufacture and sell beverage concentrates in the U.S. and Canada. Most of the brands in this segment are CSD brands. Key brands include Dr Pepper, Canada Dry, Crush, Schweppes, Sun Drop, Sunkist soda, A&W, 7UP, Squirt, Big Red, RC Cola and Hawaiian Punch. Almost all of our beverage concentrates are manufactured at our plant in St. Louis, Missouri. We are expanding our manufacturing capabilities to include a concentrate manufacturing facility in Ireland in the fourth quarter of 2021.
Beverage concentrates are shipped to third party bottlers, as well as to our own manufacturing systems, who combine them with carbonation, water, sweeteners and other ingredients, package the combined product in aluminum cans, PET containers and glass bottles, and sell them as a finished beverage to retailers through our Branded Concentrates operating segment. Beverage concentrates are also manufactured into syrup, which is shipped to fountain customers, such as fast food restaurants, who mix the syrup with water and carbonation to create a finished beverage at the point of sale to consumers through our FFS operating segment. Dr Pepper represents most of our FFS volume.
Our Beverage Concentrates brands are sold by our bottlers through all major retail channels.
LATIN AMERICA BEVERAGES
Our Latin America Beverages segment is a brand ownership, manufacturing and distribution business, with operations in Mexico representing approximately 90% of the segment's 2020 net sales. This segment participates mainly in the carbonated mineral water, flavored CSD, bottled water and vegetable juice categories. The largest brands include Peñafiel, Clamato, Squirt, Aguafiel and Crush.
VOLUME
In evaluating our performance, we consider different volume measures depending on whether we sell beverage concentrates, finished beverages, K-Cup pods or brewers.
Coffee Systems K-Cup Pod and Appliance Sales Volume
In our Coffee Systems segments, we measure our sales volume as the number of appliances and the number of individual K-Cup pods sold to our customers.
Packaged Beverages and Latin America Beverages Sales Volume
In our Packaged Beverages and Latin America Beverages segments, we measure volume as case sales to customers. A case sale represents a unit of measurement equal to 288 fluid ounces of packaged beverage sold by us. Case sales include both our owned brands and certain brands licensed to and/or distributed by us.
Beverage Concentrates Sales Volume
In our Beverage Concentrates segment, we measure our sales volume as concentrate case sales for concentrates sold by us to our bottlers and distributors. A concentrate case is the amount of concentrate needed to make one case of 288 fluid ounces of finished beverage, the equivalent of 24 twelve ounce servings. It does not include any other component of the finished beverage other than concentrate.
COMPARABLE RESULTS OF OPERATIONS
Management believes that there are certain non-GAAP financial measures that allow management to evaluate our results, trends and ongoing performance on a comparable basis. In order to derive the adjusted financial information, we adjust certain financial statement captions and metrics prepared under U.S. GAAP for certain items affecting comparability. See Non-GAAP Financial Measures for further information on the certain items affecting comparability used in the preparation of the financial information. These items are referred to within this Management's Discussion and Analysis discussion as Adjusted income from operations, Adjusted interest expense, Adjusted provision for income taxes, Adjusted net income and Adjusted diluted EPS.
EXECUTIVE SUMMARY
Financial Overview - Third Quarter of 2021 as compared to Third Quarter of 2020
As Reported, in millions (except EPS)
As Adjusted, in millions (except EPS)
Key Events During and Subsequent to the Third Quarter of 2021
During the third quarter of 2021, we made net repayments of our Notes, our commercial paper and our other credit agreements of $325 million.
On September 14, 2021, our Board of Directors declared a regular quarterly dividend of $0.1875 per share, which was paid on October 15, 2021 to shareholders of record as of October 1, 2021.
On October 1, 2021, we announced that our Board of Directors authorized a share repurchase program of up to $4 billion of our outstanding common stock, beginning on January 1, 2022, enabling us to opportunistically return value to shareholders.
On October 25, 2021, we acquired an ownership interest in Vita Coco for $20 million.
Uncertainties and Trends Affecting Our Business
We believe the North American beverage market is influenced by certain key trends and uncertainties. Refer to Item 1A, "Risk Factors", of our Annual Report, combined with the Uncertainties and Trends Affecting Liquidity section below, for more information about risks and uncertainties facing us.
Some of these items, such as the ongoing COVID-19 pandemic and its resulting impacts on the global economy, including supply chain constraints and labor shortages, have led to inflation in input costs, logistics, manufacturing and labor costs. During the third quarter of 2021, we have experienced supply chain disruptions and a significant inflationary impact compared to the prior year period. These impacts have created headwinds for our products that we expect to continue during the remainder of 2021 and into 2022.
As a result of these inflationary pressures, we have increased the pricing on a number of our products. As a result of these price increases, we may incur a reduction of volume or net sales, and combined with the inflationary pressures, could impact our margins and operating results.
Refer to Note 5 of the Notes to our Unaudited Condensed Consolidated Financial Statements and Item 3, Quantitative and Qualitative Disclosures About Market Risk for management's discussion of how we manage our exposure to commodity risk.
Impact of COVID-19 on our Financial Statements
The following table sets forth our reconciliation of significant COVID-19-related expenses. Employee compensation expense and employee protection costs, which impact our SG&A expenses and cost of sales, are included as the COVID-19 item affecting comparability and are excluded in our Adjusted financial measures. In addition, reported amounts under U.S. GAAP also include additional costs, not included as the COVID-19 item affecting comparability, as presented in tables below.
| | | | | | | | | | | | | | | | | | | | | | | | | | | | | |
| | | | | | | | | |
| Items Affecting Comparability(1) | | | | | | |
| (in millions) | Employee Compensation Expense(2) | | Employee Protection Costs(3) | | Allowances for Expected Credit Losses(4) | | Inventory Write-Downs(5) | | Total |
| For the third quarter of 2021: | | | | | | | | | |
| Coffee Systems | $ | 1 | | | $ | 1 | | | $ | — | | | $ | — | | | $ | 2 | |
| Packaged Beverages | 1 | | | 1 | | | — | | | — | | | 2 | |
| Beverage Concentrates | — | | | — | | | — | | | — | | | — | |
| Latin America Beverages | — | | | — | | | — | | | — | | | — | |
| Total | $ | 2 | | | $ | 2 | | | $ | — | | | $ | — | | | $ | 4 | |
| | | | | | | | | |
| For the third quarter of 2020: | | | | | | | | | |
| Coffee Systems | $ | 7 | | | $ | 5 | | | $ | — | | | $ | — | | | $ | 12 | |
| Packaged Beverages | 32 | | | 4 | | | — | | | — | | | 36 | |
| Beverage Concentrates | — | | | — | | | — | | | — | | | — | |
| Latin America Beverages | — | | | 1 | | | — | | | — | | | 1 | |
| Total | $ | 39 | | | $ | 10 | | | $ | — | | | $ | — | | | $ | 49 | |
| | | | | | | | | |
| For the first nine months of 2021: | | | | | | | | | |
| Coffee Systems | $ | 3 | | | $ | 14 | | | $ | (2) | | | $ | — | | | $ | 15 | |
| Packaged Beverages | 7 | | | 6 | | | (8) | | | — | | | 5 | |
| Beverage Concentrates | — | | | — | | | (3) | | | — | | | (3) | |
| Latin America Beverages | — | | | 1 | | | — | | | — | | | 1 | |
| Total | $ | 10 | | | $ | 21 | | | $ | (13) | | | $ | — | | | $ | 18 | |
| | | | | | | | | |
| For the first nine months of 2020: | | | | | | | | | |
| Coffee Systems | $ | 14 | | | $ | 7 | | | $ | 2 | | | $ | 8 | | | $ | 31 | |
| Packaged Beverages | 73 | | | 22 | | | 8 | | | — | | | 103 | |
| Beverage Concentrates | — | | | — | | | 4 | | | — | | | 4 | |
| Latin America Beverages | — | | | 1 | | | — | | | — | | | 1 | |
| Total | $ | 87 | | | $ | 30 | | | $ | 14 | | | $ | 8 | | | $ | 139 | |
| | | | | | | | | |
(1)Employee compensation expense and employee protection costs are both included as the COVID-19 items affecting comparability in the reconciliation of our Adjusted Non-GAAP financial measures.
(2)In 2021, amounts include pay for temporary employees, including the associated taxes, as well as incremental benefits provided to frontline workers such as extended sick leave, in order to maintain essential operations during the COVID-19 pandemic. In 2020, amounts primarily reflected temporary incremental frontline incentive pay and benefits, as well as pay for temporary employees, including the associated taxes. Impacts both cost of sales and SG&A expenses.
(3)Includes costs associated with personal protective equipment, temperature scans, cleaning and other sanitization services. Impacts both cost of sales and SG&A expenses.
(4)In 2020, allowances reflected the expected impact of the economic uncertainty caused by COVID-19, leveraging estimates of credit worthiness, default and recovery rates for certain of our customers. In 2021, reversals of those previously recorded allowances reflect improving economic conditions. Impacts SG&A expenses.
(5)Impacts cost of sales.
RESULTS OF OPERATIONS
We eliminate from our financial results all intercompany transactions between entities included in our consolidated financial statements and the intercompany transactions with our equity method investees.
References in the financial tables to percentage changes that are not meaningful are denoted by "NM".
Non-GAAP financial measures are provided in addition to U.S. GAAP measures. Such non-GAAP financial measures are excluded from the Results of Operations by Segment when there is no difference between the non-GAAP and the corresponding U.S. GAAP measure. See Non-GAAP Financial Measures for more information, including reconciliations to the corresponding U.S. GAAP measures.
Third Quarter of 2021 Compared to Third Quarter of 2020
Consolidated Operations
The following table sets forth our unaudited condensed consolidated results of operations for the third quarter of 2021 and 2020:
| | | | | | | | | | | | | | | | | | | | | | | |
| | Third Quarter | | Dollar | | Percentage |
| ($ in millions, except per share amounts) | 2021 | | 2020 | | Change | | Change |
| Net sales | $ | 3,250 | | | $ | 3,020 | | | $ | 230 | | | 7.6 | % |
| Cost of sales | 1,415 | | | 1,316 | | | 99 | | | 7.5 | |
| Gross profit | 1,835 | | | 1,704 | | | 131 | | | 7.7 | |
| Selling, general and administrative expenses | 1,040 | | | 949 | | | 91 | | | 9.6 | |
| Other operating expense (income), net | — | | | 2 | | | (2) | | | NM |
| Income from operations | 795 | | | 753 | | | 42 | | | 5.6 | |
| Interest expense | 116 | | | 148 | | | (32) | | | (21.6) | |
| | | | | | | |
| Impairment of investments and note receivable | — | | | 16 | | | (16) | | | NM |
| Other expense (income), net | 1 | | | 5 | | | (4) | | | NM |
| Income before provision for income taxes | 678 | | | 584 | | | 94 | | | 16.1 | |
| Provision for income taxes | 149 | | | 141 | | | 8 | | | 5.7 | |
| Net income including non-controlling interest | 529 | | | 443 | | | 86 | | | 19.4 | |
| Less: Net loss attributable to non-controlling interest | (1) | | | — | | | (1) | | | NM |
| Net income attributable to KDP | $ | 530 | | | $ | 443 | | | 87 | | | 19.6 | |
| | | | | | | |
| Earnings per common share: | | | | | | | |
| Basic | $ | 0.37 | | | $ | 0.31 | | | $ | 0.06 | | | 19.4 | % |
| Diluted | 0.37 | | | 0.31 | | | 0.06 | | | 19.4 | |
| | | | | | | |
| Gross margin | 56.5 | % | | 56.4 | % | | | | 10 bps |
| Operating margin | 24.5 | % | | 24.9 | % | | | | (40) bps |
| Effective tax rate | 22.0 | % | | 24.1 | % | | | | (210) bps |
Sales Volume. The following table sets forth changes in sales volume for the third quarter of 2021 compared to the prior year period:
| | | | | | | | |
| | Percentage Change |
| K-Cup pod volume | | 6.3 | % |
Brewer volume | | 2.2 | |
| CSD sales volume | | 2.8 | |
| NCB sales volume | | (6.4) | |
Net Sales. Net sales increased $230 million, or 7.6%, to $3,250 million for the third quarter of 2021 compared with $3,020 million in the prior year period. This performance reflected higher net price realization of 3.6%, volume/mix growth of 3.2% and favorable FX translation of 0.8%.
Gross Profit. Gross profit increased $131 million for the third quarter of 2021 compared with the prior year period. This performance primarily reflected higher net price realization, the impact of growth in volume/mix, the benefit of productivity and merger synergies, favorable FX impacts, including both transaction and translation, and lower COVID-19-related expenses. These benefits were partially offset by higher manufacturing costs, due to both inflation and the growth in volume/mix, an unfavorable change in unrealized commodity mark-to-market impacts, and increased costs to achieve productivity. Gross margin increased 10 bps versus the year ago period to 56.5%, driven by our Beverage Concentrates segment.
Selling, General and Administrative Expenses. SG&A expenses increased $91 million, or 9.6%, to $1,040 million for the third quarter of 2021 compared with $949 million in the prior year period. The increase was driven by increases in logistics, due to both inflation and volume/mix, higher marketing expense, an unfavorable comparison in unrealized mark-to-market on commodities, higher expenses associated with restructuring and integration projects and unfavorable FX impacts. These increases were partially offset by reduced expenses related to the COVID-19 pandemic and the benefit of productivity and merger synergies.
Income from Operations. Income from operations increased $42 million to $795 million for the third quarter of 2021 compared to $753 million in the prior year period due to the increase in gross profit, partially offset by increased SG&A expenses. Operating margin decreased 40 bps versus the year ago period to 24.5%.
Interest Expense. Interest expense decreased $32 million, or 21.6%, to $116 million for the third quarter of 2021 compared with $148 million in the prior year period. This change was driven by our strategic refinancing initiatives, continued deleveraging, and realized gains on interest rate contracts.
Impairment of Investments and Note Receivable. Impairment of investments and note receivable reflected a favorable comparison to a non-cash impairment charge of $16 million in the prior year period associated with our LifeFuels investment.
Effective Tax Rate. The effective tax rate decreased 210 bps to 22.0% for the third quarter of 2021, compared to 24.1% in the prior year period, which was primarily driven by the decrease on the revaluation of state deferred tax liabilities due to state legislative and apportionment changes in 2021, as well as the benefit received from U.S. provision-to-return adjustments.
Net Income Attributable to KDP. Net income increased $87 million to $530 million for the third quarter of 2021 as compared to $443 million in the prior year period, driven by improved income from operations, reduced interest expense and the favorable comparison to the impairment of our LifeFuels investment in the prior year period.
Diluted EPS. Diluted EPS increased 19.4% to $0.37 per diluted share for the third quarter of 2021 as compared to $0.31 in the prior year period.
Adjusted Results of Operations
The following table sets forth certain unaudited condensed consolidated adjusted results of operations for the third quarter of 2021 and 2020:
| | | | | | | | | | | | | | | | | | | | | | | |
| | Third Quarter | | Dollar | | Percent |
| (in millions, except per share amounts) | 2021 | | 2020 | | Change | | Change |
| Adjusted income from operations | $ | 931 | | | $ | 874 | | | $ | 57 | | | 6.5 | % |
| Adjusted interest expense | 110 | | | 139 | | | (29) | | | (20.9) | |
| Adjusted provision for income taxes | 190 | | | 173 | | | 17 | | | 9.8 | |
| Adjusted net income attributable to KDP | 631 | | | 557 | | | 74 | | | 13.3 | |
| Adjusted diluted EPS | 0.44 | | | 0.39 | | | 0.05 | | | 12.8 | |
| | | | | | | |
| Adjusted operating margin | 28.6 | % | | 28.9 | % | | | | (30) bps |
| Adjusted effective tax rate | 23.2 | % | | 23.7 | % | | | | (50) bps |
Adjusted Income from Operations. Adjusted income from operations increased $57 million, or 6.5%, to $931 million for the third quarter of 2021 as compared to Adjusted income from operations of $874 million in the prior year period. Driving this performance in the quarter were the growth in net sales and the benefits of productivity and merger synergies. These benefits were partially offset by higher manufacturing costs, due to both the growth in volume/mix and inflation, and higher marketing expense. Adjusted operating margin declined 30 bps versus the year ago period to 28.6%.
Adjusted Interest Expense. Adjusted interest expense decreased $29 million, or 20.9%, to $110 million for the third quarter of 2021 compared to Adjusted interest expense of $139 million in the prior year period. This benefit was primarily the result of our reduced interest rates resulting from our strategic refinancing initiatives, continued deleveraging, and realized gains on interest rate contracts.
Adjusted Effective Tax Rate. The Adjusted effective tax rate decreased 50 bps to 23.2% for the third quarter of 2021, compared to the Adjusted effective tax rate of 23.7% in the prior year period. This decrease was primarily driven by the benefit received from U.S. provision-to-return adjustments.
Adjusted Net Income Attributable to KDP. Adjusted net income attributable to KDP increased 13.3% to $631 million for the third quarter of 2021 as compared to Adjusted net income attributable to KDP of $557 million in the prior year period, driven by the growth in Adjusted income from operations and the decreased in Adjusted interest expense.
Adjusted Diluted EPS. Adjusted diluted EPS increased 12.8% to $0.44 per diluted share for the third quarter of 2021 as compared to Adjusted diluted EPS of $0.39 per diluted share in the prior year period.
Results of Operations by Segment
The following tables set forth net sales and income from operations for our segments for the third quarter of 2021 and 2020, as well as the other amounts necessary to reconcile our total segment results to our consolidated results presented in accordance with U.S. GAAP:
| | | | | | | | | | | |
| | Third Quarter |
| (in millions) | 2021 | | 2020 |
| Segment Results — Net sales | | | |
| Coffee Systems | $ | 1,155 | | | $ | 1,097 | |
| Packaged Beverages | 1,547 | | | 1,447 | |
| Beverage Concentrates | 392 | | | 352 | |
| Latin America Beverages | 156 | | | 124 | |
| Net sales | $ | 3,250 | | | $ | 3,020 | |
| | | |
| Third Quarter |
| (in millions) | 2021 | | 2020 |
| Segment Results — Income from operations | | | |
| Coffee Systems | $ | 334 | | | $ | 320 | |
| Packaged Beverages | 288 | | | 260 | |
| Beverage Concentrates | 286 | | | 262 | |
| Latin America Beverages | 37 | | | 25 | |
| Unallocated corporate costs | (150) | | | (114) | |
| Income from operations | $ | 795 | | | $ | 753 | |
COFFEE SYSTEMS
The following table provides selected information about our Coffee Systems segment's results:
| | | | | | | | | | | | | | | | | | | | | | | |
| Third Quarter | | Dollar | | Percent |
| (in millions) | 2021 | | 2020 | | Change | | Change |
| Net sales | $ | 1,155 | | | $ | 1,097 | | | $ | 58 | | | 5.3 | % |
| Income from operations | 334 | | | 320 | | | 14 | | | 4.4 | |
| Operating margin | 28.9 | % | | 29.2 | % | | | | (30) bps |
| Adjusted income from operations | $ | 377 | | | $ | 373 | | | 4 | | | 1.1 | % |
| Adjusted operating margin | 32.6 | % | | 34.0 | % | | | | (140) bps |
Sales Volume. Volume growth for the Coffee Systems segment included K-Cup pod volume growth of 6.3%, reflecting growth in at-home pod shipments and improvement in our away-from-home businesses, which continues to be well below pre-pandemic levels. Brewer volume increased 2.2% in the quarter, as compared to 33.7% in the year ago period.
Net Sales. Net sales increased 5.3% to $1,155 million for the third quarter of 2021 compared to net sales of $1,097 million in the prior year period, reflecting volume/mix growth of 5.7% and favorable FX translation of 0.7%, which was partially offset by lower net price realization of 1.1%.
Income from Operations. Income from operations increased $14 million, or 4.4%, to $334 million for the third quarter of 2021, compared to $320 million for the prior year period, driven by the continued benefit of productivity and merger synergies, which impacted both cost of sales and SG&A, the benefit of volume/mix growth, and a favorable comparison to COVID-19-related expenses in the prior year period. These impacts were partially offset by inflation, strategic pricing initiatives and increased marketing expense. Operating margin decreased 30 bps versus the year ago period to 28.9%.
Adjusted Income from Operations. Adjusted income from operations increased $4 million, or 1.1%, to $377 million for the third quarter of 2021, compared with Adjusted income from operations of $373 million for the prior year period, driven by the continued benefit of productivity and merger synergies, which impacted both cost of sales and SG&A, and the benefit of volume/mix growth. These impacts were partially offset by inflation, strategic pricing initiatives and increased marketing expense. Adjusted operating margin decreased 140 bps versus the year ago period to 32.6%.
PACKAGED BEVERAGES
The following table provides selected information about our Packaged Beverages segment's results:
| | | | | | | | | | | | | | | | | | | | | | | |
| Third Quarter | | Dollar | | Percent |
| (in millions) | 2021 | | 2020 | | Change | | Change |
| Net sales | $ | 1,547 | | | $ | 1,447 | | | $ | 100 | | | 6.9 | % |
| Income from operations | 288 | | | 260 | | | 28 | | | 10.8 | |
| Operating margin | 18.6 | % | | 18.0 | % | | | | 60 bps |
| Adjusted income from operations | $ | 312 | | | $ | 304 | | | 8 | | | 2.6 | % |
| Adjusted operating margin | 20.2 | % | | 21.0 | % | | | | (80) bps |
Sales Volume. Sales volume for the third quarter of 2021 increased 0.1%, as strength in CSDs, which benefited from the expansion of our route to market network, as well as increases in Polar and Mott’s, were mostly offset by declines in Snapple and Hawaiian Punch.
Net Sales. Net sales increased 6.9% to $1,547 million for the third quarter of 2021, compared with net sales of $1,447 million in the prior year period, driven by higher net price realization of 5.3%, due to the impact of lower trade and price increases, volume/mix growth of 1.5% and favorable FX translation of 0.1%.
Income from Operations. Income from operations increased $28 million, or 10.8%, to $288 million for the third quarter of 2021, compared with $260 million for the prior year period, driven by higher net price realization, the favorable comparison to COVID-19-related expenses in the prior year period, the benefits of productivity and merger synergies, and volume/mix growth. These growth drivers were partially offset by inflation, increased costs due to higher volumes, driven by an expansion of our route to market network, expenses associated with productivity projects, higher marketing expense and increases in other operating costs. Operating margin grew 60 bps versus the year ago period to 18.6%.
Adjusted Income from Operations. Adjusted income from operations increased $8 million, or 2.6%, to $312 million for the third quarter of 2021, compared with Adjusted income from operations of $304 million for the prior year period, driven by higher net price realization, the benefits of productivity and merger synergies, and volume/mix growth. These growth drivers were partially offset by inflation, increased costs due to higher volumes, driven by an expansion of our route to market network, higher marketing expense and increases in other operating costs. Adjusted operating margin declined 80 bps versus the year ago period to 20.2%.
BEVERAGE CONCENTRATES
The following table provides selected information about our Beverage Concentrates segment's results:
| | | | | | | | | | | | | | | | | | | | | | | |
| Third Quarter | | Dollar | | Percent |
| (in millions) | 2021 | | 2020 | | Change | | Change |
| Net sales | $ | 392 | | | $ | 352 | | | $ | 40 | | | 11.4 | % |
| Income from operations | 286 | | | 262 | | | 24 | | | 9.2 | |
| Operating margin | 73.0 | % | | 74.4 | % | | | | (140) bps |
| Adjusted income from operations | $ | 289 | | | $ | 265 | | | 24 | | | 9.1 | % |
| Adjusted operating margin | 73.7 | % | | 75.3 | % | | | | (160) bps |
Sales volume. Sales volume for the third quarter of 2021 declined 0.6%, as improving trends in our fountain foodservice business, which services restaurants and hospitality, were more than offset by declines in our branded concentrates business, primarily driven by a shift in sales from concentrates to finished goods in our Packaged Beverages segment.
Net Sales. Net sales increased 11.4% to $392 million for the third quarter of 2021 compared to $352 million for the prior year period, reflecting higher net price realization of 11.4%, driven by the impact of our annual price increases and lower trade, as well as favorable FX translation of 0.6%, partially offset by unfavorable volume/mix of 0.6%.
Income from Operations. Income from operations increased $24 million, or 9.2%, to $286 million for the third quarter of 2021 compared to $262 million for the prior year period, driven by the impact of higher net sales, partially offset by higher marketing expense. Operating margin declined 140 bps from versus the year ago period to 73.0%.
Adjusted Income from Operations. Adjusted income from operations increased $24 million, or 9.1%, to $289 million for the third quarter of 2021 compared with Adjusted income from operations of $265 million for the prior year period, driven by the impact of higher net sales, partially offset by higher marketing expense. Adjusted operating margin declined 160 bps versus the year ago period to 73.7%.
LATIN AMERICA BEVERAGES
The following table provides selected information about our Latin America Beverages segment's results:
| | | | | | | | | | | | | | | | | | | | | | | |
| Third Quarter | | Dollar | | Percent |
| (in millions) | 2021 | | 2020 | | Change | | Change |
| Net sales | $ | 156 | | | $ | 124 | | | $ | 32 | | | 25.8 | % |
| Income from operations | 37 | | | 25 | | | 12 | | | 48.0 | |
| Operating margin | 23.7 | % | | 20.2 | % | | | | 350 bps |
| Adjusted income from operations | $ | 37 | | | $ | 25 | | | 12 | | | 48.0 | % |
| Adjusted operating margin | 23.7 | % | | 20.2 | % | | | | 350 bps |
Sales Volume. Sales volume for the third quarter of 2021 increased 5.3% compared to the prior year period, driven primarily by Peñafiel, Squirt and Clamato.
Net Sales. Net sales increased 25.8% to $156 million for the third quarter of 2021 compared to $124 million for the prior year period, driven by favorable FX translation of 11.3%, favorable volume/mix of 10.5% and higher net price realization of 4.0%.
Income from Operations. Income from operations increased 48.0% to $37 million for the third quarter of 2021 compared to $25 million in the prior year period, driven by favorable volume/mix, favorable FX effects, including both transaction and translation, higher net pricing, and the benefits of productivity, partially offset by inflation, higher marketing investments and increased operating costs due to higher volumes. Operating margin increased 350 bps versus the year ago period to 23.7%.
Adjusted Income from Operations. Adjusted income from operations increased 48.0% to $37 million for the third quarter of 2021 compared to $25 million in the prior year period, driven by favorable volume/mix, favorable FX effects, including both transaction and translation, higher net pricing, and the benefits of productivity, partially offset by inflation, higher marketing investments and increased operating costs due to higher volumes. Adjusted operating margin grew 350 bps versus the prior year period to 23.7%.
First Nine Months of 2021 Compared to First Nine Months of 2020
Consolidated Operations
The following table sets forth our unaudited condensed consolidated results of operations for the first nine months of 2021 and 2020:
| | | | | | | | | | | | | | | | | | | | | | | |
| | First Nine Months | | Dollar | | Percentage |
| ($ in millions, except per share amounts) | 2021 | | 2020 | | Change | | Change |
| Net sales | $ | 9,292 | | | $ | 8,497 | | | $ | 795 | | | 9.4 | % |
| Cost of sales | 4,087 | | | 3,779 | | | 308 | | | 8.2 | |
| Gross profit | 5,205 | | | 4,718 | | | 487 | | | 10.3 | |
| Selling, general and administrative expenses | 3,040 | | | 2,978 | | | 62 | | | 2.1 | |
| Other operating expense (income), net | (4) | | | (40) | | | 36 | | | NM |
| Income from operations | 2,169 | | | 1,780 | | | 389 | | | 21.9 | |
| Interest expense | 381 | | | 458 | | | (77) | | | (16.8) | |
| Loss on early extinguishment of debt | 105 | | | 4 | | | 101 | | | NM |
| Impairment of investments and note receivable | — | | | 102 | | | (102) | | | NM |
| Other expense (income), net | (6) | | | 21 | | | (27) | | | NM |
| Income before provision for income taxes | 1,689 | | | 1,195 | | | 494 | | | 41.3 | |
| Provision for income taxes | 387 | | | 298 | | | 89 | | | 29.9 | |
| Net income including non-controlling interest | 1,302 | | | 897 | | | 405 | | | 45.2 | |
| Less: Net loss attributable to non-controlling interest | (1) | | | — | | | (1) | | | NM |
| Net income attributable to KDP | $ | 1,303 | | | $ | 897 | | | 406 | | | 45.3 | |
| | | | | | | |
| Earnings per common share: | | | | | | | |
| Basic | $ | 0.92 | | | $ | 0.64 | | | $ | 0.28 | | | 43.8 | % |
| Diluted | 0.91 | | | 0.63 | | | 0.28 | | | 44.4 | |
| | | | | | | |
| Gross margin | 56.0 | % | | 55.5 | % | | | | 50 bps |
| Operating margin | 23.3 | % | | 20.9 | % | | | | 240 bps |
| Effective tax rate | 22.9 | % | | 24.9 | % | | | | (200) bps |
Sales Volume. The following table provides the percentage increase in sales volumes compared to the prior year period:
| | | | | | | | |
| | Percentage Change |
| K-Cup Pods | | 6.6 | % |
| Brewers | | 22.5 | |
| CSDs | | 5.5 | |
| NCBs | | (7.3) | |
Net Sales. Net sales increased $795 million, or 9.4%, to $9,292 million for the first nine months of 2021 compared to $8,497 million in the prior year period. This performance reflected volume/mix of 6.3%, net price realization of 2.1% and favorable FX translation of 1.0%.
Gross Profit. Gross profit increased $487 million, or 10.3%, to $5,205 million for the first nine months of 2021 compared to $4,718 million in the prior year period. This performance primarily reflected strong growth in net sales, the benefit of productivity and merger synergies, and a favorable change in unrealized commodity mark-to-market impacts. These benefits were partially offset by higher manufacturing costs, driven by both volume/mix growth and inflation. Gross margin increased 50 bps versus the year ago period to 56.0%.
Selling, General and Administrative Expenses. SG&A expenses increased $62 million, or 2.1%, to $3,040 million for the first nine months of 2021 compared to $2,978 million in the prior year period. The increase was driven by increases in logistics, driven by both inflation and higher volumes, higher marketing expense, FX effects and expenses associated with productivity projects. These increases were partially offset by reduced expenses related to the COVID-19 pandemic of $97 million, productivity and merger synergies, and a favorable change in commodity mark-to-market impacts of $60 million.
Other Operating Income, net. Other operating income, net had an unfavorable change of $36 million for the first nine months of 2021 compared to the prior year period, largely driven by the network optimization program gain of $42 million on the asset sale-leaseback of four facilities in the prior year period.
Income from Operations. Income from operations increased $389 million, or 21.9%, to $2,169 million for the first nine months of 2021 compared to $1,780 million in the prior year period, driven by the increase in gross profit, partially offset by the increase in SG&A expenses and the unfavorable change in other operating income, net. Operating margin increased 240 bps versus the year ago period to 23.3%.
Interest Expense. Interest expense decreased $77 million, or 16.8%, to $381 million for the first nine months of 2021 compared to $458 million for the prior year period. This change was primarily the result of the favorable change in unrealized interest rate swap mark-to-market impacts of $35 million, lower interest rates resulting from our strategic refinancing initiatives, and our continued deleveraging.
Loss on Early Extinguishment of Debt. Loss on early extinguishment of debt reflected expense of $105 million during the first nine months of 2021 due to our strategic refinancing initiatives.
Impairment of Investments and Note Receivable. Impairment on investments and note receivable reflected a favorable comparison to a non-cash impairment charge of $102 million in the prior year period associated with our Bedford and LifeFuels investments.
Effective Tax Rate. The effective tax rate decreased 200 bps to 22.9% for the first nine months of 2021, compared to 24.9% in the prior year period, primarily driven by the tax benefit received from excess tax deductions that were generated from the vesting of RSUs in the first nine months of 2021, as well as the benefit received from the Company’s election of the high-tax exception to the GILTI calculation and U.S. provision-to-return adjustments.
Net Income Attributable to KDP. Net income attributable to KDP increased $406 million, or 45.3%, to $1,303 million for the first nine months of 2021 as compared to $897 million in the prior year period, driven by improved income from operations and reduced interest expense, as well as the favorable comparison to the impairment on investments and note receivable, partially offset by the loss on early extinguishment of debt in the first nine months of 2021.
Diluted EPS. Diluted EPS increased 44.4% to $0.91 per diluted share as compared to $0.63 in the prior year period.
Adjusted Results of Operations
The following table sets forth certain unaudited condensed consolidated adjusted results of operations for the first nine months of 2021 and 2020:
| | | | | | | | | | | | | | | | | | | | | | | |
| | First Nine Months | | Dollar | | Percent |
| (in millions, except per share amounts) | 2021 | | 2020 | | Change | | Change |
| | | | | | | |
| Adjusted income from operations | $ | 2,511 | | | $ | 2,333 | | | $ | 178 | | | 7.6 | % |
| Adjusted interest expense | 368 | | | 404 | | | (36) | | | (8.9) | |
| Adjusted provision for income taxes | 510 | | | 474 | | | 36 | | | 7.6 | |
| Adjusted net income attributable to KDP | 1,640 | | | 1,434 | | | 206 | | | 14.4 | |
| Adjusted diluted EPS | 1.15 | | | 1.01 | | | 0.14 | | | 13.9 | |
| | | | | | | |
| Adjusted operating margin | 27.0 | % | | 27.5 | % | | | | (50) bps |
| Adjusted effective tax rate | 23.7 | % | | 24.8 | % | | | | (110) bps |
Adjusted Income from Operations. Adjusted income from operations increased $178 million, or 7.6%, to $2,511 million for the first nine months of 2021 compared to Adjusted income from operations of $2,333 million in the prior year period. Driving this performance in the current period were strong growth in net sales, the benefit of productivity and merger synergies, and favorable changes in unrealized commodity mark-to-market impacts, which impacted both SG&A and cost of sales. Partially offsetting these positive drivers were inflation, higher marketing expense, increased operating costs due to higher volumes, and an unfavorable comparison to a network optimization program gain of $42 million on the asset sale-leaseback of four facilities in the prior year period. Adjusted operating margin declined 50 bps versus the year ago period to 27.0%.
Adjusted Interest Expense. Adjusted interest expense decreased $36 million, or 8.9%, to $368 million for the first nine months of 2021 compared to Adjusted interest expense of $404 million in the prior year period, driven by reduced interest rates resulting from our strategic refinancing initiatives and continued deleveraging.
Adjusted Effective Tax Rate. The Adjusted effective tax rate decreased 110 bps to 23.7% for the first nine months of 2021, compared to 24.8% in the prior year period, primarily driven by the tax benefit received from excess tax deductions that were generated from the vesting of RSUs in the first nine months of 2021, as well as the benefit received from U.S. provision-to-return adjustments.
Adjusted Net Income Attributable to KDP. Adjusted net income attributable to KDP increased 14.4% to $1,640 million for the first nine months of 2021 as compared to Adjusted net income of $1,434 million in the prior year period. This performance was driven primarily by strong growth in Adjusted income from operations and the decrease in Adjusted interest expense.
Adjusted Diluted EPS. Adjusted diluted EPS increased 13.9% to $1.15 per diluted share as compared to Adjusted diluted EPS of $1.01 per diluted share in the prior year period.
Results of Operations by Segment
The following tables provide net sales and income from operations for our reportable segments for the first nine months of 2021 and 2020, as well as the other amounts necessary to reconcile our total segment results to our consolidated results presented in accordance with U.S. GAAP:
| | | | | | | | | | | |
| (in millions) | First Nine Months |
| Segment Results — Net sales | 2021 | | 2020 |
| Coffee Systems | $ | 3,398 | | | $ | 3,113 | |
| Packaged Beverages | 4,352 | | | 4,056 | |
| Beverage Concentrates | 1,095 | | | 967 | |
| Latin America Beverages | 447 | | | 361 | |
| Net sales | $ | 9,292 | | | $ | 8,497 | |
| | | |
| First Nine Months |
| (in millions) | 2021 | | 2020 |
| Segment Results — Income from operations | | | |
| Coffee Systems | $ | 992 | | | $ | 882 | |
| Packaged Beverages | 721 | | | 657 | |
| Beverage Concentrates | 778 | | | 679 | |
| Latin America Beverages | 95 | | | 73 | |
| Unallocated corporate costs | (417) | | | (511) | |
| Income from operations | $ | 2,169 | | | $ | 1,780 | |
COFFEE SYSTEMS
The following table provides selected information about our Coffee Systems segment's results:
| | | | | | | | | | | | | | | | | | | | | | | |
| | First Nine Months | | Dollar | | Percent |
| (in millions) | 2021 | | 2020 | | Change | | Change |
| Net sales | $ | 3,398 | | | $ | 3,113 | | | $ | 285 | | | 9.2 | % |
| Income from operations | 992 | | | 882 | | | 110 | | | 12.5 | |
| Operating margin | 29.2 | % | | 28.3 | % | | | | 90 bps |
| Adjusted income from operations | 1,137 | | | 1,083 | | | 54 | | | 5.0 | % |
| Adjusted operating margin | 33.5 | % | | 34.8 | % | | | | (130) bps |
Sales Volume. Sales volume growth in the first nine months of 2021 compared to the prior year period for the Coffee Systems segment included K-Cup pod volume growth of 6.6%, reflecting strength in at-home consumption and modest improvement in the away-from-home businesses. Brewer volume increased 22.5% in the first nine months of 2021, as compared to growth of 17.7% in the year-ago period, driven by our successful brewer innovation program.
Net Sales. Net sales increased 9.2% to $3,398 million for the first nine months of 2021 compared to $3,113 million in the prior year period, driven by volume/mix growth of 9.3% and favorable FX translation of 1.0%, partially offset by lower net price realization of 1.1%.
Income from Operations. Income from operations increased $110 million, or 12.5%, to $992 million for the first nine months of 2021, compared to $882 million in the prior year period, driven by the continued benefit of productivity and merger synergies, strong volume/mix, reduced costs associated with our productivity projects, a favorable comparison to an increase in our litigation reserve in the prior year, and favorable FX effects, including both transaction and translation. These benefits were partially offset by declines due to inflation, strategic pricing initiatives, and the unfavorable comparison to a network optimization program gain of $16 million on an asset sale-leaseback of a manufacturing facility in the prior year period. Operating margin grew 90 bps versus the year ago period to 29.2%.
Adjusted Income from Operations. Adjusted income from operations increased $54 million, or 5.0%, to $1,137 million for the first nine months of 2021, compared to $1,083 million in the prior year period, driven by the continued benefit of productivity, strong volume/mix, and favorable FX effects, including both transaction and translation. These benefits were partially offset by declines due to inflation, strategic pricing initiatives, and the unfavorable comparison to a network optimization program gain of $16 million on an asset sale-leaseback of a manufacturing facility in the prior year period. Adjusted operating margin declined 130 bps versus the year ago period to 33.5%.
PACKAGED BEVERAGES
The following table provides selected information about our Packaged Beverages segment's results:
| | | | | | | | | | | | | | | | | | | | | | | |
| | First Nine Months | | Dollar | | Percent |
| (in millions) | 2021 | | 2020 | | Change | | Change |
| Net sales | $ | 4,352 | | | $ | 4,056 | | | $ | 296 | | | 7.3 | % |
| Income from operations | 721 | | | 657 | | | 64 | | | 9.7 | |
| Operating margin | 16.6 | % | | 16.2 | % | | | | 40 bps |
| Adjusted income from operations | 795 | | | 776 | | | 19 | | | 2.4 | % |
| Adjusted operating margin | 18.3 | % | | 19.1 | % | | | | (80) bps |
Sales Volume. Sales volume for the first nine months of 2021 increased 1.4% compared to the prior year period, due primarily to strength in CSDs, driven by our broad flavor portfolio, water, and the addition of Polar to our portfolio of partner brands. This was partially offset by declines in Hawaiian Punch and reductions in contract manufacturing.
Net Sales. Net sales increased 7.3% to $4,352 million in the first nine months of 2021, compared to $4,056 million in the prior year period, driven by volume/mix of 4.7%, net price realization of 2.4% and favorable FX translation of 0.2%.
Income from Operations. Income from operations increased $64 million, or 9.7%, to $721 million for the first nine months of 2021 compared to $657 million for the prior year period, driven primarily by strong volume/mix growth, higher net price realization, the favorable comparison to COVID-19-related expenses in the prior year period, and the benefit of productivity and merger synergies. These increases were partially offset by inflation, the unfavorable comparison to a network optimization gain of $26 million in the prior year period related to the asset sale-leaseback of three facilities, expenses associated with productivity projects, higher marketing expense and increased operating costs due to higher volumes, driven by an expansion of our route to market network. Operating margin grew 40 bps from the year ago period to 16.6%.
Adjusted Income from Operations. Adjusted income from operations increased $19 million, or 2.4%, to $795 million for the first nine months of 2021 compared to $776 million for the prior year period, driven primarily by strong volume/mix growth, higher net price realization and the benefit of productivity and merger synergies. These increases were partially offset by inflation, the unfavorable comparison to a network optimization gain of $26 million in the prior year period related to the asset sale-leaseback of three facilities, higher marketing expense and increased operating costs due to higher volumes, driven by an expansion of our route to market network. Adjusted operating margin decreased 80 bps versus the year ago period to 18.3%, primarily reflecting the aforementioned asset sale-leaseback gain in the year-ago period.
BEVERAGE CONCENTRATES
The following table provides selected information about our Beverage Concentrates segment's results:
| | | | | | | | | | | | | | | | | | | | | | | |
| | First Nine Months | | Dollar | | Percent |
| (in millions) | 2021 | | 2020 | | Change | | Change |
| Net sales | $ | 1,095 | | | $ | 967 | | | $ | 128 | | | 13.2 | % |
| Income from operations | 778 | | | 679 | | | 99 | | | 14.6 | |
| Operating margin | 71.1 | % | | 70.2 | % | | | | 90 bps |
| Adjusted income from operations | 784 | | | 684 | | | 100 | | | 14.6 | % |
| Adjusted operating margin | 71.6 | % | | 70.7 | % | | | | 90 bps |
Sales Volume. Sales volume for the first nine months of 2021 increased 2.4% compared to the prior year period, reflecting improving trends in our fountain foodservice component of the business, which services restaurants and hospitality, driven by increasing levels of consumer mobility during the first nine months of 2021 compared to the year-ago period.
Net Sales. Net sales increased 13.2% to $1,095 million in the first nine months of 2021, compared to $967 million in the prior year period, reflecting higher net price realization of 9.7%, volume/mix growth of 3.0% and favorable FX translation of 0.5%.
Income from Operations. Income from operations increased $99 million, or 14.6%, to $778 million for the first nine months of 2021 compared to $679 million in the prior year period. This performance reflected the impact of net sales growth, partially offset by higher marketing expense. Operating margin increased 90 bps versus the year ago period to 71.1%.
Adjusted Income from Operations. Adjusted income from operations increased $100 million, or 14.6%, to $784 million for the first nine months of 2021 compared to $684 million in the prior year period. This performance reflected the impact of net sales growth, partially offset by higher marketing expense. Adjusted operating margin increased 90 bps versus the year ago period to 71.6%.
LATIN AMERICA BEVERAGES
The following table provides selected information about our Latin America Beverages segment's results:
| | | | | | | | | | | | | | | | | | | | | | | |
| | First Nine Months | | Dollar | | Percent |
| (in millions) | 2021 | | 2020 | | Change | | Change |
| Net sales | $ | 447 | | | $ | 361 | | | $ | 86 | | | 23.8 | % |
| Income from operations | 95 | | | 73 | | | 22 | | | 30.1 | |
| Operating margin | 21.3 | % | | 20.2 | % | | | | 110 bps |
| Adjusted income from operations | 97 | | | 75 | | | 22 | | | 29.3 | % |
| Adjusted operating margin | 21.7 | % | | 20.8 | % | | | | 90 bps |
Sales Volume. Sales volume for the first nine months of 2021 as compared to the prior year period increased 2.6%, driven by Peñafiel and Clamato, partially offset by declines in Squirt and Crush.
Net Sales. Net sales grew 23.8% to $447 million for the first nine months of 2021, compared to $361 million in the prior year period, reflecting favorable FX translation of 9.1%, volume/mix growth of 8.6% and net price realization of 6.1%.
Income from Operations. Income from operations increased $22 million, or 30.1%, to $95 million for the first nine months of 2021 compared to $73 million in the prior year period, driven by higher net price realization and favorable volume/mix, partially offset by inflation and higher marketing expense. Operating margin increased 110 bps versus the year ago period to 21.3%.
Adjusted Income from Operations. Adjusted income from operations increased $22 million, or 29.3%, to $97 million for the first nine months of 2021 compared to $75 million in the prior year period, driven by higher net price realization and favorable volume/mix, partially offset by inflation and higher marketing expense. Adjusted operating margin improved 90 bps versus the year ago period to 21.7%.
CRITICAL ACCOUNTING ESTIMATES
The process of preparing our consolidated financial statements in conformity with U.S. GAAP requires the use of estimates and judgments that affect the reported amounts of assets, liabilities, revenue and expenses. Critical accounting estimates are both fundamental to the portrayal of a company’s financial condition and results and require difficult, subjective or complex estimates and assessments. These estimates and judgments are based on historical experience, future expectations and other factors and assumptions we believe to be reasonable under the circumstances. The most significant estimates and judgments are reviewed on an ongoing basis and revised when necessary. These critical accounting estimates are discussed in greater detail in our Annual Report.
LIQUIDITY AND CAPITAL RESOURCES
Overview
Our financial condition and liquidity remain strong. Net cash provided by operations was $1,933 million for the first nine months of 2021 compared to $1,666 million for the prior year period. Although there is continued uncertainty related to the impact of the ongoing COVID-19 pandemic on our future results, we believe we are uniquely positioned, with our broad portfolio and unmatched distribution network, to successfully navigate through this pandemic, and the steps we have taken over the course of the pandemic to strengthen our balance sheet leave us well positioned to manage our business. We continue to manage all aspects of our business, including, but not limited to, monitoring the financial health of our customers, suppliers and other third-party relationships, implementing gross margin enhancement strategies through our integration and productivity initiatives, and developing new opportunities for growth such as innovation and agreements with partners to distribute brands that are accretive to our portfolio.
The following summarizes our cash activity for the first nine months of 2021 and 2020:
Cash, cash equivalents, restricted cash and restricted cash equivalents decreased $52 million from December 31, 2020 to September 30, 2021 primarily as a result of deleveraging, dividend payments and investments in property, plant and equipment, which outpaced cash generated from our operations.
Cash generated by our foreign operations is generally repatriated to the U.S. periodically as working capital funding requirements in those jurisdictions allow. Foreign cash balances were $163 million and $165 million as of September 30, 2021 and December 31, 2020, respectively.
Principal Sources of Capital Resources
Our principal sources of liquidity are our existing cash and cash equivalents, cash generated from our operations and borrowing capacity currently available under our KDP Revolver and 2021 364-Day Credit Agreement. Additionally, we have an uncommitted commercial paper program where we can issue unsecured commercial paper notes on a private placement basis. Based on our current and anticipated level of operations, we believe that our operating cash flows will be sufficient to meet our anticipated obligations for the next twelve months. To the extent that our operating cash flows are not sufficient to meet our liquidity needs, we may utilize cash on hand or amounts available under our financing arrangements, if necessary.
Sources of Liquidity - Operations
Net cash provided by operating activities increased $267 million for the first nine months of 2021, as compared to the first nine months of 2020, driven by the increase in net income adjusted for non-cash items, partially offset by a decline in working capital.
Cash Conversion Cycle
Our cash conversion cycle is defined as DIO and DSO less DPO. The calculation of each component of the cash conversion cycle is provided below:
| | | | | | | | |
| Component | | Calculation (on a trailing twelve month basis) |
| DIO | | (Average inventory divided by cost of sales) * Number of days in the period |
| DSO | | (Accounts receivable divided by net sales) * Number of days in the period |
| DPO | | (Accounts payable * Number of days in the period) divided by cost of sales and SG&A expenses |
Our cash conversion cycle improved 10 days to approximately 66 days as of September 30, 2021 as compared to 56 days in the prior year period. The following table summarizes our cash conversion cycle:
| | | | | | | | | | | | | | |
| | September 30, |
| | 2021 | | 2020 |
| DIO | | 58 | | | 53 | |
| DSO | | 33 | | | 34 | |
| DPO | | 157 | | | 143 | |
| Cash conversion cycle | | (66) | | | (56) | |
Accounts Payable Program
As part of our ongoing efforts to improve our cash flow and related liquidity, we work with our suppliers to optimize our terms and conditions, which include the extension of payment terms. Excluding our suppliers who require cash at date of purchase or sale, our current payment terms with our suppliers generally range from 10 to 360 days. We also entered into agreements with third party administrators to allow participating suppliers to track payment obligations from us, and if voluntarily elected by the supplier, sell payment obligations from us to financial institutions. Suppliers can sell one or more of our payment obligations at their sole discretion and our rights and obligations to our suppliers are not impacted. We have no economic interest in a supplier’s decision to enter into these agreements and no direct financial relationship with the financial institutions. Our obligations to our suppliers, including amounts due and scheduled payment terms, are not impacted. We have been informed by the third party administrators that as of September 30, 2021 and December 31, 2020, $3,027 million and $2,578 million, respectively, of our outstanding payment obligations were voluntarily elected by the supplier and sold to financial institutions. The amounts settled through the program and paid to the financial institutions were $2,492 million and $2,022 million for the first nine months of 2021 and 2020, respectively.
Impact of the Cares Act
Beginning in the second quarter of 2020, we deferred payments of employer-related payroll taxes as allowed under the U.S. Coronavirus Aid, Relief and Economic Security Act, commonly known as the CARES Act. Payment of at least 50% of the deferred amount is due on January 3, 2022, with the remainder due by January 3, 2023. As of September 30, 2021, we have deferred a total of $59 million in such payments.
Sources of Liquidity - Financing
In March 2021, we undertook a strategic refinancing and issued $2,150 million aggregate face value of Notes, consisting of $1,150 million aggregate principal amount of 0.750% 2024 Notes, $500 million aggregate principal amount of 2.250% 2031 Notes, and $500 million aggregate principal amount of 3.350% 2051 Notes. The proceeds from the issuance were used to voluntarily prepay several tranches of our existing Notes and our 2019 KDP Term Loan in order to take advantage of current market conditions to refinance our debt maturities at more attractive interest rates, while also extending the duration of our debt. We also terminated our 2020 364-Day Credit Agreement, which would have expired in April 2021, and replaced it with our 2021 364-Day Credit Agreement, which has a term-out option allowing us to extend the maturity date by converting the facility into a term loan agreement for an additional one-year term.
Additionally, in March 2021, we filed a prospectus supplement with the SEC in order to sell up to 4,300,000 shares to or through Goldman in at-the-market offerings, known as an ATM Program. The ATM Program was completed effective March 15, 2021, and the net proceeds of approximately $140 million were primarily used to cover our obligation to remit cash to local, state and federal tax authorities in connection with the net settlement of vesting restricted stock units during the first quarter of 2021. Commissions and fees paid under the ATM program were less than $1 million for the first nine months of 2021.
Refer to Note 2 of the Notes to our Unaudited Condensed Consolidated Financial Statements for management's discussion of our financing arrangements.
We also have an active shelf registration statement, filed with the SEC on August 27, 2019, which allows us to issue an indeterminate number or amount of common stock, preferred stock, debt securities and warrants from time to time in one or more offerings at the direction of our Board of Directors.
Debt Ratings
As of September 30, 2021, our credit ratings were as follows:
| | | | | | | | | | | | | | |
| Rating Agency | Long-Term Debt Rating | Commercial Paper Rating | Outlook | Date of Last Change |
| Moody's | Baa2 | P-2 | Stable | February 26, 2021 |
| S&P | BBB | A-2 | Stable | May 14, 2018 |
These debt and commercial paper ratings impact the interest we pay on our financing arrangements. A downgrade of one or both of our debt and commercial paper ratings could increase our interest expense and decrease the cash available to fund anticipated obligations.
As of September 30, 2021, we were in compliance with all debt covenants and we have no reason to believe that we will be unable to satisfy these covenants.
Principal Uses of Capital Resources
Through the remainder of 2021, our principal uses of our capital resources following the DPS Merger are deleveraging, providing shareholder return to our investors through regular quarterly dividends, and investing in KDP to capture market share and drive growth through innovation and routes to market.
On October 1, 2021, we announced that our Board of Directors authorized a share repurchase program of up to $4 billion of our outstanding common stock, beginning on January 1, 2022, enabling us to opportunistically return value to shareholders. See Expansion of Our Capital Allocation Strategy below.
Deleveraging and Other Debt Repayments
In 2018, management set deleveraging targets for a 2-3 year time period following the DPS Merger in order to optimize our balance sheet, and we continue to be focused on achieving those targets. Since the DPS Merger, we have made net repayments of $4,047 million of our Notes, our commercial paper and our other credit agreements, including $872 million for the first nine months of 2021.
In May 2021, our 2021 Merger Notes were repaid at maturity, using cash generated from operations and the issuance of commercial paper.
Regular Quarterly Dividends
In February 2021, we announced that our Board of Directors approved a 25% increase in our annualized dividend rate to $0.75 per share, from the current annualized rate of $0.60 per share, effective with the Company’s regular quarterly dividend for the second quarter of 2021. For the first nine months of 2021, we have declared total dividends of $0.525 per share.
Capital Expenditures
We have significantly invested in state-of-the-art manufacturing and warehousing facilities, including expansive investments in new facilities in Newbridge, Ireland; Spartanburg, South Carolina; and Allentown, Pennsylvania, in 2021 and 2020, in order to optimize our supply chain network through integration and productivity projects and to mitigate risk of business interruption.
Purchases of property, plant and equipment were $325 million and $356 million for the first nine months of 2021 and 2020, respectively.
Capital expenditures, which includes both purchases of property, plant and equipment and amounts included in accounts payable and accrued expenses, for the first nine months of 2021 and 2020 primarily related to our continued investment in state-of-the-art manufacturing and warehousing facilities. Capital expenditures included in accounts payable and accrued expenses were $180 million and $255 million for the first nine months of 2021 and 2020, respectively, which primarily related to these investments.
As we begin to move past the three-year period after the DPS Merger, we expect that purchases of property, plant and equipment will be approximately 3% of net sales on an annualized basis.
Purchases of Intangible Assets
We have invested in the expansion of our DSD network through transactions with strategic independent bottlers to ensure competitive distribution scale for our brands. These transactions are generally accounted for as an asset acquisition, as the majority of the transaction price represents the reacquisition of our distribution rights. Purchases of intangible assets were $31 million and $26 million for the first nine months of 2021 and 2020, respectively.
Expansion of Our Capital Allocation Strategy
Beginning on January 1, 2022, we intend to expand our capital allocation strategy to include inorganic options to drive total shareholder return. Our primary inorganic option to drive total shareholder return will be through strategic acquisitions. However, to the extent our primary option does not occur, we may employ secondary options, which may include the repurchase of shares or special dividends. See Part II, Item 2, Unregistered Sales of Equity Securities and Use of Proceeds, for further information.
Uncertainties and Trends Affecting Liquidity
Disruptions in financial and credit markets, including those caused by the ongoing COVID-19 pandemic, may impact our ability to manage normal commercial relationships with our customers, suppliers and creditors. These disruptions could have a negative impact on the ability of our customers to timely pay their obligations to us, thus reducing our cash flow, or the ability of our vendors to timely supply materials.
Customer and consumer demand for our products may also be impacted by the risk factors discussed under "Risk Factors" in Part 1, Item 1A of our Annual Report, as well as subsequent filings with the SEC, that could have a material effect on production, delivery and consumption of our products, which could result in a reduction in our sales volume.
We believe that the following events, trends and uncertainties may also impact liquidity:
•Our intention to drive significant cash flow generation to enable continued deleveraging through the end of 2021;
•Our ability to access our committed financing arrangements, including our KDP Revolver and our 2021 364-Day Credit Agreement;
•Our ability to issue unsecured uncommitted commercial paper notes on a private placement basis up to a maximum aggregate amount outstanding at any time of $2,400 million;
•A significant downgrade in our credit ratings could limit i) a financial institution's willingness to participate in our accounts payable program and reduce the attractiveness of the accounts payable program to participating suppliers who may sell payment obligations from us to financial institutions, which could impact our accounts payable program; or ii) our ability to issue debt at terms that are favorable to us;
•Our continued payment of regular quarterly dividends;
•Our continued capital expenditures;
•Future mergers or acquisitions, which may include brand ownership companies, regional bottling companies, distributors and/or distribution rights to further extend our geographic coverage;
•Future opportunistic repurchases of our common stock or special dividends to drive total shareholder return;
•Future equity investments;
•Seasonality of our operating cash flows, which could impact short-term liquidity; and
•Fluctuations in our tax obligations.
SUPPLEMENTAL GUARANTOR FINANCIAL INFORMATION
The Notes are fully and unconditionally guaranteed by certain of our direct and indirect subsidiaries (the "Guarantors"), as defined in the indentures governing the Notes. The Guarantors are 100% owned either directly or indirectly by us and jointly and severally guarantee, subject to the release provisions described below, our obligations under the Notes. None of our subsidiaries organized outside of the U.S., immaterial subsidiaries used for charitable purposes, any of the subsidiaries held by Maple Parent Holdings Corp. prior to the DPS Merger or any of the subsidiaries acquired after the DPS Merger (collectively, the "Non-Guarantors") guarantee the Notes. The subsidiary guarantees with respect to the Notes are subject to release upon the occurrence of certain events, including the sale of all or substantially all of a subsidiary's assets, the release of the subsidiary's guarantee of our other indebtedness, our exercise of the legal defeasance option with respect to the Notes and the discharge of our obligations under the applicable indenture.
The following schedules present the summarized financial information for Keurig Dr Pepper Inc. (the “Parent”) and the Guarantors on a combined basis after intercompany eliminations; the Parent and the Guarantors' amounts due from and amounts due to Non-Guarantors are disclosed separately. The consolidating schedules are provided in accordance with the reporting requirements of Rule 13-01 under SEC Regulation S-X for the issuer and guarantor subsidiaries.
The summarized financial information for the Parent and Guarantors were as follows:
| | | | | |
| (in millions) | For the First Nine Months of 2021 |
| Net sales | $ | 5,384 | |
| |
| Income from operations | 1,149 | |
| Net income attributable to KDP | 1,303 | |
| | | | | | | | | | | |
| (in millions) | September 30, 2021 | | December 31, 2020 |
| Current assets | $ | 1,774 | | | $ | 1,810 | |
| Non-current assets | 43,821 | | | 43,333 | |
Total assets(1) | $ | 45,595 | | | $ | 45,143 | |
| | | |
| Current liabilities | $ | 4,164 | | | $ | 5,148 | |
| Non-current liabilities | 17,026 | | | 16,164 | |
Total liabilities(2) | $ | 21,190 | | | $ | 21,312 | |
(1)Includes $133 million and $423 million of intercompany receivables due to the Parent and Guarantors from the Non-Guarantors as of September 30, 2021 and December 31, 2020, respectively.
(2)Includes $37 million and $30 million of intercompany payables due to the Non-Guarantors from the Parent and Guarantors as of September 30, 2021 and December 31, 2020, respectively.
NON-GAAP FINANCIAL MEASURES
To supplement the consolidated financial statements presented in accordance with U.S. GAAP, we have presented for the third quarter and first nine months of 2021 and 2020 (i) Adjusted income from operations, (ii) Adjusted interest expense, (iii) Adjusted provision for income taxes, (iv) Adjusted net income attributable to KDP and (v) Adjusted diluted EPS, which are considered non-GAAP financial measures. The non-GAAP financial measures provided should be viewed in addition to, and not as an alternative for, results prepared in accordance with U.S. GAAP. The non-GAAP financial measures presented may differ from similarly titled non-GAAP financial measures presented by other companies, and other companies may not define these non-GAAP financial measures in the same way. The adjusted measures are not substitutes for their comparable U.S. GAAP financial measures, such as income from operations, net income, diluted EPS or other measures prescribed by U.S. GAAP, and there are limitations to using non-GAAP financial measures. We use these non-GAAP financial measures, in addition to U.S. GAAP financial measures, to evaluate our operating and financial performance and to compare such performance to that of prior periods and to the performance of our competitors. Additionally, we use these non-GAAP financial measures in making operational and financial decisions and in our budgeting and planning process. We believe that providing these non-GAAP financial measures to investors helps investors evaluate our operating performance, profitability and business trends in a way that is consistent with how management evaluates such performance and consistent with guidance previously provided by us.
For the third quarter and first nine months of 2021 and 2020, we define our Adjusted non-GAAP financial measures as certain financial statement captions and metrics adjusted for certain items affecting comparability. The items affecting comparability are defined below.
Items affecting comparability: Defined as certain items that are excluded for comparison to prior year periods, adjusted for the tax impact as applicable. Tax impact is determined based upon an approximate rate for each item. For each period, management adjusts for (i) the unrealized mark-to-market impact of derivative instruments not designated as hedges in accordance with U.S. GAAP and do not have an offsetting risk reflected within the financial results; (ii) the amortization associated with definite-lived intangible assets; (iii) the amortization of the deferred financing costs associated with the DPS Merger; (iv) the amortization of the fair value adjustment of the senior unsecured notes obtained as a result of the DPS Merger; (v) stock compensation expense and the associated windfall tax benefit attributable to the matching awards made to employees who made an initial investment in KDP; (vi) non-cash changes in deferred tax liabilities related to goodwill and other intangible assets as a result of tax rate or apportionment changes; and (vii) other certain items that are excluded for comparison purposes to prior year periods.
For the third quarter and first nine months of 2021, the other certain items excluded for comparison purposes include (i) restructuring and integration expenses related to significant business combinations; (ii) productivity expenses; (iii) costs related to significant non-routine legal matters; (iv) the loss on early extinguishment of debt related to the redemption of debt; (v) incremental costs to our operations related to risks associated with the COVID-19 pandemic; and (vi) gains from insurance recoveries related to the February 2019 organized malware attack on our business operation networks in the Coffee Systems segment.
For the third quarter and first nine months of 2020, the other certain items excluded for comparison purposes include (i) restructuring and integration expenses related to significant business combinations; (ii) productivity expenses; (iii) transaction costs for significant business combinations (completed or abandoned) excluding the DPS Merger; (iv) costs related to significant non-routine legal matters; (v) the loss on early extinguishment of debt related to the redemption of debt, (vi) incremental costs to our operations related to risks associated with the COVID-19 pandemic and (vii) impairment recognized on our equity method investments with Bedford and LifeFuels.
Incremental costs to our operations related to risks associated with the COVID-19 pandemic include incremental expenses incurred to either maintain the health and safety of our front-line employees or temporarily increase compensation to such employees to ensure essential operations continue during the pandemic. We believe removing these costs reflects how management views our business results on a consistent basis. See Impact of COVID-19 on our Financial Statements for further information.
For the third quarter and first nine months of 2021 and 2020, the supplemental financial data set forth below includes reconciliations of Adjusted income from operations, Adjusted interest expense, Adjusted provision for income taxes, Adjusted net income attributable to KDP and Adjusted diluted EPS to the applicable financial measure presented in the unaudited condensed consolidated financial statement for the same period.
KEURIG DR PEPPER INC.
RECONCILIATION OF CERTAIN REPORTED ITEMS TO CERTAIN NON-GAAP ADJUSTED ITEMS
For the Third Quarter of 2021
(Unaudited, in millions, except per share data)
| | | | | | | | | | | | | | | | | | | | | | | | | | | | | | | | | | | | | | | | | |
| | | Cost of sales | | Gross profit | | Gross margin | | Selling, general and administrative expenses | | | | | | Income from operations | | Operating margin |
| Reported | | | $ | 1,415 | | | $ | 1,835 | | | 56.5 | % | | $ | 1,040 | | | | | | | $ | 795 | | | 24.5 | % |
| Items Affecting Comparability: | | | | | | | | | | | | | | | | | |
| Mark to market | | | 27 | | | (27) | | | | | (18) | | | | | | | (9) | | | |
| Amortization of intangibles | | | — | | | — | | | | | (34) | | | | | | | 34 | | | |
| | | | | | | | | | | | | | | | | |
| | | | | | | | | | | | | | | | | |
| Stock compensation | | | — | | | — | | | | | (3) | | | | | | | 3 | | | |
| Restructuring and integration costs | | | — | | | — | | | | | (53) | | | | | | | 53 | | | |
| Productivity | | | (21) | | | 21 | | | | | (23) | | | | | | | 44 | | | |
| | | | | | | | | | | | | | | | | |
| | | | | | | | | | | | | | | | | |
| Nonroutine legal matters | | | — | | | — | | | | | (7) | | | | | | | 7 | | | |
| COVID-19 | | | (3) | | | 3 | | | | | (1) | | | | | | | 4 | | | |
| Transaction costs | | | — | | | — | | | | | (1) | | | | | | | 1 | | | |
| Malware incident | | | — | | | — | | | | | 1 | | | | | | | (1) | | | |
| | | | | | | | | | | | | | | | | |
| Adjusted | | | $ | 1,418 | | | $ | 1,832 | | | 56.4 | % | | $ | 901 | | | | | | | $ | 931 | | | 28.6 | % |
| | | | | | | | | | | | | | | | | | | | | | | | | | | | | | | | | | | | | | | | | | | | | |
| Interest expense | | | | | | | | Income before provision for income taxes | | Provision for income taxes | | Effective tax rate | | | | | | Net income attributable to KDP | | Diluted earnings per share |
| Reported | $ | 116 | | | | | | | | | $ | 678 | | | $ | 149 | | | 22.0 | % | | | | | | $ | 530 | | | $ | 0.37 | |
| Items Affecting Comparability: | | | | | | | | | | | | | | | | | | | | | |
| Mark to market | — | | | | | | | | | (9) | | | (3) | | | | | | | | | (6) | | | — | |
| Amortization of intangibles | — | | | | | | | | | 34 | | | 9 | | | | | | | | | 25 | | | 0.02 | |
| Amortization of deferred financing costs | (2) | | | | | | | | | 2 | | | 2 | | | | | | | | | — | | | — | |
| Amortization of fair value debt adjustment | (4) | | | | | | | | | 4 | | | 1 | | | | | | | | | 3 | | | — | |
| Stock compensation | — | | | | | | | | | 3 | | | — | | | | | | | | | 3 | | | — | |
| Restructuring and integration costs | — | | | | | | | | | 53 | | | 13 | | | | | | | | | 40 | | | 0.03 | |
| Productivity | — | | | | | | | | | 44 | | | 11 | | | | | | | | | 33 | | | 0.02 | |
| | | | | | | | | | | | | | | | | | | | | |
| Loss on early extinguishment of debt | — | | | | | | | | | — | | | (1) | | | | | | | | | 1 | | | — | |
| | | | | | | | | | | | | | | | | | | | | |
| Nonroutine legal matters | — | | | | | | | | | 7 | | | 2 | | | | | | | | | 5 | | | — | |
| COVID-19 | — | | | | | | | | | 4 | | | 1 | | | | | | | | | 3 | | | — | |
| Transaction costs | — | | | | | | | | | 1 | | | — | | | | | | | | | 1 | | | — | |
| Malware incident | — | | | | | | | | | (1) | | | (1) | | | | | | | | | — | | | — | |
| Change in deferred tax liabilities related to goodwill and other intangible assets | — | | | | | | | | | — | | | 7 | | | | | | | | | (7) | | | — | |
| Adjusted | $ | 110 | | | | | | | | | $ | 820 | | | $ | 190 | | | 23.2 | % | | | | | | $ | 631 | | | $ | 0.44 | |
Diluted earnings per common share may not foot due to rounding.
KEURIG DR PEPPER INC.
RECONCILIATION OF CERTAIN REPORTED ITEMS TO CERTAIN NON-GAAP ADJUSTED ITEMS
For the Third Quarter of 2020
(Unaudited, in millions, except per share data)
| | | | | | | | | | | | | | | | | | | | | | | | | | | | | | | | | | | | | | | |
| | | Cost of sales | | Gross profit | | Gross margin | | Selling, general and administrative expenses | | | | Income from operations | | Operating margin |
| Reported | | | $ | 1,316 | | | $ | 1,704 | | | 56.4 | % | | $ | 949 | | | | | $ | 753 | | | 24.9 | % |
| Items Affecting Comparability: | | | | | | | | | | | | | | | |
| Mark to market | | | 46 | | | (46) | | | | | (1) | | | | | (45) | | | |
| Amortization of intangibles | | | — | | | — | | | | | (34) | | | | | 34 | | | |
| | | | | | | | | | | | | | | |
| Stock compensation | | | — | | | — | | | | | (6) | | | | | 6 | | | |
| | | | | | | | | | | | | | | |
| Restructuring and integration costs | | | — | | | — | | | | | (39) | | | | | 39 | | | |
| Productivity | | | (10) | | | 10 | | | | | (20) | | | | | 30 | | | |
| | | | | | | | | | | | | | | |
| | | | | | | | | | | | | | | |
| Nonroutine legal matters | | | — | | | — | | | | | (8) | | | | | 8 | | | |
| | | | | | | | | | | | | | | |
| COVID-19 | | | (19) | | | 19 | | | | | (30) | | | | | 49 | | | |
| Adjusted | | | $ | 1,333 | | | $ | 1,687 | | | 55.9 | % | | $ | 811 | | | | | $ | 874 | | | 28.9 | % |
| | | | | | | | | | | | | | | | | | | | | | | | | | | | | | | | | | | | | | | | | | | | | |
| Interest expense | | | | Impairment of investments and note receivable | | | | Income before provision for income taxes | | Provision for income taxes | | Effective tax rate | | Net income including non-controlling interest | | Diluted earnings per share |
| Reported | $ | 148 | | | | | $ | 16 | | | | | $ | 584 | | | $ | 141 | | | 24.1 | % | | $ | 443 | | | $ | 0.31 | |
| Items Affecting Comparability: | | | | | | | | | | | | | | | | | |
| Mark to market | (1) | | | | | — | | | | | (44) | | | (13) | | | | | (31) | | | (0.02) | |
| Amortization of intangibles | — | | | | | — | | | | | 34 | | | 9 | | | | | 25 | | | 0.02 | |
| Amortization of deferred financing costs | (2) | | | | | — | | | | | 2 | | | 1 | | | | | 1 | | | — | |
| Amortization of fair value debt adjustment | (6) | | | | | — | | | | | 6 | | | 1 | | | | | 5 | | | — | |
| Stock compensation | — | | | | | — | | | | | 6 | | | 1 | | | | | 5 | | | — | |
| Restructuring and integration costs | — | | | | | — | | | | | 39 | | | 8 | | | | | 31 | | | 0.02 | |
| Productivity | — | | | | | — | | | | | 30 | | | 8 | | | | | 22 | | | 0.02 | |
| | | | | | | | | | | | | | | | | |
| | | | | | | | | | | | | | | | | |
| Impairment on Investment | — | | | | | (16) | | | | | 16 | | | 4 | | | | | 12 | | | 0.01 | |
| Nonroutine legal matters | — | | | | | — | | | | | 8 | | | 1 | | | | | 7 | | | — | |
| | | | | | | | | | | | | | | | | |
| COVID-19 | — | | | | | — | | | | | 49 | | | 12 | | | | | 37 | | | 0.03 | |
| Adjusted | $ | 139 | | | | | $ | — | | | | | $ | 730 | | | $ | 173 | | | 23.7 | % | | $ | 557 | | | $ | 0.39 | |
Diluted earnings per common share may not foot due to rounding.
KEURIG DR PEPPER INC.
RECONCILIATION OF CERTAIN REPORTED ITEMS TO CERTAIN NON-GAAP ADJUSTED ITEMS
For the First Nine Months of 2021
(Unaudited, in millions, except per share data)
| | | | | | | | | | | | | | | | | | | | | | | | | | | | | | | | | | | | | | | |
| | | Cost of sales | | Gross profit | | Gross margin | | Selling, general and administrative expenses | | | | Income from operations | | Operating margin |
| Reported | | | $ | 4,087 | | | $ | 5,205 | | | 56.0 | % | | $ | 3,040 | | | | | $ | 2,169 | | | 23.3 | % |
| Items Affecting Comparability: | | | | | | | | | | | | | | | |
| Mark to market | | | 53 | | | (53) | | | | | 32 | | | | | (85) | | | |
| Amortization of intangibles | | | — | | | — | | | | | (101) | | | | | 101 | | | |
| Stock compensation | | | — | | | — | | | | | (14) | | | | | 14 | | | |
| Restructuring and integration costs | | | — | | | — | | | | | (145) | | | | | 145 | | | |
| Productivity | | | (43) | | | 43 | | | | | (72) | | | | | 115 | | | |
| Nonroutine legal matters | | | — | | | — | | | | | (23) | | | | | 23 | | | |
| COVID-19 | | | (22) | | | 22 | | | | | (9) | | | | | 31 | | | |
| Transaction costs | | | — | | | — | | | | | (1) | | | | | 1 | | | |
| Malware incident | | | — | | | — | | | | | 3 | | | | | (3) | | | |
| | | | | | | | | | | | | | | |
| Adjusted | | | $ | 4,075 | | | $ | 5,217 | | | 56.1 | % | | $ | 2,710 | | | | | $ | 2,511 | | | 27.0 | % |
| | | | | | | | | | | | | | | | | | | | | | | | | | | | | | | | | | | | | | | | | | | | | | | | | |
| Interest expense | | Loss on early extinguishment of debt | | | | | | Income before provision for income taxes | | Provision for income taxes | | Effective tax rate | | | | | | Net income attributable to KDP | | Diluted earnings per share |
| Reported | $ | 381 | | | $ | 105 | | | | | | | $ | 1,689 | | | $ | 387 | | | 22.9 | % | | | | | | $ | 1,303 | | | $ | 0.91 | |
| Items Affecting Comparability: | | | | | | | | | | | | | | | | | | | | | |
| Mark to market | 7 | | | — | | | | | | | (92) | | | (23) | | | | | | | | | (69) | | | (0.05) | |
| Amortization of intangibles | — | | | — | | | | | | | 101 | | | 26 | | | | | | | | | 75 | | | 0.05 | |
| Amortization of deferred financing costs | (6) | | | — | | | | | | | 6 | | | 2 | | | | | | | | | 4 | | | — | |
| Amortization of fair value debt adjustment | (14) | | | — | | | | | | | 14 | | | 3 | | | | | | | | | 11 | | | 0.01 | |
| Stock compensation | — | | | — | | | | | | | 14 | | | 14 | | | | | | | | | — | | | — | |
| Restructuring and integration costs | — | | | — | | | | | | | 145 | | | 35 | | | | | | | | | 110 | | | 0.08 | |
| Productivity | — | | | — | | | | | | | 115 | | | 29 | | | | | | | | | 86 | | | 0.06 | |
| Loss on early extinguishment of debt | — | | | (105) | | | | | | | 105 | | | 24 | | | | | | | | | 81 | | | 0.06 | |
| | | | | | | | | | | | | | | | | | | | | |
| Nonroutine legal matters | — | | | — | | | | | | | 23 | | | 5 | | | | | | | | | 18 | | | 0.01 | |
| COVID-19 | — | | | — | | | | | | | 31 | | | 8 | | | | | | | | | 23 | | | 0.02 | |
| Transaction costs | — | | | — | | | | | | | 1 | | | — | | | | | | | | | 1 | | | — | |
| Malware incident | — | | | — | | | | | | | (3) | | | (1) | | | | | | | | | (2) | | | — | |
| Change in deferred tax liabilities related to goodwill and other intangible assets | — | | | — | | | | | | | — | | | 1 | | | | | | | | | (1) | | | — | |
| Adjusted | $ | 368 | | | $ | — | | | | | | | $ | 2,149 | | | $ | 510 | | | 23.7 | % | | | | | | $ | 1,640 | | | $ | 1.15 | |
Diluted earnings per common share may not foot due to rounding.
KEURIG DR PEPPER INC.
RECONCILIATION OF CERTAIN REPORTED ITEMS TO CERTAIN NON-GAAP ADJUSTED ITEMS
For the First Nine Months of 2020
(Unaudited, in millions, except per share data)
| | | | | | | | | | | | | | | | | | | | | | | | | | | | | | | | | | | | | | | |
| | | Cost of sales | | Gross profit | | Gross margin | | Selling, general and administrative expenses | | | | Income from operations | | Operating margin |
| Reported | | | $ | 3,779 | | | $ | 4,718 | | | 55.5 | % | | $ | 2,978 | | | | | $ | 1,780 | | | 20.9 | % |
| Items Affecting Comparability: | | | | | | | | | | | | | | | |
| Mark to market | | | 2 | | | (2) | | | | | (28) | | | | | 26 | | | |
| Amortization of intangibles | | | — | | | — | | | | | (100) | | | | | 100 | | | |
| Stock compensation | | | — | | | — | | | | | (21) | | | | | 21 | | | |
| Restructuring and integration costs | | | — | | | — | | | | | (143) | | | | | 143 | | | |
| Productivity | | | (28) | | | 28 | | | | | (75) | | | | | 103 | | | |
| Nonroutine legal matters | | | — | | | — | | | | | (43) | | | | | 43 | | | |
| COVID-19 | | | (38) | | | 38 | | | | | (79) | | | | | 117 | | | |
| Adjusted | | | $ | 3,715 | | | $ | 4,782 | | | 56.3 | % | | $ | 2,489 | | | | | $ | 2,333 | | | 27.5 | % |
| | | | | | | | | | | | | | | | | | | | | | | | | | | | | | | | | | | | | | | | | | | | | | | |
| Interest expense | | Loss on early extinguishment of debt | | Impairment of investment and note receivable | | Income before provision for income taxes | | Provision for income taxes | | Effective tax rate | | Net income attributable to KDP | | Diluted earnings per share |
| Reported | $ | 458 | | | $ | 4 | | | $ | 102 | | | $ | 1,195 | | | $ | 298 | | | 24.9 | % | | $ | 897 | | | $ | 0.63 | |
| Items Affecting Comparability: | | | | | | | | | | | | | | | |
| Mark to market | (28) | | | — | | | — | | | 54 | | | 13 | | | | | 41 | | | 0.03 | |
| Amortization of intangibles | — | | | — | | | — | | | 100 | | | 27 | | | | | 73 | | | 0.05 | |
| Amortization of deferred financing costs | (8) | | | — | | | — | | | 8 | | | 2 | | | | | 6 | | | — | |
| Amortization of fair value debt adjustment | (18) | | | — | | | — | | | 18 | | | 4 | | | | | 14 | | | 0.01 | |
| Stock compensation | — | | | — | | | — | | | 21 | | | 4 | | | | | 17 | | | 0.01 | |
| Restructuring and integration costs | | | — | | | — | | | 143 | | | 34 | | | | | 109 | | | 0.08 | |
| Productivity | — | | | — | | | — | | | 103 | | | 27 | | | | | 76 | | | 0.05 | |
| Loss on early extinguishment of debt | — | | | (4) | | | — | | | 4 | | | 1 | | | | | 3 | | | — | |
| Impairment of investment and note receivable | — | | | — | | | (102) | | | 102 | | | 25 | | | | | 77 | | | 0.05 | |
| Nonroutine legal matters | — | | | — | | | — | | | 43 | | | 10 | | | | | 33 | | | 0.02 | |
| COVID-19 | — | | | — | | | — | | | 117 | | | 29 | | | | | 88 | | | 0.06 | |
| Adjusted | $ | 404 | | | $ | — | | | $ | — | | | $ | 1,908 | | | $ | 474 | | | 24.8 | % | | $ | 1,434 | | | $ | 1.01 | |
Diluted earnings per common share may not foot due to rounding.
KEURIG DR PEPPER INC.
RECONCILIATION OF SEGMENT ITEMS TO CERTAIN NON-GAAP ADJUSTED SEGMENT ITEMS
(Unaudited)
| | | | | | | | | | | | | | | | | |
| (in millions) | Reported | | Items Affecting Comparability | | Adjusted GAAP |
| For the third quarter of 2021: | | | | | |
| | | | | |
| | | | | |
| | | | | |
| | | | | |
| | | | | |
| | | | | |
| | | | | |
| Income from Operations | | | | | |
| Coffee Systems | $ | 334 | | | $ | 43 | | | $ | 377 | |
| Packaged Beverages | 288 | | | 24 | | | 312 | |
| Beverage Concentrates | 286 | | | 3 | | | 289 | |
| Latin America Beverages | 37 | | | — | | | 37 | |
| Unallocated corporate costs | (150) | | | 66 | | | (84) | |
| Total income from operations | $ | 795 | | | $ | 136 | | | $ | 931 | |
| | | | | |
| For the third quarter of 2020: | | | | | |
| Income from Operations | | | | | |
| Coffee Systems | $ | 320 | | | $ | 53 | | | $ | 373 | |
| Packaged Beverages | 260 | | | 44 | | | 304 | |
| Beverage Concentrates | 262 | | | 3 | | | 265 | |
| Latin America Beverages | 25 | | | — | | | 25 | |
| Unallocated corporate costs | (114) | | | 21 | | | (93) | |
| Total income from operations | $ | 753 | | | $ | 121 | | | $ | 874 | |
KEURIG DR PEPPER INC.
RECONCILIATION OF SEGMENT ITEMS TO CERTAIN NON-GAAP ADJUSTED SEGMENT ITEMS
(Unaudited)
| | | | | | | | | | | | | | | | | |
| (in millions) | Reported | | Items Affecting Comparability | | Adjusted GAAP |
| For the first nine months of 2021: | | | | | |
| | | | | |
| | | | | |
| | | | | |
| | | | | |
| | | | | |
| | | | | |
| | | | | |
| Income from Operations | | | | | |
| Coffee Systems | $ | 992 | | | $ | 145 | | | $ | 1,137 | |
| Packaged Beverages | 721 | | | 74 | | | 795 | |
| Beverage Concentrates | 778 | | | 6 | | | 784 | |
| Latin America Beverages | 95 | | | 2 | | | 97 | |
| Unallocated corporate costs | (417) | | | 115 | | | (302) | |
| Total income from operations | $ | 2,169 | | | $ | 342 | | | $ | 2,511 | |
| | | | | |
| For the first nine months of 2020: | | | | | |
| Income from Operations | | | | | |
| Coffee Systems | $ | 882 | | | $ | 201 | | | $ | 1,083 | |
| Packaged Beverages | 657 | | | 119 | | | 776 | |
| Beverage Concentrates | 679 | | | 5 | | | 684 | |
| Latin America Beverages | 73 | | | 2 | | | 75 | |
| Unallocated corporate costs | (511) | | | 226 | | | (285) | |
| Total income from operations | $ | 1,780 | | | $ | 553 | | | $ | 2,333 | |
ITEM 3. Quantitative and Qualitative Disclosures About Market Risk
We are exposed to market risks arising from changes in market rates and prices, including movements in foreign currency exchange rates, interest rates and commodity prices. From time to time, we may enter into derivatives or other financial instruments to hedge or mitigate commercial risks. We do not enter into derivative instruments for speculation, investing or trading.
FOREIGN EXCHANGE RISK
The majority of our net sales, expenses and capital purchases are transacted in U.S. dollars. However, we have exposure with respect to foreign exchange rate fluctuations. Our primary exposure to foreign exchange rates is the Canadian dollar and Mexican peso against the U.S. dollar. Exchange rate gains or losses related to foreign currency transactions are recognized as transaction gains or losses in our income statement as incurred. As of September 30, 2021, the impact to our income from operations of a 10% change (up or down) in exchange rates is estimated to be an increase or decrease of approximately $42 million on an annual basis.
We use derivative instruments such as foreign exchange forward contracts to manage a portion of our exposure to changes in foreign exchange rates. As of September 30, 2021, we had derivative contracts outstanding with a notional value of $879 million maturing at various dates through September 25, 2024.
INTEREST RATE RISK
We centrally manage our debt portfolio through the use of interest rate contracts and monitor our mix of fixed-rate and variable-rate debt. As of September 30, 2021, the carrying value of our fixed-rate debt, excluding lease obligations, was $11,727 million and our variable-rate debt was $998 million, comprised entirely of commercial paper. Additionally, as of September 30, 2021, the total notional value of receive-variable, pay-fixed interest rate swaps was $450 million and the total notional value of receive-fixed, pay-variable interest rate swaps was $250 million. Our variable-rate instruments are generally based on LIBOR and a credit spread.
We estimate that the potential impact to our interest rate expense associated with variable rate debt and derivative instruments resulting from a hypothetical interest rate change of 1%, based on variable-rate debt and derivative instrument levels as of September 30, 2021, would be an increase of approximately $8 million or decrease of approximately $3 million. Our estimate of the annual impact to interest expense reflects our assumption that LIBOR will not fall below 0%.
COMMODITY RISKS
We are subject to market risks with respect to commodities because our ability to recover increased costs through higher pricing may be limited by the competitive environment in which we operate. Our principal commodities risks relate to our purchases of coffee beans, PET, aluminum, diesel fuel, corn (for high fructose corn syrup), apple juice concentrate, sucrose and natural gas (for use in processing and packaging).
We utilize commodities derivative instruments and supplier pricing agreements to hedge the risk of adverse movements in commodity prices for limited time periods for certain commodities. As of September 30, 2021, we had derivative contracts outstanding with a notional value of $440 million maturing at various dates through February 24, 2023. The fair market value of these contracts as of September 30, 2021 was a net asset of $133 million.
As a result of the current inflationary environment, described above in Item 2. Management’s Discussion and Analysis, we have fully utilized the aforementioned derivative instruments and supplier pricing agreements to minimize the further risk of inflation in the fourth quarter of 2021. As of September 30, 2021, we believe the impact of a 10% change (up or down) in market prices for these commodities would be minimal to our income from operations for the remainder of the year ending December 31, 2021.
ITEM 4. Controls and Procedures
EVALUATION OF DISCLOSURE CONTROLS AND PROCEDURES
Based on evaluation of the effectiveness of our disclosure controls and procedures (as defined in Rule 13a-15(e) and 15d-15(e) of the Exchange Act) our management, including our Chief Executive Officer and Chief Financial Officer, has concluded that, as of September 30, 2021, our disclosure controls and procedures are effective to (i) provide reasonable assurance that information required to be disclosed in the Exchange Act filings is recorded, processed, summarized and reported within the time periods specified by the SEC's rules and forms, and (ii) ensure that information required to be disclosed by us in the reports we file or submit under the Exchange Act are accumulated and communicated to our management, including our Chief Executive Officer and Chief Financial Officer, as appropriate to allow timely decisions regarding required disclosure.
No change in our internal control over financial reporting (as defined in Rule 13a-15(f) of the Exchange Act) occurred during the quarter ended September 30, 2021 that materially affected, or is reasonably likely to materially affect, our internal control over financial reporting.
PART II – OTHER INFORMATION
ITEM 1. Legal Proceedings
We are occasionally subject to litigation or other legal proceedings relating to our business. See Note 15 of the Notes to our Unaudited Condensed Consolidated Financial Statements for more information related to commitments and contingencies, which is incorporated herein by reference.
BODYARMOR LITIGATION
On March 6, 2019, ABC, a subsidiary of KDP, filed suit against BodyArmor and Mike Repole in the Superior Court for the State of Delaware. The complaint asserted claims for breach of contract and promissory estoppel against BodyArmor and asserted a claim for tortious interference against Mr. Repole, in each case in connection with BodyArmor's attempted early termination of the distribution contract between BodyArmor and ABC. The complaint seeks monetary damages relating to lost distribution revenues, disgorgement of profits, liquidated and punitive damages, attorneys' fees and costs. ABC filed an amended complaint, which added Coca-Cola as a defendant to the suit and asserted a claim for tortious interference against Coca-Cola. In December 2020, the court dismissed the individual claim against Mr. Repole, but ABC's claims against BodyArmor and Coca-Cola continue. Fact and expert discovery in the case is ongoing, and a trial date is set for February 2022. ABC intends to continue to vigorously prosecute the action. We are unable to predict the outcome of the lawsuit, the potential recovery, if any, associated with the resolution of the lawsuit or any potential effect it may have on us or our operations.
ITEM 1A. Risk Factors
There have been no material changes from the risk factors set forth in Part I, Item 1A in our Annual Report.
ITEM 2. Unregistered Sales of Equity Securities and Use of Proceeds
On October 1, 2021, our Board of Directors authorized a share repurchase program of up to $4 billion of our outstanding common stock, enabling us to opportunistically return value to shareholders. The $4 billion authorization is effective for four years, beginning on January 1, 2022 and expiring on December 31, 2025, and does not require the purchase of any minimum number of shares.
ITEM 6. Exhibits
| | | | | |
| Amended and Restated Certificate of Incorporation of Dr Pepper Snapple Group, Inc. (filed as Exhibit 3.1 to the Company's Current Report on Form 8-K (filed on May 12, 2008) and incorporated herein by reference). |
| Certificate of Amendment to Amended and Restated Certificate of Incorporation of Dr Pepper Snapple Group, Inc. effective as of May 17, 2012 (filed as Exhibit 3.2 to the Company's Quarterly Report on Form 10-Q (filed July 26, 2012) and incorporated herein by reference). |
| Certificate of Second Amendment to Amended and Restated Certificate of Incorporation of Dr Pepper Snapple Group, Inc. effective as of May 19, 2016 (filed as Exhibit 3.1 to the Company's Current Report on Form 8-K (filed May 20, 2016) and incorporated herein by reference). |
| Certificate of Third Amendment to the Amended and Restated Certificate of Incorporation of Dr Pepper Snapple Group, Inc. effective as of July 9, 2018 (filed as Exhibit 3.1 to the Company's Current Report on Form 8-K (filed July 9, 2018) and incorporate herein by reference). |
| Amended and Restated By-Laws of Keurig Dr Pepper Inc. effective as of July 9, 2018 (filed as Exhibit 3.2 to the Company's Current Report on Form 8-K (filed July 9, 2018) and incorporated herein by reference. |
| Indenture, dated April 30, 2008, between Dr Pepper Snapple Group, Inc. and Wells Fargo Bank, N.A. (filed as Exhibit 4.1 to the Company's Current Report on Form 8-K (filed on May 1, 2008) and incorporated herein by reference). |
| Form of 7.45% Senior Notes due 2038 (filed as Exhibit 4.4 to the Company's Current Report on Form 8-K (filed on May 1, 2008) and incorporated herein by reference). |
| Registration Rights Agreement, dated April 30, 2008, between Dr Pepper Snapple Group, Inc., J.P. Morgan Securities Inc., Banc of America Securities LLC, Goldman, Sachs & Co., Morgan Stanley & Co. Incorporated, UBS Securities LLC, BNP Paribas Securities Corp., Mitsubishi UFJ Securities International plc, Scotia Capital (USA) Inc., SunTrust Robinson Humphrey, Inc., Wachovia Capital Markets, LLC and TD Securities (USA) LLC (filed as Exhibit 4.5 to the Company's Current Report on Form 8-K (filed on May 1, 2008) and incorporated herein by reference). |
| Registration Rights Agreement Joinder, dated May 7, 2008, by the subsidiary guarantors named therein (filed as Exhibit 4.2 to the Company's Current Report on Form 8-K (filed on May 12, 2008) and incorporated herein by reference). |
| Supplemental Indenture, dated May 7, 2008, among Dr Pepper Snapple Group, Inc., the subsidiary guarantors named therein and Wells Fargo Bank, N.A., as trustee (filed as Exhibit 4.1 to the Company's Current Report on Form 8-K (filed on May 12, 2008) and incorporated herein by reference). |
| Second Supplemental Indenture dated March 17, 2009, to be effective as of December 31, 2008, among Splash Transport, Inc., as a subsidiary guarantor, Dr Pepper Snapple Group, Inc., and Wells Fargo Bank, N.A., as trustee (filed as Exhibit 4.8 to the Company's Annual Report on Form 10-K (filed on March 26, 2009) and incorporated herein by reference). |
| Third Supplemental Indenture, dated October 19, 2009, among 234DP Aviation, LLC, as a subsidiary guarantor; Dr Pepper Snapple Group, Inc., and Wells Fargo Bank, N.A., as trustee (filed as Exhibit 4.9 to the Company's Quarterly Report on Form 10-Q (filed November 5, 2009) and incorporated herein by reference). |
| Fourth Supplemental Indenture, dated as of January 31, 2017, among Bai Brands LLC, a New Jersey limited liability company, 184 Innovations Inc., a Delaware corporation (each as a new subsidiary guarantors under the Indenture dated April 30, 2008 (as referenced in Item 4.1 in this Exhibit Index), Dr Pepper Snapple Group, Inc., each other then-existing Guarantor under the Indenture and Wells Fargo, National Bank, N.A., as trustee (filed as Exhibit 4.1 to the Company's Current Report on Form 8-K (filed February 2, 2017) and incorporated herein by reference). |
| Indenture, dated as of December 15, 2009, between Dr Pepper Snapple Group, Inc. and Wells Fargo Bank, N.A., as trustee (filed as Exhibit 4.1 to the Company's Current Report on Form 8-K (filed on December 23, 2009) and incorporated herein by reference). |
| Fifth Supplemental Indenture, dated as of November 9, 2015, among Dr Pepper Snapple Group, Inc., the guarantors party thereto and Wells Fargo Bank, N.A., as trustee (filed as Exhibit 4.1 to the Company's Current Report on Form 8-K (filed on November 10, 2015) and incorporated herein by reference). |
| 3.40% Senior Note due 2025 (in global form), dated November 9, 2015, in the principal amount of $500,000,000 (filed as Exhibit 4.2 to the Company's Current Report on Form 8-K (filed on November 10, 2015) and incorporated herein by reference). |
| 4.50% Senior Note due 2045 (in global form), dated November 9, 2015, in the principal amount of $250,000,000 (filed as Exhibit 4.3 to the Company's Current Report on Form 8-K (filed on November 10, 2015) and incorporated herein by reference). |
| Sixth Supplemental Indenture, dated as of September 16, 2016, among Dr Pepper Snapple Group, Inc., the guarantors party thereto and Wells Fargo Bank, N.A., as trustee (filed as Exhibit 4.1 to the Company's Current Report on Form 8-K (filed on September 16, 2016) and incorporated herein by reference). |
| 2.55% Senior Note due 2026 (in global form), dated September 16, 2016, in the principal amount of $400,000,000 (filed as Exhibit 4.2 to the Company's Current Report on Form 8-K (filed on September 16, 2016) and incorporated herein by reference). |
| Seventh Supplemental Indenture, dated as of December 14, 2016, among Dr Pepper Snapple Group, Inc., the guarantors party thereto and Wells Fargo Bank, N.A., as trustee (filed as Exhibit 4.1 to the Company's Current Report on Form 8-K (filed on December 14, 2016) and incorporated herein by reference). |
| | | | | |
| 3.13% Senior Note due 2023 (in global form), dated December 14, 2016, in the principal amount of $500,000,000 (filed as Exhibit 4.3 to the Company's Current Report on Form 8-K (filed on December 14, 2016) and incorporated herein by reference). |
| 3.43% Senior Note due 2027 (in global form), dated December 14, 2016, in the principal amount of $400,000,000 (filed as Exhibit 4.4 to the Company's Current Report on Form 8-K (filed on December 14, 2016) and incorporated herein by reference). |
| 4.42% Senior Note due 2046 (in global form), dated December 14, 2016, in the principal amount of $400,000,000 (filed as Exhibit 4.5 to the Company's Current Report on Form 8-K (filed on December 14, 2016) and incorporated herein by reference). |
| Eighth Supplemental Indenture, dated as of January 31, 2017, among Bai Brands LLC, a New Jersey limited liability company, 184 Innovations Inc., a Delaware corporation (each as a new subsidiary guarantor under the Indenture dated April 30, 2008 (as referenced in Item 4.1 in this Exhibit Index), Dr Pepper Snapple Group, Inc., each other then-existing Guarantor under the Indenture) and Wells Fargo, National Bank, N.A., as trustee (filed as Exhibit 4.2 to the Company's Current Report on Form 8-K (filed on February 2, 2017) and incorporated herein by reference). |
| Ninth Supplemental Indenture, dated as of June 15, 2017, among Dr Pepper Snapple Group, Inc., the guarantors party thereto, and Wells Fargo Bank, N.A., as trustee (filed as Exhibit 4.1 to the Company's Current Report on Form 8-K (filed on June 15, 2017) and incorporated herein by reference). |
| Investor Rights Agreement by and among Keurig Dr Pepper Inc. and The Holders Listed on Schedule A thereto, dated as of July 9, 2018 (filed as Exhibit 4.1 to the Company's Current Report on Form 8-K (filed on July 9, 2018) and incorporated herein by reference). |
| Base Indenture, dated as of May 25, 2018 between Maple Escrow Subsidiary and Wells Fargo Bank, N.A. as trustee (filed as Exhibit 4.1 to the Company's Current Report on Form 8-K (filed on July 9, 2018) and incorporated herein by reference). |
| Second Supplemental Indenture (including the form of note), dated as of May 25, 2018, among Maple Escrow Subsidiary, Inc. and Maple Parent Holdings Corp. as parent guarantor, and Wells Fargo Bank, N.A., as trustee relating to the 2023 Notes (filed as Exhibit 4.3 to the Company's Current Report on Form 8-K (filed on July 9, 2018) and incorporated herein by reference). |
| Third Supplemental Indenture (including the form of note), dated as of May 25, 2018, among Maple Escrow Subsidiary, Inc. and Maple Parent Holdings Corp. as parent guarantor, and Wells Fargo Bank, N.A., as trustee relating to the 2025 Notes (filed as Exhibit 4.4 to the Company's Current Report on Form 8-K (filed on July 9, 2018) and incorporated herein by reference). |
| Fourth Supplemental Indenture (including the form of note), dated as of May 25, 2018, among Maple Escrow Subsidiary, Inc. and Maple Parent Holdings Corp. as parent guarantor, and Wells Fargo Bank, N.A., as trustee relating to the 2028 Notes (filed as Exhibit 4.5 to the Company's Current Report on Form 8-K (filed on July 9, 2018) and incorporated herein by reference). |
| Fifth Supplemental Indenture (including the form of note), dated as of May 25, 2018, among Maple Escrow Subsidiary, Inc. and Maple Parent Holdings Corp. as parent guarantor, and Wells Fargo Bank, N.A., as trustee relating to the 2038 Notes (filed as Exhibit 4.6 to the Company's Current Report on Form 8-K (filed on July 9, 2018) and incorporated herein by reference). |
| Sixth Supplemental Indenture (including the form of note), dated as of May 25, 2018, among Maple Escrow Subsidiary, Inc. and Maple Parent Holdings Corp. as parent guarantor, and Wells Fargo Bank, N.A., as trustee relating to the 2048 Notes (filed as Exhibit 4.7 to the Company's Current Report on Form 8-K (filed on July 9, 2018) and incorporated herein by reference). |
| Seventh Supplemental Indenture, dated as of July 9, 2018, among Keurig Dr Pepper Inc., the subsidiary guarantors thereto, and Wells Fargo Bank, N.A., as trustee (filed as Exhibit 4.8 to the Company's Current Report on Form 8-K (filed on July 9, 2018) and incorporated herein by reference). |
| Registration Rights Agreement, dated as of May 25, 2018, among Maple Escrow Subsidiary, Inc. and J.P. Morgan Securities LLC, Merrill Lynch, Pierce, Fenner & Smith Incorporated, Goldman Sachs & Co. LLC and Citigroup Global Markets Inc., as representative of the several purchasers of the Notes (filed as Exhibit 4.9 to the Company's Current Report on Form 8-K (filed on July 9, 2018) and incorporated herein by reference). |
| Joinder to the Registration Rights Agreement, dated as of May 25, 2018, among Maple Escrow Subsidiary, Inc. and J.P. Morgan Securities LLC, Merrill Lynch, Pierce, Fenner & Smith Incorporated, Goldman Sachs & Co. LLC and Citigroup Global Markets Inc., as representative of the several purchasers of the Notes (filed as Exhibit 4.10 to the Company's Current Report on Form 8-K (filed on July 9, 2018) and incorporated herein by reference). |
| Description of registered securities (filed as Exhibit 4.40 to the Company's Annual Report on Form 10-K (filed on February 27, 2020) and incorporated herein by reference). |
| Tenth Supplemental Indenture (including 3.20% Senior Notes Due 2030 and 3.80% Senior Notes Due 2050 (in global form)), dated as of April 13, 2020, among Keurig Dr Pepper Inc., the subsidiary guarantors thereto, and Wells Fargo Bank, N.A., as trustee (filed as Exhibit 4.1 to the Company's Current Report on Form 8-K (filed on April 13, 2020) and incorporated herein by reference). |
| Eleventh Supplemental Indenture (including 0.750% Senior Notes Due 2024, 2.250% Senior Notes Due 2031, and 3.350% Senior Notes Due 2051 (in global form)), dated as of March 15, 2021, among Keurig Dr Pepper Inc., the subsidiary guarantors thereto, and Wells Fargo Bank, N.A. as trustee (filed as Exhibit 4.1 to the Company’s Current Report on Form 8-K (filed on March 15, 2021) and incorporated herein by reference). |
| Amended and Restated Employment Agreement, dated as of July 2, 2018, by and between Keurig Green Mountain, Inc. and Robert J. Gamgort (filed as Exhibit 10.5 to the Company's Quarterly Report on Form 10-Q (filed on November 8, 2018) and incorporated herein by reference). ++ |
| | | | | |
| Employment Agreement, dated as of April 12, 2016, by and between Keurig Green Mountain, Inc. and Ozan Dokmecioglu (filed as Exhibit 10.6 to the Company's Quarterly Report on Form 10-Q (filed on November 8, 2018) and incorporated herein by reference). ++ |
| Restricted Stock Unit Award Terms and Conditions under the Keurig Dr Pepper Omnibus Incentive Plan of 2009 (filed as Exhibit 10.7 to the Company's Quarterly Report on Form 10-Q (filed on November 8, 2018) and incorporated herein by reference). ++ |
| Matching Restricted Stock Unit Award Terms and Conditions under the Keurig Dr Pepper Omnibus Incentive Plan of 2009 (filed as Exhibit 10.8 to the Company's Quarterly Report on Form 10-Q (filed on November 8, 2018) and incorporated herein by reference). ++ |
| Directors' Restricted Stock Unit Award Terms and Conditions under the Keurig Dr Pepper Omnibus Incentive Plan of 2009 (filed as Exhibit 10.9 to the Company's Quarterly Report on Form 10-Q (filed on November 8, 2018) and incorporated herein by reference). ++ |
| Keurig Dr Pepper Inc. Omnibus Stock Incentive Plan of 2019 (filed as Exhibit 10.1 to the Company's Current Report on Form 8-K (filed on June 11, 2019) and incorporated herein by reference).++ |
| Restricted Stock Unit Award Terms and Conditions under the Keurig Dr Pepper Omnibus Stock Incentive Plan of 2019 (filed as Exhibit 10.13 to the Company's Quarterly Report on Form 10-Q (filed on August 8, 2019) and incorporated herein by reference).++ |
| Matching Restricted Stock Unit Award Terms and Conditions under the Keurig Dr Pepper Omnibus Stock Incentive Plan of 2019 (filed as Exhibit 10.14 to the Company's Quarterly Report on Form 10-Q (filed on August 8, 2019) and incorporated herein by reference).++ |
| Keurig Dr Pepper Inc. Severance Pay Plan for Executives, effective as of January 1, 2020 (filed as Exhibit 10.12 to the Company's Annual Report on Form 10-K (filed on February 27, 2020) and incorporated herein by reference).++ |
| Restricted Stock Unit Award Terms and Conditions under the Keurig Dr Pepper Omnibus Stock Incentive Plan of 2019 (retention incentive awards for three of the Company’s Named Executive Officers) (filed as Exhibit 10.14 to the Company’s Quarterly Report on Form 10-Q (filed on October 29, 2020) and incorporated herein by reference). |
| Restricted Stock Unit Award Terms and Conditions under the Keurig Dr Pepper Omnibus Stock Incentive Plan of 2019, amended and restated as of December 7, 2020 (retention incentive award for one of the Company’s Named Executive Officers) (filed as Exhibit 10.14 to the Company’s Annual Report on Form 10-K (filed on February 25, 2021) and incorporated herein by reference).++ |
| Credit Agreement, dated as of February 28, 2018, among Maple Parent Holdings Corp., the banks and issuers of letters of credit party thereto, and JPMorgan Chase Bank, N.A., as administrative agent (filed as Exhibit 10.2 to the Company's Current Report on Form 8-K (filed on July 9, 2018) and incorporated herein by reference). |
| Suspension of Rights Agreement, dated September 10, 2021, among Keurig Dr Pepper Inc. (f/k/a Dr Pepper Snapple Group, Inc.), JPMorgan Chase Bank, N.A., as administrative agent, and the lenders and issuing banks party thereto.* |
| Credit Agreement, dated as of March 24, 2021, among Keurig Dr Pepper Inc., the lenders party thereto, and Bank of America, N.A., as administrative agent (filed as Exhibit 10.1 to the Company’s Current Report on Form 8-K (filed on March 26, 2021) and incorporated herein by reference). |
| Separation and Release Agreement, dated September 24, 2021, by and between the Company and Fernando Cortes (filed as Exhibit 10.1 to the Company’s Current Report on Form 8-K (filed on September 24, 2021) and incorporated herein by reference). ++ |
| Certification of Chief Executive Officer of Keurig Dr Pepper Inc. pursuant to Rule 13a-14(a) or 15d-14(a) promulgated under the Exchange Act. |
| Certification of Chief Financial Officer of Keurig Dr Pepper Inc. pursuant to Rule 13a-14(a) or 15d-14(a) promulgated under the Exchange Act. |
| Certification of Chief Executive Officer of Keurig Dr Pepper Inc. pursuant to Rule 13a-14(b) or 15d-14(b) promulgated under the Exchange Act, and Section 1350 of Chapter 63 of Title 18 of the United States Code. |
| Certification of Chief Financial Officer of Keurig Dr Pepper Inc. pursuant to Rule 13a-14(b) or 15d-14(b) promulgated under the Exchange Act, and Section 1350 of Chapter 63 of Title 18 of the United States Code. |
| 101* | The following financial information from Keurig Dr Pepper Inc.'s Quarterly Report on Form 10-Q for the quarter ended September 30, 2021, formatted in Inline XBRL: (i) Condensed Consolidated Statements of Income, (ii) Condensed Consolidated Statements of Comprehensive Income, (iii) Condensed Consolidated Balance Sheets, (iv) Condensed Consolidated Statements of Cash Flows, (v) Condensed Consolidated Statement of Changes in Stockholders' Equity, and (vi) the Notes to Condensed Consolidated Financial Statements. The Instance document does not appear in the Interactive Data File because its XBRL tags are embedded within the Inline XBRL document. |
| 104* | The cover page from this Quarterly Report on Form 10-Q, formatted as Inline XBRL. |
* Filed herewith.
** Furnished herewith.
++ Indicates a management contract or compensatory plan or arrangement.
SIGNATURES
Pursuant to the requirements of the Securities Exchange Act of 1934, the registrant has duly caused this report to be signed on its behalf by the undersigned thereunto duly authorized.
| | | | | | | | | | | |
| | Keurig Dr Pepper Inc. |
| | | | |
| | By: | | /s/ Ozan Dokmecioglu |
| | | |
| | Name: | | Ozan Dokmecioglu |
| | Title: | | Chief Financial Officer & President, International |
| | | | (Principal Financial Officer) |
| Date: October 28, 2021 | | | |