false--12-31Q3201900014133291000000000761500000200000000152300000P60D18871100000.2P60D131000000900004600000030000P3Y0.01250000002700000000001.143.351.173.45210931633121093163318350000007500000007500000008350000005570000005000000000.019500.013370.034610.032830.031250.020000.063750.001250.007500.01875P9YP8YP18Y660000006600000066000000660000000000870000000087000000600000001630000002300000005000000400000020000005000000200000020000000300000000002000000133000000900000030000000013000000430000001500000000554736610553456284
0001413329
2019-01-01
2019-09-30
0001413329
pm:A3.125Notesdue2028Member
2019-01-01
2019-09-30
0001413329
pm:A1.875Notesdue2037Member
2019-01-01
2019-09-30
0001413329
pm:A4.875Notesdue2043Member
2019-01-01
2019-09-30
0001413329
pm:A1.450Notesdue2039Member
2019-01-01
2019-09-30
0001413329
pm:A2.750Notesdue2026Member
2019-01-01
2019-09-30
0001413329
pm:A3.125Notesdue2027Member
2019-01-01
2019-09-30
0001413329
pm:A0.125Notesdue2026Member
2019-01-01
2019-09-30
0001413329
pm:A3.250Notesdue2024Member
2019-01-01
2019-09-30
0001413329
pm:A2.875Notesdue2026Member
2019-01-01
2019-09-30
0001413329
pm:A2.875Notesdue2029Member
2019-01-01
2019-09-30
0001413329
pm:A6.375Notesdue2038Member
2019-01-01
2019-09-30
0001413329
pm:A2.875Notesdue20241Member
2019-01-01
2019-09-30
0001413329
pm:A4.125Notesdue2043Member
2019-01-01
2019-09-30
0001413329
pm:A4.500Notesdue2042Member
2019-01-01
2019-09-30
0001413329
pm:A2.750Notesdue2025Member
2019-01-01
2019-09-30
0001413329
pm:A3.375Notesdue2025Member
2019-01-01
2019-09-30
0001413329
pm:A0.625Notesdue2024Member
2019-01-01
2019-09-30
0001413329
pm:A0.800Notesdue2031Member
2019-01-01
2019-09-30
0001413329
pm:A3.125Notesdue2033Member
2019-01-01
2019-09-30
0001413329
pm:A2.000Notesdue2036Member
2019-01-01
2019-09-30
0001413329
pm:A2.875Notesdue20242Member
2019-01-01
2019-09-30
0001413329
pm:A4.375Notesdue2041Member
2019-01-01
2019-09-30
0001413329
pm:A3.375Notesdue2029Member
2019-01-01
2019-09-30
0001413329
pm:A3.875Notesdue2042Member
2019-01-01
2019-09-30
0001413329
pm:A4.250Notesdue2044Member
2019-01-01
2019-09-30
0001413329
pm:A3.600Notesdue2023Member
2019-01-01
2019-09-30
0001413329
pm:A2.625Notesdue2023Member
2019-01-01
2019-09-30
0001413329
pm:A1.875Notesdue20212Member
2019-01-01
2019-09-30
0001413329
pm:A2.500Notesdue20222Member
2019-01-01
2019-09-30
0001413329
pm:A2.900Notesdue2021Member
2019-01-01
2019-09-30
0001413329
pm:A1.875Notesdue20211Member
2019-01-01
2019-09-30
0001413329
pm:FloatingNotesdue2020Member
2019-01-01
2019-09-30
0001413329
pm:A2.375Notesdue2022Member
2019-01-01
2019-09-30
0001413329
pm:A2.500Notesdue20221Member
2019-01-01
2019-09-30
0001413329
pm:A1.875Notesdue2019Member
2019-01-01
2019-09-30
0001413329
pm:A4.500Notesdue2020Member
2019-01-01
2019-09-30
0001413329
pm:A2.125Notesdue2023Member
2019-01-01
2019-09-30
0001413329
pm:A2.625Notesdue2022Member
2019-01-01
2019-09-30
0001413329
pm:A4.125Notesdue2021Member
2019-01-01
2019-09-30
0001413329
us-gaap:CommonStockMember
2019-01-01
2019-09-30
0001413329
pm:A1.750Notesdue2020Member
2019-01-01
2019-09-30
0001413329
pm:A2.000Notesdue2020Member
2019-01-01
2019-09-30
0001413329
2019-10-21
0001413329
2018-01-01
2018-09-30
0001413329
2018-07-01
2018-09-30
0001413329
2019-07-01
2019-09-30
0001413329
pm:DeconsolidationofRBHMember
2018-01-01
2018-09-30
0001413329
pm:DeconsolidationofRBHMember
2019-01-01
2019-09-30
0001413329
2019-09-30
0001413329
2018-12-31
0001413329
2018-09-30
0001413329
2017-12-31
0001413329
pm:RestrictedCashMember
2019-01-01
2019-09-30
0001413329
pm:RothmansBensonAndHedgesInc.RBHMember
pm:CeciliaLetourneauConseilQuebecoisSurLaTabacEtLaSanteandJeanYvesBlaisCasesMember
country:CA
pm:AppellateRulingMember
pm:SmokingAndHealthClassActionsMember
2019-01-01
2019-09-30
0001413329
us-gaap:CashMember
2019-01-01
2019-09-30
0001413329
pm:MarketingAdministrationAndResearchCostsMember
2019-01-01
2019-09-30
0001413329
us-gaap:NoncontrollingInterestMember
2018-01-01
2018-09-30
0001413329
us-gaap:TreasuryStockMember
2019-09-30
0001413329
us-gaap:AdditionalPaidInCapitalMember
2018-01-01
2018-09-30
0001413329
us-gaap:RetainedEarningsMember
2017-12-31
0001413329
us-gaap:NoncontrollingInterestMember
2018-12-31
0001413329
us-gaap:AdditionalPaidInCapitalMember
2019-01-01
2019-09-30
0001413329
us-gaap:TreasuryStockMember
2017-12-31
0001413329
us-gaap:NoncontrollingInterestMember
2019-01-01
2019-09-30
0001413329
us-gaap:CommonStockMember
2018-12-31
0001413329
us-gaap:TreasuryStockMember
2018-09-30
0001413329
us-gaap:AccumulatedOtherComprehensiveIncomeMember
2019-01-01
2019-09-30
0001413329
us-gaap:RetainedEarningsMember
2018-01-01
2018-09-30
0001413329
us-gaap:AdditionalPaidInCapitalMember
2019-09-30
0001413329
us-gaap:AccumulatedOtherComprehensiveIncomeMember
2018-09-30
0001413329
us-gaap:CommonStockMember
2018-09-30
0001413329
us-gaap:NoncontrollingInterestMember
2017-12-31
0001413329
us-gaap:AccumulatedOtherComprehensiveIncomeMember
2017-12-31
0001413329
us-gaap:TreasuryStockMember
2019-01-01
2019-09-30
0001413329
us-gaap:TreasuryStockMember
2018-12-31
0001413329
us-gaap:NoncontrollingInterestMember
2019-09-30
0001413329
us-gaap:RetainedEarningsMember
2018-09-30
0001413329
us-gaap:NoncontrollingInterestMember
2018-09-30
0001413329
us-gaap:AccumulatedOtherComprehensiveIncomeMember
2018-12-31
0001413329
us-gaap:RetainedEarningsMember
2019-09-30
0001413329
us-gaap:CommonStockMember
2017-12-31
0001413329
us-gaap:TreasuryStockMember
2018-01-01
2018-09-30
0001413329
us-gaap:RetainedEarningsMember
2019-01-01
2019-09-30
0001413329
us-gaap:RetainedEarningsMember
2018-12-31
0001413329
us-gaap:AccumulatedOtherComprehensiveIncomeMember
2018-01-01
2018-09-30
0001413329
us-gaap:CommonStockMember
2019-09-30
0001413329
us-gaap:AccumulatedOtherComprehensiveIncomeMember
2019-09-30
0001413329
us-gaap:AdditionalPaidInCapitalMember
2018-12-31
0001413329
us-gaap:AdditionalPaidInCapitalMember
2018-09-30
0001413329
us-gaap:AdditionalPaidInCapitalMember
2017-12-31
0001413329
us-gaap:AdditionalPaidInCapitalMember
2019-07-01
2019-09-30
0001413329
us-gaap:NoncontrollingInterestMember
2019-07-01
2019-09-30
0001413329
us-gaap:AdditionalPaidInCapitalMember
2019-06-30
0001413329
us-gaap:AdditionalPaidInCapitalMember
2018-07-01
2018-09-30
0001413329
us-gaap:CommonStockMember
2019-06-30
0001413329
2018-06-30
0001413329
us-gaap:TreasuryStockMember
2019-06-30
0001413329
us-gaap:RetainedEarningsMember
2018-06-30
0001413329
us-gaap:NoncontrollingInterestMember
2019-06-30
0001413329
us-gaap:AccumulatedOtherComprehensiveIncomeMember
2019-06-30
0001413329
us-gaap:NoncontrollingInterestMember
2018-07-01
2018-09-30
0001413329
us-gaap:CommonStockMember
2018-06-30
0001413329
us-gaap:RetainedEarningsMember
2019-06-30
0001413329
us-gaap:RetainedEarningsMember
2018-07-01
2018-09-30
0001413329
us-gaap:TreasuryStockMember
2018-06-30
0001413329
us-gaap:NoncontrollingInterestMember
2018-06-30
0001413329
us-gaap:AccumulatedOtherComprehensiveIncomeMember
2018-06-30
0001413329
us-gaap:RetainedEarningsMember
2019-07-01
2019-09-30
0001413329
us-gaap:TreasuryStockMember
2019-07-01
2019-09-30
0001413329
us-gaap:AccumulatedOtherComprehensiveIncomeMember
2018-07-01
2018-09-30
0001413329
us-gaap:AccumulatedOtherComprehensiveIncomeMember
2019-07-01
2019-09-30
0001413329
us-gaap:TreasuryStockMember
2018-07-01
2018-09-30
0001413329
2019-06-30
0001413329
us-gaap:AdditionalPaidInCapitalMember
2018-06-30
0001413329
pm:GrantDateFairValueMember
us-gaap:PerformanceSharesMember
2019-01-01
2019-09-30
0001413329
us-gaap:PerformanceSharesMember
2019-01-01
2019-09-30
0001413329
srt:MinimumMember
us-gaap:PerformanceSharesMember
2019-01-01
2019-09-30
0001413329
pm:FairValueMember
us-gaap:RestrictedStockUnitsRSUMember
2019-01-01
2019-09-30
0001413329
pm:PerformanceMetricPerformanceAgainstSpecificMeasuresOfTransformationMember
us-gaap:PerformanceSharesMember
2019-01-01
2019-09-30
0001413329
pm:A2017PerformanceIncentivePlanMember
2019-09-30
0001413329
pm:PerformanceMetricCurrencyNeutralCompoundAnnualAdjustedOperatingIncomeGrowthRateExcludingAcquisitionsMember
us-gaap:PerformanceSharesMember
2019-01-01
2019-09-30
0001413329
pm:FairValueMember
us-gaap:PerformanceSharesMember
2019-01-01
2019-09-30
0001413329
pm:A2017PerformanceIncentivePlanMember
2017-05-31
0001413329
us-gaap:RestrictedStockUnitsRSUMember
2019-09-30
0001413329
pm:A2017NonEmployeeDirectorsPlanMember
2017-05-31
0001413329
srt:MaximumMember
us-gaap:PerformanceSharesMember
2019-01-01
2019-09-30
0001413329
us-gaap:RestrictedStockUnitsRSUMember
2019-01-01
2019-09-30
0001413329
us-gaap:PerformanceSharesMember
2019-09-30
0001413329
pm:GrantDateFairValueMember
us-gaap:RestrictedStockUnitsRSUMember
2019-01-01
2019-09-30
0001413329
pm:A2017NonEmployeeDirectorsPlanMember
2019-09-30
0001413329
pm:PerformanceMetricTotalShareholderReturnMember
us-gaap:PerformanceSharesMember
2019-01-01
2019-09-30
0001413329
us-gaap:RestrictedStockUnitsRSUMember
2018-01-01
2018-09-30
0001413329
pm:PerformanceShareUnitsOtherPerformanceFactorsMember
2019-01-01
2019-09-30
0001413329
us-gaap:PerformanceSharesMember
2018-01-01
2018-09-30
0001413329
pm:PerformanceShareUnitsTSRRelativeToCustomerPeerGroupMember
2018-01-01
2018-09-30
0001413329
pm:PerformanceShareUnitsOtherPerformanceFactorsMember
2018-01-01
2018-09-30
0001413329
pm:PerformanceShareUnitsTSRRelativeToCustomerPeerGroupMember
2019-01-01
2019-09-30
0001413329
us-gaap:PerformanceSharesMember
2018-07-01
2018-09-30
0001413329
us-gaap:PerformanceSharesMember
2019-07-01
2019-09-30
0001413329
us-gaap:RestrictedStockUnitsRSUMember
2019-07-01
2019-09-30
0001413329
us-gaap:RestrictedStockUnitsRSUMember
2018-07-01
2018-09-30
0001413329
us-gaap:PensionPlansDefinedBenefitMember
2019-01-01
2019-09-30
0001413329
us-gaap:PensionPlansDefinedBenefitMember
2019-07-01
2019-09-30
0001413329
us-gaap:PensionPlansDefinedBenefitMember
2018-07-01
2018-09-30
0001413329
us-gaap:PensionPlansDefinedBenefitMember
2018-01-01
2018-09-30
0001413329
us-gaap:PostretirementBenefitCostsMember
2019-07-01
2019-09-30
0001413329
pm:PostemploymentBenefitPlansMember
2018-07-01
2018-09-30
0001413329
us-gaap:PostretirementBenefitCostsMember
2018-07-01
2018-09-30
0001413329
pm:PostemploymentBenefitPlansMember
2019-01-01
2019-09-30
0001413329
pm:PostemploymentBenefitPlansMember
2018-01-01
2018-09-30
0001413329
us-gaap:PostretirementBenefitCostsMember
2018-01-01
2018-09-30
0001413329
us-gaap:PostretirementBenefitCostsMember
2019-01-01
2019-09-30
0001413329
pm:PostemploymentBenefitPlansMember
2019-07-01
2019-09-30
0001413329
pm:DeconsolidationofRBHMember
us-gaap:DistributionRightsMember
2019-01-01
2019-09-30
0001413329
pm:DeconsolidationofRBHMember
us-gaap:TrademarksMember
2019-01-01
2019-09-30
0001413329
pm:TrademarksandDistributionNetworksMember
2019-01-01
2019-09-30
0001413329
2019-04-01
2019-06-30
0001413329
us-gaap:TrademarksMember
2018-12-31
0001413329
pm:OtherIncludingFarmerContractsAndIntellectualPropertyRightsMember
2019-09-30
0001413329
us-gaap:DistributionRightsMember
2018-12-31
0001413329
us-gaap:DistributionRightsMember
2019-09-30
0001413329
pm:OtherIncludingFarmerContractsAndIntellectualPropertyRightsMember
2018-12-31
0001413329
us-gaap:TrademarksMember
2019-09-30
0001413329
pm:DeconsolidationofRBHMember
pm:MiddleEastAndAfricaMember
2019-01-01
2019-09-30
0001413329
pm:MiddleEastAndAfricaMember
2019-09-30
0001413329
pm:EasternEuropeMember
2019-09-30
0001413329
pm:LatinAmericaAndCanadaMember
2019-09-30
0001413329
pm:LatinAmericaAndCanadaMember
2019-01-01
2019-09-30
0001413329
pm:SouthAndSoutheastAsiaMember
2019-01-01
2019-09-30
0001413329
pm:DeconsolidationofRBHMember
pm:LatinAmericaAndCanadaMember
2019-01-01
2019-09-30
0001413329
pm:SouthAndSoutheastAsiaMember
2019-09-30
0001413329
us-gaap:EuropeanUnionMember
2019-01-01
2019-09-30
0001413329
pm:SouthAndSoutheastAsiaMember
2018-12-31
0001413329
pm:LatinAmericaAndCanadaMember
2018-12-31
0001413329
pm:EasternEuropeMember
2018-12-31
0001413329
pm:DeconsolidationofRBHMember
pm:EasternEuropeMember
2019-01-01
2019-09-30
0001413329
pm:MiddleEastAndAfricaMember
2018-12-31
0001413329
pm:EastAsiaAndAustraliaMember
2019-01-01
2019-09-30
0001413329
pm:DeconsolidationofRBHMember
us-gaap:EuropeanUnionMember
2019-01-01
2019-09-30
0001413329
pm:DeconsolidationofRBHMember
pm:EastAsiaAndAustraliaMember
2019-01-01
2019-09-30
0001413329
us-gaap:EuropeanUnionMember
2019-09-30
0001413329
pm:EasternEuropeMember
2019-01-01
2019-09-30
0001413329
pm:MiddleEastAndAfricaMember
2019-01-01
2019-09-30
0001413329
pm:EastAsiaAndAustraliaMember
2019-09-30
0001413329
pm:DeconsolidationofRBHMember
pm:SouthAndSoutheastAsiaMember
2019-01-01
2019-09-30
0001413329
pm:EastAsiaAndAustraliaMember
2018-12-31
0001413329
us-gaap:EuropeanUnionMember
2018-12-31
0001413329
us-gaap:TrademarksMember
2019-01-01
2019-09-30
0001413329
us-gaap:DistributionRightsMember
2019-01-01
2019-09-30
0001413329
pm:OtherIncludingFarmerContractsAndIntellectualPropertyRightsMember
2019-01-01
2019-09-30
0001413329
us-gaap:ForeignExchangeContractMember
us-gaap:NondesignatedMember
2019-01-01
2019-09-30
0001413329
us-gaap:ForeignExchangeContractMember
us-gaap:NondesignatedMember
pm:InterestIncomeExpenseNetMember
2019-07-01
2019-09-30
0001413329
us-gaap:ForeignExchangeContractMember
us-gaap:NondesignatedMember
pm:InterestIncomeExpenseNetMember
2019-01-01
2019-09-30
0001413329
us-gaap:ForeignExchangeContractMember
us-gaap:NondesignatedMember
2018-07-01
2018-09-30
0001413329
us-gaap:ForeignExchangeContractMember
us-gaap:NondesignatedMember
pm:InterestIncomeExpenseNetMember
2018-01-01
2018-09-30
0001413329
us-gaap:ForeignExchangeContractMember
us-gaap:NondesignatedMember
pm:InterestIncomeExpenseNetMember
2018-07-01
2018-09-30
0001413329
us-gaap:ForeignExchangeContractMember
us-gaap:NondesignatedMember
2018-01-01
2018-09-30
0001413329
us-gaap:ForeignExchangeContractMember
us-gaap:NondesignatedMember
2019-07-01
2019-09-30
0001413329
us-gaap:ForeignExchangeContractMember
us-gaap:InterestExpenseMember
2018-07-01
2018-09-30
0001413329
us-gaap:ForeignExchangeContractMember
2018-07-01
2018-09-30
0001413329
us-gaap:ForeignExchangeContractMember
2019-07-01
2019-09-30
0001413329
us-gaap:ForeignExchangeContractMember
pm:MarketingAdministrationAndResearchCostsMember
2018-07-01
2018-09-30
0001413329
us-gaap:ForeignExchangeContractMember
us-gaap:InterestExpenseMember
2019-07-01
2019-09-30
0001413329
us-gaap:ForeignExchangeContractMember
us-gaap:SalesMember
2019-07-01
2019-09-30
0001413329
us-gaap:ForeignExchangeContractMember
pm:MarketingAdministrationAndResearchCostsMember
2019-07-01
2019-09-30
0001413329
us-gaap:ForeignExchangeContractMember
us-gaap:CostOfSalesMember
2019-07-01
2019-09-30
0001413329
us-gaap:ForeignExchangeContractMember
us-gaap:SalesMember
2018-07-01
2018-09-30
0001413329
us-gaap:ForeignExchangeContractMember
us-gaap:CostOfSalesMember
2018-07-01
2018-09-30
0001413329
us-gaap:ForeignExchangeContractMember
us-gaap:OtherComprehensiveIncomeMember
2018-12-31
0001413329
us-gaap:ForeignExchangeContractMember
us-gaap:OtherComprehensiveIncomeMember
2018-09-30
0001413329
us-gaap:ForeignExchangeContractMember
us-gaap:OtherComprehensiveIncomeMember
2018-06-30
0001413329
us-gaap:ForeignExchangeContractMember
us-gaap:OtherComprehensiveIncomeMember
2018-01-01
2018-09-30
0001413329
us-gaap:ForeignExchangeContractMember
us-gaap:OtherComprehensiveIncomeMember
2019-07-01
2019-09-30
0001413329
us-gaap:ForeignExchangeContractMember
us-gaap:OtherComprehensiveIncomeMember
2018-07-01
2018-09-30
0001413329
us-gaap:ForeignExchangeContractMember
us-gaap:OtherComprehensiveIncomeMember
2019-09-30
0001413329
us-gaap:ForeignExchangeContractMember
us-gaap:OtherComprehensiveIncomeMember
2017-12-31
0001413329
us-gaap:ForeignExchangeContractMember
us-gaap:OtherComprehensiveIncomeMember
2019-01-01
2019-09-30
0001413329
us-gaap:ForeignExchangeContractMember
us-gaap:OtherComprehensiveIncomeMember
2019-06-30
0001413329
srt:MaximumMember
us-gaap:ForeignExchangeContractMember
2019-01-01
2019-09-30
0001413329
us-gaap:ForeignExchangeContractMember
us-gaap:NetInvestmentHedgingMember
2019-09-30
0001413329
us-gaap:ForeignExchangeContractMember
2019-09-30
0001413329
us-gaap:ForeignExchangeContractMember
us-gaap:NondesignatedMember
2019-09-30
0001413329
us-gaap:ForeignExchangeContractMember
us-gaap:NetInvestmentHedgingMember
2019-07-01
2019-09-30
0001413329
us-gaap:ForeignExchangeContractMember
us-gaap:NetInvestmentHedgingMember
2019-01-01
2019-09-30
0001413329
us-gaap:ForeignExchangeContractMember
us-gaap:NetInvestmentHedgingMember
2018-07-01
2018-09-30
0001413329
us-gaap:ForeignExchangeContractMember
us-gaap:NetInvestmentHedgingMember
2018-01-01
2018-09-30
0001413329
us-gaap:ForeignExchangeContractMember
us-gaap:CashFlowHedgingMember
2019-09-30
0001413329
us-gaap:ForeignExchangeContractMember
us-gaap:InterestExpenseMember
2019-01-01
2019-09-30
0001413329
us-gaap:ForeignExchangeContractMember
2019-01-01
2019-09-30
0001413329
us-gaap:ForeignExchangeContractMember
2018-01-01
2018-09-30
0001413329
us-gaap:ForeignExchangeContractMember
us-gaap:CostOfSalesMember
2018-01-01
2018-09-30
0001413329
us-gaap:ForeignExchangeContractMember
us-gaap:SalesMember
2018-01-01
2018-09-30
0001413329
us-gaap:ForeignExchangeContractMember
pm:MarketingAdministrationAndResearchCostsMember
2019-01-01
2019-09-30
0001413329
us-gaap:ForeignExchangeContractMember
pm:MarketingAdministrationAndResearchCostsMember
2018-01-01
2018-09-30
0001413329
us-gaap:ForeignExchangeContractMember
us-gaap:InterestExpenseMember
2018-01-01
2018-09-30
0001413329
us-gaap:ForeignExchangeContractMember
us-gaap:CostOfSalesMember
2019-01-01
2019-09-30
0001413329
us-gaap:ForeignExchangeContractMember
us-gaap:SalesMember
2019-01-01
2019-09-30
0001413329
us-gaap:OtherAssetsMember
us-gaap:ForeignExchangeContractMember
us-gaap:NondesignatedMember
2019-09-30
0001413329
us-gaap:OtherLiabilitiesMember
us-gaap:ForeignExchangeContractMember
us-gaap:DesignatedAsHedgingInstrumentMember
2019-09-30
0001413329
pm:OtherAccruedLiabilitiesMember
us-gaap:ForeignExchangeContractMember
us-gaap:DesignatedAsHedgingInstrumentMember
2018-12-31
0001413329
us-gaap:OtherAssetsMember
us-gaap:ForeignExchangeContractMember
us-gaap:DesignatedAsHedgingInstrumentMember
2019-09-30
0001413329
us-gaap:OtherLiabilitiesMember
us-gaap:ForeignExchangeContractMember
us-gaap:NondesignatedMember
2018-12-31
0001413329
us-gaap:ForeignExchangeContractMember
2018-12-31
0001413329
us-gaap:OtherAssetsMember
us-gaap:ForeignExchangeContractMember
us-gaap:NondesignatedMember
2018-12-31
0001413329
us-gaap:OtherLiabilitiesMember
us-gaap:ForeignExchangeContractMember
us-gaap:DesignatedAsHedgingInstrumentMember
2018-12-31
0001413329
pm:OtherAccruedLiabilitiesMember
us-gaap:ForeignExchangeContractMember
us-gaap:DesignatedAsHedgingInstrumentMember
2019-09-30
0001413329
us-gaap:OtherCurrentAssetsMember
us-gaap:ForeignExchangeContractMember
us-gaap:DesignatedAsHedgingInstrumentMember
2018-12-31
0001413329
pm:OtherAccruedLiabilitiesMember
us-gaap:ForeignExchangeContractMember
us-gaap:NondesignatedMember
2018-12-31
0001413329
us-gaap:OtherAssetsMember
us-gaap:ForeignExchangeContractMember
us-gaap:DesignatedAsHedgingInstrumentMember
2018-12-31
0001413329
us-gaap:OtherCurrentAssetsMember
us-gaap:ForeignExchangeContractMember
us-gaap:DesignatedAsHedgingInstrumentMember
2019-09-30
0001413329
us-gaap:OtherCurrentAssetsMember
us-gaap:ForeignExchangeContractMember
us-gaap:NondesignatedMember
2019-09-30
0001413329
us-gaap:OtherLiabilitiesMember
us-gaap:ForeignExchangeContractMember
us-gaap:NondesignatedMember
2019-09-30
0001413329
pm:OtherAccruedLiabilitiesMember
us-gaap:ForeignExchangeContractMember
us-gaap:NondesignatedMember
2019-09-30
0001413329
us-gaap:OtherCurrentAssetsMember
us-gaap:ForeignExchangeContractMember
us-gaap:NondesignatedMember
2018-12-31
0001413329
us-gaap:OperatingSegmentsMember
pm:SouthAndSoutheastAsiaMember
2018-07-01
2018-09-30
0001413329
us-gaap:OperatingSegmentsMember
pm:EastAsiaAndAustraliaMember
2019-01-01
2019-09-30
0001413329
us-gaap:OperatingSegmentsMember
pm:MiddleEastAndAfricaMember
2018-01-01
2018-09-30
0001413329
us-gaap:OperatingSegmentsMember
pm:EastAsiaAndAustraliaMember
2019-07-01
2019-09-30
0001413329
us-gaap:OperatingSegmentsMember
pm:EasternEuropeMember
2019-01-01
2019-09-30
0001413329
us-gaap:OperatingSegmentsMember
pm:EastAsiaAndAustraliaMember
2018-01-01
2018-09-30
0001413329
us-gaap:OperatingSegmentsMember
2018-01-01
2018-09-30
0001413329
us-gaap:OperatingSegmentsMember
pm:MiddleEastAndAfricaMember
2018-07-01
2018-09-30
0001413329
us-gaap:OperatingSegmentsMember
pm:EasternEuropeMember
2018-01-01
2018-09-30
0001413329
us-gaap:OperatingSegmentsMember
pm:MiddleEastAndAfricaMember
2019-01-01
2019-09-30
0001413329
us-gaap:OperatingSegmentsMember
us-gaap:EuropeanUnionMember
2018-07-01
2018-09-30
0001413329
us-gaap:OperatingSegmentsMember
pm:LatinAmericaAndCanadaMember
2019-07-01
2019-09-30
0001413329
us-gaap:OperatingSegmentsMember
pm:LatinAmericaAndCanadaMember
2018-01-01
2018-09-30
0001413329
us-gaap:OperatingSegmentsMember
pm:EasternEuropeMember
2019-07-01
2019-09-30
0001413329
us-gaap:OperatingSegmentsMember
pm:LatinAmericaAndCanadaMember
2019-01-01
2019-09-30
0001413329
us-gaap:OperatingSegmentsMember
pm:EastAsiaAndAustraliaMember
2018-07-01
2018-09-30
0001413329
us-gaap:OperatingSegmentsMember
us-gaap:EuropeanUnionMember
2019-01-01
2019-09-30
0001413329
us-gaap:OperatingSegmentsMember
pm:SouthAndSoutheastAsiaMember
2019-01-01
2019-09-30
0001413329
us-gaap:OperatingSegmentsMember
pm:EasternEuropeMember
2018-07-01
2018-09-30
0001413329
us-gaap:OperatingSegmentsMember
us-gaap:EuropeanUnionMember
2019-07-01
2019-09-30
0001413329
us-gaap:OperatingSegmentsMember
us-gaap:EuropeanUnionMember
2018-01-01
2018-09-30
0001413329
us-gaap:OperatingSegmentsMember
pm:LatinAmericaAndCanadaMember
2018-07-01
2018-09-30
0001413329
us-gaap:OperatingSegmentsMember
pm:SouthAndSoutheastAsiaMember
2019-07-01
2019-09-30
0001413329
us-gaap:OperatingSegmentsMember
pm:SouthAndSoutheastAsiaMember
2018-01-01
2018-09-30
0001413329
us-gaap:OperatingSegmentsMember
2019-01-01
2019-09-30
0001413329
us-gaap:OperatingSegmentsMember
pm:MiddleEastAndAfricaMember
2019-07-01
2019-09-30
0001413329
pm:TheMoscowTaxInspectorateforMajorTaxpayersAuditMember
pm:EasternEuropeMember
pm:OtherLitigationMember
2019-01-01
2019-09-30
0001413329
us-gaap:OperatingSegmentsMember
pm:ReducedRiskProductsMember
us-gaap:EuropeanUnionMember
2019-01-01
2019-09-30
0001413329
us-gaap:OperatingSegmentsMember
pm:ReducedRiskProductsMember
pm:EastAsiaAndAustraliaMember
2018-07-01
2018-09-30
0001413329
us-gaap:OperatingSegmentsMember
pm:ReducedRiskProductsMember
pm:EastAsiaAndAustraliaMember
2019-07-01
2019-09-30
0001413329
us-gaap:OperatingSegmentsMember
pm:ReducedRiskProductsMember
pm:LatinAmericaAndCanadaMember
2018-01-01
2018-09-30
0001413329
us-gaap:OperatingSegmentsMember
pm:CombustibleProductsMember
us-gaap:EuropeanUnionMember
2018-01-01
2018-09-30
0001413329
us-gaap:OperatingSegmentsMember
pm:CombustibleProductsMember
pm:SouthAndSoutheastAsiaMember
2018-01-01
2018-09-30
0001413329
us-gaap:OperatingSegmentsMember
pm:ReducedRiskProductsMember
pm:SouthAndSoutheastAsiaMember
2019-01-01
2019-09-30
0001413329
us-gaap:OperatingSegmentsMember
pm:CombustibleProductsMember
pm:EasternEuropeMember
2018-07-01
2018-09-30
0001413329
us-gaap:OperatingSegmentsMember
pm:ReducedRiskProductsMember
pm:LatinAmericaAndCanadaMember
2019-07-01
2019-09-30
0001413329
us-gaap:OperatingSegmentsMember
pm:CombustibleProductsMember
pm:LatinAmericaAndCanadaMember
2019-07-01
2019-09-30
0001413329
us-gaap:OperatingSegmentsMember
pm:ReducedRiskProductsMember
us-gaap:EuropeanUnionMember
2018-07-01
2018-09-30
0001413329
us-gaap:OperatingSegmentsMember
pm:CombustibleProductsMember
us-gaap:EuropeanUnionMember
2018-07-01
2018-09-30
0001413329
pm:CombustibleProductsMember
2018-01-01
2018-09-30
0001413329
pm:ReducedRiskProductsMember
2019-07-01
2019-09-30
0001413329
us-gaap:OperatingSegmentsMember
pm:CombustibleProductsMember
pm:EastAsiaAndAustraliaMember
2018-01-01
2018-09-30
0001413329
us-gaap:OperatingSegmentsMember
pm:CombustibleProductsMember
pm:LatinAmericaAndCanadaMember
2018-07-01
2018-09-30
0001413329
us-gaap:OperatingSegmentsMember
pm:CombustibleProductsMember
pm:MiddleEastAndAfricaMember
2018-01-01
2018-09-30
0001413329
us-gaap:OperatingSegmentsMember
pm:CombustibleProductsMember
pm:EastAsiaAndAustraliaMember
2019-01-01
2019-09-30
0001413329
us-gaap:OperatingSegmentsMember
pm:CombustibleProductsMember
pm:MiddleEastAndAfricaMember
2019-07-01
2019-09-30
0001413329
pm:CombustibleProductsMember
2019-01-01
2019-09-30
0001413329
us-gaap:OperatingSegmentsMember
pm:CombustibleProductsMember
us-gaap:EuropeanUnionMember
2019-07-01
2019-09-30
0001413329
us-gaap:OperatingSegmentsMember
pm:CombustibleProductsMember
pm:EasternEuropeMember
2018-01-01
2018-09-30
0001413329
us-gaap:OperatingSegmentsMember
pm:ReducedRiskProductsMember
pm:EasternEuropeMember
2019-01-01
2019-09-30
0001413329
us-gaap:OperatingSegmentsMember
pm:ReducedRiskProductsMember
pm:SouthAndSoutheastAsiaMember
2018-07-01
2018-09-30
0001413329
us-gaap:OperatingSegmentsMember
pm:CombustibleProductsMember
pm:SouthAndSoutheastAsiaMember
2018-07-01
2018-09-30
0001413329
us-gaap:OperatingSegmentsMember
pm:ReducedRiskProductsMember
pm:SouthAndSoutheastAsiaMember
2019-07-01
2019-09-30
0001413329
us-gaap:OperatingSegmentsMember
pm:ReducedRiskProductsMember
pm:MiddleEastAndAfricaMember
2018-07-01
2018-09-30
0001413329
us-gaap:OperatingSegmentsMember
pm:CombustibleProductsMember
pm:EasternEuropeMember
2019-01-01
2019-09-30
0001413329
us-gaap:OperatingSegmentsMember
pm:ReducedRiskProductsMember
us-gaap:EuropeanUnionMember
2018-01-01
2018-09-30
0001413329
us-gaap:OperatingSegmentsMember
pm:CombustibleProductsMember
pm:LatinAmericaAndCanadaMember
2019-01-01
2019-09-30
0001413329
us-gaap:OperatingSegmentsMember
pm:ReducedRiskProductsMember
pm:EasternEuropeMember
2019-07-01
2019-09-30
0001413329
pm:ReducedRiskProductsMember
2018-01-01
2018-09-30
0001413329
us-gaap:OperatingSegmentsMember
pm:ReducedRiskProductsMember
pm:EastAsiaAndAustraliaMember
2018-01-01
2018-09-30
0001413329
us-gaap:OperatingSegmentsMember
pm:ReducedRiskProductsMember
us-gaap:EuropeanUnionMember
2019-07-01
2019-09-30
0001413329
us-gaap:OperatingSegmentsMember
pm:CombustibleProductsMember
pm:EastAsiaAndAustraliaMember
2018-07-01
2018-09-30
0001413329
pm:ReducedRiskProductsMember
2019-01-01
2019-09-30
0001413329
us-gaap:OperatingSegmentsMember
pm:CombustibleProductsMember
pm:MiddleEastAndAfricaMember
2019-01-01
2019-09-30
0001413329
us-gaap:OperatingSegmentsMember
pm:CombustibleProductsMember
pm:LatinAmericaAndCanadaMember
2018-01-01
2018-09-30
0001413329
us-gaap:OperatingSegmentsMember
pm:ReducedRiskProductsMember
pm:EastAsiaAndAustraliaMember
2019-01-01
2019-09-30
0001413329
us-gaap:OperatingSegmentsMember
pm:CombustibleProductsMember
pm:MiddleEastAndAfricaMember
2018-07-01
2018-09-30
0001413329
us-gaap:OperatingSegmentsMember
pm:CombustibleProductsMember
us-gaap:EuropeanUnionMember
2019-01-01
2019-09-30
0001413329
us-gaap:OperatingSegmentsMember
pm:ReducedRiskProductsMember
pm:EasternEuropeMember
2018-07-01
2018-09-30
0001413329
us-gaap:OperatingSegmentsMember
pm:CombustibleProductsMember
pm:EasternEuropeMember
2019-07-01
2019-09-30
0001413329
us-gaap:OperatingSegmentsMember
pm:ReducedRiskProductsMember
pm:LatinAmericaAndCanadaMember
2019-01-01
2019-09-30
0001413329
us-gaap:OperatingSegmentsMember
pm:CombustibleProductsMember
pm:EastAsiaAndAustraliaMember
2019-07-01
2019-09-30
0001413329
us-gaap:OperatingSegmentsMember
pm:ReducedRiskProductsMember
pm:LatinAmericaAndCanadaMember
2018-07-01
2018-09-30
0001413329
us-gaap:OperatingSegmentsMember
pm:CombustibleProductsMember
pm:SouthAndSoutheastAsiaMember
2019-01-01
2019-09-30
0001413329
us-gaap:OperatingSegmentsMember
pm:ReducedRiskProductsMember
pm:MiddleEastAndAfricaMember
2018-01-01
2018-09-30
0001413329
us-gaap:OperatingSegmentsMember
pm:ReducedRiskProductsMember
pm:SouthAndSoutheastAsiaMember
2018-01-01
2018-09-30
0001413329
us-gaap:OperatingSegmentsMember
pm:ReducedRiskProductsMember
pm:MiddleEastAndAfricaMember
2019-07-01
2019-09-30
0001413329
pm:CombustibleProductsMember
2018-07-01
2018-09-30
0001413329
pm:CombustibleProductsMember
2019-07-01
2019-09-30
0001413329
pm:ReducedRiskProductsMember
2018-07-01
2018-09-30
0001413329
us-gaap:OperatingSegmentsMember
pm:ReducedRiskProductsMember
pm:MiddleEastAndAfricaMember
2019-01-01
2019-09-30
0001413329
us-gaap:OperatingSegmentsMember
pm:ReducedRiskProductsMember
pm:EasternEuropeMember
2018-01-01
2018-09-30
0001413329
us-gaap:OperatingSegmentsMember
pm:CombustibleProductsMember
pm:SouthAndSoutheastAsiaMember
2019-07-01
2019-09-30
0001413329
pm:CombustibleProductsMember
pm:SmokingAndHealthClassActionsMember
us-gaap:SubsequentEventMember
2019-10-22
0001413329
pm:CombustibleProductsMember
pm:IndividualSmokingAndHealthCasesMember
us-gaap:SubsequentEventMember
2019-10-22
0001413329
pm:CombustibleProductsMember
pm:IndividualLabelRelatedCasesMember
us-gaap:SubsequentEventMember
2019-10-22
0001413329
pm:CombustibleProductsMember
pm:LabelRelatedClassActionMember
2018-10-23
0001413329
pm:CombustibleProductsMember
pm:SmokingAndHealthClassActionsMember
2018-10-23
0001413329
pm:CombustibleProductsMember
pm:PublicCivilActionsMember
2017-10-23
0001413329
pm:CombustibleProductsMember
pm:HealthCareCostRecoveryActionsMember
2017-10-23
0001413329
pm:CombustibleProductsMember
pm:HealthCareCostRecoveryActionsMember
us-gaap:SubsequentEventMember
2019-10-22
0001413329
pm:CombustibleProductsMember
pm:IndividualSmokingAndHealthCasesMember
2018-10-23
0001413329
pm:CombustibleProductsMember
pm:HealthCareCostRecoveryActionsMember
2018-10-23
0001413329
pm:CombustibleProductsMember
pm:SmokingAndHealthClassActionsMember
2017-10-23
0001413329
pm:CombustibleProductsMember
pm:IndividualLabelRelatedCasesMember
2017-10-23
0001413329
pm:CombustibleProductsMember
pm:IndividualLabelRelatedCasesMember
2018-10-23
0001413329
pm:CombustibleProductsMember
pm:LabelRelatedClassActionMember
us-gaap:SubsequentEventMember
2019-10-22
0001413329
pm:CombustibleProductsMember
pm:PublicCivilActionsMember
2018-10-23
0001413329
pm:CombustibleProductsMember
pm:IndividualSmokingAndHealthCasesMember
2017-10-23
0001413329
pm:CombustibleProductsMember
pm:PublicCivilActionsMember
us-gaap:SubsequentEventMember
2019-10-22
0001413329
country:KR
pm:HealthCareCostRecoveryActionsMember
2014-04-14
2014-04-14
0001413329
pm:SuzanneJacklinMember
country:CA
us-gaap:PendingLitigationMember
2012-06-20
2012-06-20
0001413329
pm:ImperialTobaccoLtd.RothmansBensonAndHedgesInc.AndJTIMacdonaldCorp.Member
pm:CeciliaLetourneauMember
country:CA
us-gaap:JudicialRulingMember
pm:SmokingAndHealthClassActionsMember
2015-05-27
2015-05-27
0001413329
pm:CeciliaLetourneauMember
country:CA
pm:SmokingAndHealthClassActionsMember
2015-05-27
2015-05-27
0001413329
pm:CaseDecidedInFavorOfPlaintiffMember
2019-09-30
0001413329
pm:TheAttorneyGeneralOfLagosStateMember
country:NG
us-gaap:PendingLitigationMember
pm:HealthCareCostRecoveryActionsMember
2008-03-13
2008-03-13
0001413329
pm:TheMoscowTaxInspectorateforMajorTaxpayersAuditMember
pm:EasternEuropeMember
pm:OtherLitigationMember
2019-07-01
2019-09-30
0001413329
pm:RothmansBensonAndHedgesInc.RBHMember
pm:ConseilQuebecoisSurLeTabacEtLaSanteandJeanYvesBlaisMember
country:CA
us-gaap:JudicialRulingMember
pm:SmokingAndHealthClassActionsMember
2019-03-01
2019-03-01
0001413329
pm:CombustibleProductsMember
country:IT
pm:IndividualLabelRelatedCasesMember
us-gaap:SubsequentEventMember
2019-10-22
0001413329
pm:CombustibleProductsMember
country:BR
pm:IndividualSmokingAndHealthCasesMember
us-gaap:SubsequentEventMember
2019-10-22
0001413329
pm:TheAttorneyGeneralOfOgunStateMember
country:NG
us-gaap:PendingLitigationMember
pm:HealthCareCostRecoveryActionsMember
2008-02-26
2008-02-26
0001413329
pm:RothmansBensonAndHedgesInc.RBHMember
pm:ConseilQuebecoisSurLeTabacEtLaSanteandJeanYvesBlaisMember
country:CA
us-gaap:JudicialRulingMember
pm:SmokingAndHealthClassActionsMember
2015-05-27
2015-05-27
0001413329
pm:CombustibleProductsMember
country:NG
pm:HealthCareCostRecoveryActionsMember
us-gaap:SubsequentEventMember
2019-10-22
0001413329
pm:CombustibleProductsMember
country:CA
pm:SmokingAndHealthClassActionsMember
us-gaap:SubsequentEventMember
2019-10-22
0001413329
pm:ImperialTobaccoLtd.RothmansBensonAndHedgesInc.AndJTIMacdonaldCorp.Member
pm:CeciliaLetourneauConseilQuebecoisSurLaTabacEtLaSanteandJeanYvesBlaisCasesMember
country:CA
us-gaap:JudicialRulingMember
pm:SmokingAndHealthClassActionsMember
2019-03-01
2019-03-01
0001413329
pm:RothmansBensonAndHedgesInc.RBHMember
pm:CeciliaLetourneauConseilQuebecoisSurLaTabacEtLaSanteandJeanYvesBlaisCasesMember
country:CA
pm:AppellateRulingMember
pm:SmokingAndHealthClassActionsMember
2019-03-01
2019-03-01
0001413329
pm:TheAttorneyGeneralOfGombeStateMember
country:NG
us-gaap:PendingLitigationMember
pm:HealthCareCostRecoveryActionsMember
2008-10-17
2008-10-17
0001413329
pm:ImperialTobaccoLtd.RothmansBensonAndHedgesInc.AndJTIMacdonaldCorp.Member
pm:ConseilQuebecoisSurLeTabacEtLaSanteandJeanYvesBlaisMember
country:CA
us-gaap:JudicialRulingMember
pm:SmokingAndHealthClassActionsMember
2019-03-01
2019-03-01
0001413329
pm:TheAttorneyGeneralOfKanoStateMember
country:NG
us-gaap:PendingLitigationMember
pm:HealthCareCostRecoveryActionsMember
2007-05-09
2007-05-09
0001413329
pm:CombustibleProductsMember
country:CR
pm:IndividualSmokingAndHealthCasesMember
us-gaap:SubsequentEventMember
2019-10-22
0001413329
pm:RothmansBensonAndHedgesInc.RBHMember
pm:CeciliaLetourneauConseilQuebecoisSurLaTabacEtLaSanteandJeanYvesBlaisCasesMember
country:CA
pm:AppellateRulingMember
pm:SmokingAndHealthClassActionsMember
2015-10-01
2015-10-30
0001413329
pm:TheSouthKoreanBoardOfAuditAndInspectionMember
country:KR
pm:OtherLitigationMember
2017-01-01
2017-03-31
0001413329
pm:RothmansBensonAndHedgesInc.RBHMember
pm:CeciliaLetourneauConseilQuebecoisSurLaTabacEtLaSanteandJeanYvesBlaisCasesMember
country:CA
pm:AppellateRulingMember
pm:SmokingAndHealthClassActionsMember
2019-01-01
2019-03-31
0001413329
pm:SmokerHealthDefenseAssociationadesfMember
pm:AwardpersmokerperyearMember
country:BR
pm:SmokingAndHealthClassActionsMember
2004-04-01
2004-04-30
0001413329
pm:CombustibleProductsMember
country:AR
pm:PublicCivilActionsMember
us-gaap:SubsequentEventMember
2019-10-22
0001413329
pm:CombustibleProductsMember
country:IT
pm:IndividualSmokingAndHealthCasesMember
us-gaap:SubsequentEventMember
2019-10-22
0001413329
pm:ImperialTobaccoLtd.RothmansBensonAndHedgesInc.AndJTIMacdonaldCorp.Member
pm:ConseilQuebecoisSurLeTabacEtLaSanteandJeanYvesBlaisMember
country:CA
us-gaap:JudicialRulingMember
pm:SmokingAndHealthClassActionsMember
2015-05-27
2015-05-27
0001413329
pm:TheAttorneyGeneralOfOyoStateMember
country:NG
us-gaap:PendingLitigationMember
pm:HealthCareCostRecoveryActionsMember
2007-05-25
2007-05-25
0001413329
pm:CombustibleProductsMember
country:CA
pm:IndividualSmokingAndHealthCasesMember
us-gaap:SubsequentEventMember
2019-10-22
0001413329
pm:CombustibleProductsMember
country:CL
pm:IndividualSmokingAndHealthCasesMember
us-gaap:SubsequentEventMember
2019-10-22
0001413329
pm:CombustibleProductsMember
country:KR
pm:HealthCareCostRecoveryActionsMember
us-gaap:SubsequentEventMember
2019-10-22
0001413329
pm:CombustibleProductsMember
country:BR
pm:SmokingAndHealthClassActionsMember
us-gaap:SubsequentEventMember
2019-10-22
0001413329
pm:RothmansBensonAndHedgesInc.RBHMember
pm:CeciliaLetourneauMember
country:CA
us-gaap:JudicialRulingMember
pm:SmokingAndHealthClassActionsMember
2019-03-01
2019-03-01
0001413329
pm:CombustibleProductsMember
pm:ScotlandMember
pm:IndividualSmokingAndHealthCasesMember
us-gaap:SubsequentEventMember
2019-10-22
0001413329
pm:CombustibleProductsMember
country:CA
pm:HealthCareCostRecoveryActionsMember
us-gaap:SubsequentEventMember
2019-10-22
0001413329
pm:RothmansBensonAndHedgesInc.RBHMember
pm:CeciliaLetourneauMember
country:CA
us-gaap:JudicialRulingMember
pm:SmokingAndHealthClassActionsMember
2015-05-27
2015-05-27
0001413329
pm:TheSouthKoreanBoardOfAuditAndInspectionMember
country:KR
pm:OtherLitigationMember
2016-11-01
2017-03-31
0001413329
pm:CombustibleProductsMember
country:BR
pm:HealthCareCostRecoveryActionsMember
us-gaap:SubsequentEventMember
2019-10-22
0001413329
pm:SmokerHealthDefenseAssociationadesfMember
country:BR
pm:SmokingAndHealthClassActionsMember
2004-04-30
0001413329
pm:AdamsMember
country:CA
us-gaap:PendingLitigationMember
2009-07-10
2009-07-10
0001413329
pm:TheSouthKoreanBoardOfAuditAndInspectionMember
country:KR
pm:OtherLitigationMember
2016-01-01
2016-12-31
0001413329
pm:ConseilQuebecoisSurLeTabacEtLaSanteandJeanYvesBlaisMember
country:CA
pm:SmokingAndHealthClassActionsMember
2015-05-27
2015-05-27
0001413329
pm:TheDepartmentofSpecialInvestigationsoftheGovernmentofThailandMember
country:TH
pm:OtherLitigationMember
2017-01-26
2017-01-26
0001413329
pm:CombustibleProductsMember
country:PH
pm:IndividualSmokingAndHealthCasesMember
us-gaap:SubsequentEventMember
2019-10-22
0001413329
pm:CombustibleProductsMember
country:TR
pm:IndividualSmokingAndHealthCasesMember
us-gaap:SubsequentEventMember
2019-10-22
0001413329
pm:AharonRingerV.PhilipMorrisLtd.AndGlobrandsLtd.Member
pm:PurportedLabelRelatedClassActionMember
2017-07-18
2017-07-18
0001413329
pm:CombustibleProductsMember
country:AR
pm:IndividualSmokingAndHealthCasesMember
us-gaap:SubsequentEventMember
2019-10-22
0001413329
pm:ImperialTobaccoLtd.Member
pm:CeciliaLetourneauConseilQuebecoisSurLaTabacEtLaSanteandJeanYvesBlaisCasesMember
country:CA
pm:AppellateRulingMember
pm:SmokingAndHealthClassActionsMember
2015-10-01
2015-10-30
0001413329
pm:TheDepartmentofSpecialInvestigationsoftheGovernmentofThailandMember
country:TH
us-gaap:PendingLitigationMember
pm:OtherLitigationMember
2016-01-18
2016-01-18
0001413329
pm:CombustibleProductsMember
country:PL
pm:IndividualSmokingAndHealthCasesMember
us-gaap:SubsequentEventMember
2019-10-22
0001413329
pm:CombustibleProductsMember
country:VE
pm:PublicCivilActionsMember
us-gaap:SubsequentEventMember
2019-10-22
0001413329
pm:CombustibleProductsMember
country:CL
pm:IndividualLabelRelatedCasesMember
us-gaap:SubsequentEventMember
2019-10-22
0001413329
pm:CasesRemainingOnAppealMember
2019-09-30
0001413329
pm:HugoLespadaMember
country:AR
us-gaap:JudicialRulingMember
pm:SmokingAndHealthIndividualActionsMember
2016-08-05
2016-08-05
0001413329
srt:ScenarioForecastMember
2019-01-01
2019-12-31
0001413329
pm:TaxYears20152018Member
2019-01-01
2019-09-30
0001413329
pm:RothmansBensonAndHedgesInc.RBHMember
2019-01-01
2019-09-30
0001413329
pm:UsDollarNotesMember
2019-09-30
0001413329
pm:EuroNotesPayableMember
pm:ForeignCurrencyObligationsMember
2018-12-31
0001413329
pm:EuroNotesPayableMember
pm:ForeignCurrencyObligationsMember
2019-09-30
0001413329
pm:UsDollarNotesMember
2018-12-31
0001413329
us-gaap:NotesPayableOtherPayablesMember
pm:ForeignCurrencyObligationsMember
2019-09-30
0001413329
us-gaap:NotesPayableOtherPayablesMember
pm:ForeignCurrencyObligationsMember
2018-12-31
0001413329
pm:SwissFrancNotesMember
pm:ForeignCurrencyObligationsMember
2019-09-30
0001413329
pm:SwissFrancNotesMember
pm:ForeignCurrencyObligationsMember
2018-12-31
0001413329
pm:ThreePointThreeSevenFivePercentUSDollarNotesDueAugust2029Member
pm:UsDollarNotesMember
2019-09-30
0001413329
pm:ZeroPointOneTwoFivePercentEuroNotesDueAugust2026Member
pm:EuroNotesMember
2019-09-30
0001413329
pm:TwoPointEightSevenFivePercentUSDollarNotesDueMay2024Member
pm:UsDollarNotesMember
2019-09-30
0001413329
pm:ZeroPointEightZeroZeroPercentEuroNotesDueAugust2031Member
pm:EuroNotesMember
2019-09-30
0001413329
pm:OnePointFourFiveZeroPercentEuroNotesDueAugust2039Member
pm:EuroNotesMember
2019-09-30
0001413329
pm:OnePointSevenFiveZeroPercentEuroNotesDue2020Member
pm:EuroNotesMember
2019-09-30
0001413329
pm:ThreeHundredSixtyFourDayRevolvingCreditExpiringFebruaryFourth2020Member
2019-01-28
2019-01-28
0001413329
pm:ThreeHundredSixtyFourDayRevolvingCreditExpiringFebruaryFourth2020Member
2019-01-28
0001413329
pm:TwoPointZeroPercentUSDollarNotesDueFebruary2020Member
pm:UsDollarNotesMember
2019-09-30
0001413329
pm:MultiYearRevolvingCreditExpiringFebruaryTwentyEighthTwoThousandTwentyOneMember
2019-09-30
0001413329
pm:ThreeHundredSixtyFourDayRevolvingCreditExpiringFebruaryFourth2020Member
2019-09-30
0001413329
pm:MultiYearRevolvingCreditExpiringOctoberFirstTwoThousandTwentyTwoMember
2019-09-30
0001413329
us-gaap:NotesPayableOtherPayablesMember
pm:ForeignCurrencyObligationsMember
2019-01-01
2019-09-30
0001413329
srt:MaximumMember
pm:SwissFrancNotesMember
pm:ForeignCurrencyObligationsMember
2019-09-30
0001413329
srt:MaximumMember
pm:EuroNotesPayableMember
pm:ForeignCurrencyObligationsMember
2019-09-30
0001413329
srt:MinimumMember
pm:EuroNotesPayableMember
pm:ForeignCurrencyObligationsMember
2019-09-30
0001413329
srt:MaximumMember
pm:UsDollarNotesMember
2019-09-30
0001413329
pm:UsDollarNotesMember
2019-01-01
2019-09-30
0001413329
srt:MinimumMember
pm:UsDollarNotesMember
2019-09-30
0001413329
pm:SwissFrancNotesMember
pm:ForeignCurrencyObligationsMember
2019-01-01
2019-09-30
0001413329
srt:MinimumMember
pm:SwissFrancNotesMember
pm:ForeignCurrencyObligationsMember
2019-09-30
0001413329
pm:EuroNotesPayableMember
pm:ForeignCurrencyObligationsMember
2019-01-01
2019-09-30
0001413329
us-gaap:FairValueInputsLevel3Member
2019-09-30
0001413329
us-gaap:EstimateOfFairValueFairValueDisclosureMember
2019-09-30
0001413329
us-gaap:FairValueInputsLevel1Member
2019-09-30
0001413329
us-gaap:FairValueInputsLevel2Member
2019-09-30
0001413329
us-gaap:AccumulatedGainLossNetCashFlowHedgeParentMember
2019-09-30
0001413329
us-gaap:AccumulatedTranslationAdjustmentMember
2018-09-30
0001413329
us-gaap:AccumulatedGainLossNetCashFlowHedgeParentMember
2018-09-30
0001413329
us-gaap:AccumulatedDefinedBenefitPlansAdjustmentMember
2018-09-30
0001413329
us-gaap:AccumulatedGainLossNetCashFlowHedgeParentMember
2018-12-31
0001413329
us-gaap:AccumulatedTranslationAdjustmentMember
2019-09-30
0001413329
us-gaap:AccumulatedTranslationAdjustmentMember
2018-12-31
0001413329
us-gaap:AccumulatedDefinedBenefitPlansAdjustmentMember
2019-09-30
0001413329
us-gaap:AccumulatedDefinedBenefitPlansAdjustmentMember
2018-12-31
0001413329
pm:MegapolisMember
2019-09-30
0001413329
pm:OtherRelatedPartyMember
2019-09-30
0001413329
pm:OtherRelatedPartyMember
2018-12-31
0001413329
pm:MegapolisMember
2018-12-31
0001413329
srt:MinimumMember
2019-01-01
2019-09-30
0001413329
pm:EITAMember
pm:STAEMMember
2019-09-30
0001413329
pm:EITAMember
2019-09-30
0001413329
pm:EquityMethodInvestmentGoodwillMember
2018-12-31
0001413329
pm:RothmansBensonAndHedgesInc.RBHMember
2019-03-22
0001413329
pm:ManagementEtDeveloppementDesActifsEtDesRessourcesHoldingMADARHoldingMember
pm:STAEMMember
2019-09-30
0001413329
pm:STAEMMember
2019-09-30
0001413329
2018-01-01
2018-12-31
0001413329
srt:MaximumMember
2019-01-01
2019-09-30
0001413329
pm:TTIMember
pm:PMMMember
2019-09-30
0001413329
pm:MegapolisMember
2019-09-30
0001413329
pm:IPMIndiaMember
pm:GodfreyPhillipsIndiaLtdMember
2019-09-30
0001413329
pm:EquityMethodInvestmentGoodwillMember
2019-09-30
0001413329
pm:OtherRelatedPartyMember
2019-07-01
2019-09-30
0001413329
pm:MegapolisMember
2018-01-01
2018-09-30
0001413329
pm:OtherRelatedPartyMember
2019-01-01
2019-09-30
0001413329
pm:MegapolisMember
2018-07-01
2018-09-30
0001413329
pm:MegapolisMember
2019-07-01
2019-09-30
0001413329
pm:OtherRelatedPartyMember
2018-01-01
2018-09-30
0001413329
pm:OtherRelatedPartyMember
2018-07-01
2018-09-30
0001413329
pm:MegapolisMember
2019-01-01
2019-09-30
0001413329
pm:TabacaleraCostarricenseS.A.AndMendiolaYCampaniaS.A.PurchaseOfNoncontrollingInterestMember
2018-03-21
2018-03-21
0001413329
pm:TabacaleraCostarricenseS.A.AndMendiolaYCampaniaS.A.PurchaseOfNoncontrollingInterestMember
2018-03-21
0001413329
pm:MarketingAdministrationAndResearchCostsMember
2019-07-01
2019-09-30
0001413329
srt:MaximumMember
2019-09-30
0001413329
us-gaap:CostOfSalesMember
2019-07-01
2019-09-30
0001413329
us-gaap:CostOfSalesMember
2019-01-01
2019-09-30
0001413329
srt:MinimumMember
2019-09-30
0001413329
country:PK
2019-01-01
2019-09-30
0001413329
country:CO
2019-01-01
2019-09-30
0001413329
pm:RothmansBensonAndHedgesInc.RBHMember
us-gaap:GoodwillMember
2019-03-22
0001413329
pm:RothmansBensonAndHedgesInc.RBHMember
pm:OtherComprehensiveEarningsMember
2019-03-22
0001413329
pm:MeasurementInputTerminalGrowthRateMember
us-gaap:ValuationTechniqueDiscountedCashFlowMember
2019-03-22
0001413329
pm:RothmansBensonAndHedgesInc.RBHMember
pm:OtherAssetsandLiabilitiesMember
2019-03-22
0001413329
us-gaap:MeasurementInputDiscountRateMember
us-gaap:ValuationTechniqueDiscountedCashFlowMember
2019-03-22
0001413329
pm:RothmansBensonAndHedgesInc.RBHMember
us-gaap:CashMember
2019-03-22
0001413329
pm:RothmansBensonAndHedgesInc.RBHMember
pm:CeciliaLetourneauConseilQuebecoisSurLaTabacEtLaSanteandJeanYvesBlaisCasesMember
country:CA
pm:AppellateRulingMember
pm:SmokingAndHealthClassActionsMember
2019-03-01
0001413329
us-gaap:AccountingStandardsUpdate201602Member
2019-01-01
xbrli:pure
xbrli:shares
iso4217:USD
xbrli:shares
pm:performance_metric
pm:year
iso4217:USD
iso4217:CAD
pm:cigarette
iso4217:THB
iso4217:EUR
pm:segment
pm:manufacturer
iso4217:BRL
iso4217:RUB
iso4217:KRW
pm:defendant
pm:litigation_case
pm:plaintiff
pm:patient
iso4217:ARS
UNITED STATES
SECURITIES AND EXCHANGE COMMISSION
WASHINGTON, D.C. 20549
FORM 10-Q
(Mark One)
|
| |
☑ | QUARTERLY REPORT PURSUANT TO SECTION 13 OR 15(d) OF THE SECURITIES EXCHANGE ACT OF 1934 |
For the quarterly period ended September 30, 2019
OR |
| |
☐ | TRANSITION REPORT PURSUANT TO SECTION 13 OR 15(d) OF THE SECURITIES EXCHANGE ACT OF 1934 |
For the transition period from to
Commission File Number 001-33708
|
| | | | |
Philip Morris International Inc. |
| | | | |
(Exact name of registrant as specified in its charter)
|
| |
Virginia | 13-3435103 |
(State or other jurisdiction of incorporation or organization) | (I.R.S. Employer Identification No.) |
|
| | | |
120 Park Avenue | New York | New York | 10017 |
(Address of principal executive offices) | | | (Zip Code) |
|
| | |
Registrant’s telephone number, including area code | (917) | 663-2000 |
Former name, former address and former fiscal year, if changed since last report
Securities registered pursuant to Section 12(b) of the Act:
|
| | | | |
Title of each class | | Trading Symbol(s) | | Name of each exchange on which registered |
Common Stock, no par value | | PM | | New York Stock Exchange |
1.875% Notes due 2019 | | PM19D | | New York Stock Exchange |
2.000% Notes due 2020 | | PM20B | | New York Stock Exchange |
Floating Notes due 2020 | | PM20C | | New York Stock Exchange |
1.750% Notes due 2020 | | PM20A | | New York Stock Exchange |
4.500% Notes due 2020 | | PM20 | | New York Stock Exchange |
1.875% Notes due 2021 | | PM21B | | New York Stock Exchange |
1.875% Notes due 2021 | | PM21C | | New York Stock Exchange |
4.125% Notes due 2021 | | PM21 | | New York Stock Exchange |
2.900% Notes due 2021 | | PM21A | | New York Stock Exchange |
2.625% Notes due 2022 | | PM22A | | New York Stock Exchange |
2.375% Notes due 2022 | | PM22B | | New York Stock Exchange |
2.500% Notes due 2022 | | PM22 | | New York Stock Exchange |
2.500% Notes due 2022 | | PM22C | | New York Stock Exchange |
2.625% Notes due 2023 | | PM23 | | New York Stock Exchange |
2.125% Notes due 2023 | | PM23B | | New York Stock Exchange |
|
| | | | |
Title of each class | | Trading Symbol(s) | | Name of each exchange on which registered |
3.600% Notes due 2023 | | PM23A | | New York Stock Exchange |
2.875% Notes due 2024 | | PM24 | | New York Stock Exchange |
2.875% Notes due 2024 | | PM24C | | New York Stock Exchange |
0.625% Notes due 2024 | | PM24B | | New York Stock Exchange |
3.250% Notes due 2024 | | PM24A | | New York Stock Exchange |
2.750% Notes due 2025 | | PM25 | | New York Stock Exchange |
3.375% Notes due 2025 | | PM25A | | New York Stock Exchange |
2.750% Notes due 2026 | | PM26A | | New York Stock Exchange |
2.875% Notes due 2026 | | PM26 | | New York Stock Exchange |
0.125% Notes due 2026 | | PM26B | | New York Stock Exchange |
3.125% Notes due 2027 | | PM27 | | New York Stock Exchange |
3.125% Notes due 2028 | | PM28 | | New York Stock Exchange |
2.875% Notes due 2029 | | PM29 | | New York Stock Exchange |
3.375% Notes due 2029 | | PM29A | | New York Stock Exchange |
0.800% Notes due 2031 | | PM31 | | New York Stock Exchange |
3.125% Notes due 2033 | | PM33 | | New York Stock Exchange |
2.000% Notes due 2036 | | PM36 | | New York Stock Exchange |
1.875% Notes due 2037 | | PM37A | | New York Stock Exchange |
6.375% Notes due 2038 | | PM38 | | New York Stock Exchange |
1.450% Notes due 2039 | | PM39 | | New York Stock Exchange |
4.375% Notes due 2041 | | PM41 | | New York Stock Exchange |
4.500% Notes due 2042 | | PM42 | | New York Stock Exchange |
3.875% Notes due 2042 | | PM42A | | New York Stock Exchange |
4.125% Notes due 2043 | | PM43 | | New York Stock Exchange |
4.875% Notes due 2043 | | PM43A | | New York Stock Exchange |
4.250% Notes due 2044 | | PM44 | | New York Stock Exchange |
Indicate by check mark whether the registrant (1) has filed all reports required to be filed by Section 13 or 15(d) of the Securities Exchange Act of 1934 during the preceding 12 months (or for such shorter period that the registrant was required to file such reports), and (2) has been subject to such filing requirements for the past 90 days. Yes þ No ¨
Indicate by check mark whether the registrant has submitted electronically every Interactive Data File required to be submitted pursuant to Rule 405 of Regulation S-T (§232.405 of this chapter) during the preceding 12 months (or for such shorter period that the registrant was required to submit such files). Yes þ No ¨
Indicate by check mark whether the registrant is a large accelerated filer, an accelerated filer, a non-accelerated filer, a smaller reporting company, or an emerging growth company. See the definitions of “large accelerated filer,” “accelerated filer,” “smaller reporting company,” and "emerging growth company" in Rule 12b-2 of the Exchange Act.
Large accelerated filer þ Accelerated filer ☐
Non-accelerated filer ☐ Smaller reporting company ☐
Emerging growth company ☐
If an emerging growth company, indicate by check mark if the registrant has elected not to use the extended transition period for complying with any new or revised financial accounting standards provided pursuant to Section 13(a) of the Exchange Act. ¨
Indicate by check mark whether the registrant is a shell company (as defined in Rule 12b-2 of the Exchange Act). Yes ☐ No þ
At October 21, 2019, there were 1,555,874,621 shares outstanding of the registrant’s common stock, no par value per share.
PHILIP MORRIS INTERNATIONAL INC.
TABLE OF CONTENTS
|
| | |
| | Page No. |
| | |
PART I - | | |
| | |
Item 1. | | |
| | |
| Condensed Consolidated Statements of Earnings for the | |
| Nine Months Ended September 30, 2019 and 2018 | |
| Three Months Ended September 30, 2019 and 2018 | |
| | |
| Condensed Consolidated Statements of Comprehensive Earnings for the | |
| Nine Months Ended September 30, 2019 and 2018 | |
| Three Months Ended September 30, 2019 and 2018 | |
| | |
| Condensed Consolidated Balance Sheets at | |
| September 30, 2019 and December 31, 2018 | |
| | |
| Condensed Consolidated Statements of Cash Flows for the | |
| Nine Months Ended September 30, 2019 and 2018 | |
| | |
| Condensed Consolidated Statements of Stockholders’ (Deficit) Equity for the | |
| Nine Months Ended September 30, 2019 and 2018 | |
| Three Months Ended September 30, 2019 and 2018 | |
| | |
| | |
| | |
Item 2. | | |
| | |
Item 4. | | |
| | |
PART II - | | |
| | |
Item 1. | | |
| | |
Item 1A. | | |
| | |
Item 2. | | |
| | |
Item 6. | | |
| | |
| | |
In this report, “PMI,” “we,” “us” and “our” refer to Philip Morris International Inc. and its subsidiaries.
Trademarks and service marks in this report are the registered property of, or licensed by, the subsidiaries of Philip Morris International Inc. and are italicized.
PART I – FINANCIAL INFORMATION
Item 1. Financial Statements.
Philip Morris International Inc. and Subsidiaries
Condensed Consolidated Statements of Earnings
(in millions of dollars, except per share data)
(Unaudited)
|
| | | | | | | |
| For the Nine Months Ended September 30, |
| 2019 | | 2018 |
Revenues including excise taxes | $ | 58,072 |
| | $ | 59,965 |
|
Excise taxes on products | 35,980 |
| | 37,839 |
|
Net revenues | 22,092 |
| | 22,126 |
|
Cost of sales | 7,735 |
| | 7,977 |
|
Gross profit | 14,357 |
| | 14,149 |
|
Marketing, administration and research costs (Notes 8, 19 & 20) | 6,282 |
| | 5,411 |
|
Amortization of intangibles | 50 |
| | 63 |
|
Operating income | 8,025 |
| | 8,675 |
|
Interest expense, net | 434 |
| | 540 |
|
Pension and other employee benefit costs (Note 3) | 61 |
| | 19 |
|
Earnings before income taxes | 7,530 |
| | 8,116 |
|
Provision for income taxes | 1,670 |
| | 1,894 |
|
Equity investments and securities (income)/loss, net | (86 | ) | | (61 | ) |
Net earnings | $ | 5,946 |
| | $ | 6,283 |
|
Net earnings attributable to noncontrolling interests | 377 |
| | 282 |
|
Net earnings attributable to PMI | $ | 5,569 |
| | $ | 6,001 |
|
Per share data (Note 6): | | | |
Basic earnings per share | $ | 3.57 |
| | $ | 3.85 |
|
Diluted earnings per share | $ | 3.57 |
| | $ | 3.85 |
|
See notes to condensed consolidated financial statements.
Philip Morris International Inc. and Subsidiaries
Condensed Consolidated Statements of Earnings
(in millions of dollars, except per share data)
(Unaudited)
|
| | | | | | | |
| For the Three Months Ended September 30, |
| 2019 | | 2018 |
Revenues including excise taxes | $ | 20,380 |
| | $ | 20,439 |
|
Excise taxes on products | 12,738 |
| | 12,935 |
|
Net revenues | 7,642 |
| | 7,504 |
|
Cost of sales | 2,605 |
| | 2,618 |
|
Gross profit | 5,037 |
| | 4,886 |
|
Marketing, administration and research costs (Notes 8 & 19) | 2,234 |
| | 1,710 |
|
Amortization of intangibles | 15 |
| | 20 |
|
Operating income | 2,788 |
| | 3,156 |
|
Interest expense, net | 132 |
| | 145 |
|
Pension and other employee benefit costs (Note 3) | 20 |
| | 7 |
|
Earnings before income taxes | 2,636 |
| | 3,004 |
|
Provision for income taxes | 635 |
| | 691 |
|
Equity investments and securities (income)/loss, net | (45 | ) | | (28 | ) |
Net earnings | 2,046 |
| | 2,341 |
|
Net earnings attributable to noncontrolling interests | 150 |
| | 94 |
|
Net earnings attributable to PMI | $ | 1,896 |
| | $ | 2,247 |
|
Per share data (Note 6): | | | |
Basic earnings per share | $ | 1.22 |
| | $ | 1.44 |
|
Diluted earnings per share | $ | 1.22 |
| | $ | 1.44 |
|
See notes to condensed consolidated financial statements.
Philip Morris International Inc. and Subsidiaries
Condensed Consolidated Statements of Comprehensive Earnings
(in millions of dollars)
(Unaudited)
|
| | | | | | | | |
| | For the Nine Months Ended September 30, |
| | 2019 | | 2018 |
Net earnings | | $ | 5,946 |
| | $ | 6,283 |
|
Other comprehensive earnings (losses), net of income taxes: | | | | |
Change in currency translation adjustments: | | | | |
Unrealized gains (losses), net of income taxes of ($230) in 2019 and $60 in 2018 | | 363 |
| | (939 | ) |
(Gains)/losses transferred to earnings - deconsolidation of RBH, net of income taxes of $- in 2019 and $- in 2018 (Note 20)
| | 502 |
| | — |
|
Change in net loss and prior service cost: | | | | |
Net gains (losses) and prior service costs, net of income taxes of $133 in 2019 and $- in 2018 | | 133 |
| | — |
|
Amortization of net losses, prior service costs and net transition costs, net of income taxes of ($43) in 2019 and ($30) in 2018 | | 180 |
| | 150 |
|
(Gains)/losses transferred to earnings - deconsolidation of RBH, net of income taxes of ($15) in 2019 and $- in 2018 (Note 20) | | 27 |
| | — |
|
Change in fair value of derivatives accounted for as hedges: | | | | |
Gains (losses) recognized, net of income taxes of $5 in 2019 and ($4) in 2018 | | (34 | ) | | 29 |
|
(Gains) losses transferred to earnings, net of income taxes of $3 in 2019 and $2 in 2018 | | (12 | ) | | (9 | ) |
Total other comprehensive earnings (losses) | | 1,159 |
| | (769 | ) |
Total comprehensive earnings | | 7,105 |
| | 5,514 |
|
Less comprehensive earnings attributable to: | | | | |
Noncontrolling interests | | 391 |
| | 177 |
|
Comprehensive earnings attributable to PMI | | $ | 6,714 |
| | $ | 5,337 |
|
See notes to condensed consolidated financial statements.
Philip Morris International Inc. and Subsidiaries
Condensed Consolidated Statements of Comprehensive Earnings
(in millions of dollars)
(Unaudited)
|
| | | | | | | | |
| | For the Three Months Ended September 30, |
| | 2019 | | 2018 |
Net earnings | | $ | 2,046 |
| | $ | 2,341 |
|
Other comprehensive earnings (losses), net of income taxes: | | | | |
Change in currency translation adjustments: | | | | |
Unrealized gains (losses), net of income taxes of ($163) in 2019 and $87 in 2018 | | 12 |
| | (394 | ) |
Change in net loss and prior service cost: | | | | |
Net gains (losses) and prior service costs, net of income taxes of ($2) in 2019 and $- in 2018 | | (2 | ) | | — |
|
Amortization of net losses, prior service costs and net transition costs, net of income taxes of ($13) in 2019 and ($9) in 2018 | | 61 |
| | 50 |
|
Change in fair value of derivatives accounted for as hedges: | | | | |
Gains (losses) recognized, net of income taxes of $2 in 2019 and ($5) in 2018 | | (14 | ) | | 40 |
|
(Gains) losses transferred to earnings, net of income taxes of $- in 2019 and $2 in 2018 | | 13 |
| | (15 | ) |
Total other comprehensive earnings (losses) | | 70 |
| | (319 | ) |
Total comprehensive earnings | | 2,116 |
| | 2,022 |
|
Less comprehensive earnings attributable to: | | | | |
Noncontrolling interests | | 135 |
| | 66 |
|
Comprehensive earnings attributable to PMI | | $ | 1,981 |
| | $ | 1,956 |
|
See notes to condensed consolidated financial statements.
Philip Morris International Inc. and Subsidiaries
Condensed Consolidated Balance Sheets
(in millions of dollars)
(Unaudited)
|
| | | | | | | |
| September 30,
2019 | | December 31,
2018 |
ASSETS | | | |
Cash and cash equivalents | $ | 6,507 |
| | $ | 6,593 |
|
Trade receivables (less allowances of $27 in 2019 and $25 in 2018) | 3,073 |
| | 2,950 |
|
Other receivables | 656 |
| | 614 |
|
Inventories: | | | |
Leaf tobacco | 2,081 |
| | 2,318 |
|
Other raw materials | 1,514 |
| | 1,405 |
|
Finished product | 4,934 |
| | 5,081 |
|
| 8,529 |
| | 8,804 |
|
Other current assets | 810 |
| | 481 |
|
Total current assets | 19,575 |
| | 19,442 |
|
Property, plant and equipment, at cost | 14,164 |
| | 14,557 |
|
Less: accumulated depreciation | 7,528 |
| | 7,356 |
|
| 6,636 |
| | 7,201 |
|
Goodwill (Note 4) | 5,720 |
| | 7,189 |
|
Other intangible assets, net (Note 4) | 2,088 |
| | 2,278 |
|
Investments in unconsolidated subsidiaries and equity securities (Notes 11&14) | 4,499 |
| | 1,269 |
|
Deferred income taxes | 968 |
| | 977 |
|
Other assets | 1,934 |
| | 1,445 |
|
TOTAL ASSETS | $ | 41,420 |
| | $ | 39,801 |
|
See notes to condensed consolidated financial statements.
Continued
Philip Morris International Inc. and Subsidiaries
Condensed Consolidated Balance Sheets (Continued)
(in millions of dollars, except share data)
(Unaudited)
|
| | | | | | | |
| September 30,
2019 | | December 31,
2018 |
LIABILITIES | | | |
Short-term borrowings (Note 10) | $ | 355 |
| | $ | 730 |
|
Current portion of long-term debt (Note 10) | 5,035 |
| | 4,054 |
|
Accounts payable | 1,704 |
| | 2,068 |
|
Accrued liabilities: | | | |
Marketing and selling | 677 |
| | 732 |
|
Taxes, except income taxes | 5,130 |
| | 5,088 |
|
Employment costs | 813 |
| | 794 |
|
Dividends payable | 1,831 |
| | 1,783 |
|
Other | 1,777 |
| | 1,366 |
|
Income taxes | 723 |
| | 576 |
|
Total current liabilities | 18,045 |
| | 17,191 |
|
Long-term debt (Note 10) | 26,426 |
| | 26,975 |
|
Deferred income taxes | 905 |
| | 898 |
|
Employment costs | 2,859 |
| | 3,083 |
|
Income taxes and other liabilities | 2,340 |
| | 2,393 |
|
Total liabilities | 50,575 |
| | 50,540 |
|
Contingencies (Note 8) |
| |
|
STOCKHOLDERS’ (DEFICIT) EQUITY | | | |
Common stock, no par value
(2,109,316,331 shares issued in 2019 and 2018) | — |
| | — |
|
Additional paid-in capital | 1,981 |
| | 1,939 |
|
Earnings reinvested in the business | 31,197 |
| | 31,014 |
|
Accumulated other comprehensive losses | (8,966 | ) | | (10,111 | ) |
| 24,212 |
| | 22,842 |
|
Less: cost of repurchased stock (553,456,284 and 554,736,610 shares in 2019 and 2018, respectively) | 35,222 |
| | 35,301 |
|
Total PMI stockholders’ deficit | (11,010 | ) | | (12,459 | ) |
Noncontrolling interests | 1,855 |
| | 1,720 |
|
Total stockholders’ deficit | (9,155 | ) | | (10,739 | ) |
TOTAL LIABILITIES AND STOCKHOLDERS’ (DEFICIT) EQUITY | $ | 41,420 |
| | $ | 39,801 |
|
See notes to condensed consolidated financial statements.
Philip Morris International Inc. and Subsidiaries
Condensed Consolidated Statements of Cash Flows
(in millions of dollars)
(Unaudited)
|
| | | | | | | |
| For the Nine Months Ended September 30, |
| 2019 | | 2018 |
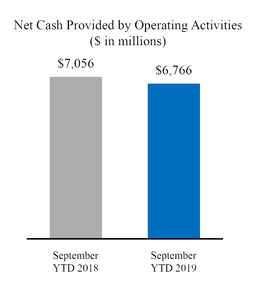
CASH PROVIDED BY (USED IN) OPERATING ACTIVITIES | | | |
| | | |
Net earnings | $ | 5,946 |
| | $ | 6,283 |
|
| | | |
Adjustments to reconcile net earnings to operating cash flows: | | | |
Depreciation and amortization | 709 |
| | 734 |
|
Deferred income tax (benefit) provision | (124 | ) | | (42 | ) |
Cash effects of changes in: | | | |
Receivables, net | (506 | ) | | 112 |
|
Inventories | (64 | ) | | (149 | ) |
Accounts payable | (31 | ) | | (376 | ) |
Accrued liabilities and other current assets | 292 |
| | 621 |
|
Income taxes | (6 | ) | | (272 | ) |
Pension plan contributions | (89 | ) | | (58 | ) |
Other | 639 |
| (1) | 203 |
|
Net cash provided by operating activities | 6,766 |
| | 7,056 |
|
| | | |
CASH PROVIDED BY (USED IN) INVESTING ACTIVITIES | | | |
| | | |
Capital expenditures | (696 | ) | | (1,102 | ) |
Investments in unconsolidated subsidiaries and equity securities | (31 | ) | | (41 | ) |
Deconsolidation of RBH (Note 20) | (1,346 | ) | (2) | — |
|
Net investment hedges | 429 |
| | (60 | ) |
Other | 17 |
| | 39 |
|
Net cash used in investing activities | (1,627 | ) | | (1,164 | ) |
See notes to condensed consolidated financial statements.
Continued
Philip Morris International Inc. and Subsidiaries
Condensed Consolidated Statements of Cash Flows (Continued)
(in millions of dollars)
(Unaudited)
|
| | | | | | | |
| For the Nine Months Ended September 30, |
| 2019 | | 2018 |
CASH PROVIDED BY (USED IN) FINANCING ACTIVITIES | | | |
| | | |
Short-term borrowing activity by original maturity: | | | |
Net issuances (repayments) - maturities of 90 days or less | $ | (340 | ) | | $ | 75 |
|
Issuances - maturities longer than 90 days | 989 |
| | — |
|
Repayments - maturities longer than 90 days | (989 | ) | | — |
|
Long-term debt proceeds | 3,819 |
| | — |
|
Long-term debt repaid | (2,971 | ) | | (2,483 | ) |
Dividends paid | (5,336 | ) | | (5,110 | ) |
Sale (purchase) of subsidiary shares to/(from) noncontrolling interests (Note 17) | 47 |
| | (82 | ) |
Other | (321 | ) | | (304 | ) |
Net cash used in financing activities | (5,102 | ) | | (7,904 | ) |
Effect of exchange rate changes on cash, cash equivalents and restricted cash | (146 | ) | | (551 | ) |
| | | |
Cash, cash equivalents and restricted cash(3): | | | |
Increase (Decrease) | (109 | ) | | (2,563 | ) |
Balance at beginning of period | 6,620 |
| | 8,476 |
|
Balance at end of period | $ | 6,511 |
| | $ | 5,913 |
|
| | | |
(1) $239 million), the Canadian tobacco litigation-related charge ($194 million) and the Asset impairment and exit cost charge ($65 million) that were included in marketing, administration and research costs in the condensed consolidated statements of earnings for the nine months ended September 30, 2019. For further details on these charges, see Note 19. Asset Impairment and Exit Costs and Note 20. Deconsolidation of RBH.
(2) $1,323 million and restricted cash of $23 million.
(3) $4 million and $33 million as of September 30, 2019 and 2018, respectively, and $27 million and $29 million as of December 31, 2018, and 2017, respectively, which were included in other current assets in the condensed consolidated balance sheets.
See notes to condensed consolidated financial statements.
Philip Morris International Inc. and Subsidiaries
Condensed Consolidated Statements of Stockholders’ (Deficit) Equity
For the Nine Months Ended September 30, 2019 and 2018
(in millions of dollars, except per share amounts)
(Unaudited)
|
| | | | | | | | | | | | | | | | | | | | | | | | | | | |
| PMI Stockholders’ (Deficit) Equity | | | | |
| Common
Stock | | Additional
Paid-in
Capital | | Earnings
Reinvested in
the
Business | | Accumulated
Other
Comprehensive Losses | | Cost of
Repurchased
Stock | | Noncontrolling
Interests | | Total |
Balances, January 1, 2018 | $ | — |
| | $ | 1,972 |
| | $ | 29,859 |
| | $ | (8,535 | ) | | $ | (35,382 | ) | | $ | 1,856 |
| | $ | (10,230 | ) |
Net earnings | | | | | 6,001 |
| | | | | | 282 |
| | 6,283 |
|
Other comprehensive earnings (losses), net of income taxes | | | | | | | (660 | ) | | | | (109 | ) | | (769 | ) |
Issuance of stock awards | | | 15 |
| | | | | | 78 |
| | | | 93 |
|
Dividends declared ($3.35 per share) | | | | | (5,221 | ) | | | | | | | | (5,221 | ) |
Payments to noncontrolling interests | | | | | | | | | | | (250 | ) | | (250 | ) |
Adoption of new accounting standards | | | | | 238 |
| | | | | | | | 238 |
|
Other (Note 17) | | | (81 | ) | | | | (4 | ) | | | | (1 | ) | | (86 | ) |
Balances, September 30, 2018 | $ | — |
| | $ | 1,906 |
| | $ | 30,877 |
| | $ | (9,199 | ) | | $ | (35,304 | ) | | $ | 1,778 |
| | $ | (9,942 | ) |
Balances, January 1, 2019 | $ | — |
| | $ | 1,939 |
| | $ | 31,014 |
| | $ | (10,111 | ) | | $ | (35,301 | ) | | $ | 1,720 |
| | $ | (10,739 | ) |
Net earnings | | | | | 5,569 |
| | | | | | 377 |
| | 5,946 |
|
Other comprehensive earnings (losses), net of income taxes | | | | | | | 616 |
| | | | 14 |
| | 630 |
|
Issuance of stock awards | | | 44 |
| | | | | | 79 |
| | | | 123 |
|
Dividends declared ($3.45 per share) | | | | | (5,386 | ) | | | | | | | | (5,386 | ) |
Payments to noncontrolling interests | | | | | | | | | | | (305 | ) | | (305 | ) |
Deconsolidation of RBH (Note 20) | | | | | | | 529 |
| | | | | | 529 |
|
Other | | | (2 | ) | | | | — |
| | | | 49 |
| | 47 |
|
Balances, September 30, 2019 | $ | — |
| | $ | 1,981 |
| | $ | 31,197 |
| | $ | (8,966 | ) | | $ | (35,222 | ) | | $ | 1,855 |
| | $ | (9,155 | ) |
See notes to condensed consolidated financial statements.
Philip Morris International Inc. and Subsidiaries
Condensed Consolidated Statements of Stockholders’ (Deficit) Equity
For the Three Months Ended September 30, 2019 and 2018
(in millions of dollars, except per share amounts)
(Unaudited)
|
| | | | | | | | | | | | | | | | | | | | | | | | | | | |
| PMI Stockholders’ (Deficit) Equity | | | | |
| Common
Stock | | Additional
Paid-in
Capital | | Earnings
Reinvested in
the
Business | | Accumulated
Other
Comprehensive Losses | | Cost of
Repurchased
Stock | | Noncontrolling
Interests | | Total |
Balances, July 1, 2018 | $ | — |
| | $ | 1,893 |
| | $ | 30,406 |
| | $ | (8,908 | ) | | $ | (35,306 | ) | | $ | 1,747 |
| | $ | (10,168 | ) |
Net earnings | | | | | 2,247 |
| | | | | | 94 |
| | 2,341 |
|
Other comprehensive earnings (losses), net of income taxes | | | | | | | (291 | ) | | | | (28 | ) | | (319 | ) |
Issuance of stock awards | | | 11 |
| | | | | | 2 |
| | | | 13 |
|
Dividends declared ($1.14 per share) | | | | | (1,776 | ) | | | | | | | | (1,776 | ) |
Payments to noncontrolling interests | | | | | | | | | | | (36 | ) | | (36 | ) |
Other | |
| | 2 |
| | |
| | |
| | |
| | 1 |
| | 3 |
|
Balances, September 30, 2018 | $ | — |
| | $ | 1,906 |
| | $ | 30,877 |
| | $ | (9,199 | ) | | $ | (35,304 | ) | | $ | 1,778 |
| | $ | (9,942 | ) |
Balances, July 1, 2019 | $ | — |
| | $ | 1,948 |
| | $ | 31,128 |
| | $ | (9,051 | ) | | $ | (35,224 | ) | | $ | 1,790 |
| | $ | (9,409 | ) |
Net earnings | | | | | 1,896 |
| | | | | | 150 |
| | 2,046 |
|
Other comprehensive earnings (losses), net of income taxes | | | | | | | 85 |
| | | | (15 | ) | | 70 |
|
Issuance of stock awards | | | 35 |
| | | | | | 2 |
| | | | 37 |
|
Dividends declared ($1.17 per share) | | | | | (1,827 | ) | | | | | | | | (1,827 | ) |
Payments to noncontrolling interests | | | | | |
| | | | | | (74 | ) | | (74 | ) |
Other | |
| | (2 | ) | | |
| | |
| | |
| | 4 |
| | 2 |
|
Balances, September 30, 2019 | $ | — |
| | $ | 1,981 |
| | $ | 31,197 |
| | $ | (8,966 | ) | | $ | (35,222 | ) | | $ | 1,855 |
| | $ | (9,155 | ) |
See notes to condensed consolidated financial statements.
Philip Morris International Inc. and Subsidiaries
Notes to Condensed Consolidated Financial Statements
(Unaudited)
Note 1. Background and Basis of Presentation:
Background
Philip Morris International Inc. is a holding company incorporated in Virginia, U.S.A., whose subsidiaries and affiliates and their licensees are engaged in the manufacture and sale of cigarettes and other nicotine-containing products, including reduced-risk products, in markets outside of the United States of America. In addition, PMI ships a version of its Platform 1 device and its consumables authorized by the FDA to Altria Group, Inc. for sale in the United States under license. Throughout these financial statements, the term "PMI" refers to Philip Morris International Inc. and its subsidiaries.
Reduced-risk products ("RRPs") is the term PMI uses to refer to products that present, are likely to present, or have the potential to present less risk of harm to smokers who switch to these products versus continuing smoking. PMI has a range of RRPs in various stages of development, scientific assessment and commercialization.
"Platform 1" is the term PMI uses to refer to PMI’s reduced-risk product that uses a precisely controlled heating device incorporating our IQOS HeatControl technology, into which a specially designed and proprietary tobacco unit is inserted and heated to generate an aerosol.
Basis of Presentation
The interim condensed consolidated financial statements of PMI are unaudited. These interim condensed consolidated financial statements have been prepared in conformity with accounting principles generally accepted in the United States of America ("U.S. GAAP") and such principles are applied on a consistent basis. It is the opinion of PMI’s management that all adjustments necessary for a fair statement of the interim results presented have been reflected therein. All such adjustments were of a normal recurring nature. Net revenues and net earnings attributable to PMI for any interim period are not necessarily indicative of results that may be expected for the entire year.
As of March 22, 2019, PMI deconsolidated the financial results of its Canadian subsidiary, Rothmans, Benson & Hedges Inc. ("RBH") from PMI's financial statements. For further details, see Note 20. Deconsolidation of RBH.
These statements should be read in conjunction with the audited consolidated financial statements and related notes, which appear in PMI’s Annual Report on Form 10-K for the year ended December 31, 2018.
Note 2. Stock Plans:
In May 2017, PMI’s shareholders approved the Philip Morris International Inc. 2017 Performance Incentive Plan (the “2017 Plan”). Under the 2017 Plan, PMI may grant to eligible employees restricted shares and restricted share units, performance-based cash incentive awards and performance-based equity awards. Up to 25 million shares of PMI’s common stock may be issued under the 2017 Plan. At September 30, 2019, shares available for grant under the 2017 Plan were 20,117,010.
In May 2017, PMI’s shareholders also approved the Philip Morris International Inc. 2017 Stock Compensation Plan for Non-Employee Directors (the “2017 Non-Employee Directors Plan”). A non-employee director is defined as a member of the PMI Board of Directors who is not a full-time employee of PMI or of any corporation in which PMI owns, directly or indirectly, stock possessing at least 50% of the total combined voting power of all classes of stock entitled to vote in the election of directors in such corporation. Up to 1 million shares of PMI common stock may be awarded under the 2017 Non-Employee Directors Plan. At September 30, 2019, shares available for grant under the plan were 954,084.
Philip Morris International Inc. and Subsidiaries
Notes to Condensed Consolidated Financial Statements
(Unaudited)
Restricted share unit (RSU) awards
During the nine months ended September 30, 2019 and 2018, shares granted to eligible employees and the weighted-average grant date fair value per share related to RSU awards were as follows:
|
| | | | | | |
| Number of Shares Granted | | Weighted-Average Grant Date Fair Value Per RSU Award Granted |
2019 | 1,717,230 |
| | $ 77.25 |
|
2018 | 1,274,730 |
| |
| $ 100.39 |
|
Compensation expense related to RSU awards was as follows:
|
| | | | | | |
| Compensation Expense Related to RSU Awards |
(in millions) | For the Nine Months Ended September 30, | For the Three Months Ended September 30, |
2019 | $ 91 |
| $ 27 |
|
2018 |
| $ 88 |
|
| $ 25 |
|
As of September 30, 2019, PMI had $153 million of total unrecognized compensation cost related to non-vested RSU awards. The cost is recognized over the original restriction period of the awards, which is typically three years after the date of the award, or upon death, disability or reaching the age of 58.
During the nine months ended September 30, 2019, 1,088,668 RSU awards vested. The grant date fair value of all the vested awards was approximately $97 million. The total fair value of RSU awards that vested during the nine months ended September 30, 2019 was approximately $92 million.
Performance share unit (PSU) awards
During the nine months ended September 30, 2019 and 2018, PMI granted PSU awards to certain executives. The PSU awards require the achievement of certain performance factors, which are predetermined at the time of grant, typically over a three-year performance cycle with performance metrics for such PSUs consisting of PMI’s Total Shareholder Return (TSR) relative to a predetermined peer group and on an absolute basis (50% weight), PMI’s currency-neutral compound annual adjusted operating income growth rate, excluding acquisitions (30% weight), and PMI’s performance against specific measures of PMI’s transformation (20% weight). The aggregate of the weighted performance factors for the three metrics determines the percentage of PSUs that will vest at the end of the three-year performance cycle. The minimum percentage of such PSUs that can vest is zero, with a target percentage of 100 and a maximum percentage of 200. Each such vested PSU entitles the participant to one share of common stock. An aggregate weighted PSU performance factor of 100 will result in the targeted number of PSUs being vested. At the end of the performance cycle, participants are entitled to an amount equivalent to the accumulated dividends paid on common stock during the performance cycle for the number of shares earned.
During the nine months ended September 30, 2019 and 2018, shares granted to eligible employees and the grant date fair value per share related to PSU awards were as follows:
|
| | | | | | | | |
| Number of Shares Granted | PSU Grant Date Fair Value Subject to Other Performance Factors Per Share | PSU Grant Date Fair Value Subject to TSR Performance Factor Per Share |
2019 | 647,700 |
| $ 77.23 |
| $ 83.59 |
|
2018 | 401,500 |
|
| $ 100.69 |
|
| $ 118.98 |
|
The grant date fair value of the PSU awards subject to the other performance factors was determined by using the average of the high and low market price of PMI’s stock at the date of the grant. The grant date fair value of the PSU market based awards
Philip Morris International Inc. and Subsidiaries
Notes to Condensed Consolidated Financial Statements
(Unaudited)
subject to the TSR performance factor was determined by using the Monte Carlo simulation model. The following assumptions were used to determine the grant date fair value of the PSU awards subject to the TSR performance factor:
|
| | | | | | |
| | |
| 2019 | | 2018 | |
Risk-free interest rate (a) | 2.4 | % | | 2.3 | % | |
Expected volatility | 21.4 | % | (b) | 19.6 | % | (c) |
(a) Based on the U.S. Treasury yield curve.
(b) Determined using the observed historical volatility.
(c) Determined using a weighted-average of historical and implied volatility.
Compensation expense related to PSU awards was as follows:
|
| | | | | |
| Compensation Expense Related to PSU Awards |
(in millions) | For the Nine Months Ended September 30, | For the Three Months Ended September 30, |
2019 | $ 43 |
| $ 10 |
|
2018 |
| $ 18 |
| ($ 12 | ) |
As of September 30, 2019, PMI had $43 million of total unrecognized compensation cost related to non-vested PSU awards. The cost is recognized over the performance cycle of the awards, or upon death, disability or reaching the age of 58.
During the nine months ended September 30, 2019, 330,616 PSU awards vested. The grant date fair value of all the vested awards was approximately $32 million. The total fair value of PSU awards that vested during the nine months ended September 30, 2019 was approximately $28 million.
Note 3. Benefit Plans:
Pension coverage for employees of PMI’s subsidiaries is provided, to the extent deemed appropriate, through separate plans, many of which are governed by local statutory requirements. In addition, PMI provides health care and other benefits to substantially all U.S. retired employees and certain non-U.S. retired employees. In general, health care benefits for non-U.S. retired employees are covered through local government plans.
Pension and other employee benefit costs per the condensed consolidated statements of earnings consisted of the following:
|
| | | | | | | | | | | | | | | |
| For the Nine Months Ended September 30, | | For the Three Months Ended September 30, |
(in millions) | 2019 | | 2018 | | 2019 | | 2018 |
Net pension costs (income) | $ | (16 | ) | | $ | (49 | ) | | $ | (6 | ) | | $ | (16 | ) |
Net postemployment costs | 72 |
| | 59 |
| | 25 |
| | 20 |
|
Net postretirement costs | 5 |
| | 9 |
| | 1 |
| | 3 |
|
Total pension and other employee benefit costs | $ | 61 |
| | $ | 19 |
| | $ | 20 |
| | $ | 7 |
|
Philip Morris International Inc. and Subsidiaries
Notes to Condensed Consolidated Financial Statements
(Unaudited)
Pension Plans
Components of Net Periodic Benefit Cost
Net periodic pension cost consisted of the following:
|
| | | | | | | | | | | | | | | |
| Pension (1) |
| For the Nine Months Ended September 30, | | For the Three Months Ended September 30, |
(in millions) | 2019 | | 2018 | | 2019 | | 2018 |
Service cost | $ | 161 |
| | $ | 159 |
| | $ | 54 |
| | $ | 52 |
|
Interest cost | 89 |
| | 87 |
| | 29 |
| | 29 |
|
Expected return on plan assets | (247 | ) | | (272 | ) | | (82 | ) | | (90 | ) |
Amortization: | | | | | | | |
Net loss | 142 |
| | 135 |
| | 47 |
| | 45 |
|
Prior service cost | — |
| | 1 |
| | — |
| | — |
|
Net periodic pension cost | $ | 145 |
| | $ | 110 |
| | $ | 48 |
| | $ | 36 |
|
(1) Primarily non-U.S. based defined benefit retirement plans.
Employer Contributions
PMI makes, and plans to make, contributions, to the extent that they are tax deductible and to meet specific funding requirements of its funded pension plans. Employer contributions of $89 million were made to the pension plans during the nine months ended September 30, 2019. Currently, PMI anticipates making additional contributions during the remainder of 2019 of approximately $25 million to its pension plans, based on current tax and benefit laws. However, this estimate is subject to change as a result of changes in tax and other benefit laws, as well as asset performance significantly above or below the assumed long-term rate of return on pension assets, or changes in interest and currency rates.
Note 4. Goodwill and Other Intangible Assets, net:
The movements in goodwill were as follows:
|
| | | | | | | | | | | | | | | | | | | | | |
(in millions) | European Union | Eastern Europe | Middle East & Africa | South & Southeast Asia | East Asia & Australia | Latin America & Canada | Total |
Balances, December 31, 2018 | $ | 1,357 |
| $ | 303 |
| $ | 87 |
| $ | 2,795 |
| $ | 536 |
| $ | 2,111 |
| $ | 7,189 |
|
Changes due to: | | | | | | | |
Currency | (61 | ) | (10 | ) | (3 | ) | 50 |
| 8 |
| 10 |
| (6 | ) |
Deconsolidation of RBH |
|
|
|
|
|
|
|
|
|
| (1,463 | ) | (1,463 | ) |
Balances, September 30, 2019 | $ | 1,296 |
| $ | 293 |
| $ | 84 |
| $ | 2,845 |
| $ | 544 |
| $ | 658 |
| $ | 5,720 |
|
At September 30, 2019, goodwill primarily reflects PMI’s acquisitions in Colombia, Greece, Indonesia, Mexico, Pakistan and Serbia, as well as the business combination in the Philippines.
For details on the deconsolidation of RBH, see Note 20. Deconsolidation of RBH.
Philip Morris International Inc. and Subsidiaries
Notes to Condensed Consolidated Financial Statements
(Unaudited)
Details of other intangible assets were as follows:
|
| | | | | | | | | | | | | | | | | | | | |
| | September 30, 2019 | | December 31, 2018 |
(in millions) | Weighted-Average Remaining Useful Life | Gross Carrying Amount | Accumulated Amortization | Net | | Gross Carrying Amount | Accumulated Amortization | Net |
Non-amortizable intangible assets | | $ | 1,288 |
| | $ | 1,288 |
| | $ | 1,269 |
| | $ | 1,269 |
|
Amortizable intangible assets: | | | | | | | | |
Trademarks | 18 years | 1,200 |
| $ | 507 |
| 693 |
| | 1,488 |
| $ | 608 |
| 880 |
|
Distribution networks | 8 years | 110 |
| 68 |
| 42 |
| | 141 |
| 82 |
| 59 |
|
Other* | 9 years | 107 |
| 42 |
| 65 |
| | 107 |
| 37 |
| 70 |
|
Total other intangible assets | | $ | 2,705 |
| $ | 617 |
| $ | 2,088 |
| | $ | 3,005 |
| $ | 727 |
| $ | 2,278 |
|
* Includes farmer contracts and intellectual property rights
Non-amortizable intangible assets substantially consist of trademarks from PMI’s acquisitions in Indonesia and Mexico. The increase since December 31, 2018 was due to currency movements of $19 million.
The decrease in the gross carrying amount of amortizable intangible assets from December 31, 2018 was mainly due to the deconsolidation of RBH's trademarks of ($275 million) and distribution network of ($29 million), combined with currency movements of ($13 million).
The change in the accumulated amortization from December 31, 2018 was mainly due to the deconsolidation of RBH's trademarks of ($133 million) and distribution network of ($18 million), currency movements of ($7 million), partially offset by the 2019 amortization of $50 million.
Amortization expense for each of the next five years is estimated to be $66 million or less, assuming no additional transactions occur that require the amortization of intangible assets.
During the second quarter of 2019, PMI completed its annual review of goodwill and non-amortizable intangible assets for potential impairment, and no impairment charges were required as a result of this review.
Note 5. Financial Instruments:
Overview
PMI operates in markets outside of the United States of America, with manufacturing and sales facilities in various locations around the world. PMI utilizes certain financial instruments to manage foreign currency and interest rate exposure. Derivative financial instruments are used by PMI principally to reduce exposures to market risks resulting from fluctuations in foreign currency exchange and interest rates by creating offsetting exposures. PMI is not a party to leveraged derivatives and, by policy, does not use derivative financial instruments for speculative purposes. Financial instruments qualifying for hedge accounting must maintain a specified level of effectiveness between the hedging instrument and the item being hedged, both at inception and throughout the hedged period. PMI formally documents the nature and relationships between the hedging instruments and hedged items, as well as its risk-management objectives, strategies for undertaking the various hedge transactions and method of assessing hedge effectiveness. Additionally, for hedges of forecasted transactions, the significant characteristics and expected terms of the forecasted transaction must be specifically identified, and it must be probable that each forecasted transaction will occur. If it were deemed probable that the forecasted transaction would not occur, the gain or loss would be recognized in earnings.
Philip Morris International Inc. and Subsidiaries
Notes to Condensed Consolidated Financial Statements
(Unaudited)
PMI uses deliverable and non-deliverable forward foreign exchange contracts, foreign currency swaps and foreign currency options, collectively referred to as foreign exchange contracts ("foreign exchange contracts"), and interest rate contracts to mitigate its exposure to changes in exchange and interest rates from third-party and intercompany actual and forecasted transactions. Both foreign exchange contracts and interest rate contracts are collectively referred to as derivative contracts ("derivative contracts"). The primary currencies to which PMI is exposed include the Euro, Swiss franc, Indonesian rupiah, Japanese yen, Mexican peso, Philippine peso and Russian ruble. At September 30, 2019, PMI had contracts with aggregate notional amounts of $24.3 billion of which $4.0 billion related to cash flow hedges, $11.3 billion related to hedges of net investments in foreign operations and $9.0 billion related to other derivatives that primarily offset currency exposures on intercompany financing.
The fair value of PMI’s derivative contracts included in the condensed consolidated balance sheets as of September 30, 2019 and December 31, 2018, were as follows:
|
| | | | | | | | | | | | | | | | | | | | |
| | Derivative Assets | | Derivative Liabilities |
| |
| | Fair Value | |
| | Fair Value |
(in millions) | | Balance Sheet Classification | | At September 30, 2019 | | At December 31, 2018 | | Balance Sheet Classification | | At September 30, 2019 | | At December 31, 2018 |
Derivative contracts designated as hedging instruments | | Other current assets | | $ | 342 |
| | $ | 54 |
| | Other accrued liabilities | | $ | 30 |
| | $ | 47 |
|
| | Other assets | | 59 |
| | 99 |
| | Income taxes and other liabilities | | 212 |
| | 525 |
|
Derivative contracts not designated as hedging instruments | | Other current assets | | 52 |
| | 67 |
| | Other accrued liabilities | | 25 |
| | 46 |
|
| | Other assets | | — |
| | — |
| | Income taxes and other liabilities | | 13 |
| | 13 |
|
Total derivatives | | | | $ | 453 |
| | $ | 220 |
| | | | $ | 280 |
| | $ | 631 |
|
For the nine months and three months ended September 30, 2019 and 2018, PMI's cash flow and net investment hedging instruments impacted the condensed consolidated statements of earnings and comprehensive earnings as follows:
|
| | | | | | | | | | | | | | | | | |
(pre-tax, in millions) | For the Nine Months Ended September 30, |
| Amount of Gain/(Loss) Recognized in Other Comprehensive Earnings/(Losses) on Derivatives | | Statement of Earnings Classification of Gain/(Loss) Reclassified from Other Comprehensive Earnings/(Losses) into Earnings | | Amount of Gain/(Loss) Reclassified from Other Comprehensive Earnings/(Losses) into Earnings |
| 2019 | | 2018 | | | | 2019 | | 2018 |
Derivatives in Cash Flow Hedging Relationship | | | | | | | | | |
Derivative contracts | $ | (39 | ) | | $ | 33 |
| | | | | | |
| | | | | Net revenues | | $ | 22 |
| | $ | (5 | ) |
| | | | | Cost of sales | | — |
| | — |
|
| | | | | Marketing, administration and research costs | | (3 | ) | | 7 |
|
| | | | | Interest expense, net | | (4 | ) | | (4 | ) |
Derivatives in Net Investment Hedging Relationship | | | | | | | | | |
Derivative contracts | 564 |
| | (7 | ) | | | | | | |
Total | $ | 525 |
| | $ | 26 |
| | | | $ | 15 |
| | $ | (2 | ) |
Philip Morris International Inc. and Subsidiaries
Notes to Condensed Consolidated Financial Statements
(Unaudited)
|
| | | | | | | | | | | | | | | | | |
(pre-tax, in millions) | For the Three Months Ended September 30, |
| Amount of Gain/(Loss) Recognized in Other Comprehensive Earnings/(Losses) on Derivatives | | Statement of Earnings Classification of Gain/(Loss) Reclassified from Other Comprehensive Earnings/(Losses) into Earnings | | Amount of Gain/(Loss) Reclassified from Other Comprehensive Earnings/(Losses) into Earnings |
| 2019 | | 2018 | | | | 2019 | | 2018 |
Derivatives in Cash Flow Hedging Relationship | | | | | | | | | |
Derivative contracts | $ | (16 | ) | | $ | 45 |
| | | | | | |
| | | | | Net revenues | | $ | (7 | ) | | $ | 2 |
|
| | | | | Cost of sales | | — |
| | — |
|
| | | | | Marketing, administration and research costs | | (4 | ) | | 10 |
|
| | | | | Interest expense, net | | (2 | ) | | (1 | ) |
Derivatives in Net Investment Hedging Relationship | | | | | | | | | |
Derivative contracts | 419 |
| | (145 | ) | | | | | | |
Total | $ | 403 |
| | $ | (100 | ) | | | | $ | (13 | ) | | $ | 11 |
|
Cash Flow Hedges
PMI has entered into derivative contracts to hedge the foreign currency exchange and interest rate risks related to certain forecasted transactions. Gains and losses associated with qualifying cash flow hedge contracts is deferred as a component of accumulated other comprehensive losses until the underlying hedged transactions are reported in PMI’s condensed consolidated statements of earnings. As of September 30, 2019, PMI has hedged forecasted transactions for periods not exceeding the next fifteen months with the exception of one derivative contract that expires in May 2024. The impact of these hedges is primarily included in operating cash flows on PMI’s condensed consolidated statements of cash flows.
Hedges of Net Investments in Foreign Operations
PMI designates certain foreign currency denominated debt and derivative contracts as net investment hedges, primarily of its Euro net assets. For the nine months ended September 30, 2019 and 2018, these hedges of net investments resulted in gains (losses), net of income taxes, of $771 million and $111 million, respectively, principally related to changes in the exchange rates between the Euro and U.S. dollar. For the three months ended September 30, 2019 and 2018, these hedges of net investments resulted in gains (losses), net of income taxes, of $598 million and $(192) million, respectively, principally related to changes in the exchange rates between the Euro and U.S. dollar. These gains (losses) were reported as a component of accumulated other comprehensive losses within currency translation adjustments, and were substantially offset by the losses and gains generated on the underlying assets. For the nine months ended September 30, 2019 and 2018, the gains for amounts excluded from the effectiveness testing recognized in earnings were $171 million and $198 million, respectively. For the three months ended September 30, 2019 and 2018, the gains for amounts excluded from the effectiveness testing recognized in earnings were $54 million and $63 million, respectively. These gains were accounted for in interest expense, net, on the condensed consolidated statement of earnings. The premiums paid for, and settlements of, net investment hedges are included in investing cash flows on PMI’s condensed consolidated statements of cash flows.
Other Derivatives
PMI has entered into derivative contracts to hedge the foreign currency exchange and interest rate risks related to intercompany loans between certain subsidiaries, and third-party loans. While effective as economic hedges, no hedge accounting is applied for these contracts; therefore, the unrealized gains (losses) relating to these contracts are reported in marketing, administration and research costs in PMI’s condensed consolidated statements of earnings. For the nine months ended September 30, 2019 and 2018, the gains (losses) from contracts for which PMI did not apply hedge accounting were $25 million and $244 million, respectively. For the three months ended September 30, 2019 and 2018, the gains (losses) from contracts for which PMI did not apply hedge accounting were $86 million and $(90) million, respectively. The gains (losses) from these contracts substantially offset the losses and gains generated by the underlying intercompany and third-party loans being hedged.
Philip Morris International Inc. and Subsidiaries
Notes to Condensed Consolidated Financial Statements
(Unaudited)
For the nine months and three months ended September 30, 2019 and 2018, these items impacted the consolidated statement of earnings as follows:
|
| | | | | | | | | | | | | | | | | | |
(pre-tax, in millions) | | For the Three Months Ended September 30, |
Derivatives not Designated
as Hedging Instruments | | Statement of Earnings
Classification of Gain/(Loss) | | Amount of Gain/(Loss)
Recognized in Earnings |
| | | | For the Nine Months Ended September 30, | | For the Three Months Ended September 30, |
| | | | 2019 | | 2018 | | 2019 | | 2018 |
Derivative contracts | | | | | | | | | | |
| |
| |
| |
| |
| |
|
|
| | Interest expense, net | | $ | 79 |
| | $ | 30 |
| | $ | 31 |
| | $ | 20 |
|
Total | | | | $ | 79 |
| | $ | 30 |
| | $ | 31 |
| | $ | 20 |
|
Qualifying Hedging Activities Reported in Accumulated Other Comprehensive Losses
Derivative gains or losses reported in accumulated other comprehensive losses are a result of qualifying hedging activity. Transfers of these gains or losses to earnings are offset by the corresponding gains or losses on the underlying hedged item. Hedging activity affected accumulated other comprehensive losses, net of income taxes, as follows:
|
| | | | | | | | | | | | | |
(in millions) | For the Nine Months Ended September 30, | | For the Three Months Ended September 30, |
| 2019 | 2018 | | 2019 | 2018 |
Gain/(loss) at beginning of period | $ | 35 |
| $ | 42 |
| | $ | (10 | ) | $ | 37 |
|
Derivative (gains)/losses transferred to earnings | (12 | ) | (9 | ) | | 13 |
| (15 | ) |
Change in fair value | (34 | ) | 29 |
| | (14 | ) | 40 |
|
Gain/(loss) as of September 30, | $ | (11 | ) | $ | 62 |
| | $ | (11 | ) | $ | 62 |
|
At September 30, 2019, PMI expects $4 million of derivative gains that are included in accumulated other comprehensive losses to be reclassified to the condensed consolidated statement of earnings within the next 12 months. These gains are expected to be substantially offset by the statement of earnings impact of the respective hedged transactions.
Contingent Features
PMI’s derivative instruments do not contain contingent features.
Credit Exposure and Credit Risk
PMI is exposed to credit loss in the event of non-performance by counterparties. While PMI does not anticipate non-performance, its risk is limited to the fair value of the financial instruments less any cash collateral received or pledged. PMI actively monitors its exposure to credit risk through the use of credit approvals and credit limit and by selecting and continuously monitoring a diverse group of major international banks and financial institutions as counterparties.
Fair Value
See Note 11. Fair Value Measurements and Note 13. Balance Sheet Offsetting for additional discussion of derivative financial instruments.
Philip Morris International Inc. and Subsidiaries
Notes to Condensed Consolidated Financial Statements
(Unaudited)
Note 6. Earnings Per Share:
Basic and diluted earnings per share (“EPS”) were calculated using the following:
|
| | | | | | | | | | | | | |
(in millions) | For the Nine Months Ended September 30, | | For the Three Months Ended September 30, |
| 2019 | 2018 | | 2019 | 2018 |
Net earnings attributable to PMI | $ | 5,569 |
| $ | 6,001 |
| | $ | 1,896 |
| $ | 2,247 |
|
Less distributed and undistributed earnings attributable to share-based payment awards | 13 |
| 13 |
| | 5 |
| 5 |
|
Net earnings for basic and diluted EPS | $ | 5,556 |
| $ | 5,988 |
| | $ | 1,891 |
| $ | 2,242 |
|
Weighted-average shares for basic EPS | 1,556 |
| 1,555 |
| | 1,556 |
| 1,555 |
|
Plus contingently issuable performance stock units (PSUs)
| — |
| — |
| | — |
| — |
|
Weighted-average shares for diluted EPS | 1,556 |
| 1,555 |
| | 1,556 |
| 1,555 |
|
Unvested share-based payment awards that contain non-forfeitable rights to dividends or dividend equivalents are participating securities and therefore are included in PMI’s earnings per share calculation pursuant to the two-class method.
For the 2019 and 2018 computations, there were no antidilutive stock awards.
Note 7. Segment Reporting:
PMI’s subsidiaries and affiliates are engaged in the manufacture and sale of cigarettes and other nicotine-containing products, including RRPs, in markets outside of the United States of America. In addition, PMI ships a version of its Platform 1 device and its consumables authorized by the FDA to Altria Group, Inc. for sale in the United States under license. Reportable segments for PMI are organized by geographic region and managed by segment managers who are responsible for the operating and financial results of the regions inclusive of all product categories sold in the region. PMI’s reportable segments are the European Union; Eastern Europe; Middle East & Africa; South & Southeast Asia; East Asia & Australia; and Latin America & Canada. PMI records net revenues and operating income to its segments based upon the geographic area in which the customer resides. Revenues from shipments of the Platform 1 device, heated tobacco units and accessories to Altria Group, Inc. for sale under license in the United States are included in Net Revenues of the Latin America & Canada segment.
PMI’s chief operating decision maker evaluates segment performance and allocates resources based on regional operating income, which includes results from all product categories sold in each region.
PMI disaggregates its net revenue from contracts with customers by both geographic location and product category for each of PMI's six reportable segments, as PMI believes this best depicts how the nature, amount, timing and uncertainty of its revenue and cash flows are affected by economic factors.
Philip Morris International Inc. and Subsidiaries
Notes to Condensed Consolidated Financial Statements
(Unaudited)
Segment data were as follows:
|
| | | | | | | | | | | | | |
(in millions) | For the Nine Months Ended September 30, | | For the Three Months Ended September 30, |
| 2019 | 2018 | | 2019 | 2018 |
Net revenues: | | | | | |
European Union | $ | 7,381 |
| $ | 6,958 |
| | $ | 2,645 |
| $ | 2,467 |
|
Eastern Europe | 2,300 |
| 2,105 |
| | 899 |
| 778 |
|
Middle East & Africa | 3,058 |
| 3,126 |
| | 1,127 |
| 1,143 |
|
South & Southeast Asia | 3,607 |
| 3,434 |
| | 1,246 |
| 1,197 |
|
East Asia & Australia | 4,094 |
| 4,235 |
| | 1,252 |
| 1,166 |
|
Latin America & Canada | 1,652 |
| 2,268 |
| | 473 |
| 753 |
|
Net revenues | $ | 22,092 |
| $ | 22,126 |
| | $ | 7,642 |
| $ | 7,504 |
|
Operating income (loss): | | | | | |
European Union | $ | 3,346 |
| $ | 3,096 |
| | $ | 1,255 |
| $ | 1,179 |
|
Eastern Europe | 284 |
| 682 |
| | (101 | ) | 270 |
|
Middle East & Africa | 1,304 |
| 1,268 |
| | 519 |
| 491 |
|
South & Southeast Asia | 1,471 |
| 1,324 |
| | 539 |
| 455 |
|
East Asia & Australia | 1,520 |
| 1,439 |
| | 451 |
| 426 |
|
Latin America & Canada | 100 |
| 866 |
| | 125 |
| 335 |
|
Operating income | $ | 8,025 |
| $ | 8,675 |
| | $ | 2,788 |
| $ | 3,156 |
|
Items affecting the comparability of results from operations were as follows:
| |
• | Russia excise and VAT audit charge - See Note 8. Contingencies for details of the $374 million pre-tax charge included in the Eastern Europe segment for the nine months and three months ended September 30, 2019. |
| |
• | Asset impairment and exit costs - See Note 19. Asset Impairment and Exit Costs for a breakdown of these costs by segment. |
| |
• | Canadian tobacco litigation-related expense - See Note 8. Contingencies and Note 20. Deconsolidation of RBH for details of the $194 million pre-tax charge included in the Latin America & Canada segment for the nine months ended September 30, 2019. |
| |
• | Loss on deconsolidation of RBH - See Note 20. Deconsolidation of RBH for details of the $239 million loss included in the Latin America & Canada segment for the nine months ended September 30, 2019. |
Philip Morris International Inc. and Subsidiaries
Notes to Condensed Consolidated Financial Statements
(Unaudited)
PMI's net revenues by product category were as follows:
|
| | | | | | | | | | | | | |
(in millions) | For the Nine Months Ended September 30, | | For the Three Months Ended September 30, |
| 2019 | 2018 | | 2019 | 2018 |
Net revenues: | | | | | |
Combustible products: | | | | | |
European Union | $ | 6,139 |
| $ | 6,381 |
| | $ | 2,178 |
| $ | 2,225 |
|
Eastern Europe | 1,774 |
| 1,926 |
| | 664 |
| 705 |
|
Middle East & Africa | 2,810 |
| 2,813 |
| | 1,064 |
| 1,019 |
|
South & Southeast Asia | 3,607 |
| 3,434 |
| | 1,246 |
| 1,197 |
|
East Asia & Australia | 2,074 |
| 2,348 |
| | 680 |
| 789 |
|
Latin America & Canada | 1,634 |
| 2,254 |
| | 466 |
| 748 |
|
Total combustible products | $ | 18,039 |
| $ | 19,156 |
| | $ | 6,298 |
| $ | 6,681 |
|
Reduced-risk products: | | | | | |
European Union | $ | 1,242 |
| $ | 577 |
| | $ | 467 |
| $ | 242 |
|
Eastern Europe | 526 |
| 179 |
| | 235 |
| 73 |
|
Middle East & Africa | 248 |
| 313 |
| | 63 |
| 124 |
|
South & Southeast Asia | — |
| — |
| | — |
| — |
|
East Asia & Australia | 2,020 |
| 1,887 |
| | 572 |
| 377 |
|
Latin America & Canada | 18 |
| 14 |
| | 7 |
| 5 |
|
Total reduced-risk products | $ | 4,053 |
| $ | 2,970 |
| | $ | 1,344 |
| $ | 823 |
|
| | | | | |
Total PMI net revenues | $ | 22,092 |
| $ | 22,126 |
| | $ | 7,642 |
| $ | 7,504 |
|
Note: Sum of product categories or Regions might not foot to total PMI due to roundings.
Net revenues related to combustible products refer to the operating revenues generated from the sale of these products, including shipping and handling charges billed to customers, net of sales and promotion incentives, and excise taxes. These net revenue amounts consist of the sale of PMI's cigarettes and other tobacco products combined. Other tobacco products primarily include roll-your-own and make-your-own cigarettes, pipe tobacco, cigars and cigarillos and do not include reduced-risk products.
Net revenues related to reduced-risk products refer to the operating revenues generated from the sale of these products, including shipping and handling charges billed to customers, net of sales and promotion incentives, and excise taxes. These net revenue amounts consist of the sale of PMI's heated tobacco units, IQOS devices and related accessories, and other nicotine-containing products, which primarily include PMI's e-vapor products.
PMI recognizes revenue, when control is transferred to the customer, typically either upon shipment or delivery of goods.
Note 8. Contingencies:
Tobacco-Related Litigation
Legal proceedings covering a wide range of matters are pending or threatened against us, and/or our subsidiaries, and/or our indemnitees in various jurisdictions. Our indemnitees include distributors, licensees, and others that have been named as parties in certain cases and that we have agreed to defend, as well as to pay costs and some or all of judgments, if any, that may be entered against them. Pursuant to the terms of the Distribution Agreement between Altria Group, Inc. (“Altria”) and PMI, PMI will indemnify Altria and Philip Morris USA Inc. (“PM USA”), a U.S. tobacco subsidiary of Altria, for tobacco product claims based in substantial part on products manufactured by PMI or contract manufactured for PMI by PM USA, and PM USA will indemnify PMI for tobacco product claims based in substantial part on products manufactured by PM USA, excluding tobacco products contract manufactured for PMI.
Philip Morris International Inc. and Subsidiaries
Notes to Condensed Consolidated Financial Statements
(Unaudited)
It is possible that there could be adverse developments in pending cases against us and our subsidiaries. An unfavorable outcome or settlement of pending tobacco-related litigation could encourage the commencement of additional litigation.
Damages claimed in some of the tobacco-related litigation are significant and, in certain cases in Brazil, Canada and Nigeria, range into the billions of U.S. dollars. The variability in pleadings in multiple jurisdictions, together with the actual experience of management in litigating claims, demonstrate that the monetary relief that may be specified in a lawsuit bears little relevance to the ultimate outcome. Much of the tobacco-related litigation is in its early stages, and litigation is subject to uncertainty. However, as discussed below, we have to date been largely successful in defending tobacco-related litigation.
We and our subsidiaries record provisions in the consolidated financial statements for pending litigation when we determine that an unfavorable outcome is probable and the amount of the loss can be reasonably estimated. At the present time, except as stated otherwise in this Note 8. Contingencies, while it is reasonably possible that an unfavorable outcome in a case may occur, after assessing the information available to it (i) management has not concluded that it is probable that a loss has been incurred in any of the pending tobacco-related cases; (ii) management is unable to estimate the possible loss or range of loss for any of the pending tobacco-related cases; and (iii) accordingly, no estimated loss has been accrued in the consolidated financial statements for unfavorable outcomes in these cases, if any. Legal defense costs are expensed as incurred.
It is possible that our consolidated results of operations, cash flows or financial position could be materially affected in a particular fiscal quarter or fiscal year by an unfavorable outcome or settlement of certain pending litigation. Nevertheless, although litigation is subject to uncertainty, we and each of our subsidiaries named as a defendant believe, and each has been so advised by counsel handling the respective cases, that we have valid defenses to the litigation pending against us, as well as valid bases for appeal of adverse verdicts. All such cases are, and will continue to be, vigorously defended. However, we and our subsidiaries may enter into settlement discussions in particular cases if we believe it is in our best interests to do so.
CCAA Proceedings and Stay of Tobacco-Related Cases Pending in Canada
As a result of the Court of Appeal of Quebec’s decision in both the Létourneau and Blais cases described below, our subsidiary, Rothmans, Benson & Hedges Inc. (“RBH”), and the other defendants, JTI Macdonald Corp., and Imperial Tobacco Canada Limited, sought protection in the Ontario Superior Court of Justice under the Companies’ Creditors Arrangement Act (“CCAA”) on March 22, March 8, and March 12, respectively. CCAA is a Canadian federal law that permits a Canadian business to restructure its affairs while carrying on its business in the ordinary course. The initial CCAA order made by the Ontario Superior Court on March 22, 2019 authorizes RBH to pay all expenses incurred in carrying on its business in the ordinary course after the CCAA filing, including obligations to employees, vendors, and suppliers. As further described in Note 20. Deconsolidation of RBH, RBH is now deconsolidated from our consolidated financial statements. As part of the CCAA proceedings, there is currently a comprehensive stay up to and including March 12, 2020 of all tobacco-related litigation pending in Canada against RBH and the other defendants, including PMI and our indemnitees (PM USA and Altria), namely, the smoking and health class actions filed in various Canadian provinces and health care cost recovery actions. These proceedings are presented below under the caption “Stayed Litigation — Canada.” Ernst & Young Inc. has been appointed as monitor of RBH in the CCAA proceedings. In accordance with the CCAA process, as the parties work towards a plan of arrangement or compromise, it is anticipated that the court will set additional hearings and further extend the stay of proceedings. On April 17, 2019, the Ontario Superior Court ruled that RBH and the other defendants will not be allowed to file an application to the Supreme Court of Canada for leave to appeal the Court of Appeal’s decision in the Létourneau and the Blais cases so long as the comprehensive stay of all tobacco-related litigation in Canada remains in effect and that the time period to file the application would be extended by the stay period. While RBH believes that the findings of liability and damages in both Létourneau and the Blais cases were incorrect, the CCAA proceedings will provide a forum for RBH to seek resolution through a plan of arrangement or compromise of all tobacco-related litigation pending in Canada. It is not possible to predict the resolution of the underlying legal proceedings or the length of the CCAA process.
Philip Morris International Inc. and Subsidiaries
Notes to Condensed Consolidated Financial Statements
(Unaudited)
Stayed Litigation — Canada
Smoking and Health Litigation — Canada
In the first class action pending in Canada, Conseil Québécois Sur Le Tabac Et La Santé and Jean-Yves Blais v. Imperial Tobacco Ltd., Rothmans, Benson & Hedges Inc. and JTI-Macdonald Corp., Quebec Superior Court, Canada, filed in November 1998, RBH and other Canadian manufacturers (Imperial Tobacco Canada Ltd. and JTI-Macdonald Corp.) are defendants. The plaintiffs, an anti-smoking organization and an individual smoker, sought compensatory and punitive damages for each member of the class who allegedly suffers from certain smoking-related diseases. The class was certified in 2005. The trial court issued its judgment on May 27, 2015. The trial court found RBH and two other Canadian manufacturers liable and found that the class members’ compensatory damages totaled approximately CAD 15.5 billion, including pre-judgment interest (approximately $11.8 billion). The trial court awarded compensatory damages on a joint and several liability basis, allocating 20% to our subsidiary (approximately CAD 3.1 billion, including pre-judgment interest (approximately $2.36 billion)). In addition, the trial court awarded CAD 90,000 (approximately $68,530) in punitive damages, allocating CAD 30,000 (approximately $22,840) to RBH. The trial court estimated the disease class at 99,957 members. RBH appealed to the Court of Appeal of Quebec. In October 2015, the Court of Appeal ordered RBH to furnish security totaling CAD 226 million (approximately $172.1 million) to cover both the Létourneau and Blais cases, which RBH has paid in installments through March 2017. The Court of Appeal ordered Imperial Tobacco Canada Ltd. to furnish security totaling CAD 758 million (approximately $577.2 million) in installments through June 2017. JTI Macdonald Corp. was not required to furnish security in accordance with plaintiffs’ motion. The Court of Appeal ordered that the security is payable upon a final judgment of the Court of Appeal affirming the trial court’s judgment or upon further order of the Court of Appeal. On March 1, 2019, the Court of Appeal issued a decision largely affirming the trial court’s findings of liability and the compensatory and punitive damages award while reducing the total amount of compensatory damages to approximately CAD 13.5 billion including interest (approximately $10.3 billion) due to the trial court’s error in the calculation of interest. The compensatory damages award is on a joint and several basis with an allocation of 20% to RBH (approximately CAD 2.7 billion, including pre-judgment interest (approximately $2.06 billion)). The Court of Appeal upheld the trial court’s findings that defendants violated the Civil Code of Quebec, the Quebec Charter of Human Rights and Freedoms, and the Quebec Consumer Protection Act by failing to warn adequately of the dangers of smoking and by conspiring to prevent consumers from learning of the dangers of smoking. The Court of Appeal further held that the plaintiffs either need not prove, or had adequately proven, that these faults were a cause of the class members’ injuries. In accordance with the judgment, defendants are required to deposit their respective portions of the damages awarded in both the Létourneau case described below and the Blais case, approximately CAD 1.1 billion (approximately $837.6 million), into trust accounts within 60 days. RBH’s share of the deposit is approximately CAD 257 million (approximately $195.7 million). PMI recorded a pre-tax charge of $194 million in its consolidated results, representing $142 million net of tax, as tobacco litigation-related expense, in the first quarter of 2019. The charge reflects PMI’s assessment of the portion of the judgment that represents probable and estimable loss prior to the deconsolidation of RBH and corresponds to the trust account deposit required by the judgment.
In the second class action pending in Canada, Cecilia Létourneau v. Imperial Tobacco Ltd., Rothmans, Benson & Hedges Inc. and JTI-Macdonald Corp., Quebec Superior Court, Canada, filed in September 1998, RBH and other Canadian manufacturers (Imperial Tobacco Canada Ltd. and JTI-Macdonald Corp.) are defendants. The plaintiff, an individual smoker, sought compensatory and punitive damages for each member of the class who is deemed addicted to smoking. The class was certified in 2005. The trial court issued its judgment on May 27, 2015. The trial court found RBH and two other Canadian manufacturers liable and awarded a total of CAD 131 million (approximately $99.8 million) in punitive damages, allocating CAD 46 million (approximately $35.0 million) to RBH. The trial court estimated the size of the addiction class at 918,000 members but declined to award compensatory damages to the addiction class because the evidence did not establish the claims with sufficient accuracy. The trial court found that a claims process to allocate the awarded punitive damages to individual class members would be too expensive and difficult to administer. On March 1, 2019, the Court of Appeal issued a decision largely affirming the trial court’s findings of liability and the total amount of punitive damages awarded allocating CAD 57 million including interest (approximately $43.4 million) to RBH. See the Blais description above and Note 20. Deconsolidation of RBH below for further detail concerning the security order pertaining to both Létourneau and Blais cases and the impact of the decision on PMI’s financial statements.
RBH and PMI believe the findings of liability and damages in both Létourneau and the Blais cases were incorrect and in contravention of applicable law on several grounds including the following: (i) defendants had no obligation to warn class members who knew, or should have known, of the risks of smoking; (ii) defendants cannot be liable to class members who would have smoked regardless of what warnings were given; and (iii) defendants cannot be liable to all class members given the individual differences between class members.
Philip Morris International Inc. and Subsidiaries
Notes to Condensed Consolidated Financial Statements
(Unaudited)
In the third class action pending in Canada, Kunta v. Canadian Tobacco Manufacturers' Council, et al., The Queen's Bench, Winnipeg, Canada, filed June 12, 2009, we, RBH, and our indemnitees (PM USA and Altria), and other members of the industry are defendants. The plaintiff, an individual smoker, alleges her own addiction to tobacco products and chronic obstructive pulmonary disease (“COPD”), severe asthma, and mild reversible lung disease resulting from the use of tobacco products. She is seeking compensatory and punitive damages on behalf of a proposed class comprised of all smokers, their estates, dependents and family members, as well as restitution of profits, and reimbursement of government health care costs allegedly caused by tobacco products.
In the fourth class action pending in Canada, Adams v. Canadian Tobacco Manufacturers' Council, et al., The Queen's Bench, Saskatchewan, Canada, filed July 10, 2009, we, RBH, and our indemnitees (PM USA and Altria), and other members of the industry are defendants. The plaintiff, an individual smoker, alleges her own addiction to tobacco products and COPD resulting from the use of tobacco products. She is seeking compensatory and punitive damages on behalf of a proposed class comprised of all smokers who have smoked a minimum of 25,000 cigarettes and have allegedly suffered, or suffer, from COPD, emphysema, heart disease, or cancer, as well as restitution of profits.
In the fifth class action pending in Canada, Semple v. Canadian Tobacco Manufacturers' Council, et al., The Supreme Court (trial court), Nova Scotia, Canada, filed June 18, 2009, we, RBH, and our indemnitees (PM USA and Altria), and other members of the industry are defendants. The plaintiff, an individual smoker, alleges his own addiction to tobacco products and COPD resulting from the use of tobacco products. He is seeking compensatory and punitive damages on behalf of a proposed class comprised of all smokers, their estates, dependents and family members, as well as restitution of profits, and reimbursement of government health care costs allegedly caused by tobacco products.
In the sixth class action pending in Canada, Dorion v. Canadian Tobacco Manufacturers' Council, et al., The Queen's Bench, Alberta, Canada, filed June 15, 2009, we, RBH, and our indemnitees (PM USA and Altria), and other members of the industry are defendants. The plaintiff, an individual smoker, alleges her own addiction to tobacco products and chronic bronchitis and severe sinus infections resulting from the use of tobacco products. She is seeking compensatory and punitive damages on behalf of a proposed class comprised of all smokers, their estates, dependents and family members, restitution of profits, and reimbursement of government health care costs allegedly caused by tobacco products. To date, we, our subsidiaries, and our indemnitees have not been properly served with the complaint.
In the seventh class action pending in Canada, McDermid v. Imperial Tobacco Canada Limited, et al., Supreme Court, British Columbia, Canada, filed June 25, 2010, we, RBH, and our indemnitees (PM USA and Altria), and other members of the industry are defendants. The plaintiff, an individual smoker, alleges his own addiction to tobacco products and heart disease resulting from the use of tobacco products. He is seeking compensatory and punitive damages on behalf of a proposed class comprised of all smokers who were alive on June 12, 2007, and who suffered from heart disease allegedly caused by smoking, their estates, dependents and family members, plus disgorgement of revenues earned by the defendants from January 1, 1954, to the date the claim was filed.
In the eighth class action pending in Canada, Bourassa v. Imperial Tobacco Canada Limited, et al., Supreme Court, British Columbia, Canada, filed June 25, 2010, we, RBH, and our indemnitees (PM USA and Altria), and other members of the industry are defendants. The plaintiff, the heir to a deceased smoker, alleges that the decedent was addicted to tobacco products and suffered from emphysema resulting from the use of tobacco products. She is seeking compensatory and punitive damages on behalf of a proposed class comprised of all smokers who were alive on June 12, 2007, and who suffered from chronic respiratory diseases allegedly caused by smoking, their estates, dependents and family members, plus disgorgement of revenues earned by the defendants from January 1, 1954, to the date the claim was filed. In December 2014, plaintiff filed an amended statement of claim.
In the ninth class action pending in Canada, Suzanne Jacklin v. Canadian Tobacco Manufacturers' Council, et al., Ontario Superior Court of Justice, filed June 20, 2012, we, RBH, and our indemnitees (PM USA and Altria), and other members of the industry are defendants. The plaintiff, an individual smoker, alleges her own addiction to tobacco products and COPD resulting from the use of tobacco products. She is seeking compensatory and punitive damages on behalf of a proposed class comprised of all smokers who have smoked a minimum of 25,000 cigarettes and have allegedly suffered, or suffer, from COPD, heart disease, or cancer, as well as restitution of profits.
Health Care Cost Recovery Litigation — Canada
In the first health care cost recovery case pending in Canada, Her Majesty the Queen in Right of British Columbia v. Imperial Tobacco Limited, et al., Supreme Court, British Columbia, Vancouver Registry, Canada, filed January 24, 2001, we, RBH, our indemnitee (PM USA), and other members of the industry are defendants. The plaintiff, the government of the province of British
Philip Morris International Inc. and Subsidiaries
Notes to Condensed Consolidated Financial Statements
(Unaudited)
Columbia, brought a claim based upon legislation enacted by the province authorizing the government to file a direct action against cigarette manufacturers to recover the health care costs it has incurred, and will incur, resulting from a “tobacco related wrong.”
In the second health care cost recovery case filed in Canada, Her Majesty the Queen in Right of New Brunswick v. Rothmans Inc., et al., Court of Queen's Bench of New Brunswick, Trial Court, New Brunswick, Fredericton, Canada, filed March 13, 2008, we, RBH, our indemnitees (PM USA and Altria), and other members of the industry are defendants. The claim was filed by the government of the province of New Brunswick based on legislation enacted in the province. This legislation is similar to the law introduced in British Columbia that authorizes the government to file a direct action against cigarette manufacturers to recover the health care costs it has incurred, and will incur, as a result of a “tobacco related wrong.”
In the third health care cost recovery case filed in Canada, Her Majesty the Queen in Right of Ontario v. Rothmans Inc., et al., Ontario Superior Court of Justice, Toronto, Canada, filed September 29, 2009, we, RBH, our indemnitees (PM USA and Altria), and other members of the industry are defendants. The claim was filed by the government of the province of Ontario based on legislation enacted in the province. This legislation is similar to the laws introduced in British Columbia and New Brunswick that authorize the government to file a direct action against cigarette manufacturers to recover the health care costs it has incurred, and will incur, as a result of a “tobacco related wrong.”
In the fourth health care cost recovery case filed in Canada, Attorney General of Newfoundland and Labrador v. Rothmans Inc., et al., Supreme Court of Newfoundland and Labrador, St. Johns, Canada, filed February 8, 2011, we, RBH, our indemnitees (PM USA and Altria), and other members of the industry are defendants. The claim was filed by the government of the province of Newfoundland and Labrador based on legislation enacted in the province that is similar to the laws introduced in British Columbia, New Brunswick and Ontario. The legislation authorizes the government to file a direct action against cigarette manufacturers to recover the health care costs it has incurred, and will incur, as a result of a “tobacco related wrong.”
In the fifth health care cost recovery case filed in Canada, Attorney General of Quebec v. Imperial Tobacco Limited, et al., Superior Court of Quebec, Canada, filed June 8, 2012, we, RBH, our indemnitee (PM USA), and other members of the industry are defendants. The claim was filed by the government of the province of Quebec based on legislation enacted in the province that is similar to the laws enacted in several other Canadian provinces. The legislation authorizes the government to file a direct action against cigarette manufacturers to recover the health care costs it has incurred, and will incur, as a result of a “tobacco related wrong.”
In the sixth health care cost recovery case filed in Canada, Her Majesty in Right of Alberta v. Altria Group, Inc., et al., Supreme Court of Queen's Bench Alberta, Canada, filed June 8, 2012, we, RBH, our indemnitees (PM USA and Altria), and other members of the industry are defendants. The claim was filed by the government of the province of Alberta based on legislation enacted in the province that is similar to the laws enacted in several other Canadian provinces. The legislation authorizes the government to file a direct action against cigarette manufacturers to recover the health care costs it has incurred, and will incur, as a result of a “tobacco related wrong.”
In the seventh health care cost recovery case filed in Canada, Her Majesty the Queen in Right of the Province of Manitoba v. Rothmans, Benson & Hedges, Inc., et al., The Queen's Bench, Winnipeg Judicial Centre, Canada, filed May 31, 2012, we, RBH, our indemnitees (PM USA and Altria), and other members of the industry are defendants. The claim was filed by the government of the province of Manitoba based on legislation enacted in the province that is similar to the laws enacted in several other Canadian provinces. The legislation authorizes the government to file a direct action against cigarette manufacturers to recover the health care costs it has incurred, and will incur, as a result of a “tobacco related wrong.”
In the eighth health care cost recovery case filed in Canada, The Government of Saskatchewan v. Rothmans, Benson & Hedges Inc., et al., Queen's Bench, Judicial Centre of Saskatchewan, Canada, filed June 8, 2012, we, RBH, our indemnitees (PM USA and Altria), and other members of the industry are defendants. The claim was filed by the government of the province of Saskatchewan based on legislation enacted in the province that is similar to the laws enacted in several other Canadian provinces. The legislation authorizes the government to file a direct action against cigarette manufacturers to recover the health care costs it has incurred, and will incur, as a result of a “tobacco related wrong.”
In the ninth health care cost recovery case filed in Canada, Her Majesty the Queen in Right of the Province of Prince Edward Island v. Rothmans, Benson & Hedges Inc., et al., Supreme Court of Prince Edward Island (General Section), Canada, filed September 10, 2012, we, RBH, our indemnitees (PM USA and Altria), and other members of the industry are defendants. The claim was filed by the government of the province of Prince Edward Island based on legislation enacted in the province that is similar to the laws enacted in several other Canadian provinces. The legislation authorizes the government to file a direct action
Philip Morris International Inc. and Subsidiaries
Notes to Condensed Consolidated Financial Statements
(Unaudited)
against cigarette manufacturers to recover the health care costs it has incurred, and will incur, as a result of a “tobacco related wrong.”
In the tenth health care cost recovery case filed in Canada, Her Majesty the Queen in Right of the Province of Nova Scotia v. Rothmans, Benson & Hedges Inc., et al., Supreme Court of Nova Scotia, Canada, filed January 2, 2015, we, RBH, our indemnitees (PM USA and Altria), and other members of the industry are defendants. The claim was filed by the government of the province of Nova Scotia based on legislation enacted in the province that is similar to the laws enacted in several other Canadian provinces. The legislation authorizes the government to file a direct action against cigarette manufacturers to recover the health care costs it has incurred, and will incur, as a result of a “tobacco related wrong.”
__________
The table below lists the number of tobacco-related cases pertaining to combustible products pending against us and/or our subsidiaries or indemnitees as of October 22, 2019, October 23, 2018 and October 23, 2017:¹
|
| | | | | | |
Type of Case | | Number of Cases Pending as of October 22, 2019 | | Number of Cases Pending as of October 23, 2018 | | Number of Cases Pending as of October 23, 2017 |
Individual Smoking and Health Cases | | 49 | | 63 | | 65 |
Smoking and Health Class Actions | | 10 | | 10 | | 11 |
Health Care Cost Recovery Actions | | 17 | | 16 | | 16 |
Label-Related Class Actions | | — | | 1 | | 1 |
Individual Label-Related Cases | | 5 | | 1 | | 1 |
Public Civil Actions | | 2 | | 2 | | 2 |
Since 1995, when the first tobacco-related litigation was filed against a PMI entity, 500 Smoking and Health, Label-Related, Health Care Cost Recovery, and Public Civil Actions in which we and/or one of our subsidiaries and/or indemnitees were a defendant have been terminated in our favor. Thirteen cases have had decisions in favor of plaintiffs. Nine of these cases have subsequently reached final resolution in our favor and four remain on appeal.
The table below lists the verdict and significant post-trial developments in the four pending cases where a verdict was returned in favor of the plaintiff:
|
| | | | | | | | |
Date | | Location of
Court/Name of
Plaintiff | | Type of
Case | | Verdict | | Post-Trial
Developments |
February 2004 | | Brazil/The Smoker Health Defense Association | | Class Action | | The Civil Court of São Paulo found defendants liable without hearing evidence. In April 2004, the court awarded “moral damages” of R$1,000 (approximately $243) per smoker per full year of smoking plus interest at the rate of 1% per month, as of the date of the ruling. The court did not assess actual damages, which were to be assessed in a second phase of the case. The size of the class was not defined in the ruling. | | Defendants appealed to the São Paulo Court of Appeals, which annulled the ruling in November 2008, finding that the trial court had inappropriately ruled without hearing evidence and returned the case to the trial court for further proceedings. In May 2011, the trial court dismissed the claim. In March 2017, plaintiff filed an en banc appeal to the Superior Court of Justice. In addition, the defendants filed a constitutional appeal to the Federal Supreme Tribunal on the basis that plaintiff did not have standing to bring the lawsuit. Both appeals are still pending. |
______
¹ Includes cases pending in Canada.
Philip Morris International Inc. and Subsidiaries
Notes to Condensed Consolidated Financial Statements
(Unaudited)
|
| | | | | | | | |
Date | | Location of
Court/Name of
Plaintiff | | Type of
Case | | Verdict | | Post-Trial
Developments |
May 27, 2015 | | Canada/Conseil Québécois Sur Le Tabac Et La Santé and Jean-Yves Blais
| | Class Action | | On May 27, 2015, the Superior Court of the District of Montreal, Province of Quebec ruled in favor of the Blais class on liability and found the class members’ compensatory damages totaled approximately CAD 15.5 billion (approximately $11.8 billion), including pre-judgment interest. The trial court awarded compensatory damages on a joint and several liability basis, allocating 20% to our subsidiary (approximately CAD 3.1 billion including pre-judgment interest (approximately $2.36 billion)). The trial court awarded CAD 90,000 (approximately $68,530) in punitive damages, allocating CAD 30,000 (approximately $22,840) to our subsidiary. The trial court ordered defendants to pay CAD 1 billion (approximately $761.5 million) of the compensatory damage award, CAD 200 million (approximately $152.3 million) of which is our subsidiary’s portion, into a trust within 60 days. | | In June 2015, RBH commenced the appellate process with the Court of Appeal of Quebec. On March 1, 2019, the Court of Appeal issued a decision largely affirming the trial court's decision. (See “Stayed Litigation — Canada” for further detail.) |
Philip Morris International Inc. and Subsidiaries
Notes to Condensed Consolidated Financial Statements
(Unaudited)
|
| | | | | | | | |
Date | | Location of
Court/Name of
Plaintiff | | Type of
Case | | Verdict | | Post-Trial
Developments |
May 27, 2015 | | Canada/Cecilia Létourneau
| | Class Action | | On May 27, 2015, the Superior Court of the District of Montreal, Province of Quebec ruled in favor of the Létourneau class on liability and awarded a total of CAD 131 million (approximately $99.8 million) in punitive damages, allocating CAD 46 million (approximately $35.0 million) to RBH. The trial court ordered defendants to pay the full punitive damage award into a trust within 60 days. The court did not order the payment of compensatory damages.
| | In June 2015, RBH commenced the appellate process with the Court of Appeal of Quebec. On March 1, 2019, the Court of Appeal issued a decision largely affirming the trial court's decision. (See “Stayed Litigation — Canada” for further detail.) |
|
| | | | | | | | |
Date | | Location of
Court/Name of
Plaintiff | | Type of
Case | | Verdict | | Post-Trial
Developments |
August 5, 2016 | | Argentina/Hugo Lespada | | Individual Action | | On August 5, 2016, the Civil Court No. 14 - Mar del Plata, issued a verdict in favor of plaintiff, an individual smoker, and awarded him ARS 110,000 (approximately $1,887), plus interest, in compensatory and moral damages. The trial court found that our subsidiary failed to warn plaintiff of the risk of becoming addicted to cigarettes. | | On August 23, 2016, our subsidiary filed its notice of appeal. On October 31, 2017, the Civil and Commercial Court of Appeals of Mar del Plata ruled that plaintiff's claim was barred by the statute of limitations and it reversed the trial court's decision. On November 28, 2017, plaintiff filed an extraordinary appeal of the reversal of the trial court's decision to the Supreme Court of the Province of Buenos Aires. |
Pending claims related to tobacco products generally fall within the following categories:
Smoking and Health Litigation: These cases primarily allege personal injury and are brought by individual plaintiffs or on behalf of a class or purported class of individual plaintiffs. Plaintiffs' allegations of liability in these cases are based on various theories of recovery, including negligence, gross negligence, strict liability, fraud, misrepresentation, design defect, failure to warn, breach of express and implied warranties, violations of deceptive trade practice laws and consumer protection statutes. Plaintiffs in these cases seek various forms of relief, including compensatory and other damages, and injunctive and equitable relief. Defenses raised in these cases include licit activity, failure to state a claim, lack of defect, lack of proximate cause, assumption of the risk, contributory negligence, and statute of limitations.
Philip Morris International Inc. and Subsidiaries
Notes to Condensed Consolidated Financial Statements
(Unaudited)
As of October 22, 2019, there were a number of smoking and health cases pending against us, our subsidiaries or indemnitees, as follows:
| |
• | 49 cases brought by individual plaintiffs in Argentina (31), Brazil (5), Canada (2), Chile (4), Costa Rica (1), Italy (1), the Philippines (1), Poland (2), Turkey (1) and Scotland (1), compared with 63 such cases on October 23, 2018, and 65 cases on October 23, 2017; and |
| |
• | 10 cases brought on behalf of classes of individual plaintiffs in Brazil (1) and Canada (9), compared with 10 such cases on October 23, 2018 and 11 such cases on October 23, 2017. |
The class actions pending in Canada are described above under the caption “Smoking and Health Litigation — Canada.”
In the class action pending in Brazil, The Smoker Health Defense Association (ADESF) v. Souza Cruz, S.A. and Philip Morris Marketing, S.A., Nineteenth Lower Civil Court of the Central Courts of the Judiciary District of São Paulo, Brazil, filed July 25, 1995, our subsidiary and another member of the industry are defendants. The plaintiff, a consumer organization, is seeking damages for all addicted smokers and former smokers, and injunctive relief. In 2004, the trial court found defendants liable without hearing evidence and awarded “moral damages” of R$1,000 (approximately $243) per smoker per full year of smoking plus interest at the rate of 1% per month, as of the date of the ruling. The court did not award actual damages, which were to be assessed in the second phase of the case. The size of the class was not estimated. Defendants appealed to the São Paulo Court of Appeals, which annulled the ruling in November 2008, finding that the trial court had inappropriately ruled without hearing evidence and returned the case to the trial court for further proceedings. In May 2011, the trial court dismissed the claim. In February 2015, the appellate court unanimously dismissed plaintiff's appeal. In September 2015, plaintiff appealed to the Superior Court of Justice. In February 2017, the Chief Justice of the Superior Court of Justice denied plaintiff's appeal. In March 2017, plaintiff filed an en banc appeal to the Superior Court of Justice. In addition, the defendants filed a constitutional appeal to the Federal Supreme Tribunal on the basis that plaintiff did not have standing to bring the lawsuit. Both appeals are still pending.
Health Care Cost Recovery Litigation: These cases, brought by governmental and non-governmental plaintiffs, seek reimbursement of health care cost expenditures allegedly caused by tobacco products. Plaintiffs' allegations of liability in these cases are based on various theories of recovery including unjust enrichment, negligence, negligent design, strict liability, breach of express and implied warranties, violation of a voluntary undertaking or special duty, fraud, negligent misrepresentation, conspiracy, public nuisance, defective product, failure to warn, sale of cigarettes to minors, and claims under statutes governing competition and deceptive trade practices. Plaintiffs in these cases seek various forms of relief including compensatory and other damages, and injunctive and equitable relief. Defenses raised in these cases include lack of proximate cause, remoteness of injury, failure to state a claim, adequate remedy at law, “unclean hands” (namely, that plaintiffs cannot obtain equitable relief because they participated in, and benefited from, the sale of cigarettes), and statute of limitations.
As of October 22, 2019, there were 17 health care cost recovery cases pending against us, our subsidiaries or indemnitees in Brazil (1), Canada (10), Korea (1) and Nigeria (5), compared with 16 such cases on October 23, 2018 and 16 such cases on October 23, 2017.
The health care cost recovery actions pending in Canada are described above under the caption “Health Care Cost Recovery Litigation — Canada.”
In the health care cost recovery case in Brazil, The Attorney General of Brazil v. Souza Cruz Ltda., et al., Federal Trial Court, Porto Alegre, Rio Grande do Sul, Brazil, filed May 21, 2019, we, our subsidiaries, and other members of the industry are defendants. Plaintiff seeks reimbursement for the cost of treating alleged smoking-related diseases for the past five years, payment of anticipated costs of treating future alleged smoking-related diseases, and moral damages. Our subsidiaries were served with the complaint. A challenge to the service of PMI as improper is pending.
In the first health care cost recovery case in Nigeria, The Attorney General of Lagos State v. British American Tobacco (Nigeria) Limited, et al., High Court of Lagos State, Lagos, Nigeria, filed March 13, 2008, we and other members of the industry are defendants. Plaintiff seeks reimbursement for the cost of treating alleged smoking-related diseases for the past 20 years, payment of anticipated costs of treating alleged smoking-related diseases for the next 20 years, various forms of injunctive relief, plus punitive damages. We are in the process of making challenges to service and the court's jurisdiction. Currently, the case is stayed in the trial court pending the appeals of certain co-defendants relating to service objections.
Philip Morris International Inc. and Subsidiaries
Notes to Condensed Consolidated Financial Statements
(Unaudited)
In the second health care cost recovery case in Nigeria, The Attorney General of Kano State v. British American Tobacco (Nigeria) Limited, et al., High Court of Kano State, Kano, Nigeria, filed May 9, 2007, we and other members of the industry are defendants. Plaintiff seeks reimbursement for the cost of treating alleged smoking-related diseases for the past 20 years, payment of anticipated costs of treating alleged smoking-related diseases for the next 20 years, various forms of injunctive relief, plus punitive damages. We are in the process of making challenges to service and the court's jurisdiction. Currently, the case is stayed in the trial court pending the appeals of certain co-defendants relating to service objections.
In the third health care cost recovery case in Nigeria, The Attorney General of Gombe State v. British American Tobacco (Nigeria) Limited, et al., High Court of Gombe State, Gombe, Nigeria, filed October 17, 2008, we and other members of the industry are defendants. Plaintiff seeks reimbursement for the cost of treating alleged smoking-related diseases for the past 20 years, payment of anticipated costs of treating alleged smoking-related diseases for the next 20 years, various forms of injunctive relief, plus punitive damages. In February 2011, the court ruled that the plaintiff had not complied with the procedural steps necessary to serve us. As a result of this ruling, plaintiff must re-serve its claim. We have not yet been re-served.
In the fourth health care cost recovery case in Nigeria, The Attorney General of Oyo State, et al., v. British American Tobacco (Nigeria) Limited, et al., High Court of Oyo State, Ibadan, Nigeria, filed May 25, 2007, we and other members of the industry are defendants. Plaintiffs seek reimbursement for the cost of treating alleged smoking-related diseases for the past 20 years, payment of anticipated costs of treating alleged smoking-related diseases for the next 20 years, various forms of injunctive relief, plus punitive damages. We challenged service as improper. In June 2010, the court ruled that plaintiffs did not have leave to serve the writ of summons on the defendants and that they must re-serve the writ. We have not yet been re-served.
In the fifth health care cost recovery case in Nigeria, The Attorney General of Ogun State v. British American Tobacco (Nigeria) Limited, et al., High Court of Ogun State, Abeokuta, Nigeria, filed February 26, 2008, we and other members of the industry are defendants. Plaintiff seeks reimbursement for the cost of treating alleged smoking-related diseases for the past 20 years, payment of anticipated costs of treating alleged smoking-related diseases for the next 20 years, various forms of injunctive relief, plus punitive damages. In May 2010, the trial court rejected our service objections. We have appealed.
In the health care cost recovery case in Korea, the National Health Insurance Service v. KT&G, et. al., filed April 14, 2014, our subsidiary and other Korean manufacturers are defendants. Plaintiff alleges that defendants concealed the health hazards of smoking, marketed to youth, added ingredients to make their products more harmful and addictive, and misled consumers into believing that Lights cigarettes are safer than regular cigarettes. The National Health Insurance Service seeks to recover damages allegedly incurred in treating 3,484 patients with small cell lung cancer, squamous cell lung cancer, and squamous cell laryngeal cancer from 2003 to 2012. The case is now in the evidentiary phase.
Label-Related Cases: These cases, brought by individual plaintiffs, or on behalf of a class or purported class of individual plaintiffs, allege that the use of the descriptor “Lights” or other alleged misrepresentations or omissions of labeling information constitute fraudulent and misleading conduct. Plaintiffs' allegations of liability in these cases are based on various theories of recovery including misrepresentation, deception, and breach of consumer protection laws. Plaintiffs seek various forms of relief including restitution, injunctive relief, and compensatory and other damages. Defenses raised include lack of causation, lack of reliance, assumption of the risk, and statute of limitations.
As of October 22, 2019, there were 5 label-related cases brought by individual plaintiffs in Italy (1) and Chile (4) pending against our subsidiaries, compared with 1 such case on October 23, 2018, and 1 such case on October 23, 2017.
An individual plaintiff filed a purported class action certification motion, Aharon Ringer v. Philip Morris Ltd. and Globrands Ltd., on July 18, 2017, in the Central District Court of Israel. Our Israeli affiliate and an Israeli importer and distributor for other multinational tobacco companies are defendants. Plaintiff seeks to represent a class of smokers in Israel who have purchased cigarettes imported by defendants since July 18, 2010. Plaintiff estimates the class size to be 7,000,000 smokers. Plaintiff alleges that defendants misled consumers by not disclosing sufficient information about carbon monoxide, tar, and nicotine yields of, and tobacco contained in, the imported cigarettes. Plaintiff seeks various forms of relief, including an order for defendants to label cigarette packs in accordance with plaintiff’s demands, and damages for misleading consumers, breach of autonomy and unjust enrichment. In September 2019, plaintiff voluntarily withdrew the class certification motion, and the trial court dismissed the case with prejudice.
Public Civil Actions: Claims have been filed either by an individual, or a public or private entity, seeking to protect collective or individual rights, such as the right to health, the right to information or the right to safety. Plaintiffs' allegations of liability in these cases are based on various theories of recovery including product defect, concealment, and misrepresentation. Plaintiffs in these
Philip Morris International Inc. and Subsidiaries
Notes to Condensed Consolidated Financial Statements
(Unaudited)
cases seek various forms of relief including injunctive relief such as banning cigarettes, descriptors, smoking in certain places and advertising, as well as implementing communication campaigns and reimbursement of medical expenses incurred by public or private institutions.
As of October 22, 2019, there were 2 public civil actions pending against our subsidiaries in Argentina (1) and Venezuela (1), compared with 2 such cases on October 23, 2018, and 2 such cases on October 23, 2017.
In the public civil action in Argentina, Asociación Argentina de Derecho de Danos v. Massalin Particulares S.A., et al., Civil Court of Buenos Aires, Argentina, filed February 26, 2007, our subsidiary and another member of the industry are defendants. The plaintiff, a consumer association, seeks the establishment of a relief fund for reimbursement of medical costs associated with diseases allegedly caused by smoking. Our subsidiary filed its answer in September 2007. In March 2010, the case file was transferred to the Federal Court on Administrative Matters after the Civil Court granted plaintiff's request to add the national government as a co-plaintiff in the case. The case is currently awaiting a court decision on the merits.
In the public civil action in Venezuela, Federation of Consumers and Users Associations (“FEVACU”), et al. v. National Assembly of Venezuela and the Venezuelan Ministry of Health, Constitutional Chamber of the Venezuelan Supreme Court, filed April 29, 2008, we were not named as a defendant, but the plaintiffs published a notice pursuant to court order, notifying all interested parties to appear in the case. In January 2009, our subsidiary appeared in the case in response to this notice. The plaintiffs purport to represent the right to health of the citizens of Venezuela and claim that the government failed to protect adequately its citizens' right to health. The claim asks the court to order the government to enact stricter regulations on the manufacture and sale of tobacco products. In addition, the plaintiffs ask the court to order companies involved in the tobacco industry to allocate a percentage of their “sales or benefits” to establish a fund to pay for the health care costs of treating smoking-related diseases. In October 2008, the court ruled that plaintiffs have standing to file the claim and that the claim meets the threshold admissibility requirements. In December 2012, the court admitted our subsidiary and BAT's subsidiary as interested third parties. In February 2013, our subsidiary answered the complaint.
Reduced-Risk Products
In Colombia, an individual filed a purported class action, Ana Ferrero Rebolledo vs. Philip Morris Colombia S.A., et al., in April 2019 against our subsidiaries with the Civil Court of Bogota related to the marketing of our Platform 1 product. Plaintiff alleges that our subsidiaries advertise the product in contravention of law and in a manner that misleads consumers by portraying the product in a positive light, and further asserts that the Platform 1 vapor contains many toxic compounds, creates a high level of dependence, and has damaging second-hand effects. Plaintiff seeks injunctive relief and damages on her behalf and on a behalf of two classes (class 1 - all Platform 1 consumers in Colombia who seek damages for the purchase price of the product and personal injuries related to the alleged addiction, and class 2 - all residents of the neighborhood where the advertising allegedly took place who seek damages for exposure to the alleged illegal advertising). Our subsidiaries have been served with the complaint. Preliminary motions are pending.
Other Litigation
The Department of Special Investigations of the government of Thailand ("DSI") conducted an investigation into alleged underpayment by our subsidiary, Philip Morris (Thailand) Limited ("PM Thailand"), of customs duties and excise taxes relating to imports from the Philippines covering the period 2003-2007. On January 18, 2016, the Public Prosecutor filed charges against our subsidiary and seven former and current employees in the Bangkok Criminal Court alleging that PM Thailand and the individual defendants jointly and with the intention to defraud the Thai government, under-declared import prices of cigarettes to avoid full payment of taxes and duties in connection with import entries of cigarettes from the Philippines during the period of July 2003 to June 2006. The government is seeking a fine of approximately THB 80.8 billion (approximately $2.65 billion). In May 2017, the King of Thailand signed a new customs act. The new act, which took effect in November 2017, substantially limits the amount of fines that Thailand could seek in these proceedings. PM Thailand believes that its declared import prices are in compliance with the Customs Valuation Agreement of the World Trade Organization and Thai law and that the allegations of the Public Prosecutor are inconsistent with several decisions already taken by Thai Customs and other Thai governmental agencies. Trial in the case began in November 2017. In March 2018, acting on a request from the Public Prosecutor, the court suspended the trial proceedings indefinitely and struck the case from the court list. In June 2018, the court reinstated the case, and the trial concluded in September 2019. The case is now in the closing argument stage, and we expect a trial court decision by the end of 2019.
Philip Morris International Inc. and Subsidiaries
Notes to Condensed Consolidated Financial Statements
(Unaudited)
The DSI also conducted an investigation into alleged underpayment by PM Thailand of customs duties and excise taxes relating to imports from Indonesia covering the period 2000-2003. On January 26, 2017, the Public Prosecutor filed charges against PM Thailand and its former Thai employee in the Bangkok Criminal Court alleging that PM Thailand and its former employee jointly and with the intention to defraud the Thai government under-declared import prices of cigarettes to avoid full payment of taxes and duties in connection with import entries during the period from January 2002 to July 2003. The government is seeking a fine of approximately THB 19.8 billion (approximately $650 million). In May 2017, the King of Thailand signed a new customs act. The new act, which took effect in November 2017, substantially limits the amount of fines that Thailand could seek in these proceedings. PM Thailand believes that its declared import prices are in compliance with the Customs Valuation Agreement of the World Trade Organization and Thai law, and that the allegations of the Public Prosecutor are inconsistent with several decisions already taken by Thai Customs and a Thai court. Trial in the case began in November 2018 and it is expected to conclude in December 2019, after which closing arguments and judgment will be scheduled.
The South Korean Board of Audit and Inspection (“BAI”) conducted an audit of certain Korean government agencies and the tobacco industry into whether inventory movements ahead of the January 1, 2015 increase of cigarette-related taxes by tobacco companies, including Philip Morris Korea Inc. ("PM Korea"), our South Korean affiliate, were in compliance with South Korean tax laws. In November 2016, the tax authorities completed their audit and assessed allegedly underpaid taxes and penalties. In order to avoid nonpayment financial costs, PM Korea paid approximately KRW 272 billion (approximately $231 million), of which KRW 100 billion (approximately $85 million) was paid in 2016 and KRW 172 billion (approximately $146 million) was paid in the first quarter of 2017. These amounts are included in other assets in the condensed consolidated balance sheets and in cash used in operating activities in the condensed consolidated statements of cash flows. PM Korea is appealing the assessments. The tax authorities have also referred the matter to the Public Prosecutor. On June 19, 2018, the Public Prosecutor decided not to file criminal charges against PM Korea and/or other alleged co-offenders. The Public Prosecutor also decided not to prosecute PM Korea and its managing director in connection with a criminal complaint against them that had been filed by the South Korean Ministry of Strategy and Finance (“MOSF”). In the criminal complaint, the MOSF alleged that PM Korea exceeded the monthly product withdrawal limits that the MOSF had set in its notice. On March 5, 2019, the Supreme Prosecutor's Office dismissed both the tax authorities' and the MOSF's appeals on the decisions of the Public Prosecutor, concluding the criminal investigations in these matters.
The Moscow Tax Inspectorate for Major Taxpayers (“MTI”) conducted an audit of AO Philip Morris Izhora (“PM Izhora”), our Russian affiliate, for the 2015-2017 financial years. On July 26, 2019, MTI issued its initial assessment, claiming that intercompany sales of cigarettes between PM Izhora and another Russian affiliate prior to excise tax increases and submission by PM Izhora of the maximum retail sales price notifications for cigarettes to the tax authorities were improper under Russian tax laws and resulted in underpayment of excise taxes and VAT. In August 2019, PM Izhora submitted its objections disagreeing with MTI’s allegations set forth in the initial assessment and MTI’s methodology for calculating the alleged underpayments. MTI accepted some of PM Izhora’s arguments and in September 2019, issued the final tax assessment claiming an underpayment of RUB 24.3 billion (approximately $374 million), including penalties and interest. In accordance with Russian tax laws, PM Izhora paid the entire amount of MTI’s final assessment. This amount was neither imposed on, nor concurrent with, the specific revenue-producing transaction, nor was it collected from customers of our Russian affiliates. PMI believes that the loss of $374 million in this matter is probable and estimable. Consequently, in the third quarter of 2019, PMI recorded a pre-tax charge of $374 million, in marketing, administration and research costs in the condensed consolidated statements of earnings, representing $315 million net of income tax. Under the Russian law, PM Izhora has until mid-September 2020 to challenge the final tax assessment to the Federal Tax Service and is considering whether to pursue such challenge.
A putative shareholder class action lawsuit, In re Philip Morris International Inc. Securities Litigation, is pending in the United States District Court for the Southern District of New York, purportedly on behalf of purchasers of Philip Morris International Inc. stock between July 26, 2016 and April 18, 2018. The lawsuit names Philip Morris International Inc. and certain officers and employees as defendants and includes allegations that the defendants made false and/or misleading statements and/or failed to disclose information about PMI’s business, operations, financial condition, and prospects, related to product sales of, and alleged irregularities in clinical studies of, PMI’s Platform 1 product. The lawsuit seeks various forms of relief, including damages. In November, 2018, the court consolidated three putative shareholder class action lawsuits with similar allegations previously filed in the Southern District of New York (namely, City of Westland Police and Fire Retirement System v. Philip Morris International Inc., et al, Greater Pennsylvania Carpenters’ Pension Fund v. Philip Morris International Inc., et al., and Gilchrist v. Philip Morris International Inc., et al.) into these proceedings. A putative shareholder class action lawsuit, Rubenstahl v. Philip Morris International Inc., et al., that had been previously filed in December, 2017 in the United States District Court for the District of
Philip Morris International Inc. and Subsidiaries
Notes to Condensed Consolidated Financial Statements
(Unaudited)
New Jersey, was voluntarily dismissed by the plaintiff due to similar allegations in these proceedings. We believe that this lawsuit is without merit and intend to defend it vigorously.
We are also involved in additional litigation arising in the ordinary course of our business. While the outcomes of these proceedings are uncertain, management does not expect that the ultimate outcomes of other litigation, including any reasonably possible losses in excess of current accruals, will have a material adverse effect on our consolidated results of operations, cash flows or financial position.
Note 9. Income Taxes:
Income tax provisions for jurisdictions outside the United States of America, as well as state and local income tax provisions, were determined on a separate company basis, and the related assets and liabilities were recorded in PMI’s condensed consolidated balance sheets.
PMI’s effective tax rates for the nine months and three months ended September 30, 2019 were 22.2% and 24.1%, respectively. PMI’s effective tax rates for the nine months and three months ended September 30, 2018 were 23.3% and 23.0%, respectively. The effective tax rate for the nine months ended September 30, 2019 was favorably impacted by further clarifications related to the Tax Cuts and Jobs Act, the reversal of a deferred tax liability on the unremitted earnings of PMI's Canadian subsidiary, RBH ($49 million), and a reduction in estimated U.S. federal income tax on dividend repatriation for the years 2015-2018 ($67 million). PMI estimates that its full-year 2019 effective tax rate will be approximately 23%, excluding the discrete tax events mentioned above and the 2019 loss on deconsolidation of RBH, which is a significant unusual or infrequently occurring item. For further details, see Note 20. Deconsolidation of RBH. Changes in currency exchange rates, earnings mix by taxing jurisdiction or future regulatory developments may have an impact on the effective tax rates, which PMI monitors each quarter. Significant judgment is required in determining income tax provisions and in evaluating tax positions.
PMI is regularly examined by tax authorities around the world and is currently under examination in a number of jurisdictions. The U.S. federal statute of limitations remains open for the years 2015 and onward. Foreign and U.S. state jurisdictions have statutes of limitations generally ranging from three to five years.
It is reasonably possible that within the next 12 months certain tax examinations will close, which could result in a change in unrecognized tax benefits along with related interest and penalties. An estimate of any possible change cannot be made at this time.
Note 10. Indebtedness:
Short-term Borrowings:
PMI's short-term borrowings, consisting of bank loans to certain PMI subsidiaries at September 30, 2019 and commercial paper and bank loans to certain PMI subsidiaries at December 31, 2018, had a carrying value of $355 million and $730 million, respectively. The fair value of PMI’s short-term borrowings, based on current market interest rates, approximates carrying value.
Philip Morris International Inc. and Subsidiaries
Notes to Condensed Consolidated Financial Statements
(Unaudited)
Long-term Debt:
At September 30, 2019 and December 31, 2018, PMI’s long-term debt consisted of the following:
|
| | | | | | | | |
(in millions) | | September 30, 2019 | | December 31, 2018 |
U.S. dollar notes, 1.875% to 6.375% (average interest rate 3.461%), due through 2044 | | $ | 20,526 |
| | $ | 20,819 |
|
Foreign currency obligations: | | | | |
Euro notes, 0.125% to 3.125% (average interest rate 1.950%), due through 2039 | | 9,594 |
| | 8,656 |
|
Swiss franc notes, 0.750% to 2.000% (average interest rate 1.337%), due through 2024 | | 1,159 |
| | 1,374 |
|
Other (average interest rate 3.283%), due through 2024 | | 182 |
| | 180 |
|
| | 31,461 |
| | 31,029 |
|
Less current portion of long-term debt | | 5,035 |
| | 4,054 |
|
| | $ | 26,426 |
| | $ | 26,975 |
|
Other foreign currency debt above includes mortgage debt in Switzerland and finance lease obligations at September 30, 2019 and December 31, 2018.
PMI's debt issuances in the first nine months of 2019 were as follows:
|
| | | | | | | | |
(in millions) | | | | | | | | |
Type | | Face Value | | Interest Rate | | Issuance | | Maturity |
| | | | | | | | |
U.S. dollar notes | (a) | $900 | | 2.875% | | May 2019 | | May 2024 |
U.S. dollar notes | (b) | $750 | | 3.375% | | May 2019 | | August 2029 |
Euro notes | (c) | €500 (approximately $557) | (d) | 0.125% | | August 2019 | | August 2026 |
Euro notes | (c) | €750 (approximately $835) | (d) | 0.800% | | August 2019 | | August 2031 |
Euro notes | (c) | €750 (approximately $835) | (d) | 1.450% | | August 2019 | | August 2039 |
(a) Interest on these notes is payable semi-annually in arrears beginning in November 2019.
(b) Interest on these notes is payable semi-annually in arrears beginning in August 2019.
(c) Interest on these notes is payable annually in arrears beginning in August 2020.
(d) USD equivalents for foreign currency notes were calculated based on exchange rates on the date of issuance.
The net proceeds from the sale of the securities listed in the table above have been and will be used for general corporate purposes, including repayment of outstanding commercial paper and refinancing of outstanding 2.000% Notes due 2020, outstanding Floating Rate Notes due 2020 and outstanding Euro denominated 1.750% Notes due 2020.
Credit Facilities:
On January 28, 2019, PMI entered into an agreement to extend the term of its $2.0 billion 364-day revolving credit facility from February 5, 2019, to February 4, 2020.
Philip Morris International Inc. and Subsidiaries
Notes to Condensed Consolidated Financial Statements
(Unaudited)
At September 30, 2019, PMI's total committed credit facilities were as follows:
(in billions)
|
| | | | |
Type | | Committed Credit Facilities |
364-day revolving credit, expiring February 4, 2020 | | $ | 2.0 |
|
Multi-year revolving credit, expiring February 28, 2021 | | 2.5 |
|
Multi-year revolving credit, expiring October 1, 2022 | | 3.5 |
|
Total facilities | | $ | 8.0 |
|
At September 30, 2019, there were no borrowings under these committed credit facilities, and the entire committed amounts were available for borrowing.
Note 11. Fair Value Measurements:
The authoritative guidance defines fair value as the exchange price that would be received for an asset or paid to transfer a liability (an exit price) in the principal or most advantageous market for the asset or liability in an orderly transaction between market participants on the measurement date. The guidance also establishes a fair value hierarchy, which requires an entity to maximize the use of observable inputs and minimize the use of unobservable inputs when measuring fair value. The guidance describes three levels of input that may be used to measure fair value, which are as follows:
| |
Level 1 - | Quoted prices in active markets for identical assets or liabilities; |
| |
Level 2 - | Observable inputs other than Level 1 prices, such as quoted prices for similar assets or liabilities; quoted prices in markets that are not active; or other inputs that are observable or can be corroborated by observable market data for substantially the full term of the assets or liabilities; and |
| |
Level 3 - | Unobservable inputs that are supported by little or no market activity and that are significant to the fair value of the assets or liabilities. |
Equity Securities
The fair value of PMI’s equity securities, which are determined by using quoted prices in active markets, have been classified within Level 1.
Derivative Financial Instruments
PMI assesses the fair value of its foreign exchange contracts and interest rate contracts using standard valuation models that use, as their basis, readily observable market inputs. The fair value of PMI’s foreign exchange forward contracts is determined by using the prevailing foreign exchange spot rates and interest rate differentials, and the respective maturity dates of the instruments. The fair value of PMI’s currency options is determined by using a Black-Scholes methodology based on foreign exchange spot rates and interest rate differentials, currency volatilities and maturity dates. PMI’s derivative financial instruments have been classified within Level 2 in the table shown below. See Note 5. Financial Instruments for additional discussion of derivative financial instruments.
Debt
The fair value of PMI’s outstanding debt, which is utilized solely for disclosure purposes, is determined using quotes and market interest rates currently available to PMI for issuances of debt with similar terms and remaining maturities. The aggregate carrying value of PMI’s debt, excluding short-term borrowings and $38 million of finance leases, was $31,423 million at September 30,
Philip Morris International Inc. and Subsidiaries
Notes to Condensed Consolidated Financial Statements
(Unaudited)
2019. The fair value of PMI’s outstanding debt, excluding the aforementioned short-term borrowings and finance leases, was classified within Level 1 and Level 2 in the table shown below.
The aggregate fair values of PMI's investments in equity securities, derivative financial instruments and PMI's debt as of September 30, 2019, were as follows:
|
| | | | | | | | | | | | | | | | |
(in millions) | | Fair Value at September 30, 2019 | | Quoted Prices
in Active
Markets for
Identical
Assets/Liabilities
(Level 1) | | Significant
Other
Observable
Inputs
(Level 2) | | Significant
Unobservable
Inputs
(Level 3) |
Assets: | | | | | | | | |
Equity securities | | $ | 282 |
| | $ | 282 |
| | $ | — |
| | $ | — |
|
Derivative contracts | | 453 |
| | — |
| | 453 |
| | — |
|
Total assets | | $ | 735 |
| | $ | 282 |
| | $ | 453 |
| | $ | — |
|
Liabilities: | | | | | | | | |
Debt | | $ | 33,828 |
| | $ | 33,663 |
| | $ | 165 |
| | $ | — |
|
Derivative contracts | | 280 |
| | — |
| | 280 |
| | — |
|
Total liabilities | | $ | 34,108 |
| | $ | 33,663 |
| | $ | 445 |
| | $ | — |
|
Note 12. Accumulated Other Comprehensive Losses:
PMI’s accumulated other comprehensive losses, net of taxes, consisted of the following:
|
| | | | | | | | | | | | |
(in millions) | | At September 30, 2019 | | At December 31, 2018 | | At September 30, 2018 |
Currency translation adjustments | | $ | (5,649 | ) | | $ | (6,500 | ) | | $ | (6,595 | ) |
Pension and other benefits | | (3,306 | ) | | (3,646 | ) | | (2,666 | ) |
Derivatives accounted for as hedges | | (11 | ) | | 35 |
| | 62 |
|
Total accumulated other comprehensive losses | | $ | (8,966 | ) | | $ | (10,111 | ) | | $ | (9,199 | ) |
Reclassifications from Other Comprehensive Earnings
The movements in accumulated other comprehensive losses and the related tax impact, for each of the components above, that are due to current period activity and reclassifications to the income statement, including those related to the deconsolidation of RBH, are shown on the condensed consolidated statements of comprehensive earnings for the nine months and three months ended September 30, 2019 and 2018. For additional information, see Note 3. Benefit Plans for disclosures related to PMI's pension and other benefits, Note 5. Financial Instruments for disclosures related to derivative financial instruments and Note 20. Deconsolidation of RBH for disclosures related to the deconsolidation of RBH.
Note 13. Balance Sheet Offsetting:
Derivative Financial Instruments
PMI uses foreign exchange contracts and interest rate contracts to mitigate its exposure to changes in exchange and interest rates from third-party and intercompany actual and forecasted transactions. Substantially all of PMI's derivative financial instruments are subject to master netting arrangements, whereby the right to offset occurs in the event of default by a participating party. While these contracts contain the enforceable right to offset through close-out netting rights, PMI elects to present them on a gross basis in the condensed consolidated balance sheets. Collateral associated with these arrangements is in the form of cash and is unrestricted. See Note 5. Financial Instruments for disclosures related to PMI's derivative financial instruments.
Philip Morris International Inc. and Subsidiaries
Notes to Condensed Consolidated Financial Statements
(Unaudited)
The effects of these derivative financial instrument assets and liabilities on PMI's condensed consolidated balance sheets were as follows:
|
| | | | | | | | | | | | | | | | | | | |
| | (in millions) | Gross Amounts Recognized | Gross Amount Offset in the Condensed Consolidated Balance Sheet | Net Amounts Presented in the Condensed Consolidated Balance Sheet | Gross Amounts Not Offset in the Condensed Consolidated Balance Sheet | |
| | Financial Instruments | Cash Collateral Received/Pledged | Net Amount |
| |
| | | | | | | | |
| | At September 30, 2019 | | | | | | |
| | Assets | | | | | | |
| | Derivative contracts | $ | 453 |
| $ | — |
| $ | 453 |
| $ | (260 | ) | $ | (141 | ) | $ | 52 |
|
| | Liabilities | | | | | | |
| | Derivative contracts | $ | 280 |
| $ | — |
| $ | 280 |
| $ | (260 | ) | $ | (15 | ) | $ | 5 |
|
| | At December 31, 2018 | | | | | | |
| | Assets | | | | | | |
| | Derivative contracts | $ | 220 |
| $ | — |
| $ | 220 |
| $ | (124 | ) | $ | (80 | ) | $ | 16 |
|
| | Liabilities | | | | | | |
| | Derivative contracts | $ | 631 |
| $ | — |
| $ | 631 |
| $ | (124 | ) | $ | (427 | ) | $ | 80 |
|
Note 14. Investments in Unconsolidated Subsidiaries, Equity Securities and Other Related Parties:
Investments in unconsolidated subsidiaries:
At September 30, 2019 and December 31, 2018, PMI had total investments in unconsolidated subsidiaries of $1,036 million and $981 million, respectively, which were accounted for under the equity method of accounting. Equity method investments are initially recorded at cost. Under the equity method of accounting, the investment is adjusted for PMI's proportionate share of earnings or losses, dividends, capital contributions, changes in ownership interests and movements in currency translation adjustments. The carrying value of our equity method investments at September 30, 2019 and December 31, 2018 exceeded our share of the unconsolidated subsidiaries' book value by $877 million and $835 million, respectively. The difference between the investment carrying value and the amount of underlying equity in net assets, excluding $837 million and $793 million attributable to goodwill as of September 30, 2019 and December 31, 2018, respectively, is being amortized on a straight-line basis over the underlying assets' estimated useful lives of 10 to 20 years. At September 30, 2019 and December 31, 2018, PMI received year-to-date dividends from unconsolidated subsidiaries of $83 million and $118 million, respectively.
PMI holds a 23% equity interest in Megapolis Distribution BV, the holding company of CJSC TK Megapolis, PMI's distributor in Russia (Eastern Europe segment).
PMI holds a 49% equity interest in United Arab Emirates-based Emirati Investors-TA (FZC) (“EITA”). PMI holds an approximate 25% economic interest in Société des Tabacs Algéro-Emiratie (“STAEM”), an Algerian joint venture that is 51% owned by EITA and 49% by the Algerian state-owned enterprise Management et Développement des Actifs et des Ressources Holding ("MADAR Holding"), formerly known as Société Nationale des Tabacs et Allumettes SpA. STAEM, which is part of the Middle East & Africa segment, manufactures and distributes under license some of PMI’s brands.
The initial investments in Megapolis Distribution BV and EITA were recorded at cost and are included in investments in unconsolidated subsidiaries and equity securities on the condensed consolidated balance sheets.
Philip Morris International Inc. and Subsidiaries
Notes to Condensed Consolidated Financial Statements
(Unaudited)
Equity securities:
Following the deconsolidation of RBH, PMI recorded the continuing investment in RBH, PMI's wholly owned subsidiary, at fair value of $3,280 million at the date of deconsolidation, within investments in unconsolidated subsidiaries and equity securities. For further details, see Note 20. Deconsolidation of RBH. Transactions between PMI and RBH are considered to be related party transactions from the date of deconsolidation and are included in the tables below.
Other related parties:
United Arab Emirates-based Trans-Emirates Trading and Investments (FZC) ("TTI") holds a 33% non-controlling interest in Philip Morris Misr LLC ("PMM"), an entity incorporated in Egypt which is consolidated in PMI’s financial statements in the Middle East & Africa segment. PMM sells, under license, PMI brands in Egypt through an exclusive distribution agreement with a local entity that is also controlled by TTI. Amounts in the tables below have been updated to reflect the transactions with this other related party for all periods.
IPM India, PMI's consolidated subsidiary in the South & Southeast Asia segment, has a non-controlling interest of 43.7% held by Godfrey Phillips India Ltd, who also acts as contract manufacturer and distributor for IPM. Amounts in the tables below include transactions between these related parties, beginning in 2019. Prior periods do not include these transactions as they were not material.
Financial activity with unconsolidated subsidiaries, equity securities and other related parties:
PMI’s net revenues and expenses with unconsolidated subsidiaries, equity securities and the other related parties were as follows:
|
| | | | | | | | | | | | | |
| For the Nine Months Ended September 30, | | For the Three Months Ended September 30, |
(in millions) | 2019 | 2018 | | 2019 | 2018 |
| | | | | |
Net revenues: |
|
| |
|
|
Megapolis Group | $ | 1,537 |
| $ | 1,411 |
| | $ | 622 |
| $ | 533 |
|
Other | 770 |
| 525 |
| | 279 |
| 210 |
|
Net revenues (a) | $ | 2,307 |
| $ | 1,936 |
| | $ | 901 |
| $ | 743 |
|
| | | | | |
Expenses: | | | | | |
Other | $ | 41 |
| $ | 16 |
| | $ | 14 |
| $ | 6 |
|
Expenses | $ | 41 |
| $ | 16 |
| | $ | 14 |
| $ | 6 |
|
(a) Net revenues exclude excise taxes and VAT billed to customers. Prior year's amounts have been reclassified to conform with the current year's presentation.
PMI’s balance sheet activity related to unconsolidated subsidiaries, equity securities and the other related parties was as follows:
Philip Morris International Inc. and Subsidiaries
Notes to Condensed Consolidated Financial Statements
(Unaudited)
|
| | | | | | | |
(in millions) | | At September 30, 2019 | At December 31, 2018 |
| | | |
Receivables: | |
|
|
|
Megapolis Group | | $ | 467 |
| $ | 172 |
|
Other | | 184 |
| 136 |
|
Receivables | | $ | 651 |
| $ | 308 |
|
| | | |
Payables: | | | |
Other | | $ | 16 |
| $ | 8 |
|
Payables | | $ | 16 |
| $ | 8 |
|
The activity primarily related to agreements with PMI’s unconsolidated subsidiaries, equity securities and other related parties, which are in the ordinary course of business, and are primarily for distribution, service fees, contract manufacturing and licenses. PMI eliminated its respective share of all significant intercompany transactions with the equity method investees.
Note 15. Sale of Accounts Receivable:
To mitigate risk and enhance cash and liquidity management PMI sells trade receivables to unaffiliated financial institutions. These arrangements allow PMI to sell, on an ongoing basis, certain trade receivables without recourse. The trade receivables sold are generally short-term in nature and are removed from the condensed consolidated balance sheets. PMI sells trade receivables under two types of arrangements, servicing and non-servicing. For servicing arrangements, PMI continues to service the sold trade receivables on an administrative basis and does not act on behalf of the unaffiliated financial institutions. When applicable, a servicing liability is recorded for the estimated fair value of the servicing. The amounts associated with the servicing liability were not material as of September 30, 2019 and September 30, 2018. Under the non-servicing arrangements, PMI does not provide any administrative support or servicing after the trade receivables have been sold to the unaffiliated financial institutions.
Cumulative trade receivables sold, including excise taxes, for the nine months ended September 30, 2019 and 2018, were $7.8 billion and $8.0 billion, respectively. PMI’s operating cash flows were positively impacted by the amount of the trade receivables sold and derecognized from the condensed consolidated balance sheets, which remained outstanding with the unaffiliated financial institutions. The trade receivables sold that remained outstanding under these arrangements as of September 30, 2019 and September 30, 2018, were $0.6 billion, and $0.6 billion, respectively. The net proceeds received are included in cash provided by operating activities in the condensed consolidated statements of cash flows. The difference between the carrying amount of the trade receivables sold and the sum of the cash received is recorded as a loss on sale of trade receivables within marketing, administration and research costs in the condensed consolidated statements of earnings. For the nine months and three months ended September 30, 2019 and 2018, the loss on sale of trade receivables was immaterial.
Philip Morris International Inc. and Subsidiaries
Notes to Condensed Consolidated Financial Statements
(Unaudited)
Note 16. Product Warranty:
PMI's IQOS devices are subject to standard product warranties generally for a period of 12 months from the date of purchase or such other periods as required by law. PMI generally provides in cost of sales for the estimated cost of warranty in the period the related revenue is recognized. PMI assesses the adequacy of its accrued product warranties and adjusts the amounts as necessary based on actual experience and changes in future estimates. Factors that affect product warranties may vary across markets but typically include product failure rates, logistics and service delivery costs, and warranty policies. PMI accounts for its product warranties within other accrued liabilities. At September 30, 2019 and December 31, 2018, these amounts were as follows:
|
| | | | | | |
(in millions) | At September 30, 2019 | At December 31, 2018 |
Balance at beginning of period | $ | 67 |
| $ | 71 |
|
Changes due to: | | |
Warranties issued | 236 |
| 179 |
|
Settlements | (153 | ) | (183 | ) |
Currency | — |
| — |
|
Balance at end of period | $ | 150 |
| $ | 67 |
|
Note 17. Acquisitions:
On March 21, 2018, PMI acquired the remaining 49% interest in Tabacalera Costarricense, S.A. and Mendiola y Compañía, S.A. for a net purchase price of $95 million, which includes $2 million of contingent consideration. As a result, PMI now owns 100% of these Costa Rican affiliates. The purchase of the remaining 49% interest resulted in a decrease to PMI’s additional paid-in capital of $86 million.
Note 18. Leases:
PMI determines that a contract contains a lease if the contract conveys a right to control the use of the identified asset for a period of time in exchange for consideration. PMI’s operating leases are principally for real estate (office space, warehouses and retail store space) and vehicles. Lease expense is recognized on a straight-line basis over the lease term. Lease terms range from 1 year to 75 years, some of which include options to renew, which are reasonably certain to be renewed. Lease terms may also include options to terminate the lease. At lease commencement PMI recognizes lease liabilities and the corresponding right-of-use assets (at the present value of future payments) for predominately all of its operating leases. The recognition of the right of use asset and lease liability includes renewal options when it is reasonably certain that they will be exercised. The exercise of a lease renewal or termination option is at PMI’s discretion. Certain of PMI’s leases include payments that are based on changes to an index or on actual usage. These lease payments are adjusted periodically and are included within variable lease costs. For information regarding PMI’s immaterial finance leases, see Note 11. Fair Value Measurements.
Beginning in 2019, PMI accounts for lease and nonlease components as a single lease component with the exception of its vehicle leases, of which PMI accounts for the lease components separately from the nonlease components. Additionally, leases with an initial term of 12 months or less are not included in the right of use asset or lease liability on the condensed consolidated statement of financial position.
Philip Morris International Inc. and Subsidiaries
Notes to Condensed Consolidated Financial Statements
(Unaudited)
PMI’s operating leases at September 30, 2019 were as follows:
|
| | | |
(in millions) | September 30, 2019 |
Assets: | |
Other assets
| $ | 716 |
|
| |
Liabilities:
| |
Current
| |
Accrued liabilities - Other | $ | 183 |
|
Noncurrent
| |
Income taxes and other liabilities
| 529 |
|
Total lease liabilities
| $ | 712 |
|
The components of PMI’s lease cost were as follows for the nine months and three months ended September 30, 2019:
|
| | | | | | |
(in millions) | For the Nine Months Ended September 30, 2019 | For the Three Months Ended September 30, 2019 |
Operating lease cost
| $ | 180 |
| $ | 61 |
|
Short-term lease cost | 45 |
| 15 |
|
Variable lease cost | 20 |
| 10 |
|
Total lease cost
| $ | 245 |
| $ | 86 |
|
For the nine months ended September 30, 2019, lease cost of $59 million were recorded in cost of sales and $186 million were recorded in marketing, administration and research cost. For the three months ended September 30, 2019, lease costs of $21 million were recorded in cost of sales and $65 million were recorded in marketing, administration and research cost.
Maturity of PMI’s operating lease liabilities, on an undiscounted basis, as of September 30, 2019, were as follows (as calculated under the new guidance ASC 842 (Leases)): |
| | | |
(in millions) | Total |
2019 | $ | 63 |
|
2020 | 191 |
|
2021 | 139 |
|
2022 | 105 |
|
2023 | 79 |
|
Thereafter | 330 |
|
Total lease payments
| 907 |
|
Less: Interest
| 195 |
|
Present value of lease liabilities
| $ | 712 |
|
Philip Morris International Inc. and Subsidiaries
Notes to Condensed Consolidated Financial Statements
(Unaudited)
Minimum rental commitments under non-cancelable operating leases in effect at December 31, 2018, were as follows (as calculated under legacy guidance ASC 840 (Leases)):
|
| | | |
(in millions) | Total |
2019 | $ | 147 |
|
2020 | 103 |
|
2021 | 73 |
|
2022 | 52 |
|
2023 | 43 |
|
Thereafter | 354 |
|
| $ | 772 |
|
Other information related to PMI’s operating leases were as follows for the nine months ended September 30, 2019:
|
| | | |
(in millions) | September 30, 2019 |
Cash paid for amounts included in the measurement of lease liabilities in Operating cash flows
| $ | 178 |
|
Leased assets obtained in exchange for new operating lease liabilities
| $ | 169 |
|
Weighted-average remaining lease term (years)
| 10.1 |
|
Weighted-average discount rate(1)
| 4.7 | % |
(1) PMI’s weighted-average discount rate is based on its estimated pre-tax cost of debt adjusted for country-specific risk.
For further details, see Note 21. New Accounting Standards.
Note 19. Asset Impairment and Exit Costs:
Global Manufacturing Infrastructure Optimization
In light of declining PMI cigarette volumes resulting from lower total industry volumes and the shift to smoke-free alternatives, PMI continues to optimize its global manufacturing infrastructure.
For the nine months and three months ended September 30, 2019, PMI recorded pre-tax asset impairment and exit costs of $65 million and $22 million, respectively. For the nine months ended September 30, 2019, these costs were related to a cigarette plant closure in Pakistan ($20 million) and Colombia ($45 million); and for the three months ended September 30, 2019, these costs were related to the plant closure in Colombia. For the cigarette plant closure in Colombia, we expect to incur additional pre-tax exit costs of approximately $4 million during the remainder of 2019.
In the second quarter of 2019, an affiliate of PMI, Philip Morris Manufacturing GmbH ("PMMG"), initiated consultations with employee representatives on a proposal to end cigarette production in its factory located in Berlin, Germany by January 1, 2020, and to seek to agree on fair solutions for any impacted employees. Until the consultation process is concluded, the closure of the Berlin facility is not considered probable (under U.S. GAAP), and the total potential costs associated with this contemplated proposal, which are expected to be significant, cannot be determined. As a result, no related costs were recorded in the third quarter of 2019. If the consultation process is successfully concluded, PMI would expect, at that time, to record charges, which would include employee severance costs, asset costs, including accelerated depreciation, and impairment and other closure related costs. The amount and timing of the income statement recognition of these amounts and the related cash flows will depend on a number of factors, including the timing of the completion of the consultation process as well as the negotiated elements of the associated social plan.
Philip Morris International Inc. and Subsidiaries
Notes to Condensed Consolidated Financial Statements
(Unaudited)
Asset Impairment and Exit Costs by Segment
PMI recorded the following pre-tax asset impairment and exit costs by segment:
|
| | | | | | | | | | | | | | | |
(in millions) | For the Nine Months Ended September 30, | | For the Three Months Ended September 30, |
| 2019 | | 2018 | | 2019 | | 2018 |
Separation programs: | | | | | | | |
South & Southeast Asia | 3 |
| | — |
| | — |
| | — |
|
Latin America & Canada | 37 |
| | — |
| | 22 |
| | — |
|
Total separation programs | 40 |
| | — |
| | 22 |
| | — |
|
Asset impairment charges: | | | | | | | |
South & Southeast Asia | 17 |
| | — |
| | — |
| | — |
|
Latin America & Canada | 8 |
| | — |
| | — |
| | — |
|
Total asset impairment charges | 25 |
| | — |
| | — |
| | — |
|
Asset impairment and exit costs | $ | 65 |
| | $ | — |
| | $ | 22 |
| | $ | — |
|
The total pre-tax asset impairment and exit costs above were included in marketing, administration and research costs on the condensed consolidated statements of earnings.
Movement in Exit Cost Liabilities
The movement in exit cost liabilities for the nine months ended September 30, 2019 was as follows:
|
| | | |
(in millions) | |
Liability balance, January 1, 2019 | $ | — |
|
Charges, net | 40 |
|
Cash spent | (21 | ) |
Currency/other | (2 | ) |
Liability balance, September 30, 2019 | $ | 17 |
|
Cash payments related to exit costs at PMI were $21 million and $13 million for the nine months and three months ended September 30, 2019, respectively. Future cash payments for exit costs incurred to date are anticipated to be substantially paid in the following twelve months.
Note 20. Deconsolidation of RBH:
As discussed in Note 8. Contingencies, following the March 1, 2019 judgment of the Court of Appeal of Québec in two class action lawsuits against PMI's Canadian subsidiary, Rothmans, Benson & Hedges Inc. ("RBH"), PMI recorded in its consolidated results a pre-tax charge of $194 million, representing $142 million net of tax, in the first quarter of 2019. This pre-tax Canadian tobacco litigation-related expense was included in marketing, administration and research costs on PMI's condensed consolidated statement of earnings for the nine months ended September 30, 2019. The charge reflects PMI’s assessment of the portion of the judgment that represents probable and estimable loss prior to the deconsolidation of RBH and corresponds to the trust account deposit required by the judgment. RBH’s share of the deposit is approximately CAD 257 million.
On March 22, 2019, RBH obtained an initial order from the Ontario Superior Court of Justice granting it protection under the Companies’ Creditors Arrangement Act ("CCAA"), which is a Canadian federal law that permits a Canadian business to restructure its affairs while carrying on its business in the ordinary course with minimal disruption to its customers, suppliers and employees.
The administration of the CCAA process, principally relating to the powers provided to the court and the court appointed monitor, removes certain elements of control of the business from both PMI and RBH. As a result, PMI has determined that it no longer has a controlling financial interest over RBH as defined in ASC 810 (Consolidation), and PMI deconsolidated RBH as of the date
Philip Morris International Inc. and Subsidiaries
Notes to Condensed Consolidated Financial Statements
(Unaudited)
of the CCAA filing. PMI has also determined that it does not exert "significant influence" over RBH as that term is defined in ASC 323 (Investments-Equity Method and Joint Ventures). Therefore, as of March 22, 2019, PMI accounted for its continuing investment in RBH in accordance with ASC 321 (Investments-Equity Securities) as an equity security, without readily determinable fair value.
Following the deconsolidation, the carrying value of assets and liabilities of RBH was removed from the consolidated balance sheet of PMI, and the continuing investment in RBH was recorded at fair value at the date of deconsolidation. The total amount deconsolidated from PMI’s balance sheet was $3,519 million, including $1,323 million of cash, $1,463 million of goodwill, $529 million of accumulated other comprehensive earnings, primarily related to historical currency translation and $204 million of other assets and liabilities, net. While PMI is accounting for its investment in RBH as an equity security, PMI would recognize dividends as income upon receipt. However, while it remains under creditor protection, RBH does not anticipate paying dividends.
The fair value of PMI’s continuing investment in RBH of $3,280 million was determined at the date of deconsolidation, recorded within Investments in unconsolidated subsidiaries and equity securities and is assessed for impairment on an ongoing basis. The estimated fair value of the underlying business was determined based on an income approach using a discounted cash flow analysis, as well as a market approach for certain contingent liabilities. The information used in the estimate includes observable inputs, primarily a discount rate of 8%, a terminal growth rate of 2.5% and information about total tobacco market size in Canada and RBH’s share of the market, as well as unobservable inputs such as operating budgets and strategic plans, various inflation scenarios, estimated shipment volumes, and expected product pricing and projected margins.
The difference between the carrying value of the assets and liabilities of RBH that were deconsolidated, and the fair value of the continuing investment, as determined at the date of deconsolidation, was $239 million, before tax, and this loss on deconsolidation is reflected within marketing, administration and research costs on PMI’s condensed consolidated statement of earnings for the nine months ended September 30, 2019. PMI also recorded a tax benefit of $49 million within the provision for income taxes for the nine months ended September 30, 2019, related to the reversal of a deferred tax liability on unremitted earnings of RBH.
RBH is party to transactions with PMI and its consolidated subsidiaries entered into in the normal course of business; these transactions include royalty payments and recharge of various corporate expenses for services benefiting RBH. Up to the date of CCAA filing, these transactions were eliminated on consolidation and had no impact on PMI’s consolidated statement of earnings. After deconsolidating RBH, these transactions are treated as third-party transactions in PMI’s financial statements. The amount of these related party transactions is included within Note 14. Investments in Unconsolidated Subsidiaries, Equity Securities and Other Related Parties.
Developments in the CCAA process, including resolution through a plan of arrangement or compromise of all pending tobacco-related litigation currently stayed in Canada, as discussed in Note 8. Contingencies, could result in a material change in the fair value of PMI’s continuing investment in RBH.
Philip Morris International Inc. and Subsidiaries
Notes to Condensed Consolidated Financial Statements
(Unaudited)
Note 21. New Accounting Standards:
Recently adopted
On February 25, 2016, the Financial Accounting Standards Board (“FASB”) issued Accounting Standards Update ASU 2016-02, “Leases” (“ASU 2016-02”). ASU 2016-02 requires organizations that lease assets to recognize on the balance sheet the assets and liabilities for the rights and obligations created by those leases. Additionally, ASU 2016-02 modifies current guidance for lessors' accounting. ASU 2016-02 is effective for interim and annual reporting periods beginning on or after January 1, 2019, with early adoption permitted. PMI has identified its lease management system and has identified and evaluated the applicable leases. In addition to the guidance in ASU 2016-02, PMI has evaluated ASU 2018-11, which was issued in July 2018 and provides an optional transitional method. As a result of this evaluation, PMI elected to use the optional transition method, which allows companies to use the effective date as the date of initial application on transition and not adjust comparative period financial information or make the new required disclosures for periods prior to the effective date. Additionally, PMI elected to use the hindsight practical expedient, as well as the package of practical expedients permitted under the transition guidance within the new standard. Upon adoption, PMI recognized lease liabilities and the corresponding right-of-use assets (at the present value of future payments) for predominately all of its operating leases in place at that time. At January 1, 2019, PMI's adoption of ASU 2016-02 resulted in an increase of approximately $0.7 billion on its assets and liabilities in its statement of financial position. ASU 2016-02 did not have a material impact on its results of operations or cash flows. For further details, see Note 18. Leases.
On January 1, 2019, PMI elected to early adopt ASU 2018-15 “Intangibles - Goodwill and Other - Internal - Use Software (Subtopic 350-40): Customer’s Accounting for Implementation Costs Incurred in a Cloud Computing Arrangement That Is a Service Contract.” The adoption of ASU 2018-15 did not have a material impact on PMI's consolidated financial position or results of operations.
Item 2.
MANAGEMENT’S DISCUSSION AND ANALYSIS OF
FINANCIAL CONDITION AND RESULTS OF OPERATIONS
Description of Our Company
We are leading a transformation in the tobacco industry to create a smoke-free future and ultimately replace cigarettes with smoke-free products to the benefit of adults who would otherwise continue to smoke, society, the company and its shareholders. We are a leading international tobacco company engaged in the manufacture and sale of cigarettes, as well as smoke-free products and associated electronic devices and accessories, and other nicotine-containing products in markets outside the United States. In addition, we ship a version of our Platform 1 device and its consumables authorized by the FDA to Altria Group, Inc. for sale in the United States under license. We are building a future on a new category of smoke-free products that, while not risk-free, are a much better choice than continuing to smoke. Through multidisciplinary capabilities in product development, state-of-the-art facilities and scientific substantiation, we aim to ensure that our smoke-free products meet adult consumer preferences and rigorous regulatory requirements. Our smoke-free IQOS product portfolio includes heat-not-burn and nicotine-containing vapor products.
We manage our business in six reportable segments:
| |
• | Middle East & Africa ("ME&A"), which includes our international duty free business; |
| |
• | South & Southeast Asia ("S&SA"); |
| |
• | East Asia & Australia ("EA&A"); and |
| |
• | Latin America & Canada ("LA&C"), which includes transactions under license with Altria Group, Inc. for the distribution of our Platform 1 product in the United States. |
Our cigarettes are sold in more than 180 markets, and in many of these markets they hold the number one or number two market share position. We have a wide range of premium, mid-price and low-price brands. Our portfolio comprises both international and local brands. In addition to the manufacture and sale of cigarettes, we are engaged in the development and commercialization of reduced-risk products ("RRPs"). RRPs is the term we use to refer to products that present, are likely to present, or have the potential to present less risk of harm to smokers who switch to these products versus continuing smoking.
We use the term net revenues to refer to our operating revenues from the sale of our products, including shipping and handling charges billed to customers, net of sales and promotion incentives, and excise taxes. Our net revenues and operating income are affected by various factors, including the volume of products we sell, the price of our products, changes in currency exchange rates and the mix of products we sell. Mix is a term used to refer to the proportionate value of premium-price brands to mid-price or low-price brands in any given market (product mix). Mix can also refer to the proportion of shipment volume in more profitable markets versus shipment volume in less profitable markets (geographic mix).
Our cost of sales consists principally of: tobacco leaf, non-tobacco raw materials, labor and manufacturing costs; shipping and handling costs; and the cost of the IQOS devices produced by third-party electronics manufacturing service providers. Estimated costs associated with IQOS warranty programs are generally provided for in cost of sales in the period the related revenues are recognized.
Our marketing, administration and research costs include the costs of marketing and selling our products, other costs generally not related to the manufacture of our products (including general corporate expenses), and costs incurred to develop new products. The most significant components of our marketing, administration and research costs are marketing and sales expenses and general and administrative expenses.
Philip Morris International Inc. is a legal entity separate and distinct from its direct and indirect subsidiaries. Accordingly, our right, and thus the right of our creditors and stockholders, to participate in any distribution of the assets or earnings of any subsidiary is subject to the prior rights of creditors of such subsidiary, except to the extent that claims of our company itself as a creditor may be recognized. As a holding company, our principal sources of funds, including funds to make payment on our debt securities, are from the receipt of dividends and repayment of debt from our subsidiaries. Our principal wholly owned and majority-owned subsidiaries currently are not limited by long-term debt or other agreements in their ability to pay cash dividends or to make other distributions with respect to their common stock that are otherwise compliant with law.
Executive Summary
The following executive summary provides significant highlights from the "Discussion and Analysis" that follows.
Consolidated Operating Results for the Nine Months Ended September 30, 2019
| |
• | Net Revenues - Net revenues of $22.1 billion for the nine months ended September 30, 2019 decreased by $34 million, or 0.2%, from the comparable 2018 amount. The change in our net revenues from the comparable 2018 amount was driven by the following (variances not to scale with year-to-date results): |
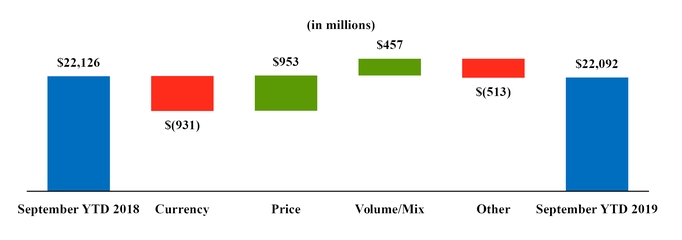
For the nine months ended September 30, 2019, net revenues, excluding unfavorable currency, increased by 4.1%, mainly reflecting: a favorable pricing variance, notably in Germany, Indonesia, Japan, the Philippines and Turkey, partly offset by Argentina; and favorable volume/mix, mainly driven by heated tobacco units in the EU, Japan and Russia, partly offset by unfavorable volume/mix of cigarettes, notably in the EU, Indonesia, Japan and Russia, as well as unfavorable volume of heated tobacco units in Korea and PMI Duty Free. The currency-neutral growth in net revenues of 4.1% came despite the unfavorable "Other" impact of $513 million, shown above, predominantly resulting from the deconsolidation of our Canadian subsidiary, Rothmans, Benson & Hedges, Inc. ("RBH"), effective March 22, 2019. For further details on the deconsolidation of RBH, see Note 8. Contingencies and Note 20. Deconsolidation of RBH.
Net revenues by product category for the nine months ended September 30, 2019 and 2018 are shown below:
| |
• | Diluted Earnings Per Share - The changes in our reported diluted earnings per share (“diluted EPS”) for the nine months ended September 30, 2019, from the comparable 2018 amounts, were as follows: |
|
| | | | | | | |
| | Diluted EPS | | % Growth (Decline) |
For the nine months ended September 30, 2018 | | $ | 3.85 |
| | |
2018 Asset impairment and exit costs | | — |
| | |
2018 Tax items | | — |
| | |
Subtotal of 2018 items | | — |
| | |
2019 Asset impairment and exit costs | | (0.03 | ) | | |
2019 Canadian tobacco litigation-related expense | | (0.09 | ) | | |
2019 Loss on deconsolidation of RBH | | (0.12 | ) | | |
2019 Russia excise and VAT audit charge | | (0.20 | ) | | |
2019 Tax items | | 0.04 |
| | |
Subtotal of 2019 items | | (0.40 | ) | | |
Currency | | (0.13 | ) | | |
Interest | | 0.04 |
| | |
Change in tax rate | | 0.03 |
| | |
Operations | | 0.18 |
| | |
For the nine months ended September 30, 2019 | | $ | 3.57 |
| | (7.3 | )% |
Asset impairment and exit costs – As a part of the optimization of our global manufacturing infrastructure, we recorded pre-tax asset impairment and exit costs of $65 million during the nine months ended September 30, 2019, related to cigarette plant closures in Colombia and Pakistan. The total pre-tax charge was included in marketing, administration and research costs on the condensed consolidated statements of earnings. For further details, see Note 19. Asset Impairment and Exit Costs.
Income taxes – Our effective tax rate for the nine months ended September 30, 2019 decreased by 1.1 percentage points to 22.2%. The effective tax rate for the nine months ended September 30, 2019 was favorably impacted by the reversal of a deferred tax liability on the unremitted earnings of our Canadian subsidiary, Rothmans, Benson & Hedges Inc. ("RBH") ($49 million), which was included in the 2019 Loss on deconsolidation of RBH ($0.12 diluted EPS impact) as discussed below and a reduction in estimated U.S. federal income tax on dividend repatriation for the years 2015-2018 ($67 million). The change in the effective tax rate that increased our diluted EPS by $0.03 per share in the table above was primarily due to further clarifications related to the Tax Cuts and Jobs Act, in addition to repatriation cost differences and earnings mix by taxing jurisdiction. For further details, see Note 9. Income Taxes.
Canadian tobacco litigation-related expense – In the first quarter of 2019, we recorded a pre-tax charge of $194 million, representing $142 million net of tax, relating to the judgment against RBH in two Québec smoking and health class actions. The charge of $0.09 per share reflects our assessment of the portion of the judgment that represents probable and estimable loss prior to the deconsolidation of RBH and corresponds to the trust account deposit required by the judgment. The total pre-tax charge was included in marketing, administration and research costs on the condensed consolidated statements of earnings and was included in the operating income of the Latin America & Canada segment. For further details, see Note 8. Contingencies and Note 20. Deconsolidation of RBH.
Loss on deconsolidation of RBH – Following the judgment in the two Québec smoking and health class actions, RBH obtained an initial order from the Ontario Superior Court of Justice granting it protection under the Companies’ Creditors Arrangement Act (“CCAA”), which is a Canadian federal law that permits a Canadian business to restructure its affairs while carrying on its business in the ordinary course with minimal disruption to its customers, suppliers and employees. The administration of the CCAA process, principally relating to the powers provided to the court and the court appointed monitor, removes certain elements of control of the business from both PMI and RBH. As a result, we have determined that we no longer have a controlling financial interest over RBH and that we do not exert "significant influence" over RBH under U.S. GAAP. Therefore, we deconsolidated RBH as of the date of the CCAA filing on March 22, 2019, and will account for our continuing investment in RBH as an equity security, without readily determinable fair value.
A loss on the deconsolidation of RBH of $239 million was included in marketing, administration and research costs on the condensed consolidated statements of earnings and was included in the operating income of the Latin America & Canada segment. The $0.12 per share impact also included a tax benefit of $49 million within the provision for income taxes, as discussed above, related to the reversal of a deferred tax liability on the unremitted earnings of RBH. For further details, see Note 8. Contingencies and Note 20. Deconsolidation of RBH.
Russia excise and VAT audit charge – As a result of the final tax assessment for the 2015-2017 financial years received by our Russian affiliate, in the third quarter of 2019, PMI recorded a pre-tax charge of $374 million in marketing, administration and research costs in the condensed consolidated statements of earnings, representing $315 million net of income tax and a diluted EPS charge of $0.20. The pre-tax charge of $374 million was included in the operating income of the Eastern Europe segment. For further details, see Note 8. Contingencies.
Currency – The unfavorable currency impact during the reporting period results from the fluctuations of the U.S. dollar, especially against the Euro, Indonesian rupiah, Russian ruble and Turkish lira, partially offset by the Swiss franc. This unfavorable currency movement has impacted our profitability across our primary revenue markets and local currency cost bases.
Interest – The favorable impact of interest was due primarily to our ongoing efforts to optimize our capital structure following the passage of the Tax Cuts and Jobs Act. This included the decision to use existing cash to repay $2.5 billion and $3.0 billion of long-term debt that matured in 2018 and in the first nine months of 2019, respectively.
Operations – The increase in diluted EPS of $0.18 from our operations in the table above was due primarily to the following segments:
| |
• | European Union: Favorable volume/mix and favorable pricing, partially offset by higher marketing, administration and research costs and higher manufacturing costs; |
| |
• | South & Southeast Asia: Favorable pricing, partially offset by higher marketing, administration and research costs, and unfavorable volume/mix; |
| |
• | Middle East & Africa: Favorable pricing and lower manufacturing costs, partially offset by unfavorable volume/mix; and |
| |
• | East Asia & Australia: Favorable pricing and lower manufacturing costs, partially offset by unfavorable volume/mix and higher marketing, administration and research costs; |
partially offset by
| |
• | Latin America & Canada: Unfavorable impact resulting from the deconsolidation of RBH, as well as unfavorable volume/mix, partially offset by lower marketing, administration and research costs, favorable pricing and lower manufacturing costs; and |
| |
• | Eastern Europe: Higher marketing, administration and research costs and higher manufacturing costs, partially offset by favorable volume/mix and favorable pricing. |
Consolidated Operating Results for the Three Months Ended September 30, 2019
| |
• | Net Revenues - Net revenues of $7.6 billion for the three months ended September 30, 2019 increased by $138 million, or 1.8%, from the comparable 2018 amount. The change in our net revenues from the comparable 2018 amount was driven by the following (variances not to scale with quarterly results): |
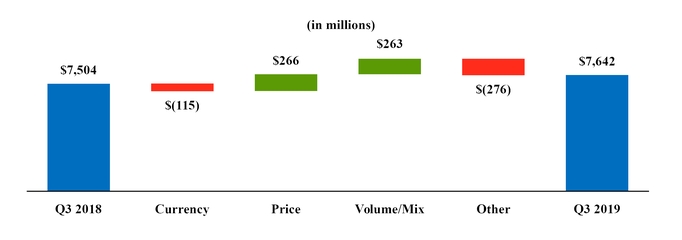
During the quarter, net revenues, excluding unfavorable currency, increased by 3.4%, mainly reflecting: a favorable pricing variance, driven notably by Germany, Indonesia, Mexico, the Philippines and Turkey, partly offset by Japan (reflecting the price repositioning of IQOS devices and associated inventory revaluation); as well as a favorable volume/mix, mainly driven by heated tobacco units, notably across the EU, Japan and Russia, partly offset by unfavorable volume/mix of cigarettes, notably in Australia, Indonesia, Japan, Mexico, Russia and Turkey, as well as unfavorable volume of heated tobacco units in Korea and PMI Duty Free. The currency-neutral growth in net revenues of 3.4% came despite the unfavorable "Other" impact of $276 million, shown above, predominantly resulting from the deconsolidation of RBH.
Net revenues by product category for the three months ended September 30, 2019 and 2018, are shown below:
| |
• | Diluted Earnings Per Share - The changes in our reported diluted EPS for the three months ended September 30, 2019, from the comparable 2018 amounts, were as follows: |
|
| | | | | |
| Diluted EPS | % Growth (Decline) |
For the three months ended September 30, 2018 | $ | 1.44 |
| |
2018 Asset impairment and exit costs | — |
| |
2018 Tax items | — |
| |
Subtotal of 2018 items | — |
| |
2019 Asset impairment and exit costs | (0.01 | ) | |
2019 Russia excise and VAT audit charge | (0.20 | ) | |
2019 Tax items | — |
| |
Subtotal of 2019 items | (0.21 | ) | |
Currency | — |
| |
Interest | 0.01 |
| |
Change in tax rate | — |
| |
Operations | (0.02 | ) | |
For the three months ended September 30, 2019 | $ | 1.22 |
| (15.3 | )% |
Asset impairment and exit costs – As a part of the optimization of our global manufacturing infrastructure, we recorded pre-tax asset impairment and exit costs of $22 million during the three months ended September 30, 2019, related to Colombia. The total pre-tax charge was included in marketing, administration and research costs on the condensed consolidated statements of earnings. For further details, see Note 19. Asset Impairment and Exit Costs.
Russia excise and VAT audit charge – As a result of the final tax assessment for the 2015-2017 financial years received by our Russian affiliate, in the third quarter of 2019, PMI recorded a pre-tax charge of $374 million in marketing, administration and research costs in the condensed consolidated statements of earnings, representing $315 million net of income tax and a diluted EPS charge of $0.20. The pre-tax charge of $374 million was included in the operating income of the Eastern Europe segment. For further details, see Note 8. Contingencies.
Operations – The decrease in diluted EPS of $0.02 from our operations in the table above was due primarily to the following segments:
| |
• | Latin America & Canada: Unfavorable impact resulting from the deconsolidation of RBH, as well as unfavorable volume/mix, partially offset by favorable pricing, lower marketing, administration and research costs and lower manufacturing costs; and |
| |
• | Eastern Europe: Higher marketing, administration and research costs, partially offset by favorable volume/mix; |
partially offset by
| |
• | European Union: Favorable volume/mix, favorable pricing and lower manufacturing costs, partially offset by higher marketing, administration and research costs; |
| |
• | South & Southeast Asia: Favorable pricing and lower manufacturing costs, partially offset by unfavorable volume/mix and higher marketing, administration and research costs; |
| |
• | Middle East & Africa: Favorable pricing and lower manufacturing costs, partially offset by unfavorable volume/mix and the timing of other revenues; and |
| |
• | East Asia & Australia: Favorable volume/mix and lower manufacturing costs, partially offset by higher marketing, administration and research costs and unfavorable pricing. |
For further details, see the “Consolidated Operating Results” and “Operating Results by Business Segment” sections of the following “Discussion and Analysis.”
Discussion and Analysis
Consolidated Operating Results
See pages 92-97 for a discussion of our "Cautionary Factors That May Affect Future Results." Our net revenues and operating income by segment are shown in the table below:
|
| | | | | | | | | | | | |
(in millions) | For the Nine Months Ended September 30, | For the Three Months Ended September 30, |
| 2019 | 2018 | 2019 | 2018 |
Net revenues: | | | | |
European Union | $ | 7,381 |
| $ | 6,958 |
| $ | 2,645 |
| $ | 2,467 |
|
Eastern Europe | 2,300 |
| 2,105 |
| 899 |
| 778 |
|
Middle East & Africa | 3,058 |
| 3,126 |
| 1,127 |
| 1,143 |
|
South & Southeast Asia | 3,607 |
| 3,434 |
| 1,246 |
| 1,197 |
|
East Asia & Australia | 4,094 |
| 4,235 |
| 1,252 |
| 1,166 |
|
Latin America & Canada | 1,652 |
| 2,268 |
| 473 |
| 753 |
|
Net revenues | $ | 22,092 |
| $ | 22,126 |
| $ | 7,642 |
| $ | 7,504 |
|
Operating income (loss): | | | | |
European Union | $ | 3,346 |
| $ | 3,096 |
| $ | 1,255 |
| $ | 1,179 |
|
Eastern Europe | 284 |
| 682 |
| (101 | ) | 270 |
|
Middle East & Africa | 1,304 |
| 1,268 |
| 519 |
| 491 |
|
South & Southeast Asia | 1,471 |
| 1,324 |
| 539 |
| 455 |
|
East Asia & Australia | 1,520 |
| 1,439 |
| 451 |
| 426 |
|
Latin America & Canada | 100 |
| 866 |
| 125 |
| 335 |
|
Operating income | $ | 8,025 |
| $ | 8,675 |
| $ | 2,788 |
| $ | 3,156 |
|
Items affecting the comparability of results from operations were as follows:
| |
• | Russia excise and VAT audit charge - See Note 8. Contingencies for details of the $374 million pre-tax charge included in the Eastern Europe segment for the nine months and three months ended September 30, 2019. |
| |
• | Asset impairment and exit costs - See Note 19. Asset Impairment and Exit Costs for a breakdown of these costs by segment. |
| |
• | Canadian tobacco litigation-related expense - See Note 8. Contingencies and Note 20. Deconsolidation of RBH for details of the $194 million pre-tax charge included in the Latin America & Canada segment for the nine months ended September 30, 2019. |
| |
• | Loss on deconsolidation of RBH - See Note 20. Deconsolidation of RBH for details of the $239 million loss included in the Latin America & Canada segment for the nine months ended September 30, 2019. |
Our net revenues by product category are shown in the table below:
|
| | | | | | | | | | | | | | | | |
PMI Net Revenues by Product Category
|
(in millions) | For the Nine Months Ended September 30, | For the Three Months Ended September 30, |
| 2019 | 2018 | Change | 2019 | 2018 | Change |
Combustible Products | | | | | | |
European Union | $ | 6,139 |
| $ | 6,381 |
| (3.8 | )% | $ | 2,178 |
| $ | 2,225 |
| (2.1 | )% |
Eastern Europe | 1,774 |
| 1,926 |
| (7.9 | )% | 664 |
| 705 |
| (5.8 | )% |
Middle East & Africa | 2,810 |
| 2,813 |
| (0.1 | )% | 1,064 |
| 1,019 |
| 4.4 | % |
South & Southeast Asia | 3,607 |
| 3,434 |
| 5.0 | % | 1,246 |
| 1,197 |
| 4.1 | % |
East Asia & Australia | 2,074 |
| 2,348 |
| (11.7 | )% | 680 |
| 789 |
| (13.8 | )% |
Latin America & Canada | 1,634 |
| 2,254 |
| (27.5 | )% | 466 |
| 748 |
| (37.7 | )% |
Total Combustible Products | $ | 18,039 |
| $ | 19,156 |
| (5.8 | )% | $ | 6,298 |
| $ | 6,681 |
| (5.7 | )% |
Reduced-Risk Products | | | | | | |
European Union | $ | 1,242 |
| $ | 577 |
| +100% |
| $ | 467 |
| $ | 242 |
| 92.5 | % |
Eastern Europe | 526 |
| 179 |
| +100% |
| 235 |
| 73 |
| +100% |
|
Middle East & Africa | 248 |
| 313 |
| (20.9 | )% | 63 |
| 124 |
| (49.2 | )% |
South & Southeast Asia | — |
| — |
| — | % | — |
| — |
| — | % |
East Asia & Australia | 2,020 |
| 1,887 |
| 7.0 | % | 572 |
| 377 |
| 51.6 | % |
Latin America & Canada | 18 |
| 14 |
| 28.1 | % | 7 |
| 5 |
| 44.2 | % |
Total Reduced-Risk Products | $ | 4,053 |
| $ | 2,970 |
| 36.5 | % | $ | 1,344 |
| $ | 823 |
| 63.4 | % |
| | | | | | |
Total PMI Net Revenues | $ | 22,092 |
| $ | 22,126 |
| (0.2 | )% | $ | 7,642 |
| $ | 7,504 |
| 1.8 | % |
Note: Sum of product categories or Regions might not foot to total PMI due to roundings.
Net revenues related to combustible products refer to the operating revenues generated from the sale of these products, including shipping and handling charges billed to customers, net of sales and promotion incentives, and excise taxes. These net revenue amounts consist of the sale of our cigarettes and other tobacco products combined. Other tobacco products primarily include roll-your-own and make-your-own cigarettes, pipe tobacco, cigars and cigarillos and do not include reduced-risk products.
Net revenues related to reduced-risk products refer to the operating revenues generated from the sale of these products, including shipping and handling charges billed to customers, net of sales and promotion incentives, and excise taxes. These net revenue amounts consist of the sale of our heated tobacco units, IQOS devices and related accessories, and other nicotine-containing products, which primarily include our e-vapor products.
We recognize revenue when control is transferred to the customer, typically either upon shipment or delivery of goods.
Revenues from shipments of the Platform 1 device, heated tobacco units and accessories to Altria Group, Inc., commencing in the third quarter of 2019, for sale under license in the United States are included in Net Revenues of the Latin America & Canada segment.
References to "Cost/Other" in the Consolidated Financial Summary table of total PMI and the six reporting segments throughout this "Discussion and Analysis" reflects the currency-neutral variances of: cost of sales (excluding the volume/mix cost component); marketing, administration and research costs (including asset impairment and exit costs, the Canadian tobacco litigation-related expense, the charge related to the deconsolidation of RBH in Canada, and the Russia excise and VAT audit charge); and amortization of intangibles. “Cost/Other” also includes the currency-neutral net revenue variance, unrelated to volume/mix and price components, attributable to fees for certain distribution rights billed to customers in certain markets in the ME&A Region, as well as the impact of the deconsolidation in RBH.
Our shipment volume by segment for cigarettes and heated tobacco units is shown in the table below:
|
| | | | | | | | | | | | |
PMI Shipment Volume (Million Units)
|
| For the Nine Months Ended September 30, | For the Three Months Ended September 30, |
| 2019 | 2018 | Change | 2019 | 2018 | Change |
Cigarettes | | | | | | |
European Union | 133,093 |
| 135,878 |
| (2.0 | )% | 47,238 |
| 48,223 |
| (2.0 | )% |
Eastern Europe | 74,779 |
| 80,294 |
| (6.9 | )% | 27,379 |
| 29,801 |
| (8.1 | )% |
Middle East & Africa | 101,957 |
| 100,831 |
| 1.1 | % | 36,994 |
| 37,406 |
| (1.1 | )% |
South & Southeast Asia | 130,230 |
| 130,846 |
| (0.5 | )% | 42,362 |
| 45,840 |
| (7.6 | )% |
East Asia & Australia | 38,650 |
| 43,391 |
| (10.9 | )% | 12,692 |
| 14,186 |
| (10.5 | )% |
Latin America & Canada | 52,906 |
| 58,829 |
| (10.1 | )% | 16,854 |
| 19,612 |
| (14.1 | )% |
Total Cigarettes | 531,615 |
| 550,069 |
| (3.4 | )% | 183,519 |
| 195,068 |
| (5.9 | )% |
Heated Tobacco Units | | | | | | |
European Union | 8,810 |
| 3,853 |
| +100% |
| 3,474 |
| 1,730 |
| +100% |
|
Eastern Europe | 8,213 |
| 2,667 |
| +100% |
| 3,858 |
| 1,152 |
| +100% |
|
Middle East & Africa | 2,061 |
| 2,832 |
| (27.2 | )% | 588 |
| 1,152 |
| (49.0 | )% |
South & Southeast Asia | — |
| — |
| — | % | — |
| — |
| — | % |
East Asia & Australia | 23,253 |
| 19,755 |
| 17.7 | % | 7,976 |
| 4,575 |
| 74.3 | % |
Latin America & Canada (1) | 202 |
| 98 |
| +100% |
| 89 |
| 43 |
| +100% |
|
Total Heated Tobacco Units | 42,539 |
| 29,205 |
| 45.7 | % | 15,985 |
| 8,652 |
| 84.8 | % |
Cigarettes and Heated Tobacco Units | | | | | | |
European Union | 141,903 |
| 139,731 |
| 1.6 | % | 50,712 |
| 49,953 |
| 1.5 | % |
Eastern Europe | 82,992 |
| 82,961 |
| — | % | 31,237 |
| 30,953 |
| 0.9 | % |
Middle East & Africa | 104,018 |
| 103,663 |
| 0.3 | % | 37,582 |
| 38,558 |
| (2.5 | )% |
South & Southeast Asia | 130,230 |
| 130,846 |
| (0.5 | )% | 42,362 |
| 45,840 |
| (7.6 | )% |
East Asia & Australia | 61,903 |
| 63,146 |
| (2.0 | )% | 20,668 |
| 18,761 |
| 10.2 | % |
Latin America & Canada | 53,108 |
| 58,927 |
| (9.9 | )% | 16,943 |
| 19,655 |
| (13.8 | )% |
Total Cigarettes and Heated Tobacco Units | 574,154 |
| 579,274 |
| (0.9 | )% | 199,504 |
| 203,720 |
| (2.1 | )% |
(1) Includes shipments to Altria Group, Inc., commencing in the third quarter of 2019, for sale in the United States under license.
Following the deconsolidation of our Canadian subsidiary, we will continue to report the volume of brands sold by RBH for which other PMI subsidiaries are the trademark owners. These include HEETS, Next, Philip Morris and Rooftop, which together accounted for approximately 40% of RBH's total shipment volume in 2018.
Heated tobacco units ("HTU") is the term we use to refer to heated tobacco consumables, which for us include our HEETS, HEETS Marlboro and HEETS FROM MARLBORO, defined collectively as HEETS, as well as Marlboro HeatSticks and Parliament HeatSticks.
Shipment volume of heated tobacco units to the United States is included in the heated tobacco unit shipment volume of the Latin America & Canada segment.
References to total international market, defined as worldwide cigarette and heated tobacco unit volume excluding the United States, total industry, total market and market shares throughout this "Discussion and Analysis" are our estimates for tax-paid products based on the latest available data from a number of internal and external sources and may, in defined instances, exclude the People's Republic of China and/or our duty free business. In addition, to reflect the deconsolidation of RBH, effective March 22, 2019, PMI's total market share has been restated for previous periods.
In-market sales ("IMS") is defined as sales to the retail channel, depending on the market and distribution model.
North Africa is defined as Algeria, Egypt, Libya, Morocco and Tunisia.
The Gulf Cooperation Council ("GCC") is defined as Bahrain, Kuwait, Oman, Qatar, Saudi Arabia and the United Arab Emirates (UAE).
Unless otherwise stated, references to total industry, total market, our shipment volume and our market share performance reflect cigarettes and heated tobacco units.
From time to time, PMI’s shipment volumes are subject to the impact of distributor inventory movements, and estimated total industry/market volumes are subject to the impact of inventory movements in various trade channels that include estimated trade inventory movements of PMI’s competitors arising from market-specific factors that significantly distort reported volume disclosures. Such factors may include changes to the manufacturing supply chain, shipment methods, consumer demand, timing of excise tax increases or other influences that may affect the timing of sales to customers. In such instances, in addition to reviewing PMI shipment volumes and certain estimated total industry/market volumes on a reported basis, management reviews these measures on an adjusted basis that excludes the impact of distributor and/or estimated trade inventory movements. Management also believes that disclosing PMI shipment volumes and estimated total industry/market volumes in such circumstances on a basis that excludes the impact of distributor and/or estimated trade inventory movements, such as on an IMS basis, improves the comparability of performance and trends for these measures over different reporting periods.
Key market data regarding total market size, our shipments and market share are shown in the tables below: |
| | | | | | | | | | | | | | | | | | |
| | For the Nine Months Ended September 30, |
| | | | PMI Shipments (billion units) | | PMI Market Share (%)(1) |
Market | | Total Market
(billion units) | | Total | | Cigarette | | Heated Tobacco Unit | | Total | | Heated Tobacco Unit |
| | 2019 | 2018 | | 2019 | 2018 | | 2019 | 2018 | | 2019 | 2018 | | 2019 | 2018 | | 2019 | 2018 |
Total PMI | | 2,023.2 | 2,057.6 | | 574.2 | 579.3 | | 531.6 | 550.1 | | 42.5 | 29.2 | | 28.3 | 28.1 | | 2.1 | 1.6 |
| | | | | | | | | | | | | | | | | | |
European Union | | | | | | | | | | | | | | | | |
France | | 29.1 | 31.1 | | 13.1 | 14.0 | | 13.1 | 14.0 | | 0.1 | — | | 44.9 | 45.3 | | 0.2 | 0.1 |
Germany | | 55.1 | 56.1 | | 20.8 | 20.5 | | 20.2 | 20.3 | | 0.6 | 0.3 | | 37.7 | 36.6 | | 1.1 | 0.5 |
Italy | | 51.1 | 52.0 | | 26.6 | 26.6 | | 24.1 | 25.5 | | 2.5 | 1.1 | | 51.6 | 51.8 | | 4.3 | 1.8 |
Poland | | 35.4 | 33.1 | | 14.5 | 13.8 | | 13.8 | 13.6 | | 0.7 | 0.2 | | 41.1 | 41.6 | | 2.1 | 0.7 |
Spain | | 34.4 | 34.1 | | 11.3 | 11.1 | | 11.1 | 10.9 | | 0.2 | 0.1 | | 31.5 | 32.1 | | 0.7 | 0.4 |
| | | | | | | | | | | | | | | | | | |
Eastern Europe | | | | | | | | | | | | | | | | |
Russia | | 167.7 | 177.2 | | 48.8 | 48.7 | | 43.4 | 47.1 | | 5.3 | 1.6 | | 29.7 | 27.8 | | 3.3 | 0.8 |
| | | | | | | | | | | | | | | | | | |
Middle East & Africa | | | | | | | | | | | | | | | | |
Saudi Arabia | | 16.1 | 15.2 | | 6.7 | 5.3 | | 6.7 | 5.3 | | — | — | | 40.5 | 41.1 | | — | — |
Turkey | | 95.4 | 88.2 | | 40.6 | 40.9 | | 40.6 | 40.9 | | — | — | | 42.5 | 46.4 | | — | — |
| | | | | | | | | | | | | | | | | | |
South & Southeast Asia | | | | | | | | | | | | | | | | |
Indonesia | | 226.3 | 224.8 | | 72.1 | 74.5 | | 72.1 | 74.5 | | — | — | | 31.9 | 33.1 | | — | — |
Philippines | | 52.6 | 52.6 | | 37.2 | 36.7 | | 37.2 | 36.7 | | — | — | | 70.8 | 69.8 | | — | — |
| | | | | | | | | | | | | | | | | | |
East Asia & Australia | | | | | | | | | | | | | | | | |
Australia | | 9.2 | 9.6 | | 2.6 | 2.8 | | 2.6 | 2.8 | | — | — | | 27.6 | 29.3 | | — | — |
Japan | | 120.3 | 130.4 | | 40.5 | 39.9 | | 20.9 | 24.2 | | 19.5 | 15.8 | | 34.3 | 34.2 | | 16.9 | 15.6 |
Korea | | 51.7 | 52.4 | | 11.8 | 13.1 | | 8.2 | 9.1 | | 3.6 | 4.0 | | 22.9 | 24.9 | | 6.9 | 7.6 |
| | | | | | | | | | | | | | | | | | |
Latin America & Canada | | | | | | | | | | | | | | | |
Argentina | | 24.6 | 25.8 | | 17.6 | 19.1 | | 17.6 | 19.1 | | — | — | | 71.5 | 74.0 | | — | — |
Mexico | | 25.1 | 25.4 | | 16.6 | 16.9 | | 16.6 | 16.9 | | — | — | | 65.9 | 66.4 | | — | — |
| | | | | | | | | | | | | | | | | | |
(1) Market share estimates are calculated using IMS data |
Note: % change for Total Market and PMI shipments is computed based on millions of units; PMI Market Share estimates for previous periods are restated to reflect RBH deconsolidation and exclude RBH-owned brands. |
|
| | | | | | | | | | | | | | | | | | |
| | For the Three Months Ended September 30, |
| | | | PMI Shipments (billion units) | | PMI Market Share (%)(1) |
Market | | Total Market (billion units) | | Total | | Cigarette | | Heated Tobacco Unit | | Total | | Heated Tobacco Unit |
| | 2019 | 2018 | | 2019 | 2018 | | 2019 | 2018 | | 2019 | 2018 | | 2019 | 2018 | | 2019 | 2018 |
Total PMI | | 696.1 | 720.1 | | 199.5 | 203.7 | | 183.5 | 195.1 | | 16.0 | 8.7 | | 28.8 | 28.9 | | 2.3 | 1.7 |
| | | | | | | | | | | | | | | | | | |
European Union | | | | | | | | | | | | | | | | |
France | | 10.2 | 10.7 | | 4.5 | 4.6 | | 4.5 | 4.6 | | — | — | | 45.0 | 45.7 | | 0.2 | 0.1 |
Germany | | 20.7 | 20.5 | | 7.4 | 7.3 | | 7.2 | 7.2 | | 0.2 | 0.1 | | 35.7 | 35.5 | | 1.1 | 0.5 |
Italy | | 18.3 | 18.3 | | 9.5 | 9.3 | | 8.5 | 8.8 | | 1.1 | 0.5 | | 52.0 | 51.9 | | 4.6 | 2.0 |
Poland | | 12.5 | 11.9 | | 5.3 | 5.2 | | 5.0 | 5.1 | | 0.3 | 0.1 | | 42.5 | 43.4 | | 2.4 | 0.9 |
Spain | | 12.6 | 12.5 | | 3.8 | 3.9 | | 3.8 | 3.8 | | 0.1 | 0.1 | | 31.6 | 32.4 | | 0.7 | 0.4 |
| | | | | | | | | | | | | | | | | | |
Eastern Europe | | | | | | | | | | | | | | | | |
Russia | | 61.4 | 65.3 | | 18.9 | 18.4 | | 16.2 | 17.6 | | 2.7 | 0.7 | | 30.9 | 28.3 | | 4.0 | 1.1 |
| | | | | | | | | | | | | | | | | | |
Middle East & Africa | | | | | | | | | | | | | | | | |
Saudi Arabia | | 5.5 | 5.3 | | 2.0 | 2.5 | | 2.0 | 2.5 | | — | — | | 40.8 | 41.7 | | — | — |
Turkey | | 33.8 | 33.7 | | 14.2 | 15.9 | | 14.2 | 15.9 | | — | — | | 41.9 | 47.1 | | — | — |
| | | | | | | | | | | | | | | | | | |
South & Southeast Asia | | | | | | | | | | | | | | | | |
Indonesia | | 79.0 | 80.3 | | 25.0 | 26.5 | | 25.0 | 26.5 | | — | — | | 31.7 | 33.0 | | — | — |
Philippines | | 17.2 | 18.3 | | 12.4 | 12.7 | | 12.4 | 12.7 | | — | — | | 71.8 | 69.5 | | — | — |
| | | | | | | | | | | | | | | | | | |
East Asia & Australia | | | | | | | | | | | | | | | | |
Australia | | 3.2 | 3.4 | | 0.9 | 1.0 | | 0.9 | 1.0 | | — | — | | 27.7 | 29.1 | | — | — |
Japan | | 42.1 | 48.3 | | 13.3 | 10.7 | | 6.5 | 7.5 | | 6.8 | 3.2 | | 34.3 | 33.7 | | 17.0 | 15.5 |
Korea | | 18.4 | 18.7 | | 4.1 | 4.6 | | 2.9 | 3.2 | | 1.1 | 1.4 | | 22.2 | 24.2 | | 6.2 | 7.4 |
| | | | | | | | | | | | | | | | | | |
Latin America & Canada | | | | | | | | | | | | | | | |
Argentina | | 8.3 | 8.1 | | 5.9 | 6.1 | | 5.9 | 6.1 | | — | — | | 70.4 | 75.2 | | — | — |
Mexico | | 7.7 | 8.5 | | 4.9 | 5.9 | | 4.9 | 5.9 | | — | — | | 63.4 | 69.1 | | — | — |
| | | | | | | | | | | | | | | | | | |
(1) Market share estimates are calculated using IMS data |
Note: % change for Total Market and PMI shipments is computed based on millions of units; PMI Market Share estimates for previous periods are restated to reflect RBH deconsolidation and exclude RBH-owned brands. |
Consolidated Operating Results for the Nine Months Ended September 30, 2019
The following discussion compares our consolidated operating results for the nine months ended September 30, 2019, with the nine months ended September 30, 2018.
Our total shipment volume decreased by 0.9%, due to:
| |
• | South & Southeast Asia, reflecting lower cigarette shipment volume, primarily in Indonesia and Pakistan, partly offset by the Philippines and Thailand; |
| |
• | East Asia & Australia, primarily reflecting lower cigarette shipment volume in Japan and lower cigarette and heated tobacco unit shipment volume in Korea, partly offset by higher heated tobacco unit shipment volume in Japan; and |
| |
• | Latin America & Canada, reflecting lower cigarette shipment volume, principally in Argentina, Canada (primarily reflecting the impact of the deconsolidation of RBH), Mexico and Venezuela, partly offset by Brazil. Excluding the volume impact from the RBH deconsolidation of approximately 2.9 billion units (reflecting the volume of RBH-owned brands from March 22, 2018 through September 30, 2018), our total shipment volume in the Region decreased by 5.2%; |
partly offset by
| |
• | the EU, reflecting higher heated tobacco unit shipment volume across the Region, notably in Italy, and higher cigarette shipment volume in Poland, partly offset by lower cigarette shipment volume in France and Italy; and |
| |
• | Middle East & Africa, primarily reflecting higher cigarette shipment volume, notably in Egypt and Saudi Arabia, partly offset by lower cigarette and heated tobacco unit shipment volume in PMI Duty Free. |
Our total shipment volume in Eastern Europe was flat, reflecting higher heated tobacco unit shipment volume across the Region, notably in Kazakhstan, Russia and Ukraine, offset by lower cigarette shipment volume, primarily in Russia and Ukraine.
Excluding the volume impact from the RBH deconsolidation of approximately 2.9 billion units (reflecting the volume of RBH-owned brands from March 22, 2018 through September 30, 2018 and including Duty-Free sales of these brands in Canada), PMI's total shipment volume decreased by 0.4%.
Impact of Inventory Movements
Excluding the volume impact from the deconsolidation of RBH, and the net favorable impact of estimated distributor inventory movements of approximately 3.6 billion units, our total in-market sales declined by 1.0% due to a 2.9% decline of cigarette in-market sales, partly offset by a 31.8% increase in heated tobacco unit in-market sales.
The net favorable impact of estimated distributor inventory movements of approximately 3.6 billion units reflected 2.9 billion heated tobacco units, driven primarily by Japan, partly offset by PMI Duty Free and Russia, and 0.7 billion cigarettes, driven primarily by the EU Region and Saudi Arabia, partly offset by North Africa and Thailand.
Our cigarette shipment volume by brand and heated tobacco units shipment volume are shown in the table below:
|
| | | | | | |
PMI Shipment Volume by Brand (Million Units)
|
| Nine Months Year-to-Date |
| 2019 | 2018 | Change |
Cigarettes
| | | |
Marlboro | 196,883 |
| 195,987 |
| 0.5 | % |
L&M | 69,765 |
| 66,751 |
| 4.5 | % |
Chesterfield | 43,502 |
| 44,622 |
| (2.5 | )% |
Philip Morris | 36,949 |
| 36,687 |
| 0.7 | % |
Parliament | 29,085 |
| 31,041 |
| (6.3 | )% |
Sampoerna A | 26,012 |
| 29,131 |
| (10.7 | )% |
Dji Sam Soe | 23,089 |
| 21,151 |
| 9.2 | % |
Bond Street | 21,099 |
| 23,960 |
| (11.9 | )% |
Lark | 15,575 |
| 17,604 |
| (11.5 | )% |
Fortune | 9,702 |
| 11,791 |
| (17.7 | )% |
Others | 59,954 |
| 71,344 |
| (16.0 | )% |
Total Cigarettes | 531,615 |
| 550,069 |
| (3.4 | )% |
Heated Tobacco Units (1) | 42,539 |
| 29,205 |
| 45.7 | % |
Total Cigarettes and Heated Tobacco Units | 574,154 |
| 579,274 |
| (0.9 | )% |
(1) Includes shipments to Altria Group, Inc., commencing in the third quarter of 2019, for sale in the United States under license.
Note: Sampoerna A includes Sampoerna; Philip Morris includes Philip Morris/Dubliss; and Lark includes Lark Harmony.
Our cigarette shipment volume of the following brands decreased:
| |
• | Chesterfield, mainly due to Argentina, Italy, Russia and Venezuela, partly offset by Brazil, Mexico and Poland; |
| |
• | Parliament, mainly due to Korea and Russia, partly offset by Turkey; |
| |
• | Sampoerna A in Indonesia, mainly reflecting the impact of retail price increases resulting in widened price gaps with competitors' products; |
| |
• | Bond Street, mainly due to Russia and Ukraine; |
| |
• | Lark, mainly due to Japan and Turkey; |
| |
• | Fortune in the Philippines, mainly reflecting up-trading to Marlboro resulting from narrowed price gaps with the below premium price segment; and |
| |
• | "Others," notably due to: the impact of the deconsolidation of RBH in Canada; mid-price Sampoerna U in Indonesia, partly reflecting the impact of above-inflation retail price increases; and low-price brands, notably in Mexico, mainly reflecting the morphing of Delicados into Chesterfield, and Russia, partly offset by Jackpot in the Philippines. |
The increase in our heated tobacco unit shipment volume was mainly driven by: the EU, notably Italy, Eastern Europe, notably Kazakhstan, Russia and Ukraine and Japan, partly offset by Korea and PMI Duty Free.
Our cigarette shipment volume of the following brands increased:
| |
• | Marlboro, mainly driven by Indonesia, reflecting the growth of the Filter Black 12s and 20s variants, the Philippines, reflecting up-trading resulting from narrowed price gaps with the below premium price segment, Saudi Arabia and Turkey, partially offset by Italy and Japan, partly reflecting the impact of out-switching to heated tobacco units, as well as France and PMI Duty Free; |
| |
• | L&M, mainly driven by Egypt, Saudi Arabia and Thailand, partly offset by Russia and Turkey; |
| |
• | Philip Morris, mainly driven by Indonesia and Russia, partly offset by Argentina; and |
| |
• | Dji Sam Soe in Indonesia, driven by the strong performance of the DSS Magnum Mild 16 variant and the introduction of 20s and 50s variants. |
International Share of Market
Our total international market share (excluding China and the United States), defined as our cigarette and heated tobacco unit sales volume as a percentage of total industry cigarette and heated tobacco unit sales volume, increased by 0.2 points to 28.3%, reflecting:
| |
• | Total international cigarette market share of 26.2%, down by 0.3 points; and |
| |
• | Total international heated tobacco unit market share of 2.1%, up by 0.5 points. |
Our total international cigarette market share, defined as our cigarette sales volume as a percentage of total industry cigarette sales volume, was 26.9%, down by 0.2 points.
|
| | | | | | | | | | | | | | | | | | | | | | | | | | | | |
Financial Summary |
Financial Summary -
Nine Months Ended
September 30, | | | | | Change
Fav./(Unfav.) | | Variance
Fav./(Unfav.) |
| 2019 | 2018 | | Total | Excl.
Curr. | | Total | Cur-
rency | Price | Vol/
Mix | Cost/
Other(1) |
(in millions) | | | |
Net Revenues | | $ | 22,092 |
| $ | 22,126 |
| | (0.2 | )% | 4.1 | % | | $ | (34 | ) | $ | (931 | ) | $ | 953 |
| $ | 457 |
| $ | (513 | ) |
Cost of Sales | | (7,735 | ) | (7,977 | ) | | 3.0 | % | (0.4 | )% | | 242 |
| 274 |
| — |
| (255 | ) | 223 |
|
Marketing, Administration and Research Costs (2) | | (6,282 | ) | (5,411 | ) | | (16.1 | )% | (22.3 | )% | | (871 | ) | 333 |
| — |
| — |
| (1,204 | ) |
Amortization of Intangibles | | (50 | ) | (63 | ) | | 20.6 | % | 15.9 | % | | 13 |
| 3 |
| — |
| — |
| 10 |
|
Operating Income | | $ | 8,025 |
| $ | 8,675 |
| | (7.5 | )% | (3.8 | )% | | $ | (650 | ) | $ | (321 | ) | $ | 953 |
| $ | 202 |
| $ | (1,484 | ) |
(1) Cost/Other variance includes the impact of the RBH deconsolidation.
(2) Unfavorable Cost/Other variance includes the Russia excise and VAT audit charge of $374 million in 2019, asset impairment & exit costs of $65 million in 2019, the 2019 Canadian tobacco litigation-related expense of $194 million, and the 2019 loss on deconsolidation of RBH of $239 million, as well as the impact of the RBH deconsolidation.
Note: Net Revenues include revenues from shipments of the Platform 1 device, heated tobacco units and accessories to Altria Group, Inc., commencing in the third quarter of 2019, for sale under license in the United States.
For the nine months ended September 30, 2019, net revenues, excluding unfavorable currency, increased by 4.1%, mainly reflecting: a favorable pricing variance, notably in Germany, Indonesia, Japan, the Philippines and Turkey, partly offset by Argentina; and favorable volume/mix, mainly driven by heated tobacco units in the EU, Japan and Russia, partly offset by unfavorable volume/mix of cigarettes, notably in the EU, Indonesia, Japan and Russia, as well as unfavorable volume of heated tobacco units in Korea and PMI Duty Free. The currency-neutral growth in net revenues of 4.1% came despite the unfavorable impact of $513 million, shown in "Cost/Other," predominantly resulting from the deconsolidation of RBH.
The unfavorable currency in net revenues was due primarily to the Euro, Indonesian rupiah, Russian ruble and Turkish lira.
Net revenues include $4,053 million in 2019 and $2,970 million in 2018 related to the sale of RRPs.
Operating income decreased by 7.5%. Excluding unfavorable currency ($321 million), the 2019 Russia excise and VAT audit charge ($374 million), the 2019 loss on deconsolidation of RBH ($239 million), the 2019 Canadian tobacco litigation-related expense ($194 million), and asset impairment and exit costs ($65 million) related to plant closures in Colombia and Pakistan as part of global manufacturing infrastructure optimization, operating income increased by 6.3%, primarily reflecting: a favorable pricing variance; favorable volume/mix, mainly across the EU, Eastern Europe and the Philippines, partly offset by Argentina, Australia, Indonesia, Japan, Korea and PMI Duty Free; and lower manufacturing costs; partly offset by higher marketing, administration and research costs, reflecting increased investment behind reduced-risk products mainly in the EU and Eastern Europe, and the net unfavorable impact resulting from the deconsolidation of RBH, shown in "Cost/Other."
Interest expense, net, of $434 million decreased by $106 million (19.6%), due primarily to our ongoing efforts to optimize our capital structure following the passage of the Tax Cuts and Jobs Act. This included the decision to use existing cash to repay $2.5 billion and $3.0 billion of long-term debt that matured in 2018 and in the first nine months of 2019, respectively.
Our effective tax rate decreased by 1.1 percentage points to 22.2%. The effective tax rate for the nine months ended September 30, 2019, was favorably impacted by further clarifications related to the Tax Cuts and Jobs Act, the reversal of a deferred tax liability on the unremitted earnings of our Canadian subsidiary, RBH ($49 million), and a reduction in estimated U.S. federal income tax on dividend repatriation for the years 2015-2018 ($67 million). We estimate that our full-year 2019 effective tax rate will be approximately 23%, excluding the discrete tax events mentioned above and the 2019 loss on deconsolidation of RBH, which is a significant unusual or infrequently occurring item. Changes in currency exchange rates, earnings mix by taxing jurisdiction or future regulatory developments may have an impact on the effective tax rates, which we monitor each quarter. Significant judgment is required in determining income tax provisions and in evaluating tax positions. For further details, see Note 9. Income Taxes.
We are regularly examined by tax authorities around the world, and we are currently under examination in a number of jurisdictions. It is reasonably possible that within the next 12 months certain tax examinations will close, which could result in a change in unrecognized tax benefits along with related interest and penalties. An estimate of any possible change cannot be made at this time.
Net earnings attributable to PMI of $5.6 billion decreased by $432 million or 7.2%. This decrease was due primarily to lower operating income as discussed above, partially offset by a lower effective tax rate and lower interest expense, net. Diluted and basic EPS of $3.57 decreased by 7.3%. Excluding an unfavorable currency impact of $0.13, the $0.12 loss on the deconsolidation of RBH, the $0.09 charge related to the 2019 Canadian tobacco litigation-related expense, the $0.03 charge related to 2019 asset impairment and exit costs, the $0.20 charge related to the 2019 Russia excise and VAT audit charge, and a favorable 2019 tax impact of $0.04 related to a reduction in estimated U.S. federal income tax on dividend repatriation for the years 2015-2018, diluted EPS increased by 6.5%.
Consolidated Operating Results for the Three Months Ended September 30, 2019
The following discussion compares our consolidated operating results for the three months ended September 30, 2019, with the three months ended September 30, 2018.
Our total shipment volume decreased by 2.1%, principally due to:
| |
• | Middle East & Africa, reflecting lower heated tobacco unit shipment volume in PMI Duty Free and cigarette shipment volume, notably in Saudi Arabia and Turkey, partly offset by Egypt; |
| |
• | South & Southeast Asia, reflecting lower cigarette shipment volume, primarily in Indonesia, Pakistan and the Philippines, partly offset by Thailand; and |
| |
• | Latin America & Canada, due to lower cigarette shipment volume, primarily in Canada (reflecting the impact of the deconsolidation of RBH) and Mexico, partly offset by Brazil. Excluding the volume impact from the RBH deconsolidation of approximately 1.5 billion units (reflecting third quarter 2018 volume of RBH-owned brands), our total shipment volume in the Region decreased by 6.9%; |
partly offset by
| |
• | the EU, reflecting higher heated tobacco unit shipment volume across the Region, notably in Italy, partly offset by lower cigarette shipment volume, primarily in France and Italy; |
| |
• | Eastern Europe, reflecting higher heated tobacco unit shipment volume across the Region, notably in Kazakhstan, Russia and Ukraine, partly offset by lower cigarette shipment volume, mainly in Russia and Ukraine; and |
| |
• | East Asia & Australia, driven by higher heated tobacco unit shipment volume in Japan (mainly reflecting a favorable comparison with the third quarter of 2018 in which IQOS consumable inventories were reduced), partly offset by lower cigarette shipment volume across the Region, notably in Japan and Korea, as well as lower heated tobacco unit shipment volume in Korea. |
Excluding the volume impact from the RBH deconsolidation of approximately 1.5 billion units (reflecting third quarter 2018 volume of RBH-owned brands and including Duty-Free sales of these brands in Canada), PMI's total shipment volume decreased by 1.4%.
Impact of Inventory Movements
Excluding the volume impact from the deconsolidation of RBH, and the net favorable impact of estimated distributor inventory movements of approximately 4.8 billion units, our total in-market sales declined by 3.6% due to a 5.7% decline of cigarette in-market sales, partially offset by a 28.3% increase in heated tobacco unit in-market sales.
The net favorable impact of estimated distributor inventory movements of approximately 4.8 billion units was driven by 3.8 billion heated tobacco units (mainly reflecting a favorable comparison with the third quarter of 2018 in which IQOS consumable inventories in Japan were reduced), and 1.0 billion cigarettes, driven partly by Japan.
Our cigarette shipment volume by brand and heated tobacco units shipment volume are shown in the table below:
|
| | | | | | |
PMI Shipment Volume by Brand (Million Units) |
| Third-Quarter |
| 2019 | 2018 | Change |
Cigarettes
| | | |
Marlboro | 68,859 |
| 69,121 |
| (0.4 | )% |
L&M | 24,428 |
| 24,329 |
| 0.4 | % |
Chesterfield | 15,001 |
| 15,821 |
| (5.2 | )% |
Philip Morris | 13,275 |
| 13,505 |
| (1.7 | )% |
Parliament | 10,407 |
| 11,588 |
| (10.2 | )% |
Sampoerna A | 8,756 |
| 10,333 |
| (15.3 | )% |
Dji Sam Soe | 8,599 |
| 7,578 |
| 13.5 | % |
Bond Street | 7,687 |
| 8,595 |
| (10.6 | )% |
Lark | 4,955 |
| 6,058 |
| (18.2 | )% |
Fortune | 3,215 |
| 4,052 |
| (20.7 | )% |
Others | 18,337 |
| 24,088 |
| (23.9 | )% |
Total Cigarettes | 183,519 |
| 195,068 |
| (5.9 | )% |
Heated Tobacco Units (1) | 15,985 |
| 8,652 |
| 84.8 | % |
Total Cigarettes and Heated Tobacco Units | 199,504 |
| 203,720 |
| (2.1 | )% |
(1) Includes shipments to Altria Group, Inc., commencing in the third quarter of 2019, for sale in the United States under license.
Note: Sampoerna A includes Sampoerna; Philip Morris includes Philip Morris/Dubliss; and Lark includes Lark Harmony.
Our cigarette shipment volume of the following brands decreased:
| |
• | Marlboro, mainly due to the GCC, Japan, partly reflecting the impact of out-switching to heated tobacco units, and Mexico, partly offset by the Philippines and Turkey; |
| |
• | Chesterfield, mainly due to Argentina, Mexico, Russia and Saudi Arabia, partly offset by Brazil; |
| |
• | Philip Morris, mainly due to Ukraine, partly offset by Indonesia; |
| |
• | Parliament, mainly due to Japan, Korea, Russia and Turkey; |
| |
• | Sampoerna A in Indonesia, mainly reflecting the impact of retail price increases resulting in widened price gaps with competitors' products; |
| |
• | Bond Street, mainly due to Russia and Ukraine; |
| |
• | Lark, mainly due to Japan and Turkey; |
| |
• | Fortune in the Philippines, mainly reflecting up-trading to Marlboro resulting from narrowed price gaps with the below premium price segment; and |
| |
• | "Others," notably due to: the impact of the deconsolidation of RBH in Canada; mid-price Sampoerna U in Indonesia, partly reflecting the impact of above-inflation retail price increases; and low-price brands, notably Morven in Pakistan, partly offset by Jackpot in the Philippines. |
The increase in our heated tobacco unit shipment volume was mainly driven by the EU, notably Italy, Eastern Europe, notably Kazakhstan, Russia and Ukraine, as well as Japan, partly offset by Korea and PMI Duty Free.
Our cigarette shipment volume of the following brands increased:
| |
• | L&M, mainly driven by Egypt and Thailand, partly offset by Russia and Turkey; and |
| |
• | Dji Sam Soe in Indonesia, driven by the strong performance of the DSS Magnum Mild 16 variant and the introduction of 20s and 50s variants. |
International Share of Market
Our total international market share (excluding China and the United States), defined as our cigarette and heated tobacco unit sales volume as a percentage of total industry cigarette and heated tobacco unit sales volume, decreased by 0.1 point to 28.8%, reflecting:
| |
• | Total international cigarette market share of 26.5%, down by 0.6 points; and |
| |
• | Total international heated tobacco unit market share of 2.3%, up by 0.6 points. |
Our total international cigarette market share, defined as our cigarette sales volume as a percentage of total industry cigarette sales volume, was 27.3%, down by 0.4 points, mainly reflecting: out-switching to IQOS, notably in the EU Region, Japan and Russia; and lower cigarette market share, notably in Argentina, Indonesia, Korea, Mexico and Turkey.
|
| | | | | | | | | | | | | | | | | | | | | | | | | | | | |
Financial Summary |
Financial Summary -
Quarters Ended September 30, | | | | | Change
Fav./(Unfav.) | | Variance
Fav./(Unfav.) |
| 2019 | 2018 | | Total | Excl.
Curr. | | Total | Cur-
rency | Price | Vol/
Mix | Cost/
Other(1) |
(in millions) | | | |
Net Revenues | | $ | 7,642 |
| $ | 7,504 |
| | 1.8 | % | 3.4 | % | | $ | 138 |
| $ | (115 | ) | $ | 266 |
| $ | 263 |
| $ | (276 | ) |
Cost of Sales | | (2,605 | ) | (2,618 | ) | | 0.5 | % | (0.6 | )% | | 13 |
| 30 |
| — |
| (181 | ) | 164 |
|
Marketing, Administration and Research Costs(2) | | (2,234 | ) | (1,710 | ) | | (30.6 | )% | (34.8 | )% | | (524 | ) | 71 |
| — |
| — |
| (595 | ) |
Amortization of Intangibles | | (15 | ) | (20 | ) | | 25.0 | % | 15.0 | % | | 5 |
| 2 |
| — |
| — |
| 3 |
|
Operating Income | | $ | 2,788 |
| $ | 3,156 |
| | (11.7 | )% | (11.3 | )% | | $ | (368 | ) | $ | (12 | ) | $ | 266 |
| $ | 82 |
| $ | (704 | ) |
(1) Cost/Other variance includes the impact of the RBH deconsolidation.
(2) Unfavorable Cost/Other variance includes the Russia excise and VAT audit charge of $374 million in 2019, asset impairment & exit costs of $22 million in 2019, as well as the impact of the RBH deconsolidation.
Note: Net Revenues include revenues from shipments of the Platform 1 device, heated tobacco units and accessories to Altria Group, Inc., commencing in the third quarter of 2019, for sale under license in the United States.
For the three months ended September 30, 2019, net revenues, excluding unfavorable currency, increased by 3.4%, mainly reflecting: a favorable pricing variance, driven notably by Germany, Indonesia, Mexico, the Philippines and Turkey, partly offset by Japan (reflecting the price repositioning of IQOS devices and associated inventory revaluation); as well as a favorable volume/mix, mainly driven by heated tobacco units, notably across the EU, Japan and Russia, partly offset by unfavorable volume/mix of cigarettes, notably in Australia, Indonesia, Japan, Mexico, Russia and Turkey, as well as unfavorable volume of heated tobacco units in Korea and PMI Duty Free. The currency-neutral growth in net revenues of 3.4% came despite the unfavorable impact of $276 million, shown in "Cost/Other," predominantly resulting from the deconsolidation of RBH.
The unfavorable currency in net revenues was due primarily to the Australian dollar, Euro and Turkish lira, partially offset by the Japanese yen.
Net revenues include $1,344 million in 2019 and $823 million in 2018 related to the sale of RRPs.
Operating income decreased by 11.7%. Excluding unfavorable currency ($12 million), the 2019 Russia excise and VAT audit charge ($374 million), and the 2019 asset impairment and exit costs ($22 million) related to a plant closure in Colombia as part of our global manufacturing infrastructure optimization, operating income increased by 1.3%, primarily reflecting: a favorable pricing variance; favorable volume/mix, reflecting the same drivers as for net revenues noted above; and lower manufacturing costs across the Regions; partly offset by higher marketing, administration and research costs, reflecting increased investment behind reduced-risk products mainly in the EU, Eastern Europe and East Asia & Australia, and the net unfavorable impact resulting from the deconsolidation of RBH shown in "Cost/Other."
Interest expense, net, of $132 million decreased by $13 million (9.0%).
Our effective tax rate for three months ended September 30, 2019, increased by 1.1 percentage points to 24.1%, primarily due to changes in earnings mix by taxing jurisdiction. For further details, see Note 9. Income Taxes.
Net earnings attributable to PMI of $1.9 billion decreased by $351 million or 15.6%. This decrease was due primarily to lower operating income as discussed above. Diluted and basic EPS of $1.22 decreased by 15.3%. Excluding the $0.01 charge related to 2019 asset impairment and exit costs and the $0.20 charge related to the 2019 Russia excise and VAT audit charge, diluted EPS decreased by 0.7%.
Operating Results by Business Segment
Business Environment
Taxes, Legislation, Regulation and Other Matters Regarding the Manufacture, Marketing, Sale and Use of Tobacco Products
The tobacco industry and our business face a number of challenges that may adversely affect our business, volume, results of operations, cash flows and financial position. These challenges, which are discussed below and in “Cautionary Factors That May Affect Future Results,” include:
| |
• | regulatory restrictions on our products, including restrictions on the packaging, marketing, and sale of tobacco or other nicotine-containing products that could reduce our competitiveness, eliminate our ability to communicate with adult consumers, or even ban certain of our products; |
| |
• | fiscal challenges, such as excessive excise tax increases and discriminatory tax structures; |
| |
• | illicit trade in cigarettes and other tobacco products, including counterfeit, contraband and so-called “illicit whites”; |
| |
• | intense competition, including from non-tax paid volume by certain local manufacturers; |
| |
• | pending and threatened litigation as discussed in Note 8. Contingencies; and |
| |
• | governmental investigations. |
Regulatory Restrictions: The tobacco industry operates in a highly regulated environment. The well-known risks of smoking have led regulators to impose significant restrictions and high excise taxes on cigarettes.
We support a comprehensive regulatory framework for tobacco products based on the principle of harm reduction, including mandated health warnings, minimum age laws, restrictions on advertising, and public place smoking restrictions. We also support regulatory measures that help reduce illicit trade.
Much of the regulation that shapes the business environment in which we operate is driven by the World Health Organization's (“WHO”) Framework Convention on Tobacco Control (“FCTC”), which entered into force in 2005. The FCTC has as its main objective to establish a global agenda for tobacco regulation, with the purpose of reducing tobacco use. To date, 180 countries and the European Union are Parties to the FCTC. The treaty requires Parties to have in place various tobacco control measures and recommends others. The FCTC governing body, the Conference of the Parties (“CoP”), has also adopted non-binding guidelines and policy recommendations related to certain articles of the FCTC that go beyond the text of the treaty. In October 2018, the CoP recognized the need for more scientific assessment and improved reporting to define policy on heated tobacco products. Similar to its previous policy recommendations on e-cigarettes, the CoP invited countries to regulate, restrict or prohibit heated tobacco products, as appropriate under their national laws.
In July 2019, the WHO issued the Report on the Global Tobacco Epidemic 2019. While citing insufficient independent studies regarding the benefits and the unknown long-term health impacts of electronic nicotine delivery systems and heated tobacco products, the WHO has taken the position that such products are not risk-free and should be regulated in the same manner as cigarettes and in line with the FCTC provisions. It is not possible to predict whether or to what extent measures recommended by the WHO, including the FCTC guidelines, will be implemented.
We agree that all tobacco and nicotine-containing products, including our RRPs, need to be regulated; however, we continue to seek to engage in a dialogue with regulators with respect to those measures that we do not believe would protect public health and, if implemented, could disrupt competition, severely limit our ability to market and sell our products (including our RRPs) to adult smokers, or increase illicit trade. We advocate for measures that would accelerate switching to better alternatives to continued smoking and embrace a regulatory framework that recognizes a risk continuum of tobacco and other nicotine-containing products.
Certain measures are discussed in more detail below and in the Reduced-Risk Products (RRPs) section.
Fiscal Challenges: Excessive and disruptive excise, sales and other tax increases and discriminatory tax structures are expected to continue to have an adverse impact on our profitability, due to lower consumption and consumer down-trading to non-premium, discount, other low-price or low-taxed combustible tobacco products such as fine cut tobacco and illicit cigarettes. In addition, in certain jurisdictions, some of our combustible products are subject to tax structures that discriminate against premium-price products and manufactured cigarettes. We believe that such tax policies undermine public health by encouraging consumers to turn to illicit trade, and ultimately undercut government revenue objectives, disrupt the competitive environment, and encourage criminal activity. Other jurisdictions have imposed, or are seeking to impose, levies or other taxes specifically on tobacco companies, such as taxes on revenues and/or profits.
EU Tobacco Products Directive: In April 2014, the EU adopted a significantly revised EU Tobacco Products Directive (TPD), which entered into force in May 2016. All 28 Member States and Norway have adopted laws transposing the TPD. The TPD sets forth a comprehensive set of regulatory requirements for tobacco products, including:
| |
• | health warnings covering 65% of the front and back panels of cigarette packs, with an option for Member States to further standardize tobacco packaging, including the introduction of plain packaging; |
| |
• | a ban on characterizing flavors in some tobacco products, with a transition period for menthol expiring in May 2020; |
| |
• | security features and tracking and tracing measures that became effective on May 20, 2019; and |
| |
• | a framework for the regulation of novel tobacco products and e-cigarettes, including requirements for health warnings and information leaflets, a prohibition on product packaging text related to reduced risk, and the introduction of notification requirements or authorization procedures in advance of commercialization. |
Plain Packaging and Other Packaging Restrictions: Plain packaging legislation bans the use of branding, logos and colors on packaging other than the brand name and variant that may be printed only in specified locations and in a uniform font. To date, plain packaging laws have been adopted in certain markets in all of our reporting segments, including the key markets of Australia, France, Saudi Arabia and Turkey, and are in various degrees of implementation. Some countries, such as Canada, New Zealand and Israel, adopted plain packaging regulations that apply to all tobacco products, including RRPs. Other countries are also considering plain packaging legislation.
Some countries have adopted, or are considering adopting, packaging restrictions that could have an impact similar to plain packaging. Examples of such restrictions include standardizing the shape and size of packages, prohibiting certain colors or the use of certain descriptive phrases on packaging, and requiring very large graphic health warnings that leave little space for branding.
Restrictions and Bans on the Use of Ingredients: The WHO and others in the public health community have recommended restrictions or total bans on the use of some or all ingredients in tobacco products, including menthol. Broad restrictions and ingredient bans would require us to reformulate our American blend tobacco products and could reduce our ability to differentiate these products in the market in the long term. Menthol bans would eliminate the entire category of mentholated tobacco products. The European Union has banned flavored tobacco products, subject to an exemption until May 2020 for menthol. Other countries may follow the EU’s approach. For instance, Turkey has banned menthol as of May 2020. Broader ingredient bans have been adopted by Canada and Brazil. In Brazil, an ingredient ban is currently on appeal by a tobacco industry union, of which our Brazilian subsidiary is a member. It is not possible to predict the outcome of these legal proceedings.
Bans on Display of Tobacco Products at Retail: In a number of our markets, including, but not limited to, Australia and Russia, governments have banned the display of tobacco products at the point of sale. Other countries are considering similar bans.
Bans and Restrictions on Advertising, Marketing, Promotions and Sponsorships: For many years, the FCTC has called for, and countries have imposed, partial or total bans on tobacco advertising, marketing, promotions and sponsorships, including bans and restrictions on advertising on radio and television, in print and on the Internet. The FCTC's non-binding guidelines recommend that governments prohibit all forms of communication with adult smokers.
Restrictions on Product Design: Some members of the public health community are calling for the further standardization of tobacco products by requiring, for example, that cigarettes have a certain minimum diameter, which would amount to a ban on slim cigarettes, or requiring the use of standardized filter and cigarette paper designs. In addition, at its meeting in November 2016, the CoP adopted non-binding guidelines recommending that countries regulate product design features that increase the attractiveness of tobacco products, such as the diameter of cigarettes and the use of flavor capsules.
Restrictions on Public Smoking: The pace and scope of public smoking restrictions have increased significantly in most of our markets. Many countries around the world have adopted, or are likely to adopt, regulations that restrict or ban smoking in public and/or work places, restaurants, bars and nightclubs. Some public health groups have called for, and some countries, regional governments and municipalities have adopted or proposed, bans on smoking in outdoor places, as well as bans on smoking in cars (typically, when minors are present) and private homes.
Other Regulatory Issues: Some regulators are considering, or in some cases have adopted, regulatory measures designed to reduce the supply of tobacco products. These include regulations intended to reduce the number of retailers selling tobacco products by, for example, reducing the overall number of tobacco retail licenses available or banning the sale of tobacco products within specified distances of certain public facilities.
In a limited number of markets, most notably Japan, we are dependent on governmental approvals that may limit our pricing flexibility.
The EU Single-Use Plastics Directive, which will require tobacco manufacturers and importers to cover the costs of public collection systems for tobacco product filters, entered into force on July 2, 2019, after which Member States will have two years to transpose it into national law. While we cannot predict the impact of this initiative on our business at this time, we are monitoring developments in this area.
Illicit Trade: The illicit tobacco trade creates a cheap and unregulated supply of tobacco products, undermines efforts to reduce smoking prevalence, especially among youth, damages legitimate businesses, stimulates organized crime, increases corruption and reduces government tax revenue. Illicit trade may account for as much as 10% of global cigarette consumption; this includes counterfeit, contraband and the growing problem of “illicit whites,” which are cigarettes legally produced in one jurisdiction for the sole purpose of being exported and illegally sold in another jurisdiction where they have no legitimate market. We estimate that illicit trade in the European Union accounted for approximately 10% of total cigarette consumption in 2018.
A number of jurisdictions are considering actions to prevent illicit trade. In November 2012, the FCTC adopted the Protocol to Eliminate Illicit Trade in Tobacco Products (the “Protocol”), which includes supply chain control measures, such as licensing of manufacturers and distributors, enforcement in free trade zones, controls on duty free and Internet sales and the implementation of tracking and tracing technologies. To date, 56 Parties, including the European Union, have ratified it. The Protocol came into force in September 2018. Parties must now start implementing its measures via national legislation. In October 2018, the first Meeting of the Parties to the Protocol decided to produce a comprehensive report on good practices for the implementation of tracking and tracing systems and to prepare a conceptual framework for global information sharing to combat illicit tobacco trade. We welcome this decision and expect that other Parties will ratify the Protocol.
We devote substantial resources to help prevent illicit trade in combustible tobacco products and RRPs. For example, we engage with governments, our business partners and other stakeholders to implement effective measures to combat illicit trade and, in some instances, pursue legal remedies to protect our intellectual property rights.
The tracking and tracing regulations for cigarettes and roll-your-own products manufactured or destined for the EU became effective on May 20, 2019. The effective date for other tobacco-containing products, including some of our RRPs such as heated tobacco units, is May 20, 2024. While we expect that this regulation will increase our operating expenses, we do not expect this increase to be significant.
In 2009, our Colombian subsidiaries entered into an Investment and Cooperation Agreement with the national and regional governments of Colombia to promote investment in, and cooperation on, anti-contraband and anti-counterfeit efforts. The agreement provides $200 million in funding over a 20-year period to address issues such as combating the illegal cigarette trade and increasing the quality and quantity of locally-grown tobacco.
In May 2016, PMI launched PMI IMPACT, a global initiative that supports third-party projects dedicated to fighting illegal trade and related crimes such as corruption, organized criminal networks and money laundering. The centerpiece of PMI IMPACT is a council of external independent experts in the fields of law, anti-corruption and law enforcement. The experts are responsible for evaluating and approving funding proposals for PMI IMPACT grants. PMI has pledged $100 million to fund projects within PMI IMPACT over three funding rounds.
Reduced-Risk Products (RRPs)
Our Approach to RRPs: We recognize that smoking cigarettes causes serious diseases and that the best way to avoid the harms of smoking is never to start or to quit. Nevertheless, it is predicted that over the next decade the number of smokers will remain largely unchanged from the current estimate of 1.1 billion, despite the considerable efforts to discourage smoking.
Cigarettes burn tobacco, which produces smoke. As a result of the combustion process, the smoker inhales various toxic substances. In contrast, RRPs do not burn tobacco and produce an aerosol that contains significantly lower levels of harmful and potentially harmful constituents ("HPHCs") than found in cigarette smoke.
For smokers who would otherwise continue to smoke, we believe that RRPs, while not risk-free, offer a much better consumer choice. Accordingly, our key strategic priorities are: to develop and commercialize products that present less risk of harm to adult smokers who switch to those products versus continued smoking; and to convince current adult smokers who would otherwise continue to smoke to switch to those products.
We recognize that this transformation from cigarettes to RRPs will take time and that the speed of transformation will depend in part upon factors beyond our control, such as the willingness of governments, regulators and other policy groups to embrace RRPs as a desired alternative to continued cigarette smoking. We also recognize that our part in this transformation must be funded from our existing cigarette business. For as long as a significant number of adult smokers continues to smoke, it is critical that the industry be led by responsible and ethical manufacturers. Therefore, during the transformation, we intend to remain a leading international cigarette manufacturer.
We have a range of RRPs in various stages of development, scientific assessment and commercialization. We conduct rigorous scientific assessments of our RRP platforms to substantiate that they reduce exposure to HPHCs and, ultimately, that these products present, are likely to present, or have the potential to present less risk of harm to adult smokers who switch to them versus continued smoking. We draw upon a team of expert scientists and engineers from a broad spectrum of scientific disciplines and our extensive learnings of adult consumer preferences to develop and assess our RRPs. Our efforts are guided by the following key objectives:
| |
• | to develop RRPs that adult smokers who would otherwise continue to smoke find to be satisfying alternatives to smoking; |
| |
• | for those adult smokers, our goal is to offer RRPs with a scientifically substantiated risk-reduction profile that approaches as closely as possible that associated with smoking cessation; |
| |
• | to substantiate the reduction of risk for the individual adult smoker and the reduction of harm to the population as a whole, based on scientific evidence of the highest standard that is made available for scrutiny and review by external independent scientists and relevant regulatory bodies; and |
| |
• | to advocate for the development of science-based regulatory frameworks for the development and commercialization of RRPs, including the communication of scientifically substantiated information to enable adult smokers to make better consumer choices. |
Our RRP Platforms: Our product development is based on the elimination of combustion via tobacco heating and other innovative systems for aerosol generation, which we believe is the most promising path to providing a better consumer choice for those who would otherwise continue to smoke. We recognize that no single product will appeal to all adult smokers. Therefore, we are developing a portfolio of products intended to appeal to a variety of distinct adult consumer preferences.
Four RRP platforms are in various stages of development and commercialization readiness:
Platform 1 uses a precisely controlled heating device incorporating our IQOS HeatControl technology, into which a specially designed and proprietary tobacco unit is inserted and heated to generate an aerosol. We have conducted a series of clinical studies for this platform, the results of which were included in our submission to the U.S. Food and Drug Administration (“FDA”) described below. The results of the first six-month term of the 6+6 month exposure response study were received at the end of 2017, and the related report was completed and submitted to the FDA in the second quarter of 2018. The study showed that all eight of the co-primary clinical risk endpoints moved in the same direction in the group that switched to our Platform 1 product as observed for smoking cessation, with statistically significant changes in five of the eight endpoints compared with on-going smoking. The results of the second six-month term of the 6+6 month exposure response study were received for analysis in the second quarter of 2018; we are analyzing the results and preparing a report. In addition, as set out in our submission to the FDA referenced above, we completed an 18-month combined chronic toxicity and carcinogenicity study in mice, which was on-going at the time of our FDA submission. We shared the results with the FDA in August 2018.
Platform 2 uses a pressed carbon heat source which, when ignited, generates a nicotine-containing aerosol by heating tobacco. The results of our pharmacokinetic study (that measured the nicotine pharmacokinetic profile as well as subjective effects) and of our five-day reduced exposure study indicate that this platform could be an acceptable substitute for adult smokers who seek an alternative to cigarettes. The reduced exposure study results showed a substantial reduction in relevant biomarkers of exposure to the measured HPHCs in those who switched to Platform 2 compared to those who continued to smoke cigarettes over a five-day period. The sustainability of this reduction as well as changes in clinical risk markers were assessed in a three-month reduced exposure study. The results of this study were received at the end of 2017, and the related report was finalized in the second quarter of 2018.
Platform 3 provides an aerosol of nicotine salt. We have explored two routes for this platform, one with electronics and one without, and conducted nicotine pharmacokinetic studies with both versions. The results of the pharmacokinetic study related to the version without electronics were received, and the related report was finalized in the fourth quarter of 2018. The results indicate this product's potential as an acceptable alternative to continued cigarette smoking in terms of product satisfaction. We are conducting a product use and adaptation study in adult smokers and expect the results in 2020.
Platform 4 covers e-vapor products, which are battery-powered devices that produce an aerosol by vaporizing a nicotine-containing liquid solution. Our e-vapor products comprise devices using current generation technology and our new e-vapor mesh technology that addresses certain challenges presented by some e-vapor products currently on the market. Our IQOS MESH products are designed to ensure the consistency and quality of the generated aerosol. We conducted a nicotine pharmacokinetic study in 2017. The results of this study were received in the second quarter of 2018 for analysis, and the related report was finalized in the fourth quarter of 2018. The results of this study indicate that IQOS MESH products are an effective means of nicotine delivery while being a satisfying alternative for e-cigarette users. In March 2019, a 6-month pre-clinical study in mice evaluating the impact of e-cigarette vapor on the risks of pulmonary and cardiovascular disease compared to cigarette smoke was completed; this study did not pertain to a specific product. The study demonstrated that e-cigarette vapors induce significantly lower biological responses associated with cardiovascular and pulmonary diseases compared with cigarette smoke. We will also initiate a clinical study to measure selected biomarkers of exposure to HPHCs and assess changes in clinical risk markers.
After we receive the results of our scientific studies mentioned above, in accordance with standard scientific practices, we intend to share the conclusions in scientific forums and to submit them for inclusion in peer-reviewed publications.
Commercialization of RRPs: We are building a new product category and tailor our commercialization strategy to the characteristics of each specific market. We focus our commercialization efforts on consumer retail experience, guided consumer trials and customer care, as well as digital communication programs. In order to accelerate switching to our Platform 1 product, our initial market introductions typically entail one-on-one consumer engagement and introductory device discounts. These initial commercialization efforts require substantial investment, which we believe will moderate over time.
In 2014, we introduced our Platform 1 product in pilot city launches in Nagoya, Japan, and in Milan, Italy. Since then, we have continuously expanded our commercialization activities, and the product is currently available for sale in 51 markets in key cities or nationwide.
We estimate that only a very small percentage of adult smokers who convert to our Platform 1 product switch back to cigarettes.
We have integrated the production of our heated tobacco units into a number of our existing manufacturing facilities, are progressing with our plans to build manufacturing capacity for our other RRP platforms, and continue to optimize our manufacturing infrastructure.
An adequate supply chain for our RRP portfolio, including the supply of electronic devices, is important to our business. We work with two electronics manufacturing service providers for the supply of our Platform 1 and IQOS MESH devices and a small number of other providers for other products in our RRP portfolio and related accessories. Although we work closely with these service providers on monitoring their production capability and financial health, the commercialization of our RRPs could be adversely affected if they are unable to meet their commitments. The production of our RRP portfolio requires various metals, and we believe that there is an adequate supply of such metals in the world markets to satisfy our current and anticipated production requirements. However, some components and materials necessary for the production of our RRPs, including those for the electronic devices, are obtained from single or limited sources, and can be subject to industry-wide shortages and price fluctuations. Our inability to secure an adequate supply of such components and materials could negatively impact the commercialization of our RRPs.
Our Platform 1 and IQOS MESH devices are subject to standard product warranties generally for a period of 12 months from the date of purchase or such other periods as required by law. We discuss product warranties in more detail in Note 16. Product
Warranty. The significance of warranty claims is dependent on a number of factors, including warranty policies and product failure rates and may increase with the number of devices sold.
Product quality may affect consumer acceptance of our RRPs.
Our commercialization efforts for the other RRP platforms are as follows:
| |
• | We currently market our e-vapor products in Ireland and the U.K. In July 2018, we pilot-launched IQOS MESH, one of our Platform 4 products, in London, U.K. We plan to start commercializing an improved version of this product within the next few months. |
| |
• | We completed a small-scale city test of TEEPS, our Platform 2 product, that we had initiated in December 2017 in Santo Domingo, the Dominican Republic, and are working on improving this product and incorporating our learnings into our future plans. |
| |
• | Depending on the outcome of the use and adaptation study described above, we plan to conduct a consumer test of our Platform 3 product. |
RRP Regulation and Taxation: RRPs contain nicotine and are not risk-free. We therefore support science-based regulation and taxation of RRPs. Regulation and taxation should differentiate between cigarettes and products that present, are likely to present, or have the potential to present less risk of harm to adult smokers who switch to these products versus continued smoking and should recognize a continuum of risk for tobacco and other nicotine-containing products. Regulation should provide minimum standards for all RRP categories and specific rules for product assessment methodologies, ingredients, labelling and consumer communication, and should ensure that the public is informed about the health risks of all combustible and non-combustible tobacco and nicotine-containing products. Regulation, as well as industry practices, should reflect the fact that youth should not consume nicotine in any form.
Some governments have banned or are seeking to ban or severely restrict emerging tobacco and nicotine-containing products such as our RRPs and communication of truthful and non-misleading information about such products. These regulations might foreclose or unreasonably restrict adult consumer access even to products that might be shown to be a better consumer choice than continuing to smoke. We oppose such blanket bans and unreasonable restrictions of products that have the potential to present less risk of harm compared to continued smoking. By contrast, we support regulation that sets clear standards for all RRP categories and propels innovation to benefit adult smokers who would otherwise continue to smoke.
In the United States, an established regulatory framework for assessing “Modified Risk Tobacco Products” and “New Tobacco Products” exists under the jurisdiction of the FDA. We submitted to the FDA a Modified Risk Tobacco Product Application (“MRTPA”) for our Platform 1 product in December 2016, and a Premarket Tobacco Product Application (“PMTA”) for our Platform 1 product in March 2017.
On April 30, 2019, the FDA determined that a version of our Platform 1 product is appropriate for the protection of public health and authorized it for sale in the United States. The FDA’s decision followed its comprehensive assessment of our PMTA.
The FDA’s marketing order does not mean that the agency “approved” our Platform 1 product. The authorization is subject to strict marketing, reporting and other requirements and is not a guarantee that the product will remain authorized, particularly if there is a significant uptake in youth initiation. The FDA will monitor the marketing of the product.
In May 2017, the FDA formally accepted and filed our MRTPA for substantive scientific review and, in June 2017, the FDA opened the period for the public to provide comments on our application. The FDA closed the public comment period on February 11, 2019. The FDA referred our MRTPA to the Tobacco Product Scientific Advisory Committee (“TPSAC”). TPSAC held a meeting on January 24 and January 25, 2018 to discuss our MRTPA. The recommendations and votes of TPSAC are not binding on the FDA. By regulation, the FDA’s decision on our MRTPA will take into account, in addition to the views of TPSAC, scientific evidence as well as comments, data and information submitted by interested persons. The FDA review of our MRTPA is on-going.
Separately, in July 2017, the FDA issued a policy announcement aiming to explore the potential of nicotine reduction in cigarettes in conjunction with the availability of less harmful products that deliver nicotine for adults who choose to use such products. In July 2018, as part of a public consultation procedure, we submitted our views on this topic to the FDA.
In the U.S., tobacco and nicotine-containing products that were not commercially marketed as of February 15, 2007 are subject to review and authorization by the FDA. Following a rise in the use of e-vapor products among minors in the U.S. and an outbreak of lung injuries alleged to be associated with e-vapor products in many states, the FDA is expected to take action regarding e-vapor products. Such action would not impact our Platform 1 product, which is not an e-vapor product and is the only heat-not-burn product with a Premarket Tobacco Authorization in the U.S. by the FDA.
While we do not sell e-vapor products in the U.S. and therefore are not subject to these actions, we continue to support regulation and industry practices that reflect the fact that youth should not consume nicotine in any form.
Future FDA actions may influence the regulatory approach of other governments.
Until recently, there were no countries with specific product standards for heat-not-burn products. Effective July 2017 and March 2018, respectively, Russia and Ukraine adopted standards that set minimum quality and safety requirements for the consumables and defined methods for demonstrating the absence of combustion, and the product standards in Kazakhstan that came into force in March 2019 also cover devices. In the UAE, a product standard on minimum quality and safety of electronic nicotine-containing products, including heat-not-burn products, was approved in March 2019. We expect and encourage other governments to consider similar product standards going forward.
In the EU, all EU Member States and Norway have transposed the EU Tobacco Products Directive, including the provisions on novel tobacco products, such as heated tobacco units, and e-cigarettes. Most of the EU Member States require a notification submitted six months before the intended placing on the market of a novel tobacco product, while some require pre-market authorizations for the introduction of such products. To date, we have filed a comprehensive dossier summarizing our scientific assessment of our Platform 1 product in 23 Member States.
In addition, in Italy, in April 2018, we submitted under recent legislation an application for HEETS, used with the IQOS device, requesting regulatory recognition of the reduction of toxic substances and potential risk reduction resulting from switching to this product compared to continued cigarette smoking. In January 2019, our application was not granted, primarily on the grounds of insufficient data and questions of methodology. Due to the constraints of the review process, we had been unable to supplement the application with all the data we subsequently filed with the FDA and to address methodological questions during the review. We plan to submit a new application where we will clarify the concerns raised by the decision and further strengthen our application by submitting additional evidence that became available since we submitted our first application, consistent with our FDA filing. We are confident that our evidence supports our application.
To date, several governmental agencies have published their scientific findings that analyze the harm-reduction potential of certain RRPs versus continuing smoking, including:
On December 12, 2017, at the request of the U.K. Department of Health and Public Health England, the U.K. Committee on Toxicity published its assessment of the risk of heat-not-burn products relative to cigarette smoking. This assessment included analysis of scientific data for two heat-not-burn products, one of which was our Platform 1 product. The assessment concluded that, while still harmful to health, compared with the known risks from cigarettes, heat-not-burn products are probably less harmful. Subsequently, on February 6, 2018, Public Health England published a report stating that the available evidence suggests that heat-not-burn products may be considerably less harmful than cigarettes and more harmful than e-cigarettes.
On May 5, 2018, the German Federal Institute for Risk Assessment (“BfR”) published a study on the Platform 1 aerosol relative to cigarette smoke using the Health Canada Intense Smoking Regimen. BfR found reductions in selected HPHCs in a range of 80-99%. This publication indicates that significant reductions in the levels of selected toxicants are likely to reduce toxicant exposure, which BfR stated might be regarded as a discrete benefit compared to combustible cigarettes.
On May 15, 2018, the Dutch National Institute for Public Health and Environment (“RIVM”) published a factsheet on novel tobacco products that heat rather than burn tobacco, focusing on our Platform 1 product. RIVM analyzed the aerosol generated by our Platform 1 product and concluded that the use of this product, while still harmful to health, is probably less harmful than continued smoking.
On June 7, 2018, the Korean Food and Drug Administration (“KFDA”) issued a statement on products that heat rather than burn tobacco. The KFDA tested three heat-not-burn products, one of which was our Platform 1 product. The KFDA confirmed that the levels of the nine HPHCs tested in the aerosol of these products were on average approximately 90% lower compared to those measured in the cigarette smoke of the top five cigarette brands in South Korea. However, the KFDA stated that it could not
establish that the tested heat-not-burn products are less harmful than cigarettes. In October 2018, our Korean affiliate filed a request with a local court seeking information underlying KFDA’s analysis, conclusions and public statements.
On August 17, 2018, the Science & Technology Committee of the U.K. House of Commons published a report of its inquiry into e-cigarettes and heat-not-burn products. The report concluded that e-cigarettes are significantly less harmful to health than smoking tobacco. The report also observed that for those smokers who don’t accept e-cigarettes, heat-not-burn products may offer a public health benefit despite their relative risk. The report called for a risk-proportionate regulatory environment for both e-cigarettes and heat-not-burn products and noted that e-cigarettes should remain the least taxed, cigarettes the most taxed, with heat-not-burn products falling between the two. The U.K. Committee on Advertising Practice announced the removal of a prohibition of health claims in the advertising of e-cigarettes in the U.K. effective November 2018, with a review of the impact of this decision on market practices 12 months thereafter.
In November 2018, the Eurasian Economic Commission (regulatory body of the Eurasian Union consisting of Armenia, Belarus, Kazakhstan, Kyrgyzstan and Russia) published the results of its commissioned study on novel nicotine-containing products, including our Platform 1 product. The study confirms significantly lower levels of HPHCs in the aerosol generated by this product compared to cigarette smoke.
In January 2019, scientific media published the results of the study of the China National Tobacco Quality Supervision and Test Centre (“CNTQST”) comparing the aerosol generated by our Platform 1 product with cigarette smoke. The CNTQST found that the former contained fewer, and lower levels of, harmful constituents than the latter and concluded that the lower temperature of heating tobacco in our Platform 1 product contributed to the difference. The CNTQST stated that the reduction in emissions of harmful constituents cannot be interpreted as equivalent to a proportionate harm/risk reduction for smokers.
We make our scientific findings publicly available for scrutiny and peer review through several channels, including our websites. From time to time, adult consumers, competitors, members of the scientific community, and others inquire into our scientific methodologies, challenge our scientific conclusions or request further study of certain aspects of our RRPs and their health effects. We are committed to a robust and open scientific debate but believe that such debate should be based on accurate and reliable scientific information. We seek to provide accurate and reliable scientific information about our RRPs; nonetheless, we may not be able to prevent third-party dissemination of false, misleading or unsubstantiated information about these products. The dissemination of scientifically unsubstantiated information or studies with a strong confirmation bias by third parties may cause confusion among adult smokers and affect their decision to switch to better alternatives to continued smoking, such as our RRPs.
To date, we have been largely successful in demonstrating to regulators that our heated tobacco units are not cigarettes due to the absence of combustion, and as such they are generally taxed either as a separate category or as other tobacco products, which typically yields more favorable tax rates than cigarettes. Although we believe that this is sensible from the public health perspective, we cannot guarantee that regulators will continue this approach.
There can be no assurance that we will succeed in our efforts to replace cigarettes with RRPs or that regulation will allow us to commercialize RRPs in all markets, to communicate about our RRPs, including making scientifically substantiated risk-reduction claims, or to treat RRPs differently from cigarettes.
Legal Challenges to RRPs: We face various administrative and legal challenges related to certain RRP activities, including allegations concerning product classification, advertising restrictions, corporate communications, product coach activities, scientific substantiation, product liability, and unfair competition. While we design our programs to comply with relevant regulations, we expect these or similar challenges to continue as we expand our efforts to commercialize RRPs and to communicate publicly. The outcomes of these matters may affect our RRP commercialization and public communication activities and performance in one or more countries.
Our RRP Business Development Initiatives: In December 2013, we established a strategic framework with Altria Group, Inc. (“Altria”) setting out terms on how the parties would collaborate to develop and commercialize e-vapor products and commercialize two of our RRPs in the U.S. In late 2018, Altria announced that it will participate in the e-vapor category only through another e-vapor company in which Altria acquired a minority interest. Regarding heat-not-burn products, as discussed above, the FDA has authorized a version of our Platform 1 product for sale in the U.S., and we are seeking authorization for our MRTP submission. These efforts are not affected by Altria's e-vapor announcement. In September 2019, Altria's subsidiary, Philip Morris USA Inc., began commercialization of a version of our Platform 1 product in Atlanta, Georgia.
Other Developments: On September 12, 2017, we announced our support of the Foundation for a Smoke-Free World. We agreed to contribute $80 million per year over the next 12 years, as specified in the agreement. We made an initial contribution of $4.5
million in 2017, the first annual contribution of $80 million in the first quarter of 2018 and the second annual contribution of $80 million in the first quarter of 2019. The Foundation is an independent body and is governed by its independent Board of Directors. The Foundation’s role, as set out in its corporate charter, includes funding research in the field of tobacco harm reduction, encouraging measures that reduce the harm caused by smoking, and assessing the effect of reduced cigarette consumption on the industry value chain.
Governmental Investigations
From time to time, we are subject to governmental investigations on a range of matters, including tax, customs, antitrust, advertising, and labor practices. We describe certain matters pending in Thailand and South Korea in Note 8. Contingencies.
In November 2010, a WTO panel issued its decision in a dispute relating to facts that arose from August 2006 between the Philippines and Thailand concerning a series of Thai customs and tax measures affecting cigarettes imported by PM Thailand into Thailand (see Note 8. Contingencies for additional information). The WTO panel decision, which was upheld by the WTO Appellate Body, concluded that Thailand had no basis to find that PM Thailand's declared customs values and taxes paid were too low, as alleged by the DSI in 2009. The decision also created obligations for Thailand to revise its laws, regulations, or practices affecting the customs valuation and tax treatment of future cigarette imports. Thailand agreed in September 2011 to fully comply with the decision by October 2012. The Philippines asserts that to date Thailand has not fully complied with the WTO panel decision. The Philippines has repeatedly expressed concerns with ongoing investigations by Thailand of PM Thailand, including those that led to the criminal charges described in Note 8. Contingencies, and has commenced two formal proceedings at the WTO to challenge criminal charges against PM Thailand arguing that the criminal charges appear to be based on grounds not supported by WTO customs valuation rules and inconsistent with several decisions already taken by Thai Customs and other Thai governmental agencies. On November 12, 2018 and July 12, 2019, the WTO issued its decisions agreeing with the Philippines that the criminal charges against PM Thailand and its former and current employees in connection with import entries of cigarettes from the Philippines and Indonesia, respectively, described in Note 8. Contingencies, are inconsistent with WTO customs valuation rules. In January 2019 and September 2019, Thailand appealed the WTO's decision related to the criminal charges in connection with import entries of cigarettes from the Philippines and Indonesia, respectively.
U.S. GAAP Treatment of Argentina as a Highly Inflationary Economy
Following the categorization of Argentina by the International Practices Task Force of the Center for Audit Quality as a country with a three-year cumulative inflation rate greater than 100%, the country is considered highly inflationary in accordance with U.S. GAAP. Consequently, we began to account for the operations of our Argentinian affiliates as highly inflationary, and to treat the U.S. dollar as the functional currency of the affiliates, effective July 1, 2018.
Asset Impairment and Exit Costs
We discuss asset impairment and exit costs in Note 19. Asset Impairment and Exit Costs to our condensed consolidated financial statements.
In the second quarter of 2019, an affiliate of PMI, Philip Morris Manufacturing GmbH ("PMMG"), initiated consultations with employee representatives on a proposal to end cigarette production in its factory located in Berlin, Germany by January 1, 2020, and to seek to agree on fair solutions for any impacted employees. Until the consultation process is concluded, the closure of the Berlin facility is not considered probable (under U.S. GAAP), and the total potential costs associated with this contemplated proposal, which are expected to be significant, cannot be determined. As a result, no related costs were recorded in the third quarter of 2019. If the consultation process is successfully concluded, PMI would expect, at that time, to record charges, which would include employee severance costs, asset costs, including accelerated depreciation, and impairment and other closure related costs. The amount and timing of the income statement recognition of these amounts and the related cash flows will depend on a number of factors, including the timing of the completion of the consultation process as well as the negotiated elements of the associated social plan. We are progressing with our negotiations with employee representatives toward an agreement on the social plan and related matters.
Acquisitions and Other Business Arrangements
We discuss our acquisitions in Note 17. Acquisitions to our condensed consolidated financial statements.
On August 27, 2019, we announced that we were in discussions with Altria Group, Inc. regarding a potential all-stock, no premium merger of equals, and on September 25, 2019, we announced that the merger discussions had ended and that both companies agreed to focus on launching our Platform 1 product in the United States.
Investments in Unconsolidated Subsidiaries and Equity Securities
We discuss our investments in unconsolidated subsidiaries and equity securities in Note 11. Fair Value Measurements and Note 14. Investments in Unconsolidated Subsidiaries, Equity Securities and Other Related Parties to our condensed consolidated financial statements.
Trade Policy
We are subject to various trade restrictions imposed by the United States of America and countries in which we do business (“Trade Sanctions”), including the trade and economic sanctions administered by the U.S. Department of the Treasury's Office of Foreign Assets Control and the U.S. Department of State. It is our policy to comply fully with these Trade Sanctions.
Tobacco products are agricultural products under U.S. law and are not technological or strategic in nature. From time to time we make sales in countries subject to Trade Sanctions, either where such sanctions do not apply to our business or pursuant to exemptions or licenses.
A subsidiary sells products to distributors that, in turn, sell those products to duty free customers that supply U.N. peacekeeping forces around the world, including those in the U.N. peacekeeping mission located in Abyei, a special administrative territory in Sudan. We do not believe that these sales, which are not subject to Trade Sanctions, and are de minimis in volume and value, present a material risk to our shareholders, our reputation or the value of our shares. We have no employees, operations or assets in the Sudan.
To our knowledge, none of our commercial arrangements results in the governments of any country identified by the U.S. government as a state sponsor of terrorism, nor entities controlled by those governments, receiving cash or acting as intermediaries in violation of U.S. laws.
We do not sell products in Iran, North Korea and Syria. From time to time, we explore opportunities to sell our products in one or more of these countries, as permitted by law.
Certain states within the U.S. have enacted legislation permitting or requiring state pension funds to divest or abstain from future investment in stocks of companies that do business with certain countries that are sanctioned by the U.S. We do not believe such legislation has had a material effect on the price of our shares.
Operating Results – Three Months and Nine Months Ended September 30, 2019
The following discussion compares operating results within each of our reportable segments for the three months and nine months ended September 30, 2019, with the three months and nine months ended September 30, 2018.
Unless otherwise stated, references to total industry, total market, our shipment volume and our market share performance reflect cigarettes and heated tobacco units.
European Union:
|
| | | | | | | | | | | | | | | | | | | | | | | | | | | | |
Financial Summary -
Quarters Ended September 30, | | | | | Change
Fav./(Unfav.) | | Variance
Fav./(Unfav.) |
| 2019 | 2018 | | Total | Excl.
Curr. | | Total | Cur-
rency | Price | Vol/
Mix | Cost/
Other |
(in millions) | | | |
Net Revenues | | $ | 2,645 |
| $ | 2,467 |
| | 7.2 | % | 11.2 | % | | $ | 178 |
| $ | (98 | ) | $ | 54 |
| $ | 222 |
| $ | — |
|
Operating Income | | $ | 1,255 |
| $ | 1,179 |
| | 6.4 | % | 12.0 | % | | $ | 76 |
| $ | (66 | ) | $ | 54 |
| $ | 153 |
| $ | (65 | ) |
For the three months ended September 30, 2019, net revenues, excluding unfavorable currency, increased by 11.2%, reflecting a favorable pricing variance, driven principally by France, Germany and the United Kingdom, and favorable volume/mix, driven by favorable heated tobacco unit volume, notably in the Czech Republic, Germany, Italy and Poland, partly offset by unfavorable cigarette volume/mix, notably in Germany, Italy and the United Kingdom.
The net revenues of the European Union segment include $467 million in 2019 and $242 million in 2018 related to the sale of RRPs.
Operating income, excluding unfavorable currency, increased by 12.0%, mainly reflecting: a favorable pricing variance; favorable volume/mix, driven by heated tobacco unit volume, notably in the Czech Republic, Germany, Italy and Poland, partly offset by lower cigarette volume/mix, notably in Germany, Italy, Switzerland and the United Kingdom; and lower manufacturing costs; partly offset by higher marketing, administration and research costs, largely related to increased investments behind reduced-risk products.
|
| | | | | | | | | | | | | | | | | | | | | | | | | | | | |
Financial Summary -
Nine Months Ended September 30, | | | | | Change
Fav./(Unfav.) | | Variance
Fav./(Unfav.) |
| 2019 | 2018 | | Total | Excl.
Curr. | | Total | Cur-
rency | Price | Vol/
Mix | Cost/
Other |
(in millions) | | | |
Net Revenues | | $ | 7,381 |
| $ | 6,958 |
| | 6.1 | % | 12.6 | % | | $ | 423 |
| $ | (457 | ) | $ | 206 |
| $ | 674 |
| $ | — |
|
Operating Income | | $ | 3,346 |
| $ | 3,096 |
| | 8.1 | % | 16.5 | % | | $ | 250 |
| $ | (261 | ) | $ | 206 |
| $ | 518 |
| $ | (213 | ) |
For the nine months ended September 30, 2019, net revenues, excluding unfavorable currency, increased by 12.6%, reflecting a favorable pricing variance, driven principally by France, Germany and the United Kingdom, partly offset by Poland; and favorable volume/mix, primarily reflecting favorable heated tobacco unit volume/mix, notably in the Czech Republic, Germany, Italy and Poland, partly offset by lower cigarette volume, notably in France and Italy, and lower cigarette volume/mix in Germany.
The net revenues of the European Union segment include $1,242 million in 2019 and $577 million in 2018 related to the sale of RRPs.
Operating income, excluding unfavorable currency, increased by 16.5%, mainly reflecting: a favorable pricing variance; favorable volume/mix, notably in the Czech Republic, Germany, Italy and Poland, driven by heated tobacco unit volume, partially offset by lower cigarette volume/mix, reflecting the same drivers as for net revenues noted above; partially offset by higher manufacturing costs and higher marketing, administration and research costs notably related to increased investments behind reduced-risk products.
European Union - Total Market, PMI Shipment Volume and Market Share Commentaries
Total market, PMI shipment volume and market share performance are shown in the table below:
|
| | | | | | | | | | | | | | |
European Union Key Data | | Third-Quarter | | Nine Months Year-to-Date |
| | | | Change |
| | | | Change |
|
| | 2019 |
| 2018 |
| % / pp |
| | 2019 |
| 2018 |
| % / pp |
|
Total Market (billion units) | | 132.1 |
| 131.4 |
| 0.5 | % | | 363.8 |
| 365.2 |
| (0.4 | )% |
| | | | | | | | |
PMI Shipment Volume (million units) | | | | | | | | |
Cigarettes | | 47,238 |
| 48,223 |
| (2.0 | )% | | 133,093 |
| 135,878 |
| (2.0 | )% |
Heated Tobacco Units | | 3,474 |
| 1,730 |
| +100.0% |
| | 8,810 |
| 3,853 |
| +100.0% |
|
Total European Union | | 50,712 |
| 49,953 |
| 1.5 | % | | 141,903 |
| 139,731 |
| 1.6 | % |
| | | | | | | | |
PMI Market Share | | | | | | | | |
Marlboro | | 18.0 | % | 18.5 | % | (0.5 | ) | | 18.1 | % | 18.4 | % | (0.3 | ) |
L&M | | 6.7 | % | 7.0 | % | (0.3 | ) | | 6.7 | % | 6.9 | % | (0.2 | ) |
Chesterfield | | 5.8 | % | 5.9 | % | (0.1 | ) | | 5.8 | % | 5.9 | % | (0.1 | ) |
Philip Morris | | 2.7 | % | 2.9 | % | (0.2 | ) | | 2.7 | % | 3.0 | % | (0.3 | ) |
HEETS | | 2.5 | % | 1.2 | % | 1.3 |
| | 2.3 | % | 1.0 | % | 1.3 |
|
Others | | 3.0 | % | 3.0 | % | — |
| | 3.2 | % | 3.2 | % | — |
|
Total European Union | | 38.7 | % | 38.5 | % | 0.2 |
| | 38.8 | % | 38.4 | % | 0.4 |
|
In the third quarter, the estimated total market in the EU increased by 0.5% to 132.1 billion units, mainly driven by:
| |
• | Germany, up by 1.3%, primarily reflecting the impact of estimated trade inventory movements of competitors' products, partly offset by the impact of price increases in March 2019; and |
| |
• | Poland, up by 4.3%, primarily reflecting a lower prevalence of illicit trade; |
partly offset by
| |
• | France, down by 4.8%, mainly due to the impact of significant excise-tax driven price increases, and an increase in the prevalence of illicit trade. |
In the third quarter, our total shipment volume increased by 1.5% to 50.7 billion units, reflecting:
| |
• | higher heated tobacco unit shipment volume across the Region, notably Italy, driven by higher market share; |
partly offset by:
| |
• | lower cigarette shipment volume, mainly in France, due to the lower total market and lower cigarette market share, and Italy, partly reflecting out-switching to heated tobacco units. |
For the nine months year-to-date, the estimated total market in the EU decreased by 0.4% to 363.8 billion units, notably due to:
| |
• | France, down by 6.4%, primarily reflecting the impact of price increases in 2018 and the first quarter of 2019; |
| |
• | Germany, down by 1.9%, primarily reflecting the impact of price increases in 2018 and March 2019; and |
| |
• | Italy, down by 1.8%, primarily reflecting the impact of price increases in 2018 and the first quarter of 2019; |
partly offset by
| |
• | Poland, up by 6.7%, reflecting the same factor as in the quarter; and |
| |
• | Spain, up by 0.9%, partly reflecting a lower prevalence of illicit trade. |
For the nine months year-to-date, our total shipment volume increased by 1.6% to 141.9 billion units, reflecting:
| |
• | higher heated tobacco unit shipment volume across the Region, notably Italy, driven by higher market share; |
partly offset by
| |
• | lower cigarette shipment volume, mainly in France and Italy, reflecting the same factors as in the quarter, partly offset by Poland, mainly driven by the higher total market. |
Eastern Europe:
|
| | | | | | | | | | | | | | | | | | | | | | | | | | | | |
Financial Summary -
Quarters Ended September 30, | | | | | Change
Fav./(Unfav.) | | Variance
Fav./(Unfav.) |
| 2019 | 2018 | | Total | Excl.
Curr. | | Total | Cur-
rency | Price | Vol/
Mix | Cost/
Other |
(in millions) | | | |
Net Revenues | | $ | 899 |
| $ | 778 |
| | 15.6 | % | 16.5 | % | | $ | 121 |
| $ | (7 | ) | $ | (3 | ) | $ | 131 |
| $ | — |
|
Operating Income (Loss) | | $ | (101 | ) | $ | 270 |
| | -(100)% |
| -(100)% |
| | $ | (371 | ) | $ | 25 |
| $ | (3 | ) | $ | 32 |
| $ | (425 | ) |
For the three months ended September 30, 2019, net revenues, excluding unfavorable currency, increased by 16.5%, reflecting favorable volume/mix, predominantly driven by heated tobacco unit volume in Kazakhstan and Ukraine, and heated tobacco unit and IQOS device volume in Russia, partly offset by lower cigarette volume/mix, mainly due to Russia and Ukraine.
The net revenues of the Eastern Europe segment include $235 million in 2019 and $73 million in 2018 related to the sale of RRPs.
Operating income decreased by over 100%. Excluding the unfavorable impact of $374 million related to the Russia excise and VAT audit charge, and favorable currency of $25 million, operating income decreased by 8.1%, mainly due to higher marketing, administration and research costs, notably reflecting increased investments behind reduced-risk products, primarily in Russia in support of geographic expansion, partly offset by favorable volume/mix, predominantly driven by heated tobacco unit volume in Russia, partly offset by lower cigarette volume/mix in Russia.
|
| | | | | | | | | | | | | | | | | | | | | | | | | | | | |
Financial Summary -
Nine Months Ended September 30, | | | | | Change
Fav./(Unfav.) | | Variance
Fav./(Unfav.) |
| 2019 | 2018 | | Total | Excl.
Curr. | | Total | Cur-
rency | Price | Vol/
Mix | Cost/
Other |
(in millions) | | | |
Net Revenues | | $ | 2,300 |
| $ | 2,105 |
| | 9.3 | % | 15.8 | % | | $ | 195 |
| $ | (137 | ) | $ | 50 |
| $ | 282 |
| $ | — |
|
Operating Income | | $ | 284 |
| $ | 682 |
| | (58.4 | )% | (56.9 | )% | | $ | (398 | ) | $ | (10 | ) | $ | 50 |
| $ | 73 |
| $ | (511 | ) |
For the nine months ended September 30, 2019, net revenues, excluding unfavorable currency, increased by 15.8%, reflecting a favorable pricing variance, driven notably by Ukraine, and favorable volume/mix, predominantly driven by heated tobacco unit and IQOS device volume in Russia and Ukraine, partly offset by lower cigarette volume/mix in Russia.
The net revenues of the Eastern Europe segment include $526 million in 2019 and $179 million in 2018 related to the sale of RRPs.
Operating income decreased by 58.4%. Excluding the unfavorable impact of $374 million related to the Russia excise and VAT audit charge, and unfavorable currency of $10 million, operating income decreased by 2.1%, due to: higher manufacturing costs and higher marketing, administration and research costs, notably reflecting increased investments behind reduced-risk products, primarily in Russia in support of geographic expansion; partly offset by a favorable pricing variance and favorable volume/mix, predominantly driven by heated tobacco unit volume in Russia and Ukraine, partly offset by lower cigarette volume/mix in Russia.
Eastern Europe - Total Market, PMI Shipment Volume and Market Share Commentaries
In the third quarter, the estimated total market in Eastern Europe decreased, notably due to:
| |
• | Russia, down by 5.9%, primarily reflecting the impact of price increases, as well as an increase in the prevalence of illicit trade; and |
| |
• | Ukraine, down by 14.5%, primarily reflecting the impact of excise tax-driven price increases, as well as an increase in the prevalence of illicit trade; |
partly offset by
| |
• | Kazakhstan, up by 4.6%, partly reflecting a lower prevalence of illicit trade. |
For the nine months year-to-date, the estimated total market in Eastern Europe decreased, notably due to:
| |
• | Russia, down by 5.3%, reflecting the same factors as in the quarter; and |
| |
• | Ukraine, down by 13.4%, reflecting the same factors as in the quarter; |
partly offset by
| |
• | Kazakhstan, up by 5.2%, reflecting the same factor as in the quarter. |
|
| | | | | | | | | | | | | |
PMI Shipment Volume (million units) | Third-Quarter | | Nine Months Year-to-Date |
| 2019 |
| 2018 |
| Change |
| | 2019 |
| 2018 |
| Change |
|
Cigarettes | 27,379 |
| 29,801 |
| (8.1 | )% | | 74,779 |
| 80,294 |
| (6.9 | )% |
Heated Tobacco Units | 3,858 |
| 1,152 |
| +100.0% |
| | 8,213 |
| 2,667 |
| +100.0% |
|
Total Eastern Europe | 31,237 |
| 30,953 |
| 0.9 | % | | 82,992 |
| 82,961 |
| — | % |
In the third quarter, our total shipment volume increased by 0.9% to 31.2 billion units, driven by:
| |
• | Kazakhstan, up by 7.9%, mainly reflecting a higher total market and a higher market share of heated tobacco units; and |
| |
• | Russia, up by 2.8%, mainly reflecting a higher market share of heated tobacco units, partially offset by the lower total market; |
partly offset by
| |
• | Ukraine, down by 6.3%, reflecting a lower total market, partly offset by higher market share of heated tobacco units. |
For the nine months year-to-date, our total shipment volume was flat at 83.0 billion units, notably reflecting:
| |
• | Kazakhstan, up by 10.5%, reflecting a higher total market and a higher market share of heated tobacco units; and |
| |
• | Russia, up by 0.1%, mainly reflecting a higher market share of heated tobacco units, partially offset by the lower total market; |
offset by
| |
• | Ukraine, down by 3.2%, reflecting a lower total market, partly offset by a higher market share, notably of heated tobacco units. |
Middle East & Africa:
|
| | | | | | | | | | | | | | | | | | | | | | | | | | | | |
Financial Summary -
Quarters Ended September 30, | | | | | Change
Fav./(Unfav.) | | Variance
Fav./(Unfav.) |
| 2019 | 2018 | | Total | Excl.
Curr. | | Total | Cur-
rency | Price | Vol/
Mix | Cost/
Other |
(in millions) | | | |
Net Revenues | | $ | 1,127 |
| $ | 1,143 |
| | (1.4 | )% | — | % | | $ | (16 | ) | $ | (16 | ) | $ | 89 |
| $ | (70 | ) | $ | (19 | ) |
Operating Income | | $ | 519 |
| $ | 491 |
| | 5.7 | % | 4.9 | % | | $ | 28 |
| $ | 4 |
| $ | 89 |
| $ | (69 | ) | $ | 4 |
|
For the three months ended September 30, 2019, net revenues, excluding unfavorable currency, were flat, reflecting a favorable pricing variance, driven predominantly by Turkey, offset by: unfavorable volume/mix, notably due to unfavorable heated tobacco unit volume in PMI Duty Free, and unfavorable cigarette volume in the GCC, primarily Saudi Arabia, and Turkey, partly offset by favorable cigarette volume in Egypt; and an unfavorable cost/other variance mainly driven by the timing of other revenues.
The net revenues of the Middle East & Africa segment include $63 million in 2019 and $124 million in 2018 related to the sale of RRPs.
Operating income, excluding favorable currency, increased by 4.9%, mainly reflecting a favorable pricing variance and lower manufacturing costs, partly offset by unfavorable volume/mix, reflecting the same drivers as for net revenues noted above, and the timing of other revenues.
|
| | | | | | | | | | | | | | | | | | | | | | | | | | | | |
Financial Summary -
Nine Months Ended September 30, | | | | | Change
Fav./(Unfav.) | | Variance
Fav./(Unfav.) |
| 2019 | 2018 | | Total | Excl.
Curr. | | Total | Cur-
rency | Price | Vol/
Mix | Cost/
Other |
(in millions) | | | |
Net Revenues | | $ | 3,058 |
| $ | 3,126 |
| | (2.2 | )% | 3.4 | % | | $ | (68 | ) | $ | (174 | ) | $ | 154 |
| $ | (45 | ) | $ | (3 | ) |
Operating Income | | $ | 1,304 |
| $ | 1,268 |
| | 2.8 | % | 8.2 | % | | $ | 36 |
| $ | (68 | ) | $ | 154 |
| $ | (81 | ) | $ | 31 |
|
For the nine months ended September 30, 2019, net revenues, excluding unfavorable currency, increased by 3.4%, mainly reflecting: a favorable pricing variance, primarily driven by Egypt, Kuwait, PMI Duty Free and Turkey, partly offset by Saudi Arabia; partly offset by unfavorable volume/mix, predominantly due to unfavorable cigarette and heated tobacco unit volume in PMI Duty Free, partly offset by Egypt and Saudi Arabia.
The net revenues of the Middle East & Africa segment include $248 million in 2019 and $313 million in 2018 related to the sale of RRPs.
Operating income, excluding unfavorable currency, increased by 8.2%, mainly reflecting a favorable pricing variance and lower manufacturing costs, partly offset by unfavorable volume/mix, notably due to unfavorable cigarette and heated tobacco unit volume in PMI Duty Free, partly offset by cigarette mix in Saudi Arabia.
Middle East & Africa - Total Market, PMI Shipment Volume and Market Share Commentaries
In the third quarter, the estimated total market in the Middle East & Africa increased, notably driven by:
| |
• | Algeria, up by 7.5%, partly reflecting the impact of estimated trade inventory movements; |
| |
• | Egypt, up by 10.1%, mainly due to the timing of estimated trade inventory movements in the third quarter of 2019 related to anticipated price increases compared to estimated unfavorable trade inventory movements in the third quarter of 2018 following the July 2018 health tax increase; and |
| |
• | Saudi Arabia, up by 4.1%, primarily reflecting a recovery of the total market following the introduction of the new excise tax in June 2017 and VAT in January 2018, respectively; |
partly offset by
| |
• | Duty Free, down by 5.6%, mainly reflecting lower purchases by travelers to China. |
For the nine months year-to-date, the estimated total market in the Middle East & Africa increased, notably driven by:
| |
• | Algeria, up by 5.9%, partly reflecting the timing of estimated trade inventory movements in 2019 compared to 2018; |
| |
• | Egypt, up by 1.8%, mainly reflecting the same factor as in the quarter; |
| |
• | Saudi Arabia, up by 6.3%, primarily reflecting a favorable comparison with the first nine months of 2018, which was down by 24.5%, mainly due to the impact of retail price increases in 2017, the first quarter of 2018 following the introduction of the new excise tax in June 2017 and VAT in January 2018; and |
| |
• | Turkey, up by 8.2%, notably reflecting a lower prevalence of illicit trade; |
partly offset by
| |
• | Duty Free, down by 5.4%, mainly reflecting lower purchases by travelers to China. |
|
| | | | | | | | | | | | | |
PMI Shipment Volume (million units) | Third-Quarter | | Nine Months Year-to-Date |
| 2019 |
| 2018 |
| Change |
| | 2019 |
| 2018 |
| Change |
|
Cigarettes | 36,994 |
| 37,406 |
| (1.1 | )% | | 101,957 |
| 100,831 |
| 1.1 | % |
Heated Tobacco Units | 588 |
| 1,152 |
| (49.0 | )% | | 2,061 |
| 2,832 |
| (27.2 | )% |
Total Middle East & Africa | 37,582 |
| 38,558 |
| (2.5 | )% | | 104,018 |
| 103,663 |
| 0.3 | % |
In the third quarter, our total shipment volume decreased by 2.5% to 37.6 billion units, notably due to:
| |
• | PMI Duty Free, down by 11.1%. Excluding the net unfavorable impact of estimated distributor inventory movements, primarily of heated tobacco units, PMI's in market sales declined by 8.0%, primarily reflecting the lower total market; |
| |
• | Saudi Arabia, down by 21.1%. Net unfavorable estimated distributor inventory movements totaled 0.6 billion cigarettes, mainly attributable to the pay-back of adjustments in the first half of 2019 resulting from the delayed importation deadline before the implementation of plain packaging scheduled for January 1, 2020. Excluding the impact of these inventory movements, PMI's in-market sales grew by 1.9%; and |
| |
• | Turkey, down by 10.7%, mainly reflecting lower market share, primarily driven by the timing of retail price increases in April 2019 compared to competition, as well as the impact of price increases in August 2019; |
partly offset by
| |
• | Egypt, up by 22.6%, primarily reflecting higher market share, driven by L&M, as well as a higher total market. |
For the nine months year-to-date, our total shipment volume increased by 0.3% to 104.0 billion units, notably in:
| |
• | Egypt, up by 14.6%, mainly reflecting the same factors as in the quarter; and |
| |
• | Saudi Arabia, up by 26.1%. Net favorable estimated distributor inventory movements totaled 1.1 billion cigarettes, mainly attributable to the timing of shipments compared to 2018. Excluding the impact of these inventory movements, PMI's in-market sales grew by 4.6%, partly reflecting a higher total market; |
partly offset by
| |
• | PMI Duty Free, down by 10.6%. Excluding the net unfavorable impact of estimated distributor inventory movements of 0.8 billion units, PMI's in-market sales decline was 5.6%, mainly reflecting the same factor as in the quarter. |
South & Southeast Asia:
|
| | | | | | | | | | | | | | | | | | | | | | | | | | | | |
Financial Summary -
Quarters Ended September 30, | | | | | Change
Fav./(Unfav.) | | Variance
Fav./(Unfav.) |
| 2019 | 2018 | | Total | Excl.
Curr. | | Total | Cur-
rency | Price | Vol/
Mix | Cost/
Other |
(in millions) | | | |
Net Revenues | | $ | 1,246 |
| $ | 1,197 |
| | 4.1 | % | 2.8 | % | | $ | 49 |
| $ | 15 |
| $ | 123 |
| $ | (89 | ) | $ | — |
|
Operating Income | | $ | 539 |
| $ | 455 |
| | 18.5 | % | 14.3 | % | | $ | 84 |
| $ | 19 |
| $ | 123 |
| $ | (64 | ) | $ | 6 |
|
For the three months ended September 30, 2019, net revenues, excluding favorable currency, increased by 2.8%, predominantly reflecting a favorable pricing variance driven by Indonesia and the Philippines, partly offset by unfavorable volume/mix, mainly due to Indonesia and Pakistan, partly offset by the favorable mix in the Philippines.
Operating income, excluding favorable currency, increased by 14.3%, predominantly reflecting: a favorable pricing variance; lower manufacturing costs, mainly in the Philippines; partly offset by unfavorable volume/mix, mainly due to Indonesia and Pakistan, partly offset by favorable mix in the Philippines; and higher marketing, administration and research costs.
|
| | | | | | | | | | | | | | | | | | | | | | | | | | | | |
Financial Summary -
Nine Months Ended September 30, | | | | | Change
Fav./(Unfav.) | | Variance
Fav./(Unfav.) |
| 2019 | 2018 | | Total | Excl.
Curr. | | Total | Cur-
rency | Price | Vol/
Mix | Cost/
Other |
(in millions) | | | |
Net Revenues | | $ | 3,607 |
| $ | 3,434 |
| | 5.0 | % | 7.3 | % | | $ | 173 |
| $ | (78 | ) | $ | 313 |
| $ | (62 | ) | $ | — |
|
Operating Income | | $ | 1,471 |
| $ | 1,324 |
| | 11.1 | % | 13.0 | % | | $ | 147 |
| $ | (25 | ) | $ | 313 |
| $ | (41 | ) | $ | (100 | ) |
For the nine months ended September 30, 2019, net revenues, excluding unfavorable currency, increased by 7.3%, reflecting: a favorable pricing variance, driven principally by Indonesia and the Philippines, partly offset by unfavorable volume/mix, largely due to Indonesia, partly offset by the Philippines.
Operating income increased by 11.1%. Excluding asset impairment and exit costs of $20 million related to a plant closure in Pakistan in the first quarter of 2019 as part of our global manufacturing infrastructure optimization, and unfavorable currency of $25 million, operating income increased by 14.5%, mainly reflecting: a favorable pricing variance; partly offset by unfavorable volume/mix, mainly due to Indonesia, partly offset by the Philippines; and higher marketing, administration and research costs, partly due to the Philippines.
South & Southeast Asia - Total Market, PMI Shipment Volume and Market Share Commentaries
In the third quarter, the estimated total market in South & Southeast Asia decreased, notably due to:
| |
• | Indonesia, down by 1.6%, mainly due to estimated trade inventory movements; |
| |
• | Pakistan, down by 49.8%, mainly due to estimated trade inventory movements following those of the second quarter 2019 related to anticipated excise tax-driven price increases compared to the prior year. Excluding the impact of these inventory movements, the total market is estimated to have declined by 14.7%; and |
| |
• | the Philippines, down by 5.8%, mainly due to the impact of price increases in the below premium segment in the fourth quarter of 2018, as well as price increases in the third-quarter of 2019; |
partly offset by
| |
• | Thailand, up by 3.3%, primarily reflecting on-going recovery from the September 2017 excise tax reform. |
For the nine months year-to-date, the estimated total market in South & Southeast Asia decreased, notably due to:
| |
• | Pakistan, down by 9.8%, mainly reflecting the impact of excise tax-driven price increases; and |
| |
• | Vietnam, down by 4.4%, mainly reflecting the impact of excise tax-driven price increases; |
partly offset by
| |
• | Indonesia, up by 0.7%, reflecting the absence of an excise tax increase in 2019; and |
| |
• | Thailand, up by 12.9%, reflecting the same factor as in the quarter. |
|
| | | | | | | | | | | | | |
PMI Shipment Volume (million units) | Third-Quarter | | Nine Months Year-to-Date |
| 2019 |
| 2018 |
| Change |
| | 2019 |
| 2018 |
| Change |
|
Cigarettes | 42,362 |
| 45,840 |
| (7.6 | )% | | 130,230 |
| 130,846 |
| (0.5 | )% |
Heated Tobacco Units | — |
| — |
| — | % | | — |
| — |
| — | % |
Total South & Southeast Asia | 42,362 |
| 45,840 |
| (7.6 | )% | | 130,230 |
| 130,846 |
| (0.5 | )% |
In the third quarter, our total shipment volume decreased by 7.6% to 42.4 billion units, notably due to:
| |
• | Indonesia, down by 5.7%, mainly reflecting a lower market share, primarily due to widening price gaps between Sampoerna A and competitive brands following its price increase in October 2018, as well as a lower total market; |
| |
• | Pakistan, down by 54.1%, mainly reflecting a lower total market; and |
| |
• | the Philippines, down by 2.8%, mainly reflecting a lower total market, partly offset by higher market share, notably of Marlboro; |
partly offset by
| |
• | Thailand, up by 8.0%, mainly reflecting a higher market share driven by the continued strong performance of L&M 7.1 and the favorable impact of distribution expansion in 2018, as well as a higher total market. |
For the nine months year-to-date, our total shipment volume decreased by 0.5% to 130.2 billion units, notably due to:
| |
• | Indonesia, down by 3.2%, mainly reflecting a lower market share primarily due to the widened retail price gap of Sampoerna A to competitive brands following its price increase in October 2018, partly offset by a higher total market; and |
| |
• | Pakistan, down by 2.4%, mainly reflecting a lower total market, partly offset by a higher market share resulting from the timing of estimated trade inventory movements of competitors' brands; |
partly offset by
| |
• | the Philippines, up by 1.5%, mainly reflecting a higher market share, notably of Marlboro; and |
| |
• | Thailand, up by 20.2%, reflecting the same factors as in the quarter. |
East Asia & Australia:
|
| | | | | | | | | | | | | | | | | | | | | | | | |
Financial Summary -
Quarters Ended September 30, | | | | | Change
Fav./(Unfav.) | | Variance
Fav./(Unfav.) |
| 2019 | 2018 | | Total | Excl.
Curr. | | Total | Cur-
rency | Price | Vol/
Mix | Cost/
Other |
(in millions) | | | |
Net Revenues | | $ 1,252 | $ 1,166 | | 7.4 | % | 7.5 | % | | $ | 86 |
| $ | (1 | ) | $ | (21 | ) | $ | 108 |
| $ | — |
|
Operating Income | | $ 451 | $ 426 | | 5.9 | % | 3.1 | % | | $ | 25 |
| $ | 12 |
| $ | (21 | ) | $ | 64 |
| $ | (30 | ) |
For the three months ended September 30, 2019, net revenues, excluding unfavorable currency, increased by 7.5%, reflecting favorable volume/mix, mainly driven by heated tobacco units in Japan, reflecting the favorable comparison with the third quarter of 2018 in which distributor inventories were reduced, partly offset by unfavorable cigarette volume in Australia and Japan and unfavorable cigarette and heated tobacco unit and IQOS device volume in Korea. The favorable volume/mix was partly offset by an unfavorable pricing variance, mainly due to Japan (reflecting the price repositioning of IQOS devices and associated inventory revaluation).
The net revenues of the East Asia & Australia segment include $572 million in 2019 and $377 million in 2018 related to the sale of RRPs.
Operating income, excluding favorable currency, increased by 3.1%, mainly reflecting favorable volume/mix, mainly driven by favorable heated tobacco unit volume in Japan, partly offset by unfavorable cigarette volume in Australia and Japan, and unfavorable cigarette and heated tobacco unit volume in Korea. The favorable volume/mix was partly offset by an unfavorable pricing variance and higher marketing, administration and research costs, partly related to reduced-risk products in Japan, partly offset by lower manufacturing costs, mainly in Korea.
|
| | | | | | | | | | | | | | | | | | | | | | | | | | | | |
Financial Summary -
Nine Months Ended September 30, | | | | | Change
Fav./(Unfav.) | | Variance
Fav./(Unfav.) |
| 2019 | 2018 | | Total | Excl.
Curr. | | Total | Cur-
rency | Price | Vol/
Mix | Cost/
Other |
(in millions) | | | |
Net Revenues | | $ | 4,094 |
| $ | 4,235 |
| | (3.3 | )% | (2.7 | )% | | $ | (141 | ) | $ | (26 | ) | $ | 186 |
| $ | (301 | ) | $ | — |
|
Operating Income | | $ | 1,520 |
| $ | 1,439 |
| | 5.6 | % | 3.3 | % | | $ | 81 |
| $ | 33 |
| $ | 186 |
| $ | (190 | ) | $ | 52 |
|
For the nine months ended September 30, 2019, net revenues, excluding unfavorable currency, decreased by 2.7%, reflecting: unfavorable volume/mix, mainly due to lower cigarette shipment volume in Australia, Japan and Korea, lower IQOS device volume in Japan and lower heated tobacco unit volume and IQOS device sales in Korea, partly offset by higher heated tobacco unit volume in Japan. The unfavorable volume/mix was partly offset by a favorable pricing variance driven predominantly by Japan.
The net revenues of the East Asia & Australia segment include $2,020 million in 2019 and $1,887 million in 2018 related to the sale of RRPs.
Operating income, excluding favorable currency, increased by 3.3%, mainly reflecting: a favorable pricing variance and lower manufacturing costs related to Japan and Korea, partly offset by unfavorable volume/mix, reflecting the same drivers as for net revenues noted above, and higher marketing, administration and research costs, mainly related to reduced-risk products in Japan, partly offset by Australia and Korea.
East Asia & Australia - Total Market, PMI Shipment Volume and Market Share Commentaries
In the third quarter, the estimated total market in East Asia & Australia, excluding China, decreased, notably due to:
| |
• | Australia, down by 7.4%, or by 11.0% excluding the impact of estimated trade inventory movements, mainly reflecting the impact of excise tax-driven retail price increases; |
| |
• | Japan, down by 12.9%, or by 4.5% excluding the impact of estimated trade inventory movements, mainly reflecting the impact of the October 1, 2018 excise tax-driven retail price increases, as well as out-switching to the low-price cigarillo category; |
| |
• | Korea, down by 1.9%, reflecting the secular decline of the cigarette category, partly offset by the growth of the heat-not-burn category; and |
| |
• | Taiwan, down by 7.9%, continuing to reflect the impact of significant excise tax-driven retail price increases in June 2017, as well as an increase in the prevalence of illicit trade. |
For the nine months year-to-date, the estimated total market in East Asia & Australia, excluding China, decreased, notably due to:
| |
• | Australia, down by 4.3%, or by 9.6% excluding the impact of estimated trade inventory movements, mainly reflecting the same factor as in the quarter; |
| |
• | Japan, down by 7.7%, or by 4.5% excluding the impact of estimated trade inventory movements, mainly reflecting the same factor as in the quarter; |
| |
• | Korea, down by 1.4%, mainly reflecting the same factor as in the quarter; and |
| |
• | Taiwan, down by 5.2%, mainly reflecting the same factors as in the quarter. |
|
| | | | | | | | | | | | | |
PMI Shipment Volume (million units) | Third-Quarter | | Nine Months Year-to-Date |
| 2019 |
| 2018 |
| Change |
| | 2019 |
| 2018 |
| Change |
|
Cigarettes | 12,692 |
| 14,186 |
| (10.5 | )% | | 38,650 |
| 43,391 |
| (10.9 | )% |
Heated Tobacco Units | 7,976 |
| 4,575 |
| 74.3 | % | | 23,253 |
| 19,755 |
| 17.7 | % |
Total East Asia & Australia | 20,668 |
| 18,761 |
| 10.2 | % | | 61,903 |
| 63,146 |
| (2.0 | )% |
In the third quarter, our total shipment volume increased by 10.2% to 20.7 billion units, notably in:
| |
• | Japan, up by 24.5%. Excluding the net favorable impact of estimated distributor inventory movements of approximately 4.4 billion units, comprised of approximately 3.9 billion heated tobacco units and approximately 0.5 billion cigarettes, mainly reflecting a favorable comparison with the third quarter of 2018 in which IQOS consumable inventories in Japan were reduced, PMI's in-market sales decline was 11.2%, reflecting the lower total market, partly offset by higher heated tobacco unit market share; |
partly offset by
| |
• | Korea, down by 10.5%, principally due to lower market share, as well as a lower total market. |
For the nine months year-to-date, our total shipment volume decreased by 2.0% to 61.9 billion units, notably in:
| |
• | Korea, down by 10.0%, principally due to lower cigarette and heated tobacco unit market share, as well as a lower total market; |
partly offset by
| |
• | Japan, up by 1.4%. Excluding the net favorable impact of estimated distributor inventory movements of approximately 3.9 billion units, comprised of approximately 3.8 billion heated tobacco units and approximately 0.1 billion cigarettes, reflecting the same factor as in the quarter, PMI's in-market sales decline was 7.6%, primarily reflecting the lower total market. |
Latin America & Canada:
|
| | | | | | | | | | | | | | | | | | | | | | | | | | | | |
Financial Summary -
Quarters Ended September 30, | | | | | Change
Fav./(Unfav.) | | Variance
Fav./(Unfav.) |
| 2019 | 2018 | | Total | Excl.
Curr. | | Total | Cur-
rency | Price | Vol/
Mix | Cost/
Other(1) |
(in millions) | | | |
Net Revenues | | $ | 473 |
| $ | 753 |
| | (37.2 | )% | (36.1 | )% | | $ | (280 | ) | $ | (8 | ) | $ | 24 |
| $ | (39 | ) | $ | (257 | ) |
Operating Income | | $ | 125 |
| $ | 335 |
| | (62.7 | )% | (60.9 | )% | | $ | (210 | ) | $ | (6 | ) | $ | 24 |
| $ | (34 | ) | $ | (194 | ) |
(1) Unfavorable Cost/Other variance includes the impact of the RBH deconsolidation.
Note: Net Revenues include revenues from shipments of the Platform 1 device, heated tobacco units and accessories to Altria Group, Inc., commencing in the third quarter of 2019, for sale under license in the United States.
For the three months ended September 30, 2019, net revenues, excluding unfavorable currency, decreased by 36.1%, almost entirely due to the unfavorable impact shown in "Cost/Other," resulting from the deconsolidation of RBH; and an unfavorable volume/mix, mainly due to Mexico; partly offset by a favorable pricing variance, driven by Mexico, partly offset by Argentina as a result of the adoption of highly inflationary accounting.
The net revenues of the Latin America & Canada segment include $7 million in 2019 and $5 million in 2018 related to the sale of RRPs.
Operating income decreased by 62.7%. Excluding asset impairment and exit costs ($22 million) related to a plant closure in Colombia as part of our global manufacturing infrastructure optimization and the unfavorable impact of currency ($6 million), operating income decreased by 54.3%. This decline was predominantly due to the unfavorable impact, shown in "Cost/Other," resulting from the deconsolidation of RBH; and unfavorable volume/mix, mainly in Mexico; partly offset by a favorable pricing variance; lower manufacturing costs; and lower marketing, administration and research costs.
|
| | | | | | | | | | | | | | | | | | | | | | | | | | | | |
Financial Summary -
Nine Months Ended
September 30, | | | | | Change
Fav./(Unfav.) | | Variance
Fav./(Unfav.) |
| 2019 | 2018 | | Total | Excl.
Curr. | | Total | Cur-
rency | Price | Vol/
Mix | Cost/
Other(1) |
(in millions) | | | |
Net Revenues | | $ | 1,652 |
| $ | 2,268 |
| | (27.2 | )% | (24.6 | )% | | $ | (616 | ) | $ | (59 | ) | $ | 44 |
| $ | (91 | ) | $ | (510 | ) |
Operating Income | | $ | 100 |
| $ | 866 |
| | (88.5 | )% | (89.6 | )% | | $ | (766 | ) | $ | 10 |
| $ | 44 |
| $ | (77 | ) | $ | (743 | ) |
(1) Unfavorable Cost/Other variance includes the impact of the RBH deconsolidation.
Note: Net Revenues include revenues from shipments of the Platform 1 device, heated tobacco units and accessories to Altria Group, Inc., commencing in the third quarter of 2019, for sale under license in the United States.
For the nine months ended September 30, 2019, net revenues, excluding unfavorable currency, decreased by 24.6%, predominantly due to: the unfavorable impact shown in "Cost/Other," resulting from the deconsolidation of RBH; and unfavorable volume, mainly due to Argentina and Canada; partly offset by a favorable pricing variance, notably in Canada and Mexico, partially offset by Argentina mainly due to the adoption of highly inflationary accounting.
The net revenues of the Latin America & Canada segment include $18 million in 2019 and $14 million in 2018 related to the sale of RRPs.
Operating income decreased by 88.5%. Excluding the loss on deconsolidation of RBH ($239 million), the Canadian tobacco litigation-related expense ($194 million), asset impairment and exit costs ($45 million) related to a plant closure in Colombia as part of our global manufacturing infrastructure optimization and favorable currency ($10 million), operating income decreased by 34.4%. This decline was predominantly due to the unfavorable impact, shown in "Cost/Other," resulting from the deconsolidation of RBH; an unfavorable volume/mix, mainly due to lower cigarette volume in Argentina and Canada; partly offset by a favorable pricing variance; lower manufacturing costs and lower marketing, administration and research costs, partly resulting from the adoption of highly inflationary accounting in Argentina.
Latin America & Canada - Total Market, PMI Shipment Volume and Market Share Commentaries
In the third quarter, the estimated total market in Latin America & Canada decreased, notably due to:
| |
• | Canada, down by 11.1%, primarily due to the impact of cumulative price increases, as well as the growing prevalence of e-vapor products; |
| |
• | Mexico, down by 9.8%, or by 2.3% excluding estimated net trade inventory movements related to the timing of price increases; and |
| |
• | Venezuela, down by 55.1%, mainly reflecting the deterioration of the socioeconomic environment and the impact of inflation-driven price increases; |
partly offset by
| |
• | Argentina, up by 2.3%. Excluding estimated net trade inventory movements related to the timing of price increases, the total market decreased by 1.6%, primarily due to the impact of cumulative price increases and the impact of the economic downturn as of the second half of 2018; and |
| |
• | Brazil, up by 5.4%. Excluding estimated net trade inventory movements primarily related to the timing of price increases, the total market increased by 0.7%. |
For the nine months year-to-date, the estimated total market in Latin America & Canada decreased, notably due to:
| |
• | Argentina, down by 4.9%, reflecting the same factors as in the quarter; |
| |
• | Canada, down by 8.9%, reflecting the same factors as in the quarter; and |
| |
• | Venezuela, down by 57.6%, reflecting the same factors as in the quarter. |
|
| | | | | | | | | | | | | |
PMI Shipment Volume (million units) | Third-Quarter | | Nine Months Year-to-Date |
| 2019 |
| 2018 |
| Change |
| | 2019 |
| 2018 |
| Change |
|
Cigarettes | 16,854 |
| 19,612 |
| (14.1 | )% | | 52,906 |
| 58,829 |
| (10.1 | )% |
Heated Tobacco Units | 89 |
| 43 |
| +100.0% |
| | 202 |
| 98 |
| +100.0% |
|
Total Latin America & Canada | 16,943 |
| 19,655 |
| (13.8 | )% | | 53,108 |
| 58,927 |
| (9.9 | )% |
In the third quarter, our total shipment volume decreased by 13.8% to 16.9 billion units, or by 6.9% excluding the impact of the RBH deconsolidation, in part due to:
| |
• | Mexico, down by 17.3%, driven by the lower total market and lower market share, largely reflecting the timing of retail price increases compared to 2018. |
For the nine months year-to-date, our total shipment volume decreased by 9.9% to 53.1 billion units, or by 5.2% excluding the impact of the RBH deconsolidation, in part due to:
| |
• | Argentina, down by 8.1%, primarily reflecting the lower total market, as well as lower market share; |
| |
• | Mexico, down by 1.9%, primarily reflecting the lower total market, as well as lower market share; and |
| |
• | Venezuela, down by 76.9%, primarily reflecting the lower total market, as well as lower market share. |
Financial Review
|
| | | | | | |
| For the Nine Months Ended September 30, |
(in millions) | 2019 | 2018 |
Net cash provided by operating activities | $ | 6,766 |
| $ | 7,056 |
|
Net cash used in investing activities | (1,627 | ) | (1,164 | ) |
Net cash used in financing activities | (5,102 | ) | (7,904 | ) |
Net Cash Provided by Operating Activities
During the first nine months of 2019, net cash provided by operating activities decreased by $0.3 billion compared with the first nine months of 2018. Excluding unfavorable currency movements of $0.9 billion, net cash provided by operating activities increased by $0.6 billion. The unfavorable currency movements represented the impacts on net earnings coupled with the currency impacts on subsidiary working capital movements and the related inter-company positions from the fluctuations of the U.S. dollar, especially against the Euro, Indonesian rupiah, Russian ruble and Turkish lira.
While the impacts of the 2019 Canadian tobacco litigation-related expense and the 2019 loss on deconsolidation of RBH reduced net earnings by $0.3 billion, there was no net impact on operating cash flows for the nine months, as the changes in deferred taxes and other operating cash flows offset the net earnings impact. Excluding the impact of the above items and unfavorable currency movements, the lower net earnings after these adjustments (partly attributable to the Russia excise and VAT audit charge which was paid in the third quarter of 2019) were partially offset by lower working capital requirements of $0.3 billion. The lower working capital requirement was primarily due to more cash used in 2018 for accounts payable mainly reflecting higher IQOS device purchases in the fourth quarter of 2017, and other favorable movements, partially offset by more cash used for accounts receivable in 2019 due to the timing of sales and cash collections.
Net Cash Used in Investing Activities
During the first nine months of 2019, net cash used in investing activities increased by $0.5 billion compared with the first nine months of 2018. This increase in net cash used in investing activities was due principally to the reduction of cash resulting from the deconsolidation of RBH, partly offset by lower capital expenditures and higher cash collateral received to secure derivatives designated as net investment hedges of Euro assets principally related to changes in exchange rates between the Euro and the U.S. dollar. For further details on deconsolidation of RBH, see Note 20. Deconsolidation of RBH. For further details on our derivatives designated as net investment hedges, see Note 5. Financial Instruments.
During the first nine months of 2019, capital expenditures decreased by $0.4 billion compared with the first nine months of 2018. The 2019 expenditures were primarily related to our ongoing investments in RRPs. We expect total capital expenditures in 2019 to be approximately $1.0 billion, compared to the previously communicated assumption of $1.1 billion.
Net Cash Used in Financing Activities
During the first nine months of 2019, net cash used in financing activities decreased by $2.8 billion compared with the first nine months of 2018. The change was due primarily to 2019 proceeds from long-term debt issuances ($3.8 billion proceeds from our U.S. dollar and Euro debt issuances in 2019) and the purchase of the remaining 49% interest in our Costa Rican affiliates in 2018, partially offset by higher long-term debt repayments and higher repayments of short-term borrowing. For further details on the purchase of the remaining 49% interest in our Costa Rican affiliates, see Note 17. Acquisitions.
Debt and Liquidity
We define cash and cash equivalents as short-term, highly liquid investments, readily convertible to known amounts of cash that mature within a maximum of three months and have an insignificant risk of change in value due to interest rate or credit risk changes. As a policy, we do not hold any investments in structured or equity-linked products. Our cash and cash equivalents are predominantly held in demand deposits with institutions that have investment-grade long-term credit rating.
We utilize long-term and short-term debt financing, including a commercial paper program that is regularly used to finance ongoing liquidity requirements, as part of our overall cash management strategy. Our ability to access the capital and credit markets as well as overall dynamics of these markets may impact borrowing costs. We expect that the combination of our long-term and short-term debt financing, the commercial paper program and the committed credit facilities, coupled with our operating cash flows, will enable us to meet our liquidity requirements.
Credit Ratings – The cost and terms of our financing arrangements as well as our access to commercial paper markets may be affected by applicable credit ratings. At September 30, 2019, our credit ratings and outlook by major credit rating agencies were as follows:
|
| | | | | | |
| | Short-term | | Long-term | | Outlook |
Moody’s | | P-1 | | A2 | | Stable |
Standard & Poor’s | | A-1 | | A | | Stable |
Fitch | | F1 | | A | | Stable |
Credit Facilities – On January 28, 2019, we entered into an agreement to extend the term of our $2.0 billion 364-day revolving credit facility from February 5, 2019, to February 4, 2020.
At September 30, 2019, our committed credit facilities and commercial paper outstanding were as follows:
|
| | | | | | | | |
(in billions) | | | | |
Type | | Committed Credit Facilities | | Commercial Paper |
364-day revolving credit, expiring February 4, 2020 | | $ | 2.0 |
| | |
Multi-year revolving credit, expiring February 28, 2021 | | 2.5 |
| | |
Multi-year revolving credit, expiring October 1, 2022 | | 3.5 |
| | |
|
Total facilities | | $ | 8.0 |
| | |
|
Commercial paper outstanding | | |
| | $ | — |
|
At September 30, 2019, there were no borrowings under the committed credit facilities, and the entire committed amounts were available for borrowing.
All banks participating in our committed credit facilities have an investment-grade long-term credit rating from the credit rating agencies. We continuously monitor the credit quality of our banking group, and at this time we are not aware of any potential non-performing credit provider.
Each of these facilities requires us to maintain a ratio of consolidated earnings before interest, taxes, depreciation and amortization (“consolidated EBITDA”) to consolidated interest expense of not less than 3.5 to 1.0 on a rolling four-quarter basis. At September 30, 2019, our ratio calculated in accordance with the agreements was 11.1 to 1.0. These facilities do not include any credit rating triggers, material adverse change clauses or any provisions that could require us to post collateral. We expect to continue to meet our covenants. The terms “consolidated EBITDA” and “consolidated interest expense,” both of which include certain adjustments, are defined in the facility agreements previously filed with the U.S. Securities and Exchange Commission.
In addition to the committed credit facilities discussed above, certain of our subsidiaries maintain short-term credit arrangements to meet their respective working capital needs. These credit arrangements, which amounted to approximately $2.9 billion at September 30, 2019 and $3.3 billion at December 31, 2018, are for the sole use of our subsidiaries. Borrowings under these arrangements amounted to $355 million at September 30, 2019, and $730 million at December 31, 2018.
Commercial Paper Program – We have access to liquidity in the commercial paper market through programs in place in the U.S. and in Europe having an aggregate issuance capacity of $8.0 billion. At September 30, 2019 and December 31, 2018, we had no commercial paper outstanding. The average commercial paper balance outstanding during the first nine months of 2019 was $2.6 billion. The average commercial paper balance outstanding during 2018 was $3.4 billion.
Sale of Accounts Receivable – To mitigate credit risk and enhance cash and liquidity management we sell trade receivables to unaffiliated financial institutions. These arrangements allow us to sell, on an ongoing basis, certain trade receivables without recourse. The trade receivables sold are generally short-term in nature and are removed from the condensed consolidated balance sheets. We sell trade receivables under two types of arrangements, servicing and nonservicing.
Our operating cash flows were positively impacted by the amount of the trade receivables sold and derecognized from the condensed consolidated balance sheets, which remained outstanding with the unaffiliated financial institutions. The trade receivables sold that remained outstanding under these arrangements as of September 30, 2019, and September 30, 2018 were $0.6 billion and $0.6 billion, respectively. The net proceeds received are included in cash provided by operating activities in the condensed consolidated statements of cash flows.
For further details, see Note 15. Sale of Accounts Receivable to our condensed consolidated financial statements.
Debt – Our total debt was $31.8 billion at September 30, 2019 and $31.8 billion at December 31, 2018.
On February 14, 2017, we filed a shelf registration statement with the U.S. Securities and Exchange Commission, under which we may from time to time sell debt securities and/or warrants to purchase debt securities over a three-year period.
Our debt issuances in the first nine months of 2019 were as follows:
|
| | | | | | | | |
(in millions) | | | | | | | | |
Type | | Face Value | | Interest Rate | | Issuance | | Maturity |
| | | | | | | | |
U.S. dollar notes | (a) | $900 | | 2.875% | | May 2019 | | May 2024 |
U.S. dollar notes | (b) | $750 | | 3.375% | | May 2019 | | August 2029 |
Euro notes | (c) | €500 (approximately $557) | (d) | 0.125% | | August 2019 | | August 2026 |
Euro notes | (c) | €750 (approximately $835) | (d) | 0.800% | | August 2019 | | August 2031 |
Euro notes | (c) | €750 (approximately $835) | (d) | 1.450% | | August 2019 | | August 2039 |
(a) Interest on these notes is payable semi-annually in arrears beginning in November 2019.
(b) Interest on these notes is payable semi-annually in arrears beginning in August 2019.
(c) Interest on these notes is payable annually in arrears beginning in August 2020.
(d) USD equivalents for foreign currency notes were calculated based on exchange rates on the date of issuance.
The net proceeds from the sale of the securities listed in the table above have been and will be used for general corporate purposes, including repayment of outstanding commercial paper and refinancing of outstanding 2.000% Notes due 2020, outstanding Floating Rate Notes due 2020 and outstanding Euro denominated 1.750% Notes due 2020.
Guarantees – At September 30, 2019, we were contingently liable for $0.5 billion of guarantees of our own performance, of which $0.3 billion were related to our obligations under indemnity agreements to enable appeals of customs assessments against our distributors and $0.2 billion were primarily related to excise taxes on the shipment of our products. There is no liability in the condensed consolidated financial statements associated with these guarantees. At September 30, 2019, our third-party guarantees were insignificant.
Equity and Dividends
We discuss our stock awards as of September 30, 2019 in Note 2. Stock Plans to our condensed consolidated financial statements.
During 2018, we did not repurchase any shares under a share repurchase program, and we do not presently intend to repurchase shares of our common stock in 2019.
Dividends paid in the first nine months of 2019 were $5.3 billion. During the third quarter of 2019, our Board of Directors approved a 2.6% increase in the quarterly dividend to $1.17 per common share. As a result, the present annualized dividend rate is $4.68 per common share.
Market Risk
Counterparty Risk - We predominantly work with financial institutions with strong short- and long-term credit ratings as assigned by Standard & Poor’s and Moody’s. These banks are also part of a defined group of relationship banks. Non-investment grade institutions are only used in certain emerging markets to the extent required by local business needs. We have a conservative approach when it comes to choosing financial counterparties and financial instruments. As such, we do not invest or hold investments in any structured or equity-linked products. The majority of our cash and cash equivalents is currently invested in demand deposits maturing within less than 30 days.
We continuously monitor and assess the credit worthiness of all our counterparties.
Derivative Financial Instruments - We operate in markets outside of the United States of America, with manufacturing and sales facilities in various locations throughout the world. Consequently, we use certain financial instruments to manage our foreign currency and interest rate exposure. We use derivative financial instruments principally to reduce our exposure to market risks resulting from fluctuations in foreign exchange and interest rates by creating offsetting exposures. We are not a party to leveraged derivatives and, by policy, do not use derivative financial instruments for speculative purposes.
See Note 5. Financial Instruments, Note 11. Fair Value Measurements, and Note 13. Balance Sheet Offsetting to our condensed consolidated financial statements for further details on our derivative financial instruments and the related collateral arrangements.
Contingencies
See Note 8. Contingencies to our condensed consolidated financial statements for a discussion of contingencies.
Cautionary Factors That May Affect Future Results
Forward-Looking and Cautionary Statements
We may from time to time make written or oral forward-looking statements, including statements contained in filings with the SEC, in reports to stockholders and in press releases and investor webcasts. You can identify these forward-looking statements by use of words such as "strategy," "expects," "continues," "plans," "anticipates," "believes," "will," "estimates," "intends," "projects," "goals," "targets" and other words of similar meaning. You can also identify them by the fact that they do not relate strictly to historical or current facts.
We cannot guarantee that any forward-looking statement will be realized, although we believe we have been prudent in our plans and assumptions. Our RRPs constitute a new product category in its early stages that is less predictable than our mature cigarette business. Achievement of future results is subject to risks, uncertainties and inaccurate assumptions. Should known or unknown risks or uncertainties materialize, or should underlying assumptions prove inaccurate, actual results could vary materially from those anticipated, estimated or projected. Investors should bear this in mind as they consider forward-looking statements and whether to invest in or remain invested in our securities. In connection with the “safe harbor” provisions of the Private Securities
Litigation Reform Act of 1995, we are identifying important factors that, individually or in the aggregate, could cause actual results and outcomes to differ materially from those contained in any forward-looking statements made by us; any such statement is qualified by reference to the following cautionary statements. We elaborate on these and other risks we face throughout this document, particularly in the “Business Environment” section. You should understand that it is not possible to predict or identify all risk factors. Consequently, you should not consider the following to be a complete discussion of all potential risks or uncertainties. We do not undertake to update any forward-looking statement that we may make from time to time, except in the normal course of our public disclosure obligations.
Risks Related to Our Business and Industry
Consumption of tax-paid cigarettes continues to decline in many of our markets.
This decline is due to multiple factors, including increased taxes and pricing, governmental actions, the diminishing social acceptance of smoking, continuing economic and geopolitical uncertainty, and the continuing prevalence of illicit products. These factors and their potential consequences are discussed more fully below and in the "Business Environment" section.
Cigarettes are subject to substantial taxes. Significant increases in cigarette-related taxes have been proposed or enacted and are likely to continue to be proposed or enacted in numerous jurisdictions. These tax increases may disproportionately affect our profitability and make us less competitive versus certain of our competitors.
Tax regimes, including excise taxes, sales taxes and import duties, can disproportionately affect the retail price of cigarettes versus other combustible tobacco products, or disproportionately affect the relative retail price of our cigarette brands versus cigarette brands manufactured by certain of our competitors. Because our portfolio is weighted toward the premium-price cigarette category, tax regimes based on sales price can place us at a competitive disadvantage in certain markets. As a result, our volume and profitability may be adversely affected in these markets.
Increases in cigarette taxes are expected to continue to have an adverse impact on our sales of cigarettes, due to resulting lower consumption levels, a shift in sales from manufactured cigarettes to other combustible tobacco products and from the premium-price to the mid-price or low-price cigarette categories, where we may be under-represented, from local sales to legal cross-border purchases of lower price products, or to illicit products such as contraband, counterfeit and "illicit whites."
Our business faces significant governmental action aimed at increasing regulatory requirements with the goal of reducing or preventing the use of tobacco products.
Governmental actions, combined with the diminishing social acceptance of smoking and private actions to restrict smoking, have resulted in reduced industry volume in many of our markets, and we expect that such factors will continue to reduce consumption levels and will increase down-trading and the risk of counterfeiting, contraband, "illicit whites" and legal cross-border purchases. Significant regulatory developments will continue to take place over the next few years in most of our markets, driven principally by the World Health Organization's Framework Convention on Tobacco Control ("FCTC"). Since it came into force in 2005, the FCTC has led to increased efforts by tobacco control advocates and public health organizations to promote increasingly restrictive regulatory measures on the marketing and sale of tobacco products to adult smokers. Regulatory initiatives that have been proposed, introduced or enacted include:
| |
• | restrictions on or licensing of outlets permitted to sell cigarettes; |
| |
• | the levying of substantial and increasing tax and duty charges; |
| |
• | restrictions or bans on advertising, marketing and sponsorship; |
| |
• | the display of larger health warnings, graphic health warnings and other labeling requirements; |
| |
• | restrictions on packaging design, including the use of colors, and plain packaging; |
| |
• | restrictions on packaging and cigarette formats and dimensions; |
| |
• | restrictions or bans on the display of tobacco product packaging at the point of sale and restrictions or bans on cigarette vending machines; |
| |
• | requirements regarding testing, disclosure and performance standards for tar, nicotine, carbon monoxide and other smoke constituents; |
| |
• | disclosure, restrictions, or bans of tobacco product ingredients; |
| |
• | increased restrictions on smoking in public and work places and, in some instances, in private places and outdoors; |
| |
• | regulation, restrictions or prohibitions of novel tobacco or nicotine-containing products; |
| |
• | elimination of duty free sales and duty free allowances for travelers; |
| |
• | encouraging litigation against tobacco companies; and |
| |
• | excluding tobacco companies from transparent public dialogue regarding public health and other policy matters. |
Our financial results could be significantly affected by regulatory initiatives resulting in a significant decrease in demand for our brands, in particular requirements that lead to a commoditization of tobacco products or impede adult consumers' ability to convert to our RRPs, as well as any significant increase in the cost of complying with new regulatory requirements.
Litigation related to tobacco use and exposure to environmental tobacco smoke could substantially reduce our profitability and could severely impair our liquidity.
There is litigation related to tobacco products pending in certain jurisdictions. Damages claimed in some tobacco-related litigation are significant and, in certain cases in Brazil, Canada and Nigeria, range into the billions of U.S. dollars. We anticipate that new cases will continue to be filed. The FCTC encourages litigation against tobacco product manufacturers. It is possible that our consolidated results of operations, cash flows or financial position could be materially affected in a particular fiscal quarter or fiscal year by an unfavorable outcome or settlement of certain pending litigation. See Note 8. Contingencies to our condensed consolidated financial statements for a discussion of pending litigation and "Business Environment—Reduced-Risk Products (RRPs)—Legal Challenges to RRPs."
We face intense competition, and our failure to compete effectively could have a material adverse effect on our profitability and results of operations.
We compete primarily on the basis of product quality, brand recognition, brand loyalty, taste, R&D, innovation, packaging, customer service, marketing, advertising and retail price and, increasingly, adult smoker willingness to convert to our RRPs. We are subject to highly competitive conditions in all aspects of our business. The competitive environment and our competitive position can be significantly influenced by weak economic conditions, erosion of consumer confidence, competitors' introduction of lower-price products or innovative products, higher tobacco product taxes, higher absolute prices and larger gaps between retail price categories, and product regulation that diminishes the ability to differentiate tobacco products and restricts adult consumer access to truthful and non-misleading information about our RRPs. Competitors include three large international tobacco companies, new market entrants, particularly with respect to innovative products, several regional and local tobacco companies and, in some instances, state-owned tobacco enterprises, principally in Algeria, Egypt, the PRC, Taiwan, Thailand and Vietnam. Industry consolidation and privatizations of state-owned enterprises have led to an overall increase in competitive pressures. Some competitors have different profit and volume objectives, and some international competitors are susceptible to changes in different currency exchange rates. Certain new market entrants may alienate consumers from innovative products through inappropriate marketing campaigns and messaging and inferior product satisfaction, while not relying on scientific substantiation based on appropriate R&D protocols and standards. The growing use of digital media could increase the speed and extent of the dissemination of inaccurate and misleading information about our RRPs.
Because we have operations in numerous countries, our results may be influenced by economic, regulatory and political developments, natural disasters, pandemics or conflicts.
Some of the countries in which we operate face the threat of civil unrest and can be subject to regime changes. In others, nationalization, terrorism, conflict and the threat of war may have a significant impact on the business environment. Natural disasters, pandemics, economic, political, regulatory or other developments could disrupt our supply chain, manufacturing capabilities or distribution capabilities. In addition, such developments could lead to loss of property or equipment that are critical to our business in certain markets and difficulty in staffing and managing our operations, which could reduce our volumes, revenues and net earnings.
In certain markets, we are dependent on governmental approvals of various actions such as price changes, and failure to obtain such approvals could impair growth of our profitability.
In addition, despite our high ethical standards and rigorous control and compliance procedures aimed at preventing and detecting unlawful conduct, given the breadth and scope of our international operations, we may not be able to detect all potential improper or unlawful conduct by our employees and partners.
We may be unable to anticipate changes in adult consumer preferences.
Our business is subject to changes in adult consumer preferences, which may be influenced by local economic conditions. To be successful, we must:
| |
• | promote brand equity successfully; |
| |
• | anticipate and respond to new adult consumer trends; |
| |
• | develop new products and markets and broaden brand portfolios; |
| |
• | convince adult smokers to convert to our RRPs; |
| |
• | ensure adequate production capacity to meet demand for our products; and |
| |
• | be able to protect or enhance margins through price increases. |
In periods of economic uncertainty, adult consumers may tend to purchase lower-price brands, and the volume of our premium-price and mid-price brands and our profitability could suffer accordingly. Such down-trading trends may be reinforced by regulation that limits branding, communication and product differentiation.
The financial and business performance of our reduced-risk products is less predictable than our cigarette business.
Our RRPs are novel products in a new category, and the pace at which adult smokers adopt them may vary, depending on the competitive, regulatory, fiscal and cultural environment, and other factors in a specific market. There may be periods of accelerated growth and periods of slower growth for these products, the timing and drivers of which may be more difficult for us to predict versus our mature cigarette business. The impact of this lower predictability on our projected results for a specific period may be significant, particularly during the early stages of this new product category.
We lose revenues as a result of counterfeiting, contraband, cross-border purchases, "illicit whites," non-tax-paid volume produced by local manufacturers, and counterfeiting of our IQOS device and heated tobacco units.
Large quantities of counterfeit cigarettes are sold in the international market. We believe that Marlboro is the most heavily counterfeited international cigarette brand, although we cannot quantify the revenues we lose as a result of this activity. In addition, our revenues are reduced by contraband, legal cross-border purchases, "illicit whites" and non-tax-paid volume produced by local manufacturers. Our revenues and consumer satisfaction with our IQOS device and heated tobacco units may be adversely affected by counterfeit products that do not meet our product quality standards and scientific validation procedures.
From time to time, we are subject to governmental investigations on a range of matters.
Investigations include allegations of contraband shipments of cigarettes, allegations of unlawful pricing activities within certain markets, allegations of underpayment of customs duties and/or excise taxes, allegations of false and misleading usage of descriptors and allegations of unlawful advertising. We cannot predict the outcome of those investigations or whether additional investigations may be commenced, and it is possible that our business could be materially affected by an unfavorable outcome of pending or future investigations. See Note 8. Contingencies—Other Litigation and “Management's Discussion and Analysis of Financial Condition and Results of Operations—Operating Results by Business Segment—Business Environment—Governmental Investigations” for a description of certain governmental investigations to which we are subject.
We may be unsuccessful in our attempts to introduce reduced-risk products, and regulators may not permit the commercialization of these products or the communication of scientifically substantiated risk-reduction claims.
Our key strategic priorities are: to develop and commercialize products that present less risk of harm to adult smokers who switch to those products versus continued smoking; and to convince current adult smokers who would otherwise continue to smoke to switch to those RRPs. For our efforts to be successful, we must: develop RRPs that such adult smokers find acceptable alternatives to smoking; conduct rigorous scientific studies to substantiate that they reduce exposure to harmful and potentially harmful constituents in smoke and, ultimately, that these products present, are likely to present, or have the potential to present less risk of harm to adult smokers who switch to them versus continued smoking; and effectively advocate for the development of science-based regulatory frameworks for the development and commercialization of RRPs, including communication of scientifically substantiated information to enable adult smokers to make better consumer choices. We might not succeed in our efforts. If we do not succeed, but others do, or if heat-not-burn products are inequitably regulated compared to other RRP categories without regard to the totality of the scientific evidence available for such products, we may be at a competitive disadvantage. In addition, actions of some market entrants, such as the inappropriate marketing of e-vapor products to youth, as well as alleged health
consequences associated with the use of certain e-vapor products, may unfavorably impact public opinion and/or mischaracterize all e-vapor products or other RRPs to consumers, regulators and policy makers without regard to the totality of scientific evidence for specific products. This may impede our efforts to advocate for the development of science-based regulatory frameworks for the development and commercialization of RRPs. We cannot predict whether regulators will permit the sale and/or marketing of RRPs with scientifically substantiated risk-reduction claims. Such restrictions could limit the success of our RRPs. Moreover, the FDA’s premarket tobacco product authorization of a version of our Platform 1 product is subject to strict marketing, reporting and other requirements and is not a guarantee that the product will remain authorized, particularly if there is a significant uptake in youth initiation.
We may be unsuccessful in our efforts to differentiate reduced-risk products and cigarettes with respect to taxation.
To date, we have been largely successful in demonstrating to regulators that our RRPs are not cigarettes, and as such they are generally taxed either as a separate category or as other tobacco products, which typically yields more favorable tax rates than cigarettes. If we cease to be successful in these efforts, RRP unit margins may be adversely affected.
Our reported results could be adversely affected by unfavorable currency exchange rates, and currency devaluations could impair our competitiveness.
We conduct our business primarily in local currency and, for purposes of financial reporting, the local currency results are translated into U.S. dollars based on average exchange rates prevailing during a reporting period. During times of a strengthening U.S. dollar, our reported net revenues, operating income and EPS will be reduced because the local currency translates into fewer U.S. dollars. During periods of local economic crises, foreign currencies may be devalued significantly against the U.S. dollar, reducing our margins. Actions to recover margins may result in lower volume and a weaker competitive position.
Changes in the earnings mix and changes in tax laws may result in significant variability in our effective tax rates. Our ability to receive payments from foreign subsidiaries or to repatriate royalties and dividends could be restricted by local country currency exchange controls.
The Tax Cuts and Jobs Act that was signed into law in December 2017 constitutes a major change to the U.S. tax system. Our estimated impact of the Tax Cuts and Jobs Act is based on management’s current interpretations, and our analysis is ongoing. Our final tax liability may be materially different from current estimates due to developments such as implementing regulations and clarifications. In future periods, our effective tax rate and our ability to recover deferred tax assets could be subject to additional uncertainty as a result of such developments. Furthermore, changes in the earnings mix or applicable foreign tax laws may result in significant variability in our effective tax rates. Because we are a U.S. holding company, our most significant source of funds is distributions from our non-U.S. subsidiaries. Certain countries in which we operate have adopted or could institute currency exchange controls that limit or prohibit our local subsidiaries' ability to convert local currency into U.S. dollars or to make payments outside the country. This could subject us to the risks of local currency devaluation and business disruption.
Our ability to grow profitability may be limited by our inability to introduce new products, enter new markets or improve our margins through higher pricing and improvements in our brand and geographic mix.
Our profit growth may suffer if we are unable to introduce new products or enter new markets successfully, to raise prices or to improve the proportion of our sales of higher margin products and in higher margin geographies.
We may be unable to expand our brand portfolio through successful acquisitions or the development of strategic business relationships.
One element of our growth strategy is to strengthen our brand portfolio and market positions through selective acquisitions and the development of strategic business relationships. Acquisition and strategic business development opportunities are limited and present risks of failing to achieve efficient and effective integration, strategic objectives and anticipated revenue improvements and cost savings. There is no assurance that we will be able to acquire attractive businesses on favorable terms, or that future acquisitions or strategic business developments will be accretive to earnings.
Government mandated prices, production control programs, shifts in crops driven by economic conditions and the impact of climate change may increase the cost or reduce the quality of the tobacco and other agricultural products used to manufacture our products.
As with other agricultural commodities, the price of tobacco leaf and cloves can be influenced by imbalances in supply and demand, and crop quality can be influenced by variations in weather patterns, including those caused by climate change. Tobacco production in certain countries is subject to a variety of controls, including government mandated prices and production control programs. Changes in the patterns of demand for agricultural products could cause farmers to produce less tobacco or cloves. Any significant change in tobacco leaf and clove prices, quality and quantity could affect our profitability and our business.
Our ability to achieve our strategic goals may be impaired if we fail to attract and retain the best global talent.
To be successful, we must continue transforming our culture and ways of working, align our talent with our business needs, innovate and transform to a consumer-centric business. We compete for talent, including in areas that are new to us, such as digital and technical solutions, with companies in the consumer products, technology and other sectors that enjoy greater societal acceptance. As a result, we may be unable to attract and retain the best global talent with the right degree of diversity, experience and skills to achieve our strategic goals.
The failure of our information systems to function as intended or their penetration by outside parties with the intent to corrupt them or our failure to comply with privacy laws and regulations could result in business disruption, litigation and regulatory action, and loss of revenue, assets or personal or other confidential data.
We use information systems to help manage business processes, collect and interpret data and communicate internally and externally with employees, suppliers, consumers, customers and others. Some of these information systems are managed by third-party service providers. We have backup systems and business continuity plans in place, and we take care to protect our systems and data from unauthorized access. Nevertheless, failure of our systems to function as intended, or penetration of our systems by outside parties intent on extracting or corrupting information or otherwise disrupting business processes, could place us at a competitive disadvantage, result in a loss of revenue, assets or personal or other sensitive data, litigation and regulatory action, cause damage to our reputation and that of our brands and result in significant remediation and other costs. Failure to protect personal data, respect the rights of data subjects, and adhere to strict cybersecurity protocols could subject us to substantial fines and other legal challenges under regulations such as the EU General Data Protection Regulation. As we are increasingly relying on digital platforms in our business, the magnitude of these risks is likely to increase.
We may be unable to adequately protect our intellectual property rights, and disputes relating to intellectual property rights could harm our business.
Our intellectual property rights are valuable assets, and their protection is important to our business. If the steps we take to protect our intellectual property rights globally, including through a combination of trademark, design, patent and other intellectual property rights, are inadequate, or if others infringe or misappropriate our intellectual property rights, notwithstanding legal protection, our business could suffer. Intellectual property rights of third parties may limit our ability to introduce new products or improve the quality of existing products in one or more markets. Competitors or other third parties may claim that we infringe their intellectual property rights. Any such claims, regardless of merit, could divert management’s attention, be costly, disruptive, time-consuming and unpredictable and expose us to litigation costs and damages, and impede our ability to manufacture and sell new products or improve existing products. If, as a result, we are unable to manufacture or sell our RRPs or improve their quality in one or more markets, our ability to convert adult smokers to our RRPs in such markets would be adversely affected.
We may be required to replace third-party contract manufacturers or service providers with our own resources.
In certain instances, we contract with third parties to manufacture some of our products or product parts or to provide other services. We may be unable to renew these agreements on satisfactory terms for numerous reasons, including government regulations. Accordingly, our costs may increase significantly if we must replace such third parties with our own resources.
Item 4. Controls and Procedures.
PMI carried out an evaluation, with the participation of PMI’s management, including PMI’s Chief Executive Officer and Chief Financial Officer, of the effectiveness of PMI’s disclosure controls and procedures (as defined in Rule 13a-15(e) under the Securities Exchange Act of 1934, as amended) as of the end of the period covered by this report. Based upon that evaluation, PMI’s Chief Executive Officer and Chief Financial Officer concluded that PMI’s disclosure controls and procedures are effective. There have been no changes in PMI’s internal control over financial reporting during the most recent fiscal quarter that have materially affected, or are reasonably likely to materially affect, PMI’s internal control over financial reporting.
Part II - OTHER INFORMATION
| |
Item 1. | Legal Proceedings. |
See Note 8. Contingencies of the Notes to the Condensed Consolidated Financial Statements included in Part I – Item 1 of this report for a discussion of legal proceedings pending against Philip Morris International Inc. and its subsidiaries.
Information regarding Risk Factors appears in “MD&A – Cautionary Factors That May Affect Future Results,” in Part I – Item 2 of this Form 10-Q and in Part I – Item 1A. Risk Factors of our Annual Report on Form 10-K for the year ended December 31, 2018.
| |
Item 2. | Unregistered Sales of Equity Securities and Use of Proceeds. |
Our share repurchase activity for each of the three months in the quarter ended September 30, 2019 was as follows:
|
| | | | | | | | | | | | | | | |
Period | | Total Number of Shares Repurchased | | Average Price Paid Per Share | | Total Number of Shares Purchased as Part of Publicly Announced Plans or Programs | | Approximate Dollar Value of Shares that May Yet be Purchased Under the Plans or Programs |
July 1, 2019 – July 31, 2019 (1) | | — |
| | $ | — |
| | — |
| | $ | — |
|
August 1, 2019 – August 31, 2019 (1) | | — |
| | $ | — |
| | — |
| | $ | — |
|
September 1, 2019 – September 30, 2019 (1) | | — |
| | $ | — |
| | — |
| | $ | — |
|
Pursuant to Publicly Announced Plans or Programs | | — |
| | $ | — |
| | | | |
July 1, 2019 – July 31, 2019 (2) | | 632 |
| | $ | 78.11 |
| | | | |
August 1, 2019 – August 31, 2019 (2) | | 2,719 |
| | $ | 84.29 |
| | | | |
September 1, 2019 – September 30, 2019 (2) | | 2,342 |
| 2,342 |
| $ | 77.89 |
| | | | |
For the Quarter Ended September 30, 2019 | | 5,693 |
| | $ | 80.68 |
| | | | |
| |
(1) | During this reporting period, we did not have an authorized share repurchase program. |
| |
(2) | Shares repurchased represent shares tendered to us by employees who vested in restricted and performance share unit awards and used shares to pay all, or a portion of, the related taxes. |
|
| | |
| | |
3.1 | | |
| | |
31.1 | | |
| |
31.2 | | |
| |
32.1 | | |
| |
32.2 | | |
| |
101.INS | | XBRL Instance Document - the instance document does not appear in the Interactive Data File because its XBRL tags are embedded within the Inline XBRL document.
|
| |
101.SCH | | XBRL Taxonomy Extension Schema. |
| |
101.CAL | | XBRL Taxonomy Extension Calculation Linkbase. |
| |
101.DEF | | XBRL Taxonomy Extension Definition Linkbase. |
| |
101.LAB | | XBRL Taxonomy Extension Label Linkbase. |
| |
101.PRE | | XBRL Taxonomy Extension Presentation Linkbase. |
| | |
104 | | Cover Page Interactive Data File (formatted as Inline XBRL and contained in Exhibit 101) |
Signature
Pursuant to the requirements of the Securities Exchange Act of 1934, the Registrant has duly caused this report to be signed on its behalf by the undersigned thereunto duly authorized.
|
|
PHILIP MORRIS INTERNATIONAL INC. |
|
/s/ MARTIN G. KING |
|
Martin G. King |
Chief Financial Officer |
|
October 24, 2019 |