http://www.inreit.com/20231231#OtherAssetsNetAmounthttp://www.inreit.com/20231231#OtherAssetsNetAmount0.260.840.871110400010632000101600000001412502--12-312023FYhttp://fasb.org/us-gaap/2023#Revenuesfalsetruehttp://fasb.org/us-gaap/2023#Revenues1110400010632000101600002026-12-012026-12-010001412502sret:ShareRedemptionPlansMember2023-12-310001412502us-gaap:AociIncludingPortionAttributableToNoncontrollingInterestMember2023-12-310001412502us-gaap:AdditionalPaidInCapitalMember2023-12-310001412502us-gaap:AccumulatedDistributionsInExcessOfNetIncomeMember2023-12-310001412502sret:NoncontrollingInterestInPartiallyOwnedPropertiesMember2023-12-310001412502sret:NoncontrollingInterestInOperatingPartnershipMember2023-12-310001412502us-gaap:AociIncludingPortionAttributableToNoncontrollingInterestMember2022-12-310001412502us-gaap:AdditionalPaidInCapitalMember2022-12-310001412502us-gaap:AccumulatedDistributionsInExcessOfNetIncomeMember2022-12-310001412502sret:NoncontrollingInterestInPartiallyOwnedPropertiesMember2022-12-310001412502sret:NoncontrollingInterestInOperatingPartnershipMember2022-12-310001412502sret:BeneficialInterestMember2022-12-310001412502us-gaap:AociIncludingPortionAttributableToNoncontrollingInterestMember2021-12-310001412502us-gaap:AdditionalPaidInCapitalMember2021-12-310001412502us-gaap:AccumulatedDistributionsInExcessOfNetIncomeMember2021-12-310001412502sret:NoncontrollingInterestInPartiallyOwnedPropertiesMember2021-12-310001412502sret:NoncontrollingInterestInOperatingPartnershipMember2021-12-310001412502sret:BeneficialInterestMember2021-12-310001412502us-gaap:AociIncludingPortionAttributableToNoncontrollingInterestMember2020-12-310001412502us-gaap:AdditionalPaidInCapitalMember2020-12-310001412502us-gaap:AccumulatedDistributionsInExcessOfNetIncomeMember2020-12-310001412502sret:NoncontrollingInterestInPartiallyOwnedPropertiesMember2020-12-310001412502sret:NoncontrollingInterestInOperatingPartnershipMember2020-12-310001412502sret:BeneficialInterestMember2020-12-310001412502sret:ResidentialMember2023-12-310001412502us-gaap:ResidentialRealEstateMembersrt:MinimumMembersret:WestwoodMember2023-12-310001412502us-gaap:ResidentialRealEstateMembersrt:MinimumMembersret:WestwindMember2023-12-310001412502us-gaap:ResidentialRealEstateMembersrt:MinimumMembersret:WestcourtMember2023-12-310001412502us-gaap:ResidentialRealEstateMembersrt:MinimumMembersret:ValleyViewMember2023-12-310001412502us-gaap:ResidentialRealEstateMembersrt:MinimumMembersret:TwinParksMember2023-12-310001412502us-gaap:ResidentialRealEstateMembersrt:MinimumMembersret:ThunderCreekMember2023-12-310001412502us-gaap:ResidentialRealEstateMembersrt:MinimumMembersret:SunwoodMember2023-12-310001412502us-gaap:ResidentialRealEstateMembersrt:MinimumMembersret:SunviewMember2023-12-310001412502us-gaap:ResidentialRealEstateMembersrt:MinimumMembersret:SunsetRidgeMember2023-12-310001412502us-gaap:ResidentialRealEstateMembersrt:MinimumMembersret:SummitPointMember2023-12-310001412502us-gaap:ResidentialRealEstateMembersrt:MinimumMembersret:StonybrookMember2023-12-310001412502us-gaap:ResidentialRealEstateMembersrt:MinimumMembersret:StonefieldPhaseOneMember2023-12-310001412502us-gaap:ResidentialRealEstateMembersrt:MinimumMembersret:StanfordCourtMember2023-12-310001412502us-gaap:ResidentialRealEstateMembersrt:MinimumMembersret:SpringMember2023-12-310001412502us-gaap:ResidentialRealEstateMembersrt:MinimumMembersret:SouthviewVillagesMember2023-12-310001412502us-gaap:ResidentialRealEstateMembersrt:MinimumMembersret:SouthgateMember2023-12-310001412502us-gaap:ResidentialRealEstateMembersrt:MinimumMembersret:SageParkMember2023-12-310001412502us-gaap:ResidentialRealEstateMembersrt:MinimumMembersret:RoughriderMember2023-12-310001412502us-gaap:ResidentialRealEstateMembersrt:MinimumMembersret:RosegateMember2023-12-310001412502us-gaap:ResidentialRealEstateMembersrt:MinimumMembersret:RosedaleEstatesMember2023-12-310001412502us-gaap:ResidentialRealEstateMembersrt:MinimumMembersret:QuailCreekSpringfieldMoMember2023-12-310001412502us-gaap:ResidentialRealEstateMembersrt:MinimumMembersret:PrairiewoodCourtsMember2023-12-310001412502us-gaap:ResidentialRealEstateMembersrt:MinimumMembersret:PebbleCreekMember2023-12-310001412502us-gaap:ResidentialRealEstateMembersrt:MinimumMembersret:ParkwestGardensMember2023-12-310001412502us-gaap:ResidentialRealEstateMembersrt:MinimumMembersret:ParkviewArmsBismarckNDMember2023-12-310001412502us-gaap:ResidentialRealEstateMembersrt:MinimumMembersret:OakCourtMember2023-12-310001412502us-gaap:ResidentialRealEstateMembersrt:MinimumMembersret:MontrealCourtsMember2023-12-310001412502us-gaap:ResidentialRealEstateMembersrt:MinimumMembersret:MonticelloMember2023-12-310001412502us-gaap:ResidentialRealEstateMembersrt:MinimumMembersret:MayfairMember2023-12-310001412502us-gaap:ResidentialRealEstateMembersrt:MinimumMembersret:MarthaAliceMember2023-12-310001412502us-gaap:ResidentialRealEstateMembersrt:MinimumMembersret:MaplewoodMember2023-12-310001412502us-gaap:ResidentialRealEstateMembersrt:MinimumMembersret:MaplewoodBendOneTwoThreeFourSixSevenEightAndRoyaleMember2023-12-310001412502us-gaap:ResidentialRealEstateMembersrt:MinimumMembersret:MapleRidgeMember2023-12-310001412502us-gaap:ResidentialRealEstateMembersrt:MinimumMembersret:LibraryLaneMember2023-12-310001412502us-gaap:ResidentialRealEstateMembersrt:MinimumMembersret:KennedyMember2023-12-310001412502us-gaap:ResidentialRealEstateMembersrt:MinimumMembersret:HighlandMeadowsMember2023-12-310001412502us-gaap:ResidentialRealEstateMembersrt:MinimumMembersret:HarrisonAndRichfieldMember2023-12-310001412502us-gaap:ResidentialRealEstateMembersrt:MinimumMembersret:GrangerCourtMember2023-12-310001412502us-gaap:ResidentialRealEstateMembersrt:MinimumMembersret:GlenPondMember2023-12-310001412502us-gaap:ResidentialRealEstateMembersrt:MinimumMembersret:GeorgetownOnRiverMember2023-12-310001412502us-gaap:ResidentialRealEstateMembersrt:MinimumMembersret:GardenGroveMember2023-12-310001412502us-gaap:ResidentialRealEstateMembersrt:MinimumMembersret:FairviewMember2023-12-310001412502us-gaap:ResidentialRealEstateMembersrt:MinimumMembersret:EmeraldCourtMember2023-12-310001412502us-gaap:ResidentialRealEstateMembersrt:MinimumMembersret:EchoManorMember2023-12-310001412502us-gaap:ResidentialRealEstateMembersrt:MinimumMembersret:DanburyMember2023-12-310001412502us-gaap:ResidentialRealEstateMembersrt:MinimumMembersret:CourtyardMember2023-12-310001412502us-gaap:ResidentialRealEstateMembersrt:MinimumMembersret:CountryClubMember2023-12-310001412502us-gaap:ResidentialRealEstateMembersrt:MinimumMembersret:ColumbiaWestMember2023-12-310001412502us-gaap:ResidentialRealEstateMembersrt:MinimumMembersret:Chandler1866Member2023-12-310001412502us-gaap:ResidentialRealEstateMembersrt:MinimumMembersret:CarltonPlaceMember2023-12-310001412502us-gaap:ResidentialRealEstateMembersrt:MinimumMembersret:BrookfieldMember2023-12-310001412502us-gaap:ResidentialRealEstateMembersrt:MinimumMembersret:BerkshireMember2023-12-310001412502us-gaap:ResidentialRealEstateMembersrt:MinimumMembersret:BayviewMember2023-12-310001412502us-gaap:ResidentialRealEstateMembersrt:MinimumMembersret:AutumnRidgeMember2023-12-310001412502us-gaap:ResidentialRealEstateMembersrt:MinimumMembersret:AuburnTwoMember2023-12-310001412502us-gaap:ResidentialRealEstateMembersrt:MinimumMembersret:AmberWoodMember2023-12-310001412502us-gaap:ResidentialRealEstateMembersrt:MaximumMembersret:WestwoodMember2023-12-310001412502us-gaap:ResidentialRealEstateMembersrt:MaximumMembersret:WestwindMember2023-12-310001412502us-gaap:ResidentialRealEstateMembersrt:MaximumMembersret:WestcourtMember2023-12-310001412502us-gaap:ResidentialRealEstateMembersrt:MaximumMembersret:ValleyViewMember2023-12-310001412502us-gaap:ResidentialRealEstateMembersrt:MaximumMembersret:TwinParksMember2023-12-310001412502us-gaap:ResidentialRealEstateMembersrt:MaximumMembersret:ThunderCreekMember2023-12-310001412502us-gaap:ResidentialRealEstateMembersrt:MaximumMembersret:SunwoodMember2023-12-310001412502us-gaap:ResidentialRealEstateMembersrt:MaximumMembersret:SunviewMember2023-12-310001412502us-gaap:ResidentialRealEstateMembersrt:MaximumMembersret:SunsetRidgeMember2023-12-310001412502us-gaap:ResidentialRealEstateMembersrt:MaximumMembersret:SummitPointMember2023-12-310001412502us-gaap:ResidentialRealEstateMembersrt:MaximumMembersret:StonybrookMember2023-12-310001412502us-gaap:ResidentialRealEstateMembersrt:MaximumMembersret:StonefieldPhaseOneMember2023-12-310001412502us-gaap:ResidentialRealEstateMembersrt:MaximumMembersret:StanfordCourtMember2023-12-310001412502us-gaap:ResidentialRealEstateMembersrt:MaximumMembersret:SpringMember2023-12-310001412502us-gaap:ResidentialRealEstateMembersrt:MaximumMembersret:SouthviewVillagesMember2023-12-310001412502us-gaap:ResidentialRealEstateMembersrt:MaximumMembersret:SageParkMember2023-12-310001412502us-gaap:ResidentialRealEstateMembersrt:MaximumMembersret:RoughriderMember2023-12-310001412502us-gaap:ResidentialRealEstateMembersrt:MaximumMembersret:RosegateMember2023-12-310001412502us-gaap:ResidentialRealEstateMembersrt:MaximumMembersret:RosedaleEstatesMember2023-12-310001412502us-gaap:ResidentialRealEstateMembersrt:MaximumMembersret:QuailCreekSpringfieldMoMember2023-12-310001412502us-gaap:ResidentialRealEstateMembersrt:MaximumMembersret:PrairiewoodCourtsMember2023-12-310001412502us-gaap:ResidentialRealEstateMembersrt:MaximumMembersret:PebbleCreekMember2023-12-310001412502us-gaap:ResidentialRealEstateMembersrt:MaximumMembersret:ParkwestGardensMember2023-12-310001412502us-gaap:ResidentialRealEstateMembersrt:MaximumMembersret:ParkviewArmsBismarckNDMember2023-12-310001412502us-gaap:ResidentialRealEstateMembersrt:MaximumMembersret:OakCourtMember2023-12-310001412502us-gaap:ResidentialRealEstateMembersrt:MaximumMembersret:MontrealCourtsMember2023-12-310001412502us-gaap:ResidentialRealEstateMembersrt:MaximumMembersret:MonticelloMember2023-12-310001412502us-gaap:ResidentialRealEstateMembersrt:MaximumMembersret:MayfairMember2023-12-310001412502us-gaap:ResidentialRealEstateMembersrt:MaximumMembersret:MarthaAliceMember2023-12-310001412502us-gaap:ResidentialRealEstateMembersrt:MaximumMembersret:MaplewoodMember2023-12-310001412502us-gaap:ResidentialRealEstateMembersrt:MaximumMembersret:MaplewoodBendOneTwoThreeFourSixSevenEightAndRoyaleMember2023-12-310001412502us-gaap:ResidentialRealEstateMembersrt:MaximumMembersret:MapleRidgeMember2023-12-310001412502us-gaap:ResidentialRealEstateMembersrt:MaximumMembersret:LibraryLaneMember2023-12-310001412502us-gaap:ResidentialRealEstateMembersrt:MaximumMembersret:KennedyMember2023-12-310001412502us-gaap:ResidentialRealEstateMembersrt:MaximumMembersret:HighlandMeadowsMember2023-12-310001412502us-gaap:ResidentialRealEstateMembersrt:MaximumMembersret:HarrisonAndRichfieldMember2023-12-310001412502us-gaap:ResidentialRealEstateMembersrt:MaximumMembersret:GrangerCourtMember2023-12-310001412502us-gaap:ResidentialRealEstateMembersrt:MaximumMembersret:GlenPondMember2023-12-310001412502us-gaap:ResidentialRealEstateMembersrt:MaximumMembersret:GeorgetownOnRiverMember2023-12-310001412502us-gaap:ResidentialRealEstateMembersrt:MaximumMembersret:GardenGroveMember2023-12-310001412502us-gaap:ResidentialRealEstateMembersrt:MaximumMembersret:FairviewMember2023-12-310001412502us-gaap:ResidentialRealEstateMembersrt:MaximumMembersret:EmeraldCourtMember2023-12-310001412502us-gaap:ResidentialRealEstateMembersrt:MaximumMembersret:EchoManorMember2023-12-310001412502us-gaap:ResidentialRealEstateMembersrt:MaximumMembersret:DanburyMember2023-12-310001412502us-gaap:ResidentialRealEstateMembersrt:MaximumMembersret:CourtyardMember2023-12-310001412502us-gaap:ResidentialRealEstateMembersrt:MaximumMembersret:CountryClubMember2023-12-310001412502us-gaap:ResidentialRealEstateMembersrt:MaximumMembersret:ColumbiaWestMember2023-12-310001412502us-gaap:ResidentialRealEstateMembersrt:MaximumMembersret:Chandler1866Member2023-12-310001412502us-gaap:ResidentialRealEstateMembersrt:MaximumMembersret:CarltonPlaceMember2023-12-310001412502us-gaap:ResidentialRealEstateMembersrt:MaximumMembersret:BrookfieldMember2023-12-310001412502us-gaap:ResidentialRealEstateMembersrt:MaximumMembersret:BerkshireMember2023-12-310001412502us-gaap:ResidentialRealEstateMembersrt:MaximumMembersret:BayviewMember2023-12-310001412502us-gaap:ResidentialRealEstateMembersrt:MaximumMembersret:AutumnRidgeMember2023-12-310001412502us-gaap:ResidentialRealEstateMembersrt:MaximumMembersret:AuburnTwoMember2023-12-310001412502us-gaap:ResidentialRealEstateMembersrt:MaximumMembersret:AmberWoodMember2023-12-310001412502srt:RetailSiteMembersrt:MinimumMembersret:WalgreensAlexandriaLaMember2023-12-310001412502srt:RetailSiteMembersrt:MaximumMembersret:WalgreensAlexandriaLaMember2023-12-310001412502srt:OfficeBuildingMembersrt:MinimumMembersret:WellsFargoCenterMember2023-12-310001412502srt:OfficeBuildingMembersrt:MinimumMembersret:ParkwayOfficeBuildingFkaEchelonMember2023-12-310001412502srt:OfficeBuildingMembersrt:MinimumMembersret:MidtownPlazaMember2023-12-310001412502srt:OfficeBuildingMembersrt:MinimumMembersret:GreatAmericanBldgMember2023-12-310001412502srt:OfficeBuildingMembersrt:MinimumMembersret:GoldmarkOfficeParkMember2023-12-310001412502srt:OfficeBuildingMembersrt:MinimumMembersret:FourPointsMember2023-12-310001412502srt:OfficeBuildingMembersrt:MinimumMembersret:FirstInternationalBankAndTrustMember2023-12-310001412502srt:OfficeBuildingMembersrt:MinimumMembersret:BluemontLakesFinancialCenterMember2023-12-310001412502srt:OfficeBuildingMembersrt:MinimumMembersret:BellPlazaMember2023-12-310001412502srt:OfficeBuildingMembersrt:MaximumMembersret:WellsFargoCenterMember2023-12-310001412502srt:OfficeBuildingMembersrt:MaximumMembersret:ParkwayOfficeBuildingFkaEchelonMember2023-12-310001412502srt:OfficeBuildingMembersrt:MaximumMembersret:MidtownPlazaMember2023-12-310001412502srt:OfficeBuildingMembersrt:MaximumMembersret:GreatAmericanBldgMember2023-12-310001412502srt:OfficeBuildingMembersrt:MaximumMembersret:GoldmarkOfficeParkMember2023-12-310001412502srt:OfficeBuildingMembersrt:MaximumMembersret:FourPointsMember2023-12-310001412502srt:OfficeBuildingMembersrt:MaximumMembersret:FirstInternationalBankAndTrustMember2023-12-310001412502srt:OfficeBuildingMembersrt:MaximumMembersret:BluemontLakesFinancialCenterMember2023-12-310001412502srt:OfficeBuildingMembersrt:MaximumMembersret:BellPlazaMember2023-12-310001412502sret:MedicalPropertyMembersrt:MinimumMembersret:BioLifeStevensPointMember2023-12-310001412502sret:MedicalPropertyMembersrt:MinimumMembersret:BioLifeSheboyganMember2023-12-310001412502sret:MedicalPropertyMembersrt:MinimumMembersret:BioLifeOshkoshMember2023-12-310001412502sret:MedicalPropertyMembersrt:MinimumMembersret:BioLifeOnalaskaMember2023-12-310001412502sret:MedicalPropertyMembersrt:MinimumMembersret:BioLifeMarquetteMember2023-12-310001412502sret:MedicalPropertyMembersrt:MinimumMembersret:BioLifeMankatoMember2023-12-310001412502sret:MedicalPropertyMembersrt:MinimumMembersret:BioLifeJanesvilleMember2023-12-310001412502sret:MedicalPropertyMembersrt:MinimumMembersret:BioLifeGrandForksMember2023-12-310001412502sret:MedicalPropertyMembersrt:MinimumMembersret:BioLifeBismarckMember2023-12-310001412502sret:MedicalPropertyMembersrt:MaximumMembersret:BioLifeStevensPointMember2023-12-310001412502sret:MedicalPropertyMembersrt:MaximumMembersret:BioLifeSheboyganMember2023-12-310001412502sret:MedicalPropertyMembersrt:MaximumMembersret:BioLifeOshkoshMember2023-12-310001412502sret:MedicalPropertyMembersrt:MaximumMembersret:BioLifeOnalaskaMember2023-12-310001412502sret:MedicalPropertyMembersrt:MaximumMembersret:BioLifeMarquetteMember2023-12-310001412502sret:MedicalPropertyMembersrt:MaximumMembersret:BioLifeMankatoMember2023-12-310001412502sret:MedicalPropertyMembersrt:MaximumMembersret:BioLifeJanesvilleMember2023-12-310001412502sret:MedicalPropertyMembersrt:MaximumMembersret:BioLifeGrandForksMember2023-12-310001412502sret:MedicalPropertyMembersrt:MaximumMembersret:BioLifeBismarckMember2023-12-310001412502us-gaap:ResidentialRealEstateMembersret:StonefieldPhaseThreeMember2023-12-310001412502us-gaap:LandMembersret:RochesterDevelopmentLandMember2023-12-310001412502us-gaap:ResidentialRealEstateMembersret:SunviewMember2023-12-310001412502us-gaap:ResidentialRealEstateMembersret:StanfordCourtMember2023-12-310001412502us-gaap:ResidentialRealEstateMembersret:SouthviewThirdMember2023-12-310001412502us-gaap:ResidentialRealEstateMembersret:SomersetMember2023-12-310001412502us-gaap:ResidentialRealEstateMembersret:PrairiewoodCourtsMember2023-12-310001412502us-gaap:ResidentialRealEstateMembersret:PebbleCreekMember2023-12-310001412502us-gaap:ResidentialRealEstateMembersret:ParkwoodMember2023-12-310001412502us-gaap:ResidentialRealEstateMembersret:ParkviewArmsBismarckNDMember2023-12-310001412502us-gaap:ResidentialRealEstateMembersret:MayfairMember2023-12-310001412502us-gaap:ResidentialRealEstateMembersret:HarrisonAndRichfieldMember2023-12-310001412502us-gaap:ResidentialRealEstateMembersret:FoxtailCreekTownhomesMember2023-12-310001412502us-gaap:ResidentialRealEstateMembersret:EmeraldCourtMember2023-12-310001412502us-gaap:ResidentialRealEstateMembersret:EagleSkyTwoMember2023-12-310001412502us-gaap:ResidentialRealEstateMembersret:EagleSkyOneMember2023-12-310001412502us-gaap:ResidentialRealEstateMembersret:CherryCreekFkaVillageMember2023-12-310001412502us-gaap:ResidentialRealEstateMembersret:Chandler1898Member2023-12-310001412502us-gaap:ResidentialRealEstateMembersret:CedarsFourMember2023-12-310001412502srt:RetailSiteMembersret:WalgreensLaurelMsMember2023-12-310001412502srt:RetailSiteMembersret:WalgreensAlexandriaLaMember2023-12-310001412502srt:RetailSiteMembersret:OreillyMandanNdMember2023-12-310001412502srt:RetailSiteMembersret:FamilyDollarMandanNdMember2023-12-310001412502srt:RetailSiteMembersret:DairyQueenMoorheadMember2023-12-310001412502srt:RetailSiteMembersret:DairyQueenDickinsonMember2023-12-310001412502srt:RetailSiteMembersret:DairyQueenAppleValleyMnMember2023-12-310001412502srt:OfficeBuildingMembersret:WellsFargoCenterMember2023-12-310001412502srt:OfficeBuildingMembersret:GateCityMember2023-12-310001412502srt:OfficeBuildingMembersret:FourPointsMember2023-12-310001412502srt:OfficeBuildingMembersret:FirstInternationalBankAndTrustMember2023-12-310001412502srt:IndustrialPropertyMembersret:TitanMachineryNorthPlatteNeMember2023-12-310001412502srt:IndustrialPropertyMembersret:TitanMachineryMinotMember2023-12-310001412502sret:MedicalPropertyMembersret:BioLifeMarquetteMember2023-12-310001412502srt:MinimumMemberus-gaap:FurnitureAndFixturesMember2023-12-310001412502srt:MaximumMemberus-gaap:FurnitureAndFixturesMember2023-12-310001412502us-gaap:BuildingAndBuildingImprovementsMember2023-12-310001412502sret:NoncontrollingInterestInPartiallyOwnedPropertiesMember2023-01-012023-12-310001412502sret:NoncontrollingInterestInPartiallyOwnedPropertiesMember2022-01-012022-12-310001412502us-gaap:PartnershipMember2023-01-012023-12-310001412502us-gaap:PartnershipMember2023-12-310001412502us-gaap:PartnershipMember2022-12-310001412502us-gaap:InterestExpenseMember2023-01-012023-12-310001412502us-gaap:InterestExpenseMember2022-01-012022-12-310001412502us-gaap:InterestRateSwapMember2023-01-012023-12-310001412502us-gaap:AociIncludingPortionAttributableToNoncontrollingInterestMember2023-01-012023-12-310001412502us-gaap:InterestRateSwapMember2022-01-012022-12-310001412502us-gaap:AociIncludingPortionAttributableToNoncontrollingInterestMember2022-01-012022-12-310001412502us-gaap:AociIncludingPortionAttributableToNoncontrollingInterestMember2021-01-012021-12-310001412502sret:GoldmarkSchlossmanCommercialRealEstateServicesMember2023-01-012023-12-310001412502us-gaap:NotesPayableToBanksMembersret:BellBankMember2022-12-310001412502us-gaap:FairValueInputsLevel3Memberus-gaap:EstimateOfFairValueFairValueDisclosureMember2023-12-310001412502us-gaap:FairValueInputsLevel3Memberus-gaap:EstimateOfFairValueFairValueDisclosureMember2022-12-310001412502sret:NoncontrollingInterestInPartiallyOwnedPropertiesMember2021-01-012021-12-310001412502srt:MinimumMemberus-gaap:MeasurementInputDiscountRateMember2023-12-310001412502srt:MaximumMemberus-gaap:MeasurementInputDiscountRateMember2023-12-310001412502us-gaap:MeasurementInputDiscountRateMember2023-12-310001412502srt:MinimumMemberus-gaap:MeasurementInputDiscountRateMember2022-12-310001412502srt:MaximumMemberus-gaap:MeasurementInputDiscountRateMember2022-12-310001412502us-gaap:MeasurementInputDiscountRateMember2022-12-310001412502sret:SESavageMemberus-gaap:FirstMortgageMember2023-12-310001412502sret:SeRogersMemberus-gaap:SecondMortgageMember2023-12-310001412502sret:SeRogersMemberus-gaap:FirstMortgageMember2023-12-310001412502sret:SeMapleGroveMemberus-gaap:SecondMortgageMember2023-12-310001412502sret:SeMapleGroveMemberus-gaap:FirstMortgageMember2023-12-310001412502sret:SeBrooklynParkLLCMemberus-gaap:SecondMortgageMember2023-12-310001412502sret:SeBrooklynParkLLCMemberus-gaap:FirstMortgageMember2023-12-310001412502sret:GrandForksMarketplaceRetailCenterMemberus-gaap:FirstMortgageMember2023-12-310001412502sret:BannerBuildingMemberus-gaap:FirstMortgageMember2023-12-310001412502us-gaap:NotesPayableToBanksMember2023-12-310001412502sret:SESavageMemberus-gaap:FirstMortgageMember2022-12-310001412502sret:SeRogersMemberus-gaap:SecondMortgageMember2022-12-310001412502sret:SeRogersMemberus-gaap:FirstMortgageMember2022-12-310001412502sret:SeMapleGroveMemberus-gaap:SecondMortgageMember2022-12-310001412502sret:SeMapleGroveMemberus-gaap:FirstMortgageMember2022-12-310001412502sret:SeBrooklynParkLLCMemberus-gaap:SecondMortgageMember2022-12-310001412502sret:SeBrooklynParkLLCMemberus-gaap:FirstMortgageMember2022-12-310001412502sret:GrandForksMarketplaceRetailCenterMemberus-gaap:FirstMortgageMember2022-12-310001412502sret:BannerBuildingMemberus-gaap:FirstMortgageMember2022-12-310001412502us-gaap:NotesPayableToBanksMember2022-12-310001412502sret:BremerBankMember2023-12-310001412502sret:BremerBankAgreementTwoMember2023-12-310001412502sret:BremerBankAgreementOneMember2023-12-310001412502sret:BremerBankAgreementTwoMember2023-01-012023-12-310001412502sret:BremerBankAgreementOneMember2023-01-012023-12-310001412502sret:BremerBankMember2022-12-310001412502us-gaap:ResidentialRealEstateMembersrt:MaximumMember2023-12-310001412502us-gaap:FairValueInputsLevel1Memberus-gaap:EstimateOfFairValueFairValueDisclosureMember2022-12-310001412502sret:MezzanineFinancingMember2023-01-012023-12-310001412502sret:MezzanineFinancingMember2022-01-012022-12-310001412502us-gaap:InterestRateSwapMember2023-12-310001412502us-gaap:OtherAssetsMember2023-12-310001412502us-gaap:OtherAssetsMember2022-12-310001412502us-gaap:NotesPayableToBanksMembersret:BellBankMember2023-01-012023-12-310001412502us-gaap:NotesPayableToBanksMembersret:BellBankMember2022-01-012022-12-310001412502us-gaap:NotesPayableToBanksMembersret:BellBankMember2021-01-012021-12-310001412502sret:CommercialMember2023-12-310001412502sret:ResidentialMember2022-12-310001412502sret:CommercialMember2022-12-310001412502us-gaap:DisposalGroupDisposedOfBySaleNotDiscontinuedOperationsMembersret:WhiteBearLakeMinnesotaMember2023-05-012023-05-310001412502us-gaap:DisposalGroupDisposedOfBySaleNotDiscontinuedOperationsMembersret:CoonRapidsMinnesotaMember2023-05-012023-05-310001412502us-gaap:DisposalGroupDisposedOfBySaleNotDiscontinuedOperationsMembersret:PropertyBloomingtonMnMember2022-12-012022-12-310001412502us-gaap:DisposalGroupDisposedOfBySaleNotDiscontinuedOperationsMembersret:PropertyLocatedInEastGrandForksMnMember2022-09-012022-09-300001412502us-gaap:DisposalGroupDisposedOfBySaleNotDiscontinuedOperationsMembersret:PropertyLocatedInEdinaMinnesotaMember2022-08-012022-08-310001412502us-gaap:DisposalGroupDisposedOfBySaleNotDiscontinuedOperationsMembersret:PropertyMoorheadMinnesotaMember2022-05-012022-05-310001412502us-gaap:DisposalGroupDisposedOfBySaleNotDiscontinuedOperationsMembersret:CommercialPropertySavageMinnesotaMember2022-03-012022-03-310001412502us-gaap:DisposalGroupDisposedOfBySaleNotDiscontinuedOperationsMembersret:ResidentialPropertyMoorheadMinnesotaMember2021-06-012021-06-300001412502us-gaap:DisposalGroupDisposedOfBySaleNotDiscontinuedOperationsMembersret:RetailPropertyWaiteParkMinnesotaMember2021-04-012021-04-300001412502us-gaap:LeasesAcquiredInPlaceMember2023-12-310001412502us-gaap:AboveMarketLeasesMember2023-12-310001412502us-gaap:LeasesAcquiredInPlaceMember2022-12-310001412502us-gaap:AboveMarketLeasesMember2022-12-310001412502sret:StFossilCreekFortWorthLlcMember2022-05-160001412502us-gaap:AccumulatedDistributionsInExcessOfNetIncomeMember2023-01-012023-12-310001412502sret:NoncontrollingInterestInOperatingPartnershipMember2023-01-012023-12-310001412502us-gaap:AccumulatedDistributionsInExcessOfNetIncomeMember2022-01-012022-12-310001412502sret:NoncontrollingInterestInOperatingPartnershipMember2022-01-012022-12-310001412502us-gaap:AccumulatedDistributionsInExcessOfNetIncomeMember2021-01-012021-12-310001412502sret:NoncontrollingInterestInOperatingPartnershipMember2021-01-012021-12-310001412502sret:OperatingPartnershipMember2023-10-012023-12-310001412502sret:OperatingPartnershipMember2022-10-012022-12-310001412502us-gaap:DisposalGroupDisposedOfBySaleNotDiscontinuedOperationsMembersret:RetailPropertyAppleValleyMinnesotaMemberus-gaap:SubsequentEventMember2024-01-250001412502us-gaap:DisposalGroupDisposedOfBySaleNotDiscontinuedOperationsMembersret:WhiteBearLakeMinnesotaMember2023-05-310001412502us-gaap:DisposalGroupDisposedOfBySaleNotDiscontinuedOperationsMembersret:CoonRapidsMinnesotaMember2023-05-310001412502us-gaap:DisposalGroupDisposedOfBySaleNotDiscontinuedOperationsMembersret:ResidentialPropertyMoorheadMinnesotaMember2021-06-300001412502us-gaap:DisposalGroupDisposedOfBySaleNotDiscontinuedOperationsMembersret:RetailPropertyWaiteParkMinnesotaMember2021-04-300001412502us-gaap:InterestRateSwapMemberus-gaap:CashFlowHedgingMemberus-gaap:DesignatedAsHedgingInstrumentMember2023-12-310001412502us-gaap:InterestRateSwapMemberus-gaap:CashFlowHedgingMemberus-gaap:DesignatedAsHedgingInstrumentMember2022-12-310001412502sret:InterestRateSwapMaturingInNovember2029Memberus-gaap:CashFlowHedgingMemberus-gaap:DesignatedAsHedgingInstrumentMember2023-01-012023-12-310001412502sret:InterestRateSwapMaturingInNovember2029InterestRateSwapTwoMemberus-gaap:CashFlowHedgingMemberus-gaap:DesignatedAsHedgingInstrumentMember2023-01-012023-12-310001412502sret:InterestRateSwapMaturingInJune2030Memberus-gaap:CashFlowHedgingMemberus-gaap:DesignatedAsHedgingInstrumentMember2023-01-012023-12-310001412502sret:InterestRateSwapMaturingInJune2030InterestRateSwapTwoMemberus-gaap:CashFlowHedgingMemberus-gaap:DesignatedAsHedgingInstrumentMember2023-01-012023-12-310001412502sret:InterestRateSwapMaturingInJune2030InterestRateSwapThreeMemberus-gaap:CashFlowHedgingMemberus-gaap:DesignatedAsHedgingInstrumentMember2023-01-012023-12-310001412502sret:InterestRateSwapMaturingInJune2030InterestRateSwapFourMemberus-gaap:CashFlowHedgingMemberus-gaap:DesignatedAsHedgingInstrumentMember2023-01-012023-12-310001412502sret:InterestRateSwapMaturingInJune2030InterestRateSwapFiveMemberus-gaap:CashFlowHedgingMemberus-gaap:DesignatedAsHedgingInstrumentMember2023-01-012023-12-310001412502sret:InterestRateSwapMaturingInJuly2031Memberus-gaap:CashFlowHedgingMemberus-gaap:DesignatedAsHedgingInstrumentMember2023-01-012023-12-310001412502sret:InterestRateSwapMaturingInJanuary2030Memberus-gaap:CashFlowHedgingMemberus-gaap:DesignatedAsHedgingInstrumentMember2023-01-012023-12-310001412502sret:InterestRateSwapMaturingInDecember2027Memberus-gaap:CashFlowHedgingMemberus-gaap:DesignatedAsHedgingInstrumentMember2023-01-012023-12-310001412502sret:InterestRateSwapDec2031Memberus-gaap:CashFlowHedgingMemberus-gaap:DesignatedAsHedgingInstrumentMember2023-01-012023-12-310001412502sret:InterestRateSwapAugust2029Memberus-gaap:CashFlowHedgingMemberus-gaap:DesignatedAsHedgingInstrumentMember2023-01-012023-12-310001412502sret:InterestRateSwapMaturingInNovember2029Memberus-gaap:CashFlowHedgingMemberus-gaap:DesignatedAsHedgingInstrumentMember2023-12-310001412502sret:InterestRateSwapMaturingInNovember2029InterestRateSwapTwoMemberus-gaap:CashFlowHedgingMemberus-gaap:DesignatedAsHedgingInstrumentMember2023-12-310001412502sret:InterestRateSwapMaturingInJune2030Memberus-gaap:CashFlowHedgingMemberus-gaap:DesignatedAsHedgingInstrumentMember2023-12-310001412502sret:InterestRateSwapMaturingInJune2030InterestRateSwapTwoMemberus-gaap:CashFlowHedgingMemberus-gaap:DesignatedAsHedgingInstrumentMember2023-12-310001412502sret:InterestRateSwapMaturingInJune2030InterestRateSwapThreeMemberus-gaap:CashFlowHedgingMemberus-gaap:DesignatedAsHedgingInstrumentMember2023-12-310001412502sret:InterestRateSwapMaturingInJune2030InterestRateSwapFourMemberus-gaap:CashFlowHedgingMemberus-gaap:DesignatedAsHedgingInstrumentMember2023-12-310001412502sret:InterestRateSwapMaturingInJune2030InterestRateSwapFiveMemberus-gaap:CashFlowHedgingMemberus-gaap:DesignatedAsHedgingInstrumentMember2023-12-310001412502sret:InterestRateSwapMaturingInJuly2031Memberus-gaap:CashFlowHedgingMemberus-gaap:DesignatedAsHedgingInstrumentMember2023-12-310001412502sret:InterestRateSwapMaturingInJanuary2030Memberus-gaap:CashFlowHedgingMemberus-gaap:DesignatedAsHedgingInstrumentMember2023-12-310001412502sret:InterestRateSwapMaturingInDecember2027Memberus-gaap:CashFlowHedgingMemberus-gaap:DesignatedAsHedgingInstrumentMember2023-12-310001412502sret:InterestRateSwapDec2031Memberus-gaap:CashFlowHedgingMemberus-gaap:DesignatedAsHedgingInstrumentMember2023-12-310001412502sret:InterestRateSwapAugust2029Memberus-gaap:CashFlowHedgingMemberus-gaap:DesignatedAsHedgingInstrumentMember2023-12-310001412502us-gaap:FairValueInputsLevel2Memberus-gaap:FairValueMeasurementsRecurringMember2023-12-310001412502us-gaap:FairValueMeasurementsRecurringMember2023-12-310001412502us-gaap:EstimateOfFairValueFairValueDisclosureMember2023-12-310001412502us-gaap:CarryingReportedAmountFairValueDisclosureMember2023-12-310001412502us-gaap:FairValueInputsLevel2Memberus-gaap:FairValueMeasurementsRecurringMember2022-12-310001412502us-gaap:FairValueMeasurementsRecurringMember2022-12-310001412502us-gaap:EstimateOfFairValueFairValueDisclosureMember2022-12-310001412502us-gaap:CarryingReportedAmountFairValueDisclosureMember2022-12-310001412502us-gaap:EquityMethodInvestmentNonconsolidatedInvesteeOrGroupOfInvesteesMember2023-01-012023-12-310001412502us-gaap:EquityMethodInvestmentNonconsolidatedInvesteeOrGroupOfInvesteesMember2022-01-012022-12-310001412502us-gaap:EquityMethodInvestmentNonconsolidatedInvesteeOrGroupOfInvesteesMember2021-01-012021-12-310001412502srt:WeightedAverageMembersret:FixedRateMortgageNotesPayableMembersret:MortgageNotesPayableMember2023-12-310001412502srt:MinimumMembersret:FixedRateMortgageNotesPayableMembersret:MortgageNotesPayableMember2023-12-310001412502srt:MaximumMembersret:FixedRateMortgageNotesPayableMembersret:MortgageNotesPayableMember2023-12-310001412502srt:WeightedAverageMembersret:FixedRateMortgageNotesPayableMembersret:MortgageNotesPayableMember2022-12-310001412502srt:MinimumMembersret:FixedRateMortgageNotesPayableMembersret:MortgageNotesPayableMember2022-12-310001412502srt:MaximumMembersret:FixedRateMortgageNotesPayableMembersret:MortgageNotesPayableMember2022-12-310001412502sret:SESavageMembersret:PromissoryNoteMember2023-12-310001412502sret:SESavageMembersret:PromissoryNoteMember2022-12-310001412502sret:FixedRateMortgageNotesPayableMembersret:MortgageNotesPayableMember2023-12-310001412502sret:FixedRateMortgageNotesPayableMembersret:MortgageNotesPayableMember2022-12-310001412502sret:BremerBankAgreementTwoMemberus-gaap:SecuredOvernightFinancingRateSofrOvernightIndexSwapRateMember2023-01-012023-12-310001412502sret:BremerBankAgreementOneMemberus-gaap:SecuredOvernightFinancingRateSofrOvernightIndexSwapRateMember2023-01-012023-12-310001412502us-gaap:CommonStockMember2023-12-310001412502us-gaap:CommonStockMember2022-12-310001412502us-gaap:CommonStockMember2021-12-310001412502us-gaap:CommonStockMember2020-12-310001412502sret:BeneficialInterestMember2023-12-310001412502us-gaap:SubsequentEventMember2024-01-162024-01-1600014125022020-12-3100014125022021-12-310001412502sret:RealEstatePropertyAcquisitions2022Member2023-01-012023-12-310001412502sret:RealEstatePropertyAcquisitions2021Member2023-01-012023-12-310001412502sret:AggregateAssetAcquisitionsMember2022-01-012022-12-310001412502us-gaap:AboveMarketLeasesMember2023-01-012023-12-310001412502us-gaap:AboveMarketLeasesMember2022-01-012022-12-310001412502us-gaap:AboveMarketLeasesMember2021-01-012021-12-310001412502us-gaap:ResidentialRealEstateMembersret:WoodlandPinesMember2023-12-310001412502us-gaap:ResidentialRealEstateMembersret:WolfCreekMember2023-12-310001412502us-gaap:ResidentialRealEstateMembersret:WillowParkMember2023-12-310001412502us-gaap:ResidentialRealEstateMembersret:WestwoodMember2023-12-310001412502us-gaap:ResidentialRealEstateMembersret:WestwindMember2023-12-310001412502us-gaap:ResidentialRealEstateMembersret:WestsideMember2023-12-310001412502us-gaap:ResidentialRealEstateMembersret:WestOakMember2023-12-310001412502us-gaap:ResidentialRealEstateMembersret:WestcourtMember2023-12-310001412502us-gaap:ResidentialRealEstateMembersret:WashingtonPropertyMember2023-12-310001412502us-gaap:ResidentialRealEstateMembersret:VillageWestMember2023-12-310001412502us-gaap:ResidentialRealEstateMembersret:VillageParkMember2023-12-310001412502us-gaap:ResidentialRealEstateMembersret:ValleyViewMember2023-12-310001412502us-gaap:ResidentialRealEstateMembersret:ValleyHomesDuplexesGrandForksNdMember2023-12-310001412502us-gaap:ResidentialRealEstateMembersret:TwinParksMember2023-12-310001412502us-gaap:ResidentialRealEstateMembersret:TwinOaksMember2023-12-310001412502us-gaap:ResidentialRealEstateMembersret:ThunderCreekMember2023-12-310001412502us-gaap:ResidentialRealEstateMembersret:SunwoodMember2023-12-310001412502us-gaap:ResidentialRealEstateMembersret:SunsetRidgeMember2023-12-310001412502us-gaap:ResidentialRealEstateMembersret:SunchaseMember2023-12-310001412502us-gaap:ResidentialRealEstateMembersret:SummitPointMember2023-12-310001412502us-gaap:ResidentialRealEstateMembersret:SummerfieldFargoNDMember2023-12-310001412502us-gaap:ResidentialRealEstateMembersret:StonybrookMember2023-12-310001412502us-gaap:ResidentialRealEstateMembersret:StonefieldPhaseTwoMember2023-12-310001412502us-gaap:ResidentialRealEstateMembersret:StonefieldPhaseOneMember2023-12-310001412502us-gaap:ResidentialRealEstateMembersret:SpringMember2023-12-310001412502us-gaap:ResidentialRealEstateMembersret:SouthviewVillagesMember2023-12-310001412502us-gaap:ResidentialRealEstateMembersret:SouthgateMember2023-12-310001412502us-gaap:ResidentialRealEstateMembersret:SierraRidgeMember2023-12-310001412502us-gaap:ResidentialRealEstateMembersret:SheridanPointeMember2023-12-310001412502us-gaap:ResidentialRealEstateMembersret:SchrockMember2023-12-310001412502us-gaap:ResidentialRealEstateMembersret:SargentMember2023-12-310001412502us-gaap:ResidentialRealEstateMembersret:SageParkMember2023-12-310001412502us-gaap:ResidentialRealEstateMembersret:SaddlebrookMember2023-12-310001412502us-gaap:ResidentialRealEstateMembersret:RoughriderMember2023-12-310001412502us-gaap:ResidentialRealEstateMembersret:RosserMember2023-12-310001412502us-gaap:ResidentialRealEstateMembersret:RosegateMember2023-12-310001412502us-gaap:ResidentialRealEstateMembersret:RosedaleEstatesMember2023-12-310001412502us-gaap:ResidentialRealEstateMembersret:RobinwoodMember2023-12-310001412502us-gaap:ResidentialRealEstateMembersret:QuailCreekSpringfieldMoMember2023-12-310001412502us-gaap:ResidentialRealEstateMembersret:PrairiewoodMeadowsMember2023-12-310001412502us-gaap:ResidentialRealEstateMembersret:PlumtreeMember2023-12-310001412502us-gaap:ResidentialRealEstateMembersret:PinhurstMember2023-12-310001412502us-gaap:ResidentialRealEstateMembersret:ParkwestGardensMember2023-12-310001412502us-gaap:ResidentialRealEstateMembersret:ParkCircleMember2023-12-310001412502us-gaap:ResidentialRealEstateMembersret:PacificParkTwoMember2023-12-310001412502us-gaap:ResidentialRealEstateMembersret:PacificParkSouthMember2023-12-310001412502us-gaap:ResidentialRealEstateMembersret:PacificParkMember2023-12-310001412502us-gaap:ResidentialRealEstateMembersret:OxfordMember2023-12-310001412502us-gaap:ResidentialRealEstateMembersret:OakviewTownhomesMember2023-12-310001412502us-gaap:ResidentialRealEstateMembersret:OakCourtMember2023-12-310001412502us-gaap:ResidentialRealEstateMembersret:NewgateMember2023-12-310001412502us-gaap:ResidentialRealEstateMembersret:MorningsideApartmentsMember2023-12-310001412502us-gaap:ResidentialRealEstateMembersret:MontrealCourtsMember2023-12-310001412502us-gaap:ResidentialRealEstateMembersret:MonticelloMember2023-12-310001412502us-gaap:ResidentialRealEstateMembersret:MarthaAliceMember2023-12-310001412502us-gaap:ResidentialRealEstateMembersret:MaplewoodMember2023-12-310001412502us-gaap:ResidentialRealEstateMembersret:MaplewoodBendOneTwoThreeFourSixSevenEightAndRoyaleMember2023-12-310001412502us-gaap:ResidentialRealEstateMembersret:MapleRidgeMember2023-12-310001412502us-gaap:ResidentialRealEstateMembersret:MadisonMember2023-12-310001412502us-gaap:ResidentialRealEstateMembersret:LibraryLaneMember2023-12-310001412502us-gaap:ResidentialRealEstateMembersret:KennedyMember2023-12-310001412502us-gaap:ResidentialRealEstateMembersret:JadestoneMember2023-12-310001412502us-gaap:ResidentialRealEstateMembersret:IslanderMember2023-12-310001412502us-gaap:ResidentialRealEstateMembersret:HuntingtonMember2023-12-310001412502us-gaap:ResidentialRealEstateMembersret:HuntersRunSecondMember2023-12-310001412502us-gaap:ResidentialRealEstateMembersret:HuntersRunFirstMember2023-12-310001412502us-gaap:ResidentialRealEstateMembersret:HighlandMeadowsMember2023-12-310001412502us-gaap:ResidentialRealEstateMembersret:HawnMember2023-12-310001412502us-gaap:ResidentialRealEstateMembersret:HartfordApartmentsMember2023-12-310001412502us-gaap:ResidentialRealEstateMembersret:HannifinMember2023-12-310001412502us-gaap:ResidentialRealEstateMembersret:GrangerCourtMember2023-12-310001412502us-gaap:ResidentialRealEstateMembersret:GlenPondMember2023-12-310001412502us-gaap:ResidentialRealEstateMembersret:GlenPondAdditionMember2023-12-310001412502us-gaap:ResidentialRealEstateMembersret:GeorgetownOnRiverMember2023-12-310001412502us-gaap:ResidentialRealEstateMembersret:GardenGroveMember2023-12-310001412502us-gaap:ResidentialRealEstateMembersret:GalleriaThirdMember2023-12-310001412502us-gaap:ResidentialRealEstateMembersret:ForestAvenueMember2023-12-310001412502us-gaap:ResidentialRealEstateMembersret:FlickertailMember2023-12-310001412502us-gaap:ResidentialRealEstateMembersret:FlagstoneMember2023-12-310001412502us-gaap:ResidentialRealEstateMembersret:FairviewMember2023-12-310001412502us-gaap:ResidentialRealEstateMembersret:EvergreenTerraceMember2023-12-310001412502us-gaap:ResidentialRealEstateMembersret:EssexMember2023-12-310001412502us-gaap:ResidentialRealEstateMembersret:EchoManorMember2023-12-310001412502us-gaap:ResidentialRealEstateMembersret:EastbrookMember2023-12-310001412502us-gaap:ResidentialRealEstateMembersret:EastBridgeMember2023-12-310001412502us-gaap:ResidentialRealEstateMembersret:EagleRunMember2023-12-310001412502us-gaap:ResidentialRealEstateMembersret:DiamondBendMember2023-12-310001412502us-gaap:ResidentialRealEstateMembersret:DesotoTownhomesMember2023-12-310001412502us-gaap:ResidentialRealEstateMembersret:DesotoEstatesMember2023-12-310001412502us-gaap:ResidentialRealEstateMembersret:DellwoodEstatesMember2023-12-310001412502us-gaap:ResidentialRealEstateMembersret:DeerParkMember2023-12-310001412502us-gaap:ResidentialRealEstateMembersret:DanburyMember2023-12-310001412502us-gaap:ResidentialRealEstateMembersret:DakotaManorMember2023-12-310001412502us-gaap:ResidentialRealEstateMembersret:CourtyardMember2023-12-310001412502us-gaap:ResidentialRealEstateMembersret:CountrysideMember2023-12-310001412502us-gaap:ResidentialRealEstateMembersret:CountryClubMember2023-12-310001412502us-gaap:ResidentialRealEstateMembersret:ColumbiaWestMember2023-12-310001412502us-gaap:ResidentialRealEstateMembersret:ColumbiaParkVillageIMember2023-12-310001412502us-gaap:ResidentialRealEstateMembersret:CobaltApartmentsMember2023-12-310001412502us-gaap:ResidentialRealEstateMembersret:CitysideApartmentsMember2023-12-310001412502us-gaap:ResidentialRealEstateMembersret:Chandler1866Member2023-12-310001412502us-gaap:ResidentialRealEstateMembersret:Chandler1834Member2023-12-310001412502us-gaap:ResidentialRealEstateMembersret:Chandler1802Member2023-12-310001412502us-gaap:ResidentialRealEstateMembersret:CarrMember2023-12-310001412502us-gaap:ResidentialRealEstateMembersret:CarltonPlaceMember2023-12-310001412502us-gaap:ResidentialRealEstateMembersret:CarlingManorMember2023-12-310001412502us-gaap:ResidentialRealEstateMembersret:CandlelightMember2023-12-310001412502us-gaap:ResidentialRealEstateMembersret:CambridgeFka44thStreetMember2023-12-310001412502us-gaap:ResidentialRealEstateMembersret:BrownstoneMember2023-12-310001412502us-gaap:ResidentialRealEstateMembersret:BrookfieldMember2023-12-310001412502us-gaap:ResidentialRealEstateMembersret:BristolParkMember2023-12-310001412502us-gaap:ResidentialRealEstateMembersret:BridgeportMember2023-12-310001412502us-gaap:ResidentialRealEstateMembersret:BriarPointeMember2023-12-310001412502us-gaap:ResidentialRealEstateMembersret:BradburyApartmentsMember2023-12-310001412502us-gaap:ResidentialRealEstateMembersret:BirchwoodTwoMember2023-12-310001412502us-gaap:ResidentialRealEstateMembersret:BirchwoodOneMember2023-12-310001412502us-gaap:ResidentialRealEstateMembersret:BettyAnnMember2023-12-310001412502us-gaap:ResidentialRealEstateMembersret:BerkshireMember2023-12-310001412502us-gaap:ResidentialRealEstateMembersret:BelmontEastAndWestMember2023-12-310001412502us-gaap:ResidentialRealEstateMembersret:BayviewMember2023-12-310001412502us-gaap:ResidentialRealEstateMembersret:BarrettArmsMember2023-12-310001412502us-gaap:ResidentialRealEstateMembersret:AutumnRidgeMember2023-12-310001412502us-gaap:ResidentialRealEstateMembersret:AuburnTwoMember2023-12-310001412502us-gaap:ResidentialRealEstateMembersret:AshburyMember2023-12-310001412502us-gaap:ResidentialRealEstateMembersret:ArborTwoMember2023-12-310001412502us-gaap:ResidentialRealEstateMembersret:ArborThreeMember2023-12-310001412502us-gaap:ResidentialRealEstateMembersret:ArborOneMember2023-12-310001412502us-gaap:ResidentialRealEstateMembersret:AmberWoodMember2023-12-310001412502us-gaap:LandMembersret:TacoBellLandMember2023-12-310001412502srt:RetailSiteMembersret:WalgreensFayettevilleArMember2023-12-310001412502srt:RetailSiteMembersret:WalgreensDenverCoMember2023-12-310001412502srt:RetailSiteMembersret:WalgreensBatesvilleArMember2023-12-310001412502srt:OfficeBuildingMembersret:TrustmarkMember2023-12-310001412502srt:OfficeBuildingMembersret:ParkwayOfficeBuildingFkaEchelonMember2023-12-310001412502srt:OfficeBuildingMembersret:MidtownPlazaMember2023-12-310001412502srt:OfficeBuildingMembersret:GreatAmericanBldgMember2023-12-310001412502srt:OfficeBuildingMembersret:GoldmarkOfficeParkMember2023-12-310001412502srt:OfficeBuildingMembersret:BluemontLakesFinancialCenterMember2023-12-310001412502srt:OfficeBuildingMembersret:BellPlazaMember2023-12-310001412502srt:IndustrialPropertyMembersret:TitanMachinerySiouxMember2023-12-310001412502srt:IndustrialPropertyMembersret:TitanMachineryMarshallMember2023-12-310001412502srt:IndustrialPropertyMembersret:TitanMachineryFargoMember2023-12-310001412502srt:IndustrialPropertyMembersret:TitanMachineryDickinsonMember2023-12-310001412502srt:IndustrialPropertyMembersret:TitanMachineryBismarckMember2023-12-310001412502srt:IndustrialPropertyMembersret:GuardianBuildingProductsMember2023-12-310001412502sret:MedicalPropertyMembersret:BioLifeStevensPointMember2023-12-310001412502sret:MedicalPropertyMembersret:BioLifeSheboyganMember2023-12-310001412502sret:MedicalPropertyMembersret:BioLifeOshkoshMember2023-12-310001412502sret:MedicalPropertyMembersret:BioLifeOnalaskaMember2023-12-310001412502sret:MedicalPropertyMembersret:BioLifeMankatoMember2023-12-310001412502sret:MedicalPropertyMembersret:BioLifeJanesvilleMember2023-12-310001412502sret:MedicalPropertyMembersret:BioLifeGrandForksMember2023-12-310001412502sret:MedicalPropertyMembersret:BioLifeBismarckMember2023-12-310001412502us-gaap:LandMember2023-12-310001412502srt:RetailSiteMember2023-12-310001412502srt:OfficeBuildingMember2023-12-310001412502srt:IndustrialPropertyMember2023-12-310001412502sret:MedicalPropertyMember2023-12-310001412502sret:ProseFossilCreekFortWorthTxMember2022-12-292022-12-290001412502sret:Chandler1898GrandForksNdMember2022-12-012022-12-010001412502sret:NewgateApartmentsBismarckNdMember2022-09-132022-09-130001412502sret:DiamondBendMandanNdMember2022-06-102022-06-100001412502sret:DesotaTownhomesGrandForksNdMember2022-05-312022-05-310001412502sret:DesotaEstatesGrandForksNdMember2022-05-312022-05-310001412502sret:DesotaApartmentsEastGrandForksMnMember2022-05-312022-05-310001412502sret:DeerParkHutchinsonMnMember2022-02-282022-02-280001412502sret:PinehurstFargoNdMember2021-07-012021-07-010001412502sret:OxfordFargoNdMember2021-07-012021-07-010001412502sret:FlagstoneFargoNdMember2021-06-012021-06-010001412502sret:BrownstoneFargoNdMember2021-06-012021-06-010001412502sret:BriarPointeFargoNdMember2021-06-012021-06-010001412502us-gaap:AdditionalPaidInCapitalMember2023-01-012023-12-310001412502sret:BeneficialInterestMember2023-01-012023-12-310001412502us-gaap:AdditionalPaidInCapitalMember2022-01-012022-12-310001412502sret:BeneficialInterestMember2022-01-012022-12-310001412502us-gaap:AdditionalPaidInCapitalMember2021-01-012021-12-310001412502sret:BeneficialInterestMember2021-01-012021-12-310001412502us-gaap:CommonStockMember2023-01-012023-12-310001412502us-gaap:CommonStockMember2022-01-012022-12-310001412502us-gaap:CommonStockMember2021-01-012021-12-310001412502sret:RealEstatePropertyAcquisitions2022Member2022-12-310001412502sret:RealEstatePropertyAcquisitions2021Member2021-12-310001412502sret:ShareRedemptionPlansMember2022-01-012022-01-010001412502sret:ShareRedemptionPlansMember2020-01-012020-12-310001412502sret:ResidentialMember2021-01-012021-12-310001412502sret:CommercialMember2021-01-012021-12-310001412502sret:GoldmarkSchlossmanCommercialRealEstateServicesMember2023-12-310001412502sret:GoldmarkPropertyManagementMember2023-12-310001412502sret:GoldmarkSchlossmanCommercialRealEstateServicesMember2022-12-310001412502sret:GoldmarkPropertyManagementMember2022-12-310001412502sret:GoldmarkSchlossmanCommercialRealEstateServicesMember2021-12-310001412502sret:GoldmarkPropertyManagementMember2021-12-310001412502sret:GoldmarkSchlossmanCommercialRealEstateServicesMember2022-01-012022-12-310001412502sret:GoldmarkSchlossmanCommercialRealEstateServicesMember2021-01-012021-12-310001412502us-gaap:ResidentialRealEstateMembersret:WoodlandPinesMember2023-01-012023-12-310001412502us-gaap:ResidentialRealEstateMembersret:WolfCreekMember2023-01-012023-12-310001412502us-gaap:ResidentialRealEstateMembersret:WillowParkMember2023-01-012023-12-310001412502us-gaap:ResidentialRealEstateMembersret:WestwoodMember2023-01-012023-12-310001412502us-gaap:ResidentialRealEstateMembersret:WestwindMember2023-01-012023-12-310001412502us-gaap:ResidentialRealEstateMembersret:WestsideMember2023-01-012023-12-310001412502us-gaap:ResidentialRealEstateMembersret:WestOakMember2023-01-012023-12-310001412502us-gaap:ResidentialRealEstateMembersret:WestcourtMember2023-01-012023-12-310001412502us-gaap:ResidentialRealEstateMembersret:WashingtonPropertyMember2023-01-012023-12-310001412502us-gaap:ResidentialRealEstateMembersret:VillageWestMember2023-01-012023-12-310001412502us-gaap:ResidentialRealEstateMembersret:VillageParkMember2023-01-012023-12-310001412502us-gaap:ResidentialRealEstateMembersret:ValleyViewMember2023-01-012023-12-310001412502us-gaap:ResidentialRealEstateMembersret:ValleyHomesDuplexesGrandForksNdMember2023-01-012023-12-310001412502us-gaap:ResidentialRealEstateMembersret:TwinParksMember2023-01-012023-12-310001412502us-gaap:ResidentialRealEstateMembersret:TwinOaksMember2023-01-012023-12-310001412502us-gaap:ResidentialRealEstateMembersret:ThunderCreekMember2023-01-012023-12-310001412502us-gaap:ResidentialRealEstateMembersret:SunwoodMember2023-01-012023-12-310001412502us-gaap:ResidentialRealEstateMembersret:SunviewMember2023-01-012023-12-310001412502us-gaap:ResidentialRealEstateMembersret:SunsetRidgeMember2023-01-012023-12-310001412502us-gaap:ResidentialRealEstateMembersret:SunchaseMember2023-01-012023-12-310001412502us-gaap:ResidentialRealEstateMembersret:SummitPointMember2023-01-012023-12-310001412502us-gaap:ResidentialRealEstateMembersret:SummerfieldFargoNDMember2023-01-012023-12-310001412502us-gaap:ResidentialRealEstateMembersret:StonybrookMember2023-01-012023-12-310001412502us-gaap:ResidentialRealEstateMembersret:StonefieldPhaseTwoMember2023-01-012023-12-310001412502us-gaap:ResidentialRealEstateMembersret:StonefieldPhaseThreeMember2023-01-012023-12-310001412502us-gaap:ResidentialRealEstateMembersret:StonefieldPhaseOneMember2023-01-012023-12-310001412502us-gaap:ResidentialRealEstateMembersret:StanfordCourtMember2023-01-012023-12-310001412502us-gaap:ResidentialRealEstateMembersret:SpringMember2023-01-012023-12-310001412502us-gaap:ResidentialRealEstateMembersret:SouthviewVillagesMember2023-01-012023-12-310001412502us-gaap:ResidentialRealEstateMembersret:SouthviewThirdMember2023-01-012023-12-310001412502us-gaap:ResidentialRealEstateMembersret:SouthgateMember2023-01-012023-12-310001412502us-gaap:ResidentialRealEstateMembersret:SomersetMember2023-01-012023-12-310001412502us-gaap:ResidentialRealEstateMembersret:SierraRidgeMember2023-01-012023-12-310001412502us-gaap:ResidentialRealEstateMembersret:SheridanPointeMember2023-01-012023-12-310001412502us-gaap:ResidentialRealEstateMembersret:SchrockMember2023-01-012023-12-310001412502us-gaap:ResidentialRealEstateMembersret:SargentMember2023-01-012023-12-310001412502us-gaap:ResidentialRealEstateMembersret:SageParkMember2023-01-012023-12-310001412502us-gaap:ResidentialRealEstateMembersret:SaddlebrookMember2023-01-012023-12-310001412502us-gaap:ResidentialRealEstateMembersret:RoughriderMember2023-01-012023-12-310001412502us-gaap:ResidentialRealEstateMembersret:RosserMember2023-01-012023-12-310001412502us-gaap:ResidentialRealEstateMembersret:RosegateMember2023-01-012023-12-310001412502us-gaap:ResidentialRealEstateMembersret:RosedaleEstatesMember2023-01-012023-12-310001412502us-gaap:ResidentialRealEstateMembersret:RobinwoodMember2023-01-012023-12-310001412502us-gaap:ResidentialRealEstateMembersret:QuailCreekSpringfieldMoMember2023-01-012023-12-310001412502us-gaap:ResidentialRealEstateMembersret:PrairiewoodMeadowsMember2023-01-012023-12-310001412502us-gaap:ResidentialRealEstateMembersret:PrairiewoodCourtsMember2023-01-012023-12-310001412502us-gaap:ResidentialRealEstateMembersret:PlumtreeMember2023-01-012023-12-310001412502us-gaap:ResidentialRealEstateMembersret:PinhurstMember2023-01-012023-12-310001412502us-gaap:ResidentialRealEstateMembersret:PebbleCreekMember2023-01-012023-12-310001412502us-gaap:ResidentialRealEstateMembersret:ParkwoodMember2023-01-012023-12-310001412502us-gaap:ResidentialRealEstateMembersret:ParkwestGardensMember2023-01-012023-12-310001412502us-gaap:ResidentialRealEstateMembersret:ParkviewArmsBismarckNDMember2023-01-012023-12-310001412502us-gaap:ResidentialRealEstateMembersret:ParkCircleMember2023-01-012023-12-310001412502us-gaap:ResidentialRealEstateMembersret:PacificParkTwoMember2023-01-012023-12-310001412502us-gaap:ResidentialRealEstateMembersret:PacificParkSouthMember2023-01-012023-12-310001412502us-gaap:ResidentialRealEstateMembersret:PacificParkMember2023-01-012023-12-310001412502us-gaap:ResidentialRealEstateMembersret:OxfordMember2023-01-012023-12-310001412502us-gaap:ResidentialRealEstateMembersret:OakviewTownhomesMember2023-01-012023-12-310001412502us-gaap:ResidentialRealEstateMembersret:OakCourtMember2023-01-012023-12-310001412502us-gaap:ResidentialRealEstateMembersret:NewgateMember2023-01-012023-12-310001412502us-gaap:ResidentialRealEstateMembersret:MorningsideApartmentsMember2023-01-012023-12-310001412502us-gaap:ResidentialRealEstateMembersret:MontrealCourtsMember2023-01-012023-12-310001412502us-gaap:ResidentialRealEstateMembersret:MonticelloMember2023-01-012023-12-310001412502us-gaap:ResidentialRealEstateMembersret:MayfairMember2023-01-012023-12-310001412502us-gaap:ResidentialRealEstateMembersret:MarthaAliceMember2023-01-012023-12-310001412502us-gaap:ResidentialRealEstateMembersret:MaplewoodMember2023-01-012023-12-310001412502us-gaap:ResidentialRealEstateMembersret:MaplewoodBendOneTwoThreeFourSixSevenEightAndRoyaleMember2023-01-012023-12-310001412502us-gaap:ResidentialRealEstateMembersret:MapleRidgeMember2023-01-012023-12-310001412502us-gaap:ResidentialRealEstateMembersret:MadisonMember2023-01-012023-12-310001412502us-gaap:ResidentialRealEstateMembersret:LibraryLaneMember2023-01-012023-12-310001412502us-gaap:ResidentialRealEstateMembersret:KennedyMember2023-01-012023-12-310001412502us-gaap:ResidentialRealEstateMembersret:JadestoneMember2023-01-012023-12-310001412502us-gaap:ResidentialRealEstateMembersret:IslanderMember2023-01-012023-12-310001412502us-gaap:ResidentialRealEstateMembersret:HuntingtonMember2023-01-012023-12-310001412502us-gaap:ResidentialRealEstateMembersret:HuntersRunSecondMember2023-01-012023-12-310001412502us-gaap:ResidentialRealEstateMembersret:HuntersRunFirstMember2023-01-012023-12-310001412502us-gaap:ResidentialRealEstateMembersret:HighlandMeadowsMember2023-01-012023-12-310001412502us-gaap:ResidentialRealEstateMembersret:HawnMember2023-01-012023-12-310001412502us-gaap:ResidentialRealEstateMembersret:HartfordApartmentsMember2023-01-012023-12-310001412502us-gaap:ResidentialRealEstateMembersret:HarrisonAndRichfieldMember2023-01-012023-12-310001412502us-gaap:ResidentialRealEstateMembersret:HannifinMember2023-01-012023-12-310001412502us-gaap:ResidentialRealEstateMembersret:GrangerCourtMember2023-01-012023-12-310001412502us-gaap:ResidentialRealEstateMembersret:GlenPondMember2023-01-012023-12-310001412502us-gaap:ResidentialRealEstateMembersret:GlenPondAdditionMember2023-01-012023-12-310001412502us-gaap:ResidentialRealEstateMembersret:GeorgetownOnRiverMember2023-01-012023-12-310001412502us-gaap:ResidentialRealEstateMembersret:GardenGroveMember2023-01-012023-12-310001412502us-gaap:ResidentialRealEstateMembersret:GalleriaThirdMember2023-01-012023-12-310001412502us-gaap:ResidentialRealEstateMembersret:FoxtailCreekTownhomesMember2023-01-012023-12-310001412502us-gaap:ResidentialRealEstateMembersret:ForestAvenueMember2023-01-012023-12-310001412502us-gaap:ResidentialRealEstateMembersret:FlickertailMember2023-01-012023-12-310001412502us-gaap:ResidentialRealEstateMembersret:FlagstoneMember2023-01-012023-12-310001412502us-gaap:ResidentialRealEstateMembersret:FairviewMember2023-01-012023-12-310001412502us-gaap:ResidentialRealEstateMembersret:EvergreenTerraceMember2023-01-012023-12-310001412502us-gaap:ResidentialRealEstateMembersret:EssexMember2023-01-012023-12-310001412502us-gaap:ResidentialRealEstateMembersret:EmeraldCourtMember2023-01-012023-12-310001412502us-gaap:ResidentialRealEstateMembersret:EchoManorMember2023-01-012023-12-310001412502us-gaap:ResidentialRealEstateMembersret:EastbrookMember2023-01-012023-12-310001412502us-gaap:ResidentialRealEstateMembersret:EastBridgeMember2023-01-012023-12-310001412502us-gaap:ResidentialRealEstateMembersret:EagleSkyTwoMember2023-01-012023-12-310001412502us-gaap:ResidentialRealEstateMembersret:EagleSkyOneMember2023-01-012023-12-310001412502us-gaap:ResidentialRealEstateMembersret:EagleRunMember2023-01-012023-12-310001412502us-gaap:ResidentialRealEstateMembersret:DiamondBendMember2023-01-012023-12-310001412502us-gaap:ResidentialRealEstateMembersret:DesotoTownhomesMember2023-01-012023-12-310001412502us-gaap:ResidentialRealEstateMembersret:DesotoEstatesMember2023-01-012023-12-310001412502us-gaap:ResidentialRealEstateMembersret:DellwoodEstatesMember2023-01-012023-12-310001412502us-gaap:ResidentialRealEstateMembersret:DeerParkMember2023-01-012023-12-310001412502us-gaap:ResidentialRealEstateMembersret:DanburyMember2023-01-012023-12-310001412502us-gaap:ResidentialRealEstateMembersret:DakotaManorMember2023-01-012023-12-310001412502us-gaap:ResidentialRealEstateMembersret:CourtyardMember2023-01-012023-12-310001412502us-gaap:ResidentialRealEstateMembersret:CountrysideMember2023-01-012023-12-310001412502us-gaap:ResidentialRealEstateMembersret:CountryClubMember2023-01-012023-12-310001412502us-gaap:ResidentialRealEstateMembersret:ColumbiaWestMember2023-01-012023-12-310001412502us-gaap:ResidentialRealEstateMembersret:ColumbiaParkVillageIMember2023-01-012023-12-310001412502us-gaap:ResidentialRealEstateMembersret:CobaltApartmentsMember2023-01-012023-12-310001412502us-gaap:ResidentialRealEstateMembersret:CitysideApartmentsMember2023-01-012023-12-310001412502us-gaap:ResidentialRealEstateMembersret:CherryCreekFkaVillageMember2023-01-012023-12-310001412502us-gaap:ResidentialRealEstateMembersret:Chandler1898Member2023-01-012023-12-310001412502us-gaap:ResidentialRealEstateMembersret:Chandler1866Member2023-01-012023-12-310001412502us-gaap:ResidentialRealEstateMembersret:Chandler1834Member2023-01-012023-12-310001412502us-gaap:ResidentialRealEstateMembersret:Chandler1802Member2023-01-012023-12-310001412502us-gaap:ResidentialRealEstateMembersret:CedarsFourMember2023-01-012023-12-310001412502us-gaap:ResidentialRealEstateMembersret:CarrMember2023-01-012023-12-310001412502us-gaap:ResidentialRealEstateMembersret:CarltonPlaceMember2023-01-012023-12-310001412502us-gaap:ResidentialRealEstateMembersret:CarlingManorMember2023-01-012023-12-310001412502us-gaap:ResidentialRealEstateMembersret:CandlelightMember2023-01-012023-12-310001412502us-gaap:ResidentialRealEstateMembersret:CambridgeFka44thStreetMember2023-01-012023-12-310001412502us-gaap:ResidentialRealEstateMembersret:BrownstoneMember2023-01-012023-12-310001412502us-gaap:ResidentialRealEstateMembersret:BrookfieldMember2023-01-012023-12-310001412502us-gaap:ResidentialRealEstateMembersret:BristolParkMember2023-01-012023-12-310001412502us-gaap:ResidentialRealEstateMembersret:BridgeportMember2023-01-012023-12-310001412502us-gaap:ResidentialRealEstateMembersret:BriarPointeMember2023-01-012023-12-310001412502us-gaap:ResidentialRealEstateMembersret:BradburyApartmentsMember2023-01-012023-12-310001412502us-gaap:ResidentialRealEstateMembersret:BirchwoodTwoMember2023-01-012023-12-310001412502us-gaap:ResidentialRealEstateMembersret:BirchwoodOneMember2023-01-012023-12-310001412502us-gaap:ResidentialRealEstateMembersret:BettyAnnMember2023-01-012023-12-310001412502us-gaap:ResidentialRealEstateMembersret:BerkshireMember2023-01-012023-12-310001412502us-gaap:ResidentialRealEstateMembersret:BelmontEastAndWestMember2023-01-012023-12-310001412502us-gaap:ResidentialRealEstateMembersret:BayviewMember2023-01-012023-12-310001412502us-gaap:ResidentialRealEstateMembersret:BarrettArmsMember2023-01-012023-12-310001412502us-gaap:ResidentialRealEstateMembersret:AutumnRidgeMember2023-01-012023-12-310001412502us-gaap:ResidentialRealEstateMembersret:AuburnTwoMember2023-01-012023-12-310001412502us-gaap:ResidentialRealEstateMembersret:AshburyMember2023-01-012023-12-310001412502us-gaap:ResidentialRealEstateMembersret:ArborTwoMember2023-01-012023-12-310001412502us-gaap:ResidentialRealEstateMembersret:ArborThreeMember2023-01-012023-12-310001412502us-gaap:ResidentialRealEstateMembersret:ArborOneMember2023-01-012023-12-310001412502us-gaap:ResidentialRealEstateMembersret:AmberWoodMember2023-01-012023-12-310001412502us-gaap:LandMembersret:TacoBellLandMember2023-01-012023-12-310001412502us-gaap:LandMembersret:RochesterDevelopmentLandMember2023-01-012023-12-310001412502srt:RetailSiteMembersret:WalgreensLaurelMsMember2023-01-012023-12-310001412502srt:RetailSiteMembersret:WalgreensFayettevilleArMember2023-01-012023-12-310001412502srt:RetailSiteMembersret:WalgreensDenverCoMember2023-01-012023-12-310001412502srt:RetailSiteMembersret:WalgreensBatesvilleArMember2023-01-012023-12-310001412502srt:RetailSiteMembersret:WalgreensAlexandriaLaMember2023-01-012023-12-310001412502srt:RetailSiteMembersret:OreillyMandanNdMember2023-01-012023-12-310001412502srt:RetailSiteMembersret:FamilyDollarMandanNdMember2023-01-012023-12-310001412502srt:RetailSiteMembersret:DairyQueenMoorheadMember2023-01-012023-12-310001412502srt:RetailSiteMembersret:DairyQueenDickinsonMember2023-01-012023-12-310001412502srt:RetailSiteMembersret:DairyQueenAppleValleyMnMember2023-01-012023-12-310001412502srt:OfficeBuildingMembersret:WellsFargoCenterMember2023-01-012023-12-310001412502srt:OfficeBuildingMembersret:TrustmarkMember2023-01-012023-12-310001412502srt:OfficeBuildingMembersret:ParkwayOfficeBuildingFkaEchelonMember2023-01-012023-12-310001412502srt:OfficeBuildingMembersret:MidtownPlazaMember2023-01-012023-12-310001412502srt:OfficeBuildingMembersret:GreatAmericanBldgMember2023-01-012023-12-310001412502srt:OfficeBuildingMembersret:GoldmarkOfficeParkMember2023-01-012023-12-310001412502srt:OfficeBuildingMembersret:GateCityMember2023-01-012023-12-310001412502srt:OfficeBuildingMembersret:FourPointsMember2023-01-012023-12-310001412502srt:OfficeBuildingMembersret:FirstInternationalBankAndTrustMember2023-01-012023-12-310001412502srt:OfficeBuildingMembersret:BluemontLakesFinancialCenterMember2023-01-012023-12-310001412502srt:OfficeBuildingMembersret:BellPlazaMember2023-01-012023-12-310001412502srt:IndustrialPropertyMembersret:TitanMachinerySiouxMember2023-01-012023-12-310001412502srt:IndustrialPropertyMembersret:TitanMachineryNorthPlatteNeMember2023-01-012023-12-310001412502srt:IndustrialPropertyMembersret:TitanMachineryMinotMember2023-01-012023-12-310001412502srt:IndustrialPropertyMembersret:TitanMachineryMarshallMember2023-01-012023-12-310001412502srt:IndustrialPropertyMembersret:TitanMachineryFargoMember2023-01-012023-12-310001412502srt:IndustrialPropertyMembersret:TitanMachineryDickinsonMember2023-01-012023-12-310001412502srt:IndustrialPropertyMembersret:TitanMachineryBismarckMember2023-01-012023-12-310001412502srt:IndustrialPropertyMembersret:GuardianBuildingProductsMember2023-01-012023-12-310001412502sret:MedicalPropertyMembersret:BioLifeStevensPointMember2023-01-012023-12-310001412502sret:MedicalPropertyMembersret:BioLifeSheboyganMember2023-01-012023-12-310001412502sret:MedicalPropertyMembersret:BioLifeOshkoshMember2023-01-012023-12-310001412502sret:MedicalPropertyMembersret:BioLifeOnalaskaMember2023-01-012023-12-310001412502sret:MedicalPropertyMembersret:BioLifeMarquetteMember2023-01-012023-12-310001412502sret:MedicalPropertyMembersret:BioLifeMankatoMember2023-01-012023-12-310001412502sret:MedicalPropertyMembersret:BioLifeJanesvilleMember2023-01-012023-12-310001412502sret:MedicalPropertyMembersret:BioLifeGrandForksMember2023-01-012023-12-310001412502sret:MedicalPropertyMembersret:BioLifeBismarckMember2023-01-012023-12-310001412502us-gaap:ResidentialRealEstateMember2023-12-310001412502us-gaap:CommercialRealEstateMember2023-12-310001412502us-gaap:EquityMethodInvestmentNonconsolidatedInvesteeOrGroupOfInvesteesMember2023-12-310001412502us-gaap:EquityMethodInvestmentNonconsolidatedInvesteeOrGroupOfInvesteesMember2022-12-310001412502srt:AffiliatedEntityMember2023-01-012023-12-310001412502sret:EntityAffiliatedWithMessrsReganAndWielandMember2022-01-012022-12-310001412502srt:AffiliatedEntityMember2021-01-012021-12-310001412502sret:ResidentialMember2023-01-012023-12-310001412502sret:CommercialMember2023-01-012023-12-310001412502sret:ResidentialMember2022-01-012022-12-310001412502sret:CommercialMember2022-01-012022-12-310001412502us-gaap:CommercialRealEstateMember2023-01-012023-12-310001412502sret:NotesReceivableInRelationToInvestmentsInUnconsolidatedAffiliatesMember2023-12-310001412502sret:VariableRateMortgageNotesPayableMembersret:MortgageNotesPayableMember2022-01-012022-12-310001412502us-gaap:DisposalGroupHeldforsaleNotDiscontinuedOperationsMembersret:RetailPropertyAppleValleyMinnesotaMember2023-01-012023-12-310001412502us-gaap:DisposalGroupHeldforsaleNotDiscontinuedOperationsMember2023-01-012023-12-310001412502us-gaap:DisposalGroupDisposedOfBySaleNotDiscontinuedOperationsMember2023-01-012023-12-310001412502us-gaap:DisposalGroupHeldforsaleNotDiscontinuedOperationsMember2022-01-012022-12-310001412502us-gaap:DisposalGroupDisposedOfBySaleNotDiscontinuedOperationsMember2022-01-012022-12-310001412502us-gaap:DisposalGroupDisposedOfBySaleNotDiscontinuedOperationsMember2021-01-012021-12-310001412502sret:NoteReceivableForCommercialTenantMember2023-12-310001412502sret:MortgageNotesPayableMember2023-12-310001412502sret:MortgageNotesPayableMember2022-12-310001412502sret:MortgageNotesPayableMember2023-01-012023-12-310001412502sret:MortgageNotesPayableMember2022-01-012022-12-310001412502sret:GoldmarkPropertyManagementMember2023-01-012023-12-310001412502sret:GoldmarkPropertyManagementMember2022-01-012022-12-310001412502sret:GoldmarkPropertyManagementMember2021-01-012021-12-310001412502sret:BellBankMember2023-12-310001412502sret:BellBankMember2022-12-310001412502sret:OperatingPartnershipMembersret:StOakCliffMember2023-12-310001412502sret:OperatingPartnershipMembersret:SESavageMember2023-12-310001412502sret:OperatingPartnershipMembersret:SeRogersMember2023-12-310001412502sret:OperatingPartnershipMembersret:SeMapleGroveMember2023-12-310001412502sret:OperatingPartnershipMembersret:SeFossilCreekLlcMember2023-12-310001412502sret:OperatingPartnershipMembersret:SeBrooklynParkLLCMember2023-12-310001412502sret:OperatingPartnershipMembersret:GrandForksMarketplaceRetailCenterMember2023-12-310001412502sret:OperatingPartnershipMembersret:BannerBuildingMember2023-12-310001412502sret:OperatingPartnershipMembersret:StOakCliffMember2022-12-310001412502sret:OperatingPartnershipMembersret:SESavageMember2022-12-310001412502sret:OperatingPartnershipMembersret:SeRogersMember2022-12-310001412502sret:OperatingPartnershipMembersret:SeMapleGroveMember2022-12-310001412502sret:OperatingPartnershipMembersret:SeFossilCreekLlcMember2022-12-310001412502sret:OperatingPartnershipMembersret:SeBrooklynParkLLCMember2022-12-310001412502sret:OperatingPartnershipMembersret:GrandForksMarketplaceRetailCenterMember2022-12-310001412502sret:OperatingPartnershipMembersret:BannerBuildingMember2022-12-310001412502sret:BellBankMember2023-01-012023-12-310001412502sret:BellBankMember2022-01-012022-12-310001412502sret:BellBankMember2021-01-012021-12-3100014125022020-11-0300014125022017-07-1100014125022012-07-200001412502us-gaap:DisposalGroupHeldforsaleNotDiscontinuedOperationsMembersret:RetailPropertyAppleValleyMinnesotaMember2023-12-310001412502sret:TrumontGroupLlcMember2022-12-310001412502sret:TrumontGroupLlcMember2022-01-012022-12-310001412502sret:FixedRateMortgageNotesPayableMembersret:MortgageNotesPayableMember2023-01-012023-12-310001412502sret:FixedRateMortgageNotesPayableMembersret:MortgageNotesPayableMember2022-01-012022-12-310001412502sret:TrumontConstructionLlcMember2023-12-310001412502sret:TrumontConstructionLlcMember2022-12-310001412502sret:TrumontConstructionLlcMember2023-01-012023-12-310001412502sret:TrumontConstructionLlcMember2022-01-012022-12-310001412502sret:OperatingPartnershipMembersret:StOakCliffMember2023-01-012023-12-310001412502sret:OperatingPartnershipMembersret:SeFossilCreekLlcMember2023-01-012023-12-310001412502sret:StOakCliffMember2023-12-310001412502sret:SeRogersMember2023-12-310001412502sret:SeFossilCreekLlcMember2023-12-310001412502sret:SeBrooklynParkLLCMember2023-12-310001412502sret:StOakCliffMember2022-12-310001412502sret:SeRogersMember2022-12-310001412502sret:SeFossilCreekLlcMember2022-12-310001412502sret:SeBrooklynParkLLCMember2022-12-310001412502sret:AggregateAssetAcquisitionsMember2022-12-310001412502sret:RealEstatePropertyAcquisitions2022Member2022-01-012022-12-310001412502sret:RealEstatePropertyAcquisitions2021Member2021-01-012021-12-310001412502sret:SterlingManagementLlcMember2023-12-310001412502sret:SterlingManagementLlcMember2023-01-012023-12-310001412502sret:SterlingManagementLlcMember2022-01-012022-12-310001412502sret:SterlingManagementLlcMember2021-01-012021-12-310001412502sret:ShareRedemptionPlansMember2023-01-012023-12-310001412502sret:ShareRedemptionPlansMember2022-01-012022-12-310001412502sret:ShareRedemptionPlansMember2021-01-012021-12-3100014125022022-01-012022-12-3100014125022021-01-012021-12-310001412502sret:SterlingManagementLlcMember2022-12-3100014125022023-12-3100014125022022-12-3100014125022023-10-012023-12-3100014125022023-06-3000014125022024-03-1300014125022023-01-012023-12-31sret:segmentxbrli:sharesiso4217:USDxbrli:pureiso4217:USDxbrli:sharessret:loansret:propertysret:itemsret:employeesret:instrument

Table of Contents

UNITED STATES

SECURITIES AND EXCHANGE COMMISSION

Washington, D.C. 20549

FORM 10-K

ANNUAL REPORT PURSUANT TO SECTION 13 OR 15(d) OF THE SECURITIES EXCHANGE ACT OF 1934

For the fiscal year ended December 31, 2023

or

TRANSITION REPORT PURSUANT TO SECTION 13 OR 15(d) OF THE SECURITIES EXCHANGE ACT OF 1934

For the transition period from to

Commission File Number 000-54295

Sterling Real Estate Trust

d/b/a Sterling Multifamily Trust

(Exact name of registrant as specified in its charter)

North Dakota

90-0115411

(State or other jurisdiction of
incorporation or organization)

(I.R.S. Employer
Identification Number)

4340 18th Ave South Ste. 200

Fargo, North Dakota

58103

(Address of principal executive offices)

(Zip Code)

(701) 353-2720

(Registrant’s telephone number, including area code)

Securities registered pursuant to Section 12(b) of the Act:

Title of each class:


Trading Symbol


Name of each exchange on which registered:

Common Shares of Beneficial Interest, par value $0.01 per share

N/A

N/A

Securities registered pursuant to Section 12(g) of the Act: none

Indicate by check mark if the registrant is a well-known seasoned issuer, as defined in Rule 405 of the Securities Act. Yes No

Indicate by check mark if the registrant is not required to file reports pursuant to Section 13 or Section 15(d) of the Exchange Act. Yes No

Indicate by check mark whether the registrant: (1) has filed all reports required to be filed by Section 13 or 15(d) of the Securities Exchange Act of 1934 during the preceding 12 months (or for such shorter period that the registrant was required to file such reports), and (2) has been subject to such filing requirements for the past 90 days. Yes No

Indicate by checkmark whether the registrant has submitted electronically, every Interactive Data File required to be submitted pursuant to Rule 405 of Regulation S-T (§232.405 of this chapter) during the preceding 12 months (or for such shorter period that the Registrant was required to submit such files). Yes No

Indicate by check mark whether the registrant is a large accelerated filer, an accelerated filer, a non-accelerated filer, a smaller reporting company, or an emerging growth company. See the definitions of “large accelerated filer,” “accelerated filer”, “smaller reporting company”, and “emerging growth company” in Rule 12b-2 of the Exchange Act.

Large accelerated filer


Accelerated filer

Non-accelerated filer

Smaller reporting company

Emerging growth company

If an emerging growth company, indicate by check mark if the registrant has elected not to use the extended transition period for complying with any new or revised financial accounting standards provided pursuant to Section 13(a) of the Exchange Act.  

Indicate by check mark whether the registrant has filed a report on and attestation to its management’s assessment of the effectiveness of its internal control over financial reporting under Section 404(b) of the Sarbanes-Oxley Act (15 U.S.C. 7262(b)) by the registered public accounting firm that prepared or issued its audit report.  

If securities are registered pursuant to Section 12(b) of the Act, indicate by check mark whether the financial statements of the registrant included in the filing reflect the correction of an error to previously issued financial statements.

Indicate by check mark whether any of those error corrections are restatements that required a recovery analysis of incentive-based compensation received by any of the registrant’s executive officers during the relevant recovery period pursuant to §240.10D-1(b).

Indicate by check mark whether the registrant is a shell company (as defined in Rule 12b-2 of the Exchange Act). Yes No

There is no established public market for the registrant’s shares of common stock.

Indicate the number of shares outstanding of each of the issuer’s classes of common shares, as of the latest practicable date.

Class


Outstanding at March 13, 2024

Common Shares of Beneficial Interest, $0.01 par value per share

11,331,382

Documents Incorporated by Reference: Portions of Sterling’s Proxy Statement for its 2023 Annual Meeting of Shareholders, which Sterling intends to file with the Securities and Exchange Commission within 120 days after the end of Sterling’s fiscal year ended December 31, 2023, are incorporated by reference into Part III (Items 10, 11, 12, 13 and 14) of this Annual Report on Form 10-K to the extent described herein. If Sterling does not file its Proxy Statement on or before 120 days after the end of its 2023 fiscal year, Sterling will file the required information in an amendment to this Annual Report on Form 10-K.

Table of Contents

Sterling Real Estate Trust

INDEX

PAGE

PART I

Item 1. Business

3

Item 1A. Risk Factors

8

Item 1B. Unresolved Staff Comments

23

Item 1C. Cybersecurity

23

Item 2. Properties

24

Item 3. Legal Proceedings

30

Item 4. Mine Safety Disclosures

30

PART II

Item 5. Market for Registrant’s Common Equity, Related Shareholder Matters and Issuer Purchases of Equity Securities

30

Item 6. Selected Financial Data

32

Item 7. Management’s Discussion and Analysis of Financial Condition and Results of Operations

32

Item 7A. Quantitative and Qualitative Disclosures about Market Risk

43

Item 8. Financial Statements and Supplementary Data

43

Item 9. Changes in and Disagreements with Accountants on Accounting and Financial Disclosure

44

Item 9A. Controls and Procedures

44

Item 9B. Other Information

45

PART III

Item 10. Trustees, Executive Officers and Corporate Governance

45

Item 11. Executive Compensation

45

Item 12. Security Ownership of Certain Beneficial Owners and Management and Related Shareholder Matters

45

Item 13. Certain Relationships and Related Transactions, and Trustee Independence

45

Item 14. Principal Accountant Fees and Services

45

PART IV

Item 15. Exhibits and Financial Statement Schedules

46

Item 16. Form 10-K Summary

46

Report of Independent Registered Public Accounting Firm and Financial Statements

49

Signatures

92

2

Table of Contents

NOTE REGARDING FORWARD-LOOKING STATEMENTS

Certain statements included in this Annual Report on Form 10-K and the documents incorporated into this document by reference contain certain “forward-looking statements” within the meaning of Section 27A of the Securities Act of 1933, as amended (the “Securities Act”), and Section 21E of the Securities Exchange Act of 1934, as amended (the “Exchange Act”). Such forward-looking statements include statements regarding our plans and objectives, including, among other things, our future financial condition, anticipated capital expenditures, anticipated dividends and other matters. Forward-looking statements are typically identified by the use of terms such as “may,” “will,” “should,” “expect,” “intend,” “plan,” “anticipate,” “estimate,” “believe,” “continue,” “predict,” “potential” or the negative of such terms and other comparable terminology. These statements are only predictions and are not historical facts. Actual events or results may differ materially.

The forward-looking statements included herein are based on our current expectations, plans, estimates and beliefs that involve numerous risks and uncertainties. Assumptions relating to the foregoing involve judgments with respect to, among other things, future economic, competitive and market conditions and future business decisions, all of which are difficult or impossible to predict accurately and many of which are beyond our control. Any of the assumptions underlying the forward-looking statements contained herein could be inaccurate. Although we believe the expectations reflected in such forward-looking statements are based on reasonable assumptions, we cannot assure readers that the forward-looking statements included in this filing will prove to be accurate. The accompanying information contained in this Annual Report on Form 10-K, including, without limitation, the information set forth under the section entitled “Risk Factors” in Item 1A, identifies important additional factors that could materially adversely affect actual results and performance. We undertake no obligation to update or revise forward-looking statements to reflect changed assumptions, the occurrence of certain unanticipated events or changes to future operating results.

PART I

All dollar amounts in this Form 10-K are stated in thousands with the exception of share and per share amounts, unless otherwise indicated.

ITEM 1.  BUSINESS

GENERAL

Sterling Real Estate Trust (“we,” “us,” “our,” “Company,” “Trust” or “Sterling”) is a real estate investment trust (“REIT”). Sterling was registered in North Dakota as an unincorporated business trust in December 2002.  References in this Annual Report on Form 10-K to the “Company,” “Sterling,” “Trust,” “we,” “us,” or “our” include consolidated subsidiaries, unless the context indicates otherwise. As a REIT, we are not subject to U.S. federal income taxation as long as we satisfy certain requirements, principally relating to the nature of our income, the level of our dividends and other factors.  As of December 31, 2023, we owned directly or through our operating partnership, 183 properties in 12 states.

UPREIT Structure

The Trust operates as an Umbrella Partnership Real Estate Investment Trust, which is a REIT that holds all or substantially all of its assets through a partnership which the REIT controls as general partner. Therefore, the Trust conducts substantially all investment activities and holds substantially all of the Trust’s assets through the operating partnership Sterling Properties, LLLP. The Trust controls the operating partnership as the general partner and owns approximately 37.72% of the operating partnership as of December 31, 2023. For purposes of satisfying the asset and income tests for qualification as a REIT for tax purposes, the proportionate shares of the assets and income of the operating partnership are deemed to be the assets and income of the Trust.

The UPREIT structure is used to facilitate acquisitions of real estate properties. A sale of property directly to a REIT is generally a taxable transaction to the property seller. However, in an UPREIT structure, if a property seller exchanges the property for limited partnership units, the seller may defer taxation of gain in such exchange until the seller resells its limited partnership units or exchanges its limited partnership units for the REIT’s common stock. By offering the ability

3

Table of Contents

to defer taxation, the Trust may gain a competitive advantage in acquiring desired properties over other buyers who cannot offer this benefit. In addition, investing in the operating partnership, rather than directly in the Trust, may be more attractive to certain institutional or other investors due to their business or tax structure. If an investor is interested in making a substantial investment in our operating partnership, the structure provides the Trust the flexibility to accommodate different terms for each investment, while applicable tax laws generally restrict a REIT from charging different fee rates among its shareholders. Finally, if the Trust’s shares become publicly traded, the former property seller may be able to achieve liquidity for the investment in order to pay taxes.

Operating Partnership

Sterling Properties, LLLP, was formed as a North Dakota limited liability limited partnership in April 2003 to acquire, own and operate properties on the Trust’s behalf. The operating partnership holds a diversified portfolio of multifamily dwellings and commercial properties located principally in the upper and central Midwest United States.

Since formation, the Trust’s focus has consisted of owning and operating income-producing real estate properties. In 2006, the Trust held 23 total properties approximating $56,265 in total assets, in the operating partnership. Between 2007 and 2023, the Trust focused extensively on strengthening the multifamily component of the portfolio, acquiring properties directly or through UPREIT transactions. A majority of these multifamily properties are located in North Dakota. The portfolio has grown to 183 properties, approximating $854,833 in total assets, and book equity, including noncontrolling interests, of approximately $301,320 as of December 31, 2023. As of December 31, 2023, the portfolio contained approximately 11,302 apartment units and 1,470,000 square feet of leasable commercial space.

OUR PEOPLE

We do not have any employees. Instead, we rely on our external Advisor to conduct our day-to-day affairs.

Advisor to the Trust

Sterling Management, LLC, a North Dakota limited liability company formed in November 2002, is the external Advisor to the Trust (the Advisor). The Advisor is responsible for managing our day-to-day affairs and for identifying, acquiring and disposing investments on our behalf.  The Advisor is 100% owned by Trustmark Enterprises, Inc., formerly known as Alloy, a North Dakota corporation (“Trustmark”).  Trustmark is owned in part by Kenneth P. Regan, a Trustee and Chief Executive Officer of the Trust, by James S. Wieland, also a Trustee of the Trust, by Joel S. Thomsen, President of the Trust. In addition, Messrs. Regan, Wieland, Thomsen and Damon Gleave serve on the Advisor’s Board of Governors. The Advisor’s employee base has seen considerable growth, both in number and expertise, since its inception.

Audit and Disclosure Committee

The Audit and Disclosure Committee was established by the Board of Trustees to assist the Board in fulfilling its fiduciary duties and oversight responsibilities. The Audit and Disclosure Committee assists the Board by overseeing the integrity of the Trust’s financial statements, financial reporting and disclosure processes, internal accounting and financial controls and the annual independent audit of the Trust’s financial statements. The Audit and Disclosure Committee also oversees the establishment and maintenance of processes to assure the Trust’s compliance with all applicable laws, regulations, and Trust policy, including compliance with filing requirements under the Exchange Act and the rules and regulations promulgated thereunder. In performing its work, it is the Audit and Disclosure Committee’s responsibility to foster free and open means of communication between the Trustees, the independent auditors and the Trust’s financial managers. Our Audit and Disclosure Committee is currently comprised of Trustees Timothy A. Hunt (Chair of the Committee), Ann L. Christenson, Gregory P. Hammes, Timothy L. Haugen, Michelle L. Korsmo, and Mark T. Polovitz.

Board of Trustees and Executive Officers

The Trust operates under the direction of our Board of Trustees, the members of which are accountable to both the Trust and its shareholders. The Trustees are elected annually by our shareholders.  In addition, the Board has a duty to supervise our relationship with the Advisor and evaluate the performance of and fees paid to the Advisor on an annual basis. The

4

Table of Contents

Advisory Agreement was approved by the Board of Trustees (including all the independent trustees) on March 23, 2023, effective April 1, 2023 until March 31, 2024. The Board of Trustees has provided investment guidance for the Advisor to follow and must approve each investment recommended by the Advisor. Currently, the Advisor has nine members on the Board, seven of whom are independent.

Although the Trust has executive officers, it does not have any paid employees. The President, Chief Executive Officer, Chief Investment Officer, Chief Financial Officer and Treasurer, and General Counsel and Secretary of the Trust, are also officers, employees, or governors of our Advisor. Among others, such executive officers oversee the Advisor’s day-to-day operations with respect to the Trust. However, when doing so, such executive officers are acting on behalf of the Advisor in performing the Advisor’s obligations under the Advisory Agreement. Generally, the only services performed by the Trust’s executive officers are those required by law or regulation, such as executing documents as required by North Dakota law and providing certifications required by the federal securities laws.

Organizational Structure

On January 1, 2021, the advisor was acquired by Trustmark Enterprises, Inc. in an equity transfer.

The following chart shows the relationship structure with the advisor:
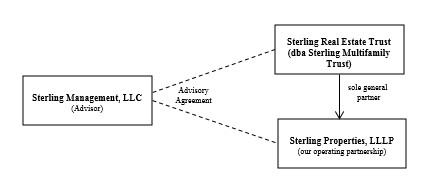
Graphic

(1)As of December 31, 2023, the Advisor was owned 100% by Trustmark Enterprises, Inc. Trustmark was owned in part by the Trust’s Chief Executive Officer and Trustee Kenneth P. Regan (30.00%), by Trustee James S. Wieland (25.00%), by President and Chief Investment Officer Joel S. Thomsen (18.50%), by General Counsel and Secretary Michael P. Carlson (1.00%) and by Chief Financial Officer and Treasurer Damon K. Gleave (1.00%).  Messrs. Regan, Thomsen, Carlson, and Gleave serve as officers of the Advisor. Messrs. Regan, Wieland, Thomsen, Carlson, and Gleave serve on the Advisor’s Board of Governors.
(2)Sterling Management, LLC serves as Advisor to both the Trust and the operating partnership. The Advisor does not own any of our shares. Messrs. Regan and Wieland beneficially own approximately 1.43% and 2.81%, respectively, of our shares as of December 31, 2023.
(3)The Trust controls the operating partnership as the general partner and owns approximately 37.72% of the operating partnership as of December 31, 2023. Messrs. Regan and Wieland beneficially owned and had voting power over approximately 16.54% and 5.16%, respectively, of the Operating Partnership as of December 31, 2023.

CORE INVESTMENT OBJECTIVES AND STRATEGY

Investment Objectives

The Trust’s primary investment objectives are to:

Acquire quality real estate properties or interests in real estate properties that can provide stable cash flow for distribution to our shareholders, preservation of capital and realization of long-term capital appreciation upon the sale of such properties;
Offer an investment option in which the value of the common shares is correlated to real estate as an asset class rather than traditional asset classes such as stocks and bonds; and

5

Table of Contents

Provide a hedge against inflation through use of month-to-month rentals or short-term and long-term lease arrangements with rental properties tenants.

The Trust may change the investment objectives only with the approval of holders of a majority of the outstanding common shares.

Investment Guidance

The Board of Trustees has provided investment guidance to the Advisor to direct the investment strategy of the Trust. Changes to the investment guidance must be approved by the Board. The Advisor has been authorized to execute:

Commercial and multifamily real estate property acquisitions and dispositions;
Investments in other real estate related assets, in each case so long as such investments are approved by our Board;
Acquisitions of property or land for the purposes of future development; and
Capital investments in the portfolio’s current properties through capital improvements.

The Board will have ultimate oversight over the Trust’s investments and may change from time to time the scope of authority delegated to the Advisor with respect to acquisition and disposition transactions.

Investment Strategy

Sterling’s current investment strategy and focus is on multifamily properties. Our Advisor monitors industry trends and invests in property believed to provide the most favorable return balanced with risk. We attempt to manage our real estate portfolio by evaluating changes or trends in the industries in which our tenants operate, the creditworthiness of our tenants and changes or trends in the area demographics surrounding our properties for evidence that our properties will continue to meet our investment objectives of cash flow, preservation of capital and capital appreciation. There is no current plan for the existing commercial properties (industrial, medical, office and retail) regarding retention, acquisition, or disposition.

The Trust will primarily invest in existing or newly developed real estate properties. The Trust may also invest in interests in real estate properties by acquiring direct ownership or ownership interests with other investors, including affiliates of the Advisor, through holding company structures or joint ventures, real estate partnerships, tenant-in-common deals, REITs, or other collective investment vehicles. The Trust may also invest in other real estate property types, including undeveloped land or other development opportunities if the land is acquired for the purpose of producing rental or other operating income in the future. The properties the Trust primarily invests in have existing rent and expense schedules, or the properties are newly constructed with predictable cash flows.

Most current acquisitions are in or near metropolitan areas. However, there is no limitation on the geographic areas in which we may acquire targeted investments.

The Trust may also acquire portfolios of real estate properties held by individual owners and real estate properties held by funds, including hedge funds. It is anticipated that such property owners will primarily sell the properties in exchange for limited partnership interests of the operating partnership.

SEGMENT DATA

We report our results in two reportable segments: residential and commercial properties. Our residential properties include multifamily. Our commercial properties include retail, office, industrial and medical properties. We assess and measure operating results based on the non-GAAP financial measurement of net operating income (“NOI”), which we define as total real estate segment revenues less real estate expenses (which consist of real estate taxes, property management fees, utilities, repairs and maintenance, insurance and direct administrative costs). Our management team believes that NOI, as a non-GAAP financial measurement, is an important metric of operating performance even though it should not be considered an alternative to net income or cash flow from operating activities. NOI is unaffected by financing, depreciation, amortization, legal and professional fees and certain general and administrative expenses.

6

Table of Contents

COMPETITION

Our properties are located in highly competitive real estate markets. The number of competitive properties in a particular area could have a material adverse effect on our ability to lease space and the amount of rent we can charge at our properties. We compete with many property owners, such as corporations, limited partnerships, individual owners, other real estate investment trusts, insurance companies and pension funds.

Our competition also consists of other owners and developers of multifamily and commercial properties who are trying to attract tenants to their properties. This competition influences our ability to acquire properties and the prices that we may pay for those properties. We believe, however, that the diversity of our investments, the experience and abilities of our management and the quality of our assets affords us some competitive advantages that have in the past, and should in the future, allow us to operate our business successfully despite the competitive nature of our business.

Generally, there are multifamily and other similar commercial properties within relatively close proximity to each of our properties. The majority of our retail properties are restaurants and pharmacies. In addition to competitor retail properties with similar business models, we and our tenants face increasing competition from outlet malls, internet shopping websites, discount shopping clubs, catalog companies, direct mail and telemarketing.

ENVIRONMENTAL MATTERS AND GOVERNMENT REGULATION

As an owner of real estate, we are subject to various environmental laws, rules and regulations adopted by various governmental bodies or agencies. These laws and regulations generally govern wastewater discharges, air emissions, the operation and removal of underground and above-ground storage tanks, the use, storage, treatment, transportation and disposal of solid hazardous materials, the remediation of contaminated property associated with the disposal of solid and hazardous materials and other health and safety-related concerns. Under these laws, a current or previous owner or operator of real estate may be liable for the costs of removal or remediation of certain hazardous or toxic substances released at a property and may be held liable to a governmental entity or to third parties for property damage or personal injuries and for investigation and clean-up costs incurred in connection with any contamination. We could be subject to liability in the form of fines or damages for noncompliance with these laws and regulations, and some environmental laws create a lien on a contaminated site in favor of the government for damages and costs it incurs in connection with the contamination. Some of these laws and regulations may impose joint and several liability on residents, owners, or operators for the costs of investigation or remediation of contaminated properties, regardless of fault or the legality of the original disposal. In addition, the presence of these substances, or the failure to properly remediate these substances, may adversely affect our ability to sell or rent the property or to use the property as collateral for future borrowing. Compliance with new or more stringent laws or regulations or stricter interpretation of existing laws may require material expenditures by us.

In addition, we are subject to many other laws and governmental regulations applicable to our properties, and changes in the laws and regulations, or in their interpretation by agencies and the courts, occur frequently. Under the Americans with Disabilities Act of 1990 (the “ADA”), all places of public accommodation are required to meet certain federal requirements related to access and use by disabled persons. The Fair Housing Amendments Act of 1988 (the “FHAA”) requires apartment communities first occupied after March 13, 1991, to be accessible to the handicapped and prohibits housing discrimination based upon familial status.

The Housing for Older Persons Act (“HOPA”) provides age-based discrimination exceptions for housing developments qualifying as housing for older persons. Non-compliance with ADA, FHAA or HOPA could result in the imposition of fines, awards of damages to private litigants, payment of attorneys’ fees and other costs to plaintiffs, substantial litigation costs and substantial costs of remediation. We believe our properties which are subject to ADA, FHAA and/or HOPA are substantially in compliance with their present requirements.

Compliance with these laws, rules, and regulations has not had a material adverse effect on our business, assets, or results of operations, financial condition, or ability to pay dividends. We do not believe our existing portfolio as of December 31, 2023 will require us to incur material expenditures to comply with these laws and regulations. However, we cannot assure that future laws, ordinances, or regulations will not impose any material liability, or that the current environmental condition of our properties will not be affected by the operations of tenants, by the existing condition of the land, by

7

Table of Contents

operations in the vicinity of the properties, such as the presence of underground storage tanks, or by the activities of unrelated third parties.

AVAILABLE INFORMATION

We electronically file our Annual Report on Form 10-K, Quarterly Reports on Form 10-Q, Current Reports on Form 8-K, proxy and information statements and all amendments to these filings with the Securities and Exchange Commission (“SEC”). The public may read any materials filed by us with the SEC on the internet site maintained by the SEC at www.sec.gov. We also maintain an internet site at www.smftrust.com, which includes the reports and other documents we file with the SEC. These reports are available as soon as reasonably practicable after such material is electronically filed or furnished to the SEC. This reference to our website is not intended to incorporate information found on the website into this filing.

ITEM 1A. RISK FACTORS

Risks Related to Sterling Real Estate Trust

Our results are dependent on amounts received from the leasing and resale of real estate investments, which are subject to market and economic changes. If income is insufficient to meet our capital needs, our ability to carry out our business plans could be adversely affected.

Our purpose is to acquire and hold real estate investments as long-term investments. The primary income that will be generated by us will be the profits, if any, from the operation or holding of the real estate and upon the resale of the investments. If circumstances arise which cause an investment to become undesirable or remain at its current value or decrease in value, we may generate less income than anticipated.

Our success is based on continuing to locate and hold suitable real estate investments, and failure of our Advisor to locate additional suitable properties or the unsuccessful operation of our existing real estate investments could adversely affect our operations and our ability to pay dividends.

Our ability to achieve our investment objectives and to pay dividends to our shareholders and distributions to unitholders is dependent upon the performance of our Advisor in locating suitable investments and appropriate financing arrangements for us as well as on the successful management of our properties after acquisition. We currently own, through the operating partnership, the properties described under Item 2 — Properties.  We cannot be sure our Advisor will be successful in locating suitable investments on financially attractive terms, or be certain that operation of the properties will avoid the risks attendant to real estate acquisitions, such as:

The risk properties may not perform in accordance with expectations, including projected occupancy and rental rates.
The risk we may have underestimated the cost of improvements or repairs required to bring or keep an acquired property up to or at standards established for its intended use or its intended market position.

We may have to make expedited decisions on whether to invest in certain properties, including prior to receipt of detailed information.

We may be required to make expedited decisions in order to effectively compete for the acquisition of desirable properties and other assets. In such cases, our Advisor and Board of Trustees may not have access to detailed information regarding real estate investments at the time of making an investment decision to pay a non-refundable deposit and to proceed with an acquisition. In addition, the actual time period during which our Advisor will be allowed to conduct due diligence may be limited. Therefore, there can be no assurance our Advisor and Board of Trustees will have knowledge of all circumstances that may adversely affect an investment.

8

Table of Contents

We may change our investment and operational policies without shareholder consent, and such changes could increase our exposure to additional risks.

Generally, the Board of Trustees may change our investment and operational policies, including our policies with respect to investments, acquisitions, growth, operations, indebtedness, capitalization and distributions, at any time without the consent of our shareholders, which could result in our making investments different from, and possibly riskier than investments made in the past. A change in our investment policies may, among other things, increase our exposure to interest rate risk, default risk and commercial real estate market fluctuations, all of which could materially affect our ability to achieve our investment objectives.

There can be no assurance dividends or distributions will be paid or increase over time.

There are many factors that can affect the availability and timing of cash dividends to our shareholders and distributions to unitholders.  Dividends and distributions will be based principally on cash available from our real estate and other investments. The amount of cash available for dividends will be affected by many factors, such as our ability to acquire profitable real estate investments, successfully manage our real estate properties, our operating expenses, and general economic conditions. We can give no assurance we will be able to pay or maintain dividends or distributions or that dividends or distributions will increase over time.

Dividends may include a return of capital, and shareholders may be required to recognize capital gain on distributions.

Dividends payable to shareholders may include a return of capital. To the extent dividends exceed cash flow from operations, a shareholder’s basis in our shares will be reduced and, to the extent dividends exceed a shareholder’s basis, the shareholder may recognize capital gain and be required to make tax payments.

We depend on certain executive officers and trustees, and the loss of such persons may delay or hinder our ability to carry out our investment strategies.

Our future success substantially depends on the active participation of James Wieland, one of our trustees, Kenneth Regan, Chief Executive Officer and a trustee, Joel Thomsen, President and Chief Investment Officer, Damon Gleave, Chief Financial Officer and Treasurer. Messrs. Wieland, Regan, Thomsen, and Gleave are also governors and owners of our Advisor. Messrs. Wieland, and Regan, have over 40 years of extensive experience each in the commercial real estate industry, and have been instrumental in setting our strategic direction, operating our business and arranging necessary financing, and through the Advisor, in locating desirable real estate investments and were serving as property manager, managing our properties. Losing the services of Messrs. Wieland, Regan, Thomsen, or Gleave without replacing their position with someone of the same competence and experience, could have a material adverse effect on our ability to successfully carry out our investment strategies and achieve our investment objectives. There can be no guarantee they will remain affiliated with us. See “Risks Related to Conflicts of Interest”.

Cybersecurity risks and cyber incidents may adversely affect our business by causing a disruption to our operations, a compromise or corruption of our confidential information, and/or damage to our business relationships, all of which could negatively impact our financial results.

A cyber incident is considered to be any adverse event that threatens the confidentiality, integrity or availability of our information resources. These incidents may be an intentional attack or an unintentional event and could involve gaining unauthorized access to our information systems for purposes of misappropriating assets, stealing confidential information, corrupting data, or causing operational disruption. The result of these incidents may include disrupted operations, misstated or unreliable financial data, liability for stolen assets or information, increased cybersecurity protection and insurance costs, litigation, and damage to our investor relationships. As our reliance on technology has increased, so have the risks posed to our information systems, both internal and those provided by the Advisor and service providers.   Our and our Advisor’s processes, procedures and internal controls that are designed to mitigate cybersecurity risks and cyber intrusions do not guarantee that a cyber incident will not occur or that our financial results, operations, or confidential information will not be negatively impacted by such an incident.

9

Table of Contents

We are not required to comply with certain reporting requirements, including those relating to auditor’s attestation reports on the effectiveness of our system of internal control over financial reporting, accounting standards and disclosure about our executive compensation, that apply to other public companies.

So long as our shares of common stock are not traded on a securities exchange, we will be deemed to be a “non-accelerated filer” under the Exchange Act, and as a non-accelerated filer, we will be exempt from compliance with the auditor attestation requirements of Section 404 of the Sarbanes-Oxley Act. In addition, so long as we are externally managed by the Advisor and we do not directly compensate our executive officers, or reimburse the Advisor or its affiliates for salaries, bonuses, benefits and severance payments for persons who also serve as one of our executive officers or as an executive officer of the Advisor, we do not have any executive compensation.

Many of our costs, such as operating and general and administrative expenses, real estate acquisition, and constructions costs, could be adversely impacted by periods of heightened inflation.

A sustained or further increase in inflation could have an adverse impact on our operating expenses incurred in connection with, among others, the property-related services such as repairs and maintenance, janitorial, utilities, security and insurance. Our operating expenses may be recoverable through commercial lease arrangements.

Risks Related to Our Structure

Our shareholders may experience dilution if we or our operating partnership issues additional securities.

Our shareholders do not have preemptive rights to any shares issued by us in the future. If we sell or issue additional shares in the future to raise capital, pursuant to a dividend reinvestment plan or in exchange for limited partnership units pursuant to our operating partnership’s Limited Liability Limited Partnership Agreement (“LLLP Agreement”), our shareholders will experience dilution of their equity investment. In addition, if our operating partnership sells additional securities or issues additional securities in connection with a property acquisition transaction, we would, and indirectly our shareholders would, experience dilution in their equity position.

Our securityholders have limited control over our operation, and the Board of Trustees has the sole power to appoint and terminate the Advisor.

Our Board of Trustees has the authority to determine our major policies, including our policies regarding financing, growth, investment strategies, debt capitalization, REIT qualification, distribution, and to take certain actions including acquiring or disposing of real estate and real estate related investments, dividend declaration and the election or removal of the Advisor. Our securityholders do not have the right to remove the Advisor but have the right to elect and remove trustees. Under our Third Amended and Restated Declaration of Trust, our trustees may not do the following without the approval of the holders of a majority of the outstanding common shares of beneficial interest:

Amend the Third Amended and Restated Declaration of Trust, except for amendments which do not adversely affect the rights, preference and privileges of shareholders.
Sell all or substantially all of our assets other than in the ordinary course of business or in connection with a liquidation and dissolution.
Conduct a merger or other reorganization of the trust; or
Dissolve or liquidate us.

Our shareholders have the right, without the concurrence of the Board of Trustees, to terminate the trust and liquidate our assets or amend the Third Amended and Restated Declaration of Trust.

Shareholders have no role in determining our investments and must rely on our Advisor and oversight by the Board of Trustees.

For future acquisitions or dispositions, the Board of Trustees has the authority to approve investment acquisitions or dispositions without shareholder approval. Therefore, shareholders will not be able to evaluate the terms of future

10

Table of Contents

investment acquisitions or dispositions, their economic merit or other relevant financial data before we acquire or sell investments. Shareholders must rely entirely on the oversight of our Board of Trustees, the management ability of our Advisor and the performance of the property managers.

We may issue securities with more favorable terms than the outstanding shares without shareholder approval.

Under our Third Amended and Restated Declaration of Trust, our Board of Trustees has the authority to establish more than one class or series of shares and to fix the relative preferences and rights regarding conversion, voting powers, restrictions, limitations as to dividends and other distributions, and terms or conditions of redemption of such different classes or series without shareholder approval. Thus, our Board could authorize the issuance of a class or series of shares with terms and conditions that could have priority as to dividends and amounts payable upon liquidation over the rights of the holders of our outstanding common shares of beneficial interest. Such class or series of shares could also have the effect of delaying, deferring or preventing a change in control of us, including an extraordinary transaction (such as a merger, tender offer or sale of all or substantially all of our assets) that might otherwise provide a premium price to holders of our shares, even if it would be in the best interest of our shareholders.

Shareholders could incur current tax liability on dividends they elect to reinvest in our shares, and may have to use separate funds to pay their tax liability.

Shareholders that participate in our dividend reinvestment plan will be deemed to have received, and for income tax purposes will be taxed on, the amount reinvested in shares to the extent the amount reinvested was not a tax-free return of capital. In addition, our shareholders will be treated for tax purposes as having received an additional dividend to the extent the shares are purchased at a discount to fair market value. As a result, unless shareholders are a tax-exempt entity, they may have to use funds from other sources to pay their tax liability on the value of the shares received.

There may be conflicts of interest between us and our shareholders on one side and our operating partnership and its limited partners on the other side.

Our trustees and officers have duties to us and our shareholders in connection with their management of us. At the same time, we, as general partner will have duties to our operating partnership and its limited partners in connection with the management of the operating partnership. Our duties as general partner of the operating partnership may come into conflict with the duties of our trustees and officers to us and our shareholders. The LLLP Agreement of our operating partnership expressly limits our liability for monetary damages by providing we will not be liable for losses sustained, liabilities incurred or benefits not derived if we acted in good faith. In addition, our operating partnership is required to indemnify us and our trustees and officers from and against any and all claims arising from operations of our operating partnership, unless it is established: (1) the act or omission was material and committed in bad faith or was the result of active and deliberate dishonesty; (2) the indemnified party received an improper personal benefit in money, property or services; or (3) in the case of a criminal proceeding, the indemnified person had reasonable cause to believe the act or omission was unlawful. The LLLP Agreement also provides that we will not be held responsible for any misconduct or negligence on the part of any agent appointed by us in good faith.

There is no public trading market for our shares, nor do we expect one to develop, which may negatively impact our shareholders’ ability to sell their shares and the price at which shares may be sold.

There is no public market for our shares and there is no assurance one may develop. In addition, the price shareholders may receive for the sale of their shares is likely to be less than the proportionate value of our investments. If our shareholders are able to find a buyer for their shares, they may have to sell them at a substantial discount from the price they purchased the shares. Consequently, shareholders may not be able to liquidate their investments in the event of emergency or for any other reason. Therefore, shareholders should consider our securities as illiquid and a long-term investment and should be prepared to hold their shares for an indefinite period of time.

11

Table of Contents

The estimated value of our common stock is based on a number of assumptions and estimates that may not be accurate and is also subject to a number of limitations.

The current estimated value of our common stock as of January 1, 2024, is approximately $23.00 per share. The methodology used by our Board to determine this value was based on estimates of the value of our real estate investments, cash and other assets and debt and other liabilities as of a date certain and certain additional information. No formal valuation has been undertaken by us. Our valuation process involves a number of estimates, assumptions and subjective judgments that may not be accurate and complete. Further, different parties using different assumptions and estimates could derive a different estimated value per share, which could be significantly different from our estimated value per share. The estimated value per share may not represent current market values or fair values as determined in accordance with U.S. generally accepted accounting principles. A shareholder should not rely on the estimated value per share as being an accurate or precise measure of the then-current value of the shares of our common stock in making a decision to buy or sell shares of our common stock, including whether to reinvest dividends by participating in the dividend reinvestment plan and whether to request redemption pursuant to our share redemption program.

Risks Related to Our Status as a REIT and Related Federal Income Tax Matters

If we fail to continue to qualify as a REIT, we would incur additional tax liabilities that would adversely affect our operations and our ability to make distributions and could result in a number of other negative consequences.

Although our management believes we are organized, have operated, and will be able to continue to be organized and to operate in such a manner to qualify as a real estate investment trust (REIT), as that term is defined under the Internal Revenue Code, we may not have been organized, may not have operated, or may not be able to continue to be organized or to operate in a manner to have qualified or remain qualified as a REIT. Qualification as a REIT involves the application of highly technical and complex Internal Revenue Code provisions for which there are only limited judicial or administrative interpretations. Even a technical or inadvertent mistake could endanger our REIT status.

The determination that we qualify as a REIT requires an ongoing analysis of various factual matters and circumstances, some of which may not be within our control, regarding our organization and ownership, distributions of our income and the nature and diversification of our income and assets. The fact we hold substantially all of our assets through our operating partnership and our ongoing reliance on factual determinations, such as determinations related to the valuation of our assets, further complicates the application of the REIT requirements for us.

If we lose our REIT qualification, we will face income tax consequences that will reduce substantially our available cash for dividends and investments for each of the years involved because:

We would be subject to federal corporate income taxation on our taxable income, including any applicable alternative minimum tax, and could be subject to increased state and local taxes.
We would not be allowed a deduction for dividends paid to shareholders in computing our taxable income; and
Unless we are entitled to relief under applicable statutory provisions, we could not elect to be taxed as a REIT for four taxable years following the year during which we were disqualified.

The increased taxes could reduce the value of the shares as well as cash available for dividends to shareholders and investments in additional assets. In addition, if we fail to continue to qualify as a REIT, we will not be required to pay dividends to shareholders. Our failure to continue to qualify as a REIT also could impair our ability to expand our business and to raise capital.

As a REIT, we may be subject to tax liabilities that reduce our cash flow.

Even if we continue to qualify as a REIT for federal income tax purposes, we may be subject to federal and state taxes on our income or property, including the following:

To continue to qualify as a REIT, we must distribute annually at least 90% of our REIT taxable income (which is determined without regard to the dividends-paid deduction or net capital gains) to our shareholders. If we satisfy

12

Table of Contents

the distribution requirement but distribute less than 100% of our REIT taxable income, we will be subject to corporate income tax on the undistributed income. In such situation, shareholders will be treated as having received the undistributed income and having paid the tax directly, but tax-exempt shareholders, such as charities or qualified pension plans, will receive no benefit from any deemed tax payments.
We may be subject to state and local taxes on our income or property, either directly or indirectly, because of the taxation of our operating partnership or of other entities through which we indirectly own our assets.
If we have net income from the sale of foreclosure property we hold primarily for sale to customers in the ordinary course of business or other non-qualifying income from foreclosure property, we must pay a tax on that income at the highest corporate income tax rate.
If we sell a property, other than foreclosure property, we hold primarily for sale to customers in the ordinary course of business, our gain will be subject to the 100% “prohibited transaction” tax.
We will be subject to a 4% nondeductible excise tax on the amount, if any, by which the distributions we pay in any calendar year are less than the sum of 85% of our ordinary income, 95% of our capital gain net income, and 100% of our undistributed income from prior years.

We may be forced to borrow funds on a short-term basis, to sell assets or to issue securities to meet the REIT minimum distribution requirement or for working capital purposes.

To qualify as a REIT, in general, we must distribute to our shareholders at least 90% of our net taxable income each year, excluding capital gains. However, we could be required to include earnings in our net taxable income before we actually receive the related cash. If we do not have sufficient cash to pay the necessary dividends to preserve our REIT status for any year or to avoid taxation, we may need to borrow funds, to sell assets or to issue additional securities even if the then-prevailing market conditions are not favorable for such actions.  In addition, we will require a minimum amount of cash to fund our daily operations. Due to the REIT distribution requirements, we may be forced to make distributions when we otherwise would use the cash to fund our working capital needs. Therefore, we may be forced to borrow funds, to sell assets or to issue additional securities at certain times for our working capital needs.

If our operating partnership does not qualify as a partnership, its income may be subject to taxation, and we would no longer qualify as a REIT.

The Internal Revenue Code classifies “publicly traded partnerships” as associations taxable as corporations (rather than as partnerships), unless substantially all of their taxable income consists of specified types of passive income. We structured our operating partnership to be classified as a partnership for federal income tax purposes. However, no assurance can be given the IRS will not challenge our position or will classify our operating partnership as a “publicly traded partnership” for federal income tax purposes. To minimize this risk, we have placed certain restrictions on the transfer and/or redemption of partnership units in the LLLP Agreement. If the IRS would assert successfully our operating partnership should be treated as a “publicly traded partnership” and substantially all of the operating partnership’s gross income did not consist of the specified types of passive income, the Internal Revenue Code would treat the operating partnership as an association taxable as a corporation. In such event, we would cease to qualify as a REIT. In addition, the imposition of a corporate tax on the operating partnership would reduce the amount of distributions the operating partnership could make to us and, in turn, reduce the amount of cash available to us to pay dividends to our shareholders.

We have transfer restrictions on our shares that may limit offers to acquire substantial amounts of the Trust’s shares at a premium.

To qualify as a REIT, our shares must be beneficially owned by 100 or more persons and no more than 50% of the value of our issued and outstanding shares may be owned directly or indirectly by five or fewer individuals. Currently, Third Amended and Restated Declaration of Trust prohibits transfers of our shares that would result in: (1) our shares being beneficially owned by fewer than 100 persons, (2) five or fewer individuals, including natural persons, private foundations, specified employee benefit plans and trusts, and charitable trusts, owning more than 50% of our shares, applying broad attribution rules imposed by the federal income tax laws, or (3) before our shares qualify as a class of publicly-offered securities, 25% or more of our shares being owned by ERISA investors. If a shareholder acquires shares in excess of the ownership limits or in violation of the restrictions on transfer, we:

13

Table of Contents

May consider the transfer to be void ab initio.
May not reflect the transaction on our books.
May institute legal action to enjoin the transaction.
May redeem such excess shares.
Automatically transfer any excess shares to a charitable trust for the benefit of a charitable beneficiary.

If such excess shares are transferred to a trust for the benefit of a charitable beneficiary, the charitable trustee shall sell the excess shares and the shareholder will be paid the net proceeds from the sale equal to the lesser of: (1) the price paid by the shareholder or the “market price” of our shares if no value was paid or (2) the price per share received by the charitable trustee.

If shares are acquired in violation of the ownership limits or the restrictions on transfer described above:

Transferee may lose its power to dispose of the shares; and
Transferee may incur a loss from the sale of such shares if the fair market price decreases.

These limitations may have the effect of preventing a change of control or takeover of us by a third party, even if the change in control or takeover would be in the best interest of our shareholders.

Complying with REIT requirements may restrict our ability to operate in a way to maximize profits.

To qualify as a REIT, we must continually satisfy tests concerning, among other things, the sources of our income, the nature and diversification of our assets, the amounts we distribute to our shareholders, and the ownership of our common shares. For example, we may be required to pay dividends to our shareholders at disadvantageous times, including when we do not have readily available funds. Thus, compliance with the REIT requirements may hinder our ability to operate solely on the basis of maximizing profits.

Complying with REIT requirements may force us to forego or liquidate otherwise attractive investments which could negatively impact shareholder value.

To qualify as a REIT, at the end of each calendar quarter, at least 75% of our assets must consist of cash, cash items, government securities and qualified real estate assets. The remainder of our investments in securities (other than government securities and qualified real estate assets), in general, cannot include more than 10% of the voting securities of any one issuer or more than 10% of the value of the outstanding securities of any one issuer. In addition, no more than 5% of the value of our assets (other than government securities and qualified real estate assets) can consist of the securities of any one issuer, and no more than 25% of the value of our assets may be represented by securities of one or more taxable REIT subsidiaries. Therefore, we may be required to liquidate otherwise attractive investments or may be forced to forego attractive investments to satisfy these requirements. Such action or inaction could be adverse to our shareholder interests.

Gains from asset sales may be subject to a 100% prohibited transaction tax, which tax could reduce the Trust’s available assets and reduce shareholder value.

We may have to sell assets from time to time to satisfy our REIT distribution requirements and other REIT requirements or for other purposes. The IRS may posit one or more asset sales may be “prohibited transactions.” If we are deemed to have engaged in a “prohibited transaction,” our gain from such sale would be subject to a 100% tax. The Internal Revenue Code sets forth a safe harbor for REITs that wish to sell property without risking the imposition of the 100% tax, but we cannot assure you we will be able to qualify for the safe harbor. We will use reasonable efforts to avoid the 100% tax and we do not intend to hold assets in a manner to cause their dispositions to be treated as “prohibited transactions,” but we cannot assure you the IRS will not challenge our position, especially if we make frequent sales or sales of assets in which we have short holding periods. Payment of a 100% tax would adversely affect our results of operations.

14

Table of Contents

Ordinary dividends payable by REITs generally are taxed at the higher ordinary income rate which could reduce the net cash received by shareholders.

The maximum U.S. federal income tax rate for “qualified dividends” payable by U.S. corporations to individual U.S. shareholders currently is 20%.  In addition, the 3.8% tax on net investment income may apply to such dividends. In general, ordinary dividends payable by REITs to its individual U.S. shareholders, however, are generally not eligible for the reduced rates and generally are taxed at ordinary income rates (for REIT dividends received after December 31, 2017, the maximum individual income tax rate currently is 37%, but the current maximum, effective federal income tax rate as to REIT dividends may be reduced to 29.6% because of a partial deduction that may apply with respect to REIT dividends; in addition, the 3.8% tax on net investment income may apply to REIT dividends). It is also possible tax legislation that has or may be enacted might increase this rate differential. The differing treatment of dividends received from REITs and other corporations might cause individual investors to view an investment in REITs as less attractive related to other corporations which might be detrimental to our ability to raise additional funds through the sale of our common shares.

Changes in legislative or other actions affecting REITs may adversely affect our status as a REIT.

The rules dealing with U.S. federal income taxation are constantly under review by the legislative process, the IRS and the U.S. Treasury Department. Changes to tax laws (which changes may apply retroactively) could adversely affect us or our shareholders. Furthermore, new legislation, regulations, administrative interpretations or court decisions could change the federal income tax laws with respect to our qualification as a REIT or the federal income tax consequences of our qualification. We cannot predict whether, when, in what forms, or with what effective dates, the laws applicable to us or our shareholders may be changed.

Our Board of Trustees may revoke our REIT election without shareholder approval, and we would no longer be required to make distributions of our net income.

Our Board of Trustees can revoke or otherwise terminate our REIT election without the approval of our shareholders if our Board determines it is not in our best interest to continue to qualify as a REIT. In such case, we would become subject to U.S. federal income tax on our taxable income, and we no longer would be required to distribute most of our net income to our shareholders, which may reduce the total return to our shareholders and affect the value of the shares.

Risks Related to Tax-Exempt Investors

Common shares may not be a suitable investment for tax-exempt investors.

There are special considerations that apply to investing in common shares on behalf of a trust, pension, profit sharing or 401(k) plans, health or welfare plans, trusts, individual retirement accounts (IRAs), or Keogh plans. If you are investing the assets of any of the above in common shares, you should satisfy yourself:

Your investment is consistent with your fiduciary obligations under applicable law, including common law, ERISA and the Internal Revenue Code.
Your investment is made in accordance with the documents and instruments that govern the trust, plan or IRA, including any investment policy.
Your investment satisfies the prudence and diversification requirements of Sections 404(a)(1)(B) and 404(a)(1)(C) of ERISA and other applicable provisions of ERISA and the Internal Revenue Code.
Your investment will not impair the liquidity of the trust, plan or IRA.
Your investment will not produce “unrelated business taxable income” for the trust, plan or IRA.
You will be able to value the assets of the trust, plan or IRA annually in accordance with ERISA requirements and applicable provisions of the trust, plan, or IRA; and
Your investment will not constitute a prohibited transaction under Section 406 of ERISA or Section 4975 of the Internal Revenue Code.

We have not evaluated, and will not evaluate, whether an investment in us is suitable for any particular trust, plan, or IRA.

15

Table of Contents

Under certain circumstances, tax-exempt shareholders may be subject to unrelated business taxable income, which could adversely affect such shareholders.

Neither ordinary nor capital gain distributions with respect to our common shares nor gain from the sale of our common shares, in general, should constitute unrelated business taxable income to tax-exempt shareholders. The following, however, are some exceptions to this rule:

Under certain circumstances, part of the income and gain recognized by certain qualified employee pension trusts with respect to our common shares may be treated as unrelated business taxable income if our common shares are held predominately by qualified employee pension trusts (which we do not expect to be the case).
Part of the income and gain recognized by a tax-exempt shareholder with respect to common shares would constitute unrelated business taxable income if the tax-exempt shareholder incurs debt to acquire the common shares; and
Part or all of the income or gain recognized with respect to our common shares held by social clubs, voluntary employee benefit associations, supplemental unemployment benefit trusts and qualified group legal services plans that are exempt from federal income taxation under Sections 501(c)(7), (9), (17), or (20) of the Internal Revenue Code may be treated as unrelated business taxable income.

Therefore, tax-exempt shareholders are not assured all dividends received from the trust will be tax-exempt.

Risks Related to Our Relationship with the Advisor and Its Affiliates

We depend on our Advisor for the successful operations of the REIT, and if required, we may not be able to find a suitable replacement advisor.

Our ability to achieve our investment objectives is dependent upon the successful performance of our Advisor in locating attractive acquisitions, advising on dispositions of real estate properties and other real estate related assets, advising on any financing arrangements and other administrative tasks to operate our business. If the Advisor suffers or is distracted by adverse financial and operational problems in connection with its operations unrelated to us or for any reason, it may be unable to allocate a sufficient amount of time and resources to our operations. If this occurs, our ability to achieve our investment objectives or pay dividends to our shareholders may be adversely affected. Any adversity experienced by the Advisor or problems in our relationship with the Advisor could also adversely impact the operation of our properties and, consequently, our cash flow and ability to pay dividends to shareholders.

Either we or the Advisor can terminate the Advisory Agreement upon 60 days written notice to the other party for any reason, or we can terminate the Advisory Agreement immediately for cause or material breach of the Advisory Agreement. In addition, the Board of Trustees may determine not to renew the Advisory Agreement in any year. If this occurs, we would need to find another advisor to provide us with day-to-day management services or engage employees to provide these services directly to us, which would likely be difficult to do and may be costly. There can be no assurances we would be able to find a suitable replacement advisor or suitable employees or enter into agreements for such services on acceptable terms.

The termination or replacement of the Advisor could trigger a default or repayment event under financings.

Lenders providing financing for our acquired properties may include provisions in the mortgage loan documentation that state the termination or replacement of the Advisor is an event of default or an event triggering acceleration of the repayment of the loan in full. Even though we will attempt to have such provisions excluded from the loan documents, the lenders may still require them to be included. In addition, the termination or replacement of the Advisor could trigger an event of default under any credit agreement governing a line of credit we may obtain. If an event of default or repayment event occurs with respect to any of our properties, our ability to achieve our investment objectives could be materially adversely affected.

16

Table of Contents

The Advisor may not be able to retain its key employees, which could adversely affect our ability to carry out our investment strategies.

We depend on the Advisor’s key officers, employees and governors. However, none of these individuals have an employment agreement with the Advisor and the loss of any or all of such person’s services and the Advisor’s inability to find, or any delay in finding, replacements with equivalent skills and experience, could adversely impact our ability to successfully carry out our investment strategies and achieve our investment objectives.

Our future success also depends on the Advisor’s and its affiliates’ ability to identify, hire, train and retain highly qualified real estate, managerial, financial, marketing, and technical personnel to provide the services to us pursuant to the Advisory Agreement and any other written services agreement, including any property management agreements. Competition for such personnel is intense, and the Advisor or its affiliates may not be able to attract, assimilate or retain such personnel in the future. The inability to attract and retain the necessary personnel could have a material adverse effect on our business and results of operations.

Risks Related to Investments in Real Estate

Insufficient geographic diversity of our real estate investments could adversely affect our operating results if economic changes impact real estate markets where we own significant assets.

Geographic concentration of our properties may expose us to economic downturns in those areas where our properties are located. A recession in any area where we own several properties or interests in properties could adversely affect our ability to generate or increase operating revenues, locate, and retain financially sound tenants or dispose of unproductive properties. In addition, it could have an adverse impact on our tenant’s ability to meet their obligations to us. Likewise, we may be required to lower our rental rates to attract desirable tenants in such an environment. Currently, the majority of our properties are located in North Dakota and Minnesota, and we hold several properties in Fargo, North Dakota and Moorhead, Minnesota. To the extent weak economic or real estate conditions affect North Dakota, Minnesota, or other markets in which we own properties more severely than other areas of the country, our financial performance could be negatively impacted.

We may invest in and develop undeveloped real property, which requires us to pay expenses prior to receiving any income on the property.

We have the discretion to invest up to 10% of our total assets in undeveloped property. When we invest in undeveloped property, such property does not generate operating revenue while costs are incurred to develop the property and may generate other expenses including property taxes and insurance. In addition, construction and development of such properties may not be completed within budget or as scheduled and projected rental levels may not be achieved. In addition to the risks of real estate investments in general, an investment in undeveloped property is subject to additional risks, including the expense and delay which may be associated with rezoning the land for a higher use and the development and environmental concerns of governmental entities and/or community groups. Therefore, we will not generate income on such property until development is completed and we begin leasing the property.

We may acquire multiple properties in a single transaction, which may adversely affect our operations through the inclusion of less desirable investments or financing requirements greater than we would otherwise be willing to incur.

Periodically, we may acquire multiple properties in a single transaction. Portfolio acquisitions are more complex and expensive than single property acquisitions, and the risk a multiple property acquisition does not close may be greater than in a single property acquisition. Portfolio acquisitions may also result in us owning investments in geographically dispersed markets, placing additional demands on our ability to manage the properties in the portfolio. In addition, a seller may require a group of properties be purchased as a package even though we may not want to purchase one or more properties in the portfolio. In these situations, if we are unable to identify another person or entity to acquire the unwanted properties, we may be required to operate or attempt to dispose of these properties. To acquire multiple properties in a single transaction we may be required to accumulate a large amount of cash. We would expect the returns we can earn on such cash to be less than the ultimate returns in real property and therefore, accumulating such cash could reduce the funds

17

Table of Contents

available for dividends. Any of the foregoing events may increase the risk of adverse business results and negatively affect our results of operations.

We may invest in co-ventures, where our co-venture partners, co-tenants or other partners in co-ownership arrangements could take actions that decrease the value of a real estate investment and lower our overall return.

We may enter into joint ventures, tenant-in-common investments or other co-ownership arrangements with our Advisor, its affiliates, our trustees, or third parties having investment objectives similar to ours in the acquisition of real estate investments. In such arrangements, we may be acquiring non-controlling interests in or sharing responsibility for managing the affairs of the investment. In such event, we would not be in a position to exercise sole decision-making authority. Investments such as these may, under certain circumstances, involve risks not present where another party is not involved, including the possibility that partners or co-investees might become bankrupt or fail to fund their required capital contributions. Co-investees may have economic or other business interests or goals which are inconsistent with our business interests or goals, and may be in a position to take actions contrary to our policies or objectives.

Such investments may also have the potential risk of impasses on decisions, such as a sale, because neither we nor the co-investee would have full control over the joint venture. Disputes between us and co-investees may result in litigation or arbitration that would increase our expenses and prevent our management and the Advisor from focusing their time and effort on our business. Consequently, actions by or disputes with co-investees might result in subjecting additional risk to properties owned by the investment. In addition, we may in certain circumstances be liable for the actions of our co-investees. Any of these risks could subject us to liabilities in excess of those contemplated and reduce our returns on that investment.

We could experience difficulties or delays renewing leases or re-leasing space, which will increase our costs to maintain such properties without receiving income.

We derive a significant portion of our net income from rent received from our tenants. Our properties include both residential as well as commercial properties. If a tenant experiences a downturn in its business or other types of financial distress, it may be unable to make timely rental payments. If lease defaults occur, we may experience delays in enforcing our rights as landlord. Also, if our tenants decide not to renew their leases, terminate early or default on their lease, we may not be able to re-let the space or may experience delays in finding suitable replacement tenants. Even if tenants decide to renew or lease new space, the terms of renewals or new leases, including the cost of required renovations or concessions to tenants, particularly commercial tenants, may be less favorable to us than current lease terms. As a result, our net income and ability to pay dividends to shareholders could be materially adversely affected. Further, if one of our properties cannot be leased on terms and conditions favorable to us, the property may not be marketable at a suitable price without substantial capital improvements, alterations, or at all.

We could face potential adverse effects if a commercial tenant is unable to make timely rental payments, declares bankruptcy or become insolvent.

If a tenant experiences a downturn in its business or other types of financial distress, it may be unable to make timely rental payments. Delayed rental payments could adversely affect cash flow available for dividends. If a commercial tenant declares bankruptcy or becomes insolvent, it may adversely affect the income produced by our properties. If a tenant defaults, we may experience delays and incur substantial costs in enforcing our rights as landlord. However, if a tenant files for bankruptcy, we cannot evict the tenant solely because of such bankruptcy. If a court authorizes the commercial tenant to reject and terminate its lease with us, our claim against the tenant for unpaid future rent would be subject to a statutory cap that might be substantially less than the remaining rent actually owed under the lease. In addition, it is unlikely a bankrupt tenant would pay in full amounts it owes us under a lease. Additionally, we may be required to incur additional costs in the form of tenant improvements and leasing commissions in our efforts to lease the space to a new tenant, as well as lower our rental rates to reflect any decline in market rents. This shortfall could adversely affect our cash flow and results of operations.

18

Table of Contents

Investments in real estate are illiquid, and we may not be able to resell a property on terms favorable to us.

We intend to hold real estate properties until such time as our Advisor determines a sale or other disposition appears to be advantageous or when our shareholders approve our termination and liquidation. Because real estate investments are relatively illiquid, it could be difficult for us to promptly sell one or more of our real estate properties on favorable terms. This may be a result of economic conditions, availability of financing, interest rates and other factors beyond our control. This may limit our ability to change our portfolio promptly in response to adverse changes in the performance of any such property or economic or market trends. We cannot predict the length of time needed to find a willing purchaser and to close the sale of a property. Real estate investments by their nature are often difficult or time consuming to liquidate. In addition, federal tax laws imposing a 100% excise tax on gains from sales of certain types of property sales by a REIT (generally, property viewed as being purchased for resale, rather than investment) could limit our ability to sell properties and may affect our ability to sell properties without adversely affecting returns to our shareholders. These restrictions could adversely affect our ability to achieve our investment objectives.

Valuations and appraisals of our investments may not necessarily correspond to realizable value.

We value our real estate properties initially at cost, which we expect to represent fair value at that time. After acquisition, valuations may include appraisals of our properties periodically. The valuation methodologies used to value our real estate properties will involve subjective judgments regarding such factors as comparable sales, rental and operating expense data, the capitalization and/or discount rate and projections of future rent and expenses based on appropriate analysis. Although we believe our valuation procedures are designed to determine the accurate fair value of our assets, appraisals and valuations of our real estate properties and other investments assets will be only estimates of fair value and therefore may not correspond to realizable value upon a sale of those assets.

Uninsured losses related to real estate investments may adversely affect our results of operation.

We purchase, and we may be required by lenders of mortgage loans or other financings to obtain, certain insurance coverage on our real estate investments. Either the property manager or the Advisor selects policy specifications and insured limits which it believes to be appropriate and adequate given the risk of loss, the cost of the coverage and industry practice. The nature of the tenants at the properties we hold may expose us and our operations to an increase in liability for personal injuries or other losses. There can be no assurance that such insurance will be sufficient to cover potential liabilities. Some of our policies may be subject to limitations involving large deductibles or co-payments and policy limits which may not be sufficient to cover losses. Furthermore, insurance against certain risks, such as terrorism, flood, and toxic mold, may be unavailable or available at commercially unreasonable rates or in amounts less than the full market value or replacement cost of the properties. There can be no assurance particular risks that are currently insurable, will continue to be insurable on an economical basis or current levels of coverage will continue to be available. If a loss occurs that is partially or completely uninsured, we may lose all or part of our investment in a property as well as the anticipated future cash flows from such properties. In addition, if the damaged properties are subject to recourse indebtedness, we would continue to be liable for the indebtedness, even if these properties were irreparably damaged. We may also be liable for any uninsured or underinsured personal injury, death, or property damage claims, which could result in decreased dividends to shareholders.

We may acquire a property or properties “AS IS,” which increases the risk of an investment that requires us to remedy defects or costs without recourse to the prior owner.

We may acquire real estate properties “as is” with only limited representations and warranties from the property seller regarding matters affecting the condition, use and ownership of the property. As a result, if defects in the property (including any building on the property) or other matters adversely affecting the property are discovered, we may not be able to pursue a claim for any or all damage against the property seller. Such a situation could negatively affect our results of operations.

19

Table of Contents

We rely on affiliated and outside property managers to properly manage and lease our properties.

The Advisor and an affiliate of the Advisor serve as our principal property managers, and the Advisor has hired and intends to hire other affiliates and/or third parties to serve as additional property managers, to manage our properties and act as leasing agents to lease vacancies in our real estate properties. These property managers will have significant decision-making authority with respect to the management of our properties. Our ability to direct and control how our properties are managed may be limited. We will not, and the Advisor will not as to its affiliates and third-party property managers, supervise any of the property managers or any of their respective personnel on a day-to-day basis. Thus, the success of our business may depend in large part on the ability of our property managers to manage the day-to-day operations and their ability to lease vacancies in our properties. Any adversity experienced by our property managers could adversely impact the operation and profitability of our properties and, consequently, our ability to achieve our investment objectives.

Risks Related with Our Indebtedness and Financing

Market conditions could adversely affect our ability to obtain financing.

As a REIT, we are required to distribute at least 90% of our taxable income (excluding net capital gains) to our shareholders in each taxable year, and thus our ability to retain internally generated cash is limited. Accordingly, our ability to acquire properties or to make capital improvements to or remodel properties can depend on our ability to obtain debt or equity financing from third parties or the sellers of properties or to sell other properties. Market fluctuations and disruptions in the credit markets could significantly affect our ability to access capital. Reductions in our available borrowing capacity, or inability to establish a credit facility when required or when business conditions warrant, could then limit the number, size and quality of properties we could acquire or the amount of improvements we could make on acquired properties, which could materially affect our ability to achieve our investment objectives and may result in price or value decreases of our real estate assets.

Derivatives and hedging activity could adversely affect cash flow.

In the normal course of business, we use derivatives to manage our exposure to interest rate volatility on debt instruments, including hedging for future debt issuances. At other times we may utilize derivatives to decrease our exposure to floating interest rates. There can be no assurance that these hedging arrangements will have the desired beneficial impact.  These arrangements, which can include a number of counterparties, may expose us to additional risks, including failure of any of our counterparties to perform under these contracts, and may involve extensive costs, such as transaction fees or breakage costs, if we terminate them.  No strategy can completely insulate us from the risks associated with interest rate volatility.

The phase out of LIBOR and transition to SOFR as a benchmark interest rate could have adverse effects.

In 2018, the Alternative Reference Rate Committee identified the Secured Overnight Financing Rate (“SOFR”) as the alternative to LIBOR. SOFR is a broad measure of the cost of borrowing cash overnight collateralized by U.S. Treasury securities, published by the Federal Reserve Bank of New York. Starting in 2024, it is expected that no new contracts will reference LIBOR and will instead use SOFR. Due to the broad use of LIBOR as a reference rate, all financial market participants, including the Company, are impacted by the risks associated with this transition and therefore it could adversely affect our operations and cash flows.

We could face difficulties in refinancing loans involving balloon payment obligations.

Some of our mortgage loans require us to make a lump-sum or “balloon” payment at maturity. Our ability to make a balloon payment at maturity could be uncertain and may depend upon our ability to obtain additional financing, to refinance the debt or our ability to sell the particular property. If we try and refinance the debt, we may not be able to obtain terms as favorable as the original loan. Based on current market interest rates, the interest rate obtained upon refinancing in subsequent years may be higher than the original loan. If we are not able to refinance the debt, or obtain acceptable terms, we may be required to sell the mortgaged property at a time which may not permit realization of the maximum return on such property. The effect of a refinancing or sale could affect the rate of return to shareholders and the projected time of disposition of our assets.

20

Table of Contents

Lenders may require restrictive covenants relating to our operations, which may adversely affect our flexibility and our ability to achieve our investment objectives.

Mortgage loans obtained by us could impose restrictions that affect our distribution and operating policies, our ability to incur additional debt and our ability to resell interests in the property. Loan documents may contain covenants that limit our ability to further mortgage the property, discontinue insurance coverage, replace the Advisor or the property manager, or terminate certain operating or lease agreements related to the property. Such restrictions may limit our ability to achieve our investment objectives.

Increases in interest rates on variable rate debt incurred and new financings by us will reduce cash available for dividends.

Increases in interest rates on any variable rate debt incurred or new financings would increase our interest costs, which could reduce our cash flows and our ability to pay dividends to our shareholders. In addition, if we need to repay existing debt during periods of rising interest rates, we could be required to liquidate one or more of our investments in properties at times which may not permit realization of the maximum return on such investments.

Complying with REIT requirements may limit our ability to hedge liabilities through tax-efficient means, which may adversely affect our results of operations.

We have entered into a number of hedging transactions and may enter into additional such transactions. Hedging transactions could take a variety of forms, including interest rate swaps or cap agreements, options, futures contracts, forward rate agreements, or similar financial instruments. The REIT provisions of the Code substantially limit our ability to hedge liabilities. Because we conduct substantially all of our operations through our operating partnership, any income from a hedging transaction entered into to manage risk of interest rate changes with respect to borrowings made or to be made to acquire or carry real estate assets will not constitute gross income to us for purposes of the 75% or 95% gross income test. As a result, we may be required to limit the operating partnership’s use of advantageous hedging techniques or to implement hedges through certain taxable corporations. This could increase the costs and risks of hedging activities. We intend to structure any hedging transaction in a manner that does not jeopardize our ability to qualify as a REIT.

Risks Related to Other Investments

Investments in other real estate related investments could involve higher risks than investment in real estate properties, which could adversely affect our operations and ability to make dividend payments.

We are permitted to invest in other real estate assets. We can invest in real estate equity, debt, and derivative securities.  These assets can be quite risky, illiquid, and volatile and the value of these assets could cause the value of our shares to fluctuate and could result in losses that materially adversely affect our results of operations.

Risks Related to Conflicts of Interest

We are subject to several conflicts of interest arising out of our relationships with our affiliates, including our Advisor and its affiliates.

There are conflicts of interest in our relationship with the Advisor and its affiliates and several trustees, which could adversely affect our operations and business operations.

We are subject to potential conflicts of interest arising out of our relationships with the Advisor, its affiliates, and certain trustees. Conflicts of interest may arise among a trustee or the Advisor and its respective affiliates, on the one hand, and us and our shareholders, on the other hand. As a result of these conflicts, the trustee or Advisor may favor its own interests or the interests of its affiliates over the interest of our shareholders or operating partnership.

21

Table of Contents

Division of Loyalty/Allocation of time and effort

Several of our officers and/or trustees serve as officers, governors, and owners of one or more entities (certain of which are affiliated with our Advisor or trustees), property managers, tenants of our properties, brokerage companies and other real estate entities owning real estate investments. As a result, these individuals owe duties to these other entities and their investors, which may conflict with the duties that they owe to us and our shareholders. Their loyalties to these other entities and investors could result in action or inaction detrimental to our business or result in conflicts relating to the allocation of their time and services, which could harm implementation of our business strategy and investment and leasing opportunities.

Allocation of investment opportunities

The Advisor and its affiliates are or may become committed to the management of other business ventures. Accordingly, there may be conflicts of interest between our investments and other investments or business ventures in which the Advisor and its affiliates are participants. In addition, the Advisor and its officers will advise other investment programs that invest in commercial real estate properties and real estate related assets in which we may be interested. Therefore, the Advisor could face conflicts of interest in allocating and determining which programs will have the opportunity to acquire and participate in such investments as they become available. As a result, other investment programs advised by the Advisor may compete with us with respect to investors and certain investments we may want to acquire.

22

Table of Contents

ITEM 1B. UNRESOLVED STAFF COMMENTS

None.

ITEM 1C. CYBERSECURITY

With oversight from the Board of Trustees, the Advisor is responsible for managing all cyber risks and overseeing our security programs. Cybersecurity risk management has been delegated to the Advisor’s executive officers, with day-to-day management carried out by the Advisor’s Chief Transformation Officer (CTO), Jamie Bucholz.

The Advisor’s cybersecurity risk oversight includes: (i) reviewing and approving technology security policies and internal cybersecurity controls, (ii) monitoring cybersecurity and information security exposures, (iii) confirming the Advisor has adequate procedures in place to not only control and limit these exposures but also to timely respond to any cyber incident, and (iv) mandatory cyber security trainings for all Advisor personnel.

The Advisor partners with several third-party technology providers to monitor and protect internal IT infrastructure and data. The Advisor has hired Marco Technologies, as the organization’s Managed IT provider with tools that systematically update hardware and software while also monitoring uptime to ensure seamless business operations. Marco Technologies also provides cyber security trainings, which all Advisor personnel are required to complete on a monthly basis. The Advisor utilizes Red Canary to provide 24/7 monitoring on all end points with triggers to isolate and mitigate any suspicious cyber activity. Finally, High Point Networks provides physical and cloud-based network data backup solutions for the Advisor. In collaboration with the Advisor, an extensive data back-up plan is in place with Return to Operations objectives of less than 24 hours. Although our CTO does not come from an information technology background, she relies on her extensive organization and project management experience to coordinate and manage the third-party providers who perform our cybersecurity function and to implement our cybersecurity incident response plan described below.

The Board of Trustees and Advisor are aware that preventive measures cannot prevent all cyber incidents. When a cyber incident occurs, our actions are guided by an incident response plan decision tree to (i) detect, contain and eradicate any threats, (ii) assess materiality, (iii) notify internal parties, (iv) recover any compromised data and information systems, (v) limit impacts of any such incident on the Trust’s operations, and (vi) report any such incident as required by law or as otherwise necessary.

Our business strategy, results of operations or financial condition have not been materially impacted by cybersecurity threats, including as a result of any previous cybersecurity incidents. Although we cannot predict the cybersecurity incidents we may face in the future, we believe we have implemented reasonable cybersecurity protections and do not have reason to believe our business strategy, results of operations or financial condition will be materially impacted by cybersecurity incidents in the future.

For a discussion of risks from cybersecurity threats, please see “Item 1A. Risk Factors.”

23

Table of Contents

ITEM 2. PROPERTIES

General

Our policy is to acquire assets with an intention to hold these assets as long-term investments seeking income and capital appreciation through an increase in value of our real estate portfolio, as well as increased revenue as a result of higher rent. These types of investments are the core of our strategy of creating shareholder value. We currently own and maintain a portfolio of real estate diversified by geographical location and by type and size.

The majority of our real estate investments are managed by a third party. Property management firms usually receive between 2% and 5% of gross rent collection for their services. Substantially all of our commercial revenues consist of base rents received under leases having terms ranging from month-to-month to over 25 years. More than half of our existing commercial property leases as of December 31, 2023 contain “step up” rental clauses providing for annual increases in the base rental payments of approximately 1.0% to 3.0% each year during the term of the lease.

Properties

As of December 31, 2023, we owned 183 properties located in 12 states, containing approximately 11,302 apartment units and 1,470,000 square feet of leasable commercial space. The residential and commercial portfolio of properties includes a diversified mixture of multifamily, single, and multi-tenant retail and office buildings as well as industrial and medical facility properties. The majority of the properties are located in the largest cities in the states of North Dakota and Minnesota.

As of December 31, 2023, approximately 79.5% (based on cost) of the properties were apartment communities. Most multifamily dwelling properties are leased to a variety of tenants under short-term leases of less than a year.

As of December 31, 2023, approximately 20.5% (based on cost) of the properties were comprised of industrial, office, retail and medical commercial properties. Most commercial properties are leased to a variety of tenants under long-term leases.

The following information applies to all of our operating properties:

We believe all of our properties are adequately covered by insurance and suitable for their intended purposes.
Our properties are located in markets where we are subject to competition in attracting new tenants and retaining current tenants; and
Depreciation is provided on a straight-line basis over the estimated useful lives of the buildings.

The below table sets forth certain information regarding each of our properties owned, including unconsolidated affiliates, as of December 31, 2023 (in thousands, except units or leasable sq. ft.).

# of

Physical

Units or

Occupancy

Year

Leasable

Total

at December

Property


Location


Acquired


Sq. Ft


Investment


31, 2023

Amberwood

Grand Forks, ND

2016

96

$

4,300

93.17

%

Arbor

Bismarck, ND

2013

12

696

97.63

%

Arbor II

Bismarck, ND

2013

12

700

99.50

%

Arbor III

Bismarck, ND

2013

12

760

100.00

%

Ashbury

Fargo, ND

2013 & 2016

61

4,139

99.50

%

Auburn II

Fargo, ND

2007

24

1,111

88.06

%

Autumn Ridge

Grand Forks, ND

2004

144

10,418

97.64

%

Barrett Arms

Crookston, MN

2014

24

1,281

97.54

%

Bayview

Fargo, ND

2007

100

6,083

92.95

%

Bell Plaza* (FKA Northland Plaza)

Bloomington, MN

2015

299,660

46,740

73.18

%

Belmont

Bismarck, ND

2020

26

1,601

93.02

%

Berkshire

Fargo, ND

2008

12

525

89.93

%

24

Table of Contents

Betty Ann

Fargo, ND

2009

24

1,012

97.02

%

Biolife Plasma Center

Bismarck, ND

2008

11,671

2,695

100.00

%

Biolife Plasma Center

Grand Forks, ND

2008

13,190

2,847

100.00

%

Biolife Plasma Center

Janesville, WI

2008

12,225

2,230

100.00

%

Biolife Plasma Center

Mankato, MN

2008

12,965

3,935

100.00

%

Biolife Plasma Center

Marquette, MI

2008

11,737

3,128

100.00

%

Biolife Plasma Center

Onalaska, WI

2008

12,180

2,384

100.00

%

Biolife Plasma Center

Oshkosh, WI

2008

12,191

2,143

100.00

%

Biolife Plasma Center

Sheboygan, WI

2008

13,230

2,482

100.00

%

Biolife Plasma Center

Stevens Point, WI

2008

13,190

2,425

100.00

%

Birchwood I

Fargo, ND

2017

12

468

97.46

%

Birchwood II

Fargo, ND

2017

54

2,917

95.67

%

Bluemont Lakes Financial Center

Fargo, ND

2004

31,750

5,303

100.00

%

Bradbury

Bismarck, ND

2018

96

6,151

92.50

%

Briar Pointe

Fargo, ND

2021

30

1,935

96.27

%

Bridgeport

Fargo, ND

2016

120

8,504

96.75

%

Bristol Park

Grand Forks, ND

2016

80

5,844

94.01

%

Brookfield

Fargo, ND

2008

72

2,680

92.49

%

Brownstone

Fargo, ND

2021

72

4,390

94.23

%

Cambridge (FKA 44th Street)

Fargo, ND

2013

42

2,558

96.35

%

Candlelight

Fargo, ND

2012

66

2,214

88.17

%

Carling Manor

Grand Forks, ND

2008

12

838

96.01

%

Carlton Place

Fargo, ND

2008

213

9,093

91.50

%

Carr

Fargo, ND

2017

18

874

99.60

%

Cedars 4

Fargo, ND

2018

18

1,245

96.58

%

Chandler 1802

Grand Forks, ND

2014

24

1,434

92.04

%

Chandler 1834

Grand Forks, ND

2018

12

722

94.37

%

Chandler 1866

Grand Forks, ND

2005

12

384

94.49

%

Chandler 1898

Grand Forks, ND

2022

12

578

94.00

%

Cherry Creek (FKA Village)

Grand Forks, ND

2008

35

2,169

90.16

%

Cityside

Fargo, ND

2018

36

1,396

87.79

%

Cobalt Apartments

Fort Worth, TX

2022

270

54,730

82.58

%

Columbia Park Village

Grand Forks, ND

2020

12

648

94.41

%

Columbia West

Grand Forks, ND

2008

70

4,487

94.61

%

Country Club

Fargo, ND

2011

40

1,843

94.06

%

Countryside

Fargo, ND

2011

24

932

96.17

%

Courtyard

St. Louis Park, MN

2013

151

9,252

74.47

%

Dairy Queen

Dickinson, ND

2012

2,811

988

100.00

%

Dairy Queen

Moorhead, MN

2011

2,712

1,033

100.00

%

Dairy Queen

Apple Valley, MN

2018

5,348

1,673

-

%

Dakota Manor

Fargo, ND

2014

54

2,996

89.41

%

Danbury

Fargo, ND

2007

135

7,681

93.34

%

Deer Park

Hutchinson, MN

2022

138

14,879

92.92

%

Dellwood Estates

Anoka, MN

2013

132

12,320

97.52

%

Desoto Estates

Grand Forks, ND

2022

68

5,992

98.45

%

Desoto Townhomes

Grand Forks, ND

2022

24

3,292

99.26

%

Diamond Bend

Mandan, ND

2022

78

10,751

95.85

%

Eagle Run

West Fargo, ND

2010

144

7,342

88.77

%

Eagle Sky I

Bismarck, ND

2016

20

1,604

98.29

%

Eagle Sky II

Bismarck, ND

2016

20

1,680

96.76

%

East Bridge

Fargo, ND

2017

58

6,490

97.16

%

Eastbrook

Bismarck, ND

2020

24

1,381

91.14

%

Echo Manor

Hutchinson, MN

2014

30

1,198

95.37

%

Eide Bailly Building***

Fargo, ND

2007

74,646

-

100.00

%

Emerald Court

Fargo, ND

2008

24

1,144

96.40

%

Essex

Fargo, ND

2017

18

937

87.04

%

Evergreen Terrace

Omaha, NE

2020

144

9,219

92.40

%

Fairview

Bismarck, ND

2008

84

5,467

96.22

%

Family Dollar Store

Mandan, ND

2010

9,100

870

100.00

%

First International Bank & Trust

Moorhead, MN

2011

3,510

945

-

%

Flagstone

Fargo, ND

2021

120

7,792

95.77

%

Flickertail

Fargo, ND

2008

180

8,151

91.06

%

Forest Avenue

Fargo, ND

2013

20

815

98.78

%

Four Points Office Building

Fargo, ND

2007

12,383

1,494

100.00

%

Foxtail Creek Townhomes

Fargo, ND

2020

30

1,488

95.06

%

Galleria III

Fargo, ND

2010

18

1,187

88.60

%

Garden Grove

Bismarck, ND

2016

95

7,274

91.36

%

Gate City Bank

Grand Forks, ND

2008

17,406

2,237

67.53

%

25

Table of Contents

Georgetown

Fridley, MN

2014

468

35,778

78.96

%

Glen Pond

Eagan, MN

2011

528

44,454

88.72

%

Goldmark Office Park

Fargo, ND

2007

127,238

23,192

100.00

%

Grand Forks Marketplace**

Grand Forks, ND

2003

182,588

-

93.94

%

Granger Court

Fargo, ND

2013

59

4,548

88.52

%

Great American Insurance Building

Fargo, ND

2005

15,000

2,270

100.00

%

Guardian Building Products

Fargo, ND

2012

100,600

3,340

100.00

%

Hannifin

Bismarck, ND

2013

14

846

96.85

%

Harrison Richfield

Grand Forks, ND

2007

140

8,182

93.71

%

Hartford

Fargo, ND

2018

30

1,421

92.63

%

Hawn

Fargo, ND

2020

48

2,801

91.05

%

Highland Meadows

Bismarck, ND

2011

144

10,847

95.25

%

Hunter’s Run I

Fargo, ND

2007

12

483

83.07

%

Hunter’s Run II

Fargo, ND

2008

12

518

97.44

%

Huntington

Fargo, ND

2015

10

439

96.65

%

Islander

Fargo, ND

2011

24

1,419

88.64

%

Jadestone

Fargo, ND

2017

18

937

74.45

%

Kennedy

Fargo, ND

2013

12

813

91.33

%

Library Lane

Grand Forks, ND

2007

60

3,007

92.42

%

Madison (FKA Columbine)

Grand Forks, ND

2015

12

740

98.22

%

Maple Ridge

Omaha, NE

2008

174

10,978

91.77

%

Maplewood

Maplewood, MN

2014

240

18,269

86.67

%

Maplewood Bend

Fargo, ND

2009 and 2010

183

7,727

88.62

%

Martha Alice

Fargo, ND

2009

24

1,055

94.66

%

Mayfair (FKA Colony Manor)

Grand Forks, ND

2008

24

1,321

94.64

%

Midtown Plaza

Minot, ND

2004

17,808

1,342

64.98

%

Monticello

Fargo, ND

2013

18

989

90.22

%

Montreal Courts

Little Canada, MN

2013

444

30,699

89.60

%

Morningside

Fargo, ND

2018

17

803

88.49

%

Newgate

Bismarck, ND

2022

46

2,462

91.40

%

Oak Court

Fargo, ND

2008

81

3,153

93.37

%

Oakview Townhomes (FKA Arrowhead)

Grand Forks, ND

2017

82

6,004

92.89

%

O'Reilly Auto Store

Mandan, ND

2010

6,300

591

100.00

%

Oxford

Fargo, ND

2021

145

10,219

96.50

%

Pacific Park I

Fargo, ND

2013

30

1,064

90.02

%

Pacific Park II

Fargo, ND

2013

39

1,182

89.06

%

Pacific South

Fargo, ND

2013

15

609

88.19

%

Park Circle

Fargo, ND

2017

18

937

95.87

%

Parkview Arms

Bismarck, ND

2015

62

4,850

93.79

%

Parkway Office (FKA Echelon Building)

Fargo, ND

2006

17,000

1,893

100.00

%

Parkwest Gardens

West Fargo, ND

2014

143

8,375

88.71

%

Parkwood

Fargo, ND

2008

40

1,582

86.90

%

Pebble Creek

Bismarck, ND

2008

70

2,881

97.20

%

Pinehurst

Fargo, ND

2021

210

14,982

92.92

%

Plumtree

Fargo, ND

2017

18

939

94.93

%

Prairiewood Court I & II

Fargo, ND

2006 and 2007

60

2,458

75.85

%

Prairiewood Meadows

Fargo, ND

2012

88

5,673

91.47

%

Quail Creek

Springfield, MO

2015

164

11,236

96.17

%

Robinwood

Coon Rapids, MN

2014

120

8,399

91.38

%

Rosedale Estates

Roseville, MN

2014

360

28,482

79.91

%

Rosegate

Fargo, ND

2008

90

3,608

88.68

%

Rosser

Bismarck, ND

2020

24

1,491

88.75

%

Roughrider

Grand Forks, ND

2016

12

699

92.04

%

Saddlebrook

West Fargo, ND

2008

60

1,804

94.53

%

Sage Park (FKA Brighton Village)

New Brighton, MN

2014

240

17,955

89.05

%

Sargent

Fargo, ND

2017

36

1,734

82.20

%

Schrock

Fargo, ND

2013

18

811

92.52

%

SE Brooklyn Park****

Brooklyn Park MN

2022

144

30,984

95.90

%

SE Maple Grove, LLC****

Maple Grove, MN

2021

161

31,514

99.40

%

SE Rogers, LLC****

Rogers, MN

2022

165

32,573

85.50

%

SE Savage, LLC****

Savage, MN

2021

190

36,790

91.10

%

Sheridan Pointe

Fargo, ND

2013

48

2,968

91.36

%

Sierra Ridge

Bismarck, ND

2006 and 2011

136

11,219

96.70

%

Somerset

Fargo, ND

2008

75

4,158

95.25

%

Southgate

Fargo, ND

2007

162

6,581

96.61

%

Southview III

Grand Forks, ND

2011

18

778

79.51

%

Southview Village

Fargo, ND

2007

72

3,653

92.18

%

Spring

Fargo, ND

2013

25

1,053

95.40

%

26

Table of Contents

ST Fossil Creek*

Fort Worth, TX

2023

228

43,405

-

%

ST Park Hill*

Dallas, TX

2023

318

49,102

79.25

%

Stanford Court

Grand Forks, ND

2013

96

5,040

89.22

%

Stonefield

Bismarck, ND

2014

192

29,079

93.06

%

Stony Brook

Omaha, NE

2009

148

11,606

94.15

%

Summerfield

Fargo, ND

2015

18

862

96.62

%

Summit Point

Fargo, ND

2015

87

6,983

96.73

%

Sunchase

Fargo, ND

2017

36

1,878

97.56

%

Sunset Ridge

Bismarck, ND

2008 and 2010

180

12,440

96.76

%

Sunview

Grand Forks, ND

2008

36

2,074

95.26

%

Sunwood Estates

Fargo, ND

2007

80

4,499

93.55

%

Thunder Creek

Fargo, ND

2018

57

5,396

92.30

%

Titan Machinery

Bismarck, ND

2015

22,293

2,376

100.00

%

Titan Machinery

Dickinson, ND

2012

17,760

1,850

100.00

%

Titan Machinery

Fargo, ND

2012

29,800

3,243

100.00

%

Titan Machinery

Marshall, MN

2011

67,600

4,029

100.00

%

Titan Machinery

Minot, ND

2012

23,690

2,272

100.00

%

Titan Machinery

North Platte, NE

2016

18,910

1,593

100.00

%

Titan Machinery

Sioux City, IA

2013

36,332

2,787

100.00

%

Trustmark

Fargo, ND

2020

45,755

13,549

100.00

%

Twin Oaks

Hutchinson, MN

2014

80

4,476

90.63

%

Twin Parks

Fargo, ND

2008

66

2,596

95.14

%

Valley Homes Duplexes

Grand Forks, ND

2015

24

2,591

89.89

%

Valley View

Golden Valley, MN

2014

72

7,825

93.51

%

Village Park

Fargo, ND

2008

60

2,536

95.68

%

Village West

Fargo, ND

2008

80

2,987

93.97

%

Walgreens

Alexandria, LA

2009

14,560

4,063

100.00

%

Walgreens

Batesville, AR

2009

14,820

6,877

100.00

%

Walgreens

Denver, CO

2011

13,390

4,706

100.00

%

Walgreens

Fayetteville, AR

2009

14,550

5,368

100.00

%

Walgreens

Laurel, MS

2010

14,820

4,264

100.00

%

Washington

Grand Forks, ND

2016

17

745

91.82

%

Wells Fargo Building

Duluth, MN

2007

96,233

6,035

74.08

%

West Oak

Fargo, ND

2017

18

904

90.32

%

Westcourt

Fargo, ND

2014

64

3,793

92.71

%

Westside

Hawley, MN

2010

14

559

79.65

%

Westwind

Fargo, ND

2008

18

633

87.74

%

Westwood Estates

Fargo, ND

2008

200

8,398

91.28

%

Willow Park

Fargo, ND

2008

102

6,843

93.22

%

Wolf Creek

Fargo, ND

2020

54

5,364

98.69

%

Woodland Pines (FKA Fredericksburg)

Omaha, NE

2018

173

13,412

91.41

%

* 70.00% ownership interest

** 66.67% ownership interest

*** 50.00% ownership interest

**** 60% ownership interest

Geography

Of our 183 properties, 142 are located in North Dakota, with 89 being located in the greater Fargo, North Dakota and Moorhead, Minnesota metropolitan statistical area. The North Dakota region generated approximately 52.6% of our rental revenue for the year ended December 31, 2023.

The following table presents the total real estate investment amount by state and annual rental revenue by state, as of the year ended December 31, 2023 (in thousands):

Real Estate

Rental

State


Investment

%

Revenue

%

North Dakota

$

514,593

53.0

%

$

75,483

52.6

%

Minnesota

299,908

30.9

%

49,304

34.3

%

Other

156,303

16.1

%

18,844

13.1

%

$

970,804

100.0

%

$

143,631

100.0

%

27

Table of Contents

Economy

The North Dakota workforce is concentrated in agricultural, energy, information technology, aerospace sciences and medical sciences. According to the U.S. Census Bureau, the 2023 estimated combined population of the Fargo, West Fargo and Moorhead metro area was 216,290 people.

The following chart depicts the difference in unemployment rates between North Dakota and the national average for 2023:


Jan

Feb

Mar

Apr

May

Jun

Jul

Aug

Sep

Oct

Nov

Dec

National (1)

3.4

%

3.6

%

3.5

%

3.4

%

3.7

%

3.6

%

3.5

%

3.8

%

3.8

%

3.8

%

3.7

%

3.7

%

North Dakota (1)

2.1

%

2.1

%

2.1

%

2.1

%

2.1

%

2.0

%

2.0

%

1.9

%

1.9

%

1.9

%

1.9

%

1.9

%

(1)Seasonally adjusted

Source: Bureau of Labor Statistics

Acquisitions and Dispositions

We had no acquisitions and two dispositions of property during the year ended December 31, 2023. We had eight acquisitions and five dispositions of property during the year ended December 31, 2022. We had five acquisitions and two dispositions of property during the year ended December 31, 2021.

Capitalization rates are a key decision-making item used by the Board. In making acquisitions, the Board currently targets capitalization rates between 6.0 to 10.0%, depending on the amount of risk involved. For those properties with greater risk, the Board targets greater capitalization rates (9.0% or greater). For those properties exhibiting less risk, a lower capitalization risk is acceptable. For potential acquisitions, the Board also requires an adequate spread between the financing on the property and the capitalization rate. Capitalization rates for acquisitions are calculated using projected net operating income divided by the investment. Net operating income is calculated by taking GAAP net income and adding back depreciation, amortization, and interest expense. Capitalization rates for dispositions are calculated in the same way with the exception of using historical, rather than projected, net operating income. The market has seen an increase in investors, driving up overall acquisition prices, thus lowering capitalization rates below the target thresholds set by the Board.

We use historical occupancy, rental income, and expenses to calculate projected net operating income for potential real estate investments. For residential properties, we make various assumptions about future rents, occupancy levels, and expenses based on historical financial information and our assessment of the property’s future potential. The projected NOI for residential acquisitions is typically based on historical occupancy and expenses over a three-to-five year period. When historical information is unavailable, market vacancy and credit loss factors are estimated.

For commercial and residential properties, assumptions regarding rental income and expenses are based on the terms of the in-place leases and available historical financial information which is then used to generate projected net operating income.

Numerous estimates and assumptions are necessary to generate projected net operating income for potential commercial and residential acquisitions, and there is no guarantee actual net operating income will equal projected net operating income.

Tenants

Our tenants are varied and consist of individuals and national, regional, and local businesses. Our commercial properties generally attract a mix of tenants. In 2023, 2022 and 2021, no single tenant represented more than 10% of our revenues. We have investments in several types of real estate, including multifamily, retail, office, industrial, and medical. Within our office, retail, and industrial properties, we have over 100 tenants who operate in numerous industries, including

28

Table of Contents

restaurants, pharmacy, medical, financing, banking, insurance, professional services, technology, wholesale and direct retail.

Lease Expirations

The vast majority of residential leases are for one-year periods. The following table lists a summary, as of December 31, 2023, of lease expirations on non-residential properties scheduled to occur during each of the ten calendar years from 2023 to 2033 and thereafter, assuming that tenants exercise no renewal options or early termination rights.  Base rents do not include CAM (common area maintenance).  

The table is based on leases on December 31, 2023 for our non-residential properties including our unconsolidated affiliates (in thousands, except leasable area data).

# of Leases

Gross

% of Gross

Expiring

% of Total

Lease Expiration Year


Expiring


Leasable Area


Leasable Area


Base Rent


Base Rent

Month-to-Month

0

0.00

%

$

0.00

%

2024

16

148,009

11.04

%

815,349

6.30

%

2025

15

145,675

10.86

%

856,425

6.62

%

2026

12

157,988

11.78

%

1,136,265

8.79

%

2027

15

132,852

9.91

%

740,515

5.73

%

2028

10

98,194

7.32

%

2,047,412

15.83

%

2029

7

91,084

6.79

%

1,106,268

8.55

%

2030

12

145,980

10.89

%

2,139,962

16.55

%

2031

2

94,907

7.08

%

1,456,597

11.26

%

2032

8

191,785

14.30

%

2,219,272

17.16

%

2033

7

63,986

4.77

%

414,479

3.21

%

Thereafter

7

70,427

5.26

%

0.00

%

Leased Total

111

1,340,887

100.00

%

$

12,932,544

100.00

%

Mortgage Notes Secured by the Properties

On December 31, 2023, we had $520,155 in mortgage notes payable with respect to our properties. Principal payments on these notes are payable as follows (in thousands):

Years ending December 31,

Amount

2024

$

22,304

2025

53,288

2026

69,259

2027

79,821

2028

41,680

Thereafter

253,803

$

520,155

Insurance

We believe we have adequate property damage, fire loss and liability insurance on all of our properties with reputable, commercially rated companies. We also believe our insurance policies contain commercially reasonable deductibles and limits, adequate to cover our properties. We expect to maintain this type of insurance coverage and to obtain similar coverage with respect to any additional properties we acquire in the near future. Further, we have title insurance relating to our properties in an aggregate amount we believe to be adequate.

29

Table of Contents

Regulations

Our properties, as well as any other properties we may acquire in the future, are subject to various federal, state, and local laws, ordinances and regulations. They include, among other things, zoning regulations, land use controls, environmental controls relating to air and water quality, noise pollution and indirect environmental impacts such as increased motor vehicle activity. We believe we have all permits and approvals necessary under current law to operate our properties.

ITEM 3. LEGAL PROCEEDINGS

The Company is subject, from time to time, to various legal proceedings and claims that arise in the ordinary course of business.  While the resolution of such matters cannot be predicted with certainty, management believes, based on currently available information, that the final outcome of such matters will not have a material effect on the financial statements of the Company.

ITEM 4. MINE SAFETY DISCLOSURES

Not applicable.

PART II

ITEM 5. MARKET FOR REGISTRANT’S COMMON EQUITY, RELATED SHAREHOLDER MATTERS AND ISSUER PURCHASES OF EQUITY SECURITIES

Market Information

Our common shares of beneficial interest are not listed on any national exchange or over-the-counter market or quoted on any national securities market, and we currently do not have plans to list or have our common shares quoted.

Shareholders and Unit Holders

As of March 13, 2024, we had 11,331,382, common shares of beneficial interests outstanding, held by a total of 1,158 common shareholders and no outstanding options or warrants to purchase our common shares.

In addition, as of March 13, 2024, there were approximately 18,569,993 limited partnership units of our operating partnership outstanding held by approximately 528 limited partners. Pursuant to the exchange rights under the LLLP Agreement of the operating partnership, we have the option, upon redemption requests by the holders of the limited partnership units, to acquire the limited partnership units by paying the holders with our common shares of beneficial interest in lieu of delivering cash. The numbers of common shareholders and limited partners is based on the Company’s records. There is no public trading market for our common shares or the limited partnership units of our Operating Partnership.

Quarterly Dividend Data

We have declared and intend to continue to declare regular quarterly dividends to our common shareholders. Because all of our operations are conducted through our operating partnership, our ability to pay dividends depends on the operating partnership’s ability to make distributions to us and its other limited partners. We pay declared dividends quarterly, whereby the dividend attributable to a calendar quarter would be paid during the first month of the next quarter. Dividends will be paid to common shareholders as of the record dates selected by the Board of Trustees. We intend to make dividends sufficient to satisfy the requirements for qualification as a REIT for federal tax purposes.

30

Table of Contents

The following tables show the dividends we have declared (including the total amount paid on a per share basis, paid in cash, reinvested in shares of our common stock pursuant to the Dividend Reinvestment Plan, and the total amount paid) during the last two fiscal years (in thousands, except per share data).

Dividends Per

Reinvested

2023 Quarter Ended


Common Share


Cash


via DRP


Total Dividends

December 31

$

0.287500

$

1,337

$

1,899

$

3,236

(a)

September 30

$

0.287500

1,323

1,884

3,207

June 30

$

0.287500

1,283

1,890

3,173

March 31

$

0.287500

1,151

1,996

3,147

$

5,094

$

7,669

$

12,763

Dividends Per

Reinvested

2022 Quarter Ended

Common Share

Cash

via DRP

Total Dividends

December 31

$

0.287500

$

1,146

$

1,962

$

3,108

(a)

September 30

$

0.287500

1,097

1,973

3,070

June 30

$

0.287500

1,127

1,910

3,037

March 31

$

0.287500

1,130

1,877

3,007

$

4,500

$

7,722

$

12,222

(a)Fourth quarter dividends paid on January 16th of the following year, for the year ended December 31, 2023. Fourth Quarter dividends were paid on January 17th of the following year, for the year ended December 31, 2022.

The Trust expects that future dividends will be maintained at least at the present rate, unless there are changes in our results of operations, our general financial condition, general economic conditions, or the Board determines other action prudent.

Sale of Securities

During the year ended December 31, 2023, the Operating Partnership issued no limited partnership units for the purchase of real estate investments.

Other Sales

During the years ended December 31, 2023, 2022 and 2021, there were no common shares of the Trust issued in exchange for limited partnership units of the operating partnership.

31

Table of Contents

Redemptions of Securities

Set forth below is information regarding common shares and limited partnership units redeemed during the year ended December 31, 2023.

Average

Total Number of

Total Number of

Approximate Dollar Value of

Total Number

Total Number

Price

Shares Redeemed

Units Redeemed

Shares (or Units) that May

of Common

of Limited

Paid per

as Part of

as Part of

Yet Be Redeemed Under

Shares

Partner Units

Common

Publicly Announced

Publicly Announced

Publicly Announced

Period


Redeemed


Redeemed


Share/Unit


Plans or Programs


Plans or Programs


Plans or Programs

January 1-31, 2023

2,000

28,000

$

21.85

1,499,000

1,181,000

$

14,022

February 1-29, 2023

1,000

$

21.85

1,499,000

1,182,000

$

13,993

March 1-31, 2023

6,000

12,000

$

21.85

1,505,000

1,194,000

$

13,587

Total

8,000

41,000

April 1-30, 2023

35,000

84,000

$

21.85

1,540,000

1,278,000

$

10,985

May 1-31, 2023

9,000

2,000

$

21.85

1,549,000

1,280,000

$

10,734

June 1-30, 2023

$

21.85

1,549,000

1,280,000

$

10,724

Total

44,000

86,000

July 1-31, 2023

8,000

$

21.85

1,549,000

1,288,000

$

10,533

August 1-31, 2023

9,000

3,000

$

21.85

1,558,000

1,291,000

$

10,278

September 1-30, 2023

1,000

1,000

$

21.85

1,559,000

1,292,000

$

10,228

Total

10,000

12,000

October 1-31, 2023

7,000

2,000

$

21.85

1,566,000

1,294,000

$

10,034

November 1-30, 2023

11,000

1,000

$

21.85

1,577,000

1,295,000

$

9,781

December 1-31, 2023

2,000

2,000

$

21.85

1,579,000

1,297,000

$

9,689

Total

20,000

5,000

For the year ended December 31, 2023, the Trust redeemed all shares or units for which we received redemption requests.  In addition, for the year ended December 31, 2023, all common shares and units redeemed were redeemed as part of the publicly announced plans.

The Amended and Restated Share Redemption Plan, effective January 1, 2022, permits us to repurchase common shares held by our shareholders and limited partnership units held by partners of our Operating Partnership, up to an aggregate amount of $55,000 worth of shares and units, upon request by the holders after they have held them for at least one year and subject to other conditions and limitations described in the plan. The amount remaining to be redeemed as of December 31, 2023, was $9,689. The redemption price for such shares and units redeemed under the plan was fixed at $21.85 per share or unit, which became effective January 1, 2022. The redemption plan will terminate in the event the shares become listed on any national securities exchange, the subject of bona fide quotes on any inter-dealer quotation system or electronic communications network or are the subject of bona fide quotes in the pink sheets. Additionally, the Board, in its sole discretion, may terminate, amend or suspend the redemption plan at any time if it determines to do so is in our best interest.

ITEM 6. SELECTED FINANCIAL DATA

None.

ITEM 7. MANAGEMENT’S DISCUSSION AND ANALYSIS OF FINANCIAL CONDITION AND RESULTS OF OPERATIONS

Safe Harbor Statement Under the Private Securities Litigation Reform Act of 1995

Certain statements contained in this section and elsewhere in this Form 10-K constitute “forward-looking statements” within the meaning of the Private Securities Litigation Reform Act of 1995.  Such forward-looking statements involve a number of known and unknown risks, uncertainties and other factors which may cause our actual results, performance, or achievements to be materially different from any future results, performance or achievements expressed or implied by such forward-looking statements.  Please see “Note Regarding Forward-Looking Statements” and “Risk Factors” for more

32

Table of Contents

information. Readers are cautioned not to place undue reliance on these forward-looking statements, which speak only as of the date the statements were made and are not guarantees of future performance.

Introduction

The following discussion should be read in conjunction with the financial statements and related notes included under Part II, Item 8 of this Annual Report on Form 10-K.

Our Management's Discussion and Analysis of Financial Condition and Results of Operations ("MD&A") within this section is focused on the years ended December 31, 2023 and 2022 including year-to-year comparisons between these years. Our MD&A for the year ended December 31, 2021, including year-to-year comparisons between 2022 and 2021, can be found in Part II, Item 7, Management's Discussion and Analysis of Financial Condition and Results of Operations in the Company's Annual Report on Form 10-K for the year ended December 31, 2022.

Overview

Sterling Real Estate Trust d/b/a Sterling Multifamily Trust (“Sterling”, “the Trust” or “the Company”) is a registered, but unincorporated business trust organized in North Dakota in December 2002.  Sterling has elected to be taxed as a Real Estate Investment Trust (“REIT”) under Sections 856-860 of the Internal Revenue Code, which requires that 75% of the assets of a REIT must consist of real estate assets and that 75% of its gross income must be derived from real estate. The net income of the REIT is allocated in accordance with the stock ownership in the same fashion as a regular corporation.  Our real estate portfolio consisted of 183 properties containing 11,302 apartment units and approximately 1,498,000 square feet of leasable commercial space as of December 31, 2023. The portfolio has a net book value of real estate investments (cost less accumulated depreciation) of approximately $757,783, which includes construction in progress. Sterling’s current acquisition strategy and focus is on multifamily apartment properties.

Critical Accounting Policies and Estimates

Below are the accounting policies and estimates that management believe are critical to the preparation of the audited consolidated financial statements included in this Report. Certain accounting policies used in the preparation of these consolidated financial statements are particularly important for an understanding of the financial position and results of operations presented in the historical consolidated financial statements included in this Report. A summary of significant accounting policies is also provided in the aforementioned notes to our consolidated financial statements (see note 2 to the audited consolidated financial statements). These policies require the application of judgment and assumptions by management and, as a result, are subject to a degree of uncertainty. Due to this uncertainty, actual results could differ materially from estimates calculated and utilized by management.

Impairment of Real Estate Investments

The Trust’s investment properties are reviewed for potential impairment at the end of each reporting period or whenever events or changes in circumstances indicate that the carrying value may not be recoverable. At the end of each reporting period, the Trust separately determines whether impairment indicators exist for each property.

Examples of situations considered to be impairment indicators include, but are not limited to:

oA substantial decline or negative cash flows;
oContinued low occupancy rates;
oContinued difficulty in leasing space;
oSignificant financially troubled tenants;
oA change in plan to sell a property prior to the end of its useful life or holding period;
oA significant decrease in market price not in line with general market trends; and
oAny other quantitative or qualitative events or factors deemed significant by the Trust’s management or Board of Trustees.

33

Table of Contents

If the presence of one or more impairment indicators as described above is identified with respect to an investment property, the asset is tested for recoverability by comparing its carrying value to the estimated future undiscounted cash flows. An investment property is considered to be impaired when the estimated future undiscounted cash flows are less than its current carrying value.  When performing a test for recoverability or estimating the fair value of an impaired investment property, the Trust makes complex or subjective assumptions which include, but are not limited to:

oProjected operating cash flows considering factors such as vacancy rates, rental rates, lease terms, tenant financial strength, demographics, holding period and property location;
oProjected capital expenditures;
oProjected cash flows from the eventual disposition of an operating property using a property specific capitalization rate;
oComparable selling prices; and
oProperty specific discount rates for fair value estimates as necessary.

To the extent impairment has occurred, the Trust will record an impairment charge calculated as the excess of the carrying value of the asset over its fair value. Based on evaluation, there was one impairment loss of $2,603 during the year ended December 31, 2023. There was one impairment loss of $561 during the year ended December 31, 2022, and there were no impairment losses during the year ended December 31, 2021.

There have been no material changes in our Critical Accounting Policies as disclosed in Note 2 to our financial statements for the year ended December 31, 2023 included elsewhere in this report.

Acquisition of Real Estate Investments

The Company allocates the purchase price of properties that meet the definition of an asset acquisition to net tangible and identified intangible assets acquired based on their relative fair values. In making estimates of relative fair values for purposes of allocating purchase price, the Company utilizes a number of sources, including independent appraisals that may be obtained in connection with the acquisition or financing of the respective property, our own analysis of recently acquired and existing comparable properties in our portfolio and other market data. The Company also considers information obtained about each property as a result of its pre-acquisition due diligence, marketing, and leasing activities in estimating the relative fair value of the tangible and intangible assets acquired.

REIT Status

We operate in a manner intended to enable us to continue to qualify as a REIT under Sections 856-860 of the Internal Revenue Code. Under those sections, a REIT which distributes at least 90% of its REIT taxable income, excluding net capital gains, as a distribution to its shareholders each year and which meets certain other conditions will not be taxed on that portion of its taxable income which is distributed to its shareholders. We intend to distribute to our shareholders 100% of our taxable income. Therefore, no provision for Federal income taxes is required. If we fail to distribute the required amount of income to our shareholders, we would fail to qualify as a REIT and substantial adverse tax consequences may result

Principal Business Activity

The operating partnership currently directly owns 183 properties. Of these, 143 residential properties located in North Dakota, Minnesota, Missouri, Nebraska and Texas and are principally multifamily apartment buildings. The remaining 40 are commercial properties primarily located in North Dakota with others located in Arkansas, Colorado, Iowa, Louisiana, Michigan, Minnesota, Mississippi, Nebraska and Wisconsin. The commercial properties include retail, office, industrial, and medical properties.  The Trust’s mix of properties is 79.5% residential and 20.5% commercial (based on cost) with a total carrying value of $757,783 at December 31, 2023. The Trust has one property held for sale located in Apple Valley, Minnesota at December 31, 2023.  The carrying value of assets held for sale at December 31, 2023 is $1,563. Currently our focus is limited to multifamily apartment properties. We will consider unsolicited offers for purchase of commercial properties on a case-by-case basis.

34

Table of Contents

The following table represents the number of properties the Trust owns in each state as of December 31, 2023:

Residential Property


Location


No. of Properties


Units

North Dakota

122

7,188

Minnesota

15

3,041

Missouri

1

164

Nebraska

4

639

Texas

1

270

143

11,302

Commercial Property


Location


No. of Properties


Sq. Ft

North Dakota

20

772,000

Arkansas

2

28,000

Colorado

1

17,000

Iowa

1

36,000

Louisiana

1

15,000

Michigan

1

12,000

Minnesota

7

493,000

Mississippi

1

15,000

Nebraska

1

19,000

Wisconsin

5

63,000

40

1,470,000

Management Highlights

Increased revenues from rental operations by $8,571 or 6.3% for the year ended December 31, 2023, compared to the year ended December 31, 2022.
No properties were acquired during the year ended December 31, 2023.
Disposed of two residential and three commercial properties during the year ended December 31, 2023.
Declared dividends aggregating $1.1500 per common share for the year ended December 31, 2023.

35

Table of Contents

Results of Operations for the Years Year Ended December 31, 2023 and 2022

Year ended December 31, 2023


Year ended December 31, 2022


Residential


Commercial


Total


Residential


Commercial


Total

(unaudited)

(unaudited)

(in thousands)

(in thousands)

Real Estate Revenues


$

123,202


$

20,429


$

143,631


$

113,968


$

21,092


$

135,060

Real Estate Expenses

Real Estate Taxes

14,025

2,178

16,203

11,734

2,511

14,245

Property Management

16,038

823

16,861

13,778

789

14,567

Utilities

11,350

1,154

12,504

10,901

1,274

12,175

Repairs and Maintenance

30,900

2,038

32,938

24,479

1,812

26,291

Insurance

5,437

106

5,543

3,755

105

3,860

Total Real Estate Expenses

77,750

6,299

84,049

64,647

6,491

71,138

Net Operating Income

$

45,452

$

14,130

59,582

$

49,321

$

14,601

63,922

Interest

21,435

19,994

Depreciation and amortization

25,004

24,679

Administration of REIT

5,430

5,247

Loss on impairment of property

2,603

561

Other income

(2,546)

(11,091)

Income from continuing operations

7,656

24,532

Discontinued operations

Net Income

$

7,656

$

24,532

Net (Loss) Income Attributed to:

Noncontrolling Interest

$

4,763

$

15,611

Sterling Real Estate Trust

$

2,893

$

8,921

Dividends per share (1)

$

1.1500

$

1.1500

Earnings per share

$

0.2600

$

0.8400

Weighted average number of common shares

11,104

10,632

(1)Does not take into consideration the amounts distributed by the operating partnership to limited partners.

Revenues

Property revenues totaled approximately $143,631 for the year ended December 31, 2023, which constituted an increase of approximately $8,571 or 6.3% compared to the same period in 2022. Residential property revenues increased approximately $9,234 and commercial property revenues decreased approximately $663.

The following table illustrates the occupancy percentage for the periods ended indicated:

December 31,

December 31,


2023

2022

Residential occupancy

90.5

%

93.2

%

Commercial occupancy

89.6

%

87.0

%

Residential revenues for the year ended December 31, 2023, increased $9,234 or 8.1%, in comparison to the same period in 2022. Residential properties acquired since January 1, 2022, contributed approximately $6,130 to the increase in total residential revenues. The remaining increase is due to decreased rental incentives caused by increased renewals and general market rent increases at our stabilized properties. Residential revenues comprised 85.8% of total revenues for the year ended December 31, 2023, compared to 84.4% of total revenues for the year ended December 31, 2022. Residential economic occupancy year-over-year decreased 2.7%, during the year ended December 31, 2023.

For the year ended December 31, 2023, total commercial revenues decreased $663 or 3.2%, in comparison to the same period in 2022. The decrease was primarily attributed to the disposition of two commercial properties which accounts for

36

Table of Contents

$365 of the decrease during the year ended December 31, 2023. The remaining difference in commercial revenues is related to bad debt expense of $195 for the year ended December 31, 2023, as compared to the same period in 2022. The bad debt is related to one tenant at a commercial building in Duluth, MN.

Expenses

Residential expenses from operations of $77,750 during the year ended December 31, 2023 increased $13,103 or 20.3% in comparison to the same period in 2022. The increase is attributed to an increase in repairs and maintenance expense of $6,422 or 26.2%. Properties acquired since January 1, 2022, attributed $885 to the increase in repairs and maintenance expense. Additionally, increased project and upgrade costs, that are considered to be deferred maintenance costs from the year ended 2022, due to COVID-19 restrictions attribute to the increase in repairs and maintenance expense during the year ended December 31, 2023. The increase is also attributed to an increase in property management fees of $2,258 or 16.4%, as well as an increase in real estate taxes and property insurance of $2,291 or 19.5% and $1,684 or 44.9% respectively. Properties acquired since January 1, 2022,  account for $1,450 and $274, respectively.

Commercial expenses from operations of $6,299 during the year ended December 31, 2023 decreased $192 or 3.0% in comparison to the same period in 2022. For the year ended December 31, 2023 utilities decreased by $87, or 66% due to the disposition of one office building in 2022. The decrease is also attributed to a decrease in property management fees of $34, or 26.9%. This is partly due to a one time advertising cost at an office building in Duluth, MN.

Interest expense of $21,435 during the year ended December 31, 2023 increased $1,442 or 7.2% in comparison to the same period in 2022. Interest expense related to financing activities increased by $1,365 during 2023.

Depreciation and amortization expense of $25,004 during the year ended December 31, 2023 increased $325 or 1.3% in comparison to the same period in 2022. Amortization expense will continue to decrease as lease intangibles become fully amortized but will increase upon acquisitions of intangible assets. Depreciation and amortization expense as a percentage of rental income for the years ended December 31, 2023 and 2022 were relatively consistent at 17.4% and 18.3%, respectively.

REIT administration expenses of $5,430 for the year ended December 31, 2023, increased $183 or 3.5% in comparison to the same period in 2022, which is attributed to an increase in REIT advisory fees paid of $125.

Other income of $2,545 for the year ended December 31, 2023 decreased $8,546 or 77.1% in comparison to the same period in 2022. The increase is primarily attributed to the sale of three commercial and two residential properties for $11,090 in 2022 as compared to only two commercial properties in 2023 for $2,597. This is offset by the increase in net loss allocations from Sterling’s ownership in six joint ventures for $621 in 2022.

Construction in Progress and Development Projects

The Trust capitalizes direct and certain indirect project costs incurred during the development period such as construction, insurance, architectural, legal, interest and other financing costs, and real estate taxes. At such time as the development is considered substantially complete, the capitalization of certain indirect costs such as real estate taxes, interest, and financing costs cease, all project-related costs included in construction in process are reclassified to land and building and other improvements.

Construction in progress as of December 31, 2023, consists primarily of construction at several residential properties located in North Dakota and Minnesota. The Rosedale Estates has a project for a parking structure and parking lot. The parking structure is budgeted at $1,710, of which $978 has incurred. The parking lot is budgeted at $5,032, of which $735 has incurred. A rehab at Granger Court due to a fire is budgeted at $1,792, of which $1,691 has incurred and will be completed in Q1 of 2024. Remaining construction in progress projects are primarily related to building and roof system, roof replacements on multiple residential properties, residential exterior window systems, and new deck systems on multiple residential properties.

The Trust has one on-going development through ventures in unconsolidated affiliates.

37

Table of Contents

Kessler Apartments, currently being developed in Fort Worth, Texas is expected to be completed in the third quarter of 2024 and the current project budget approximates $55,000 of which $41,031 has been incurred as of December 31, 2023.

Funds From Operations (FFO)

Funds From Operations (FFO) applicable to common shares and limited partnership units means net income (computed in accordance with GAAP), excluding gains (or losses) from sales of property, plus depreciation and amortization, and after adjustments for unconsolidated partnerships and joint ventures. Adjustments for unconsolidated partnerships and joint ventures will be calculated to reflect funds from operations on the same basis.

Historical cost accounting for real estate assets implicitly assumes the value of real estate assets diminishes predictably over time. Since real estate values have historically risen or fallen with market conditions, many industry investors have considered presentations of operating results for real estate companies that use historical cost accounting to be insufficient by themselves. The term Funds From Operations (FFO) was created to address this problem. It was intended to be a standard supplemental measure of REIT operating performance that excluded historical cost depreciation from — or “added back” to — GAAP net income.

Our management believes this non-GAAP measure is useful to investors because it provides supplemental information that facilitates comparisons to prior periods and for the evaluation of financial results. Management uses this non-GAAP measure to evaluate our financial results, develop budgets and manage expenditures. The method used to produce non-GAAP results is not computed according to GAAP, is likely to differ from the methods used by other companies and should not be regarded as a replacement for corresponding GAAP measures. Management encourages the review of the reconciliation of this non-GAAP financial measure to the comparable GAAP results.

Since the introduction of the definition of FFO, the term has come to be widely used by REITs. In the view of National Association of Real Estate Investment Trusts (“NAREIT”), the use of the definition of FFO (combined with the primary GAAP presentations required by the Securities and Exchange Commission) has been fundamentally beneficial, improving the understanding of operating results of REITs among the investing public and making it easier than before to compare the results of one REIT with another.

While FFO applicable to common shares and limited partnership units are widely used by REITs as performance metrics, all REITs do not use the same definition of FFO or calculate FFO in the same way. The FFO reconciliation presented here is not necessarily comparable to FFO presented by other real estate investment trusts. FFO should also not be considered as an alternative to net income as determined in accordance with GAAP as a measure of a real estate investment trust’s performance, but rather should be considered as an additional, supplemental measure, and should be viewed in conjunction with net income as presented in the consolidated financial statements included in this report. FFO applicable to common shares and limited partnership units does not represent cash generated from operating activities in accordance with GAAP and is not necessarily indicative of sufficient cash flow to fund a real estate investment trust’s needs or its ability to service indebtedness or to pay dividends to shareholders.

38

Table of Contents

The following tables include calculations of FFO, and the reconciliations to net income, for the years ended December 31, 2023, 2022 and 2021, respectively. We believe these calculations are the most comparable GAAP financial measure (in thousands):

Reconciliation of Net Income Attributable to Sterling to FFO Applicable to Common Shares and Limited Partnership Units

Year ended December 31, 2023

Year ended December 31, 2022

Year ended December 31, 2021

Weighted Avg

Weighted Avg

Weighted Avg

Shares and

Shares and

Shares and


Amount


Units


Amount


Units


Amount


Units


(unaudited)

(in thousands, except per share data)

Net Income attributable to Sterling Real Estate Trust

$

2,893

11,104

$

8,921

10,632

$

8,794

10,160

Add back:

Noncontrolling Interest - Operating Partnership Units

4,848

18,619

15,628

18,626

15,783

18,235

Depreciation & Amortization from continuing operations

25,004

24,679

22,203

Pro rata share of unconsolidated affiliate depreciation and amortization

5,960

3,312

718

Loss on impairment of real estate investments

2,603

561

Subtract:

Gain on sale of depreciable real estate

(2,597)

(11,090)

(1,710)

Funds from operations applicable to common shares and limited partnership units (FFO)

$

38,711

29,723

$

42,011

29,258

$

45,788

28,395

Liquidity and Capital Resources

Evaluation of Liquidity

We continually evaluate our liquidity and ability to fund future operations, debt obligations, and any repurchase requests. As part of our analysis, we consider among other items, the credit quality of tenants and lease expirations.

Our principal demands for funds will be for the: (i) acquisition of real estate and real estate-related investments, (ii) payment of acquisition related expenses and operating expenses, (iii) payment of dividends/distributions, (iv) payment of principal and interest on current and any future outstanding indebtedness, (v) redemptions of our securities under our redemption plans and (vi) capital improvements, development projects, and property related expenditures. Generally, we expect to meet cash needs for the payment of operating expenses and interest on outstanding indebtedness from cash flow from operations. We expect to pay dividends/distributions and any repurchase requests to our shareholders and the unit holders of our operating partnership from cash flow from operations; however, we may use other sources to fund dividends/distributions and repurchases, as necessary.

At December 31, 2023, our unrestricted cash resources consisted of cash and cash equivalents totaling $21,529. Our unrestricted cash reserves can be used for working capital needs and other commitments. In addition, we had unencumbered properties with a gross book value of $57,390, which could potentially be used as collateral to secure additional financing in future periods.

The Trust has a $4,915 variable rate (SOFR plus 2.00%) line of credit agreement with Bremer Bank, which expires in December 2026; and a $5,000 variable rate (SOFR plus 2.00%) line of credit agreement with Bremer Bank, which expires December 2026. The lines of credit are secured by specific properties. The Trust anticipates renewing the line of credit expiring in the next 12 months to continue to hold it as a cash resource to the Trust.

The sale of our securities and issuance of limited partnership units of the operating partnership in exchange for property acquisitions and sale of additional common or preferred shares is also expected to be a source of long-term capital for us.

39

Table of Contents

During the year ended December 31, 2023, we did not sell any common shares in private placements. During the year ended December 31, 2023, we issued 353,000 and 173,000 common shares under the dividend reinvestment plan and optional share purchases, respectively which raised gross proceeds of $11,714. During the year ended December 31, 2022, we did not sell any common shares in private placements. During the year ended December 31, 2022, we issued 342,000 and 177,000 common shares under the dividend reinvestment plan and as optional share purchases, respectively which raised gross proceeds of $11,531.

Additionally, to reduce our cash investment and liquidity needs, the Trust utilizes the UPREIT structure whereby we can acquire property in whole or in part by issuing partnership units in lieu of cash payments. During the year ended December 31, 2023, their was no operating partnership issued for the purchase of real estate investments. During the year end December 31, 2022, the operating partnership issued approximately 560,000 limited partnership units of the operating partnership valued at $23.00 per unit for an aggregate consideration of approximately $12,870 for the purchase of real estate investments.

The Board of Trustees, acting as general partner for the operating partnership, determined an estimate of fair value for the limited partnership units exchanged through the UPREIT structure. In determining this value, the Board relied upon their experience with, and knowledge about, the Trust’s real estate portfolio and debt obligations. The Board typically determines the fair value on an annual basis. The Trustees determine the fair value, in their sole discretion and use data points to guide their determination which is typically based on a consensus of opinion. Thus, the Trust does not employ any specific valuation methodology or formula. Rather, the Board looks to available data and information, which is often adjusted and weighted to comport more closely with the assets held by the Trust at the time of valuation. The principal valuation methodology utilized is the NAV calculation/direct capitalization method. The information made available to the Board is assembled by the Trust’s Advisor. In addition, the Board considers how the price chosen will affect existing share and unit values, redemption prices, dividend coverage ratios, yield percentages, dividend reinvestment factors, and future UPREIT transactions, among other considerations and information. The fair value was not determined based on, nor intended to comply with, fair value standards under US GAAP and the value may not be indicative of the price we would get for selling our assets in their current condition. At this time, no shares are held in street name accounts and the Trust is not subject to FINRA’s specific pricing requirements set out in Rule 2340 or otherwise.

As with any valuation methodology, the methodologies utilized by the Board in reaching an estimate of the value of the shares and limited partnership units are based upon a number of estimates, assumptions, judgments or opinions that may, or may not, prove to be correct.  The use of different estimates, assumptions, judgments, or opinions would likely have resulted in significantly different estimates of the value of the shares and limited partnership units.  In addition, the Board’s estimate of share and limited partnership unit value is not based on the book values of our real estate, as determined by GAAP, as our book value for most real estate is based on the amortized cost of the property, subject to certain adjustments.

Cash on hand, together with cash from operations and access to the lines of credit is expected to provide sufficient capital to meet the Company’s needs for at least the next 12 months and as appropriate, we will use cash flows from operations, net proceeds from share offerings, debt proceeds, and proceeds from the disposition of real estate investments to meet long term liquidity demands.

Credit Quality of Tenants

We are exposed to credit risk within our tenant portfolio, which can reduce our results of operations and cash flow from operations if our tenants are unable to pay their rent. Tenants experiencing financial difficulties may become delinquent on their rent or default on their leases and, if they file for bankruptcy protection, may reject our lease in bankruptcy court, resulting in reduced cash flow. This may negatively impact net asset values and require us to incur impairment charges. Even if a default has not occurred and a tenant is continuing to make the required lease payments, we may restructure or renew leases on less favorable terms, or the tenant’s credit profile may deteriorate, which could affect the value of the leased asset and could in turn require us to incur impairment charges.

To mitigate credit risk on commercial properties, we have historically looked to invest in assets that we believe are critically important to our tenant’s operations and have attempted to diversify our portfolio by tenant, tenant industry and geography. We also monitor all of our properties’ performance through review of rent delinquencies as a precursor to a potential

40

Table of Contents

default, meetings with tenant management and review of tenants’ financial statements and compliance with financial covenants. When necessary, our asset management process includes restructuring transactions to meet the evolving needs of tenants, refinancing debt and selling properties, as well as protecting our rights when tenants default or enter into bankruptcy.

Lease Expirations and Occupancy

Our residential leases are for a term of one year or less. The Advisor, with the assistance of our property managers, actively manages our real estate portfolio and begins discussing options with tenants in advance of scheduled lease expirations. In certain cases, we may obtain lease renewals from our tenants; however, tenants may elect to move out at the end of their term. In the cases where tenants elect not to renew, we may seek replacement tenants or try to sell the property.

Cash Flow Analysis

Our objectives are to generate sufficient cash flow over time to provide shareholders with increasing dividends and to seek investments with potential for strong returns and capital appreciation throughout varying economic cycles. We have funded 100% of dividends paid with operating cash flows. In setting a dividend rate, we focus primarily on expected returns from investments we have already made to assess the sustainability of a particular dividend rate over time.

Year ended

December 31,


2023


2022

(in thousands)

Net cash flows provided by operating activities

$

43,158

$

40,770

Net cash flows provided by (used in) investing activities

$

16,745

$

(107,960)

Net cash flows (used in) provided by financing activities

$

(40,810)

$

19,114

Operating Activities

Our real estate properties generate cash flow in the form of rental revenues, which is reduced by interest payments, direct lease costs and property-level operating expenses. Property-level operating expenses consist primarily of property management fees including salaries and wages of property management personnel, utilities, cleaning, repairs, insurance, security and building maintenance cost, and real estate taxes. Additionally, we incur general and administrative expenses, advisory fees, acquisition and disposition expenses and financing fees.

Net cash provided by operating activities was $43,158 and $40,770 for the years ended December 31, 2023 and 2022, respectively, which consists primarily of net income from property operations, adjusted for non-cash depreciation and amortization.

Investing Activities

Our investing activities generally consist of real estate-related transactions (purchases and sales of properties) and payments of capitalized property-related costs such as intangible assets.  

Net cash provided by (used in) investing activities was $16,745 and ($107,960) for the years ended the year ended December 31, 2023 and 2022, respectively (this does not include the value of UPREIT units issued in connection with investing activities). For the years ended December 31, 2023 and 2022, cash flows used in investing activities related specifically to the acquisition of properties and capital expenditures was ($12,200) and $91,600, respectively. For the year ended December 31, 2023 and 2022, cash flows used in investing activities related to the purchase of securities was $- and $29,130, respectively. Proceeds received from the sale of real estate investments during the year ended December 31, 2023 and 2022, offset this amount by $5,068 and $25,463, respectively.

41

Table of Contents

Financing Activities

Our financing activities generally consist of funding property purchases by raising proceeds and securing mortgage notes payable as well as paying dividends, paying syndication costs, and making principal payments on mortgage notes payable.

Net cash (used in) provided by financing activities was ($40,810) and $19,114, respectively, for the years ended December 31, 2023 and 2022. During the year ended December 31, 2023, we paid $26,353 in dividends and distributions, redeemed $4,995 of shares and units, received $62,231 from new mortgage notes payable, and made mortgage principal payments of $56,062. For the year ended December 31, 2022, we paid $25,310 in dividends and distributions, redeemed $2,077 of shares and units, received $26,500 from a note payable, received $37,569 from new mortgage notes payable, and made mortgage principal payments of $22,231.

Dividends and Distributions

Common Stock

We declared cash dividends to our shareholders during the period from January 1, 2023, to December 31, 2023 totaling $12,763 or $1.1500 per share, of which $5,095 was cash dividends and $7,669 were reinvested through the dividend reinvestment plan. The cash dividends were paid from our $43,158 of cash flows from operations.

We declared cash dividends to our shareholders during the period from January 1, 2022, to December 31, 2022 totaling $12,222 or $1.1500 per share, of which $4,507 was cash dividends and $7,715 were reinvested through the dividend reinvestment plan. The cash dividends were paid from our $40,770 of cash flows from operations.

We continue to provide cash dividends to our shareholders from cash generated by our operations.  The following chart summarizes the sources of our cash used to pay dividends. Our primary source of cash is cash flow provided by operating activities from our investments as presented in our cash flow statement.  We also include distributions from unconsolidated affiliates to the extent that the underlying real estate operations in these entities generate these cash flows and the gain on sale of properties relates to net profits from the sale of certain properties. Our presentation is not intended to be an alternative to our consolidated statement of cash flows and does not present all sources and uses of our cash.

The following table presents certain information regarding our dividend coverage:

Year ended

December 31,


2023


2022

(in thousands)

Cash flows provided by operations (net income of $7,656 and $24,532, respectively)

$

43,158

$

40,770

Distributions in excess of earnings received from unconsolidated affiliates


2,483


504

Gain on sales of real estate and non-real estate investments


(6)


10,529

Dividends declared


(12,763)


(12,222)

Excess

$

32,872

$

39,581

Limited Partnership Units

The operating partnership agreement provides that our operating partnership will distribute to the partners (subject to certain limitations) cash from operations on a quarterly basis (or more frequently, if we so elect) in accordance with the percentage interests of the partners. We determine the amounts of such distributions in our sole discretion.

For the year ended December 31, 2023, we declared quarterly distributions totaling $21,407 to holders of limited partnership units in our operating partnership, which we paid on April 17, July 17, and October 16, 2023, and January 16, 2024. Distributions were paid at a rate of $0.2875 per unit per quarter, which is equal to the per share distribution rate paid to the common shareholders.

42

Table of Contents

For the year ended December 31, 2022, we declared quarterly distributions totaling $21,482 to holders of limited partnership units in our operating partnership, which we paid on April 15, July 15, October 17, 2022, and January 17, 2023. Distributions were paid at a rate of $0.2875 per unit per quarter, which is equal to the per share distribution rate paid to the common shareholders.

Sources of Dividends and Distributions

For the year ended December 31, 2023, we paid aggregate dividends of $12,635, which were paid with cash flows provided by operating activities. Our funds from operations, or FFO, was $38,711, therefore, our management believes our distribution policy is sustainable over time. For the year ended December 31, 2022, we paid aggregate dividends of $11,854 which were paid with cash flows provided by operating activities. Our FFO was $42,011 for the year ended December 31, 2022. For a further discussion of FFO, including a reconciliation of FFO to net income, see “Funds from Operations” above.

Recently Issued Accounting Pronouncements

For a discussion of recently issued accounting pronouncements, see Note 2, Principal Activity and Significant Accounting Policies— Recently Issued Accounting Pronouncements, to the consolidated financial statements that are a part of this Annual Report on Form 10-K.

Recent Developments

On January 16, 2024, we paid a dividend or distribution of $0.2875 per share on our common shares of beneficial interest or limited partnership units, to common shareholders and limited unit holders of record on December 31, 2023.

We have evaluated subsequent events through the date of this filing. We are not aware of any other subsequent events which would require recognition or disclosure in the consolidated financial statements.

ITEM 7A. QUANTITATIVE AND QUALITATIVE DISCLOSURES ABOUT MARKET RISK

The Trust is exposed to certain risk arising from both its business operations and economic conditions and principally manages its exposures to a wide variety of business and operational risks through management of its core business activities. The Trust manages economic risks, liquidity, and credit risk primarily by managing the amount, sources, and duration of its assets and liabilities. The principal material financial market risk to which we are exposed, is interest-rate risk, which the Trust manages through the use of derivative financial instruments.  Specifically, the Trust enters into derivative financial instruments to manage exposures that arise from business activities that result in the receipt or payment of future known and uncertain cash amounts, the value of which are determined by interest rates. During the year ended December 31, 2023,  the Trust used 12 interest rate swaps to hedge the variable cash flows associated with market interest rate risk. These swaps have an aggregated notional amount of $103,246 for the year ended December 31, 2023. We do not enter into derivative instruments for trading or speculative purposes. The interest rate swaps expose us to credit risk in the event of non-performance by the counterparty under the terms of the agreement.

As of December 31, 2023, The Trust had $103,246 of variable-rate borrowings, with the total outstanding balance fixed through interest rate swaps. Even though our goal is to maintain a fairly low exposure to interest rate risk, we may become vulnerable to significant fluctuations in interest rates on any future repricing or refinancing of our fixed or variable rate debt or future debt.

ITEM 8. FINANCIAL STATEMENTS AND SUPPLEMENTARY DATA

Our consolidated financial statements included in this Annual Report are listed in Item 15 and begin immediately after the signature pages.

43

Table of Contents

ITEM 9. CHANGES IN AND DISAGREEMENTS WITH ACCOUNTANTS ON ACCOUNTING AND FINANCIAL DISCLOSURE

None.

ITEM 9A. CONTROLS AND PROCEDURES

Disclosure Controls and Procedures

Sterling Real Estate Trust’s Chief Executive Officer and Chief Financial Officer have evaluated the effectiveness of Sterling Real Estate Trust’s disclosure controls and procedures (as defined in Rule 13a-15(e) under the Securities Exchange Act of 1934) as of the end of the period covered by this Report. Based on the evaluation, Sterling Real Estate Trust’s Chief Executive Officer and Chief Financial Officer have concluded that Sterling Real Estate Trust’s disclosure controls and procedures were effective to ensure that information required to be disclosed in our reports that we file or submit under the Exchange Act is recorded, processed, summarized and reported within the time periods specified in the Commission’s rules and forms, and is accumulated and communicated to management, including our principal executive and principal financial officers, as appropriate to allow timely decisions regarding required disclosure.

Report of Management on Internal Control Over Financial Reporting

Our management is responsible for establishing and maintaining a comprehensive system of internal control over financial reporting to provide reasonable assurance of the proper authorization of transactions, the safeguarding of assets and the reliability of the financial records. Our internal control system was designed to provide reasonable assurance to our management and Board of Trustees regarding the preparation and fair presentation of published financial statements.  The system of internal control over financial reporting provides for appropriate division of responsibility and is documented by written policies and procedures that are communicated to employees.  The framework upon which management relied in evaluating the effectiveness of our internal control over financial reporting was set forth in Internal Controls – Integrated Framework (2013) published by the Committee of Sponsoring Organization of the Treadway Commission.

Our internal control system was designed to provide reasonable assurance regarding the reliability of financial reporting and the preparation of financial statements for external purposes in accordance with generally accepted accounting principles in the U.S. Our internal control over financial reporting includes those policies and procedures that:

i.pertain to the maintenance of records that, in reasonable detail, accurately and fairly reflect the transactions and disposition of our assets,
ii.provide reasonable assurance that transactions are recorded as necessary to permit preparation of financial statements in accordance with accounting principles generally accepted in the U.S., and that our receipts and expenditures are being made only in accordance with authorization of our management and trustees; and
iii.provide reasonable assurance regarding prevention or timely detection of unauthorized acquisition, use or disposition of our assets that could have a material effect on the consolidated financial statements.

As disclosed in Item 4, Controls and Procedures on Form 10-Q/A for the period ended June 30, 2023, during the third quarter of 2023 we identified a material weakness in internal control related to our review control to evaluate the accounting and disclosure of the attributable portion of net income relating to the noncontrolling interest of the operating partnership did not operate effectively, resulting in a material error. This did not have an impact on the total net income or the total funds from operations represented on the June 30, 2023 quarterly filing.

During 2023, management implemented our previously disclosed remediation plan that included: enhancing the design of the control activity over the review of the accounting and disclosure of the attributable portion of net income relating to the noncontrolling interest of the operating partnership.

44

Table of Contents

During the fourth quarter of 2023, we completed our testing of the operating effectiveness of the implemented controls and found them to be effective. As a result, we have concluded the material weakness has been remediated as of December 31, 2023.

Based on the results of our evaluation, our management concluded that our internal control over financial reporting was effective as of December 31, 2023. However, projections of any evaluation of effectiveness to future periods are subject to the risk that controls may become inadequate because of changes in our business or other conditions, or that the degree of compliance with our policies or procedures may deteriorate.

Inherent Limitations of Disclosure Controls and Procedures and Internal Control over Financial Reporting

There are inherent limitations to the effectiveness of any control system. A control system, no matter how well conceived and operated, can provide only reasonable assurance that its objectives are met. No evaluation of controls can provide absolute assurance that all control issues and instances of fraud, if any, within us have been detected. Also, projections of any evaluation of effectiveness to future periods are subject to the risk that controls may become inadequate because of changes in conditions or because the degree of compliance with the policies and procedures may deteriorate.  

Changes in Internal Control Over Financial Reporting

There have been no changes in our internal control over financial reporting (as defined in Rule 13a-15(f) and Rule 15d-15(f) under the Exchange Act) during the fourth quarter ended December 31, 2023 that have materially affected, or are reasonably likely to materially affect, our internal control over financial reporting.

ITEM 9B. OTHER INFORMATION

None.

PART III

The information required in Item 10 (Directors, Executive Officers and Corporate Governance), Item 11 (Executive Compensation), Item 12 (Security Ownership of Certain Beneficial Owners and Management and Related Stockholder Matters), Item 13 (Certain Relationships and Related Transactions, and Director Independence), and Item 14 (Principal Accountant Fees and Services) is incorporated by reference to our definitive proxy statement for the 2023 Annual Meeting of Shareholders to be filed with the SEC or filed by amendment to this Annual Report on or before May 1, 2024.

45

Table of Contents

PART IV

ITEM 15. EXHIBITS AND FINANCIAL STATEMENT SCHEDULES

(a)(1) The financial statements listed below are included in this report

Reports of Independent Registered Public Accounting Firms (PCAOB ID Number 49 and PCAOB ID Number 23)

Consolidated Financial Statements

Consolidated Balance Sheets at December 31, 2023 and 2022

Consolidated Statements of Operations and Other Comprehensive Income for the years ended December 31, 2023, 2022 and 2021

Consolidated Statements of Stockholders’ Equity for the years ended December 31, 2023, 2022 and 2021

Consolidated Statements of Cash Flows for the years ended December 31, 2023, 2022 and 2021

Notes to Consolidated Financial Statements

Real Estate and Accumulated Depreciation (Schedule III)

(a)(3) Exhibits

See the Exhibit Index filed as part of this Annual Report on Form 10-K.

ITEM 16. FORM 10-K SUMMARY

Not applicable.

46

Table of Contents

Graphic

STERLING REAL ESTATE TRUST AND SUBSIDIARIES

CONSOLIDATED BALANCE SHEETS AS OF DECEMBER 31, 2023 AND 2022,

AND THE RELATED CONSOLIDATED STATEMENTS OF OPERATIONS AND

OTHER COMPREHENSIVE INCOME, SHAREHOLDERS’ EQUITY AND CASH FLOWS

FOR THE YEARS ENDED

DECEMBER 31, 2023, 2022 AND 2021,

INCLUDING NOTES

and

REPORTS OF INDEPENDENT REGISTERED

PUBLIC ACCOUNTING FIRM

47

Table of Contents

STERLING REAL ESTATE TRUST AND SUBSIDIARIES


PAGE

REPORTS OF INDEPENDENT REGISTERED PUBLIC ACCOUNTING FIRMS

49

CONSOLIDATED FINANCIAL STATEMENTS

Consolidated Balance Sheets

52

Consolidated Statements of Operations and Other Comprehensive Income

53

Consolidated Statements of Shareholders’ Equity

54

Consolidated Statements of Cash Flows

55

Notes to Consolidated Financial Statements

57

Real Estate and Accumulated Depreciation (Schedule III)

84

48

Table of Contents

Report of Independent Registered Public Accounting Firm

To the Shareholders and the Board of Directors of Sterling Real Estate Trust

Opinion on the Financial Statements

We have audited the accompanying consolidated balance sheets of Sterling Real Estate Trust and its subsidiaries (the Trust) as of December 31, 2023 and 2022, the related consolidated statements of operations and other comprehensive income, changes in shareholders' equity and cash flows for each of the three years in the period ended December 31, 2023, and the related notes to the consolidated financial statements (collectively, the financial statements). In our opinion, the financial statements present fairly, in all material respects, the financial position of the Trust as of December 31, 2023 and 2022, and the results of its operations and its cash flows for each of the three years in the period ended December 31, 2023, in conformity with accounting principles generally accepted in the United States of America.

Basis for Opinion

These financial statements are the responsibility of the Trust's management. Our responsibility is to express an opinion on the Trust's financial statements based on our audits. We are a public accounting firm registered with the Public Company Accounting Oversight Board (United States) (PCAOB) and are required to be independent with respect to the Trust in accordance with U.S. federal securities laws and the applicable rules and regulations of the Securities and Exchange Commission and the PCAOB.

We conducted our audits in accordance with the standards of the PCAOB. Those standards require that we plan and perform the audit to obtain reasonable assurance about whether the financial statements are free of material misstatement, whether due to error or fraud. The Trust is not required to have, nor were we engaged to perform, an audit of its internal control over financial reporting. As part of our audits we are required to obtain an understanding of internal control over financial reporting but not for the purpose of expressing an opinion on the effectiveness of the Trust's internal control over financial reporting. Accordingly, we express no such opinion.

Our audits included performing procedures to assess the risks of material misstatement of the financial statements, whether due to error or fraud, and performing procedures that respond to those risks. Such procedures included examining, on a test basis, evidence regarding the amounts and disclosures in the financial statements. Our audits also included evaluating the accounting principles used and significant estimates made by management, as well as evaluating the overall presentation of the financial statements. We believe that our audits provide a reasonable basis for our opinion.

Critical Audit Matter

The critical audit matter communicated below is a matter arising from the current period audit of the financial statements that was communicated or required to be communicated to the audit and disclosure committee and that: (1) relates to accounts or disclosures that are material to the financial statements and (2) involved our especially challenging, subjective or complex judgments. The communication of a critical audit matter does not alter in any way our opinion on the financial statements, taken as a whole, and we are not, by communicating the critical audit matter below, providing a separate opinion on the critical audit matter or on the accounts or disclosures to which it relates.

49

Table of Contents

Evaluation of real estate investments for impairment

The Trust’s real estate investments and related intangible assets were $757.8 million and $3.0 million, respectively, as of December 31, 2023. As described in Note 2, the Trust performs impairment testing on a quarterly basis or whenever events or changes in circumstances indicate the carrying amount of its real estate investments may not be recoverable. As part of the Trust’s impairment indicator analysis, management considers numerous potential indicators of impairment of operating properties. These indicators could include a substantial decline in or continued low occupancy rate, continued difficulty in leasing space, significant financially troubled tenants, a change in plan to sell a property prior to the end of its useful life or holding period, a significant decrease in market price not in line with general market trends, and any other quantitative or qualitative events or factors deemed significant by the Trust’s management or board of trustees. The Trust identified indicators of impairment for certain real estate investments and, in such cases, further assessed the assets for recoverability by comparing the net carrying value to estimated future cash flows on an undiscounted basis. For real estate investments where the estimated future undiscounted cash flows were determined to be less than carrying value, the Trust estimated the fair value of the real estate using various analyses such as discounted cash flows (an income approach) and comparable selling prices (a market approach). An impairment charge is recognized in the amount of the excess of the carrying value over the fair value of the investment. During the years ended December 31, 2023 and 2022, impairment losses of $2.6 million and $0.6 million, respectively, were recognized.

We identified the determination of the existence of impairment indicators and when applicable, the analysis of undiscounted cash flows and fair value determinations for the Trust’s real estate investments and related intangible assets as a critical audit matter because of the significant judgements made by management, including the evaluation of the impact of the factors described above. Auditing management’s judgments used in the determination of impairment indicators involved a high degree of auditor judgment and increased audit effort. Further, auditing the Trust’s undiscounted cash flow and fair value estimates required a high degree of auditor judgment and increased audit effort as estimates underlying the calculation, including market comparable sales, discount rates, terminal capitalization rates, market growth rates and market rent rates, were based on assumptions affected by expected current and future market and economic conditions.

Our audit procedures related the Trust’s evaluation of real estate investments for impairment included the following, among others;

We tested the underlying data used in management’s analysis for completeness and accuracy, agreed such data to source documents and the underlying accounting records and evaluated management’s conclusions around potential indicators of impairment.

We evaluated the accuracy of management’s conclusions around potential indicators of impairment by reviewing management’s evaluation of potential impairment indicators on a property by property basis, considering information such as historical trends, current year property level operating performance, and changes in expected hold periods, among others, and compared our expectation to management’s analysis.

50

Table of Contents

For real estate investments with indicators of potential impairment and real estate investments adjusted to their estimated fair value, we assessed the reasonableness of the estimated hold period as well as the reasonableness of management’s significant assumptions over market comparable sales, discount rates, terminal capitalization rates and market growth rates, with the assistance of our valuation specialist by comparing to historical performance, recent agreements and industry data.

/s/ RSM US LLP

We have served as the Trust's auditor since 2021.

Minneapolis, Minnesota

March 13, 2024

PCAOB ID: 49

51

Table of Contents

PART I – FINANCIAL INFORMATION

Item 1. Financial Statements

STERLING REAL ESTATE TRUST AND SUBSIDIARIES

CONSOLIDATED BALANCE SHEETS

as of December 31, 2023 and 2022

December 31,

December 31,


2023


2022

(in thousands)

ASSETS

Real estate investments

Land and land improvements

$

127,204

$

129,682

Building and improvements

835,551

834,356

Construction in progress

8,049

7,110

Real estate investments

970,804

971,148

Less accumulated depreciation

(214,584)

(194,849)

Real estate investments, net

756,220

776,299

Cash and cash equivalents

26,919

3,257

Restricted deposits

10,142

9,323

Investments

29,371

Investment in unconsolidated affiliates

26,601

29,423

Notes receivable

8,885

8,448

Assets held for sale

1,568

Lease intangible assets, less accumulated amortization

2,983

5,290

Other assets, net

21,515

27,312

Total Assets

$

854,833

$

888,723

LIABILITIES

Mortgage notes payable, net

$

518,119

$

506,167

Notes payable

26,500

Lines of credit

1,008

Dividends payable

8,579

8,493

Tenant security deposits payable

7,104

6,368

Lease intangible liabilities, less accumulated amortization

470

646

Liabilities related to assets held for sale

2

Accrued expenses and other liabilities

19,239

16,075

Total Liabilities

553,513

565,257

COMMITMENTS and CONTINGENCIES - Note 17

SHAREHOLDERS' EQUITY

Beneficial interest

124,095

123,996

Noncontrolling interest

Operating partnership

163,308

183,048

Partially owned properties

2,555

2,640

Accumulated other comprehensive income

11,362

13,782

Total Shareholders' Equity

301,320

323,466

$

854,833

$

888,723

See Notes to Consolidated Financial Statements

52

Table of Contents

STERLING REAL ESTATE TRUST AND SUBSIDIARIES

CONSOLIDATED STATEMENTS OF OPERATIONS AND OTHER COMPREHENSIVE INCOME

FOR THE YEARS ENDED DECEMBER 31, 2023, 2022 and 2021

Year Ended

December 31,

2023


2022


2021

(in thousands, except per share data)

Income from rental operations

Real estate rental income

$

143,631

$

135,060

$

129,324

Expenses

Expenses from rental operations

Operating expenses

67,846

56,893

51,063

Real estate taxes

16,203

14,245

13,706

Depreciation and amortization

25,004

24,679

22,203

Interest

21,435

19,994

18,142

130,488

115,811

105,114

Loss on impairment of property

2,603

561

Administration of REIT

5,430

5,247

4,381

Total expenses

138,521

121,619

109,495

Income from operations

5,110

13,441

19,829

Other (loss) income

Equity in (losses) of unconsolidated affiliates

(2,959)

(2,339)

(261)

Other income

2,214

1,293

1,935

Gain on sale or conversion of real estate investments

2,597

11,090

1,710

Gain on involuntary conversion

694

1,047

1,225

Total other income

2,546

11,091

4,609

Income from continuing operations

7,656

24,532

24,438

Discontinued operations

Net income

$

7,656

$

24,532

$

24,438

Net income (loss) attributable to noncontrolling interest:

Operating partnership

4,848

15,628

15,783

Partially owned properties

(85)

(17)

(139)

Net income attributable to Sterling Real Estate Trust

$

2,893

$

8,921

$

8,794

Net income attributable to Sterling Real Estate Trust per common share, basic and diluted

$

0.26

$

0.84

$

0.87

Comprehensive income:

Net income

$

7,656

$

24,532

$

24,438

Other comprehensive gain - change in fair value of interest rate swaps

(2,420)

14,732

855

Comprehensive income:

5,236

39,264

25,293

Comprehensive income attributable to noncontrolling interest

3,247

24,989

16,193

Comprehensive income attributable to Sterling Real Estate Trust

$

1,989

$

14,275

$

9,100

Weighted average common shares outstanding, basic and diluted

11,104

10,632

10,160

See Notes to Consolidated Financial Statements

53

Table of Contents

STERLING REAL ESTATE TRUST AND SUBSIDIARIES

CONSOLIDATED STATEMENTS OF SHAREHOLDERS’ EQUITY

FOR THE YEARS ENDED DECEMBER 31, 2023, 2022 AND 2021

Accumulated

Noncontrolling

Distributions

Total

Interest

Accumulated

Common

Paid-in

in Excess of

Beneficial

Operating

Partially Owned

Comprehensive


Shares


Capital


Earnings


Interest


Partnership


Properties


Income (Loss)


Total

(in thousands)

BALANCE AT DECEMBER 31, 2020

9,855

$

139,105

$

(29,739)

$

109,366

$

181,621

$

2,346

$

(1,805)

$

291,528

Shares issued under trustee compensation plan

3

57

57

57

Contribution of assets in exchange for the issuance of noncontrolling interest shares

2,883

2,883

Shares/units redeemed

(82)

(1,552)

(1,552)

(4,014)

(5,566)

Dividends and distributions declared

(10,761)

(10,761)

(19,319)

(30,080)

Dividends reinvested - stock dividend

363

6,888

6,888

6,888

Issuance of shares under optional purchase plan

203

4,064

4,064

4,064

Change in fair value of interest rate swaps

855

855

Contributions from consolidated real estate entity noncontrolling interests

450

450

Net income (loss)

8,794

8,794

15,783

(139)

24,438

BALANCE AT DECEMBER 31, 2021

10,342

$

148,562

$

(31,706)

$

116,856

$

176,954

$

2,657

$

(950)

$

295,517

Shares issued pursuant to trustee compensation plan

3

65

65

65

Contribution of assets in exchange for the issuance of noncontrolling interest shares

12,870

12,870

Shares/units redeemed

(53)

(1,155)

(1,155)

(922)

(2,077)

Dividends and distributions declared

(12,222)

(12,222)

(21,482)

(33,704)

Dividends reinvested - stock dividend

341

7,468

7,468

7,468

Issuance of shares under optional purchase plan

177

4,063

4,063

4,063

Change in fair value of interest rate swaps

14,732

14,732

Contributions from consolidated real estate entity noncontrolling interests

Net income (loss)

8,921

8,921

15,628

(17)

24,532

BALANCE AT DECEMBER 31, 2022

10,810

$

159,003

$

(35,007)

$

123,996

$

183,048

$

2,640

$

13,782

$

323,466

Shares issued pursuant to trustee compensation plan

3

72

72

72

Shares/units redeemed

(83)

(1,813)

(1,813)

(3,181)

(4,994)

Dividends and distributions declared

(12,763)

(12,763)

(21,412)

(34,175)

Dividends reinvested - stock dividend

354

7,732

7,732

7,732

Issuance of shares under optional purchase plan

173

3,983

3,983

3,983

Change in fair value of interest rate swaps

(2,420)

(2,420)

Net income (loss)

2,893

2,893

4,848

(85)

7,656

BALANCE AT DECEMBER 31, 2023

11,257

$

168,977

$

(44,877)

$

124,100

$

163,303

$

2,555

$

11,362

$

301,320

See Notes to Consolidated Financial Statements

54

Table of Contents

STERLING REAL ESTATE TRUST AND SUBSIDIARIES

CONSOLIDATED STATEMENTS OF CASH FLOWS

FOR THE YEARS ENDED DECEMBER 31, 2023, 2022 and 2021

Year Ended

December 31,


2023


2022


2021

(in thousands)

OPERATING ACTIVITIES

Net income

$

7,656

$

24,532

$

24,438

Adjustments to reconcile net income to net cash provided by operating activities

Gain on sale of real estate investments

(2,597)

(11,090)

(1,710)

Loss on impairment of property

2,603

561

Gain on involuntary conversion

(694)

(1,047)

(1,225)

Change in fair value of securities

5,002

(322)

Equity in loss of unconsolidated affiliates

2,959

2,339

261

Distributions of earnings of unconsolidated affiliates

261

233

Allowance for uncollectible accounts receivable

(203)

(281)

(667)

Depreciation

23,257

22,161

20,918

Amortization

1,747

2,518

1,285

Amortization of debt issuance costs

627

675

608

Effects on operating cash flows due to changes in

Other assets

5,126

(209)

807

Tenant security deposits payable

736

1,143

349

Accrued expenses and other liabilities

2,327

(471)

(242)

NET CASH PROVIDED BY OPERATING ACTIVITIES

48,546

40,770

45,055

INVESTING ACTIVITIES

Gross purchase of securities

(29,130)

-

Proceeds from maturity of securities

24,369

81

-

Purchase of real estate investment properties

(81,974)

(35,915)

Capital expenditures and tenant improvements

(12,180)

(9,623)

(18,007)

Proceeds from sale of real estate investments and non-real estate investments

5,068

25,463

5,610

Proceeds from involuntary conversion

63

1,579

4,095

Investment in unconsolidated affiliates

(2,621)

(13,869)

(9,493)

Distributions in excess of earnings received from unconsolidated affiliates

2,483

504

Notes receivable issued net of payments received

(437)

(991)

(5,431)

NET CASH PROVIDED BY (USED IN) INVESTING ACTIVITIES

16,745

(107,960)

(59,141)

FINANCING ACTIVITIES

Payments for financing, debt issuance

(525)

(408)

(1,283)

Reinvested proceeds from investment certificates

(25)

Principal payments on special assessments payable

(74)

Proceeds from issuance of mortgage notes payable

67,911

37,569

116,180

Principal payments on mortgage notes payable

(53,246)

(22,231)

(43,641)

Advances on lines of credit

1,008

818,689

Payments on lines of credit

(1,008)

(818,689)

Payment on notes payable

(26,500)

Proceeds from notes payable

26,500

Proceeds from issuance of shares under optional purchase plan

3,983

4,063

4,064

Shares/units redeemed

(4,995)

(2,077)

(5,566)

Dividends/distributions paid

(26,356)

(25,310)

(22,622)

NET CASH (USED IN) PROVIDED BY FINANCING ACTIVITIES

(40,810)

19,114

47,107

NET CHANGE IN CASH AND CASH EQUIVALENTS AND RESTRICTED DEPOSITS

24,481

(48,076)

33,021

CASH AND CASH EQUIVALENTS AND RESTRICTED DEPOSITS AT BEGINNING OF PERIOD

12,580

60,656

27,635

CASH AND CASH EQUIVALENTS AND RESTRICTED DEPOSITS AT END OF PERIOD

$

37,061

$

12,580

$

60,656

CASH AND CASH EQUIVALENTS AND RESTRICTED DEPOSITS AT END OF PERIOD

Cash and cash equivalents

$

26,919

$

3,257

$

51,507

Restricted deposits

10,142

9,323

9,149

TOTAL CASH AND CASH EQUIVALENTS AND RESTRICTED DEPOSITS, END OF PERIOD

$

37,061

$

12,580

$

60,656

See Notes to Consolidated Financial Statements

55

Table of Contents

STERLING REAL ESTATE TRUST AND SUBSIDIARIES

CONSOLIDATED STATEMENTS OF CASH FLOWS

FOR THE YEARS ENDED DECEMBER 31, 2023, 2022 and 2021 (Continued)

Year Ended

December 31,


2023


2022


2021

(in thousands)

SCHEDULE OF CASH FLOW INFORMATION

Cash paid during the period for interest, net of capitalized interest

$

20,593

$

19,305

$

17,332

SUPPLEMENTARY SCHEDULE OF NONCASH INVESTING AND FINANCING ACTIVITIES

Dividends reinvested

$

7,732

$

7,468

$

6,888

Dividends declared and not paid

3,237

3,108

2,740

UPREIT distributions declared and not paid

5,342

5,385

4,827

Shares issued pursuant to trustee compensation plan

72

65

57

Acquisition of assets in exchange for the issuance of noncontrolling interest units in UPREIT

12,870

2,883

Increase in land improvements due to increase in special assessments payable

320

219

235

Unrealized (loss) gain on interest rate swaps

(2,420)

14,732

855

Acquisition of assets through assumption of debt and liabilities

406

569

Capitalized interest and real estate taxes related to construction in progress

106

91

250

See Notes to Consolidated Financial Statements

56

Table of Contents

STERLING REAL ESTATE TRUST AND SUBSIDIARIES

NOTES TO CONSOLIDATED FINANCIAL STATEMENTS

DECEMBER 31, 2023, 2022 AND 2021

(Dollar amounts in thousands, except share and per share data)

Note 1 – Organization

Sterling Real Estate Trust, d/b/a Sterling Multifamily Trust (“Sterling”, “the Trust” or “the Company”) is a registered, but unincorporated business trust organized in North Dakota in December 2002.  Sterling has elected to be taxed as a Real Estate Investment Trust (“REIT”) under Sections 856-860 of the Internal Revenue Code.

Sterling previously established an operating partnership (“Sterling Properties, LLLP”) and transferred all of its assets and liabilities to the operating partnership in exchange for general partnership units. As the general partner, Sterling has management responsibility for all activities of the operating partnership. As of December 31, 2023 and 2022, Sterling owned approximately 37.72% and 36.60%, respectively, of the operating partnership.

NOTE 2 – PRINCIPAL ACTIVITY AND SIGNIFICANT ACCOUNTING POLICIES

Basis of Presentation

The accompanying consolidated financial statements include the accounts of Sterling and all subsidiaries for which we maintain a controlling interest.

The accompanying consolidated financial statements have been prepared in accordance with United States Generally Accepted Accounting Principles (“U.S. GAAP”).

Principles of Consolidation

The consolidated financial statements include the accounts of Sterling, Sterling Properties, LLLP, and wholly owned limited liability companies and partially-owned limited liability companies. All significant intercompany transactions and balances have been eliminated in consolidation.

As of December 31, 2023, the Trust owned approximately 37.72% of the partnership interests (“OP Units”) of the Operating Partnership. The remaining OP Units, consisting exclusively of limited partner interests, are held by persons who contributed their interests in properties to the Operating Partnership in exchange for OP Units. Under the LLLP Agreement and the redemptions plans, these persons have the right to request the Operating Partnership redeem their OP Units following a specified restricted period. All redemptions are at the sole discretion of the Trust, acting for itself or in its capacity as General Partner of the Operating Partnership, and further subject to the conditions and limitations of the LLLP Agreement and redemption plans, as the same may be amended or modified from time to time. If the Trust accepts a redemption request, the redemption of OP Units shall be made in cash in an amount equal to the fair value of an equivalent number of common shares of the Trust. In lieu of delivering cash, however, the Trust, as the Operating Partnership’s general partner, may, at its option and in its sole and absolute discretion, choose to acquire any OP Units so tendered by issuing common shares in exchange for the tendered OP Units. If the Trust so chooses, its common shares will be exchanged for OP Units on a one-for-one basis. This one-for-one exchange ratio is subject to adjustment to prevent dilution. With each such exchange or redemption, the Trust’s percentage ownership in the Operating Partnership will increase. In addition, whenever the Trust issues common or other classes of its shares, it contributes the net proceeds it receives from the issuance to the Operating Partnership and the Operating Partnership issues to the Trust an equal number of OP Units or other partnership interests having preferences and rights that mirror the preferences and rights of the shares issued. This structure is commonly referred to as an umbrella partnership REIT or “UPREIT.”

Additionally, we evaluate the need to consolidate affiliates based on standards set forth in the Financial Accounting Standards Board (“FASB”) Accounting Standards Codification (“ASC”) 810, Consolidation (“ASC 810”).  In determining whether we have a requirement to consolidate the accounts of an entity, management considers factors such as our ownership interest, our authority to make decisions and contractual and substantive participating rights of the limited partners and shareholders, as well as whether the entity is a variable interest entity (“VIE”) for which we have both: a) the power to direct the activities of the VIE that most significantly impact the entity’s economic performance, and b) the obligation to absorb losses or the right to receive benefits from the VIE that could be potentially significant to the VIE.

57

Table of Contents

STERLING REAL ESTATE TRUST AND SUBSIDIARIES

NOTES TO CONSOLIDATED FINANCIAL STATEMENTS

DECEMBER 31, 2023, 2022 AND 2021

(Dollar amounts in thousands, except share and per share data)

In instances where the Trust determines that it is not the primary beneficiary of a VIE or the Trust does not control the joint venture but can exercise influence over the entity with respect to its operations and major decisions, the Trust will use the equity method of accounting. Under the equity method, the operations of a joint venture will not be consolidated with the Trust’s operations but instead its share of operations will be reflected as equity in earnings (loss) of unconsolidated entity on its consolidated statements of operations and comprehensive loss. Additionally, the Trust’s net investment in the joint venture will be reflected as investment in unconsolidated entity on the consolidated balance sheets. See Note 5 for additional details regarding variable interest entities where the Trust uses the equity method of investing.

The operating partnership meets the criteria as a variable interest entity (“VIE”). The Trust’s sole significant asset is its investment in the operating partnership. The Trust is the primary beneficiary of the Operating Partnership and accordingly consolidated the Operating Partnership. As a result, substantially all of the Trust’s assets and liabilities represent those assets and liabilities of the Operating Partnership. All of the Trust’s debt is an obligation of the Operating Partnership, and the Trust guarantees the unsecured debt obligations of the Operating Partnership. The Trust may acquire property using a reverse like-kind exchange structure (a “Reverse 1031 Like-Kind Exchange”) under the Code to defer taxable gains on the subsequent sale of real estate property. As such, the acquired property (the “Parked Property”) remains in the possession of a VIE whose legal equity interests are owned by a qualified intermediary engaged to execute the Reverse 1031 Like-Kind Exchange until the subsequent sale transaction and the Reverse 1031 Like-Kind Exchange are completed. Although the VIE is legally owned by the qualified intermediary, the Trust retains essentially all of the legal and economic benefits and obligations related to the VIE (which holds the legal title to the Parked Property prior to the completion of the Reverse 1031 Like-Kind Exchange) and, as its designated manager, has the key decision-making power over the Parked Property. The VIE (including the Parked Property) is included in the Trust’s consolidated financial statements as a consolidated VIE until legal title is transferred to the Trust upon completion of the Reverse 1031 Like-Kind Exchange.

Concentration of Credit Risk

Our cash balances are maintained in various bank deposit accounts. The bank deposit amounts in these accounts may exceed federally insured limits at various times throughout the year.

Use of Estimates

The preparation of consolidated financial statements in conformity with US GAAP requires management to make estimates and assumptions that affect the reported amounts of assets and liabilities and disclosure of contingent assets and liabilities at the date of the financial statements and the reported amounts of revenues and expenses during the reporting period. Actual results could differ from those estimates.

Real Estate Investments

Real estate investments are recorded at cost less accumulated depreciation.  Ordinary repairs and maintenance are expensed as incurred.

The Trust allocates the purchase price of each acquired investment property accounted for as an asset acquisition based upon the relative acquisition date fair value of the individual assets acquired and liabilities assumed, which generally include (i) land, (ii) building and other improvements, (iii) in-place lease value intangibles, (iv) acquired above and below market lease intangibles, and (v) assumed financing that is determined to be above or below market, if any. Transaction costs related to acquisitions accounted for as asset acquisitions are capitalized as incurred and included as a cost of the building in the accompanying balance sheet.

Furniture and fixtures are stated at cost less accumulated depreciation. Expenditures for renewals and improvements that significantly add to the productive capacity or extend the useful life of an asset are capitalized. Expenditures for routine maintenance and repairs, which do not add to the value or extend useful lives, are charged to expense as incurred.

58

Table of Contents

STERLING REAL ESTATE TRUST AND SUBSIDIARIES

NOTES TO CONSOLIDATED FINANCIAL STATEMENTS

DECEMBER 31, 2023, 2022 AND 2021

(Dollar amounts in thousands, except share and per share data)

Depreciation is provided for over the estimated useful lives of the individual assets using the straight-line method over the following estimated useful lives:

Buildings and improvements


40 years

Furniture, fixtures and equipment


5-9 years

During the third quarter, the Company completed a reassessment of the capitalization policy and determined that the Company would remove a stipulation for certain tangible assets to pass an additional percentage test of an amount of an entire property as well as add a new category related to Renovations and Improvement Projects that improve or extend the life of real estate assets.  This reassessment was accounted for as a change in accounting estimate and was made on a prospective basis effective July 1, 2023.  The change on policy did not have a significant impact on depreciation expense.

The Trust’s investment properties are reviewed for potential impairment at the end of each reporting period or whenever events or changes in circumstances indicate that the carrying value may not be recoverable. At the end of each reporting period, the Trust separately determines whether impairment indicators exist for each property.

Examples of situations considered to be impairment indicators include, but are not limited to:

oa substantial decline or negative cash flows;
ocontinued low occupancy rates;
ocontinued difficulty in leasing space;
osignificant financially troubled tenants;
oa change in plan to sell a property prior to the end of its useful life or holding period;
oa significant decrease in market price not in line with general market trends; and
oany other quantitative or qualitative events or factors deemed significant by the Trust’s management or Board of Trustees.

If the presence of one or more impairment indicators as described above is identified with respect to an investment property, the asset is tested for recoverability by comparing its carrying value to the estimated future undiscounted cash flows. An investment property is considered to be impaired when the estimated future undiscounted cash flows are less than its current carrying value.  When performing a test for recoverability or estimating the fair value of an impaired investment property, the Trust makes complex or subjective assumptions which include, but are not limited to:

oprojected operating cash flows considering factors such as vacancy rates, rental rates, lease terms, tenant financial strength, demographics, holding period and property location;
oprojected capital expenditures;
oprojected cash flows from the eventual disposition of an operating property using a property specific capitalization rate;
ocomparable selling prices; and
oproperty specific discount rates for fair value estimates as necessary.

To the extent impairment has occurred, the Trust will record an impairment charge calculated as the excess of the carrying value of the asset over its fair value for impairment of real estate investments.

Based on evaluation, there was one impairment loss of $2,603 during the year ended December 31, 2023, and there was one impairment loss of $561 during the year ended December 31, 2022. There were no impairment losses during the year ended December 31, 2021.

59

Table of Contents

STERLING REAL ESTATE TRUST AND SUBSIDIARIES

NOTES TO CONSOLIDATED FINANCIAL STATEMENTS

DECEMBER 31, 2023, 2022 AND 2021

(Dollar amounts in thousands, except share and per share data)

Properties Held for Sale

We account for our properties held for sale in accordance with ASC 360, Property, Plant and Equipment (“ASC 360”), which addresses financial accounting and reporting in a perdio in which a component or group of components of an entity either has been disposed or or is classified as held for sale.

In accordance with ASC 360, at such time as a property is held for sale, such property is carried at the lower of (1) its carrying amount or (2) fair value less costs to sell.  In addition, a property being held for sale ceases to be depreciated.  We classify operating properties as properties held for sale in the period in which all of the following criteria are met:

management, having the authority to approve the action, commits to a plan to sell the asset;
the asset is available for immediate sale in its present condition subject only to terms that are usual and customary for sales of such assets;
an active program to locate a buyer and other actions required to complete the plan to sell the asset has been initiated;
the sale of the asset is probable and the transfer of the asset is expected to qualify for recognition as a completed sale within one year;
the asset is being actively marketed for sale at a price that is reasonable in relation to its current fair value; and
given the actions required to complete the plan to sell the asset, it is unlikely that significant changes to the plan would be made or that the plan would be withdrawn.

The results of operations of a component of an entity that either has been disposed of or is classified as held-for-sale under the requirements of ASC 360 is reported in discontinued operations in accordance with ASC 205, Presentation of Financial Statements (“ASC 205”) if such disposal or classification represents a strategic shift that has (or will have) a major effect on our operations and financial results.

The Trust had one property held for sale as of December 31, 2023. There were no properties held for sale as of December 31, 2022.  See Note 18.

Cash and Cash Equivalents and Restricted Deposits

We classify highly liquid investments with a maturity of three months or less when purchased as cash equivalents. Restricted deposits include funds escrowed for tenant security deposits, real estate tax, insurance and mortgage escrows and escrow deposits required by lenders on certain properties to be used for future building renovations or tenant improvements.

Investments

Treasury Bills are short-term debt obligations with maturities of one year or less issued by the U.S. Treasury Department and backed by the U.S. Government. Treasury Bills yield no interest, but are issued at a discount to the redemption price. We classify our investments in U.S. Treasury Bills as money held for investments. We use quoted market prices to determine the fair value of our investments in U.S. Treasury Bills.

Investment in Unconsolidated Affiliates

We account for unconsolidated affiliates using the equity method of accounting per guidance established under ASC 323, Investments – Equity Method and Joint Ventures (“ASC 323”). The equity method of accounting requires the investment to be initially recorded at cost and subsequently adjusted for our share of equity in the affiliates’ earnings (losses), contributions and distributions. We evaluate the carrying amount of the investments for impairment in accordance with ASC 323. Unconsolidated affiliates are reviewed for potential impairment if the carrying amount of the investment exceeds its fair value. An impairment charge is recorded when an impairment is deemed to be other-than-temporary. To determine whether impairment is other-than-temporary, we consider whether we have the ability and intent to hold the investment until the carrying amount is fully recovered. The evaluation of an investment in an affiliate for potential

60

Table of Contents

STERLING REAL ESTATE TRUST AND SUBSIDIARIES

NOTES TO CONSOLIDATED FINANCIAL STATEMENTS

DECEMBER 31, 2023, 2022 AND 2021

(Dollar amounts in thousands, except share and per share data)

impairment can require our management to exercise significant judgments. No impairment losses were recorded related to the unconsolidated affiliates for the years ended December 31, 2023, 2022 and 2021.

Other Assets

Other assets are comprised of the following as of December 31, 2023 and 2022:


December 31, 2023


December 31, 2022

(in thousands)

Due from related party

$

54

$

50

Accounts receivable, net

6,225

5,821

Insurance claim receivable

396

3,846

Fair value of interest rate swap

11,362

13,782

Other assets

302

181

Financing fees, less accumulated amortization

46

86

Lease costs, less accumulated amortization

1,542

1,799

Prepaid expenses

1,588

1,747

Total other assets, net

$

21,515

$

27,312

Note receivable

Notes receivable are issued periodically and are secured and interest bearing. The Trust has one note receivable for a commercial tenant  bearing a 6.5% per annum interest rate which matures in 2025. The Trust also has four note receivables as disclosed in note 5.

Accrued Expenses and Other liabilities

Accrued Expenses and other liabilities are comprised of the following as of December 31, 2023 and 2022:


December 31, 2023


December 31, 2022

(in thousands)

Special assessments payable

$

877

$

647

Due to related party

676

1,408

Accounts payable - trade

3,385

2,340

Retainage payable

3

Deferred insurance proceeds

95

2

Accrued interest expense

1,413

1,318

Accrued real estate taxes

9,296

7,275

Accrued unearned rent

3,344

2,936

Other liabilities

153

146

Total accrued expenses and other liabilities

$

19,239

$

16,075

Debt Issuance Costs

We amortize external debt issuance costs related to notes and mortgage notes using the effective interest rate method, over the life term of the related debt. We record debt issuance costs net of amortization, on our consolidated balance sheets as an offset to their related debt. We record debt issuance costs related to revolving lines of credit as financing fees in other assets, regardless of whether a balance on the line of credit is outstanding. We record the amortization of all debt issuance costs as interest expense.

61

Table of Contents

STERLING REAL ESTATE TRUST AND SUBSIDIARIES

NOTES TO CONSOLIDATED FINANCIAL STATEMENTS

DECEMBER 31, 2023, 2022 AND 2021

(Dollar amounts in thousands, except share and per share data)

Noncontrolling Interest

A noncontrolling interest in a subsidiary (minority interest) is in most cases an ownership interest in the consolidated entity that should be reported as equity in the consolidated financial statements and separate from the parent company’s equity.  In addition, consolidated net income is required to be reported at amounts that include the amounts attributable to both the parent and the noncontrolling interest, and the amount of consolidated net income attributable to the parent and the noncontrolling interest are required to be disclosed on the face of the consolidated statements of operations and other comprehensive income.  

Operating Partnership: Interests in the operating partnership held by limited partners are represented by operating partnership units.  The operating partnership’s income is allocated to holders of units based upon the ratio of their holdings to the total units outstanding during the period. Capital contributions, distributions, syndication costs, and profits and losses are allocated to noncontrolling interests in accordance with the terms of the operating partnership agreement.

Partially Owned Properties: The Trust reflects noncontrolling interests in partially owned properties on the balance sheet for the portion of properties consolidated by the Trust that are not wholly owned by the Trust.  The earnings or losses from those properties attributable to the noncontrolling interests are reflected as noncontrolling interest in partially owned properties in the consolidated statements of operations and other comprehensive income.

Federal Income Taxes

We have elected to be taxed as a REIT under the Internal Revenue Code, as amended. A REIT calculates taxable income like other domestic corporations, with the major difference being a REIT is entitled to a deduction for dividends paid. A REIT is generally required to distribute each year at least 90% of its taxable income. If it chooses to retain the remaining 10% of taxable income, it may do so, but it will be subject to a corporate tax on such income. REIT shareholders are taxed on REIT distributions similar to corporate distributions.

A summary of the tax characterization of the dividends paid to shareholders of the Company’s common stock for the years ended December 31, 2023, 2022 and 2021 follows:

Tax Year Ended December 31,

Dividend

%

Dividend

%

Dividend

%

2023

2023

2022

2022

2021

2021

Tax status

Ordinary income

$

0.6226

54.14

%

$

0.6374

55.43

%

$

0.9833

92.76

%

Capital gain

%

%

0.0767

7.24

%

Return of capital

0.5274

45.86

%

0.5126

44.57

%

%

$

1.1500

100.00

%

$

1.1500

100.00

%

$

1.0600

100.00

%

We intend to continue to qualify as a REIT and, provided we maintain such status, will not be taxed on the portion of the income that is distributed to shareholders. In addition, we intend to distribute all our taxable income; therefore, no provisions or liabilities for income taxes have been recorded in the consolidated financial statements.

Sterling conducts its business activity as an Umbrella Partnership Real Estate Investment Trust (“UPREIT”) through its Operating Partnership – Sterling Properties, LLLP. The Operating Partnership is organized as a limited liability limited partnership. Income or loss is allocated to the partners in accordance with the provisions of the Internal Revenue Code 704(b) and 704(c). UPREIT status allows non-recognition of gain by an owner of appreciated real estate if that owner contributes the real estate to a partnership in exchange for a partnership interest. The conversion of a partnership interest to shares of beneficial interest in the REIT will be a taxable event to the limited partner.

62

Table of Contents

STERLING REAL ESTATE TRUST AND SUBSIDIARIES

NOTES TO CONSOLIDATED FINANCIAL STATEMENTS

DECEMBER 31, 2023, 2022 AND 2021

(Dollar amounts in thousands, except share and per share data)

We follow ASC Topic 740, Income Taxes, to recognize, measure, present and disclose in our consolidated financial statements uncertain tax positions that we have taken or expect to take on a tax return. As of December 31, 2023 and 2022 we did not have any liabilities for uncertain tax positions that we believe should be recognized in our consolidated financial statements. We are no longer subject to Federal and State tax examinations by tax authorities for years before 2019.

The operating partnership has elected to record related interest and penalties, if any, as income tax expense on the consolidated statements of operations and other comprehensive income.

Revenue Recognition

We record base rents on a straight-line basis. The monthly base rent income according to the terms of our leases is adjusted with the purpose that average monthly rent is recorded for each tenant over the term of its lease. The straight-line rent adjustment increased revenue by $291 and $302 for the year ended December 31, 2023 and 2022, respectively. The straight-line receivable balance included in receivables on the consolidated balance sheets as of December 31, 2023 and 2022, was $3,686 and $3,756, respectively. We receive payments for expense reimbursements from substantially all our multi-tenant commercial tenants throughout the year based on estimated. The Trust is the lessor for its residential and commercial leases. Leases are analyzed on an individual basis to determine lease classification. As of December 31, 2023, all leases analyzed under the Trust’s lease classification process were determined to be operating leases.

Earnings per Common Share

Basic earnings per common share is computed by dividing net income available to common shareholders (the “numerator”) by the weighted average number of common shares outstanding (the “denominator”) during the period. Sterling had no dilutive potential common shares as of December 31, 2023, 2022 and 2021 and therefore, basic earnings per common share was equal to diluted earnings per common share for both periods. As the calculation does not include net income attributable to the Operating Partnership, Operating Partnership Units are not included in the calculation, and does not have any impact on earnings per share.

For the years ended December 31, 2023, 2022 and 2021, Sterling’s denominators for the basic and diluted earnings per common share were approximately 11,104,000, 10,632,000, and 10,160,000, respectively.

Reclassifications

Certain reclassifications considered necessary for a fair presentation have been made to the prior period financial statements in order to conform to the current year’s presentation.  These reclassifications have not changed the results of operations or equity.

Recent Accounting Pronouncements

Management does not believe that any recently issued, but not yet effective accounting pronouncements, if adopted, would have a material effect on the accompanying Consolidated Financial Statements.

NOTE 3 – segment reporting

We report our results in two reportable segments: residential and commercial properties. Our residential properties include multifamily properties. Our commercial properties include retail, office, industrial, and medical properties. We assess and measure operating results based on net operating income (“NOI”), which we define as total real estate revenues less real estate expenses (which consist of real estate taxes, property management fees, utilities, repairs and maintenance, insurance and direct administrative costs). We believe NOI is an important measure of operating performance even though it should not be considered an alternative to net income or cash flow from operating activities.

63

Table of Contents

STERLING REAL ESTATE TRUST AND SUBSIDIARIES

NOTES TO CONSOLIDATED FINANCIAL STATEMENTS

DECEMBER 31, 2023, 2022 AND 2021

(Dollar amounts in thousands, except share and per share data)

Segment Revenues and Net Operating Income

The revenues and net operating income for the reportable segments (residential and commercial) are summarized as follows for the years ended December 31, 2023, 2022 and 2021, along with reconciliations to the consolidated financial statements. Segment assets are also reconciled to Total Assets as reported in the consolidated financial statements for the years ended December 31, 2023 and 2022.

Year ended December 31, 2023

Year ended December 31, 2022

Year ended December 31, 2021


Residential


Commercial


Total


Residential


Commercial


Total


Residential


Commercial


Total

(in thousands)

(in thousands)

(in thousands)

Income from rental operations

$

123,202

$

20,429

$

143,631

$

113,968

$

21,092

$

135,060

$

107,284

$

22,040

$

129,324

Expenses from rental operations

77,750

6,299

84,049

64,647

6,491

71,138

57,454

7,315

64,769

Net operating income

$

45,452

$

14,130

$

59,582

$

49,321

$

14,601

$

63,922

$

49,830

$

14,725

$

64,555

Depreciation and amortization

25,004

24,679

22,203

Interest

21,435

19,994

18,142

Administration of REIT

5,430

5,247

4,381

Loss on impairment of property

2,603

561

Other income

(2,546)

(11,091)

(4,609)

Net income

$

7,656

$

24,532

$

24,438

Segment Assets and Accumulated Depreciation

As of December 31, 2023


Residential


Commercial


Total

(in thousands)

Real estate investments

$

789,249

$

181,555

$

970,804

Accumulated depreciation

(164,793)

(49,791)

(214,584)

Total real estate investments, net

$

624,456

$

131,764

$

756,220

Lease intangible assets, less accumulated amortization

2,983

2,983

Cash and cash equivalents

26,919

Restricted deposits

10,142

Investment in unconsolidated affiliates

26,601

Notes receivable

8,885

Assets held for sale

1,568

Other assets, net

21,515

Total Assets

$

854,833

As of December 31, 2022


Residential


Commercial


Total

(in thousands)

Real estate investments

$

779,424

$

191,724

$

971,148

Accumulated depreciation

(147,115)

(47,734)

(194,849)

Total real estate investments, net

$

632,309

$

143,990

$

776,299

Lease intangible assets, less accumulated amortization

839

4,451

5,290

Cash and cash equivalents

3,257

Restricted deposits

9,323

Investment in securities

29,371

Investment in unconsolidated affiliates

29,423

Notes receivable

8,448

Other assets, net

27,312

Total Assets

$

888,723

64

Table of Contents

STERLING REAL ESTATE TRUST AND SUBSIDIARIES

NOTES TO CONSOLIDATED FINANCIAL STATEMENTS

DECEMBER 31, 2023, 2022 AND 2021

(Dollar amounts in thousands, except share and per share data)

NOTE 4 - RESTRICTED DEPOSITS AND FUNDED RESERVES


As of December 31,

As of December 31,

2023

2022

(in thousands)

Tenant security deposits

$

6,945

$

6,242

Real estate tax and insurance escrows

676

1,336

Replacement reserves

1,443

1,745

Other funded reserves

1,078

$

10,142

$

9,323

NOTE 5 – Investment in unconsolidated affiliates

Total Investment in Unconsolidated Affiliates at

Unconsolidated Affiliates

Date Acquired

Trust Ownership Interest

December 31, 2023

December 31, 2022

Banner Building

2007

66.67%

$

(478)

$

(614)

Grand Forks INREIT, LLC

2003

50%

5,193

4,961

SE Savage, LLC

2019

60%

954

1,660

SE Maple Grove, LLC

2019

60%

735

1,836

SE Rogers, LLC

2020

60%

1,419

2,413

ST Oak Cliff, LLC

2021

70%

7,920

9,098

SE Brooklyn Park, LLC

2021

60%

1,748

2,914

ST Fossil Creek, LLC

2022

70%

9,110

7,155

$

26,601

$

29,423

Banner Building - the operating partnership owns a 66.67% interest as tenant in common in an office building in Fargo, North Dakota. The property is encumbered by a first mortgage with a balance at December 31, 2023 and 2022 of $6,724 and $6,951, respectively. The Trust is jointly and severally liable for the full mortgage balance.

Grand Forks INREIT, LLC - the operating partnership is a 50% owner of a tenant in common through 100% ownership in a limited liability company. The property is located in Grand Forks, North Dakota. The property is encumbered by a non-recourse first mortgage with a balance at December 31, 2023 and 2022 of $8,948 and $9,520, respectively. The Trust is jointly and severally liable for the full mortgage balance.

SE Savage, LLC - the Operating Partnership owns a 60% interest in a limited liability company that holds a multifamily property. The property is encumbered by a first mortgage with a balance of $30,305 and $30,726 at December 31, 2023 and December 31, 2022. The Trust is jointly and severally liable for the full mortgage balance. Additionally SE Savage, LLC has an outstanding Promissory Note with Sterling Properties, LLLP, for $468 and $1,397 as of December 31, 2023 and December 31, 2022, and is an unsecured obligation of SE Savage, LLC. The note is included in Notes Receivable on the Consolidated Balance Sheet at December 31, 2023 and December 31, 2022.

65

Table of Contents

STERLING REAL ESTATE TRUST AND SUBSIDIARIES

NOTES TO CONSOLIDATED FINANCIAL STATEMENTS

DECEMBER 31, 2023, 2022 AND 2021

(Dollar amounts in thousands, except share and per share data)

SE Maple Grove, LLC - the Operating Partnership owns a 60% interest in a limited liability company that holds a multifamily property. The entity is encumbered by a first mortgage with a balance at December 31, 2023 and December 31, 2022 of $24,633  and $24,788, respectively. The property is also encumbered by a second mortgage to Sterling Properties, LLLP with a balance at both December 31, 2023 and December 31, 2022 of $3,643. The note is included in Notes Receivable on the Consolidated Balance Sheet at December 31, 2023 and December 31, 2022.

SE Rogers, LLC - the Operating Partnership owns a 60% interest in a limited liability company that is currently developing a multifamily property. The LLC holds land located in Rogers, Minnesota, with total assets of $30,576 and $32,864 at December 31, 2023 and December 31, 2022, respectively. The entity is encumbered by a first mortgage with a balance of $25,742 at both December 31, 2023 and December 31, 2022. The Company is jointly and severally liable for the full mortgage balance. The property is also encumbered by a second mortgage to Sterling Properties, LLLP with a balance at December 31, 2023 of $2,117 and December 31, 2022 of $2,938. The note is included in Notes Receivable on the Consolidated Balance Sheet at December 31, 2023 and December 31, 2022.

ST Oak Cliff, LLC - the Operating Partnership owns a 70% interest in a limited liability company, with a related party. The entity is currently developing a multifamily property. As of December 31, 2023, the Operating Partnership has contributed $9,300 in cash to the entity. The entity holds land located in Dallas, Texas with total assets of $48,738 and $40,404 at December 31, 2023 and December 31, 2022, respectively. The entity is encumbered by a construction mortgage with a balance of $36,246 and $23,409 at December 31, 2023 and December 31, 2022, respectively. The Company is jointly and severally liable for the full mortgage balance.

SE Brooklyn Park, LLC - the Operating Partnership owns a 60% interest in a limited liability company, with an unrelated third party. The entity is located in Brooklyn Park, Minnesota, with total assets of $30,325 and $30,490 at December 31, 2023 and December 31, 2022, respectively. The entity is encumbered by a first mortgage with a balance of $24,592 and $24,448 at December 31, 2023 and December 31, 2022, respectively. The Company is jointly and severally liable for the full mortgage balance. The property is also encumbered by a second mortgage to Sterling Properties, LLLP with a balance at December 31, 2023 of $2,538.  There was no balance outstanding related to the second mortgage as of December 31, 2022. The note is included in Notes Receivable on the Consolidated Balance Sheet at December 31, 2023 and December 31, 2022.

ST Fossil Creek, LLC - the Operating Partnership owns a 70% interest in a limited liability company, with a related party. The entity is currently developing a multifamily property. As of December 31, 2023, the Operating Partnership has contributed $9,275 in cash to the entity. The entity holds land located in Fort Worth, Texas with total assets of $43,517 and $11,083 at December 31, 2023 and December 31, 2022, respectively. The entity is encumbered by a construction mortgage with a balance of $26,657 at December 31, 2023.  There was no balance outstanding related to the construction mortgage at December 31, 2022. The Company is jointly and severally liable for the full mortgage balance.

66

Table of Contents

STERLING REAL ESTATE TRUST AND SUBSIDIARIES

NOTES TO CONSOLIDATED FINANCIAL STATEMENTS

DECEMBER 31, 2023, 2022 AND 2021

(Dollar amounts in thousands, except share and per share data)

The following is a summary of the financial position of the unconsolidated affiliates at December 31, 2023 and 2022.


December 31, 2023


December 31, 2022

(in thousands)

ASSETS

Real estate investments

$

261,901

$

218,747

Accumulated depreciation

(26,191)

(16,490)

235,710

202,257

Cash and cash equivalents

3,388

3,093

Restricted deposits

883

1,034

Intangible assets, less accumulated amortization

813

542

Other assets, net

780

827

Total Assets

$

241,574

$

207,753

LIABILITIES

Mortgage notes payable, net

$

191,890

$

152,246

Tenant security deposits payable

340

192

Accrued expenses and other liabilities

7,208

8,217

Total Liabilities

$

199,438

$

160,655

SHAREHOLDERS' EQUITY

Total Shareholders' Equity

$

42,136

$

47,098

Total liabilities and shareholders' equity

$

241,574

$

207,753

The following is a summary of results of operations of the unconsolidated affiliates for the years ended the years ended December 31, 2023, 2022 and 2021.

The year ended December 31,

2023

2022

2021

(in thousands)

Income from rental operations

$

19,202

$

9,545

$

4,746

Expenses from rental operations

7,687

3,668

1,632

Net operating income

$

11,515

$

5,877

$

3,114

Depreciation and Amortization

9,784

5,678

1,248

Interest

6,180

4,148

2,275

Other Income

13

(91)

-

Net loss

$

(4,462)

$

(3,858)

$

(409)

67

Table of Contents

STERLING REAL ESTATE TRUST AND SUBSIDIARIES

NOTES TO CONSOLIDATED FINANCIAL STATEMENTS

DECEMBER 31, 2023, 2022 AND 2021

(Dollar amounts in thousands, except share and per share data)

NOTE 6 - Lease intangibles

The following table summarizes the net value of other intangible assets and liabilities and the accumulated amortization for each class of intangible:

Lease

Accumulated

Lease

As of December 31, 2023


Intangibles


Amortization


Intangibles, net

Lease Intangible Assets

(in thousands)

In-place leases

$

13,927

$

(11,434)

$

2,493

Above-market leases

1,415

(925)

490

$

15,342

$

(12,359)

$

2,983

Lease Intangible Liabilities

Below-market leases

$

(2,314)

$

1,844

$

(470)

Lease

Accumulated

Lease

As of December 31, 2022


Intangibles


Amortization


Intangibles, net

Lease Intangible Assets

(in thousands)

In-place leases

$

15,528

$

(10,960)

$

4,568

Above-market leases

1,897

(1,175)

722

$

17,425

$

(12,135)

$

5,290

Lease Intangible Liabilities

Below-market leases

$

(2,379)

$

1,733

$

(646)

The estimated aggregate amortization expense for each of the five succeeding fiscal years and thereafter is as follows:

Intangible

Intangible

Years ending December 31,


Assets


Liabilities

(in thousands)

2024

$

641

$

147

2025

641

147

2026

490

77

2027

381

38

2028

311

19

Thereafter

519

42

$

2,983

$

470

The weighted average amortization period for the intangible assets (in-place leases, above-market leases) and intangible liabilities (below-market leases) acquired as of December 31, 2023 was 2.6 years.

The portion of the purchase price allocated to acquire above and below market lease intangibles is amortized on a straight-line basis over the life of the related lease as an adjustment to rental income. Amortization pertaining to above market lease intangibles of $100, $145, and $154 for the years ended December 31, 2023, 2022 and 2021, respectively, was recorded as a reduction to income from rental operations. Amortization pertaining to below market lease intangibles of $148, $164, and $183 for the years ended December 31, 2023, 2022 and 2021, respectively, was recorded as an increase to income from rental operations.

68

Table of Contents

STERLING REAL ESTATE TRUST AND SUBSIDIARIES

NOTES TO CONSOLIDATED FINANCIAL STATEMENTS

DECEMBER 31, 2023, 2022 AND 2021

(Dollar amounts in thousands, except share and per share data)

NOTE 7 – LINES OF CREDIT

We have a $4,915 variable rate (floating SOFR plus 2.00%) line of credit agreement with Bremer Bank, which expires in December 2026; and a $5,000 variable rate (floating SOFR plus 2.00%) line of credit agreement with Bremer Bank, which expires December 2026. The lines of credit are secured by specific properties. At December 31, 2023, the Bremer line of credit had $9,915 available and unused under the agreements. These operating lines are designed to enhance treasury management activities and more effectively manage cash balances. As of December 31, 2023 and December 31, 2022, there was a balance of $- and $1,008, respectively.

Certain lines of credit agreements include covenants that, in part, impose maintenance of certain debt service coverage, debt to net worth ratios, and debt yield ratios. As of December 31, 2023, no properties were out of compliance.

NOTE 8 - NOTES PAYABLE

As of December 31, 2023 and 2022, the Trust had an outstanding balance on notes payable of $- and $26,500, respectively.

The following table summarizes the Company’s mortgage notes payable.  

Principal Balance At

December 31,

December 31,

2023

2022

(in thousands)

Fixed rate mortgage notes payable (a)

$

520,155

$

508,305

Variable rate mortgage notes payable

-

-

Mortgage notes payable

520,155

508,305

Less unamortized debt issuance costs

2,036

2,138

$

518,119

$

506,167

(a)Includes $103,246 and $106,033 of variable rate mortgage debt that was swapped to a fixed rate as of December 31, 2023 and 2022, respectively.

As of December 31, 2023, we had 111 fixed rate mortgage loan with effective interest rates ranging from 2.43% to 6.85% per annum, and a weighted average effective interest rate of 3.93% per annum.

As of December 31, 2022, we had 115 fixed rate and one variable rate mortgage loan with effective interest rates ranging from 2.43% to 6.85% per annum, and a weighted average effective interest rate of 3.79% per annum.

The majority of the Company’s mortgages payable require monthly payments of principal and interest. Certain mortgages require reserves for real estate taxes and certain other costs. Mortgages are secured by the respective properties, assignment of rents, business assets, deeds to secure debt, deeds of trust and/or cash deposits with the lender. Additionally, certain mortgage note agreements include covenants that, in part, impose maintenance of certain debt service coverage and debt to worth ratios. As of December 31, 2023, ten  loans were out of compliance due to increased repair and maintenance costs related to unit renovations and increased utility costs. The loans were secured by various properties with a total outstanding balance of $17,687. Annual waivers were received from the lenders on all loans out of compliance as of December 31, 2023. As of December 31, 2022, eight loans were out of compliance due increased repair and maintenance costs related to unit renovations, bad debt allowance, and increased vacancies in the North Dakota and Minnesota markets. The loans were secured by various properties with a total outstanding balance of $9,915. Annual waivers were received from the lenders on all loans out of compliance as of December 31, 2022.

69

Table of Contents

STERLING REAL ESTATE TRUST AND SUBSIDIARIES

NOTES TO CONSOLIDATED FINANCIAL STATEMENTS

DECEMBER 31, 2023, 2022 AND 2021

(Dollar amounts in thousands, except share and per share data)

We are required to make the following principal payments on our outstanding mortgage notes payable for each of the five succeeding fiscal years and thereafter as follows:

Years ending December 31,


Amount

(in thousands)

2024

$

22,304

2025

53,288

2026

69,259

2027

79,821

2028

41,680

Thereafter

253,803

Total payments

$

520,155

NOTE 9 – DERIVATIVES AND HEDGING ACTIVITIES

As part of our interest rate risk management strategy, we have used interest rate derivatives to manage our exposure to interest rate movements and add stability to interest expense. Interest rate swaps designated as cash flow hedges involve the receipt of variable rate amounts from a counterparty in exchange for the Trust making fixed rate payments over the life of the agreement without exchange of the underlying notional amount.

As of December 31, 2023, the Trust used 12 interest rate swaps to hedge the variable cash flows associated with variable rate debt. Changes in fair value of the derivatives that are designated and that qualify as cash flow hedges are recorded in “Accumulated other comprehensive (loss) income” and are reclassified into interest expense as interest payments are made on the Company’s variable rate debt. During the next 12 months, the Trust estimates that an additional $4,128 will be reclassified as a decrease to interest expense.

The following table summarizes the Trust’s interest rate swaps designated as cash flow hedges as of December 31, 2023:

Fixed

Effective Date

Notional

Interest Rate

Maturity Date

November 1, 2019

$

6,365

3.15%

November 1, 2029

November 1, 2019

$

4,427

3.28%

November 1, 2029

January 10, 2020

$

2,888

3.39%

January 10, 2030

December 2, 2020

$

12,001

2.91%

December 2, 2027

July 1, 2021

$

25,006

2.99%

July 1, 2031

November 10, 2021

$

27,471

3.54%

August 1, 2029

December 1, 2021

$

10,516

3.32%

December 1, 2031

August 15, 2022

$

1,444

3.07%

June 15, 2030

August 15, 2022

$

2,798

3.07%

June 15, 2030

August 15, 2022

$

1,563

2.94%

June 15, 2030

August 15, 2022

$

4,135

2.94%

June 15, 2030

May 10, 2023

$

4,632

2.79%

June 10, 2030

The following table summarizes the Company’s interest rate swaps that were designated as cash flow hedges of interest rate risk:

Number of Instruments

Notional

Interest Rate Derivatives

December 31, 2023

December 31, 2022

December 31, 2023

December 31, 2022

Interest rate swaps

12

12

$

103,246

$

106,033

70

Table of Contents

STERLING REAL ESTATE TRUST AND SUBSIDIARIES

NOTES TO CONSOLIDATED FINANCIAL STATEMENTS

DECEMBER 31, 2023, 2022 AND 2021

(Dollar amounts in thousands, except share and per share data)

The table below presents the estimated fair value of the Company’s derivative financial instruments as well as their classification in the accompanying consolidated balance sheets. The valuation techniques are described in Note 10 to the consolidated financial statements.

Derivatives designated as

December 31, 2023

December 31, 2022

cash flow hedges:

Balance Sheet Location

Fair Value

Balance Sheet Location

Fair Value

Interest rate swaps

Other assets, net

$

11,362

Other assets, net

$

13,782

The following table presents the effect of the Company’s derivative financial instruments on the accompanying consolidated statements of operations and other comprehensive income (loss) for the years ended December 31, 2023 and 2022:

Location of Gain

Derivatives in

Recognized in Other

Accumulated other

Amount of (Gain)/Loss

Cash Flow Hedging

Comprehensive Income

Comprehensive Income

Reclassified from

Relationships

on Derivatives

(AOCI) into Income

AOCI into Income

2023

2023

Interest rate swaps

$

2,420

Interest expense

$

(3,743)

2022

2022

Interest rate swaps

$

(14,732)

Interest expense

$

94

Credit-risk-related Contingent Features

The Trust has agreements with each of its derivative counterparties that contain a provision whereby if the Trust defaults on the related indebtedness, including default where repayment of the indebtedness has not been accelerated by the lender, then the Trust could also be declared in default on its corresponding derivative obligation. As of December 31, 2023, the termination value of derivatives in a liability position was $0 and the termination value of derivatives in an asset position was $11,362. As December 31, 2023, the Trust has pledged the properties related to the loans which are hedged as collateral.

NOTE 10 - FAIR VALUE MEASUREMENT

The following table presents the carrying value and estimated fair value of the Company’s financial instruments:

December 31, 2023

December 31, 2022

Carrying

Carrying


Value


Fair Value


Value


Fair Value

(in thousands)

Financial assets:

Investments

$

-

$

-

$

29,371

$

29,371

Notes receivable

$

8,885

$

10,025

$

8,448

$

9,789

Derivative assets

$

11,362

$

11,362

$

13,782

$

13,782

Financial liabilities:

Mortgage notes payable

$

520,155

$

477,344

$

508,305

$

466,245

The carrying values shown in the table are included in the consolidated balance sheets under the captions indicated in Note 10. ASC 820-10 established a three-level valuation hierarchy for fair value measurement.  Management uses these valuation techniques to establish the fair value of the assets at the measurement date. These valuation techniques are based upon observable and unobservable inputs. Observable inputs reflect market data obtained from independent sources, while unobservable inputs reflect management’s assumptions.

71

Table of Contents

STERLING REAL ESTATE TRUST AND SUBSIDIARIES

NOTES TO CONSOLIDATED FINANCIAL STATEMENTS

DECEMBER 31, 2023, 2022 AND 2021

(Dollar amounts in thousands, except share and per share data)

These two types of inputs create the following fair value hierarchy:

Level 1 – Quoted prices for identical instruments in active markets.
Level 2 – Quoted prices for similar instruments in active markets; quoted prices for identical or similar instruments in markets that are not active; and model-derived valuations whose significant inputs are observable.
Level 3 – Instruments whose significant inputs are unobservable.

The guidance requires the use of observable market data, when available, in making fair value measurements. When inputs used to measure fair value fall within different levels of the hierarchy, the level within which the fair value measurement is categorized is based on the lowest level input that is significant to the fair value measurement.

Recurring Fair Value Measurements

The following table presents the Trust’s financial instruments, which are measured at fair value on a recurring basis, by the level in the fair value hierarchy within which those measurements fall. Methods and assumptions used to estimate the fair value of these instruments are described after the table.


Level 1


Level 2


Level 3


Total

(in thousands)

December 31, 2023

Derivative assets

$

$

11,362

$

$

11,362

December 31, 2022

Derivative assets

$

$

13,782

$

$

13,782

Derivatives: The fair value of interest rate swaps is determined using a discounted cash flow analysis on the expected future cash flows of the derivative.

The Company has determined that the majority of the inputs used to value its derivatives fall within Level 2 of the fair value hierarchy. In adjusting the fair value of its derivative contracts for the effect of nonperformance risk, the Company has considered any applicable credit enhancements.

Fair Value Disclosures

The following table presents the Company’s financial assets and liabilities, which are measured at fair value for disclosure purposes, by the level in the fair value hierarchy within which they fall. Methods and assumptions used to estimate the fair value of these instruments are described after the table.


Level 1


Level 2


Level 3


Total

(in thousands)

December 31, 2023

Mortgage notes payable

$

$

$

477,344

$

477,344

Notes receivable

$

$

$

10,025

$

10,025

December 31, 2022

U.S. Treasury Bills

$

29,371

$

$

$

29,371

Mortgage notes payable

$

$

$

466,245

$

466,245

Notes receivable

$

$

$

9,789

$

9,789

U.S. Treasury Bills: The Trust estimates the fair value of its Treasury Bills by using quoted market prices.

72

Table of Contents

STERLING REAL ESTATE TRUST AND SUBSIDIARIES

NOTES TO CONSOLIDATED FINANCIAL STATEMENTS

DECEMBER 31, 2023, 2022 AND 2021

(Dollar amounts in thousands, except share and per share data)

Mortgage notes payable: The Trust estimates the fair value of its mortgage notes payable by discounting the future cash flows of each instrument at rates currently offered to the Trust for similar debt instruments of comparable maturities by the Trust’s lenders. The rates used range from 5.85% to 6.00% and from 5.75% to 6.00% at December 31, 2023 and 2022, respectively.

Notes receivable: The Trust estimates the fair value of its notes receivable by discounting future cash flows of each instrument at rates currently offered to the Trust for similar note instruments of comparable maturities by the Trust’s lenders. The fair value rate was 7.25% December 31, 2023 and 2022.

NOTE 11 – NONCONTROLLING INTEREST OF UNITHOLDERS IN OPERATING PARTNERSHIP

As of December 31, 2023 and 2022, outstanding limited partnership units totaled 18,584,000 and 18,730,000, respectively. Total aggregate distributions per unit for the years ended December 31, 2023, 2022 and 2021were $1.1500, $1.1500 and $1.06,  respectively. The operating partnership declared fourth quarter distributions of $5,342 and $5,385, to limited partners payable in January 2024 and 2023, respectively.  

During the year ended December 31, 2023, there were no limited partnership units of the operating partnership exchanged for common shares of the trust.

Provided the Trust’s redemption plan exists, and subject to the conditions and limitations contained in such redemption plan (including, without limitation, applicable holding periods and ownership limitations), and further subject to the conditions and limitations set forth in the LLLP Agreement of the Operating Partnership, a Limited Partner may request the redemption of its limited partnership units for cash (a “Redemption Request”) or the exchange of its limited partnership units for Sterling common shares (an “Exchange Request”). Such request must be made in accordance with the redemption plan. Upon receipt of any Redemption or Exchange Request, as the case may be, the Trust may, at its sole and absolute discretion, acting for itself or as General Partner of the Operating Partnership, elect to redeem or exchange such limited partnership units. The Trust may, in its sole discretion, terminate, amend or suspend the redemption plan if such action is determined to be in the best interest of the Operating Partnership.

NOTE 12 – REDEMPTION PLANS

Our Board of Trustees has approved redemption plans that enable our shareholders to sell their common shares and the partners of our operating partnership to sell their limited partnership units to us, after they have held the securities for at least one year and subject to other conditions and limitations described in the plans.

Our redemption plans currently provide that the maximum amount that can be redeemed under the plan is $55,000 worth of securities. As of December 31, 2023, there were $9,689 worth of securities left to be redeemed under the redemption plan. Currently, the fixed redemption price is $21.85 per share or unit under the plans which price became effective January 1, 2022. Prior to January 1, 2022, the redemption price was $19.00 per share or unit under the plan. Prior to January 1, 2021, the redemption price was $18.25 per share or unit under the plan.

We may redeem securities under the plans provided the aggregate total has not been exceeded if we have sufficient funds to do so. The plans will terminate in the event the shares become listed on any national securities exchange, the subject of bona fide quotes on any inter-dealer quotation system or electronic communications network or are the subject of bona fide quotes in the pink sheets. Additionally, the Board, in its sole discretion, may terminate, amend or suspend the redemption plans, either or both of them, if it determines to do so in its sole discretion.

During the years ended December 31, 2023, 2022 and 2021, the Company redeemed 83,000, 53,000 and 82,000 common shares valued at $1,813, $1,155 and $1,552, respectively. In addition, during the years ended December 31, 2023, 2022 and 2021, the Company redeemed 144,000, 42,000 and 211,000 units valued at $3,181, $922 and $4,014, respectively.

73

Table of Contents

STERLING REAL ESTATE TRUST AND SUBSIDIARIES

NOTES TO CONSOLIDATED FINANCIAL STATEMENTS

DECEMBER 31, 2023, 2022 AND 2021

(Dollar amounts in thousands, except share and per share data)

NOTE 13 – BENEFICIAL INTEREST

We are authorized to issue 100,000,000 common shares of beneficial interest with $0.01 par value and 50,000,000 preferred shares with $0.01 par value, which collectively represent the beneficial interest of Sterling. As of December 31, 2023 and 2022, there were 11,257,000 and 10,810,000 common shares outstanding. We had no preferred shares outstanding as of either date.

Dividends paid to holders of common shares were $1.1500 per share, $1.1500 per share and $1.0600 per share for the years ended December 31, 2023, 2022 and 2021, respectively.

NOTE 14 – DIVIDEND REINVESTMENT PLAN

Our Board of Trustees approved a dividend reinvestment plan to provide existing holders of our common shares with a convenient method to purchase additional common shares without payment of brokerage commissions, fees or service charges. On July 20, 2012, we registered with the Securities Exchange Commission 2,000,000 common shares to be issued under the plan on Form S-3D, which automatically became effective on July 20, 2012. On July 11, 2017, we registered with the Securities Exchange Commission an additional 2,000,000 common shares to be issued under the plan on Form S-3D, which automatically became effective on July 11, 2017. On November 3, 2020, we registered with the Securities Exchange Commission an additional 2,000,000 common shares to be issued under the plan on Form S-3D, which automatically became effective on November 3, 2020.

Under this plan, eligible shareholders may elect to have all or a portion (but not less than 25%) of the cash dividends they receive automatically reinvested in our common shares. If an eligible shareholder elects to reinvest cash dividends under the plan, the shareholder may also make additional optional cash purchases of our common shares, not to exceed $10 per fiscal quarter without our prior approval. The purchase price per common share under the plan equals 95% of the estimated value per common share for dividend reinvestments and equals 100% of the estimated value per common share for additional optional cash purchases, as determined by our Board of Trustees. In addition, eligible shareholders may not in any calendar year purchase or receive via transfer more than $40 additional optional cash purchases of Common Shares.

The estimated value per common share was $23.00 and $23.00 at December 31, 2023 and 2022, respectively.

Therefore, the purchase price per common share for dividend reinvestments was $21.85 and $21.85 and for additional optional cash purchases was $23.00 and $23.00 at December 31, 2023 and 2022, respectively. The Board, in its sole discretion, may amend, suspend or terminate the plan at any time, without the consent of shareholders, upon a ten-day notice to participants.

In the year ended December 31, 2023, 353,000 shares were issued pursuant to dividend reinvestments and 173,000 shares were issued pursuant to additional optional cash purchases under the plan. In the year ended December 31, 2022, 342,000 shares were issued pursuant to dividend reinvestments and 177,000 shares were issued pursuant to additional optional cash purchases under the plan. In the year ended December 31, 2021, 363,000 shares were issued pursuant to dividend reinvestments and 203,000 shares were issued pursuant to additional optional cash purchases under the plan.

NOTE 15 – RELATED PARTY TRANSACTIONS

Effective January 1, 2021, Trustmark Enterprises, Inc. was formed to act as the holding company for Sterling Management, LLC and GOLDMARK Property Management, Inc. In connection with this restructuring transaction, the owners of Trustmark Enterprises, Inc. indirectly own Sterling Management, LLC and GOLDMARK Property Management, Inc. Trustmark Enterprises, Inc. is owned in part by the Trust’s Chief Executive Officer and Trustee Mr. Kenneth P. Regan, by Trustee Mr. James S. Wieland, President Joel S. Thomsen, General Counsel and Secretary Michael P. Carlson and by Chief Financial Officer and Treasurer Damon K. Gleave . In addition, Mr. Regan serves as the Executive Chairman of the Advisor, and Messrs. Wieland, and Thomsen serve on the Board of Governors of both the Advisor and GOLDMARK Property Management, Inc.

74

Table of Contents

STERLING REAL ESTATE TRUST AND SUBSIDIARIES

NOTES TO CONSOLIDATED FINANCIAL STATEMENTS

DECEMBER 31, 2023, 2022 AND 2021

(Dollar amounts in thousands, except share and per share data)

Sterling Management, LLC (the “Advisor”), is a North Dakota limited liability company formed in November 2002. The Advisor is responsible for managing day-to-day affairs, overseeing capital projects, and identifying, acquiring, and disposing investments on behalf of the trust.

GOLDMARK Property Management, Inc., is a North Dakota corporation formed in 1981. GOLDMARK Property Management, Inc. performs property management services for the Trust.

We have a historical and ongoing relationship with Bell Bank. Bell Bank has provided the Trust certain financial services throughout the relationship. Mr. Wieland, a Trustee, also serves as a Board Member of Bell Bank. Mr. Wieland could have an indirect material interest in any such engagement and related transactions.

The Trust has a historical and ongoing relationship with Trumont Group and Trumont Construction. Trumont Group provides development services for current joint venture projects in which the Operating Partnership is an investor. Trumont Construction has been engaged to construct the properties associated with these joint ventures. Mr. Regan, Chief Executive Officer and trustee, is a partner in both Trumont Group and Trumont Construction and has a direct material interest in any engagement or related transaction, the Trust enters into, with these entities.

Property Management Fee

During the years ended December 31, 2023, 2022 and 2021, we paid property management and administrative fees to GOLDMARK Property Management, Inc. of $15,069, 13,833, and $12,836, respectively. Management fees which approximate 5% of net collected rents, account for $5,755, $5,499, and $5,271 of these fees during the years ended December 31, 2023, 2022 and 2021. In addition, the years ended December 31, 2023, 2022 and 2021, we paid repair and maintenance expenses, and payroll related expenses to GOLDMARK Property Management, Inc. totaling $9,936, $7,744, and $6,536, respectively

Advisory Agreement

We are an externally managed trust and as such, although we have a Board of Trustees and executive officers responsible for our management, we have no paid employees. The Advisor may receive fees related to management of the Trust, acquiring, disposing, or developing real estate property, project management fees, and financing fees related to lending relationships, under the Advisory Agreement, which must be renewed on an annual basis and approved by a majority of the independent trustees. The Advisory Agreement was approved by the Board of Trustees (including all the independent Trustees) on March 23, 2023, and is effective until March 31, 2024.

The below table summarizes the fees incurred to our Advisor.

Year Ended December 31,

2023

2022

2021

(in thousands)

Fee:

Advisory

$

3,807

$

3,683

$

3,348

Acquisition

$

-

$

1,321

$

375

Disposition

$

204

$

703

$

146

Financing

$

121

$

83

$

224

Project Management

$

682

$

450

$

572

75

Table of Contents

STERLING REAL ESTATE TRUST AND SUBSIDIARIES

NOTES TO CONSOLIDATED FINANCIAL STATEMENTS

DECEMBER 31, 2023, 2022 AND 2021

(Dollar amounts in thousands, except share and per share data)

The below table summarizes the fees payable to our Advisor.

Payable at

December 31,

December 31,

2023

2022

(in thousands)

Fee:

Advisory

$

316

$

632

Acquisition

$

-

$

387

Disposition

$

-

$

72

Project Management

$

-

$

12

Operating Partnership Units Issued in Connection with Acquisitions

During the year ended December 31, 2023, there were no Operating Partnership units issued directly or indirectly, to affiliated entities

During  the year ended December 31, 2022, 510,000 Operating Partnership units were issued to an entity affiliated with Messrs. Regan and Wieland, two of our trustees, in connection with the acquisition of various properties. The aggregate value of these units was $11,741.

During the year ended December 31, 2021, there were no Operating Partnership units issued directly or indirectly, to affiliated entities.

Commissions

During the years ended December 31, 2023, 2022 and 2021, we incurred real estate commissions of $-, $567, and $312, respectively, to GOLDMARK Commercial Real Estate, Inc., in which Messrs. Regan and Wieland jointly own a controlling interest. As of December 31, 2023, there were no commissions  payable to GOLDMARK Commercial Real Estate. As of December 31, 2022,  there were commissions of $183 payable to GOLDMARK Commercial Real Estate. As of December 31, 2021, there were no unpaid commissions to GOLDMARK Commercial Real Estate.

During the years ended December 31, 2023, 2022 and 2021, we incurred real estate commissions of $-, $418, and $217, respectively to GOLDMARK Property Management. As of December 31, 2023,  there were no commission payable to GOLDMARK Property Management. As of December 31, 2022, there were commissions of $92 payable to GOLDMARK Property Management. As of December 31, 2021, there were no unpaid commissions to GOLDMARK Property Management.

Rental Income

During the years ended December 31, 2023, 2022 and 2021, we received rental income of $133, $130, and $106 , respectively, under an operating lease agreement with our Advisor.

During the year ended December 31, 2023 and 2022, we received no rental income, and during the year ended December 31, 2021 we received rental income of $19, under an operating lease agreement with GOLDMARK Commercial Real Estate, Inc.

During the years ended December 31, 2023, 2022 and 2021, we received rental income of $273, $267, and $294, respectively, under operating lease agreements with GOLDMARK Property Management, Inc.

During the years ended December 31, 2023, 2022 and 2021, we received rental income of $1,005, $859, and $404, respectively, under operating lease agreements with Bell Bank.

76

Table of Contents

STERLING REAL ESTATE TRUST AND SUBSIDIARIES

NOTES TO CONSOLIDATED FINANCIAL STATEMENTS

DECEMBER 31, 2023, 2022 AND 2021

(Dollar amounts in thousands, except share and per share data)

Other operational costs

During the years ended December 31, 2023, 2022 and 2021, the Trust incurred $670, $207, and $276, respectively, for general costs related to business operations as well as capital expenditures related to construction in progress that were paid to related parties. At December 31, 2023 and 2022, there were no operational outstanding liabilities.

During the year ended December 31, 2023, the Trust received did not receive related parties reimbursement for expenses paid that were associated with capital projects. No reimbursements for operational receivables were received during the year ended December 31, 2022. At December 31, 2023, operational receivables outstanding due from related parties was $54 and $50, respectively.

Debt Financing

At December 31, 2023, and 2022, the Trust had $60,262 and $64,123, respectively, of outstanding principal on loans entered into with Bell Bank. During the years ended December 31, 2023, 2022 and 2021, the Trust incurred interest expense on debt held with Bell Bank of $2,398, $2,480, and $2,508, respectively. Accrued interest at December 31, 2023 and 2022, related to this debt was $128 and $130, respectively.

A December 31, 2023 and December 31, 2022, the Trust had $- and $26,500, respectively, of outstanding principal on notes payable entered into with Bell Bank. During the years ended December 31, 2023, 2022 and 2021, the Trust did not incur interest expense on note payable held with Bell Bank.

Mezzanine Financing

The Trust offers mezzanine financing to joint ventures, see note 5 for investment in unconsolidated affiliates.

As of the year ended December 31, 2023 and 2022, Sterling issued $8,766 and $5,854, respectively, in second mortgage financing to related entities.

During the year ended December 31, 2023 and 2022, the Trust earned interest income of $671 and $350, respectively, related to the second mortgage financing.

Insurance Services

The Trust retains insurance services from Bell Insurance. Policies provided by these services provide insurance coverage for the Trust’s Commercial segment as well as Director and Officer general and liability coverage. At the years ended December 31, 2023, 2022 and 2021, total premiums incurred for this policy were $165, $48, and $166, respectively.

Tenant Improvement Arrangements

During the year ended December 31, 2023 and 2022, there were no tenant improvement costs incurred during. During the year ended December 31, 2021, the Trust paid $2,782 in tenant improvement costs associated with a lease agreement with Trustmark Enterprises, Inc.

Development Arrangements

Effective May 16, 2022, The Trust purchased a 70% interest in ST Fossil Creek Fort Worth, LLC. The purpose of the entity is to develop and construct a 228-unit multifamily property located in Fort Worth, Texas. The partnering investee, TG Fossil Creek Fort Worth, LLC is owned in part by Kenneth P. Regan, the Trust’s Chief Executive Officer and Trustee. Mr. Regan is also a partner in Trumont Group, the developer engaged by ST Fossil Creek Fort Worth, LLC to oversee the development of the property. Further, Mr. Regan is also a partner in Trumont Construction, the company who was engaged to oversee the day-to-day construction operations of the property.

77

Table of Contents

STERLING REAL ESTATE TRUST AND SUBSIDIARIES

NOTES TO CONSOLIDATED FINANCIAL STATEMENTS

DECEMBER 31, 2023, 2022 AND 2021

(Dollar amounts in thousands, except share and per share data)

During  the year ended December 31, 2023 and 2022, the Trust incurred and paid $- and $411, respectively, in development fees to Trumont Group. At the year ended December 31, 2023 and 2022, the Trust owed $- and $51, respectively, in development fees to Trumont Group.

During  the year ended December 31, 2023 and 2022, the Trust incurred and paid $459 and $799, respectively, in construction fees to Trumont Construction. At the year ended December 31, 2023 and 2022, the Trust owed $37 and $81, respectively, in construction fees to Trumont Construction.

During the year ended December 31, 2023 and 2022, the Trust incurred and paid $344 and $639, respectively, in general construction costs to Trumont Construction. At the year ended December 31, 2023 and 2022, no general construction costs were owed to Trumont Construction.

NOTE 16 - RENTALS UNDER OPERATING LEASES / RENTAL INCOME

Residential apartment units are rented to individual tenants with lease terms of one year or less.

Commercial properties are leased to tenants under terms expiring at various dates through 2038. Lease terms often include renewal options.

As of December 31, 2023, we derived 85.8% of our revenues from residential leases that are generally for terms of one-year or less. The residential leases may include lease income related to such items as parking, storage and non-refundable deposits that we treat as a single lease component because amenities cannot be leased on their own and the timing and pattern of revenue recognition are the same. The collection of lease payments at lease commencement is probable and therefore we subsequently recognize lease income over the lease term on a straight-line basis.  Residential leases are renewable upon consent of both parties on an annual or monthly basis.

As of December 31, 2023, we derived 14.2% of our revenues from commercial leases primarily under long-term lease agreements.  Substantially all commercial leases contain fixed escalations, or, in some instances, changes based on the Consumer Price Index, which occur at specified times during the term of the lease. In certain commercial leases, variable lease income, such as percentage rent, is recognized when rents are earned. We recognize rental income and rental abatements from our commercial leases on a straight-line basis over the lease term. Recognition of rental income commences when control of the leased space has been transferred to the tenant.

We recognize variable income from pass-through expenses on an accrual basis over the periods in which the expenses were incurred. Pass-through expenses are comprised of real estate taxes, operating expenses and common area maintenance costs which are reimbursed by tenants in accordance with specific allowable costs per tenant lease agreements. When we pay pass-through expenses, subject to reimbursement by the tenant, they are included within operating expenses, excluding real estate taxes, and reimbursements are included within “real estate rental income” along with the associated base rent in the accompanying consolidated financial statements.

We record base rents on a straight-line basis. The monthly base rent income according to the terms of our leases is adjusted so that an average monthly rent is recorded for each tenant over the term of its lease. The straight-line rent adjustment increased revenue by $291 for the year ended December 31, 2023, and increased revenue by $302 for the year ended December 31, 2022. The straight-line receivable balance included in other assets on the consolidated balance sheets as of the year ended December 31, 2023 and 2022 was $3,686 and $3,756 respectively. We receive payments for expense reimbursements from substantially all our multi-tenant commercial tenants throughout the year based on estimates.

78

Table of Contents

STERLING REAL ESTATE TRUST AND SUBSIDIARIES

NOTES TO CONSOLIDATED FINANCIAL STATEMENTS

DECEMBER 31, 2023, 2022 AND 2021

(Dollar amounts in thousands, except share and per share data)

Lease income related to the Trust’s operating leases is comprised of the following:

Year ended December 31, 2023


Residential


Commercial


Total

(in thousands)

Lease income related to fixed lease payments

$

118,323

$

15,672

$

133,995

Lease income related to variable lease payments

4,430

4,430

Other (a)

(1,113)

166

(947)

Lease Income (b)

$

117,210

$

20,268

$

137,478

(a)For the year ended December 31, 2023, “Other” is comprised of revenue adjustments related to changes in collectability and amortization of above and below market lease intangibles and lease inducements.
(b)Excludes other rental income for the year ended December 31, 2023, of $6,153, which is accounted for under the revenue recognition standard.

Year ended December 31, 2022


Residential


Commercial


Total

(in thousands)

Lease income related to fixed lease payments

$

109,769

$

16,091

$

125,860

Lease income related to variable lease payments

4,510

4,510

Other (a)

(804)

332

(472)

Lease Income (b)

$

108,965

$

20,933

$

129,898

(c)For the year ended December 31, 2022, “Other” is comprised of revenue adjustments related to changes in collectability and amortization of above and below market lease intangibles and lease inducements.
(d)Excludes other rental income for the year ended December 31, 2022, of $5,162, which is accounted for under the revenue recognition standard.

Commercial space is rented under long-term agreements. Minimum future rentals on non-cancelable operating leases as of December 31, 2023 are as follows:

Years ending December 31,


Amount

(in thousands)

2024

$

15,444

2025

15,251

2026

14,918

2027

13,529

2028

12,062

Thereafter

43,403

$

114,607

NOTE 17 - COMMITMENTS AND CONTINGENCIES

Environmental Matters

Federal law (and the laws of some states in which we own or may acquire properties) imposes liability on a landowner for the presence on the premises of hazardous substances or wastes (as defined by present and future federal and state laws and regulations). This liability is without regard to fault or knowledge of the presence of such substances and may be imposed jointly and severally upon all succeeding landowners. If such hazardous substance is discovered on a property acquired by us, we could incur liability for the removal of the substances and the cleanup of the property.

There can be no assurance that we would have effective remedies against prior owners of the property. In addition, we may be liable to tenants and may find it difficult or impossible to sell the property either prior to or following such a cleanup.

79

Table of Contents

STERLING REAL ESTATE TRUST AND SUBSIDIARIES

NOTES TO CONSOLIDATED FINANCIAL STATEMENTS

DECEMBER 31, 2023, 2022 AND 2021

(Dollar amounts in thousands, except share and per share data)

Risk of Uninsured Property Losses

We maintain property damage, fire loss, and liability insurance. However, there are certain types of losses (generally of a catastrophic nature) which may be either uninsurable or not economically insurable. Such excluded risks may include war, earthquakes, tornados, certain environmental hazards, and floods. Should such events occur, (i) we might suffer a loss of capital invested, (ii) tenants may suffer losses and may be unable to pay rent for the spaces, and (iii) we may suffer a loss of profits which might be anticipated from one or more properties.

Litigation

The Company is subject, from time to time, to various legal proceedings and claims that arise in the ordinary course of business.  While the resolution of such matters cannot be predicted with certainty, management believes, based on currently available information, that the outcome of such matters will not have a material effect on the consolidated financial statements of the Trust.

NOTE 18 – DISPOSITIONS

During the year ended December 31, 2023, the Operating Partnership sold two properties. We sold a retail property located in Coon Rapids, Minnesota for a sale price of $3,448 and recognized a gain of $1,531 in May 2023. We sold an office property located in White Bear Lake, Minnesota for a sales price of $4,710 and recognized a gain of $1,066 in May 2023.

During the year ended December 31, 2022, the Operating Partnership sold five properties. We sold a retail property located in Savage, Minnesota for a sale price of $2,700 and recognized a gain of $1,328 in March 2022. We sold a residential property located in Moorhead, Minnesota for a sale price of $6,400 and recognized a gain of $2,012 in May 2022. We sold an office property located in Edina, Minnesota for a sale price of $15,320 and recognized a gain of $6,728 in August 2022. We sold a residential property located in East Grand Forks, MN for a sale price of $1,200 and recognized a loss of $171 in September 2022. We sold a retail property located in Bloomington, Minnesota for a sale price of $2,888 and recognized a gain of $1,193 in December 2022.

During the year ended December 31, 2021, the Operating Partnership sold two properties. We sold a retail property located in Waite Park, Minnesota, for a sale price of $900 and recognized a gain of $2 in April 2021. We sold a residential property located in Moorhead, Minnesota, for a sale price of $4,950 and recognized a gain of $1,708 in June 2021.

During the year ended December 31, 2023, the Company entered into a purchase agreement to sell one retail property located in Apple Valley, Minnesota. The property qualified for held for sale accounting treatment on or prior to December 31, 2023, at which time depreciation and amortization ceased.  As such, the assets and liabilities associated with this property were separately classified as held for sale in the consolidated balance sheet as of December 31, 2023. We expect to sell the property in the first quarter of 2024. The following table shows the net book value of assets held for sale.

80

Table of Contents

STERLING REAL ESTATE TRUST AND SUBSIDIARIES

NOTES TO CONSOLIDATED FINANCIAL STATEMENTS

DECEMBER 31, 2023, 2022 AND 2021

(Dollar amounts in thousands, except share and per share data)

December 31,

December 31,

2023


2022

(in thousands)

ASSETS

Real estate investments

Land and land improvements

$

845

$

Building and improvements

828

Real estate investments

1,673

Less accumulated depreciation

(110)

Real estate investments, net

1,563

Other assets, net

5

Total Assets

$

1,568

$

LIABILITIES

Accrued expenses and other liabilities

$

2

$

Total Liabilities

$

2

$

NOTE 19 –ACQUISITIONS

The Company did not acquire any properties during the year ended December 31, 2023.

The Company acquired the following properties during the year ended December 31, 2022.

Date

Property Name

Location

Property Type

Units/ Square Footage/ Acres

Purchase Price

2/28/22

Deer Park

Hutchinson, MN

Apartment Complex

138 units

$

15,073

5/31/22

Desoto Estates

Grand Forks, ND

Apartment Complex

68 units

5,863

5/31/22

Desoto Townhomes

Grand Forks, ND

Townhomes

24 units

3,226

5/31/22

Desoto Apartments

East Grand Forks, MN

Apartment Complex

24 units

1,230

6/10/22

Diamond Bend

Mandan, ND

Apartment Complex

78 units

10,919

9/13/22

Newgate Apartments

Bismarck, ND

Apartment Complex

46 units

2,444

12/1/22

Chandler 1898

Grand Forks, ND

Apartment Complex

12 units

498

12/29/22

Prose Fossil Creek

Fort Worth, TX

Apartment Complex

270 units

55,591

$

94,844

81

Table of Contents

STERLING REAL ESTATE TRUST AND SUBSIDIARIES

NOTES TO CONSOLIDATED FINANCIAL STATEMENTS

DECEMBER 31, 2023, 2022 AND 2021

(Dollar amounts in thousands, except share and per share data)

The acquisition of Prose Fossil Creek was made utilizing a Reverse 1031 Like-Kind Exchange that was entered into at closing. As such, as of December 29, 2022, Prose Fossil Creek is in the possession of a qualified intermediary engaged to execute the Reverse 1031 Like-Kind Exchange until the sale transaction and the Reverse 1031 Like-Kind Exchange are completed. The Trust retains essentially all of the legal and economic benefits and obligations related to Prose Fossil Creek prior to the completion of the Reverse 1031 Like-Kind Exchange. Accordingly, Prose Fossil Creek is included in the Trust’s consolidated financial statements as a consolidated VIE until legal title is transferred to the Trust upon completion of the Reverse 1031 Like-Kind Exchange.

Total consideration given for acquisitions for the year ended December 31, 2022 was completed through issuing approximately 560,000 limited partnership units of the operating partnership valued at $23.00 per unit for an aggregate consideration of approximately $12,870. The value of units issued in exchange for property is determined through a value established annually by our Board of Trustees and reflects the fair value at the time of issuance.

The Company acquired the following properties during the year ended December 31, 2021.

Date

Property Name

Location

Property Type

Units/ Square Footage/ Acres

Acquisition Price

6/1/21

Flagstone

Fargo, ND

Apartment complex

120 units

$

7,723

6/1/21

Brownstone

Fargo, ND

Apartment complex

72 units

4,362

6/1/21

Briar Pointe

Fargo, ND

Apartment complex

30 units

1,929

7/1/21

Oxford

Fargo, ND

Apartment complex

144 units

10,066

7/1/21

Pinehurst

Fargo, ND

Apartment complex

210 units

14,718

$

38,798

Total consideration given for acquisitions the year ended December 31, 2021 was completed through issuing approximately 144,000 limited partnership units of the operating partnership valued at $20.00 per unit for an aggregate consideration of approximately $2,883. The value of units issued in exchange for property is determined through a value established annually by our Board of Trustees and reflects the fair value at the time of issuance.

In 2022, cash flows were reclassified to updated presentation resulting prior period to be updated to align with reclassification. The following table summarizes the allocation of the purchase price, before prorations, the Company recorded in conjunction with the acquisitions discussed above:

Year Ended

December 31,

2023

2022

Real estate investment acquired

$

-

$

93,515

Acquired lease intangible assets

-

1,732

Assumed Assets

-

3

Total Assets Acquired

$

-

$

95,250

Other liabilities

-

(406)

Net assets acquired

-

94,844

Equity/limited partnership unit consideration

-

(12,870)

Net cash consideration

$

-

$

81,974

82

Table of Contents

STERLING REAL ESTATE TRUST AND SUBSIDIARIES

NOTES TO CONSOLIDATED FINANCIAL STATEMENTS

DECEMBER 31, 2023, 2022 AND 2021

(Dollar amounts in thousands, except share and per share data)

NOTE 20 - SUBSEQUENT EVENTS

On January 1, 2024 Megan Schreiner was appointed as President by the Board of Trustees.

On January 1, 2024 Luke Swenson was appointed as Chief Investment Officer by the Board of Trustees.

On January 16, 2024 we paid a dividend or distribution of $0.2875 per share on our common shares of beneficial interest or limited partnership units, to common shareholders and limited unit holders of record on December 31, 2023.

On January 25, 2024, the Trust disposed of a retail property located in Apple Valley, MN for a sales price of $1,600.

Pending acquisitions and dispositions are subject to numerous conditions and contingencies and there are no assurances that the transactions will be completed.

We have evaluated subsequent events through the date of this filing. We are not aware of any other subsequent events which would require recognition or disclosure in the consolidated financial statements.

83

Table of Contents

STERLING REAL ESTATE TRUST AND SUBSIDIARIES

SCHEDULE III – REAL ESTATE AND ACCUMULATED DEPRECIATION

DECEMBER 31, 2023

(Dollar amounts in thousands)

Life on

which

Costs

depreciation

capitalized

Date of

on latest

Initial cost

subsequent

Gross Amount at which

Construction

income

Industrial

to company

to acquisition (a)

carried at close of period

or

statement is

Property


Physical Location


Encumbrances


Land


Buildings


Land


Buildings


Land


Buildings


Total


Depreciation


Acquisition


computed

Guardian Building Products

Fargo, ND

$

2,406

$

820

$

2,554

$

60

$

(94)

$

880

$

2,460

$

3,340

$

703

08/29/2012

40

Titan Machinery

Bismarck, ND

2,005

950

1,395

32

982

1,395

2,377

314

01/28/2015

40

Titan Machinery

Dickinson, ND

1,761

354

1,096

400

754

1,096

1,850

324

07/30/2012

40

Titan Machinery

Fargo, ND

2,368

781

1,947

515

1,296

1,947

3,243

547

10/30/2012

40

Titan Machinery

Marshall, MN

4,533

300

3,648

81

381

3,648

4,029

1,117

11/01/2011

40

Titan Machinery

Minot, ND

618

1,654

618

1,654

2,272

472

08/01/2012

40

Titan Machinery

North Platte, NE

325

1,269

325

1,269

1,594

255

01/29/2016

40

Titan Machinery

Sioux City, IA

3,588

315

2,472

315

2,472

2,787

633

10/25/2013

40

Total

$

16,661

$

4,463

$

16,035

$

1,088

$

(94)

$

5,551

$

15,941

$

21,492

$

4,365


Life on

which

Costs

depreciation

capitalized

Date of

on latest

Initial cost

subsequent

Gross Amount at which

Construction

income

Land

to company

to acquisition (a)

carried at close of period

or

statement is

Property


Physical Location


Encumbrances


Land


Buildings


Land


Buildings


Land


Buildings


Total


Depreciation


Acquisition


computed

Taco Bell

Denver, CO

$

378

$

669

$

$

$

$

669

$

$

669

$

06/14/2011

Rochester Development Land

Rochester, MN

1,364

1,364

1,364

08/29/2016

Total

$

378

$

2,033

$

$

$

$

2,033

$

$

2,033

$


84

Table of Contents

STERLING REAL ESTATE TRUST AND SUBSIDIARIES

SCHEDULE III – REAL ESTATE AND ACCUMULATED DEPRECIATION

DECEMBER 31, 2023

(Dollar amounts in thousands)

Life on

which

Costs

depreciation

capitalized

Date of

on latest

Initial cost

subsequent

Gross Amount at which

Construction

income

Medical

to company

to acquisition (a)

carried at close of period

or

statement is

Property


Physical Location


Encumbrances


Land


Buildings


Land


Buildings


Land


Buildings


Total


Depreciation


Acquisition


computed

Bio-Life

Bismarck, ND

$

2,031

$

306

$

2,255

$

11

$

123

$

317

$

2,378

$

2,695

$

1,025

01/03/2008

9

-

40

Bio-Life

Grand Forks, ND

2,088

457

2,230

1

158

458

2,388

2,846

1,050

01/03/2008

10

-

40

Bio-Life

Janesville, WI

1,735

250

1,857

123

250

1,980

2,230

865

01/03/2008

9

-

40

Bio-Life

Mankato, MN

2,206

390

2,111

280

1,154

670

3,265

3,935

1,366

01/03/2008

11

-

40

Bio-Life

Marquette, MI

213

2,793

123

213

2,916

3,129

1,240

01/03/2008

9

-

40

Bio-Life

Onalaska, WI

1,675

208

1,853

323

208

2,176

2,384

935

01/03/2008

11

-

40

Bio-Life

Oshkosh, WI

1,722

293

1,705

146

293

1,851

2,144

828

01/03/2008

10

-

40

Bio-Life

Sheboygan, WI

1,965

623

1,611

248

623

1,859

2,482

811

01/03/2008

10

-

40

Bio-Life

Stevens Point, WI

1,879

119

2,184

123

119

2,307

2,426

996

01/03/2008

9

-

40

Total

$

15,301

$

2,859

$

18,599

$

292

$

2,521

$

3,151

$

21,120

$

24,271

$

9,116


Life on

which

Costs

depreciation

capitalized

Date of

on latest

Initial cost

subsequent

Gross Amount at which

Construction

income

Residential

to company

to acquisition (a)

carried at close of period

or

statement is

Property


Physical Location


Encumbrances


Land


Buildings


Land


Buildings


Land


Buildings


Total


Depreciation


Acquisition


computed

Amberwood

Grand Forks, ND

$

2,274

$

426

$

3,304

$

3

$

331

$

429

$

3,635

$

4,064

$

643

09/13/2016

20

-

40

Arbor I/400

Bismarck, ND

335

73

516

4

65

77

581

658

158

06/04/2013

40

Arbor II/404

Bismarck, ND

342

73

538

6

43

79

581

660

143

11/01/2013

40

Arbor III/406

Bismarck, ND

340

71

536

7

107

78

643

721

143

11/01/2013

40

Ashbury

Fargo, ND

2,214

314

3,774

26

25

340

3,799

4,139

674

12/19/2016

40

Auburn II

Fargo, ND

790

105

883

12

87

117

970

1,087

396

03/23/2007

20

-

40

Autumn Ridge

Grand Forks, ND

5,023

1,072

8,875

44

67

1,116

8,942

10,058

3,910

08/16/2004

9

-

40

Barrett Arms

Crookston, MN

690

37

1,001

177

37

1,178

1,215

271

01/02/2014

40

Bayview

Fargo, ND

2,179

284

3,447

59

2,020

343

5,467

5,810

1,628

12/31/2007

20

-

40

Belmont East and West

Bismarck, ND

708

167

1,424

2

8

169

1,432

1,601

138

03/1/2020

40

Berkshire

Fargo, ND

380

31

406

7

53

38

459

497

166

03/31/2008

20

-

40

Betty Ann

Fargo, ND

397

74

738

6

140

80

878

958

289

08/31/2009

40

Birchwood 1

Fargo, ND

220

72

342

4

42

76

384

460

56

12/01/2017

40

Birchwood 2

Fargo, ND

1,298

234

2,099

52

516

286

2,615

2,901

352

12/01/2017

40

Bradbury Apartments

Bismarck, ND

1,724

1,049

4,922

139

1,049

5,061

6,110

660

10/24/18

40

Briar Pointe

Fargo, ND

1,249

384

1,551

384

1,551

1,935

100

06/01/2021

40

Bridgeport

Fargo, ND

4,731

613

7,676

14

202

627

7,878

8,505

1,370

12/19/2016

40

Bristol Park

Grand Forks, ND

2,715

985

3,976

786

985

4,762

5,747

928

02/01/2016

40

Brookfield

Fargo, ND

1,887

228

1,958

30

318

258

2,276

2,534

819

08/01/2008

20

-

40

Brownstone

Fargo, ND

2,815

780

3,610

780

3,610

4,390

233

06/01/2021

40

Cambridge (FKA 44th Street)

Fargo, ND

1,563

333

1,845

4

237

337

2,082

2,419

533

02/06/2013

40

85

Table of Contents

STERLING REAL ESTATE TRUST AND SUBSIDIARIES

SCHEDULE III – REAL ESTATE AND ACCUMULATED DEPRECIATION

DECEMBER 31, 2023

(Dollar amounts in thousands)

Candlelight

Fargo, ND

1,483

613

1,221

(326)

589

287

1,810

2,097

457

11/30/2012

40

Carling Manor

Grand Forks, ND

477

69

656

1

61

70

717

787

268

03/31/2008

40

Carlton Place

Fargo, ND

5,629

703

7,070

96

736

799

7,806

8,605

2,773

09/01/2008

20

-

40

Carr

Fargo, ND

567

66

759

4

41

70

800

870

136

01/17/2017

40

Cedars 4

Fargo, ND

134

1,068

29

134

1,097

1,231

138

12/31/18

40

Chandler 1802

Grand Forks, ND

585

133

1,114

108

133

1,222

1,355

287

01/02/2014

40

Chandler 1834

Grand Forks, ND

382

112

552

51

112

603

715

76

9/1/18

40

Chandler 1866

Grand Forks, ND

303

31

270

59

31

329

360

139

01/03/2005

20

-

40

Chandler 1898

Grand Forks, ND

114

357

1

89

115

446

561

11

12/1/22

Cherry Creek (FKA Village)

Grand Forks, ND

173

1,435

1

459

174

1,894

2,068

578

11/01/2008

40

Cityside Apartments

Fargo, ND

647

192

1,129

6

62

198

1,191

1,389

160

11/30/18

40

Columbia Park Village I

Grand Forks, ND

281

102

546

102

546

648

55

01/31/2020

40

Columbia West

Grand Forks, ND

2,221

294

3,367

1

591

295

3,958

4,253

1,399

09/01/2008

20

-

40

Country Club

Fargo, ND

964

252

1,252

2

240

254

1,492

1,746

449

05/02/2011

20

-

40

Countryside

Fargo, ND

569

135

677

68

135

745

880

222

05/02/2011

40

Courtyard

St. Louis Park, MN

2,648

2,270

5,681

794

2,270

6,475

8,745

1,632

09/03/2013

5

-

40

Dakota Manor

Fargo, ND

1,308

249

2,236

20

228

269

2,464

2,733

546

08/07/2014

40

Danbury

Fargo, ND

4,427

381

5,869

211

827

592

6,696

7,288

2,493

12/31/2007

20

-

40

Dellwood Estates

Anoka, MN

5,904

844

9,924

861

844

10,785

11,629

2,742

05/31/2013

40

Deer Park

Hutchinson, MN

8,613

1,784

12,408

184

1,784

12,592

14,376

596

2/28/22

Desoto Estates

Grand Forks, ND

4,070

955

4,869

955

4,869

5,824

203

5/31/22

Desoto Townhomes

Grand Forks, ND

1,556

464

2,767

464

2,767

3,231

115

5/31/22

Diamond Bend

Mandan, ND

6,690

722

9,789

27

749

9,789

10,538

388

6/10/22

Eagle Run

West Fargo, ND

3,531

576

5,657

381

257

957

5,914

6,871

1,930

08/12/2010

40

Eagle Sky I

Bismarck, ND

115

1,292

104

115

1,396

1,511

283

03/01/2016

40

Eagle Sky II

Bismarck, ND

135

1,279

173

135

1,452

1,587

282

03/01/2016

40

East Bridge

Fargo, ND

3,049

792

5,396

1

301

793

5,697

6,490

914

07/03/2017

40

Eastbrook

Bismarck, ND

609

145

1,233

145

1,233

1,378

118

01/31/2020

40

Echo Manor

Hutchinson, MN

869

141

875

118

141

993

1,134

243

01/02/2014

20

-

40

Emerald Court

Fargo, ND

66

830

11

180

77

1,010

1,087

366

03/31/2008

20

-

40

Essex

Fargo, ND

503

212

642

77

212

719

931

116

06/01/2017

40

Evergreen Terrace

Omaha, NE

4,883

820

7,573

477

820

8,050

8,870

604

12/17/20

40

Fairview

Bismarck, ND

2,401

267

3,978

39

918

306

4,896

5,202

1,651

12/31/2008

20

-

40

Flagstone

Fargo, ND

4,977

1,535

6,258

1,535

6,258

7,793

404

06/01/2021

40

Flickertail

Fargo, ND

5,957

426

5,590

76

1,674

502

7,264

7,766

2,343

12/31/2008

40

Forest Avenue

Fargo, ND

310

61

637

8

64

69

701

770

184

02/06/2013

40

Foxtail Creek Townhomes

Fargo, ND

267

1,221

267

1,221

1,488

102

09/15/2020

40

Galleria III

Fargo, ND

640

118

681

2

335

120

1,016

1,136

261

11/09/2010

40

Garden Grove

Bismarck, ND

3,983

606

6,073

168

606

6,241

6,847

1,207

05/04/2016

5

-

40

Georgetown on the River

Fridley, MN

16,046

4,620

23,792

8

6,350

4,628

30,142

34,770

6,178

12/19/2014

5

-

40

Glen Pond

Eagan, MN

34,765

3,761

20,569

38

1,031

3,799

21,600

25,399

6,386

12/02/2011

20

-

40

Glen Pond Addition

Eagan, MN

5,931

876

15,408

876

15,408

16,284

1,284

09/30/2020

40

Granger Court I

Fargo, ND

1,820

279

1,926

25

439

304

2,365

2,669

539

06/04/2013

20

-

40

Hannifin

Bismarck, ND

385

81

607

5

110

86

717

803

164

11/01/2013

40

Harrison and Richfield

Grand Forks, ND

756

6,346

7

587

763

6,933

7,696

2,748

07/01/2007

5

-

40

86

Table of Contents

STERLING REAL ESTATE TRUST AND SUBSIDIARIES

SCHEDULE III – REAL ESTATE AND ACCUMULATED DEPRECIATION

DECEMBER 31, 2023

(Dollar amounts in thousands)

Hartford Apartments

Fargo, ND

808

154

1,233

14

154

1,247

1,401

163

10/1/18

40

Hawn

Fargo, ND

1,444

280

2,277

244

280

2,521

2,801

219

03/01/2020

40

Highland Meadows

Bismarck, ND

5,338

1,532

8,513

675

1,532

9,188

10,720

1,504

05/01/2017

5

-

40

Hunters Run I

Fargo, ND

457

50

419

5

(2)

55

417

472

174

03/23/2007

40

Hunters Run II

Fargo, ND

403

44

441

2

46

441

487

171

07/01/2008

40

Huntington

Fargo, ND

297

86

309

4

15

90

324

414

68

08/04/2015

40

Islander

Fargo, ND

700

98

884

49

326

147

1,210

1,357

300

07/01/2011

40

Jadestone

Fargo, ND

477

212

554

136

212

690

902

108

06/01/2017

40

Kennedy

Fargo, ND

338

84

588

7

91

91

679

770

179

02/06/2013

20

-

40

Library Lane

Grand Forks, ND

1,938

301

2,332

20

189

321

2,521

2,842

1,002

10/01/2007

20

-

40

Madison

Grand Forks, ND

260

95

497

111

95

608

703

117

09/01/2015

40

Maple Ridge

Omaha, NE

7,583

766

5,608

59

3,715

825

9,323

10,148

2,828

08/01/2008

20

-

40

Maplewood

Maplewood, MN

8,310

3,120

11,655

7

2,970

3,127

14,625

17,752

2,900

12/19/2014

5

-

40

Maplewood Bend I, II, III. IV, V, VI, VII, VIII & Royale

Fargo, ND

4,049

783

5,839

1

670

784

6,509

7,293

2,064

01/01/2009

20

-

40

Martha Alice

Fargo, ND

397

74

738

6

183

80

921

1,001

303

08/31/2009

20

-

40

Mayfair

Grand Forks, ND

80

1,043

5

123

85

1,166

1,251

423

07/01/2008

20

-

40

Monticello

Fargo, ND

510

60

752

8

111

68

863

931

206

11/08/2013

20

-

40

Montreal Courts

Little Canada, MN

26,661

5,809

19,565

15

3,618

5,824

23,183

29,007

5,552

10/02/2013

5

-

40

Morningside Apartments

Fargo, ND

439

85

673

42

85

715

800

89

11/30/18

40

Newgate

Bismarck, ND

1,467

538

1,755

19

30

557

1,785

2,342

59

9/13/22

Oak Court

Fargo, ND

2,422

270

2,210

29

436

299

2,646

2,945

966

04/30/2008

28

-

40

Oakview Townhomes

Grand Forks, ND

3,353

822

4,698

471

822

5,169

5,991

899

01/11/2017

40

Oxford

Fargo, ND

6,504

1,655

8,563

1,655

8,563

10,218

535

07/01/2021

40

Pacific Park I

Fargo, ND

503

95

777

3

130

98

907

1,005

227

02/06/2013

40

Pacific Park II

Fargo, ND

431

111

865

4

140

115

1,005

1,120

250

02/06/2013

40

Pacific South

Fargo, ND

266

58

459

2

56

60

515

575

126

02/06/2013

40

Park Circle

Fargo, ND

523

196

716

7

17

203

733

936

121

06/01/2017

40

Parkview Arms

Bismarck, ND

373

3,845

365

373

4,210

4,583

889

05/13/2015

5

-

40

Parkwest Gardens

West Fargo, ND

2,815

713

5,712

39

1,450

752

7,162

7,914

1,578

06/30/2014

20

-

40

Parkwood

Fargo, ND

126

1,143

14

203

140

1,346

1,486

438

08/01/2008

40

Pebble Creek

Bismarck, ND

260

2,302

31

(62)

291

2,240

2,531

825

03/19/2008

20

-

40

Pinehurst

Fargo, ND

9,461

2,368

12,614

2,368

12,614

14,982

788

07/01/2021

40

Plumtree

Fargo, ND

502

100

782

29

100

811

911

135

05/01/2017

40

Prairiewood Courts

Fargo, ND

308

1,730

28

203

336

1,933

2,269

773

09/01/2006

20

-

40

Prairiewood Meadows

Fargo, ND

3,675

736

761

11

3,211

747

3,972

4,719

302

09/30/2012

40

Cobalt Apartments

Fort Worth, TX

27,500

5,451

46,811

5,451

46,811

52,262

1,268

12/29/22

Quail Creek

Springfield, MO

4,967

1,529

7,396

1,656

1,529

9,052

10,581

1,763

02/03/2015

5

-

40

Robinwood

Coon Rapids, MN

4,011

1,380

6,133

711

1,380

6,844

8,224

1,509

12/19/2014

40

Rosedale Estates

Roseville, MN

13,501

4,680

20,591

1,016

4,680

21,607

26,287

4,831

12/19/2014

5

-

40

Rosegate

Fargo, ND

2,798

251

2,978

49

132

300

3,110

3,410

1,214

04/30/2008

20

-

40

Rosser

Bismarck, ND

656

156

1,216

109

156

1,325

1,481

122

03/01/2020

40

Roughrider

Grand Forks, ND

357

100

448

117

100

565

665

107

08/01/2016

5

-

40

Saddlebrook

West Fargo, ND

1,252

148

1,262

203

105

351

1,367

1,718

497

12/31/2008

40

Sage Park

New Brighton, MN

9,039

2,520

13,985

1,176

2,520

15,161

17,681

3,419

12/19/2014

5

-

40

Sargent

Fargo, ND

905

164

1,529

4

17

168

1,546

1,714

272

01/10/2017

40

87

Table of Contents

STERLING REAL ESTATE TRUST AND SUBSIDIARIES

SCHEDULE III – REAL ESTATE AND ACCUMULATED DEPRECIATION

DECEMBER 31, 2023

(Dollar amounts in thousands)

Schrock

Fargo, ND

408

71

626

3

66

74

692

766

170

06/04/2013

40

Sheridan Pointe

Fargo, ND

1,914

292

2,387

21

96

313

2,483

2,796

608

10/01/2013

40

Sierra Ridge

Bismarck, ND

6,365

754

8,795

151

917

905

9,712

10,617

3,233

09/01/2006

40

Somerset

Fargo, ND

300

3,400

43

189

343

3,589

3,932

1,324

07/01/2008

40

Southgate

Fargo, ND

4,632

803

5,267

20

64

823

5,331

6,154

2,149

07/01/2007

20

-

40

Southview III

Grand Forks, ND

99

522

3

116

102

638

740

186

08/01/2011

40

Southview Villages

Fargo, ND

2,297

268

2,483

16

715

284

3,198

3,482

1,099

10/01/2007

20

-

40

Spring

Fargo, ND

410

76

822

75

24

151

846

997

232

02/06/2013

20

-

40

Stanford Court

Grand Forks, ND

291

3,854

630

291

4,484

4,775

1,107

02/06/2013

20

-

40

Stonefield-Phase I

Bismarck, ND

7,212

2,804

10,043

227

802

3,031

10,845

13,876

2,337

08/01/2014

20

-

40

Stonefield-Phase II

Bismarck, ND

4,667

1,201

3,678

486

5,754

1,687

9,432

11,119

1,581

10/23/2014

40

Stonefield-Phase III

Bismarck, ND

1,079

238

1,317

1,317

10/23/2014

n/a

Stonybrook

Omaha, NE

5,867

1,439

8,003

1,586

1,439

9,589

11,028

3,335

01/20/2009

20

-

40

Summerfield

Fargo, ND

450

129

599

6

82

135

681

816

138

08/04/2015

40

Summit Point

Fargo, ND

3,161

681

5,434

22

450

703

5,884

6,587

1,169

10/01/2015

20

-

40

Sunchase

Fargo, ND

984

181

1,563

14

86

195

1,649

1,844

276

05/01/2017

40

Sunset Ridge

Bismarck, ND

10,516

1,759

9,529

36

146

1,795

9,675

11,470

3,468

06/06/2008

9

-

40

Sunview

Grand Forks, ND

144

1,578

3

241

147

1,819

1,966

634

12/31/2008

20

-

40

Sunwood

Fargo, ND

2,716

358

3,252

38

589

396

3,841

4,237

1,401

07/01/2007

20

-

40

Thunder Creek

Fargo, ND

2,567

633

4,063

1

634

634

4,697

5,331

649

03/1/2018

25

-

40

Twin Oaks

Hutchinson, MN

5,012

816

3,245

156

816

3,401

4,217

778

10/01/2014

40

Twin Parks

Fargo, ND

1,820

119

2,072

43

227

162

2,299

2,461

815

10/01/2008

20

-

40

Valley Homes Duplexes

Grand Forks, ND

953

356

1,668

431

356

2,099

2,455

446

01/22/2015

40

Valley View

Golden Valley, MN

3,987

1,190

6,076

468

1,190

6,544

7,734

1,439

12/19/2014

5

-

40

Village Park

Fargo, ND

573

219

1,852

51

80

270

1,932

2,202

745

04/30/2008

40

Village West

Fargo, ND

2,069

357

2,274

61

127

418

2,401

2,819

896

04/30/2008

40

Washington

Grand Forks, ND

329

74

592

76

74

668

742

125

05/04/2016

40

Westcourt

Fargo, ND

2,222

287

2,914

28

353

315

3,267

3,582

782

01/02/2014

5

-

40

West Oak

Fargo, ND

592

85

692

47

73

132

765

897

135

01/17/2017

40

Westside

Hawley, MN

435

59

360

116

59

476

535

139

02/01/2010

40

Westwind

Fargo, ND

532

49

455

1

95

50

550

600

222

04/30/2008

20

-

40

Westwood

Fargo, ND

2,865

597

6,341

91

849

688

7,190

7,878

2,558

06/05/2008

20

-

40

Willow Park

Fargo, ND

4,911

288

5,286

39

812

327

6,098

6,425

2,095

12/31/2008

40

Wolf Creek

Fargo, ND

2,888

1,082

4,210

28

1,082

4,238

5,320

427

01/12/2020

40

Woodland Pines

Omaha, NE

5,920

842

10,596

1,373

842

11,969

12,811

1,501

11/30/18

40

Total

$

420,448

$

93,455

$

586,032

$

3,320

$

68,203

$

96,775

$

654,235

$

751,010

$

138,262

88

Table of Contents

STERLING REAL ESTATE TRUST AND SUBSIDIARIES

SCHEDULE III – REAL ESTATE AND ACCUMULATED DEPRECIATION

DECEMBER 31, 2023

(Dollar amounts in thousands)

Life on

which

Costs

depreciation

capitalized

Date of

on latest

Initial cost

subsequent

Gross Amount at which

Construction

income

Office

to company

to acquisition (a)

carried at close of period

or

statement is

Property


Physical Location


Encumbrances


Land


Buildings


Land


Buildings


Land


Buildings


Total


Depreciation


Acquisition


computed

Bluemont Lakes Financial Center

Fargo, ND

$

4,631

$

635

$

3,298

$

87

$

269

$

722

$

3,567

$

4,289

$

1,819

03/16/2004

3

-

40

Bell Plaza

Bloomington, MN

29,852

6,912

34,343

5,149

6,912

39,492

46,404

13,089

08/13/2015

3

-

40

Trustmark

Fargo, ND

6,746

2,089

4,718

14

6,545

2,103

11,263

13,366

1,276

08/28/2020

40

First International Bank & Trust

Moorhead, MN

210

642

5

1,046

215

1,688

1,903

244

05/13/2011

10

-

40

Four Points

Fargo, ND

70

1,238

11

175

81

1,413

1,494

567

10/18/2007

5

-

40

Gate City

Grand Forks, ND

382

893

1

955

383

1,848

2,231

465

03/31/2008

40

Goldmark Office Park

Fargo, ND

12,001

1,160

11,788

65

8,832

1,225

20,620

21,845

5,811

07/01/2007

1

-

40

Great American Bldg

Fargo, ND

1,018

511

1,290

22

447

533

1,737

2,270

803

02/01/2005

28

-

40

Midtown Plaza

Minot, ND

1,068

30

1,213

97

30

1,310

1,340

602

01/01/2004

5

-

40

Parkway office building (FKA Echelon)

Fargo, ND

1,572

278

1,491

42

82

320

1,573

1,893

654

05/15/2007

9

-

40

Wells Fargo Center

Duluth, MN

600

2,765

(115)

2,785

485

5,550

6,035

1,992

07/11/2007

4

-

40

Total

$

56,888

$

12,877

$

63,679

$

132

$

26,382

$

13,009

$

90,061

$

103,070

$

27,322


Life on

which

Costs

depreciation

capitalized

Date of

on latest

Initial cost

subsequent

Gross Amount at which

Construction

income

Retail

to company

to acquisition (a)

carried at close of period

or

statement is

Property


Physical Location


Encumbrances


Land


Buildings


Land


Buildings


Land


Buildings


Total


Depreciation


Acquisition


computed

Dairy Queen

Apple Valley, MN

845

828

845

828

1,673

110

9/17/18

40

Dairy Queen

Dickinson, ND

329

658

1

330

658

988

197

01/19/2012

40

Dairy Queen

Moorhead, MN

243

787

2

245

787

1,032

249

05/13/2011

20

Family Dollar

Mandan, ND

167

649

54

167

703

870

216

12/14/2010

40

OReilly

Mandan, ND

115

449

27

115

476

591

150

12/14/2010

40

Walgreens

Alexandria, LA

1,090

2,973

1,090

2,973

4,063

1,043

12/18/2009

28

-

40

Walgreens

Batesville, AR

4,341

473

6,405

473

6,405

6,878

2,322

07/09/2009

40

Walgreens

Denver, CO

2,900

2,349

2,358

2,349

2,358

4,707

742

06/14/2011

40

Walgreens

Fayetteville, AR

3,245

636

4,732

636

4,732

5,368

1,715

07/09/2009

40

Walgreens

Laurel, MS

1,280

2,984

1,280

2,984

4,264

1,007

07/30/2010

40

Total

$

10,486

$

7,527

$

22,823

$

3

$

81

$

7,530

$

22,904

$

30,434

$

7,751

Grand Totals

$

520,162

$

123,214

$

707,168

$

4,835

$

97,093

$

128,049

$

804,261

$

932,310

$

186,816


89

Table of Contents

STERLING REAL ESTATE TRUST AND SUBSIDIARIES

SCHEDULE III – REAL ESTATE AND ACCUMULATED DEPRECIATION

DECEMBER 31, 2023

(Dollar amounts in thousands)

Notes:

(a)The costs capitalized subsequent to acquisition is net of dispositions.
(b)The changes in total real estate investments for the years ended December 31, 2023, 2022 and 2021 are as follows (in thousands):

2023

2022

2021

Balance at January 1,

$

971,148

$

896,702

$

845,288

Purchase of real estate investments

11,875

103,252

63,299

Sale and disposal of real estate investment

(11,485)

(26,960)

(8,184)

Property held for sale

(1,673)

1,578

Provision for asset impairment

(561)

Construction in progress not yet placed in service

939

(1,285)

(5,279)

Balance at December 31,

$

970,804

$

971,148

$

896,702

(c)The changes in accumulated depreciation for the years ended December 31, 2023, 2022 and 2021 are as follows (in thousands):

2023

2022

2021

Balance at January 1,

$

194,849

$

179,155

$

160,575

Depreciation expense

23,257

22,161

20,917

Property held for sale

(110)

749

Sale and disposal of real estate investment

(3,412)

(6,467)

(3,086)

Balance at December 31,

$

214,584

$

194,849

$

179,155

(d)The aggregate cost of our real estate for federal income tax purposes is $745,494.

90

Table of Contents

Exhibit Index

Filed

Incorporated by reference

Exhibit

here

Period

Filing

number


Exhibit Description


with


Form


ending


Exhibit


Date

3.1

Articles of Organization of Sterling Real Estate Trust filed December 3, 2002

10-12G

3.1

03/10/11

3.2

Amendment to Articles of Organization of Sterling Real Estate Trust dated August 1, 2014

8-K

5.02

06/24/14

3.3

Amended and Restated Bylaws dated June 2, 2020

8-K

3.1

06/03/20

4.1

Sterling Third Amended and Restated Declaration of Trust dated June 23, 2016

8-K

4.1

06/29/16

4.2

Amended and Restated Share Redemption Plan effective January 1, 2021

8-K

10.1

09/29/21

4.3

Amended and Restated Unit Repurchase Plan effective January 1, 2021

8-K

10.2

09/29/21

4.4

Description of Registrant’s Securities

10-K

12/31/2019

4.11

03/13/20

10.1

Third Amended and Restated Agreement of Limited Liability Limited Partnership of Sterling Properties, LLLP dated January 1, 2014

8-K

5.04

06/24/14

10.2

Amended and Restated Dividend Reinvestment Plan effective June 25, 2020

8-K

10.3

06/30/20

10.3

Amendment to Certificate of Limited Liability Partnership of Sterling Properties, LLLP dated August 1, 2014

8-K

5.03

06/24/14

10.4

Form of Secured Promissory Note (15-Year Note) dated as of December 19, 2014

8-K

10.3

12/23/14

10.5

Form of Secured Promissory Note (10-Year Note) dated as of December 19, 2014

8-K

10.4

12/23/14

10.6

Form of Mortgage, Security Agreement and Fixture Filing dated as of December 19, 2014

8-K

10.5

12/23/14

10.7

Form of Promissory Note dated as of December 19, 2014

8-K

10.6

12/23/14

10.8

Form of Mortgage dated as of December 19, 2014

8-K

10.7

12/23/14

10.9

Form of Commercial Security Agreement dated as of December 19, 2014

8-K

10.8

12/23/14

10.10

Amended and Restated Sterling Real Estate Trust Independent Trustee Common Shares Plan approved June 18, 2015

8-K

10.1

06/23/15

10.11

Form of Promissory Note dated as of August 13, 2015

8-K

10.2

08/18/15

10.12

Form of Mortgage, Security Agreement and Fixture Filing dated as of August 13, 2015

8-K

10.3

08/18/15

10.13

Amendment No. 1 to Amended and Restated Independent Trustee Stock Plan

8-K

99.3

04/04/18

10.14

Amended and Restated Sterling Real Estate Trust Independent Trustee Common Shares Plan dated March 25, 2021

8-K

10.1

03/31/21

10.15

Twelfth Amended and Restated Advisory Agreement, dated April 1, 2023

8-K

10.1

03/27/23

10.16

Bell Bank Promissory Note, dated December 29, 2022 between Bell Bank and Sterling Properties, LLLP, together with commercial Guaranty of Sterling Real Estate Trust, dated December 29, 2022

8-K

10.1

01/04/23

16.1

Letter of Baker Tilly US, LLP dated March 31, 2021 to the SEC regarding statements in Item 4.01(a)

8-K

16.1

03/31/21

21.1

Subsidiaries of Registrant

X

23.1

Consent of Independent Registered Public Accounting Firm - RSM, LLP

X

31.1

Section 302 Certification of Chief Executive Officer

X

31.2

Section 302 Certification of Chief Financial Officer

X

32.1

Section 906 Certification of Chief Executive Officer and Chief Financial Officer

X

101

The following materials from Sterling Real Estate Trust’s Annual Report on Form 10-K for the year ended December 31, 2023, formatted in XBRL (eXtensible Business Reporting Language): (i) Consolidated Balance Sheets at December 31, 2023 and 2022; (ii) Consolidated Statements of Operations and Comprehensive Income for years ended December 31, 2023, 2022 and 2021; (iii) Consolidated Statements of Shareholders’ Equity for the years ended December 31, 2023, 2022 and 2021; (iv) Consolidated Statements of Cash Flows for the years ended December 31, 2023, 2022 and 2021, and; (v) Notes to Consolidated Financial Statements

X

104

Cover Page Interactive Data File, formatted in IXBRL and contained in Exhibit 101

X

91

Table of Contents

SIGNATURES

Pursuant to the requirements of Section 13 or 15(d) of the Securities Exchange Act of 1934, the registrant has duly caused the report to be signed on its behalf by the undersigned, thereunto duly authorized.

Dated: March 13, 2024


STERLING REAL ESTATE TRUST

By:

/s/ Kenneth P. Regan

Kenneth P. Regan

Chief Executive Officer

(Principal Executive Officer)

Pursuant to the requirements of the Securities Exchange Act of 1934, this report has been signed below by the following persons on behalf of the registrant and in the capacities and on the dates indicated.

Signature


Title


Date

/s/ Kenneth P. Regan

(Kenneth P. Regan)

Chief Executive Officer and Trustee
(Principal Executive Officer)

March 13, 2024

/s/ Damon K. Gleave

(Damon K. Gleave)

Chief Financial Officer and Treasurer
(Principal Financial Officer)

March 13, 2024

/s/ Lance R. Wolf

(Lance R. Wolf)

Chairman of the Board of Trustees

March 13, 2024

/s/ Ann L. Christenson

(Ann L. Christenson)

Trustee

March 13, 2024

/s/ Timothy L. Haugen

(Timothy L. Haugen)

Trustee

March 13, 2024

/s/ Timothy A. Hunt

(Timothy A. Hunt)

Trustee

March 13, 2024

/s/ Michelle L. Korsmo

(Michelle L. Korsmo)

Trustee

March 13, 2024

/s/ Mark T. Polovitz

(Mark T. Polovitz)

Trustee

March 13, 2024

/s/ James S. Wieland

(James S. Wieland)

Trustee

March 13, 2024

92