| Retail | Vanguard Market Neutral Fund | ||||||||||||||||||||||||||||||||||||||||||
| Fund Summary | ||||||||||||||||||||||||||||||||||||||||||
| Investment Objective | ||||||||||||||||||||||||||||||||||||||||||
| The Fund seeks to provide long-term capital appreciation while limiting exposure to general stock market risk. | ||||||||||||||||||||||||||||||||||||||||||
| Fees and Expenses | ||||||||||||||||||||||||||||||||||||||||||
| The following table describes the fees and expenses you may pay if you buy and hold Investor Shares of the Fund. | ||||||||||||||||||||||||||||||||||||||||||
| Shareholder Fees (Fees paid directly from your investment) | ||||||||||||||||||||||||||||||||||||||||||
| ||||||||||||||||||||||||||||||||||||||||||
| Annual Fund Operating Expenses (Expenses that you pay each year as a percentage of the value of your investment) | ||||||||||||||||||||||||||||||||||||||||||
| ||||||||||||||||||||||||||||||||||||||||||
| Example | ||||||||||||||||||||||||||||||||||||||||||
| The following example is intended to help you compare the cost of investing in the Fund’s Investor Shares with the cost of investing in other mutual funds. It illustrates the hypothetical expenses that you would incur over various periods if you were to invest $10,000 in the Fund’s shares. This example assumes that the shares provide a return of 5% each year and that total annual fund operating expenses remain as stated in the preceding table. You would incur these hypothetical expenses whether or not you redeem your investment at the end of the given period. Although your actual costs may be higher or lower, based on these assumptions your costs would be: | ||||||||||||||||||||||||||||||||||||||||||
| ||||||||||||||||||||||||||||||||||||||||||
| Portfolio Turnover | ||||||||||||||||||||||||||||||||||||||||||
| The Fund pays transaction costs, such as commissions, when it buys and sells securities (or “turns over” its portfolio). A higher portfolio turnover rate may indicate higher transaction costs and may result in more taxes when Fund shares are held in a taxable account. These costs, which are not reflected in annual fund operating expenses or in the previous expense example, reduce the Fund’s performance. During the most recent fiscal year, the Fund’s portfolio turnover rate was 79% of the average value of its portfolio. | ||||||||||||||||||||||||||||||||||||||||||
| Principal Investment Strategies | ||||||||||||||||||||||||||||||||||||||||||
| The Fund follows a market neutral strategy, which the Fund defines as a strategy designed to produce a portfolio that is neutral with respect to general stock market risk (sometimes referred to as beta neutrality). Beta is a measure of a portfolio’s volatility relative to the volatility of the general stock market. The Fund, as a whole, does not seek to adhere to any other definition of market neutrality. To implement the strategy, the advisor buys securities that it believes offer an appropriate balance between strong growth prospects and reasonable valuations relative to their industry peers and sells short securities that it considers to be overvalued, in amounts that it believes will achieve market neutrality. By taking long and short positions in different securities, the Fund attempts to limit the effect of market movements on portfolio performance. The advisor does this by using a quantitative process and may, at any time, buy or sell short any number of publicly traded, exchange-listed equity securities and may emphasize specific industries, styles (growth/value), capitalization ranges, countries, or other factors. The overall performance of the Fund depends on the net performance of its long and short positions, and it is possible for the Fund to experience a net loss across all positions. If the Fund’s investment strategy is successful, however, the net performance of its long and short positions will produce long-term capital appreciation that reflects the quality of the advisor’s security selections, with limited exposure to general stock market risk. The Fund’s long/short market neutral investment strategy is an absolute-return investment approach seeking performance that exceeds the returns of 3-month U.S. Treasury bills. An investment in the Fund, however, is different from an investment in 3-month U.S. Treasury bills because, among other things, U.S. Treasury bills are backed by the full faith and credit of the U.S. government, U.S. Treasury bills have a fixed rate of return, investors in U.S. Treasury bills have a very low risk of losing their investment, and an investment in the Fund is expected to be substantially more volatile than an investment in U.S. Treasury bills. Because of the Fund’s market neutral strategy, the Fund’s overall price movements are not expected to correlate with the general stock market’s price movements. In other words, the Fund is expected to have returns that are independent of the returns and direction of the general stock market. | ||||||||||||||||||||||||||||||||||||||||||
| Principal Risks | ||||||||||||||||||||||||||||||||||||||||||
| An investment in the Fund could lose money over short or long periods of time, and the entire amount invested could be lost. There can be no assurance that the Fund’s investment objective or strategies will be achieved, and results may vary substantially over time. The Fund is subject to the following risks, which could affect the Fund’s performance: • Strategy risk, which is the chance that the Fund’s investment strategy will not succeed. There is no guarantee that the Fund will be able to limit exposure to general stock market risk or produce returns that exceed the returns of 3-month U.S. Treasury bills. The Fund’s use of short sales in combination with its long positions in an attempt to improve performance or to reduce overall portfolio risk may not be successful and may result in greater losses or lower positive returns than if the Fund held only long positions. When the general stock market is performing strongly, the Fund is expected to underperform the market because the Fund’s short positions will likely lose money. If the Fund’s market neutral strategy is unsuccessful, the Fund may be subject to stock market risk, which is the chance that stock prices overall will decline. Stock markets tend to move in cycles, with periods of rising prices and periods of falling prices. • Short-selling risk, which is the chance that the Fund will lose money in connection with its short sales of securities. Short selling allows an investor to profit from declines in the prices of securities. To engage in a short sale, the Fund must “borrow” securities for a fee. To close out short positions, the Fund may have to sell related long positions at disadvantageous times to produce cash to unwind a short position. There is no guarantee that the price of the borrowed securities will decline; in fact, it may rise. The Fund’s loss on a short sale is theoretically unlimited, because there is no upward limit on the price a borrowed security could attain. Short selling involves higher transaction costs than long-only investing, which could offset any gains and increase any losses. • Manager risk, which is the chance that poor security selection or strategy execution will cause the Fund to fail to achieve its investment objective or to underperform other funds with a similar investment strategy. The advisor’s security selection process may not eliminate all stock market risk factors associated with the long and short positions it establishes for the Fund. It is possible that the stocks the Fund holds long will decline in value at the same time that the stocks it holds short increase in value, thereby increasing potential losses to the Fund. Any gain from a short position may be partially or totally offset by a decline in a long position, or vice versa. • Investment risk, which is the chance that the types of securities purchased by the Fund will, intentionally or unintentionally, increase the Fund’s sensitivity to certain investment factors. These factors may include, but are not limited to, market capitalization ranges, styles (growth/value), and industries of the underlying securities. These factors may cause the Fund to fail to achieve its investment objective of limiting exposure to general stock market risk or cause it to underperform other funds with a similar investment strategy. • Derivatives risk. The Fund may invest in derivatives, which may involve risks different from, and possibly greater than, those of investments directly in the underlying securities or assets. An investment in the Fund is not a deposit of a bank and is not insured or guaranteed by the Federal Deposit Insurance Corporation or any other government agency. | ||||||||||||||||||||||||||||||||||||||||||
| Annual Total Returns | ||||||||||||||||||||||||||||||||||||||||||
| The following bar chart and table are intended to help you understand the risks of investing in the Fund. The bar chart shows how the performance of the Fund‘s Investor Shares has varied from one calendar year to another over the periods shown. The table shows how the average annual total returns of the Investor Shares compare with those of a relevant market index and other comparative benchmarks, which have investment characteristics similar to those of the Fund. Returns for the Equity Market Neutral Funds Average are derived from data provided by Lipper, a Thomson Reuters Company. Keep in mind that the Fund’s past performance (before and after taxes) does not indicate how the Fund will perform in the future. Updated performance information is available on our website at vanguard.com/performance or by calling Vanguard toll-free at 800-662-7447. | ||||||||||||||||||||||||||||||||||||||||||
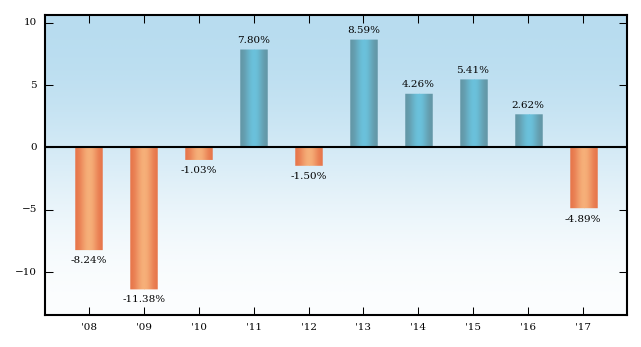
| Annual Total Returns — Vanguard Market Neutral Fund Investor Shares | ||||||||||||||||||||||||||||||||||||||||||
| ||||||||||||||||||||||||||||||||||||||||||
| During the periods shown in the bar chart, the highest return for a calendar quarter was 7.04% (quarter ended September 30, 2015), and the lowest return for a quarter was –6.54% (quarter ended March 31, 2009). | ||||||||||||||||||||||||||||||||||||||||||
| Average Annual Total Returns for Periods Ended December 31, 2017 | ||||||||||||||||||||||||||||||||||||||||||
| ||||||||||||||||||||||||||||||||||||||||||
| Actual after-tax returns depend on your tax situation and may differ from those shown in the preceding table. When after-tax returns are calculated, it is assumed that the shareholder was in the highest individual federal marginal income tax bracket at the time of each distribution of income or capital gains or upon redemption. State and local income taxes are not reflected in the calculations. Please note that after-tax returns are not relevant for a shareholder who holds fund shares in a tax-deferred account, such as an individual retirement account or a 401(k) plan. Also, figures captioned Return After Taxes on Distributions and Sale of Fund Shares may be higher than other figures for the same period if a capital loss occurs upon redemption and results in an assumed tax deduction for the shareholder. | ||||||||||||||||||||||||||||||||||||||||||
