| Oppenheimer Global Focus Fund | |||||||||||||||||||||||||||||||||||||||||||||||||||||||||||||||||
| The Fund Summary | |||||||||||||||||||||||||||||||||||||||||||||||||||||||||||||||||
| Investment Objective. | |||||||||||||||||||||||||||||||||||||||||||||||||||||||||||||||||
| The Fund seeks capital appreciation. | |||||||||||||||||||||||||||||||||||||||||||||||||||||||||||||||||
| Fees and Expenses of the Fund. | |||||||||||||||||||||||||||||||||||||||||||||||||||||||||||||||||
| This table describes the fees and expenses that you may pay if you buy and hold or redeem shares of the Fund. You may qualify for sales charge discounts if you (or you and your spouse) invest, or agree to invest in the future, at least $25,000 in certain funds in the Oppenheimer family of funds. More information about these and other discounts and sales charge waivers is available from your financial professional and in the section “About Your Account” beginning on page 16 of the prospectus, in the appendix to the prospectus titled “Special Sales Charge Arrangements and Waivers” and in the section “How to Buy Shares” beginning on page 51 in the Fund’s Statement of Additional Information. | |||||||||||||||||||||||||||||||||||||||||||||||||||||||||||||||||
| Shareholder Fees (fees paid directly from your investment) | |||||||||||||||||||||||||||||||||||||||||||||||||||||||||||||||||
| |||||||||||||||||||||||||||||||||||||||||||||||||||||||||||||||||
| Annual Fund Operating Expenses (expenses that you pay each year as a percentage of the value of your investment) | |||||||||||||||||||||||||||||||||||||||||||||||||||||||||||||||||
| |||||||||||||||||||||||||||||||||||||||||||||||||||||||||||||||||
| Example. | |||||||||||||||||||||||||||||||||||||||||||||||||||||||||||||||||
| The following Example is intended to help you compare the cost of investing in the Fund with the cost of investing in other mutual funds. The Example assumes that you invest $10,000 in a class of shares of the Fund for the time periods indicated and then redeem all of your shares at the end of those periods. The Example also assumes that your investment has a 5% return each year and that the Fund’s operating expenses remain the same. Any applicable fee waivers and/or expense reimbursements are reflected in the below examples for the first year only. Although your actual costs may be higher or lower, based on these assumptions your expenses would be as follows: | |||||||||||||||||||||||||||||||||||||||||||||||||||||||||||||||||
| If shares are redeemed | |||||||||||||||||||||||||||||||||||||||||||||||||||||||||||||||||
| |||||||||||||||||||||||||||||||||||||||||||||||||||||||||||||||||
| If shares are not redeemed | |||||||||||||||||||||||||||||||||||||||||||||||||||||||||||||||||
| |||||||||||||||||||||||||||||||||||||||||||||||||||||||||||||||||
| Portfolio Turnover. | |||||||||||||||||||||||||||||||||||||||||||||||||||||||||||||||||
| The Fund pays transaction costs, such as commissions, when it buys and sells securities (or “turns over” its portfolio). A higher portfolio turnover rate may indicate higher transaction costs and may result in higher taxes when Fund shares are held in a taxable account. These costs, which are not reflected in the annual fund operating expenses or in the Example, affect the Fund’s performance. During the most recent fiscal year, the Fund’s portfolio turnover rate was 63% of the average value of its portfolio. | |||||||||||||||||||||||||||||||||||||||||||||||||||||||||||||||||
| Principal Investment Strategies. | |||||||||||||||||||||||||||||||||||||||||||||||||||||||||||||||||
| The Fund invests mainly in common stocks of U.S. and foreign companies. The Fund can invest without limit in foreign securities in any country, including countries with developed or emerging markets. Typically, the Fund will invest a substantial portion of its assets in issuers in a number of different foreign countries. The Fund does not limit its investments to companies in a particular capitalization range or region. Under normal market conditions, the Fund will typically hold between 35 and 55 stocks.
In selecting investments for the Fund’s portfolio, the portfolio manager looks primarily for companies he believes are undervalued (i.e., there is a substantial difference between the current market price of the company and what the portfolio manager believes the company to be worth). A security may be undervalued because the market is not fully pricing an issuer’s current intrinsic value, the market does not properly assess the company’s assets, the market does not yet recognize its future potential, or the issuer may be temporarily out of favor. The Fund seeks to realize gains in the prices of those securities if and when other investors recognize their real or prospective worth. While the Fund primarily invests in stocks of companies the portfolio manager has determined to be “undervalued,” over time this may result in the Fund’s portfolio having exposure to stocks with the characteristics of both “value” and “growth” stocks. Growth companies are companies whose earnings and stock prices are expected to increase at a faster rate than the overall market. | |||||||||||||||||||||||||||||||||||||||||||||||||||||||||||||||||
| Principal Risks. | |||||||||||||||||||||||||||||||||||||||||||||||||||||||||||||||||
| The price of the Fund’s shares can go up and down substantially. The value of the Fund’s investments may fall due to adverse changes in the markets in which the Fund invests or because of poor investment selection, which could cause the Fund to underperform other funds with similar investment objectives. There is no assurance that the Fund will achieve its investment objective. When you redeem your shares, they may be worth less than what you paid for them. These risks mean that you can lose money by investing in the Fund. Risks of Investing in Stocks. The value of the Fund’s portfolio may be affected by changes in the stock markets. Stock markets may experience significant short-term volatility and may fall sharply at times. Adverse events in any part of the equity or fixed-income markets may have unexpected negative effects on other market segments. Different stock markets may behave differently from each other and U.S. stock markets may move in the opposite direction from one or more foreign stock markets. The prices of individual stocks generally do not all move in the same direction at the same time. A variety of factors can negatively affect the price of a particular company’s stock. These factors may include, but are not limited to: poor earnings reports, a loss of customers, litigation against the company, general unfavorable performance of the company’s sector or industry, or changes in government regulations affecting the company or its industry. To the extent that securities of a particular type are emphasized (for example foreign stocks, stocks of small- or mid-cap companies, growth or value stocks, or stocks of companies in a particular industry), fund share values may fluctuate more in response to events affecting the market for those types of securities. Risks of Focused Investing. Although the Fund is a diversified fund, it normally focuses its investments in a relatively small number of issuers, which may make the value of its shares more volatile than if it invested more widely. At times, the Fund may hold a significant portion of its assets in companies in a particular industry or market sector. As a result, events (such as changes in economic conditions, government regulations, market declines, or the availability of basic resources or supplies) that affect that particular industry or sector more than others may have a greater effect on the Fund’s performance. It might also be more difficult for the Fund to sell portfolio securities at a price it considers appropriate if it holds larger blocks of stock because it invests in fewer issuers. Industry and Sector Focus. At times the Fund may increase the relative emphasis of its investments in a particular industry or sector. The prices of stocks of issuers in a particular industry or sector may go up and down in response to changes in economic conditions, government regulations, availability of basic resources or supplies, or other events that affect that industry or sector more than others. To the extent that the Fund increases the relative emphasis of its investments in a particular industry or sector, its share values may fluctuate in response to events affecting that industry or sector. To some extent that risk may be limited by the Fund’s policy of not concentrating its investments in any one industry. Risks of Foreign Investing. Foreign securities are subject to special risks. Securities traded in foreign markets may be less liquid and more volatile than those traded in U.S. markets. Foreign issuers are usually not subject to the same accounting and disclosure requirements that U.S. companies are subject to, which may make it difficult for the Fund to evaluate a foreign company’s operations or financial condition. A change in the value of a foreign currency against the U.S. dollar will result in a change in the U.S. dollar value of investments denominated in that foreign currency and in the value of any income or distributions the Fund may receive on those investments. The value of foreign investments may be affected by exchange control regulations, foreign taxes, higher transaction and other costs, delays in the settlement of transactions, changes in economic or monetary policy in the United States or abroad, expropriation or nationalization of a company’s assets, or other political and economic factors. In addition, due to the inter-relationship of global economies and financial markets, changes in political and economic factors in one country or region could adversely affect conditions in another country or region. Investments in foreign securities may also expose the Fund to time-zone arbitrage risk. Foreign securities may trade on weekends or other days when the Fund does not price its shares. As a result, the value of the Fund’s net assets may change on days when you will not be able to purchase or redeem the Fund’s shares. At times, the Fund may emphasize investments in a particular country or region and may be subject to greater risks from adverse events that occur in that country or region. Foreign securities and foreign currencies held in foreign banks and securities depositories may be subject to only limited or no regulatory oversight. Risks of Developing and Emerging Markets. Investments in developing and emerging markets are subject to all the risks associated with foreign investing, however, these risks may be magnified in developing and emerging markets. Developing or emerging market countries may have less well-developed securities markets and exchanges that may be substantially less liquid than those of more developed markets. Settlement procedures in developing or emerging markets may differ from those of more established securities markets, and settlement delays may result in the inability to invest assets or to dispose of portfolio securities in a timely manner. Securities prices in developing or emerging markets may be significantly more volatile than is the case in more developed nations of the world, and governments of developing or emerging market countries may also be more unstable than the governments of more developed countries. Such countries’ economies may be more dependent on relatively few industries or investors that may be highly vulnerable to local and global changes. Developing or emerging market countries also may be subject to social, political or economic instability. The value of developing or emerging market countries’ currencies may fluctuate more than the currencies of countries with more mature markets. Investments in developing or emerging market countries may be subject to greater risks of government restrictions, including confiscatory taxation, expropriation or nationalization of a company’s assets, restrictions on foreign ownership of local companies, restrictions on withdrawing assets from the country, protectionist measures, and practices such as share blocking. In addition, the ability of foreign entities to participate in privatization programs of certain developing or emerging market countries may be limited by local law. Investments in securities of issuers in developing or emerging market countries may be considered speculative. Eurozone Investment Risks. Certain of the regions in which the Fund may invest, including the European Union (EU), currently experience significant financial difficulties. Following the global economic crisis that began in 2008, some of these countries have depended on, and may continue to be dependent on, the assistance from others such as the European Central Bank (ECB) or other governments or institutions, and failure to implement reforms as a condition of assistance could have a significant adverse effect on the value of investments in those and other European countries. In addition, countries that have adopted the euro are subject to fiscal and monetary controls that could limit the ability to implement their own economic policies, and could voluntarily abandon, or be forced out of, the euro. Such events could impact the market values of Eurozone and various other securities and currencies, cause redenomination of certain securities into less valuable local currencies, and create more volatile and illiquid markets. Additionally, the United Kingdom’s intended departure from the EU, commonly known as “Brexit,” may have significant political and financial consequences for Eurozone markets, including greater market volatility and illiquidity, currency fluctuations, deterioration in economic activity, a decrease in business confidence and an increased likelihood of a recession in the United Kingdom. Risks of Value Investing. Value investing entails the risk that if the market does not recognize that a fund’s securities are undervalued, the prices of those securities might not appreciate as anticipated. A value approach could also result in fewer investments that increase rapidly during times of market gains and could cause a fund to underperform funds that use a growth or non-value approach to investing. Value investing has gone in and out of favor during past market cycles and when value investing is out of favor or when markets are unstable, the securities of “value” companies may underperform the securities of “growth” companies. Risks of Growth Investing. If a growth company’s earnings or stock price fails to increase as anticipated, or if its business plans do not produce the expected results, its securities may decline sharply. Growth companies may be newer or smaller companies that may experience greater stock price fluctuations and risks of loss than larger, more established companies. Newer growth companies tend to retain a large part of their earnings for research, development or investments in capital assets. Therefore, they may not pay any dividends for some time. Growth investing has gone in and out of favor during past market cycles and is likely to continue to do so. During periods when growth investing is out of favor or when markets are unstable, it may be more difficult to sell growth company securities at an acceptable price. Growth stocks may also be more volatile than other securities because of investor speculation. Risks of Small- and Mid-Cap Companies. Small-cap companies may be either established or newer companies, including “unseasoned” companies that have typically been in operation for less than three years. Mid-cap companies are generally companies that have completed their initial start-up cycle, and in many cases have established markets and developed seasoned market teams. While smaller companies might offer greater opportunities for gain than larger companies, they also may involve greater risk of loss. They may be more sensitive to changes in a company’s earnings expectations and may experience more abrupt and erratic price movements. Small- and mid-cap companies’ securities may trade in lower volumes and it might be harder for the Fund to dispose of its holdings at an acceptable price when it wants to sell them. Small- and mid-cap companies may not have established markets for their products or services and may have fewer customers and product lines. They may have more limited access to financial resources and may not have the financial strength to sustain them through business downturns or adverse market conditions. Since small- and mid-cap companies typically reinvest a high proportion of their earnings in their business, they may not pay dividends for some time, particularly if they are newer companies. Small- and mid-cap companies may have unseasoned management or less depth in management skill than larger, more established companies. They may be more reliant on the efforts of particular members of their management team and management changes may pose a greater risk to the success of the business. It may take a substantial period of time before the Fund realizes a gain on an investment in a small- or mid-cap company, if it realizes any gain at all. Who Is The Fund Designed For? The Fund is designed primarily for investors seeking capital appreciation. Those investors should be willing to assume the risks of short-term share price fluctuations that are typical for an aggressive fund focusing on equity securities of issuers in foreign countries. Since the Fund’s income level will fluctuate and will likely be small, it is not designed for investors needing an assured level of current income. The Fund is not a complete investment program. You should carefully consider your own investment goals and risk tolerance before investing. An investment in the Fund is not a deposit of any bank and is not insured or guaranteed by the Federal Deposit Insurance Corporation or any other government agency. | |||||||||||||||||||||||||||||||||||||||||||||||||||||||||||||||||
| The Fund’s Past Performance. | |||||||||||||||||||||||||||||||||||||||||||||||||||||||||||||||||
| The bar chart and table below provide some indication of the risks of investing in the Fund by showing changes in the Fund’s performance (for Class A Shares) from calendar year to calendar year and by showing how the Fund’s average annual returns for the periods of time shown in the table compare with those of a broad measure of market performance. The Fund’s past investment performance (before and after taxes) is not necessarily an indication of how the Fund will perform in the future. Sales charges and taxes are not reflected in the bar chart and if those charges were included, returns would be less than those shown. More recent performance information is available by calling the toll-free number on the back of this prospectus and on the Fund’s website: https://www.oppenheimerfunds.com/fund/GlobalFocusFund | |||||||||||||||||||||||||||||||||||||||||||||||||||||||||||||||||
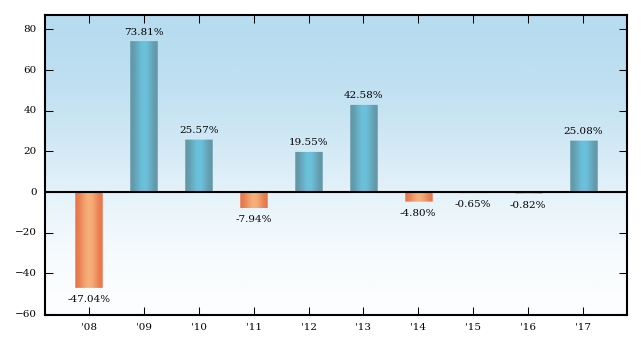
| |||||||||||||||||||||||||||||||||||||||||||||||||||||||||||||||||
| Sales charges and taxes are not included and the returns would be lower if they were. During the period shown, the highest return for a calendar quarter was 41.47% (2nd Qtr 09) and the lowest return for a calendar quarter was -32.55% (4th Qtr 08). For the period from January 1, 2018 to June 30, 2018 the return before sales charges and taxes was 6.04%. | |||||||||||||||||||||||||||||||||||||||||||||||||||||||||||||||||
| The following table shows the average annual total returns for each class of the Fund’s shares. After-tax returns are calculated using the highest individual federal marginal income tax rates and do not reflect the impact of state or local taxes. Your actual after-tax returns, depending on your individual tax situation, may differ from those shown and after-tax returns shown are not relevant to investors who hold their Fund shares through tax-deferred arrangements, such as 401(k) plans or individual retirement accounts. After-tax returns are shown for only one class and after-tax returns for other classes will vary. | |||||||||||||||||||||||||||||||||||||||||||||||||||||||||||||||||
| Average Annual Total Returns for the periods ended December 31, 2017 | |||||||||||||||||||||||||||||||||||||||||||||||||||||||||||||||||
| |||||||||||||||||||||||||||||||||||||||||||||||||||||||||||||||||