
UNITED STATES
SECURITIES AND EXCHANGE COMMISSION
Washington, D.C. 20549
FORM
For the fiscal year ended
OR
For the transition period from to
Commission file number:
(Exact Name of Registrant as Specified in its Charter)
(State or other jurisdiction of incorporation or organization) |
(I.R.S. Employer Identification No.) |
|
|
(Address of principal executive offices) |
(Zip Code) |
(
(Registrant’s telephone number, including area code)
Securities registered pursuant to Section 12(b) of the Act:
|
|
|
Title of each class |
Trading Symbol(s) |
Name of each exchange on which registered |
Securities registered pursuant to Section 12(g) of the Act: None
Indicate by check mark if the registrant is a well-known seasoned issuer, as defined in Rule 405 of the Securities Act. Yes
Indicate by check mark if the registrant is not required to file reports pursuant to Section 13 or Section 15(d) of the Act. Yes
Indicate by check mark whether the registrant: (1) has filed all reports required to be filed by Section 13 or 15(d) of the Securities Exchange Act of 1934 during the preceding 12 months (or for such shorter period that the registrant was required to file such reports), and (2) has been subject to such filing requirements for the past 90 days.
Indicate by check mark whether the registrant has submitted electronically every Interactive Data File required to be submitted pursuant to Rule 405 of Regulation S-T (§232.405 of this chapter) during the preceding 12 months (or for such shorter period that the registrant was required to submit such files).
Indicate by check mark whether the registrant is a large accelerated filer, an accelerated filer, a non-accelerated filer, a smaller reporting company or an emerging growth company. See definitions of “large accelerated filer,” “accelerated filer,” “smaller reporting company” and “emerging growth company” in Rule 12b-2 of the Exchange Act. (Check one):
Large accelerated filer |
|
Non-accelerated filer |
If an emerging growth company, indicate by check mark if the registrant has elected not to use the extended transition period for complying with any new or revised financial accounting standards provided pursuant to Section 13(a) of the Exchange Act. ☐
Indicate by check mark whether the registrant has filed a report on and attestation to its management’s assessment of the effectiveness of its internal control over financial reporting under Section 404(b) of the Sarbanes-Oxley Act (15 U.S.C. 7262(b)) by the registered public accounting firm that prepared or issued its audit report.
If securities are registered pursuant to Section 12(b) of the Act, indicate by check mark whether the financial statements of the registrant included in the filing reflect the correction of an error to previously issued financial statements. ☐
Indicate by check mark whether any of those error corrections are restatements that required a recovery analysis of incentive-based compensation received by any of the registrant’s executive officers during the relevant recovery period pursuant to §240.10D-1(b). ☐
Indicate by check mark whether the registrant is a shell company (as defined in Rule 12b‑2 of the Act). Yes
As of June 30, 2022, the last business day of the registrant’s most recent second quarter, the aggregate market value of the registrant’s common stock held by non-affiliates of the registrant was $
As of February 24, 2023,
DOCUMENTS INCORPORATED BY REFERENCE
Part III incorporates certain information by reference from the registrant’s proxy statement for the 2023 annual meeting of stockholders, which will be filed no later than 120 days after the close of the registrant’s fiscal year ended December 31, 2022.
LL FLOORING HOLDINGS, INC.
ANNUAL REPORT ON FORM 10‑K
TABLE OF CONTENTS
2
CAUTIONARY NOTE REGARDING FORWARD-LOOKING STATEMENT
This report includes statements of the Company’s expectations, intentions, plans and beliefs that constitute “forward-looking statements” within the meanings of the Private Securities Litigation Reform Act of 1995. These statements, which may be identified by words such as “may,” “will,” “should,” “expects,” “intends,” “plans,” “anticipates,” "assumes," “believes,” “thinks,” “estimates,” “seeks,” “predicts,” “could,” “projects,” "targets," “potential,” "will likely result," and other similar terms and phrases, are based on the beliefs of the Company’s management, as well as assumptions made by, and information currently available to, the Company’s management as of the date of such statements. These statements are subject to risks and uncertainties, all of which are difficult to predict and many of which are beyond the Company’s control. These risks include, without limitation, the impact of any of the following:
3
The Company specifically disclaims any obligation to update these statements, which speak only as of the dates on which such statements are made, except as may be required under the federal securities laws. These risks and other factors include those listed in this Item 1A. “Risk Factors” and elsewhere in this report.
References to “we”, “our”, “us”, “the Company”, “Lumber Liquidators”, and “LL Flooring” generally refers to LL Flooring Holdings, Inc. and its consolidated subsidiaries collectively and, where applicable, individually.
PART I
Item 1. Business.
Overview
LL Flooring Holdings, Inc. (“LL Flooring” or “Company”) is one of North America’s leading specialty retailers of hard-surface flooring, with 442 stores as of December 31, 2022. Our Company seeks to offer the best customer experience online via LLFlooring.com and in stores, with more than 500 varieties of hard-surface floors featuring a range of quality styles and on-trend designs. Our online tools such as our Picture It! Floor Visualizer also help empower customers to find the right solution for the space they’ve envisioned. Our extensive selection includes waterproof hybrid resilient, waterproof vinyl plank, solid and engineered hardwood, laminate, bamboo, tile, and cork, with a wide range of flooring enhancements and accessories to complement. The Company also provides in-home delivery and installation services to its customers. The Company primarily sells to consumers or to flooring focused pros such as flooring installers, remodelers, and small to medium home builders ("Pros") on behalf of consumers through a network of store locations in metropolitan areas. Our stores are staffed with flooring experts who provide advice, Pro partnership services and installation options for all our products, the majority of which is in stock and ready for delivery. Our vision is to be the customer’s first choice in hard-surface flooring by providing the best experience, from inspiration to installation. We offer the accessible flooring expertise and high-touch service of a local store, combined with the value, omni-channel convenience and product availability of a national chain. We plan to leverage this advantage to differentiate ourselves in the highly fragmented flooring market.
LL Flooring is a Delaware corporation with its headquarters in Richmond, Virginia. We were founded in 1994 and our initial public offering was in November 2007. Our common stock trades on the New York Stock Exchange under the symbol “LL.” Effective January 1, 2022 we completed our corporate entity name change from Lumber Liquidators Holdings, Inc. to LL Flooring Holdings, Inc. We operate in a holding company structure with LL Flooring Holdings, Inc. serving as our parent company and certain direct and indirect subsidiaries, including LL Flooring, Inc. and LL Flooring Services, conducting our operations.
Our Business
Market
We operate in a large, growing, highly fragmented hard-surface flooring market in the U.S. Based on internal estimates as well as external reports such as the July 2022 Issue of Floor Covering Weekly and Catalina Research, Inc.’s Report on Floor Coverings, Industry Trends 2022, we estimate total U.S. flooring retail sales (including soft- and hard-surface flooring and excluding installation labor and non-flooring accessory products) were $50 billion in 2021. Total hard-surface flooring retail sales were approximately $36 billion in 2021, not including installation labor and non-flooring accessory products. Total soft-surface flooring retail sales were approximately $14 billion in 2021.
Flooring sales are driven by a number of factors including discretionary income and trends in the housing market. Based on Company estimates and our review of external economic data including existing home sales, the NAHB remodeling index, new housing starts and the U.S. Census, we expect flooring sales over the long term to continue to benefit from aging and insufficient
4
housing availability, rising home values and new household formations, among other factors. From 2018 through 2021, we estimate installed sales of hard-surface flooring grew at a compound annual growth rate (CAGR) of 11% compared to a 1% CAGR for soft-surface flooring.
Competition
We compete for customers in a highly fragmented marketplace, where we believe no single retailer has captured more than a 15% share of the consumer market for flooring (including carpet and area rugs) based on internal estimates as well as the July 2022 Issue of Floor Covering Weekly and Catalina Research, Inc.’s Report on Floor Coverings, Annual Market Report 2021. The largest segment of the market is represented by independent specialty retailers comprised of local one-store flooring retailers, small chains of stores that may specialize in one or two flooring categories, and a limited number of regional chains. We also compete against national home improvement warehouse chains, national specialty retailers, warehouse clubs and online retailers. We believe we offer a compelling value proposition to customers as we provide a wide selection of high-quality, stocked products and the accessible flooring expertise and service of a local store, with the scale, omni-channel convenience and value of a national chain.
Customers
We target several distinct customer groups who each have varied needs with respect to their flooring purchases, including consumers or Pros on behalf of consumers. We believe that each of the customer groups we serve is passionate about their flooring purchase and values our wide assortment of flooring products, availability, and the quality of those products. While our offering to each of these groups begins with the same broad assortment and knowledgeable store associates, each of these customer groups requires unique service components based on the ability of our associates to share detailed product knowledge and preferred installation methods. We offer customers installation services and also provide dedicated call center resources through our customer contact center for consumers and Pros. All customer groups are offered delivery services.
Products and Services
Product Selection
We offer an extensive assortment of hard-surface flooring under multiple proprietary brand names, led by our flagships, Bellawood®, Coreluxe®, and more recently, our DuravanaTM hybrid resilient flooring, which combines the best characteristics of traditional flooring and the latest technology for waterproofing. Duravana is eco-friendly, 100% PVC free and the MDF core is manufactured from responsibly managed forests as certified by the Forest Stewardship Council. We have invested significant resources developing these national brand names. Our hard-surface flooring products feature a range of quality styles and on-trend designs and are generally differentiated in terms of quality and price based on wood versus manufactured materials, the wood species, grade, and durability of finish. Prefinished floors are the dominant choice for residential customers over unfinished wood planks that have a finish applied after installation. We also offer an assortment of installation services and accessories, including moldings, underlayment, adhesives and tools.
Direct Sourcing
We source directly from flooring and other vendors, which enables us to offer a broad assortment of high-quality proprietary products to our customers at a consistently competitive cost. We seek to establish strong, long-term relationships with our vendors around the world. In doing so, we look for vendors that have demonstrated an ability to meet our demanding specifications, our rigorous compliance standards and the capability to provide sustainable and growing supplies of high-quality, innovative, trend-right products. We source from both domestic and international vendors, and in 2022, approximately 44% of our product was sourced in North America, 39% was sourced from Asia, 12% was sourced from Europe, and 5% was sourced from South America. In order to reduce our costs, we have been actively moving our products subject to Section 301 tariffs from China into other countries, including North America.
Supply Chain
Our supply chain is wholly focused on delivering a complete assortment of products to our customers in an efficient manner. We own a one million square foot distribution center on approximately 100 acres of land in Henrico County, Virginia, which serves the stores located in the easternmost two-thirds of the United States. We operate a 500,000 square foot leased distribution center in Pomona, California as the primary distribution center for the stores located in the westernmost one-third of the United States. A number of our vendors maintain certain inventory levels for shipment directly to our stores or our customers. Our product is generally transported boxed and palletized, and the weight of our product is a key driver of our supply chain costs.
Compliance and Quality Control
Our compliance programs are designed to ensure the products we sell are safe and responsibly sourced, and meet all regulatory and statutory requirements, including, without limitation, requirements associated with the Lacey Act, United States Environment Protection Agency ("EPA") and the California Air Resources Board (“CARB”). LL Flooring and its parents, subsidiaries, affiliates
5
and related parties are committed to conducting business in accordance with the highest ethical standards, in compliance with all applicable laws, and in a manner that helps ensure that the Company is environmentally and socially responsible. LL Flooring expects its vendor partners to adhere to the same high ethical standards and share the same commitment. Our vendor code of conduct, which maintains standards that must be followed by all vendors, sub-tier suppliers, subcontractors and their agents, prohibits vendors from engaging in child labor, forced labor or other human rights issues.
We utilize a variety of due diligence processes and controls, including supplier audits, periodic on-site visits, and product testing to ensure such compliance. We utilize a risk-based approach to implement and operate the various aspects of our compliance program. Our compliance program considers, among other things, product risk, the level of vertical integration at our suppliers’ mills, legality concerns noted by both private and government parties, and the results of on-site audits that we perform. Our evaluation of sourcing risk is a key component in our allocation of resources to ensure we meet our standards for product compliance and safety. Compliance and Quality Control teams located in the United States and in China are supplemented with independent third-party resources that provide independent audits and inspections, which are incorporated into our review processes and monitor our sourcing efforts across all areas from which we source product. Compliance programs and functions are continually under review, updated and enhanced as appropriate to stay current with industry, statutory and regulatory requirements. Our Compliance and Regulatory Affairs Committee of the Board of Directors provides oversight of our compliance programs.
Additionally, we maintain and operate a 1,500 square foot lab within our distribution center on the east coast. The lab features two temperature and humidity controlled conditioning rooms and two emission chambers correlated to a CARB- and EPA-approved Third-Party Certifier standard. We believe this equipment mirrors the requirements of CARB, EPA, and capabilities of other state-of-the-art emission testing facilities. This lab, along with our third-party providers, supports our process to ensure compliance with CARB and EPA requirements. We also maintain a lab in Shanghai.
Installation
Approximately 12% of our total net revenue in 2022 was from installation services sales. Our customers purchase professional installation services through us to measure and install our flooring at competitive prices. We offer these services at all our stores. As of December 31, 2022, we utilize a network of associates to perform certain customer-facing, consultative services and coordinate the installation of our flooring products by third-party professional independent contractors. Service revenue for installation transactions that we control along with freight is included in net services sales, with the corresponding costs in cost of services sold. We believe our greater interaction with the customer and strong relationships with the third-party professional independent contractors ultimately results in a better customer experience.
Store Model
As of December 31, 2022, we operated 442 retail stores. We opened 18 new stores and did not close any stores in 2022. Although we have certain criteria that we require for every store, we are able to adapt a range of existing buildings to our format, including freestanding buildings, strip centers, or small shopping centers. Our stores are typically 6,500 to 7,500 square feet. We enter into short leases, generally for a base term of five to seven years with renewal options, to maximize our real estate flexibility.
We routinely evaluate our store site selection criteria and are currently targeting retail corridors within a market over the more industrial locations we historically sought. We consistently monitor performance of current stores as well as the market opportunity for new locations, adjusting as needed to optimize the profitability and growth potential of our store portfolio.
Sales Approach
We strive to have an integrated omni-channel sales model that enables our stores, customer contact center, digital platform, and catalogs to work together in a coordinated manner. We believe that due to the average size of the sale and the general infrequency of a flooring purchase, many of our customers conduct extensive research using multiple channels before making a purchase decision. Though our customers utilize a range of these channels in the decision-making process, the final sale is most often completed in the store, working with our flooring experts. Consumers typically plan well in advance for the inconvenience of removing old flooring and installing new flooring. Pros often have larger, more complex projects, and greater lead time and preparation is often required. Our research indicates that the length of a hard-surface flooring purchase can vary significantly from initial interest to final sale.
Our objective is to help the customer through the entire purchase cycle from inspiration to installation, whether in our store or in their home. Our goal is to provide our customers with everything needed to complete their flooring project – to remove the existing floor, install the new floor with complementary moldings and accessories, and finally, maintain the floor.
Our sales strategy emphasizes customer service by providing superior, convenient, educational tools for our customers to learn about our products and the installation process. We invest in training our store team and virtual sales team members on all of our products and install techniques. Flooring samples for most of the products we offer are available in our stores or can be ordered
6
through our digital platform or contact center. Once an order is placed, customers may choose to either have their purchases delivered to their home or job site or pick them up at a nearby store location.
We are committed to responding to our customers in a timely manner. Our customer contact center is staffed by flooring experts cross-trained in sales, customer service and product support. In addition to receiving telephone calls, our contact center associates chat online with visitors to our digital platform, respond to emails from our customers and engage in virtual selling. Customers can contact our customer contact center to place an order, make an inquiry, or order a catalog.
Knowledgeable Salespeople
We win when a customer walks into an LL Flooring store and is immediately greeted by a knowledgeable associate who can help make buying flooring easy. We believe a large segment of residential homeowners are in need of a trusted expert, as a guide through a range of flooring alternatives and services or as a resource throughout the installation process. We utilize extensive training programs to enable our store management and associates to serve our customers at the highest level. We are increasing the number of hours per month devoted to product and sales training, which focuses on selling techniques and in-depth product knowledge for our store associates, who, we believe, are a key driver in a customer’s purchasing decision.
In a small store environment, our store managers are critical in ensuring the success of delivering against our customer experience. We place an emphasis on identifying, hiring, and empowering associates who share a passion for our business philosophy where possible. Many of our store managers have previous experience with the home improvement, retail flooring or flooring installation industries. We continue to invest in our regional managers and store managers in training, with a focus on strengthening promotion-from-within and certification programs to build our future store leadership.
Digital / Omni-Channel
LLFlooring.com is our digital platform. This mobile-friendly site features inspirational content, showcases our flooring in digital room scenes, highlights our digital tools like the Picture It! Floor Visualizer and Floor Finder and promotes our services such as the ability to order a free installation estimate and flooring samples. Our digital platform contains a broad range of information on our products and services, including a comprehensive knowledge base on all aspects of flooring. Customers can also shop from home with a live sales associate in one of our stores through our virtual shopping experience. We also offer extensive product reviews, before and after photos from previous customer projects, style and design trends via the LL Style blog and how-to installation videos. A customer can also chat live with a flooring expert, either online or over the phone, regarding questions about a flooring purchase or installation. We continue to develop new features and functionality to assist customers, and to ensure they have robust tools at their disposal that are effective at helping them make the ideal flooring choice as they move between other channels. We also offer an e-commerce experience for our Pro customers, including online ordering with exclusive Pro pricing and delivery rates on our selection of over 500 floors.
Advertising
We continue to utilize a mix of digital and traditional media, email and direct mail, to balance product, service and value messaging. We also leverage our investments in paid, owned and earned media to build brand consideration and to educate customers on the flooring category. Overall, we proactively manage the mix of our media to ensure we efficiently drive sales while effectively building awareness of our brand value proposition.
We continue to progress on our journey to build awareness for the LL Flooring brand, including largely completing the physical rebranding of our stores in 2022. The new LL Flooring brand positions us to serve consumers and Pros who are looking for an unmatched combination of expertise and guidance, including installation services, combined with a curated assortment of beautiful floors at a great value.
Financing
We offer our residential customers a financing alternative through a proprietary credit card, the LL Flooring credit card, underwritten by a third-party financial institution, generally with no recourse to us. This program serves the dual function of providing financial flexibility to our customers and offering us promotional opportunities featuring deferred interest, which we often combine with product promotions. Our customers may also use their LL Flooring credit card for installation services. We also offer our Pro customers a financing alternative, which is underwritten by a third-party financial institution, generally with no recourse to us. The commercial credit program provides our Pro customers a range of additional services that we believe add flexibility to their businesses.
Human Capital
Our people are the core of our business, and we are committed to being a company that delivers an inclusive, diverse team and culture which understands, values, and adapts to the needs of our associates and customers. We seek to provide a safe, engaging work experience that excites and motivates our team members to deliver their best every day.
7
As of December 31, 2022, we had approximately 2,300 associates, 98% of whom were full-time and none of whom were represented by a union. Of these associates, 72% work in our stores, 21% work in corporate store support infrastructure or similar functions (including our call center associates) and 7% work in our distribution centers. We believe that we have good relations with our associates.
Developing our people and culture is a critical driving force behind our vision is to be the customer’s first choice in hard-surface flooring by providing the best experience, from inspiration to installation.
We have identified the following six guiding values as the foundation of our culture:
We aim to provide opportunities for learning and growth, to ensure our team is always the best in the business. In recent years, we added more regional and store managers in training to build our bench of future store leadership. Our field leadership has also focused on developing a more robust store and regional manager training program that promotes both diverse and inclusive leadership as well as driving greater internal career advancement. In 2022, we promoted more than 650 associates and invested substantial hours of training across the organization.
Our commitment to embracing diversity is supported by training and awareness programs as well as focused efforts to recruit, retain, develop and promote a diverse workforce. In 2021, we trained our top 100 leaders on how to create a diverse workplace and how to respect each other's differences, and in 2022, we provided our associates with professional development lessons on Inclusion & Diversity topics through LL Academy, our online learning platform. Additionally, all associates learn the value of Diversity, Equity, Inclusion and Belonging through in-depth online training within their first 90 days of employment.
Starting in January 2023, the Company added a Reflection & Service paid holiday. Through this new paid holiday, we are providing associates with time off for specific purposes: to observe a faith-based or cultural event that is important to them or their family, or to volunteer in service with a non-profit or community resource group on behalf of an at-risk population.
The Company also has a commitment to increase diverse representation by 8% at all levels within the organization. In the past year, we have increased our women’s leadership in VP-and-above roles by 6%, Director level roles by almost 2% and Supervisory roles by 4%. BIPOC leadership has also risen in the past year with a 10% increase in management.
Our Diversity, Equity & Inclusion Committee, comprised of a diverse group of associates, is helping to ensure associates can thrive and grow professionally. They continue to connect our work with best practices and insights to drive what diversity, equity and inclusion should look like in our Company.
Seasonality and Quarterly Results
Our quarterly results of operations can fluctuate depending on the timing of our advertising and the timing of, and income contributed by, our new stores. Our net sales fluctuate slightly as a result of seasonal factors, and we adjust merchandise inventories in anticipation of those factors, causing variations in our buildup of merchandise inventories. Generally, we experience higher-than-average net sales in the spring and fall, when more home remodeling activities typically are taking place, and lower-than-average net sales in the colder winter months and during the hottest summer months. In 2022 and to date in 2023, the Company continues to navigate uncertainty in the macroeconomic environment due to consumer confidence, inflation, volatile mortgage rates impacting housing affordability and lower existing home sales.
Intellectual Property and Trademarks
We have a number of marks registered in the United States, including LLFlooring®, Floor Love™, Lumber Liquidators®, Floor Finder®, Duravana™, Bellawood®, 1‑800‑HARDWOOD®, Quickclic®, Virginia Mill Works Co. Hand Scraped and Distressed Floors®, Dream Home Laminate Floors®, Builder’s Pride®, Avella®, Coreluxe®, Tranquility Resilient Flooring®, Lisbon Cork Co. Ltd. ®, Colston Hardwood Flooring ®, ReNature™, AquaSeal ™, Dual Defense™ and other product line names. We regard our intellectual property as having significant value and these names are an important factor in the marketing of our brands. Accordingly, we take steps intended to protect our intellectual property including, where necessary, the filing of lawsuits and administrative actions
8
to enforce our rights. Depending on the country, trademarks remain valid for as long as they are in use or their registration status is maintained. Trademark registrations generally are renewable for fixed terms.
Government Regulation
We are subject to extensive and varied federal, provincial, state and local government regulations in the jurisdictions in which we operate, including laws and regulations relating to our relationships with our associates and customers, independent third-party installers, public health and safety, zoning, accommodations for persons with disabilities, and fire codes. We are also subject to a number of compliance obligations pursuant to various settlement agreements we have entered into over the past few years. We operate each of our stores, offices and distribution centers in accordance with standards and procedures designed to comply with all applicable laws, codes, licensing requirements and regulations. Certain of our operations and properties are also subject to federal, provincial, state and local laws and regulations relating to the use, storage, handling, generation, transportation, treatment, emission, release, discharge and disposal of hazardous materials, substances and wastes and relating to the investigation and cleanup of contaminated properties, including off-site disposal locations. We do not currently incur significant costs complying with the laws and regulations related to hazardous materials. However, we could be subject to material costs, liabilities or claims relating to compliance in the future, especially in the event of changes in existing laws and regulations or in their interpretation, as well as the passage of new laws and regulations.
Our suppliers are subject to the laws and regulations of their home countries, as well as those relative to the import of their products into the United States, including, in particular, laws regulating labor, forestry and the environment. Our suppliers are subject to periodic compliance audits, onsite visits and other reviews, as appropriate, in efforts to ensure that they are in compliance with all laws and regulations. We also support social and environmental responsibility among our supplier community and our suppliers agree to comply with our expectations concerning environmental, labor and health and safety matters. Those expectations include representations and warranties that our suppliers comply with the laws, rules and regulations of the countries in which they operate.
Products that we import into the United States are subject to laws and regulations imposed in conjunction with such importation, including those issued and/or enforced by United States Customs and Border Protection. In addition, certain of our products are subject to laws and regulations relating to the importation, acquisition or sale of illegally harvested plants and plant products and the emissions of hazardous materials. We work closely with our suppliers to understand their compliance applicable laws and regulations in these areas.
Available Information
We maintain a website at LLFlooring.com. The information on or available through our website is not, and should not be considered, a part of this annual report on Form 10‑K. You may access our annual reports on Form 10‑K, quarterly reports on Form 10‑Q, current reports on Form 8‑K and amendments to those reports, as well as other reports relating to us that are filed with, or furnished to, the United States Securities and Exchange Commission (“SEC”) free of charge on our digital platform www.investors.LLFlooring.com as soon as reasonably practicable after such material is electronically filed with, or furnished to, the SEC. The SEC also maintains an Internet site, www.sec.gov, which contains reports, proxy and information statements, and other information that we file electronically with the SEC. The information contained on or connected to our website is not incorporated by reference in this report and should not be considered part of this or any other report that we file with or furnish to the SEC.
Item 1A. Risk Factors.
The risks described below could materially and adversely affect our business, results of operations, financial condition and cash flows. These risks are not the only risks that we face. Our business operations could also be affected by additional factors that apply generally to companies operating in the United States and globally, as well as other risks that are not presently known to us or that we currently consider to be immaterial.
Risks Related to Our Business Operations
Reduced consumer spending due to slower economic growth, economic recession, inflation, higher interest rates, and consumer sentiment could adversely affect demand for our products, our sales and our profit margins.
We face a volatile retail environment and changing economic conditions, including but not limited to slower economic growth, economic recession, inflation, a volatile interest and mortgage rate environment and lower existing home sales, which may further adversely affect consumer demand and spending. General economic conditions may result in higher inflation, which may increase our exposure to higher costs. If we are unable to offset these cost increases by price increases, growth, and/or cost reductions in our operations, these inflationary and other general cost increases could have a material adverse effect on our operating cash flows, profitability, and liquidity. The impact of price increases resulting from current economic conditions has resulted in a decrease in our
9
transactions. Should current economic conditions continue to weaken, consumer sentiment and demand for our products could deteriorate which could adversely affect our sales and our profit margins.
Our success depends upon the ability to attract, develop and retain highly qualified associates.
We believe that our success has depended and continues to depend on the efforts and capabilities of our associates. If we fail to hire, train, manage, and retain qualified associates with expanded skill sets or the capabilities of delivering on strategic objectives, we could lose sales to our competitors, and our labor costs, results of operations, or the execution of growth strategies could be negatively affected. Our ability to meet our labor needs while controlling labor costs is subject to many external factors including market pressure on wage rates, the size and health of the labor market and our reputation within the labor market. Many associates are in entry-level or part-time roles with historically high turnover rates, which has led to increased training and retention costs, particularly in a competitive labor market. Further, our ability to successfully execute organizational changes, including management transitions within the Company's senior leadership, is critical to our business success. We may not be able to achieve our operational goals if we are unable to attract, develop and retain qualified associates by providing competitive compensation and benefits and an engaging work experience for an inclusive, diverse team and culture. In order to deliver on our vision is to be the customer’s first choice in hard-surface flooring by providing the best experience, from inspiration to installation, our distributed operations are reliant upon different store managers and regional managers to motivate people. Our store associates must have expanded skill sets, and if we are unable to hire, train, manage, and retain qualified associates, it may result in inconsistent execution among different stores/different regions based on available labor force.
Increased transportation costs could harm our results of operations.
The efficient transportation of our products through our supply chain is a critical component of our operations. If the cost of fuel or other costs, such as duties and international container rates rise, it would result in increases in our inventory and cost of sales due to additional transportation charges and fees. Additionally, there are a limited number of delivery companies capable of efficiently transporting our products from our suppliers. Consolidation within this industry could result in increased transportation costs. A reduction in the availability of qualified drivers and/or an increase in driver regulations could continue to increase our costs. We may be unable to increase the price of our products to offset increased transportation charges, which could cause our operating results to deteriorate. Even as transportation costs moderate, the trailing costs are included in our inventory values, which may result in elevated inventory and costs of goods sold as inventory turns.
Our growth strategy is subject to many unpredictable factors including our stores' ability to achieve operating targets.
As of December 31, 2022, we had 442 stores throughout the United States. We continue to focus on executing our strategy to deliver long-term growth, which includes opening new stores. We opened 18 new stores and did not close any stores in 2022. This growth strategy and the investment associated with the development of each new store may cause our operating results to fluctuate and be unpredictable or decrease our profits. Our future results and ability to implement our growth strategy will depend on various factors, including the following:
Failure to manage our growth effectively could harm our business and operating results.
We are making technology investments designed to increase orders from our digital platform, customer contact center and dedicated Pro sales team. Our existing management information systems, including our store management systems, enterprise reporting platform, compliance procedures and financial and reporting controls, may be unable to support our expansion. Managing our growth effectively will require us to continue to enhance these systems, procedures and controls and to hire, train and retain regional and store managers and personnel for our compliance, IT, human resources and financial and reporting departments. We may not respond quickly enough to the changing demands that our expansion will impose on us. Any failure to manage our growth effectively could harm our business and operating results.
10
Damage, destruction or disruption of our distribution centers could significantly impact our operations and impede our ability to distribute certain of our products.
We have two distribution centers that house products for the direct shipment of flooring to our stores. If either of our distribution centers or our inventory held in those locations were damaged or destroyed by fire, tornado, flooding, wood infestation or other causes, our distribution processes would be disrupted. If the major highways or railways leading to and from our distribution centers were shut down due to weather or infrastructure conditions, our distribution processes would also be disrupted. Competition for premium warehousing space could affect our operating costs and distribution strategy. Any of these disruptions to the distribution centers could cause significant delays in delivery. This could impede our ability to stock our stores and deliver products to our customers and cause our net sales and operating results to deteriorate.
Our representative office in China may present increased legal and operational risks.
We have a representative office in Shanghai, China to facilitate our product sourcing in Asia. We may incur increased costs in complying with applicable local-country laws and regulations as they pertain to our products, operations and related activities. Further, if we fail to comply with applicable laws and regulations, we could be subject to, among other things, litigation and government and agency investigations. We have experienced travel restrictions in and out of China and for our sourcing office to be able to travel to other countries in Asia because of COVID-19 policies. Those policies have eased up, but it is hard to predict future restrictions. As we have implemented our diversified sourcing strategy, travel restrictions in and out of China have made it hard for our representatives in China to visit factories in other parts of Asia.
Failure to effectively manage our third-party installers may present increased legal and operational risks.
We manage third-party professional independent contractors who provide installation services to some of our customers. In some jurisdictions, we are subject to regulatory requirements and risks applicable to general contractors, which include management of licensing, permitting and quality of our third-party installers. We have established procedures designed to manage these requirements and ensure customer satisfaction with the services provided by our third-party installers. If we fail to manage these procedures effectively or provide proper oversight of these services, we may be subject to regulatory enforcement and litigation, and our net sales, our profitability and our reputation could be harmed.
Unfavorable allegations, government investigations and legal actions surrounding our products or us could harm our reputation and impair our ability to grow or sustain our business.
We have been involved in a number of government investigations and legal actions, many of which have resulted from unfavorable allegations regarding our products and us. Negative publicity surrounding these government investigations and legal actions could continue to harm our reputation and the demand for our products. Additional unfavorable allegations, government investigations and legal actions involving our products and us could also affect our perception in the market and our brands and negatively impact our business and financial condition. For instance, unfavorable allegations with certain regulators surrounding the compliance of our laminates that had previously been sourced from China has negatively affected and could continue to negatively affect our operations. If this negative impact is significant, our ability to maintain our liquidity and grow or sustain our business could be jeopardized. The cost to defend ourselves and our former associates has been and could continue to be significant.
Future litigation or governmental proceedings could result in material adverse consequences, including judgments or settlements, negatively affecting our business, financial condition and results of operations.
We are, and in the future may become, involved in lawsuits, including consumer, commercial, employment, tort and other litigation, regulatory inquiries, and governmental and other legal proceedings arising out of the ordinary course of our business. Some of these proceedings may raise difficult and complicated factual and legal issues and can be subject to uncertainties and complexities. The timing of the final resolutions to lawsuits, regulatory inquiries and governmental and other legal proceedings is typically uncertain. Additionally, the possible outcomes of, or resolutions to, these proceedings could include adverse judgments or settlements, either of which could require substantial payments. Furthermore, defending against these proceedings may require a diversion of management’s attention and resources. For further information regarding legal proceedings in which we are currently involved, see Item 8. Note 10 to the consolidated financial statements.
Failure to manage our compliance programs could adversely affect our ability to conduct business, result in significant fines and other penalties, damage our brand and reputation, and consequently negatively impact our financial position and results of operations.
The nature of our products and business is such that we have to comply with a complex set of compliance standards, including but not limited to the Lacey Act, consumer and product safety, environmental regulations. We operate our business in accordance with standards and procedures designed to comply with the applicable laws and regulations in these areas and work closely with our suppliers in order to comply with such laws and regulations. Compliance can require timely and costly procedures including but not limited to tracing raw materials, testing against emission standards, and maintaining vigorous quality assurance standards. If we violate or are alleged to have violated these laws, we could incur significant costs, be liable for damages, experience delays in shipments of our products, be subject to fines, penalties, criminal charges or other legal risks, or suffer reputational harm, any of
11
which could reduce demand for our products and adversely affect our business, financial condition and operating results. In addition, there can be no assurance that such laws or regulations will not become more stringent in the future or that we will not incur additional costs in the future in order to comply with such laws or regulations.
Our insurance coverage and self-insurance reserves may not cover existing or future claims.
In the ordinary course of business, we may incur property, casualty or other losses not covered by our insurance. We maintain various insurance policies, including directors' and officers' insurance, as well as the following:
For policies under which we are responsible for losses, we record a liability that represents our estimated cost of claims incurred and unpaid as of the balance sheet date. Unanticipated changes may produce materially different amounts of expense than those recorded, which could adversely impact our operating results. Additionally, our experience could limit our ability to obtain satisfactory insurance coverage, subjecting us to further loss, or could require significantly increased premiums.
Federal, state or local laws and regulations, including tariffs, or our failure to comply with such laws and regulations related to our products could increase our expenses, restrict our ability to conduct our business and expose us to legal risks.
We are subject to a wide range of general and industry-specific laws and regulations imposed by federal, state and local authorities in the countries in which we operate, including those related to tariffs, customs, foreign operations (such as the Foreign Corrupt Practices Act), truth-in-advertising, consumer protection, privacy, zoning and occupancy matters as well as the operation of retail stores and warehouses, production and distribution facilities and provision of installation services. In addition, various federal, provincial and state laws govern our relationship with and other matters pertaining to our associates, including wage and hour-related laws. If we fail to comply with these laws and regulations, we could be subject to legal risk, our operations could be impacted negatively, and our reputation could be damaged. Likewise, if such laws and regulations should change, our costs of compliance may increase, thereby impacting our results and our profitability.
Certain portions of our operations are subject to laws and regulations governing hazardous materials and wastes, the remediation of contaminated soil and groundwater, and the health and safety of associates. If we are unable to comply with, extend or renew a material approval, license or permit required by such laws, or if there is a delay in renewing any material approval, license or permit, our net sales and operating results could deteriorate or otherwise cause harm to our business.
With regard to our products, we spend significant resources in order to comply with applicable advertising, importation, exportation, environmental and health and safety laws and regulations. If we should violate these laws and regulations, we could experience delays in shipments of our goods, be subject to fines, penalties, criminal charges, or other legal risks, be liable for costs and damages, or suffer reputational harm, which could reduce demand for our merchandise and hurt our business and results of operations. Further, if such laws and regulations should change, we may experience increased costs in order to adhere to the new standards.
Risks Related to Our Suppliers, Products and Product Sourcing
Our ability and cost to obtain cost-effective products, especially from Asia and other international suppliers, and the operations of many of our international suppliers are subject to risks that may be beyond our control and that could harm our operations and profitability.
We rely on a select group of international suppliers to provide us with imported flooring products that meet our specifications. In 2022, our imported product was sourced from Asia, Europe, and South America. As a result, we are subject to risks associated with obtaining products from abroad, including:
12
During 2022, approximately 14% of our product was sourced from China down from 20% a year ago. Included in merchandise inventories are tariff-related costs, including Section 301 tariffs on certain products imported from China in recent years. In November 2019, a subset of these imports for certain click vinyl and other engineered products (the “Subset Products”) received an exemption that was made retroactive to the initial levying of the Section 301 Tariffs. However, as of August 7, 2020, the exclusions on subset products expired and certain flooring products imported from China were again subject to a 25% Section 301 tariff. Potential costs and any attendant impact on pricing arising from these tariffs could have a material adverse effect on our results of operations, financial condition, and liquidity.
These and other factors beyond our control could disrupt the ability of our suppliers to ship certain products to us cost-effectively or at all, which could harm our operations. If our product costs and consumer demand are adversely affected by foreign trade issues (including import tariffs and other trade restrictions with China), our sales and profitability may suffer.
Failure to identify and develop relationships with a sufficient number of qualified suppliers could affect our ability to obtain products that meet our high quality standards.
We purchase flooring directly from mills located around the world. We believe that these direct supplier relationships are important to our business. In order to retain the competitive advantage that we believe results from these relationships, we need to continue to identify, develop and maintain relationships with qualified suppliers that can satisfy our high standards for quality and our requirements for the delivery of hard-surface materials in a timely and efficient manner. We expect the need to develop new relationships to be particularly important as we seek to expand our operations, enhance our product offerings, and expand our product assortment and geographic source of origin in the future and to mitigate reliance on existing key relationships. Any inability to do so could reduce our competitiveness, slow our plans for further expansion and cause our net sales and operating results to deteriorate.
We rely on a concentrated number of suppliers for a significant portion of our supply needs. We generally do not have long-term contracts with our suppliers. In the future, our suppliers may be unable to supply us, or supply us on acceptable terms, due to various factors, which could include political instability in the supplier’s country, insufficient production capacity, product line failures, collusion, a supplier’s financial instability, inability or refusal to comply with applicable laws, trade restrictions, tariffs or our standards, duties, insufficient transport capacity and other factors beyond our control. In these circumstances, we could experience deterioration in our net sales and operating results.
The Company and third-party suppliers on whom we rely source a significant portion of the merchandise we sell from Asia, which exposes us to the risk of supply chain disruptions.
Beginning in 2020, the United States Government took significant steps to address the forced labor concerns in the Xinjiang Uyghur Autonomous Region of China ("Xinjiang Region"), including withhold release orders (“WROs") issued by United States Customs and Border Protection (“CBP”). The WROs allow CBP to detain and deny entry of imports suspected of containing raw materials from Xinjiang, regardless of the origin of the finished products. This affected global supply chains, including those industries whose products are reliant upon polysilicon, tomatoes and cotton. In June 2022, the Uyghur Forced Labor Prevention Act (“UFLPA”) went into effect, which presumes goods produced in the Xinjiang Region, or with labor linked to specified Chinese government-sponsored labor programs, were produced using forced labor and prohibits importation of such goods into the United States absent clear and convincing evidence proving otherwise. In February 2023, CBP expanded its enforcement focus beyond the high priority sectors identified in the UFLPLA (i.e., cotton, tomatoes and polysilicon) to include additional sectors including aluminum products and polyvinyl chloride (PVC) products.
In February 2023, the Company began to receive detention notices from CBP related to flooring products that contain PVC. The Company is working with its affected vendors to provide the requested documentation to CBP to show that the affected products do not contain any inputs from the Xinjiang Region, in compliance with the Company’s Standards for Vendor Partner Conduct and in compliance with certifications the Company has required of vendors related to the UFLPA. While the Company works to provide the requested documentation to CBP, we will incur costs related to storage, transportation and extra handling. The Company also expects this process to adversely impact our ability to obtain adequate inventory in the vinyl product category on a timely basis, which may result in lost sales, increased costs and an overall decrease in our profits. We are working to mitigate the impact of these customs delays by recommending to customers alternative products in our current assortment and leveraging our sourcing capabilities to look at alternative flooring categories and sourcing geographies. We cannot predict when, or the extent to which, CBP will release detained products or whether CBP will continue to issue new detention notices for additional vendors or products.
Failure of our suppliers to comply with applicable laws, use ethical practices, and meet our quality standards could result in our suspending purchasing from them, negatively impacting net sales, and could expose us to reputational and legal risks.
While our suppliers agree to operate in compliance with applicable laws and regulations and our vendor code of conduct, we do not control our suppliers. Accordingly, despite our continued investment in compliance and quality control, we cannot guarantee that
13
they comply with such laws and regulations or operate in a legal, ethical and responsible manner. While we monitor our suppliers’ adherence to our compliance and quality standards, there is no guarantee that we will be able to identify non-compliance, and it may be costly and complex to comply. Moreover, the failure of our suppliers to adhere to applicable legal requirements and the quality standards that we set for our products could lead to government investigations, litigation, write-offs and recalls, any of which could damage our reputation and our brands, increase our costs, and otherwise hurt our business.
Product liability claims could adversely affect our reputation, which could adversely affect our net sales and profitability.
We have faced and continue to face the risk of exposure to product liability claims in the event that the use of our products is alleged to have resulted in economic loss, personal injury, property damage, or violated environmental or other laws. In the event that any of our products proves to be defective or otherwise in violation of applicable laws, we may be required to recall or redesign such products. Further, in such instances, we may be subject to legal action. We maintain insurance against some forms of product liability claims, but such coverage may not be available or adequate for the liabilities actually incurred. A successful claim brought against us in excess of available insurance coverage, or any claim or product recall that results in significant adverse publicity against us, may have a material adverse effect on our net sales and operating results.
Our ability to offer hardwood flooring, particularly products made of certain species of hardwood, depends on the continued availability of sufficient suitable hardwood at reasonable cost.
Our business strategy depends on offering a wide assortment of hardwood flooring to our customers. We sell flooring made from species ranging from domestic maple, oak and pine to imported acacia, cherry, koa, mahogany and teak. Some of these species are difficult to source, and we cannot be assured of their continued availability. Our ability to obtain an adequate volume and quality of hard-to-find species depends on our suppliers’ ability to furnish those species, which, in turn, could be affected by many things including events such as forest fires, insect infestation, tree diseases, prolonged drought and other adverse weather and climate conditions. Government regulations relating to forest management practices also affect our suppliers’ ability to harvest or export timber, and changes to regulations and forest management policies, or the implementation of new laws or regulations, could impede their ability to do so. If our suppliers cannot deliver sufficient hardwood and we cannot find replacement suppliers, our net sales and operating results may be negatively impacted.
The cost of the various species of hardwood that are used in our products is important to our profitability. Hardwood lumber costs fluctuate as a result of a number of factors including changes in domestic and international supply and demand, labor costs, competition, market speculation, product availability, environmental restrictions, government regulation and trade policies, duties, weather conditions, processing and freight costs, and delivery delays and disruptions. We generally do not have long-term supply contracts or guaranteed purchase amounts. As a result, we may not be able to anticipate or react to changing hardwood costs by adjusting our purchasing practices, and we may not always be able to increase the selling prices of our products in response to increases in supply costs. If we cannot address changing hardwood costs appropriately, it could cause our operating results to deteriorate.
Risks Relating to Our Competitive Positioning
Ineffectiveness of our advertising strategy or inability to build sufficient awareness of the LL Flooring brand could result in reduced customer traffic, thereby impacting net sales and profitability.
Historically, we have used extensive advertising to encourage customers to drive to our stores, which were, at times, located some distance from population centers in areas that have lower rents than traditional retail locations. Initially, a significant portion of our advertising was directed only to consumers, whose needs with respect to their flooring purchases vary from Pros such as flooring installers, remodelers, and small to medium home builders. As our brand and marketing strategies continue to evolve, we have broadened the content of our advertising to increase the awareness of our great value, superior service and broad selection of high-quality, hard-surface flooring products. We largely completed the physical rebranding of our stores in 2022, however, consumer awareness of our brand transformation from Lumber Liquidators to LL Flooring is taking longer than expected. If our value proposition does not resonate with customers, we may not achieve desired return on investment resulting in declines in our net sales and operating results both in-store and through our digital platform.
Competition could cause price declines, decrease demand for our products and decrease our market share.
We operate in the hard-surface flooring industry, which is highly fragmented and competitive. We face significant competition from national and regional home improvement chains, national and regional specialty flooring chains, Internet-based companies and privately owned single-site enterprises. We compete on the basis of price, customer service, store location and the range, quality and availability of the hard-surface flooring that we offer our customers. If our positioning with regard to one or more of these factors should erode, deteriorate, fail to resonate with consumers or misalign with demand or expectations, our business and results may be negatively impacted.
14
Our competitive position is also influenced by the availability, quality and cost of merchandise, labor costs, distribution and sales efficiencies and our productivity compared to that of our competitors. Further, as we expand into new and unfamiliar markets, we may face different competitive environments than in the past. Likewise, as we continue to enhance and develop our product offerings, we may experience new competitive conditions.
Some of our competitors are larger organizations, have existed longer, are more diversified in the products they offer and have a more established market presence with substantially greater financial, marketing, personnel and other resources than we have. In addition, our competitors may forecast market developments more accurately than we do, develop products that are superior to ours, produce similar products at a lower cost or adapt more quickly to new technologies or evolving customer requirements than we do. Intense competitive pressures from one or more of our competitors could cause price declines, decrease demand for our products and decrease our market share.
Hard-surface flooring may become less popular as compared to other types of floor coverings in the future. For example, our products are made using various hardwood species, and concern over the environmental impact of tree harvesting could shift consumer preferences towards synthetic or inorganic flooring. In addition, hardwood flooring competes against carpet, vinyl sheet, vinyl tile, ceramic tile, natural stone and other types of floor coverings. If consumer preferences shift toward types of floor coverings that we do not sell, we may experience decreased demand for our products.
All of these competitive factors may harm us and reduce our net sales and operating results.
Risks Related to Economic Factors and Our Access to Capital
Cyclicality in the home flooring industry, coupled with our lack of diversity in our line of business, could cause volatility and risk to our business.
The hard-surface flooring industry is highly dependent on the remodeling of existing homes and new home construction. Remodeling and new home construction are cyclical and depend on a number of factors which are beyond our control, including interest and inflation rates, tax policy, real estate prices, employment levels, consumer confidence, credit availability, demographic trends, weather conditions, natural disasters and general economic conditions.
In the event of a decrease in discretionary spending, home remodeling activity or new home construction, any of which could be due to slower growth or recession, increasing interest rates, increasing unemployment or inflation, demand for our products, including hard-surface flooring, could be impacted negatively and our business and operating results could be harmed.
The inability to access our Revolving Credit Facility or other sources of capital, could cause our financial position, liquidity, and results of operations to suffer.
We have relied on and expect to continue to rely on a bank credit agreement to fund our needs for working capital. Information with respect to our Revolving Credit Facility may be found in Note 4, “Credit Agreement”, to the consolidated financial statements in Item 8 of Part II, which is incorporated herein by reference. Our access to the Revolving Credit Facility depends on our ability to meet the conditions for borrowing, including that all representations are true and correct at the time of the borrowing. Our failure to meet these requirements or obtain additional or alternative sources of capital could impact:
Risks Related to Our Information Technology
If our management information systems, including our digital platform or our customer contact center, experience disruptions, it could disrupt our business and reduce our net sales.
We depend on our management information systems to integrate the activities of our stores, digital platform and customer contact center, to process orders, make outgoing calls to customers, to respond to customer inquiries, to manage inventory, to purchase merchandise and to sell and ship goods on a timely basis. We may experience operational problems with our information systems as a result of system failures, viruses, computer “hackers” or other causes. We may incur significant expenses in order to repair any such operational problems. Any significant disruption or slowdown of our systems could cause information, including data related to customer orders, to be lost or delayed, which could result in delays in the delivery of products to our stores and customers or lost sales. For example, as we previously disclosed in August 2019, we experienced a malicious network security incident during that year for approximately a week that prevented access to several of our information technology systems and data within our networks. Based on the nature of the network security incident, the impact on our information technology systems and the results of the forensic IT
15
analysis, we do not believe confidential customer, employee or company data was lost or disclosed. Moreover, our entire corporate network, including our telephone lines, is on an Internet-based network, which is vulnerable to certain risks and uncertainties, including changes in the required technology interfaces, digital platform downtime and other technical failures, security breaches and customer privacy concerns. Accordingly, if our network is disrupted or if we cannot successfully maintain our digital platform and customer contact center in good working order, we may experience delayed communications within our operations and between our customers and ourselves and may not be able to communicate at all via our network, including via telephones connected to our network, which may result in lost sales, reputational harm, or impacts to operating results.
In addition, we are currently making, and expect to continue to make, investments in our management information systems, infrastructure and personnel, in certain cases with the assistance of strategic partners and other third-party service providers. These investments involve replacing existing systems, some of which are older, legacy systems that are less flexible and efficient, with successor systems; outsourcing certain technology and business processes to third-party service providers; making changes to existing systems, including the migration of applications to the cloud; maintaining or enhancing legacy systems that are not currently being replaced; or designing or cost-effectively acquiring new systems with new functionality. These efforts can result in significant potential risks, including failure of the systems to operate as designed, potential loss or corruption of data, changes in security processes and internal controls, cost overruns, implementation delays or errors, disruption of operations, and the potential inability to meet business and reporting requirements. Any system implementation and transition difficulty may result in operational challenges, security failures, reputational harm, and increased costs that could adversely affect our business operations and results of operations.
We may incur costs and losses resulting from security risks we face in connection with our electronic processing, transmission and storage of confidential customer information.
We accept electronic payment cards for payment in our stores and through our customer contact center. In addition, our online operations depend upon the secure transmission of confidential information over public networks, including information permitting cashless payments. As a result, we may become subject to claims for purportedly fraudulent transactions arising out of the actual or alleged theft of credit or debit card information, and we may also be subject to lawsuits or other proceedings relating to these types of incidents. Further, a compromise of our security systems that results in our customers’ personal information being obtained by unauthorized persons could adversely affect our reputation with our customers and others, as well as our operations, results of operations and financial condition, and could result in litigation against us or the imposition of penalties. A security breach could also require that we expend significant additional resources related to the security of information systems and could result in a disruption of our operations, particularly our online sales operations.
Additionally, privacy and information security laws and regulations change, and compliance with them may result in cost increases due to necessary systems changes and the development of new administrative processes. If we fail to comply with these laws and regulations or experience a data security breach, our reputation could be damaged, possibly resulting in lost future business, and we could be subjected to additional legal risk as a result of non-compliance.
Failure to maintain satisfactory compliance with certain privacy and data protections laws and regulations may subject us to substantial negative financial consequences and civil or criminal penalties.
Complex local, state, national, foreign and international laws and regulations apply to the collection, use, retention, protection, disclosure, transfer and other processing of personal data. These privacy and data protection laws and regulations are quickly evolving, with new or modified laws and regulations proposed and implemented frequently and existing laws and regulations subject to new or different interpretations and enforcement. For example, California enacted legislation, the California Consumer Privacy Act (“CCPA”). The CCPA requires, among other things, covered companies to provide new disclosures to California consumers and allows such consumers new abilities to opt-out of certain sales of personal data. The CCPA also provides for civil penalties for violations as well as a private right of action for data breaches that may increase data breach litigation. Further, the California Privacy Rights Act, which was passed in November 2020 and is fully effective in January 2023, significantly modifies the CCPA. Colorado, Connecticut, Utah and Virginia recently enacted similar data privacy legislation that will also take effect in 2023, and several other states and countries are considering expanding or passing privacy laws in the near term. These modifications and new laws will require us to incur additional costs and expenses in our efforts to comply. Our failure to comply with applicable laws and regulations or other obligations to which we may be subject relating to personal data, or to protect personal data from unauthorized access, use or other processing, could result in enforcement actions and regulatory investigations against us, claims for damages by customers and other affected individuals, fines, damage to our brand reputation, any of which could have a material adverse effect on our operations, financial performance and business.
Alternative e-commerce and online shopping offerings may erode our customer base and adversely affect our business.
Our long-term future depends heavily upon the general public’s willingness to use our stores as a means to purchase goods. In recent years, e-commerce has become more widely accepted as a means of purchasing consumer goods and services, which could adversely impact customer traffic in our stores. Additionally, certain of our competitors offer alternative e-commerce and online shopping. If consumers use alternative e-commerce and online shopping offerings to conduct business as opposed to our store locations, it could materially adversely impact our net sales and operating results.
16
Risks Relating to Our Common Stock
Our common stock price may be volatile and all or part of any investment in our common stock may be lost.
The market price of our common stock could fluctuate significantly based on various factors, including, but not limited to:
In addition, the stock market may experience significant price and volume fluctuations. These fluctuations may be unrelated to the operating performance of particular companies but may cause declines in the market price of our common stock. The price of our common stock could fluctuate based upon factors that have little or nothing to do with us or our performance.
Our anti-takeover defense provisions may cause our common stock to trade at market prices lower than it might absent such provisions.
Our certificate of incorporation and bylaws contain provisions that may make it more difficult or expensive for a third party to acquire control of us without the approval of our board of directors. These provisions include a staggered board, the availability of “blank check” preferred stock, provisions restricting stockholders from calling a special meeting of stockholders or from taking action by written consent and provisions that set forth advance notice procedures for stockholders’ nominations of directors and proposals of topics for consideration at meetings of stockholders. Our certificate of incorporation also provides that Section 203 of the Delaware General Corporation Law, which relates to business combinations with interested stockholders, applies to us. These provisions may delay, prevent or deter a merger, or other transaction that might otherwise result in our stockholders receiving a premium over the market price for their common stock. In addition, these provisions may cause our common stock to trade at a market price lower than it might absent such provisions.
Item 1B. Unresolved Staff Comments.
None.
17
Item 2. Properties.
As of February 24, 2023, we operated 442 stores located in 47 states, with no new store openings or closings since December 31, 2022. The table below sets forth the locations (alphabetically by state) of our 442 stores in operation as of February 24, 2023.
State |
Stores |
|
State |
Stores |
|
State |
Stores |
|
State |
Stores |
Alabama |
7 |
|
Iowa |
3 |
|
Nebraska |
2 |
|
Rhode Island |
1 |
Arizona |
7 |
|
Kansas |
3 |
|
Nevada |
3 |
|
South Carolina |
10 |
Arkansas |
3 |
|
Kentucky |
5 |
|
New Hampshire |
5 |
|
South Dakota |
2 |
California |
43 |
|
Louisiana |
6 |
|
New Jersey |
15 |
|
Tennessee |
9 |
Colorado |
10 |
|
Maine |
3 |
|
New Mexico |
1 |
|
Texas |
31 |
Connecticut |
7 |
|
Maryland |
9 |
|
New York |
22 |
|
Utah |
3 |
Delaware |
4 |
|
Massachusetts |
12 |
|
North Carolina |
18 |
|
Vermont |
1 |
Florida |
33 |
|
Michigan |
13 |
|
North Dakota |
1 |
|
Virginia |
18 |
Georgia |
12 |
|
Minnesota |
7 |
|
Ohio |
15 |
|
Washington |
11 |
Idaho |
2 |
|
Mississippi |
4 |
|
Oklahoma |
3 |
|
West Virginia |
5 |
Illinois |
16 |
|
Missouri |
8 |
|
Oregon |
9 |
|
Wisconsin |
8 |
Indiana |
10 |
|
Montana |
1 |
|
Pennsylvania |
21 |
|
|
|
We lease all of our stores as well as our corporate headquarters, which is located in Richmond, Virginia. The corporate headquarters location is approximately 53,000 square feet. We currently lease space near the headquarters location as a satellite office for various administrative functions.
In addition, we own a one million square foot distribution center on approximately 100 acres of land in Henrico County, Virginia, near Richmond. We lease a 504,016 square foot facility in Pomona, California, which, along with our facility in Virginia, serve as our primary distribution facilities.
Item 3. Legal Proceedings.
Information with respect to this item may be found in Note 10, “Commitments and Contingencies”, to the consolidated financial statements in Item 8 of Part II, which is incorporated herein by reference.
Item 4. Mine Safety Disclosures.
None.
PART II
Item 5. Market for Registrant’s Common Equity, Related Stockholder Matters and Issuer Purchases of Equity Securities.
Market Information
Our common stock trades on the New York Stock Exchange (“NYSE”) under the trading symbol “LL.” We are authorized to issue up to 35,000,000 shares of common stock, par value $0.001. Total shares of common stock outstanding on February 24, 2023 were 29,257,456, and we had five stockholders of record.
Issuer Purchases of Equity Securities
The following table presents our share repurchase activity for the quarter ended December 31, 2022 (dollars in thousands, except per share amounts):
|
|
|
|
|
|
|
|
Total Number |
|
|
Maximum Dollar Value |
|
||||
|
|
|
|
|
|
|
|
of Shares |
|
|
of Shares That May Yet |
|
||||
|
|
|
|
|
|
|
|
Purchased as |
|
|
Be Purchased as |
|
||||
|
|
Total Number |
|
|
Average |
|
|
Part of Publicly |
|
|
Part of Publicly |
|
||||
|
|
of Shares |
|
|
Price Paid |
|
|
Announced |
|
|
Announced |
|
||||
Period |
|
Purchased2 |
|
|
Per Share2 |
|
|
Programs |
|
|
Programs1 |
|
||||
October 1, 2022 to October 31, 2022 |
|
|
— |
|
|
|
— |
|
|
|
— |
|
|
|
43,000 |
|
November 1, 2022 to November 30, 2022 |
|
|
5,750 |
|
|
$ |
8.02 |
|
|
|
— |
|
|
|
43,000 |
|
December 1, 2022 to December 31, 2022 |
|
|
— |
|
|
|
— |
|
|
|
— |
|
|
|
43,000 |
|
Total |
|
|
5,750 |
|
|
$ |
8.02 |
|
|
|
— |
|
|
|
43,000 |
|
18
1 In January 2012, the Company’s board of directors adopted an authorization for the repurchase of up to a total of $50.0 million of the Company’s common stock, which it increased by $50.0 million in each of November 2012 and January 2014. In February 2022, the board of directors further increased this authority by an additional $35.3 million for a total authorization to repurchase up to $50.0 million of the Company’s common stock on the open market or in private transactions. In April 2022, the Company resumed its share repurchase program. The Company made cash payments of $7.0 million to repurchase 571,332 shares under the share repurchase authorization during the second quarter of 2022. As of December 31, 2022, there remains $43.0 million outstanding under the share repurchase authorization, which does not have an expiration date.
2 The table above reflects repurchases of 5,750 shares of our common stock, at an average price of $8.02, in connection with the net settlement of shares issued as a result of the vesting of restricted shares during the quarter ended December 31, 2022.
Dividend Policy
We have never paid any dividends on our common stock and do not expect to pay them in the near future.
Securities Authorized for Issuance under Equity Compensation Plans
See Item 12. “Security Ownership of Certain Beneficial Owners and Management and Related Stockholder Matters” for information regarding securities authorized for issuance under our equity compensation plans.
19
Performance Graph
The following graph compares the performance of our common stock during the period beginning December 31, 2017 through December 31, 2022, to that of the total return index for the NYSE Composite, S&P Retail Select Industry Index, and Peer Group whose members are listed below assuming an investment of $100 on December 31, 2017. Effective December 31, 2022, the Company has elected to transition from a Peer Group to a Published Industry Index, the S&P Retail Select Industry Index. The Company notes the transition to the Published Industry Index allows the Company to capture a more holistic view of consumer discretionary spending at similar size, small cap companies to benchmark specialty retail. In calculating total annual stockholder return, reinvestment of dividends, if any, is assumed. The indices are included for comparative purpose only. They do not necessarily reflect management’s opinion that such indices are an appropriate measure of the relative performance of our common stock.
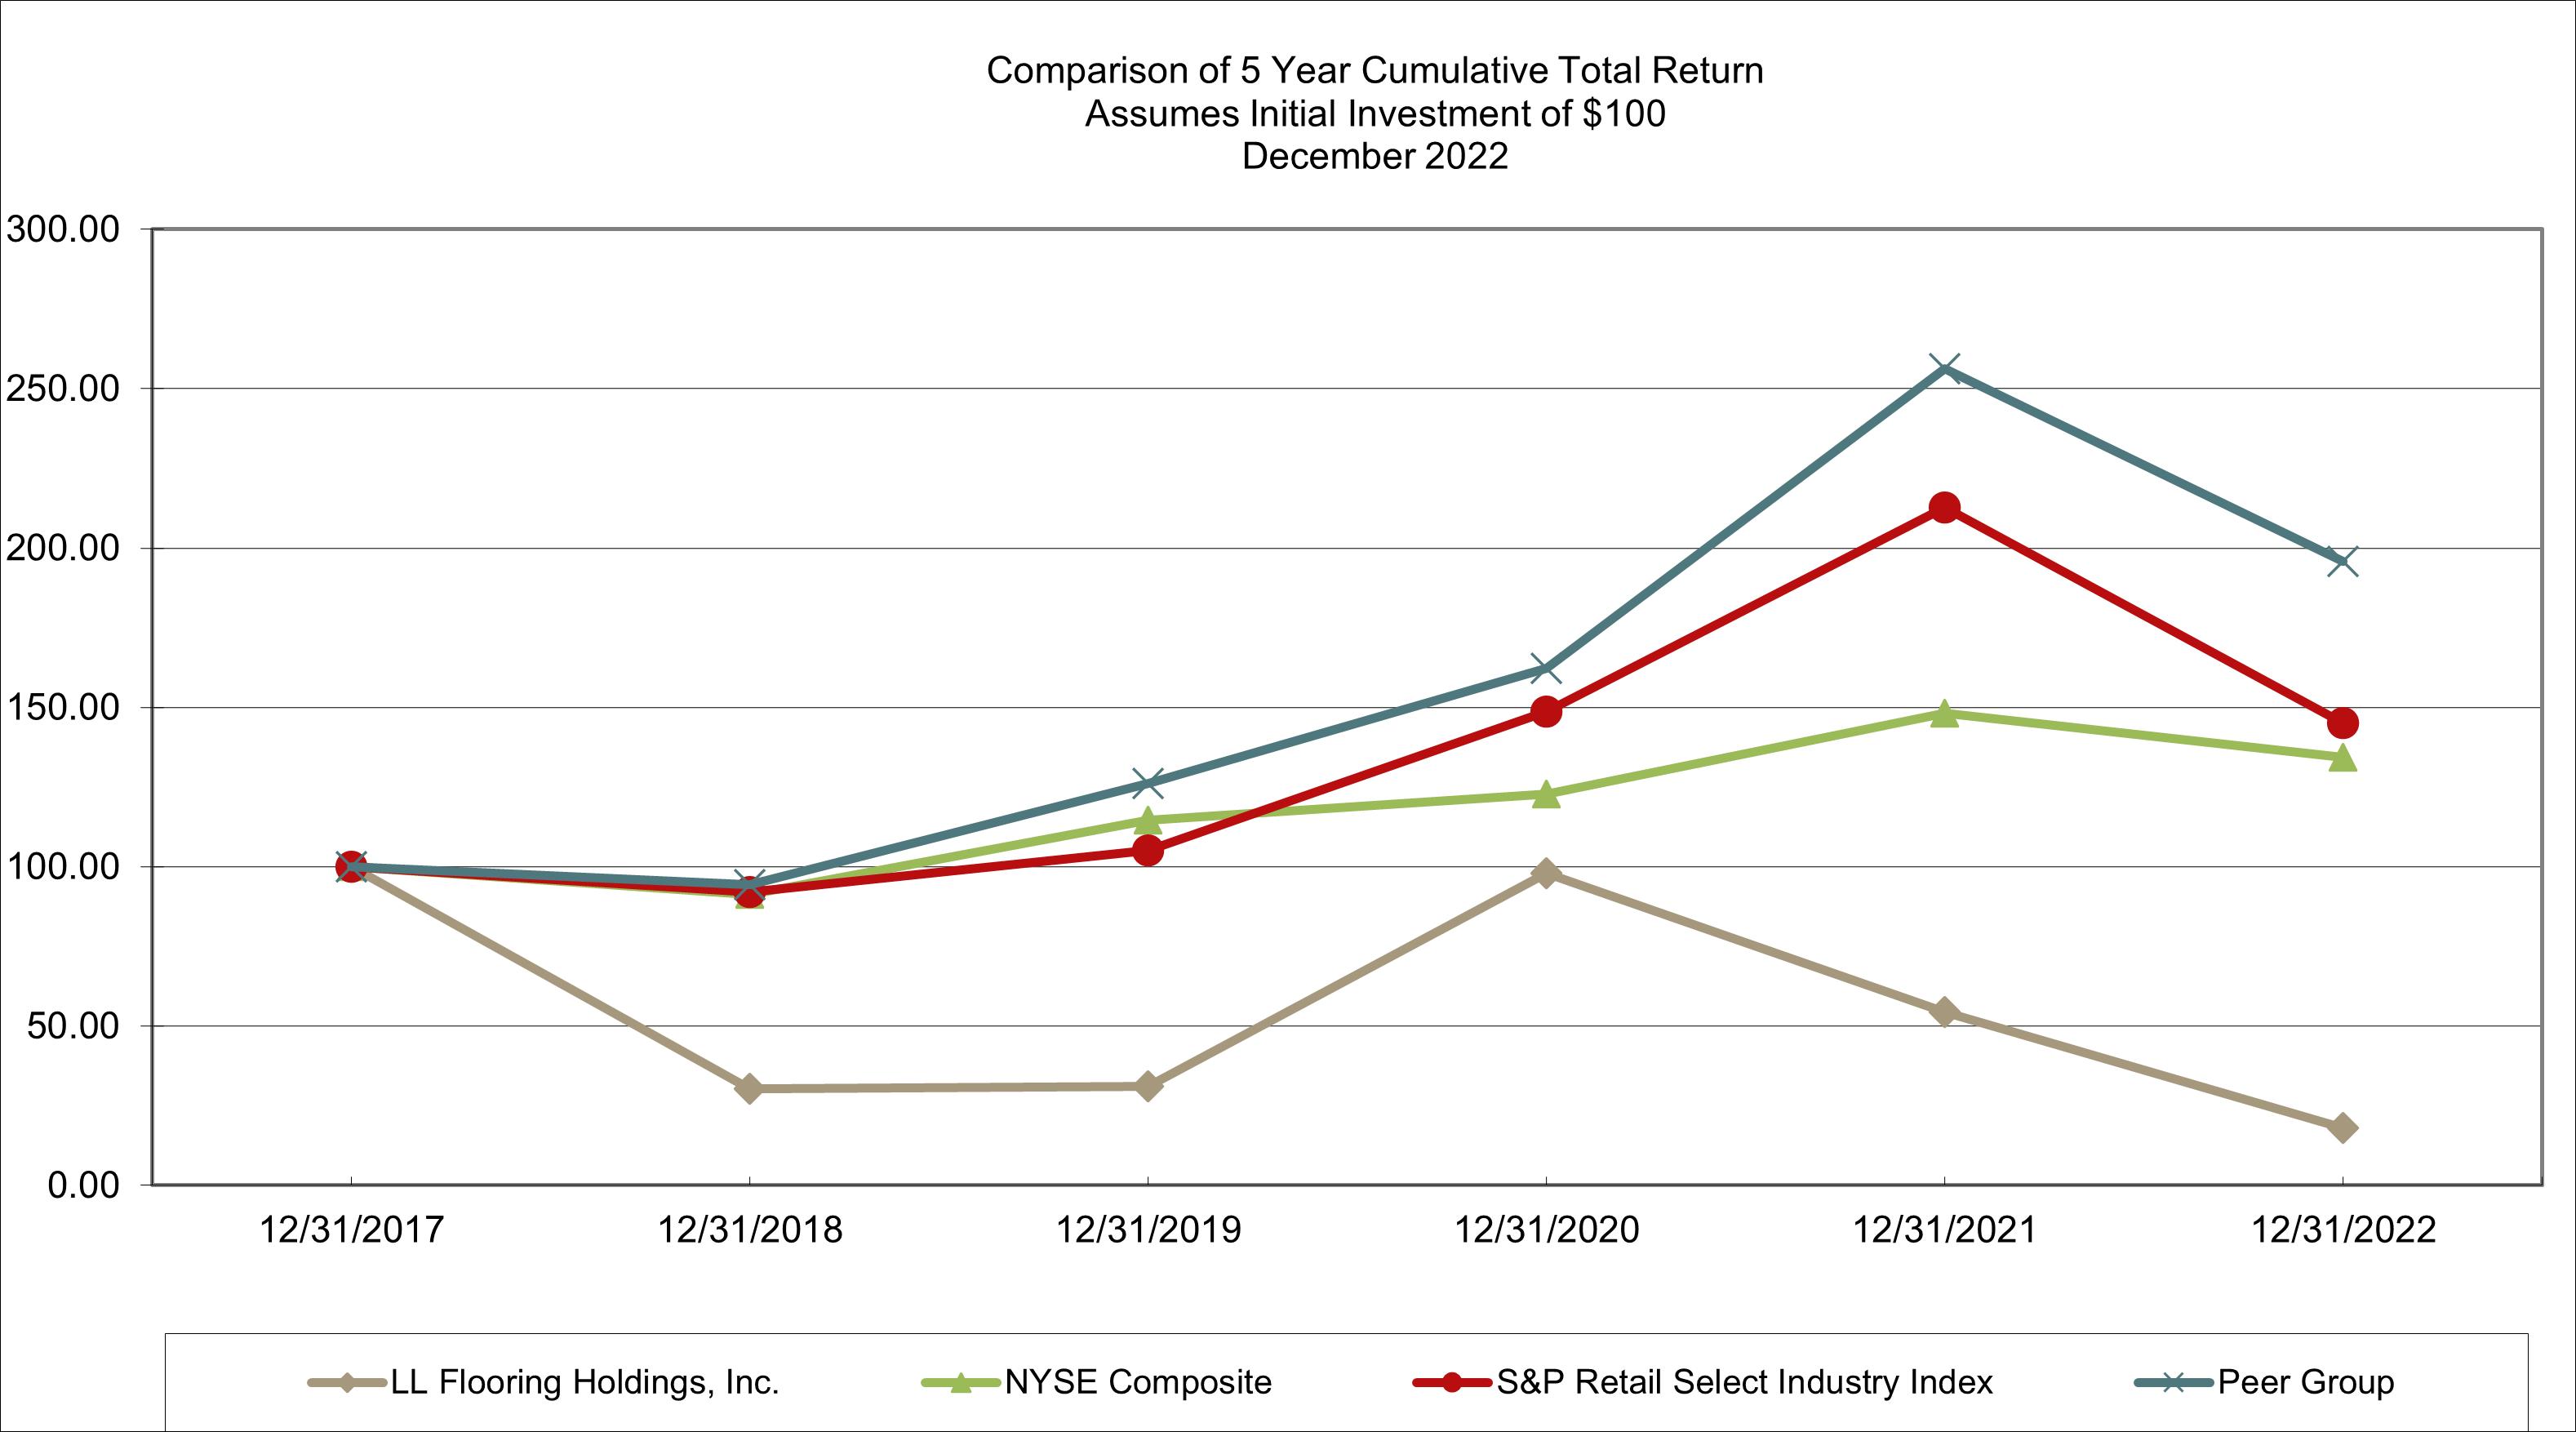
|
|
12/31/2017 |
|
|
12/31/2018 |
|
|
12/31/2019 |
|
|
12/31/2020 |
|
|
12/31/2021 |
|
|
12/31/2022 |
|
||||||
LL Flooring Holdings, Inc. |
|
|
100.00 |
|
|
|
30.33 |
|
|
|
31.12 |
|
|
|
97.93 |
|
|
|
54.38 |
|
|
|
17.90 |
|
NYSE Composite |
|
|
100.00 |
|
|
|
91.21 |
|
|
|
114.69 |
|
|
|
122.70 |
|
|
|
148.07 |
|
|
|
134.22 |
|
S&P Retail Select Industry Index1 |
|
|
100.00 |
|
|
|
92.12 |
|
|
|
104.99 |
|
|
|
148.70 |
|
|
|
212.60 |
|
|
|
145.17 |
|
Peer Group1 |
|
|
100.00 |
|
|
|
94.36 |
|
|
|
126.15 |
|
|
|
162.16 |
|
|
|
256.24 |
|
|
|
195.82 |
|
Item 6. [Reserved].
None.
20
Item 7. Management’s Discussion and Analysis of Financial Condition and Results of Operations.
Overview
LL Flooring is one of the leading specialty retailers of hard-surface flooring in the U.S. with 442 stores as of December 31, 2022. Our Company seeks to offer the best customer experience online and in stores, with more than 500 varieties of hard-surface floors featuring a range of quality styles and on-trend designs. Our online tools also help empower customers to find the right solution for the space they’ve envisioned. Our extensive selection includes waterproof hybrid resilient, waterproof vinyl plank, solid and engineered hardwood, laminate, bamboo, tile, and cork, with a wide range of flooring enhancements and accessories to complement. Our stores are staffed with flooring experts who provide advice, Pro partnership services, and installation options for all of our products, the majority of which are in stock and ready for delivery. Our vision is to be the customers' first choice in hard-surface flooring by providing the best experience, from start to finish. We offer the accessible flooring expertise and high-touch service of a local store, combined with the value, omni-channel convenience and product availability of a national brand. We plan to leverage this advantage to differentiate ourselves in the highly fragmented flooring market.
To supplement the financial measures prepared in accordance with GAAP, we use the following non-GAAP financial measures: (i) Adjusted Gross Profit; (ii) Adjusted Gross Margin; (iii) Adjusted SG&A; (iv) Adjusted SG&A as a Percentage of Net Sales; (v) Adjusted Operating (Loss) Income; (vi) Adjusted Operating Margin; (vii) Adjusted Other Expense; (viii) Adjusted Other Expense as a Percentage of Net Sales; (ix) Adjusted (Loss) Earnings; and (x) Adjusted (Loss) Earnings per Diluted Share. These non-GAAP financial measures should be viewed in addition to, and not in lieu of, financial measures calculated in accordance with GAAP. These supplemental measures may vary from, and may not be comparable to, similarly titled measures by other companies.
The non-GAAP financial measures are presented because we believe the non-GAAP financial measures provide useful information to management and investors regarding certain financial and business trends related to our financial condition and results of operations, These measures provide an additional tool for investors to use in evaluating our ongoing operating performance, and management, in certain cases, uses them to determine incentive compensation. The presented non-GAAP financial measures exclude items that management does not believe reflect our core operating performance, which include regulatory and legal settlements and associated legal and operating costs, changes in antidumping and countervailing duties, and goodwill impairment, as such items are outside of our control or due to their inherent unusual, non-operating, unpredictable, non-recurring, or non-cash nature. Reconciliations of these non-GAAP financial measures are provided on the pages that follow (certain numbers may not sum due to rounding).
Executive Summary
2022 was a challenging year for LL Flooring. We are disappointed that we did not deliver on the net sales and profitability growth that we expected. To that end, we reported comparable store sales down 5.8% as double-digit growth in sales to Pro customers was more than offset by a decrease in sales to consumers. This was combined with an operating loss due to continued material and transportation cost headwinds impacting gross margin, and a higher cost structure reflecting the investments made in our strategic growth initiatives that we expect will generate strong returns over the longer term.
In the near term, we continue to navigate a dynamic macroeconomic environment.
In addition to macroeconomic uncertainty, during the first quarter, we began experiencing customs delays relating to certain shipments of vinyl flooring originating from Vietnam. In February 2023, U.S. Customs and Border Protection (“CBP”) added aluminum and polyvinyl chloride to a list of categories including cotton, tomatoes and polysilicon for which CBP has the ability to request additional documentation from importers. We began to receive notices requesting such additional documentation for some shipments.
We require our vendors to follow our strict guidelines on responsible sourcing, we obtain periodic certifications from them concerning compliance with these standards and we perform audit procedures of their supply chain documentation. While we are working with CBP to provide requested documentation, we do not know how long their review of the documentation will take.
Based on what we know today, the customs delays could have a material impact on 2023 full year operating income due to lost sales and higher inventory carrying costs.
We are working to partially mitigate the disruptions from the customs delays by featuring alternative products in our current assortment and leveraging our sourcing capabilities to look at alternative flooring categories and sourcing geographies. See “Risk Factor – The Company and third-party suppliers on whom we rely source a significant portion of the merchandise we sell from Asia, which exposes us to the risk of supply chain disruptions.”
21
Despite these near-term challenges, we are confident the long-term fundamentals of our business are strong, and we remain focused on our strategy to deliver long-term growth driven by our six pillars:
We believe we are successfully gaining traction on several of our operating strategies, which gives us confidence in achieving long-term sustainable growth. In particular, we are very excited about our Pro strategy and continued product innovation. We remain focused on executing more consistently against our growth strategies while continuing to work on aligning our cost structure.
Highlights for the year ended December 31, 2022 were as follows:
Other Items
22
Liquidity, Working Capital and Credit Agreement
As of December 31, 2022, we had liquidity of $135.6 million, consisting of excess availability under our Credit Agreement of $124.8 million, and cash and cash equivalents of $10.8 million. This represents a decrease in liquidity of $91.9 million from December 31, 2021, primarily driven by the rebuilding of inventory in line with its strategy to offer a compelling assortment of trend-right products close to its customers. During 2022, the Company rebuilt its inventory by more than $77 million.
In January 2012, the Company’s board of directors adopted an authorization for the repurchase of up to a total of $50.0 million of the Company’s common stock, which it increased by $50.0 million in each of November 2012 and January 2014. In February 2022, the board of directors further increased this authority by an additional $35.3 million for a total authorization to repurchase up to $50.0 million of the Company’s common stock on the open market or in private transactions. In April 2022, the Company resumed its share repurchase program. The Company made cash payments of $7.0 million to repurchase 571,332 shares under the share repurchase authorization during the second quarter of 2022. As of December 31, 2022, there remains $43.0 million outstanding under the share repurchase authorization, which does not have an expiration date. The timing and amount of any share repurchases under the authorization will be determined in the Company's discretion and based on market conditions and other considerations. Share repurchases under the authorizations may be made through open market purchases or pursuant to pre-set trading plans meeting the requirements of Rule 10b5-1 under the Securities Exchange Act of 1934. The program does not obligate LL Flooring to acquire any particular amount of its common stock, and the repurchase program may be suspended or discontinued at any time at the Company’s discretion.
We believe that cash flows from operations, together with cash on hand, and the availability under our Credit Agreement will be sufficient to meet our obligations and fund our settlements, operations, anticipated capital expenditures, and potential share repurchases for the next 12 months. The Company expects to generate positive cash flow from operations as inventory purchases return to more historic levels. We prepare our forecasted cash flow and liquidity estimates based on assumptions that we believe to be reasonable but are also inherently uncertain. Actual future cash flows could differ from these estimates.
Impact of Macroeconomic Environment
We continue to navigate uncertainty in the macroeconomic environment due to consumer confidence, inflation, volatile mortgage rates impacting housing affordability and lower existing home sales. The Company will continue to monitor the competitive pricing environment to inform its pricing and promotion strategies.
Section 301 Tariffs
The Company’s financial statements have been impacted by Section 301 tariffs on certain products imported from China in recent years. The tariffs flow through the income statement as the product is sold. The Company has deployed strategies to mitigate tariffs and improve gross margin, primarily through adjusting its pricing and promotion strategies and alternative country sourcing. During the fiscal year ended December 31, 2022, the Company reduced the percentage of merchandise receipts subject to Section 301 tariffs to 14% from 20% for the fiscal year ended December 31, 2021.
As discussed in Item 8, Note 10 to the consolidated financial statements, the Company is unable to predict the timing or outcome of the ruling by the USTR and/or CIT. If these appeals are successful, the Company should qualify for refunds on these Section 301 tariffs.
23
Results of Operations
We believe the selected sales data, the percentage relationship between Net Sales and major categories in the Consolidated Statements of Operations and the percentage change in the dollar amounts of each of the items presented below are important in evaluating the performance of our business operations.
|
|
|
|
|
|
|
|
% Increase |
|
|||
|
|
% of Net Sales |
|
|
in Dollar |
|
||||||
|
|
Year Ended December 31, |
|
|
2022 |
|
||||||
|
|
2022 |
|
|
2021 |
|
|
vs. 2021 |
|
|||
Net Sales |
|
|
|
|
|
|
|
|
|
|||
Net Merchandise Sales |
|
|
86.2 |
% |
|
|
86.3 |
% |
|
|
(3.6 |
)% |
Net Services Sales |
|
|
13.8 |
% |
|
|
13.7 |
% |
|
|
(3.6 |
)% |
Total Net Sales |
|
|
100.0 |
% |
|
|
100.0 |
% |
|
|
(3.6 |
)% |
Gross Profit |
|
|
36.1 |
% |
|
|
38.2 |
% |
|
|
(8.8 |
)% |
Selling, General and Administrative Expenses |
|
|
37.2 |
% |
|
|
33.6 |
% |
|
|
6.6 |
% |
Operating (Loss) Income |
|
|
(1.1 |
)% |
|
|
4.6 |
% |
|
|
(122.2 |
)% |
Other Expense (Income) |
|
|
0.1 |
% |
|
|
— |
% |
|
|
(1846.2 |
)% |
(Loss) Income Before Income Taxes |
|
|
(1.2 |
)% |
|
|
4.6 |
% |
|
|
(125.6 |
)% |
Income Tax (Benefit) Expense |
|
|
(0.1 |
)% |
|
|
1.0 |
% |
|
|
(113.1 |
)% |
Net (Loss) Income |
|
|
(1.1 |
)% |
|
|
3.6 |
% |
|
|
(129.0 |
)% |
|
|
|
|
|
|
|
|
% Increase |
|
|||
|
|
|
|
|
in Dollar |
|
||||||
|
|
Year Ended December 31, |
|
|
2022 |
|
||||||
|
|
2022 |
|
|
2021 |
|
|
vs. 2021 |
|
|||
SELECTED SALES DATA |
|
|
|
|
|
|
|
|
|
|||
Average Sale1 |
|
$ |
1,806 |
|
|
$ |
1,567 |
|
|
|
15.3 |
% |
Comparable Store Net Sales (Decrease) Increase2 |
|
|
(5.8 |
)% |
|
|
5.2 |
% |
|
|
|
|
Transaction Count Decrease3 |
|
|
(21.1 |
)% |
|
|
(11.5 |
)% |
|
|
|
|
Average Retail Price per Unit Sold Increase4 |
|
|
11.9 |
% |
|
|
8.2 |
% |
|
|
|
|
|
|
|
|
|
|
|
|
|
|
|||
Number of Stores Open, end of period |
|
|
442 |
|
|
|
424 |
|
|
|
|
|
Number of Stores Opened in Period, net of closures |
|
|
18 |
|
|
|
14 |
|
|
|
|
|
Number of Stores Relocated in Period5 |
|
|
4 |
|
|
|
1 |
|
|
|
|
|
A detailed discussion of the 2022 year-over-year changes can be found below and should be read in conjunction with the Consolidated Financial Statements and the Notes to Consolidated Financial Statements presented in this report. A detailed discussion of the 2021 year-over-year changes can be found in “Item 7. Management’s Discussion and Analysis of Financial Condition and Results of Operations” in the Form 10-K filed on February 23, 2022.
Net Sales
Net sales decreased $41.6 million, or 3.6%, to $1,110.7 million in 2022 from $1,152.3 million in 2021 and comparable store net sales decreased 5.8%. Double-digit growth in sales to Pro customers was more than offset by the decrease in sales to consumers.
Average sale increased 15.3% and average retail price per unit sold increased 11.9%, primarily due to the Company's pricing and promotion strategies to offset higher material and transportation costs as well as favorable product mix. This was more than offset by a 21.1% decrease in transaction count due primarily to lower consumer sales.
During 2022, the Company opened 18 new stores, bringing total stores to 442 as of December 31, 2022.
24
Gross Profit
Gross profit of $401.2 million in 2022 decreased $38.8 million from 2021 and gross margin in 2022 decreased to 36.1% from 38.2% in 2021. Both years were impacted by the net of antidumping and countervailing duty rate changes, with an unfavorable adjustment of $0.4 million in 2022 and a favorable adjustment of $6.3 million in 2021. When excluding those adjustments, adjusted gross profit (a non-GAAP measure) of $401.6 million in 2022 decreased $32.2 million versus 2021 and adjusted gross margin (a non-GAAP measure) in 2022 decreased to 36.2% from 37.6% in 2021. The 140-basis point decrease in adjusted gross margin in 2022 was due primarily to higher material and transportation costs (collectively up more than 1,000 basis points) that the Company was able to partially mitigate through pricing, promotion and alternative country/vendor sourcing strategies.
|
|
Year Ended December 31, |
|
|||||||||||||
|
|
2022 |
|
|
2021 |
|
||||||||||
|
|
$ |
|
|
% of Sales |
|
|
$ |
|
|
% of Sales |
|
||||
|
|
(dollars in thousands) |
|
|||||||||||||
Gross Profit/Margin, as reported (GAAP) |
|
$ |
401,163 |
|
|
|
36.1 |
% |
|
$ |
440,042 |
|
|
|
38.2 |
% |
|
|
|
|
|
|
|
|
|
|
|
|
|
||||
Antidumping and Countervailing Adjustments1 |
|
|
413 |
|
|
|
— |
% |
|
|
(6,279 |
) |
|
|
(0.5 |
)% |
|
|
|
|
|
|
|
|
|
|
|
|
|
||||
Adjusted Gross Profit/Margin (non-GAAP measures) |
|
$ |
401,576 |
|
|
|
36.2 |
% |
|
$ |
433,763 |
|
|
|
37.6 |
% |
Selling, General and Administrative Expenses
SG&A expenses of $412.9 million in 2022 increased $25.5 million from 2021. SG&A as a percentage of net sales of 37.2% increased 360 basis points compared to last year. Included in the current year SG&A was a $9.7 million non-cash charge for goodwill impairment, which resulted from a decline in the Company’s market capitalization, increases in the weighted average cost of capital as applied to our future cash flow models, and comparable company market multiples. Both 2022 and 2021 were also impacted by certain legal matters detailed in the table that follows. When excluding these items, adjusted SG&A (a non-GAAP measure) of $403.3 million in 2022 increased $23.2 million from 2021. Adjusted SG&A as a percentage of sales (a non-GAAP measure) of 36.3% increased 330 basis points compared to last year, primarily due to increased investment in our growth strategies including new stores, higher marketing spend and Pro sales; as well as competitive wage increases for customer facing associates. In addition, adjusted SG&A deleveraged on lower net sales.
During 2022, the Company redeemed $3.6 million of MDL and Gold vouchers and reduced the accrual for legal matters and settlements for the full amount, relieved inventory at its cost, and the remaining amount -- the gross margin for the items sold of $1.3 million was recorded as a reduction in SG&A expense.
|
|
Year Ended December 31, |
|
|||||||||||||
|
|
2022 |
|
|
2021 |
|
||||||||||
|
|
$ |
|
|
% of Sales |
|
|
$ |
|
|
% of Sales |
|
||||
|
|
(dollars in thousands) |
|
|||||||||||||
SG&A, as reported (GAAP) |
|
$ |
412,885 |
|
|
|
37.2 |
% |
|
$ |
387,356 |
|
|
|
33.6 |
% |
|
|
|
|
|
|
|
|
|
|
|
|
|
||||
(Recovery) Accrual for Legal Matters and Settlements2 |
|
|
(150 |
) |
|
|
— |
% |
|
|
6,800 |
|
|
|
0.6 |
% |
Legal and Professional Fees3 |
|
|
— |
|
|
|
— |
% |
|
|
501 |
|
|
|
— |
% |
Goodwill Impairment Charge4 |
|
|
9,693 |
|
|
|
0.9 |
% |
|
|
— |
|
|
|
— |
% |
Sub-Total Items above |
|
|
9,543 |
|
|
|
0.9 |
% |
|
|
7,301 |
|
|
|
0.6 |
% |
|
|
|
|
|
|
|
|
|
|
|
|
|
||||
Adjusted SG&A (a non-GAAP measure) |
|
$ |
403,342 |
|
|
|
36.3 |
% |
|
$ |
380,055 |
|
|
|
33.0 |
% |
25
Operating (Loss) Income and Operating Margin
Operating loss was $11.7 million in 2022, compared to operating income of $52.7 million in 2021. When excluding items in the table that follows, adjusted operating loss (a non-GAAP measure) was $1.8 million and adjusted operating margin (a non-GAAP measure) was (0.2)% in 2022, a decrease of 490 basis points compared to last year. The primary driver of the decrease in adjusted operating margin was the decline in adjusted gross margin described above.
|
|
Year Ended December 31, |
|
|||||||||||||
|
|
2022 |
|
|
2021 |
|
||||||||||
|
|
$ |
|
|
% of Sales |
|
|
$ |
|
|
% of Sales |
|
||||
|
|
(dollars in thousands) |
|
|||||||||||||
Operating (Loss) Income, as reported (GAAP) |
|
$ |
(11,722 |
) |
|
|
(1.1 |
)% |
|
$ |
52,686 |
|
|
|
4.6 |
% |
|
|
|
|
|
|
|
|
|
|
|
|
|
||||
Gross Margin Adjustment Items: |
|
|
|
|
|
|
|
|
|
|
|
|
||||
Antidumping and Countervailing Adjustments1 |
|
|
413 |
|
|
|
— |
% |
|
|
(6,279 |
) |
|
|
(0.5 |
)% |
Gross Margin Adjustment Items Subtotal |
|
|
413 |
|
|
|
— |
% |
|
|
(6,279 |
) |
|
|
(0.5 |
)% |
|
|
|
|
|
|
|
|
|
|
|
|
|
||||
SG&A Adjustment Items: |
|
|
|
|
|
|
|
|
|
|
|
|
||||
(Recovery) Accrual for Legal Matters and Settlements2 |
|
|
(150 |
) |
|
|
— |
% |
|
|
6,800 |
|
|
|
0.6 |
% |
Legal and Professional Fees3 |
|
|
— |
|
|
|
— |
% |
|
|
501 |
|
|
|
— |
% |
Goodwill Impairment Charge4 |
|
|
9,693 |
|
|
|
0.9 |
% |
|
|
— |
|
|
|
— |
% |
SG&A Adjustment Items Subtotal |
|
|
9,543 |
|
|
|
0.9 |
% |
|
|
7,301 |
|
|
|
0.6 |
% |
|
|
|
|
|
|
|
|
|
|
|
|
|
||||
Adjusted Operating (Loss) Income/ Margin (a non-GAAP measure) |
|
$ |
(1,766 |
) |
|
|
(0.2 |
)% |
|
$ |
53,708 |
|
|
|
4.7 |
% |
1,2,3,4 See the Gross Profit and SG&A sections above for more detailed explanations of these individual items.
Other Expense (Income)
The Company had other expense of $1.8 million for the year ended December 31, 2022 compared to other income of $0.1 million for the year ended December 31, 2021. Both years were favorably impacted by the reversal of interest expense associated with antidumping and countervailing duty rate changes. Excluding these items as shown on the table that follows, adjusted other expense (a non-GAAP measure) was $2.0 million in 2022, which is an increase of $0.3 million compared to 2021 driven by interest expense on borrowings under our Credit Agreement. While both years included interest on borrowings under our Credit Agreement, during the second quarter of 2021, the Company repaid all borrowings under our Credit Agreement, minimizing interest expense for the year ended December 31, 2021.
|
|
Year Ended December 31, |
|
|||||||||||||
|
|
2022 |
|
|
2021 |
|
||||||||||
|
|
$ |
|
|
% of Sales |
|
|
$ |
|
|
% of Sales |
|
||||
|
|
(dollars in thousands) |
|
|||||||||||||
Other Expense (Income), as reported (GAAP) |
|
$ |
1,816 |
|
|
|
0.2 |
% |
|
$ |
(104 |
) |
|
|
— |
% |
|
|
|
|
|
|
|
|
|
|
|
|
|
||||
Interest Impact Related to Antidumping and Countervailing Adjustments5 |
|
|
(148 |
) |
|
|
— |
% |
|
|
(1,797 |
) |
|
|
(0.2 |
)% |
|
|
|
|
|
|
|
|
|
|
|
|
|
||||
Adjusted Other Expense/Adjusted Other Expense as a % of Sales (a non-GAAP measure) |
|
$ |
1,964 |
|
|
|
0.2 |
% |
|
$ |
1,693 |
|
|
|
0.2 |
% |
Provision for Income Taxes
The Company records tax expense each period for income taxes incurred for US federal tax, in certain states, and in foreign jurisdictions resulting in an effective tax rate of 10.8% and 21.0% for the years ended December 31, 2022 and 2021, respectively.
As of December 31, 2022, the Company was not in a consolidated cumulative three-year loss position. Based on the Company’s evaluation at a jurisdictional level as of December 31, 2022, the Company believes sufficient future taxable income, including
26
consideration of future performance, market or economic conditions, will be generated to use existing deferred tax assets. The amount of the deferred tax assets considered realizable could be adjusted in future periods if evidence warrants such a change.
The Company files income tax returns with the United States federal government and various state and foreign jurisdictions. In the normal course of business, the Company is subject to examination by taxing authorities. As of December 31, 2022, the Company is under audit by the IRS for the years 2018 and 2013, relating primarily to the amended 2018 tax return and related carryback to 2013 as permitted by the CARES Act of 2020. As of December 31, 2022, there are no known liabilities associated with that audit and nothing has been noted by the IRS auditor.
Diluted Earnings per Share
Net loss was $12.1 million, or $0.42 per diluted share, in 2022 compared to net income of $41.7 million, or $1.41 per diluted share, in 2021. Adjusted loss per diluted share (a non-GAAP measure) was $0.17 compared to adjusted earnings per diluted share (a non-GAAP measure) of $1.39 for 2021.
|
|
Year Ended December 31, |
|
|||||
|
|
2022 |
|
|
2021 |
|
||
|
|
(in thousands) |
|
|||||
Net (Loss) Income, as reported (GAAP) |
|
$ |
(12,081 |
) |
|
$ |
41,698 |
|
Net (Loss) Income per Diluted Share (GAAP) |
|
$ |
(0.42 |
) |
|
$ |
1.41 |
|
|
|
|
|
|
|
|
||
Gross Margin Adjustment Items: |
|
|
|
|
|
|
||
Antidumping and Countervailing Adjustments1 |
|
|
413 |
|
|
|
(6,279 |
) |
Gross Margin Adjustment Items Subtotal |
|
|
413 |
|
|
|
(6,279 |
) |
|
|
|
|
|
|
|
||
SG&A Adjustment Items: |
|
|
|
|
|
|
||
(Recovery) Accrual for Legal Matters and Settlements2 |
|
|
(150 |
) |
|
|
6,800 |
|
Legal and Professional Fees3 |
|
|
— |
|
|
|
501 |
|
Goodwill Impairment Charge4 |
|
|
9,693 |
|
|
|
— |
|
SG&A Adjustment Items Subtotal |
|
|
9,543 |
|
|
|
7,301 |
|
|
|
|
|
|
|
|
||
Other Expense (Income) Adjustment Items: |
|
|
|
|
|
|
||
Interest Impact Related to Antidumping and Countervailing Adjustments5 |
|
|
(148 |
) |
|
|
(1,797 |
) |
Other Expense (Income) Adjustment Items Subtotal |
|
|
(148 |
) |
|
|
(1,797 |
) |
|
|
|
|
|
|
|
||
Income Tax Adjustment6 |
|
|
(2,570 |
) |
|
|
204 |
|
|
|
|
|
|
|
|
||
Adjusted (Loss) Earnings |
|
$ |
(4,843 |
) |
|
$ |
41,127 |
|
Adjusted (Loss) Earnings per Diluted Share (a non-GAAP measure) |
|
$ |
(0.17 |
) |
|
$ |
1.39 |
|
1,2,3,4,5 See the Gross Profit, SG&A and Other Expense (Income) sections above for more detailed explanations of these individual items.
Liquidity, Capital Resources and Cash Flows
Sources of Liquidity
Cash flows from operations supplemented with our short-term and long-term borrowings remain sufficient to fund our operations while allowing us to fund our growth initiatives and position LL Flooring for long-term success. As of December 31, 2022, we held $10.8 million of cash and cash equivalents and $124.8 million of availability under our Credit Agreement. We believe that cash flows from operations, together with cash on hand, and the liquidity under our Credit Agreement will be sufficient to meet our obligations and fund our settlements, operations, anticipated capital expenditures, and potential share repurchases for the next 12 months.
The Company continues to navigate uncertainty in the macroeconomic environment due to consumer confidence, inflation, volatile mortgage rates impacting housing affordability and lower existing home sales. We prepare our forecasted cash flow and
27
liquidity estimates based on assumptions that we believe to be reasonable but are also inherently uncertain. Actual future cash flows could differ from these estimates.
Capital Resources
As of December 31, 2022, our material contractual obligations consist of long-term debt and letters of credit under our Credit Agreement and leases. See Note 4 and Note 6 in Item 8 to the consolidated financial statements for amounts outstanding related to our Credit Agreement and leases, respectively, as of December 31, 2022.
Cash Flows Summary
|
|
Year Ended December 31, |
|
|||||
|
|
2022 |
|
|
2021 |
|
||
|
|
(in thousands) |
|
|||||
Net Cash (Used in) Provided by Operating Activities |
|
$ |
(116,709 |
) |
|
$ |
38,670 |
|
Net Cash Used in Investing Activities |
|
|
(21,983 |
) |
|
|
(19,372 |
) |
Net Cash Provided by (Used in) Financing Activities |
|
|
64,303 |
|
|
|
(104,050 |
) |
Net Decrease in Cash and Cash Equivalents |
|
$ |
(74,389 |
) |
|
$ |
(84,752 |
) |
During 2022, the Company used $116.7 million of cash flows for operating activities, primarily driven by the rebuilding of inventory and the related impact on working capital accounts, in line with its strategy to offer a compelling assortment of trend-right products close to its customers.
During 2021, our cash flows from operating activities were $38.7 million, which was primarily the result of our net income during the period of $41.7 million, accruals for legal matters and settlements of $7.8 million, and growth in customer deposits of $5.7 million, partially offset by an increase in inventory of $15 million and decreased accounts payable of $8.5 million.
Net cash flows used in investing activities included $22.0 million and $19.4 million in capital expenditures in 2022 and 2021, respectively. Capital expenditures in both years were used primarily for opening new stores and store rebranding, with 18 net new stores opened in 2022 versus 14 net new stores in prior year.
2022 net cash flows provided by financing activities was $64.3 million, compared to net cash flows used in financing activities of $104.1 million in 2021. The activity in the current year was primarily attributable to $72.0 million of net borrowings, offset by repurchases of common stock of $8.0 million. Net cash used in the comparable 2021 period was primarily attributable to $101.0 million in repayment of outstanding debt under the Credit Agreement.
Merchandise Inventories
Merchandise inventories on December 31, 2022 increased $77.9 million from December 31, 2021 primarily due to increased purchases to replenish inventory to support the Company’s strategy to place inventory close to its customers and to support new stores, as well as, to a lesser extent, inflation. The Company believes that it has rebuilt a solid mix of quality flooring inventory that is largely long-lived in nature. We consider merchandise inventories either “available for sale” or “inbound in-transit,” based on whether we have physically received and inspected the products at an individual store location, in our distribution centers or in another facility where we control and monitor inspection.
Merchandise inventories and inventory available for sale per store in operation were as follows:
|
|
As of |
|
|
As of |
|
||
|
|
December 31, 2022 |
|
|
December 31, 2021 |
|
||
|
|
(in thousands) |
|
|||||
Inventory – Available for Sale |
|
$ |
307,730 |
|
|
$ |
197,927 |
|
Inventory – Inbound In-Transit |
|
|
24,566 |
|
|
|
56,458 |
|
Total Merchandise Inventories |
|
$ |
332,296 |
|
|
$ |
254,385 |
|
|
|
|
|
|
|
|
||
Inventory Available for Sale Per Store |
|
$ |
696 |
|
|
$ |
467 |
|
Inventory available for sale per store on December 31, 2022 was higher than inventory available for sale per store on December 31, 2021 due to the same drivers as the increase in merchandise inventories, partially offset by the opening of new stores.
Inbound in-transit inventory generally varies due to the timing of certain international shipments and certain seasonal factors, including international holidays, rainy seasons, and specific merchandise category planning.
Credit Agreement
Information with respect to this item may be found in Note 4, “Credit Agreement”, to the consolidated financial statements in Item 8 of Part II, which is incorporated herein by reference.
28
Off-Balance Sheet Arrangements
We do not have any off-balance sheet arrangements or other financing activities with special-purpose entities.
Critical Accounting Policies and Estimates
Critical accounting policies are those that we believe are both significant and that require us to make difficult, subjective or complex judgments, often because we need to estimate the effect of inherently uncertain matters. We base our estimates and judgments on historical experiences and various other factors that we believe to be appropriate under the circumstances. Actual results may differ from these estimates, and we might obtain different estimates if we used different assumptions or conditions. We believe the following critical accounting policies affect our more significant judgments and estimates used in the preparation of our financial statements.
Recognition of Net Sales
We recognize net sales for products purchased at the time the customer takes possession of the merchandise. We recognize service revenue, which consists primarily of installation revenue and freight charges for in-home delivery, when the service has been rendered. We report sales exclusive of sales taxes collected from customers and remitted to governmental taxing authorities. Net sales are reduced by an allowance for anticipated sales returns that we estimate based on historical and current sales trends and experience. We believe that our estimate for sales returns is an accurate reflection of future returns. Any reasonably likely changes that may occur in the assumptions underlying our allowance estimates would not be expected to have a material impact on our financial condition or operating performance. Actual sales returns did not vary materially from estimated amounts for 2022, 2021 or 2020.
In addition, customers who do not take immediate delivery of their purchases are generally required to pay a deposit, equal to approximately half of the retail sales value, with the balance payable when the customer takes possession of the merchandise. These customer deposits benefit our cash flow and return on investment capital, because we receive partial payment for our customers’ purchases immediately. We record these deposits as a liability on our balance sheet in Customer Deposits and Store Credits until the customer takes possession of the merchandise.
Leases
The Company determines if an arrangement is a lease at inception. If the arrangement is a lease, the Company accounts for the transaction in accordance with FASB ASC Topic 842, Leases (“ASC 842”). Operating leases are included in operating lease right-of-use (“ROU”) assets and operating lease liabilities on the consolidated balance sheet. The operating lease ROU asset also is adjusted for any lease payments made and excludes lease incentives and initial direct costs incurred. The Company’s lease terms may include options to extend or terminate the lease at certain dates, typically at the Company’s own discretion. The Company regularly evaluates the renewal options and when they are reasonably certain of exercise, the Company includes the renewal period in its lease term. Many of the Company’s leases include both lease (e.g., payments including rent, taxes, and insurance costs) and non-lease components (e.g., common-area or other maintenance costs) which are accounted for as a single lease component as the Company has elected the practical expedient to group lease and non-lease components for all leases. Lease expense for minimum lease payments is recognized on a straight-line basis over the term of the agreement. The Company made an accounting policy election that payments under agreements with an initial term of 12 months or less will not be included on the consolidated balance sheet but will be recognized in the consolidated statements of operations on a straight-line basis over the term of the agreement.
The operating lease ROU assets and operating lease liabilities are recognized as the present value of the future minimum lease payments over the lease term at commencement date. As most of the leases do not provide an implicit rate, the Company uses its incremental borrowing rate based on the information available at commencement date in determining the present value of future payments. The incremental borrowing rate is estimated with the assistance of a third party based on U.S. Composite yields obtained from Bloomberg and an estimate of the Company’s credit rating. The determination of an appropriate secured incremental borrowing rate requires judgments in selecting an appropriate yield curve and estimating adjustments for collateralization and inflation. Based on the volume of leases the Company enters into, a significant increase or decrease in the incremental borrowing rates used to discount lease payments could have a significant impact on the value of operating lease liabilities and right-of-use assets subsequently reported on its consolidated balance sheet.
Item 7A. Quantitative and Qualitative Disclosures about Market Risk.
Interest Rate Risk
The Company can be exposed to interest rate risk because of variable rate borrowings under our Credit Agreement. To the extent the Company borrows at Term SOFR, financial results are subject to changes in the market rate of interest. As of December 31, 2022, we had $72.0 million outstanding under our Revolving Credit Facility, which carried a weighted average interest rate of 5.1% repayable at any time. A hypothetical 1% increase in interest rates would cause an increase of $0.7 million of annual interest if
29
outstanding for the full year.
We currently do not engage in any interest rate hedging activity. However, in the future, in an effort to mitigate losses associated with interest rate risks, we may at times enter into derivative financial instruments, although we have not historically done so. We do not, and do not intend to, engage in the practice of trading derivative securities for profit.
30
Item 8. Consolidated Financial Statements and Supplementary Data.
31
Report of Independent Registered Public Accounting Firm
To the Shareholders and the Board of Directors of LL Flooring Holdings, Inc.
Opinion on the Financial Statements
We have audited the accompanying consolidated balance sheets of LL Flooring Holdings, Inc. (the Company) as of December 31, 2022 and 2021, the related consolidated statements of operations, comprehensive income (loss), stockholders’ equity and cash flows for each of the three years in the period ended December 31, 2022, and the related notes and Financial Statement Schedule listed in the Index at Item 15(a) (collectively referred to as the “consolidated financial statements”). In our opinion, the consolidated financial statements present fairly, in all material respects, the financial position of the Company at December 31, 2022 and 2021, and the results of its operations and its cash flows for each of the three years in the period ended December 31, 2022, in conformity with U.S. generally accepted accounting principles.
We also have audited, in accordance with the standards of the Public Company Accounting Oversight Board (United States) (PCAOB), the Company's internal control over financial reporting as of December 31, 2022, based on criteria established in Internal Control-Integrated Framework issued by the Committee of Sponsoring Organizations of the Treadway Commission (2013 framework), and our report dated March 1, 2023 expressed an unqualified opinion thereon.
Basis for Opinion
These financial statements are the responsibility of the Company's management. Our responsibility is to express an opinion on the Company’s financial statements based on our audits. We are a public accounting firm registered with the PCAOB and are required to be independent with respect to the Company in accordance with the U.S. federal securities laws and the applicable rules and regulations of the Securities and Exchange Commission and the PCAOB.
We conducted our audits in accordance with the standards of the PCAOB. Those standards require that we plan and perform the audit to obtain reasonable assurance about whether the financial statements are free of material misstatement, whether due to error or fraud. Our audits included performing procedures to assess the risks of material misstatement of the financial statements, whether due to error or fraud, and performing procedures that respond to those risks. Such procedures included examining, on a test basis, evidence regarding the amounts and disclosures in the financial statements. Our audits also included evaluating the accounting principles used and significant estimates made by management, as well as evaluating the overall presentation of the financial statements. We believe that our audits provide a reasonable basis for our opinion.
Critical Audit Matter
The critical audit matter communicated below is a matter arising from the current period audit of the financial statements that was communicated or required to be communicated to the audit committee and that: (1) relates to accounts or disclosures that are material to the financial statements and (2) involved our especially challenging, subjective or complex judgments. The communication of the critical audit matter does not alter in any way our opinion on the consolidated financial statements, taken as a whole, and we are not, by communicating the critical audit matter below, providing a separate opinion on the critical audit matter or on the accounts or disclosures to which it relates.
32
|
Operating lease right-of-use assets and operating lease liabilities |
Description of the Matter |
As discussed in Notes 1 and 5 to the consolidated financial statements, the Company recognizes right-of-use assets and corresponding lease liabilities for certain leases on the balance sheet in accordance with Accounting Standards Codification 842 (“ASC 842”). The Company used a third party to assist in determining the Company’s incremental borrowing rate in order to calculate the right-of-use assets and lease liabilities related to new or modified leases recognized on the balance sheet. During 2022, the Company recorded right-of-use assets of $36.5 million in exchange for lease liabilities related to leases originated or modified during 2022. Auditing the Company’s operating lease right-of-use assets and operating lease liabilities was challenging due to the requirement that management estimate the incremental borrowing rates in the application of ASC 842. Our procedures involved auditor judgment to evaluate management’s estimate of incremental borrowing rates used in these calculations, including selection of an appropriate yield curve and estimating adjustments for collateralization and inflation where appropriate. |
How We Addressed the Matter in Our Audit |
We obtained an understanding of and tested controls related to management’s estimate of these incremental borrowing rates. For example, we tested controls over management’s review of the incremental borrowing rate estimates, including selection of an appropriate yield curve and adjustments for collateralization and inflation where appropriate. To test the incremental borrowing rate used to record leases that originated or were modified during the year ended December 31, 2022, our audit procedures included, among others, evaluating the methodology, significant assumptions and underlying data used by the Company. We involved our valuation specialists to assist in evaluating management’s methodology used to develop the incremental borrowing rates and in preparing an independent calculation of the incremental borrowing rates, which we compared to management’s estimates. |
/s/
We have served as the Company’s auditor since 2003.
March 1, 2023
33
Report of Independent Registered Public Accounting Firm
To the Shareholders and the Board of Directors of LL Flooring Holdings, Inc.
Opinion on Internal Control Over Financial Reporting
We have audited LL Flooring Holdings, Inc.’s internal control over financial reporting as of December 31, 2022, based on criteria established in Internal Control—Integrated Framework issued by the Committee of Sponsoring Organizations of the Treadway Commission (2013 framework) (the COSO criteria). In our opinion, LL Flooring Holdings, Inc. (the Company) maintained, in all material respects, effective internal control over financial reporting as of December 31, 2022, based on the COSO criteria.
We also have audited, in accordance with the standards of the Public Company Accounting Oversight Board (United States) (PCAOB), the 2022 consolidated financial statements of the Company and our report dated March 1, 2023 expressed an unqualified opinion thereon.
Basis for Opinion
The Company’s management is responsible for maintaining effective internal control over financial reporting and for its assessment of the effectiveness of internal control over financial reporting included in the accompanying Management’s Report on Internal Control over Financial Reporting. Our responsibility is to express an opinion on the Company’s internal control over financial reporting based on our audit. We are a public accounting firm registered with the PCAOB and are required to be independent with respect to the Company in accordance with the U.S. federal securities laws and the applicable rules and regulations of the Securities and Exchange Commission and the PCAOB.
We conducted our audit in accordance with the standards of the PCAOB. Those standards require that we plan and perform the audit to obtain reasonable assurance about whether effective internal control over financial reporting was maintained in all material respects.
Our audit included obtaining an understanding of internal control over financial reporting, assessing the risk that a material weakness exists, testing and evaluating the design and operating effectiveness of internal control based on the assessed risk, and performing such other procedures as we considered necessary in the circumstances. We believe that our audit provides a reasonable basis for our opinion.
Definition and Limitations of Internal Control Over Financial Reporting
A company’s internal control over financial reporting is a process designed to provide reasonable assurance regarding the reliability of financial reporting and the preparation of financial statements for external purposes in accordance with generally accepted accounting principles. A company’s internal control over financial reporting includes those policies and procedures that (1) pertain to the maintenance of records that, in reasonable detail, accurately and fairly reflect the transactions and dispositions of the assets of the company; (2) provide reasonable assurance that transactions are recorded as necessary to permit preparation of financial statements in accordance with generally accepted accounting principles, and that receipts and expenditures of the company are being made only in accordance with authorizations of management and directors of the company; and (3) provide reasonable assurance regarding prevention or timely detection of unauthorized acquisition, use, or disposition of the company’s assets that could have a material effect on the financial statements.
Because of its inherent limitations, internal control over financial reporting may not prevent or detect misstatements. Also, projections of any evaluation of effectiveness to future periods are subject to the risk that controls may become inadequate because of changes in conditions, or that the degree of compliance with the policies or procedures may deteriorate.
/s/ Ernst & Young LLP
Richmond, Virginia
March 1, 2023
34
LL Flooring Holdings, Inc.
Consolidated Balance Sheets
(in thousands)
|
|
December 31, |
|
|
December 31, |
|
||
|
|
2022 |
|
|
2021 |
|
||
Assets |
|
|
|
|
|
|
||
Current Assets: |
|
|
|
|
|
|
||
Cash and Cash Equivalents |
|
$ |
|
|
$ |
|
||
Merchandise Inventories |
|
|
|
|
|
|
||
Prepaid Expenses |
|
|
|
|
|
|
||
Other Current Assets |
|
|
|
|
|
|
||
Total Current Assets |
|
|
|
|
|
|
||
Property and Equipment, net |
|
|
|
|
|
|
||
Operating Lease Right-of-Use Assets |
|
|
|
|
|
|
||
Goodwill |
|
|
— |
|
|
|
|
|
Net Deferred Tax Assets |
|
|
|
|
|
|
||
Other Assets |
|
|
|
|
|
|
||
Total Assets |
|
$ |
|
|
$ |
|
||
|
|
|
|
|
|
|
||
Liabilities and Stockholders’ Equity |
|
|
|
|
|
|
||
Current Liabilities: |
|
|
|
|
|
|
||
Accounts Payable |
|
$ |
|
|
$ |
|
||
Customer Deposits and Store Credits |
|
|
|
|
|
|
||
Accrued Compensation |
|
|
|
|
|
|
||
Sales and Income Tax Liabilities |
|
|
|
|
|
|
||
Accrual for Legal Matters and Settlements |
|
|
|
|
|
|
||
Operating Lease Liabilities - Current |
|
|
|
|
|
|
||
Other Current Liabilities |
|
|
|
|
|
|
||
Total Current Liabilities |
|
|
|
|
|
|
||
Other Long-Term Liabilities |
|
|
|
|
|
|
||
Operating Lease Liabilities - Long-Term |
|
|
|
|
|
|
||
Credit Agreement |
|
|
|
|
|
|
||
Total Liabilities |
|
|
|
|
|
|
||
|
|
|
|
|
|
|
||
|
|
|
|
|
|
|||
|
|
|
|
|
|
|
||
Stockholders’ Equity: |
|
|
|
|
|
|
||
Common Stock ($ |
|
|
|
|
|
|
||
Treasury Stock, at cost ( |
|
|
( |
) |
|
|
( |
) |
Additional Capital |
|
|
|
|
|
|
||
Retained Earnings |
|
|
|
|
|
|
||
Total Stockholders’ Equity |
|
|
|
|
|
|
||
Total Liabilities and Stockholders’ Equity |
|
$ |
|
|
$ |
|
||
See accompanying notes to consolidated financial statements.
35
LL Flooring Holdings, Inc.
Consolidated Statements of Operations
(in thousands except per share amounts)
|
|
Year Ended December 31, |
|
|||||||||
|
|
2022 |
|
|
2021 |
|
|
2020 |
|
|||
|
|
|
|
|
|
|
|
|
|
|||
Net Sales |
|
|
|
|
|
|
|
|
|
|||
Net Merchandise Sales |
|
$ |
|
|
$ |
|
|
$ |
|
|||
Net Services Sales |
|
|
|
|
|
|
|
|
|
|||
Total Net Sales |
|
|
|
|
|
|
|
|
|
|||
Cost of Sales |
|
|
|
|
|
|
|
|
|
|||
Cost of Merchandise Sold |
|
|
|
|
|
|
|
|
|
|||
Cost of Services Sold |
|
|
|
|
|
|
|
|
|
|||
Total Cost of Sales |
|
|
|
|
|
|
|
|
|
|||
Gross Profit |
|
|
|
|
|
|
|
|
|
|||
Selling, General and Administrative Expenses |
|
|
|
|
|
|
|
|
|
|||
Operating (Loss) Income |
|
|
( |
) |
|
|
|
|
|
|
||
Other Expense (Income) |
|
|
|
|
|
( |
) |
|
|
|
||
(Loss) Income Before Income Taxes |
|
|
( |
) |
|
|
|
|
|
|
||
Income Tax (Benefit) Expense |
|
|
( |
) |
|
|
|
|
|
( |
) |
|
Net (Loss) Income |
|
$ |
( |
) |
|
$ |
|
|
$ |
|
||
|
|
|
|
|
|
|
|
|
|
|||
Net (Loss) Income per Common Share—Basic |
|
$ |
( |
) |
|
$ |
|
|
$ |
|
||
Net (Loss) Income per Common Share—Diluted |
|
$ |
( |
) |
|
$ |
|
|
$ |
|
||
|
|
|
|
|
|
|
|
|
|
|||
Weighted Average Common Shares Outstanding: |
|
|
|
|
|
|
|
|
|
|||
Basic |
|
|
|
|
|
|
|
|
|
|||
Diluted |
|
|
|
|
|
|
|
|
|
|||
See accompanying notes to consolidated financial statements.
36
LL Flooring Holdings, Inc.
Consolidated Statements of Comprehensive (Loss) Income
(in thousands)
|
|
Year Ended December 31, |
|
|||||||||
|
|
2022 |
|
|
2021 |
|
|
2020 |
|
|||
Net (Loss) Income |
|
$ |
( |
) |
|
$ |
|
|
$ |
|
||
Other Comprehensive Income: |
|
|
|
|
|
|
|
|
|
|||
Foreign Currency Translation Adjustments |
|
|
— |
|
|
|
— |
|
|
|
|
|
Reclassification of Foreign Currency Translation to Earnings |
|
|
— |
|
|
|
— |
|
|
|
|
|
Total Other Comprehensive Income |
|
|
— |
|
|
|
— |
|
|
|
|
|
Comprehensive (Loss) Income |
|
$ |
( |
) |
|
$ |
|
|
$ |
|
||
See accompanying notes to consolidated financial statements.
37
LL Flooring Holdings, Inc.
Consolidated Statements of Stockholders’ Equity
(in thousands)
|
|
|
|
|
|
|
|
|
|
|
|
|
|
|
|
|
|
|
|
Accumulated |
|
|
|
|
||||||||
|
|
|
|
|
|
|
|
|
|
|
|
|
|
|
|
|
|
|
|
Other |
|
|
Total |
|
||||||||
|
|
Common Stock |
|
|
Treasury Stock |
|
|
Additional |
|
|
Retained |
|
|
Comprehensive |
|
|
Stockholders’ |
|
||||||||||||||
|
|
Shares |
|
|
Par Value |
|
|
Shares |
|
|
Value |
|
|
Capital |
|
|
Earnings |
|
|
Income (Loss) |
|
|
Equity |
|
||||||||
December 31, 2019 |
|
|
|
|
$ |
|
|
|
|
|
$ |
( |
) |
|
$ |
|
|
$ |
|
|
$ |
( |
) |
|
$ |
|
||||||
Stock-Based Compensation Expense |
|
|
— |
|
|
|
— |
|
|
|
— |
|
|
|
— |
|
|
|
|
|
|
— |
|
|
|
— |
|
|
|
|
||
Exercise of Stock Options |
|
|
|
|
|
— |
|
|
|
— |
|
|
|
— |
|
|
|
|
|
|
— |
|
|
|
— |
|
|
|
|
|||
Release of Restricted Shares |
|
|
|
|
|
— |
|
|
|
— |
|
|
|
— |
|
|
|
— |
|
|
|
— |
|
|
|
— |
|
|
|
— |
|
|
Common Stock Repurchased |
|
|
— |
|
|
|
— |
|
|
|
|
|
|
( |
) |
|
|
— |
|
|
|
— |
|
|
|
— |
|
|
|
( |
) |
|
Foreign Currency Translation Adjustments |
|
|
— |
|
|
|
— |
|
|
|
— |
|
|
|
— |
|
|
|
— |
|
|
|
— |
|
|
|
|
|
|
|
||
Reclassification of Foreign Currency Translation to Earnings |
|
|
— |
|
|
|
— |
|
|
|
— |
|
|
|
— |
|
|
|
— |
|
|
|
— |
|
|
|
|
|
|
|
||
Net Income |
|
|
— |
|
|
|
— |
|
|
|
— |
|
|
|
— |
|
|
|
— |
|
|
|
|
|
|
— |
|
|
|
|
||
December 31, 2020 |
|
|
|
|
$ |
|
|
|
|
|
$ |
( |
) |
|
$ |
|
|
$ |
|
|
$ |
— |
|
|
$ |
|
||||||
Stock-Based Compensation Expense |
|
|
— |
|
|
|
— |
|
|
|
— |
|
|
|
— |
|
|
|
|
|
|
— |
|
|
|
— |
|
|
|
|
||
Exercise of Stock Options |
|
|
|
|
|
|
|
|
— |
|
|
|
— |
|
|
|
|
|
|
— |
|
|
|
— |
|
|
|
|
||||
Release of Restricted Shares |
|
|
|
|
|
— |
|
|
|
— |
|
|
|
— |
|
|
|
— |
|
|
|
— |
|
|
|
— |
|
|
|
— |
|
|
Common Stock Repurchased |
|
|
— |
|
|
|
— |
|
|
|
|
|
|
( |
) |
|
|
— |
|
|
|
— |
|
|
|
— |
|
|
|
( |
) |
|
Net Income |
|
|
— |
|
|
|
— |
|
|
|
— |
|
|
|
— |
|
|
|
— |
|
|
|
|
|
|
— |
|
|
|
|
||
December 31, 2021 |
|
|
|
|
$ |
|
|
|
|
|
$ |
( |
) |
|
$ |
|
|
$ |
|
|
$ |
— |
|
|
$ |
|
||||||
Stock-Based Compensation Expense |
|
|
— |
|
|
|
— |
|
|
|
— |
|
|
|
— |
|
|
|
|
|
|
— |
|
|
|
— |
|
|
|
|
||
Exercise of Stock Options |
|
|
|
|
|
— |
|
|
|
— |
|
|
|
— |
|
|
|
|
|
|
— |
|
|
|
— |
|
|
|
|
|||
Release of Restricted Shares |
|
|
|
|
|
— |
|
|
|
— |
|
|
|
— |
|
|
|
— |
|
|
|
— |
|
|
|
— |
|
|
|
— |
|
|
Common Stock Repurchased |
|
|
( |
) |
|
|
— |
|
|
|
|
|
|
( |
) |
|
|
— |
|
|
|
— |
|
|
|
— |
|
|
|
( |
) |
|
Net Loss |
|
|
— |
|
|
|
— |
|
|
|
— |
|
|
|
— |
|
|
|
— |
|
|
|
( |
) |
|
|
— |
|
|
|
( |
) |
December 31, 2022 |
|
|
|
|
$ |
|
|
|
|
|
$ |
( |
) |
|
$ |
|
|
$ |
|
|
$ |
— |
|
|
$ |
|
||||||
See accompanying notes to consolidated financial statements
38
LL Flooring Holdings, Inc.
Consolidated Statements of Cash Flows
(in thousands)
|
|
Year Ended December 31, |
|
|||||||||||||
|
|
2022 |
|
|
|
2021 |
|
|
|
2020 |
|
|||||
Cash Flows from Operating Activities: |
|
|
|
|
|
|
|
|
|
|
|
|||||
Net (Loss) Income |
|
$ |
( |
) |
|
|
$ |
|
|
|
$ |
|
||||
Adjustments to Reconcile Net (Loss) Income: |
|
|
|
|
|
|
|
|
|
|
|
|||||
Depreciation and Amortization |
|
|
|
|
|
|
|
|
|
|
|
|||||
Impairment of Goodwill |
|
|
|
|
|
|
— |
|
|
|
|
— |
|
|||
Deferred Income Taxes (Benefit) Provision |
|
|
( |
) |
|
|
|
|
|
|
|
( |
) |
|||
Income on Vouchers Redeemed for Legal Settlements |
|
|
( |
) |
|
|
|
( |
) |
|
|
|
— |
|
||
Stock-Based Compensation Expense |
|
|
|
|
|
|
|
|
|
|
|
|||||
Provision for Inventory Obsolescence Reserves |
|
|
|
|
|
|
|
|
|
|
|
|||||
Antidumping Adjustments |
|
|
( |
) |
|
|
|
( |
) |
|
|
|
( |
) |
||
Impairment of Operating Lease Right-Of-Use |
|
|
— |
|
|
|
|
— |
|
|
|
|
|
|||
Reclassification of Foreign Currency Translation to Earnings |
|
|
— |
|
|
|
|
— |
|
|
|
|
|
|||
(Gain) Loss on Disposal of Fixed Assets |
|
|
( |
) |
|
|
|
|
|
|
|
( |
) |
|||
Changes in Operating Assets and Liabilities: |
|
|
|
|
|
|
|
|
|
|
|
|||||
Merchandise Inventories |
|
|
( |
) |
|
|
|
( |
) |
|
|
|
|
|||
Accounts Payable |
|
|
( |
) |
|
|
|
( |
) |
|
|
|
|
|||
Customer Deposits and Store Credits |
|
|
( |
) |
|
|
|
|
|
|
|
|
||||
Tariff Recovery Receivable |
|
|
|
|
|
|
|
|
|
|
|
|||||
Prepaid Expenses and Other Current Assets |
|
|
( |
) |
|
|
|
|
|
|
|
( |
) |
|||
Accrued Compensation |
|
|
( |
) |
|
|
|
( |
) |
|
|
|
|
|||
Accrual for Legal Matters and Settlements |
|
|
|
|
|
|
|
|
|
|
|
|||||
Payments for Legal Matters and Settlements |
|
|
( |
) |
|
|
|
( |
) |
|
|
|
( |
) |
||
Deferred Rent Payments |
|
|
( |
) |
|
|
|
( |
) |
|
|
|
|
|||
Deferred Payroll Taxes |
|
|
( |
) |
|
|
|
( |
) |
|
|
|
|
|||
Other Assets and Liabilities |
|
|
|
|
|
|
( |
) |
|
|
|
|
||||
Net Cash (Used in) Provided by Operating Activities |
|
|
( |
) |
|
|
|
|
|
|
|
|
||||
Cash Flows from Investing Activities: |
|
|
|
|
|
|
|
|
|
|
|
|||||
Purchases of Property and Equipment |
|
|
( |
) |
|
|
|
( |
) |
|
|
|
( |
) |
||
Other Investing Activities |
|
|
|
|
|
|
|
|
|
|
|
|||||
Net Cash Used in Investing Activities |
|
|
( |
) |
|
|
|
( |
) |
|
|
|
( |
) |
||
Cash Flows from Financing Activities: |
|
|
|
|
|
|
|
|
|
|
|
|||||
Borrowings on Credit Agreement |
|
|
|
|
|
|
— |
|
|
|
|
|
||||
Payments on Credit Agreement |
|
|
( |
) |
|
|
|
( |
) |
|
|
|
( |
) |
||
Common Stock Repurchased |
|
|
( |
) |
|
|
|
( |
) |
|
|
|
( |
) |
||
Other Financing Activities |
|
|
|
|
|
|
( |
) |
|
|
|
|
||||
Net Cash Provided by (Used in) Financing Activities |
|
|
|
|
|
|
( |
) |
|
|
|
|
||||
Effect of Exchange Rates on Cash and Cash Equivalents |
|
|
— |
|
|
|
|
— |
|
|
|
|
( |
) |
||
Net (Decrease) Increase in Cash and Cash Equivalents |
|
|
( |
) |
|
— |
|
|
( |
) |
|
— |
|
|
|
|
Cash and Cash Equivalents, Beginning of Year |
|
|
|
|
|
|
|
|
|
|
|
|||||
Cash and Cash Equivalents, End of Year |
|
$ |
|
|
|
$ |
|
|
|
$ |
|
|||||
|
|
|
|
|
|
|
|
|
|
|
|
|||||
Supplemental Disclosure of Non-Cash Operating and Financing Activities: |
|
|
|
|
|
|
|
|
|
|
|
|||||
Relief of Inventory for Vouchers Redeemed for Legal Settlements |
|
$ |
|
|
|
$ |
|
|
|
$ |
— |
|
||||
Release of Deposit for Legal Settlement and Liability |
|
|
— |
|
|
|
|
— |
|
|
|
|
|
|||
Tenant Improvement Allowance for Leases |
|
|
( |
) |
|
|
|
( |
) |
|
|
|
( |
) |
||
See accompanying notes to consolidated financial statements.
39
LL Flooring Holdings, Inc.
Notes to Consolidated Financial Statements
(amounts in thousands, except share data and per share amounts)
Note 1. Summary of Significant Accounting Policies
Nature of Business
LL Flooring Holdings, Inc., formerly Lumber Liquidators Holding, Inc., and its direct and indirect subsidiaries (collectively and, where applicable, individually, the “Company”) engage in business as a multi-channel specialty retailer of hard-surface flooring, and hard-surface flooring enhancements and accessories, operating as a single operating segment. The Company offers an extensive assortment of hard-surface flooring including waterproof hybrid resilient, waterproof vinyl plank, solid and engineered hardwood, laminate, bamboo, tile, and cork, with a wide range of flooring enhancements and accessories to complement. The Company also provides in-home delivery and installation services to its customers. The Company primarily sells to consumers or to Pros on behalf of consumers through a network of store locations in metropolitan areas. As of December 31, 2022, the Company’s
Organization and Basis of Financial Statement Presentation
The consolidated financial statements of LL Flooring Holdings, Inc., a Delaware corporation, include the accounts of its wholly owned subsidiaries. All significant intercompany transactions have been eliminated in consolidation.
Use of Estimates
The preparation of financial statements in conformity with accounting principles generally accepted in the U.S. requires management to make estimates and assumptions that affect the amounts reported in the consolidated financial statements and accompanying notes. The Company estimates that it has sufficient liquidity through amounts available under its forecasted cash flows from operations and Revolving Credit Facility to fund its working capital. The Company prepares its forecasted cash flow and liquidity estimates based on assumptions that it believes to be reasonable but are also inherently uncertain. Actual future cash flows could differ from these estimates.
Cash and Cash Equivalents
The Company had cash and cash equivalents of $
Credit Programs
Credit is offered to the Company’s customers through a credit card, underwritten by a third-party financial institution generally with no recourse to the Company. A credit line is offered to the Company’s professional customers through the LL Flooring Commercial Credit Program. This commercial credit program is underwritten by a third-party financial institution generally with no recourse to the Company.
As part of the credit program, the Company’s customers may tender their LL Flooring credit card to receive installation services.
Fair Value of Financial Instruments
The carrying amounts of financial instruments such as cash and cash equivalents, accounts payable and other liabilities approximate fair value because of the short-term nature of these items. The carrying value of the Revolving Credit Facility approximates fair value due to the variable rate of interest.
40
Merchandise Inventories
The Company values merchandise inventories at the lower of cost or net realizable value. The method by which amounts are removed from inventory is weighted average cost. All of the hardwood flooring purchased from vendors is either prefinished or unfinished, and in immediate saleable form. The Company relies on a select group of international suppliers to provide imported flooring products that meet the Company’s specifications. The Company is subject to risks associated with obtaining products from abroad, including disruptions or delays in production, shipments, delivery or processing. Merchandise inventories were rebuilt as of December 31, 2022 following COVID-19 related supply chain constraints that drove merchandise inventories below historical levels as of December 31, 2021.
Inventory cost includes the costs of bringing an article to its existing condition and location such as shipping and handling and import tariffs. Included in merchandise inventories are tariff related costs, including Section 301 tariffs on certain products imported from China in recent years. The Company has deployed pricing, promotion, and alternative country sourcing strategies to mitigate tariff-related costs and improve gross margin. The Company continues to monitor the market to inform its pricing and promotional strategies.
The Company maintains an inventory reserve for loss or obsolescence based on historical results and current sales trends. This reserve was $
Impairment of Long-Lived Assets
The Company evaluates potential impairment losses on long-lived assets and right-of-use assets used in operations when events and circumstances indicate that the assets may be impaired, and the undiscounted cash flows estimated to be generated by those assets are less than the carrying amounts of those assets. If impairment exists an impairment loss is recorded based on the difference between the carrying value and fair value of the assets.
Goodwill and Other Indefinite-Lived Intangibles
Goodwill represents the costs in excess of the fair value of net assets acquired associated with acquisitions by the Company. The Company evaluates goodwill for impairment on an annual basis, or whenever events or changes in circumstance indicate that the asset carrying value for the reporting unit exceeds its fair value. The Company considers the relationship between its market capitalization and its book value, among other factors, when reviewing for indicators of impairment. The goodwill impairment tests are based on determining the fair value of the specified reporting unit. The valuation approaches are subject to key judgments and assumptions that are sensitive to change such as judgments and assumptions about appropriate sales growth rates, operating margins, weighted average cost of capital (“WACC”), and comparable company market multiples.
When developing these key judgments and assumptions, the Company considers economic, operational and market conditions that could impact the fair value of the reporting unit. However, estimates are inherently uncertain and represent only management’s reasonable expectations regarding future developments. These estimates and the judgments and assumptions upon which the estimates are based will, in all likelihood, differ in some respects from actual future results.
Based on the analysis performed, the Company has recorded an impairment charge of $
Self-Insurance
The Company is self-insured for certain employee health benefit claims and for certain workers’ compensation claims. The Company estimates a liability for aggregate losses below stop-loss coverage limits based on estimates of the ultimate costs to be incurred to settle known claims and claims incurred but not reported as of the balance sheet date. The estimated liability is not discounted and is based on a number of assumptions and factors including historical and industry trends and economic conditions. This liability could be affected if future occurrences and claims differ from these assumptions and historical trends. As of December 31, 2022 and 2021, the Company had accruals of $
Recognition of Net Sales
The Company generates revenues primarily by retailing merchandise in the form of hard-surface and accessories. Additionally, the Company expands its revenues by offering services to deliver and/or install this merchandise for its customers; it considers these services to be separate performance obligations. The separate performance obligations are detailed on the customer’s invoice(s) and the customer often purchases flooring merchandise without purchasing installation or delivery services. Sales occur through a network of
41
period as permitted by GAAP. The Company reports its revenues exclusive of sales taxes collected from customers and remitted to governmental taxing authorities, consistent with past practice.
Revenue is based on consideration specified in a contract with a customer and excludes any sales incentives from vendors. The Company recognizes revenue when it satisfies a performance obligation by transferring control over a product to a customer or performing service for a customer. Revenues from installation and freight services are recognized when the delivery is made or the installation is complete, which approximates the recognition of revenue over time due to the short duration of service provided. The price of the Company’s merchandise and services is specified in the respective contract and detailed on the invoice agreed to with the customer including any discounts. The Company generally requires customers to pay a deposit, equal to approximately half of the retail sales value, when ordering merchandise not regularly carried in a given location or not currently in stock. In addition, the Company generally does not extend credit to its customers with payment due in full at the time the customer takes possession of merchandise or when the service is provided. Customer payments and deposits received in advance of the customer taking possession of the merchandise or receiving the services are recorded as deferred revenues in the accompanying consolidated balance sheet caption “Customer Deposits and Store Credits”.
The following table shows the activity in this account for the periods noted:
|
|
Year Ended December 31, |
|
|||||||||
|
|
2022 |
|
|
2021 |
|
|
2020 |
|
|||
Customer Deposits and Store Credits, Beginning Balance |
|
$ |
( |
) |
|
$ |
( |
) |
|
$ |
( |
) |
New Deposits |
|
|
( |
) |
|
|
( |
) |
|
|
( |
) |
Recognition of Revenue |
|
|
|
|
|
|
|
|
|
|||
Sales Tax included in Customer Deposits |
|
|
|
|
|
|
|
|
|
|||
Other |
|
|
|
|
|
|
|
|
|
|||
Customer Deposits and Store Credits, Ending Balance |
|
$ |
( |
) |
|
$ |
( |
) |
|
$ |
( |
) |
Subject to limitations under the Company’s policy, return of unopened merchandise is generally accepted for 90 days, subject to the discretion of the store manager. The amount of revenue recognized for flooring merchandise is adjusted for expected returns, which are estimated based on the Company’s historical data, current sales levels and forecasted economic trends. The Company uses the expected value method to estimate returns because it has a large number of contracts with similar characteristics. The Company reduces revenue by the number of expected returns and records it within “Other Current Liabilities” on the consolidated balance sheet. In addition, the Company recognizes a related asset for the right to recover returned merchandise and records it in the “Other Current Assets” caption of the accompanying consolidated balance sheet. This amount was $
In total, the Company offers hundreds of different flooring products; however, no single flooring product represented a significant portion of its sales mix. By major product category, the Company’s sales mix was as follows:
|
|
Year Ended December 31, |
|
|||||||||||||||||||||
|
|
2022 |
|
|
2021 |
|
|
2020 |
|
|||||||||||||||
Manufactured Products1 |
|
$ |
|
|
|
% |
|
$ |
|
|
|
% |
|
$ |
|
|
|
% |
||||||
Solid and Engineered Hardwood |
|
|
|
|
|
% |
|
|
|
|
|
% |
|
|
|
|
|
% |
||||||
Moldings and Accessories and Other |
|
|
|
|
|
% |
|
|
|
|
|
% |
|
|
|
|
|
% |
||||||
Installation and Delivery Services |
|
|
|
|
|
% |
|
|
|
|
|
% |
|
|
|
|
|
% |
||||||
Total |
|
$ |
|
|
|
% |
|
$ |
|
|
|
% |
|
$ |
|
|
|
% |
||||||
1 Includes engineered vinyl plank, laminate, vinyl and tile.
Cost of Sales
Cost of sales includes the cost of products sold, including tariffs, the cost of installation services, and transportation costs from vendors to the Company’s distribution centers or store locations. It also includes transportation costs from distribution centers to store locations, transportation costs for the delivery of products from store locations to customers, certain costs of quality control procedures, warranty and customer satisfaction costs, inventory adjustments including obsolescence and shrinkage, and costs to produce samples, which are net of vendor allowances.
The Company offers a range of limited warranties for the durability of the finish on its prefinished products to its services provided. These limited warranties range from to
42
satisfy customers for claims not directly related to the warranty on the Company’s products. Warranty costs are recorded in cost of sales. This reserve was $
Vendor allowances mostly consist of volume rebates and are accrued as earned, with those allowances received as a result of attaining certain purchase levels accrued over the incentive period based on estimates of purchases. Volume rebates earned are initially recorded as a reduction in merchandise inventories and a subsequent reduction in cost of sales when the related product is sold. Reimbursement received for the cost of producing samples is recorded as an offset against cost of sales.
Advertising Costs
Advertising costs charged to selling, general and administrative (“SG&A”) expenses, net of vendor allowances, were $
Store Opening Costs
Costs to open new store locations are charged to SG&A expenses as incurred, net of any vendor support.
Other Vendor Consideration
Consideration from non-merchandise vendors, including royalties and rebates, are generally recorded as an offset to SG&A expenses when earned.
Depreciation and Amortization
Property and equipment are carried at cost and depreciated on the straight-line method over the estimated useful lives. The estimated useful lives for leasehold improvements are the shorter of the estimated useful lives or the remainder of the lease terms. For leases with optional renewal periods for which renewal is not reasonably certain, the Company uses the original lease term, excluding optional renewal periods, to determine the appropriate estimated useful lives. Capitalized software costs are capitalized from the time that technological feasibility is established until the software is ready for use. The estimated useful lives are generally as follows:
|
|
|
|
|
Years |
Buildings and Building Improvements |
|
|
Property and Equipment |
|
|
Computer Software and Hardware |
|
|
Leasehold Improvements |
|
Leases
The Company determines if an arrangement is a lease at inception. Operating leases are included in operating lease right-of-use (“ROU”) assets and operating lease liabilities on the consolidated balance sheet. The operating lease ROU assets and operating lease liabilities are recognized as the present value of the future minimum lease payments over the lease term at commencement date. As most of the leases do not provide an implicit rate, the Company used its incremental borrowing rate based on the information available at commencement date in determining the present value of future payments. The incremental borrowing rate is determined with the assistance of a third party. The operating lease ROU asset also is adjusted for any lease payments made and excludes lease incentives and initial direct costs incurred. The Company’s lease terms may include options to extend or terminate the lease at certain dates, typically at the Company’s own discretion. The Company regularly evaluates the renewal options and when they are reasonably certain of exercise, the Company includes the renewal period in its lease term. Many of the Company’s leases include both lease (e.g., payments including rent, taxes, and insurance costs) and non-lease components (e.g., common-area or other maintenance costs) which are accounted for as a single lease component as the Company has elected the practical expedient to group lease and non-lease components for all leases. Lease expense for minimum lease payments is recognized on a straight-line basis over the term of the agreement.
The Company made an accounting policy election that payments under agreements with an initial term of 12 months or less will not be included on the consolidated balance sheet but will be recognized in the consolidated statements of income on a straight-line basis over the term of the agreement.
43
Stock-Based Compensation
The Company records compensation expense associated with stock options and other forms of equity compensation in accordance with ASC 718. The Company may issue incentive awards, including performance-based awards, in the form of stock options, restricted shares and other equity awards to employees, non-employee directors and other service providers. The Company recognizes expense for the majority of its stock-based compensation based on the fair value of the awards that are granted. For awards granted to non-employee directors, expense is recognized based on the fair value of the award at the end of a reporting period. For performance-based awards granted to certain members of senior management, the Company recognizes expense after assessing the probability of the achievement of certain financial metrics on a periodic basis. Compensation expense is recognized only for those awards expected to vest, with forfeitures estimated at the date of grant based on historical experience and future expectations. Measured compensation cost is recognized ratably over the requisite service period of the entire related stock-based compensation award.
Business Interruption Insurance Proceeds
In August 2019, the Company experienced a network security incident caused by malware that prevented access to several of the Company’s information technology systems and data. In 2020, the Company recorded $
Foreign Currency Translation
The Company’s former Canadian operations used the Canadian dollar as the functional currency. Assets and liabilities were translated at exchange rates in effect at the balance sheet date. Revenues and expenses were translated at the average monthly exchange rates during the year. Resulting translation adjustments have been recorded as a component of accumulated other comprehensive income on the consolidated balance sheets. The Company closed all our stores in Canada in December 2020 and realized expense of $
Income Taxes
Income taxes are accounted for in accordance with ASC 740 (“ASC 740”). Income taxes are provided for under the asset and liability method and consider differences between the tax and financial accounting bases. The tax effects of these differences are reflected on the consolidated balance sheets as deferred income taxes and measured using the effective tax rate expected to be in effect when the differences reverse. ASC 740 also requires that deferred tax assets be reduced by a valuation allowance if it is more likely than not that some portion of the deferred tax asset will not be realized. In evaluating the need for a valuation allowance, the Company takes into account various factors, including the nature, frequency and severity of current and cumulative losses, expected level of future taxable income, the duration of statutory carryforward periods and tax planning alternatives. In future periods, any valuation allowance will be re-evaluated in accordance with ASC 740, and a change, if required, will be recorded through income tax expense in the period such determination is made.
The Company recognizes the tax benefit from an uncertain tax position only if it is more likely than not that the tax position will be sustained on examination by the relevant taxing authorities, based on the technical merits of its position. The tax benefits recognized in the financial statements from such a position are measured based on the largest benefit that has a greater than 50% likelihood of being realized upon ultimate settlement. The Company classifies interest and penalties related to income tax matters as a component of income tax expense.
Net Income per Common Share
Basic net income per common share is determined by dividing net income by the weighted average number of common shares outstanding during the year. Diluted net income per common share is determined by dividing net income by the weighted average number of common shares outstanding during the year, plus the dilutive effect of common stock equivalents, including stock options and restricted shares. A total of
44
Note 2. Property and Equipment
Property and equipment consisted of:
|
|
December 31, |
|
|||||
|
|
2022 |
|
|
2021 |
|
||
Land |
|
$ |
|
|
$ |
|
||
Building |
|
|
|
|
|
|
||
Property and Equipment |
|
|
|
|
|
|
||
Computer Software and Hardware |
|
|
|
|
|
|
||
Leasehold Improvement |
|
|
|
|
|
|
||
Assets under Construction |
|
|
|
|
|
|
||
|
|
|
|
|
|
|
||
Less: Accumulated Depreciation and Amortization |
|
|
|
|
|
|
||
Property and Equipment, Net |
|
$ |
|
|
$ |
|
||
As of December 31, 2022 and 2021, the Company had cumulatively capitalized $
Note 3. Goodwill and Other Indefinite-Lived Intangibles
Goodwill represents the costs in excess of the fair value of net assets acquired associated with acquisitions by the Company. The Company evaluates goodwill for impairment on an annual basis, or whenever events or changes in circumstance indicate that the asset carrying value for the reporting unit exceeds its fair value. The goodwill impairment tests are based on determining the fair value of the specified reporting units based on management judgments and assumptions using the discounted cash flows under the income approach classified in Level 3 of the fair value hierarchy and comparable company market valuation classified in Level 2 of the fair value hierarchy approaches.
The Company operates as a single operating segment for the purposes of allocating goodwill as well as assessing impairments. The valuation approaches are subject to key judgments and assumptions that are sensitive to change such as judgments and assumptions about appropriate sales growth rates, operating margins, weighted average cost of capital ("WACC") and comparable company market multiples.
The Company compared the estimated fair value of its reporting unit to its carrying value as of December 31, 2022, taking into account the decline in the Company’s market capitalization, increases in the weighted average cost of capital as applied to our future cash flow models, and comparable company market multiples. The impairment test indicated a pre-tax, non-cash goodwill impairment charge of $
Note 4. Credit Agreement
On March 29, 2019, the Company entered into a Fourth Amended and Restated Credit Agreement (the “Original Credit Agreement”) with Bank of America, N.A. (the “Bank”) and Wells Fargo Bank, National Association (“Wells” and, collectively with the Bank, the “Lenders”) and the Bank in its capacity as administrative agent and collateral agent (in this capacity, the “Agent”) and Wells as syndication agent. The Original Credit Agreement was subsequently amended by the First Amendment to the Credit Agreement on April 17, 2020, and the Second Amendment to the Credit Agreement on April 30, 2021 (as amended, the “Credit Agreement”).
On December 27, 2022, the Company entered into a Waiver and Third Amendment to the Credit Agreement (the “Amendment”) with the Lenders and the Agent. The Amendment, among other things, (i) changed the rate under the Agreement for borrowings from a LIBOR-based rate to a Term SOFR-based rate (as defined in the Amendment), subject to certain adjustments specified in the Amendment and (ii) provided a waiver of a technical event of default under the Credit Agreement related to providing notice to the Lenders of the Company’s name change from Lumber Liquidators Holdings, Inc. to LL Flooring Holdings, Inc. Except as set forth in the Amendment, all other terms and conditions of the Credit Agreement remain in place.
The total size of the Credit Agreement is $
The Revolving Credit Facility is secured by security interests in the Collateral (as defined in the Credit Agreement), which includes substantially all assets of the Company including, among other things, the Company’s inventory and credit card receivables, and the Company’s East Coast distribution center located in Sandston, Virginia. Under the terms of the Credit Agreement, the Company has the ability to release the East Coast distribution center from the Collateral under certain conditions.
45
The Amendment defines the margin for Term SOFR Rate Loans (as defined in the Amendment) as a range of
The Credit Agreement contains a fixed charge coverage ratio covenant that becomes effective only when specified availability under the Revolving Credit Facility falls below the greater of $
As of December 31, 2022, there was $
Note 5. Leases
The Company has operating leases for its stores, corporate headquarters in Richmond, Virginia, its distribution center on the west coast, supplemental office facilities and certain equipment. The store location leases generally have to-
The cost components of the Company’s operating leases recorded in SG&A on the consolidated statement of operations were as follows for the periods shown:
|
|
Year Ended December 31, 2022 |
|
|
Year Ended December 31, 2021 |
|
|
Year Ended December 31, 2020 |
|
|||||||||||||||||||||||||||
|
|
Store Leases |
|
|
Other Leases |
|
|
Total |
|
|
Store Leases |
|
|
Other Leases |
|
|
Total |
|
|
Store Leases |
|
|
Other Leases |
|
|
Total |
|
|||||||||
|
|
|
|
|
|
|
|
|
|
|
|
|
|
|
|
|
|
|
|
|
|
|
|
|
|
|
|
|||||||||
Operating Lease Costs |
|
$ |
|
|
$ |
|
|
$ |
|
|
$ |
|
|
$ |
|
|
$ |
|
|
$ |
|
|
$ |
|
|
$ |
|
|||||||||
Variable Lease Costs |
|
|
|
|
|
|
|
|
|
|
|
|
|
|
|
|
|
|
|
|
|
|
|
|
|
|
|
|||||||||
Total |
|
$ |
|
|
$ |
|
|
$ |
|
|
$ |
|
|
$ |
|
|
$ |
|
|
$ |
|
|
$ |
|
|
$ |
|
|||||||||
Variable lease costs consist primarily of taxes, insurance, and common area or other maintenance costs for our leased facilities, which are paid as incurred.
Other information related to leases were as follows:
|
|
Year Ended December 31, 2022 |
|
|
Year Ended December 31, 2021 |
|
|
Year Ended December 31, 2020 |
|
|||||||||||||||||||||||||||
|
|
Store Leases |
|
|
Other Leases |
|
|
Total |
|
|
Store Leases |
|
|
Other Leases |
|
|
Total |
|
|
Store Leases |
|
|
Other Leases |
|
|
Total |
|
|||||||||
|
|
|
|
|
|
|
|
|
|
|
|
|
|
|
|
|
|
|
|
|
|
|
|
|
|
|
|
|||||||||
Supplemental Cash Flows Information |
|
|
|
|
|
|
|
|
|
|
|
|
|
|
|
|
|
|
|
|
|
|
|
|
|
|
|
|||||||||
Cash Paid for Amounts Included in the Measurement of Lease Liabilities: |
|
|
|
|
|
|
|
|
|
|
|
|
|
|
|
|
|
|
|
|
|
|
|
|
|
|
|
|||||||||
Operating Cash Flows from Operating Leases |
|
$ |
|
|
$ |
|
|
$ |
|
|
$ |
|
|
$ |
|
|
$ |
|
|
$ |
|
|
$ |
|
|
$ |
|
|||||||||
|
|
|
|
|
|
|
|
|
|
|
|
|
|
|
|
|
|
|
|
|
|
|
|
|
|
|
|
|||||||||
Right-of-Use Assets Obtained or Modified in Exchange for Operating Lease Obligations |
|
$ |
|
|
$ |
|
|
$ |
|
|
$ |
|
|
$ |
|
|
$ |
|
|
$ |
|
|
$ |
|
|
$ |
|
|||||||||
|
|
|
|
|
|
|
|
|
|
|
|
|
|
|
|
|
|
|
|
|
|
|
|
|
|
|
|
|||||||||
Weighted Average Remaining Lease Term (Years) |
|
|
|
|
|
|
|
|
|
|
|
|
|
|
|
|
|
|
|
|
|
|
|
|
|
|
|
|||||||||
|
|
|
|
|
|
|
|
|
|
|
|
|
|
|
|
|
|
|
|
|
|
|
|
|
|
|
|
|||||||||
Weighted Average Discount Rate |
|
|
% |
|
|
% |
|
|
% |
|
|
% |
|
|
% |
|
|
% |
|
|
% |
|
|
% |
|
|
% |
|||||||||
On December 31, 2022, the future minimum rental payments under non-cancelable operating leases were as follows:
46
|
|
Operating Leases |
|
|||||||||
|
|
|
|
|
|
|
|
Total |
|
|||
|
|
|
|
|
Other |
|
|
Operating |
|
|||
|
|
Store Leases |
|
|
Leases |
|
|
Leases |
|
|||
2023 |
|
$ |
|
|
$ |
|
|
$ |
|
|||
2024 |
|
|
|
|
|
|
|
|
|
|||
2025 |
|
|
|
|
|
|
|
|
|
|||
2026 |
|
|
|
|
|
|
|
|
|
|||
2027 |
|
|
|
|
|
|
|
|
|
|||
Thereafter |
|
|
|
|
|
|
|
|
|
|||
Total Minimum Lease Payments |
|
|
|
|
|
|
|
|
|
|||
Less Imputed Interest |
|
|
( |
) |
|
|
( |
) |
|
|
( |
) |
Total |
|
$ |
|
|
$ |
|
|
$ |
|
|||
Note 6. Stockholders’ Equity
Net Income per Common Share
The following table sets forth the computation of basic and diluted net income per common share:
|
|
Year Ended December 31, |
|
|||||||||
|
|
2022 |
|
|
2021 |
|
|
2020 |
|
|||
Net (Loss) Income |
|
$ |
( |
) |
|
$ |
|
|
$ |
|
||
Weighted Average Common Shares Outstanding—Basic |
|
|
|
|
|
|
|
|
|
|||
Effect of Dilutive Securities: |
|
|
|
|
|
|
|
|
|
|||
Common Stock Equivalents |
|
|
— |
|
|
|
|
|
|
|
||
Weighted Average Common Shares Outstanding—Diluted |
|
|
|
|
|
|
|
|
|
|||
Net (Loss) Income per Common Share—Basic |
|
$ |
( |
) |
|
$ |
|
|
$ |
|
||
Net (Loss) Income per Common Share—Diluted |
|
$ |
( |
) |
|
$ |
|
|
$ |
|
||
47
The following have been excluded from the computation of Weighted Average Common Shares Outstanding—Diluted because the effect would be antidilutive:
|
|
Year Ended December 31, |
|
|||||||||
|
|
2022 |
|
|
2021 |
|
|
2020 |
|
|||
Stock Options |
|
|
|
|
|
|
|
|
|
|||
Restricted Shares |
|
|
|
|
|
|
|
|
|
|||
Stock Repurchase Program
In January 2012, the Company’s board of directors adopted an authorization for the repurchase of up to a total of $
Outside of the share repurchase program, during the twelve months ended December 31, 2022, the Company repurchased $
Note 7. Stock-Based Compensation
Overview
The Company has an equity incentive plan (the “Plan”) for employees, non-employee directors and other service providers from which the Company may grant stock options, restricted shares and other equity awards. The total number of shares of common stock authorized for issuance under the Plan is
The Company also maintains the Outside Directors Deferral Plan under which each of the Company’s non-employee directors has the opportunity to elect annually to defer certain fees (which are payable in cash or in shares of Common Stock with a vesting period of at least
48
Stock Options
The following table summarizes activity related to employee stock options:
|
|
|
|
|
|
|
|
Remaining |
|
|
|
|
||||
|
|
|
|
|
Weighted |
|
|
Average |
|
|
Aggregate |
|
||||
|
|
|
|
|
Average |
|
|
Contractual |
|
|
Intrinsic |
|
||||
|
|
Shares |
|
|
Exercise Price |
|
|
Term (Years) |
|
|
Value |
|
||||
Balance, December 31, 2019 |
|
|
|
|
$ |
|
|
|
|
|
$ |
|
||||
Granted |
|
|
|
|
|
|
|
|
|
|
|
|
||||
Exercised |
|
|
( |
) |
|
|
|
|
|
|
|
|
|
|||
Forfeited |
|
|
( |
) |
|
|
|
|
|
|
|
|
|
|||
Balance, December 31, 2020 |
|
|
|
|
$ |
|
|
|
|
|
$ |
|
||||
Granted |
|
|
|
|
|
|
|
|
|
|
|
|
||||
Exercised |
|
|
( |
) |
|
|
|
|
|
|
|
|
|
|||
Forfeited |
|
|
( |
) |
|
|
|
|
|
|
|
|
|
|||
Balance, December 31, 2021 |
|
|
|
|
$ |
|
|
|
|
|
$ |
|
||||
Granted |
|
|
|
|
|
|
|
|
|
|
|
|
||||
Exercised |
|
|
( |
) |
|
|
|
|
|
|
|
|
|
|||
Forfeited |
|
|
( |
) |
|
|
|
|
|
|
|
|
|
|||
Balance, December 31, 2022 |
|
|
|
|
$ |
|
|
|
|
|
$ |
— |
|
|||
|
|
|
|
|
|
|
|
|
|
|
|
|
||||
Exercisable at December 31, 2022 |
|
|
|
|
$ |
|
|
|
|
|
$ |
— |
|
|||
Vested and Expected to Vest December 31, 2022 |
|
|
|
|
$ |
|
|
|
|
|
$ |
— |
|
|||
The aggregate intrinsic value is the difference between the exercise price and the closing price of the Company’s common stock on December 31. The stock options exercised during 2022 had
As of December 31, 2022, total unrecognized compensation cost related to unvested options was approximately $
The fair value of each stock option award is estimated by management on the date of the grant using the Black-Scholes-Merton option pricing model. The weighted average fair value of options granted during 2022, 2021 and 2020 was $
The following are the average assumptions for the periods noted:
|
|
Year Ended December 31, |
|
|
|||||||||||||
|
|
2022 |
|
|
|
|
2021 |
|
|
|
|
2020 |
|
|
|||
Expected Dividend Rate |
|
|
|
% |
|
|
|
% |
|
|
% |
||||||
Expected Stock Price Volatility |
|
|
|
|
% |
|
|
|
|
% |
|
|
|
% |
|||
Risk-Free Interest Rate |
|
|
|
|
% |
|
|
|
|
% |
|
|
|
% |
|||
Expected Term of Options |
|
|
|
|
years |
|
|
|
|
years |
|
|
|
years |
|||
The expected stock price volatility is based on the historical volatility of the Company’s stock price. The volatilities are estimated for a period of time equal to the expected term of the related option. The risk-free interest rate is based on the implied yield of U.S. Treasury zero-coupon issues with an equivalent remaining term. The expected term of the options represents the estimated period of time until exercise and is determined by considering the contractual terms, vesting schedule and expectations of future employee behavior.
49
Restricted Stock Awards
The following table summarizes activity related to employee restricted stock awards ("RSAs"):
|
|
|
|
|
Weighted Average |
|
||
|
|
|
|
|
Grant Date Fair |
|
||
|
|
Shares |
|
|
Value |
|
||
Nonvested, December 31, 2019 |
|
|
|
|
$ |
|
||
Granted |
|
|
|
|
|
|
||
Released |
|
|
( |
) |
|
|
|
|
Forfeited |
|
|
( |
) |
|
|
|
|
Nonvested, December 31, 2020 |
|
|
|
|
$ |
|
||
Granted |
|
|
|
|
|
|
||
Released |
|
|
( |
) |
|
|
|
|
Forfeited |
|
|
( |
) |
|
|
|
|
Nonvested, December 31, 2021 |
|
|
|
|
$ |
|
||
Granted |
|
|
|
|
|
|
||
Released |
|
|
( |
) |
|
|
|
|
Forfeited |
|
|
( |
) |
|
|
|
|
Nonvested, December 31, 2022 |
|
|
|
|
$ |
|
||
Additionally, the Company’s non-employee directors are compensated with an annual RSA grant with a vesting period of one year. The amount of outstanding unvested RSAs granted to non-employee directors was
The fair value of restricted shares released during 2022, 2021 and 2020 was $
The Company granted a target of
Note 8. Taxes
The components of (loss) income before income taxes were as follows:
|
|
Year Ended December 31, |
|
|||||||||
|
|
2022 |
|
|
2021 |
|
|
2020 |
|
|||
United States |
|
$ |
( |
) |
|
$ |
|
|
$ |
|
||
Foreign |
|
|
( |
) |
|
|
|
|
|
( |
) |
|
Total (Loss) Income before Income Taxes |
|
$ |
( |
) |
|
$ |
|
|
$ |
|
||
50
The (benefit) expense for income taxes consisted of the following:
|
|
Year Ended December 31, |
|
|||||||||
|
|
2022 |
|
|
2021 |
|
|
2020 |
|
|||
Current |
|
|
|
|
|
|
|
|
|
|||
Federal |
|
$ |
( |
) |
|
$ |
|
|
$ |
|
||
State |
|
|
|
|
|
|
|
|
|
|||
Foreign |
|
|
|
|
|
|
|
|
|
|||
Total Current |
|
|
|
|
|
|
|
|
|
|||
|
|
|
|
|
|
|
|
|
|
|||
Deferred |
|
|
|
|
|
|
|
|
|
|||
Federal |
|
|
( |
) |
|
|
|
|
|
( |
) |
|
State |
|
|
( |
) |
|
|
( |
) |
|
|
( |
) |
Total Deferred |
|
|
( |
) |
|
|
|
|
|
( |
) |
|
Income Tax (Benefit) Expense |
|
$ |
( |
) |
|
$ |
|
|
$ |
( |
) |
|
A reconciliation to the statutory tax rate is as follows:
|
|
Year Ended December 31, |
|
|||||||||||||||||||||
|
|
2022 |
|
|
2021 |
|
|
2020 |
|
|||||||||||||||
Income Tax (Benefit) Expense at Federal Statutory Rate |
|
$ |
( |
) |
|
|
% |
|
$ |
|
|
|
% |
|
$ |
|
|
|
% |
|||||
|
|
|
|
|
|
|
|
|
|
|
|
|
|
|
|
|
|
|
||||||
Increases (Decreases): |
|
|
|
|
|
|
|
|
|
|
|
|
|
|
|
|
|
|
||||||
State Income Taxes, Net of Federal Income |
|
|
|
|
|
( |
)% |
|
|
|
|
|
% |
|
|
|
|
|
% |
|||||
Change in Valuation Allowance and Loss |
|
|
— |
|
|
|
— |
% |
|
|
( |
) |
|
|
( |
)% |
|
|
( |
) |
|
|
( |
)% |
Foreign Operations |
|
|
|
|
|
( |
)% |
|
|
|
|
|
% |
|
|
|
|
|
% |
|||||
Uncertain Tax Positions |
|
|
( |
) |
|
|
% |
|
|
|
|
|
% |
|
|
— |
|
|
|
— |
% |
|||
Non-Deductible Items |
|
|
|
|
|
( |
)% |
|
|
( |
) |
|
|
( |
)% |
|
|
( |
) |
|
|
( |
)% |
|
CARES Act Rate Differential |
|
|
— |
|
|
|
— |
% |
|
|
— |
|
|
|
— |
% |
|
|
( |
) |
|
|
( |
)% |
Other |
|
|
|
|
|
( |
)% |
|
|
|
|
|
% |
|
|
( |
) |
|
|
( |
)% |
|||
|
|
|
|
|
|
|
|
|
|
|
|
|
|
|
|
|
|
|
||||||
Income Tax (Benefit) Expense |
|
$ |
( |
) |
|
|
% |
|
$ |
|
|
|
% |
|
$ |
( |
) |
|
|
( |
)% |
|||
51
The tax effects of temporary differences that result in significant portions of the deferred tax accounts based on enacted statutory rates in both 2022 and 2021, are as follows:
|
|
December 31, |
|
|||||
|
|
2022 |
|
|
2021 |
|
||
Deferred Tax Liabilities: |
|
|
|
|
|
|
||
Operating Lease Right-of-Use Assets |
|
$ |
( |
) |
|
$ |
( |
) |
Depreciation and Amortization and Other |
|
|
( |
) |
|
|
( |
) |
Total Gross Deferred Tax Liabilities |
|
|
( |
) |
|
|
( |
) |
|
|
|
|
|
|
|
||
Deferred Tax Assets: |
|
|
|
|
|
|
||
Operating Lease Liabilities |
|
|
|
|
|
|
||
Stock-Based Compensation Expense |
|
|
|
|
|
|
||
Legal Settlement Reserves |
|
|
|
|
|
|
||
Other Accruals and Reserves |
|
|
|
|
|
|
||
Employee Benefits |
|
|
|
|
|
|
||
Inventory Reserves |
|
|
|
|
|
|
||
Inventory Capitalization |
|
|
|
|
|
|
||
Amortization |
|
|
|
|
|
|
||
Foreign Net Operating Loss Carryforwards |
|
|
— |
|
|
|
|
|
Net Operating Loss Carryforwards |
|
|
|
|
|
|
||
Capital Loss Carryforwards and Other |
|
|
|
|
|
|
||
Total Gross Deferred Tax Assets |
|
|
|
|
|
|
||
Less: Valuation Allowance |
|
|
— |
|
|
|
( |
) |
Total Deferred Tax Assets |
|
|
|
|
|
|
||
Net Deferred Tax Asset |
|
$ |
|
|
$ |
|
||
The Company continues to monitor developments by federal and state rulemaking authorities regarding tax law changes and recognizes the impact of these law changes in the period in which they are enacted.
On December 31, 2022, the Company was in a consolidated cumulative three-year income position. Based on the Company’s evaluation at a jurisdictional level as of December 31, 2022, the Company believes sufficient future taxable income, including consideration of future performance, market, or economic conditions, will be generated to use existing deferred tax assets. The amount of the deferred tax assets considered realizable could be adjusted in future periods if evidence warrants such a change.
For 2022, we reported a $
As of December 31, 2022, the Company recognized U.S federal net operating loss of $
The Company paid income taxes (net of refunds) of $
As of December 31, 2022 and 2021, respectively, the Company had $
52
A reconciliation of the beginning and ending amount of gross unrecognized tax benefits, excluding interest and penalties, is as follows:
|
|
Year Ended December 31, |
|
|||||
|
|
2022 |
|
|
2021 |
|
||
Balance at Beginning of Year |
|
$ |
|
|
$ |
|
||
Increase for Tax Positions Related to Current Year |
|
|
|
|
|
|
||
Decrease for Tax Positions Related to Prior Years |
|
|
( |
) |
|
|
( |
) |
Settlements |
|
|
— |
|
|
|
( |
) |
Balance at End of Year |
|
$ |
|
|
$ |
|
||
The Company files income tax returns with the U.S. federal government and various state and foreign jurisdictions. In the normal course of business, the Company is subject to examination by taxing authorities. As of December 31, 2022, the Company is under audit by the Internal Revenue Service for the years 2018 and 2013, relating primarily to the amended 2018 tax return and related carryback to 2013 as permitted by the CARES Act of 2020. As of December 31, 2022, there are no known liabilities associated with that audit and nothing has been noted by the auditor.
In February 2022, the Company received sales tax and use tax assessments from the Commonwealth of Virginia covering part of 2014 through 2017. The Company believes there are factual errors, is disputing this assessment, and will defend itself vigorously in this matter. The Company is pursuing an administrative appeal, which was filed on April 15, 2022. Given the uncertainty of the final resolution, the Company cannot reasonably estimate the loss or range of loss, if any, that may result from this action and therefore no specific accrual has been made related to this. Any losses could, potentially, have a material adverse effect, individually or collectively, on the Company’s results of operations, financial condition and liquidity.
Note 9. 401(k) Plan
The Company maintains a plan, qualified under Section 401(k) of the Internal Revenue Code, for all eligible employees. Employees are eligible to participate following the completion of
Note 10. Commitments and Contingencies
The following chart shows the activity related to the Balance Sheet “Accrual for Legal Matters and Settlements-Current”. The matters themselves are described in greater detail in the paragraphs that follow the chart.
|
|
December 31, 2021 |
|
|
|
|
|
|
|
|
|
|
|
December 31, 2022 |
|
|||||
Litigation Matter |
|
Accrual for Legal Matters |
|
|
|
|
|
Settlement |
|
|
Vouchers |
|
|
Accrual for Legal Matters |
|
|||||
Description |
|
and Settlements - Current |
|
|
Accruals |
|
|
Payments |
|
|
Redeemed |
|
|
and Settlements - Current |
|
|||||
MDL |
|
$ |
|
|
$ |
— |
|
|
$ |
— |
|
|
$ |
( |
) |
|
$ |
|
||
Gold |
|
|
|
|
|
— |
|
|
|
— |
|
|
|
( |
) |
|
|
|
||
Mason |
|
|
|
|
|
|
|
|
( |
) |
|
|
— |
|
|
|
— |
|
||
Other Matters |
|
|
|
|
|
|
|
|
( |
) |
|
|
— |
|
|
|
|
|||
|
|
$ |
|
|
$ |
|
|
$ |
( |
) |
|
$ |
( |
) |
|
$ |
|
|||
|
|
|
|
|
|
|
|
|
|
|
|
|
|
|
|
|||||
|
|
December 31, 2020 |
|
|
|
|
|
|
|
|
|
|
|
December 31, 2021 |
|
|||||
Litigation Matter |
|
Accrual for Legal Matters |
|
|
|
|
|
Settlement |
|
|
Vouchers |
|
|
Accrual for Legal Matters |
|
|||||
Description |
|
and Settlements - Current |
|
|
Accruals |
|
|
Payments |
|
|
Redeemed |
|
|
and Settlements - Current |
|
|||||
MDL |
|
$ |
|
|
$ |
— |
|
|
$ |
— |
|
|
$ |
( |
) |
|
$ |
|
||
Gold |
|
|
|
|
|
— |
|
|
|
— |
|
|
|
( |
) |
|
|
|
||
Mason |
|
|
— |
|
|
|
|
|
|
— |
|
|
|
— |
|
|
|
|
||
Other Matters |
|
|
|
|
|
|
|
|
( |
) |
|
|
— |
|
|
|
|
|||
|
|
$ |
|
|
$ |
|
|
$ |
( |
) |
|
$ |
( |
) |
|
$ |
|
|||
53
Litigation Related to Formaldehyde-Abrasion MDLs
In 2018, the Company entered into a settlement agreement to resolve claims related to Chinese-manufactured laminate products (the “Formaldehyde-Abrasion MDL”). Under the terms of the settlement agreement, the Company funded $
As of December 31, 2022, the remaining accrual related to these matters was $
Litigation Relating to Bamboo Flooring
In 2019, the Company finalized a settlement agreement to resolve claims related to Morning Star bamboo flooring (the “Gold Litigation”). Under the terms of the settlement agreement, the Company contributed $
As of December 31, 2022, the remaining accrual related to these matters was $
Mason Lawsuit
In the second quarter of 2022, the Company paid $
Antidumping and Countervailing Duties Investigation
In October 2010, a conglomeration of domestic manufacturers of multilayered wood flooring (“Petitioners”) filed a petition seeking the imposition of antidumping (“AD”) and countervailing duties (“CVD”) with the United States Department of Commerce (“DOC”) and the United States International Trade Commission (“ITC”) against imports of multilayered wood flooring from China. This ruling applies to companies importing multilayered wood flooring from Chinese suppliers subject to the AD and CVD orders. The Company’s multilayered wood flooring imports from China accounted for approximately
As part of its processes in these proceedings, the DOC conducts annual reviews of the AD and CVD rates. In such cases, the DOC will issue preliminary rates that are not binding and are subject to comment by interested parties. After consideration of the comments received, the DOC will issue final rates for the applicable period, which may lag by a year or more. At the time of import, the Company makes deposits at the then prevailing rate, even while the annual review is in process. When rates are declared final by the DOC, the Company accrues a receivable or payable depending on where that final rate compares to the deposits it has made. The Company and/or the domestic manufacturers can appeal the final rate for any period and can place a hold on final settlement by U.S. Customs and Border Protection while the appeals are pending.
The Company as well as other involved parties have appealed many of the final rate determinations. Certain of those appeals are pending and, at times, have resulted in delays in settling the shortfalls and refunds. Because of the length of time for finalization of rates as well as appeals, any subsequent adjustment of AD and CVD rates typically flows through a period different from those in which the inventory was originally purchased and/or sold.
As of December 31, 2022, the outstanding AD and CVD principal balances were $
54
to rates whether due to finalization by the DOC or because of action of a court based on appeals by various parties. These amounts do not include any initial amounts paid for AD or CVD in the current period at the in-effect rate at that time.
The Company recorded net interest income related to antidumping and countervailing duties of $
Section 301 Tariffs
Since September 2018, pursuant to Section 301 of the Trade Act of 1974, the United States Trade Representative (“USTR”) has imposed tariffs on certain goods imported from China over four tranches ("Lists"). Products imported by the Company fall within Lists 3 and 4a for which tariffs range from 10% to 25%. On September 10, 2020 several importers of vinyl flooring filed a lawsuit with the Court of International Trade ("CIT") challenging the Section 301 tariffs under Lists 3 and 4a. The Company has also filed a companion case at the CIT challenging the legitimacy of the USTR's actions. On April 1, 2022 the CIT remanded the matter back to the USTR to explain its process for considering objections to the 301 tariffs and to reply to the CIT by June 30, 2022. Based on a USTR request, this deadline was extended to August 1, 2022. On August 1, 2022 the USTR filed its remand comments as well as a request to supplement the record. On September 14, 2022, the Company filed their response to the USTR’s August 1, 2022 remand determination pursuant to the CIT April 1, 2022 order. On November 4, 2022, the USTR filed its response to the Company's comments. On December 5, 2022, the Company filed its reply, which completed the CIT's briefing on the remand results. The ruling will rest with the CIT upon review of the USTR’s remand. The Company is unable to predict the timing or outcome of the ruling by the USTR and/or CIT. If these appeals are successful, the Company should qualify for refunds on these Section 301 tariffs.
Other Matters
The Company is also, from time to time, subject to claims and disputes arising in the normal course of business. In the opinion of management, while the outcome of any such claims and disputes cannot be predicted with certainty, its ultimate liability in connection with these matters is not expected to have a material adverse effect on the Company’s results of operations, financial position or liquidity.
Item 9. Changes in and Disagreements with Accountants on Accounting and Financial Disclosure.
None.
Item 9A. Controls and Procedures.
Evaluation of Disclosure Controls and Procedures
We maintain disclosure controls and procedures (as defined in Rule 13a-15(e) under the Securities Exchange Act of 1934, as amended (the “Exchange Act”), that are designed to ensure that information that would be required to be disclosed in Exchange Act reports is recorded, processed, summarized and reported within the time periods specified in the SEC’s rules and forms, and that such information is accumulated and communicated to our management, including the principal executive officer and principal financial officer, as appropriate, to allow timely decisions regarding required disclosure.
We carried out an evaluation, under the supervision, and with the participation of our management, including our principal executive officer and principal financial officer, of the effectiveness of the design and operation of our disclosure controls and procedures as of December 31, 2022. Based on this evaluation, our principal executive officer and principal financial officer concluded that our disclosure controls and procedures were effective as of December 31, 2022, and designed to provide reasonable assurance that information required to be disclosed by us in reports that we file or submit under the Exchange Act, is recorded, processed, summarized and reported within the time periods specified in the rules and forms of the SEC and that such information is accumulated and communicated to our management, including our principal executive officer and principal financial officer, as appropriate to allow timely decisions regarding required disclosure.
Management’s Report on Internal Control over Financial Reporting
Management of the Company is responsible for establishing and maintaining adequate internal control over financial reporting. Internal control over financial reporting is defined in Rule 13a-15(f) promulgated under the Exchange Act as a process, designed by, or under the supervision of the Company’s principal executive officer and principal financial officer and effected by the Company’s board of directors, management and other personnel, to provide reasonable assurance regarding the reliability of financial reporting and the preparation of financial statements for external purposes in accordance with accounting principles generally accepted in the United States of America. Internal control over financial reporting includes maintaining records that in reasonable detail accurately
55
and fairly reflect our transactions and disposition of assets; providing reasonable assurance that transactions are recorded as necessary for preparation of our financial statements in accordance with generally accepted accounting principles; providing reasonable assurance that receipts and expenditures are made only in accordance with management and Board authorizations; and providing reasonable assurance regarding prevention or timely detection of unauthorized acquisition, use or disposition of our assets that could have a material effect on our financial statements.
Because of its inherent limitations, internal control over financial reporting is not intended to provide absolute assurance that a misstatement of our financial statements would be prevented or detected. Also, projections of any evaluation of effectiveness to future periods are subject to the risk that controls may become inadequate because of changes in conditions or that the degree of compliance with policies or procedures may deteriorate.
Management under the supervision of, and with the participation of the Company’s principal executive officer and principal financial officer, conducted an evaluation of the effectiveness of our internal control over financial reporting as of December 31, 2022 based on the framework and criteria established in Internal Control — Integrated Framework (2013) issued by the Committee of Sponsoring Organizations of the Treadway Commission. This evaluation included review of the documentation of controls, evaluation of the design effectiveness of controls, testing of the operating effectiveness of controls and a conclusion on this evaluation. Based on the foregoing, management concluded that the Company’s internal control over financial reporting was effective as of December 31, 2022 based on the specified criteria.
Our internal control over financial reporting as of December 31, 2022 has been audited by Ernst & Young LLP, an independent registered public accounting firm, as stated in their report, as shown in Item 8. “Consolidated Financial Statements and Supplementary Data.”
Changes in Internal Control over Financial Reporting
There has been no change in our internal control over financial reporting that occurred during the quarter ended December 31, 2022 that has materially affected, or is reasonably likely to materially affect, our internal control over financial reporting.
Item 9B. Other Information.
On February 23, 2023, Charles Tyson, the Company’s President and Chief Executive Officer, assumed the responsibilities of principal financial officer, in addition to continuing in his role as principal executive officer. Biographical information regarding Mr. Tyson is contained in our definitive proxy statement filed with the SEC on April 1, 2022, which information is incorporated by reference into this Item 9B.
Item 9C. Disclosure Regarding Foreign Jurisdictions that Prevent Inspections.
None.
PART III
Item 10. Directors, Executive Officers and Corporate Governance.
The information required by this Item is incorporated by reference from the definitive proxy statement for our 2023 annual meeting of shareholders, which will be filed no later than 120 days after December 31, 2022.
Code of Ethics
We have a Code of Business Conduct and Ethics, which applies to all employees, officers and directors of LL Flooring Holdings, Inc. and its direct and indirect subsidiaries. Our Code of Business Conduct and Ethics meets the requirements of a “code of ethics” as defined by Item 406 of Regulation S-K, and applies to our principal executive officer and principal financial officer and all other employees. Our Code of Business Conduct and Ethics also meets the requirements of a code of conduct under Rule 303A.10 of the NYSE Listed Company Manual. Our Code of Business Conduct and Ethics is posted on our website at www.LLFlooring.com in the “Corporate Governance” section of our Investor Relations home page.
We intend to provide any required disclosure of an amendment to or waiver from our Code of Business Conduct and Ethics on our website at www.LLFlooring.com in the “Corporate Governance” section of our Investor Relations home page promptly following the amendment or waiver. We may elect to disclose any such amendment or waiver in a report on Form 8‑K filed with the SEC either in addition to or in lieu of the website disclosure. The information contained on or connected to our website is not incorporated by reference in this report and should not be considered part of this or any other report that we file with or furnish to the SEC.
56
Item 11. Executive Compensation.
The information required by this Item is incorporated by reference from the definitive proxy statement for our 2023 annual meeting of shareholders, which will be filed no later than 120 days after December 31, 2022.
Item 12. Security Ownership of Certain Beneficial Owners and Management and Related Stockholder Matters.
The information required by this Item is incorporated by reference from the definitive proxy statement for our 2023 annual meeting of shareholders, which will be filed no later than 120 days after December 31, 2022.
The information required by this Item is incorporated by reference from the definitive proxy statement for our 2023 annual meeting of shareholders, which will be filed no later than 120 days after December 31, 2022.
Item 14. Principal Accountant Fees and Services.
The information required by this Item is incorporated by reference from the definitive proxy statement for our 2023 annual meeting of shareholders, which will be filed no later than 120 days after December 31, 2022.
PART IV
Item 15. Exhibits, Financial Statement Schedules.
Consolidated Financial Statements
Refer to the financial statements filed as part of this annual report in Part II, Item 8.
Financial Statement Schedules
Schedule II – Analysis of Valuation and Qualifying Accounts for the years ended December 31, 2022, 2021 and 2020
All other financial statement schedules have been omitted because the required information is either included in the financial statements or the notes thereto or is not applicable.
Exhibits
The exhibits listed on the accompanying Exhibit Index are filed or incorporated by reference as part of this report.
Item 16. Form 10‑K Summary.
None.
LL Flooring Holdings, Inc.
Schedule II – Analysis of Valuation and Qualifying Accounts
For the Years Ended December 31, 2022, 2021 and 2020
(in thousands)
57
|
|
|
|
|
Additions |
|
|
|
|
|
|
|
|
|
|
|||||
|
|
Balance |
|
|
Charged to |
|
|
|
|
|
|
|
|
|
|
|||||
|
|
Beginning |
|
|
Cost and |
|
|
|
|
|
|
|
|
Balance End |
|
|||||
|
|
of Year |
|
|
Expenses |
|
|
Deductions (1) |
|
|
Other |
|
|
of Year |
|
|||||
For the Year Ended December 31, 2020 |
|
|
|
|
|
|
|
|
|
|
|
|
|
|
|
|||||
Reserve Deducted From Assets to Which It Applies |
|
|
|
|
|
|
|
|
|
|
|
|
|
|
|
|||||
Inventory Reserve for Loss or Obsolescence |
|
$ |
|
|
$ |
|
|
$ |
( |
) |
|
$ |
|
|
$ |
|
||||
Income Tax Valuation Allowance |
|
$ |
|
|
$ |
|
|
$ |
( |
) |
|
$ |
|
|
$ |
|
||||
|
|
|
|
|
|
|
|
|
|
|
|
|
|
|
|
|||||
For the Year Ended December 31, 2021 |
|
|
|
|
|
|
|
|
|
|
|
|
|
|
|
|||||
Reserve Deducted From Assets to Which It Applies |
|
|
|
|
|
|
|
|
|
|
|
|
|
|
|
|||||
Inventory Reserve for Loss or Obsolescence |
|
$ |
|
|
$ |
|
|
$ |
( |
) |
|
$ |
|
|
$ |
|
||||
Income Tax Valuation Allowance |
|
$ |
|
|
$ |
|
|
$ |
( |
) |
|
$ |
|
|
$ |
|
||||
|
|
|
|
|
|
|
|
|
|
|
|
|
|
|
|
|||||
For the Year Ended December 31, 2022 |
|
|
|
|
|
|
|
|
|
|
|
|
|
|
|
|||||
Reserve Deducted From Assets to Which It Applies |
|
|
|
|
|
|
|
|
|
|
|
|
|
|
|
|||||
Inventory Reserve for Loss or Obsolescence |
|
$ |
|
|
$ |
|
|
$ |
( |
) |
|
$ |
|
|
$ |
|
||||
Income Tax Valuation Allowance |
|
$ |
|
|
$ |
|
|
$ |
( |
) |
|
$ |
|
|
$ |
|
||||
58
EXHIBIT INDEX
3.01 |
|
|
3.02 |
|
|
4.01 |
|
|
4.02 |
|
|
10.1 |
* |
|
10.2 |
* |
|
10.3 |
* |
|
10.4 |
|
|
10.5 |
|
|
10.6
|
|
|
10.7 |
|
|
10.8 |
* |
|
10.9 |
* |
|
10.10 |
* |
|
10.11 |
* |
|
10.12 |
* |
|
10.13 |
* |
|
10.14 |
* |
|
10.15 |
* |
|
10.16 |
* |
59
10.17 |
|
|
10.18 |
|
|
10.19 |
|
|
10.20 |
* |
|
10.21 |
* |
|
10.22 |
* |
|
10.23 |
* |
|
10.24 |
* |
Offer Letter Agreement with Douglas S. Clark, Jr., dated January 17, 2017 (filed herewith) |
10.25 |
* |
Offer Letter Agreement with Michael E. Dauberman, dated January 19, 2022 (filed herewith) |
10.26 |
* |
|
10.27 |
* |
|
10.28 |
* |
|
21.1 |
|
|
23.1 |
|
Consent of Ernst & Young LLP, Independent Registered Public Accounting Firm |
31.1 |
|
|
32.1 |
|
|
101 |
|
The following financial statements from the Company’s Form 10-K for the year ended December 31, 2022, formatted in XBRL: (i) Consolidated Balance Sheets, (ii) Consolidated Statements of Operations, (iii) Consolidated Statements of Comprehensive Loss (Income), (iv) Consolidated Statements of Stockholders’ Equity, (v) Consolidated Statements of Cash Flows, (vi) Notes to Consolidated Financial Statements |
104 |
|
Cover Page Interactive Data File (embedded within the Inline XBRL document) |
* |
|
Indicates a management contract or compensation plan, contract or agreement. |
60
SIGNATURES
Pursuant to the requirements of Section 13 or 15(d) of the Securities Exchange Act of 1934, as amended, the registrant has duly caused this report to be signed on its behalf by the undersigned, thereunto duly authorized on March 1, 2023.
|
|
LL FLOORING HOLDINGS, INC. |
|
|
|
|
By: |
/s/ Charles E. Tyson |
|
|
Charles E. Tyson |
|
President and Chief Executive Officer |
|
Pursuant to the requirements of the Securities and Exchange Act of 1934, this report has been signed below by the following persons on behalf of the registrant and in the capacities indicated on March 1, 2023.
Signature |
|
Title |
|
|
|
/s/ Charles E. Tyson |
|
President and Chief Executive Officer |
Charles E. Tyson |
|
(Principal Executive Officer & Principal Financial Officer) |
|
|
|
/s/ Chasity D. Grosh |
|
Chief Accounting Officer |
Chasity D. Grosh |
|
(Principal Accounting Officer) |
|
|
|
/s/ Nancy M. Taylor |
|
Chairperson of the Board |
Nancy M. Taylor |
|
|
/s/ Terri F. Graham |
|
Director |
Terri F. Graham |
|
|
|
|
|
/s/ David A. Levin |
|
Director |
David A. Levin |
|
|
|
|
|
/s/ Douglas T. Moore |
|
Director |
Douglas T. Moore |
|
|
|
|
|
/s/ Joseph M. Nowicki, Jr. |
|
Director |
Joseph M. Nowicki, Jr. |
|
|
|
|
|
/s/ Ashish Parmar |
|
Director |
Ashish Parmar |
|
|
|
|
|
/s/ Famous P. Rhodes |
|
Director |
Famous P. Rhodes |
|
|
|
|
|
/s/ Martin F. Roper |
|
Director |
Martin F. Roper |
|
|
61