UNITED STATES
SECURITIES AND EXCHANGE COMMISSION
Washington, D.C. 20549
SECURITIES AND EXCHANGE COMMISSION
Washington, D.C. 20549
FORM N-CSR
CERTIFIED SHAREHOLDER REPORT OF REGISTERED
MANAGEMENT INVESTMENT COMPANIES
Investment Company Act file number 811-22045
Wisconsin Capital Funds, Inc.
(Exact name of registrant as specified in charter)
(Exact name of registrant as specified in charter)
8030 Excelsior Drive, Suite 307
Madison, WI 53717
(Address of principal executive offices) (Zip code)
(Address of principal executive offices) (Zip code)
Thomas G. Plumb
8030 Excelsior Drive, Suite 307
Madison, WI 53717
(Name and address of agent for service)
(Name and address of agent for service)
(608) 960-4616
Registrant's telephone number, including area code
Date of fiscal year end: March 31
Date of reporting period: September 30, 2017
Item 1. Reports to Stockholders.
Plumb Balanced Fund
Plumb Equity Fund
SEMI-ANNUAL REPORT
September 30, 2017
www.plumbfunds.com
PLUMB FUNDS
September 30, 2017
Dear Fellow Shareholders,
We are pleased to present the Semi-Annual Report for the Plumb Funds. For the six months ending September 30, 2017, both the Plumb Equity Fund and the Plumb Balanced Fund outperformed their benchmarks with returns of 14.17% and 9.01%, respectively. The respective blended benchmarks* described at the end of this letter were up 7.95% and 6.12% for the six months.
Both domestic and international stock indices generally performed better than bond indices for the period, reflecting, we believe, increased optimism about world economic growth. But more than reflecting economic growth, we are seeing a secular sea change that has dramatic impact on traditional economic and cultural relationships. Some pundits are heralding our current environment as the “Fourth Industrial Revolution” as innovation is affecting everything in daily lives throughout the world.
Consider that a company named Sears was once the largest retailer in the world. It still exists. Sears Holding has a market capitalization under $500 million. Amazon has a market capitalization 1,200 times larger. Sears may have had its own specific problems, but it is one of hundreds of traditional retailers that has been overwhelmed by the sea change in consumer discretionary spending patterns. Opportunities in one area often lead to disruption and the demise of companies unable to adapt and to embrace and implement the right changes.
We have called this secular trend the “rise of innovation” in past letters. This sea change has allowed many of the companies participating and driving this innovation to lead the recent stock market advance. We have attempted to identify these leaders and to avoid those companies whose business plans are being made obsolete. We believe that these trends will continue to be reflected in the stock markets for the foreseeable future.
Our equity strategy is based on our belief that innovative market leaders will reward their owners over time. Today, the five largest companies in the S&P 500 are Apple, Alphabet (Google), Microsoft, Amazon and Facebook. Only Microsoft was in the top ten fifteen years ago. A company’s market capitalization rises due to the perception of growth or opportunities for growth. Investors who identify the growth factors while they are still coming into place typically are rewarded. It is much easier to paddle with the current than to paddle upstream. So while there are many well managed companies in the investable universe, we tend to try to avoid those companies whose industries are facing what we perceive as considerable headwinds.
Our two funds have distinctly different investment objectives even though there is considerable overlap in their equity holdings. Please read the prospectus to make sure that our investment objectives match your investment needs.
3
PLUMB FUNDS
We would like to thank you for the confidence you have placed in us through your investment in the Plumb Funds.

Thomas G. Plumb
Opinions expressed are those of Thomas Plumb and are not intended to be a forecast of future events, a guarantee of future results, or investment advice.
Must be preceded or accompanied by a current prospectus.
Past Performance does not guarantee future results.
Fund holdings and sector allocations are subject to change and should not be considered recommendations to buy or sell any security. Please refer to the schedule of investments in this report for complete holdings information.
Mutual fund investing involves risk. Principal loss is possible. The Funds may invest in small and mid-sized companies which involve additional risks such as limited liquidity and greater volatility. The Funds invest in foreign securities which involve greater volatility and political, economic and currency risks and differences in accounting methods. The Plumb Balanced Fund will invest in debt securities, which typically decrease in value when interest rates rise. This risk is usually greater for longer-term debt securities. Investments by the Plumb Balanced Fund in lower-rated and non-rated securities present a greater risk of loss of principal and interest than higher-rated securities. Because the Funds may invest in ETFs, they are subject to additional risks that do not apply to conventional mutual funds, including the risks that the market price of an ETF’s shares may trade at a discount to its net asset value (“NAV”), an active secondary trading market may not develop or be maintained, or trading may be halted by the exchange in which they trade, which may impact the Funds’ ability to sell their shares.
The S&P 500 Index is an unmanaged market capitalization-weighted index based on the average weighted performance of 500 widely held common stocks. The Bloomberg Barclays Capital Intermediate Government/Credit Bond Index is an unmanaged market value weighted index measuring both the principal price changes of, and income provided by, the underlying universe of securities that comprise the index. The MSCI EAFE Index is an unmanaged market capitalization-weighted index that is designed to measure the equity market performance of developed markets, excluding the US and Canada.
|
*
|
The blended benchmark for the Plumb Balanced Fund is made up of 55% S&P 500 index, 35% Bloomberg Barclays Capital Intermediate Government/Credit Bond Index and 10% MSCI EAFE index. The blended benchmark for the Plumb Equity Fund is made up of 90% S&P 500 index and 10% MSCI EAFE index. You cannot invest directly in an index.
|
The Plumb Funds are distributed by Quasar Distributors, LLC.
4
PLUMB FUNDS
Expense Example
September 30, 2017 (Unaudited)
As a shareholder of the Plumb Funds (the “Funds”), you incur ongoing costs, including investment advisory fees; distribution (12b-1) fees; and other fund expenses. This example is intended to help you understand your ongoing costs (in dollars) of investing in the Funds and to compare these costs with the ongoing costs of investing in other mutual funds.
The Example is based on an investment of $1,000 invested at the beginning of the period and held for the entire period (April 1, 2017 – September 30, 2017).
Actual Expenses
The first line of the table on the following page provides information about actual account values and actual expenses. However, the table does not include shareholder-specific fees such as the $15.00 fee charged for wire redemptions. The table also does not include portfolio trading commissions and related trading costs. You may use the information in this line, together with the amount you invested, to estimate the expenses that you paid over the period. Simply divide your account value by $1,000 (for example, an $8,600 account value divided by $1,000 = 8.6), then multiply the result by the number in the first line under the heading entitled “Expenses Paid During the Period” to estimate the expenses you paid on your account during this period.
Hypothetical Example for Comparison Purposes
The second line of the table on the following page provides information about hypothetical account values and hypothetical expenses based on the Fund’s actual expense ratio and an assumed rate of return of 5% per year before expenses, which is not the Fund’s actual return. The hypothetical account values and expenses may not be used to estimate the actual ending account balanced or expenses you paid for the period. You may use this information to compare the ongoing costs of investing in the Funds and other funds. To do so, compare this 5% hypothetical example with the 5% hypothetical examples that appear in the shareholder reports of the other funds.
Please note that the expenses shown in the table are meant to highlight your ongoing costs only and do not reflect any transactional costs, such as sales charges (loads), redemption fees, or exchange fees, which, although not charged by the Funds, may be charged by other funds. Therefore, the second line of the table is useful in comparing ongoing costs only, and will not help you determine the relative costs of owning different funds. In addition, if these transactional costs were included, your costs would have been higher.
5
PLUMB FUNDS
Expense Example
September 30, 2017 (Unaudited) (Continued)
Plumb Balanced Fund
|
Expenses Paid
|
|||
|
Beginning
|
Ending
|
During the Period*
|
|
|
Account Value
|
Account Value
|
April 1, 2017 to
|
|
|
April 1, 2017
|
September 30, 2017
|
September 30, 2017
|
|
|
Actual
|
$1,000.00
|
$1,090.10
|
$6.81
|
|
Hypothetical
|
|||
|
(5% return per
|
|||
|
year before expenses)
|
$1,000.00
|
$1,018.55
|
$6.58
|
|
*
|
Expenses are equal to the Fund’s annualized six-month expense ratio of 1.30%, multiplied by the average account value over the period, multiplied by 183/365 (to reflect the partial year period).
|
Plumb Equity Fund
|
Expenses Paid
|
|||
|
Beginning
|
Ending
|
During the Period*
|
|
|
Account Value
|
Account Value
|
April 1, 2017 to
|
|
|
April 1, 2017
|
September 30, 2017
|
September 30, 2017
|
|
|
Actual
|
$1,000.00
|
$1,141.70
|
$7.78
|
|
Hypothetical
|
|||
|
(5% return per
|
|||
|
year before expenses)
|
$1,000.00
|
$1,017.80
|
$7.33
|
|
*
|
Expenses are equal to the Fund’s annualized six-month expense ratio of 1.45%, multiplied by the average account value over the period, multiplied by 183/365 (to reflect the partial year period).
|
6
PLUMB FUNDS
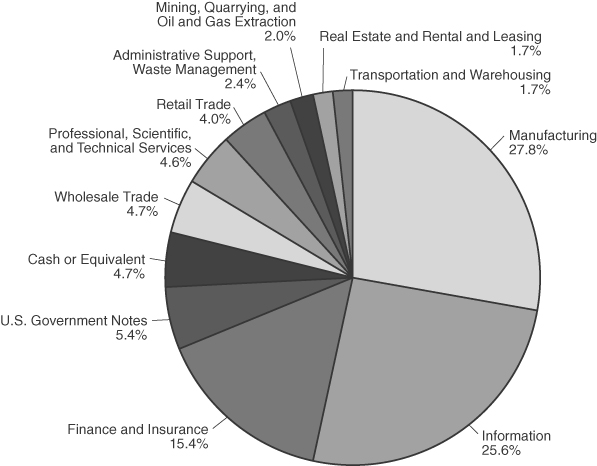
Plumb Balanced Fund
Investments by Industry Sector as of September 30, 2017
(as a Percentage of Total Investments) (Unaudited)
7
PLUMB FUNDS
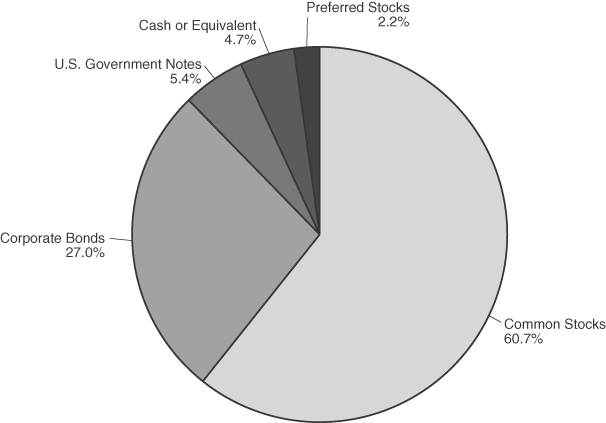
Plumb Balanced Fund
Investments by Asset Allocation as of September 30, 2017
(as a Percentage of Total Investments) (Unaudited)
8
PLUMB FUNDS
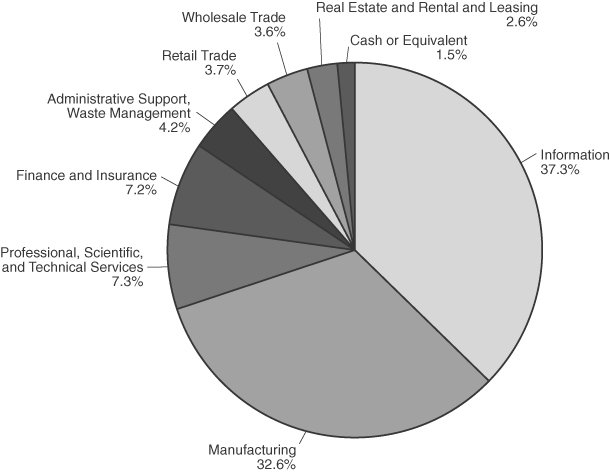
Plumb Equity Fund
Investments by Industry Sector as of September 30, 2017
(as a Percentage of Total Investments) (Unaudited)
9
PLUMB FUNDS
Plumb Balanced Fund
Schedule of Investments – September 30, 2017 (Unaudited)
|
Shares
|
Value
|
|||||||
|
COMMON STOCKS – 61.38%
|
||||||||
|
Administrative and Support Services – 2.39%
|
||||||||
|
Priceline Group, Inc. (a)
|
475
|
$
|
869,640
|
|||||
|
Beverage and Tobacco
|
||||||||
|
Product Manufacturing – 5.60%
|
||||||||
|
Brown-Forman Corp. – Class B
|
11,000
|
597,300
|
||||||
|
Constellation Brands, Inc. – Class A
|
5,000
|
997,250
|
||||||
|
PepsiCo., Inc.
|
4,000
|
445,720
|
||||||
|
2,040,270
|
||||||||
|
Chemical Manufacturing – 4.23%
|
||||||||
|
Johnson & Johnson
|
5,000
|
650,050
|
||||||
|
Portola Pharmaceuticals, Inc. (a)
|
16,500
|
891,495
|
||||||
|
1,541,545
|
||||||||
|
Computer and Electronic
|
||||||||
|
Product Manufacturing – 9.84%
|
||||||||
|
Apple, Inc.
|
5,000
|
770,600
|
||||||
|
Medtronic PLC (b)
|
7,500
|
583,275
|
||||||
|
Microchip Technology, Inc.
|
4,000
|
359,120
|
||||||
|
NVIDIA Corp.
|
4,000
|
715,080
|
||||||
|
NXP Semiconductors NV (a)(b)
|
5,000
|
565,450
|
||||||
|
QUALCOMM, Inc.
|
11,500
|
596,160
|
||||||
|
3,589,685
|
||||||||
|
Credit Intermediation and
|
||||||||
|
Related Activities – 3.82%
|
||||||||
|
Discover Financial Services
|
12,000
|
773,760
|
||||||
|
FleetCor Technologies, Inc. (a)
|
4,000
|
619,080
|
||||||
|
1,392,840
|
||||||||
|
Data Processing, Hosting,
|
||||||||
|
and Related Services – 9.64%
|
||||||||
|
Fiserv, Inc. (a)
|
6,000
|
773,760
|
||||||
|
Mastercard, Inc. – Class A
|
6,000
|
847,200
|
||||||
|
Visa, Inc. – Class A
|
10,000
|
1,052,400
|
||||||
|
WEX, Inc. (a)
|
7,500
|
841,650
|
||||||
|
3,515,010
|
||||||||
|
Merchant Wholesalers, Durable Goods – 1.94%
|
||||||||
|
Honeywell International, Inc.
|
5,000
|
708,700
|
||||||
The accompanying notes are an integral part of these financial statements.
10
PLUMB FUNDS
Plumb Balanced Fund
Schedule of Investments – September 30, 2017 (Unaudited) (Continued)
|
Shares
|
Value
|
|||||||
|
COMMON STOCKS (Continued)
|
||||||||
|
Miscellaneous Manufacturing – 2.85%
|
||||||||
|
ABIOMED, Inc. (a)
|
1,500
|
$
|
252,900
|
|||||
|
Intuitive Surgical, Inc. (a)
|
750
|
784,410
|
||||||
|
1,037,310
|
||||||||
|
Nonstore Retailers – 1.84%
|
||||||||
|
Amazon.com, Inc. (a)
|
700
|
672,945
|
||||||
|
Oil and Gas Extraction – 2.01%
|
||||||||
|
Phillips 66
|
8,000
|
732,880
|
||||||
|
Other Information Services – 4.79%
|
||||||||
|
Alphabet, Inc. – Class A (a)
|
600
|
584,232
|
||||||
|
Alphabet, Inc. – Class C (a)
|
500
|
479,555
|
||||||
|
Facebook, Inc. – Class A (a)
|
4,000
|
683,480
|
||||||
|
1,747,267
|
||||||||
|
Pipeline Transportation – 1.72%
|
||||||||
|
Enbridge, Inc. (b)
|
15,000
|
627,600
|
||||||
|
Professional, Scientific,
|
||||||||
|
and Technical Services – 3.21%
|
||||||||
|
Exact Sciences Corp. (a)
|
15,000
|
706,800
|
||||||
|
Jack Henry & Associates, Inc.
|
4,500
|
462,555
|
||||||
|
1,169,355
|
||||||||
|
Publishing Industries (except Internet) – 5.80%
|
||||||||
|
ANSYS, Inc. (a)
|
7,000
|
859,110
|
||||||
|
Microsoft Corp.
|
7,500
|
558,675
|
||||||
|
Tyler Technologies, Inc. (a)
|
4,000
|
697,280
|
||||||
|
2,115,065
|
||||||||
|
Rental and Leasing Services – 1.70%
|
||||||||
|
Synchrony Financial
|
20,000
|
621,000
|
||||||
|
TOTAL COMMON STOCKS
|
||||||||
|
(Cost $13,519,615)
|
22,381,112
|
|||||||
The accompanying notes are an integral part of these financial statements.
11
PLUMB FUNDS
Plumb Balanced Fund
Schedule of Investments – September 30, 2017 (Unaudited) (Continued)
|
Principal
|
||||||||
|
Amount
|
Value
|
|||||||
|
CORPORATE BONDS – 27.26%
|
||||||||
|
Broadcasting (except Internet) – 1.42%
|
||||||||
|
Time Warner Cable LLC
|
||||||||
|
4.000%, 09/01/2021
|
$
|
500,000
|
$
|
518,488
|
||||
|
Chemical Manufacturing – 1.35%
|
||||||||
|
Zoetis, Inc.
|
||||||||
|
3.450%, 11/13/2020
|
475,000
|
491,456
|
||||||
|
Computer and Electronic
|
||||||||
|
Product Manufacturing – 2.87%
|
||||||||
|
Bio-Rad Laboratories, Inc.
|
||||||||
|
4.875%, 12/15/2020
|
500,000
|
537,032
|
||||||
|
Motorola Solutions, Inc.
|
||||||||
|
4.000%, 09/01/2024
|
500,000
|
511,367
|
||||||
|
1,048,399
|
||||||||
|
Credit Intermediation and Related Activities – 2.12%
|
||||||||
|
Wells Fargo & Co.
|
||||||||
|
7.980%, 03/29/2049
|
750,000
|
773,438
|
||||||
|
Food Manufacturing – 1.46%
|
||||||||
|
Ingredion, Inc.
|
||||||||
|
4.625%, 11/01/2020
|
500,000
|
533,890
|
||||||
|
Health and Personal Care Stores – 2.18%
|
||||||||
|
CVS Pass-Through Trust
|
||||||||
|
6.943%, 01/10/2030
|
242,346
|
287,630
|
||||||
|
Owens & Minor, Inc.
|
||||||||
|
3.875%, 09/15/2021
|
500,000
|
508,771
|
||||||
|
796,401
|
||||||||
|
Insurance Carriers and Related Activities – 1.48%
|
||||||||
|
Old Republic International Corp.
|
||||||||
|
4.875%, 10/01/2024
|
500,000
|
538,144
|
||||||
|
Merchant Wholesalers, Durable Goods – 1.41%
|
||||||||
|
KLA-Tencor Corp.
|
||||||||
|
3.375%, 11/01/2019
|
500,000
|
512,821
|
||||||
|
Merchant Wholesalers, Nondurable Goods – 1.40%
|
||||||||
|
Actavis Funding SCS (b)
|
||||||||
|
3.000%, 03/12/2020
|
500,000
|
510,754
|
||||||
The accompanying notes are an integral part of these financial statements.
12
PLUMB FUNDS
Plumb Balanced Fund
Schedule of Investments – September 30, 2017 (Unaudited) (Continued)
|
Principal
|
||||||||
|
Amount
|
Value
|
|||||||
|
CORPORATE BONDS (Continued)
|
||||||||
|
Professional, Scientific,
|
||||||||
|
and Technical Services – 1.42%
|
||||||||
|
Dun & Bradstreet Corp.
|
||||||||
|
4.625%, 12/01/2022
|
$
|
500,000
|
$
|
517,282
|
||||
|
Publishing Industries (except Internet) – 4.27%
|
||||||||
|
CA, Inc.
|
||||||||
|
2.875%, 08/15/2018
|
500,000
|
504,700
|
||||||
|
4.500%, 08/15/2023
|
500,000
|
528,691
|
||||||
|
Symantec Corp.
|
||||||||
|
4.200%, 09/15/2020
|
500,000
|
525,250
|
||||||
|
1,558,641
|
||||||||
|
Securities, Commodity Contracts, and Other Financial
|
||||||||
|
Investments and Related Activities – 5.88%
|
||||||||
|
Citigroup, Inc. (c)
|
||||||||
|
2.664% (3 Month LIBOR USD + 1.350%), 04/25/2024
|
500,000
|
500,000
|
||||||
|
Fidelity National Financial, Inc.
|
||||||||
|
5.500%, 09/01/2022
|
350,000
|
384,134
|
||||||
|
JPMorgan Chase & Co.
|
||||||||
|
6.750%, 01/29/2050
|
750,000
|
858,795
|
||||||
|
Morgan Stanley (c)
|
||||||||
|
4.039% (Consumer Price Index
|
||||||||
|
12-Month change + 2.100%), 12/01/2017
|
400,000
|
399,500
|
||||||
|
2,142,429
|
||||||||
|
TOTAL CORPORATE BONDS
|
||||||||
|
(Cost $9,768,460)
|
9,942,143
|
|||||||
|
GOVERNMENT SECURITIES & AGENCY ISSUES – 5.47%
|
||||||||
|
Executive, Legislative, and Other
|
||||||||
|
General Government Support – 5.47%
|
||||||||
|
United States Treasury Notes
|
||||||||
|
1.250%, 04/30/2019
|
1,000,000
|
997,246
|
||||||
|
1.250%, 05/31/2019
|
1,000,000
|
996,992
|
||||||
|
TOTAL GOVERNMENT SECURITIES & AGENCY ISSUES
|
||||||||
|
(Cost $1,997,935)
|
1,994,238
|
|||||||
The accompanying notes are an integral part of these financial statements.
13
PLUMB FUNDS
Plumb Balanced Fund
Schedule of Investments – September 30, 2017 (Unaudited) (Continued)
|
Shares
|
Value
|
|||||||
|
PREFERRED STOCKS – 2.22%
|
||||||||
|
Securities, Commodity Contracts, and Other Financial
|
||||||||
|
Investments and Related Activities – 2.22%
|
||||||||
|
Goldman Sachs Group, Inc. (c)
|
||||||||
|
4.000% (3 Month LIBOR USD + 0.670%), 11/27/2017
|
35,000
|
$
|
809,200
|
|||||
|
TOTAL PREFERRED STOCKS
|
||||||||
|
(Cost $778,521)
|
809,200
|
|||||||
|
SHORT-TERM INVESTMENTS – 4.75%
|
||||||||
|
Money Market Funds – 4.75%
|
||||||||
|
Fidelity Institutional Money Market Funds –
|
||||||||
|
Government Portfolio –
|
||||||||
|
Institutional Class – 0.91% (d)
|
1,731,680
|
1,731,680
|
||||||
|
TOTAL SHORT-TERM INVESTMENTS
|
||||||||
|
(Cost $1,731,680)
|
1,731,680
|
|||||||
|
Total Investments
|
||||||||
|
(Cost $27,796,211) – 101.08%
|
36,858,373
|
|||||||
|
Liabilities in Excess of Others Assets – (1.08)%
|
(392,832
|
)
|
||||||
|
TOTAL NET ASSETS – 100.00%
|
$
|
36,465,541
|
||||||
Percentages are stated as a percent of net assets.
|
(a)
|
Non-income producing security.
|
|
(b)
|
Foreign issued security. Foreign concentration is as follows: Canada: 1.72%,
|
|
Ireland: 1.60%, Netherlands: 1.55%, Luxembourg: 1.40%.
|
|
|
(c)
|
Variable rate security. The rate listed is as of September 30, 2017.
|
|
(d)
|
Rate shown is the 7-day effective yield.
|
The accompanying notes are an integral part of these financial statements.
14
PLUMB FUNDS
Plumb Equity Fund
Schedule of Investments – September 30, 2017 (Unaudited)
|
Shares
|
Value
|
|||||||
|
COMMON STOCKS – 98.59%
|
||||||||
|
Administrative and Support Services – 4.20%
|
||||||||
|
Priceline Group, Inc. (a)
|
540
|
$
|
988,643
|
|||||
|
Beverage and Tobacco
|
||||||||
|
Product Manufacturing – 6.75%
|
||||||||
|
Brown-Forman Corp. – Class B
|
10,000
|
543,000
|
||||||
|
Constellation Brands, Inc. – Class A
|
5,250
|
1,047,112
|
||||||
|
1,590,112
|
||||||||
|
Chemical Manufacturing – 4.13%
|
||||||||
|
Portola Pharmaceuticals, Inc. (a)
|
18,000
|
972,540
|
||||||
|
Computer and Electronic
|
||||||||
|
Product Manufacturing – 15.58%
|
||||||||
|
Apple, Inc.
|
5,500
|
847,660
|
||||||
|
NVIDIA Corp.
|
4,500
|
804,465
|
||||||
|
NXP Semiconductors NV (a)(b)
|
7,000
|
791,630
|
||||||
|
QUALCOMM, Inc.
|
14,500
|
751,680
|
||||||
|
Trimble, Inc. (a)
|
12,000
|
471,000
|
||||||
|
3,666,435
|
||||||||
|
Credit Intermediation and Related Activities – 7.23%
|
||||||||
|
Discover Financial Services
|
12,000
|
773,760
|
||||||
|
FleetCor Technologies, Inc. (a)
|
6,000
|
928,620
|
||||||
|
1,702,380
|
||||||||
|
Data Processing, Hosting
|
||||||||
|
and Related Services – 22.04%
|
||||||||
|
Fidelity National Information Services, Inc.
|
7,500
|
700,425
|
||||||
|
First Data Corp. (a)
|
25,000
|
451,000
|
||||||
|
Fiserv, Inc. (a)
|
7,000
|
902,720
|
||||||
|
Mastercard, Inc. – Class A
|
7,000
|
988,400
|
||||||
|
Visa, Inc. – Class A
|
10,800
|
1,136,592
|
||||||
|
WEX, Inc. (a)
|
9,000
|
1,009,980
|
||||||
|
5,189,117
|
||||||||
|
Merchant Wholesalers, Durable Goods – 3.61%
|
||||||||
|
Honeywell International, Inc.
|
6,000
|
850,440
|
||||||
|
Miscellaneous Manufacturing – 6.15%
|
||||||||
|
ABIOMED, Inc. (a)
|
3,000
|
505,800
|
||||||
|
Intuitive Surgical, Inc. (a)
|
900
|
941,292
|
||||||
|
1,447,092
|
||||||||
The accompanying notes are an integral part of these financial statements.
15
PLUMB FUNDS
Plumb Equity Fund
Schedule of Investments – September 30, 2017 (Unaudited) (Continued)
|
Shares
|
Value
|
|||||||
|
COMMON STOCKS (Continued)
|
||||||||
|
Nonstore Retailers – 3.68%
|
||||||||
|
Amazon.com, Inc. (a)
|
900
|
$
|
865,215
|
|||||
|
Other Information Services – 4.14%
|
||||||||
|
Alphabet, Inc. – Class A (a)
|
1,000
|
973,720
|
||||||
|
Professional, Scientific,
|
||||||||
|
and Technical Services – 7.35%
|
||||||||
|
Exact Sciences Corp. (a)
|
22,000
|
1,036,640
|
||||||
|
Jack Henry & Associates, Inc.
|
6,750
|
693,833
|
||||||
|
1,730,473
|
||||||||
|
Publishing Industries (except Internet) – 11.09%
|
||||||||
|
ANSYS, Inc. (a)
|
8,000
|
981,840
|
||||||
|
Dassault Systemes SE – ADR (b)
|
7,500
|
756,300
|
||||||
|
Tyler Technologies, Inc. (a)
|
5,000
|
871,600
|
||||||
|
2,609,740
|
||||||||
|
Rental and Leasing Services – 2.64%
|
||||||||
|
Synchrony Financial
|
20,000
|
621,000
|
||||||
|
TOTAL COMMON STOCKS
|
||||||||
|
(Cost $14,089,980)
|
23,206,907
|
|||||||
|
SHORT-TERM INVESTMENTS – 1.55%
|
||||||||
|
Money Market Funds – 1.55%
|
||||||||
|
Fidelity Institutional Money Market Funds –
|
||||||||
|
Government Portfolio –
|
||||||||
|
Institutional Class – 0.91% (c)
|
364,051
|
364,051
|
||||||
|
TOTAL SHORT-TERM INVESTMENTS
|
||||||||
|
(Cost $364,051)
|
364,051
|
|||||||
|
Total Investments (Cost $14,454,031) – 100.14%
|
23,570,958
|
|||||||
|
Liabilities In Excess Of Other Assets – (0.14)%
|
(32,999
|
)
|
||||||
|
TOTAL NET ASSETS – 100.00%
|
$
|
23,537,959
|
||||||
Percentages are stated as a percent of net assets.
ADR – American Depositary Receipt
|
(a)
|
Non-income producing security.
|
|
(b)
|
Foreign issued security. Foreign concentration is as follows: France: 3.21%,
|
|
Netherlands: 3.36%.
|
|
|
(c)
|
Rate shown is the 7-day effective yield.
|
The accompanying notes are an integral part of these financial statements.
16
PLUMB FUNDS
Statements of Assets and Liabilities
September 30, 2017 (Unaudited)
|
Plumb
|
Plumb
|
|||||||
|
Balanced
|
Equity
|
|||||||
|
Fund
|
Fund
|
|||||||
|
Assets
|
||||||||
|
Investments, at value*
|
$
|
36,858,373
|
$
|
23,570,958
|
||||
|
Dividends and interest receivable
|
94,121
|
2,866
|
||||||
|
Receivable from Advisor
|
—
|
228
|
||||||
|
Cash
|
3,220
|
2,175
|
||||||
|
Prepaid assets
|
21,504
|
23,043
|
||||||
|
Total Assets
|
36,977,218
|
23,599,270
|
||||||
|
Liabilities
|
||||||||
|
Payable for investments purchased
|
388,602
|
4,675
|
||||||
|
Payable for funds shares redeemed
|
44,000
|
—
|
||||||
|
Accrued distribution fee
|
15,581
|
6,885
|
||||||
|
Payable to Advisor (a)
|
4,543
|
—
|
||||||
|
Administrative & accounting
|
||||||||
|
services fee payable (a)
|
5,949
|
3,830
|
||||||
|
Payable to directors
|
5,184
|
3,646
|
||||||
|
Accrued expenses and other liabilities
|
47,818
|
42,275
|
||||||
|
Total Liabilities
|
511,677
|
61,311
|
||||||
|
Net Assets
|
$
|
36,465,541
|
$
|
23,537,959
|
||||
|
Net Assets Consist Of:
|
||||||||
|
Paid in Capital
|
$
|
30,635,443
|
$
|
11,444,855
|
||||
|
Accumulated undistributed net
|
||||||||
|
investment income (loss)
|
165,825
|
(137,023
|
)
|
|||||
|
Accumulated net realized gain (loss)
|
(3,397,889
|
)
|
3,113,200
|
|||||
|
Net unrealized appreciation on investments
|
9,062,162
|
9,116,927
|
||||||
|
Net Assets
|
$
|
36,465,541
|
$
|
23,537,959
|
||||
|
Capital shares outstanding, $0.001 par value
|
||||||||
|
(200 million shares issued each)
|
1,351,876
|
834,578
|
||||||
|
Net asset value, offering and
|
||||||||
|
redemption price per share
|
$
|
26.97
|
$
|
28.20
|
||||
|
* Cost of Investments
|
$
|
27,796,211
|
$
|
14,454,031
|
||||
|
(a)
|
See Note 4 in the Notes to Financial Statements.
|
The accompanying notes are an integral part of these financial statements.
17
PLUMB FUNDS
Statements of Operations
For the Six Months Ended September 30, 2017 (Unaudited)
|
Plumb
|
Plumb
|
|||||||
|
Balanced
|
Equity
|
|||||||
|
Fund
|
Fund
|
|||||||
|
Investment Income:
|
||||||||
|
Dividends (Net of foreign withholding
|
||||||||
|
taxes of $1,805 and $540, respectively)
|
$
|
145,231
|
$
|
100,455
|
||||
|
Interest
|
195,649
|
2,376
|
||||||
|
Total Investment Income
|
340,880
|
102,831
|
||||||
|
Expenses:
|
||||||||
|
Investment Advisor’s fee (a)
|
114,476
|
91,843
|
||||||
|
Distribution fees
|
36,985
|
29,672
|
||||||
|
Administration & accounting service fees (a)
|
35,223
|
28,259
|
||||||
|
Transfer agent fees and expenses
|
23,511
|
19,303
|
||||||
|
Fund accounting fees
|
17,199
|
15,920
|
||||||
|
Administration fees
|
17,079
|
16,808
|
||||||
|
Legal fees
|
16,955
|
16,955
|
||||||
|
Director fees and expenses
|
12,140
|
9,532
|
||||||
|
Insurance expenses
|
8,874
|
5,855
|
||||||
|
Audit and tax fees
|
7,972
|
8,697
|
||||||
|
Custody fees
|
3,337
|
3,257
|
||||||
|
Printing and mailing expense
|
2,376
|
1,829
|
||||||
|
Registration fees
|
5,214
|
4,940
|
||||||
|
Total expenses before waiver
|
301,341
|
252,870
|
||||||
|
Less: Fees waived/reimbursed by Advisor (a)
|
(72,388
|
)
|
(47,990
|
)
|
||||
|
Net expenses
|
228,953
|
204,880
|
||||||
|
Net Investment Income (Loss)
|
111,927
|
(102,049
|
)
|
|||||
|
Realized and Unrealized Gain:
|
||||||||
|
Net realized gain on investments
|
1,979,966
|
2,777,112
|
||||||
|
Net realized gain on
|
||||||||
|
foreign currency translation
|
203
|
—
|
||||||
|
Net change in unrealized
|
||||||||
|
appreciation on investments
|
901,254
|
942,000
|
||||||
|
Net realized gain on investments
|
2,881,423
|
3,719,112
|
||||||
|
Net Increase in Net Assets
|
||||||||
|
Resulting from Operations
|
$
|
2,993,350
|
$
|
3,617,063
|
||||
|
(a)
|
See Note 4 in the Notes to the Financial Statements.
|
The accompanying notes are an integral part of these financial statements.
18
PLUMB FUNDS
Plumb Balanced Fund
Statements of Changes in Net Assets
|
For the
|
||||||||
|
Six Months
|
For the
|
|||||||
|
Ended
|
Year Ended
|
|||||||
|
September 30,
|
March 31,
|
|||||||
|
2017
|
2017
|
|||||||
|
|
(Unaudited) | |||||||
|
Operations:
|
||||||||
|
Net investment income
|
$
|
111,927
|
$
|
185,451
|
||||
|
Net realized gain on investments
|
1,979,966
|
413,290
|
||||||
|
Net realized gain on
|
||||||||
|
foreign currency translation
|
203
|
—
|
||||||
|
Net change in unrealized appreciation
|
||||||||
|
on investments
|
901,254
|
3,877,802
|
||||||
|
Net increase in net assets
|
||||||||
|
resulting from operations
|
2,993,350
|
4,476,543
|
||||||
|
Dividends and Distributions to Shareholders:
|
||||||||
|
Net investment income
|
—
|
(173,578
|
)
|
|||||
|
Total dividends and distributions
|
—
|
(173,578
|
)
|
|||||
|
Capital Share Transactions:
|
||||||||
|
Proceeds from shares sold
|
1,892,829
|
925,138
|
||||||
|
Shares issued in reinvestment of dividends
|
—
|
74,672
|
||||||
|
Cost of shares redeemed
|
(1,701,613
|
)
|
(4,251,050
|
)
|
||||
|
Net increase (decrease) in net assets
|
||||||||
|
from capital share transactions
|
191,216
|
(3,251,240
|
)
|
|||||
|
Total increase in net assets
|
3,184,566
|
1,051,725
|
||||||
|
Net Assets:
|
||||||||
|
Beginning of period
|
33,280,975
|
32,229,250
|
||||||
|
End of period*
|
$
|
36,465,541
|
$
|
33,280,975
|
||||
|
* Including accumulated undistributed net
|
||||||||
|
investment income of
|
$
|
165,825
|
$
|
53,898
|
||||
|
Change in Shares Outstanding:
|
||||||||
|
Shares sold
|
72,027
|
40,027
|
||||||
|
Shares issued in reinvestment of dividends
|
—
|
3,233
|
||||||
|
Shares redeemed
|
(64,897
|
)
|
(184,089
|
)
|
||||
|
Net increase (decrease)
|
7,130
|
(140,829
|
)
|
|||||
The accompanying notes are an integral part of these financial statements.
19
PLUMB FUNDS
Plumb Equity Fund
Statements of Changes in Net Assets
|
For the
|
||||||||
|
Six Months
|
For the
|
|||||||
|
Ended
|
Year Ended
|
|||||||
|
September 30,
|
March 31,
|
|||||||
|
2017
|
2017
|
|||||||
|
|
(Unaudited) | |||||||
|
Operations:
|
||||||||
|
Net investment loss
|
$
|
(102,049
|
)
|
$
|
(162,203
|
)
|
||
|
Net realized gain on investments
|
2,777,112
|
934,317
|
||||||
|
Net change in unrealized appreciation
|
||||||||
|
on investments
|
942,000
|
3,663,763
|
||||||
|
Net increase in net assets
|
||||||||
|
resulting from operations
|
3,617,063
|
4,435,877
|
||||||
|
Dividends and Distributions to Shareholders:
|
||||||||
|
Net realized gains
|
—
|
(231,808
|
)
|
|||||
|
Total dividends and distributions
|
—
|
(231,808
|
)
|
|||||
|
Capital Share Transactions:
|
||||||||
|
Proceeds from shares sold
|
8,789,928
|
1,764,671
|
||||||
|
Shares issued in reinvestment of dividends
|
—
|
230,820
|
||||||
|
Cost of shares redeemed
|
(12,402,108
|
)
|
(4,089,369
|
)
|
||||
|
Net decrease in net assets
|
||||||||
|
from capital share transactions
|
(3,612,180
|
)
|
(2,093,878
|
)
|
||||
|
Total increase in net assets
|
4,883
|
2,110,191
|
||||||
|
Net Assets:
|
||||||||
|
Beginning of period
|
23,533,076
|
21,422,885
|
||||||
|
End of period*
|
$
|
23,537,959
|
$
|
23,533,076
|
||||
|
* Including accumulated undistributed net
|
||||||||
|
investment loss of
|
$
|
(137,023
|
)
|
$
|
(34,974
|
)
|
||
|
Change in Shares Outstanding:
|
||||||||
|
Shares sold
|
346,435
|
73,867
|
||||||
|
Shares issued in reinvestment of dividends
|
—
|
10,444
|
||||||
|
Shares redeemed
|
(464,467
|
)
|
(181,795
|
)
|
||||
|
Net decrease
|
(118,032
|
)
|
(97,484
|
)
|
||||
The accompanying notes are an integral part of these financial statements.
20
PLUMB FUNDS
(This Page Intentionally Left Blank.)
21
PLUMB FUNDS
Plumb Balanced Fund
Financial Highlights
|
For the
|
||||
|
Six Months
|
||||
|
Ended
|
||||
|
September 30,
|
||||
|
2017
|
||||
|
(Unaudited)
|
||||
|
Per share operating performance
|
||||
|
(For a share outstanding throughout the period)
|
||||
|
Net asset value, beginning of period
|
$
|
24.75
|
||
|
Operations:
|
||||
|
Net investment income(1)
|
0.04
|
|||
|
Net realized and unrealized gain (loss)
|
2.18
|
|||
|
Total from investment operations
|
2.22
|
|||
|
Dividends and distributions to shareholders:
|
||||
|
Dividends from net investment income
|
—
|
|||
|
Total dividends and distributions
|
—
|
|||
|
Change in net asset value for the period
|
2.22
|
|||
|
Net asset value, end of period
|
$
|
26.97
|
||
|
Total return(2)
|
9.01
|
%(3)
|
||
|
Ratios / supplemental data
|
||||
|
Net assets, end of period (000)
|
$
|
36,466
|
||
|
Ratio of net expenses to average net assets:
|
||||
|
Before expense reimbursement and waivers
|
1.71
|
%(4)
|
||
|
After expense reimbursement and waivers(5)
|
1.30
|
%(4)
|
||
|
Ratio of net investment income to average net assets:
|
||||
|
After expense reimbursement and waivers(5)
|
0.64
|
%(4)
|
||
|
Portfolio turnover rate
|
24
|
%(3)
|
||
|
(1)
|
Net investment income per share is calculated using current period ending balances prior to consideration of adjustment for permanent book and tax differences.
|
|
(2)
|
Total return represents the rate that the investor would have earned or lost on an investment in the Fund, assuming reinvestment of dividends.
|
|
(3)
|
Not annualized for the six months ended September 30, 2017.
|
|
(4)
|
Annualized for the six months ended September 30, 2017.
|
|
(5)
|
Effective July 1, 2016, the Advisor contractually agreed to cap the Fund’s expenses at 1.30%. Prior to July 1, 2016, the Fund’s expense cap was 1.25%.
|
The accompanying notes are an integral part of these financial statements.
22
PLUMB FUNDS
Plumb Balanced Fund
Financial Highlights (Continued)
|
For the Years Ended March 31,
|
||||||||||||||||||
|
2017
|
2016
|
2015
|
2014
|
2013
|
||||||||||||||
|
$
|
21.69
|
$
|
22.75
|
$
|
20.97
|
$
|
18.34
|
$
|
18.38
|
|||||||||
|
0.13
|
0.15
|
0.24
|
0.29
|
0.39
|
||||||||||||||
|
3.05
|
(1.05
|
)
|
1.77
|
2.63
|
(0.01
|
)
|
||||||||||||
|
3.18
|
(0.90
|
)
|
2.01
|
2.92
|
0.38
|
|||||||||||||
|
(0.12
|
)
|
(0.16
|
)
|
(0.23
|
)
|
(0.29
|
)
|
(0.42
|
)
|
|||||||||
|
(0.12
|
)
|
(0.16
|
)
|
(0.23
|
)
|
(0.29
|
)
|
(0.42
|
)
|
|||||||||
|
3.06
|
(1.06
|
)
|
1.78
|
2.63
|
(0.04
|
)
|
||||||||||||
|
$
|
24.75
|
$
|
21.69
|
$
|
22.75
|
$
|
20.97
|
$
|
18.34
|
|||||||||
|
14.70
|
%
|
-3.98
|
%
|
9.65
|
%
|
16.01
|
%
|
2.22
|
%
|
|||||||||
|
$
|
33,281
|
$
|
32,229
|
$
|
35,098
|
$
|
33,410
|
$
|
34,094
|
|||||||||
|
1.68
|
%
|
1.65
|
%
|
1.62
|
%
|
1.58
|
%
|
1.47
|
%
|
|||||||||
|
1.28
|
%
|
1.25
|
%
|
1.25
|
%
|
1.25
|
%
|
1.25
|
%
|
|||||||||
|
0.56
|
%
|
0.65
|
%
|
1.05
|
%
|
1.36
|
%
|
1.83
|
%
|
|||||||||
|
29
|
%
|
52
|
%
|
53
|
%
|
46
|
%
|
64
|
%
|
|||||||||
The accompanying notes are an integral part of these financial statements.
23
PLUMB FUNDS
Plumb Equity Fund
Financial Highlights
|
For the
|
||||
|
Six Months
|
||||
|
Ended
|
||||
|
September 30,
|
||||
|
2017
|
||||
|
(Unaudited)
|
||||
|
Per share operating performance
|
||||
|
(For a share outstanding throughout the period)
|
||||
|
Net asset value, beginning of period
|
$
|
24.70
|
||
|
Operations:
|
||||
|
Net investment income (loss)(1)
|
0.06
|
|||
|
Net realized and unrealized gain (loss)
|
3.44
|
(2)
|
||
|
Total from investment operations
|
3.50
|
|||
|
Dividends and distributions to shareholders:
|
||||
|
Dividends from net investment income
|
—
|
|||
|
Distributions from realized gains
|
—
|
|||
|
Total dividends and distributions
|
—
|
|||
|
Change in net asset value for the period
|
3.50
|
|||
|
Net asset value, end of period
|
$
|
28.20
|
||
|
Total return(3)
|
14.17
|
%(4)
|
||
|
Ratios / supplemental data
|
||||
|
Net assets, end of period (000)
|
$
|
23,538
|
||
|
Ratio of net expenses to average net assets:
|
||||
|
Before expense reimbursement and waivers
|
1.79
|
%(5)
|
||
|
After expense reimbursement and waivers(6)
|
1.45
|
%(5)
|
||
|
Ratio of net investment income to average net assets:
|
||||
|
After expense reimbursement and waivers(6)
|
-0.72
|
%(5)
|
||
|
Portfolio turnover rate
|
35
|
%(4)
|
||
|
(1)
|
Net investment income per share is calculated using current period ending balances prior to consideration of adjustment for permanent book and tax differences.
|
|
(2)
|
Realized and unrealized gains and losses per share in this caption are balancing amounts necessary to reconcile the change in net asset value per share for the period, and may not reconcile with the aggregate gains and losses in the Statement of Operations due to share transactions for the period.
|
|
(3)
|
Total return represents the rate that the investor would have earned or lost on an investment in the Fund, assuming reinvestment of dividends.
|
|
(4)
|
Not annualized for the six months ended September 30, 2017.
|
|
(5)
|
Annualized for the six months ended September 30, 2017.
|
|
(6)
|
Effective July 1, 2016, the Advisor contractually agreed to cap the Fund’s expenses at 1.45%. Prior to July 1, 2016, the Fund’s expense cap was 1.40%.
|
The accompanying notes are an integral part of these financial statements.
24
PLUMB FUNDS
Plumb Equity Fund
Financial Highlights (Continued)
| For the Years Ended March 31, | ||||||||||||||||||
|
2017
|
2016
|
2015
|
2014
|
2013
|
||||||||||||||
|
$
|
20.40
|
$
|
24.26
|
$
|
21.57
|
$
|
17.87
|
$
|
18.02
|
|||||||||
|
(0.15
|
)
|
(0.10
|
)
|
(0.01
|
)
|
0.11
|
0.20
|
|||||||||||
|
4.69
|
(1.16
|
)
|
2.96
|
3.70
|
(0.14
|
)
|
||||||||||||
|
4.54
|
(1.26
|
)
|
2.95
|
3.81
|
0.06
|
|||||||||||||
|
—
|
—
|
(0.04
|
)
|
(0.11
|
)
|
(0.21
|
)
|
|||||||||||
|
(0.24
|
)
|
(2.60
|
)
|
(0.22
|
)
|
—
|
—
|
|||||||||||
|
(0.24
|
)
|
(2.60
|
)
|
(0.26
|
)
|
(0.11
|
)
|
(0.21
|
)
|
|||||||||
|
4.30
|
(3.86
|
)
|
2.69
|
3.70
|
(0.15
|
)
|
||||||||||||
|
$
|
24.70
|
$
|
20.40
|
$
|
24.26
|
$
|
21.57
|
$
|
17.87
|
|||||||||
|
22.38
|
%
|
-5.76
|
%
|
13.76
|
%
|
21.38
|
%
|
0.42
|
%
|
|||||||||
|
$
|
23,533
|
$
|
21,423
|
$
|
24,130
|
$
|
23,540
|
$
|
36,422
|
|||||||||
|
1.86
|
%
|
1.82
|
%
|
1.72
|
%
|
1.68
|
%
|
1.46
|
%
|
|||||||||
|
1.43
|
%
|
1.40
|
%
|
1.40
|
%
|
1.40
|
%
|
1.40
|
%
|
|||||||||
|
-0.74
|
%
|
-0.48
|
%
|
-0.05
|
%
|
0.38
|
%
|
1.08
|
%
|
|||||||||
|
18
|
%
|
41
|
%
|
52
|
%
|
52
|
%
|
84
|
%
|
|||||||||
The accompanying notes are an integral part of these financial statements.
25
PLUMB FUNDS
Notes to Financial Statements
September 30, 2017 (Unaudited)
|
1.
|
ORGANIZATION
|
Wisconsin Capital Funds, Inc. (the “Company”) is registered under the Investment Company Act of 1940 (the “1940 Act”) as an open-end, diversified management investment company. The Company was organized as a Maryland corporation on April 3, 2007. The Company is authorized to issue up to 2 billion shares, which are units of beneficial interest with a $0.001 par value. The Company currently offers shares of two series, each with its own investment strategy and risk/reward profile: the Plumb Balanced Fund and the Plumb Equity Fund (individually a “Fund”, collectively the “Funds”). The investment objective of the Plumb Balanced Fund is high total return through capital appreciation while attempting to preserve principal, with current income as a secondary objective. The investment objective of the Plumb Equity Fund is long-term capital appreciation. Wisconsin Capital Management, LLC (the “Advisor”) serves as the Funds’ investment advisor. As of December 31, 2014, the Advisor is owned by TGP, Inc. The Advisor is controlled by Thomas G. Plumb indirectly through TGP, Inc. Certain directors or officers of the Funds are also officers of the Advisor.
|
2.
|
SIGNIFICANT ACCOUNTING POLICIES
|
The following is a summary of significant accounting policies consistently followed by the Funds in the preparation of its financial statements. These policies are in conformity with accounting principles generally accepted in the United States of America (“GAAP”). The Fund is an investment company and accordingly follows the investment company accounting and reporting guidance of the Financial Accounting Standards Board (“FASB”) Accounting Standards Codification Topic 946 Financial Services – Investment Companies.
Security Valuation:
The Funds have adopted authoritative fair valuation accounting standards which establish an authoritative definition of fair value and set out a hierarchy for measuring fair value. These standards require additional disclosures about the various inputs and valuation techniques used to develop the measurements of fair value and a discussion in changes in valuation techniques and related inputs during the year. These inputs are summarized in the three broad levels listed below.
|
Level 1 –
|
quoted prices in active markets for identical securities
|
|
|
Level 2 –
|
other significant observable inputs (including quoted prices for similar securities, interest rates, prepayment speeds, credit risk, etc.)
|
|
|
Level 3 –
|
significant unobservable inputs (including the Funds’ own assumptions in determining far value of investments)
|
26
PLUMB FUNDS
Notes to Financial Statements
September 30, 2017 (Unaudited) (Continued)
Equity securities, including domestic common stocks and foreign issued common stocks, are valued at the last sale price reported by the exchange on which the securities are primarily traded on the day of valuation. Nasdaq-listed securities are valued at their Nasdaq Official Closing Price. Equity securities not traded on a listed exchange or not traded using Nasdaq are valued as of the last sale price at the close of the U.S. market. If there are no sales on a given day for securities traded on an exchange, the latest bid quotation will be used. These securities will generally be classified as Level 1 securities.
Investments in mutual funds, including money market funds, are generally priced at the ending net asset value (NAV) provided by the service agent of the Funds and will be classified as Level 1 securities.
Debt securities such as corporate bonds and preferred securities are valued using a market approach based on information supplied by independent pricing services. The market inputs used by the independent pricing service include: benchmark yields, reported trades, broker/dealer quotes, issuer spreads, two sided markets, benchmark securities, bids, offers, and reference data including market research publications. Debt securities with remaining maturities of 60 days or less may be valued on an amortized cost basis, which involves valuing an instrument at its cost and thereafter assuming a constant amortization to maturity of any discount or premium, regardless of the impact of fluctuating rates on the fair value of the instrument. To the extent the inputs are observable and timely, these debt securities will generally be classified as Level 2 securities.
Any securities or other assets for which market quotations are not readily available are valued at fair value as determined in good faith by the Advisor pursuant to procedures established under the general supervision and responsibility of the Funds’ Board of Directors and will be classified as Level 3 securities.
The inputs or methodology used for valuing securities may not be an indication of the risk associated with investing in those securities. The inputs used to measure fair value may fall into different levels of the fair value hierarchy. In such cases, for disclosure purposes, the level in the fair value hierarchy within which the fair value measurement falls in its entirety is determined based on the lowest level input that is significant to the fair value measurement in its entirety.
27
PLUMB FUNDS
Notes to Financial Statements
September 30, 2017 (Unaudited) (Continued)
The following is a summary of the inputs used, as of September 30, 2017, to value the Funds’ investments carried at fair value:
|
Description
|
Level 1
|
Level 2
|
Level 3
|
Total
|
||||||||||||
|
Plumb Balanced Fund
|
||||||||||||||||
|
Investments in:
|
||||||||||||||||
|
Common Stocks*
|
$
|
22,381,112
|
$
|
—
|
$
|
—
|
$
|
22,381,112
|
||||||||
|
Preferred Stocks*
|
809,200
|
—
|
—
|
809,200
|
||||||||||||
|
Corporate Bonds*
|
—
|
9,942,143
|
—
|
9,942,143
|
||||||||||||
|
Government Securities
|
||||||||||||||||
|
& Agency Issues*
|
—
|
1,994,238
|
—
|
1,994,238
|
||||||||||||
|
Money Market Funds
|
1,731,680
|
—
|
—
|
1,731,680
|
||||||||||||
|
Total
|
$
|
24,921,992
|
$
|
11,936,381
|
$
|
—
|
$
|
36,858,373
|
||||||||
|
Description
|
Level 1
|
Level 2
|
Level 3
|
Total
|
||||||||||||
|
Plumb Equity Fund
|
||||||||||||||||
|
Investments in:
|
||||||||||||||||
|
Common Stocks*
|
$
|
23,206,907
|
$
|
—
|
$
|
—
|
$
|
23,206,907
|
||||||||
|
Money Market Funds
|
364,051
|
—
|
—
|
364,051
|
||||||||||||
|
Total
|
$
|
23,570,958
|
$
|
—
|
$
|
—
|
$
|
23,570,958
|
||||||||
|
*
|
For detailed industry descriptions, refer to the Schedule of Investments.
|
As of and during the period ending September 30, 2017, no securities were transferred into or out of Level 1 or Level 2. It is the Funds’ policy to consider transfers into or out of any level as of the end of the reporting period. The Funds did not hold any derivative instruments during the period ended September 30, 2017.
Use of Estimates:
The presentation of the financial statements in conformity with GAAP requires management to make estimates and assumptions that affect the reported amounts of assets and liabilities and disclosure of contingent assets and liabilities at the date of the financial statements and the reported amounts of increases and decreases in net assets from operations during the reporting period. Actual results could differ from those estimates.
Expenses:
Generally, expenses directly attributable to a Fund are charged to the Fund, while expenses attributable to more than one series of the Company are allocated among the respective series based on relative net assets or another appropriate basis.
28
PLUMB FUNDS
Notes to Financial Statements
September 30, 2017 (Unaudited) (Continued)
Federal Income Taxes:
The Funds intend to meet the requirements of the Internal Revenue Code (the “Code”) applicable to regulated investment companies and to distribute substantially all net investment taxable income and net capital gains to shareholders in a manner which results in no tax cost to the Funds. Therefore, no federal income or excise tax provision is recorded.
As of and during the period ended September 30, 2017, the Funds did not have a liability for any unrecognized tax benefits. The Funds recognize interest and penalties, if any, related to unrecognized tax benefits as income tax expense in the Statements of Operations. During the period ended September 30, 2017, the Funds did not incur any interest or penalties.
Distributions to Shareholders:
Dividends from net investment income are declared and paid at least annually. Distributions of net realized capital gains, if any, will be declared and paid at least annually. Distributions to shareholders are recorded on the ex-dividend date.
The Funds may periodically make reclassifications among certain of its capital accounts as a result of the recognition and characterization of certain income and capital gain distributions determined annually in accordance with federal tax regulations which may differ from GAAP. Any such reclassifications will have no effect on net assets, results of operations or net asset values per share of the Funds.
Other:
Investment and shareholder transactions are recorded on the trade date. Gains or losses from investment transactions are determined using the specific identification method. Dividend income is recognized on the ex-dividend date and interest income is recognized on an accrual basis. Discounts and premiums on securities purchased are amortized over the expected life of the respective securities using the effective interest method. Withholding taxes on foreign dividends have been provided for in accordance with the Funds’ understanding of the applicable country’s tax rules and rates.
|
3.
|
DISTRIBUTION PLAN
|
The Company has adopted a plan pursuant to Rule 12b-1 under the 1940 Act (the “12b-1 Plan”), on behalf of the Funds, which authorizes it to pay Quasar Distributors, LLC (the “Distributor”) a distribution fee up to 0.25% of the Funds’ average daily net assets for services to prospective Fund shareholders and
29
PLUMB FUNDS
Notes to Financial Statements
September 30, 2017 (Unaudited) (Continued)
distribution of Fund shares. During the period ended September 30, 2017, the Plumb Balanced Fund and the Plumb Equity Fund incurred expenses of $36,985 and $29,672, respectively, pursuant to the 12b-1 Plan.
|
4.
|
INVESTMENT ADVISOR AND OTHER AFFILIATES
|
The Funds have an Investment Advisory Agreement (the “Advisory Agreement”) with Wisconsin Capital Management, LLC. The Advisory Agreement provides for advisory fees computed daily and paid monthly at an annual rate of 0.65% of the Funds’ average daily net assets.
Under the terms of the Advisory Agreement, the Advisor has contractually agreed to limit the Funds’ expenses. Effective August 1, 2017 until July 31, 2018, the Advisor has agreed to limit annual operating expenses to 1.30% and 1.45% of the Funds’ average daily net assets for the Plumb Balanced Fund and the Plumb Equity Fund, respectively. Any such waiver or reimbursement is subject to later adjustment to allow the Advisor to recoup amounts waived or reimbursed to the extent actual fees and expenses for a period are less than the expense limitation caps in place at the time the waiver was made, provided, however, that the Advisor shall only be entitled to recoup such amounts for a period of three years from the date such amount was waived or reimbursed. For the period ended September 30, 2017, the Advisor waived expenses for the Plumb Balanced Fund and the Plumb Equity Fund of $72,388 and $47,990, respectively. There were no expense recoupments during the period ended September 30, 2017.
The following table shows the remaining waived or reimbursed expenses subject to potential recovery as of March 31, 2017 expiring in:
|
Plumb Balanced Fund
|
Plumb Equity Fund
|
||
|
2018 . . . . . . . $125,699
|
2018 . . . . . . . $74,257
|
||
|
2019 . . . . . . . $137,257
|
2019 . . . . . . . $96,706
|
||
|
2020 . . . . . . . $130,821
|
2020 . . . . . . . $93,826
|
Effective as of June 1, 2017, U.S. Bancorp Fund Services, LLC (“USBFS”) services as administrator to the Funds pursuant to a Fund Administration Servicing Agreement.
|
5.
|
INVESTMENT TRANSACTIONS
|
For the six months ended September 30, 2017, the aggregate purchases and sales of investment securities, other than short-term investments, were as follows:
|
U.S. Government Securities
|
Other
|
|||||||||||||||
|
Purchases
|
Sales
|
Purchases
|
Sales
|
|||||||||||||
|
Plumb Balanced Fund
|
$
|
2,247,935
|
$
|
249,695
|
$
|
5,949,603
|
$
|
8,205,902
|
||||||||
|
Plumb Equity Fund
|
$
|
—
|
$
|
—
|
$
|
9,262,730
|
$
|
12,385,012
|
||||||||
30
PLUMB FUNDS
Notes to Financial Statements
September 30, 2017 (Unaudited) (Continued)
|
6.
|
BENEFICIAL OWNERSHIP
|
The beneficial ownership, either directly or indirectly, of more than 25% of the voting securities of a fund creates a presumption of control of the fund under Section 2(a)(9) of the 1940 Act. As of September 30, 2017 certain entities and their affiliates which may control or be under common control with the Advisor including Thomas Plumb, SVA Plumb Trust Company, and SVA Plumb Wealth Management, LLC, either directly or for the benefit of their customers, collectively owned 65.36% of the Plumb Balanced Fund and 72.42% of the Plumb Equity Fund.
|
7.
|
FEDERAL TAX INFORMATION
|
As of March 31, 2017 the components of accumulated earnings (losses) for income tax purposes were as follows:
|
Plumb Balanced Fund
|
Plumb Equity Fund
|
|||||||
|
Unrealized appreciation
|
$
|
8,398,793
|
$
|
8,434,241
|
||||
|
Unrealized depreciation
|
(277,431
|
)
|
(261,673
|
)
|
||||
|
Net tax unrealized
|
||||||||
|
appreciation on investments
|
8,121,362
|
8,172,568
|
||||||
|
Undistributed ordinary income
|
53,898
|
—
|
||||||
|
Undistributed long-term capital gain
|
—
|
338,447
|
||||||
|
Other accumulated losses
|
(5,338,512
|
)
|
(34,974
|
)
|
||||
|
Total accumulated gains (losses)
|
$
|
2,836,748
|
$
|
8,476,041
|
||||
The tax cost of investments as of March 31, 2017 was $25,214,980 and $15,698,365 for the Plumb Balanced Fund and Plumb Equity Fund, respectively. The tax basis of investments for tax and financial reporting purposes differs principally due to the deferral of losses on wash sales.
As of March 31, 2017, the Funds had prior tax basis capital losses which may be carried over to offset future capital gains as shown below.
|
Capital Loss Carryover
|
||
|
Plumb Balanced Fund
|
Plumb Equity Fund
|
|
|
Expires:
|
||
|
March 31, 2018
|
$(5,240,754)
|
$—
|
Prior year capital loss carryovers of $322,911 and $0 for the Plumb Balanced Fund and Plumb Equity Fund, respectively, were utilized during the year.
As of March 31, 2017, the Funds deferred, on a tax basis, late year and post-October losses of:
|
Plumb Balanced Fund
|
Plumb Equity Fund
|
|||||||
|
Late Year Ordinary
|
$
|
—
|
$
|
34,973
|
||||
|
Post-October
|
$
|
97,758
|
$
|
—
|
||||
31
PLUMB FUNDS
Notes to Financial Statements
September 30, 2017 (Unaudited) (Continued)
|
8.
|
DISTRIBUTIONS TO SHAREHOLDERS
|
The tax character of distributions paid during the fiscal years ended March 31, 2017 and 2016 was as follows:
|
Plumb Balanced Fund
|
||||||||
|
Year Ended
|
Year Ended
|
|||||||
|
March 31, 2017
|
March 31, 2016
|
|||||||
|
Distributions paid from:
|
||||||||
|
Ordinary Income
|
$
|
173,578
|
$
|
232,417
|
||||
|
Total Distributions Paid
|
$
|
173,578
|
$
|
232,417
|
||||
|
Plumb Equity Fund
|
||||||||
|
Year Ended
|
Year Ended
|
|||||||
|
March 31, 2017
|
March 31, 2016
|
|||||||
|
Distributions paid from:
|
||||||||
|
Long-Term Capital Gains
|
$
|
231,808
|
$
|
2,484,322
|
||||
|
Total Distributions Paid
|
$
|
231,808
|
$
|
2,484,322
|
||||
32
PLUMB FUNDS
Additional Information (Unaudited)
RESULTS OF SHAREHOLDER MEETING
A special meeting of the shareholders of the Funds was held on June 1, 2017. At the meeting, shareholders elected six nominees, four of whom were already serving as directors at the time of the special meeting. Each nominee was elected by a majority of the votes cast to serve as a director, to hold office until his or her successor is duly elected and qualified. The shares were voted as indicated below.
|
% of Total
|
|||||||||||||
|
Director Nominee
|
Shares Voted
|
% Voted
|
Shares Voted
|
||||||||||
|
Patrick J. Quinn
|
For
|
2,101,121
|
99.89
|
%
|
81.99
|
%
|
|||||||
|
|
Withheld
|
2,219
|
0.11
|
%
|
0.09
|
%
|
|||||||
|
Jay Loewi
|
For
|
2,101,121
|
99.89
|
%
|
81.99
|
%
|
|||||||
|
|
Withheld |
2,219
|
0.11
|
%
|
0.09
|
%
|
|||||||
|
Roy S. Schlachtenhaufen
|
For
|
2,101,121
|
99.89
|
%
|
81.99
|
%
|
|||||||
|
|
Withheld |
2,219
|
0.11
|
%
|
0.09
|
%
|
|||||||
|
Harlan J. Moeckler
|
For
|
2,101,121
|
99.89
|
%
|
81.99
|
%
|
|||||||
|
|
Withheld |
2,219
|
0.11
|
%
|
0.09
|
%
|
|||||||
|
Thomas G. Plumb
|
For
|
2,101,121
|
99.89
|
%
|
81.99
|
%
|
|||||||
|
|
Withheld |
2,219
|
0.11
|
%
|
0.09
|
%
|
|||||||
|
Nathan M. Plumb
|
For
|
2,087,874
|
99.26
|
%
|
81.47
|
%
|
|||||||
|
|
Withheld |
15,466
|
0.74
|
%
|
0.60
|
%
|
|||||||
BOARD REVIEW OF FUNDS’ INVESTMENT ADVISORY AGREEMENT
The Investment Company Act of 1940, as amended (“1940 Act”), requires that the Funds’ Investment Advisory Agreement (the “Advisory Agreement”) with the Advisor be approved on an annual basis by the vote of a majority of the Board of Directors who are not parties to the Advisory Agreement or “interested persons” of the Funds (as that term is defined in 1940 Act) (the “Independent Directors”), cast in person at a meeting called for the purpose of voting on such approval. At its meeting held June 1, 2017, the Board of Directors, including all of the Independent Directors, unanimously approved the continuation of the Advisory Agreement for another year with a contractual waiver by the Advisor. Under this waiver, the Advisor agreed to limit expenses (exclusive of any acquired fund fees and expenses) until July 31, 2018, to 1.30% and 1.45% for the Plumb Balanced Fund and Plumb Equity Fund, respectively, to the extent that either Funds’ total annual operating expenses exceed those levels.
The Board’s approval was based on its consideration and evaluation of a variety of factors, which included, among other things: (i) the nature, extent and quality of the services rendered; (ii) the investment performance of each Fund;
33
PLUMB FUNDS
Additional Information (Unaudited) (Continued)
(iii) fees and expenses paid by each Fund to the Advisor; (iv) the economies of scale and whether economies of scale will accrue to the shareholders; and (v) the costs of the services to the Advisor and profits realized by the Advisor in providing services to the Funds. The Board generally viewed these factors in their totality, with no single factor serving as the principal reason for determining whether to renew the Agreement and with individual Board members giving different weight to different factors.
In connection with its consideration of the Advisory Agreement, the Board reviewed, discussed, and considered various materials at this meeting, including:
|
•
|
a memorandum from Fund counsel discussing the duties and responsibilities of directors when approving investment advisory agreements;
|
||
|
•
|
a memorandum and related materials from the Funds’ management providing information regarding:
|
||
|
o
|
the Funds’ absolute performances as well as their performances relative to industry benchmarks and universes of relevant peers identified by Morningstar;
|
||
|
o
|
the actual fees and expenses paid by the Funds and their expense ratios compared to their respective peers identified by Morningstar; and
|
||
|
o
|
the Advisor’s analysis of profitability of the Advisory Agreement to the Advisor.
|
||
|
•
|
the Advisory Agreement with the Advisor; and
|
||
|
•
|
reports from the Funds’ Chief Compliance Officer regarding the Advisor’s adherence to the Funds’ compliance program.
|
||
In addition, the Board had received and considered detailed information on the Funds’ investment performance and expenses at each of its quarterly meetings during the year as well as in-person reports from the Funds’ portfolio manager and reports from the Funds’ Chief Compliance Officer.
The nature, extent and quality of the services rendered by the Advisor.
The Board considered the nature, extent, and quality of services provided by the Advisor, including services required to be provided under the Agreement and additional services provided by the Advisor that were not required under the Agreement. The Board considered the background and experience of the Funds’ portfolio manager as well as other advisory, compliance, and other support provided by the Advisor. The Board observed that, in addition to investment management and broker-selection services, the Advisor oversees the
34
PLUMB FUNDS
Additional Information (Unaudited) (Continued)
performance of regular compliance and risk analysis functions for the Funds, as well as provides office space, equipment, and information-technology services necessary for operation of the Funds.
The Board determined that the Advisor’s significant experience over 30 years of managing mutual funds made it well qualified to continue managing the Funds. The Board observed that the portfolio manager also has a long history in the money management industry. The Board noted that, based on the information presented to it at this meeting and during previous quarters, it believed that the nature, extent, and quality of services provided by the Advisor were reasonably comparable to those provided by advisors to comparable funds, and that such services were adequate for the Funds’ needs. The Board discussed the investment-related and other support available from the Advisor, and the Advisor in particular indicated that a plan was in place to facilitate the provision of this support. The Advisor further indicated that the corporate parent of the Advisor, TGP, Inc., had continued in its commitment to supporting the Advisor. The Advisor also suggested that any growth and diversification of the Advisor’s revenue base could facilitate additional support in the future, and that while asset growth was challenging, the more recent performance of the Funds had increased the likelihood of such growth.
The performance of the Funds.
In reviewing the investment performance of each of the Funds, the Board reviewed the year-to-date, one-year, three-year, five-year, and life-of-fund performances of the Balanced Fund and Equity Fund. The Advisor and the Board discussed the performance of the Funds, noting that the Balanced Fund had performed in the top quintile of its Morningstar category over the year-to-date, one-year, three-year, and five-year periods and that the Equity Fund had ranked in the top half of its Morningstar category over the year-to-date, one-year, and three-year periods, although it had ranked in the fourth quintile for the five-year period. The Board discussed the positive performance trends over the past three years. The Advisor discussed the internal risk-control measures employed by the fund in more recent periods and strategies to generate outperformance while moderating volatility. The Advisor indicated that in its view, the risk-control measures had moderated the risk of future significant underperformance and had helped to improve the total return of each of the Funds. After considering the performances of the Balanced Fund and the Equity Fund, and in particular a consideration of the positive recent performance, the Board determined that the performances of the Balanced Fund and the Equity Fund were satisfactory.
35
PLUMB FUNDS
Additional Information (Unaudited) (Continued)
The fees and expenses charged by the Advisor.
The Board reviewed the expense ratios for each Fund, noting that pre-waiver expense ratios totaled 1.68 percent for the Balanced Fund and 1.86 percent for the Equity Fund, and that after the waiver of certain fees and expenses the expense ratio for the Balanced Fund was currently 1.30 percent and for the Equity Fund, 1.45 percent. The Advisor said that it was proposing to continue fee waivers for each of the Funds through July 31, 2018, at their current levels. The Board observed that the gross expense ratio for both Funds had increased over the past fiscal year, which was in part attributable to an increase in various unanticipated expenses during that period. The Advisor acknowledged that the expense ratios for both Funds were higher than both the average and the median of their respective Morningstar categories. The Advisor said that the Morningstar expense ratios included funds and fund complexes with significantly larger amounts of assets under management, which tended to drive down fees and expenses for those other funds and fund complexes. The Advisor also suggested that if the Fund could grow materially, such growth would likely result in a meaningful reduction in the gross expense ratio for the Fund. The Board concluded that the fees charged by the Advisor to the Funds were appropriate given the quality and scope of services and fees charged by the Advisor to other clients, and the Funds’ expense ratios were reasonable compared to peers and competitors.
The extent to which economies of scale will be realized as the Funds grow.
The Board also considered whether economies of scale might be realized as the Funds’ assets increase. The Advisor expressed its belief that in order to achieve a level of assets under management at which the gross expense ratio of each Fund were closer to their respective Morningstar category medians, each of the Funds would need to increase its assets under management by at least two-to-three times. The Board agreed that an increase in assets would likely help the Funds to achieve economies of scale in the Funds’ operations, but that in light of their continued relatively small size, neither Fund has yet to achieve any significant economies of scale. The Board concluded that neither the Balanced Fund nor the Equity Fund was likely to realize material economies of scale until assets under management in each grew significantly.
Profits realized by the Advisor.
The Advisor discussed its profitability, indicating that it does not provide similar services to any other registered investment company. The Advisor noted that the Advisor currently manages very few accounts other than the Funds. The Board considered the fees for these other accounts. The Advisor indicated that none of these other accounts had identical investment objectives as either of the
36
PLUMB FUNDS
Additional Information (Unaudited) (Continued)
Funds and provided an overview of its standard investment advisory contract fee schedule for its separately managed account clients. The Advisor expressed its belief that the standard contract is not directly comparable to the advisory contract with the Funds because separately managed account clients do not require the same level of services or the same level of regulatory and compliance costs as does a registered investment company. The Advisor discussed the revenues and profits generated by the Funds in 2015 and 2016 and those projected for 2017. The Advisor indicated that while the Funds do not generate significant profitability for the Advisor at this time, they have continued to be sustainable and slightly profitable following the restructuring of the Advisor. The Board agreed with the reasonableness of these profitability levels.
After full consideration of the above factors, as well as of other factors that were instructive in its consideration, the Board, including all of the Independent Directors, concluded that the continuation of the Advisory Agreement for the Funds was in the best interest of each respective Fund and its shareholders.
37
(This Page Intentionally Left Blank.)
WISCONSIN CAPITAL FUNDS, INC.
c/o U.S. Bancorp Fund Services, LLC
P.O. Box 701
Milwaukee, WI 53201-0701
1-866-987-7888
INVESTMENT ADVISOR
Wisconsin Capital Management, LLC
8030 Excelsior Drive, Suite 307
Madison, WI 53717
Telephone: (608) 960-4616
DISTRIBUTOR
Quasar Distributors, LLC
777 East Wisconsin Avenue
Milwaukee, WI 53202
CUSTODIAN
U.S. Bank National Association
1555 N. Rivercenter Drive
MK-WI-5302
Milwaukee, WI 53212
TRANSFER AGENT AND
DIVIDEND DISBURSING AGENT
US Bancorp Fund Services, LLC
615 East Michigan Street
Milwaukee, WI 53202
INDEPENDENT REGISTERED PUBLIC ACCOUNTING FIRM
Cohen & Company, Ltd.
1350 Euclid Avenue, Suite 800
Cleveland, OH 44115
LEGAL COUNSEL
Quarles & Brady LLP
411 East Wisconsin Avenue
Milwaukee, WI 53202
This report has been prepared for shareholders and may be distributed to others only if preceded or accompanied by a current prospectus.
The Funds’ Statement of Additional Information contains additional information about the Funds’ directors and officers and is available, without charge, at www.plumbfunds.com or upon request by calling 1-866-987-7888.
The Funds’ Proxy Voting Policies and Procedures are available without charge upon request by calling 1-866-987-7888 and on the SEC’s website at www.sec.gov. Information regarding how the Funds voted proxies relating to portfolio securities during the 12-month period ended June 30, 2017 is available by calling 1-866-987-7888 and on the SEC’s website at www.sec.gov.
The Funds’ complete schedule of portfolio holdings for the first and third quarters is filed with the SEC on Form N-Q. The Funds’ Form N-Q is available without charge, upon request, by calling 1-866-987-7888 and on the SEC’s website at www.sec.gov. The Funds’ Forms N-Q may also be reviewed and copied at the Commission’s Public Reference Room in Washington, DC. Information on the operation of the Public Reference Room may be obtained by calling 1-800-SEC-0330.
Item 2. Code of Ethics.
Not applicable for semi-annual reports.
Item 3. Audit Committee Financial Expert.
Not applicable for semi-annual reports.
Item 4. Principal Accountant Fees and Services.
Not applicable for semi-annual reports.
Item 5. Audit Committee of Listed Registrants.
Not applicable to registrants who are not listed issuers (as defined in Rule 10A-3 under the Securities Exchange Act of 1934).
Item 6. Investments.
Schedule of Investments is included as part of the report to shareholders filed under Item 1 of this Form.
Item 7. Disclosure of Proxy Voting Policies and Procedures for Closed-End Management Investment Companies.
Not applicable to open-end investment companies.
Item 8. Portfolio Managers of Closed-End Management Investment Companies.
Not applicable to open-end investment companies.
Item 9. Purchases of Equity Securities by Closed‑End Management Investment Company and Affiliated Purchasers.
Not applicable to open-end investment companies.
Item 10. Submission of Matters to a Vote of Security Holders.
The registrant has not made any material changes to the procedures by which shareholders may recommend nominees to the Registrant’s Board of Directors after the registrant last provided disclosure in response to the requirements of Item 407(c)(2)(iv) of Regulation S-K or this Item.
Item 11. Controls and Procedures.
|
(a)
|
The Registrant’s President and Principal Financial Officer have reviewed the Registrant's disclosure controls and procedures (as defined in Rule 30a-3(c) under the Investment Company Act of 1940 (the “Act”)) as of a date within 90 days of the filing of this report, as required by Rule 30a-3(b) under the Act and Rules 13a-15(b) or 15d‑15(b) under the Securities Exchange Act of 1934. Based on their review, such officers have concluded that the disclosure controls and procedures are effective in ensuring that information required to be disclosed in this report is appropriately recorded, processed, summarized and reported and made known to them by others within the Registrant and by the Registrant’s service provider.
|
|
(b)
|
There were no changes in the Registrant's internal control over financial reporting (as defined in Rule 30a-3(d) under the Act) that occurred during the second fiscal quarter of the period covered by this report that have materially affected, or are reasonably likely to materially affect, the Registrant's internal control over financial reporting.
|
Item 12. Disclosure of Securities Lending Activities for Closed-End Management Investment Companies
Not applicable to open-end investment companies.
Item 13. Exhibits.
|
(a)
|
(1) Any code of ethics or amendment thereto, that is the subject of the disclosure required by Item 2, to the extent that the registrant intends to satisfy Item 2 requirements through filing an exhibit. Not Applicable.
|
(2) A separate certification for each principal executive officer and principal financial officer pursuant to Section 302 of the Sarbanes-Oxley Act of 2002. Filed herewith.
(3) Any written solicitation to purchase securities under Rule 23c‑1 under the Act sent or given during the period covered by the report by or on behalf of the registrant to 10 or more persons. Not applicable to open-end investment companies.
|
(1)
|
There was no change in the registrant’s independent public accountant for the period covered by this report.
|
|
(b)
|
Certifications pursuant to Section 906 of the Sarbanes‑Oxley Act of 2002. Furnished herewith.
|
SIGNATURES
Pursuant to the requirements of the Securities Exchange Act of 1934 and the Investment Company Act of 1940, the registrant has duly caused this report to be signed on its behalf by the undersigned, thereunto duly authorized.
(Registrant) Wisconsin Capital Funds, Inc.
By (Signature and Title)* /s/ Thomas G. Plumb
Thomas G. Plumb, President (Principal Executive Officer)
Date November 30, 2017
Pursuant to the requirements of the Securities Exchange Act of 1934 and the Investment Company Act of 1940, this report has been signed below by the following persons on behalf of the registrant and in the capacities and on the dates indicated.
By (Signature and Title)* /s/ Thomas G. Plumb
Thomas G. Plumb, President (Principal Executive Officer)
Date November 30, 2017
By (Signature and Title)* /s/ Nathan Plumb
Nathan Plumb, Chief Financial Officer (Principal Financial Officer)
Date November 30, 2017
* Print the name and title of each signing officer under his or her signature.