MULTI-TENANT
OFFICE/INDUSTRIAL LEASE (NNN)
CYPRESS DISTRIBUTION CENTER
Cypress, California
Cypress, California
LANDLORD:
KATELLA/HOLDER STREET, LLC,
a Delaware limited liability company
a Delaware limited liability company
TENANT:
IRHYTHM TECHNOLOGIES, INC.,
a Delaware corporation
a Delaware corporation
TABLE OF CONTENTS
Article 1 - LEASE SUMMARY AND PROPERTY SPECIFIC PROVISIONS | 1 | |||||||
| 9 | ||||||||
| Article 3 - PREMISES | 9 | |||||||
| 9 | ||||||||
| 10 | ||||||||
| 10 | ||||||||
| 11 | ||||||||
| 11 | ||||||||
| 12 | ||||||||
| 13 | ||||||||
| 13 | ||||||||
| 14 | ||||||||
| 14 | ||||||||
| 15 | ||||||||
| 16 | ||||||||
| 17 | ||||||||
| 18 | ||||||||
| 19 | ||||||||
| 19 | ||||||||
| 20 | ||||||||
| 21 | ||||||||
| 22 | ||||||||
| 22 | ||||||||
| 23 | ||||||||
| 24 | ||||||||
| 24 | ||||||||
| 24 | ||||||||
| Article 28 - RELOCATION OF PREMISES | 24 | |||||||
| Article 29 - MORTGAGEE PROTECTION | 24 | |||||||
| 25 | ||||||||
| 25 | ||||||||
Exhibits
Exhibit A Premises Floor Plan
Exhibit B Site Plan
Exhibit C Work Letter
Exhibit D Notice of Lease Term Dates
Exhibit E Rules and Regulations
Exhibit F Estoppel Certificate
Exhibit G Environmental Questionnaire and Disclosure Statement
Riders
Rider No. 1 Extension Option
Rider No. 2 Fair Market Rental Rate
Rider No. 3 Expansion Option
Rider No. 4 Termination Option
Rider No. 5 Options in General
18th
This MULTI-TENANT OFFICE/INDUSTRIAL LEASE (NNN) (“Lease”), entered into as of this __ day of March, 2021 (the “Effective Date”) for reference purposes, is by and between KATELLA/HOLDER STREET, LLC, a Delaware limited liability company, hereinafter referred to as “Landlord”, and IRHYTHM TECHNOLOGIES, INC., a Delaware corporation, hereinafter referred to as “Tenant”.
ARTICLE 1 - LEASE SUMMARY AND PROPERTY SPECIFIC PROVISIONS
1.1 Landlord’s Address: KATELLA/HOLDER STREET, LLC
c/o LBA Realty LLC
3347 Michelson Drive, Suite 200
Irvine, California 92612
Attn: Asset Manager - Cypress Distribution Center
Telephone: (949) 833-0400
E-mail: leasingnotices@lbarealty.com
With a copy to: Katella/Holder Street, LLC
c/o LBA Realty
3347 Michelson Drive, Suite 210 Irvine, California 92612
Attn: Regional Operations Manager - Cypress Distribution Center
Telephone: (949) 833-0400
E-mail: leasingnotices@lbarealty.com
For payment of Rent: KATELLA/HOLDER STREET, LLC
P.O. Box 741151
Los Angeles, California 90074-1151
1.1 Tenant’s Address: Before the Commencement Date:
IRHYTHM TECHNOLOGIES, INC. 11085 Knott Ave, Suite B Cypress, CA 90630
Attn: Head of Workplace & Real Estate
After the Commencement Date:
The Premises
With a copy to: IRHYTHM TECHNOLOGIES, INC.
699 8th St # 600
San Francisco, CA 94103
Attn: Head of Workplace & Real Estate
Tenant Billing Address: IRHYTHM TECHNOLOGIES, INC.
699 8th St # 600 San Francisco, CA 94103 Attn: Finance
1.3.Building; Property: The building located at 6550 Katella Avenue, Cypress, California 90630 (the “Building”). The Building, together with all other buildings, improvements and facilities, now or subsequently located upon the land (the “Site”), including, without limitation, the two (2) buildings currently located within the Property, as shown on the Site Plan attached hereto as Exhibit B (as such area may be expanded or reduced from time to time) is referred to herein as the “Property”. The Property is commonly known as the Cypress Distribution Center. Landlord and Tenant stipulate and agree that the Property contains 546,219 rentable square feet in the aggregate and the Building contains 342,086 rentable square feet, for all purposes of this Lease.
1.4.Premises: Suite 200 of the Building, consisting of 34,573 rentable square feet of office space (the “Office Premises”) and 34,360 rentable square feet of warehouse space (the “Warehouse Premises”), as outlined on the Premises Floor Plan attached hereto as Exhibit A. The estimated rentable square footage of the Premises is 68,933, subject to adjustment pursuant to Section 3.2 of the Standard Lease Provisions. Tenant’s Percentage of the Building: 19.75%.
1.5.City: The City of Cypress, County of Orange, State of California.
1.6.Commencement Date: The later of: (i) six (6) months following the Turnover Date, (ii) August 1, 2021. Estimated Commencement Date: August 1, 2021.
1.7.Term: One hundred twenty-six (126) full calendar months, plus any partial month at the beginning of the Term, commencing on the Commencement Date and ending on the last day of the one hundred twenty-sixth (126th) full calendar month following the Commencement Date (“Expiration Date”).
1.8.Monthly Base Rent:
Office Premises:

Months or Period
01-12*
13-24
01-36
01-48
01-60
01-72
01-84
01-96
01-108
01-120
01-126
Monthly Base Rent
$57,045.45**
$58,756.81
$60,519.52
$62,335.10
$64,205.16
$66,131.31
$68,115.25
$70,158.71
$72,263.47
$74,431.37
$76,664.31
Warehouse Premises:
Months or Period
01-12*
13-24
01-36
01-48
01-60
01-72
01-84
01-96
01-108
01-120
01-126
Monthly Base Rent
$30,924.00**
$31,851.72
$32,807.27
$33,791.49
$34,805.23
$35,849.39
$36,924.87
$38,032.62
$39,173.60
$40,348.81
$41,559.27
*Including any partial month at the beginning of the Term.
**Notwithstanding the foregoing, provided Tenant is not in default under this Lease beyond any applicable notice and cure period, Landlord hereby agrees to abate Tenant’s obligation to pay Monthly Base Rent during the second (2nd) through the seventh (7th) full calendar months of the initial Term (such total amount of abated Monthly Base Rent being hereinafter referred to as the “Abated Amount”). During such abatement period, Tenant will still be responsible for the payment of all other monetary obligations under the Lease. Tenant acknowledges that any default by Tenant under this Lease will cause Landlord to incur costs not contemplated hereunder, the exact amount of such costs being extremely difficult and impracticable to ascertain, therefore, should Landlord terminate the Lease as after a Tenant default after having been given notice and opportunity to cure, then the total unamortized sum of such Abated Amount (amortized on a straight line basis over the initial Term of this Lease) so conditionally excused shall become immediately due and payable by Tenant to Landlord; provided, however, Tenant acknowledges and agrees that nothing in this subparagraph is intended to limit any other remedies available to Landlord at law or in equity under applicable law (including, without limitation, the remedies under Civil Code Section 1951.2 and/or 1951.4 and any successor statutes or similar laws), in the event Tenant defaults under this Lease beyond any applicable notice and cure period. Upon reasonable notice to Tenant at any time prior to application of the entire Abated Amount, Landlord shall have the right to purchase from Tenant any and all then remaining Abated Amount as it applies to one or more of the remaining abatement months by paying to Tenant an amount equal to the unused balance of the Abated Amount that Landlord elects to purchase back from Tenant (the “Abated Amount Purchase Price”). Upon Landlord’s payment to Tenant of the Abated Amount Purchase Price with respect to the applicable remaining abatement months, Tenant shall thereupon be required to pay Monthly Base Rent during such months in an amount equal to the Abated Amount that Tenant would have been entitled to receive but for Landlord’s payment to Tenant of the Abated Amount Purchase Price.
Accordingly, Tenant shall deliver the following amounts to Landlord upon its execution of this Lease (pursuant to Sections 4.2 and 5.1 of the Standard Provisions):
| (a) | Monthly Base Rent: | $87,969.45 for Month 1. | ||||||
| (b) | Tenant’s Percentage | |||||||
| of Operating Expenses (est.): | $16,514.49 for Month 1. | |||||||
| (c) | Security Deposit: | $354,670.74 (See Section 1.9 below) | ||||||
| Total due upon execution of this Lease: | $459,154.68. | |||||||
1.9.Security Deposit: $354,670.74, subject to reduction in accordance with the terms and conditions of Article 6.
1.10.Permitted Use: Warehousing, manufacturing, research and development, storage and general office use, subject to the provisions set forth in this Lease and as permitted by Law.
1.11.Parking: One hundred sixty-nine (169) unreserved parking spaces, subject to the terms of Article 11 of the Standard Lease Provisions.
1.12.Brokers: Cushman & Wakefield of California, Inc., representing Landlord and Tenant.
1.13.Interest Rate: The lesser of: (a) Eight percent (8%) or (b) the maximum rate permitted by law in the State where the Property is located.
1.14.Insurance Amounts:
a.Commercial General Liability Insurance: General liability of not less than One Million Dollars ($1,000,000.00) per occurrence and Two Million Dollars ($2,000,000.00) in the aggregate.
b.Commercial Automobile Liability Insurance: Limit of liability of not less than One Million Dollars ($1,000,000.00) per accident.
c.Worker’s Compensation and Employers Liability Insurance: With limits as mandated pursuant to the laws in the State in which the Property is located, or One Million Dollars ($1,000,000.00) per person, disease and accident, whichever is greater.
d.Umbrella Liability Insurance: Limits of not less than Three Million Dollars ($3,000,000.00) per occurrence.
e.If Tenant’s business includes professional services, Professional Liability (also known as errors and omissions insurance): Not less than the minimum limits required by law for Tenant’s profession, and in any event, not less than One Million Dollars ($1,000,000.00) per occurrence.
f.Loss of Income, Extra Expense and Business Interruption Insurance: In the amount of at least 12 months of Monthly Base Rent.
1.3.Tenant Improvements: Landlord, at Landlord’s sole cost and expense, promptly following the mutual execution of this Lease, using Building-standard methods, materials, finishes and specifications, shall complete certain sewer system work as further described in Schedule 2 attached to Exhibit C attached hereto (the “Landlord Improvements”). The Landlord Improvements shall be constructed in accordance with all applicable Laws, in a good and workmanlike manner, free of defects and using new Building standard materials and equipment of good quality. Tenant shall have the right to submit a written “punch list” to Landlord, setting forth any defective item of construction, and Landlord shall promptly cause such items to be corrected.
Landlord hereby grants to Tenant an allowance of: (i) up to $75.00 per rentable square foot of the Office Premises (i.e., up to $2,592,975.00, based on the Office Premises containing approximately 34,573 rentable square feet), plus (ii) up to $2.50 per rentable square foot of the Warehouse Premises (i.e., up to $85,900.00, based on the Warehouse Premises containing approximately 34,360 rentable square feet), plus (iii) $675,000.00 ($3,353,875.00 in the aggregate) (collectively, the “Allowance”), to be applied as provided in the Work Letter.
1.4.Tenant’s Percentage: 12.62%, which is the ratio that the rentable square footage of the Premises bears to the rentable square footage of the Property.
1.5.Common Areas; Definitions; Tenant’s Rights. During the Term, Tenant shall have the non-exclusive right to use, in common with other tenants in the Property, and subject to the Rules and Regulations referred to in Article 9 of the Standard Lease Provisions, those portions of the Property (the “Property Common Areas”) not leased or designated for lease to tenants that are provided for use in common by Landlord, Tenant and any other tenants of the Property (or by the sublessees, agents, employees, customers invitees, guests or licensees of any such party), whether or not those areas are open to the general public. The Property Common Areas shall include, without limitation, all other buildings on the Property exclusive of areas maintained and repaired by tenants, and all parking areas (subject to Article 11 of the Standard Lease Provisions), loading and unloading areas, trash areas, roadways, sidewalks, walkways, parkways, driveways and landscaped areas appurtenant to the Building, fixtures, systems, decor, facilities and landscaping contained, maintained or used in connection with those areas, and shall be deemed to include any city sidewalks adjacent to the Property and located on the Site, any pedestrian walkway system, park or other facilities located on the Site and open to the general public. The common areas of the Building shall be referred to herein as the “Building Common Areas” and shall include, without limitation, the following areas of the Building: the common entrances, lobbies, common restrooms, accessways, loading docks, ramps, drives and platforms and any passageways and serviceways thereto to the extent not exclusively serving another tenant or contained within another tenant’s premises, and the common pipes, conduits, wires and appurtenant equipment serving the Premises. The Building Common Areas and the Property Common Areas shall be referred to herein collectively as the “Common Areas.” If Tenant is leasing the entire Building, then all elements of the Building and the Building Common Areas shall constitute part of the Premises and all references to Common Areas contained in this Lease shall mean and refer to those elements of the Property outside of the Premises. Notwithstanding anything to the contrary herein, Landlord acknowledges that the Tenant Improvements identified in the plans issued for review by Hendy on January 13, 2021 (the “Hendy Plans”) will include certain modifications to the Building and parking areas required to accommodate both grade and dock high loading including, without limitation, the construction of a truck well serving the Premises (the “Truck Well”). In furtherance of the foregoing, the Common Areas shall exclude, and Tenant shall have the exclusive right to use and modify, the Truck Well identified in the Hendy Plans.
1.6.Operating Expenses.
a.Intentionally omitted.
b.Operating Expenses. In addition to the Monthly Base Rent, Tenant shall pay to Landlord Tenant’s Percentage of Operating Expenses, in the manner and at the times set forth in the following provisions of this Section 1.18. “Operating Expenses” shall consist of all costs and expenses of operation, maintenance and repair of the Common Areas of the Property as determined by standard accounting practices and calculated assuming the Property is at least ninety-five percent (95%) occupied. Operating Expenses include the following costs by way of illustration but not limitation: (i) any and all assessments imposed with respect to the Property pursuant to any covenants, conditions and restrictions affecting the Property; (ii) costs, levies or assessments resulting from statutes or regulations promulgated by any government authority in connection with the use or occupancy of the Property; (iii) all costs of utilities serving the Common Areas and any costs of utilities for the Premises which are not separately metered, (iv) all Taxes and Insurance Costs as defined in the Standard Lease Provisions, (v) waste disposal; (vi)
security, if any; (vii) costs incurred in the management of the Property, including, without limitation: (1) supplies, materials, equipment and tools, (2) wages, salaries, benefits, pension payments, fringe benefits, (and payroll taxes, insurance and similar governmental charges related thereto) of employees used in the operation and maintenance of the Property, (3) the rental of personal property used by Landlord’s personnel in the maintenance, repair and operation of the Property, (4) accounting fees, legal fees and real estate consultant’s fees, and (5) a management/administrative fee not to exceed four percent (4%) of gross rents for the Property; (viii) repair and maintenance of all portions of the Building and all buildings on the Property other than such portions as are maintained by Tenant or any other tenants, including the elevators (if any), restrooms (if any), structural and non-structural portions of the Building and all other buildings on the Property, and the plumbing, heating, ventilating, air-conditioning and electrical systems installed or furnished by Landlord and not maintained by Tenant pursuant to Section 8.2 of the Standard Provisions; (ix) maintenance, costs and upkeep of all parking and Common Areas; (x) amortization on a straight-line basis over the useful life together with interest at the rate of eight percent (8%) per annum on the unamortized balance of all costs of a capital nature (including, without limitation, capital improvements, capital replacements, capital repairs, capital equipment and capital tools): (1) reasonably intended to produce a reduction in operating charges or energy consumption; or (2) required after the date of this Lease under any Law that was not applicable to the Building at the time it was originally constructed; or (3) for repair or replacement of any equipment or improvements needed to operate and/or maintain the Property at the same quality levels as prior to the repair or replacement; (xi) costs and expenses of gardening and landscaping; (xii) maintenance of signs (other than signs of tenants of the Property); (xiii) personal property taxes levied on or attributable to personal property used in connection with the Property; and (xiv) costs and expenses of repairs, resurfacing, repairing, maintenance, painting, lighting and similar items. Landlord shall have the right, from time to time, to equitably allocate some or all of the Operating Expenses among different tenants and/or different buildings and/or different premises of the Property based upon differing levels of use, demand, risk or other distinctions among such parties, premises or Buildings (the “Cost Pools”). Such Cost Pools may include, for example, all office space tenants or industrial/R&D space tenants in the Property and may be modified to take into account the addition of any additional buildings within the Property. Accordingly, in the event of such allocations into Cost Pools, Tenant’s Percentage shall be appropriately adjusted to reflect such allocation. In addition, if Landlord does not furnish a particular service or work (the cost of which, if furnished by Landlord would be included in Operating Expenses) to a tenant (other than Tenant) that has undertaken to perform such service or work in lieu of receiving it from Landlord, then Operating Expenses shall be considered to be increased by an amount equal to the additional Operating Expenses that Landlord would reasonably have incurred had Landlord furnished such service or work to that tenant.
c.Exclusions from Operating Expenses. Notwithstanding anything to the contrary contained elsewhere in this Lease, the following items shall be excluded from Operating Expenses: (i) Costs of decorating, redecorating, or special cleaning or other services provided to certain tenants and not provided on a regular basis to all tenants of the Property; (ii) Any charge for depreciation of the Property or equipment and any interest or other financing charge; (iii) All costs relating to activities for the marketing, solicitation, negotiation and execution of leases of space in the Property, including without limitation, costs of tenant improvements; (iv) All costs for which Tenant or any other tenant in the Property is being charged other than pursuant to the operating expense clauses of leases for space in the Property; (v) The cost of correcting defects in the construction of the Building or any other building in the Property or in the building equipment, except that conditions (not occasioned by construction defects) resulting from ordinary wear and tear will not be deemed defects for the purpose of this category; (vi) the cost of repair made by Landlord because of the total or partial destruction of the Property or the condemnation of a portion of the Building or any other building in the Property; (vii) The cost of any items for which Landlord is reimbursed by insurance or otherwise compensated by parties other than tenants of the Building or any other building in the Property pursuant to clauses similar to this paragraph; (viii) Any operating expense representing an amount paid to a related corporation, entity, or person which is in excess of the amount which would be paid in the absence of such relationship; (ix) The cost of any work or service performed for or facilities furnished to any tenant of the Building or any other building in the Property to a greater extent or in a manner more favorable to such tenant than that performed for or furnished to Tenant; (x) The cost of alterations of space in the Building or any other building in the Property which is leased to other tenants; (xi) Ground rent or similar payments to a ground lessor; (xii) Legal fees and related expenses incurred by Landlord (together with any damages awarded against Landlord) due to the gross negligence or willful misconduct of Landlord; (xiii) Costs arising from the presence, removal, abatement, or remediation of any Hazardous Materials within, upon or beneath the Property except to the extent caused by the release or emissions of such Hazardous Materials by Tenant or any Tenant’s Parties; (xiv) Salaries and compensation of ownership and management personnel to the extent that such persons provide services to properties other than the Property and wages and/or benefits attributable to personnel above the level of the immediate supervisor of the Property manager; (xv) Costs of selling or financing the Property, the Building or any portions thereof; (xvi) capital costs other than as expressly provided in Section 1.18(b)(x); (xvii) costs, fines, penalties, or interest incurred due to a violation of Laws by Landlord; and (xviii) expense reserves.
d.Estimate Statement and Payment of Tenant’s Percentage of Operating Expenses. By
the first day of April (or as soon as practicable thereafter) of each calendar year during the Term, Landlord shall endeavor to deliver to Tenant a statement (“Estimate Statement”) estimating the Tenant’s Percentage of Operating Expenses for the current calendar year. If at any time during the Term, but not more often than quarterly, Landlord reasonably determines that the estimated amount of Tenant’s Percentage of Operating Expenses payable by Tenant for the current calendar year will be greater or less than the amount set forth in the then current Estimate Statement, Landlord may issue a revised Estimate Statement and Tenant agrees to pay Landlord, within thirty (30) days after receipt of the revised Estimate Statement, the difference between the amount owed by Tenant under such revised Estimate Statement and the amount owed by Tenant under the original Estimate Statement for the portion of the then current calendar year which has expired. Thereafter Tenant agrees to pay Tenant’s Percentage of Operating Expenses based on such revised Estimate Statement until Tenant receives the next calendar year’s Estimate Statement or a new revised Estimate Statement for the current calendar year. Tenant’s Percentage of Operating Expenses shown on the Estimate Statement (or revised Estimate Statement, as applicable) shall be divided into twelve (12) equal monthly installments, and Tenant shall pay to Landlord, concurrently with the regular monthly Rent payment next due following the receipt of the Estimate Statement (or revised Estimate Statement, as applicable), an amount equal to one (1) monthly installment of such Tenant’s Percentage of Operating Expenses multiplied by the number of months from January in the calendar year in which such statement is submitted to the month of such payment, both months inclusive (less any amounts previously paid by Tenant with respect to any previously delivered Estimate Statement or revised Estimate Statement for such calendar year). Subsequent installments shall be paid concurrently with the regular monthly Rent payments for the balance of the calendar year and shall continue until the next calendar year’s Estimate Statement (or current calendar year’s revised Estimate Statement) is received.
e.Actual Statement. By the first day of June (or as soon as practicable thereafter) of each subsequent calendar year during the Term, Landlord shall endeavor to deliver to Tenant a statement (“Actual Statement”) which states the Tenant’s Percentage of actual Operating Expenses payable by Tenant for the immediately preceding calendar year. If the Actual Statement reveals that the Tenant’s Percentage of actual Operating Expenses were more than the Tenant’s Percentage of estimated Operating Expenses paid by Tenant with respect to the preceding calendar year, Tenant agrees to pay Landlord the difference in a lump sum within thirty (30) days after receipt of the Actual Statement. Such obligation will be a continuing one which will survive
the expiration or earlier termination of this Lease. If the Actual Statement reveals that the Tenant’s Percentage of actual Operating Expenses were less than the Operating Expenses paid by Tenant with respect to the preceding calendar year, Landlord will credit any overpayment toward the next monthly installment(s) of Rent due from Tenant or, if no such installments remain (i.e., following the expiration or earlier termination of the Lease), refund such amounts to Tenant within thirty (30) days. Prior to the expiration or sooner termination of the Term and Landlord’s acceptance of Tenant’s surrender of the Premises, Landlord will have the right to estimate the Tenant’s Percentage of actual Operating Expenses for the then current calendar year and to collect from Tenant prior to Tenant’s surrender of the Premises, any excess of such Tenant’s Percentage of actual Operating Expenses over the Tenant’s Percentage of estimated Operating Expenses paid by Tenant in such calendar year, and Landlord shall reconcile the same with the actual Operating Expenses incurred by Landlord and charge or refund Tenant for any underpayment or overpayment in accordance with this Section; provided, however, in the event of an overpayment by Tenant, Landlord shall reimburse Tenant for such overpayment within thirty (30) days following Landlord’s delivery of the Actual Statement.
f.No Release. Any delay or failure by Landlord in delivering any Estimate Statement or Actual Statement pursuant to this Section 1.18 shall not constitute a waiver of its right to receive Tenant’s payment of Tenant’s Percentage of Operating Expenses, nor shall it relieve Tenant of its obligations to pay Operating Expenses pursuant to this Section 1.18, except that Tenant shall not be obligated to make any payments based on such Estimate or Actual Statement until thirty (30) days after receipt of such statement.
g.Review. Within one hundred twenty (120) days after receiving Landlord’s Actual Statement, Tenant may, upon advance written notice to Landlord and during reasonable business hours, cause a review of Landlord’s books and records with respect to the preceding calendar year only to determine the accuracy of Landlord’s Actual Statement. Landlord shall make all pertinent records available for review that are reasonably necessary for Tenant to conduct its review. If any records are maintained at a location other than the office of the Building, Tenant may either review the records at such other location or pay for the reasonable cost of copying and shipping the records. If Tenant retains an agent, at Tenant’s sole cost and expense, to review Landlord’s records, the agent shall be an independent accountant of national standing which is reasonably acceptable to Landlord, is not compensated on a contingency basis and is also subject to a confidentiality agreement. Within sixty (60) days after the records are made available to Tenant, Tenant shall have the right to give Landlord written notice (an “Objection Notice”) stating in reasonable detail any objection to the Actual Statement of Operating Expenses for that year. If Tenant provides Landlord with a timely Objection Notice, Landlord and Tenant shall work together in good faith to resolve any issues raised in Tenant’s Objection Notice. If Tenant fails to provide Landlord with a timely Objection Notice, Landlord’s Actual Statement shall be deemed final and binding, and Tenant shall have no further right to review or object to such statement. If Landlord and Tenant determine that Operating Expenses for the calendar year are less than reported, Landlord shall provide Tenant with a credit against the next installment of Rent in the amount of the overpayment by Tenant. Likewise, if Landlord and Tenant determine that Operating Expenses for the calendar year are greater than reported, Tenant shall pay Landlord the amount of any underpayment within thirty (30) days after such determination. The records obtained by Tenant shall be treated as confidential. In no event shall Tenant be permitted to review Landlord’s records or to dispute any statement of Operating Expenses unless Tenant has paid and continues to pay all Rent when due.
1.3.Utilities and Services.
a. Utilities and Services. As used in this Lease, “Premises Utilities Costs” shall mean all actual charges for utilities for the Premises of any kind, including but not limited to water, sewer and electricity, telecommunications and cable service, and the costs of heating, ventilating and air conditioning and other utilities as well as related fees, assessments and surcharges. Tenant shall contract directly for all utilities services for the Premises and shall pay all Premises Utilities Costs directly to the various utility service providers providing such utility services to the Premises. Should Landlord elect to supply any or all of such utilities, Tenant agrees to purchase and pay for the same as Additional Rent. Tenant shall reimburse Landlord within thirty (30) days after billing for fixture charges and/or water tariffs, if applicable, which are charged to Landlord by local utility companies. Landlord will notify Tenant of this charge as soon as it becomes known. This charge will increase or decrease with current charges being levied against Landlord, the Premises or the Building by the local utility company, and will be due as Additional Rent. In no event shall Landlord be liable for any interruption or failure in the supply of any such utility or other services to Tenant. In no event shall any Rent owed Landlord under this Lease be abated by reason of the failure to furnish, delay in furnishing, unavailability or diminution in quality or quantity of any such utility or other services or interference with Tenant’s business operations as a result of any such occurrence; nor shall any such occurrence constitute an actual or constructive eviction of Tenant or a breach of an implied warranty by Landlord.
b.Maintenance/Janitorial/Service Contracts. Tenant shall, at its sole cost and expense, maintain and repair, and enter into a regularly scheduled preventive maintenance/service contract with a maintenance contractor to service all hot water, heating and air conditioning systems and equipment (“HVAC”) within the Premises, or which serve the Premises exclusively, including, without limitation, any rooftop package HVAC units, distribution lines and internal venting systems. Such repair and maintenance shall include any and all services required to conform and maintain the HVAC units in compliance with current ASHRAE Standards. As used herein, "ASHRAE Standards" shall mean those standards established by the American Society of Heating, Refrigerating and Air Conditioning Engineers, Inc. (“ASHRAE”) and Air Conditioning Contractors of America (“ACCA”) Standard Practice for Inspection and Maintenance of Commercial Building HVAC Systems, ANSI/ASHRAE/ACCA Standard 180-2008, as the same may be amended from time to time. Tenant shall have complete control over the operation of the HVAC units within the Premises, or which exclusively serve the Premises, during the Term. All cleaning and janitorial services, including regular removal of trash and debris, for the Premises shall be performed and obtained, at Tenant’s sole cost and expense, exclusively by or through Tenant or Tenant’s janitorial contractors. The maintenance contractor and janitorial contractor for same must be approved in writing by Landlord in advance, such approval not to be unreasonably withheld, conditioned or delayed. All maintenance/service contracts shall include all services recommended by the equipment manufacturer within the operation/maintenance manual and all services required to conform and maintain the HVAC in compliance with current ASHRAE Standards and shall become effective (and a copy thereof delivered to Landlord) within thirty (30) days following the Commencement Date. If Tenant fails to procure and maintain any or all of such service contacts, then Landlord reserves the right, upon thirty (30) days’ prior written notice to Tenant and Tenant’s failure to cure prior to the expiration of such notice period, to procure and maintain any or all of such service contracts, and if Landlord so elects, Tenant shall reimburse Landlord, as Additional Rent, within thirty (30) days following written demand, for the cost therefor.
c.Tenant’s Obligations. Tenant shall cooperate fully at all times with Landlord and abide by current ASHRAE Standards all reasonable and non-discriminatory regulations and requirements which Landlord may prescribe for the proper functioning and protection of the Building’s services and systems. Tenant shall not connect any conduit, pipe, apparatus or other device to the Building’s water, waste or other supply lines or systems for any purpose. Neither Tenant nor its employees, agents, contractors, licensees or invitees shall at any time enter, adjust, tamper with, touch or otherwise in any manner affect the
mechanical installations or facilities of the Building. Tenant agrees to reasonably cooperate with Landlord to the extent required by Landlord to comply with California Public Resources Code Section 25402.10 including, without limitation, providing or consenting to any utility company releasing Tenant’s energy consumption information for the Premises to Landlord. Tenant hereby consents to the release of Tenant’s energy consumption information for the Premises to Landlord, and if requested, Tenant shall promptly sign any documentation requested by the utility company to evidence such consent.
1.20 Additional Hazardous Materials Requirements. In addition to Tenant’s obligations under Article 10 of the Standard Provisions, Tenant shall comply with the following provisions with respect to Hazardous Materials (as that term is defined in Article 10):
a. Environmental Questionnaire; Disclosure. Prior to the execution of this Lease, Tenant
shall complete, execute and deliver to Landlord an Environmental Questionnaire and Disclosure Statement (the “Environmental Questionnaire”) in the form of Exhibit G, and Tenant shall certify to Landlord all information contained in the Environmental Questionnaire as true and correct to the best of Tenant’s knowledge and belief. The completed Environmental Questionnaire shall be deemed incorporated into this Lease for all purposes, and Landlord shall be entitled to rely fully on the information contained therein. Within ten (10) business days following Landlord’s demand therefor (each such date of demand is hereinafter referred to as a “Disclosure Date”), until and including the last Disclosure Date occurring prior to the expiration or sooner termination of this Lease, Tenant shall disclose to Landlord in writing the names and amounts of all Hazardous Materials, or any combination thereof, that were stored, generated, used or disposed of on, under or about the Premises for the twelve (12) month period prior to each Disclosure Date, and that Tenant intends to store, generate, use or dispose of on, under or about the Premises during the next twelve (12) month period. At Landlord’s request, Tenant’s disclosure obligations under this Section 1.20 shall include a requirement that Tenant update, execute and deliver to Landlord the Environmental Questionnaire, as the same may be reasonably modified by Landlord from time to time; provided, however, Tenant shall not be required to update the Environmental Questionnaire more than once per year unless an environmental event of default has occurred or Tenant has materially changed its business. In addition to the foregoing, within ten (10) business days of Landlord’s request, Tenant shall promptly notify Landlord of, and shall promptly provide Landlord with true, correct, complete and legible copies of, all of the following environmental items relating to the Premises: reports filed pursuant to any self-reporting requirements; reports filed pursuant to any Environmental Laws or this Lease; all permit applications, permits, monitoring reports, workplace exposure and community exposure warnings or notices, and all other reports, disclosures, plans or documents (even those that may be characterized as confidential) relating to water discharges, air pollution, waste generation or disposal, underground storage tanks or Hazardous Materials; all orders, reports, notices, listings and correspondence (even those that may be considered confidential) of or concerning the release, investigation, compliance, clean up, remedial and corrective actions, and abatement of Hazardous Materials
whether or not required by Environmental Laws; and all complaints, pleadings and other legal documents filed against Tenant related to Tenant’s use, handling, storage or disposal of Hazardous Materials.
b.Inspection; Compliance. Subject to the provisions of Article 24, below, Landlord and Landlord Parties (as that term is defined in Article 10) shall have the right, but not the obligation, to inspect, investigate, sample and/or monitor the Premises, including any air, soil, water, groundwater or other sampling, and any other testing, digging, drilling or analyses, at any time to determine whether Tenant is complying with the terms of this Section 1.20 and Article 10, and in connection therewith, Tenant shall provide Landlord with access to all relevant facilities, records and personnel. If Tenant is not in compliance with any of the provisions of this Section
1.20.and Article 10, or in the event of a release of any Hazardous Materials on, under, from or about the Premises by Tenant or any Tenant’s Parties in violation of applicable Environmental Laws, Landlord and Landlord Parties shall have the right, but not the obligation, without limitation on any of Landlord’s other rights and remedies under this Lease, to immediately enter upon the Premises and to discharge Tenant’s obligations under this Section 1.20 and Article 10 at Tenant’s expense, including without limitation the taking of emergency or long term remedial action. Landlord and Landlord Parties shall endeavor to minimize interference with Tenant’s business but shall not be liable for any such interference. In addition, Landlord, at Tenant’s sole cost and expense, shall have the right, but not the obligation, to join and participate in any legal proceedings or actions initiated in connection with any claims or causes of action arising out of the storage, generation, use or disposal by Tenant or Tenant’s Parties of Hazardous Materials on, under, from or about the Premises in violation of applicable Environmental Laws. All sums reasonably disbursed, deposited or incurred by Landlord in connection herewith, including, but not limited to, all costs, expenses and actual attorneys’ fees, shall be due and payable by Tenant to Landlord, as an item of Additional Rent, on demand by Landlord, together with interest thereon at the Interest Rate from the date of such demand until paid by Tenant. Landlord agrees that if any testing proves that the Tenant or Tenant’s Parties have not violated applicable Environmental Laws or this Lease in connection with the presence of said Hazardous Materials, Tenant shall not be liable for any costs or expenses in connection with such inspection, testing and monitoring.
c.Tenant Obligations. If the presence of any Hazardous Materials on, under or about the Premises caused by Tenant or Tenant’s Parties results in (i) injury to any person, (ii) injury to or contamination of the Premises, or (iii) injury to or contamination of any real or personal property wherever situated, Tenant, at its sole cost and expense, shall promptly take all actions necessary to return the Premises to the condition required by applicable Environmental Laws. Without limiting any other rights or remedies of Landlord under this Lease, Tenant shall pay the cost of any cleanup work performed on, under or about the Premises as required by this Lease or any Environmental Laws in connection with the removal, disposal, neutralization or other treatment of such Hazardous Materials caused by Tenant or Tenant’s Parties. If Landlord has reason to believe that Tenant or Tenant’s Parties may have caused the release of any Hazardous Materials on, under, from or about the Premises in violation of applicable Environmental Laws, then Landlord may require Tenant, at Tenant’s sole cost and expense, to conduct monitoring activities on or about the Premises satisfactory to Landlord, in its sole and absolute judgment, concerning such release of Hazardous Materials on, under, from or about the Premises. Notwithstanding anything to the contrary contained in the foregoing, Tenant shall not, without Landlord’s prior written consent, take any remedial action in response to the presence of any Hazardous Materials on, under or about the Premises, or enter into any settlement agreement, consent decree or other compromise with any governmental agency with respect to any Hazardous Materials claims; provided, however, Landlord’s prior written consent shall not be necessary in the event that the presence of Hazardous Materials on, under or about the Premises (i) poses an immediate threat to the health, safety or welfare of any individual, or (ii) is of such a nature that an immediate remedial response is necessary and it is not possible to obtain Landlord’s consent before taking such action. Tenant’s failure to timely comply with this Section 1.20 shall constitute an event of default under this Lease.
d. Tenant’s Responsibility at Conclusion of Lease. Promptly upon the expiration or sooner termination of this Lease, Tenant shall represent to Landlord in writing that (i) Tenant has made a diligent effort to determine whether any Hazardous Materials are on, under or about the Premises in violation of applicable Environmental Laws, as a result of any acts or omissions of Tenant or Tenant’s Parties and (ii) no such Hazardous Materials exist on, under or about the Premises, other than as specifically identified to Landlord by Tenant in writing. If Tenant discloses the existence of Hazardous Materials on, under or
about the Premises or if Landlord at any time discovers that Tenant or Tenant’s Parties caused the release of any Hazardous Materials on, under, from or about the Premises in violation of applicable Environmental Laws, Tenant shall, at Landlord’s request, immediately prepare and submit to Landlord within thirty (30) days after such request a comprehensive plan, subject to Landlord’s approval, specifying the actions to be taken by Tenant to return the Premises to the condition required by applicable Environmental Laws. Upon Landlord’s approval of such clean-up plan, Tenant shall, at Tenant’s sole cost and expense, without limitation on any rights and remedies of Landlord under this Lease or at law or in equity, immediately implement such plan and proceed to clean up such Hazardous Materials in accordance with all Environmental Laws and as required by such plan and this Lease. Notwithstanding anything to the contrary herein, under no circumstance shall Tenant be liable for any losses, costs, claims, liabilities and damages (including attorneys’ and consultants’ fees) arising out of any Hazardous Material present at any time on or about the Property, or the soil, air, improvements, groundwater or surface water thereof, except to the extent due to the release or emission of such Hazardous Material by Tenant or Tenant’s Parties in violation of applicable Environmental Laws.
1.21 Landlord’s Additional Repair Obligations. Landlord, at Landlord's cost (subject to inclusion in Operating Expenses as provided in Section 1.18 of the Summary), shall repair, maintain and replace as necessary, the foundation and structural elements of the Building (including structural load bearing walls and roof structure), and utility meters, electrical lines, pipes and conduits serving the Building and the Premises; provided, however, to the extent such maintenance, repairs or replacements are required as a result of any act, neglect, fault or omission of Tenant or any of Tenant's Parties, Tenant shall pay to Landlord, as Additional Rent, the costs of such maintenance, repairs and replacements. In addition, and subject to Sections 17.1 and 17.2 of the Standard Lease Provisions, Landlord shall, as part of the Operating Expenses, repair, maintain and replace, as necessary (a) the basic heating, ventilating, air conditioning ("HVAC"), sprinkler and electrical systems within the Building core and standard conduits, connections and distribution systems thereof within the Premises (but not any above standard improvements installed in the Premises such as, for example, but not by way of limitation, custom lighting, special or supplementary HVAC or plumbing systems or distribution extensions, special or supplemental electrical panels or distribution systems, or kitchen or restroom facilities and appliances to the extent such facilities and appliances are intended for the exclusive use of Tenant), and (b) the Common Areas, if any; provided, however, to the extent such maintenance, repairs or replacements are required as a result of any act, neglect, fault or omission of Tenant or any of Tenant's Parties, Tenant shall pay to Landlord, as Additional Rent within ten (10) days after demand, the costs of such maintenance, repairs and replacements. Landlord shall not be liable to Tenant for failure to perform any such maintenance, repairs or replacements, unless Landlord shall fail to make such maintenance, repairs or replacements and such failure shall continue for an unreasonable time following written notice from Tenant to Landlord of the need therefor. Without limiting the foregoing, Tenant waives the right to make repairs at Landlord's expense under any applicable Laws now or hereafter in effect.
1.22 Tenant Termination Right. If Tenant is unable to obtain approval from the City of Cypress permitting Tenant to add a loading dock/truck well on or before April 25, 2021 (the “Outside Termination Date”), then Tenant shall have the one-time right to terminate the Lease by delivering written notice of such termination (the “Termination Notice”) to Landlord on or before April 30, 2021 (the “Termination Notice Delivery Date”); provided, that, if the City of Cypress is still reviewing Tenant’s application for approval as of the Outside Termination Date, Tenant shall have the right to extend the Outside Termination Date and the Termination Notice Delivery Date by an additional 14 days by providing notice to Landlord of the same. If Tenant timely delivers the Termination Notice to Landlord, then the Lease shall terminate, and Landlord shall promptly return any prepaid Rent and the Security Deposit to Tenant. If Tenant fails to timely deliver the Termination Notice to Landlord on or before April 20, 2021 (as may be extended), then the Lease shall not terminate and Tenant shall be deemed to have irrevocably waived its right to terminate the Lease under this Section 1.22.
[REST OF PAGE INTENTIONALLY BLANK]
STANDARD LEASE PROVISIONS
ARTICLE 2 - LEASE
ARTICLE 2 - LEASE
2.1 Lease Elements; Definitions; Exhibits. The Lease is comprised of the Lease Summary and Property Specific Provisions (the “Summary”), these Standard Lease Provisions (“Standard Provisions”) and all exhibits, and riders attached hereto (collectively, “Exhibits”), all of which are incorporated together as part of one and the same instrument. All references in any such documents and instruments to “Lease” means the Summary, these Standard Provisions and all Exhibits attached hereto. All terms used in this Lease shall have the meanings ascribed to such terms in the Summary, these Standard Provisions and any Exhibits. To the extent of any inconsistency between the terms and conditions of the Summary, these Standard Provisions, or any Exhibits attached hereto, the Summary and any Exhibits attached hereto shall control over these Standard Provisions.
ARTICLE 3 - PREMISES
3.1.Lease of Premises. Landlord hereby leases to Tenant, and Tenant hereby leases from Landlord, the Premises, upon and subject to, the terms, covenants and conditions of this Lease. Each party covenants and agrees, as a material part of the consideration for this Lease, to keep and perform their respective obligations under this Lease.
3.2.Landlord’s Reserved Rights. Provided the same do not unreasonably adversely affect Tenant’s use of the Premises or Tenant’s parking rights and do not materially increase the obligations or decrease the rights of Tenant under this Lease, Landlord reserves the right from time to time to do any of the following: (a) expand the Building and construct or alter other buildings or improvements on the Property; (b) make any changes, additions, improvements, maintenance, repairs or replacements in or to the Property, Common Areas and/or the Building (including the Premises if required to do so by any applicable Laws or to the extent necessary in conjunction with any improvements to the Property, Common Areas and/or the Building), and the fixtures and equipment thereof, including, without limitation: (i) maintenance, replacement and relocation of pipes, ducts, conduits, wires and meters and equipment above the ceiling surfaces, below the floor surfaces and within the walls of the Building and the Premises; and (ii) changes in the location, size, shape and number of driveways, entrances, stairways, elevators, loading and unloading areas, ingress, egress, direction of traffic, landscaped areas and walkways, easements, parking spaces and parking areas as long as Tenant’s parking ratio is not substantially and adversely impacted; (c) close temporarily any of the Property while engaged in making repairs, improvements or alterations to the Property; and (d) perform such other acts and make such other changes with respect to the Property, as Landlord may, in the exercise of reasonable good faith business judgment, deem to be appropriate. In no event shall Landlord reconfigure the Premises as a result of any changes to the Property, Common Areas and/or the Building or as a result of Landlord’s exercise of its rights under this Section 3.2. Landlord shall endeavor to minimize, as reasonably practicable, the interference with Tenant’s business as a result of any construction performed pursuant to this Section 3.2. All measurements of rentable area of the Premises in this Lease shall be deemed to be correct and shall not be subject to remeasurement.
ARTICLE 4 - TERM AND POSSESSION
4.1.Term; Notice of Lease Dates. The Term shall be for the period designated in the Summary commencing on the Commencement Date and ending on the Expiration Date, unless the Term is sooner terminated or extended as provided in this Lease. If the Commencement Date falls on any day other than the first day of a calendar month then the Term will be measured from the first day of the month following the month in which the Commencement Date occurs. Within ten (10) days after Landlord’s written request, Tenant shall execute a written confirmation of the Commencement Date and Expiration Date of the Term in the form of the Notice of Lease Term Dates attached hereto as Exhibit D. The Notice of Lease Term Dates shall be binding upon Tenant unless Tenant reasonably objects thereto in writing within such ten (10) day period. Landlord shall use commercially reasonable efforts to complete the Landlord Improvements promptly following the Effective Date, and Landlord shall cooperate with Tenant during the completion of the Landlord Improvements to timely permit Tenant to complete the Tenant Improvement.
4.2.Possession. Landlord shall deliver possession of the Premises to Tenant as provided in the Work Letter, or if no Work Letter is attached hereto, Landlord shall deliver possession of the Premises to Tenant in its then as-is condition, subject to the provisions of Section 4.3 below. Tenant agrees that if Landlord is unable to deliver possession of the Premises to Tenant on or prior to the date that this Lease is mutually executed and delivered, the Lease will not be void or voidable, nor will Landlord be liable to Tenant for any loss or damage therefrom. Notwithstanding the foregoing, Landlord will not be obligated to deliver possession of the Premises to Tenant until Landlord has received from Tenant all of the following: (i) a copy of this Lease fully executed by Tenant; (ii) the Security Deposit required hereunder and the first installment of Monthly Base Rent and Additional Rent, if any, due under this Lease; and (iii) copies of Tenant’s insurance certificates as required hereunder.
4.3.Condition of Premises. Tenant acknowledges that, except as otherwise expressly set forth in this Lease or the Work Letter, neither Landlord nor any agent of Landlord has made any representation or warranty with respect to the Premises, the Building or the Property or their condition, or with respect to the suitability thereof for the conduct of Tenant’s business, and Tenant shall accept the Premises in its then as-is condition on delivery by Landlord. Pursuant to Section 1938 of the California Civil Code, Landlord hereby advises Tenant that as of the date of this Lease neither the Premises, the Building nor the Property have undergone inspection by a Certified Access Specialist (CASp). Further, pursuant to Section 1938 of the California Civil Code, Landlord notifies Tenant of the following: “A Certified Access Specialist (CASp) can inspect the premises and determine whether the premises comply with all of the applicable construction-related accessibility standards under state law. Although California state law does not require a CASp inspection of the premises, the commercial property owner or lessor may not prohibit the lessee or tenant from obtaining a CASp inspection of the premises for the occupancy or potential occupancy of the lessee or tenant, if requested by the lessee or tenant. The parties shall mutually agree on the arrangements for the time and manner of any such CASp inspection, the payment of the costs and fees for the CASp inspection and the cost of making any repairs necessary to correct violations of construction-related accessibility standards within the premises.” Therefore and notwithstanding anything to the contrary contained in this Lease, Landlord and Tenant agree that (a) Tenant may, at its option and at its sole cost, cause a CASp to inspect the Premises and determine whether the Premises complies with all of the applicable construction-related accessibility standards under California law, (b) the parties shall mutually coordinate and reasonably approve of the timing of any such CASp inspection so that Landlord may, at its option, have a representative present during such inspection, and (c) Tenant shall be solely responsible for the cost of any repairs necessary to correct violations of construction-related accessibility standards within the Premises, any and all such alterations and repairs to be performed in accordance with Article 13 of this Lease, but only to the extent such alterations and repairs are disclosed by such CASp inspection and required by applicable Laws to be corrected; provided Tenant shall have no obligation to remove any repairs or alterations made pursuant to a CASp inspection under this Section 4.3.
4.4.Early Access. So long as Landlord has received from Tenant the first month’s Monthly Base Rent and Additional Rent, if any, due pursuant to Section 5.1 of this Lease, certificates satisfactory to Landlord evidencing the insurance required to be carried by Tenant under this Lease, and the Security Deposit, and so long as Tenant and its contractors and employees do not interfere with the completion of the Landlord Improvements, Landlord shall give Tenant and Tenant’s designated contractors access to the Premises upon mutual execution of this Lease (the “Early Access Period”) for purposes of installing Tenant’s furniture, fixtures, and equipment (“Tenant’s Work”) and constructing the Tenant Improvements. Tenant’s Work shall be performed by Tenant at Tenant’s sole cost and expense. Tenant’s access to the Premises during the Early Access Period shall be subject to all terms and conditions of this Lease, except that Tenant shall not be obligated to pay Rent during the Early Access Period until the Commencement Date. Landlord and Tenant agree to cooperate with the other party during the period of any such early access so as not to interfere with such party’s completion of the Landlord Improvements or the Tenant Improvements, as the case may be.
ARTICLE 5 - RENT
5.1.Monthly Base Rent. Tenant agrees to pay Landlord, the Monthly Base Rent as designated in the Summary. Monthly Base Rent and recurring monthly charges of Additional Rent (defined below) shall be paid by Tenant in advance on the first day of each and every calendar month (“Due Date”) during the Term, except that the first full month’s Monthly Base Rent and Additional Rent, if any, shall be paid upon Tenant’s execution and delivery of this Lease to Landlord. Monthly Base Rent for any partial month shall be prorated in the proportion that the number of days this Lease is in effect during such month bears to the actual number of days in such month.
5.2.Additional Rent. All amounts and charges payable by Tenant under this Lease in addition to Monthly Base Rent, if any, including, without limitation, payments for Operating Expenses, Taxes, Insurance Costs and Premises Utilities Costs to the extent payable by Tenant under this Lease shall be considered “Additional Rent”, and the word “Rent” in this Lease shall include Monthly Base Rent and all such Additional Rent unless the context specifically states or clearly implies that only Monthly Base Rent is referenced. Rent shall be paid to Landlord, without any prior notice or demand therefor and without any notice, deduction or offset, in lawful money of the United States of America.
5.3.Late Charges & Interest Rate. If Landlord does not receive Rent or any other payment due from Tenant within five (5) days after the Due Date, Tenant shall pay to Landlord a late charge equal to eight percent (8%) of such past due Rent or other payment. Tenant agrees that this late charge represents a fair and reasonable estimate of the cost Landlord will incur by reason of Tenant’s late payment. Accepting any late charge shall not constitute a waiver by Landlord of Tenant’s default with respect to any overdue amount nor prevent Landlord from exercising any other rights or remedies available to Landlord. If any installment of Monthly Base Rent or Additional Rent, or any other amount payable by Tenant hereunder is not received by Landlord by the Due Date, it shall bear interest at the Interest Rate set forth in the Summary from the Due Date until paid. All interest, and any late charges imposed pursuant to this Section 5.3, shall be considered Additional Rent due from Tenant to Landlord under the terms of this Lease. Notwithstanding the foregoing, Tenant will not be assessed the foregoing late charge and interest on the first two (2) late payments during the Term, if the applicable payment is made within five (5) days of Tenant’s receipt of notice of nonpayment from Landlord.
ARTICLE 6 - SECURITY DEPOSIT
Concurrently with Tenant’s execution and delivery of this Lease to Landlord, Tenant shall deposit with Landlord the Security Deposit, if any, designated in the Summary. The Security Deposit shall be held by Landlord as security for the full and faithful performance by Tenant of all of the terms, covenants and conditions of this Lease to be performed by Tenant during the Term. If Tenant defaults beyond the expiration of any applicable notice and cure periods with respect to any of its obligations under this Lease, Landlord may (but shall not be required to) use, apply or retain all or any part of the Security Deposit for the payment of any Monthly Base Rent, Additional Rent or any other sum in default, or for the payment of any other amount, loss or damage which Landlord may spend, incur or suffer by reason of Tenant’s default. If any portion of the Security Deposit is so used or applied, Tenant shall, within ten (10) days after demand therefor, deposit cash with Landlord in an amount sufficient to restore the Security Deposit to its original amount. Landlord shall not be required to keep the Security Deposit separate from its general funds, and Tenant shall not be entitled to interest on the Security Deposit. If Tenant shall not be in default beyond applicable notice and cure periods, the Security Deposit or any balance thereof shall be returned to Tenant within thirty (30) days following the expiration of the Term, provided that Landlord may retain the Security Deposit until such time as any amount due from Tenant in accordance with this Lease has been determined and paid in full. If Landlord sells its interest in the Building during the Term and if Landlord deposits with or credits to the purchaser the Security Deposit (or balance thereof), then, upon such sale, Landlord shall be discharged from any further liability with respect to the Security Deposit. Tenant hereby waives the provisions of Section 1950.7 of the California Civil Code to the extent such law (i) establishes the time frame by which a landlord must refund a security deposit under a lease, or (ii) provides that a landlord may claim from a security deposit only those sums reasonably necessary to remedy defaults in the payment of rent, to repair damage caused by a tenant, or to clean the subject premises.
Notwithstanding the foregoing, provided Tenant is not then in default beyond any applicable notice and cure periods and has not previously been in default beyond any applicable notice and cure periods under this Lease at any prior to the last day of the thirty-sixth (36th) full calendar month of the initial Term, on the first (1st) day of the thirty- seventh (37th) full calendar month of the initial Term (the “First Adjustment Date”), Landlord shall apply $118,223.58 of the Security Deposit against the Monthly Base Rent (for both the Office and Warehouse space) then payable by Tenant for the thirty-seventh (37th) full calendar month of the initial Term. Furthermore, provided Tenant is not then in default beyond any applicable notice and cure periods and has not previously been in default beyond any applicable notice and cure periods under this Lease at any prior to the last day of the forty-eighth (48th) full calendar month of the initial Term, on the first (1st) day of the forty-ninth (49th) full calendar month of the initial Term (the “Second Adjustment Date”), Landlord shall apply $118,223.58 of the Security Deposit against the Monthly Base Rent (for both the Office and Warehouse space) then payable by Tenant for the forty-ninth (49th) full calendar month of the initial Term. There shall be no reduction in the Security Deposit if Tenant is in default beyond any applicable notice and cure periods as of the applicable adjustment date set forth herein, or if Tenant has been in default beyond any applicable notice and cure periods under this Lease at any time prior to the First Adjustment Date of the Second Adjustment Date, as the case may be.
ARTICLE 7 - OPERATING EXPENSES/UTILITIES/SERVICES
7.1.Operating Expenses. Tenant shall pay for or contribute to the costs of operation, maintenance, repair and replacement of the Premises, Building and Property as provided in the Summary.
7.2.Utilities and Services. Utilities and services to the Premises and the Property are described in the Summary.
7.3.Taxes. As used in this Lease, the term “Taxes” means: All real property taxes and assessments, possessory interest taxes, sales taxes, personal property taxes, business or license taxes or fees, gross receipts taxes, license or use fees, excises, transit charges, and other impositions of any kind (including fees “in-lieu” or in substitution of any such tax or assessment) which are now or hereafter assessed, levied, charged or imposed by any public authority upon the Building, Site, Property and/or Premises or any portion thereof, its operations or the Rent derived therefrom (or any portion or component thereof, or the ownership, operation, or transfer thereof), and any and all costs and expenses (including, without limitation, reasonable attorneys’ fees) incurred in attempting to protest, reduce or minimize the same. Taxes shall not include inheritance or estate taxes imposed upon or assessed against the interest of Landlord, gift taxes, excess profit taxes, franchise taxes, or similar taxes on Landlord’s business or any other taxes computed upon the basis of the net income of Landlord. If it shall not be lawful for Tenant to reimburse Landlord for any such Taxes, the Monthly Base Rent payable to Landlord under this Lease shall be revised to net Landlord the same net rent after imposition of any such Taxes by Landlord as would have been payable to Landlord prior to the payment of any such Taxes. Tenant shall pay for or contribute to Taxes as part of Operating Expenses as provided in the Summary. Notwithstanding anything herein to the contrary, Tenant shall be liable for all taxes levied or assessed against personal property, furniture, fixtures, above-standard Tenant Improvements and alterations, additions or improvements placed by or for Tenant in the Premises. Furthermore, Tenant shall pay prior to delinquency any (i) rent tax or sales tax, service tax, transfer tax or value added tax, or any other applicable tax on the rent or services provided herein or otherwise respecting this Lease, (ii) taxes assessed upon or with respect to the possession, leasing, operation, management, maintenance, alteration, repair, use or occupancy by Tenant of the Premises or any portion of the Property; or (iii) taxes assessed upon this transaction or any document to which Tenant is a party creating or transferring an interest or an estate in the Premises.
7.4.Insurance Costs. As used in this Lease, “Insurance Costs” means the cost of insurance obtained by Landlord pursuant to Article 15 (including self-insured amounts and deductibles, if any, to the extent permitted under Article 15, below). Tenant shall pay for or contribute to Insurance Costs as part of Operating Expenses as provided in the Summary.
7.5.Interruption of Utilities. Landlord shall have no liability to Tenant for any interruption in utilities or services to be provided to the Premises when such failure is caused by all or any of the following: (a) accident, breakage or repairs; (b) strikes, lockouts or other labor disturbances or labor disputes of any such character;
(c)governmental regulation, moratorium or other governmental action; (d) inability, despite the exercise of reasonable diligence, to obtain electricity, water or fuel; (e) service interruptions or any other unavailability of utilities resulting from causes beyond Landlord’s control including without limitation, any electrical power “brown-out” or “black-out”; or (f) any other cause beyond Landlord’s reasonable control. In addition, in the event of any such interruption in utilities or services, Tenant shall not be entitled to any abatement or reduction of Rent (except as expressly provided in Articles 17 and 18 if such failure is a result of any casualty damage or taking described therein), no eviction of Tenant shall result, and Tenant shall not be relieved from the performance of any covenant or agreement in this Lease. In the event of any stoppage or interruption of services or utilities which are not obtained directly by Tenant, Landlord shall diligently attempt to resume such services or utilities as promptly as practicable. Tenant hereby waives the provisions of any applicable existing or future Law, ordinance or governmental regulation permitting the termination of this Lease due to an interruption, failure or inability to provide any services (including, without limitation, to the extent the Premises are located in California, the provisions of California Civil Code Section 1932(1)).
ARTICLE 8 - MAINTENANCE AND REPAIR
8.1.Landlord’s Repair Obligations. Except as otherwise stated in the Summary, Tenant waives the right to make repairs at Landlord’s expense under any applicable Laws (including, without limitation, to the extent the Premises are located in California, the provisions of California Civil Code Sections 1941 and 1942 and any successor statutes or laws of a similar nature). All other repair and maintenance of the Premises, Building and Property to be performed by Landlord, if any, shall be as provided in the Summary.
8.2.Tenant’s Repair Obligations. Except for Landlord’s obligations specifically set forth elsewhere in this Lease and in Section 8.1 above and in the Summary, Tenant shall at all times and at Tenant’s sole cost and expense, keep, maintain, clean, repair, preserve and replace, as necessary, the interior of the Premises and all parts thereof including, without limitation, all Tenant Improvements, Alterations, and all furniture, fixtures and equipment, including, without limitation, all computer, telephone and data cabling and equipment, Tenant’s signs, if any, door locks, closing devices, security devices, interior of windows, window sashes, casements and frames, floors and floor coverings, shelving, kitchen, restroom facilities and/or appliances of any kind located within the Premises, if any, custom lighting, and any additions and other property located within the Premises, so as to keep all of the foregoing elements of the Premises in good condition and repair, reasonable wear and tear and casualty damage excepted. Tenant shall replace, at its expense, any and all plate and other glass in and about the Premises which is damaged or broken from any cause whatsoever except due to the negligence or willful misconduct of Landlord, its agents or employees. Such maintenance and repairs shall be performed with due diligence, lien-free and in a first-class and workmanlike manner, by licensed contractor(s) that are selected by Tenant and approved by Landlord, which approval Landlord shall not unreasonably withhold or delay. All other repair and maintenance of the Premises, Building and Property to be performed by Tenant, if any, shall be as provided in the Summary. If Tenant refuses or neglects to repair and maintain the Premises properly as required hereunder to the reasonable satisfaction of Landlord, then at any time following ten (10) days from the date on which Landlord makes a written demand on Tenant to effect such repair and maintenance, Landlord may enter upon the Premises and make such repairs and/or maintenance, and upon completion thereof, Tenant agrees to pay to Landlord as Additional Rent, Landlord’s costs for making such repairs plus an amount not to exceed ten percent (10%) of such costs for overhead, within thirty (30) days after receipt from Landlord of a written itemized bill therefor. Any amounts not reimbursed by Tenant within such thirty (30) day period will bear interest at the Interest Rate until paid by Tenant.
ARTICLE 9 - USE
Tenant shall procure, at its sole cost and expense, any and all permits required by applicable Law for Tenant’s use and occupancy of the Premises. Tenant shall use the Premises solely for the Permitted Use specified in the Summary, and shall not use or permit the Premises to be used for any other use or purpose whatsoever without Landlord’s prior written approval. Tenant shall observe and comply with the Rules and Regulations attached hereto as Exhibit E, as the same may be modified by Landlord from time to time, and all reasonable non-discriminatory modifications thereof and additions thereto from time to time put into effect and furnished to Tenant by Landlord. Landlord shall endeavor to enforce the Rules and Regulations, but shall have no liability to
Tenant for the violation or non-performance by any other tenant or occupant of any such Rules and Regulations. Tenant shall not use or allow the Premises to be used for any improper, immoral, unlawful or reasonably objectionable purpose. Tenant shall not do or permit to be done anything that will obstruct or interfere with the rights of other tenants or occupants of the Building or the Property, if any, or injure or annoy them. Tenant shall not cause, maintain or permit any nuisance in, on or about the Premises, the Building or the Property, nor commit or suffer to be committed any waste in, on or about the Premises. Without limiting the foregoing, Tenant agrees that the Premises shall not be used for the use, growing, producing, processing, storing (short or long term), distributing, transporting, or selling of marijuana, cannabis, cannabis derivatives, or any cannabis containing substances (“Cannabis”), or any office uses related to the same, nor shall Tenant permit, allow or suffer, any of Tenant’s officers, employees, agents, servants, licensees, subtenants, concessionaires, contractors and invitees to bring onto the Premises, any Cannabis. Without limiting the foregoing, the prohibitions in this paragraph shall apply to all Cannabis, whether such Cannabis is legal for any purpose whatsoever under state or federal law or both. Notwithstanding anything to the contrary, any failure b y Tenant to comply with each of the terms, covenants, conditions and provisions of this paragraph relating to Cannabis shall automatically and without the requirement of any notice be a Default that is not subject to cure, and Tenant agrees that upon the occurrence of any such Default, Landlord may elect, in its sole discretion, to exercise all of its rights and remedies under this Lease, at law or in equity with respect to such Default. Furthermore Tenant is prohibited from engaging or permitting others to engage in any activity which would be a violation of any state and/or federal laws relating to the use, sale, possession, cultivation and/or distribution of any controlled substances (whether for commercial or personal purposes) regulated under any applicable law or other applicable law relating to the medicinal use and/or distribution of marijuana/Cannabis (“Prohibited Drug Law Activities”).
Tenant shall, at its sole cost and expense, observe and comply with all Laws and all requirements of any board of fire underwriters or similar body relating to (i) Tenant's particular use of the Premises, (ii) the Alterations or the Tenant Improvements in the Premises (as opposed to any pre-existing improvements in the Premises), or (iii) the Base Building, but, as to the Base Building, only to the extent such obligations are triggered by (x) Tenant's Alterations or the Tenant Improvements to the extent the same are non-general office improvements (i.e., any changes that would be required simply by “pulling a permit,” whether by Tenant, another tenant or Landlord for improvements to the Premises, would be a Landlord obligation pursuant to Section 9.3, below), or (z) Tenant’s particular use of the Premises for non-general office use. The "Base Building" shall include the structural portions of the Building, and the public restrooms, elevators, exit stairwells and the systems and equipment located in the internal core of the Building on the floor or floors on which the Premises is located.
Landlord shall comply with all applicable Laws relating to the Common Areas of the Property and Base Building, provided that compliance with such applicable Laws is not the responsibility of Tenant under this Lease (such as improvements to the Common Areas required in connection with Tenant’s particular use of the Premises for non-general office use and other requirements described in the immediately preceding paragraph), and provided further that Landlord's failure to comply therewith would prohibit Tenant from obtaining or maintaining a certificate of occupancy for the Premises, or would unreasonably and materially affect the safety of Tenant's employees or create a significant health hazard for Tenant's employees. Landlord shall be permitted to include in Operating Expenses any costs or expenses incurred by Landlord under this Section 9.3 to the extent not prohibited by the terms of Section 1.18 above.
ARTICLE 10 - HAZARDOUS MATERIALS
As used in this Lease, the term “Environmental Law(s)” means any past, present or future federal, state or local Law relating to (a) the environment, human health or safety, including, without limitation, emissions, discharges, releases or threatened releases of Hazardous Materials (as defined below) into the environment (including, without limitation, air, surface water, groundwater or land), or (b) the manufacture, generation, refining, processing, distribution, use, sale, treatment, receipt, storage, disposal, transport, arranging for transport, or handling of Hazardous Materials. As used in this Lease, the term “Hazardous Materials” means and includes any hazardous or toxic materials, substances or wastes as now or hereafter designated or regulated under any Environmental Laws including, without limitation, asbestos, petroleum, petroleum hydrocarbons and petroleum based products, urea formaldehyde foam insulation, polychlorinated biphenyls (“PCBs”), and freon and other chlorofluorocarbons. Except for ordinary and general office supplies, such as copier toner, liquid paper, glue, ink and common household cleaning materials, and motor vehicle fuel stored in fuel tanks of motor vehicles used on site in compliance with all Environmental Laws (some or all of which may constitute Hazardous Materials), and other Hazardous Materials used in connection with the Permitted Use, Tenant agrees not to cause or permit any Tenant Parties (as defined below) to cause any Hazardous Materials to be brought upon, stored, used, handled, generated, released or disposed of on, in, under or about the Premises, the Building, the Common Areas or any other portion of the Property by Tenant, its agents, officers, directors, shareholders, members, managers, partners, employees, subtenants, assignees, licensees, contractors or invitees (collectively, “Tenant’s Parties”), without the prior written consent of Landlord, which consent Landlord may withhold in its sole and absolute discretion. Upon the expiration or earlier termination of this Lease, Tenant agrees to promptly remove from the Premises, the Building and the Property, at its sole cost and expense, any and all Hazardous Materials, including any equipment or systems containing Hazardous Materials which are installed, brought upon, stored, used, generated or released upon, in, under or about the Premises, the Building and/or the Property or any portion thereof by Tenant or any of Tenant’s Parties, to the extent required by Environmental Laws. To the fullest extent permitted by law, Tenant agrees to promptly indemnify, protect, defend and hold harmless Landlord and Landlord’s members, shareholders, partners, officers, directors, managers, employees, agents, contractors, successors and assigns (collectively, “Landlord Parties”) from and against any and all claims, damages, judgments, suits, causes of action, losses, liabilities, penalties, fines, expenses and costs (including, without limitation, clean-up, removal, remediation and restoration costs, sums paid in settlement of claims, attorneys’ fees, consultant fees and expert fees and court costs) which arise or result from the presence of Hazardous Materials on, in, under or about the Premises, the Building or any other portion of the Property and which are caused by Tenant or any of Tenant’s Parties. The provisions of this Article 10 will survive the expiration or earlier termination of this Lease. Tenant shall give Landlord written notice of any evidence of Mold, water leaks or water infiltration in the Premises promptly upon discovery of same. At its expense, Tenant shall investigate, clean up and remediate any Mold in the Premises caused or exacerbated by Tenant or any of Tenant’s Parties; provided, however, that, subject to Section 19.1 below, Tenant shall have no obligation to investigate, clean up and remediate any Mold in the Premises caused by Landlord, Landlord’s Parties or any other tenant of the Building or any unaffiliated third-party. Investigation, clean up and remediation may be performed only after Tenant has Landlord’s written approval of a plan for such remediation. All clean up and remediation shall be done in compliance with all applicable Laws and to the reasonable satisfaction of Landlord. As used in this Lease, “Mold” means mold, fungi, spores, microbial matter, mycotoxins and microbiological organic compounds. Landlord represents to Tenant that to Landlord’s “actual knowledge”, as of the date hereof, no pre-existing Hazardous Materials are present at or under the Premises, the Building or the Project in violation of any applicable Environmental Laws.
ARTICLE 11 - PARKING
During the Term, Tenant shall be entitled to utilize the number and type of parking spaces specified in the Summary within the parking areas for the Property as designated by Landlord from time to time at no cost to Tenant. Landlord shall at all times have the right to establish and modify the nature and extent of the parking areas for the Building and Property (including whether such areas shall be surface, underground and/or other structures); provided, that, Tenant’s parking ratio is not reduced as a result thereof. In addition, if Tenant is not the sole occupant of the Property, Landlord may, in its discretion, designate any unreserved parking spaces as reserved parking; provided, that, Tenant’s parking ratio is not reduced as a result thereof. The terms and conditions for parking at the Property shall be as specified in the Summary and in the Rules and Regulations regarding parking as contained in Exhibit E attached hereto, as the same may be modified by Landlord from time to time. Tenant shall not use more parking spaces than its allotment and shall not use any parking spaces specifically assigned by Landlord to other tenants, if any, or for such other uses such as visitor, handicapped or other special purpose parking. Tenant’s visitors shall be entitled to access to the parking areas on the Property designated for visitor use, subject to availability of spaces and the terms of the Summary.
Notwithstanding the foregoing, Tenant shall have the right to convert up to ten (10) unreserved parking spaces to up to ten (10) reserved, exclusive electric vehicle charging stations, on a one-to-one basis, at Tenant’s sole cost and expense, in a location designated by Landlord and approved by Tenant within reasonable proximity to the Premises. Tenant, at Tenant’s sole cost and expense, in accordance with the terms and conditions of the Lease governing Alterations, shall install such electric vehicle charging stations and power upgrades to the Property as required to install such electric vehicle charging stations. Tenant shall pay to Landlord $100.00 per month for each electric vehicle charging station throughout the Term. In addition, Tenant shall have the right, subject to Landlord’s prior approval as to design and location (not to be unreasonably withheld, conditioned or delayed), at Tenant’s sole cost and expense, to designate that such electric vehicle charging stations are for Tenant’s exclusive use (via stencil, sign, or other identifier). Landlord shall have no obligation to enforce or police the exclusivity of Tenant’s electric charging stations. In the event Tenant exercises its rights under this paragraph, the parties will execute an amendment to the Lease in order to identify those spaces reserved for Tenant’s exclusive use.
ARTICLE 12 - TENANT SIGNS
Tenant shall have the right to install, at Tenant’s sole cost and expense: (i) one (1) Building standard entry sign (restricted solely to Tenant’s name and logo) on the exterior of the Building above the doorway to the Premises or such other location as may be reasonably approved by Landlord, (ii) one (1) Building-top sign (restricted solely to Tenant’s name and logo) on the exterior of the Building in a mutually agreed-upon location, and (iii) one (1) monument sign (restricted solely to Tenant’s name and logo) at the entrance of the Property in a mutually agreed-upon location, subject to the provisions of this Article 12. Subsequent changes to Tenant’s sign and/or any additional signs, to the extent permitted by Landlord herein, shall be made or installed at Tenant’s sole cost and expense. All aspects of any such signs shall be subject to the prior written consent of Landlord (which shall not be unreasonably withheld), and shall be per Landlord’s standard specifications and materials, as revised by Landlord from time to time. Tenant shall have no right to install or maintain any other signs, banners, advertising, notices, displays, stickers, decals or any other logo or identification of any person, product or service whatsoever, in any location on or in the Property except as
(i)shall have been expressly approved by Landlord in writing prior to the installation thereof (which approval may be granted or withheld in Landlord’s reasonable discretion), (ii) shall not violate any signage restrictions or exclusive sign rights contained in any then existing leases with other tenants of the Property, if any, and (iii) are consistent and compatible with all applicable Laws, and the design, signage and graphics program from time to time implemented by Landlord with respect to the Property, if any. Landlord shall have the right to remove any signs or signage material installed without Landlord’s permission, without being liable to Tenant by reason of such removal, and to charge the cost of removal to Tenant as Additional Rent hereunder, payable within ten (10) days after written demand by Landlord. Any additional sign rights of Tenant, if any, shall be as provided in the Summary. The Building top-sign and monument rights granted to Tenant under this Article 12 are personal to the original Tenant executing this Lease and any Permitted Transferee and approved Transferee in connection with an assignment of the Lease or sublease of all or substantially all of the Premises, and are not transferable to third party Transferees separate and apart from an assignment of the Lease or sublease of all or substantially all of the Premises; provided, however, that the name of any such Permitted Transferee or Transferee that desires to replace Tenant’s name on such signage is not an Objectionable Name. As used herein, “Objectionable Name” shall mean any name which relates to an entity which is of a character or reputation, or is associated with a political orientation or faction, which is inconsistent with the quality of the Building, or which would otherwise reasonably offend landlords of comparable buildings in the vicinity of the Building.
ARTICLE 13 - ALTERATIONS
13.1.Alterations. After installation of the initial Tenant Improvements for the Premises, Tenant may, at
its sole cost and expense, make alterations, additions, improvements and decorations to the Premises (“ Alteration(s)”) subject to and upon the following terms and conditions:
a.Tenant shall not make any Alterations which: (i) affect any area outside the Premises including the outside appearance, character or use of any portions of the Building or other portions of the Property;
(ii)materially and adversely affect the Building’s roof, roof membrane, any structural component or any base Building equipment, services or systems (including fire and life/safety systems), or the proper functioning thereof, or Landlord’s access thereto; (iii) in the reasonable opinion of Landlord, lessen the value of the Building or the Property; (iv) will violate or require a change in any occupancy certificate applicable to the Premises; or (v) would trigger a legal requirement which would require Landlord to make any alteration or improvement to the Premises, Building or other aspect of the Property unless Tenant agrees to perform such alterations or reimburse Landlord for the cost thereof.
b.Tenant shall not make any Alterations not prohibited by Section 13.1(a), unless Tenant first obtains Landlord’s prior written consent, which consent Landlord shall not unreasonably withhold, provided Landlord’s prior approval shall not be required for any Alterations that is not prohibited by Section 13.1(a) above and is of a cosmetic nature that satisfies all of the following conditions (hereinafter a “Pre-Approved Alteration”): (i) the costs of such Alterations do not exceed One Dollar ($1.00) per rentable square foot of the Premises; (ii) to the extent reasonably required by Landlord or by Law due to the nature of the work being performed, Tenant delivers to Landlord final plans, specifications, working drawings, permits and approvals for such Alterations at least ten (10) days prior to commencement of the work thereof; (iii) Tenant and such Alterations otherwise satisfy all other conditions set forth in this Section 13.1; and (iv) the making of such Alterations will not otherwise cause a default by Tenant under any provision of this Lease. Tenant shall provide Landlord with ten (10) days’ prior written notice before
commencing any Alterations. In addition, before proceeding with any Alteration, Tenant’s contractors shall obtain, on behalf of Tenant and at Tenant’s sole cost and expense: (A) all necessary governmental permits and approvals for the commencement and completion of such Alterations, and (B) if the cost of such Alterations exceeds $250,000.00, a completion and lien indemnity bond, or other surety satisfactory to Landlord for such Alterations. Landlord’s approval of any plans, contractor(s) and subcontractor(s) of Tenant shall not release Tenant or any such contractor(s) and/or subcontractor(s) from any liability with respect to such Alterations and will create no liability or responsibility on Landlord’s part concerning the completeness of such Alterations or their design sufficiency or compliance with Laws.
c.All Alterations shall be performed: (i) in accordance with the approved plans, specifications and working drawings, if any; (ii) lien-free and in a first-class workmanlike manner; (iii) in compliance with all building codes and Laws; (iv) in such a manner so as not to impose any additional expense upon nor materially delay Landlord in the maintenance and operation of the Building; (v) by licensed and bondable contractors,
subcontractors and vendors selected by Tenant and reasonably approved by Landlord, and (vi) at such times, in such manner and subject to such rules and regulations as Landlord may from time to time reasonably designate. Tenant shall pay to Landlord, within ten (10) days after written demand, the costs of any increased insurance premiums incurred by Landlord to include such Alterations in the causes of loss - special form property insurance obtained by Landlord pursuant to this Lease, if Landlord elects in writing to insure such Alterations; provided, however, Landlord shall not be required to include the Alterations under such insurance. If the Alterations are not included in Landlord’s insurance, Tenant shall insure the Alterations under its causes of loss-special form property insurance pursuant to this Lease. Without limitation on the foregoing, upon Landlord’s obtaining knowledge of the commencement of any alteration, change, improvement, or addition to the Premises, Landlord shall be permitted to post a timely Notice of Non-Responsibility at the Premises, which shall also be recorded in the office of the Recorder of the County in which the Building is located, all in accordance with the terms of Sections 8444 and 8060 of the California Civil Code.
d.Tenant shall pay to Landlord, as Additional Rent, the reasonable third-party costs of Landlord’s engineers and other consultants for review of all plans, specifications and working drawings for the Alterations and for any services rendered by Landlord’s management personnel and engineers to coordinate and/or supervise any of the Alterations to the extent such services are provided in excess of or after the normal on-site hours of such engineers and management personnel, within thirty (30) days after Tenant's receipt of invoices either from Landlord or such engineers, consultants, and/or management personnel; provided, however, such third party costs shall not exceed a total of Five Thousand and No/100 Dollars ($5,000.00) in connection with any particular request for Alterations, unless and to the extent (i) Landlord, in advance of incurring such costs, notifies Tenant in writing that given the particular nature and scope of the Alterations and the corresponding review and services by Landlord’s engineers and other consultants, the same is anticipated to exceed Five Thousand and No/100 Dollars ($5,000.00) and proposes an alternate budget for such costs, and (ii) Tenant thereafter approves such budget; provided further, however, if Tenant fails within five (5) business days to either affirmatively approve such proposed budget or otherwise rescind the corresponding request for Alterations, Tenant shall be deemed to have approved such proposed budget. In addition to such costs, Tenant shall pay to Landlord, within thirty (30) days after completion of any Alterations, a construction supervision fee equal to three percent (3%) of the total hard cost of the Alterations.
e.Throughout the performance of the Alterations, Tenant shall obtain, or cause its contractors to obtain, workers compensation insurance and commercial general liability insurance in compliance with the insurance provisions of this Lease.
13.2.Removal of Alterations. All Alterations and the initial Tenant Improvements in the Premises (whether installed or paid for by Landlord or Tenant), shall become the property of Landlord and shall remain upon and be surrendered with the Premises at the end of the Term; provided, however, Landlord may, by written notice delivered to Tenant concurrently with Landlord’s consent to plans for any Alterations identify those Alterations which Landlord shall require Tenant to remove at the end of the Term. If Landlord requires Tenant to remove any such Alterations, Tenant shall, at its sole cost, remove the identified items on or before the expiration or sooner termination of this Lease and repair any damage to the Premises caused by such removal to its original condition (or, if Tenant fails to so remove any such Alterations, Tenant shall pay to Landlord all of Landlord’s costs of such removal and repair). Notwithstanding anything to the contrary herein, in no event shall Tenant be required to remove the Tenant Improvements, or (2) any Alterations, other than Alterations that are Specialty Improvements. “Specialty Improvements” means any Alterations other than normal and customary general office improvements. Notwithstanding the foregoing, “Specialty Improvements” (i) shall not include conference rooms or training space and (ii) shall include (a) any Alterations which affect the Base Building, (b) any fitness facility in the Premises, and
(c)any kitchens, showers, restrooms, washrooms or similar facilities in the Premises that are not part of the Base Building.
13.2.Liens. Tenant shall not permit any mechanic’s, materialmen’s or other liens to be filed against all
or any part of the Property or the Premises, nor against Tenant’s leasehold interest in the Premises, by reason of or in connection with any repairs, alterations, improvements or other work contracted for or undertaken by Tenant or any of the Tenant’s Parties. If any such liens are filed, Tenant shall, at its sole cost, immediately cause such liens to be released of record or bonded so that such lien(s) no longer affect(s) title to the Property, the Building or the Premises. If Tenant fails to cause any such lien to be released or bonded within ten (10) days after filing thereof, Landlord may cause such lien to be released by any means it shall deem proper, including payment in satisfaction of the claim giving rise to such lien, and Tenant shall reimburse Landlord within five (5) business days after receipt of invoice from Landlord, any sum paid by Landlord to remove such liens, together with interest at the Interest Rate from the date of such payment by Landlord.
ARTICLE 14 - TENANT’S INSURANCE
14.1.Tenant’s Insurance. On or before the earlier of any Early Access Period, the Commencement Date or the date Tenant commences or causes to be commenced any work of any type in the Premises, and continuing during the entire Term, Tenant shall obtain and keep in full force and effect, the following insurance with limits of coverage as set forth in Section 1.14 of the Summary:
a.Special Form (formerly known as “all risk”) insurance, including fire and extended coverage, sprinkler leakage (including earthquake sprinkler leakage), vandalism, malicious mischief upon property of every description and kind owned by Tenant and located in the Premises or the Building, or for which Tenant is legally liable or installed by or on behalf of Tenant including, without limitation, furniture, equipment and any other personal property, and any Alterations (but excluding the initial Tenant Improvements previously existing or installed in the Premises), in an amount not less than the full replacement
cost thereof. In the event that there shall be a dispute as to the amount which comprises full replacement cost, the decision of Landlord or any Mortgagee of Landlord shall be presumptive.
b.Commercial general liability insurance coverage on an occurrence basis, including personal injury, bodily injury (including wrongful death), broad form property damage, contractual liability (including Tenant’s indemnification obligations under this Lease), and liquor liability (if Tenant serves alcohol on the Premises). The limits of liability of such commercial general liability insurance may be increased every five (5) years during the Term upon reasonable prior notice by Landlord to an amount reasonably required by Landlord and appropriate for tenants of buildings comparable to the Building.
c.Commercial Automobile Liability covering all owned, hired and non-owned automobiles.
d.Worker’s compensation, in statutory amounts and employers’ liability, covering all persons employed in connection with any work done in, on or about the Premises for which claims for death, bodily injury or illness could be asserted against Landlord, Tenant or the Premises.
e.Umbrella liability insurance on an occurrence basis, in excess of and following the form of the underlying insurance described in Section 14.1.b. and 14.1.c. and the employer’s liability coverage in Section 14.1.d. which is at least as broad as each and every area of the underlying policies. Such umbrella liability insurance shall include pay on behalf of wording, concurrency of effective dates with primary policies, blanket contractual liability, application of primary policy aggregates, and shall provide that if the underlying aggregate is exhausted, the excess coverage will drop down as primary insurance, subject to customary commercially reasonable deductible amounts imposed on umbrella policies.
f.If Tenant’s business includes professional services, Tenant shall, at Tenant’s expense, maintain in full force and effect professional liability (also known as errors and omissions insurance), covering Tenant and Tenant’s employees from work related negligence and liability in trade.
g.Loss of income, extra expense and business interruption insurance in the amount of at least 12 months of Monthly Base Rent.
h.Any other form or forms of insurance as Tenant or Landlord or any Mortgagee of Landlord may reasonably require from time to time, in form, amounts and for insurance risks against which a prudent tenant of a building similar to the Building would protect itself, but only to the extent such risks and amounts are available in the insurance market at commercially reasonable costs.
14.2.Requirements. Each policy required to be obtained by Tenant hereunder shall: (a) be issued by insurers which are reasonably approved by Landlord and/or Landlord’s Mortgagees and are authorized to do business in the state in which the Building is located and rated not less than Financial Size VII, and with a Financial Strength rating of A in the most recent version of Best’s Key Rating Guide (provided that, in any event, the same insurance company shall provide the coverages described in Sections 14.1.a. and 14.1.g. above); (b) be in form reasonably satisfactory from time to time to Landlord; (c) name Tenant as named insured thereunder and Landlord as a loss payee as to Tenant’s property insurance, as their respective interests may appear, and shall name Landlord and, at Landlord’s request, such other persons or entities of which Tenant has been informed in writing, as additional insureds as to Tenant’s commercial liability and umbrella insurance, all as their respective interests may appear; (d) not have a deductible amount exceeding One Hundred Thousand Dollars ($100,000.00), which deductible amount shall be deemed self-insured with full waiver of subrogation; (e) be primary, and any insurance carried by Landlord or any other additional insureds shall be excess and non-contributing; (f) with respect to Tenant’s property policy, include language containing an endorsement that the insurer waives its right to subrogation; (g) intentionally deleted; (h) contain a cross liability or severability of interest endorsement; and (i) be in amounts sufficient at all times to satisfy any coinsurance requirements thereof. Tenant agrees to deliver to Landlord, as soon as practicable after the placing of the required insurance, but in no event later than the date Tenant is required to obtain such insurance as set forth in Section 14.1 above, certificates from the insurance company evidencing the existence of such insurance. Tenant shall cause replacement certificates to be delivered to Landlord prior to the expiration of any such policy or policies. If any such initial or replacement certificates are not furnished within the time(s) specified herein, Landlord shall have the right, but not the obligation, to procure such policies and certificates at Tenant’s expense.
14.3.Effect on Insurance. Tenant shall not do or permit to be done anything which will (a) violate or invalidate any insurance policy or coverage maintained by Landlord or Tenant hereunder, or (b) increase the costs of any insurance policy maintained by Landlord. If Tenant’s occupancy or conduct of its business in or on the Premises (other than for the Permitted Use) results in any increase in premiums for any insurance carried by Landlord with respect to the Building or the Property, Tenant shall either discontinue the activities affecting the insurance or pay such increase as Additional Rent within ten (10) days after being billed therefor by Landlord. If any insurance coverage carried by Landlord pursuant to this Lease or otherwise with respect to the Building or the Property shall be cancelled or reduced (or cancellation or reduction thereof shall be threatened) by reason of the use or occupancy of the Premises other than as allowed by the Permitted Use by Tenant or by anyone permitted by Tenant to be upon the Premises, and if Tenant fails to remedy such condition within five (5) business days after notice thereof, Tenant shall be deemed to be in default under this Lease and Landlord shall have all remedies provided in this Lease, at law or in equity, including, without limitation, the right (but not the obligation) to enter upon the Premises and attempt to remedy such condition at Tenant’s cost.
ARTICLE 15 - LANDLORD’S INSURANCE
During the Term, Landlord shall maintain property insurance written on a Special Form (formerly known as “all risk”) basis covering the Property and the Building, including the initial Tenant Improvements (excluding, however, Tenant’s furniture, equipment and other personal property and Alterations, unless Landlord otherwise elects to insure the Alterations pursuant to Section 13.1 above) against damage by fire and standard extended coverage perils and with vandalism and malicious mischief endorsements, rental loss coverage, at Landlord’s option, earthquake damage coverage, and such additional coverage as Landlord deems appropriate. Landlord shall also carry commercial general liability in such reasonable amounts and with such reasonable deductibles as would be carried by a prudent owner of a similar building in the state in which the Building is located. At Landlord’s option, all such insurance may be carried under any blanket or umbrella policies that Landlord has in force for other buildings and projects. In addition, at Landlord’s option, Landlord may elect to self-insure all or any part of such required insurance coverage. Landlord may but shall not be obligated to carry any other form or forms of insurance as Landlord or any Mortgagee or ground lessors of Landlord may reasonably determine is advisable. The cost of insurance obtained by Landlord pursuant to this Article 15
(including self-insured amounts and commercially reasonable deductibles) shall be consistent with the cost of insurance obtained by comparable landlords of comparable office projects in the northwestern Orange County area and shall be included in Insurance Costs; provided, however, any increase in the premium for the property insurance attributable to the replacement cost of the Tenant Improvements in excess of Building standard shall not be included as Insurance Costs, but shall be paid by Tenant within thirty (30) days after receipt of an invoice from Landlord; provided further, however, to the extent that the cumulative total of any such self-insured and commercially reasonable deductible amounts includable in Insurance Costs exceed One and No/100 Dollars ($1.00) per rentable square foot in any particular calendar year, then for purposes of calculating Insurance Costs for such calendar year, the excess shall be excluded from such calendar year, but instead carried over into subsequent calendar years (although each such subsequent calendar year will, in turn, remain subject to the annual $1.00 per rentable square foot maximum inclusion provided for hereinabove).
ARTICLE 16 - INDEMNIFICATION AND EXCULPATION
16.1.Tenant’s Assumption of Risk and Waiver. Except to the extent such matter is not covered by the insurance required to be maintained by Tenant under this Lease and/or except to the extent such matter is attributable to the negligence or willful misconduct of Landlord or Landlord’s agents, contractors or employees, Landlord shall not be liable to Tenant, or any of Tenant’s Parties for: (i) any damage to property of Tenant, or of others, located in, on or about the Premises, (ii) the loss of or damage to any property of Tenant or of others by theft or otherwise,
(iii)any injury or damage to persons or property resulting from fire, explosion, falling ceiling tiles masonry, steam, gas, electricity, water, rain or leaks from any part of the Premises or from the pipes, appliance of plumbing works or from the roof, street or subsurface or from any other places or by dampness or by any other cause of whatsoever nature, (iv) any such damage caused by other tenants or persons in the Premises, occupants of any other portions of the Property, or the public, or caused by operations in construction of any private, public or quasi-public work, or (v) any interruption of utilities and services. Landlord shall in no event be liable to Tenant or any other person for any consequential, special or punitive damages or for loss of business, revenue, income or profits and Tenant hereby waives any and all claims for any such damages. Notwithstanding anything to the contrary contained in this Section 16.1, all property of Tenant and Tenant’s Parties kept or stored on the Premises, whether leased or owned by any such parties, shall be so kept or stored at the sole risk of Tenant and Tenant shall hold Landlord harmless from any claims arising out of damage to the same, including subrogation claims by Tenant’s insurance carriers. Landlord or its agents shall not be liable for interference with light or other intangible rights.
16.2.Tenant’s Indemnification. Except to the extent arising from the negligence or willful misconduct of Landlord or Landlord’s agents, contractors or employees, Tenant shall be liable for, and shall indemnify, defend, protect and hold Landlord and the Landlord Parties harmless from and against, any and all claims, damages, judgments, suits, causes of action, losses, liabilities and expenses, including, without limitation, attorneys’ fees and court costs (collectively, “Indemnified Claims”), arising or resulting from (a) any occurrence in the Premises following the date Landlord delivers possession of all or any portion of the Premises to Tenant, except to the extent caused by the negligence or willful misconduct of Landlord or Landlord’s agents, contractors or employees, (b) any act or omission of Tenant or any of Tenant’s Parties; (c) the use of the Premises, the Building and the Property and conduct of Tenant’s business by Tenant or any of Tenant’s Parties, or any other activity, work or thing done, permitted or suffered by Tenant or any of Tenant’s Parties, in or about the Premises, the Building or elsewhere on the Property; and/or (d) any default by Tenant as to any obligations on Tenant’s part to be performed under the terms of this Lease or the terms of any contract or agreement to which Tenant is a party or by which it is bound, affecting this Lease or the Premises. The foregoing indemnification shall include, but not be limited to, any injury to, or death of, any person, or any loss of, or damage to, any property on the Premises, or on adjoining sidewalks, streets or ways, or connected with the use, condition or occupancy thereof, whether or not Landlord or any Landlord Parties has or should have knowledge or notice of the defect or conditions causing or contributing to such injury, death, loss or damage. In case any action or proceeding is brought against Landlord or any Landlord Parties by reason of any such Indemnified Claims, Tenant, upon notice from Landlord, shall defend the same at Tenant’s expense by counsel approved in writing by Landlord, which approval shall not be unreasonably withheld. Tenant’s indemnification obligations under this Section 16.2 and elsewhere in this Lease shall survive the expiration or earlier termination of this Lease. Tenant’s covenants, agreements and indemnification in Section 16.1 and this Section 16.2 are not intended to and shall not relieve any insurance carrier of its obligations under policies required to be carried by Tenant pursuant to the provisions of this Lease.
16.3.Landlord’s Indemnification of Tenant. Notwithstanding anything to the contrary contained in Section 16.1 or 16.2, Tenant shall not be required to protect, defend, save harmless or indemnify Landlord from any liability for injury, loss, accident or damage to any person resulting from Landlord’s negligent acts or omissions or willful misconduct or that of its agents, contractors, servants, employees or licensees, in connection with Landlord’s activities on or about the Premises, and subject to the terms of Article 22, Landlord hereby indemnifies and agrees to protect, defend and hold Tenant harmless from and against Indemnified Claims arising out of Landlord’s grossly negligent acts or omissions or willful misconduct or those of its agents, contractors, servants, employees or licensees in connection with Landlord’s activities on or about the Premises. Such exclusion from Tenant’s indemnity and such agreement by Landlord to so indemnify and hold Tenant harmless are not intended to and shall not relieve any insurance carrier of its obligations under policies required to be carried by Tenant pursuant to the provisions of this
Lease to the extent that such policies cover (or, if such policies would have been carried as required, would have covered) the result of grossly negligent acts or omissions or willful misconduct of Landlord or those of its agents, contractors, servants, employees or licensees; provided, however, the provisions of this sentence shall in no way be construed to imply the availability of any double or duplicate coverage. Landlord’s and Tenant’s indemnification obligations hereunder may or may not be coverable by insurance, but the failure of either Landlord or Tenant to carry insurance covering the indemnification obligation shall not limit their indemnity obligations hereunder.
ARTICLE 17 - CASUALTY DAMAGE/DESTRUCTION
17.1.Landlord’s Rights and Obligations. If the Premises or the Building is damaged by fire or other casualty not caused by the gross negligence or willful misconduct of Tenant (“Casualty”) to an extent not exceeding twenty-five percent (25%) of the full replacement cost thereof, and Landlord’s contractor estimates in writing delivered to the parties (the “Restoration Estimate”) that the damage thereto is such that the Building and/or Premises may be repaired, reconstructed or restored to substantially its condition immediately prior to such damage within twelve (12) months from the date of such Casualty, and Landlord will receive insurance proceeds sufficient to cover the costs of such repairs, reconstruction and restoration (including proceeds from Tenant and/or Tenant’s insurance which Tenant is required to deliver to Landlord pursuant to this Lease), then Landlord shall commence and proceed diligently with the work of repair, reconstruction and restoration and this Lease shall continue in full force and effect. If, however, the Premises or the Building is damaged to an extent exceeding twenty-five percent (25%) of the full replacement cost thereof, or Landlord’s contractor estimates that such work of repair, reconstruction and
restoration will require longer than twelve (12) months to complete from the date of Casualty, or Landlord will not receive insurance proceeds (and/or proceeds from Tenant, as applicable) sufficient to cover the costs of such repairs, reconstruction and restoration, then Landlord may elect to either: (a) repair, reconstruct and restore the portion of the Premises or Building damaged by such Casualty (including the Tenant Improvements, the Alterations that Landlord elects to insure pursuant to Section 13.1 and, to the extent of insurance proceeds received from T enant, the Alterations that Tenant is required to insure pursuant to Section 13.1), in which case this Lease shall continue in full force and effect; or (b) terminate this Lease effective as of the date which is thirty (30) days after Tenant’s receipt of Landlord’s election to so terminate; provided that Landlord shall only have the right to terminate this Lease if Landlord also terminates the leases of all other similarly situated tenants at the Property for which Landlord has termination rights. Under any of the conditions of this Section 17.1, Landlord shall give written notice to Tenant of its intention to repair or terminate within the later of sixty (60) days after the occurrence of such Casualty, or fifteen (15) days after Landlord’s receipt of the estimate from Landlord’s contractor or, as applicable, thirty (30) days after Landlord receives approval from Landlord’s Mortgagee to rebuild.
17.2.Tenant’s Costs and Insurance Proceeds. In the event of any damage or destruction of all or any part of the Premises, Tenant shall immediately: (a) notify Landlord thereof; and (b) if Landlord elects or is required to repair the Premises pursuant to Section 17.1, deliver to Landlord all insurance proceeds received by Tenant with respect to the Tenant Improvements and Alterations (to the extent such items are not covered by Landlord’s casualty insurance) and with respect to Alterations in the Premises that Tenant is required to insure pursuant to Section 13.1, excluding proceeds for Tenant’s furniture and other personal property, and Tenant hereby assigns to La ndlord all rights to receive such insurance proceeds. If, for any reason (including Tenant’s failure to obtain insurance for the full replacement cost of any Alterations which Tenant is required to insure pursuant to Section 13.1 hereof), Tenant fails to receive insurance proceeds covering the full replacement cost of such Alterations which are damaged, Tenant shall be deemed to have self-insured the replacement cost of such Alterations, and upon any damage or destruction thereto, if Landlord elects or is required to repair the Premises pursuant to Section 17.1, Tenant shall immediately pay to Landlord the full replacement cost of such items, less any insurance proceeds actually received by Landlord from Landlord’s or Tenant’s insurance with respect to such items.
17.3.Abatement of Rent. If as a result of any such damage, repair, reconstruction and/or restoration of the Premises or the Building, Tenant is prevented from using, and does not use, the Premises or any portion thereof, then Rent shall be equitably abated or reduced, as the case may be, during the period that Tenant continues to be so prevented from using and does not use the Premises or portion thereof, in the proportion that the rentable square feet of the portion of the Premises that Tenant is prevented from using, and does not use, bears to the total rentable square feet of the Premises. Notwithstanding the foregoing to the contrary, if the damage is due to the gross negligence or willful misconduct of Tenant or any of Tenant’s Parties, there shall be no abatement of Rent. Except for abatement of Rent as provided hereinabove, Tenant shall not be entitled to any compensation or damages for loss of, or interference with, Tenant’s business or use or access of all or any part of the Premises resulting from any such damage, repair, reconstruction or restoration.
17.4.Inability to Complete. Notwithstanding anything to the contrary contained in this Article 17, if Landlord is obligated or elects to repair, reconstruct and/or restore the damaged portion of the Building or Premises pursuant to Section 17.1 above, but is delayed from completing such repair, reconstruction and/or restoration beyond the date which is six (6) months after the date estimated by Landlord’s contractor for completion thereof pursuant to Section 17.1, by reason of any causes beyond the reasonable control of Landlord (including, without limitation, delays due to Force Majeure (not to exceed thirty (30) days), and delays caused by Tenant or any of Tenant’s Parties), then Landlord and Tenant may elect to terminate this Lease upon thirty (30) days’ prior written notice to the other party; provided, however, if Landlord completes such repair, reconstruction and/or restoration prior to the expiration of such thirty (30) day notice period, then the Lease shall not terminate, and Tenant’s election to terminate the Lease in accordance with this sentence shall be null, void and of no further force and effect.
17.5.Damage to the Property. If there is a total destruction of the improvements on the Property or partial destruction of such improvements, the cost of restoration of which would exceed one-third (1/3) of the then replacement value of all improvements on the Property, by any cause whatsoever, whether or not insured against and whether or not the Premises are partially or totally destroyed, Landlord may within a period of one hundred eighty (180) days after the occurrence of such destruction, notify Tenant in writing that it elects not to so reconstruct or restore such improvements, in which event this Lease shall cease and terminate as of the date of such destruction.
17.6.Damage Near End of Term. In addition to its termination rights in Sections 17.1, 17.4 and 17.5 above, Landlord shall have the right to terminate this Lease if any damage to the Building or Premises occurs during the last twelve (12) months of the Term and Landlord’s contractor estimates in writing delivered to the parties that the repair, reconstruction or restoration of such damage cannot be completed within the earlier of (a) the scheduled expiration date of the Term, or (b) ninety (90) days after the date of such Casualty.
17.7.Tenant’s Termination Right. In the event of any damage or destruction which affects Tenant's use and enjoyment of the Premises, if the Restoration Estimate states that the damage cannot be restored by Landlord within two hundred seventy (270) days from the date of the Casualty, Tenant shall have the right to terminate this Lease upon written notice to Landlord given within thirty (30) days after receipt of the Restoration Estimate, unless Landlord completes the restoration within said 30-day notice period, in which case this Lease shall continue in full force and effect.
17.8.Waiver of Termination Right. This Lease sets forth the terms and conditions upon which this Lease may terminate in the event of any damage or destruction. Accordingly, except as expressly provided herein, Tenant hereby waives any and all provisions of applicable Law that provide alternative rights for the parties in the event of damage or destruction (including, without limitation, to the extent the Premises are located in California, the provisions of California Civil Code Section 1932, Subsection 2, and Section 1933, Subsection 4 and any successor statute or laws of a similar nature).
ARTICLE 18 - CONDEMNATION
18.1.Substantial or Partial Taking. Subject to the provisions of Section 18.3 below, either party may terminate this Lease if any material part of the Premises is taken or condemned for any public or quasi-public use under law, by eminent domain or private purchase in lieu thereof (a “Taking”). Landlord shall also have the right to terminate this Lease if there is a Taking of any portion of the Building or the Property which would have a material adverse effect on Landlord’s ability to profitably operate the remainder of the Building and/or the Property. The terminating party shall provide written notice of termination to the other
party within thirty (30) days after it first receives notice of the Taking. The termination shall be effective as of the effective date of any order granting possession to, or vesting legal title in, the condemning authority. If this Lease is not terminated, Base Rent and all other elements of this Lease which are dependent upon the area of the Premises, the Building or the Property shall be appropriately adjusted to account for any reduction in the square footage of the Premises, Building or Property, as applicable. All compensation awarded for a Taking shall be the property of Landlord. The right to receive compensation or proceeds are expressly waived by Tenant, however, Tenant may file a separate claim for Tenant’s furniture, fixtures, equipment, and other personal property, Tenant Improvements (to the extent of any out of pocket costs paid by Tenant and not applied against the Allowance), Alterations paid for by Tenant, loss of goodwill and Tenant’s reasonable relocation expenses.
18.2.Condemnation Award. Subject to the provisions of Section 18.3 below, in connection with any Taking of the Premises or the Building, Landlord shall be entitled to receive the entire amount of any award which may be made or given in such taking or condemnation, without deduction or apportionment for any estate or interest of Tenant, it being expressly understood and agreed by Tenant that no portion of any such award shall be allowed or paid to Tenant for any so-called bonus or excess value of this Lease, and such bonus or excess value shall be the sole property of Landlord. Tenant shall not assert any claim against Landlord or the taking authority for any compensation because of such taking (including any claim for bonus or excess value of this Lease); provided, however, if any portion of the Premises is taken, Tenant shall be granted the right to recover from the condemning authority (but not from Landlord) any compensation as may be separately awarded or recoverable by Tenant for the taking of Tenant’s furniture, fixtures, equipment and other personal property within the Premises, Tenant Improvements (to the extent of any out of pocket costs paid by Tenant and not applied against the Allowance), Alterations paid for by Tenant, for Tenant’s relocation expenses, and for any loss of goodwill or other damage to Tenant’s business by reason of such taking.
18.3.Temporary Taking. In the event of a Taking of the Premises or any part thereof for temporary use, (a) this Lease shall be and remain unaffected thereby and Rent shall not abate, and (b) Tenant shall be entitled to receive for itself such portion or portions of any award made for such use with respect to the period of the taking which is within the Term, provided that if such taking shall remain in force at the expiration or earlier termination of this Lease, Tenant shall perform its obligations with respect to surrender of the Premises and shall pay to Landlord the portion of any award which is attributable to any period of time beyond the Term expiration date. For purpose of this Section 18.3, a temporary taking shall be defined as a taking for a period of two hundred seventy (270) days or less.
18.4.Waiver. Tenant hereby waives any rights it may have pursuant to any applicable Laws (including, without limitation, to the extent the Premises are located in California, any rights Tenant might otherwise have pursuant to Section 1265.130 of the California Code of Civil Procedure) and agrees that the provisions hereof shall govern the parties’ rights in the event of any Taking.
ARTICLE 19 - WAIVER OF CLAIMS; WAIVER OF SUBROGATION
19.1.Waiver of Subrogation. Notwithstanding anything to the contrary herein, Landlord and Tenant hereby waive their rights against the other party for any claims or damages or losses, including any deductibles and self-insured amounts, which are caused by or result from (a) any occurrence insured under any property insurance policy carried by Landlord or Tenant, or (b) any occurrence which would have been covered under any property insurance required to be obtained and maintained by Landlord or Tenant under this Lease had such insurance been obtained and maintained as required. The foregoing waiver shall be in addition to, and not a limitation of, any other waivers or releases contained in this Lease. All of Landlord's and Tenant's repair and indemnity obligations in this Lease shall be subject to the release contained in this Section 19.1.
19.2.Waiver of Insurers. Tenant shall cause each property insurance policy carried by Tenant to provide that the insurer waives all rights of recovery by way of subrogation against Landlord, in connection with any claims, losses and damages covered by such policy. If Tenant fails to maintain insurance for an insurable loss, such loss shall be deemed to be self-insured with a deemed full waiver of subrogation as set forth in the immediately preceding sentence.
ARTICLE 20 - ASSIGNMENT AND SUBLETTING
20.1.Restriction on Transfer. Except with respect to a Permitted Transfer pursuant to Section 20.6 below, Tenant shall not, without the prior written consent of Landlord, which consent Landlord will not unreasonably withhold or delay, assign this Lease or any interest herein or sublet the Premises or any part thereof, or permit the use or occupancy of the Premises by any party other than Tenant (any such assignment, encumbrance, sublease, license or the like being sometimes referred to as a “Transfer”). In no event may Tenant encumber or hypothecate this Lease or the Premises. This prohibition against Transfers shall be construed to include a prohibition against any assignment or subletting by operation of law. Any Transfer without Landlord’s consent (except for a Permitted Transfer pursuant to Section 20.6 below) shall constitute a default by Tenant under this Lease, and in addition to all of Landlord’s other remedies at law, in equity or under this Lease, such Transfer shall be voidable at Landlord’s election. For purposes of this Article 20, other than with respect to a Permitted Transfer under Section 20.6 and transfers of stock of Tenant if Tenant is a publicly-held corporation and such stock is transferred publicly over a recognized security exchange or over-the-counter market, if Tenant is a corporation, partnership or other entity, any transfer, assignment, encumbrance or hypothecation of fifty percent (50%) or more (individually or in the aggregate) of any stock or other ownership interest in such entity (each, a “Change of Control”), shall be deemed an assignment of this Lease and shall be subject to all of the restrictions and provisions contained in this Article 20.
20.2.Landlord’s Options. If Tenant desires to effect a Transfer, then at least thirty (30) days prior to the date when Tenant desires the Transfer to be effective (the “Transfer Date”), Tenant shall deliver to Landlord written notice (“Transfer Notice”) setting forth the terms and conditions of the proposed Transfer and the identity of the proposed assignee, sublessee or other transferee (sometimes referred to hereinafter as a “Transferee”). Tenant shall also deliver to Landlord with the Transfer Notice, a current financial statement and such evidence of financial responsibility and standing as Landlord may reasonably require of the Transferee which have been certified by a financial officer of such Transferee and or audited by a reputable independent accounting firm (if such is the normal practice of such Transferee), and such other information concerning the business background and financial condition of the proposed Transferee as Landlord may reasonably request. Except with respect to a Permitted Transfer, within fifteen (15) days after Landlord’s receipt of any Transfer Notice, and any additional information requested by Landlord pursuant to this Section 20.2, Landlord will notify Tenant of its election to do one of the following: (a) consent to the proposed Transfer subject to such reasonable conditions as Landlord may impose in providing such consent; (b) refuse such consent, which refusal shall be on reasonable grounds; or (c) terminate this Lease and recapture the Premises for reletting by Landlord, which termination shall be effective as of the proposed Transfer Date. Notwithstanding the foregoing, Landlord may
only terminate the Lease and recapture the Premises in the event Tenant desires to effect a Transfer of the entire Premises for substantially all of the remaining Term of the Lease.
20.3.Additional Conditions; Excess Rent. A condition to Landlord’s consent to any Transfer will be the delivery to Landlord of a true copy of the fully executed instrument of assignment, sublease, transfer or hypothecation, in form and substance reasonably satisfactory to Landlord, an original of Landlord’s standard consent form executed by both Tenant and the proposed Transferee, and an affirmation of guaranty in form satisfactory to Landlord executed by each guarantor of this Lease, if any. In addition, Tenant shall pay to Landlord as Additional Rent within thirty (30) days after receipt thereof, without affecting or reducing any other obligations of Tenant hereunder, fifty percent (50%) of any rent or other economic consideration received by Tenant as a result of any Transfer which exceeds, in the aggregate, (i) the total Rent which Tenant is obligated to pay Landlord under this Lease (prorated to reflect obligations allocable to any portion of the Premises subleased) for the applicable period, plus (ii) any reasonable brokerage commissions and attorneys’ fees actually paid by Tenant in connection with such Transfer, (iii) the cost of any changes, alterations and improvements to the Premises performed by Tenant in connection with such Transfer, and (iv) the amount of any free base rent reasonably provided to such Transferee. If Tenant effects a Transfer or requests the consent of Landlord to any Transfer (whether or not such Transfer is consummated), then, upon demand, and as a condition precedent to Landlord’s consideration of the proposed assignment or sublease, Tenant agrees to pay Landlord a non-refundable administrative fee of Five Hundred Dollars ($500.00), plus Landlord’s reasonable attorneys’ and paralegal fees and other costs incurred by Landlord in reviewing such proposed assignment or sublease (whether attributable to Landlord’s in-house attorneys or paralegals or otherwise), in an amount not to exceed Three Thousand Dollars ($3,000) for a transfer in the ordinary course of business. Acceptance of the Five Hundred Dollar ($500.00) administrative fee and/or reimbursement of Landlord’s attorneys’ and/or paralegal fees shall in no event obligate Landlord to consent to any proposed Transfer.
20.4.Reasonable Disapproval. Without limiting in any way Landlord’s right to withhold its consent on any reasonable grounds, it is agreed that Landlord will not be acting unreasonably in refusing to consent to a Transfer if, in Landlord’s reasonable opinion: (a) the proposed Transfer would result in more than three subleases of portions of the Premises being in effect at any one time during the Term; (b) the net worth or financial capabilities of a proposed assignee or subtenant is insufficient to meet the obligations assumed under this Lease or a sublease; (c) the proposed Transferee is an existing tenant of the Building or Property or is negotiating with Landlord (or has negotiated with
Landlord in the last six (6) months) for space in the Building or the Property (as demonstrated by an exchange of proposals or other negotiations during the preceding six (6) month period) and, in either case, Landlord has reasonably comparable space at the Property available; (d) the proposed Transferee is a governmental entity; (e) the portion of the Premises to be sublet or assigned is irregular in shape with inadequate means of ingress and egress; (f) the proposed Transfer involves a change of use of the Premises or would violate any exclusive use covenant to which Landlord is bound; (g) the Transfer would likely result in significant increase in the use of the parking areas by the Transferee’s employees or visitors, and/or significantly increase the demand upon utilities and services to be provided by Landlord to the Premises; or (h) the Transferee is not in Landlord’s reasonable opinion of reputable or good character or consistent with Landlord’s desired tenant mix for the Building.
20.5.No Release. No Transfer, occupancy or collection of rent from any proposed Transferee shall be deemed a waiver on the part of Landlord, or the acceptance of the Transferee as Tenant and no Transfer shall release Tenant of Tenant’s obligations under this Lease or alter the primary liability of Tenant to pay Rent and to perform all other obligations to be performed by Tenant hereunder. Following a default beyond any applicable notice and cure periods by Tenant, Landlord may require that any Transferee remit directly to Landlord on a monthly basis, all monies due Tenant by said Transferee, and each sublease shall provide that if Landlord gives said sublessee written notice that Tenant is in default under this Lease, said sublessee will thereafter make all payments due under the sublease directly to or as directed by Landlord, which payments will be credited against any payments due under this Lease. Tenant hereby irrevocably and unconditionally assigns to Landlord all rents and other sums payable under any sublease of the Premises; provided, however, that Landlord hereby grants Tenant a license to collect all such rents and other sums so long as Tenant is not in default beyond applicable notice and cure periods under this Lease. Consent by Landlord to one Transfer shall not be deemed consent to any subsequent Transfer. In the event of default by any Transferee of Tenant or any successor of Tenant in the performance of any of the terms hereof, Landlord may proceed directly against Tenant without the necessity of exhausting remedies against such Transferee or successor. Landlord may consent to subsequent assignments of this Lease or sublettings or amendments or modifications to this Lease with assignees of Tenant, without notifying Tenant, or any successor of Tenant, and without obtaining its or their consent thereto and any such actions shall not relieve Tenant of liability under this Lease. To the extent the Premises are located in California, Tenant hereby waives (for itself and all persons claiming under Tenant) the provisions of Civil Code Section 1995.310.
20.6.Permitted Transfers. Notwithstanding the provisions of Section 20.1 above to the contrary, provided that Tenant is not then in default beyond applicable notice and cure periods, Tenant may assign this Lease or sublet the Premises or any portion thereof (herein, a “Permitted Transfer”), without Landlord’s consent and without being subject to the profit sharing or recapture provisions set forth in Sections 20.2 and 20.3 above, to any entity that controls, is controlled by or is under common control with Tenant, or to any entity resulting from a merger or consolidation with Tenant, or to any person or entity which acquires all or substantially all of the assets or equity interest of Tenant’s business as a going concern (each, a “Permitted Transferee”), provided that: (a) at least thirty (30) days prior to such assignment or sublease, Tenant delivers to Landlord a reasonably detailed description of the proposed Transfer and the financial statements and other financial and background information of the assignee or sublessee described in Section 20.2 above; (b) in the case of an assignment, the assignee assumes, in full, the obligations of Tenant under this Lease (or in the case of a sublease, the sublessee of a portion of the Premises or Term assumes, in full, the obligations of Tenant with respect to such portion) pursuant to an assignment and assumption agreement (or a sublease, as applicable) reasonably acceptable to Landlord, a fully executed copy of which is delivered to Landlord within thirty (30) days following the effective date of such assignment or subletting; (c) each guarantor of this Lease executes a reaffirmation of its guaranty in form satisfactory to Landlord; (d) the tangible net worth and ongoing profitability of the assignee or sublessee is demonstrably sufficient to satisfy Tenant’s remaining obligations under this Lease; (e) Tenant remains fully liable under this Lease; (f) the use of the Premises is pursuant to Section 1.10 of this Lease; (g) such transaction is not entered into as a subterfuge to avoid the restrictions and provisions of this Article 20 and will not violate any exclusive use covenant to which Landlord is bound; and (h) with respect to a subletting only, Tenant and such Permitted Transferee execute Landlord’s standard consent to sublease form; and (i) Tenant is not in default beyond all applicable notice and cure periods under this Lease. In addition, a Change of Control shall be deemed a Permitted Transfer and shall be permitted without Landlord's consent and without being subject to the profit sharing or recapture provisions set forth in Sections 20.2 and 20.3 above, provided that Tenant satisfies the conditions of subparts (a)-(i), above.
ARTICLE 21 - SURRENDER AND HOLDING OVER
21.1.Surrender of Premises. Upon the expiration or sooner termination of this Lease, Tenant shall surrender all keys for the Premises and exclusive possession of the Premises to Landlord broom clean and in the condition and repair received and thereafter improved, excepting reasonable wear and tear, casualty damage which is not Tenant’s obligation to repair hereunder, and maintenance, repair, and replacement obligations that are Landlord’s express obligations under this Lease, with all of Tenant’s personal property, electronic, fiber, phone and data cabling and related equipment that is installed by or for the exclusive benefit of Tenant (other than those items installed in connection with the Tenant Improvements) and those items, if any, of Alterations identified by Landlord pursuant to Section 13.2, removed therefrom and all damage caused by such removal repaired. Notwithstanding the foregoing, Tenant shall not be required to remove or restore the loading doors in the Premises, or any of the initial Landlord Improvements or Tenant Improvements at the expiration or earlier termination of this Lease. If Tenant fails to remove by the expiration or sooner termination of this Lease all of its personal property and Alterations identified by Landlord for removal pursuant to Section 13.2, Landlord may, (without liability to Tenant for loss thereof), at Tenant’s sole cost and in addition to Landlord’s other rights and remedies under this Lease, at law or in equity: (a) remove and store such items in accordance with applicable Law; and/or (b) upon ten (10) days’ prior notice to Tenant, sell all or any such items at private or public sale for such price as Landlord may obtain as permitted under applicable Law. Landlord shall apply the proceeds of any such sale to any amounts due to Landlord under this Lease from Tenant (including
Landlord’s attorneys’ fees and other costs incurred in the removal, storage and/or sale of such items), with any remainder to be paid to Tenant.
21.2.Holding Over. Tenant will not be permitted to hold over possession of the Premises after the expiration or earlier termination of the Term without the express written consent of Landlord, which consent Landlord may withhold in its sole and absolute discretion. If Tenant holds over after the expiration or earlier termination of the Term with or without the express written consent of Landlord, then, in addition to all other remedies available to Landlord, Tenant shall become a tenant at sufferance only, upon the terms and conditions set forth in this Lease so far as applicable (including Tenant’s obligation to pay all Additional Rent under this Lease), but at a Monthly Base Rent equal to one hundred twenty-five percent (125%) of the Monthly Base Rent applicable to the Premises immediately prior to the date of such expiration or earlier termination for the first two months of such holdover and one hundred fifty percent (150%) thereafter. Any such holdover Rent shall be paid on a per month basis without reduction for partial months during the holdover. Acceptance by Landlord of Rent after such expiration or earlier termination shall not constitute consent to a hold over hereunder or result in an extension of this Lease. This Section 21.2 shall not be construed to create any express or implied right to holdover beyond the expiration of the Term or any extension thereof. If Tenant holds over possession of the Premises for a period in excess of sixty (60) days following the expiration of the Term or any extension thereof, without Landlord’s consent, Tenant shall be liable, and shall pay to Landlord within ten (10) days after demand, for all losses incurred by Landlord as a result of such holdover, and shall indemnify, defend and hold Landlord and the Landlord Parties harmless from and against all liabilities, damages, losses, claims, suits, costs and expenses (including reasonable attorneys’ fees and costs) arising from or relating to any such holdover tenancy, including without limitation, any claim for damages made by a succeeding tenant. Tenant’s indemnification obligation hereunder shall survive the expiration or earlier termination of this Lease. The foregoing provisions of this Section 21.2 are in addition to, and do not affect, Landlord’s right of re -entry or any other rights of Landlord hereunder or otherwise at law or in equity.
ARTICLE 22 - DEFAULTS
22.1.Tenant’s Default. The occurrence of any one or more of the following events shall constitute a “Default” under this Lease by Tenant:
a.the abandonment of the Premises by Tenant. “Abandonment” is defined pursuant to
applicable Law;
b.the failure by Tenant to make any payment of Rent, Additional Rent or any other payment required to be made by Tenant hereunder, where such failure continues for three (3) business days after written notice thereof from Landlord that such payment was not received when due;
c.the failure by Tenant to observe or perform any of the express or implied covenants or provisions of this Lease to be observed or performed by Tenant, other than as specified in Sections 22.1(a) or (b) above, where such failure shall continue for a period of thirty (30) days after written notice thereof from Landlord to Tenant; provided, however, that if the nature of Tenant’s default is such that it may be cured but more than thirty (30) days are reasonably required for its cure, then Tenant shall not be deemed to be in default if Tenant shall commence such cure within said thirty (30) day period and thereafter diligently prosecute such cure to completion, which completion shall occur not later than sixty (60) days from the date of such notice from Landlord; or
d.A general assignment by Tenant or any guarantor or surety of Tenant’s obligations hereunder (“Guarantor”) for the benefit of creditors;
e.The filing of a voluntary petition in bankruptcy by Tenant or any Guarantor, the filing by Tenant or any Guarantor of a voluntary petition for an arrangement, the filing by or against Tenant or any Guarantor of a petition, voluntary or involuntary, for reorganization, or the filing of an involuntary petition by the creditors of Tenant or any Guarantor, said involuntary petition remaining undischarged for a period of one hundred twenty (120) days;
f.Receivership, attachment, or other judicial seizure of substantially all of Tenant’s assets on the Premises, such attachment or other seizure remaining undismissed or undischarged for a period of thirty (30) days after the levy thereof;
g.Death or disability of Tenant or any Guarantor, if Tenant or such Guarantor is a natural person, or the failure by Tenant or any Guarantor to maintain its legal existence (other than pursuant to a Permitted Transfer), if Tenant or such Guarantor is a corporation, partnership, limited liability company, trust or other legal entity.
Any notice sent by Landlord to Tenant pursuant to this Section 22.1 shall be in lieu of, and not in addition to, any notice required under any applicable Law.
ARTICLE 23 - REMEDIES OF LANDLORD
23.1.Landlord’s Remedies; Termination. In the event of any such Default by Tenant, in addition to any other remedies available to Landlord under this Lease, at law or in equity (including, without limitation, to the extent the Premises are located in California, the remedies of Civil Code Section 1951.4 and any successor statute or similar Law, which provides that Landlord may continue this Lease in effect following Tenant’s breach and abandonment and collect rent as it falls due, if Tenant has the right to sublet or assign, subject to reasonable limitations), Landlord shall have the immediate option to terminate this Lease and all rights of Tenant hereunder and
to re-enter the Premises and remove all persons and property from the Premises; such property may be removed, stored and/or disposed of as permitted by applicable Law. If Landlord shall elect to so terminate this Lease, then Landlord may recover from Tenant: (a) the worth at the time of award of any unpaid Rent which had been earned at the time of such termination; plus (b) the worth at the time of the award of the amount by which the unpaid Rent which would have been earned after termination until the time of award exceeds the amount of such rental loss that Tenant proves could have been reasonably avoided; plus (c) the worth at the time of award of the amount by which the unpaid Rent for the balance of the term after the time of award exceeds the amount of such rental loss that Tenant proves could be reasonably avoided; plus (d) any other amount necessary to compensate Landlord for all the detriment proximately caused by Tenant’s failure to perform its obligations under this Lease or which, in the ordinary course of things, would be likely to result therefrom including, but not limited to: the total unamortized sum of any Abated Amount (amortized on a straight line basis over the initial Term of this Lease), tenant improvement costs, and brokers’ commissions; attorneys’ fees; any costs required to return the Premises to the condition required at the end of the Term; the costs of refurbishment, alterations, renovation and repair of the Premises; and removal (including the repair of any damage caused by such removal) and storage (or disposal) of Tenant’s personal property, equipment, fixtures, Alterations, Tenant Improvements and any other items which Tenant is required under this Lease to remove but does not remove; plus (e) all other monetary damages allowed under applicable Law.
As used in Sections 23.1(a) and 23.1(b) above, the “worth at the time of award” is computed by allowing interest at the Interest Rate set forth in the Summary. As used in Section 23.1(c) above, the “worth at the time of award” is computed by discounting such amount at the discount rate of the Federal Reserve Bank of San Francisco at the time of award plus one percent (1%). To the extent the Premises are located in California, Tenant hereby waives for Tenant and all those claiming under Tenant all right now or hereafter existing including, without limitation, any rights under California Code of Civil Procedure Sections 1174 and 1179 and Civil Code Section 1950.7 to redeem by order or judgment of any court or by any legal process or writ, Tenant’s right of occupancy of the Premises after any termination of this Lease.
23.2.Landlord’s Remedies; Continuation of Lease; Re-Entry Rights. In the event of any such Default by Tenant, in addition to any other remedies available to Landlord under this Lease, at law or in equity, Landlord shall also have the right to (a) continue this Lease in effect after Tenant’s breach and abandonment and recover Rent as it becomes due, and (b) with or without terminating this Lease, to re-enter the Premises and remove all persons and property from the Premises; such property may be removed, stored and/or disposed of as permitted by applicable Law. No re-entry or taking possession of the Premises by Landlord pursuant to this Section 23.2, and no acceptance of surrender of the Premises or other action on Landlord’s part, shall be construed as an election to terminate this Lease unless a written notice of such intention be given to Tenant or unless the termination thereof be decreed by a court of competent jurisdiction. No notice from Landlord or notice given under a forcible entry and detainer statute or similar Laws will constitute an election by Landlord to terminate this Lease unless such notice specifically so states. Notwithstanding any reletting without termination by Landlord because of any Default, Landlord may at any time after such reletting elect to terminate this Lease for any such Default.
23.3.Landlord’s Right to Perform. Except as specifically provided otherwise in this Lease, all covenants and agreements by Tenant under this Lease shall be performed by Tenant at Tenant’s sole cost and expense and without any abatement or offset of Rent. In the event of any Default by Tenant, Landlord may, without waiving or releasing Tenant from any of Tenant’s obligations, make such payment or perform such other act as required to cure such Default on behalf of Tenant. All sums so paid by Landlord and all necessary incidental costs incurred by Landlord in performing such other acts shall be payable by Tenant to Landlord within five (5) days after demand therefor as Additional Rent.
23.4.Rights and Remedies Cumulative. All rights, options and remedies of Landlord contained in this Article 23 and elsewhere in this Lease shall be construed and held to be cumulative, and no one of them shall be exclusive of the other, and Landlord shall have the right to pursue any one or all of such remedies or any other remedy or relief which may be provided by law or in equity, whether or not stated in this Lease. Nothing in this Article 23 shall be deemed to limit or otherwise affect Tenant’s indemnification of Landlord pursuant to any provision of this Lease.
23.5.Costs Upon Default and Litigation. Tenant shall pay to Landlord and its Mortgagee as Additional Rent all the expenses incurred by Landlord or its Mortgagee in connection with any default by Tenant hereunder or the exercise of any remedy by reason of any default by Tenant hereunder, including reasonable attorneys’ fees and expenses. If Landlord or its Mortgagee shall be made a party to any litigation commenced against Tenant or any litigation pertaining to this Lease or the Premises, at the option of Landlord and/or its Mortgagee, Tenant, at its expense, shall provide Landlord and/or its Mortgagee with counsel approved by Landlord and/or its Mortgagee and shall pay all costs incurred or paid by Landlord and/or its Mortgagee in connection with such litigation.
ARTICLE 24 - ENTRY BY LANDLORD
Landlord and its employees and agents shall at all reasonable times and upon giving Tenant reasonable notice of its election to do so (except in case of an emergency and to perform regularly scheduled services in which event no notice shall be required), have the right to enter the Premises to inspect the same, to supply any service required to be provided by Landlord to Tenant under this Lease, to exhibit the Premises to prospective lenders or purchasers (or during the last year of the Term or during any Default by Tenant, to prospective tenants), to post notices of nonresponsibility, and/or to alter, improve or repair the Premises or any other portion of the Building or Property, all without being deemed guilty of or liable for any breach of Landlord’s covenant of quiet enjoyment or any eviction of Tenant, and without abatement of Rent. In exercising such entry rights, Landlord shall comply with Tenant’s reasonable security measures (of which Landlord is informed in advance) and shall endeavor to minimize, to the extent reasonably practicable, the interference with Tenant’s business, and shall provide Tenant with one (1) business day advance notice (oral or written) of such entry (except in emergency situations and for scheduled services). For each of the foregoing purposes, Landlord shall at all times have and retain a key with which to unlock all of the doors in, upon and about the Premises, excluding Tenant’s vaults and safes, and Landlord shall have the means which Landlord may deem proper to open
said doors in an emergency in order to obtain entry to the Premises. Any entry to the Premises obtained by Landlord pursuant to this Article 24 by any of said means or otherwise shall not under any circumstances be construed or deemed to be a forcible or unlawful entry into, or a detainer of, the Premises, or an eviction of Tenant from the Premises or any portion thereof, or grounds for any abatement or reduction of Rent and Landlord shall not have any liability to Tenant for any damages or losses on account of any such entry by Landlord.
ARTICLE 25 - LIMITATION ON LANDLORD’S LIABILITY
Notwithstanding anything contained in this Lease to the contrary, the obligations of Landlord under this Lease (including as to any actual or alleged breach or default by Landlord) do not constitute personal obligations of the individual members, managers, investors, partners, directors, officers, or shareholders of Landlord or Landlord’s members or partners, and Tenant shall not seek recourse against the individual members, managers, investors, partners, directors, officers, or shareholders of Landlord or Landlord’s members or partners or any other p ersons or entities having any interest in Landlord, or any of their personal assets for satisfaction of any liability with respect to this Lease. In addition, in consideration of the benefits accruing hereunder to Tenant and notwithstanding anything contained in this Lease to the contrary, Tenant hereby covenants and agrees for itself and all of its successors and assigns that the liability of Landlord for its obligations under this Lease (including any liability as a result of any actual or alleged failure, breach or default hereunder by Landlord), shall be limited solely to, and Tenant’s and its successors’ and assigns’ sole and exclusive remedy shall be against, Landlord’s interest in the Building, and no other assets of Landlord. The term “Landlord” as used in this Lease, so far as covenants or obligations on the part of the Landlord are concerned, shall be limited to mean and include only the owner or owners, at the time in question, of the fee title to, or a lessee’s interest in a ground lease of, the Property. In the event of any transfer or conveyance of any such title or interest (other than a transfer for security purposes only), the transferor shall be automatically relieved of all covenants and obligations on the part of Landlord contained in this Lease, provided that the transferee agrees to assume all such covenants and obligations. Landlord and Landlord’s transferees and assignees shall have the absolute right to transfer all or any portion of their respective title and interest in the Premises, the Building, the Property and/or this Lease without the consent of Tenant, and such transfer or subsequent transfer shall not be deemed a violation on Landlord’s part of any of the terms and conditions of this Lease.
ARTICLE 26 - SUBORDINATION
Tenant accepts this Lease subject and subordinate to any mortgage(s), deed(s) of trust, ground lease(s) or other lien(s) now or subsequently arising upon the Premises, the Building or the Property, and to renewals, modifications, refinancings and extensions thereof (collectively referred to as a “Mortgage”). This clause shall be self-operative, but no later than ten (10) business days after written request from Landlord or any holder of a Mortgage (each a “Mortgagee” and collectively, “Mortgagee(s)”), Tenant shall execute a commercially reasonable subordination, nondisturbance and attornment agreement. As an alternative, a Mortgagee shall have the right at any time to subordinate its Mortgage to this Lease. No later than ten (10) business days after written request by Landlord or any Mortgagee, Tenant shall, without charge, attorn to any successor to Landlord’s interest in this Lease. Tenant hereby waives its rights under any current or future Law which gives or purports to give Tenant any right to terminate or otherwise adversely affect this Lease and the obligations of Tenant hereunder in the event of any such foreclosure proceeding or sale. Should Tenant fail to sign and return any such documents within said ten (10) business day period, Tenant shall be in default hereunder. Within thirty (30) days following the full execution and delivery of this Lease, Landlord will use commercially reasonable efforts to provide Tenant with a non-disturbance agreement from the holder of the existing Mortgage (the "Existing Lender"), on the Existing Lender's standard, commercially reasonable form; provided, however, Landlord's failure to provide such non-disturbance agreement shall not be a default under this Lease or otherwise affect the parties' rights and obligations under this Lease. In addition, Landlord will use commercially reasonable efforts to provide Tenant with a non-disturbance agreement from the holder of any future Mortgagees; provided, however, Landlord's failure to provide such non-disturbance agreement shall not be a default under this Lease or otherwise affect the parties' rights and obligations under this Lease.
ARTICLE 27 - ESTOPPEL CERTIFICATE
Within ten (10) business days following Landlord’s written request, Tenant shall execute and deliver to Landlord an estoppel certificate, in a form substantially similar to the form of Exhibit F attached hereto. Any such estoppel certificate delivered pursuant to this Article 27 may be relied upon by any Mortgagee, beneficiary, purchaser or prospective purchaser of any portion of the Property, as well as their assignees. Tenant’s failure to deliver such estoppel certificate following an additional two (2) business day cure period after notice shall constitute a default hereunder. Tenant’s failure to deliver such certificate within such time shall be conclusive upon Tenant that this Lease is in full force and effect, without modification except as may be represented by Landlord, that there are no uncured defaults in Landlord’s performance, and that not more than one (1) month’s Rent has been paid in advance.
ARTICLE 28 -INTENTIONALLY DELETED ARTICLE 29 - MORTGAGEE PROTECTION
If, in connection with Landlord’s obtaining or entering into any financing or ground lease for any portion of the Building or Property, the lender or ground lessor shall request modifications to this Lease, Tenant shall, within thirty (30) days after request therefor, execute an amendment to this Lease including such modifications, provided such modifications are reasonable, do not increase the obligations of Tenant hereunder, or adversely affect the leasehold estate created hereby or Tenant’s rights hereunder. In the event of any default on the part of Landlord, Tenant will give notice by registered or certified mail to any beneficiary of a deed of trust or Mortgagee covering the Premises or ground lessor of Landlord whose address shall have been furnished to Tenant, and shall offer such beneficiary, Mortgagee or ground lessor a reasonable opportunity to cure the default (including with respect to any such beneficiary or Mortgagee, time to obtain possession of the Premises, subject to this Lease and Tenant’s rights hereunder, by power of sale or judicial foreclosure, if such should prove necessary to effect a cure).
ARTICLE 30 - QUIET ENJOYMENT
Landlord covenants and agrees with Tenant that, upon Tenant performing all of the covenants and provisions on Tenant’s part to be observed and performed under this Lease (including payment of Rent hereunder), Tenant shall have the right to use and occupy the Premises in accordance with and subject to the terms and conditions of this Lease as against all persons claiming by, through or under Landlord. This covenant shall be binding upon Landlord and its successors only during its or their respective periods of ownership of the Building.
ARTICLE 31 - MISCELLANEOUS PROVISIONS
31.1.Broker. Tenant represents that it has not had any dealings with any real estate broker, finder or intermediary with respect to this Lease, other than the Brokers specified in the Summary. Tenant shall indemnify, protect, defend (by counsel reasonably approved in writing by Landlord) and hold Landlord harmless from and against any and all claims, judgments, suits, causes of action, damages, losses, liabilities and expenses (including attorneys’ fees and court costs) resulting from any breach by Tenant of the foregoing representation, including, without limitation, any claims that may be asserted against Landlord by any broker, agent or finder claiming to have represented Tenant in connection with this Lease and undisclosed by Tenant herein. Landlord shall indemnify, protect, and hold Tenant harmless from and against any and all claims, judgments, suits, causes of action, damages, losses, liabilities and expenses (including attorneys' fees and court costs) resulting from any other brokers claiming to have represented Landlord in connection with this Lease. The foregoing indemnities shall survive the expiration or earlier termination of this Lease. Landlord shall pay to the Brokers the brokerage fee, if any, pursuant to a separate written agreement between Landlord and Brokers.
31.2.Governing Law. This Lease shall be governed by, and construed pursuant to, the laws of the state in which the Building is located. Venue for any litigation between the parties hereto concerning this Lease or the occupancy of the Premises shall be initiated in the county in which the Premises are located. Subject to Article 9 above, Tenant shall comply with all governmental and quasi-governmental laws, ordinances and regulations applicable to the Building, Property and/or the Premises, and all rules and regulations adopted pursuant thereto and all covenants, conditions and restrictions applicable to and/or of record against the Building, Property and/or the Site (individually, a “Law” and collectively, the “Laws”). Landlord and Tenant desire and intend that any disputes arising between them with respect to or in connection with this Lease be subject to expeditious resolution in a court trial without a jury. Consequently, Landlord and Tenant each hereby waives the right to trial by jury of any cause of action, claim, counterclaim or cross complaint in any action, proceeding or other hearing brought either by Landlord against Tenant, or by Tenant against Landlord, on any matter whatever arising out of, or in any way connected with, this Lease, the relationship of Landlord and Tenant, Tenant’s use or occupancy of the Premises, any claim of injury or damage, and the enforcement of any remedy under any law, statute and regulation, emergency or otherwise, now or hereafter in effect; provided, however, the foregoing waiver shall not apply to any action for personal injury or property damage. If Landlord commences any summary or other proceeding for nonpayment of Rent or the recovery of possession of the Premises, Tenant shall not interpose any permissive counterclaim of whatever nature or description in any such proceeding. The foregoing shall not, however, constitute a waiver of Tenant’s right to assert any claim against Landlord in any separate action brought by Tenant. This waiver is knowingly, intentionally, and voluntarily made by each of parties hereto and each party acknowledges to the other that neither the other party nor any person acting on its respective behalf has made any representations to induce this waiver of trial by jury or in any way to modify or nullify its effect. The parties acknowledge that they have read and understand the meaning and ramifications of this waiver provision and have elected same of their own free will.
31.3.Successors and Assigns. Subject to the provisions of Article 25 above, and except as otherwise provided in this Lease, all of the covenants, conditions and provisions of this Lease shall be binding upon, and shall inure to the benefit of, the parties hereto and their respective heirs, personal representatives and permitted successors and assigns; provided, however, no rights shall inure to the benefit of any Transferee of Tenant unless the Transfer to such Transferee is made in compliance with the provisions of Article 20, and no options or other rights which are expressly made personal to the original Tenant hereunder or in any rider attached hereto shall be assignable to or exercisable by anyone other than the original Tenant and any Permitted Transferee under this Lease.
31.4.No Merger. The voluntary or other surrender of this Lease by Tenant or a mutual termination thereof shall not work as a merger and shall, at the option of Landlord, either (a) terminate all or any existing subleases, or (b) operate as an assignment to Landlord of Tenant’s interest under any or all such subleases.
31.5.Professional Fees. If either Landlord or Tenant should bring suit (or alternate dispute resolution proceedings) against the other with respect to this Lease, including for unlawful detainer, forcible entry and detainer, or any other relief against the other hereunder, then all costs and expenses incurred by the prevailing party therein (including, without limitation, its actual appraisers’, accountants’, attorneys’ and other professional fees, expenses and court costs), shall be paid by the other party, including any and all costs incurred in enforcing, perfecting and executing such judgment and all reasonable costs and attorneys’ fees associated with any appeal. Further, if for any reason Landlord consults legal counsel or otherwise incurs any costs or expenses as a result of its proper attempt to enforce the provisions of this Lease against Tenant, even though no litigation is commenced, or if commenced is not pursued to final judgment, Tenant shall be obligated to pay to Landlord, in addition to all other amounts for which Tenant is obligated hereunder, all of Landlord’s reasonable costs and expenses incurred in connection with any such acts, including attorneys’ fees incurred associated with any appeal.
31.6.Waiver. The waiver by either party of any breach by the other party of any term, covenant or
condition herein contained shall not be deemed to be a waiver of any subsequent breach of the same or any other term, covenant and condition herein contained, nor shall any custom or practice which may become established between the parties in the administration of the terms hereof be deemed a waiver of, or in any way affect, the right of any party to insist upon the performance by the other in strict accordance with said terms. No waiver of any default of either party hereunder shall be implied from any acceptance by Landlord or delivery by Tenant (as the case may be) of any Rent or other payments due hereunder or any omission by the non-defaulting party to take any action on account of such default if such default persists or is repeated, and no express waiver shall affect defaults other than as specified in said waiver.
31.7.Terms and Headings. The words “Landlord” and “Tenant” as used herein shall include the plural as well as the singular. Words used in any gender include other genders. The Article and Section headings of this Lease are not a part of this Lease and shall have no effect upon the construction or interpretation of any part hereof. Any deletion of language from this Lease prior to its execution by Landlord and Tenant shall not be construed to raise any presumption, canon of construction or implication, including, without limitation, any implication that the parties intended thereby to state the converse of the deleted language. The parties hereto acknowledge and agree that each has participated in the negotiation and drafting of this Lease; therefore, in the event of an ambiguity in, or dispute regarding the interpretation of, this Lease, the interpretation of this Lease shall not be resolved by any rule of interpretation providing for interpretation against the party who caused the uncertainty to exist or against the draftsman.
31.8.Time. Time is of the essence with respect to performance of every provision of this Lease in which time or performance is a factor.
31.9.Business Day. A “business day” is Monday through Friday, excluding holidays observed by the United States Postal Service and reference to 5:00 p.m. is to the time zone of the recipient. Whenever action must be taken (including the giving of notice or the delivery of documents) under this Lease during a certain period of time (or by a particular date) that ends (or occurs) on a non-business day, then such period (or date) shall be extended until the immediately following business day.
31.10.Payments and Notices. All Rent and other sums payable by Tenant to Landlord hereunder shall be paid to Landlord at the address designated in the Summary, or to such other persons and/or at such other places as Landlord may hereafter designate in writing. Any notice required or permitted to be given hereunder must be in writing and may be given by personal delivery (including delivery by nationally recognized overnight courier or express mailing service), by registered or certified mail, postage prepaid, return receipt requested, addressed to Tenant at the address(es) designated in the Summary, or to Landlord at the address(es) designated in the Summary. Either party may, by written notice to the other, specify a different address for notice purposes. Notice given in the foregoing manner shall be deemed given (i) when actually received or refused by the party to whom sent if delivered by a carrier or personally served or (ii) if mailed, on the day of actual delivery or refusal as shown by the certified mail return receipt or the expiration of three (3) business days after the day of mailing, whichever first occurs.
31.11.Prior Agreements; Amendments. This Lease, including the Summary and all Exhibits attached hereto, contains all of the covenants, provisions, agreements, conditions and understandings between Landlord and Tenant concerning the Premises and any other matter covered or mentioned in this Lease, and no prior agreement or understanding, oral or written, express or implied, including without limitation any marketing materials, brochures, or the like, written or verbal, provided by Landlord or its agents pertaining to the Premises or any such other matter shall govern the parties or be effective for any purpose, once this Lease has been executed by the parties. No provision of this Lease may be amended or added to except by an agreement in writing signed by the parties hereto or their respective successors in interest. The parties acknowledge that all prior agreements, communications, representations and negotiations are deemed superseded by the execution of this Lease to the extent they are not expressly incorporated herein.
31.12.Separability. The invalidity or unenforceability of any provision of this Lease shall in no way affect, impair or invalidate any other provision hereof, and such other provisions shall remain valid and in full force and effect to the fullest extent permitted by law.
31.13.Recording. Neither Landlord nor Tenant shall record this Lease or a short form memorandum of this Lease.
31.14.Accord and Satisfaction. No payment by Tenant or receipt by Landlord of a lesser amount than the Rent payment herein stipulated shall be deemed to be other than on account of the Rent, nor shall any endorsement or statement on any check or any letter accompanying any check or payment as Rent be deemed an accord and satisfaction, and Landlord may accept such check or payment without prejudice to Landlord’s right to recover the balance of such Rent or pursue any other remedy provided in this Lease. Tenant agrees that each of the foregoing covenants and agreements shall be applicable to any covenant or agreement either expressly contained in this Lease or imposed by any statute or at common law.
31.15.Financial Statements. Upon ten (10) business days prior written request from Landlord (which Landlord may only make in connection with Tenant's exercise of any Option(s) in this Lease, following an event of default by Tenant, and/or in connection with a sale, recapitalization or refinance of the Property), Tenant shall deliver to Landlord for review by Landlord and by Landlord's accountants, investors and prospective purchasers and lenders: (a) Tenant’s most recent, annual financial statement prepared in Tenant’s normal and customary manner, and (b) to the extent available and subsequent to such annual financial statement, Tenant’s most recent, quarterly financial statement prepared in Tenant’s normal and customary manner. Landlord covenants and agrees not to disclose any information regarding Tenant's financial statements to any parties other than its accountants, investors, purchasers, and lenders to keep all of Tenant's financial information confidential. Such statements shall have been prepared in accordance with Tenant’s normal and customary practices, and certified as true in all material respects by an authorized officer (e.g., CFO or Controller), member/manager or general partner of Tenant. Notwithstanding the foregoing, in the event that (i) stock in the entity which constitutes Tenant under this Lease (as opposed to an entity that controls Tenant or is otherwise an affiliate of Tenant) is publicly traded on NASDAQ or a national stock exchange, and (ii) Tenant has its own, separate and distinct 10K and 10Q filing requirements (as opposed joint or cumulative filings with an entity that controls Tenant or with entities which are otherwise affiliates of Tenant), then Tenant's obligation to provide Landlord with a copy of its most recent current financial statement shall be deemed satisfied.
31.16.No Partnership. Landlord does not, in any way or for any purpose, become a partner of Tenant in the conduct of its business, or otherwise, or joint venture or a member of a joint enterprise with Tenant by reason of this Lease.
31.17.Force Majeure. If either party hereto shall be delayed or hindered in or prevented from the performance of any act required hereunder by reason of strikes, lock-outs, labor troubles, inability to procure materials, failure of power, governmental moratorium or other governmental action or inaction (including, without limitation, failure, refusal or delay in issuing permits, approvals and/or authorizations), injunction or court order, riots, insurrection, war, governmental boycott or trade embargo, terrorism, bioterrorism, fire, earthquake, inclement weather including rain, flood or other natural disaster or other reason of a like nature not the fault of the party delaying in performing work or doing acts required under the terms of this Lease (but excluding delays due to financial inability) (herein collectively, “Force Majeure Delay(s)”), then performance of such act shall be excused for the period of the delay and the period for the performance of any such act shall be extended for a period equivalent to the period of such Force Majeure Delay. The provisions of this Section 31.17 shall not apply to nor operate to excuse Tenant from the payment of Monthly Base Rent, or any Additional Rent or any other payments strictly in accordance with the terms of this Lease.
31.18.Counterparts. This Lease may be executed in one or more counterparts, each of which shall constitute an original and all of which shall be one and the same agreement. Signatures and initials required in this document may be executed via “wet” original handwritten signature or initials, or via electronic signature or mark, which shall be binding on the parties as originals, and the executed signature pages may be delivered using pdf or similar file type transmitted via electronic mail, cloud based server, e-signature technology (such as DocuSign) or other similar electronic means, and any such transmittal shall constitute delivery of the executed document for all purposes of this Lease.
31.19.Nondisclosure of Lease Terms. Tenant acknowledges and agrees that the terms of this Lease are confidential and constitute proprietary information of Landlord. Disclosure of the terms could adversely affect the ability of Landlord to negotiate other leases and impair Landlord’s relationship with other tenants. Accordingly, Tenant agrees that it, and its partners,
officers, directors, shareholders, members, managers, employees, agents and attorneys, shall not intentionally and voluntarily disclose the terms and conditions of this Lease to any newspaper or other publication or any other tenant or apparent prospective tenant of the Building or other portion of the Property, or prospective real estate agent, either directly or indirectly, without the prior written consent of Landlord, provided, however, that Tenant may disclose the terms to prospective subtenants or assignees under this Lease or as may be required pursuant to applicable Laws and regulations.
31.20.Authority. If Tenant executes this Lease as a partnership, corporation or limited liability company, then Tenant represents and warrants that: (a) Tenant is a duly organized and existing partnership, corporation or limited liability company, as the case may be, and is qualified to do business in the state in which the Building is located; (b) such persons and/or entities executing this Lease are duly authorized to execute and deliver this Lease on Tenant’s behalf; and (c) this Lease is binding upon Tenant in accordance with its terms. Tenant shall provide to Landlord a copy of any documents reasonably requested by Landlord evidencing such qualification, organization, existence and authorization within ten (10) days after Landlord’s request. Tenant represents and warrants to Landlord that Tenant is not, (i) in violation of any Laws relating to terrorism or money laundering, or (ii) among the individuals or entities identified on any list compiled pursuant to Executive Order 13224 for the purpose of identifying suspected terrorists or on the most current list published by the U.S. Treasury Department Office of Foreign Assets Control at its official website, http://www.treas.gov/ofac/tllsdn.pdf or any replacement website or other replacement official publication of such list. Landlord represents and warrants that: (a) Landlord is a duly organized and existing limited partnership and is qualified to do business in the state in which the Building is located; (b) such persons and/or entities executing this Lease are duly authorized to execute and deliver this Lease on Landlord's behalf; and (c) this Lease is binding upon Landlord in accordance with its terms
31.21.Joint and Several Liability. If more than one person or entity executes this Lease as Tenant: (a) each of them is and shall be jointly and severally liable for the covenants, conditions, provisions and agreements of this Lease to be kept, observed and performed by Tenant; and (b) the act or signature of, or notice from or to, any one or more of them with respect to this Lease shall be binding upon each and all of the persons and entities executing this Lease as Tenant with the same force and effect as if each and all of them had so acted or signed, or given or received such notice.
31.22.No Option. The submission of this Lease for examination or execution by Tenant does not constitute a reservation of or option for the Premises and this Lease shall not become effective as a Lease until the final lease has been approved by any and all Mortgagee(s) and it has been executed by Landlord and delivered to Tenant.
31.23.OFAC. Tenant represents and warrants to Landlord that Tenant is not in violation of any Laws relating to terrorism or money laundering and will not, act, directly or indirectly, for or on behalf of any of the following:
a.Any person, group, entity, or nation named by any Executive Order or the United States Treasury Department as a terrorist, including without limitation, pursuant to Executive Order 13224 for the purpose of identifying suspected terrorists or on the most current list published by the U.S. Treasury Department Office of Foreign Assets Control (“OFAC”) at its official website, http://www.treas.gov/ofac/tllsdn.pdf or any replacement website or other replacement official publication of such list;
b.Any “Specially Designated National” or “Blocked Person” as designated pursuant to any law, order, rule, or regulation that is enforced or administered by the United States Government or any of its departments or agencies; or
c.Any other banned or blocked person, entity, nation or transaction pursuant to any law, order, rule, or regulation that is enforced or administered by OFAC.
TENANT SHALL DEFEND, INDEMNIFY AND HOLD HARMLESS LANDLORD FROM AND AGAINST ANY AND ALL CLAIMS, DAMAGES, LOSSES, RISKS, LIABILITIES AND EXPENSES (INCLUDING ATTORNEYS' FEES AND COSTS) INCURRED BY LANDLORD ARISING FROM OR RELATED TO ANY BREACH OF THE FOREGOING REPRESENTATIONS. In addition, if the foregoing representations are untrue at any time during the Term (or any extension of the Term) of the Lease, an Event of Default will be deemed to have occurred, without the necessity of notice to Tenant, and shall entitle Landlord to terminate this Lease and realize any and all remedies available under this Lease and/or at law or in equity.
31.24.Options and Rights in General. Any option (each an “Option” and collectively, the “Options”), including without limitation, any option to extend, option to terminate, option to expand, right to lease, right of first offer, and/or right of first refusal, granted to Tenant is personal to the original Tenant executing this Lease or a Permitted Transferee and may be exercised only by the original Tenant executing this Lease or a Permitted Transferee, while leasing the entire Premises, and may not be exercised or be assigned, voluntarily or involuntarily, by any person or entity other than the original Tenant executing this Lease or a Permitted Transferee. The Options, if any, granted to Tenant under this Lease are not assignable separate and apart from this Lease, nor may any Option be separated from this Lease in any manner, either by reservation or otherwise. Tenant will have no right to exercise any Option, notwithstanding any provision of the grant of option to the contrary, and Tenant’s exercise of any Option may be nullified by Landlord and deemed of no further force or effect, if (i) Tenant is in Default under the terms of this Lease as of Tenant’s exercise of the Option in question or at any time after the exercise of any such Option and prior to the commencement of the Option event, (ii) Tenant has sublet all of the Premises except pursuant to a Permitted Transfer, or (iii) Landlord has given Tenant three (3) or more notices of default that remained uncured beyond applicable notice and cure periods during any twelve (12) consecutive month period of this Lease. Each Option granted to Tenant, if any, is hereby deemed an economic term which Landlord, in its sole and absolute discretion, may or may not offer in conjunction with any future extensions of the Term. Notwithstanding the foregoing, items (i) - (iii) of this Section
31.24.shall not apply to tenant’s Termination Option described in Rider No. 4 hereto.
31.25.Approvals. Whenever this Lease requires an approval, consent, determination or judgment by either Landlord or Tenant, unless another standard is expressly set forth, such approval, consent, determination or judgment and any conditions imposed thereby shall be reasonable and shall not be unreasonably withheld or delayed.
31.26.Access. Except when and where Tenant's right of access is specifically excluded in this Lease, Tenant shall have access to the Premises twenty-four (24) hours per day, seven (7) days per week.
[NO FURTHER TEXT ON THIS PAGE; SIGNATURES ON FOLLOWING PAGE]
IN WITNESS WHEREOF, Landlord and Tenant have caused this Lease to be executed the date first above
written.
Tenant:
| IRHYTHM TECHNOLOGIES, INC. | |||||
| By: | /s/ Michael Coyle | ||||
| Michael Coyle | |||||
| Chief Executive Officer | |||||
| By: | /s/ Douglas Devine | ||||
| Douglas Devine | |||||
| Chief Financial Officer | |||||
[SIGNATURES CONTINUED ON FOLLOWING PAGE]
Landlord:
| KATELLA/HOLDER STREET, LLC | |||||
| a Delaware limited liability company | |||||
| By: | |||||
| Its: Authorized Signatory | |||||
EXHIBIT A
PREMISES FLOOR PLAN
EXHIBIT B
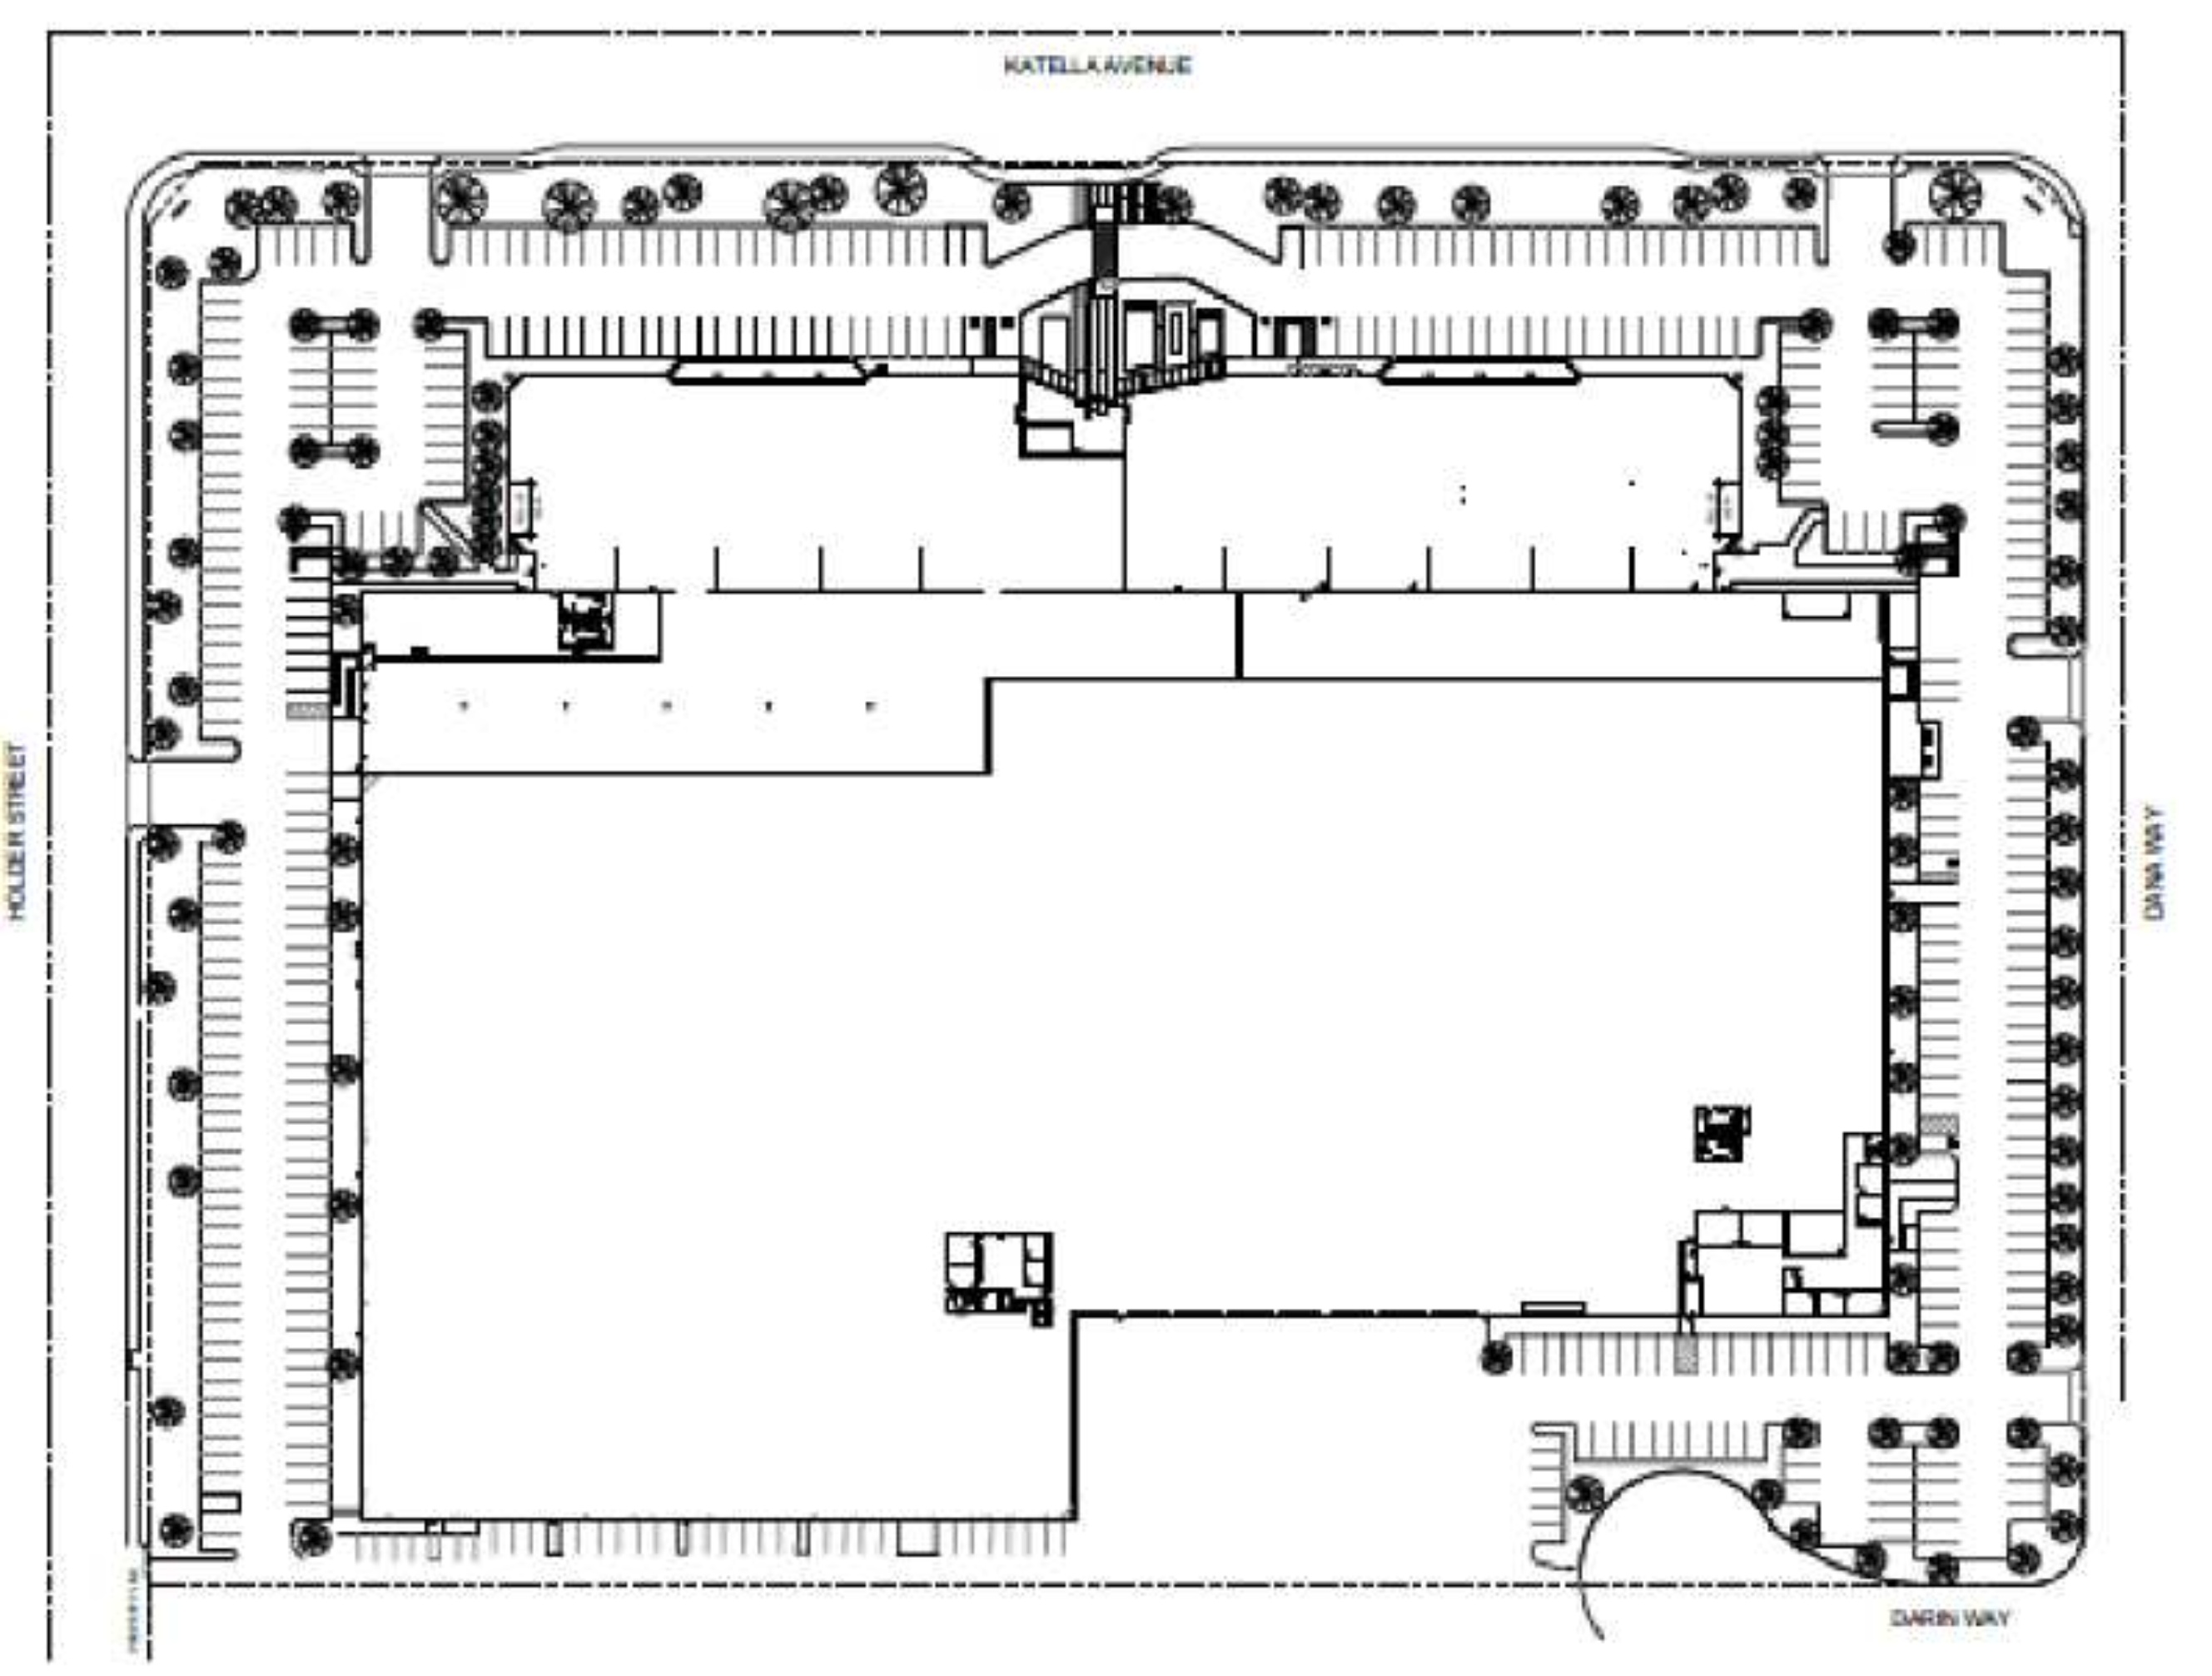 SITE PLAN
EXHIBIT C
WORK LETTER (ALLOWANCE)
1.TENANT IMPROVEMENTS. As used in the Lease and this Work Letter, the term “Tenant Improvements” or “Tenant Improvement Work” or “Tenant’s Work” means those items of general tenant improvement construction shown on the Final Plans (described in Section 4 below), more particularly described in Section 5 below.
2.WORK SCHEDULE. Prior to commencing construction, Tenant will deliver to Landlord, for Landlord’s review and approval, a schedule (“Work Schedule”), which will set forth the timetable for the planning and completion of the installation of the Tenant Improvements.
3.CONSTRUCTION REPRESENTATIVES. Landlord hereby appoints the following person(s) as Landlord’s representative (“Landlord’s Representative”) to act for Landlord in all matters covered by this Work Letter: Donna Clark.
Tenant hereby appoints the following person(s) as Tenant’s representative (“Tenant’s Representative”) to act for Tenant in all matters covered by this Work Letter: Claudia Purdy.
All communications with respect to the matters covered by this Work Letter are to be made to Landlord’s Representative or Tenant’s Representative, as the case may be, in writing in compliance with the notice provisions of the Lease. Either party may change its representative under this Work Letter at any time by written notice to the other party in compliance with the notice provisions of the Lease.
4.TENANT IMPROVEMENT PLANS
(a)Preparation of Space Plans. In accordance with the Work Schedule, Landlord agrees to meet with Tenant’s architect and/or space planner for the purpose of preparing and promptly reviewing preliminary space plans for the layout of the Premises prepared by Tenant (“Space Plans”). The Space Plans are to be sufficient to convey the architectural design of the Premises and layout of the Tenant Improvements therein and are to be submitted to Landlord in accordance with the Work Schedule for Landlord’s approval. If Landlord reasonably disapproves any aspect of the Space Plans, Landlord will advise Tenant in writing of such disapproval and the reasons therefor in accordance with the Work Schedule. Tenant will then submit to Landlord for Landlord’s approval, in accordance with the Work Schedule, a redesign of the Space Plans incorporating the revisions reasonably required by Landlord. Landlord hereby approves of the Space Plan attached hereto as Schedule 1.
(b)Preparation of Final Plans. Based on the approved Space Plans, and in accordance with the Work Schedule, Tenant’s architect will prepare complete architectural plans, drawings and specifications and complete engineered mechanical, structural and electrical working drawings for all of the Tenant Improvements for the Premises (collectively, the “Final Plans”). The Final Plans will show (a) the subdivision (including partitions and walls), layout, lighting, finish and decoration work (including carpeting and other floor coverings) for the Premises; (b) all internal and external communications and utility facilities which will require conduiting or other improvements from the base Building shell work and/or within common areas; and (c) all other specifications for the Tenant Improvements. The Final Plans will be submitted to Landlord for signature to confirm that they are consistent with the Space Plans. If Landlord reasonably disapproves any aspect of the Final Plans based on any inconsistency with the Space Plans, Landlord agrees to advise Tenant in writing of such disapproval and the reasons therefor within the time frame set forth in the Work Schedule. In accordance with the Work Schedule, Tenant will then cause Tenant’s architect to redesign the Final Plans incorporating the revisions reasonably requested by Landlord so as to make the Final Plans consistent with the Space Plans.
(c)Requirements of Tenant’s Final Plans. Tenant’s Final Plans will include locations and complete dimensions, and the Tenant Improvements, as shown on the Final Plans, will: (i) be compatible with the Building shell and with the design, construction and equipment of the Building; (ii) if not comprised of the Building standards set forth in the written description thereof (the “Standards”), then compatible with and of at least equal quality as the Standards and reasonably approved by Landlord; (iii) comply with all applicable laws, ordinances, rules and regulations of all governmental authorities having jurisdiction, and all applicable insurance regulations; (iv) not require Building service beyond the level normally provided to other tenants in the Building and will not overload the Building floors; and (v) be of a nature and quality consistent with the overall objectives of Landlord for the Building, as determined by Landlord in its reasonable but subjective discretion.
(d)Submittal of Final Plans. Once approved by Landlord and Tenant, Tenant’s architect will submit the Final Plans to the appropriate governmental agencies for plan checking and the issuance of a building permit. Tenant’s architect, with Landlord’s cooperation, will make any changes to the Final Plans which are requested by the applicable governmental authorities to obtain the building permit. After approval of the Final Plans no further changes may be made without the prior written approval of both Landlord and Tenant, which approval shall not be unreasonably withheld, conditioned or delayed, unless a Design Problem exists, and then only after agreement by Tenant to pay any excess costs resulting from the design and/or construction of such changes. "Design Problem" shall mean, individually or collectively, as reasonably determined by Landlord, (i) an adverse effect on the structural integrity of the Building, (ii) non-compliance with Laws (including applicable codes), (iii) an adverse effect on the systems and equipment of the Building, (iv) an adverse effect on the exterior appearance of the Building, (v) an effect on the exterior appearance of the Building, (vi) non-compliance with the Landlord's construction rules and regulations and/or Building Standards, (vii) having a server room located below an existing room containing a wet plumbing connection of another tenant in the Building, (viii) having a wet plumbing connection above an existing server room of another tenant in the Building, or (ix) incomplete, missing or inaccurate specifications.
(e)Changes to Shell of Building. If the Final Plans or any amendment thereof or supplement thereto shall require changes in the Building shell, the increased cost of the Building shell work caused by such changes will be paid for by Tenant or charged against the “Allowance” described in Section 5 below.
(f)Work Cost Estimate and Statement. Prior to the commencement of construction of any of the Tenant Improvements shown on the Final Plans, Tenant will submit to Landlord a written estimate of the cost to complete the Tenant Improvement Work, which written estimate will be based on the Final Plans taking into account any modifications which may be required to reflect changes in the Final Plans required by the City or County in which the Premises are located (the “Work Cost Estimate”).
Landlord will either approve the Work Cost Estimate or disapprove specific items and submit to Tenant revisions to the Final Plans to reflect deletions of and/or substitutions for such disapproved items. Submission and approval of the Work Cost Estimate will proceed in accordance with the Work Schedule. Upon Landlord’s approval of the Work Cost Estimate (such approved Work Cost Estimate to be hereinafter known as the “Work Cost Statement”), Tenant will have the right to purchase materials and to commence the construction of the items included in the Work Cost Statement pursuant to Section 6 hereof. If the total costs reflected in the Work Cost Statement exceed the Allowance described in Section 5 below, Tenant agrees to pay such excess.
5.PAYMENT FOR THE TENANT IMPROVEMENTS
(a)Allowance. Landlord hereby grants to Tenant an Allowance as referenced in the Summary. The Allowance is to be used only for:
(i)Payment of the cost of preparing the Space Plans and the Final Plans, including mechanical, electrical, plumbing and structural drawings and of all other aspects necessary to complete the Final Plans. The Allowance will not be used for the payment of extraordinary design work not consistent with the scope of the Standards (i.e., above-standard design work) or for payments to any other consultants, designers or architects other than Landlord’s architect and/or Tenant’s architect, engineers, and construction manager (provided that not more than three percent (3%) of the Allowance may be applied against the cost of Tenant’s construction manager).
(ii)The payment of plan check, permit and license fees relating to construction of the Tenant Improvements (including the portion of the Tenant Improvements located outside of the Premises).
(iii)Construction of the Tenant Improvements (including the portion of the Tenant Improvements located outside of the Premises), including, without limitation, the following:
(aa) Installation within the Premises of all partitioning, doors, floor coverings, ceilings, wall coverings and painting, millwork and similar items;
(bb) All electrical wiring, lighting fixtures, outlets and switches, and other electrical work necessary for the Premises;
(cc) The furnishing and installation of all duct work, terminal boxes, diffusers and accessories necessary for the heating, ventilation and air conditioning systems within the Premises, and supplemental systems installed therein, including the cost of meter and key control for after-hour air conditioning;
(dd) Any additional improvements to the Premises required for Tenant’s use of the Premises including, but not limited to, odor control, special heating, ventilation and air conditioning, noise or vibration control or other special systems or improvements;
(ee) All fire and life safety control systems such as fire walls, sprinklers, halon, fire alarms, including piping, wiring and accessories, necessary for the Premises;
(ff) All plumbing, fixtures, pipes and accessories necessary for the Premises;
(gg) Testing and inspection costs; and
(hh) Fees and costs attributable to general conditions associated with the construction of the Tenant Improvements plus a construction administration fee in the amount of three percent (3%) of the Allowance (“Construction Administration Fee”) to cover the services of Landlord’s tenant improvement coordinator.
(b)Excess Costs. The cost of each item referenced in Section 5(a) above shall be charged against the Allowance. If the work cost exceeds the Allowance, Tenant shall be solely responsible for payment of all excess costs, including the Construction Administration Fee, which fee shall be paid to Landlord within thirty (30) days after invoice therefor. In no event will the Allowance be used to pay for Tenant’s furniture, artifacts, equipment, telephone systems or any other item of personal property which is not affixed to the Premises.
(c)Changes. Any changes to the Final Plans will be approved by Landlord and Tenant in the manner set forth in Section 4 above. Tenant shall be solely responsible for any additional costs associated with such changes; provided, however, that Landlord will first apply toward any such increase any remaining balance of the Allowance. Landlord will have the right to decline Tenant’s request for a change to the Final Plans if such changes are inconsistent with the provisions of Section 4 above.
(d)Governmental Cost Increases. If increases in the cost of the Tenant Improvements as set forth in the Work Cost Statement are due to requirements of any governmental agency, Tenant shall be solely responsible for such additional costs; provided, however, that Landlord will first apply toward any such increase any remaining balance of the Allowance.
(e)Unused Allowance Amounts. Any unused portion of the Allowance upon completion of the Tenant Improvements will not be refunded to Tenant or be available to Tenant as a credit against any obligations of Tenant under the Lease.
(f)Disbursement of the Allowance. Provided Tenant is not in default following the giving of notice and passage of any applicable cure period under the Lease or this Work Letter, Landlord shall disburse the Allowance to Tenant to reimburse Tenant for the actual construction costs which Tenant incurs in connection with the construction of the Tenant Improvements in accordance with the following:
(i)Ninety percent (90%) of the Allowance shall be disbursed to Tenant no more frequently than monthly during the course of construction of the Work (i.e., corresponding to, and consistent with, an industry standard 10% retention in connection with progress payments to general contractors);
(ii)The final ten percent (10%) of the Allowance (i.e., the final retention) shall be disbursed to Tenant when Landlord shall have received "Evidence of Completion and Payment" as to one hundred percent (100%) of Tenant's Work having been completed and paid for by Tenant as described hereinbelow and satisfaction of the items described in subparagraph (iii) below;
(iii)As to each phase of completion of Tenant's Work described in subparagraphs (i) through (ii) above, the appropriate portion of the Allowance shall be disbursed to Tenant only when Landlord has received the following "Evidence of Completion and Payment":
(A)Tenant has delivered to Landlord a draw request (“Draw Request”) in a form reasonably satisfactory to Landlord and Landlord’s lender with respect to the Improvements specifying that the requisite portion of Tenant’s Work has been completed, together with invoices, receipts and bills evidencing the costs and expenses set forth in such Draw Request and evidence of payment by Tenant for all costs which are payable in connection with such Tenant’s Work covered by the Draw Request. As between Landlord and Tenant, the Draw Request shall be deemed to constitute Tenant’s agreement that the Tenant’s Work identified therein has been completed in a good and workmanlike manner and in accordance with the Final Plans and the Work Schedule and has been paid for;
(B)The architect for the Tenant Improvements has certified to Landlord that the Tenant Improvements have been completed to the level indicated in the Draw Request in accordance with the Final Plans;
(C)Tenant has delivered to Landlord such other evidence of Tenant’s payment of the general contractor and subcontractors for the portions of Tenant’s Work covered by the Draw Request and the absence of any liens generated by such portions of the Tenant’s Work as may be reasonably required by Landlord (i.e., unconditional lien releases in accordance with California Civil Code Sections 8120 through 8138 or release bond(s) in accordance with California Civil Code Sections 8424 and 8534);
(D)Landlord or Landlord’s architect or construction representative has inspected the Tenant Improvements and determined that the portion of Tenant’s Work covered by the Draw Request has been completed in a good and workmanlike manner;
(vi) The final disbursement of the balance of the Allowance shall be disbursed to Tenant only when Landlord has received Evidence of Completion and Payment as to all of Tenant’s Work as provided hereinabove and the following conditions have been satisfied:
(A)Intentionally omitted;
(B)A certificate of occupancy, temporary certificate of occupancy, or legal equivalent for the Tenant Improvements and the Premises has been issued by the appropriate governmental body;
(C)Tenant has delivered to Landlord: (i) properly executed mechanics lien releases from all of Tenant’s contractors, agents and suppliers in compliance with both California Civil Code Sections 8120 through 8138, which lien releases shall be conditional with respect to the then-requested payment amounts and unconditional with respect to payment amounts previously disbursed by Landlord; (ii) an application and certificate for payment (AIA form G702-1992 or equivalent) signed by Tenant’s architect/space planner; (iii) original stamped building permit plans; (iv) copy of the building permit; (v) original stamped building permit inspection card with all final sign-offs;
(vi)a reproducible copy (in a form approved by Landlord) of the “as-built” drawings of the Tenant Improvements;
(vii)air balance reports; (viii) excess energy use calculations; (ix) one year warranty letters from Tenant’s contractors; (x) manufacturer’s warranties and operating instructions; (xi) final punch list completed and signed off by Tenant’s architect/space planner; and (xii) an acceptance of the Premises signed by Tenant;
(D)Landlord has determined that no work exists which adversely affects the mechanical, electrical, plumbing, heating, ventilating and air conditioning, life-safety or other systems of the Building, the curtain wall of the Building, the structure or exterior appearance of the Building, or any other tenant’s use of such other tenant’s leased premises in the Building.
Notwithstanding anything to the contrary contained hereinabove, until the full amount of the Construction Administration Fee is paid to Landlord, all disbursements of the Allowance shall be subject to the prior deduction of the portion of the Construction Administration Fee allocable to the Tenant Improvements described in the applicable Draw Request.
(g)Books and Records. At its option, Landlord, at any time within six (6) months after final disbursement of the Allowance to Tenant, and upon at least ten (10) days prior written notice to Tenant, may cause an audit to be made of Tenant’s books and records relating to Tenant’s expenditures in connection with the construction of the Tenant Improvements. Tenant shall maintain complete and accurate books and records in accordance with generally accepted accounting principles of these expenditures for at least one (1) year. Tenant shall make available to Landlord’s auditor at the Premises within ten (10) business days following Landlord’s notice requiring the audit, all books and records maintained by Tenant pertaining to the construction and completion of the Tenant Improvements. In addition to all other remedies which Landlord may have pursuant to the Lease, Landlord may recover from Tenant the reasonable cost of its audit if the audit discloses that Tenant falsely reported to Landlord expenditures which were not in fact made or falsely reported a material amount of any expenditure or the aggregate expenditures. Landlord shall execute a commercially reasonable confidentiality agreement in connection with such audit.
6.CONSTRUCTION OF TENANT IMPROVEMENTS. Following Landlord’s approval of the Final Plans and the Work Cost Statement described in Section 4(f) above, Tenant’s contractor (selected as provided in Section 8(n)) will commence and diligently proceed with the construction of the Tenant Improvements. Tenant shall use diligent efforts to cause its contractor to complete the Tenant Improvements in a good and workmanlike manner in accordance with the Final Plans and the Work Schedule. Tenant agrees to use diligent efforts to cause construction of the Tenant Improvements to commence promptly following the issuance of a building permit for the Tenant Improvements. Landlord shall have the right to enter upon the Premises to inspect Tenant’s construction activities following reasonable advance notice Tenant.
7.DELIVERY OF POSSESSION; SUBSTANTIAL COMPLETION
(a)Delivery of Possession. Landlord shall deliver the Premises to Tenant in vacant, broom-clean condition and free of debris. Landlord agrees to use its commercially reasonable efforts to deliver possession of the Premises to Tenant on the date the Lease is fully executed. Tenant agrees that if Landlord is unable to deliver possession of the Premises to Tenant on or prior to such date, the Lease will not be void or voidable, nor will Landlord be liable to Tenant for any loss or damage resulting therefrom. The actual date upon which Landlord turns over possession of the Premises to Tenant is the “Turnover Date.”
(b)Substantial Completion; Punch-List. The Tenant Improvements will be deemed to be “substantially completed” when Tenant’s contractor certifies in writing to Landlord and Tenant that Tenant has substantially performed all of the Tenant Improvement Work required to be performed by Tenant under this Work Letter, other than decoration and minor “punch-list” type items and adjustments which do not materially interfere with Tenant’s use of the Premises; and Tenant has obtained a temporary certificate of occupancy or other required equivalent approval from the local governmental authority permitting occupancy of the Premises. Within ten (10) days after receipt of such certificates, Tenant and Landlord will conduct a walk-through inspection of the Premises and Landlord shall provide to Tenant a written punch-list specifying those decoration and other punch-list items which require completion, which items Tenant will thereafter diligently complete.
8.MISCELLANEOUS CONSTRUCTION COVENANTS
(a)No Liens. Tenant shall not allow the Tenant Improvements or the Building or any portion thereof to be subjected to any mechanic’s, materialmen’s or other liens or encumbrances arising out of the construction of the Tenant Improvements.
(b)Diligent Construction. Tenant will promptly, diligently and continuously pursue construction of the Tenant Improvements to successful completion in full compliance with the Final Plans, the Work Schedule and this Work Letter. Landlord and Tenant shall cooperate with one another during the performance of Tenant’s Work to effectuate such work in a timely and compatible manner.
(c)Compliance with Laws. Tenant will construct the Tenant Improvements in a safe and lawful manner. Tenant shall, at its sole cost and expense, comply with all applicable laws and all regulations and requirements of, and all licenses and permits issued by, all municipal or other governmental bodies with jurisdiction which pertain to the installation of the Tenant Improvements. Copies of all filed documents and all permits and licenses shall be provided to Landlord. Any portion of the Tenant Improvements which is not acceptable to any applicable governmental body, agency or department, or not reasonably satisfactory to Landlord, shall be promptly repaired or replaced by Tenant at Tenant’s expense. Notwithstanding any failure by Landlord to object to any such Tenant Improvements, Landlord shall have no responsibility therefor.
(d)Indemnification. Subject to the terms of the Lease regarding insurance and waiver of subrogation by the parties, Tenant hereby indemnifies and agrees to defend and hold Landlord, the Premises and the Building harmless from and against any and all suits, claims, actions, losses, costs or expenses of any nature whatsoever, together with reasonable attorneys’ fees for counsel of Landlord’s choice, arising out of or in connection with the Tenant Improvements or the performance of Tenant’s Work (including, but not limited to, claims for breach of warranty, worker’s compensation, personal injury or property damage, and any materialmen’s and mechanic’s liens).
(e)Insurance. Construction of the Tenant Improvements shall not proceed without Tenant first acquiring workers’ compensation and commercial general liability insurance and property damage insurance as well as “All
Risks” builders’ risk insurance, with minimum coverage of $2,000,000 or such other amount as may be approved by Landlord in writing and issued by an insurance company reasonably satisfactory to Landlord. Before commencing the construction of the Tenant Improvements, certificates of such insurance shall be furnished to Landlord for Landlord’s approval. All such policies shall provide that thirty (30) days prior notice must be given to Landlord before modification, termination or cancellation. All insurance policies maintained by Tenant pursuant to this Work Letter shall name Landlord and any lender with an interest in the Premises as additional insureds and comply with all of the applicable terms and provisions of the Lease relating to insurance. Tenant’s contractor shall be required to maintain the same insurance policies as Tenant, and such policies shall name Tenant, Landlord and any lender with an interest in the Premises as additional insureds.
(f)Construction Defects. Landlord shall have no responsibility for the Tenant Improvements and Tenant will remedy, at Tenant’s own expense, and be responsible for any and all defects in the Tenant Improvements that may appear during or after the completion thereof whether the same shall affect the Tenant Improvements in particular or any parts of the Premises in general. Tenant shall indemnify, hold harmless and reimburse Landlord for any costs or expenses incurred by Landlord by reason of any defect in any portion of the Tenant Improvements constructed by Tenant or Tenant’s contractor or subcontractors, or by reason of inadequate cleanup following completion of the Tenant Improvements.
(g)Additional Services. If the construction of the Tenant Improvements shall require that additional services or facilities (including, but not limited to, hoisting, cleanup or other cleaning services, trash removal, field supervision, or ordering of materials) be provided by Landlord, then Tenant shall pay Landlord for such items at Landlord’s cost or at a reasonable charge if the item involves time of Landlord’s personnel only. Notwithstanding anything to the contrary herein, electrical power, utilities, parking, elevator and heating, ventilation and air conditioning shall be available to Tenant during normal business hours for construction and move-in purposes at no charge to Tenant.
(h)Coordination of Labor. All of Tenant’s contractors, subcontractors, employees, servants and agents must work in harmony with and shall not interfere with any labor employed by Landlord, or Landlord’s contractors or by any other tenant or its contractors with respect to the any portion of the Property. Notwithstanding anything to the contrary herein, nothing in this Work Letter shall, however, require Tenant to use union labor.
(i)Work in Adjacent Areas. Any work to be performed in areas adjacent to the Premises shall be performed only after obtaining Landlord’s express written permission, which shall not be unreasonably withheld, conditioned or delayed.
(j)HVAC Systems. Tenant agrees to be entirely responsible for the maintenance or the balancing of any heating, ventilating or air conditioning system installed by Tenant and/or maintenance of the electrical or plumbing work installed by Tenant and/or for maintenance of lighting fixtures, partitions, doors, hardware or any other installations made by Tenant.
(k)Coordination with Lease. Nothing herein contained shall be construed as (i) constituting Tenant as Landlord’s agent for any purpose whatsoever, or (ii) a waiver by Landlord or Tenant of any of the terms or provisions of the Lease. Any default by Tenant following the giving of notice and the passage of any applicable cure period with respect to any portion of this Work Letter shall be deemed a breach of the Lease for which Landlord shall have all the rights and remedies as in the case of a breach of said Lease.
(l)Approval of Plans. Landlord will not check Tenant drawings for building code compliance. Approval of the Final Plans by Landlord is not a representation that the drawings are in compliance with the requirements of governing authorities, and it shall be Tenant’s responsibility to meet and comply with all federal, state, and local code requirements. Approval of the Final Plans does not constitute assumption of responsibility by Landlord or its architect for their accuracy, sufficiency or efficiency, and Tenant shall be solely responsible for such matters. Where no time period is specified herein, Landlord shall respond to any consent or approval request within five (5) business days and Landlord’s failure to provide or reasonably refuse its consent within two (2) business days of a second written request (delivered after the expiration of the initial five (5) business day notice) shall be deemed Landlord’s consent or approval to the request.
(m)Tenant’s Deliveries. Tenant shall deliver to Landlord, at least five (5) days prior to the commencement of construction of Tenant’s Work, the following information:
(i)The names, addresses, telephone numbers, and primary contacts for the general, mechanical and electrical contractors Tenant intends to engage in the performance of Tenant’s Work; and
(ii)The date on which Tenant’s Work will commence, together with the estimated dates of completion of Tenant’s construction and fixturing work.
(n)Qualification of Contractors. Once the Final Plans have been proposed and approved, Tenant shall select and retain a contractor, subcontractors and vendors (such as HVAC engineers), subject to Landlord's approval, which shall not be unreasonably withheld, conditioned or delayed. All contractors, subcontractors and vendors engaged by Tenant shall be bondable and licensed, possessing good labor relations, capable of performing quality workmanship and working in harmony with Landlord's general contractor and other contractors on the job, if any, all as determined by Landlord. All Tenant Improvement Work shall be coordinated with any ongoing general construction work on the Site or in the Building, if any. Landlord hereby approves the following architect, contractor, subcontractors, and vendors: Hendy and KPRS.
(o)Warranties. Tenant shall cause its contractor to provide warranties for not less than one (1) year (or such shorter time as may be customary and available without additional expense to Tenant) against defects in workmanship, materials and equipment, which warranties shall run to the benefit of Landlord or shall be assignable to Landlord to the extent that Landlord is obligated to maintain any of the improvements covered by such warranties.
(p)Landlord’s Performance of Work. Within ten (10) business days after receipt of Landlord’s notice of Tenant’s failure to perform its obligations under this Work Letter, if Tenant shall fail to commence to cure such failure, Landlord shall have the right, but not the obligation, to perform, on behalf of and for the account of Tenant, subject to reimbursement of the cost thereof by Tenant, any and all of Tenant’s Work which Landlord determines, in its reasonable discretion, should be performed immediately and on an emergency basis for the best interest of the Premises including, without limitation, work which pertains to structural components, mechanical, sprinkler and general utility systems, roofing and removal of unduly accumulated construction material and debris; provided, however, Landlord shall give Tenant at least ten (10) business days prior notice to the performance of any of Tenant’s Work.
(q)As-Built Drawings. Tenant shall cause “As-Built Drawings” (excluding furniture, fixtures and equipment) to be delivered to Landlord and/or Landlord’s representative no later than sixty (60) days after the completion of Tenant’s Work. In the event these drawings are not received by such date, Landlord may, at its election, cause said drawings to be obtained and Tenant shall pay to Landlord, as additional rent, the cost of producing these drawings.
9.TEST FIT ALLOWANCE. In addition to the Allowance, Landlord shall provide a test-fit allowance, in an amount not to exceed $0.15 per rentable square foot of the Premises (i.e., up to $10,339.95, based on the Premises containing approximately 68,933 rentable square feet), to reimburse Tenant for preparation of the initial preliminary space plan for the layout of the Premises. Landlord shall disburse the test-fit allowance to Tenant within thirty (30) days following Tenant’s demand therefor, accompanied by a written invoice documenting Tenant’s out of pocket test- fit costs that have been incurred and paid by Tenant.
10.LANDLORD CAUSED DELAY
(a)Landlord Caused Delays. The Commencement Date shall occur as provided in Section 1.6 of the Summary, provided that the Commencement Date shall be extended by the number of days of delay of the substantial completion of the Tenant Improvements in the Premises or Tenant’s occupancy of the Premises and commencement of operations to the extent caused by a "Landlord Caused Delay," as that term is defined, below, but only to the extent such Landlord Caused Delay causes the substantial completion of the Tenant Improvements to occur after the initially scheduled Commencement Date. As used in this Work Letter, "Landlord Caused Delay" shall mean actual delays to the extent resulting from (i) the failure of Landlord to timely approve or disapprove the Space Plans, Final Plans or Work Cost Estimate; (ii) material and unreasonable (when judged in accordance with industry custom and practice) interference by Landlord, its agents or Landlord Parties (except as otherwise allowed under this Work Letter) with the substantial completion of the Tenant Improvements and which objectively preclude or delay the construction of tenant improvements in the Building by any person, which interference relates to access by Tenant, or Tenant's agents to the Building or any Building facilities (including loading docks and freight elevators) or service (including temporary power and parking areas as provided herein) during normal construction hours, or the use thereof during normal construction hours; and (iii) delays due to the acts or failures to act of Landlord with respect to payment of the Tenant Improvements (except as otherwise allowed under this Work Letter).
(b)Determination of Landlord Caused Delay. If Tenant contends that a Landlord Caused Delay has occurred, Tenant shall notify Landlord in writing within three (3) business days of each of (i) the event which constitutes such Landlord Caused Delay and (ii) the date upon which such Landlord Caused Delay ends. Tenant's failure to deliver either or both of such notices to Landlord within the required time period shall be deemed a waiver by Tenant of the contended Landlord Caused Delay.
If such action, inaction or circumstance described in the notice set forth in (i) above of this Section 10(b) of this Work Letter (the "Delay Notice") are not cured by Landlord within one (1) business days of Landlord's receipt of the Delay Notice ("Landlord’s Cure Period"), then a Landlord Caused Delay shall be deemed to have occurred commencing as of the day such Landlord Caused Delay commenced and ending as of the date such delay ends.
11.REMOVAL. All removal requirements for the Tenant Improvements are set forth in Section 13.2 of the Lease.
12.COVID DELAY. Notwithstanding anything to the contrary in this Work Letter or the Lease, if a statute, law, regulation, declaration of emergency or other decree or order is issued by a federal, California state or local governmental agency with jurisdiction over the Premises relating to the ongoing COVID-19 pandemic or a similar emergency related to infectious disease (collectively, a “Government Order”) and such Governmental Order results in a delay in the substantial completion of the Tenant Improvements (including, without limitation, delays in materials and labor resulting from the implementation of any Governmental Order or Voluntary Measure), then, provided that Tenant has applied commercial reasonably efforts in good faith to expeditiously complete the Tenant Improvements notwithstanding such Government Order, the date Tenant is otherwise obligated to pay Rent under the Lease shall be delayed one day for reach day of such interference or delay; provided, however, any such delay due to Government Order shall be offset by any days of Tenant Delays.
Schedule 1
Approved Space Plan
Schedule 2
Landlord’s Work
EXHTBTT D
NOTICE OF LEASE TERM DATES
Date:____________,_________
To: ________________________
Re: [Lease (describe lease title)_______________________] dated ___________,_______ (“Lease”) by and between
____________________, a __________________ (“Landlord”), and ___________________________________, a ____________________ (“Tenant”), for the premises commonly known as __________________________________
(“Premises”).
Dear:_________________:
In accordance with the above-referenced Lease, we wish to advise and/or confirm as follows:
•That Tenant has accepted and is in possession of the Premises and acknowledges the following:
•Term of the Lease:
•Commencement Date:
•Expiration Date:
•Rentable Square Feet:
•Tenant’s Percentage of Building:
•That in accordance with the Lease, rental payments have commenced on _________________________ and rent is payable in accordance with the following schedule:
Months Monthly Base Rent
•Rent is due and payable in advance on the first day of each and every month during the Term of the Lease.
Your rent checks should be made payable to: _____________________________
ACCEPTED AND AGREED
| TENANT: | LANDLORD: | ||||||||||
| By: | By: | ||||||||||
| Print Name: | |||||||||||
| Its: | Name: | ||||||||||
| Its: | |||||||||||
EXHIBIT E
RULES AND REGULATIONS
1.Tenant agrees that it shall comply with all fire and security regulations that may be issued from time to time by Landlord, and Tenant also shall provide Landlord with the name of a designated responsible employee to represent Tenant in all matters pertaining to such fire or security regulations. Tenant shall cooperate fully with Landlord in all matters concerning fire and other emergency procedures.
2.Tenant assumes any and all responsibility for protecting its Premises from theft, robbery and pilferage. Such responsibility shall include keeping doors locked and other means of entry to the Premises closed.
3.Tenant shall not lay linoleum, tile, carpet or other similar floor covering so that the same shall be affixed to the floor of the Premises in any manner except by a paste, or other material which may easily be removed with water, the use of cement or other similar adhesive materials being expressly prohibited. The method of affixing any such linoleum, tile, carpet or other similar floor covering shall be subject to the approval of Landlord. The expense of repairing any damage resulting from a violation of this rule shall be borne by Tenant.
4.Tenant shall not without Landlord’s consent, which may be given or withheld in Landlord’s sole and absolute discretion, receive, store, discharge, or transport firearms, ammunition, or weapons or explosives of any kind or nature at, on or from the Premises.
5.No vehicle or equipment of any kind shall be dismantled, repaired or serviced on the Common Area.
6.Signs will conform to sign standards and criteria established from time to time by Landlord. No other signs, placards, pictures, advertisements, names or notices shall be inscribed, displayed or printed or affixed on or to any part of the outside or inside of the building without the written consent of Landlord and Landlord shall have the right to remove any such non-conforming signs, placards, pictures, advertisements, names or notices without notice to and at the expense of Tenant.
7.No antenna, aerial, discs, dishes or other such device shall be erected on the roof or exterior walls of the Premises, or on the grounds, without the written consent of the Landlord in each instance. Any device so installed without such written consent shall be subject to removal without notice at any time.
8.No loud speakers, televisions, phonographs, radios or other devices shall be used in a manner so as to be heard or seen outside of the Premises without the prior written consent of the Landlord.
9.Tenant shall not place or permit any obstruction or materials in the outside areas immediately adjoining the Premises or permit any work to be performed outside the Premises, other than as provided in the Lease.
10.No open storage shall be permitted in the Property.
11.All garbage and refuse shall be placed in containers placed at the location designated for refuse collection, in the manner specified by Landlord.
12.No vending machine or machines of any description shall be installed, maintained or operated upon the Common Area except for the use of Tenant's employees.
13.Tenant shall not disturb, solicit, or canvass any occupant of the building and shall cooperate to prevent same.
14.No noxious or offensive trade or activity shall be carried on upon any units or any part of the Common Area nor shall anything be done thereon which would in any way interfere with the quiet enjoyment of each of the other tenants of the Project.
15.Landlord reserves the right to make such amendments to these rules and regulations from time to time as are reasonable and nondiscriminatory and not inconsistent with the Lease.
PARKING RULES AND REGULATIONS
In addition to any parking provisions contained in the Lease, the following rules and regulations shall apply with respect to the use of the Property’s parking facilities.
1.Every parker is required to park and lock his/her own vehicle. All responsibility for damage to or loss of vehicles is assumed by the parker and Landlord shall not be responsible for any such damage or loss by water, fire, defective brakes, the act or omissions of others, theft, or for any other cause.
2.Tenant shall not park or permit its employees to park in any parking areas designated by Landlord as areas for parking by visitors to the Property. Except as otherwise expressly provided in the Lease, Tenant shall not leave vehicles in the parking areas overnight nor park any vehicles in the parking areas other than automobiles, motorcycles, motor driven or non-motor driven bicycles or four wheeled trucks.
3.Except as otherwise expressly provided in the Lease, no extended term storage of vehicles shall be permitted.
4.All directional signs and arrows must be observed.
5.The speed limit within all parking areas shall be five (5) miles per hour.
6.Parking is prohibited: (a) in areas not striped for parking; (b) in aisles; (c) where “no parking” signs are posted; (d) on ramps; (e) in cross-hatched areas; and (f) in reserved spaces and in such other areas as may be designated by Landlord.
7.Washing, waxing, cleaning or servicing of any vehicle in any area not specifically reserved for such purpose is prohibited.
8.Landlord reserves the right to modify and/or adopt such other reasonable and non-discriminatory rules and regulations for the parking facilities as it deems necessary for the operation of the parking areas. Landlord may refuse to permit any person who violates these rules to park at the Property, and any violation of the rules shall subject the vehicle to removal, at such vehicle owner’s expense.
9.Tenant’s parking spaces shall be used only for parking by vehicles no larger than normally sized passenger automobiles, vans and sport utility vehicles. Tenant shall not permit or allow any vehicles that belong to or are controlled by Tenant or Tenant’s employees, suppliers, shippers, customers or invitees to be loaded, unloaded, or parked in areas other than those designated by Landlord for such activities. If Tenant permits or allows any of the prohibited activities described herein, then Landlord shall have the right, in addition to such other rights and remedies that it may have, to remove or tow away the vehicle involved and charge the cost thereof to Tenant, which cost shall be payable by Tenant upon demand by Landlord.
In the event of a conflict between the terms of this Exhibit E and the other terms of the Lease, Summary, Work Letter or other Exhibits or Riders hereto, the terms of the Lease, Summary, Work Letter or other Exhibits or Riders shall control.
EXHIBIT F
ESTOPPEL CERTIFICATE
The undersigned (“Tenant”) hereby certifies to ______________________________________________________(“Landlord”), and ________________________________________________________________, as follows:
1.Attached hereto is a true, correct and complete copy of that certain Lease dated _________________________, between
Landlord and Tenant (the“Lease”), for the premises commonly known as ____________________________________________(the “Premises”). The Lease is now in full force and effect and has not been amended, modified or supplemented, except as set forth in Section 6 below.
2.The term of the Lease commenced on ___________________,___.
3.The term of the Lease is currently scheduled to expire on___________________,___.
4.Tenant has no option to renew or extend the Term of the Lease except: _______________________________.
5.Tenant has no preferential right to purchase the Premises or any portion of the Building/Premises except: _____________________________________________________________________.
6.The Lease has: (Initial One)
( ) not been amended, modified, supplemented, extended, renewed or assigned.
( ) been amended, modified, supplemented, extended, renewed or assigned by the following described
agreements, copies of which are attached hereto: ____________________________________________.
7.Tenant has accepted and is now in possession of the Premises and has not sublet, assigned or encumbered the Lease, the Premises or any portion thereof except as follows: ______________________________________________________.
8.The current Base Rent is $______________; and current monthly parking charges are $______________.
9.The amount of security deposit (if any) is $______________. No other security deposits have been made.
10.All rental payments payable by Tenant have been paid in full as of the date hereof. No rent under the Lease
has been paid for more than thirty (30) days in advance of its due date.
11.All work required to be performed by Landlord under the Lease has been completed and has been accepted by Tenant, and all tenant improvement allowances have been paid in full except _________________________.
12.As of the date hereof, Tenant has no actual knowledge of any defaults on the part of Landlord under the Lease except _________________________.
13.As of the date hereof, to Tenant's actual knowledge, there are no defaults on the part of Tenant under the Lease.
14.As of the date hereof, to Tenant's actual knowledge, Tenant has no defense as to its obligations under the Lease and claims no set-off or counterclaim against Landlord.
15.Tenant has no right to any concession (rental or otherwise) or similar compensation in connection with renting the space it occupies, except as expressly provided in the Lease.
16.To Tenant's actual knowledge, all insurance required of Tenant under the Lease has been provided by Tenant and all premiums have been paid.
17.There has not been filed by or, to Tenant's actual knowledge, against Tenant a petition in bankruptcy, voluntary or otherwise, any assignment for the benefit of creditors, any petition seeking reorganization or arrangement under the bankruptcy laws of the United States or any state thereof, or any other action brought pursuant to such bankruptcy laws with respect to Tenant.
18.Tenant pays rent due Landlord under the Lease to Landlord and does not have any knowledge of any other person who has any right to such rents by collateral assignment or otherwise.
The foregoing certification is made with the knowledge that _____________________________________ is about to [fund a loan to Landlord or purchase the Building from Landlord], and that _____________________________________ is relying upon the representations herein made in [funding such loan or purchasing the Building].
Dated: _________________,______.
“TENANT” _______________________________________________________
By: ____________________________________________________
Print Name: _____________________________________________
Its: ____________________________________________________
RIDER NO.1 TO LEASE
EXTENSION OPTION
This Rider No. 1 is made and entered into by and between KATELLA/HOLDER STREET, LLC, a Delaware limited liability company (“Landlord”), and IRHYTHM TECHNOLOGIES, INC., a Delaware corporation (“Tenant”), as of the day and year of the Lease between Landlord and Tenant to which this Rider is attached. Landlord and Tenant hereby agree that, notwithstanding anything contained in the Lease to the contrary, the provisions set forth below shall be deemed to be part of the Lease and shall supersede any inconsistent provisions of the Lease. All references in the Lease and in this Rider to the “Lease” shall be construed to mean the Lease (and all Exhibits and Riders attached thereto), as amended and supplemented by this Rider. All capitalized terms not defined in this Rider shall have the same meaning as set forth in the Lease.
1.Subject to Rider No. 5 entitled, “Options in General”, Landlord hereby grants to Tenant one (1) option (the “Extension Option”) to extend the Term of the Lease for one (1) additional period of five (5) years (the “Option Term”), on the same terms, covenants and conditions as provided for in the Lease during the initial Term, except for the Monthly Base Rent, which shall initially be equal to the “fair market rental rate” for the Premises for the Option Term as defined and determined in accordance with the provisions of the Fair Market Rental Rate Rider attached to the Lease as Rider No. 2, subject to fair market annual rent adjustments during the Option Term.
2.The Extension Option must be exercised, if at all, by written notice (“Extension Notice”) delivered by Tenant to Landlord no sooner than that date which is fifteen (15) months and no later than that date which is twelve (12) months prior to the expiration of the then current Term of the Lease. Provided Tenant has properly and timely exercised the Extension Option, the then current Term of the Lease shall be extended by the Option Term, and all terms, covenants and conditions of the Lease shall remain unmodified and in full force and effect, except that the Monthly Base Rent shall be as set forth above and except that there shall be no remaining Extension Option.
RIDER NO. 2 TO LEASE
FAIR MARKET RENTAL RATE
FAIR MARKET RENTAL RATE
This Rider No. 2 is made and entered into by and between KATELLA/HOLDER STREET, LLC, a Delaware limited liability company (“Landlord”), and IRHYTHM TECHNOLOGIES, INC., a Delaware corporation (“Tenant”), as of the day and year of the Lease between Landlord and Tenant to which this Rider is attached. Landlord and Tenant hereby agree that, notwithstanding anything contained in the Lease to the contrary, the provisions set forth below shall be deemed to be part of the Lease and shall supersede any inconsistent provisions of the Lease. All references in the Lease and in this Rider to the “Lease” shall be construed to mean the Lease (and all Exhibits and Riders attached thereto), as amended and supplemented by this Rider. All capitalized terms not defined in this Rider shall have the same meaning as set forth in the Lease.
1.The term “fair market rental rate” as used in this Rider and any Rider attached to the Lease means the annual amount per square foot, projected for each year of the Option Term (including annual adjustments), that a willing, non-equity tenant (excluding sublease and assignment transactions) would pay, and a willing landlord of a comparable quality building located in the Cypress, California area would accept, in an arm’s length transaction (what Landlord is accepting in then current transactions for the Building may be used for purposes of projecting rent for the Option Term), for space of comparable size, quality and floor height as the Premises, taking into account the age, quality and layout of the existing improvements in the Premises (but excluding any improvements installed at Tenant’s cost), and taking into account items that professional real estate brokers or professional real estate appraisers customarily consider, including, but not limited to, rental rates, space availability, tenant size, tenant improvement allowances, parking charges and any other lease considerations, if any, then being charged or granted by Landlord or the lessors of such similar buildings. All economic terms other than Monthly Base Rent, such as tenant improvement allowance amounts, if any, operating expense allowances, parking charges, etc., will be factored into the determination of the fair market rental rate for the Option Term. Accordingly, the fair market rental rate will be an effective rate, not specifically including, but accounting for, the appropriate economic considerations described above.
2.Landlord shall provide written notice of Landlord’s determination of the fair market rental rate not later than sixty (60) days after the last day upon which Tenant may timely exercise the right giving rise to the necessity for such fair market rental rate determination. Tenant shall have thirty (30) days (“Tenant’s Review Period”) after receipt of Landlord’s notice of the fair market rental rate within which to accept such fair market rental rate or to reasonably object thereto in writing. Failure of Tenant to so object to the fair market rental rate submitted by Landlord in writing within Tenant’s Review Period shall conclusively be deemed Tenant’s disapproval and rejection thereof. If within Tenant’s Review Period Tenant reasonably objects to or is deemed to have disapproved the fair market rental rate submitted by Landlord, Landlord and Tenant will meet together with their respective real estate brokers and legal counsel to present and discuss their individual determinations of the fair market rental rate for the Premises under the parameters set forth in Paragraph 1 above and shall diligently and in good faith attempt to negotiate a rental rate on the basis of such individual determinations. Such meeting shall occur no later than ten (10) days after the expiration of Tenant’s Review Period. The parties shall each provide the other with such supporting information and documentation as they deem appropriate. At such meeting if Landlord and Tenant are unable to agree upon the fair market rental rate, they shall each submit to the other their respective best and final offer as to the fair market rental rate. If Landlord and Tenant fail to reach agreement on such fair market rental rate within five (5) business days following such a meeting (the “Outside Agreement Date”), then Landlord and Tenant shall submit each party’s determination to appraisal in accordance with the provisions of Section 3 below.
3.(a) Landlord and Tenant shall each appoint one (1) independent appraiser who shall by profession be an M.A.I. certified real estate appraiser who shall have been active over the five (5) year period ending on the date of such appointment in the leasing of commercial (including office) properties in the Cypress, California area. The determination of the appraisers shall be limited solely to the issue of whether Landlord’s or Tenant’s last proposed (as of the Outside Agreement Date) best and final fair market rental rate for the Premises is the closest to the actual fair market rental rate for the Premises as determined by the appraisers, taking into account the requirements specified in Section 1 above. Each such appraiser shall be appointed within ten (10) business days after the Outside Agreement Date.
(b)The two (2) appraisers so appointed shall within ten (10) business days after the date of the appointment of the last appointed appraiser agree upon and appoint a third appraiser who shall be qualified under the same criteria set forth hereinabove for qualification of the initial two (2) appraisers.
(c)The three (3) appraisers shall within ten (10) business days after the appointment of the third appraiser reach a decision as to whether the parties shall use Landlord’s or Tenant’s submitted best and final fair market rental rate, and shall notify Landlord and Tenant thereof. During such ten (10) business day period, Landlord and Tenant may submit to the appraisers such information and documentation to support their respective positions as they shall deem reasonably relevant and Landlord and Tenant may each appear before the appraisers jointly to question and respond to questions from the appraisers.
(d)The decision of the majority of the three (3) appraisers shall be binding upon Landlord and Tenant and neither party shall have the right to reject the decision or to undo the exercise of the applicable Option. If either Landlord or Tenant fails to appoint an appraiser within the time period specified in Section 3(a) hereinabove, the appraiser appointed by one of them shall within ten (10) business days following the date on which the party failing to appoint an appraiser could have last appointed such appraiser reach a decision based upon the same procedures as set forth above (i.e., by selecting either Landlord’s or Tenant’s submitted best and final fair market rental rate), and shall notify Landlord and Tenant thereof, and such appraiser’s decision shall be binding upon Landlord and Tenant and neither party shall have the right to reject the decision or to undo the exercise of the applicable Option.
(e)If the two (2) appraisers fail to agree upon and appoint a third appraiser, either party, upon ten (10) days written notice to the other party, can apply to the Presiding Judge of the Superior Court of Orange County to appoint a third appraiser meeting the qualifications set forth herein. The third appraiser, however, selected shall be a person who has not previously acted in any capacity for either party.
(f)The cost of each party’s appraiser shall be the responsibility of the party selecting such appraiser, and the cost of the third appraiser (or arbitration, if necessary) shall be shared equally by Landlord and Tenant.
(g)If the process described hereinabove has not resulted in a selection of either Landlord’s or Tenant’s submitted best and final fair market rental rate by the commencement of the applicable Option Term, then, as of the commencement of the Option Term, Tenant shall be required to pay Monthly Base Rent in an amount equal to the Monthly Base Rent in effect at the end of the initial Term, but in no event shall such amount be greater than Landlord's best and final determination of the fair market rental rate submitted to the appraiser and in no event less than Tenant's best and final determination of the fair market rental rate submitted to the appraiser. Upon the final determination of the fair market rental rate, the payments made by Tenant shall be reconciled with the actual amounts of Monthly Base Rent due during the Option Term, and the appropriate party shall make any corresponding payment to the other party within thirty (30) days after the final determination of the fair market rental rate. The parties shall enter into an amendment to this Lease confirming the terms of the decision.
RIDER NO. 3 TO LEASE
EXPANSION OPTION RIDER
EXPANSION OPTION RIDER
This Rider No. 3 is made and entered into by and between KATELLA/HOLDER STREET, LLC, a Delaware limited liability company (“Landlord”), and IRHYTHM TECHNOLOGIES, INC., a Delaware corporation (“Tenant”), as of the day and year of the Lease between Landlord and Tenant to which this Rider is attached. Landlord and Tenant hereby agree that, notwithstanding anything contained in the Lease to the contrary, the provisions set forth below shall be deemed to be part of the Lease and shall supersede any inconsistent provisions of the Lease. All references in the Lease and in this Rider to the “Lease” shall be construed to mean the Lease (and all exhibits and Riders attached thereto), as amended and supplemented by this Rider. All capitalized terms not defined in this Rider shall have the same meaning as set forth in the Lease.
1.Subject to the terms and conditions of this Rider No. 3 and Rider No. 5, entitled “Options in General”, Landlord hereby grants to Tenant the one-time option to expand (“Expansion Option”) into that certain office space within the Building located contiguous to the Premises consisting of approximately 25,000 rentable square feet, as depicted in Schedule 1 to Rider No. 3 attached hereto (the “Expansion Space”), which Expansion Option must be exercised on or before the date Landlord enters into a lease with a third-party following the Effective Date. For the avoidance of doubt, if Tenant does not deliver to Landlord the Expansion Notice following the Effective Date, and Landlord leases the Expansion Space to a third party following the Effective Date and prior to Tenant’s delivery to Landlord of the Expansion Notice, then the Expansion Option shall terminate, and Tenant shall have no right to lease the Expansion Space in accordance with this Rider No. 3. Tenant must exercise its Expansion Option by providing Landlord with written notice of its election to exercise the Expansion Option (“Expansion Notice”) at any time within the initial Term (the “Option Exercise Period”). The Term as to the Expansion Space shall be coterminous with the Term with respect to the original Premises as the same may be extended pursuant to Tenant’s Extension Option. If Tenant exercises its Expansion Option within the Option Exercise Period, then commencing upon delivery of the Expansion Space to Tenant in the required condition (the “Expansion Space Commencement Date”), the Monthly Base Rent for the Expansion Space shall be adjusted to the “fair market rental rate” as defined and determined in accordance with the provisions of the Fair Market Rental Rate Rider attached to the Lease as Rider No. 2, subject to fair market annual rent adjustments during the Term; provided, that, Landlord shall provide written notice of Landlord’s initial determination of the fair market rental rate not later than ten (10) business days after Landlord’s receipt of the Expansion Notice. If Tenant exercises its Expansion Option within the Option Exercise Period, Landlord shall deliver the Expansion Space to Tenant in vacant, broom clean condition, with all Building Systems in good working order, and in compliance with all Laws to the extent such compliance is required in order to allow Tenant to obtain a demolition or construction permit or other governmental approvals for the construction of the Tenant Improvements.
2.Subject to the foregoing provisions of this Rider No. 3, Tenant’s lease of the Expansion Space will be on the same terms and conditions as affect the original Premises; provided, however, effective upon the Expansion Space Commencement Date: (i) Tenant’s Percentage will be increased to take into account the additional square footage of the Expansion Space within the Building and all figures in this Lease affected by the addition of the square footage of the Expansion Space to the Premises will be adjusted accordingly; (ii) Tenant will not be entitled to any economic concessions applicable to the original Premises pursuant to the provisions of this Lease; (iii) Tenant shall deposit an additional deposit in an amount reasonably determined by Landlord based on Tenant’s financial condition at the time it exercises the Expansion Notice, in an amount not to exceed an amount that is proportionate to the Security Deposit for the original Premises; (iv) the improvement of the Expansion Space will be subject to the provisions of Paragraph 3 below; and (v) Tenant will be entitled to a pro rata increase to the number of parking spaces allocated to Tenant under the Lease.
3.Within ten (10) days following Tenant’s delivery of the Expansion Notice to Landlord, the parties will execute an amendment to the Lease in order to include the Expansion Space as part of the Premises and to document the terms of Tenant’s lease thereof. Except as otherwise set forth herein, the Expansion Space will be delivered to Tenant and Tenant shall accept the Expansion Space from Landlord in its “AS IS” condition.
4.Any termination of the Lease shall terminate all rights of Tenant with respect to the Expansion Space. The Expansion Option shall not be severable from the Lease, nor may the Expansion Option be assigned or otherwise conveyed in connection with any permitted assignment of the Lease other than to a Permitted Transferee. Landlord’s consent to any assignment of the Lease shall not be construed as allowing an assignment or a conveyance of the Expansion Option to any assignee.
5.Tenant shall have no right to exercise the Expansion Option, notwithstanding any provision hereof to the contrary, (a) during the time commencing from the date Landlord gives to Tenant a notice of default pursuant to Article 22 of this Lease and continuing until the noncompliance alleged in said notice of default is cured, or (b) during the period of time commencing on the day after a monetary obligation to Landlord is due from Tenant and unpaid (without any necessity for notice thereof to Tenant) and continuing until the obligation is paid, or (c) if Landlord has given to Tenant three or more notices of default under Article 22 of this Lease that remain uncured beyond applicable notice and cure periods, (d) if Tenant has committed any non-curable breach, or is otherwise in default of any of the terms, covenants or conditions of this Lease, or (e) if Tenant fails to timely exercise its Expansion Option within the Option Exercise Period. The provisions of this Paragraph 5 shall also apply to a Permitted Transferee.
SCHEDULE 1 TO RIDER NO. 3
EXPANSION SPACE
EXPANSION SPACE
RIDER NO. 4 TO LEASE
TERMINATION OPTION RIDER
TERMINATION OPTION RIDER
This Rider No. 4 is made and entered into by and between KATELLA/HOLDER STREET, LLC, a Delaware limited liability company (“Landlord”), and IRHYTHM TECHNOLOGIES, INC., a Delaware corporation (“Tenant”), as of the day and year of the Lease between Landlord and Tenant to which this Rider is attached. Landlord and Tenant hereby agree that, notwithstanding anything contained in the Lease to the contrary, the provisions set forth below shall be deemed to be part of the Lease and shall supersede any inconsistent provisions of the Lease. All references in the Lease and in this Rider to the “Lease” shall be construed to mean the Lease (and all exhibits and Riders attached thereto), as amended and supplemented by this Rider. All capitalized terms not defined in this Rider shall have the same meaning as set forth in the Lease.
1.Subject to the terms of this Rider No. 4 and Rider No. 5, entitled “Options In General”, and notwithstanding anything to the contrary contained in the Lease, Tenant will have the one-time option to terminate and cancel the Lease (“Termination Option”), effective as of 11:59 p.m. on the last day of the ninetieth (90th) full calendar month of the initial Term (“Termination Date”), by delivering to Landlord, on or before the date which is nine (9) months prior to the Termination Date, written notice of Tenant’s exercise of its Termination Option. As a condition to the effectiveness of Tenant’s exercise of its Termination Option and in addition to Tenant’s obligation to satisfy all other monetary and non-monetary obligations arising under this Lease through to the Termination Date, Tenant shall pay to Landlord the following “Termination Consideration”: (a) the then unamortized value of the following (amortized over the initial Term together with interest at the rate of eight percent (8%) per annum): (i) the portion of the Allowance calculated based on the rentable area of the Premises, exclusive of $675,000 (i.e., $2,678,875.00 of the Allowance), (ii) the Abated Amount set forth in Section 1.8 of the Lease, and (iii) brokerage commissions paid by Landlord in connection with the execution of this Lease attributable to the portion of the Term remaining following the Termination Date; plus (b) $540,956.65. The Termination Consideration shall be due and payable by Tenant to Landlord concurrently with Tenant’s delivery of notice to Landlord of the exercise of the Termination Option. If Tenant properly and timely exercises its Termination Option and properly and timely delivers the Termination Consideration to Landlord as set forth above, then the Lease will terminate as of midnight on the Termination Date.
2.Upon determination of the final unamortized value of the Allowance, Abated Amount, and the brokerage commissions, Landlord and Tenant shall enter into an amendment acknowledging the total Termination Consideration.
RIDER NO. 5 TO LEASE
OPTIONS IN GENERAL
OPTIONS IN GENERAL
This Rider No. 5 is made and entered into by and between KATELLA/HOLDER STREET, LLC, a Delaware limited liability company (“Landlord”), and IRHYTHM TECHNOLOGIES, INC., a Delaware corporation (“Tenant”), as of the day and year of the Lease between Landlord and Tenant to which this Rider is attached. Landlord and Tenant hereby agree that, notwithstanding anything contained in the Lease to the contrary, the provisions set forth below shall be deemed to be part of the Lease and shall supersede any inconsistent provisions of the Lease. All references in the Lease and in this Rider to the “Lease” shall be construed to mean the Lease (and all exhibits and Riders attached thereto), as amended and supplemented by this Rider. All capitalized terms not defined in this Rider shall have the same meaning as set forth in the Lease.
1.Definition. As used in this Lease and any Rider or Exhibit attached hereto, the word “Option” has the following meaning:
(i)The Extension Option pursuant to Rider No. 1 herein;
(ii)The Expansion Option pursuant to Rider No. 2 herein; and
(ii) The Termination Option pursuant to Rider No. 3 herein.
2.Options Personal. Each Option granted to Tenant is personal to the original Tenant executing this Lease and any Permitted Transferee and may be exercised only by the original Tenant executing this Lease or such Permitted Transferee while leasing the entire Premises and without having assigned this Lease or sublet any portion of the Premises (other than to a Permitted Transferee), and may not be exercised or be assigned, voluntarily or involuntarily, by any person or entity other than the original Tenant executing this Lease and any Permitted Transferee. The Options, if any, granted to Tenant under this Lease are not assignable separate and apart from this Lease, nor may any Option be separated from this Lease in any manner, either by reservation or otherwise.
3.Effect of Default on Options. Except with respect to the Termination Option, Tenant will have no right to exercise any Option, notwithstanding any provision of the grant of option to the contrary, and Tenant’ s exercise of any Option may be nullified by Landlord and deemed of no further force or effect, if Tenant is in Default of any monetary obligation or material non-monetary obligation under the terms of this Lease as of Tenant’s exercise of the Option in question or at any time after the exercise of any such Option and prior to the commencement of the Option event, or (ii) Landlord has given Tenant three (3) or more notices of default that remained uncured beyond applicable notice and cure periods during any twelve (12) consecutive month period of this Lease.
4.Options as Economic Terms. Each Option is hereby deemed an economic term which Landlord, in its sole and absolute discretion, may or may not offer in conjunction with any future extensions of the Term.