Item 2. Management’s Discussion and Analysis of Financial Condition and Results of Operations
Cautionary Notice Regarding Forward-Looking Statements
The following discussion and analysis of our financial condition and results of operations for the three months ended September 30, 2022 and 2021 should be read in conjunction with our consolidated financial statements and related notes to those financial statements that are included elsewhere in this report. Our discussion includes forward-looking statements based upon current expectations that involve risks and uncertainties, such as our plans, objectives, expectations and intentions. Actual results and the timing of events could differ materially from those anticipated in these forward-looking statements as a result of a number of factors, including those set forth under “Risk Factors” in our Annual Report on Form 10-K for the fiscal year ended June 30, 2022.
We use words such as “anticipate,” “estimate,” “plan,” “project,” “continuing,” “ongoing,” “expect,” “believe,” “intend,” “may,” “will,” “should,” “could,” and similar expressions to identify forward-looking statements. All forward-looking statements included in this report are based on information available to us on the date hereof and, except as required by law, we assume no obligation to update any such forward-looking statements.
Overview
Research Solutions was incorporated in the State of Nevada on November 2, 2006, and is a publicly traded holding company with three wholly owned subsidiaries at June 30, 2022: Reprints Desk, Inc., a Delaware corporation, Reprints Desk Latin America S. de R.L. de C.V, an entity organized under the laws of Mexico, and RESSOL LA, S. DE R.L. DE C.V., an entity organized under the laws of Mexico.
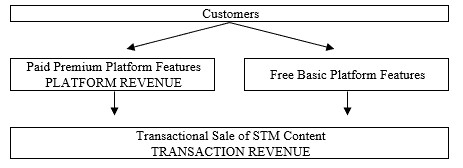
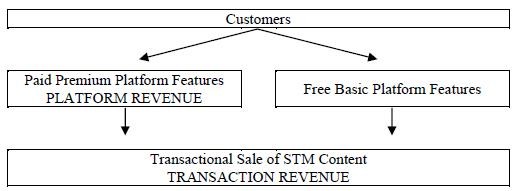
We provide two service offerings to our customers: a cloud-based software-as-a-service (“SaaS”) research platform (“Platforms”) typically sold via annual auto-renewing license agreements and the sale of published scientific, technical, and medical (“STM”) content sold as individual articles (“Transactions”) either stand alone or via the Platform. When customers utilize the Platform to purchase Transactions it is packaged as a single solution that enables life science and other research intensive organizations to accelerate their research and development activities with faster, access and management of STM articles used throughout the intellectual property development lifecycle. The Platform typically delivers a ROI to the customer via more effectively managing Transaction costs and saving researchers time during the research process.
Platforms
Our cloud-based SaaS research Platform consists of proprietary software and Internet-based interfaces sold to customers for an annual subscription fee. Legacy functionality allows customers to initiate orders, route orders for the lowest cost acquisition, manage transactions, obtain spend and usage reporting, automate authentication, and connect seamlessly to in-house and third-party software systems. Customers can also enhance the information resources they already own or license and collaborate around bibliographic information.
Additional functionality has recently been added to our Platform in the form of interactive app-like components. An alternative to manual data filtering, identification and extraction, the apps are designed to gather, augment, and extract data across a variety of formats, including bibliographic citations, tables of contents, RSS feeds, PDF files, XML feeds, and web content. We continue to develop new apps in order to build an ecosystem of apps. Together, these apps will provide researchers with an “all in one” toolkit, delivering efficiencies in core research workflows and knowledge creation processes.
Our Platform is deployed as a single, multi-tenant system across our entire customer base. Customers securely access the Platform through online web interfaces and via web service APIs that enable customers to leverage Platform features and functionality from within in-house and third-party software systems. The Platform can also be configured to satisfy a customer’s individual preferences. We leverage our Platform’s efficiencies in scalability, stability and development costs to fuel rapid innovation and competitive advantage.