UNITED STATES
SECURITIES AND EXCHANGE COMMISSION
Washington, D.C. 20549
________________________________
Form 10-K
(Mark One)
x | ANNUAL REPORT PURSUANT TO SECTION 13 OR 15(d) OF THE SECURITIES EXCHANGE ACT OF 1934 |
For the fiscal year ended June 30, 2017 or | |
¨ | TRANSITION REPORT PURSUANT TO SECTION 13 OR 15(d) OF THE SECURITIES EXCHANGE ACT OF 1934 |
Commission File Number 001-33278
______________________________
AVIAT NETWORKS, INC.
(Exact name of registrant as specified in its charter)
______________________________
Delaware | 20-5961564 | |
(State or other jurisdiction of incorporation or organization) | (I.R.S. Employer Identification No.) | |
860 N. McCarthy Blvd., Suite 200, Milpitas, California | 95035 | |
(Address of principal executive offices) | (Zip Code) | |
Registrant’s telephone number, including area code: (408) 941-7100 Securities registered pursuant to Section 12(b) of the Act: | ||
Title of Each Class | Name of Each Exchange on Which Registered | |
Common Stock, par value $0.01 per share Preferred Shares Purchase Rights | NASDAQ Stock Market LLC (NASDAQ Global Select Market) | |
Securities registered pursuant to Section 12(g) of the Act: None
_____________________________________________
Indicate by check mark if the registrant is a well-known seasoned issuer, as defined in Rule 405 of the Securities Act. Yes o No x
Indicate by check mark if the registrant is not required to file reports pursuant to Section 13 or Section 15(d) of the Act. Yes o No x
Indicate by check mark whether the registrant (1) has filed all reports required to be filed by Section 13 or 15(d) of the Securities Exchange Act of 1934 during the preceding 12 months (or for such shorter period that the registrant was required to file such reports), and (2) has been subject to such filing requirements for the past 90 days. Yes o No x
Indicate by check mark whether the registrant has submitted electronically and posted on its corporate Web site, if any, every Interactive Data File required to be submitted and posted pursuant to Rule 405 of Regulation S-T (§232.405 of this chapter) during the preceding 12 months (or for such shorter period that the registrant was required to submit and post such files). Yes x No o
Indicate by check mark if disclosure of delinquent filers pursuant to Item 405 of Regulation S-K (§229.405 of this chapter) is not contained herein, and will not be contained, to the best of registrant’s knowledge, in definitive proxy statements incorporated by reference in Part III of this Form 10-K or any amendment to this Form 10-K. x
Indicate by check mark whether the registrant is a large accelerated filer, an accelerated filer, a non-accelerated filer, or a smaller reporting company. See the definitions of “large accelerated filer,” “accelerated filer” and “smaller reporting company” in Rule 12b-2 of the Exchange Act. (Check one):
Large accelerated filer | o | Accelerated filer | o | |
Non-accelerated filer | x (Do not check if a smaller reporting company) | Smaller reporting company | o | |
Emerging growth company | o | |||
If an emerging growth company, indicate by check mark if the registrant has elected not to use the extended transition period for complying with any new or revised financial accounting standards provided pursuant to Section 13(a) of the Exchange Act. o
Indicate by check mark whether the registrant is a shell company (as defined in Rule 12b-2 of the Exchange Act). Yes o No x
As of December 30, 2016, the aggregate market value of the registrant’s common stock held by non-affiliates was approximately $46.0 million. For purposes of this calculation, the registrant has assumed that its directors, executive officers and holders of 5% or more of the outstanding common stock are affiliates.
As of August 17, 2017, there was 5,317,957 shares of the registrant’s common stock outstanding.
_________________________________
DOCUMENTS INCORPORATED BY REFERENCE
Portions of the registrant’s definitive Proxy Statement for its Annual Meeting of Stockholders, which will be filed with the Securities and Exchange Commission within 120 days after the end of the registrant’s fiscal year ended June 30, 2017, are incorporated by reference into Part III of this Annual Report on Form 10-K.
AVIAT NETWORKS, INC.
ANNUAL REPORT ON FORM 10-K
For the Fiscal Year Ended June 30, 2017
Table of Contents
Item 1. | ||
Item 1A. | ||
Item 1B. | ||
Item 2. | ||
Item 3. | ||
Item 4. | ||
Item 5. | ||
Item 6. | ||
Item 7. | ||
Item 7A. | ||
Item 8. | ||
Item 9. | ||
Item 9A. | ||
Item 9B. | ||
Item 10. | ||
Item 11. | ||
Item 12. | ||
Item 13. | ||
Item 14. | ||
Item 15. | ||
2
CAUTIONARY STATEMENT REGARDING FORWARD-LOOKING STATEMENTS
This Annual Report on Form 10-K, including “Item 7. Management’s Discussion and Analysis of Financial Condition and Results of Operations,” contains forward-looking statements that involve risks and uncertainties, as well as assumptions that, if they do not materialize or prove correct, could cause our results to differ materially from those expressed or implied by such forward-looking statements. All statements other than statements of historical fact are statements that could be deemed forward-looking statements, including statements of, about, concerning or regarding: our plans, strategies and objectives for future operations, including with respect to growing our business and sustaining profitability; our restructuring efforts; our research and development efforts and new product releases and services; trends in revenue; drivers of our business and the markets in which we operate; future economic conditions; performance or outlook and changes in our industry and the markets we serve; the outcome of contingencies; the value of our contract awards; beliefs or expectations; the sufficiency of our cash and our capital needs and expenditures; our intellectual property protection; our compliance with regulatory requirements and the associated expenses; expectations regarding litigation; our intention not to pay cash dividends; seasonality of our business; the impact of foreign exchange and inflation; taxes; and assumptions underlying any of the foregoing. Forward-looking statements may be identified by the use of forward-looking terminology, such as “anticipates,” “believes,” “expects,” “may,” “should,” “would,” “will,” “intends,” “plans,” “estimates,” “strategy,” “projects,” “targets,” “goals,” “seeing,” “delivering,” “continues,” “forecasts,” “future,” “predict,” “might,” “could,” “potential,” or the negative of these terms, and similar words or expressions.
These forward-looking statements are based on estimates reflecting the current beliefs of the senior management of Aviat Networks. These forward-looking statements involve a number of risks and uncertainties that could cause actual results to differ materially from those suggested by the forward-looking statements. Forward-looking statements should therefore be considered in light of various important factors, including those set forth in this Annual Report on Form 10-K. Important factors that could cause actual results to differ materially from estimates or projections contained in the forward-looking statements include, but are not limited to, the following:
• | continued price and margin erosion as a result of increased competition in the microwave transmission industry; |
• | the impact of the volume, timing and customer, product and geographic mix of our product orders; |
• | our ability to meet financial covenant requirements which could impact, among other things, our liquidity; |
• | the timing of our receipt of payment for products or services from our customers; |
• | our ability to meet projected new product development dates or anticipated cost reductions of new products; |
• | our suppliers’ inability to perform and deliver on time as a result of their financial condition, component shortages or other supply chain constraints; |
• | customer acceptance of new products; |
• | the ability of our subcontractors to timely perform; |
• | continued weakness in the global economy affecting customer spending; |
• | retention of our key personnel; |
• | our ability to manage and maintain key customer relationships; |
• | uncertain economic conditions in the telecommunications sector combined with operator and supplier consolidation; |
• | our failure to protect our intellectual property rights or defend against intellectual property infringement claims by others; |
• | the results of our restructuring efforts; |
• | the ability to preserve and use our net operating loss carryforwards; |
• | the effects of currency and interest rate risks; |
• | the conduct of unethical business practices in developing countries; and |
• | the impact of political turmoil in countries where we have significant business. |
Other factors besides those listed here also could adversely affect us. See “Item 1A. Risk Factors” in this Annual Report on Form 10-K for more information regarding factors that may cause our results to differ materially from those expressed or implied by the forward-looking statements contained in this Annual Report on Form 10-K.
You should not place undue reliance on these forward-looking statements, which reflect our management’s opinions only as of the date of the filing of this Annual Report on Form 10-K. Forward-looking statements are made in reliance upon the safe harbor provisions of Section 27A of the Securities Act of 1933, as amended, and Section 21E of the Securities Exchange Act of 1934, as amended, along with provisions of the Private Securities Litigation Reform Act of 1995, and we
3
undertake no obligation, other than as imposed by law, to update any forward-looking statements to reflect further developments or information obtained after the date of filing of this Annual Report on Form 10-K or, in the case of any document incorporated by reference, the date of that document.
4
PART I
Item 1. Business
Aviat Networks, Inc., together with its subsidiaries, is a global supplier of microwave networking solutions, backed by an extensive suite of professional services and support. Aviat Networks, Inc. may be referred to as “the Company,” “AVNW,” “Aviat Networks,” “we,” “us” and “our” in this Annual Report on Form 10-K.
We were incorporated in Delaware in 2006 to combine the businesses of Harris Corporation’s Microwave Communications Division (“MCD”) and Stratex Networks, Inc. (“Stratex”). On January 28, 2010, we changed our corporate name from Harris Stratex Networks, Inc. to Aviat Networks, Inc.
Our principal executive offices are located at 860 North McCarthy Boulevard, Suite 200, Milpitas, California 95035, and our telephone number is (408) 941-7100. Our common stock is listed on the NASDAQ Global Select Market under the symbol AVNW. As of June 30, 2017, we employed approximately 710 people, compared with approximately 720 people as of July 1, 2016.
Overview and Description of the Business
We design, manufacture and sell a range of wireless networking products, solutions and services to mobile and fixed public network operators, private network operators, Federal, State and Local government agencies, transportation, energy and utility companies, public safety agencies and broadcast network operators around the world. We sell products and services directly to our customers, and also, to a lesser extent, use agents and resellers.
Our products utilize microwave and millimeter wave technologies to create point to point wireless links for short, medium and long distance interconnections. Our products incorporate Ethernet switching and IP routing capabilities to form complete networking solutions. We also provide network management software tools to enable our customers to deploy, monitor and manage our systems; third party equipment such as antennas, routers, optical transmission equipment and other equipment necessary to build and deploy a complete telecommunications transmission network. We provide a full suite of professional services for planning, deployment, operations and maintenance of our customers’ networks.
Our wireless systems deliver urban, suburban, regional and country-wide communications links as the primary alternative to fiber optic connections. In dense urban and suburban areas, short range wireless solutions are faster to deploy and lower cost per mile than new fiber deployments. In developing nations, fiber infrastructure is scarce and wireless systems are used for both long and short distance connections. Wireless systems also have advantages over optical fiber in areas with rugged terrain, and to provide connections over bodies of water such as between islands or even oil and gas production platforms.
Revenue from our North America and international regions represented approximately 55% and 45%, respectively, of our revenue in fiscal 2017, 47% and 53%, respectively, of our revenue in fiscal 2016, and 46% and 54%, respectively, of our revenue in fiscal 2015. Information about our revenue attributable to our geographic regions is set forth in “Item 7. Management’s Discussion and Analysis of Financial Condition and Results of Operations” and in “Note 9. Segment and Geographic Information” of the accompanying consolidated financial statements in this Annual Report on Form 10-K.
Market Overview
We believe that future demand for microwave and millimeter wave transmission systems will be influenced by a number of factors across several market segments.
Mobile Networks
As mobile networks expand, add subscribers and increase the number of wirelessly connected devices, sensors and machines, they require investment in backhaul infrastructure. Whether mobile network operators choose to self-build this backhaul infrastructure or lease backhaul services from other network providers, the evolution of the network drives demand for transmission technologies such as microwave and millimeter wave wireless backhaul. Within this overall scope there are multiple individual drivers for investment in backhaul infrastructure.
• | New RAN Technologies. Mobile Radio Access Network (“RAN”) technologies are continually evolving. With evolution from 2G to 3G (HSPA), 4G (HSPA+ and LTE), and next 5G standards, technology is |
5
rapidly advancing and providing subscribers with higher speed access to the Internet, social media, and video streaming services. The rapid increases in data to be transported through the RAN and across the backhaul infrastructure drives requirements for higher data transport links necessitating upgrades to or replacement of the existing backhaul infrastructure.
• | Subscriber Growth. Traffic on the backhaul infrastructure increases as the number of unique subscribers grows. |
• | Connected Devices. The number of devices such as smart phones and tablets connected to the mobile network is far greater than the number of unique subscribers and is continuing to grow as consumers adopt multiple mobile device types. There is also rapid growth in the number and type of wireless enabled sensors and machines being connected to the mobile network creating new revenue streams for network operators in healthcare, agriculture, transportation and education. As a result, the data traffic crossing the backhaul infrastructure continues to grow rapidly. |
• | IoT. The Internet of Things (“IoT”) brings the potential of massive deployment of wireless end points for sensing and reporting data and remotely controlling machines and devices. The increase of data volume drives investment in network infrastructure. |
• | RAN Capacity. RAN frequency spectrum is a limited resource and shared between all of the devices and users within the coverage area of each base station. Meeting the combined demand of increasing subscribers and devices will require the deployment of much higher densities of base stations with smaller and smaller range (small cells) each requiring backhaul. |
• | Geographic Coverage. Expanding the geographic area covered by a mobile network requires the deployment of additional Cellular Base Station sites. Each additional base station site also needs to be connected to the core of the mobile network through expansion of the backhaul system. |
• | License Mandates. Mobile Operators are licensed telecommunications service providers. Licenses will typically mandate a minimum geographic footprint within a specific period of time and/or a minimum proportion of a national or regional population served. This can pace backhaul infrastructure investment and cause periodic spikes in demand. |
• | Evolution to IP. Network Infrastructure capacity, efficiency and flexibility is greatly enhanced by transitioning from legacy SDH (synchronous digital hierarchy) / SONET (synchronous optical network) / TDM (time division multiplexing) to IP (internet protocol) infrastructure. Our products offer integrated IP transport and routing functionality increasing the value they bring in the backhaul network. |
• | Expansion of Offered Services. Mobile network operators especially in emerging markets now own and operate the most modern communications networks within their respective regions. These network assets can be further leveraged to provide high speed broadband services to fixed locations such as small, medium and large business enterprises, airports, hotels, hospitals, and educational institutions. Microwave and millimeter wave backhaul is ideally suited to providing high speed broadband connections to these end points due to the lack of fiber infrastructure. |
Other Vertical Markets
In addition to mobile backhaul, we see demand for microwave technology in other vertical markets, including utility, public safety, financial institutions and broadcast.
• | Many utility companies around the world are actively investing in Smart Grid solutions and energy demand management, which drive the need for network modernization and increased capacity of networks. |
• | The investments in network modernization in the public safety market can significantly enhance the capabilities of security agencies. Improving border patrol effectiveness, enabling inter-operable emergency communications services for local or state police, providing access to timely information from centralized databases, or utilizing video and imaging devices at the scene of an incident requires a high bandwidth and reliable network. The mission critical nature of Public Safety and National security networks can require that these networks are built, operated and maintained independently of other public network infrastructure and microwave is very well suited to this environment because it is a cost-effective alternative to fiber. |
• | Microwave technology can be used to engineer long distance and more direct connections than Optical Cable. Microwave signals also travel through the air much faster than light through glass and the combined effect of shorter distance and higher speed reduces latency, which is valued for trading applications in the financial industry. Our products have already been used to create low latency connections between major centers in the United States (“U.S.”), Europe and Asia and we see long-term interest in the creation of further low latency routes in various geographies around the world. |
6
• | The enhancement of Border Security and Surveillance networks to counter terrorism and insurgency is aided by the use of wireless technologies including microwave backhaul. |
These factors are combining to create a range of opportunities for continued investment in backhaul and transport networks favoring microwave and millimeter wave technologies. As we focus on our execution of the future generations of our technology, our goal is to make wireless a viable choice for an ever-broadening range of network types.
Strategy
Over the past year, we focused on building a sustainably profitable business with future growth potential. We have invested in our people and processes to create a platform for operational excellence across sales, services, product development and supply chain areas while continuing to make investments in strengthening our product and services portfolio and expanding our reach into targeted market areas.
Our technology strategy has three main elements aligned to deliver a compelling Total Cost of Ownership (“TCO”) value proposition. The first is the integration of network routing functions into our wireless transport solution allowing our customers increased flexibility with a much better Total Cost. Second, we are expanding the data carrying capacity of our wireless products to address the increasing data demand in networks of all types. Third, in order to address the operational complexity of planning, deploying, owning and operating microwave networks, we are investing in a combination of software applications and services where our expertise can make a significant difference for our customers and partners.
We continued to develop our professional services portfolio as a key to our long-term strategy and differentiation. During the year, we continued to expand the number of customer networks managed from our North America Network Operations Center. We began offering cloud based network management to our customers and we continue to offer training and accreditation programs for microwave and IP network design, deployment and maintenance.
Our strategy includes partnering with companies with technical expertise in areas outside of our core competencies to meet our customers’ demand for an end-to-end solution. Our partner product strategy enables us to go beyond wireless transmission to address the vendor consolidation trend whereby customers are “buying more from fewer vendors” and in doing so providing expanding market share opportunity. A comprehensive solutions portfolio comprised of our wireless product and intelligent partner products can allow us to compete with vendors that offer turnkey solution portfolios and serve to focus our research and development (“R&D”) efforts on core competency wireless innovations. Having a broader portfolio will enable us to further differentiate our offerings from other independent microwave equipment suppliers.
We expect to continue to serve and expand upon our existing customer base and develop business with new customers. We intend to leverage our customer base, our longstanding presence in many countries, our distribution channels, our comprehensive product line, our superior customer service and our turnkey solution capability to continue to sell existing and new products and services to current and future customers.
Products and Solutions
Our strong product and solutions portfolio is key to building and maintaining our marquee base of customers. We offer a comprehensive product and solutions portfolio that meets the needs of service providers and network operators in every region of the world and addresses a broad range of applications, frequencies, capacities and network topologies.
• | Broad product and solution portfolio. We offer a comprehensive suite of wireless transmission networking systems for microwave and millimeter wave networking applications. Our solution consists of tailored offerings of our own wireless products and our own integrated ancillary equipment or that of other manufacturers and providers of element and network management systems and professional services. These solutions address a wide range of transmission frequencies, ranging from 2.4 GHz to 90 GHz, and a wide range of transmission capacities, ranging up to over 10 Gbps. The major product families included in these solutions are CTR 8000, WTM 4000 and AviatCloud. Our CTR 8000 platform merges the functionality of an indoor microwave modem unit and a cell site router into a single integrated solution, simplifying IP/MPLS deployments and creating a better performing network. The newest addition to our product portfolio is the WTM 4000, the highest capacity microwave radio ever produced and purpose built for SDN. To address the issues of operational complexity in our customers’ networks, AviatCloud is an app-based platform to automate and virtualize networks and their operations. |
7
• | Low total cost of ownership. Our wireless-based solutions are focused on low total cost of ownership, including savings on the combined costs of initial acquisition, installation and ongoing operation and maintenance. Our latest generation system designs reduce rack space requirements, require less power, are software-configurable to reduce spare parts requirements, and are simple to install, operate, upgrade and maintain. Our advanced wireless features can also enable operators to save on related costs, including spectrum fees and tower rental fees. |
• | Futureproof network. Our solutions are designed to protect the network operator’s investment by incorporating software-configurable capacity upgrades and plug-in modules that provide a smooth migration path to Carrier Ethernet and IP/MPLS (multiprotocol label switching)-based networking, without the need for costly equipment substitutions and additions. Our products include key technologies we believe will be needed by operators for their network evolution to support new broadband services. |
• | Flexible, easily configurable products. We use flexible architectures with a high level of software configurable features. This design approach produces high-performance products with reusable components while at the same time allowing for a manufacturing strategy with a high degree of flexibility, improved cost and reduced time-to-market. The software features of our products offer our customers a greater degree of flexibility in installing, operating and maintaining their networks. |
• | Comprehensive network management. We offer a range of flexible network management solutions, from element management to enterprise-wide network management and service assurance that we can optimize to work with our wireless systems. |
• | Complete professional services. In addition to our product offerings, we provide network planning and design, site surveys and builds, systems integration, installation, maintenance, network monitoring, training, customer service and many other professional services. Our services cover the entire evaluation, purchase, deployment and operational cycle and enable us to be one of the few complete turnkey solution providers in the industry. |
Business Operations
Sales and Service
Our primary route to market is through our own direct sales, service and support organization. This provides us with the best opportunity to leverage our role as a technology specialist and differentiate ourselves from competitors. Our focus on key customers and geographies allows us to consistently achieve high customer satisfaction ratings leading to a high level of customer retention and repeat business. Our highest concentrations of Sales and Service resources are in the United States, Western and Southern Africa, the Philippines, and the European Union. We maintain a presence in a number of other countries, some of which are based on customer locations and include, but not limited to, Canada, Mexico, Kenya, India, Saudi Arabia, Australia, New Zealand, and Singapore.
In addition to our direct channel to market, we also have informal, and in some cases formal, relationships with original equipment manufacturers (“OEMs”) and system integrators especially towards large and complex projects in National Security and Government related applications. Our role in these relationships ranges from equipment supply only to being a sub-contractor for a portion of the project scope where we will supply equipment and a variety of design, deployment and maintenance services.
We also use indirect sales channels, including dealers, resellers and sales representatives, in the marketing and sale of some lines of products and equipment on a global basis. These independent representatives may buy for resale or, in some cases, solicit orders from commercial or governmental customers for direct sales by us. Prices to the ultimate customer in many instances may be recommended or established by the independent representative and may be above or below our list prices. These independent representatives generally receive a discount from our list prices and are free to set the final sales prices paid by the customer.
We have repair and service centers in India, Nigeria, Ghana, Mexico, the Philippines, the United Kingdom and the United States. We have customer service and support personnel who provide customers with training, installation, technical support, maintenance and other services on systems under contract. We install and maintain customer equipment directly in some cases and contract with third-party service providers in other cases, depending on the equipment being installed and customer requirements.
8
The specific terms and conditions of our product warranties vary depending upon the product sold and country in which we do business. On direct sales, warranty periods generally start on the delivery date and continue for one to three years.
Manufacturing
Our global manufacturing strategy follows an outsourced manufacturing model using contract manufacturing partners in both the United States and Asia. Our strategy is based on balancing cost and supplier performance as well as taking into account qualification for localization requirements of certain market segments such as the Buy America statute.
In accordance with our global logistics requirements and customer geographic distribution, we are engaged with contract manufacturing partners in Asia and the United States. All manufacturing operations have been certified to International Standards Organization 9001, a recognized international quality standard. We have also been certified to the TL 9000 standard, a telecommunication industry-specific quality system standard.
Backlog
Our backlog by geographic region is as follows:
(In thousands) | June 30, 2017 | July 1, 2016 | |||||
North America | $ | 102,971 | $ | 97,360 | |||
International | 56,775 | 56,271 | |||||
Total backlog | $ | 159,746 | $ | 153,631 | |||
Our backlog consists primarily of contracts or purchase orders for both product and service deliveries and extended service warranties. Services include management’s initial estimate of the value of a customer’s commitment under a services contract. The calculation used by management involves estimates and judgments to gauge the extent of a customer’s commitment, including the type and duration of the agreement, and the presence of termination charges or wind down costs. Contract extensions and increases in scope are treated as backlog only to the extent of the incremental new value. We regularly review our backlog to ensure that our customers continue to honor their purchase commitments and have the financial means to purchase and deploy our products and services in accordance with the terms of their purchase contracts. Backlog estimates are subject to change and are affected by several factors, including terminations, changes in the scope of contracts, periodic revalidations, adjustments for revenue not materialized and adjustments for currency.
We expect to substantially fill the backlog as of June 30, 2017 during fiscal 2018, but we cannot be assured that this will occur. Product orders in our current backlog are subject to changes in delivery schedules or to cancellation at the option of the purchaser without significant penalty. Accordingly, although useful for scheduling production, backlog as of any particular date may not be a reliable measure of sales for any future period because of the timing of orders, delivery intervals, customer and product mix and the possibility of changes in delivery schedules and additions or cancellations of orders. The backlog figures exclude advance payments and unearned income amounts.
Customers
Although we have a large customer base, during any given fiscal year or quarter, a small number of customers may account for a significant portion of our revenue.
During fiscal 2017, Mobile Telephone Networks Group (“MTN Group”) in Africa accounted for 14% of our total revenue compared with 18% in fiscal 2016 and 14% in fiscal 2015. We have entered into separate and distinct contracts with MTN Group as well as separate arrangements with MTN Group subsidiaries. The loss of all or a substantial portion of MTN Group’s business could adversely affect our results of operations, cash flows and financial position.
Competition
The microwave and millimeter wave wireless networking business is a specialized segment of the telecommunications industry that is sensitive to technological advancements and is extremely competitive. Our principal competitors include business units of large mobile and IP network infrastructure manufacturers such as Ericsson, Huawei, NEC and Nokia, as well as a number of smaller microwave specialist companies such as Ceragon and SIAE Microelectronica.
9
Some of our larger competitors may have greater name recognition, broader product lines (some including non-wireless telecommunications equipment and managed services), a larger installed base of products and longer-standing customer relationships. They may from time to time leverage their extensive overall portfolios into completely outsourced and managed network offerings restricting opportunities for specialist suppliers. In addition, some competitors may offer seller financing, which can be a competitive advantage under certain economic climates.
Some of our larger competitors may also act as systems integrators through which we sometimes distribute and sell products and services to end users.
The smaller independent private and public specialist competitors typically leverage new technologies and low products costs, but are generally less capable of offering a complete solution including professional services, especially in the North America and Africa regions which form the majority of our addressed market.
We concentrate on market opportunities that we believe are compatible with our resources, overall technological capabilities and objectives. Principal competitive factors are cost-effectiveness, product quality and reliability, technological capabilities, service, ability to meet delivery schedules and the effectiveness of dealers in international areas. We believe that the combination of our network and systems engineering support and service, global reach, technological innovation, agility and close collaborative relationships with our customers are the key competitive strengths for us. However, customers may still make decisions based primarily on factors such as price, financing terms and/or past or existing relationships, where it may be difficult for us to compete effectively or profitably.
Research and Development
We believe that our ability to enhance our current products, develop and introduce new products on a timely basis, maintain technological competitiveness and meet customer requirements is essential to our success. Accordingly, we allocate, and intend to continue to allocate, a significant portion of our resources to research and development efforts in key technology areas and innovation to differentiate our overall portfolio from our competition. The majority of such research and development resources will be focused on technologies in microwave and millimeter wave RF, digital single processing, networking protocols and software applications.
Our research and development expenditures totaled $18.7 million, or 7.7% of revenue, in fiscal 2017, $20.8 million, or 7.7% of revenue, in fiscal 2016, and $25.4 million, or 7.6% of revenue, in fiscal 2015.
Research and development are primarily directed to the development of new products and to building technological capability. We are an industry innovator and intend to continue to focus significant resources on product development in an effort to maintain our competitiveness and support our entry into new markets.
Our product development teams numbered 142 employees as of June 30, 2017, and were located in the United States, New Zealand, Slovenia and Canada.
Raw Materials and Supplies
Because of the range of our products and services, as well as the wide geographic dispersion of our facilities, we use numerous sources of raw materials needed for our operations and for our products, such as electronic components, printed circuit boards, metals and plastics. We are dependent upon suppliers and subcontractors for a large number of components and subsystems and upon the ability of our suppliers and subcontractors to adhere to customer or regulatory materials restrictions and meet performance and quality specifications and delivery schedules.
Our strategy for procuring raw material and supplies includes dual sourcing on strategic assemblies and components. In general, we believe this reduces our risk with regard to the potential financial difficulties in our supply base. In some instances, we are dependent upon one or a few sources, either because of the specialized nature of a particular item or because of local content preference requirements pursuant to which we operate on a given project. Examples of sole or limited source categories include metal fabrications and castings, for which we own the tooling and therefore limit our supplier relationships, ASIC’s and MMICs (types of integrated circuit used in manufacturing microwave radios), which we procure at volume discount from a single source. Our supply chain plan includes mitigation plans for alternative manufacturing sources and identified alternate suppliers.
Although we have been affected by performance issues of some of our suppliers and subcontractors, we have not been materially adversely affected by the inability to obtain raw materials or products. In general, any performance issues causing short-term material shortages are within the normal frequency and impact range experienced by high-tech manufacturing companies. They are due primarily to the highly technical nature of many of our purchased components.
10
Looking ahead, we anticipate standard lead times for our raw materials and supplies.
Patents and Other Intellectual Property
We consider our patents and other intellectual property rights, in the aggregate, to constitute an important asset. We own a portfolio of patents, trade secrets, know-how, confidential information, trademarks, copyrights and other intellectual property. We also license intellectual property to and from third parties. As of June 30, 2017, we held 173 U.S. patents and 82 international patents and had 20 U.S. patent applications pending and 44 international patent applications pending. We do not consider our business to be materially dependent upon any single patent, license or other intellectual property right, or any group of related patents, licenses or other intellectual property rights. From time to time, we might engage in litigation to enforce our patents and other intellectual property or defend against claims of alleged infringement. Any of our patents, trade secrets, trademarks, copyrights and other proprietary rights could be challenged, invalidated or circumvented, or may not provide competitive advantages. Numerous trademarks used on or in connection with our products are also considered to be valuable assets.
In addition, to protect confidential information, including our trade secrets, we require our employees and contractors to sign confidentiality and invention assignment agreements. We also enter into non-disclosure agreements with our suppliers and appropriate customers to limit access to and disclosure of our proprietary information.
Although our ability to compete may be affected by our ability to protect our intellectual property, we believe that, because of the rapid pace of technological change in the wireless telecommunications industry, our innovative skills, technical expertise and ability to introduce new products on a timely basis will be more important in maintaining our competitive position than protection of our intellectual property. Trade secret, trademark, copyright and patent protections are important but must be supported by other factors such as the expanding knowledge, ability and experience of our personnel, new product introductions and product enhancements. Although we continue to implement protective measures and intend to vigorously defend our intellectual property rights, there can be no assurance that these measures will be successful.
Environmental and Other Regulations
Our facilities and operations, in common with those of our industry in general, are subject to numerous domestic and international laws and regulations designed to protect the environment, particularly with regard to wastes and emissions. We believe that we have complied with these requirements and that such compliance has not had a material adverse effect on our results of operations, financial condition or cash flows. Based upon currently available information, we do not expect expenditures to protect the environment and to comply with current environmental laws and regulations over the next several years to have a material impact on our competitive or financial position, but can give no assurance that such expenditures will not exceed current expectations. From time to time, we receive notices from the U.S. Environmental Protection Agency or equivalent state or international environmental agencies that we are a potentially responsible party under the Comprehensive Environmental Response, Compensation and Liability Act, which is commonly known as the Superfund Act, and equivalent laws. Such notices may assert potential liability for cleanup costs at various sites, which include sites owned by us, sites we previously owned and treatment or disposal sites not owned by us, allegedly containing hazardous substances attributable to us from past operations. We are not presently aware of any such liability that could be material to our business, financial condition or operating results, but due to the nature of our business and environmental risks, we cannot provide assurance that any such material liability will not arise in the future.
Electronic products are subject to environmental regulation in a number of jurisdictions. Equipment produced by us is subject to domestic and international requirements requiring end-of-life management and/or restricting materials in products delivered to customers. We believe that we have complied with such rules and regulations, where applicable, with respect to our existing products sold into such jurisdictions.
Radio communications are also subject to governmental regulation. Equipment produced by us is subject to domestic and international requirements to avoid interference among users of radio frequencies and to permit interconnection of telecommunications equipment. We believe that we have complied with such rules and regulations with respect to our existing products, and we intend to comply with such rules and regulations with respect to our future products. Reallocation of the frequency spectrum also could impact our business, financial condition and results of operations.
We have a comprehensive policy and procedures in effect concerning conflict minerals compliance.
11
Employees
As of June 30, 2017, we employed approximately 710 people, compared with approximately 720 as of the end of fiscal 2016 and approximately 780 as of the end of fiscal 2015. Approximately 270 of our employees are located in the U.S. We also utilized approximately 59 and 70 independent contractors as of June 30, 2017 and July 1, 2016, respectively. None of our employees in the U.S. are represented by a labor union. In certain international subsidiaries, our employees are represented by workers’ councils or statutory labor unions. In general, we believe that our employee relations are good.
Executive Officers of the Registrant
The name, age, position held with us, and principal occupation and employment during at least the past 5 years for each of our executive officers as of September 6, 2017, are as follows:
Name and Age | Position Currently Held and Past Business Experience | |
Michael A. Pangia, 56 | Mr. Pangia has been our President and Chief Executive Officer and a member of our board of directors (the “Board”) since July 18, 2011. From March 2009 to July 2011, he served as our Chief Sales Officer responsible for company-wide operations of the global sales and services organization. Prior to joining Aviat Networks, from 2008 to 2009, Mr. Pangia served as Senior Vice President, global sales operations and strategy at Nortel, where he was responsible for all operational aspects of the global sales function. From 2006 to 2008, he was President of Nortel’s Asia region where his key responsibilities included sales and overall business management for all countries where Nortel did business in the region. | |
Ralph Marimon, 60 | Mr. Marimon joined Aviat Networks in May 2015 as our Senior Vice President, Finance and Chief Financial Officer and is responsible for the finance and IT organizations. Before joining Aviat, Mr. Marimon served as Vice President, Finance and Chief Financial Officer of QuickLogic, a provider of ultra-low power, customizable semiconductor solutions for smartphone, tablet, wearable, and mobile enterprise OEMs, since 2008. Prior to QuickLogic, Mr. Marimon served as Chief Financial Officer within a variety of organizations including Anchor Bay Technologies, Inc., Tymphany Corporation, and Scientific Technologies Incorporated. From 1999 to 2003, he served at Com21 Corporation as Chief Financial Officer. Prior to Com21, Mr. Marimon was at KLA-Tencor Corporation for 11 years in a variety of senior executive financial management positions. | |
Meena Elliott, 54 | Ms. Elliott was appointed Senior Vice President, Chief Legal and Administrative Officer, Corporate Secretary in February 2015 and is responsible for the global legal and human resources organizations. From September 2011 to February 2015, she served as Senior Vice President, General Counsel, Secretary and had responsibilities for the global legal organization and took on responsibilities for global human resources organizations in 2014. From July 2009 to August 2011, she served as Vice President, General Counsel and Secretary. She joined our company as Associate General Counsel and Assistant Secretary in January 2007 when Harris Corporation’s MCD and Stratex Networks merged. Ms. Elliott joined MCD as Division Counsel in March 2006. Prior to joining MCD, she was Chief Counsel at the Department of Commerce from 2002 to 2006. | |
Heinz H. Stumpe, 62 | Mr. Stumpe was appointed Chief Sales Officer on June 25, 2012. Before his appointment as Chief Sales Officer, Mr. Stumpe was our Senior Vice President and Chief Operation Officer since June 30, 2008. Previously, he was Vice President, Global Operations for Aviat Networks and Stratex Networks. He joined Stratex Networks as Director of Marketing in 1996. He was promoted to Vice President, Global Accounts in 1999, Vice President, Strategic Accounts in 2002 and Vice President, Global Operations in April 2006. | |
Shaun McFall, 57 | Mr. McFall was appointed Chief Strategy Officer in 2015. He was our Chief Marketing Officer since July 2008. Previously, from 2000 to 2008, he served as Vice President, Marketing for Aviat Networks and Stratex Networks. He has been with us since 1989. | |
There is no family relationship between any of our executive officers or directors, and there are no arrangements or understandings between any of our executive officers or directors and any other person pursuant to which any of them was appointed or elected as an officer or director, other than arrangements or understandings with our directors.
12
Web site Access to Aviat Networks’ Reports; Available Information
We maintain an Internet Web site at http://www.aviatnetworks.com. Our annual reports on Form 10-K, proxy statements, quarterly reports on Form 10-Q, current reports on Form 8-K and amendments to such reports, filed or furnished pursuant to Section 13(a) or 15(d) of the Securities Exchange Act of 1934 (the “Exchange Act”) are available free of charge on our Web site as soon as reasonably practicable after these reports are electronically filed with, or furnished to, the Securities and Exchange Commission (“SEC”). Our website and the information posted thereon are not incorporated into this Annual Report on Form 10-K or any current or other periodic report that we file or furnish to the SEC.
We will also provide the reports in electronic or paper form, free of charge upon request. All reports we file with or furnish to the SEC are also available free of charge via EDGAR through the SEC’s website at http://www.sec.gov. The public may read and copy any materials filed by us with the SEC at the SEC’s Public Reference Room, 100 F. Street, N.E., Washington, D.C. 20549. The public may obtain information on the operation of the Public Reference Room by calling the SEC at 1-800-SEC-0330.
Additional information relating to our business and operations is set forth in “Item 7. Management’s Discussion and Analysis of Financial Condition and Results of Operations” in this Annual Report on Form 10-K.
Item 1A. Risk Factors
In addition to the risks described elsewhere in this Annual Report on Form 10-K and in certain of our other filings with the SEC, the following risks and uncertainties, among others, could cause our actual results to differ materially from those contemplated by us or by any forward-looking statement contained herein. Prospective and existing investors are strongly urged to carefully consider the various cautionary statements and risks set forth in this Annual Report on Form 10-K and our other public filings.
We have many business risks including those related to our financial performance, investments in our common stock, operating our business and legal matters. The risks and uncertainties described below are not the only ones facing us. Additional risks and uncertainties may also impair our business operations. If any of these risks actually occur, our financial condition and results of operations could be materially and adversely affected.
We have not been profitable and must increase our revenues and/or reduce costs if we hope to achieve profitability.
As measured under U.S. generally accepted accounting principles (“U.S. GAAP”), we incurred net losses attributable to our stockholders of $0.8 million in fiscal 2017, $29.9 million in fiscal 2016 and $24.6 million in fiscal 2015 and have been unprofitable since we became a public company in January 2007. We also have incurred losses from operations in all fiscal years since we became a public company, although we generated cash from operations in fiscal 2017, 2016, 2013, 2012, 2010 and 2009.
Throughout fiscal 2017, we experienced strong price competition for new business in all regions while major customer consolidations from prior years also put pressure on revenue and gross margin. In addition, we saw pricing pressures in all markets, particularly in international markets. Customer consolidation may have an increasing negative impact on our revenue if Aviat is not selected as a vendor for the products and/or services we provide. In order to counter pricing pressures, we invested heavily in product improvements to reduce unit costs and enhance product features, decreased overall company expenses, and worked with our vendors to attain more favorable pricing. If we are unable to reduce product unit costs associated with enhanced product features, including payments to contract manufacturers and other suppliers, or achieve the projected cost reductions, we may not achieve profitability.
We cannot be certain that these actions or others that we may take in the future will result in operating profitability or net income as determined under U.S. GAAP.
13
Our sales cycle may be lengthy, and the timing of sales, along with additional services such as warehousing, inventory management, installation and implementation of our products within our customers’ networks, may extend over more than one period, which can make our operating results difficult to predict.
We anticipate difficulty in accurately predicting the timing of the sale of products and amounts of revenue generated from sales of our products, primarily in developing countries. The establishment of a business relationship with a potential customer is a lengthy process, generally taking several months and sometimes longer. Following the establishment of the relationship, the negotiation of purchase terms can be time-consuming, and a potential customer may require an extended evaluation and testing period. We expect that our product sales cycle, which results in our products being designed into our customers’ networks, could take 12 to 24 months. A number of factors can contribute to the length of the sales cycle, including technical evaluations of our products, the design process required to integrate our products into our customers’ networks and warehousing and/or inventory management services that may be requested by certain large customers. In anticipation of product orders, we may incur substantial costs before the sales cycle is complete and before we receive any customer payments. Specifically, should a customer require warehousing and/or inventory management services, such services may impact our operating results in any period due to the costs associated with providing such services and the fact that the timing of the revenue recognition may be delayed. As a result, in the event that a sale is not completed or is canceled or delayed, we may have incurred substantial expenses, making it more difficult for us to become profitable or otherwise negatively impacting our financial results. Furthermore, because of our lengthy sales cycle, our recognition of revenue from our selling efforts may be substantially delayed, our ability to forecast our future revenue may be more limited and our revenue may fluctuate significantly from quarter to quarter.
Once a purchase agreement has been executed, the timing and amount of revenue, if applicable, may remain difficult to predict. The completion of services such as warehousing and inventory management, installation and testing of the customer’s networks and the completion of all other suppliers’ network elements are subject to the customer’s timing and efforts and other factors outside our control, each of which may prevent us from making predictions of revenue with any certainty and could cause us to experience substantial period-to-period fluctuations in our operating results.
Our average sales prices may decline in the future.
We are experiencing, and are likely to continue to experience, declining sales prices. This price pressure is likely to result in downward pricing pressure on our products and services. As a result, we are likely to experience declining average sales prices for our products. Our future profitability will depend upon our ability to improve manufacturing efficiencies, reduce costs of materials used in our products and to continue to introduce new lower-cost products and product enhancements and if we are unable to do so, we may not be able to respond to pricing pressures. If we are unable to respond to increased price competition, our business, financial condition and results of operations will be harmed. Because customers frequently negotiate supply arrangements far in advance of delivery dates, we may be required to commit to price reductions for our products before we are aware of how, or if, cost reductions can be obtained. As a result, current or future price reduction commitments and any inability on our part to respond to increased price competition could harm our business, financial condition and results of operations.
Credit and commercial risks and exposures could increase if the financial condition of our customers declines.
A substantial portion of our sales are to customers in the telecommunications industry. These customers may require their suppliers to provide extended payment terms, direct loans or other forms of financial support as a condition to obtaining commercial contracts. In addition, if local currencies cannot be hedged, we have an inherent exposure in our ability to convert monies at favorable rates from or to U.S. dollars. More generally, we expect to routinely enter into long-term contracts involving significant amounts to be paid by our customers over time. Pursuant to these contracts, we may deliver products and services representing an important portion of the contract price before receiving any significant payment from the customer. As a result of the financing that may be provided to customers and our commercial risk exposure under long-term contracts, our business could be adversely affected if the financial condition of our customers erodes. Over the past few years, certain of our customers have filed with the courts seeking protection under the bankruptcy or reorganization laws of the applicable jurisdiction, or have experienced financial difficulties. The financial healthiness may be exacerbated in many emerging markets, where our customers are being affected not only by recession, but by deteriorating local currencies and a lack of credit. Upon the financial failure of a customer, we may experience losses on credit extended to such customer, losses relating to our commercial risk exposure and the loss of the customer’s ongoing business. If customers fail to meet their obligations to us, we may experience reduced cash flows and losses in excess of reserves, which could materially adversely impact our results of operations and financial position.
14
Due to the volume of our international sales, we may be susceptible to a number of political, economic and geographic risks that could harm our business.
We are highly dependent on sales to customers outside the U.S. In each of fiscal 2017, 2016 and 2015, our sales to international customers accounted for 47%, 55% and 55%, respectively, of total revenue. Significant portions of our international sales are in less developed countries. Our international sales are likely to continue to account for a large percentage of our products and services revenue for the foreseeable future. As a result, the occurrence of any international, political, economic or geographic event could result in a significant decline in revenue. In addition, compliance with complex foreign and U.S. laws and regulations that apply to our international operations increases our cost of doing business in international jurisdictions. These numerous and sometimes conflicting laws and regulations include internal control and disclosure rules, data privacy and filtering requirements, anti-corruption laws, such as the Foreign Corrupt Practices Act, and other local laws prohibiting corrupt payments to governmental officials, and anti-competition regulations, among others. Violations of these laws and regulations could result in fines and penalties, criminal sanctions against us, our officers, or our employees, prohibitions on the conduct of our business and on our ability to offer our products and services in one or more countries, and could also materially affect our brand, our international expansion efforts, our ability to attract and retain employees, our business, and our operating results. Although we have implemented policies and procedures designed to ensure compliance with these laws and regulations, there can be no assurance that our employees, contractors, or agents will not violate our policies.
Some of the risks and challenges of doing business internationally include:
• | unexpected changes in regulatory requirements; |
• | fluctuations in international currency exchange rates including its impact on unhedgeable currencies and our forecast variations for hedgeable currencies; |
• | imposition of tariffs and other barriers and restrictions; |
• | management and operation of an enterprise spread over various countries; |
• | the burden of complying with a variety of laws and regulations in various countries; |
• | application of the income tax laws and regulations of multiple jurisdictions, including relatively low-rate and relatively high-rate jurisdictions, to our sales and other transactions, which results in additional complexity and uncertainty; |
• | the conduct of unethical business practices in developing countries; |
• | general economic and geopolitical conditions, including inflation and trade relationships; |
• | war and acts of terrorism; |
• | kidnapping and high crime rate; |
• | natural disasters; |
• | availability of U.S. dollars especially in countries with economies highly dependent on resource exports, particularly oil; and |
• | changes in export regulations. |
While these factors and the impacts of these factors are difficult to predict, any one or more of them could adversely affect our business, financial condition and results of operations in the future.
We may not be able to obtain capital when desired on favorable terms, if at all, or without dilution to our stockholders.
We believe that our existing cash and cash equivalents, the available line of credit under our credit facility and future cash collections from customers will be sufficient to provide for our anticipated requirements for working capital and capital expenditures for the next 12 months and the foreseeable future. However, it is possible that we may not generate sufficient cash flow from operations or otherwise have the capital resources to meet our longer-term capital needs. If this occurs, we may need to sell assets, reduce capital expenditures, or obtain additional equity or debt financing. We cannot assure you that additional financing will be available on terms favorable to us, or at all. If adequate funds are not available or are not available on acceptable terms if and when needed, our business, financial condition and results of operations could be harmed.
If we raise additional funds through the issuance of equity or convertible debt securities, the percentage ownership of our stockholders could be significantly diluted, and these newly-issued securities may have rights, preferences or privileges senior to those of existing stockholders.
15
We may undertake further restructuring activities, which may adversely impact our operations, and we may not realize all of the anticipated benefits of these activities or any potential future restructurings. Any restructuring activities may harm our business.
We continue to evaluate our business to determine the potential need to realign our resources as we continue to transform our business in order to achieve desired cost savings in an increasingly competitive market. In prior years, we have undertaken a series of steps to restructure our operations involving, among other things and depending on the year, reductions of our workforce, the relocation of our corporate headquarters and the reduction and outsourcing of manufacturing activities. We incurred restructuring charges of $0.6 million, $2.5 million and $4.9 million in fiscal 2017, 2016 and 2015, respectively.
We have based our restructuring efforts on assumptions and plans regarding the appropriate cost structure of our business based on our product mix and projected sales, among other factors. Some of our assumptions include the elimination of jobs and the outsourcing of certain functions to reduce our operating expenses. These assumptions may not be accurate and we may not be able to operate in accordance with our plans. Should this occur we may determine that we must incur additional restructuring charges in the future. Moreover, we cannot assure you that we will realize all of the anticipated benefits of our restructuring actions or that we will not further reduce or otherwise adjust our workforce or exit, or dispose of, certain businesses and product lines. Any decision to further limit investment, exit, or disposal of businesses or product lines may result in the recording of additional restructuring charges. Consequently, the costs actually incurred in connection with the restructuring efforts may be higher than originally planned and may not lead to the anticipated cost savings and/or improved results. For example, if we consolidate additional facilities in the future, we may incur additional restructuring and related expenses, which could have a material adverse effect on our business, financial condition or results of operations.
Our restructuring actions could harm our relationships with our employees and impact our ability to recruit new employees.
Employees, whether or not directly affected by any restructuring actions that we undertake, may seek employment with our business partners, customers or competitors. We cannot assure you that the confidential nature of our proprietary information will not be compromised by any such employees who terminate their employment with us. Further, we believe that our future success will depend in large part upon our ability to attract, motivate and retain highly skilled personnel. We may have difficulty attracting and retaining such personnel as a result of a perceived risk of future workforce reductions, and we may terminate the employment of employees as part of a restructuring and later determine that such employees were important to the success of the ongoing business.
Our business could be adversely affected if we are unable to attract and retain key personnel.
Our success and ability to invest and grow depend largely on our ability to attract and retain highly skilled technical, professional, managerial, sales and marketing personnel. Historically, competition for these key personnel has been intense. The loss of services of any of our key personnel, the inability to retain and attract qualified personnel in the future, delays in hiring required personnel, particularly engineering and sales personnel, or the loss of key personnel to competitors could make it difficult for us to meet key objectives, such as timely and effective product introductions and financial goals.
Our success will depend on new products introduced to the marketplace in a timely manner, successfully completing product transitioning and achieving customer acceptance.
The market for our products and services is characterized by rapid technological change, evolving industry standards and frequent new product introductions. Our future success will depend, in part, on continuous, timely development and introduction of new products and enhancements that address evolving market requirements and are attractive to customers. If we fail to develop or introduce on a timely basis new products or product enhancements or features that achieve market acceptance, our business may suffer. Additionally, we work closely with a variety of third party partners to develop new product features and new platforms. Should our partners face delays in the development process, then the timing of the rollout of our new products may be significantly impacted which may negatively impact our revenue and gross margin. Another factor impacting our future success is the growth in the customer demand of our new products. Rapidly changing technology, frequent new products introductions and enhancements, short product life cycles and changes in customer requirements characterize the markets for our products. We believe that successful new product introductions provide a significant competitive advantage because of the significant resources committed by customers in adopting new products and their reluctance to change products after these resources have been expended. We have spent, and expect to continue to spend, significant resources on internal research and development to support our effort to develop and introduce new products and enhancements.
16
As we transition to new product platforms, we face significant risk that the development of our new products may not be accepted by our current customers or by new customers. To the extent that we fail to introduce new and innovative products that are adopted by customers, we could fail to obtain an adequate return on these investments and could lose market share to our competitors, which could be difficult or impossible to regain. Similarly, we may face decreased revenue, gross margins and profitability due to a rapid decline in sales of current products as customers hold spending to focus purchases on new product platforms. We could incur significant costs in completing the transition, including costs of inventory write-downs of the current product as customers transition to new product platforms. In addition, products or technologies developed by others may render our products noncompetitive or obsolete and result in significant reduction in orders from our customers and the loss of existing and prospective customers.
Our quarterly results may be volatile, which can adversely affect the trading price of our common stock.
Our quarterly operating results may vary significantly for a variety of reasons, many of which are outside our control. These factors could harm our business and include, among others:
• | seasonality in the purchasing habits of our customers; |
• | the volume and timing of product orders and the timing of completion of our product deliveries and installations; |
• | our ability and the ability of our key suppliers to respond to changes on demand as needed; |
• | margin variability based on geographic and product mix; |
• | our suppliers’ inability to perform and deliver on time as a result of their financial condition, component shortages or other supply chain constraints; |
• | retention of key personnel; |
• | the length of our sales cycle; |
• | litigation costs and expenses; |
• | continued timely rollout of new product functionality and features; |
• | increased competition resulting in downward pressure on the price of our products and services; |
• | unexpected delays in the schedule for shipments of existing products and new generations of the existing platforms; |
• | failure to realize expected cost improvement throughout our supply chain; |
• | order cancellations or postponements in product deliveries resulting in delayed revenue recognition; |
• | restructuring and streamlining of our operations; |
• | war and acts of terrorism; |
• | natural disasters; |
• | the ability of our customers to obtain financing to enable their purchase of our products; |
• | fluctuations in international currency exchange rates; |
• | regulatory developments including denial of export and import licenses; |
• | general economic conditions worldwide that affect demand and financing for microwave and millimeter wave telecommunications networks; and |
• | the timing and size of future restructuring plans and write-offs. |
Our quarterly results are expected to be difficult to predict and delays in product delivery or closing a sale can cause revenue, margins and net income or loss to fluctuate significantly from anticipated levels. A substantial portion of our contracts are completed in the latter part of a quarter and a significant percentage of these are large orders. Because a significant portion of our cost structure is largely fixed in the short term, revenue shortfalls tend to have a disproportionately negative impact on our profitability and can increase our inventory. The number of large new transactions also increases the risk of fluctuations in our quarterly results because a delay in even a small number of these transactions could cause our quarterly revenues and profitability to fall significantly short of our predictions. In addition, we may increase spending in response to competitive actions or in pursuit of new market opportunities. Accordingly, we cannot provide assurances that we will be able to achieve profitability in the future or that if profitability is attained, that we will be able to sustain profitability, particularly on a quarter-to-quarter basis.
17
We face strong competition for maintaining and improving our position in the market, which can adversely affect our revenue growth and operating results.
The wireless access, interconnection and backhaul business is a specialized segment of the wireless telecommunications industry and is extremely competitive. Competition in this segment is intense, and we expect it to increase. Some of our competitors have more extensive engineering, manufacturing and marketing capabilities and significantly greater financial, technical and personnel resources than we have. In addition, some of our competitors have greater name recognition, broader product lines, a larger installed base of products and longer-standing customer relationships. Our competitors include established companies, such as Ericsson, Huawei, NEC and Nokia, as well as a number of other public and private companies, such as Ceragon, DragonWave and SIAE. Some of our competitors are OEMs or systems integrators through whom we market and sell our products, which means our business success may depend on these competitors to some extent. One or more of our largest customers could internally develop the capability to manufacture products similar to those manufactured or outsourced by us and, as a result, the demand for our products and services may decrease.
In addition, we compete for acquisition and expansion opportunities with many entities that have substantially greater resources than we have. Our competitors may enter into business combinations in order to accelerate product development or to compete more aggressively and we may lack the resources to meet such enhanced competition.
Our ability to compete successfully will depend on a number of factors, including price, quality, availability, customer service and support, breadth of product lines, product performance and features, rapid time-to-market delivery capabilities, reliability, timing of new product introductions by us, our customers and competitors, the ability of our customers to obtain financing and the stability of regional sociopolitical and geopolitical circumstances, and the ability of large competitors to obtain business by providing more seller financing especially for large transactions. We can give no assurances that we will have the financial resources, technical expertise, or marketing, sales, distribution, customer service and support capabilities to compete successfully, or that regional sociopolitical and geographic circumstances will be favorable for our successful operation.
If we fail to accurately forecast our manufacturing requirements or customer demand, we could incur additional costs, which would adversely affect our business and results of operations.
If we fail to accurately predict our manufacturing requirements or forecast customer demand, we may incur additional costs of manufacturing and our gross margins and financial results could be adversely affected. If we overestimate our requirements, our contract manufacturers may experience an oversupply of components and assess us charges for excess or obsolete components that could adversely affect our gross margins. If we underestimate our requirements, our contract manufacturers may have inadequate inventory or components, which could interrupt manufacturing and result in higher manufacturing costs, shipment delays, damage to customer relationships and/or our payment of penalties to our customers. Our contract manufacturers also have other customers and may not have sufficient capacity to meet all of their customer’s needs, including ours, during periods of excess demand.
Part of our inventory may be written off, which would increase our cost of revenues. In addition, we may be exposed to inventory-related losses on inventories purchased by our contract manufacturers.
During fiscal 2017, 2016 and 2015, we recorded charges to reduce the carrying value of our inventory which totaled $1.1 million, $9.9 million and $8.0 million, respectively. Such charges equaled 0.5%, 3.7% and 2.4% of our revenue in fiscal 2017, 2016 and 2015, respectively. These charges were primarily due to excess and obsolete inventory resulting from lower forecast, product transitioning or discontinuance.
Inventory of raw materials, work in-process or finished products may accumulate in the future, and we may encounter losses due to a variety of factors, including:
• | rapid technological change in the wireless telecommunications industry resulting in frequent product changes; |
• | the need of our contract manufacturers to order raw materials that have long lead times and our inability to estimate exact amounts and types of items thus needed, especially with regard to the frequencies in which the final products ordered will operate; and |
• | cost reduction initiatives resulting in component changes within the products. |
Further, our inventory of finished products may accumulate as the result of inaccuracies in the forecasting process, cancellation of customer orders or our customers’ refusal to confirm the acceptance of our products. Our forecasting process is based on information discussed with customers concerning future orders. If a customer chooses to revise or
18
hold on placing the order, we may see an unfavorable impact on our inventory given the customization that is involved in our products. Our contract manufacturers are required to purchase inventory based on manufacturing projections we provide to them. If actual orders from our customers are lower than these manufacturing projections, our contract manufacturers will have excess inventory of raw materials or finished products which we would be required to purchase. In addition, we require our contract manufacturers from time to time to purchase more inventory than is immediately required, and to partially assemble components, in order to shorten our delivery time in case of an increase in demand for our products. In the absence of such increase in demand, we may need to compensate our contract manufacturers. If we are required to purchase excess inventory from our contract manufacturers or otherwise compensate our contract manufacturers for purchasing excess inventory, our business, financial condition and results of operations could be materially adversely affected. We also may purchase components or raw materials from time to time for use by our contract manufacturers in the manufacturing of our products. These purchases are based on our own manufacturing projections. If our actual orders are lower than these manufacturing projections, we may accumulate excess inventory, which we may be required to write down. If we are forced to write down inventory other than in the normal course of business, our business, financial condition and results of operations could be materially adversely affected.
The effects of the poor global financial and economic conditions in certain markets has had, and may continue to have, significant effects on our customers and suppliers, and has in the past, and may in the future have, a material adverse effect on our business, operating results, financial condition and stock price.
The effects of poor global financial and economic conditions in certain markets include, among other things, significant reductions in available capital and liquidity from banks and other providers of credit, substantial reductions and/or fluctuations in equity and currency values worldwide.
Poor economic conditions in certain markets have adversely affected and may continue to adversely affect our customers’ access to capital and/or willingness to spend capital on our products, and/or their levels of cash liquidity and/or their ability and/or willingness to pay for products that they will order or have already ordered from us, or result in their ceasing operations. Further, we have experienced an increasing number of our customers, principally in emerging markets, requesting longer payment terms, lease or vendor financing arrangements, longer terms for the letters of credit securing purchases of our products and services, which could potentially negatively impact our orders, revenue conversion cycle, and cash flows.
In seeking to reduce their expenses, we have also seen significant pressure from our customers to lower prices for our products as they try to improve their operating performance and procure additional capital equipment within their reduced budget levels. To the extent that we lower prices on our products and services, our orders, revenues, and gross margins may be negatively impacted. Additionally, certain emerging markets are particularly sensitive to pricing as a key differentiator. Where price is a primary decision driver, we may not be able to effectively compete or we may choose not to compete due to unacceptable margins.
In addition, poor economic conditions in certain markets could materially adversely affect our suppliers’ access to capital and liquidity with which to maintain their inventories, production levels, and/or product quality, could cause them to raise prices or lower production levels, or result in their ceasing operations. Further, with respect to our credit facility discussed under “Liquidity, Capital Resources and Financial Strategies” in Item 7 of this Annual Report on Form 10-K, if continued uncertain economic conditions adversely affect Silicon Valley Bank, our ability to access the funds available under our credit facility could be materially adversely affected.
The potential effects of these economic factors are difficult to forecast and mitigate. As a consequence, our operating results for a particular period are difficult to predict and prior results are not necessarily indicative of results to be expected in future periods. Any of the foregoing effects could have a material adverse effect on our business, results of operations, and financial condition and could adversely affect our stock price.
19
If we fail to effectively manage our contract manufacturer relationships, we could incur additional costs or be unable to timely fulfill our customer commitments, which would adversely affect our business and results of operations and, in the event of an inability to fulfill commitments, would harm our customer relationships.
We outsource all of our manufacturing and a substantial portion of our repair service operations to independent contract manufacturers and other third parties. Our contract manufacturers typically manufacture our products based on rolling forecasts of our product needs that we provide to them on a regular basis. The contract manufacturers are responsible for procuring components necessary to build our products based on our rolling forecasts, building and assembling the products, testing the products in accordance with our specifications and then shipping the products to us. We configure the products to our customer requirements, conduct final testing and then ship the products to our customers. Although we currently partner with multiple major contract manufacturers, there can be no assurance that we will not encounter problems as we are dependent on contract manufacturers to provide these manufacturing services or that we will be able to replace a contract manufacturer that is not able to meet our demand.
In addition, if we fail to effectively manage our relationships with our contract manufacturers or other service providers, or if one or more of them should not fully comply with their contractual obligations or should experience delays, disruptions, component procurement problems or quality control problems, then our ability to ship products to our customers or otherwise fulfill our contractual obligations to our customers could be delayed or impaired which would adversely affect our business, financial results and customer relationships.
We depend on sole or limited sources for some key components and failure to receive timely delivery of any of these components could result in deferred or lost sales.
In some instances, we are dependent upon one or a few sources, either because of the specialized nature of a particular item or because of local content preference requirements pursuant to which we operate on a given project. Examples of sole or limited sourcing categories include metal fabrications and castings, for which we own the tooling and therefore limit our supplier relationships, and MMICs (a type of integrated circuit used in manufacturing microwave radios), which we procure at a volume discount from a single source. Our supply chain plan includes mitigation plans for alternative manufacturing sources and identified alternate suppliers. However, if these alternatives cannot address our requirements when our existing sources of these components fail to deliver them on time, we could suffer delayed shipments, canceled orders and lost or deferred revenues, as well as material damage to our customer relationships. Should this occur, our operating results, cash flows and financial condition could be materially adversely affected.
As a result of changes in tax laws, treaties, rulings, regulations or agreements, or their interpretation, of any country in which we operate, the loss of a major tax dispute or a successful challenge to our operating structure, intercompany pricing policies or the taxable presence of our key subsidiaries in certain countries, or other factors, our effective tax rate could be highly volatile and could adversely affect our operating results.
We operate in multiple jurisdictions and our profits are taxed pursuant to the tax laws of these jurisdictions. Our future effective tax rate may be adversely affected by a number of factors, many of which are outside of our control, including:
• | the jurisdictions in which profits are determined to be earned and taxed; |
• | adjustments to estimated taxes upon finalization of various tax returns; |
• | increases in expenses not deductible for tax purposes, including write-offs of acquired in-process research and development and impairment of goodwill in connection with acquisitions; |
• | ability to utilize net operating loss; |
• | changes in available tax credits; |
• | changes in share-based compensation expense; |
• | changes in the valuation of our deferred tax assets and liabilities; |
• | changes in domestic or international tax laws or the interpretation of such tax laws; |
• | the resolution of issues arising from tax audits with various tax authorities; |
• | the tax effects of purchase accounting for acquisitions and restructuring charges that may cause fluctuations between reporting periods; and |
• | taxes that may be incurred upon a repatriation of cash from foreign operations. |
Any significant increase in our future effective tax rates could impact our results of operations for future periods adversely.
20
Our ability to use net operating loss carryforwards to offset future taxable income for U.S. federal income tax purposes and other tax benefits may be limited.
Section 382 of the Internal Revenue Code of 1986, as amended (the “Code”) imposes an annual limitation on the amount of taxable income that may be offset if a corporation experiences an “ownership change” as defined in Section 382 of the Code. An ownership change occurs when a company’s “five-percent shareholders” (as defined in Section 382 of the Code) collectively increase their ownership in the company by more than 50 percentage points (by value) over a rolling three-year period. Additionally, various states have similar limitations on the use of state net operating losses (“NOL”) following an ownership change.
If we experience an ownership change, our ability to use our NOLs, any loss or deducting attributable to a “net unrealized built-in loss” and other tax attributes (collectively, the “Tax Benefits”) could be substantially limited, and the timing of the usage of the Tax Benefits could be substantially delayed, which could significantly impair the value of the Tax Benefits. There is no assurance that we will be able to fully utilize the Tax Benefits and we could be required to record an additional valuation allowance related to the amount of the Tax Benefits that may not be realized, which could adversely impact our result of operations.
We believe that these Tax Benefits are a valuable asset for us. On September 6, 2016, the Board approved a Tax Benefit Preservation Plan (the “Plan”) in an effort to protect our Tax Benefits during the effective period of the Plan. Further, on September 6, 2016, the Board adopted certain amendments to our Amended and Restated Certificate of Incorporation, as amended (the “Charter Amendments”), which are intended to preserve the Tax Benefits by restricting certain transfers of our common stock. The Plan and the Charter Amendments were approved by our stockholders at our 2016 annual meeting of stockholders on November 16, 2016. Although the Plan and the Charter Amendments are intended to reduce the likelihood of an “ownership change” that could adversely affect us, there is no assurance that the restrictions on transferability in the Plan and the Charter Amendments will prevent all transfers that could result in such an “ownership change.” There also can be no assurance that the transfer restrictions in the Charter Amendments will be enforceable against all of our stockholders absent a court determination confirming such enforceability. The transfer restrictions may be subject to challenge on legal or equitable grounds.
The Plan and the Charter Amendments could make it more difficult for a third party to acquire, or could discourage a third party from acquiring, us or a large block of our common stock. A third party that acquires 4.9% or more of our common stock could suffer substantial dilution of its ownership interest under the terms of the Plan through the issuance of common stock or common stock equivalents to all stockholders other than the acquiring person. The acquisition may also be void under the Charter Amendments.
The foregoing provisions may adversely affect the marketability of our common stock by discouraging potential investors from acquiring our stock. In addition, these provisions could delay or frustrate the removal of incumbent directors and could make more difficult a merger, tender offer or proxy contest involving us, or impede an attempt to acquire a significant or controlling interest in us, even if such events might be beneficial to us and our stockholders.
Our customers may not pay for products and services in a timely manner, or at all, which would decrease our cash flows and adversely affect our working capital.
Our business requires extensive credit risk management that may not be adequate to protect against customer nonpayment. A risk of non-payment by customers is a significant focus of our business. We expect a significant amount of future revenue to come from international customers in developing countries. We do not generally expect to obtain collateral for sales, although we require letters of credit or credit insurance as appropriate for international customers. For information regarding the percentage of revenue attributable to certain key customers, see the risks discussed in the following risk factor. Our historical accounts receivable balances have been concentrated in a small number of significant customers. Unexpected adverse events impacting the financial condition of our customers, bank failures or other unfavorable regulatory, economic or political events in the countries in which we do business may impact collections and adversely impact our business, require increased bad debt expense or receivable write-offs and adversely impact our cash flows, financial condition and operating results, which could also result in a breach of our bank covenants.
21
Because a significant amount of our revenue may come from a limited number of customers, the termination of any of these customer relationships may adversely affect our business.
Sales of our products and services historically have been concentrated in a small number of customers. Principal customers for our products and services include domestic and international wireless/mobile service providers, OEMs, as well as private network users such as public safety agencies; government institutions; and utility, pipeline, railroad and other industrial enterprises that operate broadband wireless networks. During fiscal 2017, 2016 and 2015, we had one customer in Africa, MTN Group that accounted for 14%, 18% and 14%, respectively, of our total revenue. Although we have a large customer base, during any given quarter a small number of customers may account for a significant portion of our revenue.
It is possible that a significant portion of our future product sales also could become even more concentrated in a limited number of customers. In addition, product sales to major customers have varied widely from period to period. The loss of any existing customer, a significant reduction in the level of sales to any existing customer, or our inability to gain additional customers could result in declines in our revenue or an inability to grow revenue. In addition, further consolidation of our potential customer base could result in purchasing decision delays as consolidating customers integrate their operations and could generally reduce our opportunities to win new customers to the extent that the number of potential customers decreases. Furthermore, as our customers become larger, they may have more leverage to negotiate better pricing which could adversely affect our revenues and gross margins.
Consolidation within the telecommunications industry could result in a decrease in our revenue.
The telecommunications industry has experienced significant consolidation among its participants, and we expect this trend to continue. Some operators in this industry have experienced financial difficulty and have filed, or may file, for bankruptcy protection. Other operators may merge and one or more of our competitors may supply products to the customers of the combined company following those mergers. This consolidation could result in purchasing decision delays and decreased opportunities for us to supply products to companies following any consolidation. This consolidation may also result in lost opportunities for cost reduction and economies of scale.
We continually evaluate strategic transaction opportunities which could involve merger, restructuring, divestiture, sale and/or acquisition activities that could disrupt our operations and harm our operating results.
Our growth depends upon market growth, our ability to enhance our existing products and our ability to introduce new products on a timely basis. We intend to continue to address the need to develop new products and enhance existing products through acquisitions, or “tuck-ins,” product lines, technologies, and personnel. Strategic transactions involve numerous risks, including the following:
• | difficulties in integrating the operations, systems, technologies, products, and personnel of the combined companies, particularly companies with large and widespread operations and/or complex products; |
• | diversion of management’s attention from normal daily operations of the business and the challenges of managing larger and more widespread operations resulting from business combinations, sales, divestitures and /or restructurings; |
• | potential difficulties in completing projects associated with in-process research and development intangibles; |
• | difficulties in entering markets in which we have no or limited direct prior experience and where competitors in each market have stronger market positions; |
• | initial dependence on unfamiliar supply chains or relatively small supply partners; |
• | insufficient revenue to offset increased expenses associated with acquisitions; and |
• | the potential loss of key employees, customers, resellers, vendors and other business partners of our company or the companies with which we engage in strategic transactions following and continuing after announcement of an anticipated strategic transaction. |
Strategic transactions may also cause us to:
• | issue common stock that would dilute our current stockholders or cause a change in control of the combined company; |
• | use a substantial portion of our cash resources, or incur debt; |
• | significantly increase our interest expense, leverage and debt service requirements if we incur additional debt to pay for an acquisition; |
• | assume material liabilities; |
22
• | record goodwill and non-amortizable intangible assets that are subject to impairment testing on a regular basis and potential periodic impairment charges; |
• | incur amortization expenses related to certain intangible assets; |
• | incur tax expenses related to the effect of acquisitions on our intercompany R&D cost sharing arrangement and legal structure; |
• | incur large and immediate write-offs and restructuring and other related expenses; and |
• | become subject to intellectual property or other litigation. |
Mergers, restructurings, sales and acquisitions of high-technology companies are inherently risky and subject to many factors outside of our control. No assurance can be given that any future strategic transactions will be successful and will not materially adversely affect our business, operating results or financial condition. Failure to manage and successfully complete a strategic transaction could materially harm our business and operating results. Even when an acquired or acquiring company has already developed and marketed products, there can be no assurance that product enhancements will be made in a timely fashion or that pre-acquisition due diligence will have identified all possible issues that might arise with respect to such products.
If we are unable to adequately protect our intellectual property rights, we may be deprived of legal recourse against those who misappropriate our intellectual property.
Our ability to compete will depend, in part, on our ability to obtain and enforce intellectual property protection for our technology in the U.S. and internationally. We rely upon a combination of trade secrets, trademarks, copyrights, patents and contractual rights to protect our intellectual property. In addition, we enter into confidentiality and invention assignment agreements with our employees, and enter into non-disclosure agreements with our suppliers and appropriate customers so as to limit access to and disclosure of our proprietary information. We cannot give assurances that any steps taken by us will be adequate to deter misappropriation or impede independent third-party development of similar technologies. In the event that such intellectual property arrangements are insufficient, our business, financial condition and results of operations could be harmed. We cannot provide assurances that the protection provided to our intellectual property by the laws and courts of particular nations will be substantially similar to the protection and remedies available under U.S. law. Furthermore, we cannot provide assurances that third parties will not assert infringement claims against us based on intellectual property rights and laws in other nations that are different from those established in the U.S.
If we fail to develop and maintain distribution and licensing relationships, our revenue may decrease.
Although a majority of our sales are made through our direct sales force, we also market our products through indirect sales channels such as independent agents, resellers, OEMs and systems integrators. These relationships enhance our ability to pursue major contract awards and, in some cases, are intended to provide our customers with easier access to financing and a greater variety of equipment and service capabilities, which an integrated system provider should be able to offer. We may not be able to maintain our current relationships or develop new ones. If additional relationships are developed, they may not be successful. Furthermore, as we consider increasing licensing revenue based on upgraded technology, we may not be successful in transitioning customers to the planned software upgrades. Our inability to establish or maintain these distribution and licensing relationships could restrict our ability to market our products and thereby result in significant reductions in revenue. If these revenue reductions occur, our business, financial condition and results of operations would be harmed.
If sufficient radio frequency spectrum is not allocated for use by our products, or we fail to obtain regulatory approval for our products, our ability to market our products may be restricted.
We will be affected by the allocation and auction of the radio frequency spectrum by governmental authorities both in the U.S. and internationally. These governmental authorities may not allocate sufficient radio frequency spectrum for use by our products or we may not be successful in obtaining regulatory approval for our products from these authorities. Historically, in many developed countries, the unavailability of frequency spectrum has inhibited the growth of wireless telecommunications networks. In addition, to operate in a jurisdiction, we must obtain regulatory approval for our products. Each jurisdiction in which we market our products has its own regulations governing radio communications. Products that support emerging wireless telecommunications services can be marketed in a jurisdiction only if permitted by suitable frequency allocations, auctions and regulations. The process of establishing new regulations is complex and lengthy. If we are unable to obtain sufficient allocation of radio frequency spectrum by the appropriate governmental authority or obtain the proper regulatory approval for our products, our business, financial condition and results of operations may be harmed.
23
Radio communications are subject to regulation by U.S. and foreign laws and international treaties. Generally, our products need to conform to a variety of United States and international requirements established to avoid interference among users of transmission frequencies and to permit interconnection of telecommunications equipment. Any delays in compliance with respect to our future products could delay the introduction of such products.
Our business is subject to changing regulation of corporate governance, public disclosure and anti-bribery measures which have resulted in increased costs and may continue to result in additional costs in the future and/or potential liabilities.
We are subject to rules and regulations of federal and state regulatory authorities, The NASDAQ Stock Market LLC (“NASDAQ”) and financial market entities charged with the protection of investors and the oversight of companies whose securities are publicly traded, and foreign and domestic legislative bodies. During the past few years, these entities, including the Public Company Accounting Oversight Board, the SEC, NASDAQ and several foreign governments such as the governments of the United Kingdom and Brazil, have issued requirements, laws and regulations and continue to develop additional requirements, laws and regulations, most notably the Sarbanes-Oxley Act of 2002 (“SOX”), and recent laws and regulations regarding bribery and unfair competition. Our efforts to comply with these requirements and regulations have resulted in, and are likely to continue to result in, increased general and administrative expenses and a diversion of substantial management time and attention from revenue-generating activities to compliance activities.
Moreover, because these laws, regulations and standards are subject to varying interpretations, their application in practice may evolve over time as new guidance becomes available. This evolution may result in continuing uncertainty regarding compliance matters and additional costs potentially necessitated by ongoing revisions to our disclosure and governance practices. Finally, if we are unable to ensure compliance with such requirements, laws, or regulations, we may be subject to costly prosecution and liability, and resulting reputational harm, from such noncompliance.
Changes in accounting standards issued by the Financial Accounting Standards Board (“FASB”) could adversely affect our financial condition and results of operations, and could require a significant expenditure of time, attention and resources, especially by senior management.
Our accounting and financial reporting policies conform to U.S. GAAP, which are periodically revised and/or expanded. The application of accounting principles is also subject to varying interpretations over time. Accordingly, we are required to adopt new or revised accounting standards or comply with revised interpretations that are issued from time to time by various parties, including accounting standard setters and those who interpret the standards, such as the FASB and the SEC and our independent registered public accounting firm. The FASB has recently proposed new financial accounting standards that may result in significant changes that could adversely affect our financial condition and results of operations.
In May 2014, the FASB issued Accounting Standards Update (“ASU”) 2014-09, Revenue from Contracts with Customers, which supersedes nearly all existing U.S. GAAP regarding revenue recognition. In February 2016, the FASB issued ASU 2016-02, Leases, which requires all operating leases with lease terms longer than twelve months be recorded as lease assets and lease liabilities on our consolidated balance sheets. Implementing changes required by new standards, requirements or laws likely will require a significant expenditure of time, attention and resources. It is impossible to completely predict the impact, if any, on us of future changes to accounting standards and financial reporting and corporate governance requirements.
Refer to Note 1 - The Company and Summary of Significant Accounting Policies of the Notes to the Consolidated Financial Statements for further discussion of these new accounting standards, including the implementation status and potential impact to our consolidated financial statements.
There are inherent limitations on the effectiveness of our controls.
We do not expect that our disclosure controls or our internal control over financial reporting will prevent or detect all errors and all fraud. A control system, no matter how well-designed and operated, can provide only reasonable, not absolute, assurance that the control system’s objectives will be met. The design of a control system must reflect the fact that resource constraints exist, and the benefits of controls must be considered relative to their costs. Further, because of the inherent limitations in all control systems, no evaluation of controls can provide absolute assurance that misstatements due to error or fraud will not occur or that all control issues and instances of fraud, if any, have been detected. These inherent limitations include the realities that judgments in decision-making can be faulty and that breakdowns can occur because of simple errors or mistakes. Controls can also be circumvented by individual acts of some persons, by collusion of two or more people, or by management’s override of the controls. The design of any system of controls is based in part on certain assumptions about the likelihood of future events, and there can be no assurance that any design will succeed in
24
achieving its stated goals under all potential future conditions. Projections of any evaluation of the effectiveness of controls to future periods are subject to risks. Over time, controls may become inadequate due to changes in conditions or deterioration in the degree of compliance with policies or procedures. If our controls become inadequate, we could fail to meet our financial reporting obligations, our reputation may be adversely affected, our business and operating results could be harmed, and the market price of our stock could decline.
Our products are used in critical communications networks which may subject us to significant liability claims.
Because our products are used in critical communications networks, we may be subject to significant liability claims if our products do not work properly. We warrant to our current customers that our products will operate in accordance with our product specifications. If our products fail to conform to these specifications, our customers could require us to remedy the failure or could assert claims for damages. The provisions in our agreements with customers that are intended to limit our exposure to liability claims may not preclude all potential claims. In addition, any insurance policies we have may not adequately limit our exposure with respect to such claims. Liability claims could require us to spend significant time and money in litigation or to pay significant damages. Any such claims, whether or not successful, would be costly and time-consuming to defend, and could divert management’s attention and seriously damage our reputation and our business.
We may be subject to litigation regarding our intellectual property. This litigation could be costly to defend and resolve, and could prevent us from using or selling the challenged technology.
The wireless telecommunications industry is characterized by vigorous protection and pursuit of intellectual property rights, which has resulted in often protracted and expensive litigation. Any litigation regarding patents or other intellectual property could be costly and time-consuming and could divert our management and key personnel from our business operations. The complexity of the technology involved and the uncertainty of intellectual property litigation increase these risks. Such litigation or claims could result in substantial costs and diversion of resources. In the event of an adverse result in any such litigation, we could be required to pay substantial damages, cease the use and transfer of allegedly infringing technology or the sale of allegedly infringing products and expend significant resources to develop non-infringing technology or obtain licenses for the infringing technology. We can give no assurances that we would be successful in developing such non-infringing technology or that any license for the infringing technology would be available to us on commercially reasonable terms, if at all. This could have a materially adverse effect on our business, results of operation, financial condition, competitive position and prospects.
System security risks, data protection breaches, and cyber attacks could compromise our proprietary information, disrupt our internal operations and harm public perception of our security products, which could cause our business and reputation to suffer and adversely affect our stock price.
In the ordinary course of business, we store sensitive data, including intellectual property, our proprietary business information and proprietary information of our customers, suppliers and business partners, on our networks. The secure maintenance of this information is critical to our operations and business strategy. Increasingly, companies, including ours, are subject to a wide variety of attacks on their networks on an ongoing basis. Despite our security measures, our information technology and infrastructure may be vulnerable to penetration or attacks by computer programmers and hackers, or breached due to employee error, malfeasance or other disruptions. Any such breach could compromise our networks, creating system disruptions or slowdowns and exploiting security vulnerabilities of our products, and the information stored on our networks could be accessed, publicly disclosed, lost or stolen, which could subject us to liability to our customers, suppliers, business partners and others, and cause us reputational and financial harm. In addition, sophisticated hardware and operating system software and applications that we produce or procure from third parties may contain defects in design or manufacture, including “bugs” and other problems that could unexpectedly interfere with the operation of our networks.
If an actual or perceived breach of network security occurs in our network or in the network of a customer of our security products, regardless of whether the breach is attributable to our products, the market perception of the effectiveness of our products could be harmed. Because the techniques used by computer programmers and hackers, many of whom are highly sophisticated and well-funded, to access or sabotage networks change frequently and generally are not recognized until after they are used, we may be unable to anticipate or immediately detect these techniques. This could impede our sales, manufacturing, distribution or other critical functions. In addition, the economic costs to us to eliminate or alleviate cyber or other security problems, bugs, viruses, worms, malicious software systems and security vulnerabilities could be significant and may be difficult to anticipate or measure because the damage may differ based on the identity and motive of the programmer or hacker, which are often difficult to identify.
25
Anti-takeover provisions of Delaware law, the Plan, and provisions in our Amended and Restated Certificate of Incorporation, as amended, and Amended and Restated Bylaws could make a third-party acquisition of us difficult.
Because we are a Delaware corporation, the anti-takeover provisions of Delaware law could make it more difficult for a third party to acquire control of us, even if the change in control would be supported by our stockholders. We are subject to the provisions of Section 203 of the General Corporation Law of Delaware, which prohibits us from engaging in certain business combinations, unless the business combination is approved in a prescribed manner. In addition, our Amended and Restated Certificate of Incorporation, as amended, and Amended and Restated Bylaws also contain certain provisions that may make a third-party acquisition of us difficult, including the ability of the Board to issue preferred stock and the requirement that nominations for directors and other proposals by stockholders must be made in advance of the meeting at which directors are elected or the proposals are voted upon.
In addition, the Plan and the Charter Amendments could make an acquisition of us more difficult, and certain acquisitions may also be void under the Charter Amendments. The risks associated with the Plan and the Charter Amendments are described in more detail above under the heading “Our ability to use net operating loss carryforwards to offset future taxable income for U.S. federal income tax purposes and other tax benefits may be limited.”
Item 1B. Unresolved Staff Comments
None.
Item 2. Properties
As of June 30, 2017, we leased approximately 178,000 square feet of facilities worldwide, with approximately 42% in the United States, mostly in California, Texas, and North Carolina. Our corporate headquarters is located in Milpitas, California, and consists of approximately 19,000 square feet office space. We also lease approximately 54,000 square feet of office, assembly facilities and warehouse in certain locations in Texas. Internationally, we lease approximately 104,000 square feet of facilities throughout Europe, Canada, Central America, South America, Africa and Asia regions, including offices in Singapore, Slovenia, Philippine Islands, India, Mexico, Brazil, Canada, South Africa, Ghana, Ivory Coast, Kenya, Nigeria, Algeria, France, Netherlands, Poland, Russia, Australia, Dubai, Saudi Arabia, Lebanon, China, and Thailand. In addition, we own approximately 108,000 square feet of facilities in Wellington, New Zealand and Lanarkshire, Scotland.
We maintain our facilities in good operating condition, and believe that they are suitable and adequate for our current and projected needs. We continuously review our anticipated requirements for facilities and may, from time to time, acquire additional facilities, expand existing facilities, or dispose of existing facilities or parts thereof, as we deem necessary.
For more information about our lease obligations, see “Note 12. Commitments and Contingencies” of the notes to consolidated financial statements, which are included in Item 8 in this Annual Report on Form 10-K.
Item 3. Legal Proceedings
We are subject from time to time to disputes with customers concerning our products and services. In May 2016, we received notification of a claim for $1.0 million in damages from a customer in Austria alleging that certain of our products were defective. We are continuing to investigate this claim, and at this time an estimate of the reasonably possible loss or range of loss cannot be made. In August 2016, we received a correspondence from a customer in Africa demanding that certain inventory be repurchased under the terms of an inventory management agreement that we believed had previously expired. We settled this matter for $0.2 million in April 2017.
From time to time, we may be involved in various other legal claims and litigation that arise in the normal course of our operations. We are aggressively defending all current litigation matters. Although there can be no assurances and the outcome of these matters is currently not determinable, we currently believe that none of these claims or proceedings are likely to have a material adverse effect on our financial position. We expect to defend each of these disputes vigorously. There are many uncertainties associated with any litigation and these actions or other third-party claims against us may cause us to incur costly litigation and/or substantial settlement charges. As a result, our business, financial condition, results of operations, and cash flows could be adversely affected. The actual liability in any such matters may be materially different from our estimates, if any.
26
We record accruals for our outstanding legal proceedings, investigations or claims when it is probable that a liability will be incurred and the amount of loss can be reasonably estimated. We evaluate, at least on a quarterly basis, developments in legal proceedings, investigations or claims that could affect the amount of any accrual, as well as any developments that would result in a loss contingency to become both probable and reasonably estimable. Except for the matter above which was ultimately settled for $0.2 million, we have not recorded any accrual for loss contingencies associated with such legal claims or litigation discussed above.
Item 4. Mine Safety Disclosures
Not applicable.
27
PART II
Item 5. Market for Registrant’s Common Equity, Related Stockholder Matters and Issuer Purchases of Equity Securities
Market Information and Price Range of Common Stock
Our common stock, with a par value of $0.01 per share, is listed and primarily traded on the NASDAQ Global Select Market, under the ticker symbol AVNW (prior to January 28, 2010 our ticker symbol was HSTX). There was no established trading market for shares of our common stock prior to January 29, 2007.
According to the records of our transfer agent, as of August 17, 2017, there were 2,544 holders of record of our common stock. The following table sets forth the high and low closing prices for a share of our common stock on NASDAQ Global Select Market for the periods indicated during our fiscal years 2017 and 2016, as retroactively adjusted for the 1-for-12 reverse stock split discussed in “Note 1. The Company and Summary of Significant Accounting Policies” of the notes to consolidated financial statements, which are included in Item 8 in this Annual Report on Form 10-K:
Fiscal 2017 | Fiscal 2016 | ||||||||||||||
High | Low | High | Low | ||||||||||||
First Quarter | $ | 9.93 | $ | 7.39 | $ | 15.96 | $ | 12.48 | |||||||
Second Quarter | $ | 14.94 | $ | 8.43 | $ | 14.04 | $ | 8.92 | |||||||
Third Quarter | $ | 15.86 | $ | 10.35 | $ | 9.57 | $ | 6.60 | |||||||
Fourth Quarter | $ | 23.55 | $ | 14.30 | $ | 9.31 | $ | 6.18 | |||||||
Dividend Policy
We have not paid cash dividends on our common stock and do not intend to pay cash dividends in the foreseeable future. We intend to retain any earnings for use in our business. In addition, the covenants of our credit facility may restrict us from paying dividends or making other distributions to our stockholders under certain circumstances.
Sales of Unregistered Securities
During fiscal 2017, we did not issue or sell any unregistered securities.
Issuer Repurchases of Equity Securities
During fiscal 2017, we did not repurchase any equity securities.
Performance Graph
The following graph and accompanying data compares the cumulative total return on our common stock with the cumulative total return of the Total Return Index for The NASDAQ Composite Market (U.S. Companies) and the NASDAQ Telecommunications Index for the five-year period ended June 30, 2017. The stock price performance shown on the graph below is not necessarily indicative of future price performance. Note that this graph and accompanying data is “furnished,” not “filed,” with the SEC.
28
COMPARISON OF 5 YEAR CUMULATIVE TOTAL RETURN*
Among Aviat Networks, Inc., the NASDAQ Composite Index
and the NASDAQ Telecommunications Index
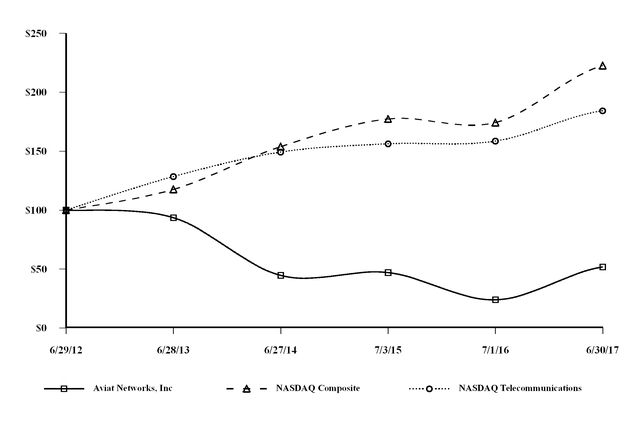
6/29/2012 | 6/28/2013 | 6/27/2014 | 7/3/2015 | 7/1/2016 | 6/30/2017 | ||||||||||||||||||
Aviat Networks, Inc. | $ | 100.00 | $ | 93.57 | $ | 44.66 | $ | 46.98 | $ | 23.95 | $ | 51.77 | |||||||||||
NASDAQ Composite | $ | 100.00 | $ | 117.60 | $ | 153.88 | $ | 177.34 | $ | 174.29 | $ | 222.67 | |||||||||||
NASDAQ Telecommunications | $ | 100.00 | $ | 128.44 | $ | 149.22 | $ | 156.24 | $ | 158.51 | $ | 184.31 | |||||||||||
____________________________
* | Assumes (i) $100 invested on June 29, 2012 in Aviat Networks, Inc. common stock, the Total Return Index for The NASDAQ Composite Market (U.S. companies) and the NASDAQ Telecommunications Index; and (ii) immediate reinvestment of all dividends. |
29
Item 6. Selected Financial Data
The following table summarizes our selected historical financial information for each of the last five fiscal years that has been derived from our consolidated financial statements. All of the per-share data have been retroactively adjusted for the 1-for-12 reverse stock split discussed in “Note 1. The Company and Summary of Significant Accounting Policies” of the notes to consolidated financial statements, which are included in Item 8 of this Annual Report on Form 10-K. Data presented for fiscal years 2017, 2016 and 2015 are included elsewhere in this Annual Report on Form 10-K. This table should be read in conjunction with our other financial information, including “Item 7. Management’s Discussion and Analysis of Financial Condition and Results of Operations” and the consolidated financial statements and notes, included elsewhere in this Annual Report on Form 10-K.
Fiscal Year Ended | |||||||||||||||||||
(In thousands, except per share amounts) | June 30, 2017 | July 1, 2016 | July 3, 2015 | June 27, 2014(1) | June 28, 2013(1) | ||||||||||||||
Revenue from product sales and services | $ | 241,874 | $ | 268,690 | $ | 335,878 | $ | 346,032 | $ | 471,255 | |||||||||
Cost of product sales and services | 166,402 | 206,973 | 255,188 | 260,844 | 332,913 | ||||||||||||||
Loss from continuing operations (2) (3) | (621 | ) | (30,178 | ) | (24,648 | ) | (52,018 | ) | (12,647 | ) | |||||||||
Net loss (2) (3) | (621 | ) | (29,637 | ) | (24,554 | ) | (51,100 | ) | (16,725 | ) | |||||||||
Net income attributable to noncontrolling interests, net of tax | 202 | 270 | 71 | — | — | ||||||||||||||
Net loss attributable to Aviat Networks (2) (3) | (823 | ) | (29,907 | ) | (24,625 | ) | (51,100 | ) | (16,725 | ) | |||||||||
Basic and diluted loss per common share: | |||||||||||||||||||
Loss from continuing operations | $ | (0.16 | ) | $ | (5.81 | ) | $ | (4.77 | ) | $ | (10.13 | ) | $ | (2.53 | ) | ||||
Net loss | (0.16 | ) | (5.71 | ) | (4.75 | ) | (9.95 | ) | (3.34 | ) | |||||||||
_______________________
(1) | As revised, during the fourth quarter of fiscal 2015, these amounts have been revised as we identified and corrected errors around our accrued liability related to cost of services revenue. |
(2) | Include share-based compensation expense $2.1 million, $1.8 million, $2.2 million, $3.4 million and $6.4 million for fiscal 2017, 2016, 2015, 2014 and 2013 respectively. |
(3) | Include restructuring charges of $0.6 million, $2.5 million, $4.9 million, $11.2 million and $3.1 million for fiscal 2017, 2016, 2015, 2014 and 2013 respectively. |
As of | |||||||||||||||||||
(In thousands) | June 30, 2017 | July 1, 2016 | July 3, 2015 | June 27, 2014(1) | June 28, 2013(1) | ||||||||||||||
Total assets | $ | 152,576 | $ | 166,111 | $ | 224,715 | $ | 253,184 | $ | 305,816 | |||||||||
Long-term liabilities | 12,218 | 12,707 | 18,198 | 19,574 | 24,825 | ||||||||||||||
_______________________
(1) | As revised, during the fourth quarter of fiscal 2015, these amounts have been revised as we identified and corrected errors around our accrued liability related to cost of services revenue. |
30
Item 7. Management’s Discussion and Analysis of Financial Condition and Results of Operations
Overview of Business; Operating Environment and Key Factors Impacting Fiscal 2016 and 2017 Results
The following Management’s Discussion and Analysis (“MD&A”) is intended to help the reader understand our results of operations and financial condition. MD&A is provided as a supplement to, and should be read in conjunction with, our consolidated financial statements and the accompanying notes. In the discussion below, our fiscal year ending June 29, 2018 is referred to as “fiscal 2018” or “2018”; our fiscal year ended June 30, 2017 is referred to as “fiscal 2017” or “2017”; our fiscal year ended July 1, 2016 is referred to as “fiscal 2016” or “2016”; and our fiscal year ended July 3, 2015 is referred to as “fiscal 2015” or “2015.”
Overview
We generate revenue by designing, developing, manufacturing and supporting a range of wireless networking products, solutions and services for mobile and fixed communications service providers, private network operators, government agencies, transportation, energy and utility companies, public safety agencies and broadcast network operators across the world. Our products include point-to-point digital microwave transmission systems designed for first/last mile access, middle mile/backhaul, and long distance trunking applications. We also provide network management software solutions to enable operators to deploy, monitor and manage our systems, third party equipment such as antennas, routers, optical transmission equipment and other equipment necessary to build and deploy a complete telecommunications transmission network. We provide a full suite of professional services for planning, deployment, operations and maintenance of our customers’ networks.
We work continuously to improve our established brands and to create new products that meet our customers’ evolving needs and preferences. Our fundamental business goal is to generate superior returns for our stockholders over the long term. We believe that increases in revenue, operating profits and earnings per share are the key measures of financial performance for our business. However, within the industry there continues to be strong price competition for new business and periodic large customer consolidations that intensify competition in all regions.
Our strategic focus in fiscal 2018 will be to continue to accelerate innovation and optimize our product portfolio, improve costs and operational efficiencies, grow our revenue and create a sustainable, profitable business model. To do this, we continue to examine our products, markets, facilities, development programs, and operational flows to ensure we are focused on what we do well and what will differentiate us in the future. We will continue working to streamline management processes to attain the efficiency levels required by the markets in which we do business.
Although the general trend of increasing demand for bandwidth to support mobile networks applies in all markets, we expect to see quarter-to-quarter fluctuations within markets and with individual customers based on customers’ past purchasing patterns. Seasonality is also a factor that impacts our business. Our fiscal third quarter revenue and orders have historically been lower than the revenue and orders in our second fiscal quarter because many of our customers utilize a significant portion of their capital budgets at the end of their fiscal years, which is typically the calendar year end and coincides with our second fiscal quarter. The majority of our customers begin a new fiscal year on January 1, and capital expenditures tend to be lower in an organization’s first quarter than in its fourth quarter. We anticipate that this seasonality will continue. The seasonality between the second quarter and third quarter may be affected by a variety of additional factors, including changes in the global economy.
In line with industry trends, we expect to provide increased managed services, including network design, inventory management, final configuration and warehousing services, to certain customers in certain geographies. Our operating results may be impacted by providing these services to the extent that we may need to postpone the recognition of revenue and incur upfront and ongoing expenses that are not offset with additional revenue from product sales associated with these services until a future period.
We continue to explore strategic alternatives to improve the market position and profitability of our product offerings in the marketplace, generate additional liquidity and enhance our valuation. We may pursue our goals during the next twelve months through organic growth and through strategic alternatives. Some of these alternatives have included, and could continue to include, selective acquisitions, divestitures and the sale of assets or securities. We have also provided, and may from time to time in the future provide, information to interested parties.
31
Operations Review
The market for mobile backhaul continues to be our primary addressable market segment and, over the long term, the demand for increasing the backhaul capacity in our customers’ networks continues to grow. In North America, we supported long-term evolution (“LTE”) deployments of our mobile operator customers, public safety network deployments for state and local governments, and private network implementations for utilities and other customers. In international markets, our business continued to rely on a combination of customers increasing their capacity to handle subscriber growth, the ongoing build-out of some large 3G deployments, and the emergence of early stage LTE deployments. Our international business was adversely affected in fiscal 2016 and fiscal 2017 by constrained availability of U.S. dollars in countries with economies highly dependent on resource exports, particularly oil. This condition, along with decline in local purchasing power because of the currency devaluation relative to U.S. dollars, limited capital spending and slowed payments from customers in those locations. Our position continues to be to support our customers for LTE readiness and ensure that our technology roadmap is well aligned with evolving market requirements. We continue to find that our strength in turnkey and after-sale support services is a differentiating factor that wins business for us and enables us to expand our business with existing customers in all markets. However, as disclosed above and in the “Risk Factors” section in Item 1A of this Annual Report on Form 10-K, a number of factors could prevent us from achieving our objectives, including ongoing pricing pressures attributable to competition and macroeconomic conditions in the geographic markets that we service.
Revenue
We manage our sales activities primarily on a geographic basis in North America and three international geographic regions: (1) Africa and Middle East, (2) Europe and Russia and (3) Latin America and Asia Pacific. Revenue by region for fiscal 2017, 2016 and 2015 and the related changes were shown in the table below:
Fiscal Year | $ Change | % Change | |||||||||||||||||||||||
(In thousands, except percentages) | 2017 | 2016 | 2015 | 2017/2016 | 2016/2015 | 2017/2016 | 2016/2015 | ||||||||||||||||||
North America | $ | 132,078 | $ | 125,482 | $ | 153,239 | $ | 6,596 | $ | (27,757 | ) | 5.3 | % | (18.1 | )% | ||||||||||
Africa and Middle East | 60,150 | 82,742 | 97,112 | (22,592 | ) | (14,370 | ) | (27.3 | )% | (14.8 | )% | ||||||||||||||
Europe and Russia | 14,128 | 20,539 | 35,990 | (6,411 | ) | (15,451 | ) | (31.2 | )% | (42.9 | )% | ||||||||||||||
Latin America and Asia Pacific | 35,518 | 39,927 | 49,537 | (4,409 | ) | (9,610 | ) | (11.0 | )% | (19.4 | )% | ||||||||||||||
Total Revenue | $ | 241,874 | $ | 268,690 | $ | 335,878 | $ | (26,816 | ) | $ | (67,188 | ) | (10.0 | )% | (20.0 | )% | |||||||||
Our revenue in North America increased $6.6 million, or 5.3%, in fiscal 2017 compared with fiscal 2016. The increase in North America was from private network customers, offset by decreased revenue from wireless operator customers. Private network business increased in fiscal 2017 due to new customers and substantial investments by certain customers in network upgrades. The decrease in revenue from our North America wireless operator customers was primarily due to them reaching the end of their LTE network build cycle. Revenue in North America decreased $27.8 million, or 18.1%, in fiscal 2016 compared with fiscal 2015. While our order volume increased in North America compared to fiscal 2015, we experienced a shift in the mix of business away from wireless operator customers and toward private networks operated by governments and utilities. In addition, orders from private networks generally have a longer cycle time from order placement to completion for revenue than orders from the wireless operators because of the larger degree of service content included with the private network projects. In fiscal 2016, we saw a decrease in revenue both from the lower volume of business with wireless operator customers and from the longer cycle time to revenue from the larger volume of business with private network customers.
Revenue in Africa and the Middle East decreased $22.6 million, or 27.3%, in fiscal 2017 compared with fiscal 2016 due to lower sales to mobile operator customers in Africa and a decrease in revenue from customers in the Middle East. Our sales to major African customers have declined for several years due to a combination of factors that vary within the region, including customer constraints on capital spending and decline in local purchasing power because of currency devaluation relative to U.S. dollars. Revenue in Africa and the Middle East decreased $14.4 million, or 14.8%, in fiscal 2016 compared with fiscal 2015. The fiscal 2016 decrease in revenue came from decreased sales volume to our private network customers in the Middle East and across several customers in Africa. Revenue with our major wireless operator customers in the region remained relatively low, and slightly down in fiscal 2016 compared to fiscal 2015.
Revenue in Europe and Russia was down $6.4 million, or 31.2%, in fiscal 2017 compared with fiscal 2016. The decrease came from lower sales to our large customers in the region compared with fiscal 2016. In addition, sales were negatively affected by decreased purchasing power coming from the general weakness of the Euro relative to the U.S.
32
dollar. Revenue in Europe and Russia was down $15.5 million, or 42.9% in fiscal 2016 compared with fiscal 2015 for similar reasons.
Revenue in Latin America and Asia Pacific declined $4.4 million, or 11.0%, in fiscal 2017 compared with fiscal 2016, primarily due to decreased deliveries to our larger customers in the Asia-Pacific region. Business in Latin America increased a small amount over the previous fiscal year. Revenue in Latin America and Asia-Pacific declined $9.6 million, or 19.4%, in fiscal 2016 compared with fiscal 2015, mostly due to lower product sales to several mid-size customers in Asia Pacific, partially offset by a large increase with one of our customers in the region. The decrease was also attributable to a year-to-year reduction in sales to private network customers in Latin America.
Fiscal Year | $ Change | % Change | |||||||||||||||||||||||
(In thousands, except percentages) | 2017 | 2016 | 2015 | 2017/2016 | 2016/2015 | 2017/2016 | 2016/2015 | ||||||||||||||||||
Product sales | $ | 153,517 | $ | 167,827 | $ | 214,874 | $ | (14,310 | ) | $ | (47,047 | ) | (8.5 | )% | (21.9 | )% | |||||||||
Services | 88,357 | 100,863 | 121,004 | (12,506 | ) | (20,141 | ) | (12.4 | )% | (16.6 | )% | ||||||||||||||
Total Revenue | $ | 241,874 | $ | 268,690 | $ | 335,878 | $ | (26,816 | ) | $ | (67,188 | ) | (10.0 | )% | (20.0 | )% | |||||||||
Our revenue from product sales decreased $14.3 million, or 8.5%, in fiscal 2017 compared with fiscal 2016. Product sales were weaker in all international markets, with the exception of Latin America, for the same reasons as mentioned above in the regional comments. The $23.2 million decrease in international product sales was partially offset by an $8.9 million increase in North America product sales during fiscal 2017. Our service revenue decreased $12.5 million, or 12.4%, in fiscal 2017 compared with fiscal 2016 mainly due to the reduction in product sales. Service sales in North America decreased by $2.3 million, and service sales to our international customers decreased by $10.2 million.
Our revenue from product sales decreased $47.0 million, or 21.9%, in fiscal 2016 compared with fiscal 2015. Product volumes were lower in all sectors, but the majority of the decrease was in North America and Europe. In North America this decline reflected fewer orders from wireless operators and the extended cycle time to complete large projects. In Europe, this decline reflected constrained capital spending mentioned above. Our services revenue decreased $20.1 million, or 16.6%, in fiscal 2016 compared with fiscal 2015, due to reduced service activities in all sectors, but particularly in North America, Middle East and Africa.
Gross Margin
Fiscal Year | $ Change | % Change | |||||||||||||||||||||||
(In thousands, except percentages) | 2017 | 2016 | 2015 | 2017/2016 | 2016/2015 | 2017/2016 | 2016/2015 | ||||||||||||||||||
Revenue | $ | 241,874 | $ | 268,690 | $ | 335,878 | $ | (26,816 | ) | $ | (67,188 | ) | (10.0 | )% | (20.0 | )% | |||||||||
Cost of revenue | 166,402 | 206,973 | 255,188 | (40,571 | ) | (48,215 | ) | (19.6 | )% | (18.9 | )% | ||||||||||||||
Gross margin | $ | 75,472 | $ | 61,717 | $ | 80,690 | $ | 13,755 | $ | (18,973 | ) | 22.3 | % | (23.5 | )% | ||||||||||
% of revenue | 31.2 | % | 23.0 | % | 24.0 | % | |||||||||||||||||||
Product margin % | 31.5 | % | 23.3 | % | 23.7 | % | |||||||||||||||||||
Service margin % | 30.7 | % | 22.4 | % | 24.5 | % | |||||||||||||||||||
Gross margin for fiscal 2017 increased $13.8 million, or 22.3%, compared with fiscal 2016. Gross margin as a percentage of revenue for fiscal 2017 improved to 31.2%, compared with 23.0% in fiscal 2016. Gross margin improvement was primarily due to lower supply chain costs, a decrease in inventory write-down of $9.1 million and improved sales margin rates from both product and service businesses. Product margin as a percentage of product revenue increased over the same period in fiscal 2016 primarily due to reduced supply chain costs, a decrease in inventory write-down of $9.1 million and greater concentration of sales in higher margin regions. Gross margin as a percentage of service revenue also improved in all sectors compared with the same period in fiscal 2016. We attributed the margin improvement in the service business and our reduced supply chain costs to process improvement programs along with our restructuring program implemented over the past several quarters.
Gross margin for fiscal 2016 decreased $19.0 million, or 23.5%, compared with fiscal 2015. Gross margin as a percentage of revenue for fiscal 2016 decreased to 23.0%, compared with 24.0% in fiscal 2015. The decrease was primarily due to lower revenue volume across all business sectors during fiscal 2016 and an increase in inventory write-down of $2.9 million, partially offset by reduced supply chain costs compared with fiscal 2015. Product margin as a percentage of product revenue decreased from fiscal 2015 primarily due to supply chain costs being absorbed by a
33
substantially smaller volume of product sales during the year and an increase in inventory write-down of $2.9 million. Service margin as a percentage of service revenue declined primarily due to a less profitable service business in international markets.
Research and Development Expenses
Fiscal Year | $ Change | % Change | |||||||||||||||||||||||
(In thousands, except percentages) | 2017 | 2016 | 2015 | 2017/2016 | 2016/2015 | 2017/2016 | 2016/2015 | ||||||||||||||||||
Research and development expenses | $ | 18,684 | $ | 20,806 | $ | 25,368 | $ | (2,122 | ) | $ | (4,562 | ) | (10.2 | )% | (18.0 | )% | |||||||||
% of revenue | 7.7 | % | 7.7 | % | 7.6 | % | |||||||||||||||||||
Our R&D expenses decreased $2.1 million, or 10.2%, in fiscal 2017 compared with fiscal 2016. The decrease in R&D expenses was primarily due to a $1.2 million reduction in professional services and material spending along with an increase of $1.1 million related to an international economic incentive grant credit earned in fiscal 2017. We continue to invest in new product features, new functionality and lower cost platforms that we believe will enable our product lines to retain their technology leads in a cost-effective manner.
Our R&D expenses decreased $4.6 million, or 18.0%, in fiscal 2016 compared with fiscal 2015. The decrease in R&D expenses was primarily due to a $4.4 million reduction in personnel and related expenses due to the restructuring programs implemented, and $1.8 million facility expense reassigned to restructuring accounts. The decreases were partially offset by a $1.7 million increase in professional services and material spending for new products.
Selling and Administrative Expenses
Fiscal Year | $ Change | % Change | |||||||||||||||||||||||
(In thousands, except percentages) | 2017 | 2016 | 2015 | 2017/2016 | 2016/2015 | 2017/2016 | 2016/2015 | ||||||||||||||||||
Selling and administrative expenses | $ | 57,184 | $ | 65,902 | $ | 76,005 | $ | (8,718 | ) | $ | (10,103 | ) | (13.2 | )% | (13.3 | )% | |||||||||
% of revenue | 23.6 | % | 24.5 | % | 22.6 | % | |||||||||||||||||||
Our selling and administrative expenses decreased $8.7 million, or 13.2%, in fiscal 2017 compared with fiscal 2016. The decrease was primarily due to a $7.6 million decrease in personnel and related expenses, and a $0.9 million reduction in professional fees primarily associated with accounting, IT, legal, and marketing consulting services. We will continue to seek ways to improve our operating efficiency in fiscal 2018.
Our selling and administrative expenses decreased $10.1 million, or 13.3%, in fiscal 2016 compared with fiscal 2015. The decrease was primarily due to a $3.8 million decrease in personnel and related expenses, a $6.5 million reduction in professional fees primarily associated with accounting, IT, legal, and marketing consulting services, a $1.4 million decrease in sales commission and incentive compensation, and a $0.4 million decrease in share-based compensation expenses. The decreases were partially offset by a $1.9 million increase in professional fees primarily associated with process improvements, and a $0.6 million increase in bad debt expenses.
Restructuring Charges
During the fourth quarter of fiscal 2016, we initiated a restructuring plan (the “Fiscal 2016-2017 Plan”) to streamline our operations and align expense with current revenue levels. Activities under the Fiscal 2016-2017 Plan primarily include reductions in force in marketing, selling and general and administrative functions across the Company.
During the third quarter of fiscal 2015, with the intent to bring our operational cost structure in line with the changing dynamics of the microwave radio and telecommunications markets, we initiated a restructuring plan (“the Fiscal 2015-2016 Plan”) to lower fixed overhead costs and operating expenses and to preserve cash flow. Activities under the Fiscal 2015-2016 Plan primarily include reductions in force across the Company, but primarily in operations outside the United States.
During the third quarter of fiscal 2014, in line with the decrease in revenue that we experienced and our reduced forecast for the immediate future, we initiated a restructuring plan (“the Fiscal 2014-2015 Plan”) to reduce our operating costs, primarily in North America, Europe and Asia. Activities under the Fiscal 2014-2015 Plan primarily include reductions in force and additional facility downsizing of our Santa Clara, California headquarters.
34
During the fourth quarter of fiscal 2013, we initiated a restructuring plan (the “Fiscal 2013-2014 Plan”) that was intended to reduce our operating expenses primarily in North America, Europe and Asia. Activities under the Fiscal 2013-2014 Plan included reductions in force and the downsizing of our Santa Clara, California headquarters and certain international field offices.
Our restructuring charges by plan for fiscal 2017, 2016 and 2015 are summarized in the table below:
Fiscal Year | $ Change | % Change | |||||||||||||||||||||||
(In thousands, except percentages) | 2017 | 2016 | 2015 | 2017/2016 | 2016/2015 | 2017/2016 | 2016/2015 | ||||||||||||||||||
Fiscal 2016-2017 Plan | $ | 345 | $ | 2,210 | $ | — | $ | (1,865 | ) | $ | 2,210 | (84.4 | )% | N/A | |||||||||||
Fiscal 2015-2016 Plan | 36 | 282 | 3,503 | (246 | ) | (3,221 | ) | (87.2 | )% | (91.9 | )% | ||||||||||||||
Fiscal 2014-2015 Plan | 162 | 77 | 1,277 | 85 | (1,200 | ) | 110.4 | % | (94.0 | )% | |||||||||||||||
Fiscal 2013-2014 Plan | 46 | (114 | ) | 87 | 160 | (201 | ) | (140.4 | )% | (231.0 | )% | ||||||||||||||
Total | $ | 589 | $ | 2,455 | $ | 4,867 | $ | (1,866 | ) | $ | (2,412 | ) | (76.0 | )% | (49.6 | )% | |||||||||
Our restructuring expenses consisted primarily of severance and related benefit charges, facilities costs related to obligations under non-cancelable leases for facilities that we ceased to use, and lease termination charges. During June 2016, we entered into a lease termination agreement for our previous headquarters lease in Santa Clara, California.
Restructuring charges for fiscal 2017 included $0.4 million employee severance and benefits costs primarily related to the Fiscal 2016-2017 Plan and $0.2 million facility charges primarily consisted of headquarters moving costs. Restructuring charges for fiscal 2016 included $2.5 million employee severance and benefits costs primarily related to the Fiscal 2016-2017 Plan and the Fiscal 2015-2016 Plan, a $1.9 million lease termination payable, offset by a $1.2 million deferred rent liability write-off and a net decrease of $0.7 million lease impairment liabilities both resulted from the termination of our Santa Clara headquarters building. Restructuring charges for fiscal 2015 included a $2.9 million employee termination charge primarily related to the Fiscal 2015-2016 Plan, a $1.4 million facility charge related to ceasing to use portion of our Santa Clara headquarters building and a $0.6 million Slovenia government fund penalty charge related to the workforce reduction.
We have substantially completed the restructuring activities under all plans by the end of fiscal 2017.
Interest Income, Interest Expense and Other Expense
Fiscal Year | $ Change | % Change | |||||||||||||||||||||||
(In thousands, except percentages) | 2017 | 2016 | 2015 | 2017/2016 | 2016/2015 | 2017/2016 | 2016/2015 | ||||||||||||||||||
Interest income | $ | 261 | $ | 252 | $ | 360 | $ | 9 | $ | (108 | ) | 4 | % | (30 | )% | ||||||||||
Interest expense | (50 | ) | (104 | ) | (388 | ) | 54 | 284 | (52 | )% | (73 | )% | |||||||||||||
Other income (expense) | 169 | (1,245 | ) | — | 1,414 | (1,245 | ) | (114 | )% | N/A | |||||||||||||||
Interest income reflected interest earned on our cash equivalents which were comprised of money market funds and certificates of deposit.
Interest expense was primarily related to interest associated with borrowings under the Silicon Valley Bank (“SVB”) Credit Facility and discounts on customer letters of credit.
Other income in fiscal 2017 included a $0.3 million foreign currency translation gain reclassified from accumulated other comprehensive loss upon liquidation of a dormant foreign legal entity. This income was offset partially by a $0.2 million foreign exchange loss on a dividend declared by our Nigeria entity (a partnership for U.S. tax purposes) to our Aviat U.S. entity. Other expense in fiscal 2016 related to the foreign exchange loss on a dividend declared by our Nigeria entity to Aviat U.S. entity which was caused by a significant devaluation of the Nigerian Naira in June 2016.
35
Income Taxes
Fiscal Year | $ Change | ||||||||||||||||||
(In thousands, except percentages) | 2017 | 2016 | 2015 | 2017/2016 | 2016/2015 | ||||||||||||||
Loss from continuing operations before income taxes | $ | (605 | ) | $ | (28,543 | ) | $ | (25,958 | ) | $ | 27,938 | $ | (2,585 | ) | |||||
Provision for (benefit from) income taxes | 16 | 1,635 | (1,310 | ) | (1,619 | ) | 2,945 | ||||||||||||
As % of loss from continuing operations before income taxes | (2.6 | )% | (5.7 | )% | 5.0 | % | |||||||||||||
Our income tax expense (benefit) from continuing operations was $16 thousand of expense for fiscal 2017 compared to $1.6 million of expense for fiscal 2016 and $1.3 million of benefit for fiscal 2015. The difference between our income tax expense (benefit) from continuing operations and income tax expense at the statutory rate of 35% was primarily attributable to losses in tax jurisdictions in which we cannot recognize a tax benefit and increase in foreign withholding taxes. During fiscal 2017, we recorded a $3.7 million tax benefit from the audit assessment refund received from the Inland Revenue Authority of Singapore. During fiscal 2015, we released approximately $4.4 million of the deferred tax valuation allowance in jurisdictions where management believed the utilization of deferred tax assets was more likely than not based on the weighting of positive and negative evidence.
Income from Discontinued Operations
Fiscal Year | $ Change | ||||||||||||||||||
(In thousands) | 2017 | 2016 | 2015 | 2017/2016 | 2016/2015 | ||||||||||||||
Income from discontinued operations, net of tax | $ | — | $ | 541 | $ | 94 | $ | (541 | ) | $ | 447 | ||||||||
Our discontinued operations consisted of the WiMAX business, which was sold to EION Networks, Inc. (“EION”) on September 2, 2011. We completed the business transition with EION in fiscal 2012. The income recognized in fiscal 2016 was primarily due to recovery of certain WiMAX customer receivables that were previously written down. The income recognized in fiscal 2015 was primarily due to a $0.1 million write-off of accrued liabilities due to EION.
Liquidity, Capital Resources and Financial Strategies
As of June 30, 2017, our total cash and cash equivalents and short-term investments totaled $35.9 million. Approximately $22.0 million, or 61.4%, was held in the United States. The remaining balance of $13.9 million, or 38.6%, was held by entities outside the United States. Of the amount of cash and cash equivalents held by our foreign subsidiaries at June 30, 2017, $9.7 million was held in jurisdictions where our undistributed earnings are indefinitely reinvested, and if repatriated, would be subject to U.S. taxes which would be nominal.
Operating Activities
Cash provided by (used in) operating activities is presented as net loss adjusted for certain non-cash items and changes in assets and liabilities. Net cash provided by (used in) operating activities was $9.4 million for fiscal 2017, $0.4 million for fiscal 2016 and $(9.6) million for fiscal 2015.
For fiscal 2017 compared to fiscal 2016, cash provided by operating activities improved by $9.0 million. Results from operations improved by $29.0 million as we had a lower net loss of $0.6 million in fiscal 2017 compared to a net loss of $29.6 million in fiscal 2016. Net contribution of non-cash items to cash provided by operating activities decreased by $12.0 million and net contribution of changes in operating assets and liabilities to cash provided by operating activities decreased by $8.0 million in fiscal 2017 as compared to fiscal 2016.
The $29.0 million decrease in net loss includes a $3.7 million tax refund from the Inland Revenue Authority of Singapore related to a $13.2 million tax assessment we paid in fiscal 2014. This tax refund was recorded as a discrete tax benefit when it was received during our first quarter of fiscal 2017.
The $12.0 million decrease in the net contribution of non-cash items to cash provided by operating activities was primarily due to a $8.7 million decrease in charges for inventory write-downs, a $2.1 million decrease in bad debt expense, a $0.8 million decrease in depreciation and amortization of property, plant and equipment, a $0.7 million decrease in loss on disposition of property, plant and equipment and a $0.3 million gain on liquidation of a dormant subsidiary in the third quarter of fiscal 2017.
36
Changes in operating assets and liabilities resulted in a decrease of $8.0 million for fiscal 2017 compared to fiscal 2016. The decrease in accounts receivable was primarily due to stronger collections, and unbilled receivables increased due to timing of billings. The fluctuation in accounts payable and accrued expenses was primarily due to timing of liabilities incurred and vendor payments. The change in inventories and in customer service inventories was primarily due to demand and our focus on improving our inventory management. The change in advance payments and unearned income was due to timing of payment from customers and revenue recognition. We used $3.7 million in cash during fiscal 2017 on expenses related to restructuring liabilities.
For fiscal 2016 compared to fiscal 2015, the $10.0 million increase in cash provided by operating activities was primarily due to a $9.0 million increase in working capital, a $4.4 million decrease in deferred income taxes benefits and a $1.8 million higher inventory and customer service inventory write-downs, offset by a $5.1 million higher net loss.
Investing Activities
Net cash used in investing activities was $4.0 million for fiscal year 2017, $1.8 million for fiscal 2016 and $3.7 million for fiscal 2015, which consisted primarily of capital expenditures.
For fiscal 2018, we expect to spend approximately $5.3 million for capital expenditures, primarily on equipment for development and manufacturing of new products and to support customer managed services.
Financing Activities
Financing cash flows consist primarily of proceeds and repayments of short-term debt and proceeds from sale of share of common stock through employee equity plans. Net cash provided by financing activities was $21 thousand for fiscal year 2017, $13 thousand for fiscal 2016 and $2.9 million for fiscal 2015.
As of June 30, 2017, our principal sources of liquidity consisted of the $35.9 million in cash, cash equivalents and short-term investments, $5.8 million of available credit under our $30.0 million credit facility with Silicon Valley Bank (“SVB”) which expires on June 30, 2018, and future collections of receivables from customers. We regularly require letters of credit from some customers and, from time to time, these letters of credit are discounted without recourse shortly after shipment occurs in order to meet immediate liquidity requirements and to reduce our credit and sovereign risk. Historically, our primary sources of liquidity have been cash flows from operations and credit facilities.
We believe that our existing cash and cash equivalents, the available line of credit under the SVB Credit Facility (as defined below) and future cash collections from customers will be sufficient to provide for our anticipated requirements for working capital and capital expenditures for at least the next 12 months. Our SVB Credit Facility expires on June 30, 2018. While we intend and expect the SVB Credit Facility to be renewed, there can be no assurance that the SVB Credit Facility will be renewed. In addition, there can be no assurance, however, that our business will generate cash flow from operations, that we will be in compliance with the quarterly financial covenants contained in the SVB Credit Facility, or that we will have a sufficient borrowing base under such facility, or that anticipated operational improvements will be achieved. If we are not in compliance with the financial covenants or do not have sufficient eligible accounts receivable to support our borrowing base, the availability of our credit facility is not certain or may be diminished. Over the longer term, if we are unable to maintain cash balances or generate sufficient cash flow from operations to service our obligations that may arise in the future, we may be required to sell assets, reduce capital expenditures, or obtain financing. If we need to obtain additional financing, we cannot be assured that it will be available on favorable terms, or at all. Our ability to make scheduled principal payments or pay interest on or refinance any future indebtedness depends on our future performance and financial results, which, to a certain extent, are subject to general conditions in or affecting the microwave communications market and to general economic, political, financial, competitive, legislative and regulatory factors beyond our control.
Available Credit Facility, Borrowings and Repayment of Debt
On March 28, 2014, we entered into a Second Amended and Restated Loan Agreement with SVB (the “SVB Credit Facility”). The SVB Credit Facility was amended on September 25, 2014, October 30, 2014 and December 2, 2014 to provide for extensions to the deadline for preparing and filing our fiscal 2014 financial statements with the SEC. On February 27, 2015, the SVB Credit Facility was further amended to provide for certain amendments to the financial covenants, borrowing base and an early termination fee if the SVB Credit Facility is terminated prior to its expiration. In March 2016, we amended the SVB Credit Facility to amend financial covenants and to reduce the maximum borrowing capacity from $40.0 million to $30.0 million. In June 2016, we amended the SVB Credit Facility to amend the minimum Earnings before Interest, Tax, Depreciation and Amortization (“EBITDA”) covenant; to create a new sub-limit for letters
37
of credit issued under the revolving credit facility of $12.0 million; to reduce the advance rate applicable to Singapore Borrower’s eligible accounts in the calculation of the borrowing base of the revolving credit facility; to increase the interest rate margins applicable to revolving loans made to Singapore Borrower by 2.00% above the applicable margin; and to extend the facility maturity date to June 30, 2018. In June 2017, the SVB Credit Facility was amended to exclude certain guarantee, indemnity and similar agreements from the borrowing base calculations and to extend the effective date to July 15, 2017 for the requirement that we obtain credit insurance on the receivables of the Singapore Borrower to be included in the borrowing base.
The SVB Credit Facility carries an interest rate computed at the daily prime rate as published in the Wall Street Journal plus a spread of 0.50% to 1.50%, with such spread determined based on our adjusted quick ratio. During fiscal 2017, the weighted average interest rate on our outstanding loan was 4.21%. As of June 30, 2017 and July 1, 2016, our outstanding debt balance under the SVB Credit Facility was $9.0 million in each fiscal year, and the interest rate was 4.75% and 4.00% respectively.
The SVB Credit Facility provides for a committed amount of up to $30.0 million, with a $30.0 million sublimit that can be borrowed by our Singapore subsidiary. Borrowings that may be advanced under the SVB Credit Facility at the lesser of $30.0 million or a borrowing base equal to a specified percentage of the value of eligible accounts receivable and U.S. unbilled accounts of the Company, subject to certain reserves and eligibility criteria. The SVB Credit Facility can also be utilized to issue letters of credit with a $12.0 million sublimit. If the SVB Credit Facility is terminated by us in certain circumstances prior to its expiration, we are subject to an early termination fee equal to 1% of the revolving line. As of June 30, 2017, available credit under the SVB Credit Facility was $5.8 million reflecting the calculated borrowing base of $20.0 million less existing borrowings of $9.0 million and outstanding letters of credit of $5.2 million.
The SVB Credit Facility contains quarterly financial covenants including minimum adjusted quick ratio and minimum profitability (EBITDA) requirements. In the event our adjusted quick ratio falls below a certain level, cash received in our accounts with SVB may be directly applied to reduce outstanding obligations under the SVB Credit Facility. The SVB Credit Facility also imposes certain restrictions on our ability to dispose of assets, permit a change in control, merge or consolidate, make acquisitions, incur indebtedness, grant liens, make investments, make certain restricted payments and enter into transactions with affiliates under certain circumstances. Certain of our assets, including accounts receivable, inventory, and equipment, are pledged as collateral for the SVB Credit Facility. Upon an event of default, outstanding obligations would be immediately due and payable. Under certain circumstances, a default interest rate will apply on all obligations during the existence of an event of default at a per annum rate of interest equal to 2.00% above the applicable interest rate.
As of June 30, 2017, we were in compliance with the quarterly financial covenants, as amended, contained in the SVB Credit Facility. However, we have historically amended the agreement to revise financial covenants and the fact that the SVB Credit Facility contains subjective acceleration clauses that could be triggered by the lender, the $9.0 million borrowing was classified as a current liability as of June 30, 2017 and July 1, 2016. We repaid the $9.0 million in July 2017.
Restructuring Payments
We had liabilities for restructuring activities totaling $1.7 million as of June 30, 2017, of which $1.5 million was classified as current liability and expected to be paid in cash over the next 12 months. We expect to fund these future payments with available cash and cash provided by operations.
38
Contractual Obligations
The following table summarizes our contractual obligations and commitments as of June 30, 2017:
Obligations Due by Fiscal Year | |||||||||||||||||||||||
(In thousands) | Total | < 1 year | 1 - 3 years | 3 - 5 years | > 5 years | Other | |||||||||||||||||
Borrowings under credit facility | $ | 9,000 | $ | 9,000 | $ | — | $ | — | $ | — | $ | — | |||||||||||
Purchase obligations (1)(4) | 17,846 | 17,529 | 137 | 72 | 108 | — | |||||||||||||||||
Other purchase obligations (3)(4) | 1,364 | 1,364 | — | — | — | ||||||||||||||||||
Operating lease commitments (4) | 7,555 | 1,997 | 2,419 | 1,116 | 2,023 | — | |||||||||||||||||
Reserve for uncertain tax positions (2) | 2,453 | — | — | — | — | 2,453 | |||||||||||||||||
Total contractual cash obligations | $ | 38,218 | $ | 29,890 | $ | 2,556 | $ | 1,188 | $ | 2,131 | $ | 2,453 | |||||||||||
___________________________
(1) | From time to time in the normal course of business we may enter into purchasing agreements with our suppliers that require us to accept delivery of, and remit full payment for, finished products that we have ordered, finished products that we requested be held as safety stock, and work in process started on our behalf in the event we cancel or terminate the purchasing agreement. Because these agreements do not specify fixed or minimum quantities, do not specify minimum or variable price provisions, and do not specify the approximate timing of the transaction, and we have no present intention to cancel or terminate any of these agreements, we currently do not believe that we have any future liability under these agreements. |
(2) | Liabilities for uncertain tax positions of $2.5 million were included in long-term liabilities in the consolidated balance sheets. At this time, we are unable to make a reasonably reliable estimate of the timing of payments related to this amount due to uncertainties in the timing of tax audit outcomes. |
(3) | Contractual obligation related to software licenses. |
(4) | These items are not recorded on our consolidated balance sheets. |
Commercial Commitments
We have entered into commercial commitments in the normal course of business including surety bonds, standby letters of credit and other arrangements with financial institutions and insurers primarily relating to the guarantee of future performance on certain tenders and contracts to provide products and services to customers. As of June 30, 2017, we had commercial commitments on outstanding surety bonds and standby letters of credit as follows:
Expiration of Commitments by Fiscal Year | |||||||||||||||||||
(In thousands) | Total | 2018 | 2019 | 2020 | After 2021 | ||||||||||||||
Standby letters of credit used for: | |||||||||||||||||||
Payment guarantees | $ | 267 | $ | 158 | $ | — | $ | — | $ | 109 | |||||||||
Performance | 6,226 | 3,635 | 2,577 | 14 | — | ||||||||||||||
Tax bonds | 14 | 9 | — | 5 | — | ||||||||||||||
6,507 | 3,802 | 2,577 | 19 | 109 | |||||||||||||||
Surety bonds used for: | |||||||||||||||||||
Bids | 100 | 100 | — | — | — | ||||||||||||||
Performance | 23,984 | 13,354 | 10,630 | — | — | ||||||||||||||
Payment guarantees | 760 | 725 | 35 | — | — | ||||||||||||||
Tax bonds | 3,390 | 13 | — | 3,377 | — | ||||||||||||||
28,234 | 14,192 | 10,665 | 3,377 | — | |||||||||||||||
Total commercial commitments | $ | 34,741 | $ | 17,994 | $ | 13,242 | $ | 3,396 | $ | 109 | |||||||||
Historically, we have not paid out any significant amount of our performance guarantees. As such, the outstanding commercial commitments have not been recorded in our consolidated balance sheets.
39
Off-Balance Sheet Arrangements
In accordance with the definition under SEC rules (Item 303(a) (4) (ii) of Regulation S-K), any of the following qualify as off-balance sheet arrangements:
• | any obligation under certain guarantee contracts; |
• | a retained or contingent interest in assets transferred to an unconsolidated entity or similar entity or similar arrangement that serves as credit, liquidity or market risk support to that entity for such assets; |
• | any obligation, including a contingent obligation, under certain derivative instruments; and |
• | any obligation, including a contingent obligation, under a material variable interest held by the registrant in an unconsolidated entity that provides financing, liquidity, market risk or credit risk support to the registrant, or engages in leasing, hedging or research and development services with the registrant. |
Currently we are not participating in transactions that generate relationships with unconsolidated entities or financial partnerships, including variable interest entities, and we do not have any material retained or contingent interest in assets as defined above. As of June 30, 2017, we did not have material financial guarantees or other contractual commitments that are reasonably likely to adversely affect liquidity. In addition, we are not currently a party to any related party transactions that materially affect our results of operations, cash flows or financial condition.
Due to the downsizing of certain of our operations pursuant to restructuring plans or otherwise, some properties leased by us have been sublet to third parties. In the event any of these third parties vacate any of these premises, we would be legally obligated under master lease arrangements. We believe that the financial risk of default by such sublessors is not likely to be individually or in the aggregate material to our financial position, results of operations or cash flows.
Financial Risk Management
In the normal course of doing business, we are exposed to the risks associated with foreign currency exchange rates and changes in interest rates. We employ established policies and procedures governing the use of financial instruments to manage our exposure to such risks.
Exchange Rate Risk
We conduct business globally in numerous currencies and are therefore exposed to foreign currency risks. We use derivative instruments to reduce the volatility of earnings and cash flows associated with changes in foreign currency exchange rates. We do not hold or issue derivatives for trading purposes or make speculative investments in foreign currencies.
We use foreign exchange forward contracts to hedge forecasted foreign currency transactions relating to forecasted sales and purchase transactions. Prior to the fourth quarter of fiscal 2015, these derivatives were designated as cash flow hedges and are carried at fair value. The effective portion of the gain or loss was initially reported as a component of accumulated other comprehensive loss, and upon occurrence of the forecasted transaction, was subsequently reclassified into the income or expense line item to which the hedged transaction relates. Beginning the fourth quarter of fiscal 2015, we no longer prepared contemporaneous documentation of hedges for the new foreign exchange forward contracts we entered into. As a result, the foreign exchange hedges no longer qualified as cash flow hedges. The changes in fair value related to the hedges were recorded in income or expenses line items on our statements of operations. We also enter into foreign exchange forward contracts to mitigate the change in fair value of specific non-functional currency assets and liabilities on the balance sheets. All balance sheet hedges are marked to market through earnings every period. Changes in the fair value of these derivatives are largely offset by re-measurement of the underlying assets and liabilities. The last qualifying cash flow hedges occurred in the first quarter of fiscal 2016 and we reclassified a $41 thousand gain out of accumulated other comprehensive loss into cost of revenues during the first quarter of fiscal 2016.
As of June 30, 2017, we had one foreign currency forward contract outstanding as follows:
Currency | Notional Contract Amount (Local Currency) | Notional Contract Amount (USD) | |||||
(In thousands) | |||||||
South African Rand | 6,687 | $ | 511 | ||||
40
Net foreign exchange loss recorded in our consolidated statements of operations during fiscal 2017, 2016 and 2015 was as follows:
Fiscal Year | |||||||||||
(In thousands) | 2017 | 2016 | 2015 | ||||||||
Amount included in costs of revenues | $ | (847 | ) | $ | (556 | ) | $ | (3,308 | ) | ||
Amount included in other income (expense) | 135 | (1,245 | ) | — | |||||||
Total foreign exchange loss, net | $ | (712 | ) | $ | (1,801 | ) | $ | (3,308 | ) | ||
A 10% adverse change in currency exchange rates for our foreign currency derivatives held as of June 30, 2017 would have an impact of approximately $0.1 million on the fair value of such instruments. Certain of our international business are transacted in non-U.S. dollar currency. As discussed above, we utilize foreign currency hedging instruments to minimize the currency risk of international transactions. The impact of translating the assets and liabilities of foreign operations to U.S. dollars is included as a component of stockholders’ equity. As of June 30, 2017 and July 1, 2016, the cumulative translation adjustment decreased our stockholders’ equity by $11.8 million and $11.2 million, respectively.
In 2017, we reclassified a $0.3 million foreign current translation gain from accumulated other comprehensive loss to other income (expense) upon liquidation of a dormant foreign legal entity.
In June of 2016, the Nigeria Central Bank allowed the Naira to float freely after being fixed at approximately 197 Naira to one U.S. dollar. This event caused a devaluation in the Naira to approximately 280 Naira to one U.S. dollar resulting in the year over year losses in foreign exchange and cumulative translation adjustments for our Nigeria transactions.
During fiscal 2015 the company experienced increased volatility in foreign currency markets, resulting in the increased year over year losses in foreign exchange and cumulative translation adjustments, particularly in countries where there is no available market to hedge the local currency.
Interest Rate Risk
Our exposure to market risk for changes in interest rates relates primarily to our cash equivalents, short-term investments and borrowings under our credit facility.
Exposure on Cash Equivalents and Short-term Investments
We had $35.9 million in total cash and cash equivalents and short-term investments as of June 30, 2017. Cash equivalents and short-term investments totaled $22.4 million as of June 30, 2017 and were comprised of money market funds and certificates of deposit. Cash equivalents and short-term investments have been recorded at fair value on our balance sheets.
We do not use derivative financial instruments in our short-term investment portfolio. We invest in high-credit quality issues and, by policy, limit the amount of credit exposure to any one issuer and country. The portfolio includes only marketable securities with active secondary or resale markets to ensure portfolio liquidity. The portfolio is also diversified by maturity to ensure that funds are readily available as needed to meet our liquidity needs. This policy reduces the potential need to sell securities in order to meet liquidity needs and therefore the potential effect of changing market rates on the value of securities sold.
The primary objective of our short-term investment activities is to preserve principal while maximizing yields, without significantly increasing risk. Our cash equivalents and short-term investments earn interest at fixed rates; therefore, changes in interest rates will not generate a gain or loss on these investments unless they are sold prior to maturity. Actual gains and losses due to the sale of our investments prior to maturity have been immaterial. The investments held as of June 30, 2017 had a weighted average days to maturity of 285 days, and an average yield of 7.13% per annum. A 10% change in interest rates on our cash equivalents and short-term investments is not expected to have a material impact on our financial position, results of operations or cash flows.
Exposure on Borrowings
During fiscal 2017, we had $9.0 million of demand borrowings outstanding under our credit facility that incurred interest at the prime rate plus a spread of 0.50% to 1.50%, with such spread determined based on our adjusted quick
41
ratio. During fiscal 2017, our weighted average interest rate was 4.21% and we recorded total interest expense of less than $0.1 million on these borrowings.
A 10% change in interest rates on the current borrowings or on future borrowings is not expected to have a material impact on our financial position, results of operations or cash flows since interest on our borrowings is not material to our overall financial position.
Critical Accounting Estimates
Our consolidated financial statements are prepared in accordance with U.S. GAAP. These accounting principles require us to make certain estimates, judgments and assumptions. We believe that the estimates, judgments and assumptions upon which we rely are reasonable based upon information available to us.
These estimates, judgments and assumptions can affect the reported amounts of assets and liabilities as of the date of the consolidated financial statements as well as the reported amounts of revenues and expenses during the periods presented. To the extent there are material differences between these estimates, judgments or assumptions and actual results, our financial statements will be affected.
The accounting policies that reflect our more significant estimates, judgments and assumptions and which we believe are the most critical to aid in fully understanding and evaluating our reported financial results include the following:
• | revenue recognition and valuation of accounts receivable; |
• | inventory valuation and provision for excess and obsolete inventory losses; |
• | impairment of long-lived assets; and |
• | income taxes valuation. |
In some cases, the accounting treatment of a particular transaction is specifically dictated by U.S. GAAP and does not require management’s judgment in its application. There are also areas in which management’s judgment in selecting among available alternatives would not produce a materially different result. Our senior management has reviewed these critical accounting policies and related disclosures with the Audit Committee of the Board.
The following is not intended to be a comprehensive list of all of our accounting policies or estimates. Our significant accounting policies are more fully described in “Note 1. The Company and Summary of Significant Accounting Policies” in the notes to consolidated financial statements. In preparing our financial statements and accounting for the underlying transactions and balances, we apply those accounting policies. We consider the estimates discussed below as critical to an understanding of our financial statements because their application places the most significant demands on our judgment, with financial reporting results relying on estimates about the effect of matters that are inherently uncertain.
Besides estimates that meet the “critical” accounting estimate criteria, we make many other accounting estimates in preparing our financial statements and related disclosures. All estimates, whether or not deemed critical, affect reported amounts of assets, liabilities, revenue and expenses as well as disclosures of contingent assets and liabilities. Estimates are based on experience and other information available prior to the issuance of the financial statements. Materially different results can occur as circumstances change and additional information becomes known, including for estimates that we do not deem “critical.”
Revenue Recognition and Valuation of Accounts Receivable
Application of the various accounting principles in GAAP related to the measurement and recognition of revenue requires us to make judgments and estimates. Specifically, complex arrangements with nonstandard terms and conditions may require significant contract interpretation to determine the appropriate accounting, including whether the deliverables specified in a multiple-deliverable arrangement should be treated as separate units of accounting. Additionally, we are required to make subjective estimates and apply judgment regarding matters that are inherently uncertain including the allocation of revenue to various components of our multiple element arrangements which may contain hardware, software, licenses, maintenance and service contracts.
Revenue recognition is also impacted by our ability to estimate expected returns and collectability. We consider various factors, including a review of specific transactions, the creditworthiness of the customers’ historical experience and market and economic conditions, when calculating these provisions and allowances. Evaluations are conducted each
42
quarter to assess the adequacy of the estimates.
Recognition of profit on long-term contracts requires estimates of the total contract value, the total cost at completion and the measurement of progress towards completion. Significant judgment is required when estimating total contract costs and progress to completion on the arrangements as well as whether a loss is expected to be incurred on the contract. If circumstances arise that change the original estimates of revenues, costs, or extent of progress toward completion, revisions to the estimates are made. These revisions may result in increases or decreases in estimated revenues or costs, and such revisions are reflected in income in the period in which the circumstances that gave rise to the revision become known by the company.
Inventory Valuation and Provisions for Excess and Obsolete Losses
Our inventories have been valued at the lower of cost or market. We balance the need to maintain prudent inventory levels to ensure competitive delivery performance with the risk of excess or obsolete inventory due to changing technology and customer requirements, and new product introductions. The manufacturing of our products is handled primarily by contract manufacturers. Our contract manufacturers procure components and manufacture our products based on our forecast of product demand. We regularly review inventory quantities on hand and record a provision for excess and obsolete inventory based primarily on our estimated forecast of product demand, the stage of the product life cycle, anticipated end of product life and production requirements. Several factors may influence the sale and use of our inventories, including decisions to exit a product line, technological change, new product development and competing product offerings. These factors could result in a change in the amount of obsolete inventory quantities on hand. Additionally, our estimates of future product demand may prove to be inaccurate, in which case the provision required for excess and obsolete inventory may be overstated or understated. In the future, if we determine that our inventory is overvalued, we would be required to recognize such costs in cost of product sales and services in our consolidated statement of operations at the time of such determination. In the case of goods which have been written down below cost at the close of a fiscal quarter, such reduced amount is considered the new lower cost basis for subsequent accounting purposes, and subsequent changes in facts and circumstances do not result in the restoration or increase in that newly established cost basis. We did not make any material changes in the valuation methodology during the past three fiscal years.
Our customer service inventories are stated at the lower of cost or market. We carry service parts because we generally provide product warranty for 12 to 36 months and earn revenue by providing enhanced and extended warranty and repair service during and beyond this warranty period. Customer service inventories consist of both component parts, which are primarily used to repair defective units, and finished units, which are provided for customer use permanently or on a temporary basis while the defective unit is being repaired. We record adjustments to reduce the carrying value of customer service inventories to their net realizable value. Factors influencing these adjustments include product life cycles, end of service life plans and volume of enhanced or extended warranty service contracts. Estimates of net realizable value involve significant estimates and judgments about the future, and revisions would be required if these factors differ from our estimates.
Impairment of Long-Lived Assets
We evaluate long-lived assets for impairment whenever events or changes in circumstances indicate that the carrying value of an asset may not be recoverable. Impairment is considered to exist if the total estimated future cash flows on an undiscounted basis are less than the carrying amount of the assets. If impairment exists, the impairment loss is measured and recorded based on discounted estimated future cash flows. In estimating future cash flows, assets are grouped at the lowest levels for which there are identifiable cash flows that are largely independent of cash flows from other asset groups.
Our estimate of future cash flows is based upon, among other things, certain assumptions about expected future operating performance, growth rates and other factors. The actual cash flows realized from these assets may vary significantly from our estimates due to increased competition, changes in technology, fluctuations in demand, consolidation of our customers, reductions in average selling prices and other factors. Assumptions underlying future cash flow estimates are therefore subject to significant risks and uncertainties.
43
Income Taxes Valuation
We record the estimated future tax effects of temporary differences between the tax basis of assets and liabilities of amounts reported in our consolidated balance sheets, as well as operating loss and tax credit carryforwards. Significant judgment is required in evaluating our uncertain tax positions and determining our provision for income taxes. Although we believe our reserves are reasonable, no assurance can be given that the final tax outcome of these matters will not be different from that which is reflected in our historical income tax provisions and accruals. We adjust these reserves in light of changing facts and circumstances, such as the opening and closing of a tax audit or the refinement of an estimate. To the extent that the final tax outcome of these matters is different than the amounts recorded, such differences may result in an increase or decrease to our tax provision in a subsequent period in which such determination is made.
We record deferred taxes by applying enacted statutory tax rates to the respective jurisdictions and follow specific and detailed guidelines in each tax jurisdiction regarding the recoverability of any tax assets recorded on the balance sheets and provide necessary valuation allowances as required. Future realization of deferred tax assets ultimately depends on meeting certain criteria in ASC 740, Income Taxes. One of the major criteria is the existence of sufficient taxable income of the appropriate character (for example, ordinary income or capital gain) within the carryback or carryforward periods available under the tax law. We regularly review our deferred tax assets for recoverability based on historical taxable income, projected future taxable income, the expected timing of the reversals of existing temporary differences and tax planning strategies. Our judgments regarding future profitability may change due to many factors, including future market conditions and our ability to successfully execute our business plans and/or tax planning strategies. Should there be a change in our ability to recover our deferred tax assets, our tax provision would increase or decrease in the period in which the assessment is changed.
The accounting estimates related to the liability for uncertain tax position require us to make judgments regarding the sustainability of each uncertain tax position based on its technical merits. It is inherently difficult and subjective to estimate our reserves for the uncertain tax positions. Although we believe our estimates are reasonable, no assurance can be given that the final tax outcome of these matters will be same as these estimates. These estimates are updated quarterly based on factors such as change in facts or circumstances, changes in tax law, new audit activity, and effectively settled issues.
Impact of Recently Issued Accounting Pronouncements
See “Note 1. The Company and Summary of Significant Accounting Policies” in the notes to consolidated financial statements for a full description of recently issued accounting pronouncements, including the respective expected dates of adoption and effects on our consolidated financial position and results of operations.
Item 7A. Quantitative and Qualitative Disclosures About Market Risk.
In the normal course of doing business, we are exposed to the risks associated with foreign currency exchange rates and changes in interest rates. We employ established policies and procedures governing the use of financial instruments to manage our exposure to such risks. For a discussion of such policies and procedures and the related risks, see “Financial Risk Management” in “Item 7. Management’s Discussion and Analysis of Financial Condition and Results of Operations,” which is incorporated by reference into this Item 7A.
44
Item 8. Financial Statements and Supplementary Data
Index to Financial Statements
Page | |
45
Report of Independent Registered Public Accounting Firm
The Board of Directors and Stockholders
Aviat Networks, Inc.
Milpitas, California:
We have audited the accompanying consolidated balance sheets of Aviat Networks, Inc. as of June 30, 2017 and July 1, 2016, and the related consolidated statements of operations, comprehensive loss, equity and cash flows for the years ended June 30, 2017, July 1, 2016 and July 3, 2015. In connection with our audits of the financial statements, we have also audited the financial statement schedule - Valuation and Qualifying Accounts as of and for the years ended June 30, 2017, July 1, 2016 and July 3, 2015 listed in the Index at Item 15(a)(2). These financial statements and schedule are the responsibility of the Company’s management. Our responsibility is to express an opinion on these financial statements and schedule based on our audits.
We conducted our audits in accordance with the standards of the Public Company Accounting Oversight Board (United States). Those standards require that we plan and perform the audit to obtain reasonable assurance about whether the financial statements are free of material misstatement. The Company is not required to have, nor were we engaged to perform, an audit of its internal control over financial reporting. Our audits included consideration of internal control over financial reporting as a basis for designing audit procedures that are appropriate in the circumstances, but not for the purpose of expressing an opinion on the effectiveness of the Company’s internal control over financial reporting. Accordingly, we express no such opinion. An audit also includes examining, on a test basis, evidence supporting the amounts and disclosures in the financial statements, assessing the accounting principles used and significant estimates made by management, as well as evaluating the overall presentation of the financial statements and schedule. We believe that our audits provide a reasonable basis for our opinion.
In our opinion, the consolidated financial statements referred to above present fairly, in all material respects, the financial position of Aviat Networks, Inc. as of June 30, 2017 and July 1, 2016 and the results of its operations and its cash flows for the years ended June 30, 2017, July 1, 2016 and July 3, 2015, in conformity with accounting principles generally accepted in the United States of America.
Also, in our opinion, the financial statement schedule - Valuation and Qualifying Accounts as of and for the years ended June 30, 2017, July 1, 2016 and July 3, 2015, when considered in relation to the basic consolidated financial statements taken as a whole, presents fairly in all material respects the information set forth therein.
/s/ BDO USA, LLP | ||
San Jose, California
September 6, 2017
46
AVIAT NETWORKS, INC.
CONSOLIDATED STATEMENTS OF OPERATIONS
Fiscal Year Ended | |||||||||||
(In thousands, except per share amounts) | June 30, 2017 | July 1, 2016 | July 3, 2015 | ||||||||
Revenues: | |||||||||||
Revenue from product sales | $ | 153,517 | $ | 167,827 | $ | 214,874 | |||||
Revenue from services | 88,357 | 100,863 | 121,004 | ||||||||
Total revenues | 241,874 | 268,690 | 335,878 | ||||||||
Cost of revenues: | |||||||||||
Cost of product sales | 105,183 | 128,727 | 163,890 | ||||||||
Cost of services | 61,219 | 78,246 | 91,298 | ||||||||
Total cost of revenues | 166,402 | 206,973 | 255,188 | ||||||||
Gross margin | 75,472 | 61,717 | 80,690 | ||||||||
Operating expenses: | |||||||||||
Research and development expenses | 18,684 | 20,806 | 25,368 | ||||||||
Selling and administrative expenses | 57,184 | 65,902 | 76,005 | ||||||||
Amortization of identifiable intangible assets | — | — | 380 | ||||||||
Restructuring charges | 589 | 2,455 | 4,867 | ||||||||
Total operating expenses | 76,457 | 89,163 | 106,620 | ||||||||
Operating loss | (985 | ) | (27,446 | ) | (25,930 | ) | |||||
Interest income | 261 | 252 | 360 | ||||||||
Interest expense | (50 | ) | (104 | ) | (388 | ) | |||||
Other income (expense) | 169 | (1,245 | ) | — | |||||||
Loss from continuing operations before income taxes | (605 | ) | (28,543 | ) | (25,958 | ) | |||||
Provision for (benefit from) income taxes | 16 | 1,635 | (1,310 | ) | |||||||
Loss from continuing operations | (621 | ) | (30,178 | ) | (24,648 | ) | |||||
Income from discontinued operations, net of tax | — | 541 | 94 | ||||||||
Net loss | (621 | ) | (29,637 | ) | (24,554 | ) | |||||
Less: Net income attributable to noncontrolling interests, net of tax | 202 | 270 | 71 | ||||||||
Net loss attributable to Aviat Networks | $ | (823 | ) | $ | (29,907 | ) | $ | (24,625 | ) | ||
Amount attributable to Aviat Networks | |||||||||||
Net loss from continuing operations, net of tax | $ | (823 | ) | $ | (30,448 | ) | $ | (24,719 | ) | ||
Net income from discontinued operations, net of tax | $ | — | $ | 541 | $ | 94 | |||||
Basic and diluted loss per share attributable to Aviat Networks’ common stockholders: | |||||||||||
Continuing operations | $ | (0.16 | ) | $ | (5.81 | ) | $ | (4.77 | ) | ||
Discontinued operations | $ | — | $ | 0.10 | $ | 0.02 | |||||
Net loss | $ | (0.16 | ) | $ | (5.71 | ) | $ | (4.75 | ) | ||
Weighted average shares outstanding, basic and diluted | 5,292 | 5,238 | 5,184 | ||||||||
See accompanying notes to consolidated financial statements
47
AVIAT NETWORKS, INC.
CONSOLIDATED STATEMENTS OF COMPREHENSIVE LOSS
Fiscal Year Ended | |||||||||||
(In thousands) | June 30, 2017 | July 1, 2016 | July 3, 2015 | ||||||||
Net loss | $ | (621 | ) | $ | (29,637 | ) | $ | (24,554 | ) | ||
Other comprehensive income (loss): | |||||||||||
Cash flow hedges: | |||||||||||
Change in unrealized loss on cash flow hedges | — | — | (314 | ) | |||||||
Reclassification adjustments for (gain) loss included in net loss | — | (41 | ) | 321 | |||||||
Net change in unrealized (loss) gain on hedging activities | — | (41 | ) | 7 | |||||||
Foreign currency translation: | |||||||||||
Loss arising during period | (279 | ) | (2,488 | ) | (5,672 | ) | |||||
Reclassification of gain on liquidation of subsidiary | (349 | ) | — | — | |||||||
Net change in cumulative translation adjustment | (628 | ) | (2,488 | ) | (5,672 | ) | |||||
Other comprehensive loss | (628 | ) | (2,529 | ) | (5,665 | ) | |||||
Comprehensive loss | (1,249 | ) | (32,166 | ) | (30,219 | ) | |||||
Comprehensive income attributable to noncontrolling interests, net of tax | 202 | 270 | 71 | ||||||||
Comprehensive loss attributable to Aviat Networks | $ | (1,451 | ) | $ | (32,436 | ) | $ | (30,290 | ) | ||
See accompanying notes to consolidated financial statements
48
AVIAT NETWORKS, INC.
CONSOLIDATED BALANCE SHEETS
(In thousands, except share and par value amounts) | June 30, 2017 | July 1, 2016 | |||||
ASSETS | |||||||
Current Assets: | |||||||
Cash and cash equivalents | $ | 35,658 | $ | 30,479 | |||
Restricted cash | 541 | 558 | |||||
Short-term investments | 264 | 222 | |||||
Accounts receivable, net | 45,945 | 63,449 | |||||
Unbilled receivables | 12,110 | 5,117 | |||||
Inventories | 21,794 | 27,293 | |||||
Customer service inventories | 1,871 | 3,064 | |||||
Other current assets | 6,402 | 10,232 | |||||
Total current assets | 124,585 | 140,414 | |||||
Property, plant and equipment, net | 16,406 | 18,162 | |||||
Deferred income taxes | 6,178 | 6,068 | |||||
Other assets | 5,407 | 1,467 | |||||
Total long-term assets | 27,991 | 25,697 | |||||
TOTAL ASSETS | $ | 152,576 | $ | 166,111 | |||
LIABILITIES AND EQUITY | |||||||
Current Liabilities: | |||||||
Short-term debt | $ | 9,000 | $ | 9,000 | |||
Accounts payable | 33,606 | 33,217 | |||||
Accrued expenses | 21,933 | 23,205 | |||||
Advance payments and unearned income | 20,004 | 30,615 | |||||
Restructuring liabilities | 1,475 | 3,910 | |||||
Total current liabilities | 86,018 | 99,947 | |||||
Unearned income | 7,062 | 8,387 | |||||
Other long-term liabilities | 1,022 | 1,409 | |||||
Reserve for uncertain tax positions | 2,453 | 1,414 | |||||
Deferred income taxes | 1,681 | 1,497 | |||||
Total liabilities | 98,236 | 112,654 | |||||
Commitments and contingencies (Note 12) | |||||||
Equity: | |||||||
Preferred stock, $0.01 par value; 50,000,000 shares authorized; none issued | — | — | |||||
Common stock, $0.01 par value; 300,000,000 shares authorized; 5,317,766 and 5,261,041 shares issued and outstanding as of as of June 30, 2017 and July 1, 2016, respectively | 53 | 53 | |||||
Additional paid-in-capital | 813,733 | 811,601 | |||||
Accumulated deficit | (748,204 | ) | (747,381 | ) | |||
Accumulated other comprehensive loss | (11,785 | ) | (11,157 | ) | |||
Total Aviat Networks stockholders’ equity | 53,797 | 53,116 | |||||
Noncontrolling interests | 543 | 341 | |||||
Total equity | 54,340 | 53,457 | |||||
TOTAL LIABILITIES AND EQUITY | $ | 152,576 | $ | 166,111 | |||
See accompanying notes to consolidated financial statements
49
AVIAT NETWORKS, INC.
CONSOLIDATED STATEMENTS OF CASH FLOWS
Fiscal Year Ended | |||||||||||
(In thousands) | June 30, 2017 | July 1, 2016 | July 3, 2015 | ||||||||
Operating Activities | |||||||||||
Net loss | $ | (621 | ) | $ | (29,637 | ) | $ | (24,554 | ) | ||
Adjustments to reconcile net loss to net cash provided by (used in) operating activities: | |||||||||||
Amortization of identifiable intangible assets | — | — | 380 | ||||||||
Depreciation and amortization of property, plant and equipment | 5,840 | 6,648 | 7,242 | ||||||||
(Recovery) provision for uncollectible receivables | (580 | ) | 1,532 | 880 | |||||||
Share-based compensation | 2,111 | 1,836 | 2,187 | ||||||||
Deferred tax assets, net | 75 | (334 | ) | (4,711 | ) | ||||||
Charges for inventory and customer service inventory write-downs | 1,137 | 9,868 | 8,043 | ||||||||
Gain on disposition of WiMAX business | — | — | (85 | ) | |||||||
Loss on disposition of property, plant and equipment, net | 153 | 827 | 384 | ||||||||
Gain on liquidation of subsidiary | (349 | ) | — | — | |||||||
Changes in operating assets and liabilities: | |||||||||||
Accounts receivable | 18,178 | 17,023 | (8,816 | ) | |||||||
Unbilled receivables | (6,986 | ) | 12,041 | 6,125 | |||||||
Inventories | 6,383 | (4,995 | ) | (663 | ) | ||||||
Customer service inventories | 90 | 2,419 | 2,285 | ||||||||
Accounts payable | 608 | (13,976 | ) | 1,562 | |||||||
Accrued expenses | (1,310 | ) | (599 | ) | (4,140 | ) | |||||
Advance payments and unearned income | (13,099 | ) | (4,425 | ) | 4,666 | ||||||
Income taxes payable or receivable | 1,415 | 2 | 1,450 | ||||||||
Other assets and liabilities | (3,640 | ) | 2,126 | (1,833 | ) | ||||||
Net cash provided by (used in) operating activities | 9,405 | 356 | (9,598 | ) | |||||||
Investing Activities | |||||||||||
Payments for acquisition of property, plant and equipment | (4,021 | ) | (1,574 | ) | (3,693 | ) | |||||
Purchase of short-term investments | (139 | ) | (222 | ) | — | ||||||
Maturities of short-term investments | 122 | — | — | ||||||||
Net cash used in investing activities | (4,038 | ) | (1,796 | ) | (3,693 | ) | |||||
Financing Activities | |||||||||||
Proceeds from borrowings | 33,000 | 36,000 | 54,000 | ||||||||
Repayments of borrowings | (33,000 | ) | (36,000 | ) | (51,000 | ) | |||||
Proceeds from issuance of common stock under employee stock plans | 21 | 13 | 13 | ||||||||
Payments on capital lease obligations | — | — | (140 | ) | |||||||
Net cash provided by financing activities | 21 | 13 | 2,873 | ||||||||
Effect of exchange rate changes on cash, cash equivalents and restricted cash | (244 | ) | (2,347 | ) | (4,246 | ) | |||||
Net increase (decrease) in cash, cash equivalents and restricted cash | 5,144 | (3,774 | ) | (14,664 | ) | ||||||
Cash, cash equivalents and restricted cash, beginning of year | 31,425 | 35,199 | 49,863 | ||||||||
Cash, cash equivalents and restricted cash, end of year | $ | 36,569 | $ | 31,425 | $ | 35,199 | |||||
50
Fiscal Year Ended | |||||||||||
(In thousands) | June 30, 2017 | July 1, 2016 | July 3, 2015 | ||||||||
Non-cash investing activities | |||||||||||
Reclassification of property, plant and equipment to inventory | $ | — | $ | 1,094 | $ | — | |||||
Unpaid property, plant and equipment | $ | 1,219 | $ | 1,261 | $ | 319 | |||||
Supplemental disclosures of cash flow information: | |||||||||||
Cash paid for interest | $ | 94 | $ | 111 | $ | 387 | |||||
Cash (refunded) paid for income taxes, net | $ | (313 | ) | $ | 1,964 | $ | 2,042 | ||||
See accompanying notes to consolidated financial statements
51
AVIAT NETWORKS, INC.
CONSOLIDATED STATEMENTS OF EQUITY
Aviat Networks Stockholders’ Equity | ||||||||||||||||||||||||||||||
Common Stock | Additional Paid-in Capital | Accumulated Deficit | Accumulated Other Comprehensive Loss | Total Aviat Networks Stockholders’ Equity | Noncontrolling Interests | Total Equity | ||||||||||||||||||||||||
(In thousands, except share amounts) | Shares | $ Amount | ||||||||||||||||||||||||||||
Balance as of June 27, 2014 | 5,184,852 | $ | 52 | $ | 807,588 | $ | (692,849 | ) | $ | (2,963 | ) | $ | 111,828 | $ | — | $ | 111,828 | |||||||||||||
Net (loss) income | (24,625 | ) | (24,625 | ) | 71 | (24,554 | ) | |||||||||||||||||||||||
Other comprehensive loss, net of tax | (5,665 | ) | (5,665 | ) | (5,665 | ) | ||||||||||||||||||||||||
Issuance of common stock under employee stock plans | 23,348 | — | 13 | 13 | 13 | |||||||||||||||||||||||||
Share-based compensation | 2,187 | 2,187 | 2,187 | |||||||||||||||||||||||||||
Balance as of July 3, 2015 | 5,208,200 | 52 | 809,788 | (717,474 | ) | (8,628 | ) | 83,738 | 71 | 83,809 | ||||||||||||||||||||
Net (loss) income | (29,907 | ) | (29,907 | ) | 270 | (29,637 | ) | |||||||||||||||||||||||
Other comprehensive loss, net of tax | (2,529 | ) | (2,529 | ) | (2,529 | ) | ||||||||||||||||||||||||
Issuance of common stock under employee stock plans | 54,498 | 1 | 12 | 13 | 13 | |||||||||||||||||||||||||
Fractional shares buyback and other | (1,657 | ) | (35 | ) | (35 | ) | (35 | ) | ||||||||||||||||||||||
Share-based compensation | 1,836 | 1,836 | 1,836 | |||||||||||||||||||||||||||
Balance as of July 1, 2016 | 5,261,041 | 53 | 811,601 | (747,381 | ) | (11,157 | ) | 53,116 | 341 | 53,457 | ||||||||||||||||||||
Net (loss) income | (823 | ) | (823 | ) | 202 | (621 | ) | |||||||||||||||||||||||
Other comprehensive loss, net of tax | (628 | ) | (628 | ) | (628 | ) | ||||||||||||||||||||||||
Issuance of common stock under employee stock plans | 56,725 | — | 21 | 21 | 21 | |||||||||||||||||||||||||
Share-based compensation | 2,111 | 2,111 | 2,111 | |||||||||||||||||||||||||||
Balance as of June 30, 2017 | 5,317,766 | $ | 53 | $ | 813,733 | $ | (748,204 | ) | $ | (11,785 | ) | $ | 53,797 | $ | 543 | $ | 54,340 | |||||||||||||
See accompanying notes to consolidated financial statements
52
AVIAT NETWORKS, INC.
NOTES TO CONSOLIDATED FINANCIAL STATEMENTS
Note 1. The Company and Summary of Significant Accounting Policies
The Company
We design, manufacture and sell a range of wireless networking solutions and services to mobile and fixed telephone service providers, private network operators, government agencies, transportation and utility companies, public safety agencies and broadcast system operators across the globe. Our products include broadband wireless access base stations and customer premises equipment for fixed and mobile, point-to-point digital microwave radio systems for access, backhaul, trunking and license-exempt applications, supporting new network deployments, network expansion, and capacity upgrades.
We were incorporated in Delaware in 2006 to combine the businesses of Harris Corporation’s Microwave Communications Division (“MCD”) and Stratex Networks, Inc. (“Stratex”). On January 28, 2010, we changed our corporate name from Harris Stratex Networks, Inc. to Aviat Networks, Inc. (“the Company”, “Aviat Networks,” “Aviat”, “we,” “us,” and “our”) to more effectively reflect our business and communicate our brand identity to customers. Additionally, the change of our corporate name was to comply with the termination of the Harris Corporation (“Harris”) trademark licensing agreement resulting from the spin-off by Harris of its interest in our stock to its stockholders in May 2009.
Basis of Presentation
The consolidated financial statements include the accounts of Aviat Networks and its wholly-owned and majority owned subsidiaries. Significant intercompany transactions and accounts have been eliminated. Certain amounts in the prior-years consolidated financial statements have been reclassified to conform to the current-year presentation
Our fiscal year ends on the Friday nearest June 30. This was June 30 for fiscal 2017, July 1 for fiscal 2016 and July 3 for fiscal 2015. Fiscal years 2017 and 2016 presented each included 52 weeks, and fiscal year 2015 included 53 weeks. In these notes to consolidated financial statements, we refer to our fiscal years as “fiscal 2017”, “fiscal 2016” and “fiscal 2015.”
Use of Estimates
The preparation of consolidated financial statements in accordance with accounting principles generally accepted in the United States (“U.S. GAAP”) requires us to make estimates, assumptions and judgments affecting the amounts reported and related disclosures. Estimates are based upon historical factors, current circumstances and the experience and judgment of our management. We evaluate our estimates and assumptions on an ongoing basis and may employ outside experts to assist us in making these evaluations. Changes in such estimates, based on more accurate information, or different assumptions or conditions, may affect amounts reported in future periods. Such estimates affect significant items, including revenue recognition, provision for uncollectible receivables, inventory valuation, valuation allowances for deferred tax assets, uncertainties in income taxes, restructuring obligations, product warranty obligations, share-based awards, contingencies, recoverability of long-lived assets and useful lives of property, plant and equipment.
Reverse Stock Split
On June 14, 2016, we effected a reverse stock split of all of the outstanding shares of our common stock at a ratio of 1-for-12 (“Reverse Stock Split”). The authorized shares of 300 million and par value per share of the common stock at $0.01 per share remain unchanged after the reverse stock split. All share and per-share data in our consolidated financial statements and applicable disclosures have been retroactively adjusted to reflect this reverse stock split.
To reflect the reverse stock split on shareholders' equity, we reclassified an amount equal to the par value of the reduced shares from the common stock par value account to the additional paid in capital account, resulting in no net impact to shareholders' equity on our consolidated balance sheets.
53
Cash, Cash Equivalents, Restricted Cash and Short-Term Investments
We consider all highly liquid investments with an original maturity of three months or less at the date of purchase to be cash equivalents. Cash equivalents are carried at amortized cost, which approximates fair value due to the short-term nature of these investments. Investments with an original maturity of greater than three months and less than 12 months are accounted for as short-term investments and are classified as such at the time of purchase.
We hold cash, cash equivalents and short-term investments at several major financial institutions, which often significantly exceed Federal Deposit Insurance Corporation insured limits. However, a substantial portion of the cash equivalents is invested in prime money market funds which are backed by the securities in the fund. Our short-term investments are comprised of time deposits and certificates of deposit. We classify our marketable securities as “available-for-sale” because we view our entire portfolio as available for use in our current operations.
As of June 30, 2017 and July 1, 2016, all of our high-quality marketable debt securities were invested in prime money market funds and were classified as cash equivalents except for $0.3 million and $0.2 million, respectively, in short-term investments.
Cash and cash equivalents that are restricted as to withdrawal or usage under the terms of contractual agreements are recorded as restricted cash. At June 30, 2017, our short-term restricted cash mainly included cash balances at one of our international subsidiaries. At July 1, 2016, our short-term restricted cash included $0.6 million of restricted cash in one of our Africa subsidiaries related to a severance amount paid to a former employee in the first quarter of fiscal 2017. We accrued the severance in restructuring liabilities as of July 1, 2016. Our long-term restricted cash included cash balance in our disability insurance voluntary plan account that cannot be used by us for any operating purposes other than to pay benefits to the insured employees and was recorded in other assets in our consolidated balance sheets and the corresponding liabilities were included in other long-term liabilities in our consolidated balance sheets.
Significant Concentrations
We typically invoice our customers for the sales order (or contract) value of the related products delivered at various milestones, including order receipt, shipment, installation and acceptance and for services when rendered. Our trade receivables are derived from sales to customers located in North America, Africa, Europe, the Middle East, Russia, Asia-Pacific and Latin America.
Accounts receivable is presented net of allowance for estimated uncollectible accounts to reflect any loss anticipated on the collection of accounts receivable balances. We calculate the allowance based on our history of write-offs, level of past due accounts and the economic status of the customers. The fair value of our accounts receivable approximates their net realizable value.
We regularly require letters of credit from some customers and, from time to time, we discount these letters of credit issued by customers through various financial institutions. The discounting of letters of credit depends on many factors, including the willingness of financial institutions to discount the letters of credit and the cost of such arrangements. Under these arrangements, collection risk is fully transferred to the financial institutions. We record the financing charges on discounting these letters of credit as interest expense.
During fiscal 2017, 2016 and 2015, we had one customer in Africa, Mobile Telephone Networks Group (“MTN Group”) that accounted for 14%, 18% and 14%, respectively, of our total revenue. As of June 30, 2017 and July 1, 2016, MTN Group accounted for approximately 26% and 22%, respectively, of our accounts receivable. As of July 1, 2016, Motorola accounted for approximately 11% of our accounts receivable. No other customers accounted for more than 10% of our revenue or accounts receivable for the years presented. The loss of all business from MTN Group, Motorola, or any other significant customers, could adversely affect our results of operations, cash flows and financial position.
Financial instruments that potentially subject us to a concentration of credit risk consist principally of cash equivalents, marketable debt securities, trade accounts receivable and financial instruments used in foreign currency hedging activities. We invest our excess cash primarily in prime money market funds and certificates of deposit. We are exposed to credit risks related to such instruments in the event of default or decrease in credit-worthiness of the issuers of the investments.
We perform ongoing credit evaluations of our customers and generally do not require collateral on accounts receivable, as the majority of our customers are large, well-established companies. However, in certain circumstances, we may require letters of credit, additional guarantees or advance payments. We maintain allowances for collection losses, but historically have not experienced any significant losses related to any particular geographic area. Our
54
customers are primarily in the telecommunications industry, so our accounts receivable are concentrated within one industry and exposed to concentrations of credit risk within that industry. Accounts receivable are written off when attempts to collect outstanding amounts have been exhausted or there are other indicators that the amounts are no longer collectible.
We rely on third parties to manufacture our products and we purchase raw materials from third-party vendors. We outsource our manufacturing services to two independent manufacturers. In addition, we purchase certain strategic component inventory which is consigned to our third-party manufacturers. Other components included in our products are sourced from various suppliers and are principally industry standard parts and components that are available from multiple vendors. The inability of a contract manufacturer or supplier to fulfill our supply requirements or changes in their financial or business condition could disrupt our ability to supply quality products to our customers, and thereby may have a material adverse effect on our business and operating results.
We have entered into agreements relating to our foreign currency contracts with Silicon Valley Bank, a multinational financial institution. The amounts subject to credit risk arising from the possible inability of any such parties to meet the terms of their contracts are generally limited to the amounts, if any, by which such party’s obligations exceed our obligations to that party.
Inventories
Inventories are valued at the lower of cost or market. Cost is determined using standard cost, which approximates actual cost on a weighted-average first-in-first-out basis. We regularly review inventory quantities on hand and record adjustments to reduce the cost of inventory for excess and obsolete inventory based primarily on our estimated forecast of product demand and production requirements. Inventory adjustments are measured as the difference between the cost of the inventory and estimated market value based upon assumptions about future demand and charged to the provision for inventory, which is a component of cost of sales. At the point of the loss recognition, a new, lower-cost basis for that inventory is established, and any subsequent improvements in facts and circumstances do not result in the restoration or increase in that newly established cost basis.
Customer Service Inventories
Our customer service inventories are stated at the lower of cost or market. We carry service parts because we generally provide product warranty for 12 to 36 months and earn revenue by providing enhanced and extended warranty and repair service during and beyond this warranty period. Customer service inventories consist of both component parts, which are primarily used to repair defective units, and finished units, which are provided for customer use permanently or on a temporary basis while the defective unit is being repaired. We record adjustments to reduce the carrying value of customer service inventories to their net realizable value. Factors influencing these adjustments include product life cycles, end of service life plans and volume of enhanced or extended warranty service contracts. Estimates of net realizable value involve significant estimates and judgments about the future, and revisions would be required if these factors differ from our estimates.
Property, Plant and Equipment
Property, plant and equipment are stated on the basis of cost less accumulated depreciation and amortization. We capitalize costs of software, consulting services, hardware and other related costs incurred to purchase or develop internal-use software. We expense costs incurred during preliminary project assessment, re-engineering, training and application maintenance.
Depreciation and amortization are calculated using the straight-line method over the estimated useful lives of the respective assets. Leasehold improvements are amortized on the straight-line method over the shorter of the remaining lease term or the estimated useful life of the improvements. The useful lives of the assets are generally as follows:
Buildings | 40 years |
Leasehold improvements | 2 to 10 years |
Software | 3 to 5 years |
Machinery and equipment | 2 to 5 years |
Expenditures for maintenance and repairs are charged to expense as incurred. Cost and accumulated depreciation of assets sold or retired are removed from the respective property accounts, and any gain or loss is reflected in the consolidated statements of operations.
55
Impairment of Long-Lived Assets
We evaluate long-lived assets for impairment whenever events or changes in circumstances indicate that the carrying value of an asset may not be recoverable. Impairment is considered to exist if the total estimated future cash flows on an undiscounted basis are less than the carrying amount of the assets. If impairment exists, the impairment loss is measured and recorded based on discounted estimated future cash flows. In estimating future cash flows, assets are grouped at the lowest levels for which there are identifiable cash flows that are largely independent of cash flows from other asset groups.
Our estimate of future cash flows is based upon, among other things, certain assumptions about expected future operating performance, growth rates and other factors. The actual cash flows realized from these assets may vary significantly from our estimates due to increased competition, changes in technology, fluctuations in demand, consolidation of our customers, reductions in average selling prices and other factors. Assumptions underlying future cash flow estimates are therefore subject to significant risks and uncertainties.
Warranties
On product sales, we provide for future warranty costs upon product delivery. The specific terms and conditions of those warranties vary depending upon the product sold and country in which we do business. In the case of products sold by us, our warranties generally start from the delivery date and continue for one to three years, depending on the terms.
Many of our products are manufactured to customer specifications and their acceptance is based on meeting those specifications. Factors that affect our warranty liabilities include the number of product units subject to warranty protection, historical experience and management’s judgment regarding anticipated rates of warranty claims and cost per claim. We assess the adequacy of our recorded warranty liabilities every quarter and make adjustments to the liabilities as necessary.
Noncontrolling interests
A noncontrolling interest represents the equity interest in a subsidiary that is not attributable, either directly or indirectly, to Aviat Networks and is reported as our equity, separately from our controlling interests. The noncontrolling interests relate to our ownership interest in a subsidiary company in South Africa with a local partner, where we are the majority owner at 51%. Revenues, expenses, gains, losses, net loss and other comprehensive income (loss) are reported in the consolidated financial statements at the consolidated amounts, which include the amounts attributable to both the controlling and noncontrolling interests.
Operating Leases
We lease facilities and equipment under various operating leases. These lease agreements generally include rent escalation clauses, and many include renewal periods at our option. We recognize expense for scheduled rent increases on a straight-line basis over the lease term beginning with the date we take possession of the leased space. Leasehold improvements made either at the inception of the lease or during the lease term are amortized over the current lease term, or estimated life, if shorter.
Foreign Currency Translation
The functional currency of our subsidiaries located in the United Kingdom, Singapore, Mexico, Algeria and New Zealand is the United States (“U.S.”) dollar. Determination of the functional currency is dependent upon the economic environment in which an entity operates as well as the customers and suppliers the entity conducts business with. Changes in facts and circumstances may occur which could lead to a change in the functional currency of that entity. Accordingly, all of the monetary assets and liabilities of these subsidiaries are re-measured into U.S. dollars at the current exchange rate as of the applicable balance sheet date, and all non-monetary assets and liabilities are re-measured at historical rates. Income and expenses are re-measured at the average exchange rate prevailing during the period. Gains and losses resulting from the re-measurement of these subsidiaries’ financial statements are included in the consolidated statements of operations.
Our other international subsidiaries use their respective local currency as their functional currency. Assets and liabilities of these subsidiaries are translated at the local current exchange rates in effect at the balance sheet date, and income and expense accounts are translated at the average exchange rates during the period. The resulting translation adjustments are included in accumulated other comprehensive loss.
56
Gains and losses resulting from foreign exchange transactions and revaluation of monetary assets and liabilities in non-functional currencies are included in either cost of product sales and services or other income (expense) in the accompanying consolidated statements of operations, based on the nature of the transactions. Net foreign exchange loss recorded in our consolidated statements of operations during fiscal 2017, 2016 and 2015 was as follows:
Fiscal Year | |||||||||||
(In thousands) | 2017 | 2016 | 2015 | ||||||||
Amount included in costs of revenues | $ | (847 | ) | $ | (556 | ) | $ | (3,308 | ) | ||
Amount included in other income (expense) | 135 | (1,245 | ) | — | |||||||
Total foreign exchange loss, net | $ | (712 | ) | $ | (1,801 | ) | $ | (3,308 | ) | ||
Retirement Benefits
As of June 30, 2017, we provided retirement benefits to substantially all employees primarily through our defined contribution retirement plans. These plans have matching and savings elements. Contributions by us to these retirement plans are based on profits and employees’ savings with no other funding requirements. We halted making matching contributions to the U.S. plan from the second quarter of fiscal 2014 through the end of fiscal 2015. We resumed making contributions to the plans in fiscal 2016.
Contributions to retirement plans are expensed as incurred. Retirement plan expense amounted to $1.8 million, $2.0 million and $1.7 million in fiscal 2017, 2016 and 2015, respectively.
Revenue Recognition
We generate substantially all of our revenue from the sales or licensing of our microwave radio and wireless access systems, network management software, and professional services including installation, commissioning, maintenance and support services and training. Principal customers for our products and services include domestic and international wireless/mobile service providers, original equipment manufacturers, resellers, system integrators, as well as private network users such as public safety agencies, government institutions, and utility, pipeline, railroad and other industrial enterprises that operate broadband wireless networks. Our customers generally purchase a combination of our products and services as part of a multiple element arrangement. Our assessment of which revenue recognition guidance is appropriate to account for each element in an arrangement can involve significant judgment.
Revenue from product sales is generated predominately from the sales of products manufactured by third-party manufacturers to whom we have outsourced our manufacturing processes. In general, printed circuit assemblies, mechanical housings, and packaged modules are manufactured by contract manufacturing partners, with periodic business reviews of material levels and obsolescence. Product assembly, product testing, complete system integration and system testing may either be performed within our own facilities or at the locations of our third-party manufacturers.
Revenue from services includes certain installation, extended warranty, customer support, consulting, training and education. It also can include certain revenue generated from the resale of equipment purchased on behalf of customers for installation service contracts we perform for customers. Such equipment may include towers, antennas, and other related materials. Maintenance and support services are generally offered to our customers over a specified period of time and from sales and subsequent renewals of maintenance and support contracts.
We recognize revenue when the earnings process is complete as evidenced by persuasive evidence of an arrangement, delivery has occurred, the sales price is fixed or determinable and collectability is reasonably assured. Revenue is recognized net of allowances for returns, discounts and any taxes collected from customers and subsequently remitted to governmental authorities. Delivery does not occur until products have been shipped or services have been provided to the customer, title and risk of loss has transferred to the customer, and (if applicable) either customer acceptance has been obtained or customer acceptance provisions have lapsed. The sales price is not considered to be fixed or determinable until all contingencies related to the sale have been resolved. Revenue from net product sales is recognized when title and risk of loss has transferred to the customer and there are no unfulfilled company obligations that affect the customer’s final acceptance of the arrangement. We recognize maintenance and support services revenue ratably over the maintenance or service period. Professional services revenue consists of fees we earn related to consulting and educational services. We recognize revenue from professional services as the services are performed or upon written acceptance from customers, if applicable, or acceptance provisions have lapsed assuming all other conditions for revenue recognition noted above have been met.
57
We often enter into multiple contractual agreements with the same customer. Such agreements are reviewed to determine whether they should be evaluated as one arrangement. If an arrangement, other than a long-term contract, requires the delivery or performance of multiple deliverables or elements, we determine whether the individual elements represent “separate units of accounting”. Based on the terms and conditions of our typical product sales arrangement, we believe that our products and services can be accounted for as separate units because our products and services have value to our customers on a stand-alone basis.
When a sale involves multiple deliverables, the entire fee from the arrangement is allocated to each unit of accounting based on the relative selling price of each deliverable. When applying the relative selling price method, the accounting principles establish a hierarchy to determine the selling price to be used for allocating revenue to deliverables as follows: (i) vendor-specific objective evidence (“VSOE”), (ii) third-party evidence of selling price (“TPE”) and (iii) best estimate of the selling price (“ESP”). Generally, we are not able to determine TPE because our go-to-market strategy differs from that of our peers and our offerings contain a significant level of differentiation such that the comparable pricing of products with similar functionality cannot be obtained. When we are unable to establish a selling price using VSOE or TPE, we use ESP to allocate the arrangement fees to the deliverables. Revenue allocated to each element is then recognized when the other revenue recognition criteria are met for each element. There is generally no customer right of return in our sales agreements. The sequence for typical multiple element arrangements: we deliver our products, perform installation services and then provide post-contract support services.
ESP is determined by considering a number of factors including our pricing policies, internal costs and gross margin objectives, method of distribution, information gathered from experience in customer negotiations, market research and information, recent technological trends, competitive landscape and geographies. The determination of ESP is approved by our management taking into consideration our pricing strategy. We regularly review VSOE, TPE and ESP and maintain internal controls over the establishment and updating of these estimates.
Revenues related to long-term contracts for customized network solutions are recognized using the percentage-of-completion method. In using the percentage-of-completion method, we generally apply the cost-to-cost method of accounting where sales and profits are recorded based on the ratio of costs incurred to estimated total costs at completion. Recognition of profit on long-term contracts requires estimates of the total contract value, the total cost at completion and the measurement of progress towards completion. Significant judgment is required when estimating total contract costs and progress to completion on the arrangements as well as whether a loss is expected to be incurred on the contract. If circumstances arise that change the original estimates of revenues, costs, or extent of progress toward completion, revisions to the estimates are made. These revisions may result in increases or decreases in estimated revenues or costs, and such revisions are reflected in income in the period in which the circumstances that gave rise to the revision become known by the company. We perform ongoing profitability analysis of our services contracts accounted for under the percentage-of-completion method in order to determine whether the latest estimates of revenues, costs and profits require updating. If at any time these estimates indicate that the contract will be unprofitable, the entire estimated loss for the remainder of the contract is recorded immediately. We establish billing terms at the time project deliverables and milestones are agreed. Revenues recognized in excess of the amounts invoiced to clients are classified as unbilled receivables in our consolidated balance sheets.
We reserve for estimated product returns as an offset to revenue or deferred revenue based primarily on historical trends. Actual product returns may be different than what was estimated. These factors and unanticipated changes in the economic and industry environment could make actual results differ from our return estimates.
We also consider whether contracts should be combined when specific aggregation criteria are met including when the contracts are in substance an arrangement to perform a single project with a customer; the contracts are negotiated as a package in the same economic environment with an overall profit objective; and the contracts require interrelated activities with common costs that cannot be separately identified with, or reasonably allocated to the elements, phases or units of output and the contracts are performed concurrently or in a continuous sequence under the same project management at the same location or at different locations in the same general vicinity.
Cost of Product Sales and Services
Cost of sales consists primarily of materials, labor and overhead costs incurred internally and amounts incurred for contract manufacturers to produce our products, personnel and other implementation costs incurred to install our products and train customer personnel, and customer service and third party original equipment manufacturer costs to provide continuing support to our customers.
58
Shipping and handling costs are included as a component of costs of product sales in our consolidated statements of operations because they are also included in revenue that we bill our customers.
Advertising Costs
We expense all advertising costs as incurred. Advertising costs were immaterial during fiscal 2017, 2016 and 2015.
Presentation of Transactional Taxes Collected from Customers and Remitted to Government Authorities
We present transactional taxes such as sales and use tax collected from customers and remitted to governmental authorities on a net basis.
Research and Development Costs
Our research and development costs, which include costs in connection with new product development, improvement of existing products, process improvement, and product use technologies, are charged to operations in the period in which they are incurred.
Share-Based Compensation
We estimate the grant date fair value of our share-based awards and amortize this fair value to compensation expense over the requisite service period or vesting term. To estimate the fair value of our stock option awards, we use the Black-Scholes option pricing model. The determination of the fair value of stock option awards on the date of grant using an option pricing model is affected by our stock price as well as assumptions regarding a number of complex and subjective variables. These variables include our expected stock price volatility over the expected term of the awards, actual and projected employee stock option exercise behaviors, risk-free interest rate and expected dividends. Due to the inherent limitations of option valuation models, including consideration of future events that are unpredictable and the estimation process utilized in determining the valuation of the share-based awards, the ultimate value realized by our employees may vary significantly from the amounts expensed in our financial statements. For restricted stock awards and units and performance share awards and units, we measure the grant date fair value based upon the market price of our common stock on the date of the grant. The fair value of each market-based stock unit with market conditions was estimated using the Monte-Carlo simulation model.
We generally recognize compensation cost for share-based payment awards on a straight-line basis over the requisite service period. For an award that has a graded vesting schedule, compensation expense is recognized on a straight-line basis over the requisite service period for each separately vesting portion of the award as if the award was, in-substance, multiple awards. The amount of compensation cost recognized at any date must at least equal the portion of the grant-date value of the award that is vested at that date.
For awards with a performance condition vesting feature, we recognize share-based compensation costs for the performance awards and units when achievement of the performance conditions is considered probable. Any previously recognized compensation cost would be reversed if the performance condition is not satisfied or if it is not probable that the performance conditions will be achieved. For awards with a market condition vesting feature, we recognize share-based compensation costs over the period the requisite service is rendered, regardless of when, if ever, the market condition is satisfied.
During the fourth quarter of fiscal 2017, we adopted Accounting Standards Update (“ASU”) 2016-09 and elected to account for forfeitures as they occur. Refer to accounting standards adopted below for changes to the accounting for share-based compensation expense.
Restructuring Charges
Our restructuring charges represent expenses incurred in connection with certain cost reduction programs that we have implemented, and consisted of the costs of employee termination costs, lease and other contract termination charges and other costs of exiting activities or geographies. A liability for costs associated with an exit or disposal activity is measured at its fair value when the liability is incurred. Expenses for one-time termination benefits are recognized at the date we notify the employee, unless the employee must provide future service, in which case the benefits are expensed ratably over the future service period. We recognize severance benefits provided as part of an ongoing benefit arrangement when the payment is probable and the amounts can be reasonably estimated. Liabilities related to termination of an operating lease or contract are measured and recognized at fair value when the contract does not have any future economic benefit to the entity and the fair value of the liability is determined based on the present value of the
59
remaining lease obligations, adjusted for the effects of deferred items recognized under the lease, and reduced by estimated sublease rentals that could be reasonably obtained for the property. The assumptions in determining such estimates include anticipated timing of sublease rentals and estimates of sublease rental receipts and related costs based on market conditions. We expense all other costs related to an exit or disposal activity as incurred.
Income Taxes and Related Uncertainties
We account for income taxes under the asset and liability method. Deferred tax assets and liabilities are determined based on the estimated future tax effects of temporary differences between the financial statement and tax basis of assets and liabilities, as measured by tax rates at which temporary differences are expected to reverse as well as operating loss and tax credit carry forwards. Deferred tax expense (benefit) is the result of changes in deferred tax assets and liabilities. A valuation allowance is established to offset any deferred tax assets if, based upon the available information, it is more likely than not that some or all of the deferred tax assets will not be realized.
We are required to compute our income taxes in each federal, state, and international jurisdiction in which we operate. This process requires that we estimate the current tax exposure as well as assess temporary differences between the accounting and tax treatment of assets and liabilities, including items such as accruals and allowances not currently deductible for tax purposes as well as operating loss and tax credit carry forwards. The income tax effects of the differences we identify are classified as current or long-term deferred tax assets and liabilities in our consolidated balance sheets. Our judgments, assumptions, and estimates relative to the current provision for income taxes take into account current tax laws, our interpretation of current tax laws, and possible outcomes of current and future audits conducted by foreign and domestic tax authorities. Changes in tax laws or our interpretation of tax laws and the resolution of current and future tax audits could significantly impact the amounts provided for income taxes in our consolidated balance sheets and consolidated statements of operations. We must also assess the likelihood that deferred tax assets will be realized from future taxable income and, based on this assessment, establish a valuation allowance, if required. Our determination of our valuation allowance is based upon a number of assumptions, judgments, and estimates, including forecasted earnings, future taxable income, and the relative proportions of revenue and income before taxes in the various domestic and international jurisdictions in which we operate. To the extent we establish a valuation allowance or change the valuation allowance in a period, we reflect the change with a corresponding increase or decrease to our tax provision in our consolidated statements of operations.
We use a two-step process to determine the amount of tax benefit to be recognized for uncertain tax positions. The first step is to evaluate the tax position for recognition by determining if the weight of available evidence indicates that it is more likely than not that the position will be sustained on audit, including resolution of related appeals or litigation processes, if any. The second step requires us to estimate and measure the tax benefit as the largest amount that is more than 50% likely of being realized upon ultimate settlement. It is inherently difficult and subjective to estimate such amounts, as this requires us to determine the probability of various possible outcomes. We reevaluate these uncertain tax positions on a quarterly basis. This evaluation is based on factors including, but not limited to, changes in facts or circumstances, changes in tax law, effectively settled issues under audit, and new audit activity. Such a change in recognition or measurement would result in the recognition of a tax benefit or an additional charge to the tax provision in the period.
Accounting Standards Adopted
In May 2017, the Financial Accounting Standards Board (“FASB”) issued ASU 2017-09, Compensation-Stock Compensation (Topic 718): Scope of Modification Accounting. The amendment provides guidance on the types of changes to the terms or conditions of share-based payment awards to which an entity would be required to apply modification accounting under Accounting Standards Codification (“ASC”) 718.The guidance is effective for annual periods, and interim periods within those annual periods, beginning after December 15, 2017, with early adoption permitted. The amendment in this ASU should be applied prospectively to an award modified on or after the adoption date. We adopted this standard during the fourth quarter of fiscal 2017.
In November 2016, the FASB issued ASU 2016-18, Statement of Cash Flows (Topic 230): Restricted Cash. The guidance addresses diversity in practice that exists in the classification and presentation of changes in restricted cash and requires that a statement of cash flows explain the change during the period in the total of cash, cash equivalents, and amounts generally described as restricted cash or restricted cash equivalents. We adopted this standard during the fourth quarter of fiscal 2017 with no material impact on our consolidated financial statements and disclosures.
In August 2016, the FASB issued ASU 2016-15, Statement of Cash Flows, Clarification of Certain Cash Receipts and Cash Payments, which provides guidance on the presentation and classification of eight specific cash flow issues.
60
We adopted this standard during the fourth quarter of fiscal 2017. There was no reclassification impact resulted from the adoption on our consolidated statements of cash flows for fiscal year 2016 and fiscal year 2015, and such statements have been presented in accordance with this new guidance.
In March 2016, the FASB issued ASU 2016-09, Improvements to Employee Share-Based Payment Accounting (Topic 718), which simplifies several aspects of the accounting for share-based payment transactions, including the income tax consequences, classification of awards as either equity or liabilities, forfeiture, statutory tax withholding requirements, and classification on the statement of cash flows. We adopted this standard during the fourth quarter of fiscal 2017 and elected to account for forfeitures as they occur using a modified retrospective transition method. The change from the current method of estimating forfeitures resulted in a cumulative-effect adjustment of approximately $9 thousand, which we recorded as expense in fiscal 2017. The guidance also requires companies to record excess tax benefits and tax deficiencies as income tax benefit or expense in the statement of operations prospectively when share-based awards vest or are settled. The adoption had no impact on our deferred tax assets and the fiscal 2017 opening accumulated deficit balance because we had no historical excess tax benefit related tax attributes. We also elected to apply the change in cash flow classification of excess tax benefits prospectively, resulting in no reclassification of our consolidated statements of cash flows.
In April 2015, the FASB issued ASU 2015-03, Interest - Imputation of Interest (Topic 835-30), Simplifying the Presentation of Debt Issuance Costs. To simplify the presentation of debt issuance costs, the standard requires that debt issuance costs related to a recognized debt liability be presented in the balance sheet as a direct deduction from the carrying amount of that debt liability, consistent with debt discounts. In August 2015, the FASB issued ASU No. 2015-15, Presentation and Subsequent Measurement of Debt Issuance Costs Associated with Line-of-Credit Arrangements. This ASU includes an SEC staff announcement that the SEC staff would not object to an entity deferring and presenting the costs of securing a revolving line of credit as an asset, and amortizing the costs over the term of the line-of-credit arrangement, regardless of there are any outstanding borrowings on the line-of-credit arrangement. The subject of this ASU was not previously addressed by ASU No. 2015-03. We have adopted both accounting guidance during the first quarter of fiscal 2017 and applied its provisions retrospectively. The adoption of these standards had no material impact on our consolidated financial statements and related disclosures.
Accounting Standards Not Yet Adopted
In May 2014, the FASB issued ASU 2014-09 (ASC Topic 606), Revenue from Contracts with Customers, which along with amendments issued in 2015 and 2016, will supersede nearly all current U.S. GAAP guidance on this topic and eliminate industry-specific guidance. The amendments are based on the principle that revenue should be recognized to depict the transfer of promised goods or services to customers in an amount that reflects the consideration to which the entity expects to be entitled in exchange for those goods or services. Additional disclosures will also be required to enable users to understand the nature, amount, timing and uncertainty of revenue and cash flows arising from contracts with customers. This accounting standard update, as amended, will be effective for us in the first quarter of fiscal year 2019. The new revenue standard may be applied retrospectively to each prior period presented or retrospectively with the cumulative effect recognized in retained earnings as of the date of adoption. We are in process of evaluating the impact of the standard update. The ultimate impact on revenue resulting from the application of the new standard will be subject to assessments that are dependent on many variables, including, but not limited to, the terms of our contractual arrangements and our mix of business. We have established a cross-functional implementation team to implement the standard update related to the recognition of revenue from contracts with customers. We have identified and are in the process of evaluating changes to our systems, processes and internal controls to meet the reporting and increased disclosure requirements associated with this standard update. We expect the timing of revenue recognition to change in certain areas, including our services segment’s installation revenue, which upon adoption will be recognized as revenue and costs over a period of time. Also, since we currently expense sales commissions as incurred, the requirement in the new standard to capitalize certain in-scope sales commissions is being evaluated to determine its potential impact in the consolidated financial statements in the year of adoption. We expect to adopt the new standard on a modified retrospective basis in the first quarter of fiscal 2019. We are continuing to assess all potential impacts of the guidance and given normal ongoing business dynamics, preliminary conclusions are subject to change.
In October 2016, the FASB issued ASU 2016-16 Income Taxes (Topic 740), Accounting for Income Taxes: Intra-Entity Asset Transfers of Assets Other than Inventory, which requires that an entity recognizes the tax expense from the sale of intra-entity sales of assets, other than inventory, in the seller’s tax jurisdiction when the transfer occurs, even though the pre-tax effects of that transaction are eliminated in consolidation. The guidance will be effective for our fiscal year 2019. Early adoption is permitted. The ASU must be adopted using a modified retrospective method. We do not expect the adoption of this standard to have a material impact on our consolidated financial statements and related disclosures.
61
In February 2016, the FASB issued ASU 2016-02, Leases (Topic 842), which introduces the recognition of lease assets and lease liabilities by lessees for those leases classified as operating leases under previous guidance. This standard will become effective for interim and annual periods beginning after December 15, 2018, with early adoption permitted. The guidance is required to be adopted at the earliest period presented using a modified retrospective approach. We expect that most of our operating lease commitments will be subject to the new standard and recognized as right-of-use assets and operating lease liabilities upon the adoption of ASU 2016-02. We are evaluating the effect the adoption of the standard will have on our consolidated financial statements and related disclosures.
In January 2016, the FASB issued ASU 2016-01, Financial Instruments - Overall (Subtopic 825-10): Recognition and Measurement of Financial Assets and Financial Liabilities. This guidance retains the current accounting for classifying and measuring investments in debt securities and loans, but requires equity investments to be measured at fair value with subsequent changes recognized in net income, except for those accounted for under the equity method or requiring consolidation. The guidance also changes the accounting for investments without a readily determinable fair value and that do not qualify for the practical expedient to estimate fair value. A policy election can be made for these investments whereby estimated fair value may be measured at cost and adjusted in subsequent periods for any impairment or changes in observable prices of identical or similar investments. This ASU is effective for fiscal years beginning after December 15, 2017. We do not expect the adoption of this guidance to have a material impact on our consolidated financial statements.
In July 2015, the FASB issued ASU 2015-11 Inventory (Topic 330), Simplifying the Measurement of Inventory, which provides guidance to companies who account for inventory using either the first-in, first-out (“FIFO”) or average cost methods. The guidance states that companies should measure inventory at the lower of cost and net realizable value. Net realizable value is defined as the estimated selling prices in the ordinary course of business, less reasonably predictable costs of completion, disposal and transportation. This ASU is effective for fiscal years beginning after December 15, 2016. Early adoption is permitted. We do not expect the adoption of this guidance to have a material impact on our consolidated financial statements.
Note 2. Accumulated Other Comprehensive Loss
The changes in components of our accumulated other comprehensive loss during fiscal 2017, 2016 and 2015 were as follows:
(In thousands) | Foreign Currency Translation Adjustment (“CTA”) | Hedging Derivatives | Total Accumulated Other Comprehensive Income (Loss) | ||||||||
Balance as of June 27, 2014 | $ | (2,997 | ) | $ | 34 | $ | (2,963 | ) | |||
Other comprehensive loss before reclassification | (5,672 | ) | (314 | ) | (5,986 | ) | |||||
Less: reclassification for amounts included in net loss | — | 321 | 321 | ||||||||
Balance as of July 3, 2015 | (8,669 | ) | 41 | (8,628 | ) | ||||||
Other comprehensive loss before reclassification | (2,488 | ) | — | (2,488 | ) | ||||||
Less: reclassification for amounts included in net loss | — | (41 | ) | (41 | ) | ||||||
Balance as of July 1, 2016 | (11,157 | ) | — | (11,157 | ) | ||||||
Other comprehensive loss before reclassification | (279 | ) | — | (279 | ) | ||||||
Less: reclassification for amounts included in net loss | (349 | ) | — | (349 | ) | ||||||
Balance as of June 30, 2017 | $ | (11,785 | ) | $ | — | $ | (11,785 | ) | |||
No income tax benefits were allocated to other comprehensive loss in fiscal 2017, 2016 and 2015.
62
In fiscal 2017, 2016 and 2015, the realized gain (loss) reclassified out of accumulated other comprehensive loss were included in the following line item locations in our consolidated statements of operations:
Fiscal Year | |||||||||||
(In thousands) | 2017 | 2016 | 2015 | ||||||||
Revenues | $ | — | $ | — | $ | (378 | ) | ||||
Cost of revenues | — | 41 | 57 | ||||||||
Other income (expense) | 349 | — | — | ||||||||
$ | 349 | $ | 41 | $ | (321 | ) | |||||
Note 3. Net Loss per Share of Common Stock
Net loss per share is computed using the two-class method, by dividing net loss attributable to us by the weighted average number of common shares and participating securities outstanding during the period. Our restricted shares contain rights to receive non-forfeitable dividends and therefore are considered to be participating securities and included in the calculations of net income per basic and diluted common share. Undistributed losses are not allocated to unvested restricted shares because the unvested restricted shares are not contractually obligated to share our losses. The impact on earnings per share of the participating securities under the two-class method was immaterial.
As we incurred net loss for all periods in fiscal 2017, 2016 and 2015, the effect of outstanding stock options, restricted stock awards and units and performance share awards and units were anti-dilutive and therefore were excluded from the diluted net loss per share calculations. The following table summarizes the potential shares of common stock that were excluded from the diluted net loss per share calculations:
Fiscal Year | ||||||||
(In thousands) | 2017 | 2016 | 2015 | |||||
Stock options | 410 | 538 | 613 | |||||
Restricted stock awards and units and performance share awards and units | 403 | 258 | 42 | |||||
Total potential shares of common stock excluded | 813 | 796 | 655 | |||||
Note 4. Balance Sheet Components
Cash, Cash Equivalents, and Restricted Cash
The following table provides a summary of cash, cash equivalents, and restricted cash reported within the Consolidated Balance Sheets that reconciles to the corresponding amount in the Consolidated Statements of Cash Flows:
(In thousands) | June 30, 2017 | July 1, 2016 | |||||
Cash and cash equivalents | $ | 35,658 | $ | 30,479 | |||
Restricted cash | 541 | 558 | |||||
Restricted cash included in Other assets | 370 | 388 | |||||
Total cash, cash equivalents, and restricted cash in the Statements of Cash Flows | $ | 36,569 | $ | 31,425 | |||
Accounts Receivable, net
Our net accounts receivable is summarized below:
(In thousands) | June 30, 2017 | July 1, 2016 | |||||
Accounts receivable | $ | 49,864 | $ | 71,416 | |||
Less: allowances for collection losses | (3,919 | ) | (7,967 | ) | |||
$ | 45,945 | $ | 63,449 | ||||
63
Inventories
Our inventories are summarized below:
(In thousands) | June 30, 2017 | July 1, 2016 | |||||
Finished products | $ | 16,619 | $ | 20,044 | |||
Work in process | 3,088 | 5,104 | |||||
Raw materials and supplies | 2,087 | 2,145 | |||||
Total inventories | $ | 21,794 | $ | 27,293 | |||
Deferred cost of revenue included within finished goods | $ | 7,120 | $ | 5,984 | |||
Consigned inventories included within raw materials | $ | 1,268 | $ | 2,035 | |||
During fiscal 2017, 2016 and 2015, we recorded charges to adjust our inventory and customer service inventory due to excess and obsolete inventory resulting from lower sales forecast, product transitioning or discontinuance. Such charges incurred during fiscal 2017, 2016 and 2015 were classified in cost of product sales as follows:
Fiscal Year | |||||||||||
(In thousands) | 2017 | 2016 | 2015 | ||||||||
Excess and obsolete inventory charges | $ | 39 | $ | 9,175 | $ | 6,291 | |||||
Customer service inventory write-downs | 1,098 | 693 | 1,752 | ||||||||
$ | 1,137 | $ | 9,868 | $ | 8,043 | ||||||
As % of revenue | 0.5 | % | 3.7 | % | 2.4 | % | |||||
Property, Plant and Equipment, net
Our property, plant and equipment, net are summarized below:
(In thousands) | June 30, 2017 | July 1, 2016 | |||||
Land | $ | 710 | $ | 710 | |||
Buildings and leasehold improvements | 11,442 | 11,714 | |||||
Software | 14,803 | 14,620 | |||||
Machinery and equipment | 43,174 | 42,960 | |||||
70,129 | 70,004 | ||||||
Less accumulated depreciation and amortization | (53,723 | ) | (51,842 | ) | |||
$ | 16,406 | $ | 18,162 | ||||
Depreciation and amortization expense related to property, plant and equipment, including amortization of internal use software and capital lease equipment, was $5.8 million, $6.6 million and $7.2 million, respectively, in fiscal 2017, 2016 and 2015.
Accrued Expenses
Our accrued expenses are summarized below:
(In thousands) | June 30, 2017 | July 1, 2016 | |||||
Accrued compensation and benefits | $ | 8,317 | $ | 7,161 | |||
Accrued agent commissions | 1,911 | 3,551 | |||||
Accrued warranties | 3,056 | 3,944 | |||||
Other | 8,649 | 8,549 | |||||
$ | 21,933 | $ | 23,205 | ||||
64
We accrue for the estimated cost to repair or replace products under warranty. Changes in our warranty liability, which is included as a component of accrued expenses in the consolidated balance sheets were as follows:
Fiscal Year | |||||||||||
(In thousands) | 2017 | 2016 | 2015 | ||||||||
Balance as of the beginning of the fiscal year | $ | 3,944 | $ | 4,221 | $ | 3,777 | |||||
Warranty provision recorded during the period | 1,604 | 3,462 | 5,595 | ||||||||
Consumption during the period | (2,492 | ) | (3,739 | ) | (5,151 | ) | |||||
Balance as of the end of the period | $ | 3,056 | $ | 3,944 | $ | 4,221 | |||||
Advanced payments and Unearned Income
Our advanced payments and unearned income are summarized below:
(In thousands) | June 30, 2017 | July 1, 2016 | |||||
Advanced payments | $ | 8,760 | $ | 12,124 | |||
Unearned income | 11,244 | 18,491 | |||||
$ | 20,004 | $ | 30,615 | ||||
Note 5. Fair Value Measurements of Assets and Liabilities
Fair value is defined as the price that would be received to sell an asset or paid to transfer a liability in the principal market (or most advantageous market, in the absence of a principal market) for the asset or liability in an orderly transaction between market participants as of the measurement date. We maximize the use of observable inputs and minimize the use of unobservable inputs in measuring fair value and establish a three-level fair value hierarchy that prioritizes the inputs used to measure fair value. The three levels of inputs used to measure fair value are as follows:
• | Level 1 — Observable inputs such as quoted prices in active markets for identical assets or liabilities; |
• | Level 2 — Observable market-based inputs or observable inputs that are corroborated by market data; and |
• | Level 3 — Unobservable inputs that are supported by little or no market activity and that are significant to the fair value of the assets or liabilities. |
The carrying amounts, estimated fair values and valuation input levels of our assets and liabilities that are measured at fair value on a recurring basis as of June 30, 2017 and July 1, 2016 were as follows:
June 30, 2017 | July 1, 2016 | ||||||||||||||||
(In thousands) | Carrying Amount | Fair Value | Carrying Amount | Fair Value | Valuation Inputs | ||||||||||||
Assets: | |||||||||||||||||
Cash and cash equivalents: | |||||||||||||||||
Money market funds | $ | 22,059 | $ | 22,059 | $ | 18,800 | $ | 18,800 | Level 1 | ||||||||
Bank certificates of deposit | $ | 66 | $ | 66 | $ | 11 | $ | 11 | Level 2 | ||||||||
Short-term investments: | |||||||||||||||||
Bank certificates of deposit | $ | 264 | $ | 264 | $ | 222 | $ | 222 | Level 2 | ||||||||
Other current assets: | |||||||||||||||||
Foreign exchange forward contracts | $ | — | $ | — | $ | 5 | $ | 5 | Level 2 | ||||||||
Liabilities: | |||||||||||||||||
Other accrued expenses: | |||||||||||||||||
Foreign exchange forward contracts | $ | 5 | $ | 5 | $ | 9 | $ | 9 | Level 2 | ||||||||
We classify items within Level 1 if quoted prices are available in active markets. Our Level 1 items mainly are money market funds purchased from two major financial institutions. As of June 30, 2017, these money market funds were valued at $1.00 net asset value per share by these financial institutions.
65
We classify items in Level 2 if the observable inputs to quoted market prices, benchmark yields, reported trades, broker/dealer quotes or alternative pricing sources are available with reasonable levels of price transparency. Our bank certificates of deposit and foreign exchange forward contracts are classified within Level 2. Foreign currency forward contracts are measured at fair value using observable foreign currency exchange rates. The assets and liabilities related to our foreign currency forward contracts were not material as of June 30, 2017 and July 1, 2016. We did not have any recurring assets or liabilities that were valued using significant unobservable inputs.
Our policy is to recognize asset or liability transfers among Level 1, Level 2 and Level 3 as of the actual date of the events or change in circumstances that caused the transfer. During fiscal 2017, 2016 and 2015, we had no transfers between levels of the fair value hierarchy of our assets or liabilities measured at fair value.
Note 6. Credit Facility and Debt
On March 28, 2014, we entered into a Second Amended and Restated Loan Agreement with Silicon Valley Bank (the “SVB Credit Facility”). The SVB Credit Facility was amended on September 25, 2014, October 30, 2014 and December 2, 2014 to provide for extensions to the deadline for preparing and filing our fiscal 2014 financial statements with the SEC. On February 27, 2015, the SVB Credit Facility was further amended to provide for certain amendments to the financial covenants, borrowing base and an early termination fee if the SVB Credit Facility is terminated prior to its expiration. In March 2016, we amended the SVB Credit Facility to amend financial covenants and to reduce the maximum borrowing capacity from $40.0 million to $30.0 million. In June 2016, we amended the SVB Credit Facility to amend the minimum EBITDA covenant; to create a new sub-limit for letters of credit issued under the revolving credit facility of $12.0 million; to reduce the advance rate applicable to Singapore Borrower’s eligible accounts in the calculation of the borrowing base of the revolving credit facility; to increase the interest rate margins applicable to revolving loans made to Singapore Borrower by 2.00% above the applicable margin; and to extend the maturity date to June 30, 2018. In June 2017, the SVB Credit Facility was amended to exclude certain guarantee, indemnity and similar agreements from the borrowing base calculations and to extend the effective date to July 15, 2017 for the requirement that we obtain credit insurance on the receivables of the Singapore Borrower to be included in the borrowing base. The SVB Credit Facility carries an interest rate computed at the daily prime rate as published in the Wall Street Journal plus a spread of 0.50% to 1.50%, with such spread determined based on our adjusted quick ratio. During fiscal 2017, the weighted average interest rate on our outstanding loan was 4.21%. As of June 30, 2017 and July 1, 2016, our outstanding debt balance under the SVB Credit Facility was $9.0 million, and the interest rate was 4.75% and 4.00% respectively.
The SVB Credit Facility provides for a committed amount of up to $30.0 million, with a $30.0 million sublimit that can be borrowed by our Singapore subsidiary. Borrowings may be advanced under the SVB Credit Facility at the lesser of $30.0 million or a borrowing base equal to a specified percentage of the value of eligible accounts receivable and U.S. unbilled accounts of the Company, subject to certain reserves and eligibility criteria. The SVB Credit Facility can also be utilized to issue letters of credit with a $12.0 million sublimit. If the SVB Credit Facility is terminated by us in certain circumstances prior to its expiration, we are subject to an early termination fee equal to 1.00% of the revolving line. As of June 30, 2017, available credit under the SVB Credit Facility was $5.8 million reflecting the calculated borrowing base of $20.0 million less existing borrowings of $9.0 million and outstanding letters of credit of $5.2 million.
The SVB Credit Facility contains quarterly financial covenants including minimum adjusted quick ratio and minimum profitability (EBITDA) requirements. In the event our adjusted quick ratio falls below a certain level, cash received in our accounts with SVB may be directly applied to reduce outstanding obligations under the SVB Credit Facility. The SVB Credit Facility also imposes certain restrictions on our ability to dispose of assets, permit a change in control, merge or consolidate, make acquisitions, incur indebtedness, grant liens, make investments, make certain restricted payments and enter into transactions with affiliates under certain circumstances. Certain of our assets, including accounts receivable, inventory, and equipment, are pledged as collateral for the SVB Credit Facility. Upon an event of default, outstanding obligations would be immediately due and payable. Under certain circumstances, a default interest rate will apply on all obligations during the existence of an event of default at a per annum rate of interest equal to 2.00% above the applicable interest rate. As of June 30, 2017, we were in compliance with the quarterly financial covenants, as amended, contained in the SVB Credit Facility. However, we have historically amended the agreement to revise financial covenants and the fact that the SVB Credit Facility contains subjective acceleration clauses that could be triggered by the lender, the $9.0 million borrowing was classified as a current liability as of June 30, 2017 and July 1, 2016.
We also obtained an uncommitted short-term line of credit of $0.4 million from a bank in New Zealand to support the operations of our subsidiary located there in fiscal 2015. This line of credit provides for $0.3 million in short-term advances at various interest rates, all of which was available as of June 30, 2017. The line of credit also provides for the
66
issuance of standby letters of credit and company credit cards, of which $0.1 million was outstanding as of June 30, 2017. This facility may be terminated upon notice, is reviewed annually for renewal or modification, and is supported by a corporate guarantee.
Note 7. Restructuring Activities
The following tables summarize our restructuring related activities during fiscal year 2017, 2016 and 2015:
(In thousands) | Severance and Benefits | ||||||||||||||||||
Fiscal 2016-2017 Plan | Fiscal 2015-2016 Plan | Fiscal 2014-2015 Plan | Fiscal 2013-2014 Plan | Total | |||||||||||||||
Balance as of June 27, 2014 | $ | — | $ | — | $ | 1,290 | $ | 214 | $ | 1,504 | |||||||||
Charges, net | — | 2,862 | (29 | ) | (43 | ) | 2,790 | ||||||||||||
Cash payments | — | (2,212 | ) | (1,261 | ) | (65 | ) | (3,538 | ) | ||||||||||
Balance as of July 3, 2015 | — | 650 | — | 106 | 756 | ||||||||||||||
Charges, net | 2,210 | 344 | — | (6 | ) | 2,548 | |||||||||||||
Cash payments | (698 | ) | (637 | ) | — | (32 | ) | (1,367 | ) | ||||||||||
Balance as of July 1, 2016 | 1,512 | 357 | — | 68 | 1,937 | ||||||||||||||
Charges, net | 345 | 36 | — | — | 381 | ||||||||||||||
Cash payments | (1,542 | ) | (294 | ) | — | (4 | ) | (1,840 | ) | ||||||||||
Balance as of June 30, 2017 | $ | 315 | $ | 99 | $ | — | $ | 64 | $ | 478 | |||||||||
(In thousands) | Facilities and Other | ||||||||||||||
Fiscal 2015-2016 Plan | Fiscal 2014-2015 Plan | Fiscal 2013-2014 Plan | Total | ||||||||||||
Balance as of June 27, 2014 | $ | — | $ | 92 | $ | 3,572 | $ | 3,664 | |||||||
Charges, net | 641 | 1,306 | 130 | 2,077 | |||||||||||
Cash payments | (8 | ) | (608 | ) | (1,371 | ) | (1,987 | ) | |||||||
Balance as of July 3, 2015 | 633 | 790 | 2,331 | 3,754 | |||||||||||
Charges, net | (62 | ) | 77 | (108 | ) | (93 | ) | ||||||||
Cash payments | (21 | ) | (584 | ) | (1,373 | ) | (1,978 | ) | |||||||
Noncash adjustments | — | 299 | 896 | 1,195 | |||||||||||
Balance as of July 1, 2016 | 550 | 582 | 1,746 | 2,878 | |||||||||||
Charges, net | — | 162 | 46 | 208 | |||||||||||
Cash payments | 13 | (576 | ) | (1,287 | ) | (1,850 | ) | ||||||||
Balance as of June 30, 2017 | $ | 563 | $ | 168 | $ | 505 | $ | 1,236 | |||||||
In June 2016, we entered into a lease termination agreement for our headquarters lease in Santa Clara, California (“Termination Agreement”). The noncash adjustments in the table above represents a $1.2 million deferred rent credit write-off to the restructuring expenses. Under the Termination Agreement, we agreed to pay a termination fee of $1.9 million payable over 14 months. The unpaid termination fee was included in the restructuring liabilities as of June 30, 2017 under the Fiscal 2014-2015 Plan and the Fiscal 2013-2014 Plan.
As of June 30, 2017, $1.5 million of the accrual balance was in short-term restructuring liabilities while $0.2 million was included in other long-term liabilities on the consolidated balance sheets.
Fiscal 2016-2017 Plan
During the fourth quarter of fiscal 2016, we initiated a restructuring plan (the “Fiscal 2016-2017 Plan”) to streamline our operations and align expenses with current revenue levels. Activities under the Fiscal 2016-2017 Plan primarily include reductions in workforce in marketing, selling and general and administrative functions. We have substantially complete the remaining restructuring activities under the Fiscal 2016-2017 Plan by the end of fiscal 2017. Payments related to the accrued restructuring liability balance for this plan will be paid through fiscal 2018.
67
Fiscal 2015-2016 Plan
During the third quarter of fiscal 2015, with the intent to bring our operational cost structure in line with the changing dynamics of the microwave radio and telecommunications markets, we initiated a restructuring plan (the “Fiscal 2015-2016 Plan”) to lower fixed overhead costs and operating expenses and to preserve cash flow. Activities under the Fiscal 2015-2016 Plan primarily include reductions in workforce across the Company, but primarily in operations outside the United States. We have substantially completed the restructuring activities under the Fiscal 2015-2016 Plan as of July 1, 2016. Payments related to the accrued restructuring liability balance for this plan is expected to be paid through fiscal 2020.
Fiscal 2014-2015 Plan
During the third quarter of fiscal 2014, in line with the decrease in revenue that we experienced and our reduced forecast for the immediate future, we initiated a restructuring plan (the “Fiscal 2014-2015 Plan”) to reduce our operating costs, primarily in North America, Europe and Asia. Activities under the Fiscal 2014-2015 Plan primarily include reductions in workforce and additional facility downsizing of our Santa Clara, California headquarters. We have substantially completed the restructuring activities under the Fiscal 2014-2015 Plan as of July 1, 2016. Payments related to the accrued restructuring liability balance for this plan will be paid through fiscal 2018.
Fiscal 2013-2014 Plan
During the fourth quarter of fiscal 2013, we initiated a restructuring plan (the “Fiscal 2013-2014 Plan”) that was intended to reduce our operating expenses primarily in North America, Europe and Asia. Activities under the Fiscal 2013-2014 Plan included reductions in workforce and facility downsizing of our Santa Clara, California headquarters and certain international field offices. We substantially completed the restructuring activities under the Fiscal 2013-2014 Plan as of June 27, 2014. Payments related to the accrued restructuring liability balance for this plan will be paid through fiscal 2018.
Note 8. Stockholders’ Equity
As discussed in Note 1, on June 14, 2016, we effected a 1-for-12 reverse stock split of our common stock. All share and per share data in this note have been retroactively adjusted to reflect this reverse stock split.
Stock Incentive Programs
2007 Stock Equity Plan
As of June 30, 2017, we had one stock incentive plan for our employees and nonemployee directors, the 2007 Stock Equity Plan, as amended and restated effective November 13, 2015 (the “2007 Stock Plan”). The 2007 Stock Plan provides for accelerated vesting of certain share-based awards if there is a change in control of the Company. The 2007 Stock Plan also provides for the issuance of share-based awards in the form of stock options, stock appreciation rights, restricted stock awards and units, and performance share awards and units. We have various incentive programs under the 2007 Stock Plan, including annual and long-term incentive programs (“AIP” or “LTIP”).
Under the 2007 Stock Plan, option exercise prices are equal to the fair market value on the date the options are granted using our closing stock price. Options granted in fiscal 2015 would be fully vested after 3.5 years from the grant date. We did not grant any options in fiscal 2017 and 2016. After vesting, options generally may be exercised within seven years after the date of grant.
Restricted stock unit is not transferable until vested and the restrictions lapse upon the achievement of continued employment or service over a specified time period. Restricted stock unit issued to employees generally vests between three to four years from the date of grant. Restricted stock unit issued to non-executive board members annually generally vests on the day before the annual stockholders’ meeting.
Vesting of performance share awards and unit is subject to the achievement of pre-determined financial performance criteria and continued employment through the end of the applicable period. Market-based stock units vest upon meeting certain pre-determined share price performance criteria and continued employment through the end of the applicable period. The performance criteria of the performance share awards and units and the market-based stock units can be achieved before the end of the vesting period.
68
We issue new shares of our common stock to our employees upon the exercise of stock options, vesting of restricted stock awards and units or vesting of performance share awards and units. All awards that are canceled prior to vesting or expire unexercised are returned to the approved pool of reserved shares under the 2007 Stock Plan and made available for future grants. Shares of our common stock remaining available for future issuance under the 2007 Stock Plan totaled 270,947 as of June 30, 2017.
On September 6, 2016, the Board authorized and declared a dividend distribution of one right (a “Right”) for each outstanding share of our common stock, par value $0.01 per share (the “Common Shares”), to our stockholders of record as of the close of business on September 16, 2016. Each Right entitles the registered holder to purchase from the Company one one-thousandth of a share of Series A Participating Preferred Stock, par value $0.01 per share (the “Preferred Shares”), of the Company at an exercise price of $35.00 (the “Exercise Price”) per one one-thousandth of a Preferred Share, subject to adjustment. Until the rights become exercisable, they will not be evidenced by separate certificates and will trade automatically with shares of the Company’s common stock. The Rights have a de minimis fair value. The complete terms of the Rights are set forth in a Tax Benefit Preservation Plan (the “Plan”), dated as of September 6, 2016, between the Company and Computershare Inc., as rights agent. By adopting the Plan, we are helping to preserve the value of certain deferred tax benefits, including those generated by net operating losses (collectively, the “Tax Benefits”), which could be lost in the event of an “ownership change” as defined under Section 382 of the Internal Revenue Code of 1986, as amended. The Plan reduces the likelihood that changes in our investor base have the unintended effect of limiting our use of the Tax Benefits.
Also, on September 6, 2016, our Board of Directors adopted certain amendments to our Amended and Restated Certificate of Incorporation, as amended (the “Charter Amendments”). The Charter Amendments are designed to preserve the Tax Benefits by restricting certain transfers of our common stock.
Both the Plan and the Charter Amendments were approved at our 2016 annual meeting of stockholders on November 16, 2016. No actions were taken under the Plan as of June 30, 2017.
Employee Stock Purchase Plan
Under the Employee Stock Purchase Plan (“ESPP”), employees are entitled to purchase shares of our common stock at a 5% discount from the fair market value at the end of a three-month purchase period. As of June 30, 2017, 61,065 shares were reserved for future issuances under the ESPP. We issued 974 shares under the ESPP during fiscal 2017.
Share-Based Compensation
Total following table presents the compensation expense for share-based awards included in our consolidated statements of operations for fiscal 2017, 2016 and 2015:
Fiscal Year | |||||||||||
(In thousands) | 2017 | 2016 | 2015 | ||||||||
By Expense Category: | |||||||||||
Cost of product sales and services | $ | 208 | $ | 154 | $ | 151 | |||||
Research and development | 138 | 110 | 108 | ||||||||
Selling and administrative | 1,765 | 1,572 | 1,928 | ||||||||
Total share-based compensation expense | $ | 2,111 | $ | 1,836 | $ | 2,187 | |||||
By Types of Award: | |||||||||||
Options | $ | 260 | $ | 837 | $ | 1,459 | |||||
Restricted stock awards and units | 1,473 | 933 | 688 | ||||||||
Performance share awards and units and market-based stock units | 378 | 66 | 40 | ||||||||
Total share-based compensation expense | $ | 2,111 | $ | 1,836 | $ | 2,187 | |||||
69
The following table summarizes the unamortized compensation expense and the remaining years over which such expense would be expected to be recognized, on a weighted-average basis, by type of award:
June 30, 2017 | ||||||
Unamortized Expense | Weighted Average Remaining Recognition Period | |||||
(In thousands) | (Years) | |||||
Options | $ | 152 | 1.09 | |||
Restricted stock awards and units | $ | 2,485 | 1.79 | |||
Performance share awards and units and market-based stock units | $ | 900 | 1.50 | |||
Stock Options
A summary of the combined stock option activity under our equity plans during fiscal 2017 is as follows:
Shares | Weighted Average Exercise Price | Weighted Average Remaining Contractual Life | Aggregate Intrinsic Value | |||||||||
(Years) | (In thousands) | |||||||||||
Options outstanding as of July 1, 2016 | 448,359 | $ | 32.95 | 3.37 | ||||||||
Granted | — | N/A | ||||||||||
Exercised | (573 | ) | $ | 14.88 | ||||||||
Forfeited | (34,282 | ) | $ | 33.50 | ||||||||
Expired | (40,799 | ) | $ | 74.40 | ||||||||
Options outstanding as of June 30, 2017 | 372,705 | $ | 28.39 | 2.72 | $ | 167 | ||||||
Options vested and expected to vest as of June 30, 2017 | 372,705 | $ | 28.39 | 2.72 | $ | 167 | ||||||
Options exercisable as of June 30, 2017 | 348,506 | $ | 29.30 | 2.59 | $ | 118 | ||||||
The aggregate intrinsic value represents the total pre-tax intrinsic value or the aggregate difference between the closing price of our common stock on June 30, 2017 of $17.40 and the exercise price for in-the-money options that would have been received by the optionees if all options had been exercised on June 30, 2017. The options expected to vest are the result of applying the pre-vesting forfeiture rate assumptions to total outstanding options.
The fair value of each option grant under our 2007 Stock Plan was estimated using the Black-Scholes option pricing model on the date of grant. No options were granted during fiscal 2017 and 2016. A summary of the significant weighted average assumptions we used in the Black-Scholes valuation model is as follows:
Fiscal Year | |||
2015 | |||
Expected dividends | — | % | |
Expected volatility | 53.9 | % | |
Risk-free interest rate | 1.13 | % | |
Expected term (years) | 4.25 | ||
Weighted average grant date fair value per share granted | $ | 6.60 | |
70
The following summarizes all of our stock options outstanding and exercisable as of June 30, 2017:
Options Outstanding | Options Exercisable | ||||||||||||||||
Actual Range of Exercise Prices | Number Outstanding | Weighted Average Remaining Contractual Life | Weighted Average Exercise Price | Number Exercisable | Weighted Average Exercise Price | ||||||||||||
(Years) | |||||||||||||||||
$14.88 | — | $15.60 | 82,615 | 4.59 | $ | 15.38 | 58,416 | $ | 15.38 | ||||||||
$20.64 | — | $27.36 | 83,863 | 2.56 | $ | 26.17 | 83,863 | $ | 26.17 | ||||||||
$27.72 | — | $30.72 | 70,725 | 1.64 | $ | 29.28 | 70,725 | $ | 29.28 | ||||||||
$31.20 | — | $31.20 | 74,462 | 3.19 | $ | 31.20 | 74,462 | $ | 31.20 | ||||||||
$32.52 | — | $62.16 | 56,222 | 1.10 | $ | 42.33 | 56,222 | $ | 42.33 | ||||||||
$71.04 | — | $71.04 | 4,818 | 0.69 | $ | 71.04 | 4,818 | $ | 71.04 | ||||||||
$14.88 | — | $71.04 | 372,705 | 2.72 | $ | 28.39 | 348,506 | $ | 29.30 | ||||||||
Additional information related to our stock options is summarized below:
Fiscal Year | |||||||||||
(In thousands) | 2017 | 2016 | 2015 | ||||||||
Intrinsic value of options exercised | $ | 3 | $ | — | $ | — | |||||
Fair value of options vested | $ | 654 | $ | 1,395 | $ | 1,990 | |||||
Restricted Stock Awards and Units
A summary of the status of our restricted stock as of June 30, 2017 and changes during fiscal 2017 is as follows:
Shares | Weighted Average Grant Date Fair Value | |||||
Restricted stock outstanding as of July 1, 2016 | 210,596 | $ | 12.01 | |||
Granted | 237,874 | $ | 9.66 | |||
Vested and released | (55,178 | ) | $ | 9.40 | ||
Forfeited | (14,277 | ) | $ | 12.29 | ||
Restricted stock outstanding as of June 30, 2017 | 379,015 | $ | 10.91 | |||
The fair value of each restricted stock grant is based on the closing price of our common stock on the date of grant. The total fair value of restricted stock that vested during fiscal 2017, 2016 and 2015 was $0.5 million, $0.7 million and $0.6 million, respectively.
71
Market -Based Stock Units
A summary of the status of our market-based stock units as of June 30, 2017 and changes during fiscal 2017 is as follows:
Shares | Weighted Average Grant Date Fair Value | |||||
Market-based stock units outstanding as of July 1, 2016 | 149,169 | $ | 2.56 | |||
Granted | 50,000 | $ | 6.83 | |||
Forfeited | (55,845 | ) | $ | 2.56 | ||
Market-based stock units outstanding as of June 30, 2017 | 143,324 | $ | 4.05 | |||
The fair value of each market-based stock unit with market condition was estimated using the Monte-Carlo simulation model. A summary of the significant weighted average assumptions we used in the Monte Carlo simulation model is as follows:
Fiscal Year | |||||||||
2017 | 2016 | 2015 | |||||||
Expected Dividends | — | % | — | % | N/A | ||||
Expected volatility | 58.1 | % | 52.4 | % | N/A | ||||
Risk-free interest rate | 1.20 | % | 1.21 | % | N/A | ||||
Weighted average grant date fair value per share granted | $ | 6.83 | $ | 2.56 | N/A | ||||
The fair value of the market-based stock units with market condition criteria is expensed over the derived service period for each separate vesting tranche. If the derived service period is rendered, the total fair value of the award at the date of the grant is recognized as compensation expense even if the market condition is not achieved.
Performance Share Awards and Units
A summary of the status of our performance shares awards and units as of June 30, 2017 and changes during fiscal 2017 is as follows:
Shares | Weighted Average Grant Date Fair Value | |||||
Performance share awards and units outstanding as of July 1, 2016 | — | N/A | ||||
Granted | 72,941 | $ | 9.18 | |||
Forfeited | — | N/A | ||||
Performance share awards and units outstanding as of June 30, 2017 | 72,941 | $ | 9.18 | |||
No performance shares award or unit vested during fiscal 2017 and 2016. The total fair value of performance share awards and units that vested during fiscal 2015 was $0.1 million.
Note 9. Segment and Geographic Information
We operate in one reportable business segment: the design, manufacturing and sale of a range of wireless networking products, solutions and services. We conduct business globally and our sales and support activities are managed on a geographic basis. Our Chief Executive Officer is the Chief Operating Decision Maker (the “CODM”). Our CODM manages our business primarily by function globally and reviews financial information on a consolidated basis, accompanied by disaggregated information about revenues by geographic region, for purposes of allocating resources and evaluating financial performance. The profitability of our geographic region is not a determining factor in allocating resources and the CODM does not evaluate profitability below the level of the consolidated company.
72
We report revenue by region and country based on the location where our customers accept delivery of our products and services. Revenue by region for 2017, 2016 and 2015 were as follows:
Fiscal Year | |||||||||||
(In thousands) | 2017 | 2016 | 2015 | ||||||||
North America | $ | 132,078 | $ | 125,482 | $ | 153,239 | |||||
Africa and Middle East | 60,150 | 82,742 | 97,112 | ||||||||
Europe and Russia | 14,128 | 20,539 | 35,990 | ||||||||
Latin America and Asia Pacific | 35,518 | 39,927 | 49,537 | ||||||||
Total Revenue | $ | 241,874 | $ | 268,690 | $ | 335,878 | |||||
Revenue by country comprising more than 5% of our total revenue for fiscal 2017, 2016 and 2015 were as follows:
(In thousands, except percentages) | Revenue | % of Total Revenue | ||||
Fiscal 2017: | ||||||
United States | $ | 127,889 | 52.9 | % | ||
Nigeria | $ | 18,147 | 7.5 | % | ||
Philippines | $ | 13,733 | 5.7 | % | ||
Fiscal 2016: | ||||||
United States | $ | 121,283 | 45.1 | % | ||
Nigeria | $ | 28,862 | 10.7 | % | ||
Fiscal 2015: | ||||||
United States | $ | 151,066 | 45.0 | % | ||
Nigeria | $ | 36,459 | 10.9 | % | ||
Our long-lived assets, consisting primarily of property, plant and equipment, by geographic areas based on the physical location of the assets as of June 30, 2017 and July 1, 2016 were as follows:
(In thousands) | June 30, 2017 | July 1, 2016 | |||||
United States | $ | 5,854 | $ | 11,353 | |||
United Kingdom | 2,727 | 2,946 | |||||
New Zealand | 6,310 | 2,618 | |||||
Other countries | 1,515 | 1,245 | |||||
Total | $ | 16,406 | $ | 18,162 | |||
Note 10. Divestiture
In March 2011, our board of directors approved a plan for the sale of our WiMAX business. On September 2, 2011, we sold to EION Networks, Inc. (“EION”) our WiMAX business and related assets consisting of certain technology, inventory and equipment. As consideration for the sale of assets, EION agreed to pay us $0.4 million in cash and up to $2.8 million in additional cash payments contingent upon specific factors related to future WiMAX business performance. We had received $0.1 million in total of such contingent payments through June 27, 2014 and do not expect any further payments from EION. In addition, EION is entitled to receive cash payments up to $2.0 million upon collection of certain WiMAX accounts receivable. As of September 26, 2014, we made $1.6 million in total of such payments to EION and wrote-off the remaining $0.4 million balance resulting from the write-downs of the corresponding WiMAX accounts receivable. As of June 30, 2017 and July 1, 2016, we had no liabilities related to the disposition of WiMAX business.
In the third quarter of fiscal 2011, we began accounting for the WiMAX business as a discontinued operation and, therefore, the operating results of our WiMAX business were included in discontinued operations in our consolidated financial statements for all years presented. The income recognized in fiscal 2016 was primarily due to the recovery of
73
certain WiMAX customer receivables that was previously written down. The income recognized in fiscal 2015 was primarily due to a $0.1 million write-off of accrued liabilities due to EION.
Summary results of operations for the WiMAX business were as follows:
Fiscal Year | |||||||||||
(In thousands) | 2017 | 2016 | 2015 | ||||||||
Income from operations of WiMAX | $ | — | $ | 652 | $ | 30 | |||||
Gain on disposal | — | — | 85 | ||||||||
Income taxes | — | (111 | ) | (21 | ) | ||||||
Income from discontinued operations, net of tax | $ | — | $ | 541 | $ | 94 | |||||
Note 11. Income Taxes
Income (loss) from continuing operations before provision for income taxes during fiscal year 2017, 2016 and 2015 consisted of the following:
Fiscal Year | |||||||||||
(In thousands) | 2017 | 2016 | 2015 | ||||||||
United States | $ | 10,979 | $ | (4,248 | ) | $ | (18,603 | ) | |||
Foreign | (11,584 | ) | (24,295 | ) | (7,355 | ) | |||||
Total loss from continuing operations before income taxes | $ | (605 | ) | $ | (28,543 | ) | $ | (25,958 | ) | ||
Provision for (benefit from) income taxes from continuing operations for fiscal year 2017, 2016 and 2015 were summarized as follows:
Fiscal Year | |||||||||||
(In thousands) | 2017 | 2016 | 2015 | ||||||||
Current provision (benefit): | |||||||||||
Federal | $ | (14 | ) | $ | 131 | $ | — | ||||
Foreign | (52 | ) | 1,814 | 3,378 | |||||||
State and local | 7 | 24 | 23 | ||||||||
(59 | ) | 1,969 | 3,401 | ||||||||
Deferred provision (benefit): | |||||||||||
Federal | 168 | (468 | ) | (216 | ) | ||||||
Foreign | (93 | ) | 134 | (4,495 | ) | ||||||
75 | (334 | ) | (4,711 | ) | |||||||
Total provision for (benefit from) income taxes from continuing operations | $ | 16 | $ | 1,635 | $ | (1,310 | ) | ||||
74
The provision for (benefit from) income taxes from continuing operations differed from the amount computed by applying the federal statutory rate of 35% to our income before provision for income taxes as follows:
Fiscal Year | |||||||||||
(In thousands) | 2017 | 2016 | 2015 | ||||||||
Tax benefit at statutory rate | $ | (196 | ) | $ | (9,990 | ) | $ | (9,065 | ) | ||
Valuation allowances | (1,346 | ) | 6,609 | (3,900 | ) | ||||||
Foreign non-deductible expenses | 628 | 103 | (80 | ) | |||||||
State and local taxes, net of U.S. federal tax benefit | 358 | (134 | ) | (500 | ) | ||||||
Foreign income taxed at rates less than the U.S. statutory rate | 2,062 | 6,019 | 9,970 | ||||||||
Dividend from foreign subsidiary | — | (1,781 | ) | — | |||||||
Foreign branch income/withholding taxes | 1,116 | 292 | 1,350 | ||||||||
Singapore refund | (3,778 | ) | — | — | |||||||
Change in uncertain tax positions | 1,173 | 437 | 610 | ||||||||
Other | (1 | ) | 80 | 305 | |||||||
Total provision for (benefit from) income taxes from continuing operations | $ | 16 | $ | 1,635 | $ | (1,310 | ) | ||||
The income tax expense (benefit) from continuing operations was $16 thousand of expense for fiscal 2017, $1.6 million of expense for fiscal 2016 and $1.3 million of benefit for fiscal 2015. The difference between our income tax expense (benefit) from continuing operations and income tax expense at the statutory rate of 35% was primarily attributable to losses in tax jurisdictions in which we cannot recognize a tax benefit and increase in foreign withholding taxes. During fiscal 2017, we recorded a $3.7 million tax benefit from the audit assessment refund received from the Inland Revenue Authority of Singapore. During fiscal 2015, we released approximately $4.4 million of the deferred tax valuation allowance in jurisdictions where management believed the utilization of deferred tax assets was more likely than not based on the weighting of positive and negative evidence.
75
The components of deferred tax assets and liabilities were as follows:
(In thousands) | June 30, 2017 | July 1, 2016 | |||||
Deferred tax assets: | |||||||
Inventory | $ | 4,390 | $ | 6,652 | |||
Accruals and reserves | 2,611 | 2,497 | |||||
Bad debts | 669 | 1,091 | |||||
Amortization | 1,870 | 3,148 | |||||
Stock compensation | 2,266 | 2,599 | |||||
Deferred revenue | 3,127 | 1,759 | |||||
Unrealized exchange gain/loss | 3,295 | 3,422 | |||||
Other | 3,715 | 6,623 | |||||
Tax credit carryforwards | 15,337 | 18,016 | |||||
Tax loss carryforwards | 168,115 | 167,468 | |||||
Total deferred tax assets before valuation allowance | 205,395 | 213,275 | |||||
Valuation allowance | (197,951 | ) | (202,824 | ) | |||
Total deferred tax assets | 7,444 | 10,451 | |||||
Deferred tax liabilities: | |||||||
Branch undistributed earnings reserve | 990 | 822 | |||||
Depreciation | 1,501 | 4,596 | |||||
Other | 456 | 462 | |||||
Total deferred tax liabilities | 2,947 | 5,880 | |||||
Net deferred tax assets | $ | 4,497 | $ | 4,571 | |||
As Reported on the Consolidated Balance Sheets | |||||||
Deferred income tax assets | $ | 6,178 | $ | 6,068 | |||
Deferred income tax liabilities | 1,681 | 1,497 | |||||
Total net deferred income taxes | $ | 4,497 | $ | 4,571 | |||
Our valuation allowance related to deferred income taxes, as reflected in our consolidated balance sheets, was $198.0 million as of June 30, 2017 and $202.8 million as of July 1, 2016. The decrease in valuation allowance in fiscal 2017 was primarily due to the release of valuation allowance in certain foreign jurisdictions, partially offset by losses in tax jurisdictions in which we cannot recognize tax benefits.
Tax loss and credit carryforwards as of June 30, 2017 have expiration dates ranging between one year and no expiration in certain instances. The amount of U.S. federal tax loss carryforwards as of June 30, 2017 and July 1, 2016 were $339.8 million and $345.3 million, respectively, and begin to expire in fiscal 2023. The amount of U.S. federal and state tax credit carryforwards as of June 30, 2017 were $16.4 million, and certain credits will begin to expire in fiscal 2018. The amount of foreign tax loss carryforwards as of June 30, 2017 was $232.1 million and certain losses begin to expire in fiscal 2018. The amount of foreign tax credit carryforwards as of June 30, 2017 were $4.4 million, and certain credits will begin to expire in fiscal 2023.
United States income taxes have not been provided on basis differences in foreign subsidiaries of $5.0 million and $5.6 million, respectively, as of June 30, 2017 and July 1, 2016, because of our intention to reinvest these earnings indefinitely. The residual U.S. tax liability, if such amounts were remitted, would be nominal.
We entered into a tax sharing agreement with Harris effective on January 26, 2007, the date of the acquisition of Stratex. The tax sharing agreement addresses, among other things, the settlement process associated with pre-merger tax liabilities and tax attributes that are attributable to the Microwave Communication Division when it was a division of Harris. There were no settlement payments recorded in fiscal year 2017, 2016 or 2015.
As of June 30, 2017 and July 1, 2016, we had unrecognized tax benefits of $18.7 million and $27.0 million, respectively, for various federal, foreign, and state income tax matters. Unrecognized tax benefits decreased by $8.3
76
million. Our total unrecognized tax benefits that, if recognized, would affect our effective tax rate were $2.5 million and $1.4 million, respectively, as of June 30, 2017 and July 1, 2016. These unrecognized tax benefits are presented on the accompanying consolidated balance sheets net of the tax effects of net operating loss carryforwards.
We account for interest and penalties related to unrecognized tax benefits as part of our provision for income taxes. The interest accrued was $0.2 million as of June 30, 2017 and immaterial as of July 1, 2016. No penalties have been accrued.
Our unrecognized tax benefit activity for fiscal 2017, 2016 and 2015 was as follows:
(In thousands) | Amount | ||
Unrecognized tax benefit as of June 27, 2014 | $ | 28,209 | |
Additions for tax positions in prior periods | 673 | ||
Decreases for tax positions in prior periods | (227 | ) | |
Decreases related to change of foreign exchange rate | (1,745 | ) | |
Unrecognized tax benefit as of July 3, 2015 | 26,910 | ||
Additions for tax positions in current periods | 397 | ||
Additions for tax positions in prior periods | 246 | ||
Decreases related to change of foreign exchange rate | (515 | ) | |
Unrecognized tax benefit as of July 1, 2016 | 27,038 | ||
Additions for tax positions in prior periods | 626 | ||
Additions for tax positions in current periods | 831 | ||
Decreases for tax positions in prior periods | (9,279 | ) | |
Decreases related to change of foreign exchange rate | (477 | ) | |
Unrecognized tax benefit as of June 30, 2017 | $ | 18,739 | |
During the fiscal year 2014, we received an assessment letter from the Inland Revenue Authority of Singapore (“IRAS”) related to deductions claimed in prior years and made a payment of $13.2 million related to tax years 2007 through 2010, reflecting all of the taxes incrementally assessed by IRAS. While we disagreed with the IRAS assessment, the payment was a required step in order to continue our appeal. Since the initial assessment, we have continued to challenge this assessment. During the first quarter of fiscal year 2017, we received an initial refund of $3.7 million from IRAS and recognized a discrete benefit in the first quarter of fiscal year 2017. During the first quarter of fiscal 2018, we received an additional refund of $1.3 million from IRAS which represents a final settlement. We will recognize the refund as a discrete tax benefit in the first quarter of fiscal 2018. During the next twelve months, it is reasonably possible that our unrecognized tax benefits will be impacted by up to $3.0 million.
We have a number of years with open tax audits which vary from jurisdiction to jurisdiction. Our major tax jurisdictions include the U.S., Singapore, Nigeria and the Ivory Coast. The earliest years still open and subject to potential audits for these jurisdictions are as follows: U.S. —2003; Singapore — 2006; Nigeria — 2011, and Ivory Coast — 2016.
Note 12. Commitments and Contingencies
Operating Lease Commitments
We lease office and manufacturing facilities under non-cancelable operating leases expiring at various dates through 2024. We lease approximately 19,000 square feet of office space in Milpitas, California as our corporate headquarters with a term of 60 months. As of June 30, 2017, future minimum lease payments for our Milpitas headquarters total $1.4 million.
77
As of June 30, 2017, our future minimum lease payments under all non-cancelable operating leases with an initial lease term in excess of one year were as follows:
Fiscal Years | Amount | ||
(In thousands) | |||
2018 | $ | 1,997 | |
2019 | 1,431 | ||
2020 | 988 | ||
2021 | 908 | ||
2022 | 208 | ||
Thereafter | 2,023 | ||
Total | $ | 7,555 | |
These commitments do not contain any material rent escalations, rent holidays, contingent rent, rent concessions, leasehold improvement incentives or unusual provisions or conditions. We sublease a portion of our facilities to third parties and the total minimum rents to be received in the future under our non-cancelable subleases were $0.1 million as of June 30, 2017. The future minimum lease payments are not reduced by the minimum sublease rents.
Rental expense for operating leases, including rentals on a month-to-month basis was $4.0 million, $5.1 million and $6.5 million in fiscal 2017, 2016 and 2015, respectively.
Purchase Orders and Other Commitments
From time to time in the normal course of business, we may enter into purchasing agreements with our suppliers that require us to accept delivery of, and remit full payment for, finished products that we have ordered, finished products that we requested be held as safety stock, and work in process started on our behalf in the event we cancel or terminate the purchasing agreement. Because these agreements do not specify fixed or minimum quantities, do not specify minimum or variable price provisions, and do not specify the approximate timing of the transaction, and we have no present intention to cancel or terminate any of these agreements, we currently do not believe that we have any future liability under these agreements. As of June 30, 2017, we had outstanding purchase obligations with our suppliers or contract manufacturers of $17.8 million. In addition, we had contractual obligations of approximately $1.4 million associated with software licenses as of June 30, 2017.
Financial Guarantees and Commercial Commitments
Guarantees issued by banks, insurance companies or other financial institutions are contingent commitments issued to guarantee our performance under borrowing arrangements, such as bank overdraft facilities, tax and customs obligations and similar transactions or to ensure our performance under customer or vendor contracts. The terms of the guarantees are generally equal to the remaining term of the related debt or other obligations and are generally limited to two years or less. As of June 30, 2017, we had no guarantees applicable to our debt arrangements.
We have entered into commercial commitments in the normal course of business including surety bonds, standby letters of credit agreements and other arrangements with financial institutions primarily relating to the guarantee of future performance on certain contracts to provide products and services to customers. As of June 30, 2017, we had commercial commitments of $34.7 million outstanding that were not recorded in our consolidated balance sheets. During the second fiscal quarter, we recorded a payout in cost of revenues of $0.4 million on the performance guarantees to a contractor in the Middle East region. We believe the customer improperly drew down on the performance bond and intend to pursue all remedies available to recover the payment. We do not believe, based on historical experience and information currently available, that it is probable that any significant amounts will be required to be paid on the performance guarantees in the future.
Indemnifications
Under the terms of substantially all of our license agreements, we have agreed to defend and pay any final judgment against our customers arising from claims against such customers that our products infringe the intellectual property rights of a third party. As of June 30, 2017, we have not received any notice that any customer is subject to an infringement claim arising from the use of our products; we have not received any request to defend any customers from infringement claims arising from the use of our products; and we have not paid any final judgment on behalf of any
78
customer related to an infringement claim arising from the use of our products. Because the outcome of infringement disputes is related to the specific facts of each case, and given the lack of previous or current indemnification claims, we cannot estimate the maximum amount of potential future payments, if any, related to our indemnification provisions. As of June 30, 2017, we had not recorded any liabilities related to these indemnifications.
Legal Proceedings
We are subject from time to time to disputes with customers concerning our products and services. In May 2016, we received notification of a claim for $1.0 million in damages from a customer in Austria alleging that certain of our products were defective. We are continuing to investigate this claim, and at this time an estimate of the reasonably possible loss or range of loss cannot be made. We believe that we have numerous contractual and legal defenses to these disputes, and we intend to dispute them vigorously.
In August 2016, we received correspondence from a customer in Africa demanding that certain inventory be repurchased under the terms of an inventory management agreement that we believed had previously expired. We settled this matter for $0.2 million in April 2017.
From time to time, we may be involved in various other legal claims and litigation that arise in the normal course of our operations. We are aggressively defending all current litigation matters. Although there can be no assurances and the outcome of these matters is currently not determinable, we currently believe that none of these claims or proceedings are likely to have a material adverse effect on our financial position. We expect to defend each of these disputes vigorously. There are many uncertainties associated with any litigation and these actions or other third-party claims against us may cause us to incur costly litigation and/or substantial settlement charges. As a result, our business, financial condition, results of operations, and cash flows could be adversely affected. The actual liability in any such matters may be materially different from our estimates, if any.
We record accruals for our outstanding legal proceedings, investigations or claims when it is probable that a liability will be incurred and the amount of loss can be reasonably estimated. We evaluate, at least on a quarterly basis, developments in legal proceedings, investigations or claims that could affect the amount of any accrual, as well as any developments that would result in a loss contingency to become both probable and reasonably estimable. Except for the matter above which was ultimately settled for $0.2 million, we have not recorded any accrual for loss contingencies associated with such legal claims or litigation discussed above.
Contingent Liabilities
We record a loss contingency as a charge to operations when (i) it is probable that an asset has been impaired or a liability has been incurred at the date of the financial statements; and (ii) the amount of the loss can be reasonably estimated. Disclosure in the notes to the financial statements is required for loss contingencies that do not meet both those conditions if there is a reasonable possibility that a loss may have been incurred. Gain contingencies are not recorded until realized. We expense all legal costs incurred to resolve regulatory, legal and tax matters as incurred.
Periodically, we review the status of each significant matter to assess the potential financial exposure. If a potential loss is considered probable and the amount can be reasonably estimated, we reflect the estimated loss in our results of operations. Significant judgment is required to determine the probability that a liability has been incurred or an asset impaired and whether such loss is reasonably estimable. Further, estimates of this nature are highly subjective, and the final outcome of these matters could vary significantly from the amounts that have been included in our consolidated financial statements. As additional information becomes available, we reassess the potential liability related to our pending claims and litigation and may revise estimates accordingly. Such revisions in the estimates of the potential liabilities could have a material impact on our results of operations and financial position.
79
Note 13. Quarterly Financial Data (Unaudited)
The following financial information reflects all normal recurring adjustments, which are, in the opinion of management, necessary for a fair statement of the results of the interim periods. Our fiscal quarters end on the Friday nearest the end of the calendar quarter. Summarized quarterly data for fiscal 2017 and 2016 were as follows:
(In thousands, except per share amounts) | Q1 Ended 9/30/2016 | Q2 Ended 12/30/2016 | Q3 Ended 3/31/2017 | Q4 Ended 6/30/2017 | |||||||||||
Fiscal 2017 | |||||||||||||||
Revenue | $ | 58,207 | $ | 68,536 | $ | 58,700 | $ | 56,431 | |||||||
Gross margin | 17,365 | 21,116 | 17,732 | 19,259 | |||||||||||
Operating (loss) income | (2,925 | ) | 2,513 | 73 | (646 | ) | |||||||||
Net (loss) income | (601 | ) | 1,722 | (330 | ) | (1,412 | ) | ||||||||
Net (loss) income attributable to Aviat Networks | (629 | ) | 1,678 | (399 | ) | (1,473 | ) | ||||||||
Per share data: | |||||||||||||||
Basic net (loss) income per common share | $ | (0.12 | ) | $ | 0.32 | $ | (0.08 | ) | $ | (0.28 | ) | ||||
Diluted net (loss) income per common share | (0.12 | ) | 0.31 | (0.08 | ) | (0.28 | ) | ||||||||
(In thousands, except per share amounts) | Q1 Ended 10/2/2015 | Q2 Ended 1/1/2016 | Q3 Ended 4/1/2016 | Q4 Ended 7/1/2016 | |||||||||||
Fiscal 2016 | |||||||||||||||
Revenue | $ | 79,555 | $ | 70,416 | $ | 60,467 | $ | 58,252 | |||||||
Gross margin | 21,011 | 16,424 | 14,413 | 9,869 | |||||||||||
Operating loss | (1,598 | ) | (4,998 | ) | (7,594 | ) | (13,256 | ) | |||||||
Net loss | (1,154 | ) | (5,534 | ) | (7,808 | ) | (15,141 | ) | |||||||
Net loss attributable to Aviat Networks | (1,203 | ) | (5,679 | ) | (7,874 | ) | (15,151 | ) | |||||||
Per share data: | |||||||||||||||
Basic and diluted net loss per common share (1) | $ | (0.23 | ) | $ | (1.09 | ) | $ | (1.50 | ) | $ | (2.88 | ) | |||
_______________________
(1) | All per share data in this note have been retroactively adjusted for the Reverse Stock Split discussed in Note 1. |
The following tables summarize notable items included in our results of operations for each of the fiscal quarters presented:
(In thousands) | Q1 Ended 9/30/2016 | Q2 Ended 12/30/2016 | Q3 Ended 3/31/2017 | Q4 Ended 6/30/2017 | |||||||||||
Fiscal 2017 | |||||||||||||||
Restructuring charges | $ | 160 | $ | 72 | $ | 111 | $ | 246 | |||||||
Nigeria foreign exchange loss (gain) on dividend receivable | 210 | (2 | ) | 10 | (5 | ) | |||||||||
WTM inventory recovery | — | (83 | ) | (48 | ) | (45 | ) | ||||||||
Performance bond expense | — | 365 | — | — | |||||||||||
Gain on liquidation of subsidiary | — | — | (349 | ) | — | ||||||||||
Tax refund from Inland Revenue Authority of Singapore | (3,741 | ) | — | — | — | ||||||||||
(In thousands) | Q1 Ended 10/2/2015 | Q2 Ended 1/1/2016 | Q3 Ended 4/1/2016 | Q4 Ended 7/1/2016 | |||||||||||
Fiscal 2016 | |||||||||||||||
Restructuring charges | $ | 21 | $ | 34 | $ | 804 | $ | 1,596 | |||||||
Nigeria foreign exchange loss on dividend receivable | — | — | — | 1,245 | |||||||||||
WTM inventory write-down | — | — | — | 5,057 | |||||||||||
80
Note 14. Subsequent Events
In August 2017, we received an insurance recovery of $0.3 million which will be recorded as a reduction of operating expenses in the first quarter of 2018.
During the first quarter of fiscal 2018, we received a refund of $1.3 million from IRAS which represents a final settlement. We will recognize the tax refund as a discrete tax benefit in the first quarter of fiscal 2018. For more information about the tax refund, see “Note 11. Income Taxes”.
Item 9. Changes in and Disagreements with Accountants on Accounting and Financial Disclosure
Not applicable.
Item 9A. Controls and Procedures
Evaluation of Disclosure Controls and Procedures
Based on management’s evaluation, with participation of our Chief Executive Officer (CEO) and Chief Financial Officer (CFO), as of the end of the period covered by this report, our CEO and CFO have concluded that our disclosure controls and procedures, as defined in Rules 13a-15(e) and 15d-15(e) under the Securities Exchange Act of 1934, as amended (the “Exchange Act”), are effective to provide reasonable assurance that the information required to be disclosed in reports that we file or submit under the Exchange Act is recorded, processed, summarized and reported within the time periods specified in the Securities and Exchange Commission rules and forms, and is accumulated and communicated to management, including our principal executive officer and principal financial officer, as appropriate to allow timely decisions regarding required disclosures.
Changes in Internal Controls Over Financial Reporting
There were no changes to our internal control over financial reporting as defined in Rules 13a-15(f) or 15d-15(f) that occurred during the quarter ended June 30, 2017 that have materially affected, or are reasonably likely to materially affect, our internal control over financial reporting.
Management Report on Internal Control Over Financial Reporting
Our management is responsible for establishing and maintaining adequate internal control over financial reporting (as defined in Rules 13a-15(f) and 15d-15(f) under the Exchange Act) to provide reasonable assurance regarding the reliability of our financial reporting and the preparation of consolidated financial statements for external purposes in accordance with U.S. GAAP.
Management assessed our internal control over financial reporting as of June 30, 2017, the end of our fiscal year. Management based its assessment on criteria established in Internal Control-Integrated Framework issued by the Committee of Sponsoring Organizations of the Treadway Commission (2013 framework). Management’s assessment included evaluation of elements such as the design and operating effectiveness of key financial reporting controls, process documentation, accounting policies, and our overall control environment.
Based on this assessment, management has concluded that our internal control over financial reporting was effective as of the end of the fiscal year to provide reasonable assurance regarding the reliability of financial reporting and the preparation of consolidated financial statements for external reporting purposes in accordance with U.S. GAAP. We reviewed the results of management’s assessment with the Audit Committee of our Board of Directors.
This Annual Report on Form 10-K does not include an attestation report of our independent registered public accounting firm regarding internal controls over financial reporting because Aviat is a non-accelerated filer and is not subject to auditor attestation requirements under the applicable rules of the Securities Exchange Commission.
Inherent Limitations on Effectiveness of Controls
Our management, including the CEO and CFO, does not expect that our disclosure controls and procedures or our internal control over financial reporting will prevent or detect all errors and all fraud. A control system, no matter how well-designed and operated, can provide only reasonable, not absolute, assurance that the control system’s objectives will be met. The design of a control system must reflect the fact that there are resource constraints, and the benefits of controls must be considered relative to their costs. Further, because of the inherent limitations in all control systems, no
81
evaluation of controls can provide absolute assurance that misstatements due to error or fraud will not occur or that all control issues and instances of fraud, if any, have been detected. The design of any system of controls is based in part on certain assumptions about the likelihood of future events, and there can be no assurance that any design will succeed in achieving its stated goals under all potential future conditions. Projections of any evaluation of the effectiveness of controls to future periods are subject to risks. Over time, controls may become inadequate because of changes in conditions or deterioration in the degree of compliance with policies or procedures.
Item 9B. Other Information
None.
82
PART III
Certain information required by Part III is omitted from this Annual Report on Form 10-K because we will file a definitive Proxy Statement with the SEC within 120 days after the end of our fiscal year ended June 30, 2017.
Item 10. Directors, Executive Officers and Corporate Governance
We adopted a Code of Conduct that is available at www.aviatnetworks.com. No amendments to our Code of Business Ethics or waivers from our Code of Conduct with respect to any of our executive officers or directors have been made. If, in the future, we amend our Code of Conduct or grant waivers from our Code of Conduct with respect to any of our executive officers or directors, we will make information regarding such amendments or waivers available on our corporate website (www.aviatnetworks.com) for a period of at least 12 months.
For information with respect to Executive Officers, see Part I, Item 1 of this Annual Report on Form 10-K, under “Executive Officers of the Registrant.”
Information regarding our directors and compliance with Section 16(a) of the Exchange Act by our directors and executive officers will appear in our definitive Proxy Statement and is incorporated herein by reference.
Item 11. Executive Compensation
Information regarding our executive compensation will appear in our definitive Proxy Statement and is incorporated herein by reference.
Item 12. Security Ownership of Certain Beneficial Owners and Management and Related Stockholder Matters
Information regarding security ownership of certain beneficial owners and management and related stockholder matters will appear in our definitive Proxy Statement and is incorporated herein by reference.
Item 13. Certain Relationships and Related Transactions, and Director Independence
Information regarding certain relationships and related transactions, and director independence will appear in our definitive Proxy Statement and is incorporated herein by reference.
Item 14. Principal Accountant Fees and Services
Information regarding our principal accountant fees and services will appear in our definitive Proxy Statement and is incorporated herein by reference.
83
PART IV
Item 15. Exhibits and Financial Statement Schedules
(a) | The following documents are filed as part of this report. |
1. Financial Statements
The financial statements of Aviat Networks, Inc. are set forth in Item 8 of this Annual Report on Form 10-K.
2. Financial Statement Schedules
Schedule | Page |
Schedule II — Valuation and Qualifying Accounts for the three fiscal years ended July 1, 2016 | |
All other schedules have been omitted because the required information is not present or is not present in amounts sufficient to require submission of the schedules or because the information required is included in the consolidated financial statements or notes thereto.
(b) | Exhibits. |
The information required by this Item is set forth on the Exhibit Index (following the Signatures section of this report) and is included, or incorporated by reference, in this Form 10-K.
84
SIGNATURES
Pursuant to the requirements of the Securities Exchange Act of 1934, the registrant has duly caused this report to be signed on its behalf by the undersigned, thereunto duly authorized.
AVIAT NETWORKS, INC. (Registrant) | |||||
Date: | September 6, 2017 | By: | /s/ Ralph S. Marimon | ||
Ralph S. Marimon | |||||
Senior Vice President and Chief Financial Officer | |||||
Pursuant to the requirements of the Securities Exchange Act of 1934, this report has been signed below by the following persons on behalf of the registrant and in the capacities and on the dates indicated.
Signature | Title | Date | ||
/s/ Michael A. Pangia | President and Chief Executive Officer (Principal Executive Officer) | September 6, 2017 | ||
Michael A. Pangia | ||||
/s/ Ralph S. Marimon | Senior Vice President and Chief Financial Officer (Principal Financial Officer) | September 6, 2017 | ||
Ralph S. Marimon | ||||
/s/ Eric Chang | Vice President, Corporate Controller and Principal Accounting Officer (Principal Accounting Officer) | September 6, 2017 | ||
Eric Chang | ||||
/s/ John Mutch | Chairman of the Board | September 6, 2017 | ||
John Mutch | ||||
/s/ Wayne Barr, Jr. | Director | September 6, 2017 | ||
Wayne Barr, Jr. | ||||
/s/ Kenneth Kong | Director | September 6, 2017 | ||
Kenneth Kong | ||||
/s/ John Quicke | Director | September 6, 2017 | ||
John Quicke | ||||
/s/ James C. Stoffel | Director | September 6, 2017 | ||
James C. Stoffel | ||||
85
SCHEDULE II — VALUATION AND QUALIFYING ACCOUNTS
AVIAT NETWORKS, INC.
Years Ended June 30, 2017, July 1, 2016 and July 3, 2015
(In thousands) | Balance at Beginning of Period | Charged to (Credit from) Costs and Expenses | Deductions | Balance at End of Period | |||||||||||
Allowances for collection losses: | |||||||||||||||
Year ended June 30, 2017 | $ | 7,967 | $ | (484 | ) | $ | 3,564 | (A) | $ | 3,919 | |||||
Year ended July 1, 2016 | $ | 6,641 | $ | 2,431 | $ | 1,105 | (B) | $ | 7,967 | ||||||
Year ended July 3, 2015 | $ | 7,442 | $ | 1,302 | $ | 2,103 | (C) | $ | 6,641 | ||||||
____________________________
Note A - Consisted of changes to allowance for collection losses of $607 thousand for foreign currency translation gain and $4,172 thousand for uncollectible accounts charged off, net of recoveries on accounts previously charged off.
Note B - Consisted of changes to allowance for collection losses of $308 thousand for foreign currency translation losses and $797 thousand for uncollectible accounts charged off, net of recoveries on accounts previously charged off.
Note C - Consisted of changes to allowance for collection losses of $250 thousand for foreign currency translation losses and $1,853 thousand for uncollectible accounts charged off, net of recoveries on accounts previously charged off.
86
EXHIBIT INDEX
The following exhibits are filed herewith or are incorporated herein by reference to exhibits previously filed with the SEC:
Ex. # | Description | |
2.1 | ||
3.1 | ||
3.2 | ||
3.3 | ||
3.4 | ||
3.5 | ||
4.1 | ||
4.1.1 | ||
10.1 | ||
10.2 | ||
10.3 | ||
10.4* | ||
10.5 | ||
10.6 | ||
10.6.1 | ||
10.6.2 | ||
87
Ex. # | Description | |
10.6.3 | ||
10.6.4 | ||
10.6.5 | ||
10.6.6 | ||
10.6.7 | ||
10.7* | ||
10.8* | ||
10.8.1* | ||
10.9* | ||
10.10* | ||
10.11 | ||
10.12* | ||
10.13 | ||
10.14 | ||
21 | ||
23.1 | ||
31.1 | ||
31.2 | ||
32.1 | ||
32.2 | ||
101.INS | XBRL Instance Document | |
88
Ex. # | Description | |
101.SCH | XBRL Taxonomy Extension Schema Document | |
101.CAL | XBRL Taxonomy Extension Calculation Linkbase Document | |
101.DEF | XBRL Taxonomy Extension Definition Linkbase Document | |
101.LAB | XBRL Taxonomy Extension Label Linkbase Document | |
101.PRE | XBRL Taxonomy Extension Presentation Linkbase Document | |
______________________________
* | Management compensatory contract, arrangement or plan required to be filed as an exhibit pursuant to Item 15(b) of this report. |
89