00013769869/30X12023Q3False—00013769862022-10-012023-06-3000013769862023-06-30xbrli:sharesiso4217:USD00013769862022-09-300001376986tve:PowerProgramAppropriationInvestmentMember2022-09-300001376986tve:PowerProgramRetainedEarningsMember2022-09-300001376986tve:NonpowerProgramsAppropriationInvestmentNetMember2022-09-300001376986us-gaap:AccumulatedOtherComprehensiveIncomeMember2022-09-3000013769862023-04-012023-06-3000013769862022-04-012022-06-3000013769862021-10-012022-06-300001376986us-gaap:AccumulatedOtherComprehensiveIncomeMember2022-10-012023-06-3000013769862021-09-3000013769862022-06-300001376986tve:PowerProgramAppropriationInvestmentMember2022-03-310001376986tve:PowerProgramRetainedEarningsMember2022-03-310001376986tve:NonpowerProgramsAppropriationInvestmentNetMember2022-03-310001376986us-gaap:AccumulatedOtherComprehensiveIncomeMember2022-03-3100013769862022-03-310001376986tve:PowerProgramAppropriationInvestmentMember2022-04-012022-06-300001376986tve:PowerProgramRetainedEarningsMember2022-04-012022-06-300001376986tve:NonpowerProgramsAppropriationInvestmentNetMember2022-04-012022-06-300001376986us-gaap:AccumulatedOtherComprehensiveIncomeMember2022-04-012022-06-300001376986tve:PowerProgramAppropriationInvestmentMember2022-06-300001376986tve:PowerProgramRetainedEarningsMember2022-06-300001376986tve:NonpowerProgramsAppropriationInvestmentNetMember2022-06-300001376986us-gaap:AccumulatedOtherComprehensiveIncomeMember2022-06-300001376986tve:PowerProgramAppropriationInvestmentMember2023-03-310001376986tve:PowerProgramRetainedEarningsMember2023-03-310001376986tve:NonpowerProgramsAppropriationInvestmentNetMember2023-03-310001376986us-gaap:AccumulatedOtherComprehensiveIncomeMember2023-03-3100013769862023-03-310001376986tve:PowerProgramAppropriationInvestmentMember2022-10-012023-06-300001376986tve:PowerProgramRetainedEarningsMember2023-04-012023-06-300001376986tve:NonpowerProgramsAppropriationInvestmentNetMember2023-04-012023-06-300001376986tve:PowerProgramRetainedEarningsMember2022-10-012023-06-300001376986tve:NonpowerProgramsAppropriationInvestmentNetMember2022-10-012023-06-300001376986us-gaap:AccumulatedOtherComprehensiveIncomeMember2023-04-012023-06-300001376986tve:PowerProgramAppropriationInvestmentMember2023-06-300001376986tve:PowerProgramRetainedEarningsMember2023-06-300001376986tve:NonpowerProgramsAppropriationInvestmentNetMember2023-06-300001376986us-gaap:AccumulatedOtherComprehensiveIncomeMember2023-06-300001376986tve:PowerProgramAppropriationInvestmentMember2021-09-300001376986tve:PowerProgramRetainedEarningsMember2021-09-300001376986tve:NonpowerProgramsAppropriationInvestmentNetMember2021-09-300001376986us-gaap:AccumulatedOtherComprehensiveIncomeMember2021-09-300001376986tve:PowerProgramAppropriationInvestmentMember2021-10-012022-06-300001376986tve:PowerProgramRetainedEarningsMember2021-10-012022-06-300001376986tve:NonpowerProgramsAppropriationInvestmentNetMember2021-10-012022-06-300001376986us-gaap:AccumulatedOtherComprehensiveIncomeMember2021-10-012022-06-30tve:People0001376986us-gaap:CarryingReportedAmountFairValueDisclosureMember2023-06-300001376986us-gaap:CarryingReportedAmountFairValueDisclosureMember2022-09-30tve:Item0001376986us-gaap:OtherCurrentAssetsMemberus-gaap:CommodityContractMember2023-06-300001376986us-gaap:OtherCurrentAssetsMemberus-gaap:CommodityContractMember2022-09-3000013769862019-04-012021-03-310001376986tve:CumberlandMember2023-04-012023-06-300001376986tve:CumberlandMember2022-10-012023-06-300001376986us-gaap:OtherNoncurrentAssetsMember2023-06-300001376986us-gaap:OtherNoncurrentAssetsMember2022-09-300001376986us-gaap:OtherNoncurrentAssetsMember2023-06-300001376986us-gaap:OtherNoncurrentAssetsMember2022-09-300001376986tve:EnergyRightMembersrt:MinimumMember2022-10-012023-06-300001376986tve:EnergyRightMembersrt:MaximumMember2022-10-012023-06-300001376986tve:EnergyRightMember2022-10-012023-06-300001376986us-gaap:AccountsReceivableMember2023-06-300001376986us-gaap:AccountsReceivableMember2022-09-300001376986tve:EnergyRightLoanReserveMember2023-06-300001376986tve:EnergyRightLoanReserveMember2022-09-300001376986tve:EconomicDevelopmentLoanCollectiveReserveMember2023-06-300001376986tve:EconomicDevelopmentLoanCollectiveReserveMember2022-09-300001376986tve:EconomicDevelopmentLoanSpecificLoanReserveMember2023-06-300001376986tve:EconomicDevelopmentLoanSpecificLoanReserveMember2022-09-300001376986tve:UnrealizedLossesOnInterestRateDerivativesMember2023-06-300001376986tve:UnrealizedLossesOnInterestRateDerivativesMember2022-09-300001376986us-gaap:DeferredDerivativeGainLossMember2023-06-300001376986us-gaap:DeferredDerivativeGainLossMember2022-09-300001376986us-gaap:DeferredFuelCostsMember2023-06-300001376986us-gaap:DeferredFuelCostsMember2022-09-300001376986us-gaap:PensionCostsMember2023-06-300001376986us-gaap:PensionCostsMember2022-09-300001376986tve:NonNuclearDecommissioningMember2023-06-300001376986tve:NonNuclearDecommissioningMember2022-09-300001376986tve:NuclearDesommissioningCostsMember2023-06-300001376986tve:NuclearDesommissioningCostsMember2022-09-300001376986tve:OtherNonCurrentRegulatoryAssetsMember2023-06-300001376986tve:OtherNonCurrentRegulatoryAssetsMember2022-09-300001376986us-gaap:DeferredIncomeTaxChargesMember2023-06-300001376986us-gaap:DeferredIncomeTaxChargesMember2022-09-300001376986us-gaap:DeferredDerivativeGainLossMember2023-06-300001376986us-gaap:DeferredDerivativeGainLossMember2022-09-300001376986us-gaap:PostretirementBenefitCostsMember2023-06-300001376986us-gaap:PostretirementBenefitCostsMember2022-09-300001376986us-gaap:VariableInterestEntityPrimaryBeneficiaryMember2012-09-300001376986tve:JsccgMember2012-09-300001376986tve:HoldcoMember2012-09-300001376986tve:SCCGMember2013-09-3000013769862013-09-30xbrli:pure0001376986us-gaap:VariableInterestEntityPrimaryBeneficiaryMember2023-06-300001376986us-gaap:VariableInterestEntityPrimaryBeneficiaryMember2022-09-300001376986us-gaap:VariableInterestEntityPrimaryBeneficiaryMember2023-04-012023-06-300001376986us-gaap:VariableInterestEntityPrimaryBeneficiaryMember2022-04-012022-06-300001376986us-gaap:VariableInterestEntityPrimaryBeneficiaryMember2022-10-012023-06-300001376986us-gaap:VariableInterestEntityPrimaryBeneficiaryMember2021-10-012022-06-300001376986us-gaap:OtherNoncurrentLiabilitiesMember2023-06-300001376986us-gaap:OtherNoncurrentLiabilitiesMember2022-09-300001376986us-gaap:AccountsPayableAndAccruedLiabilitiesMember2023-06-300001376986us-gaap:AccountsPayableAndAccruedLiabilitiesMember2022-09-300001376986tve:OperatingLeaseLiabilityMember2023-06-300001376986tve:OperatingLeaseLiabilityMember2022-09-300001376986us-gaap:OtherCurrentLiabilitiesMember2023-06-300001376986us-gaap:OtherCurrentLiabilitiesMember2022-09-300001376986tve:NuclearMember2022-09-300001376986tve:NonNuclearMember2022-09-300001376986tve:NuclearMember2022-10-012023-06-300001376986tve:NonNuclearMember2022-10-012023-06-300001376986tve:NuclearMember2023-06-300001376986tve:NonNuclearMember2023-06-300001376986tve:A2023SeriesAMember2023-06-300001376986tve:A2009SeriesBMember2022-10-012023-06-300001376986tve:A2009SeriesBJunePaymentMember2022-10-012023-06-300001376986tve:DebtOfVariableInterestEntitiesMember2023-04-012023-06-300001376986tve:TotalMember2023-06-300001376986us-gaap:RevolvingCreditFacilityMember2023-06-30tve:Credit_facilities0001376986us-gaap:LetterOfCreditMember2023-06-300001376986us-gaap:LetterOfCreditMember2022-09-300001376986us-gaap:LineOfCreditMember2023-06-300001376986tve:KemperLagoonCreekLeaseholdInterestsMember2022-09-300001376986tve:KemperLagoonCreekLeaseholdInterestsMember2023-04-012023-06-300001376986tve:LagoonCreekMember2022-10-012023-06-300001376986tve:KemperMember2022-10-012023-06-300001376986tve:LagoonCreekMember2023-04-012023-06-300001376986tve:LagoonCreekMembersrt:ScenarioForecastMember2023-04-012023-09-300001376986tve:LagoonCreekMembersrt:ScenarioForecastMember2023-10-012024-09-300001376986tve:LagoonCreekMembersrt:ScenarioForecastMember2052-10-012053-09-300001376986us-gaap:InterestRateSwapMember2023-04-012023-06-300001376986us-gaap:InterestRateSwapMember2022-04-012022-06-300001376986us-gaap:InterestRateSwapMember2022-10-012023-06-300001376986us-gaap:InterestRateSwapMember2021-10-012022-06-300001376986tve:CommodityContractUnderFHPMember2023-04-012023-06-300001376986tve:CommodityContractUnderFHPMember2022-04-012022-06-300001376986tve:CommodityContractUnderFHPMember2022-10-012023-06-300001376986tve:CommodityContractUnderFHPMember2021-10-012022-06-300001376986tve:CommodityContractUnderFHPMembertve:FuelExpenseMember2023-04-012023-06-300001376986tve:CommodityContractUnderFHPMembertve:PurchasedPowerExpenseMember2023-04-012023-06-300001376986tve:CommodityContractUnderFHPMembertve:FuelExpenseMember2022-10-012023-06-300001376986tve:CommodityContractUnderFHPMembertve:PurchasedPowerExpenseMember2022-10-012023-06-300001376986tve:A250MillionSterlingCurrencySwapMember2023-06-300001376986tve:A250MillionSterlingCurrencySwapMemberus-gaap:AccountsPayableAndAccruedLiabilitiesMember2023-06-300001376986tve:A250MillionSterlingCurrencySwapMemberus-gaap:OtherNoncurrentLiabilitiesMember2023-06-300001376986tve:A250MillionSterlingCurrencySwapMember2022-09-300001376986tve:A250MillionSterlingCurrencySwapMemberus-gaap:AccountsPayableAndAccruedLiabilitiesMember2022-09-300001376986tve:A250MillionSterlingCurrencySwapMemberus-gaap:OtherNoncurrentLiabilitiesMember2022-09-300001376986tve:A150MillionSterlingCurrencySwapMember2023-06-300001376986tve:A150MillionSterlingCurrencySwapMemberus-gaap:AccountsPayableAndAccruedLiabilitiesMember2023-06-300001376986us-gaap:OtherNoncurrentLiabilitiesMembertve:A150MillionSterlingCurrencySwapMember2023-06-300001376986tve:A150MillionSterlingCurrencySwapMember2022-09-300001376986tve:A150MillionSterlingCurrencySwapMemberus-gaap:AccountsPayableAndAccruedLiabilitiesMember2022-09-300001376986us-gaap:OtherNoncurrentLiabilitiesMembertve:A150MillionSterlingCurrencySwapMember2022-09-300001376986tve:A10BillionNotionalInterestRateSwapMember2023-06-300001376986tve:A10BillionNotionalInterestRateSwapMemberus-gaap:AccountsPayableAndAccruedLiabilitiesMember2023-06-300001376986tve:A10BillionNotionalInterestRateSwapMembertve:InterestPayableCurrentMember2023-06-300001376986tve:A10BillionNotionalInterestRateSwapMemberus-gaap:OtherNoncurrentLiabilitiesMember2023-06-300001376986tve:A10BillionNotionalInterestRateSwapMember2022-09-300001376986tve:A10BillionNotionalInterestRateSwapMemberus-gaap:AccountsPayableAndAccruedLiabilitiesMember2022-09-300001376986tve:A10BillionNotionalInterestRateSwapMembertve:InterestPayableCurrentMember2022-09-300001376986tve:A10BillionNotionalInterestRateSwapMemberus-gaap:OtherNoncurrentLiabilitiesMember2022-09-300001376986us-gaap:InterestRateSwapMember2023-06-300001376986us-gaap:InterestRateSwapMemberus-gaap:AccountsPayableAndAccruedLiabilitiesMember2023-06-300001376986us-gaap:InterestRateSwapMemberus-gaap:OtherNoncurrentLiabilitiesMember2023-06-300001376986us-gaap:InterestRateSwapMember2022-09-300001376986us-gaap:InterestRateSwapMemberus-gaap:AccountsPayableAndAccruedLiabilitiesMember2022-09-300001376986us-gaap:InterestRateSwapMembertve:InterestPayableCurrentMember2022-09-300001376986us-gaap:InterestRateSwapMemberus-gaap:OtherNoncurrentLiabilitiesMember2022-09-300001376986us-gaap:CommodityContractMember2023-06-300001376986us-gaap:OtherNoncurrentAssetsMemberus-gaap:CommodityContractMember2023-06-300001376986us-gaap:CommodityContractMemberus-gaap:AccountsPayableAndAccruedLiabilitiesMember2023-06-300001376986us-gaap:OtherNoncurrentLiabilitiesMemberus-gaap:CommodityContractMember2023-06-300001376986us-gaap:CommodityContractMember2022-09-300001376986us-gaap:OtherCurrentAssetsMembertve:CommodityContractNotUnderFHPMember2022-09-300001376986us-gaap:OtherNoncurrentAssetsMemberus-gaap:CommodityContractMember2022-09-300001376986us-gaap:CommodityContractMemberus-gaap:AccountsPayableAndAccruedLiabilitiesMember2022-09-300001376986us-gaap:OtherNoncurrentLiabilitiesMemberus-gaap:CommodityContractMember2022-09-300001376986tve:CommodityContractUnderFHPMember2023-06-300001376986tve:CommodityContractUnderFHPMemberus-gaap:AccountsPayableAndAccruedLiabilitiesMember2023-06-300001376986us-gaap:OtherNoncurrentLiabilitiesMembertve:CommodityContractUnderFHPMember2023-06-300001376986tve:CommodityContractUnderFHPMember2022-09-300001376986tve:CommodityContractUnderFHPMemberus-gaap:AccountsReceivableMember2022-09-300001376986us-gaap:OtherCurrentAssetsMembertve:CommodityContractUnderFHPMember2022-09-300001376986us-gaap:OtherNoncurrentAssetsMembertve:CommodityContractUnderFHPMember2022-09-300001376986tve:CommodityContractUnderFHPMemberus-gaap:AccountsPayableAndAccruedLiabilitiesMember2022-09-30tve:Bond_issues0001376986srt:MinimumMember2022-10-012023-06-300001376986srt:MaximumMember2022-10-012023-06-300001376986srt:NaturalGasReservesMember2023-06-300001376986srt:NaturalGasReservesMember2022-09-300001376986tve:PowerPurchaseAgreementWithOptionToSettleMember2023-06-30tve:Unitstve:pure0001376986tve:PowerPurchaseAgreementWithOptionToSettleMember2022-09-30tve:Years0001376986us-gaap:CurrencySwapMember2023-06-300001376986us-gaap:CurrencySwapMember2022-09-300001376986us-gaap:InterestRateContractMember2023-06-300001376986us-gaap:InterestRateContractMember2022-09-300001376986tve:InterestSwapCollateralMember2023-06-300001376986us-gaap:FairValueInputsLevel2Member2023-06-300001376986us-gaap:FairValueInputsLevel2Member2022-09-300001376986us-gaap:CollateralizedSecuritiesMember2023-06-300001376986tve:CreditOfCustomersMember2022-10-012023-06-30tve:Customers0001376986srt:MoodysA1RatingMember2022-10-012023-06-300001376986srt:MoodysCaa1RatingMember2022-10-012023-06-300001376986us-gaap:EquityFundsMember2023-06-300001376986us-gaap:RealEstateFundsMember2023-06-300001376986us-gaap:CreditMember2023-06-300001376986us-gaap:PrivateEquityFundsMember2023-06-300001376986tve:PrivateRealEstateFundsMember2023-06-300001376986tve:PrivateCreditMember2023-06-300001376986tve:NdtMember2023-04-012023-06-300001376986tve:NdtMember2022-04-012022-06-300001376986tve:NdtMember2022-10-012023-06-300001376986tve:NdtMember2021-10-012022-06-300001376986tve:ArtMember2023-04-012023-06-300001376986tve:ArtMember2022-04-012022-06-300001376986tve:ArtMember2022-10-012023-06-300001376986tve:ArtMember2021-10-012022-06-300001376986tve:SerpMember2023-04-012023-06-300001376986tve:SerpMember2022-04-012022-06-300001376986tve:SerpMember2022-10-012023-06-300001376986tve:SerpMember2021-10-012022-06-300001376986tve:LTDCPMember2023-04-012023-06-300001376986tve:LTDCPMember2022-04-012022-06-300001376986tve:LTDCPMember2022-10-012023-06-300001376986tve:LTDCPMember2021-10-012022-06-300001376986us-gaap:FairValueInputsLevel1Member2023-06-300001376986us-gaap:FairValueInputsLevel3Member2023-06-300001376986tve:CommodityContractUnderFHPMemberus-gaap:FairValueInputsLevel1Member2023-06-300001376986us-gaap:FairValueInputsLevel2Membertve:CommodityContractUnderFHPMember2023-06-300001376986us-gaap:FairValueInputsLevel3Membertve:CommodityContractUnderFHPMember2023-06-300001376986srt:AffiliatedEntityMember2023-06-300001376986us-gaap:FairValueInputsLevel1Member2022-09-300001376986us-gaap:FairValueInputsLevel3Member2022-09-300001376986tve:CommodityContractUnderFHPMemberus-gaap:FairValueInputsLevel1Member2022-09-300001376986us-gaap:FairValueInputsLevel2Membertve:CommodityContractUnderFHPMember2022-09-300001376986us-gaap:FairValueInputsLevel3Membertve:CommodityContractUnderFHPMember2022-09-300001376986srt:AffiliatedEntityMember2022-09-300001376986us-gaap:PortionAtOtherThanFairValueFairValueDisclosureMember2023-06-300001376986us-gaap:PortionAtOtherThanFairValueFairValueDisclosureMember2022-09-300001376986stpr:AL2023-04-012023-06-300001376986stpr:AL2022-04-012022-06-300001376986stpr:AL2022-10-012023-06-300001376986stpr:AL2021-10-012022-06-300001376986stpr:GA2023-04-012023-06-300001376986stpr:GA2022-04-012022-06-300001376986stpr:GA2022-10-012023-06-300001376986stpr:GA2021-10-012022-06-300001376986stpr:KY2023-04-012023-06-300001376986stpr:KY2022-04-012022-06-300001376986stpr:KY2022-10-012023-06-300001376986stpr:KY2021-10-012022-06-300001376986stpr:MS2023-04-012023-06-300001376986stpr:MS2022-04-012022-06-300001376986stpr:MS2022-10-012023-06-300001376986stpr:MS2021-10-012022-06-300001376986stpr:NC2023-04-012023-06-300001376986stpr:NC2022-04-012022-06-300001376986stpr:NC2022-10-012023-06-300001376986stpr:NC2021-10-012022-06-300001376986stpr:TN2023-04-012023-06-300001376986stpr:TN2022-04-012022-06-300001376986stpr:TN2022-10-012023-06-300001376986stpr:TN2021-10-012022-06-300001376986stpr:VA2023-04-012023-06-300001376986stpr:VA2022-04-012022-06-300001376986stpr:VA2022-10-012023-06-300001376986stpr:VA2021-10-012022-06-300001376986tve:LpcsDomain2023-04-012023-06-300001376986tve:LpcsDomain2022-04-012022-06-300001376986tve:LpcsDomain2022-10-012023-06-300001376986tve:LpcsDomain2021-10-012022-06-300001376986tve:IndustriesdirectlyservedDomain2023-04-012023-06-300001376986tve:IndustriesdirectlyservedDomain2022-04-012022-06-300001376986tve:IndustriesdirectlyservedDomain2022-10-012023-06-300001376986tve:IndustriesdirectlyservedDomain2021-10-012022-06-300001376986tve:FederalagenciesandotherDomain2023-04-012023-06-300001376986tve:FederalagenciesandotherDomain2022-04-012022-06-300001376986tve:FederalagenciesandotherDomain2022-10-012023-06-300001376986tve:FederalagenciesandotherDomain2021-10-012022-06-300001376986srt:ScenarioForecastMember2022-10-012023-09-300001376986tve:A20yearTerminationNoticeMember2023-04-012023-06-300001376986tve:A5yearterminationnoticeMember2023-06-300001376986tve:A5yearterminationnoticeMember2023-04-012023-06-300001376986tve:A20yearTerminationNoticeMember2022-10-012023-06-300001376986tve:A5yearterminationnoticeMember2022-10-012023-06-300001376986us-gaap:PensionPlansDefinedBenefitMember2023-04-012023-06-300001376986us-gaap:PensionPlansDefinedBenefitMember2022-04-012022-06-300001376986us-gaap:OtherPostretirementBenefitPlansDefinedBenefitMember2023-04-012023-06-300001376986us-gaap:OtherPostretirementBenefitPlansDefinedBenefitMember2022-04-012022-06-300001376986us-gaap:PensionPlansDefinedBenefitMember2022-10-012023-06-300001376986us-gaap:PensionPlansDefinedBenefitMember2021-10-012022-06-300001376986us-gaap:OtherPostretirementBenefitPlansDefinedBenefitMember2022-10-012023-06-300001376986us-gaap:OtherPostretirementBenefitPlansDefinedBenefitMember2021-10-012022-06-300001376986us-gaap:OtherPensionPlansDefinedBenefitMembersrt:MinimumMember2023-04-012023-06-300001376986us-gaap:OtherPensionPlansDefinedBenefitMember2022-10-012023-06-300001376986tve:A401KMember2022-10-012023-06-300001376986tve:RebatesMember2022-10-012023-06-300001376986tve:SerpMember2022-10-012023-06-300001376986srt:ScenarioForecastMember2022-10-012026-09-30tve:Insurance_layerstve:reactorstve:Procedures0001376986us-gaap:OtherLiabilitiesMember2023-06-30
UNITED STATES
SECURITIES AND EXCHANGE COMMISSION
Washington, D.C. 20549
FORM 10-Q
(MARK ONE)
x QUARTERLY REPORT PURSUANT TO SECTION 13, 15(d), OR 37 OF THE
SECURITIES EXCHANGE ACT OF 1934
For the quarterly period ended June 30, 2023
OR
o TRANSITION REPORT PURSUANT TO SECTION 13 OR 15(d) OF
THE SECURITIES EXCHANGE ACT OF 1934
For the transition period from _____ to _____
Commission file number 000-52313
TENNESSEE VALLEY AUTHORITY
(Exact name of registrant as specified in its charter)
| | | | | | | | | | | |
A corporate agency of the United States created by an act of Congress (State or other jurisdiction of incorporation or organization) | | 62-0474417 (I.R.S. Employer Identification No.) |
| |
400 W. Summit Hill Drive Knoxville, Tennessee (Address of principal executive offices) | | 37902 (Zip Code) |
(865) 632-2101
(Registrant's telephone number, including area code)
None
(Former name, former address and former fiscal year, if changed since last report)
Securities registered pursuant to Section 12(b) of the Act
| | | | | | | | |
| Title of each class | Trading Symbol(s) | Name of each exchange on which registered |
| N/A | N/A | N/A |
Indicate by check mark whether the registrant (1) has filed all reports required to be filed by Section 13, 15(d), or 37 of the Securities Exchange Act of 1934 during the preceding 12 months (or for such shorter period that the registrant was required to file such reports), and (2) has been subject to such filing requirements for the past 90 days.
Yes x No o
Indicate by check mark whether the registrant has submitted electronically every Interactive Data File required to be submitted pursuant to Rule 405 of Regulation S-T (§ 232.405 of this chapter) during the preceding 12 months (or for such shorter period that the registrant was required to submit such files).
Yes x No o
Indicate by check mark whether the registrant is a large accelerated filer, an accelerated filer, a non-accelerated filer, a smaller reporting company, or an emerging growth company. See the definitions of "large accelerated filer," "accelerated filer," "smaller reporting company," and "emerging growth company" in Rule 12b-2 of the Exchange Act.
Large accelerated filer o Accelerated filer o
Non-accelerated filer x Smaller reporting company o
Emerging growth company o
If an emerging growth company, indicate by check mark if the registrant has elected not to use the extended transition period for complying with any new or revised financial accounting standards provided pursuant to Section 13(a) of the Exchange Act. o
Indicate by check mark whether the registrant is a shell company (as defined in Rule 12b-2 of the Exchange Act).
Yes o No x
Number of shares of common stock outstanding at July 31, 2023: N/A
| | | | | |
| Table of Contents |
| | |
| | Page |
GLOSSARY OF COMMON ACRONYMS...................................................................................................................................... | |
FORWARD-LOOKING INFORMATION......................................................................................................................................... | |
GENERAL INFORMATION............................................................................................................................................................ | |
| | |
|
| | |
ITEM 1. FINANCIAL STATEMENTS............................................................................................................................................. | |
| |
| |
| |
| |
| |
| |
| | |
| |
Executive Overview............................................................................................................................................................... | |
Results of Operations............................................................................................................................................................ | |
Liquidity and Capital Resources............................................................................................................................................ | |
| |
| |
| |
| |
Critical Accounting Estimates................................................................................................................................................ | |
| |
| |
| | |
| |
| | |
ITEM 4. CONTROLS AND PROCEDURES.................................................................................................................................. | |
| |
| |
| | |
|
| | |
ITEM 1. LEGAL PROCEEDINGS.................................................................................................................................................. | |
| |
ITEM 1A. RISK FACTORS............................................................................................................................................................ | |
| | |
| |
| |
ITEM 6. EXHIBITS........................................................................................................................................................................ | |
| | |
SIGNATURES............................................................................................................................................................................... | |
| | | | | | | | |
| GLOSSARY OF COMMON ACRONYMS |
Following are definitions of some of the terms or acronyms that may be used in this Quarterly Report on Form 10-Q for the quarter ended June 30, 2023 (the "Quarterly Report"): |
| |
| Term or Acronym | | Definition |
| | |
| | |
| | |
| | |
| AOCI | | Accumulated other comprehensive income (loss) |
| ARO | | Asset retirement obligation |
| ART | | Asset Retirement Trust |
| Bonds | | Bonds, notes, or other evidences of indebtedness |
| | |
| | |
| | |
| Caledonia CC | | Caledonia Combined Cycle Plant |
| CCR | | Coal combustion residuals |
| | |
| | |
| | |
| | |
| COVID-19 | | Coronavirus Disease 2019 |
| | |
| | |
| CTs | | Combustion turbine unit(s) |
| CVA | | Credit valuation adjustment |
| CWA | | Clean Water Act |
| | |
| CY | | Calendar year |
| | |
| DCP | | Deferred Compensation Plan |
| | |
| | |
| | |
| EIS | | Environmental Impact Statement |
| | |
| | |
| EO(s) | | Executive Order(s) |
| EPA | | Environmental Protection Agency |
| | |
| | |
| | |
| | |
| FERC | | Federal Energy Regulatory Commission |
| | |
| FHP | | Financial Hedging Program |
| | |
| GAAP | | Accounting principles generally accepted in the United States of America |
| GAC | | Grid access charge |
| GEH | | GE Hitachi Nuclear Energy |
| GHG | | Greenhouse gas |
| | |
| | |
| | |
| | |
| Holdco | | John Sevier Holdco LLC |
| JSCCG | | John Sevier Combined Cycle Generation LLC |
| | |
| kWh | | Kilowatt hours |
| LPCs | | Local power company customers |
| | |
| | |
| | |
| MLGW | | Memphis Light, Gas and Water Division |
| mmBtu | | Million British thermal unit(s) |
| MtM | | Mark-to-market |
| | |
| MWh | | Megawatt hours |
| | |
| NAV | | Net asset value |
| NDT | | Nuclear Decommissioning Trust |
| NEIL | | Nuclear Electric Insurance Limited |
| NEPA | | National Environmental Policy Act |
| | |
| NES | | Nashville Electric Service |
NOx | | Nitrogen oxides |
| | |
| NRC | | Nuclear Regulatory Commission |
| | |
| | |
| | |
| | |
| | |
| | |
| | |
| | |
| | |
| PPA(s) | | Power Purchase Agreement(s) |
| | |
| QTE | | Qualified technological equipment and software |
| | |
| | |
| RECs | | Renewable Energy Certificates |
| | |
| RFP(s) | | Request(s) for proposals |
| SCCG | | Southaven Combined Cycle Generation LLC |
| SCRs | | Selective catalytic reduction systems |
| SEC | | Securities and Exchange Commission |
| SEEM | | Southeast Energy Exchange Market |
| | | | | | | | |
| SERP | | Supplemental Executive Retirement Plan |
| SHLLC | | Southaven Holdco LLC |
| | |
| | |
| | |
| | |
| | |
| | |
| TVA | | Tennessee Valley Authority |
| TVA Act | | The Tennessee Valley Authority Act of 1933, as amended, 16 U.S.C. §§ 831-831ee |
| TVA Board | | TVA Board of Directors |
| | |
| | |
| U.S. Treasury | | United States Department of the Treasury |
| | |
| | |
| VIE | | Variable interest entity |
| | |
| XBRL | | eXtensible Business Reporting Language |
FORWARD-LOOKING INFORMATION
This Quarterly Report contains forward-looking statements relating to future events and future performance. All statements other than those that are purely historical may be forward-looking statements. In certain cases, forward-looking statements can be identified by the use of words such as "may," "will," "should," "expect," "anticipate," "believe," "intend," "project," "plan," "predict," "assume," "forecast," "estimate," "objective," "possible," "probably," "likely," "potential," "speculate," "aim," "aspiration," "goal," "seek," "strategy," "target," the negative of such words, or other similar expressions.
Although the Tennessee Valley Authority ("TVA") believes that the assumptions underlying any forward-looking statements are reasonable, TVA does not guarantee the accuracy of these statements. Numerous factors could cause actual results to differ materially from those in any forward-looking statements. These factors include, among other things:
•Significant delays and additional costs, and/or inability to obtain necessary regulatory approvals, licenses, or permits, for major projects, including for assets that TVA needs to serve its existing and future load and to meet its carbon reduction aspirations;
•Events at a nuclear facility, whether or not operated by or licensed to TVA, which, among other things, could lead to increased regulation or restriction on the construction, ownership, operation, or decommissioning of nuclear facilities or on the storage of spent fuel, obligate TVA to pay retrospective insurance premiums, reduce the availability and affordability of insurance, increase the costs of operating TVA's existing nuclear units, or cause TVA to forego future construction at these or other facilities;
•Risks associated with the operation of nuclear facilities or other generation and related facilities, including coal combustion residuals ("CCR") facilities;
•Inability to continue to operate certain assets, especially nuclear facilities, including due to the inability to obtain, or loss of, regulatory approval for the operation of assets;
•Significant additional costs for TVA to manage and operate its CCR facilities;
•Physical attacks, threats, or other interference causing damage to TVA's facilities or interfering with TVA's operations;
•The failure of TVA's generation, transmission, navigation, flood control, and related assets and infrastructure, including CCR facilities and spent nuclear fuel storage facilities, to operate as anticipated, resulting in lost revenues, damages, or other costs that are not reflected in TVA's financial statements or projections, including due to aging or technological issues;
•Costs or liabilities that are not anticipated in TVA's financial statements for third-party claims, natural resource damages, environmental cleanup activities, or fines or penalties associated with unexpected events such as failures of a facility or infrastructure;
•Events at a TVA facility, which, among other things, could result in loss of life, damage to the environment, damage to or loss of the facility, or damage to the property of others;
•Events that negatively impact TVA's reliability, including from problems at other utilities or at TVA facilities or the increase in intermittent sources of power;
•Events or changes involving transmission lines, dams, and other facilities not operated by TVA, including those that affect the reliability of the interstate transmission grid of which TVA's transmission system is a part and those that increase flows across TVA's transmission grid;
•Disruption of supplies of fuel, purchased power, or other critical items or services, which may result from, among other things, economic conditions, weather conditions, physical or cyber attacks, political developments, international trade restrictions or tariffs, legal actions, mine closures or reduced mine production, increases in fuel exports, environmental regulations affecting TVA's suppliers, transportation or delivery constraints, shortages of raw materials, supply chain difficulties, labor shortages, strikes, inflation, or similar events and which may, among other things, hinder TVA's ability to operate its assets and to complete projects on time and on budget;
•Circumstances that cause TVA to change its determinations regarding the appropriate mix of generation assets;
•Costs or other challenges resulting from a failure by TVA to meet its carbon reduction aspirations;
•New, amended, or existing laws, regulations, executive orders ("EOs"), or administrative orders or interpretations, including those related to climate change and other environmental matters, and the costs of complying with these laws, regulations, EOs, or administrative orders or interpretations;
•The cost of complying with known, anticipated, or new environmental requirements, some of which could render continued operation of many of TVA's aging coal-fired generation units not cost-effective or result in their removal from service, perhaps permanently;
•Actions taken, or inaction, by the United States ("U.S.") government relating to the national debt ceiling or automatic spending cuts in government programs;
•Inability to respond quickly enough to current or potential customer demands or needs or to act solely in the interest of ratepayers;
•Negative outcomes of current or future legal or administrative proceedings;
•Federal legislation aimed specifically at curtailing TVA's activities, including legislation that may cause TVA to lose its protected service territory, its sole authority to set rates, or its authority to manage the Tennessee River system or the real property currently entrusted to TVA; subject TVA to additional environmental regulation or additional requirements of the North American Electric Reliability Corporation; require the divestiture of TVA or the sale of certain of TVA's assets; lower the debt ceiling on bonds, notes, or other evidences of indebtedness (collectively, "Bonds") specified in the Tennessee Valley Authority Act of 1933, as amended, 16 U.S.C. §§ 831-831ee ("TVA Act"); or restrict TVA's access to its
funds;
•Cyber attacks on TVA's assets or the assets of third parties upon which TVA relies;
•Other unforeseeable occurrences negatively impacting TVA assets or their supporting infrastructure;
•The need for significant future contributions associated with TVA's pension plans, other post-retirement benefit plans, or health care plans;
•Increases in TVA's financial liabilities for decommissioning its nuclear facilities and retiring other assets;
•The requirement or decision to make additional contributions to TVA's Nuclear Decommissioning Trust ("NDT") or Asset Retirement Trust ("ART");
•Differences between estimates of revenues and expenses and actual revenues earned and expenses incurred;
•Limitations on TVA's ability to borrow money, which may result from, among other things, TVA's approaching or substantially reaching the debt ceiling or TVA's losing access to the debt markets, and which may impact TVA's ability to make planned capital investments;
•An increase in TVA's cost of capital, which may result from, among other things, changes in the market for Bonds, disruptions in the banking system or financial markets, changes in the credit rating of TVA or the U.S. government, or, potentially, an increased reliance by TVA on alternative financing should TVA approach its debt limit;
•The inaccuracy of certain assumptions about the future, including economic forecasts, anticipated energy and commodity prices, cost estimates, construction schedules, power demand forecasts, the appropriate generation mix to meet demand, and assumptions about potential regulatory environments;
•Significant decline in the demand for electricity that TVA produces, which may result from, among other things, economic downturns or recessions, loss of customers, reductions in demand for electricity generated from non-renewable sources or centrally located generation sources, increased utilization of distributed energy resources, increased energy efficiency and conservation, or improvements in alternative generation and energy storage technologies;
•Changes in customer preferences for energy produced from cleaner generation sources;
•Addition or loss of customers by TVA or TVA's local power company customers ("LPCs");
•Potential for increased demand for energy resulting from, among other things, an increase in the population of TVA's service area;
•Changes in technology, which, among other things, may affect relationships with customers and require TVA to change how it conducts its operations;
•Changes in the economy and volatility in financial markets;
•Reliability or creditworthiness of counterparties including but not limited to customers, suppliers, renewable resource providers, and financial institutions;
•Changes in the market price of commodities such as purchased power, coal, uranium, natural gas, fuel oil, crude oil, construction materials, reagents, or emission allowances;
•Changes in the market price of equity securities, debt securities, or other investments;
•Changes in interest rates, currency exchange rates, or inflation rates;
•Failure to attract or retain an appropriately qualified, diverse, and inclusive workforce;
•Changes in the membership of the TVA Board of Directors ("TVA Board") or TVA senior management, which may impact how TVA operates;
•Weather conditions, including changing weather patterns, extreme weather conditions, and other events such as flooding, droughts, wildfires, and snow or ice storms that may result from climate change, which may hamper TVA's ability to supply power, cause customers' demand for power to exceed TVA's then-present power supply, or otherwise negatively impact net revenue;
•Events affecting the supply or quality of water from the Tennessee River system or Cumberland River system, or elsewhere, which could interfere with TVA's ability to generate power;
•Catastrophic events, such as fires, earthquakes, explosions, solar events, electromagnetic pulses, geomagnetic disturbances, droughts, floods, hurricanes, tornadoes, polar vortexes, icing events, or other casualty events, wars, national emergencies, terrorist activities, pandemics, or other similar destructive or disruptive events;
•Inability to use regulatory accounting for certain costs;
•Ineffectiveness of TVA's financial control system to control issues and instances of fraud or to detect errors;
•Ineffectiveness of TVA's disclosure controls and procedures or its internal control over financial reporting;
•Adverse effects from the Coronavirus Disease 2019 ("COVID-19") or future pandemics;
•Inability of TVA to implement its business strategy successfully, including due to the increased use in the public of distributed energy resources or energy-efficiency programs;
•Inability of TVA to adapt its business model to changes in the utility industry and customer preferences and to remain cost competitive;
•Loss of quorum of the TVA Board, which may limit TVA's ability to adapt to meet changing business conditions;
•Negative impacts on TVA's reputation; or
•Other unforeseeable events.
See also Part I, Item 1A, Risk Factors, and Part II, Item 7, Management's Discussion and Analysis of Financial Condition and Results of Operations in TVA's Annual Report on Form 10-K for the year ended September 30, 2022 (the "Annual Report"), and Part I, Item 2, Management's Discussion and Analysis of Financial Condition and Results of Operations in this Quarterly Report for a discussion of factors that could cause actual results to differ materially from those in any forward-looking statement. New factors emerge from time to time, and it is not possible for TVA to predict all such factors or to assess the extent to which any factor or combination of factors may impact TVA's business or cause results to differ materially from those contained
in any forward-looking statement. TVA undertakes no obligation to update any forward-looking statement to reflect developments that occur after the statement is made, except as required by law.
GENERAL INFORMATION
Fiscal Year
References to years (2023, 2022, etc.) in this Quarterly Report are to TVA's fiscal years ending September 30. Years that are preceded by "CY" are references to calendar years.
Notes
References to "Notes" are to the Notes to Consolidated Financial Statements contained in Part I, Item 1, Financial Statements in this Quarterly Report.
Available Information
TVA files annual, quarterly, and current reports with the Securities and Exchange Commission ("SEC") under Section 37 of the Securities Exchange Act of 1934 (the "Exchange Act"). TVA's SEC filings are available to the public at www.tva.com, free of charge, as soon as reasonably practicable after such reports are electronically filed with or furnished to the SEC. Information contained on or accessible through TVA's website shall not be deemed to be incorporated into, or to be a part of, this Quarterly Report or any other report or document that TVA files with the SEC. All TVA SEC reports are available to the public without charge from the website maintained by the SEC at www.sec.gov.
PART I - FINANCIAL INFORMATION
ITEM 1. FINANCIAL STATEMENTS
TENNESSEE VALLEY AUTHORITY
CONSOLIDATED BALANCE SHEETS (Unaudited)
(in millions)
| | | | | | | | | | | |
| ASSETS |
| | June 30, 2023 | | September 30, 2022 |
| Current assets | | | |
| Cash and cash equivalents | $ | 500 | | | $ | 500 | |
| | | |
| | | |
| Accounts receivable, net | 1,603 | | | 2,007 | |
| Inventories, net | 1,185 | | | 1,072 | |
| Regulatory assets | 236 | | | 138 | |
| Other current assets | 161 | | | 257 | |
| Total current assets | 3,685 | | | 3,974 | |
| | | |
| Property, plant, and equipment | | | |
| Completed plant | 67,229 | | | 66,442 | |
| Less accumulated depreciation | (35,223) | | | (34,239) | |
| Net completed plant | 32,006 | | | 32,203 | |
| Construction in progress | 3,161 | | | 2,535 | |
| Nuclear fuel | 1,410 | | | 1,492 | |
| Finance leases | 584 | | | 630 | |
| Total property, plant, and equipment, net | 37,161 | | | 36,860 | |
| | | |
| Investment funds | 4,202 | | | 3,671 | |
| | | |
| Regulatory and other long-term assets | | | |
| Regulatory assets | 5,666 | | | 6,134 | |
| Operating lease assets, net of amortization | 165 | | | 155 | |
| Other long-term assets | 334 | | | 394 | |
| Total regulatory and other long-term assets | 6,165 | | | 6,683 | |
| | | |
| Total assets | $ | 51,213 | | | $ | 51,188 | |
| The accompanying notes are an integral part of these consolidated financial statements. |
TENNESSEE VALLEY AUTHORITY
CONSOLIDATED BALANCE SHEETS (Unaudited)
(in millions)
| | | | | | | | | | | |
| LIABILITIES AND PROPRIETARY CAPITAL |
| June 30, 2023 | | September 30, 2022 |
| Current liabilities | | | |
| Accounts payable and accrued liabilities | $ | 2,431 | | | $ | 2,466 | |
| | | |
| Accrued interest | 252 | | | 273 | |
| Asset retirement obligations | 262 | | | 275 | |
| | | |
| | | |
| Regulatory liabilities | 224 | | | 391 | |
| Short-term debt, net | 722 | | | 1,172 | |
| Current maturities of power bonds | 22 | | | 29 | |
| Current maturities of long-term debt of variable interest entities | 35 | | | 39 | |
| | | |
| Total current liabilities | 3,948 | | | 4,645 | |
| | | |
| Other liabilities | | | |
| Post-retirement and post-employment benefit obligations | 2,909 | | | 3,072 | |
| Asset retirement obligations | 6,860 | | | 6,887 | |
| Finance lease liabilities | 594 | | | 628 | |
| Other long-term liabilities | 1,425 | | | 1,485 | |
| | | |
| Regulatory liabilities | 59 | | | 172 | |
| Total other liabilities | 11,847 | | | 12,244 | |
| | | |
| Long-term debt, net | | | |
| Long-term power bonds, net | 18,861 | | | 17,826 | |
| Long-term debt of variable interest entities, net | 951 | | | 968 | |
| | | |
| Total long-term debt, net | 19,812 | | | 18,794 | |
| | | |
| Total liabilities | 35,607 | | | 35,683 | |
| | | |
Contingencies and legal proceedings (Note 20) | | | |
| | | |
| Proprietary capital | | | |
| Power program appropriation investment | 258 | | | 258 | |
| Power program retained earnings | 14,893 | | | 14,800 | |
| Total power program proprietary capital | 15,151 | | | 15,058 | |
| Nonpower programs appropriation investment, net | 527 | | | 533 | |
| Accumulated other comprehensive loss | (72) | | | (86) | |
| Total proprietary capital | 15,606 | | | 15,505 | |
| | | |
| Total liabilities and proprietary capital | $ | 51,213 | | | $ | 51,188 | |
| The accompanying notes are an integral part of these consolidated financial statements. |
TENNESSEE VALLEY AUTHORITY
CONSOLIDATED STATEMENTS OF OPERATIONS (Unaudited)
(in millions)
| | | | | | | | | | | | | | | | | | | | | | | |
| | Three Months Ended June 30 | | Nine Months Ended June 30 |
| | 2023 | | 2022 | | 2023 | | 2022 |
| Operating revenues | | | | | | | |
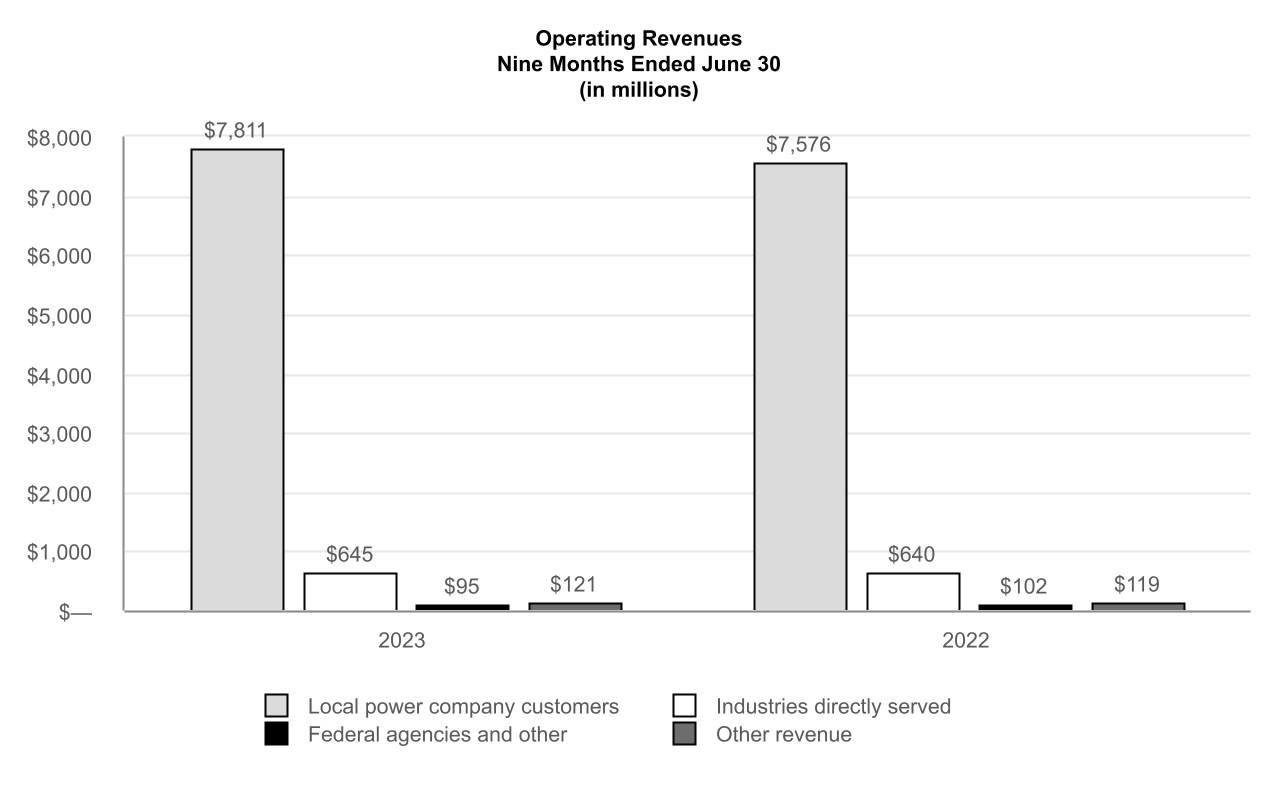
| Revenue from sales of electricity | $ | 2,664 | | | $ | 2,932 | | | $ | 8,551 | | | $ | 8,318 | |
| Other revenue | 34 | | | 38 | | | 121 | | | 119 | |
| Total operating revenues | 2,698 | | | 2,970 | | | 8,672 | | | 8,437 | |
| Operating expenses | | | | | | | |
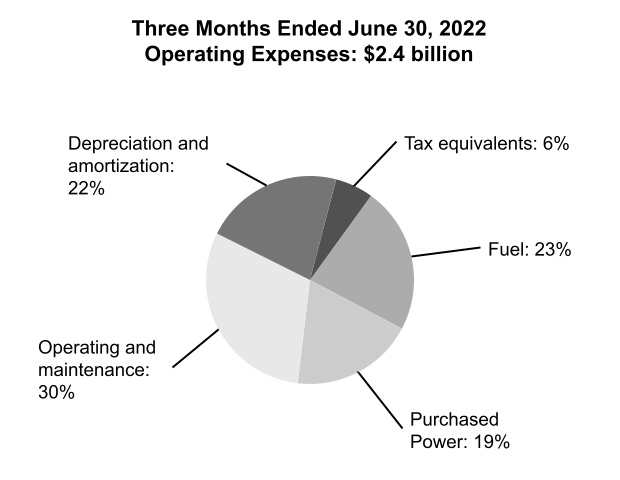
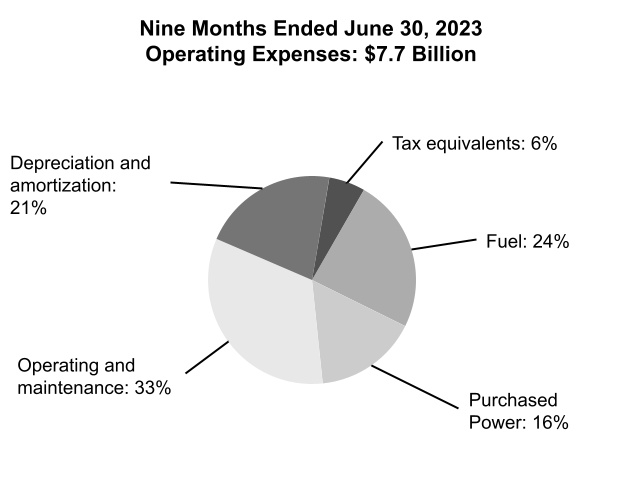
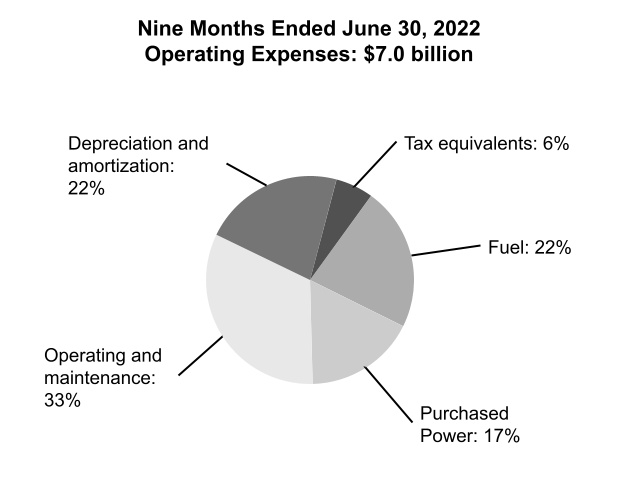
| Fuel | 530 | | | 539 | | | 1,845 | | | 1,563 | |
| Purchased power | 350 | | | 465 | | | 1,234 | | | 1,208 | |
| Operating and maintenance | 896 | | | 722 | | | 2,546 | | | 2,269 | |
| Depreciation and amortization | 548 | | | 513 | | | 1,631 | | | 1,535 | |
| Tax equivalents | 137 | | | 141 | | | 435 | | | 412 | |
| Total operating expenses | 2,461 | | | 2,380 | | | 7,691 | | | 6,987 | |
| Operating income | 237 | | | 590 | | | 981 | | | 1,450 | |
| Other income (expense), net | 20 | | | (6) | | | 57 | | | 11 | |
| Other net periodic benefit cost | 51 | | | 64 | | | 153 | | | 194 | |
| Interest expense | 264 | | | 264 | | | 794 | | | 791 | |
| Net income (loss) | $ | (58) | | | $ | 256 | | | $ | 91 | | | $ | 476 | |
| The accompanying notes are an integral part of these consolidated financial statements. |
TENNESSEE VALLEY AUTHORITY
CONSOLIDATED STATEMENTS OF COMPREHENSIVE INCOME (LOSS) (Unaudited)
(in millions)
| | | | | | | | | | | | | | | | | | | | | | | |
| | Three Months Ended June 30 | | Nine Months Ended June 30 |
| | 2023 | | 2022 | | 2023 | | 2022 |
| Net income (loss) | $ | (58) | | | $ | 256 | | | $ | 91 | | | $ | 476 | |
| Other comprehensive income (loss) | | | | | | | |
| Net unrealized gain (loss) on cash flow hedges | 5 | | | (40) | | | 79 | | | (50) | |
| Net unrealized (gain) loss reclassified to earnings from cash flow hedges | (22) | | | 34 | | | (65) | | | 50 | |
| Total other comprehensive income (loss) | (17) | | | (6) | | | 14 | | | — | |
| Total comprehensive income (loss) | $ | (75) | | | $ | 250 | | | $ | 105 | | | $ | 476 | |
| The accompanying notes are an integral part of these consolidated financial statements. |
TENNESSEE VALLEY AUTHORITY
CONSOLIDATED STATEMENTS OF CASH FLOWS (Unaudited)
For the Nine Months Ended June 30
(in millions)
| | | | | | | | | | | |
| | 2023 | | 2022 |
| Cash flows from operating activities | | | |
| Net income | $ | 91 | | | $ | 476 | |
| Adjustments to reconcile net income to net cash provided by operating activities | | | |
Depreciation and amortization(1) | 1,647 | | | 1,551 | |
| Amortization of nuclear fuel cost | 268 | | | 252 | |
| Non-cash retirement benefit expense | 186 | | | 246 | |
| | | |
| Other regulatory amortization and deferrals | 26 | | | (203) | |
| | | |
| | | |
| | | |
| Changes in current assets and liabilities | | | |
| Accounts receivable, net | 401 | | | (184) | |
| Inventories and other current assets, net | (190) | | | (131) | |
| Accounts payable and accrued liabilities | (120) | | | 298 | |
| Accrued interest | (24) | | | (34) | |
| | | |
| Pension contributions | (231) | | | (233) | |
| | | |
| | | |
| | | |
| Other, net | (278) | | | (204) | |
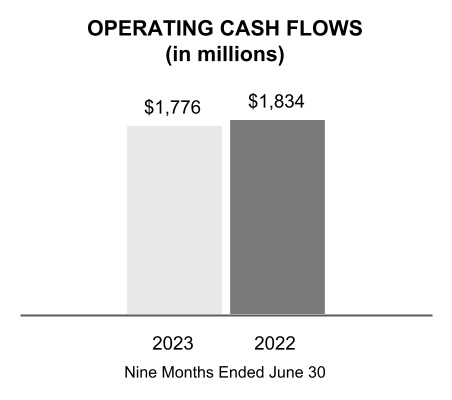
| Net cash provided by operating activities | 1,776 | | | 1,834 | |
| | | |
| Cash flows from investing activities | | | |
| Construction expenditures | (1,825) | | | (1,772) | |
| | | |
| Nuclear fuel expenditures | (267) | | | (235) | |
| | | |
| Acquisition of leasehold interests in combustion turbine assets | (155) | | | — | |
| Loans and other receivables | | | |
| Advances | (7) | | | (9) | |
| Repayments | 6 | | | 12 | |
| Other, net | 15 | | | 26 | |
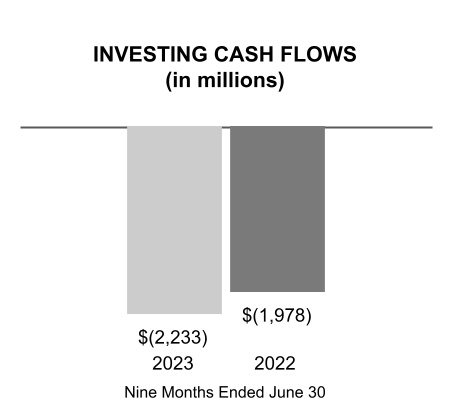
| Net cash used in investing activities | (2,233) | | | (1,978) | |
| | | |
| Cash flows from financing activities | | | |
| Long-term debt | | | |
| Issues of power bonds | 992 | | | — | |
| | | |
| Redemptions and repurchases of power bonds | (29) | | | (28) | |
| | | |
| Redemptions of debt of variable interest entities | (22) | | | (21) | |
| Short-term debt issues (redemptions), net | (450) | | | 254 | |
| Payments on leases and leasebacks | (36) | | | (63) | |
| | | |
| Financing costs, net | (4) | | | — | |
| | | |
| | | |
| | | |
| Other, net | 6 | | | 5 | |
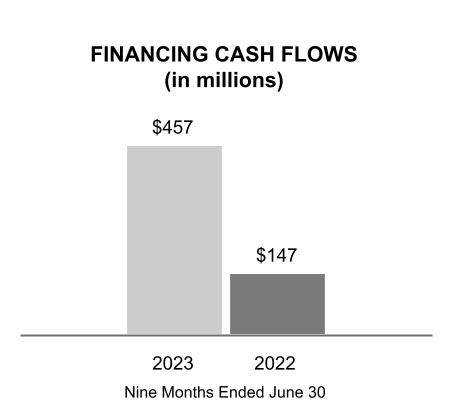
| Net cash provided by financing activities | 457 | | | 147 | |
| Net change in cash, cash equivalents, and restricted cash | — | | | 3 | |
| Cash, cash equivalents, and restricted cash at beginning of period | 520 | | | 518 | |
| Cash, cash equivalents, and restricted cash at end of period | $ | 520 | | | $ | 521 | |
| | | |
| | | |
| | | |
| | | |
| | | |
Note (1) Includes amortization of debt issuance costs and premiums/discounts. |
| The accompanying notes are an integral part of these consolidated financial statements. |
TENNESSEE VALLEY AUTHORITY
CONSOLIDATED STATEMENTS OF CHANGES IN PROPRIETARY CAPITAL (Unaudited)
For the Three Months Ended June 30, 2023 and 2022
(in millions)
| | | | | | | | | | | | | | | | | | | | | | | | | | | | | |
| | Power Program Appropriation Investment | |
Power Program Retained Earnings | | Nonpower Programs Appropriation Investment, Net | | Accumulated
Other
Comprehensive
Loss | |
Total |
| Balance at March 31, 2022 | $ | 258 | | | $ | 13,910 | | | $ | 537 | | | $ | (16) | | | $ | 14,689 | |
| Net income (loss) | — | | | 258 | | | (2) | | | — | | | 256 | |
| Total other comprehensive loss | — | | | — | | | — | | | (6) | | | (6) | |
| Return on power program appropriation investment | — | | | (1) | | | — | | | — | | | (1) | |
| | | | | | | | | |
Balance at June 30, 2022 | $ | 258 | | | $ | 14,167 | | | $ | 535 | | | $ | (22) | | | $ | 14,938 | |
| | | | | | | | | |
| Balance at March 31, 2023 | $ | 258 | | | $ | 14,950 | | | $ | 529 | | | $ | (55) | | | $ | 15,682 | |
| Net loss | — | | | (56) | | | (2) | | | — | | | (58) | |
| Total other comprehensive loss | — | | | — | | | — | | | (17) | | | (17) | |
| Return on power program appropriation investment | — | | | (1) | | | — | | | — | | | (1) | |
Balance at June 30, 2023 | $ | 258 | | | $ | 14,893 | | | $ | 527 | | | $ | (72) | | | $ | 15,606 | |
The accompanying notes are an integral part of these consolidated financial statements. |
TENNESSEE VALLEY AUTHORITY
CONSOLIDATED STATEMENTS OF CHANGES IN PROPRIETARY CAPITAL (Unaudited)
For the Nine Months Ended June 30, 2023 and 2022
| | | | | | | | | | | | | | | | | | | | | | | | | | | | | |
| | Power Program Appropriation Investment | |
Power Program Retained Earnings | | Nonpower Programs Appropriation Investment, Net | | Accumulated
Other
Comprehensive
Income (Loss) | |
Total |
| Balance at September 30, 2021 | $ | 258 | | | $ | 13,689 | | | $ | 540 | | | $ | (22) | | | $ | 14,465 | |
| Net income (loss) | — | | | 481 | | | (5) | | | — | | | 476 | |
| | | | | | | | | |
| Return on power program appropriation investment | — | | | (3) | | | — | | | — | | | (3) | |
| | | | | | | | | |
Balance at June 30, 2022 | $ | 258 | | | $ | 14,167 | | | $ | 535 | | | $ | (22) | | | $ | 14,938 | |
| | | | | | | | | |
| Balance at September 30, 2022 | $ | 258 | | | $ | 14,800 | | | $ | 533 | | | $ | (86) | | | $ | 15,505 | |
| Net income (loss) | — | | | 97 | | | (6) | | | — | | | 91 | |
| Total other comprehensive income | — | | | — | | | — | | | 14 | | | 14 | |
| Return on power program appropriation investment | — | | | (4) | | | — | | | — | | | (4) | |
Balance at June 30, 2023 | $ | 258 | | | $ | 14,893 | | | $ | 527 | | | $ | (72) | | | $ | 15,606 | |
The accompanying notes are an integral part of these consolidated financial statements. |
NOTES TO CONSOLIDATED FINANCIAL STATEMENTS (Unaudited)
(Dollars in millions except where noted)
| | | | | | | | | | | |
| Note | Page |
| 1 | | Summary of Significant Accounting Policies | |
| 2 | | Impact of New Accounting Standards and Interpretations | |
| 3 | | Accounts Receivable, Net | |
| 4 | | Inventories, Net | |
| 5 | | Other Current Assets | |
| 6 | | Plant Closures | |
| | | |
| 7 | | Other Long-Term Assets | |
| 8 | | Regulatory Assets and Liabilities | |
| 9 | | Variable Interest Entities | |
| 10 | | Other Long-Term Liabilities | |
| 11 | | Asset Retirement Obligations | |
| 12 | | Debt and Other Obligations | |
| | | |
| 13 | | Risk Management Activities and Derivative Transactions | |
| 14 | | Fair Value Measurements | |
| 15 | | Revenue | |
| 16 | | Other Income (Expense), Net | |
| 17 | | Supplemental Cash Flow Information | |
| 18 | | Benefit Plans | |
| 19 | | Collaborative Arrangement | |
| 20 | | Contingencies and Legal Proceedings | |
| | | |
1. Summary of Significant Accounting Policies
General
The Tennessee Valley Authority ("TVA") is a corporate agency and instrumentality of the United States ("U.S.") that was created in 1933 by federal legislation in response to a proposal by President Franklin D. Roosevelt. TVA was created to, among other things, improve navigation on the Tennessee River, reduce the damage from destructive flood waters within the Tennessee River system and downstream on the lower Ohio and Mississippi Rivers, further the economic development of TVA's service area in the southeastern U.S., and sell the electricity generated at the facilities TVA operates. Today, TVA operates the nation's largest public power system and supplies power in most of Tennessee, northern Alabama, northeastern Mississippi, and southwestern Kentucky and in portions of northern Georgia, western North Carolina, and southwestern Virginia to a population of approximately 10 million people.
TVA also manages the Tennessee River, its tributaries, and certain shorelines to provide, among other things, year-round navigation, flood damage reduction, and affordable and reliable electricity. Consistent with these primary purposes, TVA also manages the river system and public lands to provide recreational opportunities, adequate water supply, improved water quality, cultural and natural resource protection, and economic development. TVA performs these management duties in cooperation with other federal and state agencies that have jurisdiction and authority over certain aspects of the river system. In addition, the TVA Board of Directors ("TVA Board") has established two councils — the Regional Resource Stewardship Council and the Regional Energy Resource Council — to advise TVA on its stewardship activities in the Tennessee Valley and its energy resource activities.
The power program has historically been separate and distinct from the stewardship programs. It is required to be self-supporting from power revenues and proceeds from power financings, such as proceeds from the issuance of bonds, notes, or other evidences of indebtedness (collectively, "Bonds"). Although TVA does not currently receive Congressional appropriations, it is required to make annual payments to the United States Department of the Treasury ("U.S. Treasury") as a return on the government's appropriation investment in TVA's power facilities (the "Power Program Appropriation Investment"). In the 1998 Energy and Water Development Appropriations Act, Congress directed TVA to fund essential stewardship activities related to its management of the Tennessee River system and nonpower or stewardship properties with power revenues in the event that there were insufficient appropriations or other available funds to pay for such activities in any fiscal year. Congress has not provided any appropriations to TVA to fund such activities since 1999. Consequently, during 2000, TVA began paying for essential stewardship activities primarily with power revenues, with the remainder funded with user fees and other forms of revenues derived in connection with those activities. The activities related to stewardship properties do not meet the criteria of
an operating segment under accounting principles generally accepted in the United States of America ("GAAP"). Accordingly, these assets and properties are included as part of the power program, TVA's only operating segment.
Power rates are established by the TVA Board as authorized by the Tennessee Valley Authority Act of 1933, as amended, 16 U.S.C. §§ 831-831ee ("TVA Act"). The TVA Act requires TVA to charge rates for power that will produce gross revenues sufficient to provide funds for operation, maintenance, and administration of its power system; payments to states and counties in lieu of taxes ("tax equivalents"); debt service on outstanding indebtedness; payments to the U.S. Treasury in repayment of and as a return on the Power Program Appropriation Investment; and such additional margin as the TVA Board may consider desirable for investment in power system assets, retirement of outstanding Bonds in advance of maturity, additional reduction of the Power Program Appropriation Investment, and other purposes connected with TVA's power business. TVA fulfilled its requirement to repay $1.0 billion of the Power Program Appropriation Investment with the 2014 payment; therefore, this repayment obligation is no longer a component of rate setting. In setting TVA's rates, the TVA Board is charged by the TVA Act to have due regard for the primary objectives of the TVA Act, including the objective that power shall be sold at rates as low as are feasible. Rates set by the TVA Board are not subject to review or approval by any state or other federal regulatory body.
Fiscal Year
TVA's fiscal year ends September 30. Years (2023, 2022, etc.) refer to TVA's fiscal years unless they are preceded by "CY," in which case the references are to calendar years.
Cost-Based Regulation
Since the TVA Board is authorized by the TVA Act to set rates for power sold to its customers, TVA is self-regulated. Additionally, TVA's regulated rates are designed to recover its costs. Based on current projections, TVA believes that rates, set at levels that will recover TVA's costs, can be charged and collected. As a result of these factors, TVA records certain assets and liabilities that result from the regulated ratemaking process that would not be recorded under GAAP for non-regulated entities. Regulatory assets generally represent incurred costs that have been deferred because such costs are probable of future recovery in customer rates. Regulatory liabilities generally represent obligations to make refunds to customers for previous collections for costs that are not likely to be incurred or deferral of gains that will be credited to customers in future periods. TVA assesses whether the regulatory assets are probable of future recovery by considering factors such as applicable regulatory changes, potential legislation, and changes in technology. Based on these assessments, TVA believes the existing regulatory assets are probable of recovery. This determination reflects the current regulatory and political environment and is subject to change in the future. If future recovery of regulatory assets ceases to be probable, or TVA is no longer considered to be a regulated entity, then costs would be required to be written off. All regulatory asset write-offs would be required to be recognized in earnings in the period in which future recovery ceases to be probable.
Basis of Presentation
TVA prepares its consolidated interim financial statements in conformity with GAAP for consolidated interim financial information. Accordingly, TVA's consolidated interim financial statements do not include all of the information and notes required by GAAP for annual financial statements. As such, they should be read in conjunction with the audited financial statements for the year ended September 30, 2022, and the notes thereto, which are contained in TVA's Annual Report on Form 10-K for the year ended September 30, 2022 (the "Annual Report"). In the opinion of management, all adjustments (consisting of items of a normal recurring nature) considered necessary for fair presentation are included on the consolidated interim financial statements.
The accompanying consolidated interim financial statements, which have been prepared in accordance with GAAP, include the accounts of TVA and variable interest entities ("VIEs") of which TVA is the primary beneficiary. See Note 9 — Variable Interest Entities. Intercompany balances and transactions have been eliminated in consolidation.
Use of Estimates
The preparation of financial statements requires TVA to estimate the effects of various matters that are inherently uncertain as of the date of the consolidated financial statements. Although the consolidated financial statements are prepared in conformity with GAAP, TVA is required to make estimates and assumptions that affect the reported amounts of assets and liabilities, the disclosure of contingent assets and liabilities, and the amounts of revenues and expenses, reported during the reporting period. Each of these estimates varies in regard to the level of judgment involved and its potential impact on TVA's financial results. Estimates are considered critical either when a different estimate could have reasonably been used, or where changes in the estimate are reasonably likely to occur from period to period, and such use or change would materially impact TVA's financial condition, results of operations, or cash flows.
Cash, Cash Equivalents, and Restricted Cash
Cash includes cash on hand, non-interest bearing cash, and deposit accounts. All highly liquid investments with original maturities of three months or less are considered cash equivalents. Cash and cash equivalents that are restricted, as to
withdrawal or use under the terms of certain contractual agreements, are recorded in Other long-term assets on the Consolidated Balance Sheets. Restricted cash and cash equivalents include cash held in trusts that are currently restricted for TVA economic development loans and for certain TVA environmental programs in accordance with agreements related to compliance with certain environmental regulations.
The following table provides a reconciliation of cash, cash equivalents, and restricted cash reported on the Consolidated Balance Sheets and Consolidated Statements of Cash Flows:
| | | | | | | | | | | |
Cash, Cash Equivalents, and Restricted Cash (in millions) |
| | At June 30, 2023 | | At September 30, 2022 |
| Cash and cash equivalents | $ | 500 | | | $ | 500 | |
| | | |
| Restricted cash and cash equivalents included in Other long-term assets | 20 | | | 20 | |
| Total cash, cash equivalents, and restricted cash | $ | 520 | | | $ | 520 | |
Allowance for Uncollectible Accounts
TVA recognizes an allowance that reflects the current estimate for credit losses expected to be incurred over the life of the financial assets based on historical experience, current conditions, and reasonable and supportable forecasts that affect the collectability of the reported amounts. The appropriateness of the allowance is evaluated at the end of each reporting period.
To determine the allowance for trade receivables, TVA considers historical experience and other currently available information, including events such as customer bankruptcy and/or a customer failing to fulfill payment arrangements by the due date. TVA's corporate credit department also performs an assessment of the financial condition of customers and the credit quality of the receivables. In addition, TVA reviews other reasonable and supportable forecasts to determine if the allowance for uncollectible amounts should be further adjusted in accordance with the accounting guidance for Current Expected Credit Losses.
To determine the allowance for loans receivables, TVA aggregates loans into the appropriate pools based on the existence of similar risk characteristics such as collateral types and internal assessed credit risks. In situations where a loan exhibits unique risk characteristics and is no longer expected to experience similar risks to the rest of its pool, the loan will be evaluated separately. TVA derives an annual loss rate based on historical loss and then adjusts the rate to reflect TVA's consideration of available information on current conditions and reasonable and supportable future forecasts. This information may include economic and business conditions, default trends, and other internal and external factors. For periods beyond the reasonable and supportable forecast period, TVA uses the current calculated long-term average historical loss rate for the remaining life of the loan portfolio.
The allowance for uncollectible accounts was less than $1 million at both June 30, 2023, and September 30, 2022, for trade accounts receivable. Additionally, loans receivable of $135 million and $105 million at June 30, 2023, and September 30, 2022, respectively, are included in Accounts receivable, net and Other long-term assets, for the current and long-term portions, respectively. Loans receivables are reported net of allowances for uncollectible accounts of $3 million at both June 30, 2023 and September 30, 2022.
Inventories
Certain Fuel, Materials, and Supplies. Materials and supplies inventories are valued using an average unit cost method. A new average cost is computed after each inventory purchase transaction, and inventory issuances are priced at the latest moving weighted average unit cost. Coal, fuel oil, and natural gas inventories are valued using an average cost method. A new weighted average cost is computed monthly, and monthly issues are priced accordingly.
Renewable Energy Certificates. TVA accounts for Renewable Energy Certificates ("RECs") using the specific identification cost method. RECs that are acquired through power purchases are recorded as inventory and charged to purchased power expense when the RECs are subsequently used or sold. TVA assigns a value to the RECs at the inception of the power purchase arrangement using a relative standalone selling price approach. RECs created through TVA-owned asset generation are recorded at zero cost.
Emission Allowances. TVA accounts for emission allowances using the specific identification cost method. Allowances that are acquired through third party purchases are recorded as inventory at cost and charged to operating expense based on tons emitted during the respective compliance periods.
Allowance for Inventory Obsolescence. TVA reviews materials and supplies inventories by category and usage on a periodic basis. Each category is assigned a probability of becoming obsolete based on the type of material and historical usage
data. TVA has a fleet-wide inventory management policy for each generation type. Based on the estimated value of the inventory, TVA adjusts its allowance for inventory obsolescence.
Revenues
TVA recognizes revenue from contracts with customers to depict the transfer of goods or services to customers in an amount to which the entity expects to be entitled in exchange for those goods or services. For the generation and transmission of electricity, this is generally at the time the power is delivered to a metered customer delivery point for the customer's consumption or distribution. As a result, revenues from power sales are recorded as electricity is delivered to customers. In addition to power sales invoiced and recorded during the month, TVA accrues estimated unbilled revenues for power sales provided to five customers whose billing date occurs prior to the end of the month. Exchange power sales are presented in the accompanying Consolidated Statements of Operations as a component of sales of electricity. Exchange power sales are sales of excess power after meeting TVA native load and directly served requirements. Native load refers to the customers on whose behalf a company, by statute, franchise, regulatory requirement, or contract, has undertaken an obligation to serve. TVA engages in other arrangements in addition to power sales. Certain other revenue from activities related to TVA's overall mission is recorded in Other revenue. Revenues that are not related to the overall mission are recorded in Other income (expense), net.
Pre-Commercial Plant Operations
As part of the process of completing the construction of a generating unit, the electricity produced is used to serve the demands of the electric system. TVA estimates revenues earned during pre-commercial operations at the fair value of the energy delivered based on TVA's hourly incremental dispatch cost. Colbert combustion turbine units 9-10 commenced pre-commercial plant operations in June 2023 and became operational on July 25, 2023. Estimated revenue of less than $1 million related to this project was capitalized to offset project costs for the three and nine months ended June 30, 2023. TVA also capitalized related fuel costs for this project of $1 million for the three and nine months ended June 30, 2023.
Depreciation
TVA accounts for depreciation of its properties using the composite depreciation convention of accounting. Under the composite method, assets with similar economic characteristics are grouped and depreciated as one asset. Depreciation is generally computed on a straight-line basis over the estimated service lives of the various classes of assets. The estimation of asset useful lives requires management judgment, supported by external depreciation studies of historical asset retirement experience. Depreciation rates are determined based on external depreciation studies that are updated at least every five years, with the latest study implemented during the first quarter of 2022. Depreciation expense was $482 million and $459 million for the three months ended June 30, 2023 and 2022, respectively. Depreciation expense was $1.4 billion for both the nine months ended June 30, 2023 and 2022. See Note 6 — Plant Closures for a discussion of the impact of plant closures.
2. Impact of New Accounting Standards and Interpretations
The following accounting standards have been issued but, at June 30, 2023, were not effective and had not been adopted by TVA:
| | | | | |
|
| |
| |
| |
|
|
| |
| |
| |
|
|
| |
| |
| |
|
|
| |
| |
| |
|
|
| |
| |
| |
|
Accounting for Contract Assets and Contract Liabilities from Contracts with Customers |
| Description | This guidance requires an entity (acquirer) to recognize and measure contract assets and contract liabilities acquired in a business combination in accordance with revenue with customers. It is expected that an acquirer will generally recognize and measure acquired contract assets and contract liabilities in a manner consistent with how the acquiree recognized and measured contract assets and contract liabilities in the acquiree’s financial statements. The entity should apply the standard prospectively to business combinations occurring on or after the effective date of the standard. |
| Effective Date for TVA | This new standard is effective for TVA’s interim and annual reporting periods beginning October 1, 2023. While early adoption is permitted, TVA does not currently plan to adopt this standard early. |
| Effect on the Financial Statements or Other Significant Matters | TVA does not expect the adoption of this standard to have a material impact on its financial condition, results of operations, or cash flows. |
|
|
| |
| |
| |
|
|
| |
| |
| |
| | | | | |
|
| |
| |
| |
|
|
| |
| |
| |
|
|
| |
| |
| |
|
|
| |
| |
| |
|
|
| |
| |
| |
|
Troubled Debt Restructurings and Vintage Disclosures |
| Description | This guidance eliminates the recognition and measurement guidance on troubled debt restructuring for creditors that have adopted Financial Instruments-Credit Losses and requires enhanced disclosures about loan modifications for borrowers experiencing financial difficulty. Additionally, the guidance requires public business entities to present current-period gross write-offs by year of origination in their vintage disclosures. The entity should apply the standard prospectively except for the transition method related to the recognition and measurement of troubled debt restructuring. For the transition method, an entity has the option to apply a modified retrospective transition method, resulting in a cumulative-effect adjustment to retained earnings in the period of adoption. |
| Effective Date for TVA | This new standard is effective for TVA’s interim and annual reporting periods beginning October 1, 2023. While early adoption is permitted, TVA does not currently plan to adopt this standard early. |
| Effect on the Financial Statements or Other Significant Matters | TVA does not expect the adoption of this standard to have a material impact on its financial condition, results of operations, or cash flows. |
|
|
| |
| |
| |
|
|
| |
| |
| |
3. Accounts Receivable, Net
Accounts receivable primarily consist of amounts due from customers for power sales. The table below summarizes the types and amounts of TVA's accounts receivable:
| | | | | | | | | | | |
Accounts Receivable, Net (in millions) |
| | At June 30, 2023 | | At September 30, 2022 |
| Power receivables | $ | 1,514 | | | $ | 1,899 | |
| Other receivables | 89 | | | 108 | |
| | | |
Accounts receivable, net(1) | $ | 1,603 | | | $ | 2,007 | |
Note
(1) Allowance for uncollectible accounts was less than $1 million at both June 30, 2023, and September 30, 2022, and therefore is not represented in the table above.
4. Inventories, Net
The table below summarizes the types and amounts of TVA's inventories:
| | | | | | | | | | | |
Inventories, Net (in millions) |
| | At June 30, 2023 | | At September 30, 2022 |
| Materials and supplies inventory | $ | 842 | | | $ | 808 | |
| Fuel inventory | 401 | | | 303 | |
| Renewable energy certificates/emissions allowance inventory, net | 17 | | | 18 | |
| Allowance for inventory obsolescence | (75) | | | (57) | |
| Inventories, net | $ | 1,185 | | | $ | 1,072 | |
5. Other Current Assets
Other current assets consisted of the following:
| | | | | | | | | | | |
Other Current Assets (in millions) |
| | At June 30, 2023 | | At September 30, 2022(1) |
| Commodity contract derivative assets | $ | 21 | | | $ | 172 | |
| Prepaid software maintenance | 28 | | | 14 | |
| Prepaid insurance | 26 | | | 16 | |
| Current portion of prepaid long-term service agreements | 22 | | | 12 | |
| Other | 64 | | | 43 | |
| Other current assets | $ | 161 | | | $ | 257 | |
Note
(1) At September 30, 2022, $14 million, $16 million, and $12 million previously classified as Other (a component of Other current assets) have been reclassified to Prepaid software maintenance (a component of Other current assets), Prepaid insurance (a component of Other current assets), and Current portion of prepaid long-term service agreements (a component of Other current assets), respectively, to conform with current year presentation.
Commodity Contract Derivative Assets. TVA enters into certain derivative contracts for natural gas that require physical delivery of the contracted quantity of the commodity as well as certain financial derivative contracts to hedge exposure to the price of natural gas. Commodity contract derivative assets classified as current include deliveries or settlements that will occur within 12 months or less. See Note 13 — Risk Management Activities and Derivative Transactions — Derivatives Not Receiving Hedge Accounting Treatment — Commodity Contract Derivatives and — Commodity Derivatives under the FHP for a discussion of TVA's commodity contract derivatives.
6. Plant Closures
Background
TVA must continuously evaluate all generating assets to ensure an optimal energy portfolio that provides safe, clean, and reliable power while maintaining flexibility and fiscal responsibility to the people of the Tennessee Valley. Based on results of assessments presented to the TVA Board in 2019, the retirement of Bull Run Fossil Plant ("Bull Run") by December 2023 was approved. In addition, TVA is evaluating the impact of retiring the balance of the coal-fired fleet by 2035, and that evaluation includes environmental reviews, public input, and TVA Board approval. Due to these evaluations, certain planning assumptions were updated, and their financial impacts are discussed below.
In January 2023, TVA issued its Record of Decision to retire the two coal-fired units at Cumberland Fossil Plant ("Cumberland") by the end of CY 2026 and CY 2028.
Financial Impact
TVA's policy is to adjust depreciation rates to reflect the most current assumptions, ensuring units will be fully depreciated by the applicable retirement dates. As a result of TVA's decision to accelerate the retirement of Bull Run, TVA has recognized a cumulative $592 million of accelerated depreciation since the second quarter of 2019. Of this amount, $37 million and $35 million were recognized for Bull Run during the three months ended June 30, 2023 and 2022, respectively, and $110 million and $105 million were recognized during the nine months ended June 30, 2023 and 2022, respectively. TVA's decision to retire the two units at Cumberland is estimated to result in approximately $16 million of additional depreciation quarterly, which does not include any potential impact from additions or retirements to net completed plant. TVA has recognized a cumulative $32 million of additional depreciation since January 2023.
TVA also recognized $11 million and $17 million in Operating and maintenance expense related to additional inventory reserves and write-offs for the coal-fired fleet, including Bull Run and Cumberland, during the nine months ended June 30, 2023 and 2022, respectively. Of this amount, $3 million and $6 million were recognized during the three months ended June 30, 2023 and 2022, respectively.
7. Other Long-Term Assets
The table below summarizes the types and amounts of TVA's other long-term assets:
| | | | | | | | | | | |
Other Long-Term Assets (in millions) |
| At June 30, 2023 | | At September 30, 2022 |
| | | |
| Loans and other long-term receivables, net | $ | 131 | | | $ | 99 | |
EnergyRight® receivables, net | 47 | | | 49 | |
| Prepaid long-term service agreements | 57 | | | 74 | |
| Commodity contract derivative assets | 1 | | | 102 | |
| | | |
| | | |
| | | |
| Other | 98 | | | 70 | |
| Total other long-term assets | $ | 334 | | | $ | 394 | |
Loans and Other Long-Term Receivables. TVA's loans and other long-term receivables primarily consist of economic development loans for qualifying organizations and a receivable for reimbursements to recover the cost of providing long-term, on-site storage for spent nuclear fuel. The current and long-term portions of the loans receivable are reported in Accounts receivable, net and Other long-term assets, respectively, on TVA's Consolidated Balance Sheets. At June 30, 2023 and September 30, 2022, the carrying amount of the loans receivable, net of discount, reported in Accounts receivable, net was $4 million and $6 million, respectively.
EnergyRight® Receivables. In association with the EnergyRight® program, TVA's local power company customers ("LPCs") offer financing to end-use customers for the purchase of energy-efficient equipment. Depending on the nature of the energy-efficiency project, loans may have a maximum term of five years or 10 years. TVA purchases the resulting loans receivable from its LPCs. The loans receivable are then transferred to a third-party bank with which TVA has agreed to repay in full any loans receivable that have been in default for 180 days or more or that TVA has determined are uncollectible. Given this continuing involvement, TVA accounts for the transfer of the loans receivable as secured borrowings. The current and long-term portions of the loans receivable are reported in Accounts receivable, net and Other long-term assets, respectively, on TVA's Consolidated Balance Sheets. At June 30, 2023, and September 30, 2022, the carrying amount of the loans receivable, net of discount, reported in Accounts receivable, net was $12 million and $13 million, respectively. See Note 10 — Other Long-Term Liabilities for information regarding the associated financing obligation.
Allowance for Loan Losses. The allowance for loan loss is an estimate of expected credit losses, measured over the estimated life of the loan receivables, that considers reasonable and supportable forecasts of future economic conditions in addition to information about historical experience and current conditions. See Note 1 — Summary of Significant Accounting Policies — Allowance for Uncollectible Accounts.
The allowance components, which consist of a collective allowance and specific loans allowance, are based on the risk characteristics of TVA's loans. Loans that share similar risk characteristics are evaluated on a collective basis in measuring credit losses, while loans that do not share similar risk characteristics with other loans are evaluated on an individual basis.
| | | | | | | | | | | |
Allowance Components (in millions) |
| At June 30, 2023 | | At September 30, 2022 |
EnergyRight® loan reserve | $ | 1 | | | $ | 1 | |
| Economic development loan collective reserve | 1 | | | 1 | |
| Economic development loan specific loan reserve | 1 | | | 1 | |
| | | |
| Total allowance for loan losses | $ | 3 | | | $ | 3 | |
Prepaid Long-Term Service Agreements. TVA has entered into various long-term service agreements for major maintenance activities at certain of its combined cycle plants. TVA uses the direct expense method of accounting for these arrangements. TVA accrues for parts when it takes ownership and for contractor services when they are rendered. Under certain of these agreements, payments made exceed the value of parts received and services rendered. The current and long-term portions of the resulting prepayments are reported in Other current assets and Other long-term assets, respectively, on TVA's Consolidated Balance Sheets. At June 30, 2023, and September 30, 2022, prepayments of $22 million and $12 million, respectively, were recorded in Other current assets.
Commodity Contract Derivative Assets. TVA enters into certain derivative contracts for natural gas that require physical delivery of the contracted quantity of the commodity as well as certain financial derivative contracts to hedge exposure to the price of natural gas. See Note 13 — Risk Management Activities and Derivative Transactions — Derivatives Not Receiving
Hedge Accounting Treatment — Commodity Contract Derivatives and — Commodity Derivatives under the FHP for a discussion of TVA's commodity contract derivatives.
8. Regulatory Assets and Liabilities
TVA records certain assets and liabilities that result from the regulated ratemaking process that would not be recorded under GAAP for non-regulated entities. As such, certain items that would generally be reported in earnings or that would impact the Consolidated Statements of Operations are recorded as regulatory assets or regulatory liabilities. Regulatory assets generally represent incurred costs that have been deferred because such costs are probable of future recovery in customer rates. Regulatory liabilities generally represent obligations to make refunds to customers for previous collections for costs that are not likely to be incurred or deferral of gains that will be credited to customers in future periods. Components of regulatory assets and regulatory liabilities are summarized in the table below.
| | | | | | | | | | | |
Regulatory Assets and Liabilities (in millions) |
| | At June 30, 2023 | | At September 30, 2022 |
| Current regulatory assets | | | |
| | | |
| Unrealized losses on interest rate derivatives | $ | 32 | | | $ | 47 | |
| | | |
| Unrealized losses on commodity derivatives | 180 | | | 14 | |
| | | |
| | | |
| Fuel cost adjustment receivable | 24 | | | 77 | |
| | | |
| Total current regulatory assets | 236 | | | 138 | |
| | | |
| Non-current regulatory assets | | | |
| Retirement benefit plans deferred costs | 1,746 | | | 1,839 | |
| Non-nuclear decommissioning costs | 2,638 | | | 2,856 | |
| | | |
| Unrealized losses on interest rate derivatives | 473 | | | 479 | |
| Nuclear decommissioning costs | 592 | | | 821 | |
| | | |
| Unrealized losses on commodity derivatives | 78 | | | 1 | |
| | | |
| | | |
| Other non-current regulatory assets | 139 | | | 138 | |
| Total non-current regulatory assets | 5,666 | | | 6,134 | |
| Total regulatory assets | $ | 5,902 | | | $ | 6,272 | |
| | | |
| Current regulatory liabilities | | | |
| Fuel cost adjustment tax equivalents | $ | 203 | | | $ | 218 | |
| | | |
| Unrealized gains on commodity derivatives | 21 | | | 173 | |
| Total current regulatory liabilities | 224 | | | 391 | |
| | | |
| Non-current regulatory liabilities | | | |
| Retirement benefit plans deferred credits | 58 | | | 70 | |
| Unrealized gains on commodity derivatives | 1 | | | 102 | |
| Total non-current regulatory liabilities | 59 | | | 172 | |
| | | |
| Total regulatory liabilities | $ | 283 | | | $ | 563 | |
9. Variable Interest Entities
A VIE is an entity that either (i) has insufficient equity to permit the entity to finance its activities without additional subordinated financial support or (ii) has equity investors who lack the characteristics of owning a controlling financial interest. When TVA determines that it has a variable interest in a VIE, a qualitative evaluation is performed to assess which interest holders have the power to direct the activities that most significantly impact the economic performance of the entity and have the obligation to absorb losses or receive benefits that could be significant to the entity. The evaluation considers the purpose and design of the business, the risks that the business was designed to create and pass along to other entities, the activities of the business that can be directed and which party can direct them, and the expected relative impact of those activities on the economic performance of the business through its life. TVA has the power to direct the activities of an entity when it has the ability to make key operating and financing decisions, including, but not limited to, capital investment and the issuance of debt.
Based on the evaluation of these criteria, TVA has determined it is the primary beneficiary of certain entities and as such is required to account for the VIEs on a consolidated basis.
John Sevier VIEs
In 2012, TVA entered into a $1.0 billion construction management agreement and lease financing arrangement with John Sevier Combined Cycle Generation LLC ("JSCCG") for the completion and lease by TVA of the John Sevier Combined Cycle Facility ("John Sevier CCF"). JSCCG is a special single-purpose limited liability company formed in January 2012 to finance the John Sevier CCF through a $900 million secured note issuance (the "JSCCG notes") and the issuance of $100 million of membership interests subject to mandatory redemption. The membership interests were purchased by John Sevier Holdco LLC ("Holdco"). Holdco is a special single-purpose entity, also formed in January 2012, established to acquire and hold the membership interests in JSCCG. A non-controlling interest in Holdco is held by a third party through nominal membership interests, to which none of the income, expenses, and cash flows are allocated.
The membership interests held by Holdco in JSCCG were purchased with proceeds from the issuance of $100 million of secured notes (the "Holdco notes") and are subject to mandatory redemption pursuant to a schedule of amortizing, semi-annual payments due each January 15 and July 15, with a final payment due in January 2042. The payment dates for the mandatorily redeemable membership interests are the same as those of the Holdco notes. The sale of the JSCCG notes, the membership interests in JSCCG, and the Holdco notes closed in January 2012. The JSCCG notes are secured by TVA's lease payments, and the Holdco notes are secured by Holdco's investment in, and amounts receivable from, JSCCG. TVA's lease payments to JSCCG are equal to and payable on the same dates as JSCCG's and Holdco's semi-annual debt service payments. In addition to the lease payments, TVA pays administrative and miscellaneous expenses incurred by JSCCG and Holdco. Certain agreements related to this transaction contain default and acceleration provisions.
Due to its participation in the design, business activity, and credit and financial support of JSCCG and Holdco, TVA has determined that it has a variable interest in each of these entities. Based on its analysis, TVA has concluded that it is the primary beneficiary of JSCCG and Holdco and, as such, is required to account for the VIEs on a consolidated basis. Holdco's membership interests in JSCCG are eliminated in consolidation.
Southaven VIE
In 2013, TVA entered into a $400 million lease financing arrangement with Southaven Combined Cycle Generation LLC ("SCCG") for the lease by TVA of the Southaven Combined Cycle Facility ("Southaven CCF"). SCCG is a special single-purpose limited liability company formed in June 2013 to finance the Southaven CCF through a $360 million secured notes issuance (the "SCCG notes") and the issuance of $40 million of membership interests subject to mandatory redemption. The membership interests were purchased by Southaven Holdco LLC ("SHLLC"). SHLLC is a special single-purpose entity, also formed in June 2013, established to acquire and hold the membership interests in SCCG. A non-controlling interest in SHLLC is held by a third party through nominal membership interests, to which none of the income, expenses, and cash flows of SHLLC are allocated.
The membership interests held by SHLLC were purchased with proceeds from the issuance of $40 million of secured notes (the "SHLLC notes") and are subject to mandatory redemption pursuant to a schedule of amortizing, semi-annual payments due each February 15 and August 15, with a final payment due on August 15, 2033. The payment dates for the mandatorily redeemable membership interests are the same as those of the SHLLC notes, and the payment amounts are sufficient to provide returns on, as well as returns of, capital until the investment has been repaid to SHLLC in full. The rate of return on investment to SHLLC is seven percent, which is reflected as interest expense in the Consolidated Statements of Operations. SHLLC is required to pay a pre-determined portion of the return on investment to Seven States Southaven, LLC on each lease payment date as agreed in SHLLC's formation documents (the "Seven States Return"). The current and long-term portions of the Membership interests of VIE subject to mandatory redemption are included in Accounts payable and accrued liabilities and Other long-term liabilities, respectively.
The payment dates for the mandatorily redeemable membership interests are the same as those of the SHLLC notes. The SCCG notes are secured by TVA's lease payments, and the SHLLC notes are secured by SHLLC's investment in, and amounts receivable from, SCCG. TVA's lease payments to SCCG are payable on the same dates as SCCG's and SHLLC's semi-annual debt service payments and are equal to the sum of (i) the amount of SCCG's semi-annual debt service payments, (ii) the amount of SHLLC's semi-annual debt service payments, and (iii) the amount of the Seven States Return. In addition to the lease payments, TVA pays administrative and miscellaneous expenses incurred by SCCG and SHLLC. Certain agreements related to this transaction contain default and acceleration provisions.
In the event that TVA were to choose to exercise an early buy out feature of the Southaven facility lease, in part or in whole, TVA must pay to SCCG amounts sufficient for SCCG to repay or partially repay on a pro rata basis the membership interests held by SHLLC, including any outstanding investment amount plus accrued but unpaid return. TVA also has the right, at any time and without any early redemption of the other portions of the Southaven facility lease payments due to SCCG, to fully repay SHLLC's investment, upon which repayment SHLLC will transfer the membership interests to a designee of TVA.
TVA participated in the design, business activity, and financial support of SCCG and has determined that it has a direct variable interest in SCCG resulting from risk associated with the value of the Southaven CCF at the end of the lease term. Based on its analysis, TVA has determined that it is the primary beneficiary of SCCG and, as such, is required to account for the VIE on a consolidated basis.
Impact on Consolidated Financial Statements
The financial statement items attributable to carrying amounts and classifications of JSCCG, Holdco, and SCCG at June 30, 2023, and September 30, 2022, as reflected on the Consolidated Balance Sheets, are as follows:
| | | | | | | | | | | |
Summary of Impact of VIEs on Consolidated Balance Sheets (in millions) |
| | At June 30, 2023 | | At September 30, 2022 |
| | | |
| | | |
| | | |
| | | |
| Current liabilities | | | |
| Accrued interest | $ | 21 | | | $ | 10 | |
| Accounts payable and accrued liabilities | 1 | | | 2 | |
| Current maturities of long-term debt of variable interest entities | 35 | | | 39 | |
Total current liabilities | 57 | | | 51 | |
| Other liabilities | | | |
| Other long-term liabilities | 17 | | | 18 | |
| Long-term debt, net | | | |
| Long-term debt of variable interest entities, net | 951 | | | 968 | |
| Total liabilities | $ | 1,025 | | | $ | 1,037 | |
Interest expense of $12 million and $13 million for the three months ended June 30, 2023 and 2022, respectively, and $36 million and $38 million for the nine months ended June 30, 2023 and 2022, respectively, is included in the Consolidated Statements of Operations related to debt of VIEs and membership interests of VIEs subject to mandatory redemption.
Creditors of the VIEs do not have any recourse to the general credit of TVA. TVA does not have any obligations to provide financial support to the VIEs other than as prescribed in the terms of the agreements related to these transactions.
10. Other Long-Term Liabilities
Other long-term liabilities consist primarily of liabilities related to certain derivative agreements as well as liabilities related to operating leases. The table below summarizes the types and amounts of Other long-term liabilities:
| | | | | | | | | | | |
Other Long-Term Liabilities (in millions) |
| | At June 30, 2023 | | At September 30, 2022(1) |
| Interest rate swap liabilities | $ | 805 | | | $ | 851 | |
| Operating lease liabilities | 92 | | | 93 | |
| Currency swap liabilities | 153 | | | 228 | |
| Commodity contract derivative liabilities | 78 | | | 1 | |
EnergyRight® financing obligation | 55 | | | 58 | |
| Long-term deferred compensation | 42 | | | 39 | |
| Advances for construction | 51 | | | 53 | |
| Long-term deferred revenue | 41 | | | 39 | |
| | | |
| Other | 108 | | | 123 | |
| Total other long-term liabilities | $ | 1,425 | | | $ | 1,485 | |
Note
(1) At September 30, 2022, $1 million previously classified as Other (a component of Other long-term liabilities) has been reclassified to Commodity contract derivative liabilities (a component of Other long-term liabilities) to conform with current year presentation.
Interest Rate Swap Liabilities. TVA uses interest rate swaps to fix variable short-term debt to a fixed rate. The values of these derivatives are included in Accounts payable and accrued liabilities, Accrued interest, and Other long-term liabilities on the Consolidated Balance Sheets. At June 30, 2023, and September 30, 2022, the carrying amount of the interest rate swap liabilities reported in Accounts payable and accrued liabilities and Accrued interest was $32 million and $54 million, respectively.
See Note 13 — Risk Management Activities and Derivative Transactions — Derivatives Not Receiving Hedge Accounting Treatment — Interest Rate Derivatives for information regarding the interest rate swap liabilities.
Operating Lease Liabilities. TVA's operating leases consist primarily of railcars, equipment, real estate/land, and power generating facilities. At June 30, 2023 and September 30, 2022, the current portion of TVA's operating leases reported in Accounts payable and accrued liabilities was $66 million and $59 million, respectively.
Currency Swap Liabilities. To protect against exchange rate risk related to British pound sterling denominated Bond transactions, TVA entered into foreign currency hedges. The values of these derivatives are included in Accounts payable and accrued liabilities and Other long-term liabilities on the Consolidated Balance Sheets. At June 30, 2023 and September 30, 2022, the carrying amount of the currency swap liabilities recorded in Accounts payable and accrued liabilities was $8 million and $12 million, respectively. See Note 13 — Risk Management Activities and Derivative Transactions — Cash Flow Hedging Strategy for Currency Swaps for more information regarding the currency swap liabilities.
EnergyRight® Financing Obligation. TVA purchases certain loans receivable from its LPCs in association with the EnergyRight® program. The current and long-term portions of the resulting financing obligation are reported in Accounts payable and accrued liabilities and Other long-term liabilities, respectively, on TVA's Consolidated Balance Sheets. At both June 30, 2023, and September 30, 2022, the carrying amount of the financing obligation reported in Accounts payable and accrued liabilities was $14 million. See Note 7 — Other Long-Term Assets for information regarding the associated loans receivable.
Long-Term Deferred Compensation. TVA provides compensation arrangements to engage and retain certain employees, both executive and non-executive, which are designed to provide participants with the ability to defer compensation to future periods. The current and long-term portions are recorded in Accounts payable and accrued liabilities and Other long-term liabilities, respectively, on TVA’s Consolidated Balance Sheets. At June 30, 2023 and September 30, 2022, the current amount of deferred compensation recorded in Accounts payable and accrued liabilities was $56 million and $53 million, respectively.
Advances for Construction. TVA receives refundable and non-refundable advances for construction that are generally intended to defray all or a portion of the costs of building or extending TVA’s existing power assets. Amounts received are deferred as a liability with the long-term portion representing amounts that will not be recognized within the next 12 months. As projects meet milestones or other contractual obligations, the refundable portion is refunded to the customer and the non-refundable portion is recognized as contributions in aid of construction and offsets the cost of plant assets. At June 30, 2023 and September 30, 2022, the current amount of advances for construction recorded in Accounts payable and accrued liabilities was $53 million and $33 million, respectively.
Long-Term Deferred Revenue. Long-term deferred revenue represents payments received that exceed services rendered resulting in the deferral of revenue. The long-term portion represents amounts that will not be recognized within the next 12 months primarily related to fiber and transmission agreements. The current and long-term portions of the deferral are reported in Accounts payable and accrued liabilities and Other long-term liabilities, respectively, on TVA’s Consolidated Balance Sheets. At June 30, 2023 and September 30, 2022, the current amount of deferred revenue recorded in Accounts payable and accrued liabilities was $11 million and $16 million, respectively.
11. Asset Retirement Obligations
During the nine months ended June 30, 2023, TVA's total asset retirement obligations ("ARO") liability decreased $40 million as a result of settlements related to retirement projects that were conducted during the period, partially offset by periodic accretion. The nuclear and non-nuclear accretion amounts were deferred as regulatory assets. During the nine months ended June 30, 2023, $141 million of the related regulatory assets were amortized into expense as these amounts were collected in rates. See Note 8 — Regulatory Assets and Liabilities. TVA maintains investment trusts to help fund its decommissioning obligations. See Note 14 — Fair Value Measurements — Investment Funds and Note 20 — Contingencies and Legal Proceedings — Contingencies — Decommissioning Costs for a discussion of the trusts' objectives and the current balances of the trusts.
| | | | | | | | | | | | | | | | | | | | |
| Asset Retirement Obligation Activity | |
| | Nuclear | | Non-Nuclear | | Total | |
Balance at September 30, 2022 | $ | 3,643 | | | $ | 3,519 | | | $ | 7,162 | | (1) |
| Settlements | — | | | (195) | | | (195) | | |
| Revisions in estimate | 6 | | | (28) | | | (22) | | |
| | | | | | |
| | | | | | |
| Accretion (recorded as regulatory asset) | 124 | | | 53 | | | 177 | | |
| | | | | | |
| Balance at June 30, 2023 | $ | 3,773 | | | $ | 3,349 | | | $ | 7,122 | | (1) |
| | | | | | |
| | | | | | |
Note
(1) Includes $262 million and $275 million at June 30, 2023, and September 30, 2022, respectively, in Current liabilities.
Revisions to non-nuclear estimates decreased the liability balance by $28 million for the nine months ended June 30, 2023. The decrease was primarily attributable to reductions in closure liabilities of $15 million at Cumberland based on identified changes in the projected timing of certain asset retirement activities and $9 million at Paradise Fossil Plant as a result of refined project cost estimates.
12. Debt and Other Obligations
Debt Outstanding
Total debt outstanding at June 30, 2023, and September 30, 2022, consisted of the following:
| | | | | | | | | | | |
Debt Outstanding
(in millions) |
| | At June 30, 2023 | | At September 30, 2022 |
| Short-term debt | | | |
| Short-term debt, net of discounts | $ | 722 | | | $ | 1,172 | |
| Current maturities of power bonds issued at par | 22 | | | 29 | |
| Current maturities of long-term debt of VIEs issued at par | 35 | | | 39 | |
| | | |
| Total current debt outstanding, net | 779 | | | 1,240 | |
| Long-term debt | | | |
Long-term power bonds(1) | 18,990 | | | 17,950 | |
| Long-term debt of VIEs, net | 951 | | | 968 | |
| | | |
| Unamortized discounts, premiums, issue costs, and other | (129) | | | (124) | |
| Total long-term debt, net | 19,812 | | | 18,794 | |
| Total debt outstanding | $ | 20,591 | | | $ | 20,034 | |
Note
(1) Includes net exchange gain from currency transactions of $89 million and $150 million at June 30, 2023, and September 30, 2022, respectively.
Debt Securities Activity
The table below summarizes the long-term debt securities activity for the period from October 1, 2022, to June 30, 2023:
| | | | | | | | | | | | | | | | |
| Debt Securities Activity |
| | | Date | | Amount (in millions) | | |
| Issues | | | | | | |
2023 Series A(1) | | March 2023 | | $ | 1,000 | | | |
| | | | | | |
| Discount on debt issues | | | | (8) | | | |
| Total long-term debt issues | | | | $ | 992 | | | |
| | | | | | |
Redemptions/Maturities(2) | | | | | | |
| | | | | | |
| | | | | | |
| | | | | | |
| | | | | | |
| | | | | | |
| 2009 Series B | | December 2022 | | $ | 1 | | | |
| 2009 Series B | | June 2023 | | 28 | | | |
| | | | | | |
| | | | | | |
| | | | | | |
| | | | | | |
| | | | | | |
| Total redemptions/maturities of power bonds | | | | 29 | | | |
| | | | | | |
| | | | | | |
| Debt of variable interest entities | | | | 22 | | | |
| Total redemptions/maturities of debt | | | | $ | 51 | | | |
| | | | | | |
| | | | | | |
| | | | | | |
| | | | | | |
| | | | | | |
Notes
(1) The 2023 Series A Bonds were issued at 99.187 percent of par.
(2) All redemptions were at 100 percent of par.
Credit Facility Agreements
TVA has funding available under four long-term revolving credit facilities totaling approximately $2.7 billion. See the table below for additional information on the four long-term revolving credit facilities. The interest rate on any borrowing under these facilities varies based on market factors and the rating of TVA's senior unsecured, long-term, non-credit-enhanced debt. TVA is required to pay an unused facility fee on the portion of the total $2.7 billion that TVA has not borrowed or committed under
letters of credit. This fee, along with letter of credit fees, may fluctuate depending on the rating of TVA's senior unsecured, long-term, non-credit-enhanced debt. At June 30, 2023, and September 30, 2022, there were $595 million and $704 million, respectively, of letters of credit outstanding under these facilities, and there were no borrowings outstanding. TVA's letters of credit are primarily posted as collateral under TVA's interest rate swaps. See Note 13 — Risk Management Activities and Derivative Transactions — Other Derivative Instruments — Collateral. TVA may also post collateral for TVA's currency swaps, for commodity derivatives under the Financial Hedging Program ("FHP"), or for certain transactions with third parties that require TVA to post letters of credit.
The following table provides additional information regarding TVA's funding available under the four long-term revolving credit facilities:
| | | | | | | | | | | | | | | | | | | | | | | | | | |
Summary of Long-Term Credit Facilities At June 30, 2023 (in millions) |
| Maturity Date | | Facility Limit | | Letters of Credit Outstanding | | Cash Borrowings | | Availability |
| | | | | | | | |
March 2026(1) | | $ | 150 | | | $ | 38 | | | $ | — | | | $ | 112 | |
| February 2025 | | 500 | | | 302 | | | — | | | 198 | |
| September 2026 | | 1,000 | | | 99 | | | — | | | 901 | |
| March 2027 | | 1,000 | | | 156 | | | — | | | 844 | |
| Total | | $ | 2,650 | | | $ | 595 | | | $ | — | | | $ | 2,055 | |
Note
(1) During the second quarter of 2023, TVA extended the maturity date from February 9, 2024 to March 29, 2026.
TVA and the U.S. Treasury, pursuant to the TVA Act, have entered into a memorandum of understanding under which the U.S. Treasury provides TVA with a $150 million credit facility. This credit facility was renewed for 2023 with a maturity date of September 30, 2023. Access to this credit facility or other similar financing arrangements with the U.S. Treasury has been available to TVA since the 1960s. TVA can borrow under the U.S. Treasury credit facility only if it cannot issue Bonds in the market on reasonable terms, and TVA considers the U.S. Treasury credit facility a secondary source of liquidity. The interest rate on any borrowing under this facility is based on the average rate on outstanding marketable obligations of the U.S. with maturities from date of issue of 12 months or less. There were no outstanding borrowings under the facility at June 30, 2023. The availability of this credit facility may be impacted by how the U.S. government addresses the possibility of approaching its debt limit.
Lease/Leasebacks
TVA previously entered into leasing transactions to obtain third-party financing for 24 peaking combustion turbine units ("CTs") as well as certain qualified technological equipment and software ("QTE"). Due to TVA's continuing involvement with the combustion turbine facilities and the QTE during the leaseback term, TVA accounted for the lease proceeds as financing obligations. There were no outstanding leaseback obligations related to the remaining CTs and QTE at June 30, 2023 and September 30, 2022. Prior to 2021, TVA made final rent payments involving 16 CTs and acquired the equity interest related to these transactions. Rent payments under the remaining CT lease/leaseback transactions were made through January 2022. In December 2021, TVA gave notice of its election to acquire the leasehold interests related to the remaining eight CTs for a total of $155 million. One associated acquisition closed in December 2022 for $78 million, and the other acquisition closed in May 2023 for $77 million. As a result, TVA recorded the cash consideration as reacquired rights, which is an intangible asset included in Completed plant on the Consolidated Balance Sheet. The amount will be amortized over the remaining estimated useful life of the underlying CTs. TVA recognized $2 million of amortization expense related to the reacquired rights within the Consolidated Statement of Operations for the nine months ended June 30, 2023. Transaction costs were not material. The estimated amortization expense for the remainder of 2023 is $1 million and will be $5 million annually from 2024 through 2052. The estimated amortization expense will be $2 million in 2053.
13. Risk Management Activities and Derivative Transactions
TVA is exposed to various risks related to commodity prices, investment prices, interest rates, currency exchange rates, and inflation as well as counterparty credit and performance risks. To help manage certain of these risks, TVA has historically entered into various derivative transactions, principally commodity option contracts, forward contracts, swaps, swaptions, futures, and options on futures. Other than certain derivative instruments in its trust investment funds, it is TVA's FHP policy to enter into these derivative transactions solely for hedging purposes and not for speculative purposes.
Overview of Accounting Treatment
TVA recognizes certain of its derivative instruments as either assets or liabilities on its Consolidated Balance Sheets at fair value. The accounting for changes in the fair value of these instruments depends on (1) whether TVA uses regulatory accounting to defer the derivative gains and losses, (2) whether the derivative instrument has been designated and qualifies for hedge accounting treatment, and (3) if so, the type of hedge relationship (for example, cash flow hedge).
The following tables summarize the accounting treatment that certain of TVA's financial derivative transactions receive:
| | | | | | | | | | | | | | | | | | | | | | | | | | | | | | | | | | | | | | | |
Summary of Derivative Instruments That Receive Hedge Accounting Treatment (part 1)
Amount of Mark-to-Market Gain (Loss) Recognized in Accumulated Other Comprehensive Income (Loss)
(in millions) |
| | | | | | Three Months Ended June 30 | | Nine Months Ended June 30 | |
| Derivatives in Cash Flow Hedging Relationship | | Objective of Hedge Transaction | | Accounting for Derivative
Hedging Instrument | | 2023 | | 2022 | | 2023 | | 2022 | |
| Currency swaps | | To protect against changes in cash flows caused by changes in foreign currency exchange rates (exchange rate risk) | | Unrealized gains and losses are recorded in AOCI and reclassified to Interest expense to the extent they are offset by gains and losses on the hedged transaction | | $ | 5 | | | $ | (40) | | | $ | 79 | | | $ | (50) | | |
| | | | | | | | | | | | | | | | | | | | | | | | | | | |
Summary of Derivative Instruments That Receive Hedge Accounting Treatment (part 2)(1)
Amount of Gain (Loss) Reclassified from Accumulated Other Comprehensive Income (Loss) to Interest Expense
(in millions) |
| | Three Months Ended June 30 | | Nine Months Ended June 30 | |
| Derivatives in Cash Flow Hedging Relationship | | 2023 | | 2022 | | 2023 | | 2022 | |
| Currency swaps | | $ | 22 | | | $ | (34) | | | $ | 65 | | | $ | (50) | | |
Note
(1) There were no amounts excluded from effectiveness testing for any of the periods presented. Based on forecasted foreign currency exchange rates, TVA expects to reclassify approximately $4 million of gains from Accumulated other comprehensive income (loss) ("AOCI") to Interest expense within the next 12 months to offset amounts anticipated to be recorded in Interest expense related to the forecasted exchange loss on the debt.
| | | | | | | | | | | | | | | | | | | | | | | | | | | | | | | | | | | | | | | |
Summary of Derivative Instruments That Do Not Receive Hedge Accounting Treatment Amount of Gain (Loss) Recognized in Income on Derivatives(1) (in millions) |
| | | | | | Three Months Ended June 30 | | Nine Months Ended June 30 | |
| Derivative Type | | Objective of Derivative | | Accounting for Derivative Instrument | | 2023 | | 2022 | | 2023 | | 2022 | |
| Interest rate swaps | | To fix short-term debt variable rate to a fixed rate (interest rate risk) | | Mark-to-market gains and losses are recorded as regulatory liabilities and assets, respectively
Realized gains and losses are recognized in Interest expense when incurred during the settlement period and are presented in operating cash flow | | $ | (10) | | | $ | (26) | | | $ | (36) | | | $ | (83) | | |
| | | | | | | | | | | | | |
| | | | | | | | | | | | | |
Commodity derivatives
under the FHP | | To protect against fluctuations in market prices of purchased commodities (price risk) | | Mark-to-market gains and losses are recorded as regulatory liabilities and assets, respectively
Realized gains and losses are recognized in Fuel expense or Purchased power expense as the contracts settle to match the delivery period of the underlying commodity(2) | | (97) | | | 14 | | | (256) | | | 14 | | |
Notes
(1) All of TVA's derivative instruments that do not receive hedge accounting treatment have unrealized gains (losses) that would otherwise be recognized in income but instead are deferred as regulatory assets and liabilities. As such, there were no related gains (losses) recognized in income for these unrealized gains (losses) for the three and nine months ended June 30, 2023 and for the three and nine months ended June 30, 2022.
(2) Of the amount recognized for the three months ended June 30, 2023, $78 million and $19 million were reported in Fuel expense and Purchased power expense, respectively. Of the amount recognized for nine months ended June 30, 2023, $205 million and $51 million were reported in Fuel expense and Purchased power expense, respectively. Amounts recognized in 2022 were solely reported in Fuel expense.
| | | | | | | | | | | | | | | | | | | | | | | |
Fair Values of TVA Derivatives (in millions) |
| | At June 30, 2023 | | At September 30, 2022 |
| Derivatives That Receive Hedge Accounting Treatment: |
| Balance | | Balance Sheet Presentation | | Balance | | Balance Sheet Presentation |
| Currency swaps | | | | | | | |
| | | | | | | |
£250 million Sterling | $ | (80) | | | Accounts payable and accrued liabilities $(5); Other long-term liabilities $(75) | | $ | (130) | | | Accounts payable and accrued liabilities $(7); Other long-term liabilities $(123) |
£150 million Sterling | (81) | | | Accounts payable and accrued liabilities $(3); Other long-term liabilities $(78) | | (110) | | | Accounts payable and accrued liabilities $(5); Other long-term liabilities $(105) |
| | | | | | | |
| Derivatives That Do Not Receive Hedge Accounting Treatment: |
| Balance | | Balance Sheet Presentation | | Balance | | Balance Sheet Presentation |
| Interest rate swaps | | | | | | | |
| $1.0 billion notional | $ | (619) | | | Accounts payable and accrued liabilities $(19); Accrued interest $(6); Other long-term liabilities $(594) | | $ | (672) | | | Accounts payable and accrued liabilities $(9); Accrued interest $(33); Other long-term liabilities $(630) |
| $476 million notional | (218) | | | Accounts payable and accrued liabilities $(6); Accrued interest $(1); Other long-term liabilities $(211) | | (233) | | | Accounts payable and accrued liabilities $(3); Accrued interest $(9); Other long-term liabilities $(221) |
| Commodity contract derivatives | 11 | | | Other current assets $21; Other long-term assets $1; Accounts payable and accrued liabilities $(10); Other long-term liabilities $(1) | | 145 | | | Other current assets $118; Other long-term assets $34; Accounts payable and accrued liabilities $(6); Other long-term liabilities $(1) |
| Commodity derivatives under the FHP | (247) | | | Accounts payable and accrued liabilities $(170); Other long-term liabilities $(77) | | 115 | | | Accounts receivable, net $1; Other current assets $54; Other long-term assets $68; Accounts payable and accrued liabilities $(8) |
| | | | | | | |
Cash Flow Hedging Strategy for Currency Swaps
To protect against exchange rate risk related to British pound sterling denominated Bond transactions, TVA entered into foreign currency hedges at the time the Bond transactions occurred. TVA had two currency swaps outstanding at June 30, 2023, with total currency exposure of £400 million and expiration dates in 2032 and 2043.
When the dollar strengthens against the British pound sterling, the exchange gain on the Bond liability and related accrued interest is offset by an equal amount of loss on the swap contract that is reclassified out of AOCI. Conversely, the exchange loss on the Bond liability and related accrued interest is offset by an equal amount of gain on the swap contract that is reclassified out of AOCI. All such exchange gains or losses on the Bond liability and related accrued interest are included in Long-term debt, net and Accrued interest, respectively. The offsetting exchange losses or gains on the swap contracts are recognized in AOCI. If any gain (loss) were to be incurred as a result of the early termination of the foreign currency swap contract, the resulting income (expense) would be amortized over the remaining life of the associated Bond as a component of Interest expense. The values of the currency swap liabilities are included in Accounts payable and accrued liabilities and Other long-term liabilities on the Consolidated Balance Sheets.
Derivatives Not Receiving Hedge Accounting Treatment
Interest Rate Derivatives. Generally TVA uses interest rate swaps to fix variable short-term debt to a fixed rate, and TVA uses regulatory accounting treatment to defer the mark-to-market ("MtM") gains and losses on its interest rate swaps. The net deferred unrealized gains and losses are classified as regulatory liabilities or assets on TVA's Consolidated Balance Sheets and are included in the ratemaking formula when gains or losses are realized. The values of these derivatives are included in Accounts payable and accrued liabilities, Accrued interest, and Other long-term liabilities on the Consolidated Balance Sheets, and realized gains and losses, if any, are included on TVA's Consolidated Statements of Operations. For the three months ended June 30, 2023 and 2022, the changes in fair market value of the interest rate swaps resulted in the reduction in unrealized losses of $85 million and $262 million, respectively. For the nine months ended June 30, 2023 and 2022, the changes in fair market value of the interest rate swaps resulted in the reduction in unrealized losses of $33 million and $533 million, respectively. TVA may hold short-term debt balances lower than the notional amount of the interest rate swaps from time to time due to
changes in business conditions and other factors. While actual balances vary, TVA generally plans to maintain average balances of short-term debt equal to or in excess of the combined notional amount of the interest rate swaps.
Commodity Contract Derivatives. TVA enters into certain derivative contracts for natural gas that require physical delivery of the contracted quantity of the commodity. TVA may also enter into short-term power purchase agreements with a term of less than one year that provide an option to financially settle contracted power deliveries. This option creates an embedded derivative in the hosting power purchase agreement. TVA marks to market these contracts and defers the unrealized gains (losses) as regulatory liabilities (assets). At June 30, 2023, TVA's natural gas contract derivatives had terms of up to three years.
| | | | | | | | | | | | | | | | | | | | | | | | | | | | | | | | | | | |
Commodity Contract Derivatives |
| | At June 30, 2023 | | At September 30, 2022 |
| | Number of Contracts | | Notional Amount | | Fair Value (MtM) (in millions) | | Number of Contracts | | Notional Amount | | Fair Value (MtM) (in millions) |
| | | | | | | | | | | |
| Natural gas contract derivatives | 64 | | 337 million mmBtu | | $ | 18 | | | 44 | | 296 million mmBtu | | $ | 145 | |
| Power purchase agreement with option to settle | 2 | | 351 thousand MWh | | $ | (7) | | | — | | — thousand MWh | | $ | — | |
Commodity Derivatives under the FHP. In 2022, TVA reinstated the FHP, and hedging activity began under the program. Currently, TVA is hedging exposure to the price of natural gas under the FHP. There is no Value at Risk aggregate transaction limit under the current FHP structure, but the TVA Board reviews and authorizes the use of tolerances and measures annually. TVA's FHP policy prohibits trading financial instruments under the FHP for speculative purposes. At June 30, 2023, TVA's natural gas swap contracts under the FHP had remaining terms of up to five years.
| | | | | | | | | | | | | | | | | | | | | | | | | | | | | | | | | | | |
Commodity Derivatives under Financial Hedging Program(1) |
| At June 30, 2023 | | At September 30, 2022 |
| Number of Contracts | | Notional Amount | | Fair Value (MtM) (in millions) | | Number of Contracts | | Notional Amount | | Fair Value (MtM) (in millions) |
| Natural gas | | | | | | | | | | | |
| | | | | | | | | | | |
| Swap contracts | 303 | | 420 | million mmBtu | | $ | (247) | | | 225 | | 256 | million mmBtu | | $ | 115 | |
| | | | | | | | | | | |
| | | | | | | | | | | |
| | | | | | | | | | | |
| | | | | | | | | | | |
| | | | | | | | | | | |
| | | | | | | | | | | |
| | | | | | | | | | | |
| | | | | | | | | | | |
Note
(1) Fair value amounts presented are based on the net commodity position with the counterparty. Notional amounts disclosed represent the net value of contractual amounts.
TVA defers all FHP unrealized gains (losses) as regulatory liabilities (assets) and records the realized gains or losses in Fuel expense and Purchased power expense to match the delivery period of the underlying commodity. The fair value of commodity derivatives under the FHP decreased $362 million primarily due to a decrease in forward natural gas prices at June 30, 2023 as compared to September 30, 2022.
Offsetting of Derivative Assets and Liabilities
The amounts of TVA's derivative instruments as reported on the Consolidated Balance Sheets are shown in the table below:
| | | | | | | | | | | | | | |
Derivative Assets and Liabilities(1)
(in millions) |
| | At June 30, 2023 | | | | | At September 30, 2022 |
| Assets | | | | | | |
| | | | | | |
| Commodity contract derivatives | $ | 22 | | | | | | $ | 152 | |
Commodity derivatives under the FHP(2) | — | | | | | | 123 | |
| Total derivatives subject to master netting or similar arrangement | $ | 22 | | | | | | $ | 275 | |
| | | | | | |
| | | | | | |
| | | | | | |
| Liabilities | | | | | | |
| Currency swaps | $ | 161 | | | | | | $ | 240 | |
Interest rate swaps(3) | 837 | | | | | | 905 | |
| Commodity contract derivatives | 11 | | | | | | 7 | |
Commodity derivatives under the FHP(2) | 247 | | | | | | 8 | |
| | | | | | |
| Total derivatives subject to master netting or similar arrangement | $ | 1,256 | | | | | | $ | 1,160 | |
| | | | | | |
| | | | | | |
| | | | | | |
| | |
| | | | | | |
| | | | | | |
| | | | | | |
| | | | | | |
| | | | | | |
| | | | | | |
| | | | | | |
| | | | | | |
| | | | | | |
| | | | | | |
| | | | | | |
| | | | | | |
| | | | | | |
| | | | | | |
| | | | | | |
Notes
(1) Offsetting amounts include counterparty netting of derivative contracts. Except as discussed below, there were no other material offsetting amounts on TVA's Consolidated Balance Sheets at either June 30, 2023, or September 30, 2022.
(2) At June 30, 2023, the gross derivative asset and gross derivative liability was $25 million and $272 million, respectively, with offsetting amounts for each totaling $25 million.
(3) Letters of credit of $569 million and $704 million were posted as collateral at June 30, 2023, and September 30, 2022, respectively, to partially secure the liability positions of one of the interest rate swaps in accordance with the collateral requirements for this derivative.
Other Derivative Instruments
Investment Fund Derivatives. Investment funds consist primarily of funds held in the Nuclear Decommissioning Trust ("NDT"), the Asset Retirement Trust ("ART"), the Supplemental Executive Retirement Plan ("SERP"), and the TVA Deferred Compensation Plan ("DCP"). See Note 14 — Fair Value Measurements — Investment Funds for a discussion of the trusts, plans, and types of investments. The NDT and ART may invest in derivative instruments which may include swaps, futures, options, forwards, and other instruments. At June 30, 2023, and September 30, 2022, the NDT held investments in forward contracts to purchase debt securities. The fair values of these derivatives were in net asset positions totaling $8 million and $4 million at June 30, 2023, and September 30, 2022, respectively.
Collateral. TVA's interest rate swaps, currency swaps, and commodity derivatives under the FHP contain contract provisions that require a party to post collateral (in a form such as cash or a letter of credit) when the party's liability balance under the agreement exceeds a certain threshold. At June 30, 2023, the aggregate fair value of all derivative instruments with credit-risk related contingent features that were in a liability position was $1.3 billion. TVA's collateral obligations at June 30, 2023, under these arrangements were $549 million, for which TVA had posted $569 million in letters of credit. These letters of credit reduce the available balance under the related credit facilities. TVA's assessment of the risk of its nonperformance includes a reduction in its exposure under the interest rate swap contracts as a result of this posted collateral.
For all of its derivative instruments with credit-risk related contingent features:
•If TVA remains a majority-owned U.S. government entity but Standard & Poor's Financial Services, LLC or Moody's Investors Service, Inc. ("Moody's") downgrades TVA's credit rating to AA or Aa2, respectively, TVA's collateral obligations would likely increase by $22 million, and
•If TVA ceases to be majority-owned by the U.S. government, TVA's credit rating would likely be downgraded and TVA would be required to post additional collateral.
Counterparty Risk
TVA may be exposed to certain risks when a counterparty has the potential to fail to meet its obligations in accordance with agreed terms. These risks may be related to credit, operational, or nonperformance matters. To mitigate certain counterparty risk, TVA analyzes the counterparty's financial condition prior to entering into an agreement, establishes credit limits, monitors the appropriateness of those limits, as well as any changes in the creditworthiness of the counterparty, on an ongoing basis, and when required, employs credit mitigation measures, such as collateral or prepayment arrangements and
master purchase and sale agreements.
Customers. TVA is exposed to counterparty credit risk associated with trade accounts receivable from delivered power sales to LPCs, and from industries and federal agencies directly served, all located in the Tennessee Valley region. Of the $1.5 billion and $1.9 billion of receivables from power sales outstanding at June 30, 2023, and September 30, 2022, respectively, the majority of the counterparties were rated investment grade. The obligations of these customers that are not investment grade are secured by collateral. TVA is also exposed to risk from exchange power arrangements with a small number of investor-owned regional utilities related to either delivered power or the replacement of open positions of longer-term purchased power or fuel agreements. TVA believes its policies and procedures for counterparty performance risk reviews have generally protected TVA against significant exposure related to market and economic conditions. See Note 1 — Summary of Significant Accounting Policies — Allowance for Uncollectible Accounts, Note 3 — Accounts Receivable, Net, and Note 7 — Other Long-Term Assets.
TVA had revenue from two LPCs that collectively accounted for 16 percent of total operating revenues for both the nine months ended June 30, 2023 and the nine months ended June 30, 2022.
Suppliers. TVA assesses potential supplier performance risks, including procurement of fuel, parts, and services. If suppliers are unable to perform under TVA's existing contracts or if TVA is unable to obtain similar services or supplies from other vendors, TVA could experience delays, disruptions, additional costs, or other operational outcomes that may impact generation,
maintenance, and capital programs. If certain fuel or purchased power suppliers fail to perform under the terms of their contract with TVA, TVA might lose the money that it paid to the supplier under the contract and have to purchase replacement fuel or power on the spot market, perhaps at a significantly higher price than TVA was entitled to pay under the contract. In addition, TVA might not be able to acquire replacement fuel or power in a timely manner and thus might be unable to satisfy its own obligations to deliver power. TVA continues evaluating potential supplier performance risks and supplier impact but cannot determine or predict the duration of such risks/impacts or the extent to which such risks/impacts could affect TVA's business, operations, and financial results or cause potential business disruptions.
TVA has experienced an increase in supplier impacts as a result of the state of global supply chains and the economy, such as project delays, limited availability of supplies, and price increases. Russia's invasion of Ukraine has further intensified the state of global supply chains and inflationary pressures, and TVA will continue to monitor these pressures.
Natural Gas. TVA purchases a significant amount of its natural gas requirements through contracts with a variety of suppliers and purchases substantially all of its fuel oil requirements on the spot market. TVA delivers to its gas fleet under firm and non-firm transportation contracts on multiple interstate natural gas pipelines. TVA contracts for storage capacity that allows for operational flexibility and increased supply during peak gas demand scenarios or supply disruptions. TVA plans to continue using contracts of various lengths and terms to meet the projected natural gas needs of its natural gas fleet. TVA also maintains on-site, fuel oil backup to operate at the majority of the combustion turbine sites in the event of major supply disruptions. In the event suppliers are unable to perform under existing contracts, TVA can utilize its storage portfolio or other suppliers to help secure replacement natural gas volumes.
Coal. To help ensure a reliable supply of coal, TVA had coal contracts with multiple suppliers as of June 30, 2023. The contracted supply of coal is sourced from several geographic regions of the U.S. and is delivered via barge and rail. As a result of emerging technologies, environmental regulations, industry trends, and natural gas market volatility over the past few years, coal suppliers are facing increased financial pressure, which has led to relatively poor credit ratings and bankruptcies, restructuring, mine closures, or other scenarios. A long-term continued decline in demand for coal could result in more consolidations, additional bankruptcies, restructuring, mine closures, or other scenarios.
Nuclear Fuel. Nuclear fuel is obtained predominantly through long-term uranium concentrate supply contracts, contracted conversion services, contracted enrichment services, or a combination thereof, and contracted fuel fabrication services. The supply markets for uranium concentrates and certain nuclear fuel services are subject to price fluctuations and availability restrictions. Supply market conditions may make procurement contracts subject to credit risk related to the potential nonperformance of counterparties. In the event of nonperformance by these or other suppliers, TVA believes that replacement uranium concentrate and nuclear fuel services can be obtained, although at prices that may be unfavorable when compared to the prices under the current supply agreements.
As a result of Russia’s invasion of Ukraine, new contracts for Russian origin nuclear fuel have been limited by Executive Order ("EO") 14066, and further restrictions on the purchase or use of Russian origin fuel may be forthcoming. TVA should have no direct impact from existing or future restrictions since TVA has no Russian origin nuclear fuel in inventory for use in its reactors and it is not contracted to purchase any Russian origin nuclear fuel. TVA could be impacted by higher market prices as a result of general market impacts associated with supply restrictions; however, at this time TVA's nuclear fuel is obtained predominantly through long-term contracts.
Purchased Power. TVA acquires power from a variety of power producers through long-term and short-term power purchase agreements ("PPAs") as well as through spot market purchases. Because of the reliability risk of purchased power, TVA requires that the PPAs contain certain counterparty performance assurance requirements to help insure counterparty performance during the term of the agreements.
Other Suppliers. Mounting solar supply chain constraints, commodity price increases, and the recent trade policy investigation into solar panel imports have created challenges for the U.S. solar industry. Both TVA's Self-Directed Solar project and existing solar PPA portfolio are not immune from these challenges. Similar to the experience of the rest of the industry, the majority of TVA's contracted PPAs from previous requests for proposals ("RFPs") that are not yet online have been impacted by project delays and prices increases, and TVA terminated one PPA because of counterparty default.
Derivative Counterparties. TVA has entered into physical and financial contracts that are classified as derivatives for hedging purposes, and TVA's NDT, ART, and qualified defined benefit plan ("pension plan") have entered into derivative contracts for investment purposes. If a counterparty to one of the physical or financial derivative transactions defaults, TVA might incur costs in connection with entering into a replacement transaction. If a counterparty to the derivative contracts into which the NDT, the ART, or the pension plan have entered for investment purposes defaults, the value of the investment could decline significantly or perhaps become worthless. TVA has concentrations of credit risk from the banking, coal, and gas industries because multiple companies in these industries serve as counterparties to TVA in various derivative transactions. At June 30, 2023, all of TVA's commodity derivatives under the FHP, currency swaps, interest rate swaps, and PPAs with option to settle were with counterparties whose Moody's credit ratings were A2 or higher. TVA classifies forward natural gas contracts as derivatives. At June 30, 2023, the natural gas contracts were with counterparties whose ratings ranged from B1 to A1.
14. Fair Value Measurements
Fair value is determined based on the exchange price that would be received for an asset or paid to transfer a liability (an exit price) in the asset or liability's principal market, or in the absence of a principal market, the most advantageous market for the asset or liability in an orderly transaction between market participants. TVA uses market or observable inputs as the preferred source of values, followed by assumptions based on hypothetical transactions in the absence of market inputs.
Valuation Techniques
The measurement of fair value results in classification into a hierarchy by the inputs used to determine the fair value as follows:
| | | | | | | | | | | |
| Level 1 | —
| | Unadjusted quoted prices in active markets accessible by the reporting entity for identical assets or liabilities. Active markets are those in which transactions for the asset or liability occur with sufficient frequency and volume to provide pricing. |
Level 2
| —
| | Pricing inputs other than quoted market prices included in Level 1 that are based on observable market data and that are directly or indirectly observable for substantially the full term of the asset or liability. These include quoted market prices for similar assets or liabilities, quoted market prices for identical or similar assets in markets that are not active, adjusted quoted market prices, inputs from observable data such as interest rate and yield curves, volatilities and default rates observable at commonly quoted intervals, and inputs derived from observable market data by correlation or other means. |
| Level 3 | —
| | Pricing inputs that are unobservable, or less observable, from objective sources. Unobservable inputs are only to be used to the extent observable inputs are not available. These inputs maintain the concept of an exit price from the perspective of a market participant and should reflect assumptions of other market participants. An entity should consider all market participant assumptions that are available without unreasonable cost and effort. These are given the lowest priority and are generally used in internally developed methodologies to generate management's best estimate of the fair value when no observable market data is available. |
A financial instrument's level within the fair value hierarchy (where Level 1 is the highest and Level 3 is the lowest) is based on the lowest level of input significant to the fair value measurement.
The following sections describe the valuation methodologies TVA uses to measure different financial instruments at fair value. Except for gains and losses on SERP and DCP assets, all changes in fair value of these assets and liabilities have been recorded as changes in regulatory assets, regulatory liabilities, or AOCI on TVA's Consolidated Balance Sheets and Consolidated Statements of Comprehensive Income (Loss). Except for gains and losses on SERP and DCP assets, there has been no impact to the Consolidated Statements of Operations or the Consolidated Statements of Cash Flows related to these fair value measurements.
Investment Funds
At June 30, 2023, Investment funds were comprised of $4.2 billion of equity securities and debt securities classified as trading measured at fair value. Equity and trading debt securities are held in the NDT, ART, SERP, and DCP. The NDT holds funds for the ultimate decommissioning of TVA's nuclear power plants. The ART holds funds primarily for the costs related to the future closure and retirement of TVA's other long-lived assets. The balances in the NDT and ART were $2.9 billion and $1.2 billion, respectively, at June 30, 2023.
TVA established a SERP to provide benefits to selected employees of TVA which are comparable to those provided by competing organizations. The DCP is designed to provide participants with the ability to defer compensation to future periods. The NDT, ART, SERP, and DCP funds are invested in portfolios of securities generally designed to achieve a return in line with overall equity and debt market performance.
The NDT, ART, SERP, and DCP are composed of multiple types of investments and are managed by external institutional investment managers. Most U.S. and international equities, U.S. Treasury inflation-protected securities, real estate investment trust securities, and cash securities and certain derivative instruments are measured based on quoted exchange prices in active markets and are classified as Level 1 valuations. Fixed-income investments, high-yield fixed-income investments, currencies, and most derivative instruments are non-exchange traded and are classified as Level 2 valuations. These measurements are based on market and income approaches with observable market inputs.
Private equity limited partnerships, private real asset investments, and private credit investments may include holdings of investments in private real estate, venture capital, buyout, mezzanine or subordinated debt, restructuring or distressed debt, and special situations through funds managed by third-party investment managers. These investments generally involve a three-to-four-year period where the investor contributes capital, followed by a period of distribution, typically over several years. The investment period is generally, at a minimum, 10 years or longer. The NDT had unfunded commitments related to private equity limited partnerships of $210 million, private real assets of $123 million, and private credit of $64 million at June 30, 2023. The ART had unfunded commitments related to limited partnerships in private equity of $116 million, private real assets of $61 million, and private credit of $34 million at June 30, 2023. These investments have no redemption or limited redemption options and may also impose restrictions on the NDT's and ART's ability to liquidate their investments. There are no readily available quoted exchange prices for these investments. The fair value of these investments is based on information provided by the investment managers. These investments are valued on a quarterly basis. TVA's private equity limited partnerships, private real asset investments, and private credit investments are valued at net asset values ("NAV") as a practical expedient for fair value. TVA classifies its interest in these types of investments as investments measured at NAV in the fair value hierarchy.
Commingled funds represent investment funds comprising multiple individual financial instruments. The commingled funds held by the NDT, ART, SERP, and DCP consist of either a single class of securities, such as equity, debt, or foreign currency securities, or multiple classes of securities. All underlying positions in these commingled funds are either exchange traded or measured using observable inputs for similar instruments. The fair value of commingled funds is based on NAV per fund share (the unit of account), derived from the prices of the underlying securities in the funds. These commingled funds can be redeemed at the measurement date NAV and are classified as Commingled funds measured at NAV in the fair value hierarchy.
Realized and unrealized gains and losses on equity and trading debt securities are recognized in current earnings and are based on average cost. The gains and losses of the NDT and ART are subsequently reclassified to a regulatory asset or liability account in accordance with TVA's regulatory accounting policy. See Note 1 — Summary of Significant Accounting Policies — Cost-Based Regulation and Note 8 — Regulatory Assets and Liabilities. TVA recorded unrealized gains and losses related to its equity and trading debt securities held during each period as follows:
| | | | | | | | | | | | | | | | | | | | | | | | | | | | | | | | | |
Unrealized Investment Gains (Losses) (in millions) |
| | | | Three Months Ended June 30 | | Nine Months Ended June 30 | |
| Fund | | Financial Statement Presentation | | 2023 | | 2022 | | 2023 | | 2022 | |
| NDT | | Regulatory assets(1) | | $ | 51 | | | $ | (331) | | | $ | 292 | | | $ | (305) | | |
| ART | | Regulatory assets(2) | | 24 | | | (139) | | | 145 | | | (147) | | |
| SERP | | Other income (expense) | | 2 | | | (9) | | | 9 | | | (14) | | |
| DCP | | Other income (expense) | | 1 | | | (2) | | | 2 | | | (4) | | |
Notes
(1) Includes $31 million of unrealized gains and $105 million of unrealized losses related to NDT equity securities (excluding commingled funds) for the three months ended June 30, 2023 and 2022, respectively. Includes $79 million of unrealized gains and $85 million of unrealized losses related to NDT equity securities (excluding commingled funds) for the nine months ended June 30, 2023 and 2022, respectively.
(2) Includes $7 million of unrealized gains and $35 million of unrealized losses related to ART equity securities (excluding commingled funds) for the three months ended June 30, 2023 and 2022, respectively. Includes $23 million of unrealized gains and $26 million of unrealized losses related to ART equity securities (excluding commingled funds) for nine months ended June 30, 2023 and 2022, respectively.
Currency and Interest Rate Swap Derivatives
See Note 13 — Risk Management Activities and Derivative Transactions — Cash Flow Hedging Strategy for Currency Swaps and Derivatives Not Receiving Hedge Accounting Treatment for a discussion of the nature, purpose, and contingent features of TVA's currency swaps and interest rate swaps. These swaps are classified as Level 2 valuations and are valued based on income approaches using observable market inputs for similar instruments.
Commodity Contract Derivatives and Commodity Derivatives under the FHP
Commodity Contract Derivatives. Most of these derivative contracts are valued based on market approaches, which utilize short-term and mid-term market-quoted prices from an external industry brokerage service. Embedded derivatives for power purchase agreements are valued based on an income approach using observable market inputs provided by an independent industry pricing service. These contracts are classified as Level 2 valuations.
Commodity Derivatives under the FHP. Swap contracts are valued using a pricing model based on New York Mercantile Exchange inputs and are subject to nonperformance risk outside of the exit price. These contracts are classified as Level 2 valuations.
See Note 13 — Risk Management Activities and Derivative Transactions — Derivatives Not Receiving Hedge Accounting Treatment — Commodity Contract Derivatives and — Commodity Derivatives under the FHP.
Nonperformance Risk
The assessment of nonperformance risk, which includes credit risk, considers changes in current market conditions, readily available information on nonperformance risk, letters of credit, collateral, other arrangements available, and the nature of master netting arrangements. TVA is a counterparty to currency swaps, interest rate swaps, commodity contracts, and other derivatives which subject TVA to nonperformance risk. Nonperformance risk on the majority of investments and certain exchange-traded instruments held by TVA is incorporated into the exit price that is derived from quoted market data that is used to mark the investment to market.
Nonperformance risk for most of TVA's derivative instruments is an adjustment to the asset/liability fair value. TVA adjusts for nonperformance risk, both of TVA (for liabilities) and the counterparty (for assets), by applying credit valuation adjustments ("CVAs"). TVA determines an appropriate CVA for each applicable financial instrument based on the term of the instrument and TVA's or the counterparty's credit rating as obtained from Moody's. For companies that do not have an observable credit rating, TVA uses internal analysis to assign a comparable rating to the counterparty. TVA discounts each financial instrument using the historical default rate (as reported by Moody's for CY 1983 to CY 2022) for companies with a similar credit rating over a time period consistent with the remaining term of the contract. The application of CVAs resulted in a less than $1 million decrease in the fair value of assets and a $1 million decrease in the fair value of liabilities at June 30, 2023.
Fair Value Measurements
The following tables set forth by level, within the fair value hierarchy, TVA's financial assets and liabilities that were measured at fair value on a recurring basis at June 30, 2023, and September 30, 2022. Financial assets and liabilities have been classified in their entirety based on the lowest level of input that is significant to the fair value measurement. TVA's assessment of the significance of a particular input to the fair value measurement requires judgment and may affect the determination of the fair value of the assets and liabilities and their classification in the fair value hierarchy levels.
| | | | | | | | | | | | | | | | | | | | | | | |
Fair Value Measurements
At June 30, 2023
(in millions) |
| Quoted Prices in Active
Markets for
Identical Assets
(Level 1) | | Significant Other
Observable Inputs
(Level 2) | | Significant
Unobservable
Inputs
(Level 3) | | Total |
| Assets | | | | | | | |
| Investments | | | | | | | |
| Equity securities | $ | 658 | | | $ | — | | | $ | — | | | $ | 658 | |
Government debt securities(1) | 302 | | | 61 | | | — | | | 363 | |
Corporate debt securities(2) | — | | | 444 | | | — | | | 444 | |
| Mortgage and asset-backed securities | — | | | 35 | | | — | | | 35 | |
Institutional mutual funds | 290 | | | — | | | — | | | 290 | |
| Forward debt securities contracts | — | | | 8 | | | — | | | 8 | |
Private equity funds measured at net asset value(3) | — | | | — | | | — | | | 605 | |
Private real asset funds measured at net asset value(3) | — | | | — | | | — | | | 382 | |
Private credit measured at net asset value(3) | — | | | — | | | — | | | 144 | |
Commingled funds measured at net asset value(3) | — | | | — | | | — | | | 1,273 | |
| Total investments | 1,250 | | | 548 | | | — | | | 4,202 | |
| | | | | | | |
| Commodity contract derivatives | — | | | 22 | | | — | | | 22 | |
| | | | | | | |
| | | | | | | |
| Total | $ | 1,250 | | | $ | 570 | | | $ | — | | | $ | 4,224 | |
| | | | | | | |
| Quoted Prices in Active
Markets for
Identical Liabilities
(Level 1) | | Significant Other
Observable Inputs
(Level 2) | | Significant
Unobservable
Inputs
(Level 3) | | Total |
| Liabilities | | | | | | | |
Currency swaps(4) | $ | — | | | $ | 161 | | | $ | — | | | $ | 161 | |
| Interest rate swaps | — | | | 837 | | | — | | | 837 | |
| Commodity contract derivatives | — | | | 11 | | | — | | | 11 | |
| Commodity derivatives under the FHP | — | | | 247 | | | — | | | 247 | |
| | | | | | | |
| Total | $ | — | | | $ | 1,256 | | | $ | — | | | $ | 1,256 | |
Notes
(1) Includes government-sponsored entities, including $302 million of U.S. Treasury securities within Level 1 of the fair value hierarchy.
(2) Includes both U.S. and foreign debt.
(3) Certain investments that are measured at fair value using the NAV per share (or its equivalent) practical expedient have not been categorized in the fair value hierarchy. The fair value amounts presented in this table are intended to permit reconciliation of the fair value hierarchy to the amounts presented on the Consolidated Balance Sheets.
(4) TVA records currency swaps net of cash collateral received from or paid to the counterparty if applicable, to the extent such amount is not recorded in Accounts payable and accrued liabilities. See Note 13 — Risk Management Activities and Derivative Transactions — Offsetting of Derivative Assets and Liabilities.
| | | | | | | | | | | | | | | | | | | | | | | |
Fair Value Measurements
At September 30, 2022
(in millions) |
| Quoted Prices in Active
Markets for
Identical Assets
(Level 1) | | Significant Other
Observable Inputs
(Level 2) | | Significant
Unobservable
Inputs
(Level 3) | | Total |
| Assets | | | | | | | |
| Investments | | | | | | | |
| Equity securities | $ | 534 | | | $ | — | | | $ | — | | | $ | 534 | |
Government debt securities(1) | 358 | | | 36 | | | — | | | 394 | |
Corporate debt securities(2) | — | | | 283 | | | — | | | 283 | |
| Mortgage and asset-backed securities | — | | | 52 | | | — | | | 52 | |
Institutional mutual funds | 242 | | | — | | | — | | | 242 | |
Forward debt securities contracts | — | | | 4 | | | — | | | 4 | |
Private equity funds measured at net asset value(3) | — | | | — | | | — | | | 487 | |
Private real asset funds measured at net asset value(3) | — | | | — | | | — | | | 369 | |
Private credit measured at net asset value(3) | — | | | — | | | — | | | 103 | |
Commingled funds measured at net asset value(3) | — | | | — | | | — | | | 1,203 | |
| Total investments | 1,134 | | | 375 | | | — | | | 3,671 | |
| | | | | | | |
| Commodity contract derivatives | — | | | 152 | | | — | | | 152 | |
| Commodity derivatives under the FHP | — | | | 123 | | | — | | | 123 | |
| | | | | | | |
| Total | $ | 1,134 | | | $ | 650 | | | $ | — | | | $ | 3,946 | |
| | | | | | | |
| | | | | | | |
| Quoted Prices in Active
Markets for
Identical Liabilities
(Level 1) | | Significant Other
Observable Inputs
(Level 2) | | Significant
Unobservable
Inputs
(Level 3) | | Total |
| Liabilities | | | | | | | |
Currency swaps(4) | $ | — | | | $ | 240 | | | $ | — | | | $ | 240 | |
| Interest rate swaps | — | | | 905 | | | — | | | 905 | |
| Commodity contract derivatives | — | | | 7 | | | — | | | 7 | |
| Commodity derivatives under the FHP | — | | | 8 | | | — | | | 8 | |
| | | | | | | |
| Total | $ | — | | | $ | 1,160 | | | $ | — | | | $ | 1,160 | |
Notes
(1) Includes government-sponsored entities, including $358 million of U.S. Treasury securities within Level 1 of the fair value hierarchy.
(2) Includes both U.S. and foreign debt.
(3) Certain investments that are measured at fair value using the NAV per share (or its equivalent) practical expedient have not been categorized in the fair value hierarchy. The fair value amounts presented in this table are intended to permit reconciliation of the fair value hierarchy to the amounts presented on the Consolidated Balance Sheets.
(4) TVA records currency swaps net of cash collateral received from or paid to the counterparty if applicable, to the extent such amount is not recorded in Accounts payable and accrued liabilities. See Note 13 — Risk Management Activities and Derivative Transactions — Offsetting of Derivative Assets and Liabilities.
Other Financial Instruments Not Recorded at Fair Value
TVA uses the methods and assumptions described below to estimate the fair value of each significant class of financial instruments. The fair value of the financial instruments held at June 30, 2023, and September 30, 2022, may not be representative of the actual gains or losses that will be recorded when these instruments mature or are called or presented for early redemption. The estimated values of TVA's financial instruments not recorded at fair value at June 30, 2023, and September 30, 2022, were as follows:
| | | | | | | | | | | | | | | | | | | | | | | | | | | | | |
Estimated Values of Financial Instruments Not Recorded at Fair Value
(in millions) |
| | | | At June 30, 2023 | | At September 30, 2022 |
| | Valuation Classification | | Carrying
Amount | | Fair
Value | | Carrying
Amount | | Fair
Value |
EnergyRight® receivables, net (including current portion) | Level 2 | | $ | 59 | | | $ | 59 | | | $ | 62 | | | $ | 62 | |
| | | | | | | | | |
| Loans and other long-term receivables, net (including current portion) | Level 2 | | 135 | | | 127 | | | 105 | | | 96 | |
| | | | | | | | | |
EnergyRight® financing obligations (including current portion) | Level 2 | | 69 | | | 78 | | | 72 | | | 81 | |
| | | | | | | | | |
| | | | | | | | | |
| | | | | | | | | |
| Membership interests of VIEs subject to mandatory redemption (including current portion) | Level 2 | | 18 | | | 21 | | | 20 | | | 22 | |
| | | | | | | | | |
| Long-term outstanding power bonds, net (including current maturities) | Level 2 | | 18,883 | | | 18,971 | | | 17,856 | | | 18,070 | |
| | | | | | | | | |
| Long-term debt of VIEs, net (including current maturities) | Level 2 | | 986 | | | 988 | | | 1,007 | | | 989 | |
| | | | | | | | | |
| | | | | | | | | |
The carrying value of Cash and cash equivalents, Restricted cash and cash equivalents, Accounts receivable, net, and Short-term debt, net approximate their fair values.
The fair value for loans and other long-term receivables is estimated by determining the present value of future cash flows using a discount rate equal to lending rates for similar loans made to borrowers with similar credit ratings and for similar remaining maturities, where applicable. The fair value of long-term debt and membership interests of VIEs subject to mandatory redemption is estimated by determining the present value of future cash flows using current market rates for similar obligations, giving effect to credit ratings and remaining maturities.
15. Revenue
Revenue from Sales of Electricity
TVA's revenue from contracts with customers is primarily derived from the generation and sale of electricity to its customers and is included in Revenue from sales of electricity on the Consolidated Statements of Operations. Electricity is sold primarily to LPCs for distribution to their end-use customers. In addition, TVA sells electricity to directly served industrial companies, federal agencies, and others.
| | | | | |
| LPC sales | Approximately 91 percent of TVA's Revenue from sales of electricity for both the three and nine months ended June 30, 2023, was from LPCs, which then distribute the power to their customers using their own distribution systems. Power is delivered to each LPC at delivery points within the LPC's service territory. TVA recognizes revenue when the customer takes possession of the power at the delivery point. For power sales, the performance obligation to deliver power is satisfied in a series over time because the sales of electricity over the term of the customer contract are a series of distinct goods that are substantially the same and have the same pattern of transfer to the customer. TVA has no continuing performance obligations subsequent to delivery. Using the output method for revenue recognition provides a faithful depiction of the transfer of electricity as customers obtain control of the power and benefit from its use at delivery. Additionally, TVA has an enforceable right to consideration for energy delivered at any discrete point in time and will recognize revenue at an amount that reflects the consideration to which TVA is entitled for the energy delivered.
The amount of revenue is based on contractual prices approved by the TVA Board. Customers are invoiced monthly for power delivered as measured by meters located at the delivery points. The net transaction price is offset by certain credits available to customers that are known at the time of billing. Credits are designed to achieve objectives of the TVA Act and include items such as hydro preference credits for residential customers of LPCs, economic development credits to promote growth in the Tennessee Valley, wholesale bill credits to maintain long-term partnerships with LPCs, pandemic credits created to support LPCs and strengthen the public power response to the COVID-19 pandemic, and demand response credits allowing TVA to reduce industrial customer usage in periods of peak demand to balance system demand. Payments are typically due within approximately one month of invoice issuance. |
| |
| Directly served customers | Directly served customers, including industrial customers, federal agencies, and other customers, take power for their own consumption. Similar to LPCs, power is delivered to a delivery point, at which time the customer takes possession and TVA recognizes revenue. For all power sales, the performance obligation to deliver power is satisfied in a series over time since the sales of electricity over the term of the customer contract are a series of distinct goods that are substantially the same and have the same pattern of transfer to the customer. TVA has no continuing performance obligations subsequent to delivery. Using the output method for revenue recognition provides a faithful depiction of the transfer of electricity as customers obtain control of the power and benefit from its use at delivery. Additionally, TVA has an enforceable right to consideration for energy delivered at any discrete point in time and will recognize revenue at an amount that reflects the consideration to which TVA is entitled for the energy delivered.
The amount of revenue is based on contractual prices approved by the TVA Board. Customers are invoiced monthly for power delivered as measured by meters located at the delivery points. The net transaction price is offset by certain credits available to customers that are known at the time of billing. Examples of credits include items such as economic development credits to promote growth in the Tennessee Valley, pandemic credits created to support directly served customers in response to the COVID-19 pandemic, and demand response credits allowing TVA to reduce industrial customer usage in periods of peak demand to balance system demand. Payments are typically due within approximately one month of invoice issuance. |
Other Revenue
Other revenue consists primarily of wheeling and network transmission charges, sales of excess steam that is a by-product of power production, delivery point charges for interconnection points between TVA and the customer, REC sales, and certain other ancillary goods or services.
Disaggregated Revenues
During the three and nine months ended June 30, 2023, revenues generated from TVA's electricity sales were $2.7 billion and $8.6 billion, respectively, and accounted for virtually all of TVA's revenues. TVA's operating revenues by state for the three and nine months ended June 30, 2023 and 2022, are detailed in the table below:
| | | | | | | | | | | | | | | | | | | | | | | |
Operating Revenues By State (in millions) |
| Three Months Ended June 30 | | Nine Months Ended June 30 |
| | 2023 | | 2022 | | 2023 | | 2022 |
Alabama | $ | 388 | | | $ | 419 | | | $ | 1,244 | | | $ | 1,203 | |
Georgia | 59 | | | 69 | | | 207 | | | 207 | |
Kentucky | 172 | | | 195 | | | 562 | | | 556 | |
Mississippi | 263 | | | 283 | | | 814 | | | 788 | |
North Carolina | 17 | | | 20 | | | 67 | | | 63 | |
Tennessee | 1,754 | | | 1,929 | | | 5,613 | | | 5,455 | |
Virginia | 9 | | | 10 | | | 35 | | | 34 | |
| Subtotal | 2,662 | | | 2,925 | | | 8,542 | | | 8,306 | |
| Off-system sales | 2 | | | 7 | | | 9 | | | 12 | |
| | | | | | | |
| Revenue from sales of electricity | 2,664 | | | 2,932 | | | 8,551 | | | 8,318 | |
| Other revenue | 34 | | | 38 | | | 121 | | | 119 | |
| Total operating revenues | $ | 2,698 | | | $ | 2,970 | | | $ | 8,672 | | | $ | 8,437 | |
TVA's operating revenues by customer type for the three and nine months ended June 30, 2023 and 2022, are detailed in the table below:
| | | | | | | | | | | | | | | | | | | | | | | |
Operating Revenues by Customer Type (in millions) |
| Three Months Ended June 30 | | Nine Months Ended June 30 |
| | 2023 | | 2022 | | 2023 | | 2022 |
| Revenue from sales of electricity | | | | | | | |
| Local power companies | $ | 2,431 | | | $ | 2,662 | | | $ | 7,811 | | | $ | 7,576 | |
| Industries directly served | 203 | | | 229 | | | 645 | | | 640 | |
| Federal agencies and other | 30 | | | 41 | | | 95 | | | 102 | |
| Revenue from sales of electricity | 2,664 | | | 2,932 | | | 8,551 | | | 8,318 | |
| Other revenue | 34 | | | 38 | | | 121 | | | 119 | |
| Total operating revenues | $ | 2,698 | | | $ | 2,970 | | | $ | 8,672 | | | $ | 8,437 | |
TVA and LPCs continue to work together to meet the changing needs of consumers around the Tennessee Valley. In 2019, the TVA Board approved a partnership agreement option that better aligns the length of LPC power contracts with TVA's long-term commitments. Under the partnership arrangement, the LPC power contracts automatically renew each year and have a 20-year termination notice. The partnership arrangements can be terminated under certain circumstances, including TVA's failure to limit rate increases as provided for in the agreements going forward. Participating LPCs receive benefits including a 3.1 percent wholesale bill credit in exchange for their long-term commitment, which enables TVA to recover its long-term financial commitments over a commensurate period. The total wholesale bill credits to LPCs participating in the partnership agreement were $45 million and $48 million for the three months ended June 30, 2023 and 2022, respectively. The total wholesale bill credits to LPCs participating in the partnership agreement were $140 million and $141 million for the nine months ended June 30, 2023 and 2022, respectively. In 2020, TVA provided participating LPCs a flexibility option, named Generation Flexibility, that allows them to locally generate or purchase up to approximately five percent of their average total hourly energy sales over a certain time period in order to meet their individual customers' needs. As of July 31, 2023, 147 LPCs had signed the partnership agreement with TVA, and 86 LPCs had signed a Power Supply Flexibility Agreement.
In 2021, the TVA Board approved a 2.5 percent monthly base rate credit, the Pandemic Recovery Credit, which was effective for 2022. In 2022, the TVA Board approved a 2.5 percent monthly base rate credit, which is an extension of the Pandemic Recovery Credit, and is effective for 2023. These pandemic credits apply to service provided to TVA's LPCs, their large commercial and industrial customers, and TVA directly served customers. The 2023 credit is expected to approximate $230 million. For the three months ended June 30, 2023 and 2022, pandemic credits totaled $52 million and $56 million,
respectively. For the nine months ended June 30, 2023 and 2022, pandemic credits totaled $158 million and $161 million, respectively.
The number of LPCs by contract arrangement, the revenues derived from such arrangements for the three and nine months ended June 30, 2023, and the percentage those revenues comprised of TVA's total operating revenues for the same periods, are summarized in the tables below: | | | | | | | | | | | | | | | | | | | | |
TVA Local Power Company Contracts At or for the Three Months Ended June 30, 2023 |
Contract Arrangements(1) | | Number of LPCs | | Revenue from Sales of Electricity to LPCs
(in millions) | | Percentage of Total Operating Revenues |
| 20-year termination notice | | 147 | | | $ | 2,073 | | | 76.8 | % |
| | | | | | |
| | | | | | |
| | | | | | |
| | | | | | |
| 5-year termination notice | | 6 | | | 358 | | | 13.3 | % |
| Total | | 153 | | | $ | 2,431 | | | 90.1 | % |
Note
(1) Ordinarily, the LPCs and TVA have the same termination notice period; however, in a contract with one of the LPCs with a five-year termination notice, TVA has a 10-year termination notice (which becomes a five-year termination notice if TVA loses its discretionary wholesale rate-setting authority). Certain LPCs have five-year termination notices or a shorter period if any act of Congress, court decision, or regulatory change requires or permits that election.
| | | | | | | | | | | | | | | | | | | | |
TVA Local Power Company Contracts At or for the Nine Months Ended June 30, 2023 |
Contract Arrangements(1) | | Number of LPCs | | Revenue from Sales of Electricity to LPCs
(in millions) | | Percentage of Total Operating Revenues |
| 20-year termination notice | | 147 | | | $ | 6,741 | | | 77.7 | % |
| | | | | | |
| | | | | | |
| | | | | | |
| | | | | | |
| 5-year termination notice | | 6 | | | 1,070 | | | 12.3 | % |
| Total | | 153 | | | $ | 7,811 | | | 90.0 | % |
Note(1) Ordinarily, the LPCs and TVA have the same termination notice period; however, in a contract with one of the LPCs with a five-year termination notice, TVA has a 10-year termination notice (which becomes a five-year termination notice if TVA loses its discretionary wholesale rate-setting authority). Certain LPCs have five-year termination notices or a shorter period if any act of Congress, court decision, or regulatory change requires or permits that election.
TVA's two largest LPCs — Memphis Light, Gas and Water Division ("MLGW") and Nashville Electric Service ("NES") — have contracts with a five-year and a 20-year termination notice period, respectively. Sales to MLGW and NES each accounted for eight percent of TVA's total operating revenues for both the nine months ended June 30, 2023 and the nine months ended June 30, 2022.
Contract Balances
Contract assets represent an entity's right to consideration in exchange for goods and services that the entity has transferred to customers. TVA did not have any material contract assets at June 30, 2023.
Contract liabilities represent an entity's obligations to transfer goods or services to customers for which the entity has received consideration (or an amount of consideration is due) from the customers. These contract liabilities are primarily related to upfront consideration received prior to the satisfaction of the performance obligation. See Economic Development Incentives below and Note 10 — Other Long-Term Liabilities — Long-Term Deferred Revenue.
Economic Development Incentives. Under certain economic development programs, TVA offers incentives to existing and potential power customers in targeted business sectors that make multi-year commitments to invest in the Tennessee Valley. TVA records those incentives as reductions of revenue. Incentives recorded as a reduction to revenue were $84 million and $81 million for the three months ended June 30, 2023 and 2022, respectively. Incentives recorded as a reduction to revenue were $248 million and $249 million for the nine months ended June 30, 2023 and 2022, respectively. Incentives that have been approved but have not been paid are recorded in Accounts payable and accrued liabilities and Other long-term liabilities on the Consolidated Balance Sheets. At June 30, 2023, and September 30, 2022, the outstanding unpaid incentives were $192 million and $187 million, respectively. Incentives that have been paid out may be subject to claw back if the customer fails to meet certain program requirements.
16. Other Income (Expense), Net
Income and expenses not related to TVA's operating activities are summarized in the following table:
| | | | | | | | | | | | | | | | | | | | | | | |
Other Income (Expense), Net (in millions) |
| | Three Months Ended June 30 | | Nine Months Ended June 30 |
| | 2023 | | 2022 | | 2023 | | 2022 |
| | | | | | | |
| Interest income | $ | 9 | | | $ | 2 | | | $ | 25 | | | $ | 9 | |
| External services | 5 | | | 3 | | | 11 | | | 11 | |
| Gains (losses) on investments | 5 | | | (11) | | | 15 | | | (13) | |
| Miscellaneous | 1 | | | — | | | 6 | | | 4 | |
| Other income (expense), net | $ | 20 | | | $ | (6) | | | $ | 57 | | | $ | 11 | |
17. Supplemental Cash Flow Information
Construction in progress and asset retirement obligation project accruals and nuclear fuel expenditures included in Accounts payable and accrued liabilities at June 30, 2023 and 2022, were $464 million and $470 million, respectively, and are excluded from the Consolidated Statements of Cash Flows for the nine months ended June 30, 2023 and 2022, as non-cash investing activities.
Cash flows from swap contracts that are accounted for as hedges are classified in the same category as the item being
hedged or on a basis consistent with the nature of the instrument.
18. Benefit Plans
TVA sponsors a pension plan that covers most of its full-time employees hired before July 1, 2014, a qualified defined contribution plan ("401(k) plan") that covers most of its full-time employees, two unfunded post-retirement health care plans that provide for non-vested contributions toward the cost of eligible retirees' medical coverage, other post-employment benefits, such as workers' compensation, and the SERP. The pension plan and the 401(k) plan are administered by a separate legal entity, the TVA Retirement System ("TVARS"), which is governed by its own board of directors.
The components of net periodic benefit cost and other amounts recognized as changes in regulatory assets for the three and nine months ended June 30, 2023 and 2022, were as follows:
| | | | | | | | | | | | | | | | | | | | | | | | | | | | | | | | | | | | | | | | | | | | | | | |
Components of TVA's Benefit Plans(1) (in millions) |
| | For the Three Months Ended June 30 | | For the Nine Months Ended June 30 |
| | Pension Benefits | | Other Post-Retirement Benefits | | Pension Benefits | | Other Post-Retirement Benefits |
| | 2023 | | 2022 | | 2023 | | 2022 | | 2023 | | 2022 | | 2023 | | 2022 |
| Service cost | $ | 8 | | | $ | 13 | | | $ | 3 | | | $ | 5 | | | $ | 24 | | | $ | 39 | | | $ | 9 | | | $ | 13 | |
| Interest cost | 142 | | | 94 | | | 5 | | | 4 | | | 426 | | | 283 | | | 16 | | | 11 | |
| Expected return on plan assets | (123) | | | (108) | | | — | | | — | | | (369) | | | (326) | | | — | | | — | |
| Amortization of prior service credit | (22) | | | (23) | | | (4) | | | (5) | | | (66) | | | (70) | | | (13) | | | (13) | |
| Recognized net actuarial loss | 34 | | | 97 | | | — | | | 2 | | | 101 | | | 294 | | | — | | | 5 | |
| Total net periodic benefit cost as actuarially determined | 39 | | | 73 | | | 4 | | | 6 | | | 116 | | | 220 | | | 12 | | | 16 | |
| Amount expensed due to actions of regulator | 19 | | | 3 | | | — | | | — | | | 58 | | | 10 | | | — | | | — | |
| Total net periodic benefit cost | $ | 58 | | | $ | 76 | | | $ | 4 | | | $ | 6 | | | $ | 174 | | | $ | 230 | | | $ | 12 | | | $ | 16 | |
Note
(1) The components of net benefit cost other than the service cost component are included in Other net periodic benefit cost on the Consolidated Statements of Operations.
TVA's minimum required pension plan contribution for 2023 is $300 million. TVA contributes $25 million per month to TVARS and as of June 30, 2023, had contributed $225 million. The remaining $75 million will be contributed by September 30, 2023. For the nine months ended June 30, 2023, TVA also contributed $79 million to the 401(k) plan and $19 million (net of $3 million in rebates) to the other post-retirement plans. TVA expects to contribute $6 million to the SERP in 2023.
19. Collaborative Arrangement
In December 2022, TVA, Ontario Power Generation, Synthos Green Energy, and GE Hitachi Nuclear Energy ("GEH") entered into a multi-party collaborative arrangement to advance the global deployment of the GEH BWRX-300 small modular reactor. GEH is responsible for standard design development. Under the agreement, TVA will contribute up to $88 million for design costs incurred by GEH through 2026. At the time feasibility is determined, TVA will have the right to use the design and may receive additional economic benefits.
Payments pursuant to the agreement are recorded as research and development expense, which is reflected as Operating and maintenance expense on TVA's Consolidated Statement of Operations in the period incurred. TVA recorded $6 million and $24 million of expenses related to this agreement for the three and nine months ended June 30, 2023, respectively. TVA also has a $6 million letter of credit posted under this arrangement at June 30, 2023.
20. Contingencies and Legal Proceedings
Contingencies
Nuclear Insurance. Section 170 of the Atomic Energy Act, commonly known as the Price-Anderson Act, provides a layered framework of financial protection to compensate for liability claims of members of the public for personal injury and property damages arising from a nuclear incident in the U.S. This financial protection consists of two layers of coverage. The primary level is private insurance underwritten by American Nuclear Insurers and provides public liability insurance coverage of $450 million for each nuclear power plant licensed to operate. If this amount is not sufficient to cover claims arising from a nuclear incident, the second level, Secondary Financial Protection, applies. Within the Secondary Financial Protection level, the licensee of each nuclear reactor has a contingent obligation to pay a retrospective premium, equal to its proportionate share of the loss in excess of the primary level, regardless of proximity to the incident of fault, up to a maximum of approximately $138 million per reactor per incident. With TVA's seven reactors, the maximum total contingent obligation per incident is $963 million. This retrospective premium is payable at a maximum rate currently set at approximately $20 million per year per nuclear incident per reactor. Currently, 96 reactors are participating in the Secondary Financial Protection program.
In the event that a nuclear incident results in public liability claims, the primary level provided by American Nuclear Insurers combined with the Secondary Financial Protection should provide up to approximately $13.7 billion in coverage.
Federal law requires that each Nuclear Regulatory Commission ("NRC") power reactor licensee obtain property insurance from private sources to cover the cost of stabilizing and decontaminating a reactor and its station site after an accident. TVA carries property, decommissioning liability, and decontamination liability insurance from Nuclear Electric Insurance Limited ("NEIL") and European Mutual Association for Nuclear Insurance. The limits available for a loss are up to $2.1 billion for two of TVA's nuclear sites and up to $2.8 billion for the remaining site. Some of this insurance may require the payment of retrospective premiums up to a maximum of approximately $114 million.
TVA purchases accidental outage (business interruption) insurance for TVA's nuclear sites from NEIL. In the event that an accident covered by this policy takes a nuclear unit offline or keeps a nuclear unit offline, NEIL will pay TVA, after a waiting period, an indemnity (a set dollar amount per week) with a maximum indemnity of $490 million per unit. This insurance policy may require the payment of retrospective premiums up to a maximum of approximately $44 million, but only to the extent the retrospective premium is deemed necessary by the NEIL Board of Directors to pay losses unable to be covered by NEIL's surplus.
Decommissioning Costs. TVA recognizes legal obligations associated with the future retirement of certain tangible long-lived assets related primarily to nuclear generating plants, coal-fired generating plants, hydroelectric generating plants/dams, transmission structures, and other property-related assets. See Note 11 — Asset Retirement Obligations.
Nuclear Decommissioning. Provision for decommissioning costs of nuclear generating units is based on options prescribed by the NRC procedures to dismantle and decontaminate the facilities to meet the NRC criteria for license termination. At June 30, 2023, $3.8 billion, representing the discounted value of future estimated nuclear decommissioning costs, was included in nuclear AROs. The actual decommissioning costs may vary from the derived estimates because of, among other things, changes in current assumptions, such as the assumed dates of decommissioning, changes in regulatory requirements, changes in technology, and changes in the cost of labor, materials, and equipment. Utilities that own and operate nuclear plants are required to use different procedures in calculating nuclear decommissioning costs under GAAP than those that are used in calculating nuclear decommissioning costs when reporting to the NRC. The two sets of procedures produce different estimates for the costs of decommissioning primarily because of differences in the underlying assumptions. TVA bases its nuclear decommissioning estimates on site-specific cost studies. The most recent study was approved and implemented in September 2022. Site-specific cost studies are updated for each of TVA's nuclear units at least every five years.
TVA maintains an NDT to provide funding for the ultimate decommissioning of its nuclear power plants. See Note 14 — Fair Value Measurements — Investment Funds. TVA monitors the value of its NDT and believes that, over the long term and before cessation of nuclear plant operations and commencement of decommissioning activities, adequate funds from
investments and additional contributions, if necessary, will be available to support decommissioning. TVA's operating nuclear power units are licensed through various dates between 2033 - 2055, depending on the unit. It may be possible to extend the operating life of some of the units with approval from the NRC. See Note 8 — Regulatory Assets and Liabilities and Note 11 — Asset Retirement Obligations.
Non-Nuclear Decommissioning. At June 30, 2023, $3.3 billion, representing the discounted value of future estimated non-nuclear decommissioning costs, was included in non-nuclear AROs. This decommissioning cost estimate involves estimating the amount and timing of future expenditures and making judgments concerning whether or not such costs are considered a legal obligation. Estimating the amount and timing of future expenditures includes, among other things, making projections of the timing and duration of the asset retirement process and how costs will escalate with inflation. The actual decommissioning costs may vary from the derived estimates because of changes in current assumptions, such as the assumed dates of decommissioning, changes in regulatory requirements, changes in technology, and changes in the cost of labor, materials, and equipment. TVA updates its underlying assumptions for non-nuclear decommissioning AROs at least every five years. However, material changes in underlying assumptions that impact the amount and timing of undiscounted cash flows are continuously monitored and incorporated into ARO balances in the period identified.
TVA maintains an ART to help fund the ultimate decommissioning of its non-nuclear power assets. See Note 14 — Fair Value Measurements — Investment Funds. Estimates involved in determining if additional funding will be made to the ART include inflation rate, rate of return projections on the fund investments, and the planned use of other sources to fund decommissioning costs. See Note 8 — Regulatory Assets and Liabilities and Note 11 — Asset Retirement Obligations.
Environmental Matters. TVA's generation activities, like those across the utility industry and in other industrial sectors, are subject to federal, state, and local environmental laws and regulations. Major areas of regulation affecting TVA's activities include air quality control, greenhouse gas ("GHG") emissions, water quality control, and management and disposal of solid and hazardous wastes. Regulations in these major areas continue to become more stringent and have, and will continue to have, a particular emphasis on climate change, renewable generation, and energy efficiency.
TVA has incurred, and expects to continue to incur, substantial capital and operating and maintenance costs to comply with evolving environmental requirements primarily associated with, but not limited to, the operation of TVA's coal-fired and natural gas-fired generating units in general and emissions of pollutants from those units. Environmental requirements placed on the operation of coal-fired and other generating units using fossil fuels such as oil and natural gas will likely continue to become more restrictive over time. Failure to comply with environmental and safety requirements can result in enforcement actions and litigation, which can lead to the imposition of significant civil liability, including fines and penalties, criminal sanctions, and/or temporary or permanent closure of non-compliant facilities. Historical non-compliance can also lead to difficulty in renewing existing permits, as well as difficulty in obtaining permits to bring new generation facilities online. Other obstacles to renewal or permitting of new facilities include a proliferation of non-government organizations seeking to use litigation tools to delay or stop altogether permitting of new fossil fuel facilities in favor of renewable energy projects.
TVA estimates that compliance with existing Clean Air Act requirements (excluding GHG requirements and new or proposed regulations) could lead to costs of $231 million from 2023 to 2027, which include existing controls capital projects and air operations and maintenance projects. TVA also estimates additional expenditures of approximately $711 million from 2023 to 2027 relating to TVA's coal combustion residuals ("CCR") Program, as well as expenditures of approximately $48 million from 2023 to 2027 relating to compliance with Clean Water Act ("CWA") requirements. Future costs could differ from these estimates if new environmental laws or regulations become applicable to TVA or the facilities it operates, or if existing environmental laws or regulations are revised or reinterpreted. There could also be costs that cannot reasonably be predicted at this time, due to uncertainty of actions, that could increase these estimates, and these estimates do not include expenditures expected to be incurred after 2027.
Compliance with the Environmental Protection Agency's ("EPA's") CCR rule ("CCR Rule") required implementation of a groundwater monitoring program, additional engineering, and ongoing analysis. As further analyses are performed, including evaluation of monitoring results, there is the potential for additional costs for investigation and/or remediation. These costs cannot reasonably be predicted until a final remedy is selected where required.
Liability for releases, natural resource damages, and required cleanup of hazardous substances is primarily regulated by the federal Comprehensive Environmental Response, Compensation, and Liability Act ("CERCLA"), the Resource Conservation and Recovery Act ("RCRA"), and other federal and parallel state statutes. In a manner similar to many other governmental entities, industries, and power systems, TVA has generated or used hazardous substances over the years. TVA operations at some facilities have resulted in releases of contaminants that TVA has addressed or is addressing consistent with state and federal requirements. At June 30, 2023 and September 30, 2022, TVA's estimated liability for required cleanup and similar environmental work for those sites for which sufficient information is available to develop a cost estimate was approximately $16 million and $17 million, respectively, on a non-discounted basis, and was included in Accounts payable and accrued liabilities and Other long-term liabilities on the Consolidated Balance Sheets. Additionally, the potential inclusion of new hazardous substances under CERCLA and RCRA jurisdiction could significantly affect TVA's future liability for remediating historical releases.
Potential Liability Associated with Workers' Exposure to CCR Materials. In response to the 2008 ash spill at Kingston, TVA hired Jacobs Engineering Group, Inc. ("Jacobs") to oversee aspects of the cleanup. After the cleanup was completed, Jacobs was sued in the U.S. District Court for the Eastern District of Tennessee ("Eastern District") by employees of a contractor involved in the cleanup and family members of some of the employees. The plaintiffs alleged that Jacobs failed to take or provide proper health precautions and misled workers about the health risks associated with exposure to coal fly ash, which is a CCR material. The plaintiffs also alleged that exposure to the fly ash caused significant illnesses, including in some cases death. Other contractor employees and family members also filed similar lawsuits against Jacobs in the Eastern District. In the third quarter of 2023, Jacobs announced that it reached a global settlement that resolved all of these lawsuits. While TVA was not a party to any of these lawsuits, TVA may potentially have an indemnity obligation to reimburse Jacobs in some circumstances. TVA does not expect any potential liability to have a material adverse impact on its results of operations or financial condition.
Legal Proceedings
General. At June 30, 2023, TVA had accrued $28 million of probable losses with respect to Legal Proceedings. Of the accrued amount, $10 million is included in Other long-term liabilities and $18 million is included in Accounts payable and accrued liabilities. No assurance can be given that TVA will not be subject to significant additional claims and liabilities. If actual liabilities significantly exceed the estimates made, TVA's results of operations, liquidity, and financial condition could be materially adversely affected.
There have been no material changes to the legal proceedings described in Note 21 — Commitments and Contingencies — Legal Proceedings of the Annual Report, except as described below.
Case Involving Rate Changes. On September 7, 2022, the U.S. Court of Appeals for the Fourth Circuit ("Fourth Circuit") affirmed the dismissal of the lawsuit filed against TVA and one of its LPCs, Bristol Virginia Utilities Authority, by a LPC customer, asserting claims for breach of contract and violation of the Administrative Procedure Act. On January 5, 2023, the plaintiff filed a petition with the U.S. Supreme Court to review the Fourth Circuit's decision, and on May 9, 2023, TVA filed a brief in opposition to the petition. On June 12, 2023, the Supreme Court denied the petition, and the resolution of this matter is now final.
Case Involving Johnsonville Aeroderivative Combustion Turbine Project. On December 22, 2022, the Southern Environmental Law Center filed a lawsuit in the U.S. District Court for the Middle District of Tennessee on behalf of the Sierra Club, alleging that TVA violated the National Environmental Policy Act ("NEPA") in deciding to build a new aeroderivative combustion turbine project at its Johnsonville facility.
The Sierra Club claims that TVA violated NEPA by failing to adequately analyze the climate consequences of the project, adequately address GHG mitigation in light of EOs to decarbonize the power sector, consider a reasonable range of alternatives to the project, and prepare an environmental impact statement ("EIS").
The Sierra Club requests the federal court to enter a declaratory judgment that TVA's environmental assessment ("EA") violates NEPA and that TVA's decision to issue a finding of no significant impact ("FONSI") was arbitrary, vacate the EA and FONSI, order TVA to prepare an EIS, and prohibit further construction and operation of the combustion turbines until TVA has complied with NEPA. On March 20, 2023, TVA moved to dismiss the case, and that motion remains pending before the court. TVA cannot predict the outcome of this litigation.
Case Involving Long-Term Agreements. On August 17, 2020, the Southern Environmental Law Center filed a lawsuit in the U.S. District Court for the Western District of Tennessee on behalf of Protect Our Aquifer, Energy Alabama, and Appalachian Voices, alleging that, beginning in August 2019, TVA violated NEPA and Section 10 of the TVA Act by offering a Long-Term Agreement to its LPCs. On February 1, 2023, the court granted TVA's motion for summary judgment and dismissed the lawsuit. The environmental groups' appeal deadline expired on April 7, 2023.
Case Involving Cumberland Combined Cycle Plant. On June 14, 2023, Appalachian Voices, the Center for Biological Diversity, and the Sierra Club filed a lawsuit in the United States District Court for the Middle District of Tennessee alleging that TVA violated NEPA in deciding to build a 1,450 MW combined cycle plant at its Cumberland facility. The plaintiffs request the court, among other things, to enter a declaratory judgment that the Cumberland EIS violated NEPA and TVA's decision to issue the Cumberland Record of Decision was arbitrary, capricious, and/or not in accordance with law; enter a declaratory judgment that TVA’s failure to supplement the Cumberland EIS violated NEPA and was arbitrary, capricious, and/or not in accordance with law; vacate the Cumberland EIS and the Cumberland Record of Decision; order TVA to prepare a revised draft EIS or supplemental EIS subject to public comment that corrects the NEPA violations identified by the plaintiffs; and enjoin further construction and operation of the Cumberland combined cycle plant until TVA has complied with NEPA. TVA is preparing its response and cannot predict the outcome of this litigation.
ITEM 2. MANAGEMENT'S DISCUSSION AND ANALYSIS OF FINANCIAL CONDITION AND RESULTS OF OPERATIONS
The Management's Discussion and Analysis of Financial Condition and Results of Operations ("MD&A") explains the results of operations and general financial condition of the Tennessee Valley Authority ("TVA"). The MD&A should be read in conjunction with the accompanying unaudited consolidated financial statements and TVA's Annual Report on Form 10-K for the year ended September 30, 2022 (the "Annual Report").
Executive Overview
TVA's operating revenues were $8.7 billion and $8.4 billion for the nine months ended June 30, 2023 and 2022, respectively. Operating revenues increased for the nine months ended June 30, 2023, as compared to the same period of the prior year, primarily as a result of higher fuel cost recovery revenue. The higher fuel cost recovery revenue was driven by higher fuel rates as a result of higher coal and purchased power market prices, partially offset by lower sales volume. The decreased sales volume was driven by overall milder weather during 2023. Although TVA sustained several days of single-digit temperatures and experienced record-setting demand as a result of Winter Storm Elliott in late December 2022, these impacts were largely offset by TVA experiencing milder weather during the remainder of the nine-month period.
Total operating expenses increased $704 million for the nine months ended June 30, 2023, as compared to the nine months ended June 30, 2022. Fuel and purchased power expense increased $308 million primarily due to higher purchased power market prices and higher effective fuel rates and an increase in fuel cost recovery due to the deferral of significant unplanned fuel price volatility during the three months ended June 30, 2022. These increases were partially offset by lower demand for energy due to milder weather and higher availability of nuclear generation. Operating and maintenance expense increased $277 million for the nine months ended June 30, 2023, as compared to the same period of the prior year, primarily due to increases in payroll and benefit costs, expenditures related to TVA's New Nuclear Program, and outage and contract labor expense.
In the second quarter of 2023, TVA documented its final decision to retire the two coal-fired units at Cumberland Fossil Plant ("Cumberland"). TVA is working on the replacement generation for the first unit at Cumberland with a 1,450 MW combined cycle plant that is expected to be operational by the end of CY 2026. The second unit is scheduled to be retired by the end of CY 2028, and in May 2023, TVA published the notice of intent to conduct an environmental impact statement ("EIS") to study potential environmental impacts associated with the proposed construction and operation of facilities to replace part of that generation. In addition, pre-commercial plant operations began on Colbert combustion turbine units 9-10 in June 2023 and on Colbert combustion turbine unit 11 in early July 2023, and all units became operational on July 25, 2023. See Key Initiatives and Challenges — Coal-Fired Units and Natural Gas-Fired Units below.
Winter Storm Elliott brought historic winter storm conditions across the majority of the United States, including the TVA service area. Rain followed by extreme cold weather and wind also created operational challenges, including the failure of several generating facilities to operate as planned and challenges in purchasing and importing generation from neighboring markets. TVA implemented emergency operation plans previously established with its local power company customers ("LPCs") and direct serve customers, including load reduction directives to LPCs which resulted in rolling outages, to ensure the overall stability of the power grid. TVA has conducted a review of the actions taken both before and during the event to prepare for future needs and challenges. See Key Initiatives and Challenges — Operational Challenges — Winter Storm Elliott.
Results of Operations
Sales of Electricity
Sales of electricity, which accounted for nearly all of TVA's operating revenues, were 37,026 million and 39,611 million of kilowatt hours ("kWh") for the three months ended June 30, 2023 and 2022, respectively. Sales of electricity, which accounted for nearly all of TVA's operating revenues, were 112,685 million and 117,547 million of kWh for the nine months ended June 30, 2023 and 2022, respectively. TVA sells power at wholesale rates to LPCs that then resell the power to their customers at retail rates. TVA also sells power to directly served customers, consisting primarily of federal agencies and customers with large or nonstandard loads. In addition, power exceeding TVA's system needs is sold under exchange power arrangements with certain other power systems.
The following chart compares TVA's sales of electricity by customer type for the periods indicated:
The following charts show a breakdown of TVA's energy load: 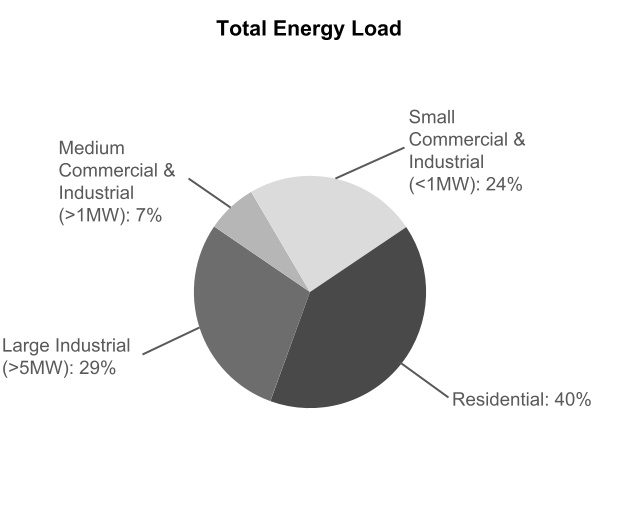
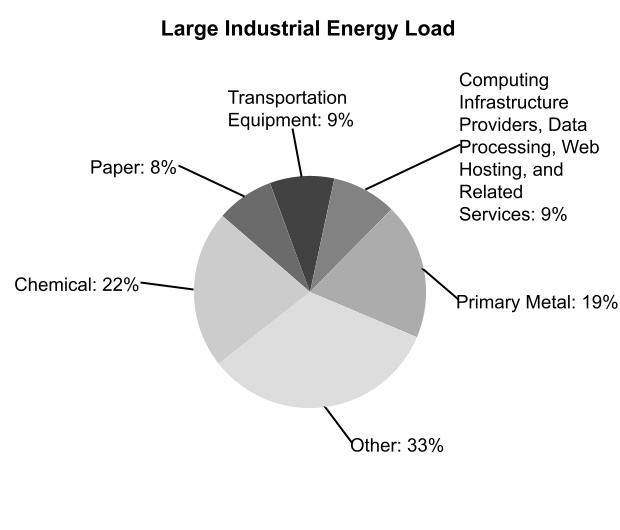
Note
Information included in the charts above was derived from energy usage of directly served customers and customers served by LPCs during calendar
year ("CY") 2022, and these graphs will continue to be updated on a CY basis.
Weather affects both the demand for TVA power and the price for that power. TVA uses degree days to measure the impact of weather on its power operations. Degree days measure the extent to which the TVA system 23-station average temperatures vary from 65 degrees Fahrenheit.
| | | | | | | | | | | | | | | | | | | | | | | | | | | | | | | | | | | | | | | | | |
| Degree Days | | |
| Variation from Normal | | Change from Prior Period |
| | 2023 | | Normal | | Percent Variation | | 2022 | | Normal(1) | | Percent Variation | | Percent Change |
| Heating Degree Days | | | | | | | | | | | | | |
| Three Months Ended June 30 | 196 | | | 191 | | 2.6 | % | | 204 | | | 191 | | | 6.8 | % | | (3.9) | % |
| Nine Months Ended June 30 | 2,774 | | | 3,123 | | (11.2) | % | | 3,014 | | | 3,123 | | | (3.5) | % | | (8.0) | % |
| | | | | | | | | | | | | |
| Cooling Degree Days | | | | | | | | | | | | | |
| Three Months Ended June 30 | 493 | | | 595 | | (17.1) | % | | 688 | | | 595 | | | 15.6 | % | | (28.3) | % |
| Nine Months Ended June 30 | 518 | | | 666 | | (22.2) | % | | 803 | | | 666 | | | 20.6 | % | | (35.5) | % |
| | | | | | | | | | | | | |
| | | | | | | | | | | | | |
| | | | | | | | | | | | | |
| | | | | | | | | | | | | |
Note
(1) The prior period degree day information was adjusted in 2023 in order to incorporate a change in TVA's current calculation of normal weather. TVA now calculates based on a 20-year period of weather history (CYs 2001-2020), and this period will be updated every five years.
Sales of electricity decreased approximately seven percent for the three months ended June 30, 2023, as compared to the same period of the prior year. The decreased sales volume was driven by milder weather during the current quarter, which resulted in a 28 percent decline in cooling degree days over the same period of the prior year. For industries directly served, sales of electricity decreased primarily within the chemical sector due to business-specific constraints, as these industries directly served are not driven primarily by weather, but mainly from changes in the economy and respective industry sectors.
Sales of electricity decreased approximately four percent for the nine months ended June 30, 2023, as compared to the same period of the prior year. The decreased sales volume was driven by overall milder weather during 2023 as compared to 2022, which resulted in a 35 percent decline in cooling degree days. Although Winter Storm Elliott brought cold temperatures and record-setting demand to the Tennessee Valley region in late December 2022, these impacts were largely offset by TVA experiencing milder weather during the remainder of the nine-month period. For industries directly served, sales of electricity decreased primarily within the chemical sector due to business-specific constraints, as these industries directly served are not driven primarily by weather, but mainly from changes in the economy and respective industry sectors.
Financial Results
The following table compares operating results for the three and nine months ended June 30, 2023 and 2022:
| | | | | | | | | | | | | | | | | | | | | | | | | | | | | | | | | | | | | | | | | | | | | | | |
Summary Consolidated Statements of Operations (in millions) |
| | Three Months Ended June 30 | | Nine Months Ended June 30 |
| | 2023 | | 2022 | | Change | | Percent Change | | 2023 | | 2022 | | Change | | Percent Change |
| Operating revenues | $ | 2,698 | | | $ | 2,970 | | | $ | (272) | | | (9.2) | % | | $ | 8,672 | | | $ | 8,437 | | | $ | 235 | | | 2.8 | % |
| Operating expenses | 2,461 | | | 2,380 | | | 81 | | | 3.4 | % | | 7,691 | | | 6,987 | | | 704 | | | 10.1 | % |
| Operating income | 237 | | | 590 | | | (353) | | | (59.8) | % | | 981 | | | 1,450 | | | (469) | | | (32.3) | % |
| Other income (expense), net | 20 | | | (6) | | | 26 | | | (433.3) | % | | 57 | | | 11 | | | 46 | | | 418.2 | % |
| Other net periodic benefit cost | 51 | | | 64 | | | (13) | | | (20.3) | % | | 153 | | | 194 | | | (41) | | | (21.1) | % |
| Interest expense | 264 | | | 264 | | | — | | | — | % | | 794 | | | 791 | | | 3 | | | 0.4 | % |
| Net income (loss) | $ | (58) | | | $ | 256 | | | $ | (314) | | | (122.7) | % | | $ | 91 | | | $ | 476 | | | $ | (385) | | | (80.9) | % |
Operating Revenues. Operating revenues for the three months ended June 30, 2023 and 2022, were $2.7 billion and $3.0 billion, respectively. Operating revenues for the nine months ended June 30, 2023 and 2022, were $8.7 billion and $8.4 billion, respectively. The following charts compare TVA's operating revenues for the periods indicated:
TVA's two largest LPCs — Memphis Light, Gas and Water Division ("MLGW") and Nashville Electric Service ("NES") — have contracts with a five-year and a 20-year termination notice period, respectively. Sales to MLGW and NES each accounted for eight percent of TVA's total operating revenues for both the nine months ended June 30, 2023 and the nine months ended June 30, 2022.
TVA's rate structure uses pricing signals to indicate seasons and hours of higher cost to serve its customers and to capture a portion of TVA's fixed costs in fixed charges. The structure includes three base revenue components: time of use demand charges, time of use energy charges, and a grid access charge ("GAC"). The demand charges are based upon the customer's peak monthly usage. The energy charges are based on time differentiated kWh used by the customer. Both of these components can be significantly impacted by weather. The GAC captures a portion of fixed costs and is offset by a corresponding reduction to the energy rates. The GAC also reduces the impact of weather variability to the overall rate structure.
TVA has a partnership agreement option that better aligns the length of LPC power contracts with TVA's long-term commitments. Under the partnership arrangement, the LPC power contracts automatically renew each year and have a 20-year termination notice. The partnership arrangements can be terminated under certain circumstances, including TVA's failure to limit rate increases as provided for in the agreements going forward. Participating LPCs receive benefits including a 3.1 percent wholesale bill credit in exchange for their long-term commitment, which enables TVA to recover its long-term financial commitments over a commensurate period. As of July 31, 2023, 147 LPCs had signed the 20-year partnership agreement with TVA.
In 2021, the TVA Board approved a 2.5 percent monthly base rate credit, the Pandemic Recovery Credit, which was effective for 2022. In 2022, the TVA Board approved a 2.5 percent monthly base rate credit, which is an extension of the Pandemic Recovery Credit, and is effective for 2023. These pandemic credits apply to service provided to TVA's LPCs, their large commercial and industrial customers, and TVA directly served customers. The 2023 credit is expected to approximate $230 million. These credits were able to be offered as a result of TVA's financial and operational performance. Future credits are uncertain as they also will be subject to TVA performance.
In addition to base revenues, the rate structure includes a separate fuel rate that includes: the costs of natural gas, fuel oil, purchased power, coal, emission allowances, nuclear fuel, and other fuel-related commodities; realized gains and losses on derivatives purchased to hedge the costs of such commodities; and payments to states and counties in lieu of taxes ("tax equivalents") associated with the fuel cost adjustments.
The changes in revenue components are summarized below:
| | | | | | | | | | | | | | | | | | | | | | | | | | | | | | | | | | | |
Changes in Revenue Components (in millions) |
| Three Months Ended June 30 | | Nine Months Ended June 30 |
| | 2023 | | 2022 | | Change | | 2023 | | 2022 | | Change |
| Base revenue | | | | | | | | | | | |
| Energy revenue | $ | 1,078 | | | $ | 1,170 | | | $ | (92) | | | $ | 3,290 | | | $ | 3,455 | | | $ | (165) | |
| Demand revenue | 848 | | | 898 | | | (50) | | | 2,591 | | | 2,541 | | | 50 | |
| Grid access charge | 147 | | | 147 | | | — | | | 441 | | | 442 | | | (1) | |
| Long-term partnership credits for LPCs | (45) | | | (48) | | | 3 | | | (140) | | | (141) | | | 1 | |
| Pandemic credits | (52) | | | (56) | | | 4 | | | (158) | | | (161) | | | 3 | |
Other charges and credits(1) | (153) | | | (153) | | | — | | | (470) | | | (487) | | | 17 | |
| Total base revenue | 1,823 | | | 1,958 | | | (135) | | | 5,554 | | | 5,649 | | | (95) | |
| Fuel cost recovery | 839 | | | 967 | | | (128) | | | 2,988 | | | 2,657 | | | 331 | |
| Off-system sales | 2 | | | 7 | | | (5) | | | 9 | | | 12 | | | (3) | |
| Revenue from sales of electricity | 2,664 | | | 2,932 | | | (268) | | | 8,551 | | | 8,318 | | | 233 | |
| Other revenue | 34 | | | 38 | | | (4) | | | 121 | | | 119 | | | 2 | |
| Total operating revenues | $ | 2,698 | | | $ | 2,970 | | | $ | (272) | | | $ | 8,672 | | | $ | 8,437 | | | $ | 235 | |
Note
(1) Includes economic development credits to promote growth in the Tennessee Valley, hydro preference credits for residential customers of LPCs, and demand response credits allowing TVA to reduce industrial customer usage in periods of peak demand to balance system demand. See Note 15 — Revenue.
Operating revenues decreased $272 million for the three months ended June 30, 2023, as compared to the same period of the prior year, primarily due to a $135 million decrease in base revenue. The $135 million decrease in base revenue was driven by lower sales volume as a result of milder weather in the Tennessee Valley region in the three months ended June 30, 2023, as compared to the same period of the prior year. In addition, there was a $128 million decrease in fuel cost recovery revenue which was driven by a $65 million decrease attributable to lower fuel rates and $63 million decrease attributable to lower
sales volume during the quarter. The lower fuel rates were primarily due to lower natural gas prices as compared to the three month period of the prior year.
Operating revenues increased $235 million for the nine months ended June 30, 2023, as compared to the same period of the prior year, primarily due to a $331 million increase in fuel cost recovery revenue. The $331 million increase in fuel cost recovery revenue was driven by a $443 million increase attributable to higher fuel rates partially offset by a $112 million decrease attributable to lower sales volume in 2023. The higher fuel rates were primarily due to higher coal prices. The lower sales volume was driven by overall milder weather in the Tennessee Valley region in the nine months ended June 30, 2023, as compared to the same period of the prior year. Partially offsetting the increase in fuel cost recovery revenue was a $95 million decrease in base revenue. The $95 million decrease in base revenue was driven by a $115 million decrease attributable to lower sales volume partially offset by a $20 million increase attributable to higher rates. The increase in effective rates was primarily due to lower other charges and credits as compared to the same period of the prior year.
Operating Expenses. Operating expense components as a percentage of total operating expenses for the three and nine months ended June 30, 2023 and June 30, 2022, consisted of the following:
| | | | | | | | | | | | | | | | | | | | | | | | | | | | | | | | | | | | | | | | | | | | | | | |
Operating Expenses (in millions) |
| Three Months Ended June 30 | | Nine Months Ended June 30 |
| 2023 | | 2022 | | Change | | Percent Change | | 2023 | | 2022 | | Change | | Percent Change |
| Operating expenses | | | | | | | | | | | | | | | |
| Fuel | $ | 530 | | | $ | 539 | | | $ | (9) | | | (1.7) | % | | $ | 1,845 | | | $ | 1,563 | | | $ | 282 | | | 18.0 | % |
| Purchased power | 350 | | | 465 | | | (115) | | | (24.7) | % | | 1,234 | | | 1,208 | | | 26 | | | 2.2 | % |
| Operating and maintenance | 896 | | | 722 | | | 174 | | | 24.1 | % | | 2,546 | | | 2,269 | | | 277 | | | 12.2 | % |
| Depreciation and amortization | 548 | | | 513 | | | 35 | | | 6.8 | % | | 1,631 | | | 1,535 | | | 96 | | | 6.3 | % |
| Tax equivalents | 137 | | | 141 | | | (4) | | | (2.8) | % | | 435 | | | 412 | | | 23 | | | 5.6 | % |
| Total operating expenses | $ | 2,461 | | | $ | 2,380 | | | $ | 81 | | | 3.4 | % | | $ | 7,691 | | | $ | 6,987 | | | $ | 704 | | | 10.1 | % |
Three Months Ended June 30, 2023, Compared to Three Months Ended June 30, 2022
Fuel expense decreased $9 million for the three months ended June 30, 2023, as compared to the same period of the prior year. This decrease was primarily due to lower effective fuel rates of $146 million resulting from lower natural gas prices, as well as a decrease of $19 million from lower demand for energy due to milder weather. Partially offsetting these decreases was an increase in fuel cost recovery of $156 million due to the deferral of significant unplanned price volatility during the three months ended June 30, 2022.
Purchased power expense decreased $115 million for the three months ended June 30, 2023, as compared to the same period of the prior year. This decrease was primarily from lower demand for energy due to milder weather resulting in a $129 million decrease, as well as a decrease of $120 million due to lower purchased power market prices. Partially offsetting these decreases was an increase in fuel cost recovery of $134 million due to the deferral of significant unplanned price volatility during the three months ended June 30, 2022.
Operating and maintenance expense increased $174 million for the three months ended June 30, 2023, as compared to the same period of the prior year. This increase was primarily due to $38 million of increased outage expense primarily driven by increased nuclear refueling outages, $37 million of increased payroll and benefit costs primarily due to labor escalation for cost of living increases and additional headcount to support operational needs, $24 million of increased contract labor costs primarily related to power operations performance improvement activities and natural gas project work, and $21 million of expenditures related to TVA's New Nuclear Program. In addition there was an $18 million increase in legal accruals.
Depreciation and amortization expense increased $35 million for the three months ended June 30, 2023, as compared to the same period of the prior year. TVA's decision to retire the two units at Cumberland resulted in additional Depreciation expense of approximately $16 million for the three months ended June 30, 2023, and amortization expense of decommissioning costs recovered in rates increased $13 million. The remainder of the increase is primarily due to depreciation of additions to net completed plant.
Tax equivalents expense decreased $4 million for the three months ended June 30, 2023, as compared to the same period of the prior year. The change is primarily driven by a decrease in the tax equivalents collected in the fuel cost recovery.
Nine Months Ended June 30, 2023, Compared to Nine Months Ended June 30, 2022
Fuel expense increased $282 million for the nine months ended June 30, 2023, as compared to the same period of the prior year. This increase was primarily due to an increase in fuel cost recovery of $150 million from the deferral of significant unplanned fuel price volatility during the three months ended June 30, 2022. In addition, higher effective fuel rates from higher coal prices resulted in a $141 million increase in fuel expense. Partially offsetting these increases was a decrease of $9 million primarily from lower demand for energy due to milder weather.
Purchased power expense increased $26 million for the nine months ended June 30, 2023, as compared to the same period of the prior year. This increase was primarily due to higher purchased power market prices, resulting in an increase of $159 million. In addition, the fuel cost recovery increased purchased power expense by $125 million from the deferral of significant unplanned price volatility during the three months ended June 30, 2022. Partially offsetting these increases was a decrease of $258 million primarily from lower demand for energy due to milder weather and higher availability of nuclear generation.
Operating and maintenance expense increased $277 million for the nine months ended June 30, 2023, as compared to the same period of the prior year. This increase was primarily due to $75 million of increased payroll and benefit costs primarily due to labor escalation for cost of living increases and additional headcount to support operational needs, $62 million of expenditures related to TVA's New Nuclear Program, $52 million of increased outage expense primarily driven by increased nuclear refueling outages and increased scope for natural gas outages, and $30 million of increased contract labor costs
primarily related to power operations performance improvement activities and natural gas project work. In addition there was a $17 million increase in legal accruals.
Depreciation and amortization expense increased $96 million for the nine months ended June 30, 2023, as compared to the same period of the prior year. Amortization expense of decommissioning costs recovered in rates increased $38 million, and TVA's decision to retire the two units at Cumberland resulted in additional Depreciation expense of approximately $32 million for the nine months ended June 30, 2023. The remainder of the increase is primarily due to depreciation of additions to net completed plant.
Tax equivalents expense increased $23 million for the nine months ended June 30, 2023, as compared to the same period of the prior year. The change is primarily driven by higher tax equivalent payments as a result of increased power sales revenue and an increase in the tax equivalents collected in the fuel cost recovery.
Generating Sources. The following tables show TVA's generation and purchased power by generating source as a percentage of all electrical power generated and purchased (based on kWh) for the periods indicated:
| | | | | | | | | | | | | | | | | | | | | | | | | | | | |
Total Power Supply by Generating Source For the three months ended June 30 (millions of kWh) |
| | 2023 | | 2022 | | | |
| | | | | | | | | | | | |
| Nuclear | 16,349 | | | 44 | % | | 15,150 | | | 38 | % | | | | | |
| Natural gas and/or oil-fired | 8,316 | | | 22 | % | | 9,023 | | | 22 | % | | | | | |
| Coal-fired | 4,974 | | | 13 | % | | 5,839 | | | 14 | % | | | | | |
| Hydroelectric | 1,771 | | | 5 | % | | 2,276 | | | 6 | % | | | | | |
Total TVA-operated generation facilities(1)(2) | 31,410 | | | 84 | % | | 32,288 | | | 80 | % | | | | | |
Purchased power (natural gas and/or oil-fired)(3) | 3,517 | | | 9 | % | | 4,955 | | | 12 | % | | | | | |
Purchased power (other renewables)(4) | 1,646 | | | 4 | % | | 1,826 | | | 5 | % | | | | | |
| | | | | | | | | | | | |
| Purchased power (hydroelectric) | 213 | | | 1 | % | | 385 | | | 1 | % | | | | | |
| Purchased power (coal-fired) | 803 | | | 2 | % | | 822 | | | 2 | % | | | | | |
Total purchased power(2) | 6,179 | | | 16 | % | | 7,988 | | | 20 | % | | | | | |
| Total power supply | 37,589 | | | 100 | % | | 40,276 | | | 100 | % | | | | | |
Notes
(1) Generation from TVA-owned renewable resources (non-hydroelectric) is less than one percent for all periods shown and therefore is not represented in the table above.
(2) Raccoon Mountain Pumped-Storage Plant net generation is allocated against each TVA-operated generation facility and purchased power type for both the three months ended June 30, 2023, and the three months ended June 30, 2022. See Part I, Item 1, Business — Power Supply and Load Management Resources — Raccoon Mountain Pumped-Storage Plant in the Annual Report for a discussion of Raccoon Mountain Pumped-Storage Plant.
(3) Purchased power (natural gas and/or oil-fired) includes generation from Caledonia Combined Cycle Plant ("Caledonia CC"), which is currently a leased facility operated by TVA. Generation from Caledonia CC was 1,053 million kWh and 1,173 million kWh for the three months ended June 30, 2023 and 2022, respectively.
(4) Purchased power (other renewables) includes purchased power from the following renewable sources: solar, wind, biomass, and renewable cogeneration. TVA sells the Renewable Energy Certificates ("RECs") resulting from some of this purchased power to certain customers.
| | | | | | | | | | | | | | | | | | | | | | | | | | | | |
Total Power Supply by Generating Source For the nine months ended June 30 (millions of kWh) |
| | 2023 | | 2022 | | | |
| | | | | | | | | | | | |
| Nuclear | 49,259 | | | 43 | % | | 46,907 | | | 39 | % | | | | | |
| Natural gas and/or oil-fired | 24,084 | | | 21 | % | | 25,076 | | | 21 | % | | | | | |
| Coal-fired | 13,970 | | | 12 | % | | 14,956 | | | 13 | % | | | | | |
| Hydroelectric | 9,907 | | | 9 | % | | 10,812 | | | 9 | % | | | | | |
Total TVA-operated generation facilities(1)(2) | 97,220 | | | 85 | % | | 97,751 | | | 82 | % | | | | | |
Purchased power (natural gas and/or oil-fired)(3) | 9,148 | | | 8 | % | | 12,860 | | | 11 | % | | | | | |
Purchased power (other renewables)(4) | 4,684 | | | 4 | % | | 4,914 | | | 4 | % | | | | | |
| | | | | | | | | | | | |
| Purchased power (hydroelectric) | 1,293 | | | 1 | % | | 2,029 | | | 1 | % | | | | | |
| Purchased power (coal-fired) | 2,188 | | | 2 | % | | 2,072 | | | 2 | % | | | | | |
Total purchased power(2) | 17,313 | | | 15 | % | | 21,875 | | | 18 | % | | | | | |
| Total power supply | 114,533 | | | 100 | % | | 119,626 | | | 100 | % | | | | | |
Notes
(1) Generation from TVA-owned renewable resources (non-hydroelectric) is less than one percent for all periods shown and therefore is not represented in the table
above.
(2) Raccoon Mountain Pumped-Storage Plant net generation is allocated against each TVA-operated generation facility and purchased power type for both the nine months ended June 30, 2023, and the nine months ended June 30, 2022. See Part I, Item 1, Business — Power Supply and Load Management Resources — Raccoon Mountain Pumped-Storage Plant in the Annual Report for a discussion of Raccoon Mountain Pumped-Storage Plant.
(3) Purchased power (natural gas and/or oil-fired) includes generation from Caledonia CC, which is currently a leased facility operated by TVA. Generation from Caledonia CC was 2,614 million kWh and 3,421 million kWh for the nine months ended June 30, 2023 and 2022, respectively.
(4) Purchased power (other renewables) includes purchased power from the following renewable sources: solar, wind, biomass, and renewable cogeneration.
In addition to power supply sources included here, TVA offers energy efficiency programs that effectively reduce energy needs. TVA estimates energy needs could be reduced by approximately 2,100 million kWh in 2023 due to TVA's energy efficiency programs.
Interest Expense. Interest expense and interest rates for the three and nine months ended June 30, 2023 and the three and nine months ended June 30, 2022, were as follows:
| | | | | | | | | | | | | | | | | | | | | | | | | | | | | | | | | | | | |
Interest Expense and Rates (in millions) | |
| | Three Months Ended June 30 | | Nine Months Ended June 30 | |
| | 2023 | | 2022 | | Percent
Change | | 2023 | | 2022 | | Percent
Change | |
Interest expense(1) | $ | 264 | | | $ | 264 | | | — | % | | $ | 794 | | | $ | 791 | | | 0.4 | % | |
| | | | | | | | | | | | |
Average blended debt balance(2) | $ | 20,618 | | | $ | 20,415 | | | 1.0 | % | | $ | 20,646 | | | $ | 20,639 | | | — | % | |
| | | | | | | | | | | | |
Average blended interest rate(3) | 4.92 | % | | 4.99 | % | | (1.4) | % | | 4.93 | % | | 4.96 | % | | (0.6) | % | |
Notes
(1) Includes amortization of debt discounts, issuance, and reacquisition costs, net.
(2) Includes average balances of long-term power bonds, debt of variable interest entities ("VIEs"), and discount notes.
(3) Includes interest on long-term power bonds, debt of VIE, and discount notes.
Total interest expense was relatively flat for the three months ended June 30, 2023, and increased $3 million for the nine months ended June 30, 2023, as compared to the same periods of the prior year. For the nine months ended June 30, 2023, the increase was primarily driven by a $32 million increase from higher average rates on short-term debt and a $7 million increase from higher other interest partially offset by a $36 million decrease from lower average rates and balances on long-term debt.
Liquidity and Capital Resources
Sources of Liquidity
TVA depends on various sources of liquidity to meet cash needs and contingencies. TVA's primary sources of liquidity are cash from operations and proceeds from the issuance of short-term debt in the form of discount notes, along with periodic issuances of long-term debt. TVA's balance of short-term debt typically changes frequently as TVA issues discount notes to meet short-term cash needs and pay scheduled maturities of discount notes and long-term debt. TVA’s next significant power bond maturity is $1.0 billion in September 2024. The periodic amounts of short-term debt issued are determined by near-term expectations for cash receipts, cash expenditures, and funding needs, while seeking to maintain a target range of cash and cash equivalents on hand.
In addition to cash from operations and proceeds from the issuance of short-term and long-term debt, TVA's sources of liquidity include four long-term revolving credit facilities totaling approximately $2.7 billion, a $150 million credit facility with the United States Department of the Treasury ("U.S. Treasury"), and proceeds from other financings. The TVA Board authorized TVA to issue power bonds and enter into other financing arrangements in an aggregate amount not to exceed $2.0 billion during 2023. See Note 12 — Debt and Other Obligations — Credit Facility Agreements. In the second quarter of 2023, TVA issued $1.0 billion of power bonds maturing in March 2028. Other financing arrangements may include sales of receivables, loans, or other assets.
The Tennessee Valley Authority Act of 1933, as amended, 16 U.S.C. §§ 831-831ee ("TVA Act") authorizes TVA to issue bonds, notes, or other evidences of indebtedness (collectively, "Bonds") in an amount not to exceed $30.0 billion outstanding at any time. Power bonds outstanding, excluding unamortized discounts and premiums and net exchange gains from foreign currency transactions, at June 30, 2023, were $19.8 billion (including current maturities). The balance of Bonds outstanding directly affects TVA's capacity to meet operational liquidity needs and to strategically use Bonds to fund certain capital investments as management and the TVA Board may deem desirable. Other options for financing not subject to the limit on Bonds, including lease financings, could provide supplementary funding if needed. Currently, TVA expects to utilize a combination of Bonds, additional power revenues through power rate increases, available federal funding through the Infrastructure Investment and Jobs Act and the Inflation Reduction Act, third party funding resources, and other ways to fund its
ongoing operational liquidity needs while making planned capital investments through the decade. See Lease Financings below, Note 9 — Variable Interest Entities, and Note 12 — Debt and Other Obligations for additional information.
TVA may from time to time seek to retire or purchase its outstanding debt through cash purchases and/or exchanges for securities, in open market purchases, privately negotiated transactions, or otherwise. Such repurchases or exchanges, if any, will depend on prevailing market conditions, TVA's liquidity requirements, contractual restrictions, and other factors. The amounts involved may be material.
TVA may hold higher cash balances from time to time in response to potential market volatility or other business conditions. In addition, cash balances may include collateral received from counterparties.
Debt Securities. TVA's Bonds are not obligations of the U.S., and the U.S. does not guarantee the payments of principal or interest on Bonds. TVA's Bonds consist of power bonds and discount notes. Power bonds have maturities of between one and 50 years. At June 30, 2023, the average maturity of long-term power bonds was 14.68 years, and the weighted average interest rate was 4.61 percent. Discount notes have maturities of less than one year. Power bonds and discount notes have a first priority and equal claim of payment out of net power proceeds. Net power proceeds are defined as the remainder of TVA's gross power revenues after deducting the costs of operating, maintaining, and administering its power properties and payments to states and counties in lieu of taxes, but before deducting depreciation accruals or other charges representing the amortization of capital expenditures, plus the net proceeds from the sale or other disposition of any power facility or interest therein. In addition to power bonds and discount notes, TVA had long-term debt associated with certain VIEs outstanding at June 30, 2023. See Lease Financings below, Note 9 — Variable Interest Entities, and Note 12 — Debt and Other Obligations for additional information.
The following table provides additional information regarding TVA's short-term borrowings:
| | | | | | | | | | | | | | | | | | | | | | | | | | | | | | | | | | | | | |
Short-Term Borrowings (in millions) |
| | At June 30, 2023 | | Three Months Ended June 30, 2023 | | | | Nine Months Ended June 30, 2023 | | At June 30, 2022 | | Three Months Ended June 30, 2022 | | Nine Months Ended June 30, 2022 |
| Gross Amount Outstanding (at End of Period) or Average Gross Amount Outstanding (During Period) | | | | | | | | | | | | | |
| Discount notes | $ | 723 | | | $ | 493 | | | | | $ | 1,050 | | | $ | 1,034 | | | $ | 715 | | | $ | 919 | |
| Maximum Month-End Gross Amount Outstanding (During Period) | | | | | | | | | | | | | |
| Discount notes | N/A | | $ | 723 | | | | | $ | 1,864 | | | N/A | | $ | 1,034 | | | $ | 1,526 | |
| Weighted Average Interest Rate | | | | | | | | | | | | | |
| Discount notes | 5.04 | % | | 4.95 | % | | | | 4.21 | % | | 1.38 | % | | 0.68 | % | | 0.21 | % |
Although TVA Bonds are not obligations of the U.S., TVA, as a corporate agency and instrumentality of the U.S. government, may be impacted if the sovereign credit ratings of the U.S. are downgraded. Additionally, TVA may be impacted by how the U.S. government addresses situations of approaching its statutory debt limit. According to statements made by nationally recognized credit rating agencies, downward pressure on the ratings of the U.S. could eventually develop if there are no changes in current policies and budget deficits and the trajectory of debt continues to increase; additionally, current ratings factor in the prospect that debates over raising the debt ceiling of the U.S. government could continue to be protracted and difficult. The outlook on the ratings of the U.S. government and TVA is currently stable with two of the three agencies that provide ratings on TVA Bonds. In May 2023, Fitch Ratings placed the U.S. government's credit rating on Rating Watch Negative, reflecting its perception of a deterioration in the U.S. public finances and challenges associated with raising the U.S. debt limit. Fitch subsequently placed the ratings of TVA and certain other government-related issuers on Rating Watch Negative. TVA's rated senior unsecured Bonds are currently rated Aaa, AAA, and AA+, by Moody's Investors Service, Inc., Fitch Ratings, and Standard & Poor's Financial Services, LLC, respectively. TVA's short-term discount notes are not rated.
Lease Financings. TVA has entered into certain leasing transactions with special purpose entities ("SPEs") to obtain third-party financing for its facilities. These SPEs are sometimes identified as VIEs of which TVA is determined to be the primary beneficiary. TVA is required to account for these VIEs on a consolidated basis. In addition, TVA previously entered into leasing transactions to obtain third-party financing for 24 peaking combustion turbine units ("CTs") as well as certain qualified technological equipment and software ("QTE"). See Note 9 — Variable Interest Entities and Note 12 — Debt and Other Obligations for information about TVA's lease financing activities.
Summary Cash Flows
A major source of TVA's liquidity is operating cash flows resulting from the generation and sale of electricity. Cash, cash equivalents, and restricted cash totaled $520 million and $521 million at June 30, 2023 and 2022, respectively. A summary of cash flow components for the nine months ended June 30, 2023 and 2022, follows:
Cash provided by (used in):
Operating Activities. TVA's cash flows from operations are primarily driven by sales of electricity, fuel expense, and operating and maintenance expense. The timing and level of cash flows from operations can be affected by the weather, changes in working capital, commodity price fluctuations, outages, and other project expenses.
Net cash flows provided by operating activities decreased $58 million for the nine months ended June 30, 2023, as compared to the same period of the prior year. The decrease is primarily due to increased fuel and purchased power payments as a result of higher coal, natural gas, and purchased power market prices; higher cash used for asset retirement obligation settlements; and higher cash payments related to TVA’s new nuclear program.
Investing Activities. The majority of TVA's investing cash flows are due to investments to acquire, upgrade, or maintain generating and transmission assets, including environmental projects and the purchase of nuclear fuel.
Net cash flows used in investing activities increased $255 million for the nine months ended June 30, 2023, as compared to the same period of the prior year driven primarily by the acquisition of leasehold interests in combustion turbine assets and higher nuclear fuel expenditures. Nuclear fuel expenditures vary depending on the number of outages and the prices and timing of purchases of uranium and enrichment services. Additionally, expenditures for certain combustion turbine, transmission, and environmental projects contributed to the increase as compared to the prior year, partially offset by expenditures for the Watts Bar Unit 2 steam generator replacement project, which was completed in the prior year.
Financing Activities. TVA's cash flows provided by or used in financing activities are primarily driven by the timing and level of cash flows provided by operating activities, cash flows used in investing activities, and net issuance and redemption of debt instruments to maintain a strategic balance of cash on hand.
Net cash provided by financing activities increased $310 million for the nine months ended June 30, 2023, as compared to the same period of the prior year, primarily due to higher net debt issuances. Lower net cash flows provided by operating activities and higher net cash used in investing activities in the first three quarters of 2023 resulted in the need for net debt issuances to maintain targeted cash balance levels during the period. TVA may continue to have a need to increase debt in the coming years as it continues to invest in power system assets, which may result in positive net cash flows provided by financing activities in future periods.
Contractual Obligations
TVA has certain obligations and commitments to make future payments under contracts. There have been no material changes to TVA's contractual obligations as discussed in the Annual Report in Part II, Item 7, Management's Discussion and Analysis of Financial Condition and Results of Operations — Liquidity and Capital Resources, Note 8 — Leases, Note 11 — Variable Interest Entities, Note 14 — Debt and Other Obligations, and Note 20 — Benefit Plans.
Key Initiatives and Challenges
There have been no material changes to the key initiatives and challenges described in Part II, Item 7, Management's Discussion and Analysis of Financial Condition and Results of Operations — Key Initiatives and Challenges of the Annual Report, except as described below.
Optimum Energy Portfolio
TVA is developing its next Integrated Resource Plan ("IRP"), which will provide TVA direction on how to best meet future electricity demands from now to 2050. As part of the IRP process, and in alignment with the National Environmental Policy Act ("NEPA"), TVA will analyze potential environmental impacts associated with the IRP by preparing an EIS. In May 2023, TVA published the notice of intent, which is the first step in the NEPA process. The IRP process includes extensive engagement from the public and stakeholders and is expected to be complete in CY 2024. See Part II, Item 7, Management's Discussion and Analysis of Financial Condition and Results of Operations — Key Initiatives and Challenges in the Annual Report.
TVA is also partnering with the University of Tennessee Baker Center for Public Policy and with diverse stakeholders from across the Valley to conduct a Valley Pathways Study, focused on building a competitive and clean economy for the Tennessee Valley. This study will examine potential scenarios for all economic sectors across the Valley that will support sustainable growth and a viable and preferred decarbonization pathway.
Coal-Fired Fleet. TVA must continuously evaluate all generating assets to ensure an optimal energy portfolio that provides safe, clean, and reliable power while maintaining flexibility and fiscal responsibility to the people of the Tennessee Valley. In 2022, TVA made available and received public input on a draft EIS to assess the impacts associated with the potential retirement of Cumberland and the construction and operation of facilities to replace part of that generation. The final EIS was published in December 2022, and TVA documented its final decision with the Record of Decision on January 10, 2023. TVA plans to retire the two coal-fired units at Cumberland, which accounted for 2,470 MW of summer net capability at September 30, 2022, and replace generation for one unit with a 1,450 MW combined cycle plant that is expected to be operational by the end of CY 2026 when the first unit is scheduled to be retired. The second unit is scheduled to be retired by the end of CY 2028, and in May 2023, TVA published the notice of intent to conduct an EIS to study potential environmental impacts associated with the proposed construction and operation of facilities to replace part of that generation. On May 12, 2023, TVA made available to the public a draft EIS to assess the impacts associated with the potential retirement of Kingston Fossil Plant ("Kingston") and the construction and operation of facilities to replace part of that generation. TVA asked for public input on the draft EIS during the 45-day public comment period of May 19, 2023 through July 3, 2023. TVA is currently reviewing comments submitted on the draft EIS, and a final EIS is expected to be published by the second quarter of 2024. See Part II, Item 7, Management's Discussion and Analysis of Financial Condition and Results of Operations — Key Initiatives and Challenges — Coal-Fired Fleet in the Annual Report.
Natural Gas-Fired Units. During 2019, the TVA Board approved an expansion of approximately 1,500 MW of peaking gas replacement capacity at two combustion turbine gas facilities, with each project expecting to increase combustion turbine generation capacity by 750 MW. Pre-commercial plant operations began on Colbert combustion turbine units 9-10 in June 2023 and on Colbert combustion turbine unit 11 in early July 2023, and all units became operational on July 25, 2023. See Part II, Item 7, Management's Discussion and Analysis of Financial Condition and Results of Operations — Key Initiatives and Challenges — Natural Gas-Fired Units in the Annual Report.
As discussed in Coal-Fired Fleet above, TVA is replacing generation for one unit at Cumberland with a 1,450 MW combined cycle plant that is expected to be operational by the end of CY 2026 when this first unit is scheduled to be retired. As of June 30, 2023, TVA had spent $157 million on this project, and expects to spend an additional $1.4 billion through CY 2026.
Renewable Power Purchase Agreements. TVA issued a request for proposal ("RFP") during 2021 for up to 200 MW of new renewable energy. In December 2022, TVA signed four power purchase agreements ("PPAs") for a total of 160 MW of solar generation expected to come online in 2025. In April 2023, TVA also signed a PPA for 377 MW of hydroelectric generation that was effective beginning in May 2023.
In addition, TVA’s existing solar PPA portfolio is not immune from the challenges affecting the U.S. solar industry. Similar to the experience of the rest of the industry, the majority of TVA’s contracted PPAs from previous RFPs that are not yet online have been impacted by project delays and price increases. In the second quarter of 2023, one of the counterparties failed to comply with the terms of its PPA. TVA terminated the agreement, which includes 66 MW of solar and 66 MW of battery storage, due to the counterparty's default.
System Operations Center. A new system operations center is being built to accommodate a new energy management system. The facility is now approved for $332 million and expected to be constructed in CY 2024 and fully operational in CY 2026. See Part II, Item 7, Management's Discussion and Analysis of Financial Condition and Results of Operations — Key Initiatives and Challenges — System Operations Center in the Annual Report.
Energy Management System. A new energy management system will replace the existing analog system with a digital system. The system is now approved for $108 million and expected to be complete by CY 2027. See Part II, Item 7, Management's Discussion and Analysis of Financial Condition and Results of Operations — Key Initiatives and Challenges — Energy Management System in the Annual Report.
Collaborative Arrangement. In December 2022, TVA, Ontario Power Generation, Synthos Green Energy, and GE Hitachi Nuclear Energy ("GEH") entered into a multi-party collaborative arrangement to advance the global deployment of the GEH BWRX-300 small modular reactor. GEH is responsible for standard design development. TVA recorded $24 million of research and development expense related to this agreement for the nine months ended June 30, 2023, and expects to record up to an additional $13 million of expense for the remainder of 2023. See Note 19 — Collaborative Arrangement for additional information.
Automated Energy Exchange Platform. On July 14, 2023, the United States Court of Appeals for the District of Columbia Circuit ("D.C. Circuit") remanded the Federal Energy Regulatory Commission's ("FERC") approval of the Southeast Energy Exchange Market (“SEEM”), sending the matter back to FERC for additional proceedings. Among other things, the court found that FERC failed to provide adequate explanations for its acceptance of SEEM’s market design and for whether SEEM’s zero-cost transmission rates transformed SEEM into a loose power pool, which would require a joint tariff to be filed with FERC allowing open membership and access to pool transmission for non-members. TVA is evaluating the impact of the D.C. Circuit opinion and cannot predict the outcome of the D.C. Circuit’s remand at FERC or any future or related proceeding. See Part II, Item 7, Management’s Discussion and Analysis of Financial Condition and Results of Operations — Key Initiatives and Challenges — Optimum Energy Portfolio — Automated Energy Exchange Platform in the Annual Report.
Operational Challenges
Coal Supply. TVA experienced challenges in 2022 related to coal supply as a result of supply limitations and transportation challenges. Coal supply availability and transportation performance improved during the first quarter of 2023. Mild weather prior to late December 2022, which continued in the second and third quarters of 2023, required lower than forecasted coal-fired generation, enabling inventory stockpiles to increase, and current market conditions reflect an approximate balance between demand and available supply, due to weaker export markets and lower natural gas prices. TVA also invested in additional multi-year coal supply contracts to provide stability in coal supply availability. These investments will support fuel resiliency with TVA's overall coal supply. Coal transportation performance also improved in the first quarter of 2023 due to the settlement of the rail labor strike and increased availability of railroad workers. See Part II, Item 7, Management's Discussion and Analysis of Financial Condition and Results of Operations — Key Initiatives and Challenges — Coal Supply in the Annual Report.
Winter Storm Elliott. In late December 2022, Winter Storm Elliott brought historic winter storm conditions across the majority of the United States. The TVA service area sustained several days of single-digit temperatures and high winds and experienced record-setting power demand. On December 23, 2022, TVA broke its all-time record for single-day energy demand of more than 740 million kWh, as well as its highest winter peak power demand of 33,427 MW. Rain followed by extreme cold weather and wind caused operational challenges at several coal and natural gas-fired facilities, including freezing instrumentation, which resulted in a maximum unavailability of generation capacity of approximately 7,300 MW. TVA also encountered challenges in purchasing and importing generation from neighboring markets that were also experiencing high demand, which resulted in curtailments during TVA's peak demand periods.
As a result of these challenges, TVA implemented emergency operation plans previously established with its LPC and direct serve customers, which included public requests for broad conservation of power, curtailment of power to all customers on interruptible rates through TVA's demand response programs along with further requests to large customers to voluntarily reduce power consumption, and load reduction directives to LPCs to ensure the overall stability of the power grid. The load reduction directives were issued on two occasions, on December 23, 2022 for approximately two hours and on December 24, 2022 for approximately six hours, which resulted in rolling outages.
Although purchases were challenged, TVA did purchase a significant volume of power to help meet energy needs and experienced high prices during the winter storm event. TVA deferred $149 million of fuel and purchased power costs in December 2022 through its fuel cost adjustment primarily as a result of unplanned power purchases during the event. TVA began recognizing these deferred costs in expense in February 2023.
TVA has conducted a review of the actions taken both before and during the event to prepare for future needs and challenges. The review recommended actions to improve the reliability and resiliency of TVA's system, including developing design modification plans for each generating facility for both winter and summer peaks, improving cross-organizational coordination and communication, strengthening fuel resiliency strategy, updating load forecasting operations, enhancing emergency protocols, and updating processes for communicating with customers and key stakeholders, among others. In addition, TVA has already implemented numerous actions to increase operational resilience. These actions included placing more robust enclosures at generating facilities and enhancing insulation around instrumentation.
In addition, FERC, North American Electric Reliability Corporation, and North American Electric Reliability Corporation’s regional entities have opened a joint inquiry into the operations of the bulk power system during the winter weather conditions that occurred with Winter Storm Elliott. FERC has stated that the purpose of the joint inquiry is to further protect the reliability of the grid for future weather-related events.
Decarbonization
TVA is exploring the potential for hydrogen to serve as a tool in the decarbonization of the Tennessee Valley, both within the electrical sector and elsewhere. In November 2022, TVA and other major utility companies responded to a funding opportunity from the Department of Energy with the intention of obtaining federal financial support for a Southeast Hydrogen Hub. In December 2022, notification was received from the Department of Energy that the preliminary proposal was reviewed and the Southeast Hydrogen Hub proposal was encouraged to advance to the application stage. TVA anticipates the Southeast Hydrogen Hub will build on existing infrastructure utilizing advancing technologies to enhance the production, storage, transport, and delivery of hydrogen to transition the energy economy toward a decarbonized future. Decisions on the funding opportunity are expected by the end of CY 2023. See Part II, Item 7, Management's Discussion and Analysis of Financial Condition and Results of Operations — Key Initiatives and Challenges — Decarbonization in the Annual Report.
Board Quorum
The terms of A.D. Frazier and Jeff W. Smith as members of the TVA Board of Directors ended January 3, 2023, with the adjournment of the most recent session of Congress. Although their terms of office expired May 18, 2022, the TVA Act permitted them to continue to serve as Directors until the end of this session of Congress.
On January 4, 2023, Beth Prichard Geer, L. Michelle Moore, Robert P. Klein, William J. Renick, Joe H. Ritch, and Adam Wade White took their oath of office and began their service as members of the TVA Board of Directors. With these new Board members, TVA has a full nine-member Board. The term of Director Kilbride expired on May 18, 2023, although he is permitted under the TVA Act to remain in office until the earlier of the end of the current session of Congress or the date a successor takes office. See Part II, Item 7, Management's Discussion and Analysis of Financial Condition and Results of Operations — Key Initiatives and Challenges — Board Quorum in the Annual Report.
Environmental Matters
There have been no material changes to the environmental matters described in Part I, Item 1, Business — Environmental Matters of the Annual Report, except as described below.
Clean Air Act Programs and Regulations
Revised Cross-State Air Pollution Update Rule. Under a revised version of the Cross-State Air Pollution Rule, the Shawnee Fossil Plant ("Shawnee") facility is subject to reduced ozone-season nitrogen oxides ("NOx") allowances and has been required to surrender most of its allowance inventory. In 2022, TVA monitored forecasted needs and purchased allowances for the Shawnee facility. A longer-term compliance strategy for the facility is being developed that may include installing NOx control upgrades, incorporating operational changes, and continuing to purchase allowances. When completed, this strategy will help TVA comply with both the Revised Cross-State Air Pollution Rule Update Rule and the Federal Implementation Plan Addressing Regional Ozone Transport for the 2015 Ozone National Ambient Air Quality Standards ("NAAQS"). TVA has obtained approval from the State of Kentucky for construction of seven selective catalytic reduction systems ("SCRs") at the Shawnee facility. TVA plans to construct SCRs at four units by the end of 2025 and is evaluating plans for the remaining three units. Inclusive of the costs for these four SCRs, at June 30, 2023, TVA’s estimated potential expenditures on Clean Air Act control projects are $62 million, $90 million, and $79 million for the remainder of 2023, 2024, and 2025 - 2027, respectively. See Part I, Item 1, Business — Environmental Matters — Clean Air Act Programs and Regulations — Revised Cross-State Air Pollution Rule in the Annual Report.
Federal Implementation Plan Addressing Regional Ozone Transport for the 2015 Ozone NAAQS. On April 6, 2022, the Environmental Protection Agency ("EPA") issued a proposed Federal Implementation Plan ("FIP") to address cross-state air pollution with respect to NAAQS. On March 15, 2023, the EPA issued final regulations known as the "Good Neighbor Plan" to reduce NOx emissions from power plants and certain industrial facilities. With the Good Neighbor Plan, the EPA issued its FIP that covers 23 states, including Alabama, Kentucky, and Mississippi, to reduce the interstate transport of NOx. Under the rule, beginning with the 2023 ozone season, power plants in 22 states, including Alabama, Kentucky, and Mississippi, are required to participate in a NOx trading program. Over time, the emission budgets will decline based on the level of reductions achievable through phased installation of emissions controls at power plants starting in 2024. The rule also establishes daily emission rates for coal steam electric generating units greater than or equal to 100 megawatts in the covered states beginning with the 2024 ozone season. To help comply with these regulations, TVA is developing a longer-term compliance strategy for its Shawnee facility that may include installing NOx control upgrades, incorporating operational changes, and continuing to purchase allowances. On June 29, 2023, the EPA issued an interim rule to stay, for emission sources in several states, including Kentucky and Mississippi, the effectiveness of the 2023 FIP requirements. The EPA's interim rule responds to judicial orders that stay, pending judicial review, earlier EPA actions disapproving State Implementation Plans of certain states. See Revised Cross-State
Air Pollution Update Rule above and Part I, Item 1, Business — Environmental Matters — Clean Air Act Program and Regulations — Proposed Federal Implementation Plan Addressing Regional Ozone Transport for the 2015 Ozone NAAQS in the Annual Report.
Proposed Greenhouse Gas Emission Standards and Guidelines. On May 23, 2023, the EPA published in the Federal Register five proposed actions to address greenhouse gas (“GHG”) emissions from fossil fuel-fired electric generating units. More specifically, the EPA (1) proposed revised new source performance standards (“NSPS”) for GHG emissions from new fossil fuel-fired stationary combustion turbine units; (2) proposed revised NSPS for GHG emissions from existing fossil fuel-fired steam generating units that undertake large modifications; (3) proposed new GHG emission guidelines for existing fossil fuel-fired steam generating units; (4) proposed GHG emissions guidelines for existing large, frequently operated stationary combustion turbine units; and (5) proposed to repeal the Affordable Clean Energy (“ACE”) rule. These proposed standards and guidelines, if finalized in their current form, could have a material adverse effect on TVA's results of operations and financial condition. See Part I, Item 1, Business – Environmental Matters – Clean Air Act Programs and Regulations – Affordable Clean Energy Rule and – New Source Performance Standards.
Climate Change
Emissions. Though many of TVA's facilities continue to emit air pollutants, emissions from all TVA-owned and operated units (including small CTs of less than 25 MW) have been reduced from historic peaks. Emissions of NOx and sulfur dioxide ("SO2") began being regulated in 1995 and 1977, respectively. Emissions of NOx and SO2 have been reduced by 97 percent and 99 percent, respectively, since their initial year of regulation.
| | | | | | | | | | | | | | | | | |
|
Emissions and Intensity Rates (1) | | CY 2022 | | CY 2021 | | | |
| | | | | | | |
| | | | | | | |
| | | | | | | |
Nitrogen Oxides (NOx)(2) | | | | | | | |
Total NOx Emissions (MT) | | 15,270 | | 15,210 | | | |
Total NOx Emissions Intensity (MT/Net MWh) | | 0.000113 | | 0.000109 | | | |
Sulfur Dioxide (SO2)(2) | | | | | | | |
Total SO2 Emissions (MT) | | 22,331 | | 25,226 | | | |
Total SO2 Emissions Intensity (MT/Net MWh) | | 0.000165 | | 0.000181 | | | |
| Mercury (Hg) | | | | | | | |
| Total Hg Emissions (kg) | | 39.2 | | 22.3 | | | |
| Total Hg Emissions Intensity (kg/Net MWh) | | 0.0000003 | | 0.0000002 | | | |
| | | | | | | |
| | | | | | | |
Notes
(1) Intensity rates are calculated based on generation from TVA's most recent fiscal year for years indicated and emissions data from the most recent CYs.
(2) Emissions data is consistent with Edison Electric Institute Environmental, Social, Governance and Sustainability Report standards, which are based on metric tons ("MTs"), whereas overall CO2 emission rates and baseline reductions from historical levels are based on short tons.
For CY 2022, TVA's emissions of carbon dioxide ("CO2") from its owned and operated units, including purchased power and REC retirement adjustments which reduce the reportable CO2 emissions, were 54 million tons, resulting in a TVA system average, as delivered, CO2 emission rate of 658 lbs/MWh. This represents a 54 percent and 50 percent reduction in mass carbon emissions and TVA's carbon emission rate, respectively, from 2005 levels.
While TVA continues down the path of lowering emissions, including GHG emissions, there will be fluctuations in TVA's emission numbers. Between CY 2021 and CY 2022, TVA's GHG emissions reflect higher electricity usage in the Tennessee Valley as the region experienced economic growth. Changes in the power supply mix between CY 2021 and CY 2022 also impacted the emissions fluctuation, as TVA continues to make operational decisions to keep the system reliable and deliver low-cost energy.
Report on Climate-Related Risks. On January 30, 2023, the Government Accountability Office ("GAO") publicly released a report entitled Tennessee Valley Authority: Additional Steps Are Needed to Better Manage Climate-Related Risks. This report examines climate-related risks to TVA's operations and steps TVA has taken to manage climate-related risks as well as additional steps needed. In the report, the GAO made three recommendations:
• TVA's CEO should direct TVA staff to conduct an inventory of assets and operations vulnerable to climate change that includes analyzing the likelihood and degree of damage or disruption from climate change and the likely consequences if specific climate effects were to occur.
• Once TVA staff identifies vulnerable assets and operations, TVA's CEO should direct TVA staff to develop a resilience plan that identifies and prioritizes measures to address climate change vulnerabilities and that includes a portfolio of resilience measures and an action plan that specifies which risks to address and how and when to do so.
• TVA's CEO should direct staff to establish a plan to routinely reassess the TVA resilience plan and incorporate updated information about implemented resilience actions, as well as updated information about climate change, resilience technologies and planning tools, and connected infrastructure vulnerabilities.
TVA provided a response to the GAO in June 2023 outlining completed and planned TVA actions to address the recommendations. To strengthen TVA’s climate resiliency, TVA has established new priority actions in TVA’s Climate Action Adaptation and Resiliency Plan. These actions include continuing to implement and maintain seasonal readiness programs that incorporate climate threats, continuing to evaluate climate threats in enterprise risk management, researching methods for improving climate resilience and adaptation planning, incorporating relevant climate change information in each IRP, evaluating systems and components for potential resiliency hardening, integrating climate resiliency in the transmission grid resiliency program, and completing asset analysis and incorporating climate resiliency into business processes.
Clean-up of Solid and Hazardous Wastes
Coal Combustion Residuals. On May 18, 2023, the EPA issued a proposed rule expanding the federal CCR rule to include legacy CCR units. The proposed rule would establish two new classes of units not currently regulated under the federal CCR rule: (1) legacy CCR surface impoundments, which are surface impoundments that contained both CCR and liquids on or after October 19, 2015, and that are located at a power plant that ceased generating power prior to October 19, 2015, and (2) CCR management units, which are any area of land on which any non-containerized accumulations of CCR are received, placed, or otherwise managed, and which is not a CCR unit. The EPA proposes to subject both classes of legacy units to the requirements applicable to currently regulated units with a few exceptions and also proposes to mandate the requirement to initiate closure within 12 months of the effective date of the rule. If finalized in its current form, this proposed rule may significantly increase the number of federally regulated units in TVA’s fleet that will be subject to substantial costs for closure, post-closure, and potential remediation, and could have a material adverse effect on TVA's results of operations and financial condition.
Water Quality Control Developments
Steam-Electric Effluent Guidelines. On March 7, 2023, the EPA proposed new effluent limitation guidelines (“ELGs”) for steam electric power generators. The proposed rule would impose more stringent effluent limits on discharges of flue gas desulfurization wastewater, bottom ash transport water, and combustion residual leachate from coal-fired power plants as well as establish new definitions for various legacy wastewaters, which affects when more stringent requirements will apply to such wastewaters. The EPA's proposed rule also includes flexible paths for certain types of power plants to come into compliance with the proposed ELGs. Since this is a proposed rule, it is premature to evaluate the potential impacts of this rule on TVA operations; however, EPA adoption of such a rule could result in material compliance costs to TVA. See Part I, Item 1, Business — Environmental Matters — Water Quality Control Developments — Steam-Electric Effluent Guidelines in the Annual Report.
Waters of the United States. On May 25, 2023, the Supreme Court in Sackett v. EPA narrowed the interpretation of the scope of “waters of the United States” under the Clean Water Act (“CWA”). Specifically, the Court ruled that CWA jurisdiction extends only to: (1) traditional interstate navigable waters; (2) relatively permanent waters connected to traditional interstate navigable waters; and (3) adjacent wetlands with a continuous surface connection to such waters. In reaching its decision, the Court rejected the “substantial nexus” standard for determining the jurisdiction of the CWA that was articulated by Justice Kennedy in the Court’s Rapanos decision. The result of this decision is that fewer waters will be subject to CWA permitting or other restrictions, and the EPA and the Army Corps of Engineers will need to revise the Waters of the United States ("WOTUS") rule they issued on January 18, 2023, which includes within the definition of WOTUS waters that meet the substantial nexus standard. The impact of the rulemaking process cannot be determined at this time.
Legal Proceedings
From time to time, TVA is party to or otherwise involved in lawsuits, claims, proceedings, investigations, and other legal matters ("Legal Proceedings") that have arisen in the ordinary course of conducting its activities, as a result of catastrophic events or otherwise. At June 30, 2023, TVA had accrued $28 million with respect to Legal Proceedings. No assurance can be given that TVA will not be subject to significant additional claims and liabilities. If actual liabilities significantly exceed the estimates made, TVA's results of operations, liquidity, and financial condition could be materially adversely affected.
For a discussion of certain current material Legal Proceedings, see Note 20 — Contingencies and Legal Proceedings — Legal Proceedings, which discussions are incorporated into this Part I, Item 2, Management's Discussion and Analysis of Financial Condition and Results of Operations.
Off-Balance Sheet Arrangements
At June 30, 2023, TVA had no off-balance sheet arrangements.
Critical Accounting Estimates
The preparation of financial statements requires TVA to estimate the effects of various matters that are inherently uncertain as of the date of the financial statements. Although the financial statements are prepared in conformity with accounting principles generally accepted in the U.S., TVA is required to make estimates and assumptions that affect the reported amounts of assets and liabilities, the disclosure of contingent assets and liabilities, and the amounts of revenues and expenses reported during the reporting period. Each of these estimates varies in regard to the level of judgment involved and its potential impact on TVA's financial results. Estimates are deemed critical either when a different estimate could have reasonably been used, or where changes in the estimate are reasonably likely to occur from period to period, and such use or change would materially impact TVA's financial condition, results of operations, or cash flows. TVA's critical accounting estimates and policies are discussed in Part II, Item 7, Management's Discussion and Analysis of Financial Condition and Results of Operations — Critical Accounting Estimates and Note 1 — Summary of Significant Accounting Policies of the Notes to Consolidated Financial Statements in the Annual Report.
New Accounting Standards and Interpretations
For a discussion of new accounting standards and interpretations, see Note 2 — Impact of New Accounting Standards and Interpretations, which discussion is incorporated into this Part I, Item 2, Management's Discussion and Analysis of Financial Condition and Results of Operations.
Legislative and Regulatory Matters
For additional discussion on legislative and regulatory matters, including a discussion of environmental legislation and regulation, see Item 2, Management's Discussion and Analysis of Financial Condition and Results of Operations — Environmental Matters of this Quarterly Report. Also, see Part I, Item 1, Business — Environmental Matters and Part II, Item 7, Management's Discussion and Analysis of Financial Condition and Results of Operations — Key Initiatives and Challenges of the Annual Report.
TVA does not engage, and does not control any entity that is engaged, in any activity listed under Section 13(r) of the Securities Exchange Act of 1934 ("Exchange Act"), which requires certain issuers to disclose certain activities relating to Iran involving the issuer and its affiliates. Based on information supplied by each such person, none of TVA's directors and executive officers are involved in any such activities. While TVA is an agency and instrumentality of the U.S., TVA does not believe its disclosure obligations, if any, under Section 13(r) extend to the activities of any other departments, divisions, or agencies of the U.S.
ITEM 3. QUANTITATIVE AND QUALITATIVE DISCLOSURES ABOUT MARKET RISK
There are no material changes related to market risks disclosed under Part II, Item 7, Management's Discussion and Analysis of Financial Condition and Results of Operations — Risk Management Activities in the Annual Report. See Note 13 — Risk Management Activities and Derivative Transactions for additional information regarding TVA's derivative transactions and risk management activities.
ITEM 4. CONTROLS AND PROCEDURES
Disclosure Controls and Procedures
TVA maintains disclosure controls and procedures designed to ensure that information required to be disclosed by TVA in reports that it files or submits under the Exchange Act is recorded, processed, summarized, and reported, within the time periods specified in the Securities and Exchange Commission’s rules and forms, and is accumulated and communicated to TVA’s management, as appropriate, to allow timely decisions regarding required disclosure. TVA's management, including the President and Chief Executive Officer, the Executive Vice President and Chief Financial and Strategy Officer, and members of the Disclosure Control Committee, including the Vice President and Controller (Principal Accounting Officer) (collectively "management"), evaluated the effectiveness of TVA's disclosure controls and procedures (as defined in Rule 13a-15(e) under the Exchange Act) as of June 30, 2023. Based on this evaluation, management concluded that TVA's disclosure controls and procedures were effective as of June 30, 2023.
Changes in Internal Control over Financial Reporting
During the quarter ended June 30, 2023, there were no changes in TVA's internal control over financial reporting
that materially affected, or are reasonably likely to materially affect, TVA's internal control over financial reporting.
PART II - OTHER INFORMATION
ITEM 1. LEGAL PROCEEDINGS
From time to time, TVA is party to or otherwise involved in lawsuits, claims, proceedings, investigations, and other legal matters ("Legal Proceedings") that have arisen in the ordinary course of conducting its activities, as a result of catastrophic events or otherwise. While the outcome of the Legal Proceedings to which TVA is a party cannot be predicted with certainty, any adverse outcome to a Legal Proceeding involving TVA may have a material adverse effect on TVA's financial condition, results of operations, and cash flows.
For a discussion of certain current material Legal Proceedings, see Note 20 — Contingencies and Legal Proceedings — Legal Proceedings, which discussions are incorporated by reference into this Part II, Item 1, Legal Proceedings.
ITEM 1A. RISK FACTORS
There are no material changes related to risk factors from the risk factors disclosed in Part I, Item 1A, Risk Factors in the Annual Report.
ITEM 5. OTHER INFORMATION
During the three months ended June 30, 2023, no director or officer of TVA notified TVA of the adoption or termination of a "Rule 10b5-1 trading arrangement" or "non-Rule 10b5-1 trading arrangement," as each term is defined in Item 408(a) of Regulation S-K.
ITEM 6. EXHIBITS
| | | | | |
| Exhibit No. | Description |
| 3.1 | |
| |
| 3.2 | Bylaws of the Tennessee Valley Authority Adopted by the TVA Board of Directors on May 18, 2006, as amended on April 3, 2008, May 19, 2008, June 10, 2010, February 13, 2014, August 21, 2014, and November 6, 2014 (Incorporated by reference to Exhibit 3.2 to TVA's Annual Report on Form 10-K for the year ended September 30, 2014, File No. 000-52313) |
| |
| 31.1 | |
| | |
| 31.2 | |
| | |
| 32.1 | |
| | |
| 32.2 | |
| |
| |
| |
| 101.INS | Inline XBRL Instance Document - the instance document does not appear in the Interactive Data File because its XBRL tags are embedded within the Inline XBRL document |
| | |
| 101.SCH | Inline XBRL Taxonomy Extension Schema |
| | |
| 101.CAL | Inline XBRL Taxonomy Extension Calculation Linkbase |
| | |
| 101.DEF | Inline XBRL Taxonomy Extension Definition Linkbase |
| | |
| 101.LAB | Inline XBRL Taxonomy Extension Label Linkbase |
| | |
| 101.PRE | Inline XBRL Taxonomy Extension Presentation Linkbase |
| |
| 104 | Cover Page Interactive Data File - formatted in Inline XBRL and contained in Exhibit 101 |
SIGNATURES
Pursuant to the requirements of the Securities Exchange Act of 1934, the registrant has duly caused this report to be signed on its behalf by the undersigned, thereunto duly authorized.
| | | | | | | | | | | |
| Date: | July 31, 2023 | | TENNESSEE VALLEY AUTHORITY |
| | | (Registrant) |
| | | |
| | | |
| | By: | /s/ Jeffrey J. Lyash |
| | | Jeffrey J. Lyash |
| | | President and Chief Executive Officer
(Principal Executive Officer)
|
| | By: | /s/ John M. Thomas, III |
| | | John M. Thomas, III |
| | | Executive Vice President and Chief Financial and Strategy Officer
(Principal Financial Officer) |