0001373715false2021FYP3YP2Y51P5DP5D0.0074212.512.512.512.512.512.512.512.5P4Y00013737152021-01-012021-12-3100013737152021-06-30iso4217:USD00013737152022-01-31xbrli:shares00013737152021-12-3100013737152020-12-31iso4217:USDxbrli:shares0001373715us-gaap:LicenseAndServiceMember2021-01-012021-12-310001373715us-gaap:LicenseAndServiceMember2020-01-012020-12-310001373715us-gaap:LicenseAndServiceMember2019-01-012019-12-310001373715us-gaap:TechnologyServiceMember2021-01-012021-12-310001373715us-gaap:TechnologyServiceMember2020-01-012020-12-310001373715us-gaap:TechnologyServiceMember2019-01-012019-12-3100013737152020-01-012020-12-3100013737152019-01-012019-12-310001373715us-gaap:LicenseAndServiceMemberus-gaap:CostOfSalesMember2021-01-012021-12-310001373715us-gaap:LicenseAndServiceMemberus-gaap:CostOfSalesMember2020-01-012020-12-310001373715us-gaap:LicenseAndServiceMemberus-gaap:CostOfSalesMember2019-01-012019-12-310001373715us-gaap:CostOfSalesMemberus-gaap:TechnologyServiceMember2021-01-012021-12-310001373715us-gaap:CostOfSalesMemberus-gaap:TechnologyServiceMember2020-01-012020-12-310001373715us-gaap:CostOfSalesMemberus-gaap:TechnologyServiceMember2019-01-012019-12-310001373715now:SalesAndMarketingMember2021-01-012021-12-310001373715now:SalesAndMarketingMember2020-01-012020-12-310001373715now:SalesAndMarketingMember2019-01-012019-12-310001373715us-gaap:ResearchAndDevelopmentExpenseMember2021-01-012021-12-310001373715us-gaap:ResearchAndDevelopmentExpenseMember2020-01-012020-12-310001373715us-gaap:ResearchAndDevelopmentExpenseMember2019-01-012019-12-310001373715us-gaap:GeneralAndAdministrativeExpenseMember2021-01-012021-12-310001373715us-gaap:GeneralAndAdministrativeExpenseMember2020-01-012020-12-310001373715us-gaap:GeneralAndAdministrativeExpenseMember2019-01-012019-12-310001373715us-gaap:CommonStockMember2018-12-310001373715us-gaap:AdditionalPaidInCapitalMember2018-12-310001373715us-gaap:RetainedEarningsMember2018-12-310001373715us-gaap:AccumulatedOtherComprehensiveIncomeMember2018-12-3100013737152018-12-310001373715us-gaap:CommonStockMember2019-01-012019-12-310001373715us-gaap:AdditionalPaidInCapitalMember2019-01-012019-12-310001373715us-gaap:AccumulatedOtherComprehensiveIncomeMember2019-01-012019-12-310001373715us-gaap:RetainedEarningsMember2019-01-012019-12-310001373715us-gaap:CommonStockMember2019-12-310001373715us-gaap:AdditionalPaidInCapitalMember2019-12-310001373715us-gaap:RetainedEarningsMember2019-12-310001373715us-gaap:AccumulatedOtherComprehensiveIncomeMember2019-12-3100013737152019-12-310001373715us-gaap:CommonStockMember2020-01-012020-12-310001373715us-gaap:AdditionalPaidInCapitalMember2020-01-012020-12-310001373715us-gaap:AccumulatedOtherComprehensiveIncomeMember2020-01-012020-12-310001373715us-gaap:RetainedEarningsMember2020-01-012020-12-310001373715us-gaap:CommonStockMember2020-12-310001373715us-gaap:AdditionalPaidInCapitalMember2020-12-310001373715us-gaap:RetainedEarningsMember2020-12-310001373715us-gaap:AccumulatedOtherComprehensiveIncomeMember2020-12-310001373715us-gaap:CommonStockMember2021-01-012021-12-310001373715us-gaap:AdditionalPaidInCapitalMember2021-01-012021-12-310001373715us-gaap:AccumulatedOtherComprehensiveIncomeMember2021-01-012021-12-310001373715us-gaap:RetainedEarningsMember2021-01-012021-12-310001373715us-gaap:CommonStockMember2021-12-310001373715us-gaap:AdditionalPaidInCapitalMember2021-12-310001373715us-gaap:RetainedEarningsMember2021-12-310001373715us-gaap:AccumulatedOtherComprehensiveIncomeMember2021-12-310001373715now:DataCenterEquipmentMemberus-gaap:ServiceLifeMember2021-01-012021-12-310001373715now:DataCenterEquipmentMemberus-gaap:SubsequentEventMemberus-gaap:ServiceLifeMember2022-01-012022-01-310001373715us-gaap:BuildingMember2021-01-012021-12-310001373715srt:MinimumMembernow:ComputerEquipmentAndSoftwareMember2021-01-012021-12-310001373715srt:MaximumMembernow:ComputerEquipmentAndSoftwareMember2021-01-012021-12-310001373715srt:MinimumMemberus-gaap:FurnitureAndFixturesMember2021-01-012021-12-310001373715srt:MaximumMemberus-gaap:FurnitureAndFixturesMember2021-01-012021-12-310001373715srt:MinimumMember2021-01-012021-12-310001373715srt:MaximumMember2021-01-012021-12-310001373715now:TwoThousandTwelveEmployeeStockPurchasePlanMember2021-01-012021-12-310001373715us-gaap:AccountingStandardsUpdate202006Membersrt:ScenarioForecastMember2022-01-010001373715us-gaap:CommercialPaperMember2021-12-310001373715us-gaap:CorporateDebtSecuritiesMember2021-12-310001373715us-gaap:CertificatesOfDepositMember2021-12-310001373715us-gaap:USTreasuryAndGovernmentMember2021-12-310001373715now:MortgageAndAssetBackedSecuritiesMember2021-12-310001373715us-gaap:CommercialPaperMember2020-12-310001373715us-gaap:CorporateDebtSecuritiesMember2020-12-310001373715us-gaap:CertificatesOfDepositMember2020-12-310001373715us-gaap:USTreasuryAndGovernmentMember2020-12-310001373715us-gaap:MoneyMarketFundsMemberus-gaap:CashEquivalentsMemberus-gaap:FairValueInputsLevel1Member2021-12-310001373715us-gaap:MoneyMarketFundsMemberus-gaap:FairValueInputsLevel2Memberus-gaap:CashEquivalentsMember2021-12-310001373715us-gaap:MoneyMarketFundsMemberus-gaap:CashEquivalentsMember2021-12-310001373715us-gaap:CommercialPaperMemberus-gaap:CashEquivalentsMemberus-gaap:FairValueInputsLevel1Member2021-12-310001373715us-gaap:FairValueInputsLevel2Memberus-gaap:CommercialPaperMemberus-gaap:CashEquivalentsMember2021-12-310001373715us-gaap:CommercialPaperMemberus-gaap:CashEquivalentsMember2021-12-310001373715us-gaap:CorporateDebtSecuritiesMemberus-gaap:CashEquivalentsMemberus-gaap:FairValueInputsLevel1Member2021-12-310001373715us-gaap:FairValueInputsLevel2Memberus-gaap:CorporateDebtSecuritiesMemberus-gaap:CashEquivalentsMember2021-12-310001373715us-gaap:CorporateDebtSecuritiesMemberus-gaap:CashEquivalentsMember2021-12-310001373715us-gaap:CertificatesOfDepositMemberus-gaap:CashEquivalentsMemberus-gaap:FairValueInputsLevel1Member2021-12-310001373715us-gaap:FairValueInputsLevel2Memberus-gaap:CertificatesOfDepositMemberus-gaap:CashEquivalentsMember2021-12-310001373715us-gaap:CertificatesOfDepositMemberus-gaap:CashEquivalentsMember2021-12-310001373715us-gaap:CashEquivalentsMemberus-gaap:DepositsMemberus-gaap:FairValueInputsLevel1Member2021-12-310001373715us-gaap:FairValueInputsLevel2Memberus-gaap:CashEquivalentsMemberus-gaap:DepositsMember2021-12-310001373715us-gaap:CashEquivalentsMemberus-gaap:DepositsMember2021-12-310001373715us-gaap:InvestmentsMemberus-gaap:CommercialPaperMemberus-gaap:FairValueInputsLevel1Member2021-12-310001373715us-gaap:InvestmentsMemberus-gaap:FairValueInputsLevel2Memberus-gaap:CommercialPaperMember2021-12-310001373715us-gaap:InvestmentsMemberus-gaap:CommercialPaperMember2021-12-310001373715us-gaap:InvestmentsMemberus-gaap:CorporateDebtSecuritiesMemberus-gaap:FairValueInputsLevel1Member2021-12-310001373715us-gaap:InvestmentsMemberus-gaap:FairValueInputsLevel2Memberus-gaap:CorporateDebtSecuritiesMember2021-12-310001373715us-gaap:InvestmentsMemberus-gaap:CorporateDebtSecuritiesMember2021-12-310001373715us-gaap:InvestmentsMemberus-gaap:CertificatesOfDepositMemberus-gaap:FairValueInputsLevel1Member2021-12-310001373715us-gaap:InvestmentsMemberus-gaap:FairValueInputsLevel2Memberus-gaap:CertificatesOfDepositMember2021-12-310001373715us-gaap:InvestmentsMemberus-gaap:CertificatesOfDepositMember2021-12-310001373715us-gaap:InvestmentsMembernow:MortgageAndAssetBackedSecuritiesMemberus-gaap:FairValueInputsLevel1Member2021-12-310001373715us-gaap:InvestmentsMemberus-gaap:FairValueInputsLevel2Membernow:MortgageAndAssetBackedSecuritiesMember2021-12-310001373715us-gaap:InvestmentsMembernow:MortgageAndAssetBackedSecuritiesMember2021-12-310001373715us-gaap:InvestmentsMemberus-gaap:USTreasuryAndGovernmentMemberus-gaap:FairValueInputsLevel1Member2021-12-310001373715us-gaap:InvestmentsMemberus-gaap:USTreasuryAndGovernmentMemberus-gaap:FairValueInputsLevel2Member2021-12-310001373715us-gaap:InvestmentsMemberus-gaap:USTreasuryAndGovernmentMember2021-12-310001373715us-gaap:FairValueInputsLevel1Member2021-12-310001373715us-gaap:FairValueInputsLevel2Member2021-12-310001373715us-gaap:MoneyMarketFundsMemberus-gaap:CashEquivalentsMemberus-gaap:FairValueInputsLevel1Member2020-12-310001373715us-gaap:MoneyMarketFundsMemberus-gaap:FairValueInputsLevel2Memberus-gaap:CashEquivalentsMember2020-12-310001373715us-gaap:MoneyMarketFundsMemberus-gaap:CashEquivalentsMember2020-12-310001373715us-gaap:USTreasuryAndGovernmentMemberus-gaap:CashEquivalentsMemberus-gaap:FairValueInputsLevel1Member2020-12-310001373715us-gaap:USTreasuryAndGovernmentMemberus-gaap:FairValueInputsLevel2Memberus-gaap:CashEquivalentsMember2020-12-310001373715us-gaap:USTreasuryAndGovernmentMemberus-gaap:CashEquivalentsMember2020-12-310001373715us-gaap:InvestmentsMemberus-gaap:CommercialPaperMemberus-gaap:FairValueInputsLevel1Member2020-12-310001373715us-gaap:InvestmentsMemberus-gaap:FairValueInputsLevel2Memberus-gaap:CommercialPaperMember2020-12-310001373715us-gaap:InvestmentsMemberus-gaap:CommercialPaperMember2020-12-310001373715us-gaap:InvestmentsMemberus-gaap:CorporateDebtSecuritiesMemberus-gaap:FairValueInputsLevel1Member2020-12-310001373715us-gaap:InvestmentsMemberus-gaap:FairValueInputsLevel2Memberus-gaap:CorporateDebtSecuritiesMember2020-12-310001373715us-gaap:InvestmentsMemberus-gaap:CorporateDebtSecuritiesMember2020-12-310001373715us-gaap:InvestmentsMemberus-gaap:CertificatesOfDepositMemberus-gaap:FairValueInputsLevel1Member2020-12-310001373715us-gaap:InvestmentsMemberus-gaap:FairValueInputsLevel2Memberus-gaap:CertificatesOfDepositMember2020-12-310001373715us-gaap:InvestmentsMemberus-gaap:CertificatesOfDepositMember2020-12-310001373715us-gaap:InvestmentsMemberus-gaap:USTreasuryAndGovernmentMemberus-gaap:FairValueInputsLevel1Member2020-12-310001373715us-gaap:InvestmentsMemberus-gaap:USTreasuryAndGovernmentMemberus-gaap:FairValueInputsLevel2Member2020-12-310001373715us-gaap:InvestmentsMemberus-gaap:USTreasuryAndGovernmentMember2020-12-310001373715us-gaap:FairValueInputsLevel1Member2020-12-310001373715us-gaap:FairValueInputsLevel2Member2020-12-310001373715now:Swarm64ASMember2021-08-202021-08-200001373715now:Swarm64ASMemberus-gaap:DevelopedTechnologyRightsMember2021-08-200001373715now:Swarm64ASMemberus-gaap:DevelopedTechnologyRightsMember2021-08-202021-08-200001373715now:Swarm64ASMember2021-08-200001373715now:LightStepIncMember2021-06-152021-06-150001373715now:LightStepIncMemberus-gaap:DevelopedTechnologyRightsMember2021-06-150001373715now:LightStepIncMemberus-gaap:DevelopedTechnologyRightsMember2021-06-152021-06-150001373715now:LightStepIncMemberus-gaap:CustomerRelatedIntangibleAssetsMember2021-06-150001373715now:LightStepIncMember2021-06-150001373715now:ElementAIIncMember2021-01-082021-01-080001373715us-gaap:DevelopedTechnologyRightsMembernow:ElementAIIncMember2021-01-080001373715us-gaap:DevelopedTechnologyRightsMembernow:ElementAIIncMember2021-01-082021-01-080001373715now:ElementAIIncMember2021-01-080001373715us-gaap:SeriesOfIndividuallyImmaterialBusinessAcquisitionsMember2021-01-012021-12-310001373715now:SweagleNVMember2020-07-012020-07-010001373715now:SweagleNVMember2020-07-010001373715us-gaap:DevelopedTechnologyRightsMembernow:SweagleNVMember2020-07-010001373715now:RupertLabsInc.Member2020-02-072020-02-070001373715now:RupertLabsInc.Memberus-gaap:DevelopedTechnologyRightsMember2020-02-070001373715now:RupertLabsInc.Member2020-02-070001373715now:LoomSystemsLtd.Member2020-02-062020-02-060001373715us-gaap:DevelopedTechnologyRightsMembernow:LoomSystemsLtd.Member2020-02-060001373715now:LoomSystemsLtd.Member2020-02-060001373715us-gaap:DevelopedTechnologyRightsMember2021-01-012021-12-310001373715now:All2019BusinessCombinationsMember2019-01-012019-12-310001373715us-gaap:DevelopedTechnologyRightsMember2021-12-310001373715us-gaap:DevelopedTechnologyRightsMember2020-12-310001373715us-gaap:PatentsMember2021-12-310001373715us-gaap:PatentsMember2020-12-310001373715us-gaap:OtherIntangibleAssetsMember2021-12-310001373715us-gaap:OtherIntangibleAssetsMember2020-12-310001373715us-gaap:DevelopedTechnologyRightsMember2020-01-012020-12-310001373715us-gaap:ComputerEquipmentMember2021-12-310001373715us-gaap:ComputerEquipmentMember2020-12-310001373715us-gaap:SoftwareAndSoftwareDevelopmentCostsMember2021-12-310001373715us-gaap:SoftwareAndSoftwareDevelopmentCostsMember2020-12-310001373715us-gaap:LeaseholdImprovementsMember2021-12-310001373715us-gaap:LeaseholdImprovementsMember2020-12-310001373715us-gaap:FurnitureAndFixturesMember2021-12-310001373715us-gaap:FurnitureAndFixturesMember2020-12-310001373715us-gaap:ConstructionInProgressMember2021-12-310001373715us-gaap:ConstructionInProgressMember2020-12-310001373715us-gaap:NondesignatedMemberus-gaap:ForeignExchangeContractMember2021-12-310001373715us-gaap:NondesignatedMemberus-gaap:ForeignExchangeContractMember2020-12-310001373715us-gaap:FairValueInputsLevel2Memberus-gaap:NondesignatedMemberus-gaap:PrepaidExpensesAndOtherCurrentAssetsMemberus-gaap:ForeignExchangeContractMember2021-12-310001373715us-gaap:FairValueInputsLevel2Memberus-gaap:NondesignatedMemberus-gaap:PrepaidExpensesAndOtherCurrentAssetsMemberus-gaap:ForeignExchangeContractMember2020-12-310001373715us-gaap:FairValueInputsLevel2Membernow:AccruedExpensesAndOtherCurrentLiabilitiesMemberus-gaap:NondesignatedMemberus-gaap:ForeignExchangeContractMember2021-12-310001373715us-gaap:FairValueInputsLevel2Membernow:AccruedExpensesAndOtherCurrentLiabilitiesMemberus-gaap:NondesignatedMemberus-gaap:ForeignExchangeContractMember2020-12-3100013737152022-01-012021-12-31xbrli:pure00013737152023-01-012021-12-310001373715now:A2022ConvertibleSeniorNotesMember2021-12-310001373715now:A2030SeniorNotesMember2021-12-310001373715now:A2030SeniorNotesMember2020-12-310001373715now:A2022ConvertibleSeniorNotesMember2020-12-310001373715us-gaap:FairValueInputsLevel2Membernow:A2022ConvertibleSeniorNotesMember2021-12-310001373715us-gaap:FairValueInputsLevel2Membernow:A2022ConvertibleSeniorNotesMember2020-12-310001373715us-gaap:FairValueInputsLevel2Membernow:A2030SeniorNotesMember2021-12-310001373715us-gaap:FairValueInputsLevel2Membernow:A2030SeniorNotesMember2020-12-310001373715now:A2030SeniorNotesMember2020-08-310001373715now:A2030SeniorNotesMember2020-08-012020-08-310001373715now:A2022ConvertibleSeniorNotesMember2017-06-300001373715now:A2022ConvertibleSeniorNotesMember2017-05-012017-06-300001373715now:StockPriceTriggerMeasurementMember2021-01-012021-12-310001373715now:NotesPriceTriggerMeasurementMember2021-01-012021-12-310001373715now:A2022ConvertibleSeniorNotesMember2021-01-012021-12-310001373715now:A2022ConvertibleSeniorNotesMember2020-08-110001373715now:A2022ConvertibleSeniorNotesMember2020-08-112020-08-110001373715now:A2022NoteHedgeMember2021-01-012021-12-310001373715now:A2022NoteHedgeMember2021-12-310001373715now:A2022WarrantsMember2021-01-012021-12-310001373715now:A2022WarrantsMember2021-12-310001373715now:A2022WarrantsMember2020-01-012020-12-310001373715us-gaap:AccumulatedTranslationAdjustmentMember2021-12-310001373715us-gaap:AccumulatedTranslationAdjustmentMember2020-12-310001373715us-gaap:AccumulatedNetUnrealizedInvestmentGainLossMember2021-12-310001373715us-gaap:AccumulatedNetUnrealizedInvestmentGainLossMember2020-12-310001373715us-gaap:EmployeeStockOptionMember2021-12-310001373715us-gaap:RestrictedStockUnitsRSUMember2021-12-310001373715now:TwoThousandTwelveEquityIncentivePlanMember2021-12-310001373715now:TwoThousandTwelveEmployeeStockPurchasePlanMember2021-12-31now:plan0001373715now:TwoThousandFiveStockOptionPlanAndTwoThousandTwelveEquityIncentivePlanMember2021-01-012021-12-310001373715now:TwoThousandFiveStockOptionPlanAndTwoThousandTwelveEquityIncentivePlanMember2021-12-31now:tranche0001373715srt:ChiefExecutiveOfficerMemberus-gaap:EmployeeStockOptionMembernow:A2021PerformanceAwardsMember2021-10-012021-12-310001373715srt:ChiefExecutiveOfficerMemberus-gaap:EmployeeStockOptionMembernow:A2021PerformanceAwardsMember2021-12-310001373715srt:MinimumMembersrt:ChiefExecutiveOfficerMemberus-gaap:EmployeeStockOptionMembernow:A2021PerformanceAwardsMember2021-10-012021-12-310001373715srt:MinimumMembernow:A2021PerformanceAwardsMember2021-10-012021-12-310001373715us-gaap:EmployeeStockOptionMember2021-01-012021-12-310001373715us-gaap:RestrictedStockUnitsRSUMember2019-12-310001373715us-gaap:RestrictedStockUnitsRSUMember2020-01-012020-12-310001373715us-gaap:RestrictedStockUnitsRSUMember2020-12-310001373715us-gaap:RestrictedStockUnitsRSUMember2021-01-012021-12-310001373715now:RestrictedStockUnitsWtihServiceConditionOnlyMember2021-12-310001373715now:RestrictedStockUnitsWithServiceAndPerformanceConditionsMember2021-12-310001373715us-gaap:RestrictedStockUnitsRSUMember2019-01-012019-12-310001373715srt:MinimumMemberus-gaap:PerformanceSharesMember2021-01-012021-12-310001373715srt:MaximumMemberus-gaap:PerformanceSharesMember2021-01-012021-12-310001373715us-gaap:PerformanceSharesMember2021-01-012021-12-310001373715us-gaap:PerformanceSharesMember2020-07-012020-07-310001373715us-gaap:PerformanceSharesMember2020-01-012020-12-310001373715us-gaap:PerformanceSharesMember2019-01-012019-12-310001373715us-gaap:EmployeeStockMember2021-01-012021-12-310001373715us-gaap:EmployeeStockMember2020-01-012020-12-310001373715us-gaap:EmployeeStockMember2019-01-012019-12-310001373715us-gaap:EmployeeStockOptionMember2019-01-012019-12-310001373715now:PerformanceRestrictedStockUnitsMember2021-01-012021-12-310001373715srt:MinimumMemberus-gaap:EmployeeStockOptionMember2021-01-012021-12-310001373715srt:MaximumMemberus-gaap:EmployeeStockOptionMember2021-01-012021-12-310001373715srt:ChiefExecutiveOfficerMemberus-gaap:EmployeeStockOptionMemberus-gaap:ShareBasedCompensationAwardTrancheOneMembernow:A2021PerformanceAwardsMember2021-10-012021-12-310001373715us-gaap:ShareBasedCompensationAwardTrancheTwoMembersrt:ChiefExecutiveOfficerMemberus-gaap:EmployeeStockOptionMembernow:A2021PerformanceAwardsMember2021-10-012021-12-310001373715srt:ChiefExecutiveOfficerMemberus-gaap:ShareBasedCompensationAwardTrancheThreeMemberus-gaap:EmployeeStockOptionMembernow:A2021PerformanceAwardsMember2021-10-012021-12-310001373715srt:ChiefExecutiveOfficerMemberus-gaap:EmployeeStockOptionMembernow:ShareBasedPaymentArrangementTrancheEightMembernow:A2021PerformanceAwardsMember2021-10-012021-12-310001373715srt:ChiefExecutiveOfficerMemberus-gaap:EmployeeStockOptionMembernow:ShareBasedPaymentArrangementTrancheFourMembernow:A2021PerformanceAwardsMember2021-10-012021-12-310001373715srt:ChiefExecutiveOfficerMembernow:ShareBasedPaymentArrangementTrancheFiveMemberus-gaap:EmployeeStockOptionMembernow:A2021PerformanceAwardsMember2021-10-012021-12-310001373715srt:ChiefExecutiveOfficerMemberus-gaap:EmployeeStockOptionMembernow:ShareBasedPaymentArrangementTrancheSixMembernow:A2021PerformanceAwardsMember2021-10-012021-12-310001373715srt:ChiefExecutiveOfficerMemberus-gaap:EmployeeStockOptionMembernow:ShareBasedPaymentArrangementTrancheSevenMembernow:A2021PerformanceAwardsMember2021-10-012021-12-310001373715us-gaap:EmployeeStockOptionMember2020-01-012020-12-310001373715now:A2018WarrantsMemberus-gaap:WarrantMember2021-01-012021-12-310001373715now:A2018WarrantsMemberus-gaap:WarrantMember2020-01-012020-12-310001373715now:A2018WarrantsMemberus-gaap:WarrantMember2019-01-012019-12-310001373715us-gaap:ConvertibleNotesPayableMembernow:A2022ConvertibleSeniorNotesMember2021-01-012021-12-310001373715us-gaap:ConvertibleNotesPayableMembernow:A2022ConvertibleSeniorNotesMember2020-01-012020-12-310001373715us-gaap:ConvertibleNotesPayableMembernow:A2022ConvertibleSeniorNotesMember2019-01-012019-12-310001373715now:A2022WarrantsMemberus-gaap:WarrantMember2021-01-012021-12-310001373715now:A2022WarrantsMemberus-gaap:WarrantMember2020-01-012020-12-310001373715now:A2022WarrantsMemberus-gaap:WarrantMember2019-01-012019-12-310001373715us-gaap:EmployeeStockOptionMember2021-01-012021-12-310001373715us-gaap:EmployeeStockOptionMember2020-01-012020-12-310001373715us-gaap:EmployeeStockOptionMember2019-01-012019-12-310001373715us-gaap:RestrictedStockUnitsRSUMember2021-01-012021-12-310001373715us-gaap:RestrictedStockUnitsRSUMember2020-01-012020-12-310001373715us-gaap:RestrictedStockUnitsRSUMember2019-01-012019-12-310001373715us-gaap:EmployeeStockMember2021-01-012021-12-310001373715us-gaap:EmployeeStockMember2020-01-012020-12-310001373715us-gaap:EmployeeStockMember2019-01-012019-12-310001373715us-gaap:DomesticCountryMember2021-12-310001373715us-gaap:StateAndLocalJurisdictionMember2021-12-310001373715srt:MinimumMember2021-12-310001373715srt:MaximumMember2021-12-310001373715now:CelonisSEMembersrt:ScenarioForecastMember2022-01-012022-03-310001373715srt:NorthAmericaMember2021-01-012021-12-310001373715srt:NorthAmericaMember2020-01-012020-12-310001373715srt:NorthAmericaMember2019-01-012019-12-310001373715us-gaap:EMEAMember2021-01-012021-12-310001373715us-gaap:EMEAMember2020-01-012020-12-310001373715us-gaap:EMEAMember2019-01-012019-12-310001373715now:AsiaPacificAndOtherMember2021-01-012021-12-310001373715now:AsiaPacificAndOtherMember2020-01-012020-12-310001373715now:AsiaPacificAndOtherMember2019-01-012019-12-310001373715srt:NorthAmericaMember2021-12-310001373715srt:NorthAmericaMember2020-12-310001373715us-gaap:EMEAMember2021-12-310001373715us-gaap:EMEAMember2020-12-310001373715now:AsiaPacificAndOtherMember2021-12-310001373715now:AsiaPacificAndOtherMember2020-12-310001373715now:LicenseandServiceDigitalWorkflowProductsMember2021-01-012021-12-310001373715now:LicenseandServiceDigitalWorkflowProductsMember2020-01-012020-12-310001373715now:LicenseandServiceDigitalWorkflowProductsMember2019-01-012019-12-310001373715now:LicenseandServiceITOMProductsMember2021-01-012021-12-310001373715now:LicenseandServiceITOMProductsMember2020-01-012020-12-310001373715now:LicenseandServiceITOMProductsMember2019-01-012019-12-310001373715us-gaap:SubsequentEventMembernow:CelonisSEMember2022-03-31
UNITED STATES
SECURITIES AND EXCHANGE COMMISSION
Washington, D.C. 20549
FORM 10-K
| | | | | |
☒ | Annual Report pursuant to Section 13 or 15(d) of the Securities Exchange Act of 1934 |
For the fiscal year ended December 31, 2021
OR
| | | | | |
☐ | Transition report pursuant to Section 13 or 15(d) of the Securities Exchange Act of 1934 |
Commission File Number: 001-35580
SERVICENOW, INC.
(Exact name of registrant as specified in its charter)
| | | | | | | | |
| Delaware | | 20-2056195 |
(State or other jurisdiction of
incorporation or organization) | | (I.R.S. Employer
Identification Number) |
ServiceNow, Inc.
2225 Lawson Lane
Santa Clara, California 95054
(408) 501-8550
(Address, including zip code, and telephone number, including area code, of registrant’s principal executive offices)
Securities registered pursuant to Section 12(b) of the Act:
| | | | | | | | | | | | | | |
| Title of each class | | Trading Symbol | | Name of each exchange on which registered |
| Common stock, par value $0.001 per share | | NOW | | The New York Stock Exchange |
Securities registered pursuant to Section 12(g) of the Act:
Not applicable
__________________________
Indicate by check mark if the Registrant is a well-known seasoned issuer, as defined in Rule 405 of the Securities Act. Yes ☒ No ☐
Indicate by check mark if the Registrant is not required to file reports pursuant to Section 13 or Section 15(d) of Act. Yes ☐ No ☒
Indicate by check mark whether the Registrant (1) has filed all reports required to be filed by Section 13 or 15(d) of the Securities Exchange Act of 1934 during the preceding 12 months (or for such shorter period that the Registrant was required to file such reports), and (2) has been subject to such filing requirements for the past 90 days: Yes ☒ No ☐
Indicate by check mark whether the Registrant has submitted electronically every Interactive Data File required to be submitted pursuant to Rule 405 of Regulation S-T (§232.405 of this chapter) during the preceding 12 months (or for such shorter period that the Registrant was required to submit such files). Yes ☒ No ☐
Indicate by check mark whether the Registrant is a large accelerated filer, an accelerated filer, a non-accelerated filer, a smaller reporting company or an emerging growth company. See the definitions of “large accelerated filer,” “accelerated filer,” “smaller reporting company” and “emerging growth company” in Rule 12b-2 of the Exchange Act.
| | | | | | | | | | | |
Large Accelerated Filer | ☒ | Accelerated Filer | ☐ |
Non-Accelerated Filer | ☐ | Smaller Reporting Company | ☐ |
| | Emerging Growth Company | ☐ |
If an emerging growth company, indicate by check mark if the registrant has elected not to use the extended transition period for complying with any new or revised financial accounting standards provided pursuant to Section 13(a) of the Exchange Act. ☐
Indicate by check mark whether the registrant has filed a report on and attestation to its management’s assessment of the effectiveness of its internal control over financial reporting under Section 404(b) of the Sarbanes-Oxley Act by the registered public accounting firm that prepared or issued its audit report. ☒
Indicate by check mark whether the Registrant is a shell company (as defined in Rule 12b-2 of the Act). Yes ☐ No ☒
Based on the closing price of the Registrant’s Common Stock on the last business day of the Registrant’s most recently completed second fiscal quarter, which was June 30, 2021, the aggregate market value of its shares (based on a closing price of $549.55 per share on June 30, 2021 as reported on the New York Stock Exchange) held by non-affiliates was approximately $82.9 billion.
As of January 31, 2022, there were approximately 200 million shares of the Registrant’s Common Stock outstanding.
DOCUMENTS INCORPORATED BY REFERENCE
Portions of the Registrant’s definitive proxy statement for its 2022 Annual Meeting of Stockholders (Proxy Statement) to be filed within 120 days of the Registrant’s fiscal year ended December 31, 2021, are incorporated by reference in Part III of this Report on Form 10-K. Except with respect to information specifically incorporated by reference in this Form 10-K, the Proxy Statement is not deemed to be filed as part of this Form 10-K.
TABLE OF CONTENTS
| | | | | | | | |
| | Page |
| | |
| Item 1 | | |
| Item 1A | | |
| Item 1B | | |
| Item 2 | | |
| Item 3 | | |
| Item 4 | | |
| | |
| | |
| Item 5 | | |
| Item 6 | | |
| Item 7 | | |
| Item 7A | | |
| Item 8 | | |
| Item 9 | | |
| Item 9A | | |
| Item 9B | | |
| Item 9C | | |
| | |
| | |
| Item 10 | | |
| Item 11 | | |
| Item 12 | | |
| Item 13 | | |
| Item 14 | | |
| | |
| | |
| Item 15 | | |
| Item 16 | | |
| | |
| | |
| | |
PART I
FORWARD-LOOKING STATEMENTS
This Annual Report on Form 10-K, including the “Management’s Discussion and Analysis of Financial Condition and Results of Operations,” contains forward-looking statements regarding future events and our future results that are based on our current expectations, estimates, forecasts and projections about our business, our results of operations, the industry in which we operate and the beliefs and assumptions of our management. Words such as “believe,” “may,” “will,” “estimate,” “continue,” “anticipate,” “would,” “could,” “should,” “intend” and “expect,” variations of these words, and similar expressions are intended to identify those forward-looking statements. These forward-looking statements are only predictions and are subject to risks, uncertainties, assumptions and other factors that are difficult to predict. Therefore, actual results may differ materially and adversely from those expressed in any forward-looking statements. Factors that might cause or contribute to such differences include, but are not limited to those discussed in this Report under the section entitled “Risk Factors” in Item 1A of Part I and elsewhere herein, and in other reports we file with the Securities and Exchange Commission (“SEC”). While forward-looking statements are based on the reasonable expectations of our management at the time that they are made, you should not rely on them. We undertake no obligation to revise or update publicly any forward-looking statements for any reason, whether as a result of new information, future events or otherwise, except as may be required by law.
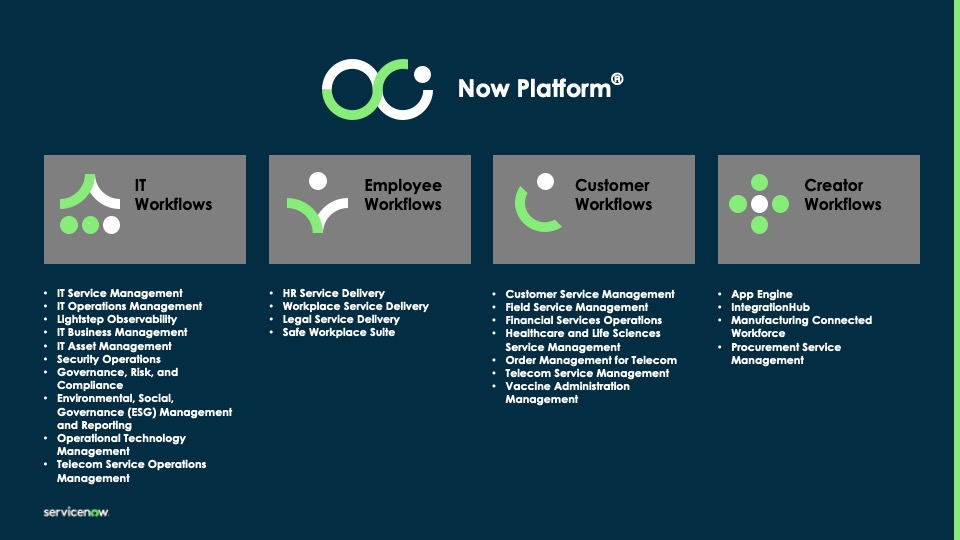
ServiceNow was founded on a simple premise: a better technology platform will help work flow better. The company’s purpose is to make the world work better for everyone. We help global enterprises across industries, universities and governments to digitize their workflows—the individual tasks that need to be executed to get a job done. Our technology platform, which we refer to as the Now Platform, enables us to connect systems, silos, departments and processes with digital workflows that are simple and easy to use. We categorize the workflows we provide into four primary areas: Information Technology (“IT”), Employee, Customer and Creator, as discussed in more detail below. Our IT workflows give IT departments the ability to plan, build, operate and service across the entire IT lifecycle. Our Employee workflows help customers simplify how their employees get the services they need, creating a familiar, consumer-like way to get work done from wherever an employee may be—at home, in the workplace or in the field. Our Customer workflows help organizations reimagine the customer experience and increase customer loyalty. Our Creator workflows enable our customers to quickly create, test, and deploy their own applications on the Now Platform.
Traditionally, business processes have been automated and embedded across enterprise technology systems from finance to human resources (“HR”) to sales, customer support and beyond. Over time, these systems have become disconnected, siloed and complex, often limiting flexibility and adaptability and lacking the intuition and empowerment of technologies created for the individual consumer. ServiceNow is changing these limitations. We offer the capability to quickly change how work is done to keep pace with a rapidly changing environment. The Now Platform delivers a simple, user-friendly experience, making work easier, faster and more fulfilling. We believe a better service experience is the ultimate desired outcome of digital transformation.
The Now Platform is uniquely positioned to enable our customers’ digital transformation from non-integrated enterprise technology solutions with manual and disconnected processes and activities, to integrated enterprise technology solutions with automation and connected processes and activities. The transformation to digital operations, enabled by the Now Platform, increases our customers’ resiliency and security and delivers great experiences and additional value to their employees and consumers.
The company’s success began with Information Technology Service Management (“ITSM”), a category in which ServiceNow has become a market leader. Over time, we expanded beyond our ITSM capabilities to meet the needs of our customer’s expanding digital requirements to modernize technology operations, employee experiences, customer experiences, industry-specific challenges and application development and integration. We are now recognized as a leader for multiple products across our IT, Employee, Customer and Creator Workflows.
The Now Platform’s task-based orientation allows work to be done with a single, aligned view of every service experience. For example, a new employee uses ServiceNow to complete onboarding tasks with their new employer. The new employee is interfacing through an integrated ServiceNow experience whether tasks originate from ServiceNow or other systems. Similarly, customer service can be executed in a way that solves problems without creating frustration.
Over the years, we have expanded our customer base and our customers have expanded their use of the Now Platform. For example, many companies now have multi-year, digital transformation plans, many of which heavily involve introducing uses of additional ServiceNow products and services. From a single, out-of-the-box solution, companies recognize the value of using additional products to strengthen the richness and quality of their data running through the Now Platform. As we help organizations realize more value from the Now Platform and better serve their stakeholders, we do so in a manner that also helps organizations accelerate their environmental, social and governance (“ESG”) ambitions. To serve the growing focus on ESG, ServiceNow also offers an integrated ESG solution on the Now Platform as part of our IT workflows.
ServiceNow strives to help our customers solve their unique challenges, operate on their unique technologies and systems and change at their unique pace. The foundation of our approach to customers and our ambition to be the defining enterprise software company of the 21st century are grounded in our values.
•Wow our customers: Customers are the center of our world. We strive to deliver the best customer experiences and innovations.
•Win as a team: We share the same goals and have clear roles in achieving them. We deliver results as a team and enjoy the journey.
•Create belonging: Diversity, equity and inclusion are fundamental. Belonging is the breakthrough. We lead with empathy, which means listening and acting to make everyone feel they belong with ServiceNow.
•Stay hungry and humble: We do not take success for granted. We are always ready to learn and evolve. We grow together, bringing fresh ideas and new perspectives.
For all these reasons, our customers trust us with their mission critical operations, and we feel immensely proud that “The World Works with ServiceNow.”
Our Products
ServiceNow’s product portfolio spans four workflows—IT, Employee, Customer and Creator—and are delivered on ServiceNow’s Platform—the Now Platform. The products under each of our workflows are helping customers connect work across systems and silos to enable great experiences for people. Each year, two platform upgrades are released, each with new standard functionality and new standalone products to further simplify the way our customers work and enhance productivity.
The Now Platform
The Now Platform is a single-cloud platform with one data model and one architecture, enabling speed, flexibility and innovation that offers a one-stop shop for automation and simplification of manual processes. It is highly flexible, scalable, and extensible. The Now Platform delivers workflows across siloed organizations and systems by connecting them together in a seamless way to unlock productivity and improve experiences for both employees and customers. As the foundation for how we deliver our enterprise-wide digital workflows, the Now Platform integrates with our customers’ cloud platforms and systems of choice, allowing our customers to deliver workflows across their current and future preferred systems of record and collaboration platforms. The automation of workflows on our platform is enhanced by additional services we offer, such as artificial intelligence (“AI”), machine learning, robotic process automation, performance analytics, electronic service catalogs and portals, configuration management systems, data benchmarking, encryption and collaboration and low-code/no-code development tools. While every company has a different suite of user interfaces from web-based to mobile to conversation applications, the Now Platform creates a common user experience for customers to manage workflows across all interfaces.
The Now Platform also powers three native mobile experiences for everyday work across the enterprise: Virtual Agent, Now Mobile and Mobile Onboarding. Enterprises can take advantage of consumer-like, mobile experiences, such as getting help from human resources or ordering a computer, from our platform. Our goal is to make our customers’ work lives as simple, easy and mobile-friendly as their personal lives.
IT Workflows
Our IT Workflows help companies unite IT, risk management, and security operations on a single platform to deliver modern, resilient services aligned to our customers’ priorities. Our IT products assist IT departments to serve their customers, manage their networks, identify and remediate security vulnerabilities and threats, gain visibility across their IT resources and asset lifecycles, optimize IT costs and reduce time spent on administrative tasks. We enable IT workflows through ITSM, IT Business Management, IT Operations Management, IT Asset Management, Security Operations, and Governance, Risk and Compliance, among other products. Many of these products also enable our Employee and Customer workflows.
IT Service Management
As our flagship product suite, ITSM defines, structures, consolidates, manages and automates the IT services that an enterprise offers its employees, customers and partners. Among ITSM’s capabilities are AI, machine learning, predictive intelligence, Virtual Agent, recording incidents, remediating problems, automating routine tasks and requests, performance analytics and continual improvement management capabilities.
IT Business Management
Our IT Business Management product suite enables customers to manage their IT priorities, including the scope and cost of IT projects, the development of software related to those projects and the overall management of the customer’s IT project portfolio.
IT Operations Management
Our IT Operations Management product suite connects a customer’s physical and cloud-based IT infrastructure with our applications and platform. It identifies a customer’s IT infrastructure components (e.g., servers) and associated business services (e.g., email) which are dependent upon that infrastructure. It also maintains a single data record for all IT configurable items, which allows our customers to exercise control over their on-premises or cloud-based infrastructures and orchestrate key processes and tasks.
IT Asset Management
Our IT Asset Management product automates customers’ IT software, hardware and cloud asset lifecycles with workflows to track the financial, contractual and inventory details of these IT assets throughout their lifecycles.
Security Operations
Our security operations product connects with internal and third-party security alerts from a customer’s infrastructure to prioritize and respond to incidents and vulnerabilities according to their potential impact on a customer’s business.
Governance, Risk and Compliance
Our Governance, Risk and Compliance (“GRC”) products help customers manage risk and resilience in real time. Among the GRC’s product suite’s capabilities are policy and compliance management, risk management, including detection and assessment, business continuity management, vendor risk management and operational risk management.
Employee Workflows
Our Employee workflow products can transform the employee experience and make work better for our customers’ employees by letting their employees work and collaborate where and how they want, improving productivity and agility. Employee workflow products also help customers be more efficient with their employee resources, staffing and delivery services, streamline employee lifecycle events and increase visibility as workforces continue to be remote. We enable Employee workflows through HR Service Delivery, Safe Workplace Suite, Workplace Service Delivery, and Legal Service Delivery, among other products.
HR Service Delivery
Our HR Service Delivery product defines, structures, consolidates, manages and automates HR services related to employee requests. HR Service Delivery capabilities include HR case management, employee self-service, knowledge management and management of employee lifecycle events across multiple departments, such as onboarding, transfers and off-boarding.
Safe Workplace Suite
We created a Safe Workplace suite of applications and a dashboard to help companies manage the steps for returning employees to the workplace, assessing both workforce and workplace readiness, contact tracing and documenting employee health and vaccination status. These applications were developed to help companies reopen the workplace and support the health and safety of their employees after emergencies or pandemics, increase engagement, improve productivity and maintain business continuity, all while creating a great user experience for employees.
Workplace Service Delivery
Our Workplace Service Delivery product keeps our customers’ workplaces running smoothly with a multi-channel, mobile-enabled solution. With Workplace Service Delivery, employees of our customers automate requests, reservations and repairs to help use space wisely, provide easy access to services, manage requests efficiently and get real-time visibility.
Legal Service Delivery
Our Legal Service Delivery product consolidates manual tools and modernizes internal legal operations processes to manage legal requests across the enterprise. With Legal Service Delivery, legal teams can gain efficiency, deliver support efficiently with automated responses and get insight into demand with real-time reporting and dashboards.
Customer Workflows
Customer workflows help drive customer loyalty with connected digital workflows that deliver modern customer experiences. Customer workflows help customers elevate their customer service with enhanced resolution efficiency and improved service quality made possible with workflows, automation, and location-based work tasks management. Customer service departments no longer have to rely on reactive agents searching multiple systems to find a single answer to customer issues. Integrating front-end customer service capabilities with operations and field service resources, our Customer workflow products help create a seamless customer experience from issue to resolution through connected digital workflows that deliver fast support on a customer’s channel of choice. We enable Customer workflows through Customer Service Management and Field Service Management, among other products.
Customer Service Management
Our Customer Service Management product defines, structures, consolidates, manages and automates common customer service cases and requests, such as password resets, to be automated with out-of-the-box self-service, and for other cases it routes work from the customer service agent to field service, engineering, operations, finance or legal personnel to resolve the underlying issues.
Field Service Management
Our Field Service Management product allows field service agents to be effectively assigned, deployed and managed on the same underlying customer service management platform that created and managed the customer incident.
Creator Workflows
Creator workflows help customers build cross-enterprise digital workflow applications fast with a low-code platform that safely delivers agile services at scale. As organizations digitally transform, they need to pivot faster with new processes and business models. This requires faster, more agile execution with more automation delivered through software applications. With Creator Workflows, citizen developers have access to pre-built templates, low-code tools and modular building blocks created by professional developers and the user experience is further enhanced when such apps are used on the same platform they were built. We enable Creator workflows through App Engine and IntegrationHub, among other products.
App Engine
Our App Engine product empowers enterprise-class low code application delivery with intuitive and intelligent experiences, at speed and scale. With App Engine, customers and third-party developers can extend workflow automation by creating, testing and deploying their own consumer-grade applications that can be scaled from a single department to the entire enterprise. Examples of applications our customers have developed include: an application developed by a company with a large network of seasonal retail stores and offices to track progress and identify issues in opening and closing their seasonal locations, which enabled significant cost savings; an application developed by the IT office of a university that allocated and billed costs associated with IT maintenance, allowing the university to retire multiple legacy software systems; and an application developed by a mortgage company to ensure that loan files were complete and accurate prior to packaging and selling the loans to investors.
IntegrationHub
Our IntegrationHub product enables anyone who creates an application on the Now Platform to extend workflows into third-party products, eliminating the need for other integration tools to connect a ServiceNow workflow with other software platforms. Integration hub provides a framework that allows developers to create and publish integrations for use by anyone. The Now Platform provides connectors to hundreds of products and integrations in the ServiceNow Store.
Industry Solutions
We offer industry solutions to better address the unique needs of specific industries. We offer industry solutions for financial services; telecommunications, media and technology (“TMT”); healthcare and life sciences; and manufacturing. We intend to offer other industry specific solutions in addition to our other workflow products. With Financial Services Operations, financial services customers can unite their front, middle and back offices to improve customer and employee experiences. With Telecommunications Service Management and Order Management, TMT customers can scale their order management process, launch services quickly, enhance customer care, automate service assurance and gain real-time data visibility. With Healthcare and Life Sciences Service Management, healthcare and life sciences customers can offer consumer-grade experiences, unlock productivity and streamline operations. With Manufacturing Connected Workforce and Operational Technology Management, manufacturing customers can empower their workforce with digital tools and knowledge to improve efficiency and create a single system of action for their operational environment, improve uptime and drive outcomes across their operations.
Professional Services
Our Professional Services are offered by ServiceNow alone and in a co-delivery model with our network of partners to help customers maximize the value of their ServiceNow investment. Our professional services include process design, implementation, configuration, architecture and optimization services. With our Now Value methodology as the foundation for customer success, our services bring together our experts and leading practices enabling our customers to create value and drive customer outcomes as they embark on enterprise digital transformations through the use of our platform. Our training services include programs for all of our products.
Customer Support
Customers receive standard and enhanced support around the globe, from technical resources located in the United States and internationally. We will start offering customer support on a subscription-based model and we offer self-service technical support through our support portal, which provides access to documentation, knowledge base articles, online training, online support forums and online case creation.
Our Technology and Operations
We operate a multi-instance architecture that provides each customer with its own dedicated application logic and database. This architecture is designed to deliver high-availability, scalability, performance, security and ease of upgrading. Our cloud infrastructure primarily consists of industry-standard servers, networks and storage components. We host our full software-as-a-service experience on our own private cloud and use public cloud service providers for customers that are primarily in highly regulated markets.
Our data centers operate in paired configurations to enable replication for high-availability and redundancy. We currently operate data centers in Australia, Brazil, Canada, Germany, Ireland, Japan, South Korea, the Netherlands, Singapore, Switzerland, the United Kingdom, and the United States, and we continuously evaluate our data center operations and capacity in existing and new geographies.
We offer customers the option to deploy our services on dedicated hardware in our data centers. We offer customers the option to have their EU-hosted data handled exclusively within the EU. Our architecture also gives us the added flexibility to allow customers the option of deploying our services internally or under contract with a third party to host the software in order to support unique regulatory or security requirements. While there are some limitations on agility and flexibility as compared to our cloud offering, a minority of our customers have elected the third-party alternative. The standard and enhanced customer support we provide for self-hosted customers is similar to the support we provide to customers deployed in our managed data centers.
Sales and Marketing
We market and sell our products and services to enterprises across industries, including government, financial services, healthcare, telecommunications, manufacturing, IT services, technology, oil and gas, education and consumer products. We sell our product offerings and services through subscription services primarily through our global direct sales organization. We also sell services through managed services providers and resale partners.
Our marketing efforts and lead generation activities consist primarily of customer referrals, digital advertising (including via our website), trade shows, industry events, brand campaigns and press releases. We also host our annual Knowledge user conference, webinars and other user forums, including regional forums which we call Now at Work, where customers and partners both participate in and present on a variety of programs designed to educate them on industry best practices and help accelerate their success.
We continue to expand our sales capabilities in new geographies, including through investments in direct and indirect sales channels, professional services capabilities, customer support resources, post-sales customer support resources, strategic alliances and partnerships, implementation partners and advisory councils. We also plan to increase our investment in our existing locations in order to achieve scale efficiencies in our sales and marketing efforts.
Partner Ecosystem
In addition to our global direct sales organization, we also have a strong and growing ecosystem of partners that helps accelerate our customers’ digital transformation initiatives and deliver customer value at scale. Our partners play a critical role in helping companies digitally transform their business. Our industry and workflow capabilities paired with our partners’ industry and functional domain experience help customers of all sizes. Together with our partners, we offer industry and domain-focused solutions at scale and are accelerating digital transformation as we help companies drive new approaches in engaging their end users and employees.
Customers
We primarily sell our services to large enterprise customers, and we host and support large, enterprise-wide deployments for our customers. As of December 31, 2021, we had approximately 7,400 enterprise customers. Our customers operate in a wide variety of industries, including government, financial services, healthcare, manufacturing, IT services, technology, oil and gas, telco, education and consumer products. The portion of our revenues generated by sales to government customers has also increased over time. See “Risk Factors—Doing business with the public sector, including U.S. governments and agencies, heavily-regulated organizations and governments globally, subjects us to risks related to the government procurement process, regulations, and contracting requirements” for additional information about our sales to government customers.
Research and Development
Our research and development organization is responsible for the design, development, testing and validation of our solutions. We focus on innovating and developing new services and core technologies and further enhancing the functionality, reliability and performance of our existing solutions. Using emerging technologies, we can anticipate customer demands and then bring new services and new versions of existing services to market quickly in order to remain competitive in the marketplace. We have made, and will continue to make, significant investments in research and development to broaden our platform capabilities, strengthen our existing applications, expand the number of applications on our platform, enhance our user experience and develop additional mobile, automation and machine intelligence technologies.
Acquisitions and Investments
In addition to our own research and development investments, we have made strategic acquisitions and investments and will continue to assess opportunities to complement our technology and skill sets and expand our product reach. Our focus is on building out our platform and products through both organic investments to support customer needs and acquisitions of talent and enhanced capabilities. For example, our larger acquisitions in 2021 focused on bringing development and operations observability and additional AI capabilities to the Now Platform and across our suite of products.
Competition
As customers accelerate their digital transformation plans and digital operation initiatives, they are demanding less complexity and lower total cost in the implementation, sourcing, integration and ongoing maintenance of their information technology environments. The Now Platform is designed to meet customers’ demands by seamlessly connecting workflows across siloed organizations and systems in a way that unlocks productivity, improving experiences for both employees and customers and delivering real business outcomes. Our technology platform offers solutions that are complementary to the offerings of many enterprise software vendors; we believe that we do not need those vendors to lose for us to win. We work directly with product and service offerings from a broad range of companies including some of the largest in the world, and continuously increase our strategic alliances with many of these companies as we expand our integrations for customers. However, as we and those vendors grow, we may find ourselves in competition with solutions and alternative approaches to solving customer needs, including:
•Enterprise application software vendors. We designed the Now Platform to quickly integrate with, and complement the performance of well-established, enterprise application software vendors, such as Oracle, SAP, Salesforce, and Workday. Customers may choose to work directly with their application software vendors to improve integrations and create connected workflows.
•New technologies and entrants. Markets are rapidly evolving and highly competitive, with relatively low barriers to entry. New technologies and competitors are entering the markets to solve similar problems in different ways, intensifying competition. Customers may choose alternative technologies to improve integrations and create connected workflows.
•In-house solutions. Many customers have invested substantial personnel and financial resources to implement and integrate their current enterprise software into their businesses. Customers may choose to work with their internal IT departments or other personnel to build custom workflow solutions and integrations.
•Cloud-based vendors. As businesses increasingly utilize public cloud and software-as-a-service (“SaaS”)-based offerings, they are adopting a hybrid (on-premise and off-premise) approach for their existing and new compute workloads. As a result, our services will need to increasingly compete for customers’ hybrid IT workloads with off-premises public cloud and SaaS-based offerings. Additionally, our offerings may compete with offerings from various public cloud providers. Many of these cloud providers are partnering with on-premise hardware vendors to deliver their cloud platform as an on-premise solution.
Intellectual Property
We rely upon a combination of U.S. and international copyright, trade secret, patent and trademark laws and confidentiality procedures and contractual restrictions, such as confidentiality and license agreements, to establish, protect and grow our intellectual property (“IP”) rights. In addition, we enter into confidentiality and proprietary rights agreements with our employees, partners, vendors, consultants and other third parties and control access to our IP and other proprietary information. We also purchase or license technology that we incorporate into our products or services. In certain of our partnership arrangements, our partners may develop technology on the Now Platform that may be subject to copyright or other intellectual property rights that we agree to with the partner.
We continue to grow our global patent portfolio and IP rights that relate to our platform, applications, services, research and development and other activities. Our success depends in part upon our ability to protect our core technology and IP. As of December 31, 2021, we had over 2,150 U.S. and foreign patents, including patents acquired from third parties, and over 850 pending patent applications. We do not believe that our proprietary technology is dependent on any single patent or other IP right or group of related patents or IP rights. We file patent applications to protect our IP and have and may continue to acquire additional patents, patent portfolios, or patent applications. See “Risk Factors—Lawsuits against us by third parties that allege we infringe their intellectual property rights could harm our business and operating results” and “Risk Factors—Our intellectual property protections may not provide us with a competitive advantage and defending our intellectual property may result in substantial expenses that harm our operating results” for additional information.
Environmental, Social and Governance
We operate our business and global impact strategy consistent with our purpose to “make the world work better for everyone”. Through our global impact strategy, we formalized existing programs and started new initiatives intended to make our business, our communities and the world more equitable and sustainable. Our strategy focuses on areas where our business can drive positive change across ESG by addressing various ESG risks and opportunities. Our Nominating and Governance Committee oversees our ESG activities, programs and disclosures, our Audit Committee oversees our processes, procedures and validation related to our ESG disclosures and our Compensation Committee oversees human capital management.
In April 2021, we issued our inaugural Global Impact Report to provide insights into the ESG areas where we are focusing our efforts. For environmental, we are working towards sustaining our planet by championing a net-zero environment. For governance, we are acting with integrity by building trust through ethical, transparent and secure business practices. For social, we are creating equitable opportunity to make work more equitable, accessible and rewarding for all people. Additional information about our “social” initiatives is discussed below in “—Human Capital Management”. In September 2021, we announced our goal to achieve net-zero greenhouse gas emissions by 2030. In October 2021, we announced our integrated ESG solution to help customers activate their ESG strategy. In November 2021, we became a member of the Dow Jones Sustainability Index (DJSI) for North America.
Human Capital Management
Our People Strategy
Our People Strategy is pivotal to our goal of becoming the defining enterprise software company of the 21st century. Our People Strategy is designed to help us execute against our business strategy, while living our best lives, doing our best work, and fulfilling our purpose together. We aim to attract, recruit, develop and retain the best, most diverse talent, celebrating the diversity and differences that drive our innovation and creativity. We are committed to a respectful, rewarding, and inclusive work environment that enables our people to grow themselves, grow their teams, and grow the business with the mission to make the world work better for everyone. Our People Strategy is based on two foundational principles and three key pillars.
Foundational principles
•We must always honor ServiceNow’s authentic culture and purpose as we continue to grow.
•We must ensure that our People Strategy is informed by data and insights as we strive to scale efficiently and make informed and unbiased decisions.
Key pillars
•Scale and Innovation: We need to build and innovate around a talent engine that attracts, grows, and retains the best people who will drive our business and mission forward. Our talent engine puts our people at the center, and is rooted in processes, data and systems that allow us to be efficient and cost effective.
•Inclusive Employee Experience: We need to foster an inclusive culture in which all of our people feel a deep sense of belonging and can be their authentic self. The experience our employees have at ServiceNow is a critical factor in retaining and attracting top talent.
•Growth and Development: We know from our employee surveys that our people have a deep desire for learning opportunities that will help them grow as individuals and as teams, and ultimately, help them grow our business. As a result, growth and development—from early-in-career talent to senior leaders—are critical aspects of our People Strategy.
Our Culture
ServiceNow’s culture is grounded in our values, first discussed above. We live our culture by regularly listening to our people and gathering feedback directly from our workforce to inform our programs and employee needs globally. We listen through our Employee Voice Surveys (“EVS”), which measures and analyzes employee engagement, including on such topics as inclusion and belonging, learning and development, recognition, pay, and well-being. EVS insights are used to action plan at all levels of the organization and inform the assessment of our human capital management approach and its alignment with our company purpose and business strategy.
We also listen by gaining insights across the employee lifecycle through onboarding, exit, and other check-in surveys. Among other things, our listening in 2021 gave us invaluable insights into ways we could best support employees through the COVID-19 pandemic and has fueled our Future of Work strategy and policies.
As a result, we earned several external recognitions in 2021 that speak to our strong culture including from the Fortune Future 50, the Fortune 100 Best Companies to Work For and the Great Place to Work’s 100 Best Workplaces for Parents.
Diversity, Equity and Inclusion (“DE&I”)
“Creating Belonging” is one of our four company values. We expect each of our people to live our values both inside and outside of the work environment. We have several initiatives focused on recruiting, learning and development, and culture to weave DE&I throughout our talent processes to drive sustainable progress as we strive to create a more diverse, equitable and inclusive culture.
Within ServiceNow, we support multiple Belonging Groups for women, racial and ethnic minorities, military veterans, people with disabilities, people of different faiths, and people who identify as LGBTQI+. These groups are intended to give employees a safe space and help support our culture and community-building efforts across the company. We also publicly disclose our progress on a multitude of workforce metrics in the various reports we issue that include information on gender, race, and ethnic minority representation in our U.S. employee population.
We also create belonging in our communities. Our NextGen Professional Program, a digital skills program building the next generation of ServiceNow certified professionals (“NextGen”), is creating generational, diverse talent engines for our customers and partners. This program builds critical skillsets for participants, many of whom are traditionally marginalized by the technology industry. In addition, our partnership with Benedict College in South Carolina is deepening our relationships with the historically black colleges and universities (HBCU) community. Further, ServiceNow’s $100 million Racial Equity Fund was launched in January 2021, designed to drive more sustainable wealth creation by funding homeownership, entrepreneurship, and neighborhood revitalization within black communities in 10 regions across the United States. It was fully deployed in December 2021. Additionally, in 2021, the employees of ServiceNow volunteered a total of approximately 19,900 hours and donated a total of approximately $2 million. Our corporate giving, including grants, matching donations and rewards, totaled approximately $10 million.
Total Rewards
Our total rewards philosophy has at its core the goal of attracting, rewarding, and retaining top talent to help us execute our strategy and mission. We believe in competitive pay practices and a pay-for-performance culture. In addition to base salary, all our employees are eligible to participate in our annual cash bonus plan or in our sales commission plan. In order to attract and retain the best talent, we have a broad-based discretionary equity program and an employee stock purchase plan, which enables employees to participate in the success of our company. Our employees enjoy a competitive benefits offering that focuses on physical, mental, and financial well-being.
Pay Equity
Everyone deserves to be treated fairly and respectfully. We believe there should be equity across the entire talent ecosystem – from hiring through career advancement. To achieve that, we continue to build and scale equitable people practices that foster inclusive and fair outcomes for all employees. This includes pay equity. Because pay equity is so dynamic at a high-growth company like ours, we manage it on an ongoing basis and do regular analyses and adjustments, as warranted. We are proud that our process led us to achieve systematic pay equity as of October 20, 2021, our latest company-wide analysis, and helps ensure that we maintain pay equity on an ongoing basis.
Well-being and Safety
ServiceNow is committed to supporting employee well-being and safety while they are at work and in their personal lives.
At the outset of the pandemic, we quickly adopted a company policy encouraging all employees to work remotely and closed all of our offices (including our headquarters), except for certain critical positions. Throughout 2020 and 2021, we took a wide variety of measures to protect the health and well-being of our global employees during the COVID-19 pandemic, including implementing a pandemic medical leave policy, providing a one-time, wellness stipend and offering employees the choice to work remote. We also hosted a series of speakers to help employees navigate through the challenging time. In 2021, as COVID-19 peaked in countries across the world, ServiceNow responded. For example, during the largest wave of the pandemic in India in the spring of 2021, ServiceNow provided our employees based in India on-campus vaccination drives, virtual information sessions with doctors, and other COVID-19 related medical benefits.
In addition to programs relating to COVID-19, our standard, comprehensive benefits package covers many physical, emotional, and financial wellness programs. From June to September 2021, we offered additional time-off with “recharge half-day Fridays” to further support the well-being of our global employees.
Learning and Development
Our people have a deep desire to learn and grow. Our learning and development programs are designed to “grow self, grow team, grow business.” In addition to the extensive functional learning program run by individual business units that focus on technical skills and capabilities, our global Learning and Development program is focused on enabling all our people – from our early-in-career talent who have access to programs that help them plan for professional growth and financial success to our more tenured leaders who have access to programs like “Future Readiness,” led by Harvard Business Professor Frances Frei, focusing on the importance of inclusive leadership, strategy and trust in the new world of work–to grow and be the best individual contributors, managers and leaders they can be.
New Ways of Working
In October 2021, we announced our new Future of Work policy to support our people as they adapt to new ways of working that shift paradigms, embrace flexibility, promote inclusion, and drive innovation. Under this policy, beginning in 2022, the majority of our employees are in a workplace three days or fewer a week, which provides them flexibility to organize their schedules. Our flexible working environment will enable us to attract, recruit and retain the best talent and we believe will only serve to strengthen our company. Our fully-remote workforce is also expected to continue to increase, allowing us to tap into different, more diverse talent, who are not geographically close to a ServiceNow workplace.
Workforce Metrics
As of December 31, 2021, we employed 16,881 people on a full-time basis, 9,341 in the United States and 7,540 internationally. None of our U.S. employees are represented by a labor union. Employees in certain European countries are represented by workers’ councils and have the benefits of collective bargaining arrangements at the national level. We have not experienced interruptions of operations or work stoppages due to labor disagreements.
Available Information
You can obtain copies of our Annual Report on Form 10-K, Quarterly Reports on Form 10-Q, Current Reports on Form 8-K, and other filings with the SEC, and all amendments to these filings, free of charge from our website at www.servicenow.com/company/investor-relations/sec-filings.html as soon as reasonably practicable following our filing of any of these reports with the SEC. The SEC maintains an Internet site that contains reports, proxy and information statements and other information regarding issuers that file electronically with the SEC at www.sec.gov. The contents of these websites are not incorporated into this filing and our references to the URLs for these websites are intended to be inactive textual references only.
Investors and others should note that we announce material financial information to our investors using our investor relations website (https://www.servicenow.com/company/investor-relations.html), SEC filings, press releases, public conference calls and webcasts. We use these channels, including our website and social media, to communicate with our investors and the public about our company, our services and other issues. It is possible that the information we post on social media could be deemed to be material information. Therefore, we encourage investors, the media, and others interested in our company to review the information we make available on our website and the social media channels listed on our website.
Investing in our securities involves risks. You should carefully consider the risks and uncertainties under “Risk Factors Summary” and the more detailed descriptions immediately following the summary, together with all of the other information in this Annual Report on Form 10-K, including our consolidated financial statements and related notes, before making an investment decision. The risks and uncertainties described below are not the only ones we face. The occurrence of any of the following risks or additional risks and uncertainties not presently known to us or that we currently believe to be immaterial could materially and adversely affect our business, financial condition or results of operations. Many risks affect more than one category, and the risks are not in order of significance or probability of occurrence because they have been grouped by categories. Our stock price could decline due to any of these risks.
Risk Factors Summary
This summary of risks below is intended to provide an overview of the risks we face. Important information is included in the body of each risk factor that cannot be substituted for by reviewing only the summary
•Risks Related to Our Ability to Grow Our Business
•Privacy laws and concerns, evolving regulation of cloud computing, cross-border data transfer restrictions, other foreign and domestic regulations and standards related to data and the Internet may adversely affect our business.
•Doing business with the public sector, including U.S. governments and agencies, heavily-regulated organizations and governments globally, subjects us to risks related to government procurement processes, regulations, and contracting requirements.
•If we fail to comply with applicable anti-corruption and anti-bribery laws, export control or global trade laws, we could be subject to penalties and civil and/or criminal sanctions and our business could be materially adversely affected.
•We participate in intensely competitive markets, and if we do not compete effectively, our business and operating results will be harmed.
•If we fail to innovate in response to rapidly evolving technological and market developments and customer needs, our competitive position and business prospects may be harmed.
•If we are unsuccessful in increasing our penetration of international markets or managing the risks associated with foreign markets, our business and operating results will be adversely affected.
•We rely on our network of partners for an increasing portion of our revenues, and if these partners fail to perform, our ability to sell and distribute our products may be limited, and our operating results and growth rate may be harmed.
•Delays in the release of, or actual or perceived defects in, our products may slow the adoption of our latest technologies, reduce our ability to efficiently provide services, decrease customer satisfaction, and adversely impact future product sales.
•As more of our sales efforts are targeted at larger enterprise customers, our sales cycle may become longer and more expensive and we may encounter pricing pressure and implementation and configuration challenges.
•As we acquire or invest in companies and technologies, we may not realize the expected business or financial benefits and the acquisitions and investments may divert our management’s attention and result in additional shareholder dilution.
•Risks Related to the Operation of Our Business
•If we or our third-party service providers experience an actual or perceived cyber-security event, our platform may be perceived as not being secure and we may lose customers and incur significant liabilities, any of which would harm our business and operating results.
•If we lose key members of our management team or employees or are unable to attract and retain the employees we need, our compensation costs will increase and our business and operating results will be adversely affected.
•Disruptions or defects in our services could damage our customers’ businesses, subject us to substantial liability and harm our reputation and financial results.
•Lawsuits against us by third parties that allege we infringe their intellectual property rights could harm our business and operating results.
•Our intellectual property protections may not provide us with a competitive advantage, and defending our intellectual property may result in substantial expenses that harm our operating results.
•Our use of open source software could harm our ability to sell our products and services and subject us to possible litigation.
•Various factors, including our customers’ business, integration, migration, compliance and security requirements, or errors by us, our partners, or our customers, may cause implementations of our products to be delayed, inefficient or otherwise unsuccessful.
•Risks Related to the Financial Performance or Financial Position of Our Business
•Our operating results may vary significantly from period to period, and if we fail to meet the financial performance expectations of investors or securities analysts, the price of our common stock could decline substantially.
•Because we generally recognize revenues from our subscription service over the subscription term, a decrease in new subscriptions or renewals during a reporting period may not be immediately reflected in our operating results for that period.
•As our business grows, we expect our revenue growth rate to continue to decline.
•Changes in our effective tax rate or disallowance of our tax positions may adversely affect our financial position and results.
•If we are unable to maintain effective internal control over financial reporting, the accuracy and timeliness of our financial reporting may be adversely affected.
•Risks Related to General Economic Conditions
•The extent to which the ongoing COVID-19 pandemic will continue to impact our business and future results of operations and financial condition will depend on future developments, which are highly uncertain and difficult to predict.
•Natural disasters, including climate change, and other events beyond our control could harm our business.
•Global economic conditions may harm our industry, business and results of operations.
•Foreign currency exchange rate fluctuations could harm our financial results.
•Risks Related to Our 2030 Notes and 2022 Notes
•Our debt service obligations may adversely affect our financial condition and cash flows from operations.
•The conditional conversion feature of the 2022 Notes may adversely affect our financial condition and operating results.
•The convertible note hedge and warrant transactions may affect the value of the 2022 Notes and our common stock.
•We are subject to counterparty risk with respect to the 2022 Note Hedge.
•Risks Related to Ownership of Our Common Stock
•Our stock price is likely to continue to be volatile and could subject us to litigation.
•We do not intend to pay dividends on our common stock, so any returns will be limited to changes in our stock price.
•Provisions in our charter documents, Delaware law, 2030 Notes or 2022 Notes might discourage, delay or prevent a change of control or changes in our management and, therefore, depress our stock price.
Risks Related to Our Ability to Grow Our Business
Privacy laws and concerns, evolving regulation of cloud computing, cross-border data transfer restrictions, other foreign and domestic regulations and standards related to data and the Internet may adversely affect our business.
National and local governments or agencies have adopted, and may continue to adopt, laws and regulations affecting data privacy, the use of the Internet as a commercial medium and data sovereignty or residency requirements concerning the location of data centers and support services. As a cloud-based service provider, we optimize performance of our products and services by utilizing data centers located in, and support provided from, different jurisdictions. Changing laws, regulations and standards applying to the collection, use, sharing, transfer or other processing of data, including personal data, could affect our ability to develop our products and services to maximize their utility, as well as our customers’ ability to use data or share data with service providers. Such changes may restrict our ability to use, store or otherwise process data of our customers in connection with providing and supporting our services. In some cases, this could impact our ability to offer our services in certain locations or our customers’ ability to deploy our services globally.
Compliance with, and other obligations imposed by, existing and upcoming laws globally, including Europe and state specific privacy laws in the United States (“US”), global trends to regulate the use of AI, the ruling of the European Court of Justice in Schrems v. Facebook Ireland and interpretations of that ruling by regulators and customers, recommendations issued by the European Data Protection Board, new Standard Contractual Clauses issued by the European Commission, and other privacy, data residency, sovereignty and transfer laws, regulations and standards (including self-regulatory standards) may cause us to incur substantial operational costs or require us to modify our data handling practices and/or policies, may limit the development, use and adoption of our services, and could reduce overall demand for our services. Laws or regulations related to the use of AI technology may impact our ability to use certain data for developing our products and may also become an impediment to the adoption of our products for customers regulated by such laws and regulations. Recently we began offering a European Union (“EU”) centric services delivery model, by which customers may elect to receive support from EU‑based ServiceNow teams, with an EU, cloud‑hosted digital workflow solution. This offering required a significant investment in financial and human resources, and we may see similar requests for local solutions in other territories. In addition, actual or perceived non-compliance could result in proceedings or investigations against us by regulatory authorities or others, lead to significant fines, damages, orders or reputational harm and may otherwise adversely impact our business, financial condition
and operating results.
Changes in our developed or acquired products and how such products utilize data could also alter or increase our compliance requirements. As a result, our innovation and business drivers in developing or acquiring new and emerging technologies and the demand for our products could be impacted.
Doing business with the public sector, including U.S. governments and agencies, heavily-regulated organizations and governments globally, subjects us to risks related to government procurement processes, regulations, and contracting requirements.
We provide products and services to the U.S. federal, state and local governments and heavily-regulated organizations directly and through our partners. We have made, and may continue to make, significant investments to support future sales opportunities in various government sectors. This includes obtaining and maintaining additional cloud security authorizations in the US for the ServiceNow Government Community Cloud, such as the U.S. Federal Risk and Authorization Management Program (“FedRAMP”) High Provisional Authority to Operate (“P-ATO”) from the Joint Authorization Board, and the U.S. Department of Defense Security Requirements Guide Impact Level 4 P-ATO for cloud computing by the Defense Information Systems Agency. We have also made significant investments to obtain security authorizations and certifications outside the US. However, government certification requirements may change, or we may be unable to achieve or sustain one or more government certification or authorization, including those mentioned above. As a result, if such requirements change, our ability to sell into the government sector could be restricted until we meet any revised requirements.
A substantial majority of our sales to date to government entities in the US have been made indirectly through our distributors, resellers or service provider partners. Doing business with government entities presents a variety of risks. The procurement process for governments and their agencies is highly competitive, time-consuming and may be subject to political influence and may involve different rules and conditions on the offering or pricing of products and services. We incur significant up-front time and expense, which subjects us to additional compliance risks and costs, without any assurance that we (or a third-party distributor, reseller or service provider) will win a contract. Beyond this, demand for our products and services may be adversely impacted by public sector budgetary cycles and funding availability that in any given fiscal cycle may be reduced or delayed, including in connection with an extended federal government shutdown or changes to government policy. Further, if we or our partners are successful in receiving a contract award, that award could be challenged during a bid protest process. Bid protests may result in an increase in expenses related to obtaining contract awards or an unfavorable modification or loss of an award. Even if a bid protest were unsuccessful, the delay in the startup and funding of the work under these contracts may cause our actual results to differ materially and adversely from those anticipated.
Our customers also include non-U.S. governments, to which government procurement risks similar to those present in U.S. government contracting and regulatory compliance also apply, particularly in certain emerging markets where our customer base is less established. We have seen challenges to successful awards through bid protest procedures in jurisdictions outside the US. As our non-US government business grows, we may see an increase in bid protests as part of the standard government procurement legal procedures that exist in many jurisdictions. In addition, compliance with complex regulations and contracting provisions in a variety of jurisdictions can be expensive and consume significant management resources. In certain jurisdictions, our ability to win business may be constrained by political and other factors unrelated to our competitive position in the market. Each of these difficulties could materially adversely affect our business and results of operations.
In addition, public sector customers may have contractual, statutory or regulatory rights to terminate current contracts with us or our third-party distributors or resellers for convenience or due to a default, though such risk may be assumed by such third-party distributor or reseller. If a contract is terminated for convenience, we may only be able to collect fees for products or services delivered prior to termination and settlement expenses. If a contract is terminated due to a default, we may be liable for excess costs incurred by the customer for procuring alternative products or services or be precluded from doing further business with government entities. Further, we are required to comply with a variety of complex laws, regulations, and contractual provisions relating to the formation, administration, or performance of government contracts that give public sector customers substantial rights and remedies, many of which are not typically found in commercial contracts. These may include rights with respect to price protection, refund and setoff, the accuracy of information provided to the government, contractor compliance with supplier diversity policies, and other obligations that are particular to government contracts. These obligations may apply to us and/or our third-party resellers or distributors whose practices we may not control. Such parties’ non-compliance could impose repercussions with respect to contractual and customer satisfaction issues.
In addition, governments routinely investigate and audit contractors for compliance with these requirements. If, from an audit, it is determined that we have failed to comply with these requirements, we may be subject to civil and criminal penalties and administrative sanctions, including termination of contracts, forfeiture of profits, cost associated with the triggering of price
reduction clauses, fines, and suspensions or debarment from future government business, all of which may cause us to suffer reputational harm.
Further, we are increasingly doing business in heavily regulated industries, such as the financial services, telecommunication media and television and health care industries. Current and prospective customers in such industries may be required to comply with more stringent regulations in connection with subscribing to and implementing our services or particular regulations regarding third-party vendors that may be interpreted differently by different customers. In addition, regulatory agencies may impose requirements toward third-party vendors that we may not be able to, or may not choose to, meet. In addition, customers in these heavily-regulated industries often have a right to conduct audits of our systems, products and practices. If one or more customer determines that some aspect of our business does not meet regulatory requirements, we may be limited in our ability to continue or expand our business.
If we fail to comply with applicable anti-corruption and anti-bribery laws, export control or global trade laws, we could be subject to penalties and civil and/or criminal sanctions and our business could be materially adversely affected.
As we continue to expand our business internationally, we will inevitably do more business with large enterprises and the public sector in countries that are perceived to have heightened levels of public sector corruption. Increased business in countries perceived to have heightened levels of corruption could subject us and our officers and directors to increased scrutiny and increased liability from our business operations. We have implemented and continue to update our compliance program but there is a risk that our employees, partners and agents, as well as those companies to which we outsource certain of our business operations, could take actions in violation of our policies and applicable law, for which we may be ultimately held responsible. In addition, we are subject to global trade laws that apply to our worldwide operations, including restrictions on conducting business in certain restricted countries or with certain entities or individuals. Any violation of the U.S. Foreign Corrupt Practices Act of 1977, as amended (the “FCPA”), the UK Bribery Act, other applicable anti-corruption and anti-bribery laws, export control or global trade laws by our employees or third-party intermediaries could result in regulatory investigations and whistleblower complaints, which could subject us to significant risks such as adverse media coverage and/or severe criminal or civil sanctions, which could materially adversely affect our reputation, business, operating results, and prospects.
We participate in intensely competitive markets, and if we do not compete effectively, our business and operating results will be harmed.
The markets for our enterprise cloud solutions are rapidly evolving and highly competitive, with relatively low barriers to entry. As the market for digital workflow products and offerings matures and new technologies, in-house solutions and competitors enter the market, we find ourselves increasingly competing with solutions and alternative approaches to solving customer needs or experiencing reluctance or unwillingness from customers to migrate away from their current solutions. Further, as our offerings have become more widely adopted and successful in the market, more competitors are developing competing offerings. For example, while the Now Platform was designed to quickly integrate with and offers solutions that are complementary to the offerings of many well-established systems that traditionally operate as “systems of record,” competition in this space has been increasing. Some of the companies operating these “systems of record” offer, or plan to offer, workflow solutions similar to ours. Additionally, sources of alternative solutions and approaches include those provided by:
•enterprise application software vendors, such as Oracle, SAP, Salesforce and Workday;
•new technology vendors and entrants;
•in-house solutions of current and prospective customers; and
•cloud-based vendors.
Some of our existing competitors and potential competitors are larger and have greater name recognition and scale, longer operating histories, more established customer relationships, larger marketing budgets and greater financial, technical and resources than we do. Competitors and new entrants may be able to respond more quickly and effectively to new or changing opportunities, technologies, standards, customer requirements and buying practices. They may introduce new technology, solve similar problems in different ways or more effectively utilize existing technology that reduces demand for our services. They may utilize acquisitions, integrations or consolidations to offer integrated or bundled products, enhanced functionality or other advantages. “Systems of record” operators may attempt to create technology solutions that would prevent our systems from integrating with theirs. Enterprise software application vendors may reduce the price of or offer free-of-charge competing products, services or subscriptions creating pricing pressures, or bundle them with their other offerings causing our offerings to appear relatively more expensive. Smaller competitors, new technology vendors and new entrants may also accelerate pricing pressures in the various markets in which we compete.
Additionally, companies may expand their services to compete with our services, or we may shift our products and services to compete with current and future competitors in adjacent markets. They may invest in industry-specific solutions that claim to provide a unique solution for that industry. We have expanded and expect to continue to expand the breadth of our services to include offerings in new markets and industries, the use of our platform by developers and generally in low-code/no-code capabilities. As a result, we expect increasing competition from companies focused on these other areas. Also, as
customers increasingly adopt a hybrid (on-premise and off-premise) approach for their IT workloads, our cloud services may fail to address evolving customer requirements, which could cause a decline in demand for our services and for us to experience lower growth. Competition from cloud-based vendors may increase as they partner with on-premise hardware providers to deliver their cloud platform as an on-premise solution. Further, the flexibility of future of work models may reduce entry barriers in the markets we operate or usher a new wave of innovation, increasing competition from new entrants and technologies and existing competitors. For these reasons, we may not be able to compete successfully. Competition could result in reduced sales and margins, losses or failure of our products to achieve or maintain market acceptance, any of which could harm our business.
If we fail to innovate in response to rapidly evolving technological and market developments and customer needs, our competitive position and business prospects may be harmed.
We compete in markets that continue to evolve rapidly. The pace of innovation will continue to accelerate as customers increasingly base their purchases on digital technologies and shift to modern cloud-based infrastructure and agile ways of working. As digital transformation accelerates across the enterprise, capabilities such as AI, machine learning, hyper automation, low-code/no-code application development, system observability, database scalability, consumer-grade user experiences, collaboration, Internet-connected devices, security, cryptography, internal software development operations, and application and service awareness become increasingly relevant to customers’ evolving needs. Our customers and prospective customers are either facing competing imperatives to adopt digital technologies, or are built on fully digital, modern, dynamic IT technologies. Accordingly, to compete effectively, we must:
•identify and innovate in the right emerging technologies,
•accurately predict our customers’ changing digital transformation needs, priorities and adoption practices, including their technology infrastructures and buying and budgetary practices,
•invest in and continually optimize our own technology platform so that it continues to meet the very high performance expectations of our customers,
•successfully deliver new, scalable platform and database technologies and products to meet these needs and priorities,
•efficiently integrate with other technologies within our customers’ digital environments,
•expand our offerings into industries and to buyers who are not familiar with our offerings,
•profitably market and sell products to companies in markets where our sales and marketing teams have less experience,
•successfully shift to a subscription-based, services model and sell such services; effectively secure our platform, data and customers’ data, and
•effectively deliver, directly or through our partner ecosystem, the digital transformation process planning, IT systems architecture planning, and product implementation services that our customers require to be successful.
If we fail to meet any of these requirements, our competitive position, strategic relevance and business prospects may be harmed. Further, we may make significant investments in changing the way we offer our products or services, such as starting the shift to a subscription-based model for support services, in response to evolving customer needs. Customers may be dissatisfied with the change in the manner and scope of how the services are delivered and the resulting change in the pricing model and may resist or be slow to adopt changes to our offerings, all of which may adversely impact our ability to compete.
If we are unsuccessful in increasing our penetration of international markets or managing the risks associated with foreign markets, our business and operating results will be adversely affected.
Sales outside of North America represented 36% and 35% of our total revenues for the years ended December 31, 2021 and 2020, respectively. Our business and future prospects depend on increasing our international sales as a percentage of our total revenues outside the US. The failure to grow internationally will harm our business. Additionally, operating in international markets requires significant investment and management attention and subjects us to different regulatory, political and economic risks from those in the US. We have made, and will continue to make, substantial investments in data centers, geographic specific service delivery models, advisory councils, cloud computing infrastructure, sales, marketing, partnership arrangements, personnel and facilities as we enter and expand in new geographic markets. When we make these investments, it is typically unclear whether, and when, sales in the new market will justify our investments. We may significantly underestimate the level of investment and time required to be successful, or whether we will be successful. Our rate of acquisition of new large enterprise customers, a factor affecting our growth, has been generally lower in territories where we are less established and where there may be increased or changing regulations and operational and IP risks, as compared to our more established locations. We have experienced, and may continue to experience, difficulties in some of our investments in geographic expansion, including hiring qualified sales management personnel, penetrating the target market, anticipating and ensuring compliance with regulatory requirements and developments, and managing foreign operations in such locales. Risks inherent with making our products and services available in international markets include without limitation:
•compliance with multiple, conflicting and changing governmental laws and regulations, including employment, tax, competition, requirements to have local partner(s), local entity ownership limitations, technology transfer or sharing requirements, data residency and transfer laws and regulations, privacy and data protection laws and regulations, which may increase operational costs and restrictions;
•compliance by us and our business partners with international bribery and anti-corruption laws, including, but not limited to, the UK Bribery Act and the FCPA;
•the risk that illegal or unethical activities of our local employees or business partners will be attributed to or result in liability to us or damage to our reputation;
•the risk that we will fail to meet the requirements of the rules and regulations relating to government or other public sector contracting;
•longer and potentially more complex sales and accounts receivable payment cycles and other collection difficulties;
•tax treatment of revenues from international sources and changes to tax codes, including being subject to foreign tax laws and being liable for paying withholding, income or other taxes in foreign jurisdictions;
•different pricing and distribution environments;
•foreign currency fluctuations, which may cause transactional and translational remeasurement losses;
•potential changes in international trade policies, tariffs, agreements and practices, including the adoption and expansion of formal or informal trade restrictions or regulatory frameworks favoring local competitors;
•potential threatening state-sponsored actions, including cybersecurity threats directed at local data centers, customers or end-users;
•local governmental direction, business practices and/or cultural norms that may favor local competitors;
•localization of our services, including translation into foreign languages and associated expenses; and
•natural disasters, acts of war, terrorism or pandemics.
If we are unable to manage these risks, if our required investments in these international markets are greater than anticipated, or if we are unsuccessful in increasing sales in emerging markets, our revenue growth rate, business and operating results will be adversely affected.
We rely on our network of partners for an increasing portion of our revenues, and if these partners fail to perform, our ability to sell and distribute our products may be limited, and our operating results and growth rate may be harmed.
An increasing portion of our revenues is generated by sales through our network of partners, including managed service providers and resellers. Increasingly, we and our customers rely on our partners to provide professional services, including customer implementations, and there may not be enough qualified implementation partners available to meet customer demand. While we provide our partners with training and programs, including accreditations and certifications, these programs may not be effective or utilized consistently. In addition, new partners may require extensive training and may require significant time and resources to achieve productivity. Our partners may subject us to lawsuits, potential liability, and reputational harm if, for example, any of our partners misrepresent the functionality of our platform or products to customers, fail to perform services to our customers’ expectations, or violate laws or our corporate policies. In addition, our partners may utilize our platform to develop products and services that could potentially compete with products and services that we offer currently or in the future. Concerns over competitive matters or IP ownership could constrain these partnerships. If we fail to effectively manage and grow our network of partners, or properly monitor the quality and efficacy of their service delivery, our ability to sell our products and efficiently provide our services may be impacted, and our operating results and growth rate may be harmed.
Delays in the release of, or actual or perceived defects in, our products may slow the adoption of our latest technologies, reduce our ability to efficiently provide services, decrease customer satisfaction, and adversely impact future product sales.
We must successfully continue to release new products and updates to existing products. The success of any release depends on a number of factors, including our ability to manage the risks associated with actual or perceived quality or other defects or deficiencies, delays in the timing of releases or the adoption of releases by customers, and other complications that may arise during the early stages of introducing our products. If releases are delayed or if customers perceive that our releases contain bugs or other defects or are difficult to implement, customer adoption of our new products or updates may be adversely impacted, customer satisfaction may decrease, our ability to efficiently provide our services may be reduced, and our growth prospects may be harmed.
As more of our sales efforts are targeted at larger enterprise customers, our sales cycle may become longer and more expensive and we may encounter pricing pressure and implementation and configuration challenges.
As we target more of our sales efforts at larger enterprise customers, we may face heightened costs, longer sales cycles, greater competition and less predictability in completing some of our sales. With such customers, their decision to use our services may be an enterprise-wide decision. Such sales require considerable time for the customer to evaluate and test our platform prior to making a purchasing decision, require us to provide greater levels of education regarding the use and benefits of our services, as well as addressing concerns regarding data security, compliance with privacy and data protection laws and regulations of prospective customers with international operations or whose own customers operate internationally. In addition, larger enterprise customers may demand more configuration, integration services and features. As a result of these factors, these sales opportunities may require us to devote greater sales support and professional services resources to individual customers,
driving up costs and time required to complete sales and diverting our own sales and professional services resources to a smaller number of larger transactions. Large enterprise customers may be switching from legacy on-premises solutions when purchasing our products, and may rely on third parties with whom we do not have relationships when making purchasing decisions. If we fail to effectively manage these risks associated with sales cycles and sales to larger enterprise customers, our business, financial condition, and results of operations may be affected.
As we acquire or invest in companies and technologies, we may not realize the expected business or financial benefits and the acquisitions and investments may divert our management’s attention and result in additional shareholder dilution.
We have acquired or invested in companies and technologies as part of our business strategy and will continue to evaluate and execute potential strategic transactions, including acquisitions of or investments in businesses, technologies, services, products and other assets. We have and will continue to enter relationships with other businesses to expand our service offerings, go-to-market and sales efforts, functionality or our ability to provide services in international locations, which could involve preferred or exclusive licenses, additional channels of distribution, discount pricing or investments in other companies. Although we conduct reasonably extensive due diligence with each of the entities we engage for a strategic transaction, our efforts may not reveal every material concern with respect to the target entity or our assumptions surrounding the resulting combination. These strategic transactions involve numerous risks, including:
•assimilating or integrating the businesses, technologies, products, personnel or operations of the acquired companies;
•failing to achieve the expected benefits of the acquisition or investment;
•potential loss of key employees of the acquired company;
•inability to maintain relationships with customers and partners of the acquired business;
•potential adverse tax consequences;
•disruption to our business and diversion of management attention and other resources;
•potential financial and credit risks associated with acquired customers;
•dependence on acquired technologies or licenses for which alternatives may not be available to us without significant cost or complexity;
•in the case of foreign acquisitions, the challenges associated with integrating operations across different cultures and languages and any currency and regulatory risks associated with specific countries;
•introducing increased complexity and burden to maintain the technology platform or introducing vulnerabilities or threats by integrating acquired technologies;
•increased data security or privacy compliance requirements from integrating the acquired technology or company;
•impairment to our investments if our investees are unable to obtain future funding on favorable terms or at all; and
•potential unknown liabilities associated with the acquired businesses.
In addition, we have and may continue to pay cash and may have to incur debt or issue equity or equity-linked securities to pay for acquisitions, each of which could adversely affect our financial condition or our stock price. Furthermore, if we finance acquisitions by issuing equity, convertible or other debt securities or loans, our existing shareholders may be diluted, or we could face constraints related to the terms of and repayment obligation related to the incurrence of indebtedness that could affect our stock price. The occurrence of any of these risks could harm our business, operating results and financial condition.
Risks Related to the Operation of Our Business
If we or our third-party service providers experience an actual or perceived cyber-security event, our platform may be perceived as not being secure and we may lose customers and incur significant liabilities, any of which would harm our business and operating results.
Our operations involve the storage, transmission and processing of our customers’ confidential, proprietary and sensitive data, which may include personally identifiable information, protected health information, financial information and, in some cases, government information. While we have security measures and a data governance framework in place designed to protect customer information and prevent data loss, these measures may contain legacy code vulnerabilities, have limited implementation or be breached because of employee error or intentional action or third-party actions, including unintentional events or deliberate attacks by cyber criminals or foreign state actors, and result in someone obtaining unauthorized access to our instances and ultimately our customers’ data or our data, IP and other confidential business information. For example, third parties have attempted to fraudulently induce employees, contractors, or users to disclose information or to gain access to our data or our customers’ data, and we have been the target of email scams that attempt to acquire personal information or company assets. Further, we have experienced increased cyberattacks and security challenges as the growing number of employees, vendors and other third parties that remotely access our systems increases our attack surface. We have also seen an increase in cyberattack volume, frequency, and sophistication driven by the global enablement of remote workforces.
Computer malware, ransomware, viruses, hacking, phishing and denial of service attacks by third parties have become
more prevalent in our industry, and they, or attempts, have occurred on our and our third-party service providers’ systems in the past and may occur again on these systems in the future. The frequency and sophistication of these malicious attacks have increased, and it appears that cyber crimes and cyber criminal networks, some of which may be state-supported, have been provided substantial resources and may target U.S. enterprises or our customers and their use of our products. In addition, we have established extensive development and testing environments for our engineers developing new products and features. Security protocols in those environments have necessarily been less rigorous than in environments housing customer data, but a vulnerability or security defect developed in that environment could become incorporated in code imported to our environments housing customer data. Similarly, in the unique circumstances where customer data may be utilized in developer environments for testing or learning, that data may be at greater risk. Because techniques used to sabotage, obtain unauthorized access to systems or prohibit authorized access to systems change frequently and generally may not be detected until successfully launched against a target, we have been and may continue to be unable to anticipate these techniques or to implement adequate preventative measures. This has included and may continue to include underlying infiltration of pre-existing systems, including those of our third-party service providers or customers, perpetrated by more sophisticated or state-supported attackers, including foreign cybersecurity attacks on U.S. technology companies identified in late 2020. It may also include exploitation of vulnerabilities in third party or open source software code that may be incorporated into our own or our customers’ systems, such as the vulnerability in the Java logging library known as “log4j” identified in late 2021 that affected many in our industry. The occurrence of these and other more sophisticated or state-supported attack campaigns may increase as geopolitical tensions and intermittent warfare escalate outside of the US. We devote significant financial and personnel resources to implement and maintain security measures while meeting customer expectations as to the performance of our systems; however, as cyber-security threats develop and grow more complex over time, we will continue to make significant further investments to protect data and infrastructure, but a residual risk may remain despite our preventative efforts. A security breach suffered by us or our third-party service providers, an attack against our service availability or unauthorized access or loss of data could result in a disruption to our service, litigation, service level agreement claims, indemnification and other contractual obligations, regulatory investigations, government fines and penalties, reputational damage, loss of sales and customers, mitigation and remediation expenses and other significant costs and liabilities. In addition, we may incur significant costs and operational consequences of paying to access data, investigating, remediating, complying with notice obligations and implementing additional measures designed to prevent actual or perceived security incidents. We also cannot be certain that our existing insurance coverage will continue to be available on acceptable terms or in sufficient amounts to cover the potentially significant losses that may result from a security incident or breach or the insurer will not deny coverage as to any future claim.
Further, in most instances, our customers administer access to the data held in their particular instance for their employees and service providers. While we offer tools and support, customers are not required to utilize them and may suffer a cyber-security event on their own systems, unrelated to our own, and allow a malicious actor to obtain access to the customer’s information held on our platform. Even if such a breach is unrelated to our security programs or practices, such breach could result in our incurring significant economic and operational costs in investigating, remediating, and implementing additional measures to further protect our customers from their own vulnerabilities, and could result in reputational harm to us.
Digital supply chain attacks have increased in frequency and severity. We cannot guarantee that third parties and our supply chain infrastructure have not been compromised or that they do not contain exploitable defects or bugs that could result in a breach of or disruption to our platform, systems and network or the systems and networks of third parties that support us and our business. Third parties may also exploit vulnerabilities in, or obtain unauthorized access to, platforms, systems, networks, or physical facilities utilized by us or our third-party vendors or service providers.
If we lose key members of our management team or employees or are unable to attract and retain the employees we need, our compensation costs will increase and our business and operating results will be adversely affected.
Competition for talent in the technology industry has become increasingly intense, particularly in the last several months. In 2021, there has been a dramatic increase in workers leaving their positions throughout our industry that is being referred to as the “great resignation,” and the market to build, retain and replace talent has become even more highly competitive. Our success depends substantially upon the continued services of our management team, particularly our chief executive officer, our chief product and engineering officer, and the other members of our executive staff. In response to this highly competitive environment, we recently made significant performance-based equity awards to our executive staff outside of our regular compensation program, but we cannot guarantee that this will be sufficient to retain all of these individuals. From time to time in the ordinary course of business, there may be changes in our management team resulting from the hiring or departure of executives. While we seek to manage these transitions carefully, including by establishing strong processes and procedures and succession planning, such changes may result in a loss of institutional knowledge, cause disruptions to our business and negatively affect our business.
The technology industry is subject to substantial and continuous competition for diverse, talented product and engineering, sales and operations employees. Many key individual contributors, particularly in research and development, engineering and sales, are critical to our success and can command very significant compensation in the market. We have faced and may continue to face difficulties attracting, hiring and retaining highly-skilled personnel and with appropriate qualifications and may not be able to fill positions in desired geographic areas or at all. In particular, competition for experienced software
and cloud computing infrastructure engineers in our primary operating locations (San Francisco Bay area, San Diego, Seattle, Hyderabad, Dublin, London, and Amsterdam) is intense. Such difficulties may be exacerbated by employees’ reactions to our policies related to COVID-19 vaccination or flexibility to remote working. As a result, we have also experienced and may continue to experience increased compensation and training costs that may not be offset by either improved productivity or higher sales, potentially resulting in a reduction in our profitability. Many of our employees, including all of our executive officers, are employed “at-will” and may terminate their employment with us at any time. If we fail to attract new personnel or fail to retain and motivate our current personnel, our business and future growth prospects could be adversely affected.
In addition, we believe our corporate culture of fostering innovation, teamwork and employee satisfaction has been a key contributor to our success to date. However, in this period of the "great resignation," we have and may continue to face higher employee turnover rates. As we continue to grow and expand globally and navigate shifting workforce priorities, including a new hybrid work model in which many of our employees continue to work remote for part of the week and fully remote workers continue to increase, we may find it difficult to maintain important aspects of our corporate culture, which could negatively affect our ability to retain and recruit personnel who are essential to our future success and could ultimately have a negative impact on our ability to innovate our technology and our business. Further, as of December 31, 2021, approximately 31% of our employees have been employed by us for a year or less and we must be able to effectively integrate, develop and motivate a large number of new employees, while maintaining the effectiveness of our business execution and the beneficial aspects of our corporate culture. Such challenges may be exacerbated by the new hybrid work model.
Disruptions or defects in our services could damage our customers’ businesses, subject us to substantial liability and harm our reputation and financial results.
Our business depends on our platform to be available without disruption. From time to time, we experience defects, disruptions, outages and other performance and quality problems with our platform, and new defects may be detected in the future and may arise from our increasing use of the public cloud. For example, we provide regular updates to our services, which can contain undetected defects when first released. Defects may also be introduced by our use of third-party software, including open-source software. Disruptions may result from errors we make in developing, delivering, configuring or hosting our services, or designing, installing, expanding or maintaining our cloud infrastructure. Disruptions in service can also result from incidents that are outside of our control, including denial of service or ransomware attacks. We currently serve our customers primarily using equipment managed by us and co-located in third-party data centers operated by several different providers located around the world, and serve certain of our customers that are primarily in highly regulated markets, using data center facilities operated by public cloud service providers. These data centers are vulnerable to damage or interruption from earthquakes, hurricanes, floods, fires, power loss and similar events. They may also be subject to break-ins, sabotage, intentional acts of vandalism and similar misconduct, equipment failure and adverse events caused by operator error or negligence. Despite precautions taken at these centers, problems at these centers have occurred, resulting in interruptions in our services. Such problems could occur again and result in similar or lengthier service interruptions and the loss of customer data. In addition, our customers may use our services in ways that cause disruptions in service for other customers. In addition to data center providers, we also have a large ecosystem of service providers that we use in our delivery of our products. If there is a compromise to data or other incident with our critical service providers, it may impact our ability to provide our services. Our customers use our services to manage important aspects of their businesses, and our reputation and business will be adversely affected if our customers and potential customers believe our services are unreliable. Disruptions or defects in our services may reduce our revenues, cause us to issue credits or pay penalties, subject us to claims and litigation, cause our customers to delay payment or terminate or fail to renew their subscriptions, and adversely affect our ability to attract new customers. Similarly, customers may have unique requirements for system resiliency and performance depending on their business models and customers in highly regulated markets may have more demanding requirements that we may not be able to, or may not choose to, meet. The occurrence of payment delays, service credit, warranty or termination for material breach or other claims against us could result in an increase in our bad debt expense, an increase in collection cycles, an increase to our service level credit accruals, other increased expenses or risks of litigation. We may not have insurance sufficient to compensate us for potentially significant losses that may result from claims arising from disruptions to our services.
Lawsuits against us by third parties that allege we infringe their intellectual property rights could harm our business and operating results.
There is considerable patent and other IP development activity and claims and related litigation regarding patent and IP rights in our industry. Our competitors, other third parties and non-practicing entities, own large numbers of patents, copyrights, trademarks and trade secrets, which they may use to assert claims of infringement, misappropriation or other violations of IP rights against us. Moreover, the patent portfolios of many of our competitors are larger than ours. This disparity may increase the risk that our competitors may sue us for patent infringement and may limit our ability to counterclaim for patent infringement or settle through patent cross-licenses. We have recorded material charges for legal settlements of such claims in the past. In any IP litigation, regardless of the scope or merit, we may incur substantial costs and attorney’s fees and, if the claims are successfully asserted against us and we are found to be infringing upon, misappropriating or otherwise violating the IP rights of others, we could be required to: pay substantial damages and/or make substantial ongoing royalty payments; cease
offering or modify our products and services; comply with other unfavorable terms, including settlement terms; and indemnify our customers and business partners, obtain costly licenses on their behalf, and/or refund fees or other payments previously paid to us. Further, upon expiration of the term of any agreements that allow us to use third-party IP, we may be unable to renew such agreements on favorable terms, if at all, in which case we may face IP litigation. The mere existence of any lawsuit, or any interim or final outcomes, and the public statements related to it (or absence of such statements) by the press, analysts and litigants could be unsettling to our customers and prospective customers. This could cause an adverse impact to our customer satisfaction and related renewal rates, cause us to lose potential sales, and could also be unsettling to investors or prospective investors and cause a substantial decline in our stock price. Any claim or litigation against us could be costly, time-consuming and divert the attention of management and key personnel from our business operations and harm our financial condition and operating results.
Our intellectual property protections may not provide us with a competitive advantage, and defending our intellectual property may result in substantial expenses that harm our operating results.
Our success depends to a significant degree on our ability to protect our proprietary technology and our brand under patent, copyright, trademark, trade secret and other IP protections in the US and other jurisdictions. Though we seek patent protection for our technology, we may not be successful in obtaining patent protection, and any patents acquired in the future may not provide competitive advantages or other value. In addition, any patents that have been or may be issued or acquired may be contested, circumvented, found unenforceable or invalidated, and we may not be able to prevent third parties from infringing upon them. Further, legal standards relating to the validity, enforceability and scope of protection of IP rights vary.
Despite our efforts to protect our proprietary rights, unauthorized parties may attempt to copy or obtain and use our technology to develop products and services that provide features and functionality similar to ours. Policing unauthorized use of our technology is difficult. Our competitors could also independently develop services equivalent to ours, and our IP rights may not be broad enough for us to prevent competitors from utilizing their developments to compete with us. Reverse engineering, unauthorized copying or other misappropriation of our proprietary technology could enable third parties to benefit from our technology without paying us for it, which would significantly harm our business.
Our IP rights may be challenged by others or invalidated through administrative processes or litigation. Effective patent, trademark, copyright and trade secret protection may not be available in every country in which we offer services. The laws of some foreign countries may not offer effective protection for or be as protective of IP rights as those in the US, and mechanisms for enforcement of IP rights or available remedies may be inadequate, ineffective or scarce. We may be required to spend significant resources to monitor and protect our IP rights. We have initiated and, in the future, may initiate claims or litigation against third parties for infringement or misappropriation of our proprietary rights or to establish the validity of our proprietary rights. Any litigation, whether or not resolved in our favor, could result in significant expense to us, divert the efforts of our technical and management personnel and may result in counter-claims with respect to infringement or misappropriation of IP rights by us. If we are unable to prevent third parties from infringing upon or misappropriating our IP rights or are required to incur substantial expenses defending our IP rights, our business and operating results may be adversely affected.
Our use of open source software could harm our ability to sell our products and services and subject us to possible litigation.
Our products incorporate software licensed to us by third-party authors under open source licenses, and we expect to continue to incorporate open source software into our products and services in the future. We monitor our use of open source software in an effort to avoid subjecting our products and services to adverse licensing conditions. However, there can be no assurance that our efforts have been or will be successful. There is little or no legal precedent governing the interpretation of the terms of open source licenses, and therefore the potential impact of these terms on our business is uncertain and enforcement of these terms may result in unanticipated obligations regarding our products and services. For example, depending on which open source license governs certain open source software included within our products and services, we may be subjected to conditions requiring us to offer our products and services to users at no cost; make available the source code for modifications and derivative works based upon, incorporating or using such open source software; and license such modifications or derivative works under the terms of the particular open source license. Moreover, if an author or other third party that distributes such open source software were to allege that we had not complied with the conditions of one or more of these licenses, we could be required to incur significant legal costs defending ourselves against such allegations, be subject to significant damages or be enjoined from distributing our products and services.
Various factors, including our customers’ business, integration, migration, compliance and security requirements, or errors by us, our partners, or our customers, may cause implementations of our products to be delayed, inefficient or otherwise unsuccessful.
Our business depends upon the successful implementation of our products by our customers either through us or our partners. Further, our customers’ business, integration, migration, compliance and security requirements, or errors by us, our partners, or our customers, or other factors may cause implementations to be delayed, inefficient or otherwise unsuccessful. For example, changes in the functional requirements of our customers, delays in timeline, or deviations from recommended best practices may occur during the course of implementation. As a result of these and other risks, we or our customers may incur significant implementation costs in connection with the purchase, implementation and enablement of our products. Some customer implementations may take longer than planned or fail to meet our customers’ expectations, which may delay our ability to sell additional products or result in customers canceling or failing to renew their subscriptions before our products have been fully implemented. Some customers may lack the internal resources to manage a digital transformation such as our offering and, as a consequence, may be unable to see the benefits of our products. Unsuccessful, lengthy, or costly implementations and integrations could result in claims from customers, reputational harm, and opportunities for competitors to displace our products, each of which could have an adverse effect on our business and operating results.
Risks Related to the Financial Performance or Financial Position of Our Business
Our operating results may vary significantly from period to period, and if we fail to meet the financial performance expectations of investors or securities analysts, the price of our common stock could decline substantially.
Our operating results may vary significantly from period to period as a result of various factors, some of which are beyond our control. For any period, there is a risk that our financial performance will not meet the financial guidance we have previously given for that period, or we may otherwise fail to meet the financial performance expectations of the securities analysts who issue reports on our company and our common stock price or our investors. There is also a risk that we may issue forward-looking financial guidance for a period that fails to meet the expectations of such securities analysts or investors. If any of the foregoing occurs, for any reason, either within or outside of our control, the price of our common stock could decline substantially and investors in our common stock could incur substantial losses. Some of the important factors that may cause our financial performance to vary widely, or cause our forward-looking financial guidance to fall below the expectations of such securities analysts or investors, include:
•our ability to attract new customers, retain and increase sales to existing customers, and satisfy customers’ requirements;
•changes in our mix of products and services, including cloud and self-hosted offerings or customers use of our products;
•our ability to increase sales and market penetration of our products or services;
•volatility in foreign currency exchange rates and our ability to effectively hedge our foreign currency exposure;
•the rate of expansion, retention and productivity of our sales and engineering organizations;
•the number of new employees added;
•the cost, timing and management effort for our development of new products and services;
•general economic conditions that may adversely affect our customers’ or prospective customers’ purchasing decisions;
•the amount and timing of operating costs and capital expenditures related to business operation and expansion;
•seasonality of when we enter into customer agreements;
•the length and complexity of the sales cycle and certification process for our services, especially for larger deals and sales to larger enterprises, government and regulated organizations;
•changes in the size and complexity of our customer relationships;
•changes to our management, sales and account management teams as we scale and evolve business priorities;
•changes in our or our competitors’ pricing policies or models;
•significant security breaches, technical difficulties or interruptions of our services;
•new solutions or products introduced by our competitors;
•changes in effective tax rates;
•changes in the average contract term of our customer agreements, timing of renewals, renewal rates, expansion within our existing customers and billings duration;
•the timing of customer payments and payment defaults by customers;
•extraordinary expenses such as litigation costs or damages, including settlement payments;
•the costs associated with acquiring new businesses and technologies and the follow-on costs of integration, including the tax effects of acquisitions;
•changes in laws or regulations impacting the delivery of our services;
•our ability to comply with privacy laws and regulations;
•significant litigation or regulatory actions relating to claims of IP infringement, violation of privacy laws, employment matters or any other significant matter;
•the amount and timing of equity awards and the related financial statement expenses;
•the impact of new accounting pronouncements; and
•our ability to accurately estimate the total addressable market for our products and services.
Because we generally recognize revenues from our subscription service over the subscription term, a decrease in new subscriptions or renewals during a reporting period may not be immediately reflected in our operating results for that period.
We generally recognize revenues from customers ratably over the terms of their subscriptions. Net new annual contract value from new subscriptions and expansion contracts entered into during a period can generally be expected to generate revenues for the duration of the subscription term. As a result, a significant portion of the revenues we report in each period are derived from the recognition of deferred revenues relating to subscriptions entered into during previous periods. Consequently, a decrease in new or renewed subscriptions in any single reporting period will have a limited impact on our revenues for that period. Also, our ability to adjust our cost structure in the event of a decrease in new or renewed subscriptions may be limited.
Further, a decline in new subscriptions, expansion contracts or renewals in a given period may not be fully reflected in our revenues for that period, but they will negatively affect our revenues in future periods. Accordingly, the effect of significant downturns in sales and market acceptance of our services, and changes in our rate of renewals, may not be fully reflected in our results of operations until future periods. Our subscription model also makes it difficult for us to rapidly increase our revenues through additional sales in any period, as revenues from new customers are generally recognized over the applicable subscription term. Additionally, due to the complexity of certain customer contracts, the actual revenue recognition treatment required under Accounting Standard Codification Topic 606, “Revenue from Contracts with Customers (“Topic 606”)” depends on contract-specific terms and may result in greater variability in revenues from period to period.
A decrease in new subscriptions, expansion contracts or renewals in a reporting period may not immediately impact billings for that period because the decrease may be offset by an increase in billings duration, the dollar value of contracts with future start dates, or the dollar value of collections in the current period related to contracts with future start dates.
As our business grows, we expect our revenue growth rate to continue to decline.
We have experienced significant revenue growth in prior periods; however, our longer-term revenue growth rate is declining, and we expect that it will continue to decline into the foreseeable future due to a number of reasons, which may include maturation of our business, increasing competition, or decrease in the growth of our overall market. We also expect our costs to increase in future periods as we continue to invest in our strategic priorities, which may not result in increased revenues or growth in our business. You should not rely on our revenue from any prior period as an indication of our future revenue growth. If we are unable to maintain consistent revenue or revenue growth, our stock price could be volatile.
Changes in our effective tax rate or disallowance of our tax positions may adversely affect our financial position and results.
We are subject to income taxes in the US and various foreign jurisdictions. We believe that our provision for income taxes is reasonable, but the ultimate tax outcome may differ from the amounts recorded in our consolidated financial statements and may materially affect our financial results in the period or periods in which such outcome is determined. Our effective tax rate could be adversely affected by changes in the mix of earnings and losses in countries with differing statutory tax rates, certain non-deductible expenses, the valuation of deferred tax assets and liabilities and the effects of acquisitions. Increases in our effective tax rate would reduce our profitability or in some cases increase our losses.
Additionally, our future effective tax rate could be impacted by changes in accounting principles or changes in federal, state or international tax laws or tax rulings. The Biden Administration has proposed increases to the U.S. corporate income tax rate, minimum tax on book income, and increased taxation of international business operations. The U.S. Department of Treasury has broad authority to issue regulations and interpretative guidance that may significantly impact how we will apply the law, which could affect our results of operations in the period issued. Many countries and organizations such as the Organization for Economic Cooperation and Development are actively considering changes to existing tax laws or have proposed or enacted new laws that could increase our tax obligations in countries where we do business or cause us to change the way we operate our business. Recent global tax developments applicable to multinational businesses and increased scrutiny under tax examinations could have a material impact on our business and negatively affect our financial results. Any changes in federal, state or international tax laws or tax rulings may increase our worldwide effective tax rate and harm our financial position and results of operations.
In addition, we may be subject to income tax audits by tax jurisdictions throughout the world, many of which have not established clear guidance on the tax treatment of cloud computing companies. Although we believe our income tax liabilities are reasonably estimated and accounted for in accordance with applicable laws and principles, an adverse resolution of one or
more uncertain tax positions in any period could have a material impact on our results of operations for that period. Further, many of our most important intangible assets are held outside the US and are subject to inter-company agreements regarding the development and distribution of those assets to other jurisdictions with potential challenge under permanent establishment or transfer pricing principles. While we believe that our position is appropriate and well founded, if our position was to be successfully challenged by taxing authorities in other jurisdictions, we may become subject to significant tax liabilities, which could harm our financial position and financial results.
If we are unable to maintain effective internal control over financial reporting, the accuracy and timeliness of our financial reporting may be adversely affected.
Section 404 of the Sarbanes-Oxley Act requires us to assess and report on the effectiveness of our internal control over financial reporting annually and at a reasonable assurance level of our disclosure controls and procedures quarterly, which must be attested to by our independent registered public accounting firm annually. Our independent registered public accounting firm may issue a report that is adverse if it is not satisfied with the level at which our controls are documented, designed or operating. Moreover, our testing, or the subsequent testing by our independent registered public accounting firm, may reveal material weaknesses or significant deficiencies. If material weaknesses are identified or we are not able to comply with the requirements of Section 404 in a timely manner, our reported financial results could be materially misstated or could subsequently require restatement, we could receive an adverse opinion regarding our internal control over financial reporting from our independent registered public accounting firm, we could be subject to investigations or sanctions by regulatory authorities and we could incur substantial expenses. We may not be able to effectively implement system and process changes required for new standards on a timely basis. Any delays or failure to update our systems and processes could also lead to a material weakness or significant deficiency.
Risks Related to General Economic Conditions
The extent to which the ongoing COVID-19 pandemic will continue to impact our business and future results of operations and financial condition will depend on future developments, which are highly uncertain and difficult to predict.
The COVID-19 pandemic has had, and continues to have, a significant impact around the world and it is difficult to assess or predict its continued impact on the global economic market, which will be highly dependent upon the continuing actions of governments, businesses and other organizations in response to the pandemic and the effectiveness of those actions. The status of global economic recovery remains uncertain and unpredictable, and will be impacted by developments in the pandemic including any subsequent waves of outbreak or new variant strains of the COVID-19 virus, which may require re-closures or other preventative measures. If the pandemic were to endure for the longer term, recession, depression or other sustained adverse market events may result.
Early in the COVID-19 pandemic, some customers or potential customers reduced their digital transformation spend or delayed their digital transformation initiatives. We also experienced some curtailed customer demand, reduced contract duration, changes in collection cycles, lengthened payment terms, and impact on our ability to land new customers. If we should see customers reduce or delay their digital transformation spend in response to the pandemic conditions or see increased competitive pressures due to changes in terms and conditions and pricing of our competitors’ products and services, our business, results of operations and overall financial performance in future periods could be materially and adversely impacted.
In the first quarter of 2020, we temporarily closed most of our offices (including our headquarters) around the world. Starting late 2021, many employees began to return to our offices for at least part of the week. Our return to work approach may vary among geographies depending on appropriate health protocols, and may change at any time. Certain employees who do not agree with our approach to health protocols may seek employment elsewhere. Additionally, our efforts to re-open our offices could expose our employees to health risks and could involve additional costs or liability. The COVID-19 pandemic will have a long-term effect on the nature of our office environment, remote working and how we innovate and operate. While we believe that this will be a positive development over the longer term, there may be operational and workplace culture challenges that may adversely affect our business, including talent retention, in the shorter term.
If the COVID-19 pandemic continues or worsens, especially in regions in which we have material operations or sales, our business activities from impacted areas, including sales-related activities, could be adversely affected. Disruptive activities could include continued business closures in impacted areas, further or continued restrictions on our employees’ and other service providers’ ability to travel, impacts to productivity if our employees or their family members experience health issues, and potential delays in hiring and onboarding mainly in our general and administrative functions. The COVID-19 pandemic could also impact our data center operations, including potential disruptions to the supply chain of hardware needed to maintain these third-party systems, and primary vendors we rely on for products and services that allow our employees to work remotely.
The extent and continued impact of the COVID-19 pandemic on our business will depend on certain developments including the duration and spread of the outbreak and new variant strains of the virus; the availability and distribution of effective vaccines; the severity of the economic decline attributable to the pandemic and timing, nature and sustainability of economic recovery; and government responses, including vaccination or testing mandates, all of which are highly uncertain and unpredictable. While our revenues and earnings are relatively predictable as a result of our subscription-based business model, the effect of the COVID-19 pandemic may not be fully reflected in our results of operations and overall financial performance until future periods and could cause our future results of operations to vary significantly from period to period.
The effects of the COVID-19 pandemic also may heighten other risks, including significant volatility in the global markets, trading prices of our common stock, interest rate and foreign currency described in this “Risk Factors” section. Risks caused or heightened by the COVID-19 pandemic may continue for the duration of and possibly beyond the COVID-19 pandemic for an indefinite period.
Natural disasters, including climate change, and other events beyond our control could harm our business.
Natural disasters or other catastrophic events may cause damage or disruption to our operations, international commerce and the global economy, and thus could have a negative effect on us. Our business operations are subject to interruption by natural disasters, flooding, fire, power shortages, pandemics such as COVID-19, terrorism, political unrest, telecommunications failure, vandalism, cyber-attacks, geopolitical instability, war, the effects of climate change and other events beyond our control. Although we maintain crisis management and disaster response plans, such events could make it difficult or impossible for us to deliver our services to our customers, could decrease demand for our services, and could cause us to incur substantial expense. Our insurance may not be sufficient to cover losses or additional expense that we may sustain. The majority of our research and development activities, offices, IT systems, and other critical business operations are located near major seismic faults in California and Washington. Customer data could be lost, significant recovery time could be required to resume operations and our financial condition and operating results could be adversely affected in the event of a major natural disaster or catastrophic event.
In addition, the impacts of climate change on the global economy and our industry are rapidly evolving. We may be subject to increased regulations, reporting requirements, standards or expectations regarding the environmental impacts of our business. While we seek to mitigate our business risks associated with climate change by establishing robust environmental programs and partnering with organizations who are focused on mitigating their own climate-related risks, there are inherent climate-related risks wherever business is conducted. Any of our primary locations may be vulnerable to the adverse effects of climate change. For example, our California headquarters have experienced and may continue to experience, climate-related events and at an increasing frequency, including drought, water scarcity, heat waves, wildfires and resultant air quality impacts and power shutoffs associated with the wildfires. Additionally, while more employees have returned to our offices under our new hybrid return-to-work model, it will remain difficult to mitigate the impact of these events on all our employees as remote work is part of such model. Changing market dynamics, global policy developments and increasing frequency and impact of extreme weather events on critical infrastructure in the US and elsewhere have the potential to disrupt our business, the business of our customers or third-party suppliers, and may cause us to experience higher attrition, losses and additional costs to maintain or resume operations.
Global economic conditions may harm our industry, business and results of operations.
We operate globally and as a result our business, revenues and profitability are impacted by global macroeconomic conditions. The success of our activities is affected by general economic and market conditions, including, among others, inflation rate fluctuations, interest rates, tax rates, economic uncertainty, political instability, changes in laws, and trade barriers and sanctions. In 2020, the U.S. capital markets experienced and continue to experience extreme volatility and disruption following the global outbreak of COVID-19. Recently, inflation rates in the US have increased to levels not seen in several years. Such economic volatility could adversely affect our business, financial condition, results of operations and cash flows, and future market disruptions could negatively impact us. These unfavorable economic conditions could increase our operating costs and, because our typical contracts with customers lock in our price for a few years, our profitability could be negatively affected. Geopolitical destabilization could impact global currency exchange rates, commodity prices, trade and movement of resources, which may adversely affect the buying power of our customers, our access to and cost of resources from our suppliers, and ability to grow our business. In addition, from time to time, the US and other key international economies have been impacted by geopolitical and economic instability, high levels of credit defaults, international trade disputes, changes in demand for various goods and services, high levels of persistent unemployment, wage and income stagnation, restricted credit, poor liquidity, reduced corporate profitability, volatility in credit, equity and foreign exchange markets, inflation, bankruptcies, international trade agreements, trade restrictions and overall economic uncertainty. These conditions can arise suddenly and affect the rate of IT spending and could adversely affect our customers’ or prospective customers’ ability or willingness to purchase our services, delay purchasing decisions, reduce the value or duration of their subscriptions, or affect renewal rates, all of which could harm our operating results.
Foreign currency exchange rate fluctuations could harm our financial results.
We conduct significant transactions, including revenue transactions and intercompany transactions, in currencies other than the U.S. Dollar or the functional operating currency of the transactional entities. In addition, our international subsidiaries maintain significant net assets that are denominated in the functional operating currencies of these entities. Accordingly, changes in the value of currencies relative to the U.S. Dollar may impact our consolidated revenues and operating results due to transactional and translational remeasurement that is reflected in our earnings. It is particularly difficult to forecast any impact from exchange rate movements, so there is risk that unanticipated currency fluctuations could adversely affect our financial results or cause our results to differ from investor expectations or our own guidance in any future periods. Volatility in exchange rates and global financial markets is expected to continue due to political and economic uncertainty globally.
We use derivative instruments, such as foreign currency forwards, to hedge certain exposures to fluctuations in certain foreign currency exchange rates. These hedging contracts may reduce, but cannot entirely eliminate, the impact of adverse currency exchange rate movements. Further, unanticipated changes in currency exchange rates may result in poorer overall financial performance than if we had not engaged in any such hedging transactions. Moreover, for a number of reasons, we may not be able to establish a perfect correlation between such hedging instruments and the exposures being hedged. Any such imperfect correlation may prevent us from achieving the intended hedge, and could expose us to a greater overall risk of loss than if we had not hedged.
Risks Related to Our 2030 Notes and 2022 Notes
Our debt service obligations may adversely affect our financial condition and cash flows from operations.
As of December 31, 2021, we have $1.5 billion aggregate principal amount of the 2030 Notes payable outstanding due on September 1, 2030, as described in Note 11 in the notes to our consolidated financial statements included elsewhere in this Annual Report on Form 10-K. Our ability to make payments on, repay or refinance the 2030 Notes in the future will depend on our future performance which is subject to a variety of risks and uncertainties, many of which are beyond our control. If we decide to refinance the 2030 Notes, we may be required to do so on different or less favorable terms or we may be unable to refinance the 2030 Notes at all, both of which may adversely affect our financial condition. Maintenance of our indebtedness, contractual restrictions, and additional issuances of indebtedness could:
•cause us to dedicate a substantial portion of our cash flows from operations towards debt service obligations and principal repayments;
•increase our vulnerability to adverse changes in general economic, industry and competitive conditions;
•limit our flexibility in planning for, or reacting to, changes in our business and our industry;
•impair our ability to obtain future financing for working capital, capital expenditures, acquisitions, general corporate or other purposes; and
•due to limitations within the debt instruments, restrict our ability to grant liens on property, enter into certain mergers, dispose of all or substantially all of our or our subsidiaries’ assets, taken as a whole, materially change our business or incur subsidiary indebtedness, subject to customary exceptions.
We are required to comply with the covenants set forth in the indentures governing the 2030 Notes. Our ability to comply with these covenants may be affected by events beyond our control. If we breach any of the covenants and do not obtain a waiver from the note holders or lenders, then, subject to applicable cure periods, any outstanding indebtedness may be declared immediately due and payable. In addition, changes by any rating agency to our credit rating may negatively impact the value and liquidity of our securities. Downgrades in our credit ratings could restrict our ability to obtain additional financing in the future and could affect the terms of any such financing.
The conditional conversion feature of the 2022 Notes may adversely affect our financial condition and operating results.
Prior to the close of business on the business day immediately preceding February 1, 2022, the holders of the 2022 Notes had the option to convert their notes during any calendar quarter if the last reported sale price of our common stock for at least 20 trading days during the period of 30 consecutive trading days ending on the last trading day of the immediately preceding calendar quarter is greater than or equal to $175.18. We have settled conversion requests and will settle additional conversion requests prior to the maturity of the 2022 Notes. We will settle all remaining conversion and maturity settlement obligations in cash, which could materially adversely affect our liquidity, financial position, results of operations and cash flows.
The convertible note hedge and warrant transactions may affect the value of the 2022 Notes and our common stock.
In connection with the sale of the 2022 Notes, we entered into convertible note hedge (the “2022 Note Hedge”) transactions with certain financial institutions (“option counterparties”). We also entered into warrant transactions with the option counterparties pursuant to which we sold warrants for the purchase of our common stock (the “2022 Warrants”). The actual number of shares of our common stock issuable upon the automatic exercise of the remaining portion of the 2022 Warrants, if any, is unknown at this time. Refer to Note 11 in the notes to our consolidated financial statements included elsewhere in this Annual Report on Form 10-K for additional information.
The option counterparties and/or their respective affiliates may modify their hedge positions by entering into or unwinding various derivatives with respect to our common stock and/or purchasing or selling our common stock in secondary market transactions prior to the maturity of the 2022 Notes (and are likely to do so during any observation period related to a conversion of the 2022 Notes, or following any repurchase of the 2022 Notes by us on any fundamental change repurchase date (as defined in the Indenture) or otherwise). This activity could also cause or avoid an increase or a decrease in our stock price or the 2022 Notes price and, to the extent the activity occurs during the final observation period related to the settlement of the remaining 2022 Notes, it could affect the amount and value of the consideration that note holders will receive.
The potential effect, if any, of these transactions and activities on our stock price or the 2022 Notes price will depend in part on market conditions and cannot be ascertained at this time. Any of these activities could adversely affect the value of our common stock and the value of the 2022 Notes (and the resulting amount of cash and/or number of shares, if any, that note holders would receive upon the conversion).
We are subject to counterparty risk with respect to the 2022 Note Hedge.
The option counterparties are financial institutions, and we will be subject to the risk that any or all of them may default under the 2022 Note Hedge. Our exposure to the credit risk of the option counterparties will not be secured by any collateral. If an option counterparty becomes subject to insolvency proceedings, we will become an unsecured creditor in those proceedings, with a claim equal to our exposure at that time under our transactions with that option counterparty. Our exposure will depend on many factors but, generally, an increase in our exposure will be correlated to an increase in the stock price and in the volatility of our common stock. In addition, upon a default by an option counterparty, we may suffer adverse tax consequences. We can provide no assurances as to the financial stability or viability of the option counterparties.
Risks Related to Ownership of Our Common Stock
Our stock price is likely to continue to be volatile and could subject us to litigation.
Our stock price is likely to continue to be volatile and could be subject to wide fluctuations. In addition, technology companies in general have highly volatile stock prices, and the volatility in stock price and trading volume of securities is often unrelated or disproportionate to the financial performance of the companies issuing the securities. Factors affecting our stock price, some of which are beyond our control, include:
•changes in the estimates of our operating results or changes in recommendations by securities analysts that elect to cover our common stock;
•announcements of new products, services or technologies, new applications or enhancements to services, strategic alliances, acquisitions, or other significant events by us or by our competitors;
•fluctuations in company valuations, such as high-growth or cloud companies, investors perceive to be comparable to us;
•changes to our management team;
•trading activity by directors, executive officers and significant shareholders, or the market’s perception that large shareholders intend to sell their shares;
•the inclusion, exclusion, or deletion of our stock from any trading indices, such as the S&P 500 Index;
•the size of our market float;
•the trading volume of our common stock, including sales upon exercise of outstanding options or vesting of equity awards or sales and purchases of common stock issued in connection with settling the remaining portion of the 2022 Warrants;
•the economy as a whole, market conditions in our industry, and the industries of our customers;
•changes to our credit ratings;
•environmental, social, governance and other issues impacting our reputation; and
•overall performance of the equity markets.
Following periods of volatility in the market price of a company’s securities, securities class action litigation has often been brought against that company. Securities litigation could result in substantial costs and divert management’s attention and resources from our business. This could materially adversely affect our business, operating results, and financial condition.
We do not intend to pay dividends on our common stock, so any returns will be limited to changes in our stock price.
We have never declared or paid any cash dividends on our common stock and we do not intend to declare or pay any cash dividends for the foreseeable future. Our ability to pay cash dividends on our common stock may be prohibited or limited by the terms of any future debt financing arrangements. Return to shareholders will be limited to increased stock price, if any.
Provisions in our charter documents, Delaware law, 2030 Notes or 2022 Notes might discourage, delay or prevent a change of control or changes in our management and, therefore, depress our stock price.
Our restated certificate of incorporation, as amended (“Charter”), and restated bylaws contain provisions that could depress our stock price by acting to discourage, delay or prevent a change in control or changes in our management that the shareholders of our company may deem advantageous. These provisions among other things:
•established a classified board, although our board will be fully declassified by our 2023 annual meeting of shareholders;
•permit the board to establish the number of directors;
•provide that directors may only be removed “for cause” and only with the approval of 66 2/3% of our shareholders;
•require super-majority voting to amend some provisions in our Charter, and restated bylaws;
•authorize issuance of “blank check” preferred stock that our board could use to implement a shareholder rights plan;
•prohibit shareholder action by written consent, which requires all shareholder actions to be taken at a meeting;
•provide that the board is expressly authorized to make, alter or repeal our restated bylaws; and
•establish advance notice requirements for nominations for election to our board or proposing matters that can be acted upon by shareholders at annual shareholder meetings (though our restated bylaws have shareholder proxy access).
Further, Section 203 of the Delaware General Corporation Law may discourage, delay or prevent a change in control of our company. Section 203 imposes certain restrictions on merger, business combinations and other transactions between us and certain shareholders. The fundamental change provisions of our 2022 Notes or change in control repurchase event provisions of our 2030 Notes may delay or prevent a change in control of our company, because those provisions allow note holders to require us to repurchase such notes upon the occurrence of a fundamental change or change in control repurchase event.
| | | | | |
| ITEM 1B. | UNRESOLVED STAFF COMMENTS |
None.
Our principal office is located in Santa Clara, California, where we lease approximately 879,000 square feet of space under lease agreements for our business operations and product development. We also have approximately 241,000 square feet of expansion space that is currently under development by the landlord under the lease agreement. We also maintain offices globally. All of our properties are currently leased. We believe our existing facilities are adequate to meet our current requirements. See Note 17 in the notes to our consolidated financial statements included elsewhere in this Annual Report on Form 10-K for more information about our lease commitments. We expect to expand our facilities capacity as our employee base grows. We believe we will be able to obtain such space on acceptable and commercially reasonable terms.
From time to time, we are party to litigation and other legal proceedings in the ordinary course of business. While the results of any litigation or other legal proceedings are uncertain, we are not presently a party to any legal proceedings that, if determined adversely to us, would individually or taken together have a material adverse effect on our business, financial position, results of operations or cash flows.
| | | | | |
| ITEM 4. | MINE SAFETY DISCLOSURES |
Not applicable.
PART II
| | | | | |
| ITEM 5. | MARKET FOR REGISTRANT’S COMMON EQUITY, RELATED STOCKHOLDER MATTERS AND ISSUER PURCHASES OF EQUITY SECURITIES |
Market Information for Common Stock
Our common stock is listed on the New York Stock Exchange under the symbol “NOW.”
Dividends
Our board of directors currently intends to retain any future earnings to support operations and to finance the growth and development of our business, and therefore does not intend to pay cash dividends on our common stock for the foreseeable future.
Stockholders
As of December 31, 2021, there were 12 registered stockholders of record (not including an indeterminate number of beneficial holders of stock held in street name through brokers and other intermediaries) of our common stock.
Securities Authorized for Issuance under Equity Compensation Plans
The information required by this item will be included in an amendment to this Annual Report on Form 10-K or incorporated by reference from our definitive proxy statement to be filed with the SEC pursuant to Regulation 14A.
Stock Performance Graph
This performance graph shall not be deemed “soliciting material” or to be “filed” with the SEC, for purposes of Section 18 of the Securities Exchange Act of 1934, as amended (the “Exchange Act”), or otherwise subject to the liabilities under that section, and shall not be deemed incorporated by reference into any of our other filings under the Securities Act of 1933, (the “Securities Act”) or the Exchange Act except to the extent we specifically incorporate it by reference into such filing.
The graph below compares the cumulative total stockholder return on our common stock with the cumulative total return on the S&P 500 Index, NYSE Composite Index and the Standard & Poor Systems Software Index for each of the last five fiscal years ended December 31, 2017 through December 31, 2021, assuming an initial investment of $100. Data for the S&P 500 Index, NYSE Composite Index and the Standard & Poor Systems Software Index assume reinvestment of dividends.
The comparisons in the graph below are based upon historical data and are not indicative of, nor intended to forecast, future performance of our common stock.
| | | | | | | | | | | | | | | | | | | | | | | | | | | | | | | | | | | | | | | | |
| | | Base Period | | | | | | | | | | | |
| | | Dec 31, 2016 | | | Dec 31, 2017 | | Dec 31, 2018 | | Dec 31, 2019 | | Dec 31, 2020 | | Dec 31, 2021 |
| ServiceNow, Inc. | | | 100.00 | | | 175.40 | | | 239.51 | | | 379.77 | | | 740.42 | | | 873.16 | |
| NYSE Composite | | | 100.00 | | | 118.73 | | | 108.10 | | | 135.68 | | | 145.16 | | | 175.18 | |
| S&P 500 | | | 100.00 | | | 121.83 | | | 116.49 | | | 153.17 | | | 181.35 | | | 233.41 | |
| S&P Systems Software | | | 100.00 | | | 137.38 | | | 159.88 | | | 242.03 | | | 346.30 | | | 521.15 | |
Unregistered Sales of Equity Securities
In February 2021, we entered into partial unwind agreements that reduced the aggregate number of 2022 Warrants to 1,004,872. In connection with the partial unwind of the 2022 Warrants, we delivered, in an exchange pursuant to Section 3(a)(9) of the Securities Act, an aggregate of 536,023 shares of our common stock to the holders of the 2022 Warrants, which were Citibank, N.A., Goldman Sachs & Co. LLC, JPMorgan Chase Bank, National Association, London Branch, and Morgan Stanley & Co. LLC. We did not receive any proceeds from the partial unwind agreements in connection with our 2022 Warrants, nor were they subject to underwriting discounts or commissions.
In connection with the acquisition of Contexeo SAS, d/b/a Mapwize (“Mapwize”), in September 2021, we issued 2,445 shares of our common stock to the founders of Mapwize. The shares of common stock were issued in reliance on the exemption from registration pursuant to Section 4(a)(2) of the Securities Act, as a transaction by an issuer not involving a public offering.
Issuer Purchases of Equity Securities
None.
| | | | | |
| ITEM 6. | SELECTED CONSOLIDATED FINANCIAL DATA |
Part II, Item 6 is no longer required as the Company has adopted certain provisions within the amendments to Regulation S-K that eliminate Item 301.
| | | | | |
| ITEM 7. | MANAGEMENT’S DISCUSSION AND ANALYSIS OF FINANCIAL CONDITION AND RESULTS OF OPERATIONS |
This section of our Annual Report on Form 10-K discusses our financial condition and results of operations for the fiscal years ended December 31, 2021 and 2020, and year-to-year comparisons between fiscal 2021 and fiscal 2020 in accordance with U.S. Generally Accepted Accounting Principles (“GAAP”). A discussion of our financial condition and results of operations for the fiscal year ended December 31, 2019 and year-to-year comparisons between fiscal 2020 and fiscal 2019 that is not included in this Annual Report on Form 10-K can be found in “Management’s Discussion and Analysis of Financial Condition and Results of Operations” in Part II, Item 7 of our Annual Report on Form 10-K for the fiscal year ended December 31, 2020, filed on February 12, 2021.
Our free cash flow and billings measures included in the sections entitled “—Key Business Metrics—Free Cash Flow” and “—Key Business Metrics—Billings” are not in accordance with GAAP. These non-GAAP financial measures are not intended to be considered in isolation or as a substitute for, or superior to, financial information prepared and presented in accordance with GAAP. These measures may be different from non-GAAP financial measures used by other companies, limiting their usefulness for comparison purposes. We encourage investors to carefully consider our results under GAAP, as well as our supplemental non-GAAP results, to more fully understand our business.
Overview
ServiceNow was founded on a simple premise: a better technology platform will help work flow better. The company’s purpose is to make the world work better for everyone. We help global enterprises across industries, universities and governments to digitize their workflows. The Now Platform enables us to connect systems, silos, departments and processes with digital workflows that are simple and easy to use. We categorize the workflows we provide into four primary areas: IT, Employee, Customer and Creator. The products under each of our workflows are helping customers connect work across systems and silos to enable great experiences for people. The Now Platform is uniquely positioned to enable our customers’ digital transformation from non-integrated enterprise technology solutions with manual and disconnected processes and activities, to integrated enterprise technology solutions with automation and connected processes and activities. The transformation to digital operations, enabled by the Now Platform, increases our customers’ resiliency and security and delivers great experiences and additional value to their employees and consumers.
In response to the COVID-19 pandemic, we continue to focus on maintaining business continuity, helping our employees, customers and communities, and preparing for the future and the long-term success of our business. We are continuing to monitor the actual and potential effects of the COVID-19 pandemic across our business. The extent and continued impact of the COVID-19 pandemic on our business will depend on certain developments including the duration and spread of the outbreak and new variant strains of the virus; the availability and distribution of effective vaccines; the severity of the economic decline attributable to the pandemic and timing, nature and sustainability of economic recovery; and government responses, including vaccination or testing mandates, all of which are highly uncertain and unpredictable. Starting late 2021, many employees began to return to our offices for at least part of the week. Our return to work approach may vary among geographies depending on appropriate health protocols, and may change at any time depending on the severity of or spikes in COVID-19. The impact, if any, of these and any additional operational changes we may implement is uncertain but changes we have implemented have not affected and are not expected to affect our ability to maintain operations, including financial reporting systems, internal control over financial reporting and disclosure controls and procedures. See the section “Risk Factors” in Part 1, Item 1A of this Annual Report for further discussion of the possible impact of the COVID-19 pandemic on our business.
Key Business Metrics
Remaining performance obligations. Transaction price allocated to remaining performance obligations (“RPO”) represents contracted revenue that has not yet been recognized, which includes deferred revenue and non-cancelable amounts that will be invoiced and recognized as revenue in future periods. RPO excludes contracts that are billed in arrears, such as certain time and materials contracts, as we apply the “right to invoice” practical expedient under relevant accounting guidance. Current remaining performance obligations (“cRPO”) represents RPO that will be recognized as revenue in the next 12 months.
As of December 31, 2021, our RPO was $11.5 billion, of which 49% represented cRPO. RPO and cRPO increased by 29%, respectively, compared to December 31, 2020. Factors that may cause our RPO to vary from period to period include the following:
•Foreign currency exchange rates. While a majority of our contracts have historically been in U.S. Dollars, an increasing percentage of our contracts in recent periods has been in foreign currencies, particularly the Euro and British Pound Sterling. Fluctuations in foreign currency exchange rates as of the balance sheet date will cause variability in our RPO.
•Mix of offerings. In a minority of cases, we allow our customers to host our software by themselves or through a third-party service provider. In self-hosted offerings, we recognize a portion of the revenue upfront upon the delivery of the software and as a result, such revenue is excluded from RPO.
•Subscription start date. From time to time, we enter into contracts with a subscription start date in the future and these amounts are included in RPO if such contracts are signed by the balance sheet date.
•Timing of contract renewals. While customers typically renew their contracts at the end of the contract term, from time to time, customers may do so either before or after the scheduled expiration date. For example, in cases where we are successful in selling additional products or services to an existing customer, a customer may decide to renew its existing contract early to ensure that all its contracts expire on the same date. In other cases, prolonged negotiations or other factors may result in a contract not being renewed until after it has expired.
•Contract duration. While we typically enter into multi-year subscription services, the duration of our contracts varies. Further, we continue to see an increase in the number of 12-month agreements entered into with the U.S. Federal government throughout the year, with the highest number of agreements entered into in the quarter ended September 30, driven primarily by timing of their annual budget expenditures. We sometimes also enter into contracts with durations that have a 12-month or shorter term to enable the contracts to co-terminate with the existing contract. The contract duration will cause variability in our RPO.
Number of customers with ACV greater than $1 million. We count the total number of customers with annual contract value (“ACV”) greater than $1 million as of the end of the period. We had 1,359, 1,085, and 882 customers with ACV greater than $1 million as of December 31, 2021, 2020 and 2019, respectively. For purposes of customer count, a customer is defined as an entity that has a unique Dunn & Bradstreet Global Ultimate (“GULT”) Data Universal Numbering System (“DUNS”) number and an active subscription contract as of the measurement date. The DUNS number is a global standard for business identification and tracking. We make exceptions for holding companies, government entities and other organizations for which the GULT, in our judgment, does not accurately represent the ServiceNow customer. For example, while all U.S. government agencies roll up to “Government of the United States” under the GULT, we count each government agency that we contract with as a separate customer. Our customer count is subject to adjustments for acquisitions, spin-offs and other market activity; accordingly, we restate previously disclosed number of customers with ACV greater than $1 million calculations to allow for comparability. ACV is calculated based on the foreign exchange rate in effect at the time the contract was signed. Foreign exchange rate fluctuations could cause some variability in the number of customers with ACV greater than $1 million. We believe information regarding the total number of customers with ACV greater than $1 million provides useful information to investors because it is an indicator of our growing customer base and demonstrates the value customers are receiving from the Now Platform.
Free cash flow. We define free cash flow, a non-GAAP financial measure, as GAAP net cash provided by operating activities reduced by purchases of property and equipment. Purchases of property and equipment are otherwise included in cash used in investing activities under GAAP. We believe information regarding free cash flow provides useful information to investors because it is an indicator of the strength and performance of our business operations. However, our calculation of free cash flow may not be comparable to similar measures used by other companies. A calculation of free cash flow is provided below:
| | | | | | | | | | | | | | | | | |
| | Year Ended December 31, |
| | 2021 | | 2020 | | 2019 |
| | | | | |
| (in millions) |
| Free cash flow: | | | | | |
| Net cash provided by operating activities | $ | 2,191 | | | $ | 1,786 | | | $ | 1,236 | |
| Purchases of property and equipment | (392) | | | (419) | | | (265) | |
Free cash flow (1) | $ | 1,799 | | | $ | 1,367 | | | $ | 971 | |
(1)Free cash flow for the years ended December 31, 2021 and 2020 include the effect of $15 million and $82 million, respectively relating to the repayments of convertible senior notes attributable to debt discount. Refer to Note 11 in the notes to our consolidated financial statements included elsewhere in this Annual Report on Form 10-K for further details.
We have historically seen higher collections in the quarter ended March 31 due to seasonality in timing of entering into customer contracts which is significantly higher in the quarter ended December 31. Additionally, we have historically seen higher disbursements in the quarters ended March 31 and September 30 due to payouts under our annual commission plans, purchases under our employee stock purchase plan, payouts under our bonus plans and coupon payments related to our 2030 Notes beginning in 2021.
Renewal rate. We calculate our renewal rate by subtracting our attrition rate from 100%. Our attrition rate for a period is equal to the ACV from customers lost during the period, divided by the sum of (i) the total ACV from all customers that renewed during the period, excluding changes in price or users, and (ii) the total ACV from all customers lost during the period. Accordingly, our renewal rate is calculated based on ACV and is not based on the number of customers that have renewed. Further, our renewal rate does not reflect increased or decreased purchases from our customers to the extent such customers are not lost customers or lapsed renewal. A lost customer is a customer that did not renew an expiring contract and that, in our judgment, will not be renewed. Typically, a customer that reduces its subscription upon renewal is not considered a lost customer. However, in instances where the subscription decrease represents the majority of the customer’s ACV, we may deem the renewal as a lost customer. For our renewal rate calculation, we define a customer as an entity with a separate production instance of our service and an active subscription contract as of the measurement date, instead of an entity with a unique GULT or DUNS number. We adjust our renewal rate for acquisitions, consolidations and other customer events that cause the merging of two or more accounts occurring at the time of renewal. Additionally, starting in 2020, we simplified our methodology related to contracts less than 12 months to derive ACV used to calculate renewal rate. Previously disclosed renewal rates may be restated to reflect such adjustments or methodology simplification to allow for comparability. However, there were no material changes to such previously disclosed renewal rates. Our renewal rate was 98% for each of the years ended December 31, 2021, 2020 and 2019. As our renewal rate is impacted by the timing of renewals, which could occur in advance of, or subsequent to the original contract end date, period-to-period comparison of renewal rates may not be meaningful.
Billings. We define billings, a non-GAAP financial measure, as GAAP revenues recognized plus the change in total GAAP unbilled receivables, deferred revenue and customer deposits as presented on the consolidated statements of cash flows. The calculation of billings is provided below:
| | | | | | | | | | | | | | | | | |
| | Year Ended December 31, |
| | 2021 | | 2020 | | 2019 |
| | | | | |
| (dollars in millions) |
| Billings: | | | | | |
| Total revenues | $ | 5,896 | | | $ | 4,519 | | | $ | 3,460 | |
Change in deferred revenue, unbilled receivables and customer deposits(1) | 954 | | | 710 | | | 542 | |
| Total billings | $ | 6,850 | | | $ | 5,229 | | | $ | 4,002 | |
| Year-over-year percentage change in total billings | 31 | % | | 31 | % | | 30 | % |
(1)As presented on or derived from our consolidated statements of cash flows.
Billings consists of amounts invoiced for subscription contracts with existing customers, renewal contracts, expansion contracts, contracts with new customers, and contracts for professional services and training. Factors that may cause our billings results to vary from period to period include the following:
•Billings duration. While we typically bill customers annually in advance for our subscription services, customers sometimes request, and we accommodate, billings with durations less than or greater than the typical 12-month term. Changes in billings duration had a favorable impact of $38 million and an immaterial impact on billings for the years ended December 31, 2021 and 2020, respectively.
•Contract start date. From time to time, we enter into contracts with a contract start date in the future, and we exclude these amounts from billings as these amounts are not included in our consolidated balance sheets, unless such amounts have been paid as of the balance sheet date.
•Foreign currency exchange rates. While a majority of our billings have historically been in U.S. Dollars, an increasing percentage of our billings in recent periods has been in foreign currencies, particularly the Euro and British Pound Sterling. Fluctuations in foreign currency exchange rates will cause variability in our billings. Foreign currency rate fluctuations had a favorable impact of $74 million and $21 million for the years ended December 31, 2021 and 2020, respectively.
•Timing of contract renewals. While customers typically renew their contracts at the end of the contract term, from time to time customers may do so either before or after the scheduled expiration date. For example, in cases where we are successful in selling additional products or services to an existing customer, a customer may decide to renew its existing contract early to ensure that all its contracts expire on the same date. In other cases, prolonged negotiations or other factors may result in a contract not being renewed until after it has expired.
•Seasonality. We have historically experienced seasonality in terms of when we enter into customer agreements for our services. We sign a significantly higher percentage of agreements with new customers, as well as expansion with existing customers, in the fourth quarter of each year. The increase in customer agreements for the fourth quarter is primarily a result of both large enterprise account buying patterns typical in the software industry, which are driven primarily by the expiration of annual authorized budgeted expenditures, and the terms of our commission plans which incentivize our direct sales organization to meet their annual quotas by December 31. Furthermore, we usually sign a significant portion of these agreements during the last month, and often the last two weeks, of each quarter. This seasonality in the timing of entering into customer contracts is sometimes not immediately apparent in our billings, due to the fact that we typically exclude cloud-offering contracts with a future start date from our billings, unless such amounts have been paid as of the balance sheet date. Similarly, this seasonality is reflected to a much lesser extent, and sometimes is not immediately apparent in our revenues, due to the fact that we recognize subscription revenues from our cloud offering contracts over the term of the subscription agreement, which is generally 12 to 36 months. Although these seasonal factors are common in the technology industry, historical patterns should not be considered a reliable indicator of our future sales activity or performance. Further, the seasonal factors could be heightened due to the impact of a gross domestic product contraction and other impacts unknown on our customers and sales cycles caused by the COVID-19 pandemic.
To facilitate greater year-over-year comparability in our billings results, we disclose the impact that foreign currency rate fluctuations and fluctuations in billings duration had on our billings. The impact of foreign currency rate fluctuations is calculated by translating the current period results for entities reporting in currencies other than U.S. Dollars into U.S. Dollars at the exchange rates in effect during the prior period presented, rather than the actual exchange rates in effect during the current period. The impact of fluctuations in billings duration is calculated by replacing the portion of multi-year billings in excess of 12 months during the current period with the portion of multi-year billings in excess of 12 months during the prior period presented. Notwithstanding the adjustments described above, the comparability of billings results from period to period remains subject to the impact of variations in the dollar value of contracts with future start dates and the timing of contract renewals, for which no adjustments have been presented.
While we believe billings is one indicator of the performance of our business, due to the factors described above, an increase or decrease in billings may not reflect the actual performance for that reporting period. As a result, our billings metric has become less indicative of the actual performance of our business over time and we do not plan to disclose this metric in future filings.
Critical Accounting Policies and Significant Judgments and Estimates
Our management’s discussion and analysis of financial condition and results of operations is based on our consolidated financial statements, which have been prepared in accordance with GAAP. The preparation of these consolidated financial statements requires us to make estimates and assumptions that affect the reported amounts of assets and liabilities and the disclosure of contingent assets and liabilities at the date of the consolidated financial statements, as well as the reported revenues and expenses during the reporting periods. These items are monitored and analyzed by us for changes in facts and circumstances, and material changes in these estimates could occur in the future. We base our estimates on historical experience and on various other factors that we believe are reasonable under the circumstances, the results of which form the basis for making judgments about the carrying value of assets and liabilities that are not readily apparent from other sources. Changes in estimates are reflected in reported results for the period in which they become known. Actual results may differ from these estimates under different assumptions or conditions and such differences could be material.
While our significant accounting policies are more fully described in Note 2 in the notes to our consolidated financial statements included elsewhere in this Annual Report on Form 10-K, we believe that the following accounting policies are critical to the process of making significant judgments and estimates in the preparation of our audited consolidated financial statements.
Revenue Recognition
We derive our revenues predominately from subscription revenues which are primarily comprised of subscription fees that give customers access to the ordered subscription service, related support and updates, if any, to the subscribed service during the subscription term. For our cloud services, we recognize subscription revenues ratably over the contract term beginning on the commencement date of each contract, the date we make our services available to our customers. Our contracts with customers typically include a fixed amount of consideration and are generally non-cancelable and without any refund-type provisions.
Subscription revenues also include revenues from self-hosted offerings in which customers deploy, or we grant customers the option to deploy without significant penalty, our subscription service internally or contract with a third party to host the software. For these contracts, we account for the software element separately from the related support and updates as they are distinct performance obligations. The transaction price is allocated to separate performance obligations on a relative standalone selling price (“SSP”) basis. The transaction price allocated to the software element is recognized when transfer of control of the software to the customer is complete. The transaction price allocated to the related support and updates are recognized ratably over the contract term.
We enter into contracts that can include various combinations of products and services, which are generally capable of being distinct and accounted for as separate performance obligations. For these contracts, the transaction price is allocated to the separate performance obligations on a relative SSP basis. Evaluating the terms and conditions included within our customer contracts for appropriate revenue recognition and determining whether products and services are considered distinct performance obligations that should be accounted for separately versus together may require significant judgment.
Deferred Commissions
Deferred commissions are the incremental selling costs that are associated with acquiring customer contracts and consist primarily of sales commissions paid to our sales organization and referral fees paid to independent third parties. Commissions and referral fees earned upon the execution of initial and expansion contracts are primarily deferred and amortized over a period of benefit that we have determined to be five years consistent with prior year. Commissions earned upon the renewal of customer contracts are deferred and amortized over the average renewal term. Additionally, for self-hosted offerings, consistent with the recognition of subscription revenues for self-hosted offerings, a portion of the commission cost is expensed upfront when the self-hosted offering is made available. Determining the period of benefit including average renewal term requires judgment for which we take into consideration our customer contracts, our technology life cycle and other factors.
Business combinations
The allocation of the purchase price in a business combination requires management to make significant estimates in determining the fair value of acquired assets and assumed liabilities, especially with respect to intangible assets. The excess of the purchase price in a business combination over the fair value of these tangible and intangible assets acquired and liabilities assumed is recorded as goodwill. Critical estimates in valuing certain intangible assets include, but are not limited to, future expected cash flows, discount rates, the time and expense to recreate the assets and profit margin a market participant would receive. These estimates are inherently uncertain and unpredictable and, as a result, actual results may differ from estimates. The Company evaluates these estimates and assumptions as new information is obtained and may record adjustments to the fair value of the tangible and intangible assets acquired and liabilities assumed but not later than one year from the acquisition date.
Income Taxes
Our annual tax rate is based on our income, statutory tax rates and tax planning opportunities available to us in the various jurisdictions in which we operate. Tax laws are complex and subject to different interpretations by the taxpayer and respective government taxing authorities. Significant judgment is required in determining our tax expense (benefit) and in evaluating our tax positions, including evaluating uncertainties and the complexity of taxes on foreign earnings. We review our tax positions quarterly and adjust the balances as new information becomes available.
Deferred tax assets represent amounts available to reduce income taxes payable on taxable income in future years. Such assets arise because of temporary differences between the financial reporting and tax bases of assets and liabilities, as well as from net operating loss and tax credit carryforwards. We evaluate the recoverability of these future tax deductions and credits by assessing the adequacy of future expected taxable income from all sources, including future growth, forecasted earnings, future taxable income, the mix of earnings in the jurisdictions in which we operate, historical earnings, taxable income in prior years, if carryback is permitted under the law, carryforward periods and prudent and feasible tax planning strategies. A valuation allowance is established if it is more likely than not that all or a portion of the deferred tax asset will not be realized. To the extent sufficient positive evidence becomes available, we may release all or a portion of our valuation allowance in one or more future periods. A release of the valuation allowance, if any, would result in the recognition of certain deferred tax assets and a material income tax benefit for the period in which such release is recorded.
Due to cumulative losses including tax deductible stock compensation and based on all available positive and negative evidence, we have determined that it is more likely than not that our U.S. deferred tax assets will not be realizable as of December 31, 2021. Management applied significant judgment in assessing the positive and negative evidence available in the determination of the amount of deferred tax assets that were more likely than not to be realized in the future. In determining the need, or continued need, for a valuation allowance, we considered the weighting of the positive and negative evidence which includes, among other things, cumulative losses including tax deductible stock compensation expense , future growth, forecasted earnings, and future taxable income.
Our tax positions are subject to income tax audits by multiple tax jurisdictions throughout the world. We recognize the tax benefit of an uncertain tax position only if it is more likely than not the position is sustainable upon examination by the taxing authority based on the technical merits. We measure the tax benefit recognized as the largest amount of benefit which is more likely than not to be realized upon settlement with the taxing authority. We recognize interest accrued and penalties related to unrecognized tax benefits in our tax provision. Significant judgment is required to evaluate uncertain tax positions. Our evaluations are based upon a number of factors, including changes in facts or circumstances, changes in tax law or guidance, correspondence with tax authorities during the course of audits and effective settlement of audit issues. Changes in the recognition or measurement of uncertain tax positions could result in material increases or decreases in our income tax expense in the period in which we make the change, which could have a material impact on our effective tax rate and operating results.
We calculate the current and deferred income tax provision based on estimates and assumptions that could differ from the actual results reflected in income tax returns filed in subsequent years and record adjustments based on filed income tax returns when identified. The amount of income taxes paid is subject to examination by U.S. federal, state and foreign tax authorities. The estimate of the potential outcome of any uncertain tax issue is subject to management’s assessment of relevant risks, facts and circumstances existing at that time. To the extent the assessment of such tax position changes, we record the change in estimate in the period in which we make the determination.
Change in Accounting Estimate
In January 2022, we completed an assessment of the useful life of our data center equipment and determined we should increase the estimated useful life of data center equipment from three to four years. This change in accounting estimate will be effective beginning fiscal year 2022. Based on the carrying amount of data center equipment included in property and equipment, net that are in-service as of December 31, 2021, it is estimated this change will increase our fiscal year 2022 operating income by approximately $80 million.
New Accounting Pronouncements Pending Adoption
The impact of recently issued accounting standards is set forth in Note 2, Summary of Significant Accounting Policies, of the notes to our consolidated financial statements included elsewhere in this Annual Report on Form 10-K.
Components of Results of Operations
Revenues
Subscription revenues. Subscription revenues are primarily comprised of fees that give customers access to the ordered subscription service for both self-hosted offerings and cloud-based subscription offerings, and related standard and enhanced support and updates, if any, to the subscription service during the subscription term. For our cloud-based offerings, we recognize revenue ratably over the subscription term. For self-hosted offerings, a substantial portion of the sales price is recognized upon delivery of the software, which may cause greater variability in our subscription revenues and subscription gross margin. Pricing includes multiple instances, hosting and support services, data backup and disaster recovery services, as well as future updates, when and if available, offered during the subscription term. We typically invoice our customers for subscription fees in annual increments upon execution of the initial contract or subsequent renewal. Our contracts are generally non-cancelable during the subscription term, though a customer can terminate for breach if we materially fail to perform.
Professional services and other revenues. Our arrangements for professional services are primarily on a time-and-materials basis, and we generally invoice our customers monthly in arrears for the professional services based on actual hours and expenses incurred. Some of our professional services arrangements are on a fixed fee or subscription basis. Professional services revenues are recognized as services are delivered. Other revenues primarily consist of fees from customer training delivered on-site or through publicly available classes. Typical payment terms require our customers to pay us within 30 days of invoice.
We sell our subscription services primarily through our direct sales organization. We also sell services through managed service providers and resale partners. We also generate revenues from certain professional services and from training of customers and partner personnel, through both our direct team and indirect channel sales. Revenues from our direct sales organization represented 79%, 81% and 82% of our total revenues for the years ended December 31, 2021, 2020 and 2019, respectively. For purposes of calculating revenues from our direct sales organization, revenues from systems integrators and managed services providers are included as part of the direct sales organization.
Cost of Revenues
Cost of subscription revenues. Cost of subscription revenues consists primarily of expenses related to hosting our services and providing support to our customers. These expenses are comprised of data center capacity costs, which include colocation costs associated with our data centers as well as interconnectivity between data centers, depreciation related to our infrastructure hardware equipment dedicated for customer use, amortization of intangible assets, expenses associated with software, public cloud service costs, IT services and dedicated customer support, personnel-related costs directly associated with data center operations and customer support, including salaries, benefits, bonuses and stock-based compensation and allocated overhead.
Cost of professional services and other revenues. Cost of professional services and other revenues consists primarily of personnel-related costs directly associated with our professional services and training departments, including salaries, benefits, bonuses and stock-based compensation, the costs of contracted third-party partners, travel expenses and allocated overhead.
Professional services are performed directly by our services team, as well as by contracted third-party partners. Fees paid by us to third-party partners are primarily recognized as cost of revenues as the professional services are delivered. Cost of revenues associated with our professional services engagements contracted with third-party partners as a percentage of professional services and other revenues was 14%, 10% and 15% for the years ended December 31, 2021, 2020 and 2019, respectively.
Sales and Marketing
Sales and marketing expenses consist primarily of personnel-related expenses directly associated with our sales and marketing staff, including salaries, benefits, bonuses and stock-based compensation. Sales and marketing expenses also include the amortization of commissions paid to our sales employees, including related payroll taxes and fringe benefits. In addition, sales and marketing expenses include branding expenses, marketing program expenses, which include events such as Knowledge, and costs associated with purchasing advertising and marketing data, software and subscription services dedicated for sales and marketing use and allocated overhead.
Research and Development
Research and development expenses consist primarily of personnel-related expenses directly associated with our research and development staff, including salaries, benefits, bonuses and stock-based compensation and allocated overhead. Research and development expenses also include data center capacity costs, costs associated with outside services contracted for research and development purposes and depreciation of infrastructure hardware equipment that is used solely for research and development purposes.
General and Administrative
General and administrative expenses consist primarily of personnel-related expenses for our executive, finance, legal, human resources, facilities and administrative personnel, including salaries, benefits, bonuses and stock-based compensation, external legal, accounting and other professional services fees, other corporate expenses, amortization of intangible assets and allocated overhead.
Provision for (benefit from) Income Taxes
Provision for (benefit from) income taxes consist of federal, state and foreign income taxes. Due to cumulative losses, we maintain a valuation allowance against our U.S. deferred tax assets as of December 31, 2021 and 2020. We consider all available evidence, both positive and negative, including but not limited to earnings history, projected future outcomes, industry and market trends and the nature of each of the deferred tax assets in assessing the extent to which a valuation allowance should be applied against our U.S. and foreign deferred tax assets.
Comparison of the years ended December 31, 2021 and 2020
Revenues
| | | | | | | | | | | | | | | | | |
| | Year Ended December 31, | | % Change |
| | 2021 | | 2020 | |
| | | | | |
| (dollars in millions) | | |
| Revenues: | | | | | |
| Subscription | $ | 5,573 | | | $ | 4,286 | | | 30 | % |
| Professional services and other | 323 | | | 233 | | | 39 | % |
| Total revenues | $ | 5,896 | | | $ | 4,519 | | | 30 | % |
| Percentage of revenues: | | | | | |
| Subscription | 95 | % | | 95 | % | | |
| Professional services and other | 5 | % | | 5 | % | | |
| Total | 100 | % | | 100 | % | | |
Subscription revenues increased by $1.3 billion for the year ended December 31, 2021, compared to the prior year, driven by increased purchases by existing customers and an increase in customer count. Included in subscription revenues is $241 million and $205 million of revenues recognized upfront from the delivery of software associated with self-hosted offerings during the years ended December 31, 2021 and 2020, respectively.
We expect subscription revenues for the year ending December 31, 2022 to increase in absolute dollars as we continue to add new customers and existing customers increase their usage of our products, but remain relatively flat as a percentage of revenue compared to the year ended December 31, 2021. We will continue to monitor the COVID-19 pandemic in 2022 and its impact on customer acquisition and renewal rates.
Our expectations for revenues, cost of revenues and operating expenses for the year ending December 31, 2022 are based on the 31-day average of foreign exchange rates for December 2021.
Subscription revenues consist of the following:
| | | | | | | | | | | | | | | | | |
| Year Ended December 31, | | % Change |
| 2021 | | 2020 | |
| | | | | |
| (dollars in millions) | | |
| Digital workflow products | $ | 4,882 | | | $ | 3,749 | | | 30 | % |
| ITOM products | 691 | | | 537 | | | 29 | % |
| Total subscription revenues | $ | 5,573 | | | $ | 4,286 | | | 30 | % |
Our digital workflow products include the Now Platform, IT Service Management, IT Business Management, IT Asset Management, Security Operations, Governance, Risk and Compliance, HR Service Delivery, Safe Workplace Suite of applications, Workplace Service Delivery, Legal Service Delivery, Customer Service Management, Field Service Management, Industry Solutions, App Engine and IntegrationHub, and are generally priced on a per user basis. Our ITOM products are generally priced on a per node (physical or virtual server) basis and increasingly on a subscription unit basis which allows us to measure customers’ management of physical IT resources.
Professional services and other revenues increased by $90 million for the year ended December 31, 2021, compared to the prior year, due to an increase in services and trainings provided to new and existing customers. We expect professional services and other revenues for the year ending December 31, 2022 to increase in absolute dollars, but remain relatively flat as a percentage of revenue compared to the year ended December 31, 2021. We are increasingly focused on deploying our internal professional services organization as a strategic resource and relying on our partner ecosystem to contract directly with customers for implementation services delivery.
Cost of Revenues and Gross Profit Percentage
| | | | | | | | | | | | | | | | | |
| | Year Ended December 31, | | % Change |
| | 2021 | | 2020 | |
| | | | | |
| | (dollars in millions) | | |
| Cost of revenues: | | | | | |
| Subscription | $ | 1,022 | | | $ | 731 | | | 40 | % |
| Professional services and other | 331 | | | 256 | | | 29 | % |
| Total cost of revenues | $ | 1,353 | | | $ | 987 | | | 37 | % |
| Gross profit percentage: | | | | | |
| Subscription | 82 | % | | 83 | % | | |
| Professional services and other | (2) | % | | (10) | % | | |
| Total gross profit percentage | 77 | % | | 78 | % | | |
| | | | | |
| Gross profit: | $ | 4,543 | | | $ | 3,532 | | | 29 | % |
| | | | | |
| | | | | |
| | | | | |
| | | | | |
Cost of subscription revenues increased by $291 million for the year ended December 31, 2021, compared to the prior year, primarily due to increased headcount and increased costs to support the growth of our subscription offerings including costs to support customers in regulated markets. Personnel-related costs including stock-based compensation and overhead expenses increased by $123 million as compared to prior year. Depreciation expense related to data center hardware and software and maintenance costs to support the expansion of our data center capacity including public cloud service costs increased by $141 million and amortization of intangibles increased by $29 million as a result of acquisitions as compared to the prior year.
We expect our cost of subscription revenues for the year ending December 31, 2022 to increase in absolute dollars as we provide subscription services to more customers and increase usage within our customer instances but slightly decrease as a percentage of revenue resulting from the change in estimated useful life of data center equipment from three to four years beginning in 2022.
Our subscription gross profit percentage was 82% and 83% for each of the years ended December 31, 2021 and 2020, respectively. We expect our subscription gross profit percentage to slightly increase for the year ended December 31, 2022 compared to the year ended December 31, 2021 driven by the change in estimated useful life of data center equipment from three to four years beginning in 2022. However, we will continue to incur incremental costs to attract customers in regulated markets by adopting public cloud offerings as well as increased support for customers impacted by new and evolving data residency requirements. To the extent future acquisitions are consummated, our cost of subscription revenues may increase due to additional non-cash charges associated with the amortization of intangible assets acquired.
Cost of professional services and other revenues increased by $75 million for the year ended December 31, 2021 as compared to the prior year. The increase was primarily due to increased headcount to support growth resulting in an increase in personnel-related costs including stock-based compensation and overhead expenses by $55 million and an increase in outside service costs by $20 million compared to prior period.
Our professional services and other gross loss percentage improved to 2% for the year ended December 31, 2021, compared to 10% in the prior year, primarily driven by the increased utilization of our internal professional services organization and the reduction in certain travel expenses. However, we expect our professional services and other gross loss percentage to worsen for the year ending December 31, 2022 as we expect additional cost to support business growth and increases in travel expenses compared to the year ended December 31, 2021.
Sales and Marketing
| | | | | | | | | | | | | | | | | |
| | Year Ended December 31, | | % Change |
| | 2021 | | 2020 | |
| | | | | |
| | (dollars in millions) | | |
| Sales and marketing | $ | 2,292 | | | $ | 1,855 | | | 24 | % |
| Percentage of revenues | 39 | % | | 41 | % | | |
| | | | | |
Sales and marketing expenses increased by $437 million for the year ended December 31, 2021, compared to the prior year. The increase was primarily due to increased headcount resulting in an increase in personnel-related costs including stock-based compensation and overhead expenses of $329 million, compared to the prior year. Amortization of deferred commissions and third-party referral fees increased by $79 million, compared to the prior year, due to an increase in contracts with new customers, expansion and renewal contracts. Other sales and marketing program expenses, which include branding, purchase of advertising and market data and outside services, increased by $29 million compared to the prior year. We converted certain in-person events to digital events in the first half of 2021 amid COVID-19 travel restrictions which resulted in certain savings for the year ended December 31, 2021 compared to the same period in the prior year.
We expect sales and marketing expenses for the year ending December 31, 2022 to increase in absolute dollars, but remain relatively flat as a percentage of revenue compared to the year ended December 31, 2021, as we continue to see leverage from increased sales productivity and marketing efficiencies offset by growth in our international operations and increases in travel expenses in 2022.
Research and Development | | | | | | | | | | | | | | | | | |
| | Year Ended December 31, | | % Change |
| | 2021 | | 2020 | |
| | | | | |
| | (dollars in millions) | | |
| Research and development | $ | 1,397 | | | $ | 1,024 | | | 36 | % |
| Percentage of revenues | 24 | % | | 23 | % | | |
| | | | | |
Research and development expenses increased by $373 million during the year ended December 31, 2021, compared to the prior year. The increase was primarily due to increased headcount resulting in an increase in personnel-related costs including stock-based compensation and overhead expenses of $346 million compared to prior year. The remaining increase was primarily due to $22 million increase in outside services and hosting costs and data center related depreciation costs to support research and development activities.
We expect research and development expenses for the year ending December 31, 2022 to increase in absolute dollars, but remain relatively flat as a percentage of revenue compared to the year ended December 31, 2021, as we continue to improve the existing functionality of our services, develop new applications to fill market needs and enhance our core platform.
General and Administrative
| | | | | | | | | | | | | | | | | |
| | Year Ended December 31, | | % Change |
| | 2021 | | 2020 | |
| | | | | |
| | (dollars in millions) | | |
| General and administrative | $ | 597 | | | $ | 454 | | | 31 | % |
| Percentage of revenues | 10 | % | | 10 | % | | |
| | | | | |
General and administrative expenses increased by $143 million during the year ended December 31, 2021, compared to the prior year. The increase was primarily due to increased headcount resulting in an increase in personnel-related costs including stock-based compensation and overhead expenses of $113 million. The remaining increase was primarily due to $21 million of outside service costs to support digital transformation projects across functions to improve processes as we scale as well as incremental investment in environmental, social and corporate governance initiatives (“ESG”).
We expect general and administrative expenses for the year ending December 31, 2022 to increase in absolute dollars but remain relatively flat as a percentage of revenue compared to the year ended December 31, 2021, as we continue to see leverage from continued G&A productivity, offset by higher stock-based compensation related to the 2021 Performance Awards, increased investment in cyber security and our ESG efforts.
Stock-based Compensation
| | | | | | | | | | | | | | | | | |
| | Year Ended December 31, | | % Change |
| | 2021 | | 2020 | |
| | | | | |
| | (dollars in millions) | | |
| Cost of revenues: | | | | | |
| Subscription | $ | 128 | | | $ | 98 | | | 31 | % |
| Professional services and other | 59 | | | 52 | | | 13 | % |
| Sales and marketing | 389 | | | 320 | | | 22 | % |
| Research and development | 395 | | | 282 | | | 40 | % |
| General and administrative | 160 | | | 118 | | | 36 | % |
| Total stock-based compensation | $ | 1,131 | | | $ | 870 | | | 30 | % |
| Percentage of revenues | 19 | % | | 19 | % | | |
Stock-based compensation increased by $261 million during the year ended December 31, 2021, compared to the prior year, primarily due to additional grants to current and new employees and increased weighted-average grant date fair value of stock awards.
Stock-based compensation is inherently difficult to forecast due to fluctuations in our stock price. Based upon our stock price as of December 31, 2021, we expect stock-based compensation to continue to increase in absolute dollars for the year ending December 31, 2022 as we continue to issue stock-based awards to our employees, but remain relatively flat as a percentage of revenue compared to the year ended December 31, 2021. We expect stock-based compensation as a percentage of revenue to decline over time as we continue to grow.
Foreign Currency Exchange
Our international operations have provided and will continue to provide a significant portion of our total revenues. Revenues outside North America represented 36% and 35% of total revenues for the years ended December 31, 2021 and 2020, respectively. Because we primarily transact in foreign currencies for sales outside of the United States, the general weakening of the U.S. Dollar relative to other major foreign currencies (primarily the Euro and British Pound Sterling) during the year ended December 31, 2021 had a favorable impact on our revenues. For entities reporting in currencies other than the U.S. Dollar, if we had translated our results for the year ended December 31, 2021 at the exchange rates in effect for the year ended December 31, 2020 rather than the actual exchange rates in effect during the period, our reported subscription revenues would have been $77 million lower. The impact from the foreign currency movements was not material for professional services and other revenues for the year ended December 31, 2021.
In addition, because we primarily transact in foreign currencies for cost of revenues and operating expenses outside of the United States, the general weakening of the U.S. Dollar relative to other major foreign currencies had an unfavorable impact on our cost of revenue and sales and marketing expense during the year ended December 31, 2021. For entities reporting in currencies other than the U.S. Dollar, if we had translated our results for the year ended December 31, 2021 at the exchange rates in effect for the year ended December 31, 2020 rather than the actual exchange rates in effect during the period, our reported cost of revenues and sales and marketing expenses would have been $22 million and $25 million lower for the year ended December 31, 2021, respectively. The impact from the foreign currency movements from the year ended December 31, 2020 to the year ended December 31, 2021 was not material to research and development and general and administrative expenses.
Interest Expense
| | | | | | | | | | | | | | | | | |
| Year Ended December 31, | | % Change |
| 2021 | | 2020 | |
| | | | | |
| (dollars in millions) | | |
| Interest expense | $ | (28) | | | $ | (33) | | | (15 | %) |
| Percentage of revenues | — | % | | (1 | %) | | |
Interest expense decreased during the year ended December 31, 2021, compared to the prior year, due to the decrease in amortization expense of debt discount and issuance costs as a result of lower outstanding principal balance of the 2022 Notes. For the year ending December 31, 2022, we expect to incur approximately $25 million related to the 2030 Notes and 2022 Notes.
Other Income (Expense), net
| | | | | | | | | | | | | | | | | |
| | Year Ended December 31, | | % Change |
| | 2021 | | 2020 | |
| | | | | |
| | (dollars in millions) | | |
| Interest income | $ | 20 | | | $ | 39 | | | (49) | % |
| | | | | |
| Loss on extinguishment of 2022 Notes | (3) | | | (47) | | | 94 | % |
| Other | 3 | | | (8) | | | 138 | % |
| Other income (expense), net | $ | 20 | | | $ | (16) | | | 225 | % |
| | | | | |
Other income (expense), net increased by $36 million during the year ended December 31, 2021, compared to the prior year, primarily driven by the lower loss on extinguishment of the 2022 Notes due primarily to the 2022 Notes Repurchase which occurred in 2020 and a larger amount of early conversions of the 2022 Notes and lower foreign currency exchange losses, mainly offset by a decrease in interest income resulting from the decline in interest rates.
To mitigate our risks associated with fluctuations in foreign currency exchange rates, we enter into foreign currency derivative contracts with maturities of 12 months or less to hedge a portion of our net outstanding monetary assets and liabilities. These hedging contracts may reduce, but cannot entirely eliminate, the impact of adverse currency exchange rate movements.
Provision for (benefit from) Income Taxes
| | | | | | | | | | | | | | | | | |
| | Year Ended December 31, | | % Change |
| | 2021 | | 2020 | |
| | | | | |
| | (dollars in millions) | | |
| Income before income taxes | $ | 249 | | | $ | 150 | | | 66 | % |
| Provision for (benefit from) income taxes | 19 | | | 31 | | | (39 | %) |
| Effective tax rate | 8 | % | | 21 | % | | (62) | % |
Our effective tax rate was 8% and 21% for the years ended December 31, 2021 and December 31, 2020. The difference in rates was primarily attributable to the mix of earnings and losses in foreign jurisdictions with differing tax rates, including a revaluation of our deferred taxes to account for a change in the United Kingdom tax rate, and a partial valuation allowance release related to acquired Lightstep, Inc. deferred tax liabilities. See Note 16 in the notes to our consolidated financial statements included elsewhere in this Annual Report on Form 10-K for our reconciliation of income taxes at the statutory federal rate to the provision for (benefit from) income taxes.
We maintained a full valuation allowance on our U.S. federal and state deferred tax assets as of December 31, 2021 and 2020, respectively. The significant components of the tax expense recorded are current cash taxes payable in various jurisdictions. The cash tax expenses are impacted by each jurisdiction’s individual tax rates, laws on timing of recognition of income and deductions, and availability of net operating losses and tax credits. Given the full valuation allowance on our U.S. federal and state deferred tax assets, sensitivity of current cash taxes to local rules and our foreign structuring, we expect that our effective tax rate could fluctuate significantly on a quarterly basis and could be adversely affected to the extent earnings are lower than anticipated in countries that have lower statutory rates and higher than anticipated in countries that have higher statutory rates. To the extent sufficient positive evidence becomes available, we may release all or a portion of our valuation allowance in one or more future periods. A release of the valuation allowance, if any, would result in the recognition of certain deferred tax assets and a material income tax benefit for the period in which such release is recorded.
Liquidity and Capital Resources
We generate cash inflows from operations primarily from selling subscription services which are generally paid in advance of provisioning services, and cash outflows to develop new services and core technologies that further enhance the Now Platform, engage our customer and enhance their experience, and enable and transform our business operations. Subscription services arrangements typically have a three-year duration, and we have experienced a renewal rate of 98% over the last three years. Cash outflows from operations are principally comprised of the salaries, bonuses, commissions, and benefits for our workforce; licenses and services arrangements that are integral to our business operations and data centers; and operating lease arrangements that underlie our facilities. We have generated positive operating cash flows over the last ten years as we continue to grow our business in pursuit of our business strategy, and we expect to grow our business and generate positive cash flows from operations during 2022. When assessing sources of liquidity, we also include cash and cash equivalents, short-term investments and long-term investments totaling $4.9 billion as of December 31, 2021.
Our working capital requirements are principally comprised of non-contract workforce salaries, bonuses, commissions, and benefits and, to a lesser extent, cancellable and non-cancelable licenses and services arrangements that are integral to our business operations, and operating lease obligations. Non-cancelable purchase commitments for business operations total $383 million as of December 31, 2021, due primarily over the next five years. In addition. we expect payment for the investment in Celonis SE of $100 million in the first quarter of 2022. Operating lease obligations totaling $741 million are principally associated with leased facilities and have varying maturities with $418 million due over the next five years.
To grow our business, we also invest in capital and expand our facilities to enable our data centers and workforce and consider strategic acquisitions of technology and businesses to supplement our technology portfolio. Our capital expenditures are typically under cancelable arrangements primarily used to support the installed base and growth of our hosted business. We have also issued long-term debt to finance our business. In August 2020, we issued 1.40% fixed rate ten-year notes with an aggregate principal amount of $1.5 billion due on September 1, 2030 (the “2030 Notes”). In May and June 2017, we issued the 2022 Notes with an aggregate principal amount of $782.5 million. The remaining principal amount of the 2022 Notes, totaling $92 million, will be settled in cash during the first half of 2022.
Our free cash flows, together with our other sources of liquidity, are available to service our liabilities as well as our cancellable and non-cancellable arrangements. We anticipate cash flows generated from operations, cash, cash equivalents and investments will be sufficient to meet our liquidity needs for at least the next 12 months. As we look beyond the next 12 months, we seek to continue to grow free cash flows necessary to fund our operations and grow our business. If we require additional capital resources, we may seek to finance our operations from the current funds available or additional equity or debt financing.
| | | | | | | | | | | |
| | Year Ended December 31, |
| | 2021 | | 2020 |
| | | |
| | (in millions) |
| Net cash provided by operating activities | $ | 2,191 | | | $ | 1,786 | |
| Net cash used in investing activities | (1,607) | | | (1,507) | |
| Net cash provided by (used in) financing activities | (506) | | | 597 | |
| Net increase in cash, cash equivalents and restricted cash | 53 | | | 901 | |
Operating Activities
Net cash provided by operating activities was $2.2 billion for the year ended December 31, 2021 compared to $1.8 billion for the prior year. The net increase in operating cash flow was primarily due to increase in operating income and higher collections driven by revenue growth compared to settlement of payables. In addition, we benefited from a reduction in repayments of 2022 Notes attributable to debt discount.
Investing Activities
Net cash used in investing activities for the year ended December 31, 2021 was $1.6 billion compared to $1.5 billion for the prior year. The net increase in cash used in investing activities was primarily due to $678 million increase in business combinations, net of cash and restricted cash acquired, and $59 million purchase of new strategic investments offset by $586 million decrease in net purchases of investments.
Financing Activities
Net cash used in financing activities for the year ended December 31, 2021 was $506 million compared to net provided by financing activities of $597 million for the prior year. The change was primarily driven by the $1.5 billion proceeds from the issuance of 2030 Notes in the year ended December 31, 2020, offset by the 2022 Notes Repurchase of $1.6 billion which was funded in part by the proceeds received from the partial unwind of the 2022 Note hedge of $1.1 billion. The remaining change was due to $103 million increase in taxes paid related to net share settlement of equity awards offset by $21 million increase in proceeds from employee equity plans primarily driven by higher share price compared to prior year.
Contractual Obligations and Commitments
Our estimated future obligations consist of leases, an agreement to purchase $100 million of common and preferred shares in Celonis SE, purchase obligations, debt and unrecognized tax benefits as of December 31, 2021. Refer to Note 17 “Commitments and Contingencies” and Note 19 “Subsequent Events” to our consolidated financial statements included in this Annual Report on Form 10-K for more information.
| | | | | |
| ITEM 7A. | QUALITATIVE AND QUANTITATIVE DISCLOSURES ABOUT MARKET RISK
|
Foreign Currency Exchange Risk
We have foreign currency risks related to our revenue and operating expenses denominated in currencies other than the U.S. Dollar, primarily the Euro and British Pound Sterling. We are a net receiver of Euro and British Pound Sterling, and therefore benefit from a weakening of the U.S. Dollar relative to these currencies and, conversely, are adversely affected by a strengthening of the U.S. Dollar relative to these currencies. Revenues denominated in U.S. Dollar as a percentage of total revenues was 70% during the year ended December 31, 2021 and 71% for each of the years ended December 31, 2020 and 2019, respectively.
To mitigate our risks associated with fluctuations in foreign currency exchange rates, we enter into foreign currency derivative contracts to hedge a portion of our net outstanding monetary assets and liabilities. These derivative contracts are intended to offset gains or losses related to remeasuring monetary assets and liabilities that are denominated in currencies other than the functional currency of the entities in which they are recorded.
A hypothetical 10% increase in the U.S. Dollar against other currencies would have resulted in a decrease in operating income of $62 million, $47 million and $31 million for the years ended December 31, 2021, 2020 and 2019, respectively. This analysis disregards the possibilities that rates can move in opposite directions and that losses from one geographic area may be offset by gains from another geographic area.
These derivative contracts expose us to credit risk to the extent that the counterparties may be unable to meet the terms of the arrangement. We mitigate this credit risk by transacting with major financial institutions with high credit ratings and entering into master netting arrangements, which permit net settlement of transactions with the same counterparty. While the contract or notional amount is often used to express the volume of foreign currency derivative contracts, the amounts potentially subject to credit risk are generally limited to the amounts, if any, by which the counterparties’ obligations under the agreements exceed our obligations to the counterparties. We are not required to pledge, and are not entitled to receive, cash collateral related to these derivative instruments. We do not enter into derivative contracts for trading or speculative purposes. Refer to Note 8 in the notes to our consolidated financial statements included elsewhere in this Annual Report on Form 10-K for additional information.
Interest Rate Sensitivity
We had an aggregate of $4.9 billion in cash, cash equivalents, short-term investments and long-term investments as of December 31, 2021. This amount was invested primarily in money market funds, certificates of deposit, corporate notes and bonds, government and agency securities and other debt securities with a minimum rating of BBB by Standard & Poor’s, Baa2 by Moody’s, or BBB by Fitch. The primary objectives of our investment activities are the preservation of capital and support of our liquidity requirements. Our investments are exposed to market risk due to fluctuations in interest rates, which may affect our interest income and the fair market value of our investments.
A hypothetical 100 basis point increase in interest rates would have resulted in an approximate $30 million decline of the fair value of our available-for-sale securities. This estimate is based on a sensitivity model that measures market value changes when changes in interest rates occur.
As of December 31, 2020, we had an aggregate of $4.6 billion in cash, cash equivalents, short-term investments and long-term investments, and a hypothetical 100 basis point increase in interest rates would have resulted in an approximate $29 million decline of the fair value of our available-for-sale securities.
Market Risk
In August 2020, we issued 1.40% fixed rate ten-year notes with an aggregate principal amount of $1.5 billion due on September 1, 2030. The 2030 Notes were issued at 99.63% of principal and we incurred approximately $13 million for debt issuance costs. Interest is payable semi-annually in arrears on March 1 and September 1 of each year, beginning on March 1, 2021, and the entire outstanding principal amount is due at maturity on September 1, 2030. The 2030 Notes are unsecured obligations and the indentures governing the 2030 Notes contain customary events of default and covenants that, among others and subject to exceptions, restrict the Company’s ability to incur or guarantee debt secured by liens on specified assets or enter into sale and lease-back transactions with respect to specified properties.
In May and June 2017, we issued the 2022 Notes with an aggregate principal amount of $782.5 million. We carry these instruments at face value less unamortized discount on our consolidated balance sheet. Because these instruments do not bear interest, we have no economic interest rate exposure on our 2022 Notes associated with changes in interest rates. However, the fair value of our 2022 Notes is exposed to interest rate risks. Generally, the fair market value of our 2022 Notes will increase as interest rates fall and decrease as interest rates rise. In addition, the fair value of the 2022 Notes is affected by our stock price due to the conversion feature and will generally increase as the stock price increases.
We hold cash balances with multiple financial institutions in various countries and these balances routinely exceed deposit insurance limits.
As of December 31, 2021 and 2020, we had $99 million and $28 million, respectively, of equity investments in privately-held companies that are in the development stage. The fair value of these strategic investments may fluctuate depending on the financial condition and near-term prospects of these companies, and we may be required to record an impairment charge if the carrying value of these investments exceed their fair value. We are required to measure equity securities at fair value with changes in fair value recognized through our consolidated statements of comprehensive income. As a result, we anticipate additional volatility to our consolidated statements of comprehensive income in future periods as we continue to strategically invest and grow the portfolio, due to the valuation and timing of observable price changes of our investments in privately held securities. These changes could be material based on market conditions and events.
| | | | | |
| ITEM 8. | CONSOLIDATED FINANCIAL STATEMENTS AND SUPPLEMENTARY DATA |
SERVICENOW, INC.
INDEX TO CONSOLIDATED FINANCIAL STATEMENTS
| | | | | |
| | Page |
| |
| |
| Consolidated Financial Statements | |
| |
| |
| |
| |
| |
| |
| |
| |
| |
| |
Report of Independent Registered Public Accounting Firm
To the Board of Directors and Stockholders of ServiceNow, Inc.
Opinions on the Financial Statements and Internal Control over Financial Reporting
We have audited the accompanying consolidated balance sheets of ServiceNow, Inc. and its subsidiaries (the “Company”) as of December 31, 2021 and 2020, and the related consolidated statements of comprehensive income, of stockholders’ equity and of cash flows for each of the three years in the period ended December 31, 2021, including the related notes (collectively referred to as the “consolidated financial statements”). We also have audited the Company's internal control over financial reporting as of December 31, 2021, based on criteria established in Internal Control - Integrated Framework (2013) issued by the Committee of Sponsoring Organizations of the Treadway Commission (COSO).
In our opinion, the consolidated financial statements referred to above present fairly, in all material respects, the financial position of the Company as of December 31, 2021 and 2020, and the results of its operations and its cash flows for each of the three years in the period ended December 31, 2021 in conformity with accounting principles generally accepted in the United States of America. Also in our opinion, the Company maintained, in all material respects, effective internal control over financial reporting as of December 31, 2021, based on criteria established in Internal Control - Integrated Framework (2013) issued by the COSO.
Basis for Opinions
The Company's management is responsible for these consolidated financial statements, for maintaining effective internal control over financial reporting, and for its assessment of the effectiveness of internal control over financial reporting, included in Management’s Report on Internal Control Over Financial Reporting appearing under Item 9A. Our responsibility is to express opinions on the Company’s consolidated financial statements and on the Company's internal control over financial reporting based on our audits. We are a public accounting firm registered with the Public Company Accounting Oversight Board (United States) (PCAOB) and are required to be independent with respect to the Company in accordance with the U.S. federal securities laws and the applicable rules and regulations of the Securities and Exchange Commission and the PCAOB.
We conducted our audits in accordance with the standards of the PCAOB. Those standards require that we plan and perform the audits to obtain reasonable assurance about whether the consolidated financial statements are free of material misstatement, whether due to error or fraud, and whether effective internal control over financial reporting was maintained in all material respects.
Our audits of the consolidated financial statements included performing procedures to assess the risks of material misstatement of the consolidated financial statements, whether due to error or fraud, and performing procedures that respond to those risks. Such procedures included examining, on a test basis, evidence regarding the amounts and disclosures in the consolidated financial statements. Our audits also included evaluating the accounting principles used and significant estimates made by management, as well as evaluating the overall presentation of the consolidated financial statements. Our audit of internal control over financial reporting included obtaining an understanding of internal control over financial reporting, assessing the risk that a material weakness exists, and testing and evaluating the design and operating effectiveness of internal control based on the assessed risk. Our audits also included performing such other procedures as we considered necessary in the circumstances. We believe that our audits provide a reasonable basis for our opinions.
Definition and Limitations of Internal Control over Financial Reporting
A company’s internal control over financial reporting is a process designed to provide reasonable assurance regarding the reliability of financial reporting and the preparation of financial statements for external purposes in accordance with generally accepted accounting principles. A company’s internal control over financial reporting includes those policies and procedures that (i) pertain to the maintenance of records that, in reasonable detail, accurately and fairly reflect the transactions and dispositions of the assets of the company; (ii) provide reasonable assurance that transactions are recorded as necessary to permit preparation of financial statements in accordance with generally accepted accounting principles, and that receipts and expenditures of the company are being made only in accordance with authorizations of management and directors of the company; and (iii) provide reasonable assurance regarding prevention or timely detection of unauthorized acquisition, use, or disposition of the company’s assets that could have a material effect on the financial statements.
Because of its inherent limitations, internal control over financial reporting may not prevent or detect misstatements. Also, projections of any evaluation of effectiveness to future periods are subject to the risk that controls may become inadequate because of changes in conditions, or that the degree of compliance with the policies or procedures may deteriorate.
Critical Audit Matters
The critical audit matter communicated below is a matter arising from the current period audit of the consolidated financial statements that was communicated or required to be communicated to the audit committee and that (i) relates to accounts or disclosures that are material to the consolidated financial statements and (ii) involved our especially challenging, subjective, or complex judgments. The communication of critical audit matters does not alter in any way our opinion on the consolidated financial statements, taken as a whole, and we are not, by communicating the critical audit matter below, providing a separate opinion on the critical audit matter or on the accounts or disclosures to which it relates.
Subscription revenue recognition - customer contracts with multiple performance obligations
As described in Note 2 to the consolidated financial statements, the Company enters into contracts that can include various combinations of products and services, which are generally capable of being distinct and accounted for as separate performance obligations. Subscription revenues include self-hosted offerings in which customers deploy, or the Company grants customers the option to deploy without significant penalty, the Company’s subscription services internally or contract with a third party to host the software. For these contracts, management accounts for the software element separately from the related support and updates as they are distinct performance obligations. The transaction price allocated to the software element is recognized when transfer of control of the software to the customer is complete. The transaction price allocated to the related support and updates are recognized ratably over the contract term. As disclosed by management, evaluating the terms and conditions included within the Company’s customer contracts for appropriate revenue recognition and determining whether products and services are considered distinct performance obligations that should be accounted for separately versus together may require significant judgment. The Company recognized subscription revenues of $5.6 billion for the year ended December 31, 2021.
The principal consideration for our determination that performing procedures relating to subscription revenue recognition for customer contracts with multiple performance obligations is a critical audit matter is the matter involved significant audit effort in performing procedures related to management’s identification of distinct performance obligations.
Addressing the matter involved performing procedures and evaluating audit evidence in connection with forming our overall opinion on the consolidated financial statements. These procedures included testing the effectiveness of controls relating to the revenue recognition process, including controls over the identification of performance obligations and evaluation of the terms and conditions within the customer contracts for appropriate revenue recognition. These procedures also included, among others, testing management’s process for identifying distinct performance obligations and evaluating the terms and conditions within the customer contracts by examining the customer contracts on a test basis for appropriate revenue recognition.
/s/ PricewaterhouseCoopers LLP
San Jose, California
February 3, 2022
We have served as the Company’s auditor since 2011.
SERVICENOW, INC.
CONSOLIDATED BALANCE SHEETS
(in millions, except number of shares which are reflected in thousands and per share data)
| | | | | | | | | | | |
| December 31, |
| | 2021 | | 2020 |
| Assets | | | |
| Current assets: | | | |
| Cash and cash equivalents | $ | 1,728 | | | $ | 1,677 | |
| Short-term investments | 1,576 | | | 1,415 | |
| Accounts receivable, net | 1,390 | | | 1,009 | |
| Current portion of deferred commissions | 303 | | | 229 | |
| Prepaid expenses and other current assets | 223 | | | 192 | |
| | | |
| Total current assets | 5,220 | | | 4,522 | |
| Deferred commissions, less current portion | 623 | | | 444 | |
| Long-term investments | 1,630 | | | 1,468 | |
| Property and equipment, net | 766 | | | 660 | |
| Operating lease right-of-use assets | 591 | | | 454 | |
| Intangible assets, net | 287 | | | 153 | |
| Goodwill | 777 | | | 241 | |
| Deferred tax assets | 692 | | | 673 | |
| Other assets | 212 | | | 100 | |
| Total assets | $ | 10,798 | | | $ | 8,715 | |
| Liabilities and Stockholders’ Equity | | | |
| Current liabilities: | | | |
| Accounts payable | $ | 89 | | | $ | 34 | |
| Accrued expenses and other current liabilities | 850 | | | 668 | |
| Current portion of deferred revenue | 3,836 | | | 2,963 | |
| Current portion of operating lease liabilities | 82 | | | 72 | |
| Current debt, net | 92 | | | — | |
| | | |
| Total current liabilities | 4,949 | | | 3,737 | |
| Deferred revenue, less current portion | 63 | | | 45 | |
| | | |
| Operating lease liabilities, less current portion | 556 | | | 423 | |
| Long-term debt, net | 1,484 | | | 1,640 | |
| Other long-term liabilities | 51 | | | 36 | |
| Total liabilities | 7,103 | | | 5,881 | |
| Commitments and contingencies | | | |
| Stockholders’ equity: | | | |
Preferred stock, $0.001 par value; 10,000 shares authorized; no shares issued or outstanding | — | | | — | |
Common stock $0.001 par value; 600,000 shares authorized; 199,608 and 195,845 shares issued and outstanding at December 31,2021 and 2020, respectively | — | | | — | |
| Additional paid-in capital | 3,665 | | | 2,974 | |
| Accumulated other comprehensive income | 34 | | | 94 | |
| Accumulated deficit | (4) | | | (234) | |
| Total stockholders’ equity | 3,695 | | | 2,834 | |
| Total liabilities and stockholders’ equity | $ | 10,798 | | | $ | 8,715 | |
See accompanying notes to consolidated financial statements
SERVICENOW, INC.
CONSOLIDATED STATEMENTS OF COMPREHENSIVE INCOME
(in millions, except number of shares which are reflected in thousands and per share data)
| | | | | | | | | | | | | | | | | |
| | Year Ended December 31, |
| | 2021 | | 2020 | | 2019 |
| Revenues: | | | | | |
| Subscription | $ | 5,573 | | | $ | 4,286 | | | $ | 3,255 | |
| Professional services and other | 323 | | | 233 | | | 205 | |
| Total revenues | 5,896 | | | 4,519 | | | 3,460 | |
Cost of revenues (1): | | | | | |
| Subscription | 1,022 | | | 731 | | | 549 | |
| Professional services and other | 331 | | | 256 | | | 247 | |
| Total cost of revenues | 1,353 | | | 987 | | | 796 | |
| Gross profit | 4,543 | | | 3,532 | | | 2,664 | |
Operating expenses (1): | | | | | |
| Sales and marketing | 2,292 | | | 1,855 | | | 1,534 | |
| Research and development | 1,397 | | | 1,024 | | | 749 | |
| General and administrative | 597 | | | 454 | | | 339 | |
| | | | | |
| Total operating expenses | 4,286 | | | 3,333 | | | 2,622 | |
| Income from operations | 257 | | | 199 | | | 42 | |
| Interest expense | (28) | | | (33) | | | (33) | |
| Other income (expense), net | 20 | | | (16) | | | 58 | |
| Income before income taxes | 249 | | | 150 | | | 67 | |
| Provision for (benefit from) income taxes | 19 | | | 31 | | | (560) | |
| Net income | $ | 230 | | | $ | 119 | | | $ | 627 | |
| Net income per share - basic | $ | 1.16 | | | $ | 0.61 | | | $ | 3.36 | |
| Net income per share - diluted | $ | 1.13 | | | $ | 0.59 | | | $ | 3.18 | |
| Weighted-average shares used to compute net income per share - basic | 198,094 | | | 193,096 | | | 186,466 | |
| Weighted-average shares used to compute net income per share - diluted | 203,167 | | | 202,478 | | | 197,223 | |
| Other comprehensive income (loss): | | | | | |
| Foreign currency translation adjustments | $ | (41) | | | $ | 66 | | | $ | 20 | |
| Unrealized gains (losses) on investments, net of tax | (19) | | | 3 | | | 9 | |
| | | | | |
| Other comprehensive income (loss) | (60) | | | 69 | | | 29 | |
| Comprehensive income | $ | 170 | | | $ | 188 | | | $ | 656 | |
(1)Includes stock-based compensation as follows:
| | | | | | | | | | | | | | | | | |
| | Year Ended December 31, |
| | 2021 | | 2020 | | 2019 |
| Cost of revenues: | | | | | |
| Subscription | $ | 128 | | | $ | 98 | | | $ | 73 | |
| Professional services and other | 59 | | | 52 | | | 43 | |
| Operating expenses: | | | | | |
| Sales and marketing | 389 | | | 320 | | | 268 | |
| Research and development | 395 | | | 282 | | | 195 | |
| General and administrative | 160 | | | 118 | | | 83 | |
See accompanying notes to consolidated financial statements
SERVICENOW, INC.
CONSOLIDATED STATEMENTS OF STOCKHOLDERS’ EQUITY
(in millions, except number of shares which are reflected in thousands)
| | | | | | | | | | | | | | | | | | | | | | | | | | | | | | | | | | | |
| | Common Stock | | Additional
Paid-in
Capital | | Accumulated Deficit | | Accumulated
Other
Comprehensive Income (Loss) | | Total
Stockholders’
Equity |
| | Shares | | Amount | |
| Balance at December 31, 2018 | 180,175 | | | $ | — | | | $ | 2,094 | | | $ | (980) | | | $ | (4) | | | $ | 1,110 | |
| Common stock issued under employee stock plans | 5,003 | | | — | | | 108 | | | — | | | — | | | 108 | |
| Taxes paid related to net share settlement of equity awards | — | | | — | | | (410) | | | — | | | — | | | (410) | |
| Stock-based compensation | — | | | — | | | 663 | | | — | | | — | | | 663 | |
| Settlement of 2018 Warrants | 4,283 | | | — | | | — | | | — | | | — | | | — | |
| Other comprehensive income, net of tax | — | | | — | | | — | | | — | | | 29 | | | 29 | |
| Net income | — | | | — | | | — | | | 627 | | | — | | | 627 | |
| Balance at December 31, 2019 | 189,461 | | | $ | — | | | $ | 2,455 | | | $ | (353) | | | $ | 25 | | | $ | 2,127 | |
| | | | | | | | | | | |
| Common stock issued under employee stock plans | 4,099 | | | — | | | 152 | | | — | | | — | | | 152 | |
| Taxes paid related to net share settlement of equity awards | — | | | — | | | (509) | | | — | | | — | | | (509) | |
| Stock-based compensation | — | | | — | | | 874 | | | — | | | — | | | 874 | |
| Settlement of 2022 Warrants | 2,285 | | | — | | | — | | | — | | | — | | | — | |
| Settlement of 2022 Notes conversion feature | — | | | — | | | (1,377) | | | — | | | — | | | (1,377) | |
| Benefit from exercise of 2022 Note Hedge | — | | | — | | | 1,379 | | | — | | | — | | | 1,379 | |
| Other comprehensive income, net of tax | — | | | — | | | — | | | — | | | 69 | | | 69 | |
| Net income | — | | | — | | | — | | | 119 | | | | | 119 | |
| Balance at December 31, 2020 | 195,845 | | | $ | — | | | $ | 2,974 | | | $ | (234) | | | $ | 94 | | | $ | 2,834 | |
| | | | | | | | | | | |
| Common stock issued under employee stock plans | 3,227 | | | — | | | 168 | | | — | | | — | | | 168 | |
| Taxes paid related to net share settlement of equity awards | — | | | — | | | (612) | | | — | | | — | | | (612) | |
| Stock-based compensation | — | | | — | | | 1,130 | | | — | | | — | | | 1,130 | |
| Shares granted related to business combination | — | | | — | | | 6 | | | — | | | — | | | 6 | |
| Settlement of 2022 Warrants | 536 | | | — | | | — | | | — | | | — | | | — | |
| Settlement of 2022 Notes conversion feature | — | | | — | | | (225) | | | — | | | — | | | (225) | |
| Benefit from exercise of 2022 Note Hedge | — | | | — | | | 224 | | | — | | | — | | | 224 | |
| Other comprehensive loss, net of tax | — | | | — | | | — | | | — | | | (60) | | | (60) | |
| Net income | — | | | — | | | — | | | $ | 230 | | | — | | | 230 | |
| Balance at December 31, 2021 | 199,608 | | | $ | — | | | $ | 3,665 | | | $ | (4) | | | $ | 34 | | | $ | 3,695 | |
See accompanying notes to consolidated financial statements
SERVICENOW, INC.
CONSOLIDATED STATEMENTS OF CASH FLOWS
(in millions)
| | | | | | | | | | | | | | | | | |
| | Year Ended December 31, |
| | 2021 | | 2020 | | 2019 |
| Cash flows from operating activities: | | | | | |
| Net income | $ | 230 | | | $ | 119 | | | $ | 627 | |
| Adjustments to reconcile net income to net cash provided by operating activities: | | | | | |
| Depreciation and amortization | 472 | | | 336 | | | 252 | |
| | | | | |
| Amortization of deferred commissions | 294 | | | 218 | | | 168 | |
| Amortization of debt discount and issuance costs | 7 | | | 24 | | | 33 | |
| Stock-based compensation | 1,131 | | | 870 | | | 662 | |
| | | | | |
| Deferred income taxes | (34) | | | (24) | | | (576) | |
| | | | | |
| | | | | |
| | | | | |
| | | | | |
| | | | | |
| Repayments of convertible senior notes attributable to debt discount | (15) | | | (82) | | | — | |
| Loss on extinguishment of 2022 Notes | 3 | | | 47 | | | — | |
| Other | 45 | | | (2) | | | (8) | |
| Changes in operating assets and liabilities, net of effect of business combinations: | | | | | |
| Accounts receivable | (401) | | | (152) | | | (260) | |
| Deferred commissions | (565) | | | (365) | | | (255) | |
| Prepaid expenses and other assets | (93) | | | (55) | | | (30) | |
| Accounts payable | 55 | | | (34) | | | 21 | |
| Deferred revenue | 960 | | | 711 | | | 537 | |
| Accrued expenses and other liabilities | 102 | | | 175 | | | 65 | |
| Net cash provided by operating activities | 2,191 | | | 1,786 | | | 1,236 | |
| Cash flows from investing activities: | | | | | |
| Purchases of property and equipment | (392) | | | (419) | | | (265) | |
| Business combinations, net of cash acquired | (785) | | | (107) | | | (7) | |
| Purchases of intangibles | (7) | | | (13) | | | (73) | |
| Purchases of investments | (2,485) | | | (2,922) | | | (1,596) | |
| Purchases of strategic investments | (71) | | | (12) | | | — | |
| Sales and maturities of investments | 2,119 | | | 1,965 | | | 1,193 | |
| | | | | |
| Other | 14 | | | 1 | | | 23 | |
| Net cash used in investing activities | (1,607) | | | (1,507) | | | (725) | |
| Cash flows from financing activities: | | | | | |
| | | | | |
| | | | | |
| Net proceeds from borrowings on 2030 Notes | — | | | 1,482 | | | — | |
| Repayments of convertible senior notes attributable to principal | (61) | | | (1,628) | | | — | |
| Net proceeds from unwind of 2022 Note Hedge | — | | | 1,106 | | | — | |
| | | | | |
| | | | | |
| | | | | |
| Proceeds from employee stock plans | 167 | | | 146 | | | 108 | |
| Taxes paid related to net share settlement of equity awards | (612) | | | (509) | | | (410) | |
| | | | | |
| | | | | |
| Net cash provided by (used in) financing activities | (506) | | | 597 | | | (302) | |
| Foreign currency effect on cash, cash equivalents and restricted cash | (25) | | | 25 | | | — | |
| Net increase in cash, cash equivalents and restricted cash | 53 | | | 901 | | | 209 | |
| Cash, cash equivalents and restricted cash at beginning of period | 1,679 | | | 778 | | | 569 | |
| Cash, cash equivalents and restricted cash at end of period | $ | 1,732 | | | $ | 1,679 | | | $ | 778 | |
| Cash, cash equivalents and restricted cash at end of period: | | | | | |
| Cash and cash equivalents | $ | 1,728 | | | $ | 1,677 | | | $ | 776 | |
| Current portion of restricted cash included in prepaid expenses and other current assets | 4 | | | 2 | | | 2 | |
| Total cash, cash equivalents and restricted cash shown in the consolidated statement of cash flows | $ | 1,732 | | | $ | 1,679 | | | $ | 778 | |
| Supplemental disclosures of other cash flow information: | | | | | |
| Interest paid | $ | 41 | | | $ | — | | | $ | — | |
| Income taxes paid, net of refunds | $ | 36 | | | $ | 39 | | | $ | 20 | |
| Non-cash investing and financing activities: | | | | | |
| | | | | |
| | | | | |
| Settlement of 2022 Notes conversion feature | $ | 225 | | | $ | 275 | | | $ | — | |
| Benefit from exercise of 2022 Note Hedge | $ | 224 | | | $ | 273 | | | $ | — | |
| Property and equipment included in accounts payable and accrued expenses | $ | 63 | | | $ | 35 | | | $ | 57 | |
| | | | | |
| | | | | |
| | | | | |
See accompanying notes to consolidated financial statements
SERVICENOW, INC.
NOTES TO CONSOLIDATED FINANCIAL STATEMENTS
Unless the context requires otherwise, references in this report to “ServiceNow,” the “Company,” “we,” “us,” and “our” refer to ServiceNow, Inc. and its consolidated subsidiaries.
(1) Description of the Business
ServiceNow was founded on a simple premise: a better technology platform will help work flow better. We help global enterprises across industries, universities and governments to digitize their workflows. We categorize the workflows we provide into four primary areas: IT, Employee, Customer and Creator. The products under each of our workflows help customers connect work across systems and silos to enable great experiences for people. The Now Platform is uniquely positioned to enable our customers’ digital transformation from non-integrated enterprise technology solutions with manual and disconnected processes and activities, to integrated enterprise technology solutions with automation and connected processes and activities which increases our customers’ resiliency and security and delivers additional value to their employees and consumers.
(2) Summary of Significant Accounting Policies
Principles of Consolidation
The accompanying consolidated financial statements have been prepared in conformity with U.S. Generally Accepted Accounting Principles (“GAAP”), and include our accounts and the accounts of our wholly-owned subsidiaries. All intercompany transactions and balances have been eliminated upon consolidation.
Use of Estimates
The preparation of consolidated financial statements in conformity with GAAP requires management to make certain estimates and assumptions. These estimates and assumptions affect the reported amounts of assets and liabilities and disclosure of contingent assets and liabilities at the date of the consolidated financial statements, as well as reported amounts of revenues and expenses during the reporting period. Such management estimates and assumptions include, but are not limited to, standalone selling price (“SSP”) for each distinct performance obligation included in customer contracts with multiple performance obligations, the period of benefit for deferred commissions, valuation of intangible assets, the useful life of property and equipment and identifiable intangible assets, stock-based compensation expense and income taxes. Actual results could differ from those estimates. We assessed the impact of COVID-19 on the estimates and assumptions and determined there was no material impact.
In January 2022, we completed an assessment of the useful life of our data center equipment and determined we should increase the estimated useful life of data center equipment from three to four years. This change in accounting estimate will be effective beginning fiscal year 2022.
Segments
Our chief operating decision maker allocates resources and assesses financial performance based upon discrete financial information at the consolidated level. There are no segment managers who are held accountable by the chief operating decision maker, or anyone else, for operations, operating results and planning for levels or components below the consolidated unit level. Accordingly, we have determined that we operate as a single operating and reportable segment.
Foreign Currency Translation and Transactions
The functional currencies for our foreign subsidiaries are primarily their respective local currencies. Assets and liabilities of the wholly-owned foreign subsidiaries are translated into U.S. Dollars at exchange rates in effect at each period end. Amounts classified in stockholders’ equity are translated at historical exchange rates. Revenues and expenses are translated at the average exchange rates during the period. The resulting translation adjustments are recorded in accumulated other comprehensive income as a component of stockholders’ equity. Foreign currency transaction gains and losses are included in other income (expense), net within the consolidated statements of comprehensive income, and have not been material for all periods presented.
Revenue Recognition
Revenues are recognized when control of services is transferred to our customers, in an amount that reflects the consideration we expect to be entitled to in exchange for those services.
Subscription revenues
Subscription revenues are primarily comprised of subscription fees that give customers access to the ordered subscription service, related support and updates, if any, to the subscribed service during the subscription term. We recognize subscription revenues ratably over the contract term beginning on the commencement date of each contract, which is the date we make our services available to our customers. Our contracts with customers typically include a fixed amount of consideration and are generally non-cancelable and without any refund-type provisions. We typically invoice our customers annually in advance for our subscription services upon execution of the initial contract or subsequent renewal, and our invoices are typically due within 30 days from the invoice date.
Subscription revenues also include revenues from self-hosted offerings in which customers deploy, or we grant customers the option to deploy without significant penalty, our subscription service internally or contract with a third party to host the software. For these contracts, we account for the software element separately from the related support and updates as they are distinct performance obligations. Refer to the discussion below related to contracts with multiple performance obligations for further details. The transaction price is allocated to separate performance obligations on a relative SSP basis. The transaction price allocated to the software element is recognized when transfer of control of the software to the customer is complete. The transaction price allocated to the related support and updates are recognized ratably over the contract term.
Professional services and other revenues
Our professional services arrangements are primarily on a time-and-materials basis, and we generally invoice our customers monthly in arrears for these professional services based on actual hours and expenses incurred. Some of our professional services arrangements are on a fixed fee or subscription basis. Professional services revenues are recognized as services are delivered. Other revenues consist of fees from customer training delivered on-site or through publicly available classes. Typical payment terms require our customers to pay us within 30 days of invoice.
Contracts with multiple performance obligations
We enter into contracts that can include various combinations of products and services, which are generally capable of being distinct and accounted for as separate performance obligations. We evaluate the terms and conditions included within our customer contracts to ensure appropriate revenue recognition, including whether products and services are considered distinct performance obligations that should be accounted for separately versus together. For contracts with multiple performance obligations, the transaction price is allocated to the separate performance obligations on a relative SSP basis. We determine SSP by considering the historical selling price of these performance obligations in similar transactions as well as other factors, including, but not limited to, competitive pricing of similar products, other software vendor pricing, industry publications and current pricing practices.
Contract balances
Unbilled receivables represent subscription revenues that are recognized upon delivery of the software prior to being invoiced. Unbilled receivables are primarily presented under prepaid expenses and other current assets on our consolidated balance sheets.
Deferred revenue consists primarily of payments received related to unsatisfied performance obligations at the end of the period. Once our services are available to customers, we record amounts due in accounts receivable and in deferred revenue. To the extent we bill customers in advance of the billing period commencement date, the accounts receivable and corresponding deferred revenue amounts are netted to zero on our consolidated balance sheets, unless such amounts have been paid as of the balance sheet date.
Customer deposits primarily relate to payments received from customers which could be refundable pursuant to the terms of the contract and are presented under accrued expenses and other current liabilities on our consolidated balance sheets.
Deferred Commissions
Deferred commissions are the incremental selling costs that are associated with acquiring customer contracts and consist primarily of sales commissions paid to our sales organization and referral fees paid to independent third parties. Deferred commissions also include the associated payroll taxes and fringe benefit costs associated with payments to our sales employees to the extent they are incremental. Commissions and referral fees earned upon the execution of initial and expansion contracts are primarily deferred and amortized over a period of benefit that we have determined to be five years. Commissions earned upon the renewal of customer contracts are deferred and amortized over the average renewal term. Additionally, for self-hosted offerings, consistent with the recognition of subscription revenue for self-hosted offerings, a portion of the commission cost is expensed upfront when the self-hosted offering is made available. We determine the period of benefit by taking into consideration our customer contracts, our technology life cycle and other factors. We include amortization of deferred commissions in sales and marketing expense in our consolidated statements of comprehensive income. There was no impairment loss in relation to the incremental selling costs capitalized for all periods presented.
Fair Value Measurements
Fair value is defined as the exchange price that would be received for an asset or paid to transfer a liability in the principal or most advantageous market for the asset or liability in an orderly transaction between market participants on the measurement date. We use a fair value hierarchy that is based on three levels of inputs, of which the first two are considered observable and the last unobservable. The three levels of the fair value hierarchy are as follows:
Level 1—Quoted prices (unadjusted) in active markets for identical assets or liabilities;
Level 2—Other inputs that are directly or indirectly observable in the marketplace; and
Level 3— Significant unobservable inputs that are supported by little or no market activity.
Cash and Cash Equivalents
Cash and cash equivalents consist of highly liquid investments with original or remaining maturities of three months or less at the date of purchase. Cash and cash equivalents are stated at fair value.
Accounts Receivable, net
We record trade accounts receivable at the net invoice value and such receivables are non-interest bearing. We consider receivables past due based on the contractual payment terms. We reserve for specific amounts if collectability is no longer reasonably assured based on assessment of various factors including historical loss rates and expectations of forward-looking loss estimates. Individual accounts receivable are written off when we become aware of a specific customer’s inability to meet its financial obligation, and all collection efforts are exhausted.
Investments
Investments consist of commercial paper, corporate notes and bonds, certificates of deposit, U.S. government and agency securities and mortgage and asset backed securities. We classify investments as available-for-sale at the time of purchase. All investments are recorded at estimated fair value and investments with original maturities of less than one year at time of purchase is classified as short-term. Unrealized gains and losses are included in accumulated other comprehensive income, net of tax, a component of stockholders’ equity, except for credit-related impairment losses for available-for-sale debt securities.
We evaluate investments with unrealized loss positions for other than temporary impairment by assessing if they are related to deterioration in credit risk and whether we expect to recover the entire amortized cost basis of the security, our intent to sell and whether it is more likely than not that we will be required to sell the securities before the recovery of their cost basis. Credit-related impairment losses, not to exceed the amount that fair value is less than the amortized cost basis, are recognized through an allowance for credit losses with changes in the allowance for credit losses recorded in other income (expense), net in the consolidated statements of comprehensive income. For purposes of identifying and measuring impairment, the policy election was made to exclude the applicable accrued interest from both the fair value and amortized cost basis. Applicable accrued interest, net of the allowance for credit losses (if any) of $12 million and $13 million, is recorded in prepaid expenses and other current assets on the consolidated balance sheets as of December 31, 2021 and 2020, respectively.
Realized gains and losses and declines in value judged to be other than temporary are determined based on the specific identification method and are reported in other income (expense), net in the consolidated statements of comprehensive income.
Strategic investments
Strategic investments consist of debt and non-marketable equity investments in privately-held companies in which we do not have a controlling interest or significant influence. Debt investments in privately-held companies are classified as available-for-sale and are recorded at their estimated fair value with changes in fair value recorded through accumulated other comprehensive income. We have elected to apply the measurement alternative for equity investments that do not have readily determinable fair values, measuring them at cost, less any impairment, plus or minus adjustments resulting from observable price changes in orderly transactions for the identical or a similar investment of the same issuer. An impairment loss is recorded when event or circumstance indicates a decline in value has occurred. We include these strategic investments in other assets on our consolidated balance sheets.
Derivative Financial Instruments
We use derivative financial instruments, mainly forward contracts with maturities of 12 months or less, to manage foreign currency risks. These derivative contracts are not designated as hedging instruments and changes in the fair value are recorded in other income (expense), net on the consolidated statements of comprehensive income. Realized gains (losses) from settlement of the derivative assets and liabilities are classified as investing activities in the consolidated statements of cash flows.
Property and Equipment, net
Property and equipment are stated at cost net of accumulated depreciation. Depreciation is calculated using the straight-line method over the estimated useful lives of the assets as follows:
| | | | | | | | |
| Building | | 39 years |
| Computer equipment and software | | 3-5 years |
| Furniture and fixtures | | 3-7 years |
| Leasehold and other improvements | | shorter of the lease term or estimated useful life |
Capitalized Software Development Costs
Software development costs for software to be sold, leased, or otherwise marketed are expensed as incurred until the establishment of technological feasibility, at which time those costs are capitalized until the product is available for general release to customers and amortized over the estimated life of the product. Costs and time incurred between the establishment of technological feasibility and product release have not been material, and all software development costs have been charged to research and development expense in our consolidated statements of comprehensive income.
Leases
We determine if an arrangement is or contains a lease at inception. Operating lease right-of-use assets and liabilities are recognized at the lease commencement date based on the present value of lease payments over the lease term. Lease payments consist primarily of the fixed payments under the arrangement, less any lease incentives. We generally use an incremental borrowing rate estimated based on the information available at the lease commencement date to determine the present value of lease payments, unless the implicit rate is readily determinable. Lease expense for lease payments is recognized on a straight-line basis over the lease term.
We account for lease and non-lease components as a single lease component for office leases. Lease and non-lease components for all other leases are generally accounted for separately. Additionally, we do not record leases on the balance sheet that, at the lease commencement date, have a lease term of 12 months or less.
Operating leases are included in operating lease right-of-use assets, current portion of operating lease liabilities, and operating lease liabilities, less current portion in our consolidated balance sheets. We did not have any material financing leases in any of the periods presented.
Business Combinations
We allocate the acquisition purchase price to the tangible and intangible assets acquired and liabilities assumed, based on their estimated fair values. The excess of the purchase price over the fair value of these assets acquired and liabilities assumed is recorded as goodwill. Allocation of the purchase price requires significant estimates in determining the fair value of acquired assets and assumed liabilities, especially with respect to intangible assets. Critical estimates include, but are not limited to, future expected cash flows, discount rates, the time and expense to recreate the assets and profit margin a market participant would receive. These estimates are inherently uncertain and unpredictable and, as a result, actual results may differ from estimates. During the measurement period, which may not be later than one year from the acquisition date, the Company may record adjustments to the fair value of these tangible and intangible assets acquired and liabilities assumed, with the corresponding offset to goodwill.
Goodwill and Intangible Assets
Goodwill is evaluated for impairment at least annually or more frequently if circumstances indicate that goodwill may not be recoverable. A qualitative assessment is performed to determine whether it is more likely than not that the fair value of its reporting unit is less than its carrying amount. If the reporting unit does not pass the qualitative assessment, the carrying amount of the reporting unit, including goodwill, is compared to fair value and goodwill is considered impaired if the carrying value of the reporting unit exceeds its fair value. Any excess is recognized as an impairment loss.
Intangible assets consist of developed technologies and other intangible assets, including patents and contractual agreements. Intangible assets are amortized over the period of estimated benefit using the straight-line method and estimated useful lives ranging from two to twelve years.
Impairment of Long-Lived Assets
We evaluate long-lived assets, including purchased intangible assets, for impairment whenever events or changes in circumstances indicate that the carrying amount of the assets may not be recoverable. Recoverability is measured by comparing the carrying amount to the future undiscounted cash flows we expect the asset to generate. Any excess of the carrying value of the asset above its fair value is recognized as an impairment loss.
Advertising Costs
Advertising costs, excluding costs related to our annual Knowledge user conference and other user forums, are expensed as incurred and are included in sales and marketing expense. These costs for the years ended December 31, 2021, 2020 and 2019 were $198 million, $172 million and $115 million, respectively.
Stock-based Compensation
We recognize compensation expense related to stock options and restricted stock units (“RSUs”) with only service conditions on a straight-line basis over the requisite service period. For stock options and RSUs with service, performance and market conditions (performance-based RSUs (“PRSUs”)), expenses are recognized on a graded vesting basis over the requisite service period and for awards with performance conditions, when it is probable that the performance condition will be achieved. The probability of achievement is assessed periodically to determine whether the performance metric continues to be probable. When there is a change in the probability of achievement, any cumulative effect of the change in requisite service period is recognized in the period of the change with the change to be amortized over the respective vesting period. We recognize compensation expense related to shares issued pursuant to the employee stock purchase plan (“ESPP”) on a straight-line basis over the six-month offering period. We recognize compensation expense net of estimated forfeiture activity. Amounts withheld related to the minimum statutory tax withholding requirements paid by us on behalf of our employees are recorded as a liability and a reduction to additional paid-in capital when paid and are included as a reduction of cash flows from financing activities.
We estimate the fair value of stock options with only service conditions and shares issued pursuant to the ESPP using the Black-Scholes options pricing model and the fair value of RSU awards (including PRSUs) using the fair value of our common stock on the date of grant. For stock options and PRSUs with service, performance and market conditions, we estimate the fair value of the options granted and the corresponding derived service periods using the Monte Carlo simulation, which requires the use of various assumptions, including the stock price volatility and risk-free interest rate as of the valuation date corresponding to the length of time remaining in the performance period.
Concentration of Credit Risk and Significant Customers
Financial instruments potentially exposing us to credit risk consist primarily of cash, cash equivalents, derivative contracts, investments and accounts receivable. We hold cash at financial institutions that management believes are high credit, quality financial institutions and invest in investment-grade debt securities. Our derivative contracts expose us to credit risk to the extent that the counterparties may be unable to meet the terms of the arrangement. We mitigate this credit risk by transacting with major financial institutions with high credit ratings and entering into master netting arrangements, which permit net settlement of transactions with the same counterparty. We are not required to pledge, and are not entitled to receive, cash collateral related to these derivative instruments. We are also exposed to credit risk under the convertible note hedge transactions that may result from counterparties’ non-performance.
Credit risk arising from accounts receivable is mitigated to a certain extent due to our large number of customers and their dispersion across various industries and geographies. As of December 31, 2021 and 2020, there were no customers that represented more than 10% of our accounts receivable balance. There were no customers that individually exceeded 10% of our total revenues in any of the periods presented. For purposes of assessing concentration of credit risk and significant customers, a group of customers under common control or customers that are affiliates of each other are regarded as a single customer. The allowance for doubtful accounts and write offs were not material for each of the period ending December 31, 2021, 2020 and 2019.
Income Taxes
We use the asset and liability method of accounting for income taxes, in which deferred tax assets and liabilities are recognized for the future tax consequences attributable to differences between the consolidated financial statement carrying amounts of existing assets and liabilities and their respective tax bases. We measure deferred tax assets and liabilities using enacted tax rates expected to apply to taxable income in the years in which those temporary differences are expected to be reversed. We recognize the effect on deferred tax assets and liabilities of a change in tax rates within the provision for (benefit from) income taxes as income and expense in the period that includes the enactment date. A valuation allowance is established if it is more likely than not that all or a portion of the deferred tax asset will not be realized. In determining the need for a valuation allowance, we consider future growth, forecasted earnings, future taxable income, the mix of earnings in the jurisdictions in which we operate, historical earnings, taxable income in prior years, if carryback is permitted under the law, carryforward periods and prudent and feasible tax planning strategies.
Our tax positions are subject to income tax audits by multiple tax jurisdictions throughout the world. We recognize the tax benefit of an uncertain tax position only if it is more likely than not the position is sustainable upon examination by the taxing authority, based on the technical merits. We measure the tax benefit recognized as the largest amount of benefit which is more likely than not to be realized upon settlement with the taxing authority. We recognize interest accrued and penalties related to unrecognized tax benefits in our tax provision.
We calculate the current and deferred income tax provision based on estimates and assumptions that could differ from the actual results reflected in income tax returns filed in subsequent years and record adjustments based on filed income tax returns when identified. The amount of income taxes paid is subject to examination by U.S. federal, state and foreign tax authorities. The estimate of the potential outcome of any uncertain tax issue is subject to management’s assessment of relevant risks, facts and circumstances existing at that time. To the extent the assessment of such tax position changes, we record the change in estimate in the period in which we make the determination.
Prior Period Reclassifications
Certain prior period amounts have been reclassified to conform to the current period presentation. These reclassifications did not result in a restatement of prior period financial statements.
Recently Issued Accounting Pronouncements Pending Adoption
Debt with Conversion Options
In August 2020, the FASB issued ASU 2020-06, “Debt–Debt with Conversion and Other Options (Subtopic 470-20) and Derivatives and Hedging–Contracts in Entity’s Own Equity (Subtopic 815-40)” to simplify the accounting for convertible instruments and contracts on an entity’s own equity. The standard results in our 2022 Notes being accounted for as a single unit of debt and requires the if-converted method to calculate diluted earnings per share calculation. We adopted this standard effective January 1, 2022 using a modified retrospective method, under which the basis of all convertible instruments outstanding at adoption have been adjusted to the amounts that would have been recorded had the new guidance been applied from inception. The previously recorded equity component of the convertible instrument outstanding and amortization of the debt discount and issuance costs classified as equity are reclassified from equity to debt through an adjustment to the opening balance of accumulated deficit as of January 1, 2022 which will result in reduced interest expense in future periods. Adoption of the standard resulted in a decrease to accumulated deficit of $17 million, decrease to additional paid-in capital of $19 million and an increase to debt, current of $2 million.
Acquired Contract Assets and Contract Liabilities
In October 2021, the FASB issued ASU 2021-08, “Business Combinations (Topic 805): Accounting for Acquired Contract Assets and Contract Liabilities” which improves comparability for both the recognition and measurement of acquired revenue contracts with customers at the date of and after a business combination by providing consistent recognition guidance. This standard is effective for fiscal years beginning after December 15, 2022. Early adoption is permitted, including in an interim period, for any period for which financial statements have not yet been issued. However, adoption in an interim period other than the first fiscal quarter requires an entity to apply the new guidance to all prior business combinations that have occurred since the beginning of the annual period in which the new guidance is adopted. The Company is currently evaluating the impact, if any, of adoption of this standard on our consolidated financial statements.
(3) Investments
Marketable Debt Securities
The following is a summary of our available-for-sale debt securities recorded within short-term and long-term investments on the consolidated balance sheets (in millions):
| | | | | | | | | | | | | | | | | | | | | | | |
| | December 31, 2021 |
| Amortized
Cost | | Gross
Unrealized
Gains | | Gross
Unrealized
Losses | | Estimated
Fair Value |
| Available-for-sale securities: | | | | | | | |
| Commercial paper | $ | 528 | | | $ | — | | | $ | — | | | $ | 528 | |
| Corporate notes and bonds | 2,418 | | | 1 | | | (7) | | | 2,412 | |
| Certificates of deposit | 28 | | | — | | | — | | | 28 | |
| U.S. government and agency securities | 140 | | | — | | | — | | | 140 | |
| Mortgage and asset backed securities | 100 | | | — | | | (2) | | | 98 | |
| Total available-for-sale securities | $ | 3,214 | | | $ | 1 | | | $ | (9) | | | $ | 3,206 | |
| | | | | | | | | | | | | | | | | | | | | | | |
| December 31, 2020 |
| Amortized
Cost | | Gross
Unrealized
Gains | | Gross
Unrealized
Losses | | Estimated
Fair Value |
| Available-for-sale securities: | | | | | | | |
| Commercial paper | $ | 406 | | | $ | — | | | $ | — | | | $ | 406 | |
| Corporate notes and bonds | 2,298 | | | 10 | | | — | | | 2,308 | |
| Certificates of deposit | 23 | | | — | | | — | | | 23 | |
| U.S. government and agency securities | 145 | | | 1 | | | — | | | 146 | |
| Total available-for-sale securities | $ | 2,872 | | | $ | 11 | | | $ | — | | | $ | 2,883 | |
As of December 31, 2021, the contractual maturities of our available-for-sale debt securities, excluding those securities classified within cash and cash equivalents on the consolidated balance sheet and mortgage and asset backed securities that do not have a single maturity, did not exceed 36 months. The fair values of available-for-sale securities, by remaining contractual maturity, are as follows (in millions):
| | | | | |
| December 31, 2021 |
| Due within 1 year | $ | 1,576 | |
| Due in 1 year through 5 years | 1,532 | |
| Instruments not due in single maturity | 98 | |
| Total | $ | 3,206 | |
As of December 31, 2021 and December 31, 2020, the gross unrealized losses that have been in a continuous unrealized loss position related to $2,416 million and $637 million available-for-sale debt securities, respectively, were not material.
The decline in fair value below amortized cost basis was not considered other than temporary as it is more likely than not we will hold the securities until maturity or a recovery of the cost basis, and credit-related impairment losses were not deemed material as of December 31, 2021.
Strategic Investments
As of December 31, 2021 and 2020, the total amount of equity investments in privately-held companies included in other assets on our consolidated balance sheets was $99 million and $28 million, respectively. We classify these assets as Level 3 within the fair value hierarchy as only an impairment or observable adjustment is recognized based on observable transaction price at the transaction date of identical or similar investment of the same issuer and other unobservable inputs such as volatility.
(4) Fair Value Measurements
The following table presents our fair value hierarchy for our assets measured at fair value on a recurring basis as of December 31, 2021 (in millions):
| | | | | | | | | | | | | | | | | |
| Level 1 | | Level 2 | | Total |
| Cash equivalents: | | | | | |
| Money market funds | $ | 706 | | | $ | — | | | $ | 706 | |
| Commercial paper | — | | | 110 | | | 110 | |
| Corporate notes and bonds | — | | | 28 | | | 28 | |
| Certificates of deposit | — | | | 8 | | | 8 | |
| Deposits | 235 | | | — | | | 235 | |
| | | | | |
| Marketable securities: | | | | | |
| Commercial paper | — | | | 528 | | | 528 | |
| Corporate notes and bonds | — | | | 2,412 | | | 2,412 | |
| Certificates of deposit | — | | | 28 | | | 28 | |
| Mortgage and asset backed securities | — | | | 98 | | | 98 | |
| U.S. government and agency securities | — | | | 140 | | | 140 | |
| | | | | |
| Total | $ | 941 | | | $ | 3,352 | | | $ | 4,293 | |
The following table presents our fair value hierarchy for our assets measured at fair value on a recurring basis as of December 31, 2020 (in millions):
| | | | | | | | | | | | | | | | | |
| Level 1 | | Level 2 | | Total |
| Cash equivalents: | | | | | |
| Money market funds | $ | 1,305 | | | $ | — | | | $ | 1,305 | |
| | | | | |
| | | | | |
| | | | | |
| U.S. government and agency securities | — | | | 2 | | | 2 | |
| Marketable securities: | | | | | |
| Commercial paper | — | | | 406 | | | 406 | |
| Corporate notes and bonds | — | | | 2,308 | | | 2,308 | |
| Certificates of deposit | — | | | 23 | | | 23 | |
| U.S. government and agency securities | — | | | 146 | | | 146 | |
| | | | | |
| Total | $ | 1,305 | | | $ | 2,885 | | | $ | 4,190 | |
We determine the fair value of our security holdings based on pricing from our service providers and market prices from industry-standard independent data providers. Such market prices may be quoted prices in active markets for identical assets (Level 1 inputs) or pricing determined using inputs other than quoted prices that are observable either directly or indirectly (Level 2 inputs).
Our equity investments in privately-held companies are not included in the table above and are discussed in Note 3. See Note 8 for the fair value measurement of our derivative contracts and Note 11 for the fair value measurement of our long-term debt, which are also not included in the table above.
(5) Business Combinations
2021 Business Combinations
On August 20, 2021, we acquired all outstanding stock of Swarm64 AS, a leader in database performance and scale digital workflows, for $32 million in an all-cash transaction. The purchase price was allocated based on the estimated fair value of developed technology intangible asset of $14 million (five-year estimated useful life) and goodwill of $20 million, which is not deductible for income tax purposes.
On June 15, 2021, we acquired LightStep, Inc., a leading observability solution provider, for $512 million in a cash transaction. The purchase price was preliminarily allocated based on the estimated fair value of developed technology intangible asset of $85 million (five-year estimated useful life), customer related and brand assets of $11 million, net tangible assets of $8 million, deferred tax liabilities of $6 million and goodwill of $413 million, which is not deductible for income tax purposes.
On January 8, 2021, we acquired all outstanding stock of Element AI Inc., a leading enterprise artificial intelligence (“AI”) solution provider, for $228 million in an all-cash transaction. The purchase price was allocated based on the estimated fair value of developed technology intangible asset of $85 million (five-year estimated useful life), net tangible assets of $16 million, and goodwill of $81 million, which is partially deductible for income tax purposes. At time of acquisition, we established an unrecognized tax benefit of $43 million on pre-acquisition net operating loss carryforwards and other tax attributes which was subsequently released resulting in establishment of deferred tax asset based on completion of valuation and filing certain tax returns in the third quarter of 2021.
Goodwill is primarily attributed to the value expected from synergies resulting from the business combinations. The fair values assigned to tangible and intangible assets acquired and liabilities assumed are based on management’s estimates and assumptions and may be subject to change as additional information is received. The provisional measurements of fair value for income taxes payable and deferred taxes may be subject to change as additional information is received and certain tax returns are finalized. The Company expects to finalize the fair value measurements as soon as practicable, but not later than one year from the acquisition date.
During the year ended December 31, 2021, we also completed certain acquisitions for total purchase consideration of $34 million primarily to enhance our products. These acquisitions were not material to our consolidated financial statements, either individually or in the aggregate.
2020 Business Combinations
On July 1, 2020, we acquired Sweagle NV for $25 million in an all-cash transaction to extend our DevOps and IT Operations Management (“ITOM”) capabilities. The purchase price was allocated based on the estimated fair value to intangible assets of $8 million comprised mainly of developed technology of $7 million, deferred tax liabilities of $2 million, and goodwill of $19 million.
On February 7, 2020, we acquired Rupert Labs, Inc. d/b/a Passage AI for $33 million in an all-cash transaction to advance our deep learning of conversational AI capabilities. The purchase price was allocated based on the estimated fair value to developed technology intangible assets of $22 million, deferred tax liabilities of $5 million and $15 million of goodwill.
On February 6, 2020, we acquired Loom Systems Ltd. for $58 million in an all-cash transaction to extend our AI capabilities for ITOM by providing customers with analytics solutions. The purchase price was allocated based on the estimated fair value to developed technology intangible assets of $17 million, deferred tax liabilities of $4 million and goodwill of $40 million.
Developed technology intangible assets acquired during the year are amortized over a five-year estimated useful life and goodwill is not tax deductible for income tax purposes.
2019 Business Combination
During the year ended December 31, 2019, we completed a business combination for $8 million in cash in which we acquired certain intangible assets, including developed technology and customer arrangements.
We have included the financial results of business combinations in the consolidated financial statements from the respective dates of acquisition, which were not material. Pro forma revenue and earnings amounts on a combined basis have not been presented as it is impracticable due to the lack of availability of historical financial statements that comply with GAAP. Aggregate acquisition-related costs associated with business combinations are not material for the years ended December 31, 2021, 2020 and 2019, respectively, and are included in general and administrative expenses in our condensed consolidated statements of comprehensive income as incurred.
(6) Goodwill and Intangible Assets
Goodwill balances are presented below (in millions):
| | | | | | | | | | | | | | | | | |
| | Carrying Amount |
| Balance as of December 31, 2019 | | $ | 157 | |
| Goodwill acquired | | 74 | |
| Foreign currency translation adjustments | | 10 | |
| Balance as of December 31, 2020 | | $ | 241 | |
| Goodwill acquired | | 538 | |
| Foreign currency translation adjustments | | (2) | |
| Balance as of December 31, 2021 | | $ | 777 | |
Intangible assets consist of the following (in millions):
| | | | | | | | | | | |
| | December 31, 2021 | | December 31, 2020 |
| Developed technology | $ | 415 | | | $ | 226 | |
| Patents | 69 | | | 65 | |
| Other | 14 | | | 3 | |
| Intangible assets, gross | $ | 498 | | | $ | 294 | |
| Less: accumulated amortization | (211) | | | (141) | |
| Intangible assets, net | $ | 287 | | | $ | 153 | |
The weighted-average useful life for the developed technology acquired during each of the years ended December 31, 2021 and 2020 was approximately five years. Amortization expense for intangible assets was approximately $76 million, $46 million and $35 million for the years ended December 31, 2021, 2020 and 2019, respectively.
The following table presents the estimated future amortization expense related to intangible assets held at December 31, 2021 (in millions):
| | | | | | | | | | | | | | | | | |
| Years Ending December 31, |
| 2022 | | $ | 80 | |
| 2023 | | 74 | |
| 2024 | | 67 | |
| 2025 | | 45 | |
| 2026 | | 15 | |
| Thereafter | | 6 | |
| Total future amortization expense | | $ | 287 | |
(7) Property and Equipment
Property and equipment, net consists of the following (in millions):
| | | | | | | | | | | |
| | December 31, |
| | 2021 | | 2020 |
| Computer equipment | $ | 1,226 | | | $ | 974 | |
| Computer software | 77 | | | 72 | |
| Leasehold and other improvements | 200 | | | 168 | |
| Furniture and fixtures | 74 | | | 69 | |
| | | |
| Construction in progress | 14 | | | 9 | |
| Property and equipment, gross | 1,591 | | | 1,292 | |
| Less: Accumulated depreciation | (825) | | | (632) | |
| Property and equipment, net | $ | 766 | | | $ | 660 | |
Construction in progress consists primarily of leasehold and other improvements and in-process software development costs. Depreciation expense was $312 million, $225 million and $168 million for the years ended December 31, 2021, 2020 and 2019, respectively.
(8) Derivative Contracts
As of December 31, 2021 and 2020, we had foreign currency forward contracts with total notional values of $833 million and $583 million, respectively, which are not designated as hedging instruments. Our foreign currency contracts are classified within Level 2 as the valuation inputs are based on quoted prices and market observable data of similar instruments in active markets, such as currency spot and forward rates. The fair value of these outstanding derivative contracts was as follows (in millions):
| | | | | | | | | | | | | | |
| | Consolidated Balance Sheet Location | | December 31, 2021 | December 31, 2020 |
| Derivative Assets: | | | | |
| Foreign currency derivative contracts | Prepaid expenses and other current assets | | $ | 2 | | $ | 8 | |
| Derivative Liabilities | | | | |
| Foreign currency derivative contracts | Accrued expenses and other current liabilities | | $ | 3 | | $ | 10 | |
(9) Deferred Revenue and Performance Obligations
Revenues recognized during the year ended December 31, 2021 from amounts included in deferred revenue as of December 31, 2020 were $2.9 billion. Revenues recognized during the year ended December 31, 2020 from amounts included in deferred revenue as of December 31, 2019 were $2.1 billion.
Remaining Performance Obligations
Transaction price allocated to remaining performance obligations (“RPO”) represents contracted revenue that has not yet been recognized, which includes deferred revenue and non-cancelable amounts that will be invoiced and recognized as revenues in future periods. RPO excludes contracts that are billed in arrears, such as certain time and materials contracts, as we apply the “right to invoice” practical expedient under relevant accounting guidance.
As of December 31, 2021, the total non-cancelable RPO under our contracts with customers was $11.5 billion, and we expect to recognize revenues on approximately 49% of these RPO over the following 12 months, with the balance to be recognized thereafter.
(10) Accrued Expenses and Other Current Liabilities
Accrued expenses and other current liabilities consist of the following (in millions):
| | | | | | | | | | | |
| | December 31, |
| | 2021 | | 2020 |
| Accrued payroll | $ | 444 | | | $ | 372 | |
| Taxes payable | 101 | | | 58 | |
| Other employee related liabilities | 121 | | | 92 | |
| Other | 184 | | | 146 | |
| Total accrued expenses and other current liabilities | $ | 850 | | | $ | 668 | |
(11) Debt
The following table summarizes the carrying value of our outstanding debt (in millions, except percentages):
| | | | | | | | | | | | | | | | | | | | | | | |
| December 31, 2021 | | December 31, 2020 |
| 2030 Notes | | 2022 Notes | | 2030 Notes | | 2022 Notes |
Current, net of unamortized debt discount and issuance costs of $2 million | $ | — | | | $ | 92 | | | $ | — | | | $ | — | |
Long-term, net of unamortized debt discount and issuance costs of $16 million and $29 million, respectively | 1,484 | | | — | | | 1,482 | | | 158 | |
| Total debt | $ | 1,484 | | | $ | 92 | | | $ | 1,482 | | | $ | 158 | |
| Effective interest rate of the liability component - 2022 Notes | 4.75% |
| Effective interest rate - 2030 Notes | 1.53% |
The effective interest rates for the 2030 Notes and 2022 Notes include interest payable, amortization of debt issuance cost and amortization of debt discount, as applicable.
We consider the fair value of the 2030 Notes and 2022 Notes at December 31, 2021 to be a Level 2 measurement. The estimated fair value of the 2030 Notes and 2022 Notes at December 31, 2021 and December 31, 2020 based on the closing trading price per $100 of the 2030 Notes and 2022 Notes were as follows (in millions):
| | | | | | | | | | | |
| December 31, 2021 | | December 31, 2020 |
| 2022 Notes | $ | 440 | | | $ | 687 | |
| 2030 Notes | $ | 1,400 | | | $ | 1,463 | |
| | | |
2030 Notes
In August 2020, we issued 1.40% fixed rate ten-year notes with an aggregate principal amount of $1.5 billion due on September 1, 2030 (the “2030 Notes”). The 2030 Notes were issued at 99.63% of principal and we incurred approximately $13 million for debt issuance costs. Interest is payable semi-annually in arrears on March 1 and September 1 of each year, beginning on March 1, 2021, and the entire outstanding principal amount is due at maturity on September 1, 2030. The 2030 Notes are unsecured obligations and the indentures governing the 2030 Notes contain customary events of default and covenants that, among others and subject to exceptions, restrict the Company’s ability to incur or guarantee debt secured by liens on specified assets or enter into sale and lease-back transactions with respect to specified properties.
2022 Notes
In May and June 2017, we issued an aggregate of $782.5 million of 0% convertible senior notes (the “2022 Notes”), which are due June 1, 2022 unless earlier converted or repurchased in accordance with their terms. The 2022 Notes do not bear interest, and we cannot redeem the 2022 Notes prior to maturity. The 2022 Notes are unsecured obligations and do not contain any financial covenants or restrictions on the payments of dividends, the incurrence of indebtedness or the issuance or repurchase of securities by us or any of our subsidiaries. In accounting for the issuance of the 2022 Notes and the related transaction costs, we valued and bifurcated the conversion option from the host debt instrument, referred to as debt discount, and recorded the conversion option of $160 million in equity at issuance. The resulting debt discount and transactions costs allocated to the liability component are amortized to interest expense using the effective interest method over the term of the 2022 Notes.
Upon conversion of the 2022 Notes, we may choose to pay or deliver, as the case may be, cash, shares of our common stock or a combination of cash and shares of our common stock upon settlement. We currently intend to settle the principal amount of the 2022 Notes with cash.
| | | | | | | | | | | | | | | | | | | | | | | |
| Convertible Date | | Initial Conversion Price per Share | | Initial Conversion Rate per $1,000 Par Value | | Initial Number of Shares |
| | | | | | | (in millions) |
| 2022 Notes | February 1, 2022 | | $ | 134.75 | | | 7.42 shares | | 6 | |
| | | | | | | |
Conversion of the 2022 Notes prior to the Convertible Date. At any time prior to the close of business on the business day immediately preceding February 1, 2022 (“Convertible Date”), holders of the 2022 Notes may convert their Notes at their option, only if one of the following conditions are met:
•during any calendar quarter (and only during such calendar quarter) if the last reported sale price of our common stock for at least 20 trading days (whether or not consecutive) during the period of 30 consecutive trading days ending on the last trading day of the immediately preceding calendar quarter is greater than or equal to 130% of the conversion price on each applicable trading day (in each case, the “Conversion Condition”); or
•during the five-business day period after any five-consecutive trading day period, or the measurement period, in which the trading price per $1,000 principal amount of the 2022 Notes for each trading day of the measurement period was less than 98% of the product of the last reported sale price of our common stock and the conversion rate on each such trading day; or
•upon the occurrence of specified corporate events.
For conversion requests received prior to maturity, the difference between the fair value and the amortized book value is recorded as a gain or loss on early note conversion.
Conversion of the 2022 Notes on or after the Convertible Date. On or after the Convertible Date, a holder may convert all or any portion of its 2022 Notes at any time prior to the close of business on the second scheduled trading day immediately preceding maturity regardless of the foregoing conditions, and such conversions will settle upon maturity. Upon settlement, we will pay or deliver, as the case may be, cash, shares of our common stock or a combination of cash and shares of our common stock, at our election.
The conversion price of the 2022 Notes will be subject to adjustment in some events. Holders of the 2022 Notes who convert their 2022 Notes in connection with certain corporate events that constitute a “make-whole fundamental change” are, under certain circumstances, entitled to an increase in the conversion rate. Additionally, in the event of a corporate event that constitutes a “fundamental change,” holders of the 2022 Notes may require us to purchase with cash all or a portion of the 2022 Notes upon the occurrence of a fundamental change, at a purchase price equal to 100% of the principal amount of the 2022 Notes plus any accrued and unpaid special interest, if any.
The Conversion Condition for the 2022 Notes was met for all the quarters ended June 30, 2018 through December 31, 2021, except for the quarter ended December 31, 2018. Therefore, our 2022 Notes became convertible at the holders’ option beginning on July 1, 2018 and continue to be convertible through January 31, 2022, except for the quarter ended March 31, 2019 because the Conversion Condition for the 2022 Notes was not met for the quarter ended December 31, 2018.
During the year ended December 31, 2021, we paid cash to settle $75 million in principal of the 2022 Notes and the loss on the early note conversions was not material. As a result of the settlements, we also recorded a net reduction to additional paid-in capital, reflecting $225 million fair value adjustments to the settled conversion option partially offset by $224 million benefit from the 2022 Note Hedge (as defined below).
Based on conversion requests received through January 31, 2022, settlement of the 2022 Notes during the first quarter of 2022 is not expected to be material. Conversions received on or after February 1, 2022, will be settled with the remaining principal amount of the 2022 Notes on the maturity date, which is June 1, 2022.
Repurchase of 2022 Notes
On August 11, 2020, we repurchased $497 million in aggregate principal amount of the 2022 Notes (the “2022 Notes Repurchase”) funded in part by the $1.1 billion proceeds received from the partial unwind of the 2022 Note Hedge (as defined below). The 2022 Notes Repurchase was accounted for as a debt extinguishment in which $493 million and $1.1 billion were allocated to the liability and equity components of the 2022 Notes, respectively. The cash consideration allocated to the liability component was based on the estimated fair value of the liability component utilizing a discount rate assuming a similar liability per the Company’s credit rating with the same maturity, but without the conversion option, as of the repurchase date. The cash consideration allocated to the equity component was based on the aggregate cash consideration less the estimated fair value of the liability component. The loss on extinguishment of $39 million recorded as other income (expense), net, represents the difference between the allocated cash consideration and the carrying value of the liability component, which includes the proportionate amounts of unamortized debt discount and unamortized debt issuance costs in the amount of $43 million.
Note Hedge
To minimize the impact of potential economic dilution upon conversion of the 2022 Notes, we entered into convertible note hedge transactions (the “2022 Note Hedge”) with certain investment banks, with respect to our common stock concurrently with the issuance of the 2022 Notes.
| | | | | | | | | | | | | | | | | |
| Purchase | | Initial Shares | | Shares as of
December 31, 2021 |
| | | | | |
| (in millions) |
| 2022 Note Hedge | $ | 128 | | | 6 | | | 1 | |
| | | | | |
The 2022 Note Hedge covers shares of our common stock at a strike price per share that corresponds to the initial conversion price of the 2022 Notes, subject to adjustment, and are exercisable upon conversion of the 2022 Notes. If exercised, we may elect to receive cash, shares of our common stock, or a combination of cash and shares. The 2022 Note Hedge will expire upon the maturity of the 2022 Notes. The 2022 Note Hedge is intended to reduce the potential economic dilution upon conversion of the 2022 Notes in the event that the fair value per share of our common stock at the time of exercise is greater than the conversion price of the 2022 Notes. The 2022 Note Hedge is a separate transaction and is not part of the terms of the 2022 Notes. Holders of the 2022 Notes will not have any rights with respect to the 2022 Note Hedge. The 2022 Note Hedge does not impact earnings per share, as it was entered into to offset any dilution from the 2022 Notes.
On August 11, 2020, in connection with the 2022 Notes Repurchase, we entered into partial unwind agreements (the “Note Hedge Unwind”) to reduce the number of options corresponding to the principal amount of the 2022 Notes Repurchase. We received $1.1 billion for the Note Hedge Unwind and the aggregate number of shares underlying the call options under the 2022 Note Hedge was reduced by 3.7 million shares. Consistent with early conversions of the 2022 Notes, proceeds received by the Company from the Note Hedge Unwind were used to settle a portion of the 2022 Notes Repurchase.
Warrants
| | | | | | | | | | | | | | | | | | | | | | | | | | | | | |
| Proceeds | | Initial Shares | | Strike Price | | First Expiration Date | | Shares as of
December 31, 2021 |
| (in millions) | | (in millions) | | | | | | (in millions) |
| 2022 Warrants | $ | 54 | | | 6 | | | $ | 203.40 | | | September 1, 2022 | | 1 | |
| | | | | | | | | |
Separately, we entered into warrant transactions with certain investment banks, whereby we sold warrants to acquire, subject to adjustment, the number of shares of our common stock shown in the table above (the “2022 Warrants”). If the average market value per share of our common stock for the reporting period, as measured under the 2022 Warrants, exceeds the strike price of the respective 2022 Warrants, such 2022 Warrants would have a dilutive effect on our earnings per share to the extent we report net income. The 2022 Warrants are separate transactions and are not remeasured through earnings each reporting period. The 2022 Warrants are not part of the 2022 Notes or 2022 Note Hedge.
In connection with the 2022 Notes Repurchase and early note conversions, we also entered into partial unwind agreements to reduce the number of warrants outstanding under the 2022 Warrants by delivering an aggregate of 0.5 million and 2.3 million shares of our common stock during the year ended December 31, 2021 and 2020, respectively.
According to the terms, the remaining portion of the 2022 Warrants will be net share settled and automatically exercised over a 60 trading day period beginning on the first expiration date as set forth above based on the daily volume-weighted average stock prices over the same 60 trading day period.
We expect to issue additional shares of our common stock in the second half of 2022 upon the automatic exercise of the remaining portion of the 2022 Warrants. The remaining portion of the 2022 Warrants could have a dilutive effect to the extent that the daily volume-weighted average stock prices over a 60 trading day period beginning on September 1, 2022 exceeds the strike price of the 2022 Warrants. Based on the volume-weighted average stock price on December 31, 2021, the total number of shares of our common stock to be issued upon the automatic exercise of the remaining portion of the 2022 Warrants would be approximately 0.7 million. The actual number of shares of our common stock issuable upon the automatic exercise of the remaining portion of the 2022 Warrants, if any, is unknown at this time.
(12) Accumulated Other Comprehensive Income
The components of accumulated other comprehensive income, net of tax, consist of the following (in millions):
| | | | | | | | | | | |
| | December 31, |
| | 2021 | | 2020 |
| Foreign currency translation adjustment | $ | 46 | | | $ | 87 | |
Net unrealized gain (loss) on investments, net of tax | (12) | | | 7 | |
| Accumulated other comprehensive income | $ | 34 | | | $ | 94 | |
Reclassification adjustments out of accumulated other comprehensive income into net income were not material for all periods presented.
(13) Stockholders' Equity
Common Stock
We are authorized to issue a total of 600.0 million shares of common stock as of December 31, 2021. Holders of our common stock are not entitled to receive dividends unless declared by our board of directors. As of December 31, 2021, we had 199.6 million shares of common stock outstanding and had reserved shares of common stock for future issuance as follows (in thousands):
| | | | | | | | | | | |
| | | December 31, 2021 |
| Stock plans: | | |
| Options outstanding | | 1,305 | |
RSUs (1) | | 5,808 | |
| Shares of common stock available for future grants: | | |
2021 Equity Incentive Plan (2) | | 8,501 | |
Amended and Restated 2012 Employee Stock Purchase Plan (2) | | 9,389 | |
| Total shares of common stock reserved for future issuance | | 25,003 | |
(1)Represents the number of shares issuable upon settlement of outstanding RSUs and PRSUs, as discussed under in Note 14.
(2)Refer to Note 14 for a description of these plans.
During the years ended December 31, 2021 and 2020, we issued a total of 3.2 million shares and 4.1 million shares, respectively, from stock option exercises, vesting of RSUs, net of employee payroll taxes and purchases from ESPP. In addition, as described in Note 11, we issued 0.5 million and 2.3 million shares of our common stock upon partial unwind of the 2022 Warrants during the year ended December 31, 2021 and 2020, respectively.
Preferred Stock
Our board of directors has the authority, without further action by stockholders, to issue up to 10 million shares of preferred stock in one or more series. Our board of directors may designate the rights, preferences, privileges and restrictions of the preferred stock, including dividend rights, conversion rights, voting rights, terms of redemption, liquidation preference and number of shares constituting any series or the designation of any series. The issuance of preferred stock could have the effect of restricting dividends on our common stock, diluting the voting power of our common stock, impairing the liquidation rights of our common stock, or delaying or preventing a change in control. At December 31, 2021 and 2020, no shares of preferred stock were outstanding.
(14) Equity Awards
We currently have three equity incentive plans, our 2005 Stock Option Plan (the “2005 Plan”), 2012 Equity Incentive Plan (the “2012 Plan”) and 2021 Equity Incentive Plan (the “2021 Plan”). The 2005 Plan was terminated in connection with our initial public offering in 2012 but continues to govern the terms of outstanding stock options that were granted prior to the termination of the 2005 Plan. We no longer grant equity awards pursuant to the 2005 Plan. The 2012 Plan was terminated in connection with the approval of the 2021 Plan on June 7, 2021 but continues to govern the terms of outstanding equity awards that were granted prior to the termination of the 2012 Plan. As of June 7, 2021, we no longer grant equity awards pursuant to the 2012 Plan.
The 2021 Plan and the 2012 Plan provide for the grant of incentive stock options, nonqualified stock options, stock appreciation rights, RSUs, performance-based stock awards and other forms of equity compensation (collectively, “equity awards”). In addition, the 2021 Plan and the 2012 Plan provide for the grant of performance cash awards. Incentive stock options may be granted only to employees. All other equity awards may be granted to employees, including officers, as well as directors and consultants. Prior to June 7, 2021, the 2012 Plan share reserve was increased to the extent outstanding stock options under the 2005 Plan expire or terminate unexercised.
Our Amended and Restated 2012 Employee Stock Purchase Plan (the “2012 ESPP”) authorizes the issuance of shares of common stock pursuant to purchase rights granted to our employees. The price at which common stock is purchased under the 2012 ESPP is equal to 85% of the fair market value of our common stock on the first or last day of the offering period, whichever is lower. Offering periods are six months long and begin on February 1 and August 1 of each year. Prior to June 7, 2021, the number of shares of common stock reserved for issuance automatically increased on January 1 of each year, by up to 1% of the total number of shares of common stock outstanding on December 31 of the preceding year as determined by our board of directors. Our board of directors elected not to increase the number of shares of common stock reserved for issuance under the 2012 ESPP pursuant to the provision described in the preceding sentence for the year ending December 31, 2021, and for the remaining term of the 2012 ESPP, the share reserve will not be increased without shareholder approval.
Stock Options
Stock options are exercisable at a price equal to the market value of the underlying shares of common stock on the date of the grant as determined by our board of directors or, for those stock options issued subsequent to our initial public offering, the closing price of our common stock as reported on the New York Stock Exchange on the date of grant. Stock options granted under the 2005 Plan and the 2012 Plan to new employees generally vest 25% one year from the date the requisite service period begins and continue to vest monthly for each month of continued employment over the remaining three years. Stock options granted under the 2021 Plan vest in eight equal tranches based on service conditions and achievement of both performance and market conditions. Options granted generally are exercisable for a period of up to ten years contingent on each holder’s continuous status as a service provider.
A summary of stock option activity was as follows:
| | | | | | | | | | | | | | | | | | | | | | | |
| Number of
Shares | | Weighted-
Average
Exercise
Price Per Share | | Weighted-
Average
Remaining
Contractual
Term | | Aggregate
Intrinsic Value |
| (in thousands) | | | | (in years) | | (in millions) |
| Outstanding at December 31, 2019 | 1,154 | | | $ | 77.70 | | | | | |
| | | | | | | |
| Exercised | (621) | | | $ | 52.98 | | | | | $ | 199 | |
| Canceled | (11) | | | $ | 75.77 | | | | | |
| Outstanding at December 31, 2020 | 522 | | | $ | 107.14 | | | | | |
Granted (1) | 1,052 | | | $ | 676.77 | | | | | |
| Exercised | (267) | | | $ | 59.60 | | | | | $ | 140 | |
| Canceled | (2) | | | $ | 84.24 | | | | | |
| Outstanding at December 31, 2021 | 1,305 | | | $ | 551.39 | | | 8.8 | | $ | 157 | |
| Vested and expected to vest as of December 31, 2021 | 1,037 | | | $ | 528.37 | | | 8.6 | | $ | 148 | |
| Vested and exercisable as of December 31, 2021 | 178 | | | $ | 92.06 | | | 3.7 | | $ | 99 | |
(1) Includes awards assumed in business combinations
Aggregate intrinsic value represents the difference between the estimated fair value of our common stock and the exercise price of outstanding, in-the-money options. The total intrinsic value of the options exercised was $138 million for the year ended December 31, 2019.
The weighted-average grant date fair value per share of options granted was $248.85 for the year ended December 31, 2021. The total fair value of shares vested was $10 million, $7 million and $8 million for the years ended December 31, 2021, 2020 and 2019, respectively.
In the fourth quarter of 2021, the board of directors and the compensation committee approved a one-time long-term performance-based options to the Chief Executive Officer (“2021 CEO Performance Award") and to certain executives (collectively “2021 Performance Awards”), respectively, for a total grant date fair value of $232 million. The 2021 Performance Awards will vest in eight equal tranches based on service and achievement of both performance and market conditions, subject to continued employment and specifically for the 2021 CEO Performance Award, as CEO or Executive Chairman of the Company, through each vesting date. The performance and market condition for a particular tranche may be achieved at different points in time and in any order but will become eligible to vest only when all service, performance and market conditions for the respective tranche are met but no earlier than two years. The performance and market condition must be achieved by September 30, 2026 (the "Performance Period"). The stock price metric will be achieved when both the 180-Day volume weighted average price ("VWAP") and the 30-Day VWAP equal or exceed the respective tranche stock price metric on any day during the Performance Period. The performance metric is achieved when the trailing four quarter cumulative GAAP subscription revenues equal or exceed the respective tranche performance target. Shares acquired upon exercise of the options cannot be sold, transferred or disposed until after the end of the Performance Period and the 2021 Performance Awards will expire ten years from the respective date of grant.
The fair value of the 2021 Performance Awards and the corresponding derived service periods were estimated using the Monte Carlo simulation. Stock-based compensation expense is recognized on a graded vesting basis over the requisite service period for each respective tranche, but not shorter than the two year minimum service period, and includes an assessment of when it is probable the performance condition will be achieved which involves subjective assessment of our future financial projection.
As of December 31, 2021, total unrecognized compensation cost, adjusted for estimated forfeitures, related to unvested stock options was approximately $132 million. The weighted-average remaining vesting period of unvested stock options at December 31, 2021 was three years.
RSUs
A summary of RSU activity was as follows:
| | | | | | | | | | | |
| Number of
Shares | | Weighted-Average Grant-Date Fair Value Per Share |
| (in thousands) | | |
| Outstanding at December 31, 2019 | 8,733 | | | $ | 185.39 | |
| Granted | 3,643 | | | $ | 367.52 | |
| Vested | (4,250) | | | $ | 181.85 | |
| Forfeited | (764) | | | $ | 221.84 | |
| Outstanding at December 31, 2020 | 7,362 | | | $ | 274.23 | |
| Granted | 2,912 | | | 577.26 |
| Vested | (3,653) | | | $ | 268.81 | |
| Forfeited | (813) | | | 354.42 |
| Outstanding at December 31, 2021 | 5,808 | | | $ | 416.00 | |
| Expected to vest as of December 31, 2021 | 5,209 | | | |
RSUs outstanding as of December 31, 2021 were comprised of 5.5 million RSUs with only service conditions and 0.3 million RSUs with both service conditions and performance conditions, including certain RSUs with additional market conditions. The total intrinsic value of the RSUs vested was $2.1 billion, $1.8 billion and $1.4 billion for the years ended December 31, 2021, 2020 and 2019, respectively. The aggregate intrinsic value of the RSUs outstanding and expected to vest as of December 31, 2021 was $3.8 billion and $3.4 billion, respectively.
For the years ended December 31, 2021 and 2020, PRSUs with service, performance and market vesting criteria are considered as eligible to vest when approved by the compensation committee of our board of directors in January of the year following the grant. The ultimate number of shares eligible to vest range from 0% to 200% depending on achievement relative to the performance metrics and for PRSUs granted in 2021, further depends on our total shareholder return relative to that of the S&P 500 index over the applicable measurement period. The eligible shares will vest in February of the following year and either vest semi-annually or quarterly thereafter over the remaining two years, contingent on each holder’s continuous status as a service provider on the applicable vesting dates. The number of PRSUs granted shown in the table above reflects the shares that could be eligible to vest at 100% of target for PRSUs and includes adjustments for over or under achievement granted in the prior year. In July 2020, our board of directors approved a modification to the fiscal year 2020 performance target. As a result, an incremental expense of $29 million is recognized over the remaining vesting period.
We recognized $124 million, $70 million, and $68 million of stock-based compensation expense, net of actual and estimated forfeitures, associated with PRSUs on a graded vesting basis during the year ended December 31, 2021, 2020, and 2019, respectively.
As of December 31, 2021, total unrecognized compensation cost, adjusted for estimated forfeitures, related to unvested RSUs was approximately $2.0 billion and the weighted-average remaining vesting period was three years.
Valuation Assumptions
The following assumptions were used in the Black-Scholes options pricing model and the Monte Carlo simulation model, to estimate our stock-based compensation on the date of the grant for ESPP, stock options and PRSUs, respectively, as applicable.
| | | | | | | | | | | | | | | | | |
| | Year Ended December 31, |
| 2021 | | 2020 | | 2019 |
| Risk Free Interest Rate | | | | | |
| ESPP | 0.06% - 0.11% | | 0.11% - 2.04% | | 2.04% - 2.46% |
| Stock Options | 1.20% - 1.45% | | * | | 1.80 | % |
| PRSU | 0.19% - 0.20% | | ** | | ** |
| Expected Term (in years) | | | | | |
| ESPP | 0.5 | | 0.5 | | 0.5 |
| Stock Options | 7.5 - 10 | | * | | 10 |
| Expected Volatility | | | | | |
| ESPP | 35% - 60% | | 30% - 60% | | 30% - 49% |
| Stock Options | 38% - 41% | | * | | 40 | % |
| PRSU | 41% - 42% | | ** | | ** |
* There were no stock option grants in 2020.
** There were no grants with market conditions for the respective fiscal year.
Expected volatility. The expected volatility is based on the historical volatility of our common stock for a period similar to our expected term.
Expected term. We determine the expected term based on historical experience of similar awards, giving consideration to the contractual terms of the stock-based awards, vesting schedules and expectations of future employee behavior. We estimate the expected term for ESPP using the purchase period.
Risk-free interest rate. The risk-free interest rate is based on the U.S. Treasury yield curve in effect at the time of grant for the expected term of the stock-based award.
Expected dividend yield. Our expected dividend yield is zero, as we have not and do not currently intend to declare dividends in the foreseeable future.
(15) Net Income Per Share
Basic net income per share attributable to common stockholders is computed by dividing net income attributable to common stockholders by the weighted-average number of shares of common stock outstanding during the period. Diluted net income per share is computed by dividing net income attributable to common stockholders by the weighted-average number of shares of common stock outstanding during the period, adjusted for the effects of dilutive shares of common stock, which are comprised of outstanding stock options, RSUs, ESPP obligations, the 2022 Notes and the 2022 and 2018 Warrants. Stock awards with performance or market conditions are included in dilutive shares to the extent all conditions are met. The dilutive potential shares of common stock are computed using the treasury stock method or the as-if converted method, as applicable. The effects of outstanding stock options, RSUs, ESPP obligations, 2022 Notes and 2022 and 2018 Warrants are excluded from the computation of diluted net income per share in periods in which the effect would be antidilutive.
The following tables present the calculation of basic and diluted net income per share attributable to common stockholders (in thousands, except per share data):
| | | | | | | | | | | | | | | | | |
| | Year Ended December 31, |
| | 2021 | | 2020 | | 2019 |
| Numerator: | | | | | |
| Net income | $ | 230,141 | | | $ | 118,503 | | | $ | 626,698 | |
| Denominator: | | | | | |
Weighted-average shares outstanding - basic | 198,094 | | | 193,096 | | | 186,466 | |
| Weighted-average effect of potentially dilutive securities: | | | | | |
| Common stock options | 293 | | | 547 | | | 1,109 | |
| RSUs | 3,429 | | | 4,421 | | | 4,897 | |
| | | | | |
| | | | | |
| 2018 Warrants | — | | | — | | | 842 | |
| 2022 Notes | 535 | | | 842 | | | 2,737 | |
| 2022 Notes settlements | 116 | | | 1,931 | | | — | |
| 2022 Warrants | 649 | | | 920 | | | 1,172 | |
| Partial settlement of 2022 Warrants | 51 | | | 721 | | | — | |
| Weighted-average shares outstanding - diluted | 203,167 | | | 202,478 | | | 197,223 | |
| Net income per share - basic | $ | 1.16 | | | $ | 0.61 | | | $ | 3.36 | |
| Net income per share - diluted | $ | 1.13 | | | $ | 0.59 | | | $ | 3.18 | |
Potentially dilutive securities that are not included in the calculation of diluted net income per share because doing so would be antidilutive are as follows (in thousands):
| | | | | | | | | | | | | | | | | |
| | Year Ended December 31, |
| | 2021 | | 2020 | | 2019 |
| Common stock options | 998 | | | — | | | 161 | |
| RSUs | 381 | | | 347 | | | 413 | |
| | | | | |
| ESPP obligations | 209 | | | 224 | | | 273 | |
| | | | | |
| | | | | |
| | | | | |
| | | | | |
| Total potentially dilutive securities | 1,588 | | | 571 | | | 847 | |
(16) Income Taxes
The components of income before income taxes by U.S. and foreign jurisdictions were as follows (in millions):
| | | | | | | | | | | | | | | | | |
| | Year Ended December 31, |
| | 2021 | | 2020 | | 2019 |
| United States | $ | 152 | | | $ | 13 | | | $ | (49) | |
| Foreign | 97 | | | 137 | | | 116 | |
| Total | $ | 249 | | | $ | 150 | | | $ | 67 | |
The provision for (benefit from) income taxes consist of the following (in millions):
| | | | | | | | | | | | | | | | | |
| | Year Ended December 31, |
| | 2021 | | 2020 | | 2019 |
| Current provision: | | | | | |
| Federal | $ | — | | | $ | — | | | $ | — | |
| State | 1 | | | — | | | — | |
| Foreign | 52 | | | 53 | | | 16 | |
| 53 | | | 53 | | | 16 | |
| Deferred provision: | | | | | |
| Federal | (3) | | | (5) | | | (3) | |
| State | (3) | | | (1) | | | (1) | |
| Foreign | (28) | | | (16) | | | (572) | |
| (34) | | | (22) | | | (576) | |
| Provision for (benefit from) income taxes | $ | 19 | | | $ | 31 | | | $ | (560) | |
The effective income tax rate differs from the federal statutory income tax rate applied to the income before income taxes due to the following (in millions):
| | | | | | | | | | | | | | | | | |
| | Year Ended December 31, |
| | 2021 | | 2020 | | 2019 |
| | | | | |
| Tax computed at U.S. federal statutory rate | $ | 53 | | | $ | 31 | | | $ | 14 | |
| | | | | |
| Tax rate differential for international subsidiaries | 5 | | | 1 | | | (5) | |
| Stock-based compensation | (160) | | | (157) | | | (108) | |
| Tax credits | (76) | | | (64) | | | (51) | |
| Foreign restructuring and amortization | 1 | | | 7 | | | — | |
| | | | | |
| Executive compensation | 23 | | | 25 | | | 19 | |
| Valuation allowance | 169 | | | 184 | | | (432) | |
| Other | 4 | | | 4 | | | 3 | |
| Provision for (benefit from) income taxes | $ | 19 | | | $ | 31 | | | $ | (560) | |
Significant components of our deferred tax assets are shown below (in millions). A valuation allowance has been recognized to offset our deferred tax assets, as necessary, by the amount of any tax benefits that, based on evidence, are not expected to be realized.
| | | | | | | | | | | |
| | December 31, |
| | 2021 | | 2020 |
| Deferred tax assets: | | | |
| Net operating loss carryforwards | $ | 1,061 | | | $ | 882 | |
| | | |
| Credit carryforwards | 318 | | | 235 | |
| Lease liability | 152 | | | 115 | |
| | | |
| Depreciation and amortization | 587 | | | 636 | |
| Other | 126 | | | 103 | |
| Total deferred tax assets | 2,244 | | | 1,971 | |
| Less valuation allowance | (1,326) | | | (1,129) | |
| 918 | | | 842 | |
| Deferred tax liabilities: | | | |
| | | |
| | | |
| | | |
| Right of use asset | (141) | | | (106) | |
| Other | (94) | | | (70) | |
| Net deferred tax assets | $ | 683 | | | $ | 666 | |
The unremitted earnings of our foreign subsidiaries are not considered indefinitely reinvested, except in certain designated jurisdictions in which the resident entity is a service provider that is not expected to generate substantial amounts of cash in excess of what may be reinvested by the local entity. We have not provided for state income or withholding taxes on the undistributed earnings of foreign subsidiaries which are considered indefinitely invested outside of the U.S. The amount of unrecognized deferred tax liability on these undistributed earnings is not material as of December 31, 2021.
As of December 31, 2021, we had U.S. federal net operating loss and federal tax credit carryforwards of approximately $4.0 billion and $250 million, respectively. The federal tax credits and a portion of the federal net operating loss carryforwards will begin to expire in 2024 if not utilized. In addition, as of December 31, 2021, we had state net operating loss and state tax credit carryforwards of approximately $2.3 billion and $184 million, respectively. The state net operating loss will begin to expire in 2022 if not utilized, however the tax effected amount due to expire in 2022 is immaterial. State tax credits and a portion of the federal net operating loss carryforwards can be carried forward indefinitely. Utilization of our net operating loss and credit carryforwards may be subject to annual limitation due to the ownership change limitations provided by the Internal Revenue Code and similar state provisions. Such an annual limitation could result in the expiration of the net operating loss and tax credit carryforwards before utilization.
We maintain a full valuation allowance against our U.S. deferred tax assets as of December 31, 2021. We regularly assess the need for a valuation allowance against our deferred tax assets. In making that assessment, we consider both positive and negative evidence related to the likelihood of realization of the deferred tax assets to determine, based on the weight of available evidence, whether it is more likely than not that some or all of the deferred tax assets will not be realized. Due to cumulative losses including tax deductible stock compensation and based on all available evidence, we have determined that it is more likely than not that our U.S. deferred tax assets will not be realized as of December 31, 2021.
The $197 million increase in the 2021 valuation allowance was primarily attributable to an increase in deferred tax assets related to net operating losses and R&D credits partially offset by a valuation allowance release related to Lightstep, Inc. acquired deferred tax liabilities.. The $210 million increase in the 2020 valuation allowance was primarily attributable to an increase in deferred tax assets related to net operating losses. The $424 million decrease in the 2019 valuation allowance was primarily attributable to the release of the valuation allowance on the Irish deferred tax assets. The Company has recently improved its profitability in the US and to the extent sufficient positive evidence becomes available, we may release a portion, or all, of our valuation allowance in one or more future periods. A release of the valuation allowance, if any, would result in the recognition of certain deferred tax assets and a material income tax benefit for the period in which such release is recorded.
A reconciliation of the beginning and ending balance of total unrecognized tax benefits is as follows (in millions):
| | | | | | | | | | | | | | | | | |
| | Year Ended December 31, |
| | 2021 | | 2020 | | 2019 |
| Balance, beginning period | $ | 81 | | | $ | 37 | | | $ | 28 | |
| Tax positions taken in prior period: | | | | | |
| Gross increases | 5 | | | 6 | | | 1 | |
| Gross decreases | — | | | (1) | | | — | |
| Tax positions taken in current period: | | | | | |
| Gross increases | 38 | | | 39 | | | 8 | |
| | | | | |
| Lapse of statute of limitations | — | | | — | | | — | |
| Settlements | — | | | — | | | — | |
| Balance, end of period | $ | 124 | | | $ | 81 | | | $ | 37 | |
As of December 31, 2021, we had gross unrecognized tax benefits of approximately $124 million of which $28 million would impact the effective tax rate, if recognized. We recognize accrued interest and penalties related to unrecognized tax benefits as income tax expense. Accrued interest and penalties included in our liability related to unrecognized tax benefits were $4 million and $2 million at December 31, 2021 and 2020, respectively. The amount of unrecognized tax benefits could be reduced upon expiration of the applicable statutes of limitations. The potential reduction in unrecognized tax benefits during the next 12 months is not expected to be material. Interest and penalties accrued on these uncertain tax positions are recognized as income tax expense and will be released upon the expiration of the statutes of limitations. These amounts are also not material for any periods presented.
We are subject to taxation in the United States and foreign jurisdictions. As of December 31, 2021, our tax years 2004 to 2020 remain subject to examination in most jurisdictions.
Governments in certain countries where we do business have enacted legislation in response to the COVID-19 pandemic, including the Coronavirus Aid, Relief, and Economic Security Act (the “CARES Act”) enacted by the United States on March 27, 2020. We are continuing to analyze these legislative developments which are not material for the year ended December 31, 2021.
There are differing interpretations of tax laws and regulations, and as a result, disputes may arise with tax authorities involving issues of the timing and amount of deductions and allocations of income among various tax jurisdictions. We periodically evaluate our exposures associated with our tax filing positions. We believe that adequate amounts have been reserved for any adjustments that may ultimately result from these examinations, and we do not anticipate a significant impact to our gross unrecognized tax benefits within the next 12 months related to these years. Although the timing of the resolution, settlement, and closure of any audit is highly uncertain, it is reasonably possible that the balance of gross unrecognized tax benefits could significantly change in the next 12 months. However, given the number of years that remain subject to examination, we are unable to estimate the full range of possible adjustments to the balance of gross unrecognized tax benefits.
(17) Commitments and Contingencies
Operating Leases
For some of our offices and data centers, we have entered into non-cancelable operating lease agreements with various expiration dates through 2035. Certain lease agreements include options to renew or terminate the lease, which are not reasonably certain to be exercised and therefore are not factored into our determination of lease payments.
Total operating lease costs was $100 million and $83 million, excluding short-term lease costs, variable lease costs and sublease income each of which were immaterial, for each of the years ended December 31, 2021 and 2020, respectively.
Total cash paid for amounts included in the measurement of operating lease liabilities was $75 million and $59 million for the years ended December 31, 2021 and 2020, respectively. Operating lease liabilities arising from obtaining operating right-of-use assets was $223 million and $112 million for the years ended December 31, 2021 and 2020, respectively, of which the increase is largely related to additional office facilities located in Santa Clara, California in line with the original commitment.
As of December 31, 2021, the weighted-average remaining lease term is nine years and the weighted-average discount rate is 3%.
Maturities of operating lease liabilities as of December 31, 2021 are presented in the table below (in millions):
| | | | | | | | | | | | | | | | | |
| Years Ending December 31, |
| 2022 | | $ | 97 | |
| 2023 | | 104 | |
| 2024 | | 86 | |
| 2025 | | 75 | |
| 2026 | | 56 | |
| Thereafter | | 323 | |
| Total operating lease payments | | 741 | |
| Less: imputed interest | | (103) | |
| Present value of operating lease liabilities | | $ | 638 | |
In addition to the amounts above, as of December 31, 2021, we have operating leases, primarily for offices, that have not yet commenced with undiscounted cash flows of $208 million. These operating leases will commence in 2022 with lease terms of four to thirteen years.
Other Contractual Commitments
Other contractual commitments consist of data center and IT operations and sales and marketing activities related to our daily business operations. Future minimum payments under our non-cancelable purchase commitments as of December 31, 2021 are presented in the table below (in millions):
| | | | | | | | | | | | | | | | | |
| | Purchase Obligations (1) |
| Years Ending December 31, | | |
| 2022 | | $ | 153 | |
| 2023 | | 113 | |
| 2024 | | 55 | |
| 2025 | | 34 | |
| 2026 | | 24 | |
| Thereafter | | 4 | |
| Total | | $ | 383 | |
(1)Not included in the table above are certain purchase commitments related to our future annual Knowledge user conferences and other customer or sales conferences to be held in 2022 and future years. If we had canceled these contractual commitments as of December 31, 2021 we would have been obligated to pay cancellation penalties of approximately $41 million in aggregate.
In addition to the amounts above, we expect payment for the investment in Celonis SE of $100 million in the first quarter of 2022 and the repayments of our 2022 Notes and 2030 Notes with an aggregate principal amount of $92 million and $1.5 billion due on June 1, 2022 and September 1, 2030, respectively. Refer to Note 11 and Note 19 for further information regarding our Notes and the Celonis SE investment. Further, $28 million of unrecognized tax benefits have been recorded as liabilities as of December 31, 2021.
Letters of Credit
As of December 31, 2021, we had letters of credit in the aggregate amount of $21 million, primarily in connection with our customer contracts and operating leases.
Legal Proceedings
From time to time, we are party to litigation and other legal proceedings in the ordinary course of business. While the results of any litigation or other legal proceedings are uncertain, management does not believe the ultimate resolution of any pending legal matters is likely to have a material adverse effect on our financial position, results of operations or cash flows, except for those matters for which we have recorded a loss contingency. We accrue for loss contingencies when it is both probable that we will incur the loss and when we can reasonably estimate the amount of the loss or range of loss.
Generally, our subscription agreements require us to defend our customers for third-party intellectual property infringement and other claims. Any adverse determination related to intellectual property claims or other litigation could prevent us from offering our services and adversely affect our financial condition and results of operations.
Indemnification Provisions
Our agreements include provisions indemnifying customers against intellectual property and other third-party claims. In addition, we have entered into indemnification agreements with our directors, executive officers and certain other officers that will require us, among other things, to indemnify them against certain liabilities that may arise as a result of their affiliation with us. We have not incurred any costs as a result of such indemnification obligations and have not recorded any liabilities related to such obligations in the consolidated financial statements.
(18) Information about Geographic Areas and Products
Revenues by geographic area, based on the location of our users, were as follows for the periods presented (in millions):
| | | | | | | | | | | | | | | | | |
| | Year Ended December 31, |
| | 2021 | | 2020 | | 2019 |
North America (1) | $ | 3,752 | | | $ | 2,960 | | | $ | 2,276 | |
EMEA (2) | 1,551 | | | 1,132 | | | 866 | |
| Asia Pacific and other | 593 | | | 427 | | | 318 | |
| Total revenues | $ | 5,896 | | | $ | 4,519 | | | $ | 3,460 | |
Property and equipment, net by geographic area were as follows (in millions):
| | | | | | | | | | | |
| | December 31, |
| 2021 | | 2020 |
| Property and equipment, net: | | | |
North America (3) | $ | 484 | | | $ | 395 | |
EMEA (2) | 176 | | | 172 | |
| Asia Pacific and other | 106 | | | 93 | |
| Total property and equipment, net | $ | 766 | | | $ | 660 | |
(1)Revenues attributed to the United States were 94% of North America revenues for each of the years ended December 31, 2021, 2020 and 2019.
(2)Europe, the Middle East and Africa (“EMEA”)
(3)Property and equipment, net attributed to the United States were approximately 84% and 78% of property and equipment, net attributable to North America as of December 31, 2021 and 2020, respectively.
Subscription revenues consist of the following (in millions):
| | | | | | | | | | | | | | | | | |
| Year Ended December 31, |
| 2021 | | 2020 | | 2019 |
| Digital workflow products | $ | 4,882 | | | $ | 3,749 | | | $ | 2,811 | |
| ITOM products | 691 | | | 537 | | | 444 | |
| Total subscription revenues | $ | 5,573 | | | $ | 4,286 | | | $ | 3,255 | |
Our digital workflow products include the Now Platform, IT Service Management, IT Business Management, IT Asset Management, Security Operations, Governance, Risk and Compliance, HR Service Delivery, Safe Workplace Suite of applications, Workplace Service Delivery, Legal Service Delivery, Customer Service Management, Field Service Management, Industry Solutions, App Engine and IntegrationHub, and are generally priced on a per user basis. Our ITOM products are generally priced on a per node (physical or virtual server) basis and increasingly on a subscription unit basis which allows us to measure customers’ management of physical IT resources.
(19) Subsequent Events
On December 31, 2021, we entered into an agreement with Celonis SE, a leader in process mining, to purchase $100 million in cash for common and preferred shares, which we expect to settle in the first quarter of 2022.
| | | | | |
| ITEM 9. | CHANGES IN AND DISAGREEMENTS WITH ACCOUNTANTS ON ACCOUNTING AND
FINACIAL DISCLOSURE |
None.
| | | | | |
| ITEM 9A. | CONTROLS AND PROCEDURES
|
(a) Evaluation of Disclosure Controls and Procedures
Regulations under the Exchange Act require public companies, including our Company, to maintain “disclosure controls and procedures,” which are defined in Rule 13a-15(e) and Rule 15d-15(e) to mean a company’s controls and other procedures that are designed to ensure that information required to be disclosed in the reports that it files or submits under the Exchange Act is recorded, processed, summarized and reported, within the time periods specified in the SEC’s rules and forms. Disclosure controls and procedures include, without limitation, controls and procedures designed to ensure that information required to be disclosed in our reports filed or submitted under the Exchange Act is accumulated and communicated to management, including our principal executive officer and principal financial officer, or persons performing similar functions, as appropriate, to allow timely decisions regarding required or necessary disclosures. In designing and evaluating our disclosure controls and procedures, management recognizes that disclosure controls and procedures, no matter how well conceived and operated, can provide only reasonable, not absolute, assurance that the objectives of the disclosure controls and procedures are met. Additionally, in designing disclosure controls and procedures, our management necessarily was required to apply its judgment in evaluating the cost-benefit relationship of possible disclosure controls and procedures. Our Chief Executive Officer and Chief Financial Officer have concluded, based on the evaluation of the effectiveness of the disclosure controls and procedures by our management as of December 31, 2021, that our disclosure controls and procedures were effective at the reasonable assurance level for this purpose.
(b) Management’s Report on Internal Control Over Financial Reporting
Our management is responsible for establishing and maintaining adequate internal control over financial reporting (as defined in Rules 13a-15(f) and 15d-15(f) under the Exchange Act) to provide reasonable assurance regarding the reliability of our financial reporting and the preparation of consolidated financial statements for external purposes in accordance with generally accepted accounting principles.
Our management, under the supervision of our Chief Executive Officer and Chief Financial Officer, conducted an evaluation of the effectiveness of our internal control over financial reporting based on the framework in Internal Control—Integrated Framework (2013), issued by the Committee of Sponsoring Organizations of the Treadway Commission. Based on this evaluation, management concluded that our internal control over financial reporting was effective as of December 31, 2021.
The effectiveness of our internal control over financial reporting as of December 31, 2021 has been audited by PricewaterhouseCoopers LLP, an independent registered public accounting firm, as stated in their report, which is included in Item 8 of this Annual Report on Form 10-K.
(c) Changes in Internal Control over Financial Reporting
There were no changes to our internal control over financial reporting (as such term is defined in Rules 13a-15(f) and 15d-15(f) under the Exchange Act) that occurred during the quarter ended December 31, 2021 that have materially affected, or is reasonably likely to materially affect, our internal control over financial reporting.
| | | | | |
| ITEM 9B. | OTHER INFORMATION |
None.
| | | | | |
| ITEM 9C. | DISCLOSURES REGARDING FOREIGN JURISDICTION THAT PREVENT INSPECTIONS |
Not Applicable.
PART III
| | | | | |
| ITEM 10. | DIRECTORS, EXECUTIVE OFFICERS AND CORPORATE GOVERNANCE |
The information required by this item will be included in an amendment to this Annual Report on Form 10-K or incorporated by reference from our definitive proxy statement to be filed pursuant to Regulation 14A.
| | | | | |
| ITEM 11. | EXECUTIVE COMPENSATION |
The information required by this item will be included in an amendment to this Annual Report on Form 10-K or incorporated by reference from our definitive proxy statement to be filed pursuant to Regulation 14A.
| | | | | |
| ITEM 12. | SECURITY OWNERSHIP OF CERTAIN BENEFICIAL OWNERS AND MANAGEMENT AND RELATED STOCKHOLDER MATTERS |
The information required by this item will be included in an amendment to this Annual Report on Form 10-K or incorporated by reference from our definitive proxy statement to be filed pursuant to Regulation 14A.
| | | | | |
| ITEM 13. | CERTAIN RELATIONSHIPS AND RELATED TRANSACTIONS AND DIRECTOR INDEPENDENCE |
The information required by this item will be included in an amendment to this Annual Report on Form 10-K or incorporated by reference from our definitive proxy statement to be filed pursuant to Regulation 14A.
| | | | | |
| ITEM 14. | PRINCIPAL ACCOUNTING FEES AND SERVICES
|
The information required by this item will be included in an amendment to this Annual Report on Form 10-K or incorporated by reference from our definitive proxy statement to be filed pursuant to Regulation 14A.
PART IV
| | | | | |
| ITEM 15. | EXHIBITS AND FINANCIAL STATEMENT SCHEDULES |
The following documents are filed as a part of this Annual Report on Form 10-K:
(a) Financial Statements
The information concerning our financial statements, and Report of Independent Registered Public Accounting Firm required by this Item is incorporated by reference herein to the section of this Annual Report on Form 10-K in Item 8, entitled “Consolidated Financial Statements and Supplementary Data.”
(b) Financial Statement Schedules
All schedules have been omitted because the required information is not present or not present in amounts sufficient to require submission of the schedules, or because the information required is included in Item 8, entitled the “Consolidated Financial Statements and Supplementary Data.”
(c) Exhibits
The list of exhibits filed with this report is set forth in the Exhibit Index following the signature pages and is incorporated herein by reference.
| | | | | |
| ITEM 16. | FORM 10-K SUMMARY |
None.
EXHIBIT INDEX
| | | | | | | | | | | | | | | | | | | | | | | | | | | | | | | | | | | |
Exhibit Number | Description of Document | | Incorporated by Reference | | Filed
Herewith |
| Form | | File No. | | Exhibit | | Filing Date | |
| | | 8-K | | 001-35580 | | 3.1 | | 6/9/2021 | | |
| | | 8-K | | 001-35580 | | 3.2 | | 6/9/2021 | | |
| | | S-1/A | | 333-180486 | | 4.1 | | 6/19/2012 | | |
| | | 8-K | | 001-35580 | | 4.1 | | 5/30/2017 | | |
| | | 8-K | | 001-35580 | | 4.1 | | 8/11/2020 | | |
| | | 8-K | | 001-35580 | | 4.2 | | 8/11/2020 | | |
| | | | | | | | | | | X |
| | | 10-K | | 001-35580 | | 10.1 | | 2/27/2015 | | |
| | | S-1 | | 333-180486 | | 10.2 | | 3/30/2012 | | |
| | | 10-K | | 001-35580 | | 10.3 | | 2/27/2019 | | |
| | | 10-Q | | 001-35580 | | 10.1 | | 7/30/2020 | | |
| | | 10-Q | | 001-35580 | | 10.2 | | 7/30/2020 | | |
| | | S-8 | | 333-256854 | | 4.5 | | 6/7/2021 | | |
| | | 10-Q | | 001-35580 | | 10.4 | | 7/29/2021 | | |
| | | 8-K | | 001-35580 | | 10.2 | | 6/9/2021 | | |
| | | 10-Q | | 001-35580 | | 10.5 | | 7/29/2021 | | |
| | | S-8 | | 333-253013 | | 99.1 | | 2/12/2021 | | |
| | | | | | | | | | | | | | | | | | | | | | | | | | | | | | | | | | | |
Exhibit Number | Description of Document | | Incorporated by Reference | | Filed
Herewith |
| Form | | File No. | | Exhibit | | Filing Date | |
| | | S-8 | | 333-253013 | | 99.2 | | 2/12/2021 | | |
| | | S-8 | | 333-257171 | | 4.5 | | 6/17/2021 | | |
| | | 10-Q | | 001-35580 | | 10.6 | | 7/29/2021 | | |
| | | 8-K | | 001-35580 | | 10.1 | | 10/23/2019 | | |
| | | 8-K | | 001-35580 | | 10.1 | | 3/27/2020 | | |
| | | 8-K | | 001-35580 | | 10.1 | | 11/18/2019 | | |
| | | S-1 | | 333-180486 | | 10.7 | | 3/30/2012 | | |
| | | 10-Q | | 001-35580 | | 10.1 | | 11/5/2014 | | |
| | | 10-Q | | 001-35580 | | 10.1 | | 8/8/2017 | | |
| | | 10-Q | | 001-35580 | | 10.1 | | 11/6/2017 | | |
| | | 10-K | | 001-35580 | | 10.17 | | 2/27/2019 | | |
| | | 10-Q | | 001-35580 | | 10.1 | | 10/29/2020 | | |
| | | 8-K | | 001-35580 | | 10.1 | | 4/16/2021 | | |
| | | 10-Q | | 001-35580 | | 10.1 | | 10/28/2021 | | |
| | | | | | | | | | | X |
| | | S-1/A | | 333-184674 | | 10.12 | | 11/9/2012 | | |
| | | 8-K | | 001-35580 | | 10.1 | | 12/15/2014 | | |
| | | | | | | | | | | | | | | | | | | | | | | | | | | | | | | | | | | |
Exhibit Number | Description of Document | | Incorporated by Reference | | Filed
Herewith |
| Form | | File No. | | Exhibit | | Filing Date | |
| | | 10-Q | | 001-35580 | | 10.1 | | 5/8/2018 | | |
| | | 10-Q | | 001-35580 | | 10.2 | | 5/8/2018 | | |
| | | 10-Q | | 001-35580 | | 10.3 | | 5/8/2018 | | |
| | | 8-K | | 001-35580 | | 99.1 | | 5/30/2017 | | |
| | | 8-K | | 001-35580 | | 99.2 | | 5/30/2017 | | |
| | | 8-K | | 001-35580 | | 99.1 | | 6/22/2017 | | |
| | | 8-K | | 001-35580 | | 99.2 | | 6/22/2017 | | |
|
| | 10-Q | | 001-35580 | | 10.2 | | 10/29/2020 | | |
| | | 10-Q | | 001-35580 | | 10.3 | | 10/29/2020 | | |
| | | 10-Q | | 001-35580 | | 10.4 | | 10/29/2020 | | |
| | | 10-Q | | 001-35580 | | 10.3 | | 4/29/2021 | | |
| | | 10-Q | | 001-35580 | | 10.1 | | 8/3/2016 | | |
| | | | | | | | | | | X |
| | | | | | | | | | | X |
| | | | | | | | | | | X |
| | | | | | | | | | | X |
| | | | | | | | | | | X |
| | | | | | | | | | | X |
| | | | | | | | | | | X |
| 101.INS | XBRL Instance Document - the instance document does not appear in the Interactive Data File because its XBRL tags are embedded within the Inline XBRL document | | | | | | | | | | X |
| 101.SCH | Inline XBRL Taxonomy Extension Schema Document | | | | | | | | | | X |
| | | | | | | | | | | | | | | | | | | | | | | | | | | | | | | | | | | |
Exhibit Number | Description of Document | | Incorporated by Reference | | Filed
Herewith |
| Form | | File No. | | Exhibit | | Filing Date | |
101.CAL | Inline XBRL Taxonomy Extension Calculation Linkbase Document | | | | | | | | | | X |
101.DEF | Inline XBRL Taxonomy Extension Definition Linkbase Document | | | | | | | | | | X |
101.LAB | Inline XBRL Taxonomy Extension Label Linkbase Document | | | | | | | | | | X |
101.PRE | Inline XBRL Taxonomy Extension Presentation Linkbase Document | | | | | | | | | | X |
| 104 | Cover Page Interactive Data File (formatted as inline XBRL and contained in Exhibit 101) | | | | | | | | | | X |
| | | | | | | | | | | |
| | | | | | | | | | | |
+ Registrant has omitted portions of the relevant exhibit and filed such exhibit separately with the Securities and Exchange Commission pursuant to a request for confidential treatment granted under Rule 406 under the Securities Act of 1933, as amended.
* Indicates a management contract, compensatory plan or arrangement.
** The certifications on Exhibit 32 hereto are deemed not “filed” for purposes of Section 18 of the Securities and Exchange Act of 1934, as amended, or otherwise subject to the liability of that Section. Such certifications will not be deemed incorporated by reference into any filing under the Securities Act or the Exchange Act.
SIGNATURES
Pursuant to the requirements of Section 13 or 15(d) of the Securities Exchange Act of 1934, the registrant has duly caused this report to be signed on its behalf by the undersigned thereunto duly authorized.
Dated: February 3, 2022
| | | | | | | | | | | |
| SERVICENOW, INC. |
| | | |
| By: | | /s/ William R. McDermott |
| | | William R. McDermott
President and Chief Executive Officer |
POWER OF ATTORNEY
KNOW ALL BY THESE PRESENTS, that each person whose signature appears below constitutes and appoints William R. McDermott and Gina Mastantuono, and each of them, as his or her true and lawful attorneys-in-fact and agents, each with the full power of substitution, for him or her and in his or her name, place or stead, in any and all capacities, to sign any and all amendments to this report, and to file the same, with exhibits thereto and other documents in connection therewith, with the Securities and Exchange Commission, granting unto said attorneys-in-fact and agents, and each of them, full power and authority to do and perform each and every act and thing requisite and necessary to be done in and about the premises, as fully to all intents and purposes as he might or could do in person, hereby ratifying and confirming all that said attorneys-in-fact and agents, or their or his substitute or substitutes, may lawfully do or cause to be done by virtue hereof.
Pursuant to the requirements of the Securities Exchange Act of 1934, this report has been signed by the following persons in the capacities and on the dates indicated.
| | | | | | | | | | | | | | |
| Signature | | Title | | Date |
| | | | |
| /s/ William R. McDermott | | President, Chief Executive Officer and Director (Principal Executive Officer) | | February 3, 2022 |
| William R. McDermott | | | |
| | | | |
| /s/ Gina Mastantuono | | Chief Financial Officer (Principal Financial Officer) | | February 3, 2022 |
| Gina Mastantuono | | | |
| | | | |
| /s/ Kevin T. McBride | | SVP, Corporate Controller and Chief Accounting Officer (Principal Accounting Officer) | | February 3, 2022 |
| Kevin T. McBride | | | |
| | | | |
| /s/ Frederic B. Luddy | | Chairman of the Board of Directors | | February 3, 2022 |
| Frederic B. Luddy | | | | |
| | | | |
| /s/ Susan L. Bostrom | | Director | | February 3, 2022 |
| Susan L. Bostrom | | | | |
| | | | |
| /s/ Teresa Briggs | | Director | | February 3, 2022 |
| Teresa Briggs | | | | |
| | | | |
| /s/ Jonathan C. Chadwick | | Director | | February 3, 2022 |
| Jonathan C. Chadwick | | | | |
| | | | |
| /s/ Paul E. Chamberlain | | Director | | February 3, 2022 |
| Paul E. Chamberlain | | | | |
| /s/ Lawrence J. Jackson, Jr. | | Director | | February 3, 2022 |
| Lawrence J. Jackson, Jr. | | | | |
| /s/ Jeffrey A. Miller | | Director | | February 3, 2022 |
| Jeffrey A. Miller | | | | |
| /s/ Joseph M. Quinlan | | Director | | February 3, 2022 |
| Joseph M. Quinlan | | | | |
| /s/ Sukumar Rathnam | | Director | | February 3, 2022 |
| Sukumar Rathnam | | | | |
| /s/ Anita M. Sands | | Director | | February 3, 2022 |
| Anita M. Sands | | | | |
| /s/ Dennis M. Woodside | | Director | | February 3, 2022 |
| Dennis M. Woodside | | | | |