UNITED STATES
SECURITIES AND EXCHANGE COMMISSION
Washington, D.C. 20549
___________________
FORM 10-K
___________________
| ANNUAL REPORT PURSUANT TO SECTION 13 OR 15(d) OF THE SECURITIES EXCHANGE ACT OF 1934 | |||||
For the fiscal year ended December 31 , 2022
or
| TRANSITION REPORT PURSUANT TO SECTION 13 OR 15(d) OF THE SECURITIES EXCHANGE ACT OF 1934 | |||||
Commission file number: 001-33530
(Exact name of registrant as specified in its charter)
| (State or other jurisdiction of incorporation) | (IRS Employer Identification Number) | |||||||||||||||||||
| , | ||||||||||||||||||||
| , | ||||||||||||||||||||
| (Address of principal executive offices, including Zip Code) | (Registrant’s telephone number, including area code) | |||||||||||||||||||
Securities registered pursuant to Section 12(b) of the Act:
| Title of each class | Trading Symbol(s) | Name of each exchange on which registered | ||||||
Securities registered pursuant to Section 12(g) of the Act: None
Indicate by check mark if the registrant is a well-known seasoned issuer, as defined in Rule 405 of the Securities Act.
Yes ☐ No ☒
Indicate by check mark if the registrant is not required to file reports pursuant to Section 13 or Section 15(d) of the Act.
Yes ☐ No ☒
Indicate by check mark whether the registrant (1) has filed all reports required to be filed by Section 13 or 15(d) of the Securities Exchange Act of 1934 during the preceding 12 months (or for such shorter period that the registrant was required to file such reports), and (2) has been subject to such filing requirements for the past 90 days.
Indicate by check mark whether the registrant has submitted electronically every Interactive Data File required to be submitted pursuant to Rule 405 of Regulation S-T (§232.405 of this chapter) during the preceding 12 months (or for such shorter period that the registrant was required to submit such files).
Indicate by check mark whether the registrant is a large accelerated filer, an accelerated filer, a non-accelerated filer, a smaller reporting company, or an emerging growth company. See definitions of “large accelerated filer,” “accelerated filer,” “smaller reporting company,” and “emerging growth company” in Rule 12b-2 of the Exchange Act.
Non-accelerated filer ☐ Smaller reporting company ☐ Emerging growth company ☐
If an emerging growth company, indicate by check mark if the registrant has elected not to use the extended transition period for complying with any new or revised financial accounting standards provided pursuant to Section 13(a) of the Exchange Act.
☐
Indicate by check mark whether the registrant has filed a report on and attestation to its management’s assessment of the effectiveness of its internal control over financial reporting under Section 404(b) of the Sarbanes-Oxley Act (15 U.S.C. 7262(b)) by the registered public accounting firm that prepared or issued its audit report.
If securities are registered pursuant to Section 12(b) of the Act, indicate by check mark whether the financial statements of the registrant included in the filing reflect the correction of an error to previously issued financial statements.
☐
Indicate by check mark whether any of those error corrections are restatements that required a recovery analysis of incentive-based compensation received by any of the registrant’s executive officers during the relevant recovery period pursuant to §240.10D-1(b).
☐
Indicate by check mark whether the registrant is a shell company (as defined in Rule 12b-2 of the Act).
Yes ☐ No ☒
The aggregate market value of voting stock held by non-affiliates of the Registrant was $518,560,146 as of June 30, 2022 (based upon the closing sale price on The New York Stock Exchange for such date). For this purpose, all shares held by directors, executive officers and stockholders beneficially owning ten percent or more of the registrant’s common stock have been treated as held by affiliates. This determination of affiliate status is not necessarily a conclusive determination for other purposes.
The number of shares of the Registrant’s common stock outstanding as of February 22, 2023 was 46,032,886 .
DOCUMENTS INCORPORATED BY REFERENCE
Portions of the Registrant’s definitive Proxy Statement for its 2023 Annual Meeting of Stockholders are incorporated by reference into Part III of this Form 10-K.
TABLE OF CONTENTS
| Item 1. | |||||||||||
| Item 1A. | |||||||||||
| Item 1B. | |||||||||||
| Item 2. | |||||||||||
| Item 3. | |||||||||||
| Item 4. | |||||||||||
| Item 5. | |||||||||||
| Item 6. | |||||||||||
| Item 7. | |||||||||||
| Item 7A. | |||||||||||
| Item 8. | |||||||||||
| Item 9. | |||||||||||
| Item 9A. | |||||||||||
| Item 9B. | |||||||||||
| Item 10. | |||||||||||
| Item 11. | |||||||||||
| Item 12. | |||||||||||
| Item 13. | |||||||||||
| Item 14. | |||||||||||
| Item 15. | |||||||||||
| Item 16. | |||||||||||
PART I
ITEM 1. BUSINESS
Green Brick Partners, Inc. and its subsidiaries (“Green Brick”, “the Company”, “we” or “us”) is a diversified homebuilding and land development company. We acquire and develop land and build homes through our eight brands of builders in five major markets. Our core markets are in the high growth U.S. metropolitan areas of Dallas-Fort Worth (“DFW”) and Austin, Texas, Atlanta, Georgia, as well as the Treasure Coast, Florida area and Colorado Springs, Colorado. We are engaged in all aspects of the homebuilding process, including land acquisition and development, entitlements, design, construction, title and mortgage services, marketing and sales and the creation of brand images at our residential neighborhoods and master planned communities.
We believe we offer higher quality homes with more distinctive designs and floor plans than those built by our competitors at comparable prices. Many of our communities are located in premium locations and we seek to enhance homebuyer satisfaction by utilizing high-quality materials, offering a broad range of customization options and building well-crafted homes. We seek to maximize value over the long term and operate our business to mitigate risks in the event of a downturn by controlling costs and quickly reacting to regional and local market trends.
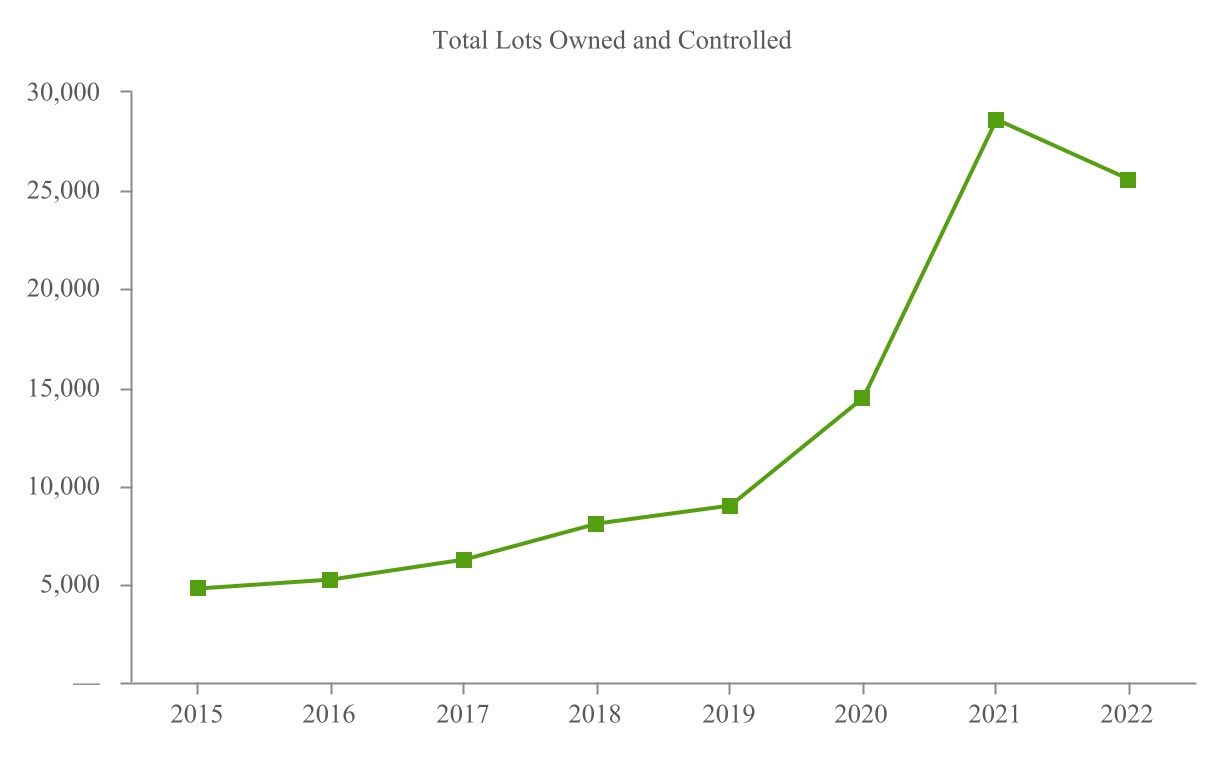
We are a leading lot developer in our markets and believe that our strict operating discipline provides us with a competitive advantage in seeking to maximize returns while minimizing risk. As of December 31, 2022, we owned or controlled approximately 25,500 home sites in high-growth submarkets throughout the DFW, Austin, and Atlanta metropolitan areas and the Treasure Coast, Florida market. We provide finished lots to our subsidiary builders or option lots from third-party developers for our builders’ homebuilding operations and provide them with construction funding and strategic planning. Our Atlanta and Florida builders provide us with their local knowledge and relationships.
We are a Delaware corporation, incorporated in 2006. We commenced operations as a publicly held homebuilding company in 2014. Our principal executive offices are located at 2805 Dallas Pkwy, Ste 400, Plano, TX 75093.
Business Strategy
We believe we are well-positioned for growth through the disciplined execution of the following elements of our strategy:
•Consistent Land Acquisition Program with Disciplined Underwriting. We believe our ability to identify, acquire and develop land in desirable locations and on favorable terms is critical to our success. We evaluate land opportunities based on how we expect such opportunities will contribute to overall profitability and returns. Through our rigorous national underwriting program, we seek to identify attractive properties that are typically located in prime neighborhood locations or in preferred growth corridors. We focus on the development of entitled parcels in communities where we can generally sell all homes within 24 to 60 months from the start of sales. Notwithstanding, we will also invest in longer-term land investments if our return criteria is generated.
•Focus on Markets with a Favorable Growth Outlook and Strong Demand Fundamentals. We have chosen to focus our operations to sunbelt and sunbelt adjacent states because we believe that these markets offer attractive residential real estate investment characteristics, such as growing economies, improving levels of employment, and population growth relative to national averages, favorable migration patterns, general housing affordability, and desirable lifestyle and weather characteristics. We currently generate income from home sales in Texas, Colorado, Florida, and Georgia. Each of these states experienced double-digit growth between 2010 and 2020 while the population of the US only grew 7.3%. In 2022, Texas, Florida and Georgia were ranked first, second and fourth, respectively in terms of population growth according to the U.S. Census Bureau.
•Strategically Increase Market Positions in our Existing Markets. We believe that there are significant opportunities to profitably expand in our core markets. As of December 31 , 2022
•Deliver Superior Designs, Broad Product Ranges and Enhanced Homebuying Experience. We partner our expertise with that of our builders to design attractive neighborhoods and homes to appeal to a wide variety of potential homebuyers. Our homebuilding projects include townhomes, patio homes, single family homes, and luxury homes. We believe we can adapt quickly to changing market conditions and optimize performance and returns while strategically reducing portfolio risk because of our diversified product strategy. One of our core operating philosophies
1
is to create a culture which provides a positive, memorable experience for our homebuyers. In consultation with nationally and locally recognized architecture firms, interior and exterior consultants, and homeowner focus groups, we research and design a diversified range of products for various levels and price points.
•Disciplined Investment Strategy Combined with the Prudent Use of Leverage. We seek to maximize value over the long-term and operate our business to mitigate risks in the event of a downturn by controlling costs and focusing on regional and local market trends. We believe that our strict operating discipline combined with our prudent use of financial leverage to continue to invest in our land acquisition, development and homebuilding businesses provides us with a competitive advantage in seeking to maximize returns while minimizing risk. We target a debt to total capitalization ratio of approximately 30% to 35%, which we expect will continue to provide us with significant additional growth capital. As of December 31 , 2022
•Targeted Expansion into Adjacent Markets. We currently intend to pursue targeted expansion of our entry-level builder, Trophy Signature Homes, into markets within our current states. We believe Trophy’s more affordable product and quicker inventory turns make its platform uniquely scalable to expand outside of the DFW metroplex. We plan to expand Trophy into markets compatible with our existing markets that demonstrate strong trends in demographics, employment, and in-migration by leveraging existing relationships with land developers and homebuilders. In this regard, in February 2022, we began our expansion into the Austin, TX market. In addition, we have traditionally, and may in the future, grow through the acquisition of homebuilders in our current markets or other markets that meet our demographic and economic growth criteria.
Our Builders and Homes
The following table presents general information about each of our builders, including the types of homes they build and their price ranges as of December 31 , 2022
| Builder | Ownership | Market | Products Offered | Price Range | ||||||||||||||||||||||
| Trophy Signature Homes LLC (“Trophy”) | 100% | DFW and Austin | Single family | $270,000 to $1,080,000 | ||||||||||||||||||||||
| CB JENI Homes DFW LLC (“CB JENI”) | 100% | DFW | Townhomes | $270,000 to $630,000 | ||||||||||||||||||||||
| Normandy Homes (“Normandy”) | 100% | DFW | Single family | $450,000 to $1,150,000 | ||||||||||||||||||||||
| SGHDAL LLC (“Southgate”) | 100% | DFW | Luxury homes | $760,000 to $1,570,000 | ||||||||||||||||||||||
| CLH20 LLC (“Centre Living”) | 90% | DFW | Townhomes and Single Family | $380,000 to $930,000 | ||||||||||||||||||||||
| The Providence Group of Georgia LLC (“TPG”) | 50% | Atlanta | Townhomes, Condominiums and Single Family | $360,000 to $1,200,000 | ||||||||||||||||||||||
| GRBK GHO Homes LLC (“GRBK GHO”) | 80% | Treasure Coast | Patio homes and Single Family | $340,000 to $2,290,000 | ||||||||||||||||||||||
GB Challenger, LLC (“Challenger”) | 49.9% | Colorado Springs and Denver | Townhomes and Single Family | $330,000 to $820,000 | ||||||||||||||||||||||
2
Our backlog reflects the number and value of homes for which we have entered into sales contracts with customers but not yet delivered. With the exception of a normal cancellation rate, we expect all of the backlog as of December 31 , 2022
| Year Ended December 31, 2022 | December 31, 2022 | December 31, 2021 | ||||||||||||||||||||||||||||||||||||||||||
| Builder | Average Selling Communities | Selling Communities | Backlog, Units | Backlog, in thousands | Selling Communities | Backlog, Units | Backlog, in thousands | |||||||||||||||||||||||||||||||||||||
| Trophy | 25 | 28 | 143 | $ | 78,840 | 23 | 413 | $ | 246,668 | |||||||||||||||||||||||||||||||||||
CB JENI (1) | 15 | 16 | 121 | 72,395 | 15 | 283 | 139,531 | |||||||||||||||||||||||||||||||||||||
| Southgate | 4 | 4 | 38 | 44,045 | 4 | 158 | 131,455 | |||||||||||||||||||||||||||||||||||||
| Centre Living | 4 | 3 | 22 | 12,352 | 5 | 45 | 24,289 | |||||||||||||||||||||||||||||||||||||
| TPG | 19 | 20 | 111 | 77,431 | 19 | 352 | 200,405 | |||||||||||||||||||||||||||||||||||||
| GRBK GHO | 9 | 9 | 102 | 84,032 | 8 | 229 | 127,508 | |||||||||||||||||||||||||||||||||||||
Total (2) | 76 | 80 | 537 | $ | 369,095 | 74 | 1,480 | $ | 869,856 | |||||||||||||||||||||||||||||||||||
(1)Includes Normandy Homes.
(2)GB Challenger is not included in the table above as Green Brick does not have a controlling financial interest in Challenger. Our investment in Challenger is treated as an unconsolidated investment under the equity method of accounting and is included in investments in unconsolidated entities in our consolidated balance sheets.
In response to our customers expressed desire for an expedited and transparent sales process, we offer a selection of homes with simplified, all upgrades included options. Our Trophy Signature Homes and CB JENI X lines have been at the forefront of creating an honest, easy to follow, sales experience that seeks to offer simplified solutions with top-of-the-line finishes regardless of a homebuyer’s price range. We believe that this streamlined process and focus on operational efficiency has enabled us to react quickly to the rise of the work from home lifestyle of our homebuyers. As a result, we have launched updated plans with a focus on dedicated office spaces, home integrations with the newest technology, and the latest in energy-efficient solutions including tankless water heaters, high-efficiency LED lighting, ENERGY STAR rated appliances, and low flow bathroom fixtures.
We are focused on creating environmentally sustainable products, and our purchasing power enables us to include green features in our homes. Each new home we build is healthier and more energy efficient, and has less impact on the environment than prior generations of homes as a result of features like:
•Low-VOC paint that reduces pollution;
•WaterSense® faucets that reduce water flow without sacrificing performance;
• Low-E windows that reduce infrared and ultraviolet light coming into the home; and
•Energy Star® appliances that reduce energy consumption.
Land Policy
Our land inventory strategy strives to provide us with a multi-year supply of lots for each of our brands for future homebuilding while limiting excess supply that would be subject to market cycle risk. With certain exceptions, we focus on the development of entitled parcels in communities where we can generally sell all lots and homes within 24 to 60 months from the start of sales. This focus allows us to limit exposure to land development and land risks while pursuing favorable returns on our investments. We seek to minimize our exposure to land risk through disciplined management of entitlements, the use of land and lot options, and other flexible land acquisition arrangements. We are actively involved in every step of the land entitlement, home design, and construction processes with our builders.
Our land teams focus on acquiring well located land that will position us to deliver future earnings growth in 2023 and beyond. As of December 31 , 2022December 31 , 2022
3
Marketing and Sales Process
We sell our homes primarily from models that we have designed and constructed. We employ new home consultants who are paid salaries, commissions or both to conduct on-site sales of our homes. Our in-house sales force typically works from sales offices located in model homes in or near each community. Sales representatives assist potential buyers by providing them with basic floor plans, price information, development and construction timetables, virtual and in-person tours of model homes, and upgrade options. Sales personnel are trained by us and generally have had prior experience selling new homes in the local market. Our personnel, along with subcontracted marketing and design consultants, carefully design the exterior and interior of each home to appeal to the lifestyles of targeted homebuyers. We also sell homes through independent realtors.
We offer a preferred lender referral program through our mortgage joint venture to provide lending options to homebuyers in need of financing. We also offer homeowners a comprehensive warranty on each home. Homes are generally covered by an eight to ten-year warranty for structural concerns, one year for defects and products used, and two years for electrical, plumbing, heating, ventilation, and air conditioning parts and labor.
Our marketing strategy has increasingly involved advertising through digital channels including real estate listing sites, paid search, display advertising, social media, and e-mail marketing, all of which drive traffic to our builders’ websites. This has allowed us to attract more qualified and knowledgeable homebuyers and has helped us reduce our selling, general and administrative expenses as a percentage of home sales revenues. However, we also continue to advertise through more traditional media on a limited basis, including newspapers, radio advertisements, other local and regional publications, and on billboards where appropriate. We tailor our marketing strategy and message based on the community being advertised and the customers being targeted.
Financial Services
In addition to independently branded subsidiary homebuilders, Green Brick Partners retains 100% ownership in Green Brick Title and 49% ownership in BHome Mortgage. Our financial services help our customers bring their homebuying dreams into reality by providing mortgage and title services, allowing for a one-stop-shop solution. Through BHome Mortgage, our mortgage services buyers can expect personal attention from their first meeting through the closing of their new home. As part of the Green Brick Partners family, Green Brick Title’s unprecedented access to resources beyond those of a traditional title company enables us to always stay one step ahead of our competition and bring buyers unmatched customer service.
4
Raw Materials
Typically, all the raw materials and most of the components used in our business are readily available in the United States. Most are standard items carried by major suppliers. However, the rapid increase in the number of homes started during 2021 through the first half of 2022 caused shortages in the availability of such materials and in the price of services, thereby leading to delays in the delivery of homes and increased home construction prices. We continue to monitor the supply markets to achieve the best prices available. See “Risk Factors - Labor and raw material shortages and price fluctuations could delay or increase the cost of land development and home construction, which could materially and adversely affect our business.”
Seasonality
The homebuilding industry experiences seasonal fluctuations in quarterly operating results and capital requirements. We typically experience the highest new home order activity in spring and summer, although this activity is also highly dependent on the number of active selling communities, timing of new community openings, and other market factors. Since it typically has taken five to nine months to construct a new home, we have historically delivered more homes in the second half of the year as spring and summer home orders are delivered. Because of this seasonality, home starts, construction costs and related cash outflows have historically been highest in the second and third quarters, and the majority of cash receipts from home deliveries occur during the third and fourth quarters. We expect this seasonal pattern to continue over the long-term, although it may be affected by volatility in the homebuilding industry. Due to the significant increase in home demand and the more limited supply of both existing homes and speculative home inventory from all builders for the past two years, such seasonal patterns have been far less evident in our business operations.
Competition
Competition in the homebuilding industry is intense, and there are relatively low barriers to entry. Homebuilders compete for, among other things, homebuyers, desirable land parcels, financing, raw materials, and skilled labor. Increased competition could hurt our business, as it could prevent us from acquiring attractive land parcels on which to build homes or make such acquisitions more expensive, hinder our market share expansion, and lead to pricing pressures on our homes that may adversely impact our revenues and margins. Our competitors may independently develop land and construct housing units that are superior or substantially similar to our products. Furthermore, a number of our primary competitors are significantly larger, have a longer operating history, and may have greater resources or lower cost of capital; accordingly, they may be able to compete more effectively in one or more of the markets in which we operate. Many of these competitors also have longstanding relationships with subcontractors and suppliers in the markets in which we operate. We also compete for sales with individual resales of existing homes and with available rental housing.
Human Capital Resources
Attracting, retaining, and building talent is critical in our business. We continue to recruit talented team members that exhibit superior emotional intelligence. This focus on a staff that places a strong emphasis on communication and navigating a fast-paced environment empathetically and judiciously enables us to operate effectively and efficiently each day. We seek to establish a supportive culture that fosters a strong sense of ownership and a continuous drive to excel. Our goal is to not just empower our team members with the tools needed to succeed but to create a community that focuses on taking ownership of one’s work. Our culture celebrates individual success, primes our employees for growth, and is critical in maintaining our competitive edge over our peers.
At December 31 , 2022550 full-time employees, including approximately 500 who were involved in our homebuilding operations, with locations in Dallas-Ft. Worth and Austin, Texas, Atlanta, Georgia and the Treasure Coast, Florida, and approximately 50 in management and administration. Our operations are carried out through both local and centralized management. Our centralized management sets our strategy and leads decisions related to our land acquisition, national purchasing, marketing analytics, risk management, finance, cash management, capital allocation, human resources management, and IT support for our builders. Our homebuilder operations consist of our division employees, led by management with significant homebuilding experience and who possess a depth of knowledge in their particular markets, and include employees responsible for the design, construction oversight, marketing, and sales of our homes. We act solely as a general contractor, and all construction operations are coordinated by our project managers and field superintendents who schedule and monitor third-party independent subcontractors. Our ability to deliver our homes is dependent on the availability and quality of the subcontractors, such as electricians, plumbers, drywall installers, and bricklayers with whom we partner to build our homes. We do not have collective bargaining agreements relating to any of our employees. We offer our employees a compensation package with a broad range of company-paid benefits, including medical, dental, life insurance, and other health and welfare plans, that we believe are competitive.
5
We believe having a diverse and inclusive work environment, where everyone has a sense of belonging, not only drives engagement but fosters innovation, which is critical to driving growth. Our management teams are expected to exhibit and promote honest, ethical and respectful conduct in the workplace. All of our employees must adhere to a code of conduct that sets standards for appropriate behavior and includes required internal training on preventing, identifying, reporting and stopping any type of discrimination. Furthermore, our management team supports a culture of developing future leaders from our existing workforce, enabling us to promote from within for many leadership positions. We believe this provides long-term focus and continuity to our operations while also providing opportunities for the growth and advancement of our employees.
Governmental Regulations and Environmental Regulation
Homebuilding Related Regulations. We are subject to various local, state, and federal statutes, ordinances, rules, and regulations concerning zoning, building design, construction, and similar matters, including local regulations that impose restrictive zoning and density requirements. In addition, local and state governments have broad discretion regarding the imposition of development fees for projects under their jurisdictions. Governing agencies may also require concessions or may require the developer to commit to providing roads and other offsite infrastructure, the costs of which can be substantial, and may require them to be in place prior to the commencement of new home construction. In addition, governing agencies may impose construction moratoriums which could subject us to delays or may preclude us entirely from developing communities due to building moratoriums, “no growth” or “slow growth” initiatives or building permit allocation ordinances, which could be implemented in the future. In addition, we are subject to various licensing, registration, and filing requirements in connection with the construction, advertisement, and sale of homes in our communities. Also, some states are attempting to make homebuilders responsible for violations of wage and other labor laws by their subcontractors.
Environmental Regulations. We are subject to a variety of local, state, and federal statutes, ordinances, rules and regulations concerning the protection of the environment. The particular environmental laws that apply to any given homebuilding site vary according to multiple factors, including the site’s location, its environmental conditions, and the present and former uses of the site and adjoining properties. In some markets, we are subject to environmentally-sensitive land ordinances that mandate open space areas with public elements in housing developments, and prevent development on hillsides, wetlands and other protected areas. We must also comply with open space restrictions, flood plain restrictions, desert wash area restrictions, native plant regulations, endangered species acts, and view restrictions. In those cases where an endangered or threatened species is involved, environmental rules and regulations can result in the restriction or elimination of development in identified environmentally sensitive areas. From time to time, the United States Environmental Protection Agency and similar federal or state agencies review homebuilders’ compliance with environmental laws and may levy fines and penalties for failure to comply strictly with applicable environmental laws or impose additional requirements for future compliance as a result of past failures. Any such actions taken may increase our costs. Further, we expect that increasingly stringent requirements will be imposed on homebuilders and land developers in the future.
Energy and Climate Change Related Regulations. There is constantly a variety of new legislation being enacted, or considered for enactment at the federal, state and local levels relating to energy and climate change. Some of this legislation relates to items such as carbon dioxide emissions control and building codes that impose energy efficiency standards. New building code requirements that impose stricter energy efficiency standards could significantly increase the cost to construct homes, although our energy-efficiency technologies and offerings meet, and in many instances exceed, current and expected energy efficiency thresholds. As climate change concerns continue to grow, legislation and regulations of this nature are expected to continue and may result in increased costs and longer approval and development timelines. Similarly, energy and environment-related initiatives affect a wide variety of companies throughout the United States and the world, and because our operations are heavily dependent on significant amounts of raw materials, such as lumber, steel, and concrete, such initiatives could have an indirect adverse impact on our operations and profitability to the extent the manufacturers and suppliers of our materials are burdened with expensive carbon dioxide emissions control and other environmental and energy-related regulations.
Available Information
Our website address is www.greenbrickpartners.com. Our Annual Reports on Form 10-K, Quarterly Reports on Form 10-Q, Current Reports on Form 8-K and amendments to those reports filed or furnished pursuant to Section 13 or 15(d) of the Exchange Act are available free of charge through our website as soon as reasonably practicable after they are electronically filed with, or furnished to, the Securities and Exchange Commission (the “SEC”). Our website and the information contained or incorporated therein are not intended to be incorporated into this Annual Report on Form 10-K.
6
ITEM 1A. RISK FACTORS
Set forth below are the risks that we believe are material to our investors. Any of these risks could significantly and adversely affect our business, financial condition and results of operations. You should carefully consider the risks described below, together with the other information included in this Annual Report on Form 10-K, including the information contained under the caption “Forward-Looking Statements”.
Risks Related to our Business and Industry
The homebuilding industry is cyclical. A severe downturn in the industry could adversely affect our business, results of operations and stockholders’ equity.
The residential homebuilding industry is cyclical and is highly sensitive to changes in general economic conditions such as levels of employment, consumer confidence and income, availability of financing for acquisitions, construction and permanent mortgages, interest rate levels, inflation and demand for housing. The U.S. housing market could be negatively impacted by declining consumer confidence, restrictive mortgage standards and large supplies of foreclosures, resales and new homes, among other factors. These conditions, combined with a prolonged economic downturn, high unemployment levels, increases in the rate of inflation and uncertainty in the U.S. economy, could contribute to higher cancellation rates, decreased demand for housing, increased market inventory of new homes, reduced sales prices and increased pricing pressure. Lower demand for our homes, combined with lower sales prices or the offering of other incentives or concessions would also have an adverse impact on our margins. If demand for housing stalls or declines, we could experience declines in the market value of our inventory and demand for our lots, homes and construction loans, which could have a material adverse effect on our business, liquidity, financial condition and results of operations.
Our operating performance is subject to risks associated with the real estate industry.
Real estate investments are susceptible to various risks, fluctuations and cycles in value and demand, many of which are beyond our control. Certain events may decrease cash available for operations and the value of our real estate assets. These events include, but are not limited to:
•adverse changes in international, national or local economic and demographic conditions;
•adverse changes in financial conditions of buyers and sellers of properties, particularly residential homes and land suitable for development of residential homes;
•competition from other real estate investors with significant capital, including other real estate operating companies and developers and institutional investment funds;
•fluctuations in interest rates, which could adversely affect the ability of homebuyers to obtain financing on favorable terms or their willingness to obtain financing at all;
•unanticipated increases in expenses, including, without limitation, insurance costs, development costs, real estate assessments and other taxes and costs of compliance with laws, regulations and governmental policies; and
•changes in enforcement of laws, regulations and governmental policies, including, without limitation, health, safety, environmental, zoning and tax laws.
Adverse changes in macroeconomic conditions in and around the markets we operate in, and where prospective purchasers of our homes live, could reduce the demand and adversely affect our business, results of operations, and financial condition.
Adverse changes in economic conditions in markets where we conduct our operations and where prospective purchasers of our homes live have had and may in the future have a negative impact on our business. Adverse changes in employment and median income levels, job growth, consumer confidence, interest rates, perceptions regarding the strength of the housing market, and population growth, or an oversupply of homes for sale may reduce demand or depress prices for our homes and cause home buyers to cancel their agreements to purchase our homes. This, in turn, could adversely affect our results of operations and financial condition.
In addition, periods of economic slowdown or recession, rising interest rates or declining demand for real estate, or the public perception that any of these events may occur, could result in a general decline in the purchase of homes or an increased incidence of home order cancellations. If we cannot successfully implement our business strategy, our business, liquidity, financial condition and results of operations will be adversely affected.
7
Our business and financial results could be adversely affected by significant inflation or deflation.
Inflation can adversely affect our homebuilding operations by increasing costs of land, financing, materials, labor and construction. While we attempt to pass on cost increases to homebuyers by increasing prices, we may not be able to offset cost increases with higher selling prices in a weak housing market. In addition, significant inflation is often accompanied by higher interest rates, which have a negative impact on housing demand. In a highly inflationary environment, depending on industry and other economic conditions, we may be precluded from raising home prices enough to keep up with the rate of inflation or may have to discount prices which could reduce our profit margins. Moreover, with inflation, the costs of capital increase and the purchasing power of our cash resources could decline. The current and continued economic conditions of high inflation
and rising interest rates, especially increases in mortgage rates, could lead to a decrease in demand for new homes. Current or future efforts by the government to stimulate the economy may increase the risk of significant inflation and its adverse impact on our business or financial results.
Alternatively, a significant period of deflation could cause a decrease in overall spending and borrowing levels. This could lead to a deterioration in economic conditions, including an increase in the rate of unemployment. Deflation could cause the value of our inventory to decline or reduce the value of existing homes below the related mortgage loan balance, which could potentially increase the supply of existing homes and have a negative impact on our results of operations.
We depend on the availability and satisfactory performance of subcontractors. Our business could be negatively affected if our subcontractors are not able to perform.
We conduct our land development and homebuilding operations primarily as a general contractor. Our unaffiliated third-party subcontractors perform virtually all of our land development and constructions. Consequently, the timing and quality of the development of our land and the construction of our homes depends on the availability and skill of our subcontractors. There may not be sufficient availability of and satisfactory performance by these unaffiliated third-party subcontractors in the markets in which we operate. If there are inadequate subcontractor resources, our ability to meet customer demands, both timing and quality, could be adversely affected which could have a material adverse effect on our reputation, our future growth and our profitability.
Labor and raw material shortages and price fluctuations could delay or increase the cost of land development and home construction, which could materially and adversely affect our business.
The residential construction industry experiences labor and raw material shortages from time to time, including shortages in qualified tradespeople and in supplies such as insulation, drywall, cement, steel and lumber. These labor and raw material shortages can be more severe during periods of strong demand for housing or when a region in which we operate experiences a natural disaster that has a significant impact on existing residential and commercial structures. Significant increases in the demand for new homes result in extended lead times, supply shortages and price increases because of the heightened demand for the raw materials, products and appliances. For example, we have previously, and may in the future experience price increases, shortages and extensions to our lead time for the delivery of materials such as lumber, appliances and windows. This has and may continue to result in longer construction periods, delays in home closings and margin compression if we are unable to increase our sales prices accordingly.
The cost of labor and raw materials may also be adversely affected during periods of shortage or high inflation. Shortages and price increases could cause delays in, and increase our costs of, land development and home construction, which we may not be able to offset by raising home prices due to market demand and because the price for each home is typically set prior to its delivery pursuant to the agreement of sale with the homebuyer. In addition, the federal government has at various times in recent years imposed tariffs on a variety of imports from foreign countries and may impose additional tariffs in the future. Significant tariffs or other restrictions that are placed on raw materials that we use in our homebuilding operation, such as lumber or steel, could cause the cost of home construction to increase which we may not be able to offset by raising home prices or which could slow our absorption due to constraints on market demand. As a result, shortages or increased costs of labor and raw materials could have a material adverse effect on our business, prospects, financial condition and results of operations.
Failure to recruit, retain and develop highly skilled, competent employees may have a material adverse effect on our business and results of operations.
Our success depends on the continued performance of key employees, including management team members at both the corporate and homebuilder subsidiary levels. Our results of operations could suffer if any of the management team members decided to terminate their employment with us. Our ability to retain our management team or to attract suitable replacements should any members of our management team leave is dependent on the competitive nature of the employment market. The loss of services from key management team members or a limitation in their availability could materially and adversely impact our
8
business, liquidity, financial condition and results of operations. Such a loss could also be negatively perceived in the capital markets. We do not maintain key person insurance with respect to any member of our named executive officers.
Furthermore, key employees working in the land development, homebuilding and construction industries are highly sought after. Experienced employees in the homebuilding, land acquisition, and construction industries are fundamental to our ability to generate, obtain and manage opportunities. In particular, local knowledge and relationships are critical to our ability to source attractive land acquisition opportunities. Failure to attract and retain such personnel or to ensure that their experience and knowledge is not lost when they leave the business through retirement, redundancy or otherwise may adversely affect the standards of our service and may have an adverse impact on our business, financial conditions and results of operations.
We may be unable to achieve our objectives because of our inability to execute on our business strategies.
Our business objectives include expanding into new markets and becoming a more capital and operationally efficient home builder. We cannot guarantee that our strategies to meet these objectives will be successful or that they will result in growth, and increased earnings or returns within our desired time frame. We cannot guarantee that we will achieve positive operational or financial results in the future, or results that are equal to or better than those attained in the past. We also cannot provide any assurance that we will be able to maintain our strategies in the future. Due to unexpectedly favorable or unfavorable market conditions or other factors, we may determine that we need to adjust, refine or abandon all or portions of our strategies, and any related initiatives or actions. We cannot guarantee that any such adjustments will be successful. The failure of any one or more of our present strategies, or any related initiatives or actions, or the failure of any adjustments that we may pursue or implement, could have an adverse effect on our ability to increase the value and profitability of our business, our ability to operate our business in the ordinary course, our overall liquidity, and our consolidated financial statements. The effect in each case could be material.
Our long-term success depends on our ability to acquire undeveloped land, partially finished developed lots and finished lots suitable for residential homebuilding at reasonable prices, in accordance with our land investment criteria.
The homebuilding industry is highly competitive for suitable land and the risk inherent in purchasing and developing land is directly impacted by changes in consumer demand for housing. The availability of finished and partially finished developed lots and undeveloped land for purchase that meet our investment criteria depends on a number of factors outside our control, including land availability, competition with other homebuilders and land buyers, inflation in land prices, zoning, allowable housing density, the ability to obtain building permits and other regulatory requirements. Should suitable land or lots become more difficult to locate or obtain, the number of lots we may be able to develop and sell could decrease, the number of homes we may be able to build and sell could decrease and the cost of land could increase substantially, which could adversely impact our results of operations.
As competition for suitable land increases, the cost of acquiring both finished and undeveloped lots and the cost of developing owned land could rise and the availability of suitable land at acceptable prices may decline, which could adversely impact our financial results. The availability of suitable land assets could also affect the success of our land acquisition strategy, which may impact our ability to increase the number of active selling communities, to grow our revenues and margins and to achieve or maintain profitability.
Our results of operations could be adversely affected if we are unable to develop communities successfully or within expected timeframes.
Before a community generates any revenue, time and material expenditures are required to acquire and prepare land, entitle and finish lots, obtain development approvals, pay taxes and construct significant portions of project infrastructure, amenities, model homes and sales facilities. It can take several years from the time that we acquire control of a property to the time that we make our first home sale on the site. Delays in the development of communities expose us to the risk of changes in market conditions for homes. A decline in our ability to develop and market our communities successfully and to generate positive cash flow from these operations in a timely manner could have a material adverse effect on our business and results of operations and on our ability to service our debt and meet our working capital requirements.
Real estate investments are relatively illiquid. As a result, our ability to promptly sell one or more properties in response to changing economic, financial and investment conditions may be limited, and we may be forced to hold non-income producing assets for an extended period of time. We cannot predict whether we will be able to sell any property for the price or on the terms that we set or whether any price or other terms offered by a prospective purchaser would be acceptable to us. We also cannot predict the length of time needed to find a willing purchaser and to close the sale of a property.
9
Our future growth may include additional strategic investments, joint ventures, partnerships and/or acquisitions of companies that may not be as successful as we anticipate and could disrupt our ongoing businesses and adversely affect our operations.
Our investments in our homebuilding subsidiaries have contributed to our historical growth and similar investments may be a component of our growth strategy in the future. We may make additional strategic investments, enter into new joint venture or partnership arrangements or acquire businesses, some of which may be significant. These endeavors may involve significant risks and uncertainties, including distraction of management from current operations, significant start-up costs, insufficient revenues to offset expenses associated with these new investments and inadequate return on capital in these investments, any of which may adversely affect our financial condition and results of operations. Our failure to successfully identify and manage future investments, joint ventures, partnerships or acquisitions could harm our results of operations.
Our geographic concentration could materially and adversely affect us if the homebuilding industry in our current markets decline.
In the DFW metropolitan area, we primarily operate in the counties of Dallas, Collin, Denton, Ellis, Rockwall, Tarrant, Kaufman, Hunt, and Johnson. In Austin, we primarily operate in the counties of Bastrop and Travis. In Atlanta, we primarily operate in the counties of Fulton, Gwinnett, Cobb, Forsyth, Cherokee and Dekalb. In Florida, we primarily operate in the counties of Indian River and St. Lucie. We may not realize our favorable growth outlook if housing demand and population growth stagnate or decrease in our core markets. Furthermore, we may be unable to compete effectively with the resale home market in our core markets. Because our operations are concentrated in these areas, a prolonged economic downturn in one or more of these areas could have a material adverse effect on our business, liquidity, financial condition and results of operations, and a disproportionately greater impact on us than other homebuilders with more diversified operations. Further, slower rates of population growth or population declines in the DFW, Austin, Atlanta or Treasure Coast markets, especially as compared to the high population growth rates in prior years, could affect the demand for housing, causing home prices in these markets to decline and adversely affect our business, financial condition and results of operations.
Our developments are subject to government regulations, which could cause us to incur significant liabilities or restrict our business activities.
Our developments are subject to numerous local, state, federal and other statutes, ordinances, rules and regulations concerning zoning, development, building design, construction and similar matters that impose restrictive zoning and density requirements, which impose limitations on the number and type of homes that can be built within the boundaries of a particular area. Projects that are not yet entitled may be subjected to periodic delays, changes in use, less intensive development or elimination of development in certain specific areas due to government regulations. We may also be subject to periodic delays or may be precluded entirely from developing in certain communities due to building moratoriums or “slow-growth” or “no-growth” initiatives that could be implemented in the future. Local governments also have broad discretion regarding the imposition of development and service fees for projects in their jurisdiction. Projects for which we have received land use and development entitlements or approvals may still require a variety of other governmental approvals and permits during the development process and can also be impacted adversely by unforeseen health, safety and welfare issues, which can further delay these projects or prevent their development. As a result, lot and home sales could decline and costs could increase, which could have a material adverse effect on our current results of operations and our long-term growth prospects.
Changes in global or regional environmental conditions and governmental actions in response to such changes may adversely affect us by increasing the costs of or restricting our planned or future growth activities.
There is growing concern from many members of the scientific community and the general public that an increase in global average temperatures due to emissions of greenhouse gases and other human activities have caused, or will cause, significant changes in weather patterns and increase the frequency and severity of natural disasters. Government mandates, standards or regulations intended to reduce greenhouse gas emissions or projected climate change impacts have resulted, and are likely to continue to result, in restrictions on land development in certain areas and increased energy, transportation and raw material costs. Governmental requirements directed at reducing effects on climate could cause us to incur expenses that we cannot recover or that will require us to increase the price of homes we sell to the point that it affects demand for those homes.
Our financial condition and results of operations may be adversely affected by a decrease in the value of our land or homes and the associated carrying costs.
We continuously acquire land for replacement of land inventory and expansion within our current markets and may in the future acquire land for expansion into new markets. However, the market value of land, building lots and housing inventories can fluctuate significantly due to changing market conditions. The measures we employ to manage inventory risk may not be adequate to insulate our operations from a severe drop in inventory values. If housing demand decreases below what we
10
anticipated when we acquired our inventory, we may not be able to generate profits consistent with those we have generated in the past and we may not be able to recover our costs when we sell lots and homes. When market conditions are such that land values are not appreciating, option arrangements previously entered into may become less desirable, at which time we may elect to forgo deposits and pre-acquisition costs and terminate such arrangements. During adverse market conditions, we may have substantially higher inventory carrying costs, may have to write down our inventory as a result of impairment and/or may have to sell land or homes at a loss. Any material write-downs of assets, or sales at a loss, could have a material adverse effect on our financial condition and results of operations.
Demand for our homes and lots is dependent on the cost and availability of mortgage financing.
Our business depends on the ability of our homebuyers, as well as the ability of those who buy homes from the third-party homebuilding entities to which we sell lots (our “homebuilding customers”), to obtain financing for the purchase of their homes. Many of these homebuyers must sell their existing homes in order to buy a home from us or our homebuilding customers. Rising interest rates, decreased availability of mortgage financing or of certain mortgage programs, higher down payment requirements or increased monthly mortgage costs may lead to reduced demand for our homes and lots. Higher interest rates can also hinder our ability to realize our backlog because certain of our home purchase contracts provide homebuyers with a financing contingency. Financing contingencies allow homebuyers to cancel their home purchase contracts in the event that they cannot arrange for adequate financing within a certain time period after the execution of the home purchase contracts. As a result, rising interest rates can decrease our home sales and mortgage originations. Any of these factors could have a material adverse effect on our business, liquidity, financial condition and results of operations.
In addition, the federal government has a significant role in supporting mortgage lending through its conservatorship of Federal National Mortgage Association (“Fannie Mae”) and Federal Home Loan Mortgage Corporation (“Freddie Mac”), both of which purchase home mortgages and mortgage-backed securities originated by mortgage lenders, and its insurance of mortgages originated by lenders through the Federal Housing Administration (the “FHA”) and the Veterans Administration (“VA”). The availability and affordability of mortgage loans, including consumer interest rates for such loans, could be adversely affected by a curtailment or cessation of the federal government’s mortgage-related programs or policies. The FHA may continue to impose stricter loan qualification standards, raise minimum down payment requirements, impose higher mortgage insurance premiums and other costs and/or limit the number of mortgages it insures. Due to growing federal budget deficits, the U.S. Treasury may not be able to continue supporting the mortgage-related activities of Fannie Mae, Freddie Mac, the FHA and the VA at present levels, or it may significantly revise the federal government’s participation in and support of the residential mortgage market. Because the availability of Fannie Mae, Freddie Mac, FHA- and VA-backed mortgage financing is an important factor in marketing and selling many of our homes, any limitations, restrictions or changes in the availability of such government-backed financing could reduce our home sales, which could have a material adverse effect on our business, liquidity, financial condition and results of operations.
High cancellation rates may negatively impact our business.
Our backlog reflects the number and value of homes for which we have entered into sales contracts with homebuyers but not yet delivered. Although these sales contracts require a cash deposit, a homebuyer may in certain circumstances cancel the contract and receive a complete or partial refund of the deposit as a result of state or local laws and our contract provisions. If home prices decline, the national or local homebuilding environment or general economy weakens, our neighboring competitors reduce their sales prices (or increase their sales incentives), interest rates increase or the availability of mortgage financing tightens, homebuyers may have an incentive to cancel their contracts with us, even where they might be entitled to no refund or only a partial refund. Significant cancellations could have a material adverse effect on our business as a result of lost sales revenue and the accumulation of unsold housing inventory.
Any increase in unemployment or underemployment may lead to an increase in the number of loan delinquencies and property repossessions, which would have an adverse impact on our business.
People who are unemployed, underemployed, who have left the labor force or are concerned about the loss of their jobs are less likely to purchase new homes. They may also be forced to sell their homes as they face difficulties in making required mortgage payments. Therefore, any increase in unemployment or underemployment may lead to an increase in the number of loan delinquencies and property repossessions. Such a condition could have an adverse impact on our business both by reducing demand for our homes, lots and construction loans and by increasing the supply of homes for sale.
Our results of operations could be adversely impacted by negative events at, or performance of, our partially owned controlled builders.
We participate in the homebuilding business, in part, through non-wholly owned subsidiaries, which we refer to as our “controlled builders.” We exercise control over the operations of each controlled builder. We have entered into arrangements
11
with these controlled builders in order to take advantage of their local knowledge and relationships, acquire attractive land positions and brand images, manage our risk profile and leverage our capital base. Even though the co-investors in our controlled builders are subject to certain non-competition provisions, the viability of our participation in the homebuilding business depends on our ability to maintain good relationships with our controlled builders.
The effectiveness of our management, the value of our expertise and the rapport we maintain with our controlled builders are important factors for new builders considering doing business with us and may affect our ability to attract homebuyers, subcontractors, employees or others upon whom our business and results of operations ultimately depend. Further, our relationships with our controlled builders generate additional business opportunities that support our growth. If we are unable to maintain good relationships with our controlled builders, we may be unable to fully take advantage of existing agreements, expand our relationships with these controlled builders or capitalize on future opportunities with additional builders.
In Atlanta, we sell lots to one of our controlled builders for its homebuilding operations and provide it loans to finance home construction. If our controlled builder fails to successfully execute its business strategies for any reason, it may be unable to purchase lots from us, repay outstanding construction finance loans made by us or borrow from us in the future, any of which could negatively impact our business, financial condition and results of operations.
Increases in the after-tax costs of owning a home could reduce demand for our homes and lots.
On December 22, 2017, the U.S. government enacted comprehensive tax legislation commonly referred to as the Tax Cuts and Jobs Act (the “Tax Act”). The Tax Act made major changes to the Internal Revenue Code that, in part, affect the after-tax cost of owning a home. Specifically, the Tax Act limited the ability of homebuyers to deduct (i) property taxes, (ii) mortgage interest, and (iii) state and local income taxes. The annual deduction for real estate taxes and state and local income taxes (or sales taxes in lieu of income taxes) is now generally limited to $10,000. These changes increased the after-tax cost of owning a new home for many of our potential homebuyers and the potential homebuyers of our homebuilding customers.
If the federal government or a state government further changes its income tax laws to further eliminate or substantially limit these income tax deductions, the after-tax cost of owning a new home would further increase for many of our potential customers.
The loss or reduction of homeowner tax deductions that have historically been available has reduced and could further reduce the perceived affordability of homeownership, and therefore the demand for and sales price of new homes, including ours. In addition, increases in property tax rates or fees on developers by local governmental authorities, as experienced in response to reduced federal and state funding or to fund local initiatives, such as funding schools or road improvements, or increases in insurance premiums can adversely affect the ability of potential customers to obtain financing or their desire to purchase new homes, and can have an adverse impact on our business and financial results.
Severe weather conditions, natural disasters, acts of war or terrorism could increase our operating expenses and reduce our revenues and cash flows.
The climates and geology of the states in which we operate present increased risks of severe weather conditions and natural disasters. The occurrence of severe weather conditions or natural disasters can delay new home deliveries and lot development, reduce the availability of materials and/or negatively impact the demand for new homes in affected areas.
Additionally, to the extent that hurricanes, severe storms, earthquakes, tornadoes, droughts, floods, wildfires or other natural disasters or similar events occur, our homes under construction or our lots under development could be damaged or destroyed, which may result in losses exceeding our insurance coverage. Any of these events could increase our operating expenses, impair our cash flows and reduce our revenues. To the extent that climate change increases the frequency and severity of weather-related disasters, we may experience increasing negative weather-related impacts to our operations in the future.
Further, acts of war, any outbreak or escalation of hostilities between the United States and any foreign power or acts of terrorism may cause disruptions to the U.S. economy or the local economies of the markets in which we operate, cause shortages of building materials, increase costs associated with obtaining building materials, result in building code changes that could increase costs of construction, affect job growth and consumer confidence or cause economic changes that we cannot anticipate, all of which could reduce demand for our lots, homes and construction loans and adversely impact our business and results of operations.
12
We may not be able to compete effectively against competitors in the homebuilding, land development and financial services industries.
Competition in the land development and homebuilding industries in our markets is intense, and there are relatively low barriers to entry. Land developers and homebuilders compete for, among other things, homebuyers, desirable land parcels, financing, raw materials and skilled labor. Increased competition could hurt our business, as it could prevent us from acquiring attractive land parcels for development and resale or homebuilding (or make such acquisitions more expensive), hinder our market share expansion and lead to pricing pressures that adversely impact our margins and revenues. Our business, liquidity, financial condition and results of operations could be materially and adversely affected if we are unable to compete successfully. Our competitors may independently develop land and construct housing units that are superior or substantially similar to our products. Furthermore, a number of our primary competitors are significantly larger, have a longer operating history and may have greater resources or lower cost of capital than us. Accordingly, competitors may be able to compete more effectively in one or more of the markets in which we operate. Many of these competitors also have longstanding relationships with subcontractors and suppliers in the markets in which we operate. Our homebuilding business also competes for sales with individual resales of existing homes and with available rental housing.
Our construction financing business competes with other lenders, including national, regional and local banks and other financial institutions, some of which have greater access to capital or different lending criteria and may be able to offer more attractive financing to potential homebuyers.
Our capital resources and liquidity could be adversely affected if we are required to repurchase or sell a substantial portion of the equity interest in our controlled homebuilding subsidiaries.
The operating agreements governing our partially owned controlled builders contain buy-sell provisions that may be triggered in certain circumstances. In the event that a buy-sell event occurs, our builder will have the right to initiate a buy-sell process, which may happen at an inconvenient time for us. In the event the buy-sell provisions are exercised at a time when we lack sufficient capital to purchase the remaining equity interest, we may elect to sell our equity interest in the entity. If a buy-sell provision is exercised and we elect to purchase the interest in an entity that we do not already own, we may be obligated to expend significant capital in order to complete such acquisition, which may result in our being unable to pursue other investments or opportunities. If either of these events occurs, our revenue and net income could decline or we may not have sufficient capital necessary to implement our growth strategy.
We are subject to environmental laws and regulations, which may increase our costs, limit the areas in which we can build homes and develop land and delay completion of our projects.
We are subject to several local, state, federal and other statutes, ordinances, rules and regulations concerning the environment. The particular environmental laws that apply to any given homebuilding or development site vary according to multiple factors, including the site location, environmental conditions and the present and former uses of the site and adjoining properties. Environmental laws and conditions may result in delays, may cause us to incur substantial compliance and other costs and can prohibit or severely restrict homebuilding and land development activity in environmentally sensitive regions or areas. In addition, when an endangered or threatened species is involved, environmental rules and regulations can result in the restriction or elimination of development in identified environmentally sensitive areas. From time to time, the United States Environmental Protection Agency and similar federal or state agencies review homebuilders’ compliance with environmental laws and may levy fines and penalties for failure to comply strictly with applicable environmental laws or impose additional requirements for future compliance because of past failures. Any such actions taken with respect to our business may increase our costs. Environmental regulations can also have an adverse impact on the availability and price of certain raw materials such as lumber. Further, we expect that increasingly stringent requirements will be imposed on homebuilders and land developers in the future.
Under various environmental laws, current or former owners of real estate may be required to investigate and clean up hazardous or toxic substances and may be held liable to a governmental entity or to third parties for related damages, including for bodily injury, and for investigation and clean-up costs incurred by such parties in connection with the contamination.
Poor relations with the residents of our communities, or with local real estate agents, could negatively impact our home sales, which could cause our revenues or results of operations to decline.
Residents of communities we develop rely on us to resolve issues or disputes that may arise in connection with the operation or development of their communities. Efforts made by us to resolve these issues or disputes could be deemed unsatisfactory by the affected residents and subsequent actions by these residents could adversely affect sales or our reputation. In addition, we could be required to make material expenditures related to the settlement of such issues or disputes or to modify community development plans, which could adversely affect our results of operations.
13
Most of our potential homebuyers engage local real estate agents who are unaffiliated with us in connection with their search for a new home. If we do not maintain good relations with, and a good reputation among, these real estate agents, the agents may not encourage potential homebuyers to consider, or may actively discourage homebuyers from considering, our communities, which could adversely affect our results of operations.
Information technology failures and data security breaches could harm our business.
We rely on information technology systems and other computer resources to carry out operational and marketing activities, as well as to maintain our business records. As part of our normal business activities, we may collect and store certain confidential information, including information about employees, homebuyers, customers, vendors and suppliers and may share information with vendors who assist us with certain aspects of our business. Many of these resources are provided to us and/or maintained on our behalf by third-party service providers pursuant to agreements that specify certain security and service level standards. Our ability to conduct our business may be impaired if these resources are compromised, degraded, damaged or fail, whether due to a virus or other harmful circumstance, intentional penetration or disruption of our information technology resources by a third-party, natural disaster, hardware or software corruption or failure or error (including a failure of security controls incorporated into or applied to such hardware or software), telecommunications system failure, service provider error or failure, intentional or unintentional personnel actions (including the failure to follow our security protocols) or lost connectivity to networked resources.
There has been an increase in cyber-attacks in recent years. Breaches of our data security systems, including by cyber-attacks, could result in the unintended public disclosure or the misappropriation of our proprietary information or personal and confidential information, about our employees, consumers who view our homes, homebuyers or our business partners, which could require us to incur significant expense to address and resolve such issues. The release of confidential information may also lead to identity theft and related fraud, litigation or other proceedings against us by affected individuals, business partners and/or regulators, and the outcome of such proceedings, which could include penalties or fines, and any significant disruption of our business could have a material and adverse effect on our reputation resulting in the loss of customers, sales and revenue.
Data protection and privacy laws continue to evolve and become more complex in various U.S. federal and state jurisdictions. Such regulatory changes, variations in requirements across jurisdictions and ongoing discussions about a national privacy law could present compliance challenges. The costs of complying with such changes could adversely affect our business.
We maintain insurance coverage for potential breaches but the costs to remedy a breach may not be fully covered by our insurance. We provide employee awareness training of cybersecurity threats and utilize information technology security experts to assist us in our evaluations of the effectiveness of the security of our information technology systems, and we regularly enhance our security measures to protect our systems and data. We use various encryption, tokenization and authentication technologies to mitigate cybersecurity risks and have increased our monitoring capabilities to enhance early detection and rapid response to potential cyber threats. While we have not had a significant cybersecurity breach or attack that had a material impact on our business or operations, there can be no assurance that our efforts to maintain the security and integrity of our information technology systems will be effective or that attempted breaches would not be successful in the future.
Product liability and warranty claims and litigation that arise in the ordinary course of business may be costly, which could adversely affect our business.
As a homebuilder, we are subject to construction defect and home warranty claims arising in the ordinary course of business. These claims are common in the homebuilding industry and can be costly and once claims are asserted, it can be difficult to determine the extent to which the assertion will expand geographically. In addition, the costs of insuring against construction defect and product liability claims are high. This coverage may be restricted and become more costly in the future. If the limits or coverages of our current and former insurance programs prove inadequate, or we are not able to obtain adequate, or reasonably priced, insurance against these types of claims in the future, or the amounts currently provided for future warranty or insurance claims are inadequate, we may experience losses that could negatively impact our financial results.
We self-insure some of our risks through a wholly-owned insurance subsidiary. We record expenses and liabilities based on the estimated costs required to cover our self-insured liability. These estimated costs are based on an analysis of our historical claims and industry data and include an estimate of claims incurred but not yet reported. The projection of losses related to these liabilities requires actuarial assumptions that are subject to variability due to uncertainties regarding construction defect claims relative to our markets and the types of products we build, insurance industry practices, and legal or regulatory actions and/or interpretations, among other factors.
14
Our quarterly results of operations may fluctuate because our business is seasonal in nature.
The homebuilding industry experiences seasonal fluctuations in quarterly results of operations and capital requirements. We typically experience the highest new home order activity in spring and summer, although this activity is also highly dependent on the number of active selling communities, timing of new community openings and other market factors. Since it typically takes five to nine months to construct a new home, we deliver more homes in the second half of the year as spring and summer home orders convert to home deliveries. Because of this seasonality, home starts, construction costs and related cash outflows have historically been highest in the second and third quarters, and the majority of cash receipts from home deliveries occurs during the second half of the year. We expect this seasonal pattern to continue over the long-term, although we may also be affected by volatility in the homebuilding industry.
Additionally, weather-related problems may occur, delaying starts or closings or increasing costs and reducing profitability. Delays in opening new communities or new sections of existing communities could have an adverse impact on home sales and revenues. Expenses are not incurred and recognized evenly throughout the year. Because of these factors, our quarterly results of operations may be uneven and may be marked by lower revenues and earnings in some quarters compared with others.
Shortages or extreme fluctuations in the availability of natural resources and utilities could have an adverse effect on our operations.
The markets in which we operate may in the future be subject to utility or other resource shortages, including significant changes to the availability of electricity and water. Shortages of natural resources in our markets, particularly shortages of water, may make it more difficult for us to obtain regulatory approval for new developments. We may experience material fluctuations in utility and resource costs across our markets, and we may incur additional costs and may not be able to complete construction on a timely basis if such fluctuations arise. Furthermore, these shortages and interest rate fluctuations may adversely affect the regional economies in which we operate, which may reduce demand for our homes, lots and construction loans and negatively affect our business and results of operations.
We may suffer uninsured losses or suffer material losses in excess of insurance limits.
We could suffer physical damage to property or incur liabilities resulting in losses that may not be fully recoverable by insurance. In addition, certain types of risks, such as personal injury claims, may be, or may become in the future, either uninsurable or not economically insurable, or may not be currently or in the future covered by our insurance policies or otherwise be subject to significant deductibles or limits. Should an uninsured loss or a loss in excess of insured limits occur or be subject to deductibles, we could sustain financial loss or lose capital invested in the affected property as well as anticipated future income from that property. In addition, we could be liable to repair damage or meet liabilities caused by risks that are uninsured or subject to deductibles. We may be liable for any debt or other financial obligations related to an affected property. Material losses or liabilities in excess of insurance proceeds may occur in the future.
Negative publicity could adversely affect our reputation and business
Our success also depends on our reputation and our brand image. Any unfavorable media coverage related to our industry, brand, personnel or operations may adversely affect our stock price and the performance of our business, regardless of its accuracy or inaccuracy. Negative publicity spreads quickly through the use of electronic communication, including social media outlets, websites, “tweets”, blogs and other digital platforms. Our success in maintaining and expanding our brand image depends on our ability to adapt to this rapidly changing media environment. Negative publicity or negative commentary from any media outlets could damage our reputation and reduce the demand for our homes, which would adversely affect our business.
A major health and safety incident relating to our business could be costly in terms of potential liabilities and reputational damage.
Building sites are inherently dangerous and operating in the land development and homebuilding industries poses certain inherent health and safety risks. Our health and safety performance is critical to the success of our business given regulatory requirements on points. Any failure in health and safety performance may result in penalties for non-compliance with relevant regulatory requirements, and a failure that results in a major or significant health and safety incident is likely to be costly in terms of potential liabilities incurred as a result. Such a failure could generate significant negative publicity and have a corresponding impact on our reputation, our relationships with relevant regulatory agencies or governmental authorities and our ability to attract employees, subcontractors and homebuyers, which in turn could have a material adverse effect on our business, financial condition and results of operations. Additionally, we are subject to laws and regulations related to workers’ health and safety, and there are efforts to subject homebuilders like us to other labor related laws or rules, some of which may make us responsible for things done by our subcontractors over which we have little or no control.
15
Our business and financial results could be adversely affected by the failure of persons who act on our behalf to comply with applicable regulations and guidelines.
Although we expect all of our employees, officers and directors to comply at all times with all applicable laws, rules and regulations, there may be instances in which subcontractors or others through whom we do business engage in practices that do not comply with applicable regulations or guidelines. Should we learn of practices relating to homes we build that do not comply with applicable regulations or guidelines, lots we develop or financing we provide, we would move actively to stop the non-complying practices as soon as possible and would take disciplinary action with regard to employees who were aware of the practices and did not take steps to address them, including terminating their employment when necessary. However, regardless of the steps we take after we learn of practices that do not comply with applicable regulations or guidelines, we can in some instances be subject to fines or other governmental penalties, and our reputation can be injured due to the occurrence of such practices.
Products supplied to us and work done by subcontractors can expose us to risks that could adversely affect our business.
We rely on subcontractors to perform the actual construction of our homes, and, in some cases, to select and obtain building materials. Despite our detailed specifications and quality control procedures, subcontractors may use improper construction processes or defective materials in some cases. Defective products widely used by the homebuilding industry can require extensive repairs to large numbers of homes. The cost of complying with our warranty obligations may be significant if we are unable to recover the cost of repairs from subcontractors, materials suppliers and insurers.
Laws and regulations governing the residential mortgage industry could have an adverse effect on our business and financial results.
In 2020, we established a joint venture, BHome Mortgage, to provide mortgage related services to homebuyers. The residential mortgage lending industry remains under intense scrutiny and is heavily regulated at the federal, state and local levels. Although we do not originate mortgages, we are directly or indirectly subject to certain of these regulations. Changes to existing laws or regulations or adoption of new laws or regulations could require our joint venture to incur significant compliance costs. A material failure to comply with any of these laws or regulations could result in the loss or suspension of required licenses or other approvals, the imposition of monetary penalties, and restitution awards or other relief. Any of these outcomes could have an adverse effect on our results of operations.
Risks Related to Our Financing and Capital Structure
We may be unable to obtain suitable bonding for the development of our housing projects
We are periodically required to provide bonds to governmental authorities and others to ensure the completion of our projects and these bonds are generally not released until all development and construction activities to which they relate are completed. Depending on market conditions, surety providers may be reluctant to issue new bonds and may request credit enhancements (such as cash deposits or letters of credit) in order to maintain existing bonds or to issue new bonds. If we are unable to obtain required bonds for our future projects, or if we are required to provide credit enhancements with respect to our current or future bonds, our business, liquidity, financial condition and results of operations could be materially and adversely affected.
A negative change in our credit rating could adversely affect our business.
Our business requires access to capital on favorable terms to service our indebtedness, cover our operating expenses and fund other liquidity needs. Negative rating actions by credit agencies such as downgrades increase the cost to access capital and make it difficult for us to meet our liquidity needs. Any downgrade of our credit rating by any of the principal credit agencies may exacerbate these difficulties. There are no assurances that we will not experience downgrades in our credit ratings in the future, whether due to worsening macroeconomic conditions, a downturn in the housing industry, failure to successfully execute our business strategy, or the adverse impact on our results of operations or liquidity position of any of the above or otherwise.
Difficulty in obtaining sufficient capital could result in an inability to acquire land for our developments or increased costs and delays in the completion of development projects.
The homebuilding industry is capital-intensive and requires significant up-front expenditures to acquire land parcels and begin development. Land acquisition, development and construction activities may be adversely affected by any shortage or increased cost of financing or the unwillingness of third parties to engage in partnerships, joint ventures or other alternative arrangements.
16
In addition to the financing provided by the senior unsecured notes, we currently have access to a senior secured revolving credit facility and a senior unsecured revolving credit facility. We cannot ensure that we will be able to extend the maturity of these credit facilities or arrange another facility on acceptable terms or at all.
Furthermore, in the future, we may seek additional capital in the form of equity or debt financing from a variety of potential sources, including additional bank financings and/or securities offerings. The availability of borrowed funds, especially for land acquisition and construction financing, may be greatly reduced nationally, and the lending community may require increased amounts of equity to be invested in a project by borrowers in connection with both new loans and the extension of existing loans. The credit and capital markets are subject to volatility. If we are required to seek additional financing to fund our operations, volatility in these markets may restrict our flexibility to access such financing. If we are not successful in obtaining sufficient capital to fund our planned capital and other expenditures, we may be unable to acquire land for our housing developments and/or to develop the housing. Any difficulty in obtaining sufficient capital for planned development expenditures could also cause project delays and any such delay could result in cost increases. Any one or more of the foregoing events could have a material adverse effect on our business, liquidity, financial condition and results of operations.
Our debt instruments contain limitations and restrictions that could prevent us from capitalizing on business opportunities and could adversely affect our growth.
Our revolving credit facilities and the terms of our senior unsecured notes impose certain restrictions on our and certain of our subsidiaries’ operations and activities and require us to maintain certain financial covenants. The most significant restrictions relate to debt incurrence (including non-recourse indebtedness), creation of liens, repayment of certain indebtedness prior to its respective stated maturity, sales of assets, cash distributions (including paying dividends), capital stock repurchases, and investments by us and certain of our subsidiaries. These restrictions may prevent us from capitalizing on business opportunities and could adversely affect our growth.
The restrictions in our debt instruments could prohibit or restrict our and certain of our subsidiaries’ activities, such as undertaking capital raising or restructuring activities or entering into other transactions. In addition, if we fail to comply with these restrictions, an event of default could occur and our debt under these debt instruments could become due and payable prior to maturity. Any such event of default could lead to cross defaults under certain of our other debt or negatively impact other covenants. In any of these situations, we may be unable to amend the applicable instrument or obtain a waiver without significant additional cost, or at all. Any such situation could have a material adverse effect on our liquidity and financial condition.
Risks Related to Ownership of Our Common Stock
Future issuances of our common stock or Series A preferred stock could adversely affect the market for our common and preferred stock or dilute the ownership interest of our stockholders.
We are not restricted from issuing additional shares of our authorized common stock or Series A preferred stock, including securities that could be converted into or exchanged for, or that represent the right to receive, shares of our common or preferred stock. For example, in December 2021, we offered 2,000,000 depositary shares representing shares of our 5.75% cumulative perpetual preferred stock. If we issue a substantial number of shares of common or Series A preferred stock, or depositary shares representing interests in our preferred stock, or if the expectation of such issuances is broadly disseminated in the market, including in connection with any acquisitions, the market price for our common, preferred or depositary shares could be adversely affected, and our stockholders’ interest could be diluted. Our decision to issue equity securities will depend on market conditions and other factors, and we cannot predict or estimate with certainty the amount, timing or nature of potential future issuances. Accordingly, our stockholders bear the risk that such future equity issuances could reduce market price and dilute their stock holding with us. As of December 31, 2022, we had 46,032,930 shares of common stock and 2,000 shares of Series A preferred stock outstanding.
Our common and preferred stock are equity securities and are subordinate to our existing and future indebtedness and effectively subordinated to all indebtedness and other non-equity claims against our subsidiaries.
Shares of our common stock and preferred stock are equity interests and do not constitute indebtedness. Accordingly, shares of our common stock and depositary shares, which represent a fractional interest in our Series A preferred stock, will rank junior to all of our existing and future indebtedness (including indebtedness convertible into our common stock or preferred stock), to the indebtedness and other liabilities of our existing or future subsidiaries, and to other non-equity claims against us and our assets available to satisfy claims against us, including in the event of liquidation. Moreover, holders of our
17
depositary shares and outstanding preferred stock have preferential dividend and liquidation rights compared to holders of our common stock. We are permitted to incur additional debt. In the event of a bankruptcy, liquidation, dissolution or winding-up of our affairs, lenders and holders of our debt securities would receive distributions of our available assets prior to holders of our common stock, depositary shares and other outstanding preferred stock. Additionally, our right to participate in a distribution of assets upon any of our subsidiaries’ liquidation or reorganization is subject to prior claims of that subsidiary’s creditors, including holders of any preferred stock of that subsidiary.
Certain large stockholders own a significant percentage of our shares and exert significant influence over us. Their interests may not coincide with ours and they may make decisions with which we may disagree.
Greenlight Capital, Inc. and its affiliates (“Greenlight”) and James R. Brickman own approximately 37.2% and 3.4%, respectively, of our voting power. These large stockholders, acting together, could determine substantially all matters requiring stockholder approval, including the election of directors and approval of significant corporate transactions, such as a sale or other change of control transaction. In addition, this concentration of ownership may delay or prevent a change in control within us and make some transactions more difficult or impossible without the support of these stockholders. The interests of these stockholders may not always coincide with our interests or the interests of other stockholders. Accordingly, these stockholders could cause us to enter into transactions or agreements that you would not approve or make decisions with which you may disagree.
Certain large stockholders’ shares have been and may in the future be sold into the market, which could cause the market price of our common stock to decrease significantly.
We believe that a significant portion of our common stock beneficially owned by Greenlight and Mr. Brickman are “restricted securities” within the meaning of the federal securities laws. We entered into registration rights agreements with each of these parties in 2014 which provide these parties the right to require us to register the resale of their shares under certain circumstances. In December 2020, 24,118,668 shares held by Greenlight were registered for resale on Form S-3 in accordance with the registration rights agreement. These shares may be sold in the market at any time, subject to compliance with securities laws. If these holders sell substantial amounts of these shares, the price of our common stock could decline. In addition, the sale of these shares could impair our ability to raise capital through the sale of additional equity securities. As of December 31 , 2022
ITEM 1B. UNRESOLVED STAFF COMMENTS
None.
ITEM 2. PROPERTIES
We lease our principal executive office located at 2805 Dallas Parkway, Suite 400, Plano, Texas, 75093. Our homebuilding and title division offices are located in leased space in the markets where we conduct business. We believe that such properties are suitable and adequate to meet the needs of our businesses. Because of the nature of our homebuilding operations, we and our builders hold significant amounts of property as inventory in connection with our homebuilding business. We discuss these properties in the discussion of our homebuilding operations in Part I, Item 1 and Part II, Item 7 of this Annual Report on Form 10-K.
ITEM 3. LEGAL PROCEEDINGS
We are involved in various claims and litigation arising in the ordinary course of business. We do not believe that any such claims and litigation will have a material adverse effect upon our results of operations or financial position.
ITEM 4. MINE SAFETY DISCLOSURES
Not Applicable.
18
PART II
ITEM 5. MARKET FOR REGISTRANT’S COMMON EQUITY, RELATED STOCKHOLDER MATTERS AND ISSUER PURCHASES OF EQUITY SECURITIES
Market Information
Our common stock trades on The New York Stock Exchange under the ticker symbol “GRBK”.
Holders of Record
On February 22, 2023, there were 59 stockholders of record of our common stock. We believe the number of beneficial owners of our common stock is substantially greater than the number of record holders because a large portion of our outstanding common stock is held of record in broker “street names” for the benefit of individual investors. As of February 22, 2023, there were 46,032,886 common shares outstanding.
Dividends on Common Shares
We have not paid any dividends since our inception and do not anticipate declaring or paying any cash dividends on our common stock in the foreseeable future. We currently anticipate that we will retain our available cash for general corporate purposes. Payment of future dividends, if any, will be at the discretion of our Board of Directors (the “Board”) and will depend on many factors, including general economic and business conditions, our strategic plans, our financial results and condition, legal requirements and other factors as our Board deems relevant.
Common Stock Performance Graph
The following graph compares the yearly dollar change in the cumulative total shareholder return on the Company’s common stock against the cumulative total shareholder return of the Russell 3000 Index and the S&P Homebuilders Select Industry Index for the five year period that commenced December 31, 2017 and ended December 31, 2022.
ITEM 6. RESERVED
19
FORWARD-LOOKING STATEMENTS
This Annual Report on Form 10-K contains “forward-looking statements” within the meaning of the securities laws. These forward-looking statements are subject to a number of risks and uncertainties, many of which are beyond our control. All statements other than statements of historical facts included or incorporated by reference in this Annual Report on Form 10-K, including the statements regarding our strategy, future operations, financial position, estimated revenues, projected costs, prospects, plans, and objectives, are forward-looking statements. When used in this Annual Report, the words “will,” “believe,” “anticipate,” “plan,” “intend,” “estimate,” “expect,” “project,” and similar expressions are intended to identify forward-looking statements, although not all forward-looking statements contain these identifying words. Although we believe that our plans, intentions, and expectations reflected in or suggested by the forward-looking statements we make in this Annual Report on Form 10-K are reasonable, we cannot assure you that these plans, intentions, or expectations will be achieved. Forward-looking statements included or incorporated by reference in this Annual Report on Form 10-K include statements concerning (1) our balance sheet strategy and belief that we have ample liquidity; (2) our goals and strategies and their anticipated benefits, including expansion into new markets; (3) our intentions and the expected benefits and advantages of our product and land positioning strategies; (4) our expectations regarding future finished lots, the quality of those lots and the timing of backlog fulfillment; (5) expectations regarding our industry and our business in 2023 and beyond; (6) the contribution of certain market factors to our growth; (7) our land and lot acquisition strategy; (8) the sufficiency of our capital resources to support our business strategy and to service our debt; (9) the impact of new accounting standards and changes in accounting estimates; (10) trends and expectations regarding sales prices, sales orders, sales pace, cancellations, construction costs, gross margins, land costs and profitability and future home inventories; (11) our future cash needs; (12) our strategy to utilize leverage to invest in our business; (13) seasonal factors and the impact of seasonality in future quarters; (14) our expectations regarding access to additional growth capital; (15) our expectations regarding future land revenue recognition; (16) our ability to adapt to changing market conditions and (17) the disposition of legal claims and related contingencies.
These forward-looking statements reflect our current views about future events and are subject to risks, uncertainties and assumptions. We wish to caution readers that certain important factors may have affected and could in the future affect our actual results and could cause actual results to differ significantly from what is anticipated by our forward-looking statements. These risks include, but are not limited to: (1) general economic conditions in our markets, seasonality, cyclicality and competition in the homebuilding industry; (2) changes in macroeconomic conditions, including interest and unemployment rates, that could adversely impact demand for new homes or the ability of our buyers to qualify; (3) shortages, delays or increased costs of raw materials, or increases in other operating costs, including costs related to labor, real estate taxes and insurance, which in each case exceed our ability to increase prices; (4) significant periods of inflation or deflation; (5) a shortage of labor, (6) an inability to acquire land in our markets at anticipated prices or difficulty in obtaining land-use entitlements; (7) our inability to successfully execute our strategies, including the successful development of our communities within expected timeframes and the growth and expansion of our Trophy brand; (8) a failure to recruit, retain or develop highly skilled and competent employees; (9) the geographic concentration of our operations; (10) government regulation risks; (11) adverse changes in the availability or volatility of mortgage financing; (12) severe weather events or natural disasters; (13) difficulty in obtaining sufficient capital to fund our growth; (14) our ability to meet our debt service obligations; (15) a decline in the value of our inventories and resulting write-downs of the carrying value of our real estate assets; (16) our ability to adequately self-insure and (17) changes in accounting standards that adversely affect our reported earnings or financial condition.
Please see “Risk Factors” located in Part I, Item 1A in this Annual Report on Form 10-K for a further discussion of these and other risks and uncertainties which could affect our future results. We undertake no obligation to revise any forward-looking statements to reflect events or circumstances after the date of those statements or to reflect the occurrence of anticipated or unanticipated events, except to the extent we are legally required to disclose certain matters in SEC filings or otherwise.
20
ITEM 7. MANAGEMENT’S DISCUSSION AND ANALYSIS OF FINANCIAL CONDITION AND RESULTS OF OPERATIONS
For business overview and developments during the year ended December 31, 2022, refer to Part I, Item 1 of this Annual Report on Form 10-K.
Overview and Outlook
Our key financial and operating metrics are home deliveries, home closings revenue, average sales price of homes delivered, and net new home orders, which refers to the number of sales contracts executed reduced by the number of sales contracts canceled during the relevant period. Our results for each key financial and operating metric, as compared to the year ended December 31, 2021, are provided below:
| Year Ended | ||||||||
| December 31, 2022 | ||||||||
| Home deliveries | Increased by 2.9% | |||||||
| Home closings revenue | Increased by 30.0% | |||||||
| Average sales price of homes delivered | Increased by 26.3% | |||||||
| Net new home orders | Decreased by 30.8% | |||||||
The expansion of our revenues year over year is primarily attributable to the strong performance of our Trophy division, growth in the average selling price of homes, the impact of macroeconomic factors, and an influx of millennial first-time home buyers during the first half of the year. The significant increase in new home construction in our markets has, in turn, led to increased demand for labor and the raw materials, products and appliances for new homes. Due to the increased demand, we have experienced increases in cost and decreased availability of skilled labor as well as increases, shortages, and significant extensions to our lead time for the delivery of key materials and inputs. Additionally, the recent rapid rise in interest rates as well as the inflationary impact on buying power has impacted the ability of some buyers to qualify for mortgages in spite of unsatisfied demand for homes and the continued undersupply of existing and new home inventory.
2022 Developments
From October 2021 to October 2022, homes in the DFW and Atlanta markets appreciated by 13.5% and 14.9%, respectively, compared to 8.6% average appreciation for 20 major U.S. metropolitan areas (Source: S&P Dow Jones Indices & CoreLogic, October 31, 2022). Among the 12 largest metropolitan areas in the country, the Dallas and Atlanta areas ranked third and sixth, respectively, in annual rate of job growth from November 2021 to November 2022 (Source: US Bureau of Labor Statistics, November 2022). We believe that we operate in two of the most desirable housing markets in the nation and that increasing demand and supply constraints in our target markets create favorable conditions for our future growth.
Results of Operations
Year Ended December 31, 2022 Compared to the Year Ended December 31, 2021
Residential Units Revenue and New Homes Delivered
The table below represents residential units revenue and new homes delivered for the years ended December 31, 2022 and December 31, 2021 (dollars in thousands):
| Years Ended December 31, | ||||||||||||||||||||||||||
| 2022 | 2021 | Change | % | |||||||||||||||||||||||
| Home closings revenue | $ | 1,696,911 | $ | 1,305,620 | $ | 391,291 | 30.0 | % | ||||||||||||||||||
| Mechanic’s lien contracts revenue | 7,040 | 4,067 | 2,973 | 73.1 | % | |||||||||||||||||||||
| Residential units revenue | $ | 1,703,951 | $ | 1,309,687 | $ | 394,264 | 30.1 | % | ||||||||||||||||||
| New homes delivered | 2,916 | 2,834 | 82 | 2.9 | % | |||||||||||||||||||||
| Average sales price of homes delivered | $ | 581.9 | $ | 460.7 | $ | 121.2 | 26.3 | % | ||||||||||||||||||
The $394.3 million increase in residential units revenue was driven by the 26.3% increase in the average sales price of homes delivered for the year ended December 31, 2022 and the 2.9% increase in the number of homes delivered. The increase
21
in the average sales price of homes delivered for the year ended December 31, 2022 was attributable to overall price increases driven by high demand and low supply of inventory.
New Home Orders and Backlog
The table below represents new home orders and backlog related to our builder operations segments, excluding mechanic’s liens contracts (dollars in thousands):
| Years Ended December 31, | ||||||||||||||||||||||||||
| 2022 | 2021 | Change | % | |||||||||||||||||||||||
| Net new home orders | 1,973 | 2,851 | (878) | (30.8) | % | |||||||||||||||||||||
| Revenue from new net home orders | $ | 1,210,315 | $ | 1,488,613 | $ | (278,298) | (18.7) | % | ||||||||||||||||||
| Average selling price of net new home orders | $ | 613.4 | $ | 522.1 | $ | 91.3 | 17.5 | % | ||||||||||||||||||
| Cancellation rate | 13.8 | % | 7.7 | % | 6.1 | % | 79.2 | % | ||||||||||||||||||
| Absorption rate per average active selling community per quarter | 6.5 | 8.2 | (1.7) | (20.7) | % | |||||||||||||||||||||
| Average active selling communities | 76 | 87 | (11) | (12.6) | % | |||||||||||||||||||||
| Active selling communities at end of period | 80 | 74 | 6 | 8.1 | % | |||||||||||||||||||||
| Backlog | $ | 369,095 | $ | 869,856 | $ | (500,761) | (57.6) | % | ||||||||||||||||||
| Backlog units | 537 | 1,480 | (943) | (63.7) | % | |||||||||||||||||||||
| Average sales price of backlog | $ | 687.3 | $ | 587.7 | $ | 99.6 | 16.9 | % | ||||||||||||||||||
Net new home orders decreased by 30.8% over the prior year period and our absorption rate per average active selling community decreased 20.7% year over year. The lower levels of buyer traffic to many of our communities reduced the level of new home orders; we believe that the traffic decline starting in the second quarter was attributable to the recent rapid rise in interest rates as buyers reevaluated their buying capacity as well as the inflationary impact on consumer buying power and consumer confidence. Despite the lower sales pace, our decline in new order revenues was smaller than the decline in orders at 18.7% as our average sales price on new orders rose by 17.5%.
Backlog refers to homes under sales contracts that have not yet closed at the end of the relevant period, and absorption rate refers to the rate at which net new home orders are contracted per average active selling community during the relevant period. Upon a cancellation, the customer deposit may be returned to the prospective purchaser. Accordingly, backlog may not be indicative of our future revenue.
Our cancellation rate, which refers to sales contracts canceled divided by sales contracts executed during the relevant period, was 13.8% for the year ended December 31, 2022, compared to 7.7% for the year ended December 31, 2021. Our cancellation rate increase was driven by rapidly rising interest rates as well as customer concerns with the macroeconomic environment. Sales contracts relating to homes in backlog may be canceled by the prospective purchaser for a number of reasons, such as the prospective purchaser’s inability to obtain suitable mortgage financing.
Backlog declined by 57.6% with a 63.7% drop in backlog units, offset by a 16.9% increase in the average sales price of backlog units. The drop in backlog units is a function of the lower levels of new home orders described above as well as an increase in our cancellation rate. With the volatility in interest rates, customers also are demonstrating a strong preference for inventory spec homes that are nearing completion. As a result, homes spend a shorter amount of time in backlog, thereby creating a smaller total backlog level. The increase in average sales price was attributable to overall price increases driven by high demand and low supply of inventory.
22
Residential Units Gross Margin
The table below represents the components of residential units gross margin (dollars in thousands):
| Years Ended December 31, | ||||||||||||||||||||||||||
| 2022 | 2021 | |||||||||||||||||||||||||
| Home closings revenue | $ | 1,696,911 | 100.0 | % | $ | 1,305,620 | 100.0 | % | ||||||||||||||||||
| Cost of homebuilding units | 1,190,782 | 70.2 | % | 961,115 | 73.6 | % | ||||||||||||||||||||
| Homebuilding gross margin | $ | 506,129 | 29.8 | % | $ | 344,505 | 26.4 | % | ||||||||||||||||||
| Mechanic’s lien contracts revenue | $ | 7,040 | 100.0 | % | $ | 4,067 | 100.0 | % | ||||||||||||||||||
| Cost of mechanic’s lien contracts | 6,132 | 87.1 | % | 3,249 | 79.9 | % | ||||||||||||||||||||
| Mechanic’s lien contracts gross margin | $ | 908 | 12.9 | % | $ | 818 | 20.1 | % | ||||||||||||||||||
| Residential units revenue | $ | 1,703,951 | 100.0 | % | $ | 1,309,687 | 100.0 | % | ||||||||||||||||||
| Cost of residential units | 1,196,914 | 70.2 | % | 964,364 | 73.6 | % | ||||||||||||||||||||
| Residential units gross margin | $ | 507,037 | 29.8 | % | $ | 345,323 | 26.4 | % | ||||||||||||||||||
Cost of residential units for the year ended December 31, 2022 increased by $232.6 million, or 24.1%, compared to the year ended December 31, 2021, primarily driven by the increasing levels of input prices and more expensive homes delivered during the period.
Residential units gross margin for the year ended December 31, 2022 increased to 29.8%, compared to 26.4% for the year ended December 31, 2021, primarily due to overall price increases that outpaced the levels of cost increases.
Land and Lots Revenue
The table below represents lots closed and land and lots revenue (dollars in thousands):
| Years Ended December 31, | ||||||||||||||||||||||||||
| 2022 | 2021 | Change | % | |||||||||||||||||||||||
| Lots revenue | $ | 19,090 | $ | 24,866 | $ | (5,776) | (23.2) | % | ||||||||||||||||||
| Land revenue | 34,752 | 68,323 | (33,571) | (49.1) | % | |||||||||||||||||||||
| Land and lots revenue | $ | 53,842 | $ | 93,189 | $ | (39,347) | (42.2) | % | ||||||||||||||||||
| Lots closed | 288 | 323 | (35) | (10.8) | % | |||||||||||||||||||||
| Average sales price of lots closed | $ | 66.3 | $ | 77.0 | $ | (10.7) | (13.9) | % | ||||||||||||||||||
The 23.2% decrease in lots revenue was driven by the 10.8% decrease in the number of lots closed from a higher proportion of lots developed for internal use. The average lot price decreased by 13.9% due to a higher number of entry level lots sold. Land revenue represents sales of tracts of land during the years ended December 31, 2022 and 2021; such sales are opportunistic but are not generally in the ordinary course of business.
Selling, General and Administrative Expenses
The table below represents the components of selling, general and administrative expense (dollars in thousands):
| Years Ended December 31, | As Percentage of Segment Revenue | |||||||||||||||||||||||||
| 2022 | 2021 | 2022 | 2021 | |||||||||||||||||||||||
| Builder operations | $ | 166,816 | $ | 135,464 | 9.7 | % | 10.1 | % | ||||||||||||||||||
| Land development | 621 | 880 | 1.3 | % | 1.4 | % | ||||||||||||||||||||
| Corporate, other and unallocated (income) expense | (3,494) | (2,075) | — | % | — | % | ||||||||||||||||||||
| Total selling, general and administrative expenses | $ | 163,943 | $ | 134,269 | 9.3 | % | 9.6 | % | ||||||||||||||||||
Total selling, general and administrative expense as a percentage of revenue modestly improved to 9.3% from 9.6% for the year ended December 31, 2022 compared to the year ended December 31, 2021.
23
Builder Operations
The decrease in selling, general and administrative expense as a percentage of revenue for builder operations from 10.1% to 9.7% was primarily attributable to an increase in builder operations revenues without a corresponding increase in the level of overhead costs. Builder overhead expenditures include salaries, sales commissions, and community costs such as advertising and marketing expenses, rent, professional fees, and non-capitalized property taxes.
Land Development
Selling, general and administrative expense as a percentage of revenue for land development remained relatively flat for the year ended December 31, 2022 compared to the year ended December 31, 2021.
Corporate, Other and Unallocated
Selling, general and administrative expense for the corporate, other and unallocated non-operating segment for the year ended December 31, 2022 was income of $3.5 million, compared to income of $2.1 million for the year ended December 31, 2021. The change is primarily due to an increase in capitalized overhead adjustments that are not allocated to builder operations and land development segments.
Equity in Income of Unconsolidated Entities
Equity in income of unconsolidated entities increased to $25.6 million, or 30.0%, for the year ended December 31, 2022, compared to $19.7 million for the year ended December 31, 2021, primarily due to an increase in earnings from GB Challenger. See Note 5 to our consolidated financial statements included in Part II, Item 8 of this Annual Report on Form 10-K for a summary of Green Brick’s share in net earnings by unconsolidated entity.
Other Income, Net
Other income, net, increased to $11.8 million for the year ended December 31, 2022, compared to $9.5 million for the year ended December 31, 2021. The change is primarily due to customer deposits forfeited during the year ended December 31, 2022.
Income Tax Expense
Income tax expense increased to $82.5 million for the year ended December 31, 2022 from $52.6 million for the year ended December 31, 2021. The increase was driven by a reduced benefit in the Energy Efficient Tax Homes Tax Credit, change in state tax rates in Florida and Colorado, and a higher taxable income during the year ended December 31, 2022.
Year Ended December 31, 2021 Compared to the Year Ended December 31, 2020
For discussion and analysis of our results of operations for the year ended December 31, 2021 as well as for comparison to our results of operations for the year ended December 31, 2020, refer to Item 7 of Part II of our Annual Report on Form 10-K for the year ended December 31, 2021.
24
Lots Owned and Controlled
The following table presents the lots we owned or controlled, including lot option contracts, as of December 31, 2022 and December 31, 2021. Owned lots are those for which we hold title, while controlled lots are lots past feasibility studies for which we do not hold title but have the contractual right to acquire title.
| December 31, 2022 | December 31, 2021 | ||||||||||||||||||||||||||||||||||
| Central | Southeast | Total | Central | Southeast | Total | ||||||||||||||||||||||||||||||
| Lots owned | |||||||||||||||||||||||||||||||||||
| Finished lots | 1,901 | 998 | 2,899 | 1,328 | 797 | 2,125 | |||||||||||||||||||||||||||||
| Lots in communities under development | 10,309 | 1,698 | 12,007 | 16,439 | 1,675 | 18,114 | |||||||||||||||||||||||||||||
Land held for future development(1) | 6,575 | — | 6,575 | — | — | — | |||||||||||||||||||||||||||||
| Total lots owned | 18,785 | 2,696 | 21,481 | 17,767 | 2,472 | 20,239 | |||||||||||||||||||||||||||||
Lots controlled | |||||||||||||||||||||||||||||||||||
| Lots under third party option contracts | 2,212 | 6 | 2,218 | 2,670 | 70 | 2,740 | |||||||||||||||||||||||||||||
| Land under option for future acquisition and development | 110 | 18 | 128 | 3,318 | 508 | 3,826 | |||||||||||||||||||||||||||||
| Lots under option through unconsolidated development joint ventures | 1,289 | 411 | 1,700 | 1,333 | 483 | 1,816 | |||||||||||||||||||||||||||||
| Total lots controlled | 3,611 | 435 | 4,046 | 7,321 | 1,061 | 8,382 | |||||||||||||||||||||||||||||
Total lots owned and controlled (2) | 22,396 | 3,131 | 25,527 | 25,088 | 3,533 | 28,621 | |||||||||||||||||||||||||||||
| Percentage of lots owned | 83.9 | % | 86.1 | % | 84.2 | % | 70.8 | % | 70.0 | % | 70.7 | % | |||||||||||||||||||||||
(1) Land held for future development consist of raw land parcels where development activities have been postponed due to market conditions or other factors.
(2) Total lots excludes lots with homes under construction.
The following table presents additional information on the lots we owned as of December 31, 2022 and December 31, 2021.
| December 31, 2022 | December 31, 2021 | ||||||||||
| Total lots owned | 21,481 | 20,239 | |||||||||
| Land under option for future acquisition and development | 128 | 3,826 | |||||||||
| Lots under option through unconsolidated development joint ventures | 1,700 | 1,816 | |||||||||
| Total lots self-developed | 23,309 | 25,881 | |||||||||
| Self-developed lots as a percentage of total lots owned and controlled | 91.3 | % | 90.4 | % | |||||||
Liquidity and Capital Resources Overview
We had $76.6 million and $77.2 million of unrestricted cash as of December 31, 2022 and December 31, 2021, respectively. Our historical cash management strategy includes redeploying net cash from the sale of home inventory to acquire and develop land and lots that represent opportunities to generate desired margins and using cash to make additional investments in business acquisitions, joint ventures, or other strategic activities.
For the year ended December 31, 2022, our principal uses of capital were home construction, land purchases, land development, operating expenses, payment of routine liabilities and stock repurchases. We used funds generated by operations and available borrowings to meet our short-term working capital requirements. We remain focused on generating positive margins in our builder operations segments and acquiring desirable land positions in order to maintain a strong balance sheet and remain poised for continued growth.
Cash flows for each of our communities depend on the community’s stage in the development cycle and can differ substantially from reported earnings. Early stages of development or expansion require significant cash outlays for land acquisitions, entitlements and other approvals, roads, utilities, general landscaping and other amenities. These costs are a
25
component of our inventory and are not recognized in our statement of income until a home closes. In the later stages of community development, cash inflows may significantly exceed earnings reported for financial statement purposes, as the cash outflows associated with home construction and land development have previously occurred.
Our debt to total capitalization ratio, which is calculated as the sum of borrowings on lines of credit, the senior unsecured notes and notes payable, net of debt issuance costs, divided by the total capitalization, which equals the sum of Green Brick Partners, Inc. stockholders’ equity and total debt, was approximately 25.7% as of December 31, 2022. Additionally, as of December 31, 2022, our net debt to total capitalization ratio, which is a non-GAAP financial measure, remained low at 21.5%. It is our intent to prudently employ leverage to continue to invest in our land acquisition, development and homebuilding businesses. We target a debt to total capitalization ratio of approximately 30% to 35%, which we expect will provide us with significant additional growth capital.
Reconciliation of a Non-GAAP Financial Measure
In this Annual Report on Form 10-K, we utilize a financial measure of net debt to total capitalization ratio that is a non-GAAP financial measure as defined by the SEC. Net debt to total capitalization is calculated as the total debt less cash and cash equivalents, divided by the sum of total Green Brick Partners, Inc. stockholders’ equity and total debt less cash and cash equivalents. We present this measure because we believe it is useful to management and investors in evaluating our financing structure. We also believe this measure facilitates the comparison of our financing structure with other companies in our industry. Because this measure is not calculated in accordance with U.S. Generally Accepted Accounting Principles (“GAAP”), it may not be comparable to other similarly titled measures of other companies and should not be considered in isolation or as a substitute for, or superior to, financial measures prepared in accordance with GAAP.
The closest GAAP financial measure to the net debt to total capitalization ratio is the debt to total capitalization ratio. The following table represents a reconciliation of the net debt to total capitalization ratio as of December 31, 2022.
| Gross | Cash and cash equivalents | Net | |||||||||||||||
| Total debt, net of debt issuance costs | $ | 367,842 | $ | (76,588) | $ | 291,254 | |||||||||||
| Total Green Brick Partners, Inc. stockholders’ equity | 1,061,907 | — | 1,061,907 | ||||||||||||||
| Total capitalization | $ | 1,429,749 | $ | (76,588) | $ | 1,353,161 | |||||||||||
| Debt to total capitalization ratio | 25.7 | % | — | — | |||||||||||||
| Net debt to total capitalization ratio | — | — | 21.5 | % | |||||||||||||
Key Sources of Liquidity
Our key sources of liquidity were funds generated by operations and provided by borrowings during the year ended December 31, 2022.
Debt Instruments
Borrowings on lines of credit outstanding, net of debt issuance costs, as of December 31, 2022 and December 31, 2021 consisted of the following (in thousands):
| December 31, 2022 | December 31, 2021 | ||||||||||
| Secured Revolving Credit Facility | $ | — | $ | 2,000 | |||||||
| Unsecured Revolving Credit Facility | 20,000 | — | |||||||||
| Debt issuance costs, net of amortization | (2,605) | (2,738) | |||||||||
| Total borrowings on lines of credit, net | $ | 17,395 | $ | (738) | |||||||
Secured Revolving Credit Facility – As of December 31, 2022, we had no outstanding amounts under our Secured Revolving Credit Facility, compared to $2.0 million as of December 31, 2021. Borrowings under the Secured Revolving Credit Facility bear interest at a floating rate per annum equal to the rate announced by Bank of America, N.A. as its “Prime Rate” less 0.25%, subject to a minimum rate. On February 9, 2022, the Company entered into the Eighth Amendment to this credit agreement to extend its maturity date to May 1, 2025 and to reduce the minimum interest rate from 4.00% to 3.15%. All other material terms of the credit agreement, as amended, remained unchanged.
26
Unsecured Revolving Credit Facility – As of December 31, 2022, we had $20.0 million outstanding under our Unsecured Revolving Credit facility. We had no outstanding amounts as of December 31, 2021. On December 9, 2022, the Company entered into the Tenth Amendment to this credit agreement which increased the secured outstanding commitments from $300.0 million to $325.0 million, replaced the Eurodollar rate, and extended the termination date by one year to December 14, 2025. Outstanding advances under the Unsecured Revolving Credit Facility accrue interest at the benchmark rate plus 2.5%. As of December 31, 2022, the interest rate on outstanding borrowings under the Unsecured Revolving Credit Facility was 6.9% per annum. As amended, the aggregate principal amount of the revolving credit commitments under the Credit Agreement is $325.0 million through December 14, 2025.
Senior Unsecured Notes - As of December 31, 2022, we had four series of senior unsecured notes outstanding which were each issued pursuant to a note purchase agreement. The aggregate amount of senior unsecured notes outstanding was $335.8 million as of December 31, 2022, up from $335.4 million as of December 31, 2021, respectively, net of issuance costs.
•In August 2019, we issued $75 million of senior unsecured notes (the “2026 Notes”). Interest accrues at an annual rate of 4.0% and is payable quarterly. Principal on the 2026 Notes is required to be paid in increments of $12.5 million on August 8, 2024 and $12.5 million on August 8, 2025 with a final principal payment of $50.0 million on August 8, 2026.
•In August 2020, we issued $37.5 million of senior unsecured notes (the “2027 Notes”). Interest accrues at an annual rate of 3.35% and is payable quarterly. Principal on the 2027 Notes is due on August 26, 2027.
•In February 2021, we issued $125.0 million of senior unsecured notes (the “2028 Notes”). Interest accrues at an annual rate of 3.25% and is payable quarterly. Principal on the 2028 Notes is due in increments of $25.0 million annually on February 25 in each of 2024, 2025, 2026, 2027, and 2028.
•In December 2021, we issued $100.0 million of senior unsecured notes (the “2029 Notes”). Interest accrues at an annual rate of 3.25% and is payable quarterly. A required principal prepayment of $30.0 million is due on December 28, 2028. The remaining unpaid principal balance is due on December 28, 2029.
Optional prepayment is allowed with payment of a “make-whole” premium which fluctuates depending on market interest rates. Interest is payable quarterly in arrears.
Our debt instruments require us to maintain specific financial covenants, each of which we were in compliance with as of December 31, 2022. Specifically, under the most restrictive covenants, we are required to maintain the following:
•a minimum interest coverage (consolidated EBITDA to interest incurred) of no less than 2.0 to 1.0. As of December 31, 2022, our interest coverage on a last 12 months’ basis was 24.1 to 1.0;
•a Consolidated Tangible Net Worth of no less than approximately $678.8 million. As of December 31, 2022, our Consolidated Tangible Net Worth was $1,060.6 million; and
•a maximum debt to total capitalization rolling average ratio of no more than 40.0%. As of December 31, 2022, we had a rolling average ratio of 27.1%.
As of December 31, 2022, we believe that our cash on hand, capacity available under our lines of credit and cash flows from operations for the next twelve months will be sufficient to service our outstanding debt during the next twelve months and fund our operations. For more detailed information on our lines of credit, refer to Note 8 to the Consolidated Financial Statements located in Part II, Item 8 of this Annual Report on Form 10-K.
Preferred Equity
As of December 31, 2022 and December 31, 2021 we had issued and outstanding 2,000,000 Depositary Shares, each representing 1/1000 of a share of our 5.75% Series A Cumulative Perpetual Preferred Stock (the “Series A Preferred Stock”). We pay cumulative cash dividends on the Series A Preferred Stock, when and as declared by the Board, at the rate of 5.75% of the $25,000 liquidation preference per share. Dividends are payable quarterly in arrears. During the year ended December 31, 2022, we paid dividends of $2.8 million on the Series A Preferred Stock. As the series A Preferred Stock was issued in December 2021, no dividend payments were made during the year ended December 31, 2021. On February 14, 2023, the Board declared a quarterly cash dividend of $0.359 per depositary share on the Series A Preferred Stock. The dividend is payable on March 15, 2023 to stockholders of record as of March 1, 2023.
27
Registration Statements
In December 2020, we filed with the SEC a shelf registration statement on Form S-3 registering up to $500 million of securities, including shares of common stock, preferred stock or debt securities either separately or represented by warrants, or depositary shares as well as units that include any of these securities. Under the rules governing shelf registration statements, we will file a prospectus supplement and advise the SEC of the amount and type of securities each time we issue securities under this registration statement.
Cash Flows
The following summarizes our primary sources and uses of cash for the year ended December 31, 2022 as compared to the year ended December 31, 2021:
•Operating activities. Net cash provided by operating activities for the year ended December 31, 2022 was $90.7 million, compared to a $92.4 million use of cash from operating activities during the year ended December 31, 2021. The net cash inflows for the year ended December 31, 2022 were primarily generated from business operations of $314.0 million, partially offset by an increase in inventory of $217.6 million.
•Investing activities. Net cash used in investing activities for the year ended December 31, 2022 increased to $6.5 million compared to $2.0 million for the year ended December 31, 2021. The increase in cash outflows was primarily due to a $3.6 million capital contribution to our joint venture GBTM Sendera, LLC during the year ended December 31, 2022.
•Financing activities. Net cash used in financing activities for the year ended December 31, 2022 was $84.5 million, compared to a $154.3 million source of cash during the year ended December 31, 2021. The cash outflows for the year ended December 31, 2022 were primarily for share repurchases of $101.5 million, partially offset by net borrowings from lines of credit of $18.0 million.
For discussion and analysis our cash flows for the year ended December 31, 2021 as well as for comparison to our cash flows for the year ended December 31, 2020, refer to Item 7 of Part II of our Annual Report on Form 10-K for the year ended December 31, 2021.
Off-Balance Sheet Arrangements
Land and Lot Option Contracts
In the ordinary course of business, we enter into land purchase contracts with third-party developers to procure lots for the construction of our homes in the future. We are subject to customary obligations associated with such contracts. These purchase contracts typically require an earnest money deposit, and the purchase of properties under these contracts is generally contingent upon satisfying certain requirements, including obtaining applicable property and development entitlements.
We also utilize option contracts with lot sellers as a method of acquiring lots in staged takedowns, which are the schedules that dictate when lots must be purchased to help manage the financial and market risk associated with land holdings, and to reduce the use of funds from our corporate financing sources. Lot option contracts generally require us to pay a non-refundable deposit for the right to acquire lots over a specified period of time at pre-determined prices which typically include escalations in lot prices over time.
Our utilization of lot option contracts is dependent on, among other things, our supply of internally developed lots, the availability of land sellers willing to enter into these arrangements, the availability of capital to finance the development of optioned lots, general housing market conditions and local market dynamics. Options may be more difficult to procure from land sellers in strong housing markets and are more prevalent in certain geographic regions.
28
We generally have the right, at our discretion, to terminate our obligations under both purchase contracts and option contracts by forfeiting the earnest money deposit with no further financial responsibility to the land seller.
As of December 31, 2022, we had earnest money deposits of $24.6 million at risk associated with contracts to purchase 2,923 lots past feasibility studies with an aggregate purchase price of approximately $219.8 million.
Letters of Credit and Performance Bonds
Refer to Note 18 in the accompanying Notes to the Consolidated Financial Statements included in this Annual Report on Form 10-K for details of letters of credit and performance bonds outstanding.
Guarantee
Refer to Note 5 in the accompanying Notes to the Consolidated Financial Statements included in this Annual Report on Form 10-K for details of our guarantee in relation to our joint venture with EJB River Holdings, LLC (“EJB River Holdings”).
Critical Accounting Policies
The preparation of financial statements in accordance with GAAP requires management to use judgment and make estimates that affect the reported amounts of assets and liabilities at the date of the financial statements and the reported amounts of revenues, costs and expenses during the reporting period. Management bases estimates and judgments on historical experience and on various other factors that we believe to be reasonable under the circumstances. Actual results may differ from estimates under different assumptions or conditions. Management believes that the following accounting area is most critical to the portrayal of our financial condition and results of operations and requires the most subjective or complex judgments.
Impairment of Inventory
We value inventory at cost unless the carrying value is determined to be not recoverable in which case the affected inventory is written down to fair value. In accordance with Accounting Standards Codification 360, Property, Plant, and Equipment (“ASC 360”), we evaluate our inventory for indicators of impairment by individual community and development during each reporting period.
For our builder operations segments, during each reporting period, contribution margins on closed homes, average margins of homes under construction, and forecasted margins for future starts are reviewed at a community level by management. In the event that this review suggests higher potential for losses at a specific community, the Company monitors such communities by adding them to our “watchlist” communities, and, when an impairment indicator is present, further analysis is performed.
For our land development segment, we perform a quarterly review for indicators of impairment for each project which involves comparing anticipated lot sale revenues to projected costs (i.e. lot gross margins). For lots designated for our builders, we review land for indicators of impairment on a consolidated level for each community, looking at overall projected home contribution margins. In determining the allocation of costs to a particular land parcel, we rely on project budgets which are based on a variety of assumptions, such as development schedules and future costs to be incurred. It is common that actual results differ from budgeted amounts for various reasons, including delays, changes in costs that have not been committed, unforeseen issues encountered during project development that fall outside the scope of existing contracts, or items that ultimately cost more or less than the budgeted amount. We apply procedures to maintain best estimates in our budgets, including assessing and revising project budgets on a periodic basis, obtaining commitments from subcontractors and vendors for future costs to be incurred and utilizing the most recent information available to estimate costs.
For each real estate asset that has an indicator of impairment, we analyze whether the estimated remaining undiscounted future cash flows are more or less than the asset’s carrying value. The estimated cash flows are determined by projecting the remaining revenue from closings based on the contractual lot takedowns remaining, future projected lot takedowns, or historical and projected home sales or delivery absorptions for homebuilding operations and then comparing such projections to the remaining projected expenditures for development or home construction. Remaining projected expenditures are based on the most current pricing/bids received from subcontractors for current phases or homes under development. For future phases of land development, management uses its judgment to project potential cost increases. In determining the estimated cash flows for land held for sale, management considers recent comparisons to market comparable transactions, bona fide letters of intent from outside parties, executed sales contracts, broker quotes, and similar information. When projecting revenue, management does not assume improvement in market conditions.
29
If the estimated undiscounted cash flows are less than the asset’s carrying value, the asset is deemed impaired and written down to fair value. These impairment evaluations require us to make estimates and assumptions regarding future conditions, including the timing and amounts of development costs and sales prices of real estate assets, to determine if expected future cash flows will be sufficient to recover the asset’s carrying value.
Fair value is determined based on estimated future cash flows discounted for inherent risks associated with real estate assets. These discounted cash flows are impacted by expected risk based on estimated land development activities, construction and delivery timelines, market risk of price erosion, uncertainty of development or construction cost increases, and other risks specific to the asset or market conditions where the asset is located when the assessment is made. These factors are specific to each community and may vary among communities. When deemed appropriate, we use recent comparisons to market comparable transactions, bona fide letters of intent from outside parties, executed sales contracts, broker quotes, or similar information as inputs to estimate the fair value of certain real estate assets.
When estimating cash flows of a community, management makes various assumptions, including: (i) expected sales prices and sales incentives to be offered, including the number of homes available, pricing and incentives being offered by us or other builders, and future sales price adjustments based on market and economic trends; (ii) expected sales pace and cancellation rates based on local housing market conditions, competition and historical trends; (iii) costs expended to date and expected to be incurred including, but not limited to, land and land development costs, home construction costs, interest costs, indirect construction and overhead costs, and selling and marketing costs; (iv) alternative product offerings that may be offered that could have an impact on sales pace, sales price and/or building costs; and (v) alternative uses for the property.
Many assumptions are interdependent and a change in one may require a corresponding change to other assumptions. For example, increasing or decreasing sales absorption rates has a direct impact on the estimated per unit sales price of a home, the level of time-sensitive costs (such as indirect construction, overhead and carrying costs), and selling and marketing costs (such as model home maintenance costs and advertising costs). Due to uncertainties in the estimation process, the volatility in demand for new housing and the long life cycle of many communities, actual results could differ significantly from such estimates.
Refer to Note 1 to our consolidated financial statements included in Part II, Item 8 of this Annual Report on Form 10-K for further description of our significant accounting policies.
Recent Accounting Pronouncements
See Note 1 to our consolidated financial statements included in Part II, Item 8 of this Annual Report on Form 10-K for recent accounting pronouncements.
ITEM 7A. QUANTITATIVE AND QUALITATIVE DISCLOSURES ABOUT MARKET RISK
Our operations are interest rate sensitive. Because overall housing demand is adversely affected by increases in interest rates, a significant increase in mortgage interest rates may negatively affect the ability of homebuyers to secure adequate financing. Higher interest rates could adversely affect our revenues, gross margins and net income.
Our lines of credit have variable interest rates which are subject to minimum interest rates. An increase in interest rates could cause the cost of those lines to increase. As of December 31 , 2022
For fixed rate debt, such as our senior unsecured notes, changes in interest rates have an impact on the fair value of the debt instrument, not on our earnings or cash flows.
The following table provides information about our significant fixed rate instruments that are sensitive to changes in interest rates. Our debt obligations, annual maturity amounts, weighted average interest rates, and estimated fair market value of our senior unsecured notes for the year ended December 31 , 2022
30
| Years ended December 31, | |||||||||||||||||||||||||||||||||||||||||||||||||||||
| 2023 | 2024 | 2025 | 2026 | 2027 | 2028 | 2029 | Total | Fair Value at December 31, 2022 | |||||||||||||||||||||||||||||||||||||||||||||
| Liabilities: | |||||||||||||||||||||||||||||||||||||||||||||||||||||
| Senior unsecured notes | |||||||||||||||||||||||||||||||||||||||||||||||||||||
| Principal repayments | $ | — | 37,500 | 37,500 | 75,000 | 62,500 | 55,000 | 70,000 | 337,500 | 306,129 | |||||||||||||||||||||||||||||||||||||||||||
| Weighted Average interest rate | 3.43 | % | 3.43 | % | 3.42 | % | 3.37 | % | 3.27 | % | 3.25 | % | 3.25 | % | 3.38 | % | |||||||||||||||||||||||||||||||||||||
We do not enter into, or intend to enter into, swaps, forward or option contracts on interest rates or commodities or other types of derivative financial instruments for trading, hedging or speculative purposes.
Many of the statements contained in this section are forward-looking and should be read in conjunction with the disclosures under the heading “Forward-Looking Statements.”
31
ITEM 8. FINANCIAL STATEMENTS AND SUPPLEMENTARY DATA
Report of Independent Registered Public Accounting Firm
To the Stockholders and the Board of Directors
Green Brick Partners, Inc.
Opinion on the Financial Statements
We have audited the accompanying consolidated balance sheets of Green Brick Partners, Inc. and its subsidiaries (the Company) as of December 31 , 2022December 31 , 2022December 31 , 2022December 31 , 2022
We have also audited, in accordance with the standards of the Public Company Accounting Oversight Board (United States) (PCAOB), the Company’s internal control over financial reporting as of December 31 , 2022
Basis for Opinion
These financial statements are the responsibility of the Company’s management. Our responsibility is to express an opinion on the Company’s financial statements based on our audits. We are a public accounting firm registered with the PCAOB and are required to be independent with respect to the Company in accordance with U.S. federal securities laws and the applicable rules and regulations of the Securities and Exchange Commission and the PCAOB.
We conducted our audits in accordance with the standards of the PCAOB. Those standards require that we plan and perform the audits to obtain reasonable assurance about whether the financial statements are free of material misstatement, whether due to error or fraud. Our audits included performing procedures to assess the risks of material misstatement of the financial statements, whether due to error or fraud, and performing procedures that respond to those risks. Such procedures included examining, on a test basis, evidence regarding the amounts and disclosures in the financial statements. Our audits also included evaluating the accounting principles used and significant estimates made by management, as well as evaluating the overall presentation of the financial statements. We believe that our audits provide a reasonable basis for our opinion.
Critical Audit Matter
The critical audit matters communicated below are matters arising from the current period audit of the financial statements that were communicated or required to be communicated to the audit committee and that: (1) relate to accounts or disclosures that are material to the financial statements and (2) involved our especially challenging, subjective or complex judgments. The communication of critical audit matters does not alter in any way our opinion on the financial statements, taken as a whole, and we are not, by communicating the critical audit matters below, providing separate opinions on the critical audit matters or on the accounts or disclosures to which they relate.
Evaluation of Inventory for Impairment
As described in Notes 1 and 4 to the financial statements, the Company’s inventory, including homes completed or under construction and land and lots inventory was $1,422 million as of December 31, 2022. The Company performs impairment testing quarterly to determine whether events or changes in circumstances indicate the carrying amount of its inventory may not be recoverable.
If future results are not consistent with the Company’s assumptions and estimates, including future events such as deterioration of market conditions or significant changes in the absorption rates, changes in the assumptions could have a significant impact on the determination of indicators of potential impairment.
We identified the evaluation of potential indicators of impairment for inventory as a critical audit matter. This is due to a high degree of auditor judgment that was involved in evaluating management’s assumptions and judgments regarding whether
32
changes in market conditions at a location in which the Company operates would indicate a significant decrease in the fair value of the inventory.
Our audit procedures related to the Company’s evaluation of potential indicators of impairment for inventory include the following primary procedures, among others to address this critical audit matter:
a.We obtained an understanding of the relevant controls related to the evaluation of inventory for impairment and tested such controls for design and operating effectiveness, including controls related to the Company’s process to evaluate potential indicators of impairment.
b.We evaluated the completeness and appropriateness of management’s assessment of qualitative and quantitative impairment indicators by community.
c.We tested management’s process of identifying potential indicators of impairment by comparing actual contribution margins on closed homes to management’s target contribution margin to identify communities averaging below the target and identifying communities with significantly declining margins and/or increasing costs.
d.We evaluated the reasonableness of the key inputs and assumption used in management’s undiscounted cash flow analyses and fair value determinations, as necessary, by comparing the assumptions to historical information, recalculated mathematical accuracy of management’s calculations, independent analysis, current year actual financial information and third-party resources.
/s/ RSM US LLP
We have served as the Company’s auditor since 2016.
PCAOB ID: 49
February 27, 2023
33
GREEN BRICK PARTNERS, INC.
CONSOLIDATED BALANCE SHEETS
(In thousands, except share data)
| As of December 31, | |||||||||||
| 2022 | 2021 | ||||||||||
| ASSETS | |||||||||||
| Cash and cash equivalents | $ | $ | |||||||||
| Restricted cash | |||||||||||
| Receivables | |||||||||||
| Inventory | |||||||||||
| Investments in unconsolidated entities | |||||||||||
| Right-of-use assets - operating leases | |||||||||||
| Property and equipment, net | |||||||||||
| Earnest money deposits | |||||||||||
| Deferred income tax assets, net | |||||||||||
| Intangible assets, net | |||||||||||
| Goodwill | |||||||||||
| Other assets | |||||||||||
| Total assets | $ | $ | |||||||||
| LIABILITIES AND EQUITY | |||||||||||
| Liabilities: | |||||||||||
| Accounts payable | $ | $ | |||||||||
| Accrued expenses | |||||||||||
| Customer and builder deposits | |||||||||||
| Lease liabilities - operating leases | |||||||||||
| Borrowings on lines of credit, net | ( | ||||||||||
| Senior unsecured notes, net | |||||||||||
| Notes payable | |||||||||||
| Total liabilities | |||||||||||
| Commitments and contingencies | |||||||||||
| Redeemable noncontrolling interest in equity of consolidated subsidiary | |||||||||||
| Equity: | |||||||||||
| Green Brick Partners, Inc. stockholders’ equity | |||||||||||
| Preferred stock, $0.01 par value: 5,000,000 shares authorized; 2,000 issued and outstanding as of December 31, 2022 and 2021, respectively | |||||||||||
| Common stock, $0.01 par value: 100,000,000 shares authorized; 46,032,930 issued and outstanding as of December 31, 2022 and 51,151,911 and 50,759,972 issued and outstanding as of December 31, 2021, respectively | |||||||||||
| Treasury stock, at cost: none as of December 31, 2022 and 391,939 shares as of December 31, 2021 | ( | ||||||||||
| Additional paid-in capital | |||||||||||
| Retained earnings | |||||||||||
| Total Green Brick Partners, Inc. stockholders’ equity | |||||||||||
| Noncontrolling interests | |||||||||||
| Total equity | |||||||||||
| Total liabilities and equity | $ | $ | |||||||||
The accompanying notes are an integral part of these consolidated financial statements.
34
GREEN BRICK PARTNERS, INC.
CONSOLIDATED STATEMENTS OF INCOME
(In thousands, except per share data)
| Years Ended December 31, | |||||||||||||||||
| 2022 | 2021 | 2020 | |||||||||||||||
| Residential units revenue | $ | $ | $ | ||||||||||||||
| Land and lots revenue | |||||||||||||||||
| Total revenues | |||||||||||||||||
| Cost of residential units | |||||||||||||||||
| Cost of land and lots | |||||||||||||||||
| Total cost of revenues | |||||||||||||||||
| Total gross profit | |||||||||||||||||
| Selling, general and administrative expenses | ( | ( | ( | ||||||||||||||
| Change in fair value of contingent consideration | ( | ||||||||||||||||
| Equity in income of unconsolidated entities | |||||||||||||||||
| Other income, net | |||||||||||||||||
| Income before income taxes | |||||||||||||||||
| Income tax expense | |||||||||||||||||
| Net income | |||||||||||||||||
| Less: Net income attributable to noncontrolling interests | |||||||||||||||||
| Net income attributable to Green Brick Partners, Inc. | $ | $ | $ | ||||||||||||||
| Net income attributable to Green Brick Partners, Inc. per common share: | |||||||||||||||||
| Basic | $ | $ | $ | ||||||||||||||
| Diluted | $ | $ | $ | ||||||||||||||
Weighted average common shares used in the calculation of net income attributable to Green Brick Partners, Inc. per common share: | |||||||||||||||||
| Basic | |||||||||||||||||
| Diluted | |||||||||||||||||
The accompanying notes are an integral part of these consolidated financial statements.
35
GREEN BRICK PARTNERS, INC.
CONSOLIDATED STATEMENTS OF CHANGES IN STOCKHOLDERS’ EQUITY
(In thousands, except share data)
| Common Stock | Preferred Stock | Treasury Stock | Additional Paid-in Capital | Retained Earnings | Total Green Brick Partners, Inc. Stockholders’ Equity | Non controlling Interests | Total Stockholders’ Equity | |||||||||||||||||||||||||||||||||||||||||||||||||
| Shares | Amount | Shares | Amount | Shares | Amount | |||||||||||||||||||||||||||||||||||||||||||||||||||
| Balance at December 31, 2019 | $ | — | $ | — | ( | $ | ( | $ | $ | $ | $ | $ | ||||||||||||||||||||||||||||||||||||||||||||
| Issuance of common stock under 2014 Omnibus Equity Incentive Plan | — | — | — | — | — | — | ||||||||||||||||||||||||||||||||||||||||||||||||||
| Withholdings from vesting of restricted stock awards | ( | ( | — | — | — | — | ( | — | ( | — | ( | |||||||||||||||||||||||||||||||||||||||||||||
| Amortization of deferred share-based compensation | — | — | — | — | — | — | — | — | ||||||||||||||||||||||||||||||||||||||||||||||||
| Change in fair value of redeemable noncontrolling interest | — | — | — | — | — | — | — | — | ||||||||||||||||||||||||||||||||||||||||||||||||
| Increase in ownership in CB JENI Homes | — | — | — | — | — | — | — | ( | — | |||||||||||||||||||||||||||||||||||||||||||||||
| Contributions | — | — | — | — | — | — | — | — | — | |||||||||||||||||||||||||||||||||||||||||||||||
| Distributions | — | — | — | — | — | — | — | — | — | ( | ( | |||||||||||||||||||||||||||||||||||||||||||||
| Net income | — | — | — | — | — | — | — | |||||||||||||||||||||||||||||||||||||||||||||||||
| Balance at December 31, 2020 | $ | — | $ | — | ( | $ | ( | $ | $ | $ | $ | $ | ||||||||||||||||||||||||||||||||||||||||||||
| Issuance of common stock under 2014 Omnibus Equity Incentive Plan | — | — | — | — | — | — | ||||||||||||||||||||||||||||||||||||||||||||||||||
| Withholdings from vesting of restricted stock awards | ( | ( | — | — | — | — | ( | — | ( | — | ( | |||||||||||||||||||||||||||||||||||||||||||||
| Issuance of preferred stock | — | — | — | — | — | — | — | |||||||||||||||||||||||||||||||||||||||||||||||||
| Amortization of deferred share-based compensation | — | — | — | — | — | — | — | — | ||||||||||||||||||||||||||||||||||||||||||||||||
| Change in fair value of redeemable noncontrolling interest | — | — | — | — | — | — | ( | — | ( | — | ( | |||||||||||||||||||||||||||||||||||||||||||||
| Distributions | — | — | — | — | — | — | — | — | — | ( | ( | |||||||||||||||||||||||||||||||||||||||||||||
| Net income | — | — | — | — | — | — | — | |||||||||||||||||||||||||||||||||||||||||||||||||
| Balance at December 31, 2021 | $ | $ | ( | $ | ( | $ | $ | $ | $ | $ | ||||||||||||||||||||||||||||||||||||||||||||||
36
GREEN BRICK PARTNERS, INC.
CONSOLIDATED STATEMENTS OF CHANGES IN STOCKHOLDERS’ EQUITY
(In thousands, except share data)
| Common Stock | Preferred Stock | Treasury Stock | Additional Paid-in Capital | Retained Earnings | Total Green Brick Partners, Inc. Stockholders’ Equity | Non controlling Interests | Total Stockholders’ Equity | |||||||||||||||||||||||||||||||||||||||||||||||||
| Shares | Amount | Shares | Amount | Shares | Amount | |||||||||||||||||||||||||||||||||||||||||||||||||||
| Balance at December 31, 2021 | $ | $ | ( | $ | ( | $ | $ | $ | $ | $ | ||||||||||||||||||||||||||||||||||||||||||||||
| Issuance of common stock under 2014 Omnibus Equity Incentive Plan | — | — | — | — | — | — | ||||||||||||||||||||||||||||||||||||||||||||||||||
| Withholdings from vesting of restricted stock awards | ( | — | — | ( | — | ( | — | ( | ||||||||||||||||||||||||||||||||||||||||||||||||
| Amortization of deferred share-based compensation | — | — | — | — | — | — | — | — | ||||||||||||||||||||||||||||||||||||||||||||||||
| Dividends | — | — | — | — | — | — | — | ( | ( | — | ( | |||||||||||||||||||||||||||||||||||||||||||||
| Share repurchases | — | — | — | — | ( | ( | — | — | ( | — | ( | |||||||||||||||||||||||||||||||||||||||||||||
| Retirement of treasury shares | ( | ( | — | — | ( | ( | — | — | — | |||||||||||||||||||||||||||||||||||||||||||||||
| Change in fair value of redeemable noncontrolling interest | — | — | — | — | — | — | ( | — | ( | — | ( | |||||||||||||||||||||||||||||||||||||||||||||
| Distributions | — | — | — | — | — | — | — | — | — | ( | ( | |||||||||||||||||||||||||||||||||||||||||||||
| Net income | — | — | — | — | — | — | — | |||||||||||||||||||||||||||||||||||||||||||||||||
| Balance at December 31, 2022 | $ | $ | $ | $ | $ | $ | $ | $ | ||||||||||||||||||||||||||||||||||||||||||||||||
The accompanying notes are an integral part of these consolidated financial statements.
37
GREEN BRICK PARTNERS, INC.
CONSOLIDATED STATEMENTS OF CASH FLOWS
(In thousands)
| Years Ended December 31, | |||||||||||||||||
| 2022 | 2021 | 2020 | |||||||||||||||
| Cash flows from operating activities: | |||||||||||||||||
| Net income | $ | $ | $ | ||||||||||||||
| Adjustments to reconcile net income to net cash provided by (used in) operating activities: | |||||||||||||||||
| Depreciation and amortization expense | |||||||||||||||||
| (Gain) loss on disposal of property and equipment, net | ( | ||||||||||||||||
| Share-based compensation expense | |||||||||||||||||
| Change in fair value of contingent consideration | |||||||||||||||||
| Deferred income taxes, net | ( | ( | ( | ||||||||||||||
| Equity in income of unconsolidated entities | ( | ( | ( | ||||||||||||||
| Allowances for option deposits and pre-acquisition costs | |||||||||||||||||
| Distributions of income from unconsolidated entities | |||||||||||||||||
| Changes in operating assets and liabilities: | |||||||||||||||||
| Decrease (increase) in receivables | ( | ( | |||||||||||||||
| Increase in inventory | ( | ( | ( | ||||||||||||||
| Decrease (increase) in earnest money deposits | ( | ( | |||||||||||||||
| (Increase) decrease in other assets | ( | ( | |||||||||||||||
| Increase (decrease) in accounts payable | ( | ||||||||||||||||
| Increase in accrued expenses | |||||||||||||||||
| Payment of contingent consideration in excess of acquisition date fair value | ( | ( | |||||||||||||||
| (Decrease) increase in customer and builder deposits | ( | ||||||||||||||||
| Net cash provided by (used in) operating activities | ( | ||||||||||||||||
| Cash flows from investing activities: | |||||||||||||||||
| Investments in unconsolidated entities | ( | ( | ( | ||||||||||||||
| Purchase of property and equipment, net of disposals | ( | ( | ( | ||||||||||||||
| Net cash used in investing activities | ( | ( | ( | ||||||||||||||
| Cash flows from financing activities: | |||||||||||||||||
| Borrowings from lines of credit | |||||||||||||||||
| Repayments of lines of credit | ( | ( | ( | ||||||||||||||
| Borrowings from senior unsecured notes | |||||||||||||||||
| Proceeds from notes payable | |||||||||||||||||
| Repayments of notes payable | ( | ( | ( | ||||||||||||||
| Payments of debt issuance costs | ( | ( | ( | ||||||||||||||
| Payments of withholding tax on vesting of restricted stock awards | ( | ( | ( | ||||||||||||||
| Share repurchases | ( | ||||||||||||||||
| Net proceeds from issuance of preferred shares | |||||||||||||||||
| Dividends paid | ( | ||||||||||||||||
| Contributions from noncontrolling interests | |||||||||||||||||
| Distributions to redeemable noncontrolling interest | ( | ( | |||||||||||||||
| Distributions to noncontrolling interests | ( | ( | ( | ||||||||||||||
| Net cash (used in) provided by financing activities | ( | ( | |||||||||||||||
| Net (decrease) increase in cash and cash equivalents and restricted cash | ( | ( | |||||||||||||||
| Cash and cash equivalents, beginning of period | |||||||||||||||||
| Restricted cash, beginning of period | |||||||||||||||||
| Cash and cash equivalents and restricted cash, beginning of period | $ | $ | $ | ||||||||||||||
| Cash and cash equivalents, end of period | |||||||||||||||||
| Restricted cash, end of period | |||||||||||||||||
| Cash and cash equivalents and restricted cash, end of period | $ | $ | $ | ||||||||||||||
38
GREEN BRICK PARTNERS, INC.
CONSOLIDATED STATEMENTS OF CASH FLOWS
(In thousands)
| Supplemental disclosure of cash flow information: | |||||||||||||||||
| Cash paid for income taxes, net of refunds | $ | $ | $ | ||||||||||||||
The accompanying notes are an integral part of these consolidated financial statements.
39
GREEN BRICK PARTNERS, INC.
NOTES TO CONSOLIDATED FINANCIAL STATEMENTS
1. SUMMARY OF SIGNIFICANT ACCOUNTING POLICIES
Principles of Consolidation
The accompanying consolidated financial statements include the accounts of Green Brick Partners, Inc., its controlled subsidiaries, and variable interest entities in which Green Brick Partners, Inc. or one of its controlled subsidiaries is deemed to be the primary beneficiary (together, the “Company”, “we”, or “Green Brick”).
The Company evaluated its wholly-owned subsidiaries and controlled builder under ASC 810, Consolidation (“ASC 810”) and concluded that its controlled builder is a variable interest entity (“VIE”). The Company owns a 50 % equity interest and a 51 % voting interest in its controlled builder. In addition, the Company appoints two of the three board managers of its controlled builder and is able to exercise control over its operations. The Company accounts for its controlled builder under the variable interest model and is the primary beneficiary of its controlled builder in accordance with ASC 810.
All intercompany balances and transactions have been eliminated in consolidation.
The Company uses the equity method of accounting for its investments in unconsolidated entities over which it exercises significant influence but does not have a controlling interest. Under the equity method, the Company’s share of the unconsolidated entities’ earnings or losses is included in the consolidated statements of income.
Use of Estimates
The preparation of the consolidated financial statements in conformity with GAAP requires management of the Company to make estimates and assumptions that affect the amounts reported in the consolidated financial statements and accompanying notes, including the reported amounts of assets and liabilities and disclosure of contingent assets and liabilities at the date of the consolidated financial statements and the reported amounts of revenue and expenses during the reporting periods. Actual results could differ from those estimates.
Cash and Cash Equivalents
The Company considers all highly liquid investments with original maturities of three months or less at the time of purchase to be cash equivalents. The cash balances of the Company are held with multiple financial institutions. At times, cash balances at certain banks and financial institutions may exceed insurable amounts. The Company believes it mitigates this risk by monitoring the financial stability of institutions holding material cash balances. The Company has not experienced any losses in such accounts and believes that the risk of loss is minimal.
40
Receivables
Receivables consist of amounts collectible from manufacturing rebates earned by our homebuilders during the normal course of business, receivables related to land development joint amounts, amounts collectible from third-party escrow agents related to closings on land, lots and homes, and amounts collectible related to mechanic’s lien contracts. As of December 31, 2022 all amounts are considered fully collectible and no allowance for credit losses was recorded. Any allowance for credit losses is estimated based on our historical losses, the existing economic conditions, and the financial stability of our customers. Receivables are written off in the period that they are deemed uncollectible.
Inventory and Cost of Revenues
Inventory consists of undeveloped land, raw land scheduled for development, land held for future development, land in the process of development, land held for sale, developed lots, homes completed and under construction, and model homes. Inventory is valued at cost unless the carrying value is determined to be not recoverable in which case the affected inventory is written down to fair value. Cost includes any related pre-acquisition costs that are directly identifiable with a specific property so long as those pre-acquisition costs are anticipated to be recoverable at the sale of the property.
Residential lots held for sale and lots held for development include the initial cost of acquiring the land as well as certain costs capitalized related to developing the land into individual residential lots including direct overhead, interest and real estate taxes.
Land development and other project costs, including direct overhead, interest and property taxes incurred during development and home construction, are capitalized. Land development and other common costs that benefit an entire community are allocated to individual lots or homes based on relative sales value. The costs of completed lots are transferred to work in process when home construction begins. Home construction costs and related carrying charges (principally interest and real estate taxes) are allocated to the cost of individual homes.
Inventory costs for completed homes are expensed upon closing and delivery of the homes. Changes to estimated total land development costs subsequent to initial home closings in a community are generally allocated to the unclosed homes and lots in the community on a pro-rata basis. The life cycle of a community generally ranges from 24 to 72 months, commencing with the acquisition of land, continuing through the land development phase, construction, and concluding with the sale and delivery of homes. We recognize costs as incurred on our mechanic’s lien contracts.
Impairment of Inventory
In accordance with ASC 360, Property, Plant, and Equipment (“ASC 360”), we evaluate our inventory for indicators of impairment by individual community and development during each reporting period.
For our builder operations segments, during each reporting period, contribution margins on closed homes, average margins of homes under construction, and forecasted margins for future starts are reviewed at a community level. In the event that this review suggests higher potential for losses at a specific community, the Company monitors such communities by adding them to our “watchlist” communities, and, when an impairment indicator is present, further analysis is performed.
For our land development segment, we perform a quarterly review for indicators of impairment for each project which involves comparing anticipated lot sale revenues to projected costs (i.e. lot gross margins). For lots designated for our builders, we review land for indicators of impairment on a consolidated level for each community, looking at overall projected home contribution margins. In determining the allocation of costs to a particular land parcel, we rely on project budgets which are based on a variety of assumptions, including assumptions about development schedules and future costs to be incurred. It is common that actual results differ from budgeted amounts for various reasons, including delays, changes in costs that have not been committed, unforeseen issues encountered during project development that fall outside the scope of existing contracts, or items that ultimately cost more or less than the budgeted amount. We apply procedures to maintain best estimates in our budgets, including assessing and revising project budgets on a periodic basis, obtaining commitments from subcontractors and vendors for future costs to be incurred and utilizing the most recent information available to estimate costs.
For each real estate asset that has an indicator of impairment, we analyze whether the estimated remaining undiscounted future cash flows are more or less than the asset’s carrying value. The estimated cash flows are determined by projecting the remaining revenue from closings based on the contractual lot takedowns remaining, future projected lot takedowns, or historical and projected home sales or delivery absorptions for homebuilding operations and then comparing such projections to the
41
remaining projected expenditures for development or home construction. Remaining projected expenditures are based on the most current pricing/bids received from subcontractors for current phases or homes under development. For future phases of land development, management uses its judgment to project potential cost increases. In determining the estimated cash flows for land held for sale, management considers recent comparisons to market comparable transactions, bona fide letters of intent from outside parties, executed sales contracts, broker quotes, and similar information. When projecting revenue, management does not assume improvement in market conditions.
If the estimated undiscounted cash flows are less than the asset’s carrying value, the asset is deemed impaired and written down to fair value. These impairment evaluations require us to make estimates and assumptions regarding future conditions, including the timing and amounts of development costs and sales prices of real estate assets, to determine if expected future cash flows will be sufficient to recover the asset’s carrying value.
Fair value is determined based on estimated future cash flows discounted for inherent risks associated with real estate assets. These discounted cash flows are impacted by expected risk based on estimated land development activities, construction and delivery timelines, market risk of price erosion, uncertainty of development or construction cost increases, and other risks specific to the asset or market conditions where the asset is located when the assessment is made. These factors are specific to each community and may vary among communities. When deemed appropriate, we use recent comparisons to market comparable transactions, bona fide letters of intent from outside parties, executed sales contracts, broker quotes, or similar information as inputs to estimate the fair value of certain real estate assets.
When estimating cash flows of a community, management makes various assumptions, including: (i) expected sales prices and sales incentives to be offered, including the number of homes available, pricing and incentives being offered by us or other builders, and future sales price adjustments based on market and economic trends; (ii) expected sales pace and cancellation rates based on local housing market conditions, competition and historical trends; (iii) costs expended to date and expected to be incurred including, but not limited to, land and land development costs, home construction costs, interest costs, indirect construction and overhead costs, and selling and marketing costs; (iv) alternative product offerings that may be offered that could have an impact on sales pace, sales price and/or building costs; and (v) alternative uses for the property.
Many assumptions are interdependent and a change in one may require a corresponding change in other assumptions. For example, increasing or decreasing sales absorption rates have a direct impact on the estimated per unit sales price of a home, the level of time-sensitive costs (such as indirect construction, overhead and carrying costs), and selling and marketing costs (such as model home maintenance costs and advertising costs). Due to uncertainties in the estimation process, the volatility in demand for new housing and the long life cycle of many communities, actual results could differ significantly from such estimates.
Capitalization of Interest
The Company capitalizes interest costs incurred to inventory during land development, home construction, and other qualifying activities. Interest capitalized as cost of inventory is charged to cost of revenues as related homes, land and lots are closed. Interest incurred on undeveloped land is directly expensed and included in interest expense in our consolidated statements of income.
Investments in Unconsolidated Entities
In accordance with ASC 323, Investments - Equity Method and Joint Ventures (“ASC 323”), the Company uses the equity method of accounting for its investments in unconsolidated entities over which it exercises significant influence but does not have a controlling interest. The equity method of accounting requires the investment to be initially recorded at cost and subsequently adjusted for the Company’s share of equity in the unconsolidated entity’s earnings or losses. The Company evaluates the carrying amount of the investments in unconsolidated entities for impairment in accordance with ASC 323. If the Company determines that a loss in the value of the investment is other than temporary, the Company writes down the investment to its estimated fair value. Any such losses are recorded to equity in income of unconsolidated entities in the Company’s consolidated statements of income. Due to uncertainties in the estimation process and the volatility in demand for new housing, actual results could differ significantly from such estimates.
The Company has made an election to classify distributions received from unconsolidated entities using the nature of the distribution approach. Distributions received are classified as cash inflows from operating activities based on the nature of the activities of the investee that generated the distribution.
42
Earnest Money Deposits
In the ordinary course of business, the Company enters into land and lot option contracts to procure land for the construction of homes in the future. Pursuant to these option contracts, the Company generally provides a deposit to the seller as consideration for the right to purchase land at different times in the future, usually at predetermined prices. Such contracts enable the Company to defer acquiring portions of properties owned by third parties or unconsolidated entities until the Company has determined whether and when to exercise its option, which reduces the Company’s financial risk associated with long-term land holdings. Option deposits and pre-acquisition costs (such as environmental testing, surveys, engineering, and entitlement costs) are capitalized if the costs are directly identifiable with the land under option and acquisition of the property is probable. These costs are reclassified to inventory upon taking title to the land. The Company writes off deposits and pre-acquisition costs if it becomes probable that the Company will not proceed with the project or recover the capitalized costs. Such decisions take into consideration changes in local market conditions, the timing of required land takedowns, the availability and best use of necessary incremental capital, and other factors.
Intangible Assets
Intangible assets, net consists of the estimated fair value of the acquired trade name, net of amortization. The trade name has a definite life and is amortized over ten years.
Intangible assets are tested for impairment whenever events or circumstances indicate that the carrying amount of an asset may not be recoverable. An impairment loss would be recognized if the carrying amount of the asset exceeds the estimated undiscounted future cash flows expected to result from the use of the asset and its eventual disposition. The impairment loss recorded would be the excess of the asset’s carrying value over its fair value. Fair value would be determined using a discounted cash flow analysis or other valuation technique.
43
Goodwill
The excess of the purchase price of a business acquisition over the net fair value of assets acquired and liabilities assumed is capitalized as goodwill in accordance with ASC 805, Business Combinations (“ASC 805”). The allocation to goodwill represents the excess of the purchase price, including contingent consideration, over the estimated fair value of assets acquired and liabilities assumed. Goodwill results primarily from operational synergies expected from the business combination.
Goodwill is assessed for impairment at least annually in the fourth quarter, or more frequently if certain impairment indicators are present. A goodwill impairment loss is recognized for the amount by which the carrying amount of the reporting unit, including goodwill, exceeds its fair value.
The Company reviews goodwill for impairment at the reporting unit level. The Company generally elects to first assess qualitative factors to determine whether it is more likely than not that fair value of the reporting level is less than its carrying amount. Qualitative factors include adverse macroeconomic conditions, industry and market conditions, overall financial performance, reporting unit specific events and entity specific events. If, after completing a qualitative assessment, the Company concludes that it is more likely than not that the fair value of the reporting unit is less than its carrying amount, the Company must perform a quantitative test to evaluate goodwill for impairment.
To perform a quantitative test, the Company calculates the fair value of the reporting unit and compares that amount to the reporting unit’s carrying value. The fair value of the reporting unit is determined by using generally accepted valuation techniques, including discounted cash flow models and market multiple analysis. The Company’s valuation methodology for assessing impairment would require management to make judgments and assumptions based on historical experience and projections of future operating performance. The Company recognizes goodwill impairment, if any, as the excess of the reporting unit’s carrying value over its fair value, not to exceed the total amount of goodwill allocated to the reporting unit.
Warranties
The Company offers homeowners a comprehensive third-party warranty on each home. Homes are generally covered by a ten-year warranty for qualified and defined structural defects, one year for defects and products used, and two years for electrical, plumbing, heating, ventilation, and air conditioning parts and labor. The Company accrues an estimate of its exposure to warranty claims based on both current and historical home closings data and warranty costs incurred. A warranty accrual is made with the closing of a home and it is included within accrued expenses on the consolidated balance sheets. Any legal costs associated with loss contingencies related to warranties are expensed as incurred.
Debt Issuance Costs
Debt issuance costs represent costs incurred related to the senior unsecured notes, revolving secured and unsecured credit facilities, and notes payable, including amendments thereto, and reduce the carrying amount of debt on the consolidated balance sheets. These costs are subject to capitalization to inventory over the term of the related debt facility using the straight-line method, which approximates the effective interest rate method for our senior unsecured notes and notes payable.
44
Revenue Recognition
Contracts with Customers
The Company derives revenues from two primary sources: the closing and delivery of homes through our builder operations segments and the closing of lots and land sold to third parties through our land development segment. All of our revenue is from contracts with customers.
Contract Liabilities
The Company requires homebuyers to submit a deposit for home purchases and requires third-party buyers to submit a deposit in connection with land sale or lot option contracts. These deposits serve as an incentive for performance under homebuilding and land sale or development contracts. Cash received as customer deposits, if held in escrow, is reflected as restricted cash and as customer and builder deposits on the consolidated balance sheets.
Performance Obligations
The Company’s contracts with homebuyers contain a single performance obligation, which is satisfied when homes are completed and legal title has been transferred to the buyer. The Company does not have any variable consideration associated with home sales transactions.
Revenue from mechanic’s lien contracts in which the Company serves as the general contractor for custom homes where the customer owns the underlying land and improvements is recognized based on the input method, where progress toward completion is measured by relating the actual cost of work performed to date to the estimated total cost of the respective contracts.
Lot option contracts contain multiple performance obligations. The performance obligations are satisfied as lots are closed and legal title has been transferred to the builder. For lot option contracts, individual performance obligations are accounted for separately. The transaction price is allocated to the separate performance obligations on a relative stand-alone selling price basis. Certain lot option contracts require escalations in lot price over the option period. Any escalator is not collectible until the lot closing occurs. While we recognize lot escalators as variable consideration within the transaction price, we do not recognize escalator revenue until a builder closes on a lot subject to an escalator as the escalator relates to general inflation and holding costs.
Occasionally, the Company sells developed and undeveloped land parcels. If the land parcel is developed prior to the sale of the land, the revenue is recognized at closing since we deliver a single performance obligation in the form of a developed parcel. We also recognize revenue at closing on undeveloped land parcel sales as there are no other obligations beyond delivering the undeveloped land.
Homebuyers are not obligated to pay for a home until the closing and delivery of the home. The selling price of a home is based on the contract price adjusted for any change orders, which are considered modifications of the contract price.
Homebuilders are not obligated to pay for developed lots prior to control of the lots and any associated improvements being transferred to them. The term of our lot option contracts is generally based upon the number of lots being purchased and an agreed upon lot takedown schedule, which can be in excess of one year. Lots cannot be taken down until development is substantially complete. There is no significant financing component related to our third-party lot sales.
The Company does not sell warranties outside of the customary workmanship warranties provided on homes or developed lots at the time of sale. The warranties offered to homebuyers are short term, with the exception of ten-year warranties on structural concerns for homes. As these are assurance-type warranties, there is no separate performance obligation related to warranties provided to homebuyers or homebuilders.
Significant Judgments and Estimates
There are no significant judgments involved in the recognition of residential units revenue. The performance obligation of delivering a completed home is satisfied upon the sale closing when title transfers to the buyer.
45
There are no significant judgments involved in the recognition of land and lots revenue. The performance obligation of delivering land and lots is satisfied upon the closing of the sale when title transfers to the buyer.
Contract Costs
The Company recognizes an asset for the incremental costs of obtaining a contract with a customer if it expects to recover those costs.
The Company pays sales commissions to employees and/or outside realtors related to individual home sales which are expensed as incurred at the time of closing. Commissions on the sale of land parcels are also expensed as incurred upon closing. Sales commissions on the sale of homes are included in the selling, general, and administrative expenses in the consolidated statements of income.
The Company also pays builder incentives to employees which are based on the time it takes to build individual homes, as well as quality inspection completion and customer satisfaction. The builder incentives do not represent incremental costs that would require capitalization as we would incur these costs whether or not we sold the home. As such, we recognize builder incentives as expense at the time they are incurred and paid.
Advertising costs, sales salaries and certain costs associated with model homes, such as signage, do not qualify for capitalization under ASC 340-40, Other Assets and Deferred Costs - Contracts with Customers, as they are not incremental costs of obtaining a contract. As such, we expense these costs to selling, general and administrative expense as incurred. Costs incurred related to model home furnishings and sales office construction are capitalized and included in property and equipment, net on the consolidated balance sheets.
Advertising Expense
The Company expenses advertising costs as incurred. Advertising costs are included in selling, general and administrative expense in the consolidated statements of income. Advertising expense for the years ended December 31 , 20221.2 million, $1.3 million and $2.2 million, respectively.
Interest Expense
Interest expense consists primarily of interest costs incurred on our debt that are not capitalized, and amortization of debt issuance costs. We capitalize interest costs incurred to inventory during development and other qualifying activities. Debt issuance costs are capitalized to inventory over the term of the underlying debt using the straight-line method, which approximates the effective interest rate method for our senior unsecured notes and notes payable, in accordance with our interest capitalization policy. All interest costs were capitalized during the years ended December 31 , 2022
Net Income Attributable to Green Brick Partners, Inc. per Common Share
Basic earnings per common share is computed by dividing net income allocated to common stockholders by the weighted average number of common shares outstanding during each period, adjusted for non-vested shares of restricted stock awards during each period. Net income allocated to common stockholders is net income adjusted for preferred stock dividends including dividends declared and cumulative dividends related to the current dividend period that have not been declared as of period end. Diluted earnings per share is calculated using the treasury stock method and includes the effect of all dilutive securities, including stock options and restricted stock awards.
46
Cost Recognition
Lot acquisition, materials, direct costs, interest and indirect costs related to the acquisition, development, and construction of lots and homes are capitalized. Direct and indirect costs of developing residential lots are allocated evenly to all applicable lots. Capitalized costs of residential lots are recognized when the related revenue is recognized. Non-capitalizable costs in connection with developed lots and completed homes and other selling and administrative costs are recognized when incurred.
Share-Based Compensation
The Company measures and accounts for share-based awards in accordance with ASC 718, Compensation - Stock Compensation. The Company expenses share-based payment awards made to employees and directors, including stock options and restricted stock awards. Share-based compensation expense associated with stock options and restricted stock awards with vesting contingent upon the achievement of service conditions is recognized on a straight-line basis, net of estimated forfeitures, over the requisite service period over which the awards are expected to vest. The Company estimates the value of stock options with vesting contingent upon the achievement of service conditions as of the date the award was granted using the Black-Scholes option pricing model. The Black-Scholes option pricing model requires the use of certain input variables, such as expected volatility, risk-free interest rate and expected award life.
Income Taxes
The Company accounts for income taxes using the asset and liability method, under which deferred tax assets and liabilities are recognized for the future tax consequences attributable to temporary differences between financial statement carrying amounts of existing assets and liabilities and their respective tax bases, operating losses and tax credit carryforwards. Deferred tax assets and liabilities are measured using enacted tax rates expected to apply to taxable income in years in which temporary differences are expected to be recovered or settled. The effect on deferred tax assets and liabilities of a change in tax rates is recognized in income in the period that includes the enactment date.
The Company regularly reviews historical and anticipated future pre-tax results of operations to determine whether we will be able to realize the benefit of deferred tax assets. A valuation allowance is required to reduce the deferred tax asset when it is more-likely-than-not that all or some portion of the deferred tax asset will not be realized due to the lack of sufficient taxable income. The Company assesses the recoverability of deferred tax assets and the need for a valuation allowance on an ongoing basis. In making this assessment, management considers all available positive and negative evidence and available income tax planning to determine whether it is more-likely-than-not that some portion or all of the deferred tax assets will be realized in future periods. This assessment requires significant judgment and estimates involving current and deferred income taxes, tax attributes relating to the interpretation of various tax laws, historical bases of tax attributes associated with certain assets and limitations surrounding the realization of deferred tax assets.
We establish accruals for uncertain tax positions that reflect our best estimate of deductions and credits that may not be sustained on a more-likely-than-not basis. We recognize interest and penalties related to uncertain tax positions in the income tax expense in the consolidated statements of income. Accrued interest and penalties, if any, are included within accrued expenses on the consolidated balance sheets. In accordance with ASC 740, Income Taxes, the Company recognizes the effect of income tax positions only if those positions have a more-likely-than-not chance of being sustained by the Company. Recognized income tax positions are measured at the largest amount that is greater than 50% likely of being realized. Changes in recognition or measurement are reflected in the period in which the change in judgment occurs.
Fair Value Measurements
The Company has adopted and implemented the provisions of ASC 820-10, Fair Value Measurements (“ASC 820-10”), with respect to fair value measurements of: all elected financial assets and liabilities and any nonfinancial assets and liabilities that are recognized or disclosed in the consolidated financial statements at fair value on a recurring basis (at least annually). Under ASC 820-10, fair value is defined as an exit price, or the amount that would be received to sell an asset or paid to transfer a liability in an orderly transaction between market participants as of the measurement date. These provisions establish a three-tiered fair value hierarchy that prioritizes inputs to valuation techniques used in fair value calculations. The three levels
47
of input are defined as follows:
| Level 1 — | unadjusted quoted prices for identical assets or liabilities in active markets accessible by the Company; | ||||
| Level 2 — | inputs that are observable in the marketplace other than those classified as Level 1; and | ||||
| Level 3 — | inputs that are unobservable in the marketplace and significant to the valuation. | ||||
Entities are encouraged to maximize the use of observable inputs and minimize the use of unobservable inputs. If a financial instrument uses inputs that fall in different levels of the hierarchy, the instrument will be categorized based upon the lowest level of input that is significant to the fair value calculation.
Our valuation methods may produce a fair value calculation that may not be indicative of net realizable value or reflective of future fair values. Furthermore, while we believe our valuation methods are appropriate and consistent with other market participants, the use of different methodologies or assumptions to determine the fair value of certain financial instruments could result in a different fair value measurement at the reporting date.
Transfers between levels of the fair value hierarchy are deemed to have occurred on the date of the event or change in circumstances that caused the transfer.
2. INTANGIBLE ASSETS, GOODWILL, AND REDEEMABLE NONCONTROLLING INTEREST
Intangible Assets
In April 2018, following a series of transactions, the Company acquired substantially all of the assets and assumed certain liabilities of GHO Homes Corporation and its affiliates (“GHO”) through a newly formed subsidiary, GRBK GHO Homes, LLC (“GRBK GHO”). The Company holds an 80% controlling interest in this Florida-based partner.
Intangible assets related to the acquired trade name were recognized in this business combination. The amortization of the acquired trade name of $0.1 million for each of the years ended December 31 , 20220.4 million and $0.3 million as of December 31 , 2022
The estimated amortization expense related to the acquired trade name for each of the next five years as of December 31 , 2022
| 2023 | $ | ||||
| 2024 | |||||
| 2025 | |||||
| 2026 | |||||
| 2027 | |||||
| Thereafter | |||||
| Total | $ | 452 | |||
Goodwill
Pursuant to this acquisition, the Company recognized goodwill of $0.7 million. The Company performed its annual goodwill impairment testing during the fourth quarter of 2022 by completing a qualitative assessment, which included the review of macroeconomic conditions and financial performance, among others. Through this assessment the Company
48
determined that it is not more likely than not that the carrying amount of the Southeast reporting unit exceeds its fair value. The Company did not record any goodwill impairment during the years ended December 31, 2022, 2021 and 2020.
Redeemable Noncontrolling Interest in Equity of Consolidated Subsidiary
As part of the GRBK GHO business combination, we entered into a put/call agreement (“Put/Call Agreement”) with respect to the equity interest in the joint venture held by the minority partner. The Put/Call Agreement provides that the 20% ownership interest in GRBK GHO held by the minority partner would be subject to put and purchase options starting in April 2024. The exercise price would be based on the financial results of GRBK GHO for the three years prior to exercise of the option. If the minority partner does not exercise the put option, we have the option, but not the obligation, to buy the 20% interest in GRBK GHO from our partner.
Based on the nature of the put/call structure, the noncontrolling interest attributable to the 20% minority interest owned by our Florida-based partner is included as redeemable noncontrolling interest in equity of consolidated subsidiary in the Company’s consolidated financial statements.
| Years Ended December 31, | ||||||||||||||
| 2022 | 2021 | |||||||||||||
| Redeemable noncontrolling interest, beginning of period | $ | $ | ||||||||||||
| Net income attributable to redeemable noncontrolling interest partner | ||||||||||||||
| Distributions of income to redeemable noncontrolling interest partner | ( | |||||||||||||
| Change in fair value of redeemable noncontrolling interest | ||||||||||||||
| Redeemable noncontrolling interest, end of period | $ | $ | ||||||||||||
3. VARIABLE INTEREST ENTITIES
Consolidated VIEs
CB JENI
On April 29, 2020, through a series of transactions, the Company acquired the remaining membership and voting interests in our subsidiary, CB JENI Homes DFW LLC (“CB JENI”). As a result, CB JENI became an indirect wholly owned subsidiary and no longer considered a VIE. CB JENI was consolidated in the Company’s consolidated financial statements based on the majority voting interest pursuant to ASC 810.
As both the entity wholly owned by the Company to which CB JENI’s ownership interests were assigned to and CB JENI were controlled by the Company, the acquisition of the remaining membership interest was accounted for at the carrying amounts on CB JENI’s books, pursuant to provisions of ASC 805 that govern transactions between entities under common control.
TPG
The Providence Group of Georgia LLC (“TPG”), a controlled builder based in Atlanta in which the Company owns a 50 % equity interest, is considered to be a VIE. We sell finished lots and option lots from third-party developers to this controlled builder for its homebuilding operations and provide them with construction financing and strategic planning. Pursuant to the Company’s agreement with TPG, the Company has the ability to appoint two of the three members to TPG’s board of managers. A majority of the board of managers constitutes a quorum to transact business and no action can be approved by the board of managers without the approval from at least one individual whom the Company has appointed.
The Company has the ability to control the activities of TPG that most significantly impact its economic performance through the board of managers. Such activities include, but are not limited to, involvement in the day-to-day capital and operating decisions, the ability to determine the budget and plan, the ability to control financing decisions, and the ability to acquire or dispose of land. In addition, the Company has the right to receive the expected residual returns and obligation to absorb the expected losses of this controlled builder through the pro rata profits and losses as allocated based on our ownership interest. Therefore, the Company is considered TPG’s primary beneficiary and its financial statements are consolidated in the Company’s consolidated financial statements following the variable interest model.
49
The aggregated carrying amounts of assets and liabilities of TPG were $190.1 million and $164.1 million, respectively, as of December 31 , 2022162.0 million and $146.6 million, respectively, as of December 31, 2021. The noncontrolling interest attributable to the 50% minority interest owned by TPG was included as noncontrolling interests in the Company’s consolidated financial statements. The creditors of this controlled builder have no recourse against the Company.
Unconsolidated VIEs
Please refer to Note 5 for information on the Company’s VIE evaluation of its joint ventures with EJB River Holdings, LLC and GBTM Sendera, LLC.
Land and lot option purchase contracts
The Company evaluates all option contracts to purchase land and lots to determine whether they are VIEs and, if so, whether the Company is the primary beneficiary of counterparts of these option contracts. Although the Company does not have legal title to the optioned land or lots, if the Company is deemed to be the primary beneficiary or makes a significant deposit for optioned land or lots, it may need to consolidate the land or lots under option at the purchase price of the optioned land or lots.
4. INVENTORY
| December 31, 2021 | |||||||||||
| Homes completed or under construction | $ | $ | |||||||||
| Land and lots - developed and under development | |||||||||||
Land held for future development(1) | 48,369 | — | |||||||||
| Land held for sale | |||||||||||
| Total inventory | $ | $ | |||||||||
(1)Land held for future development consists of raw land parcels where development activities have been postponed due to market conditions or other factors. All applicable carrying costs, including property taxes, are expensed as incurred.
| Years Ended December 31, | |||||||||||||||||
| 2022 | 2021 | 2020 | |||||||||||||||
| Interest capitalized at beginning of period | $ | $ | $ | ||||||||||||||
| Interest incurred | |||||||||||||||||
| Interest charged to cost of revenues | ( | ( | ( | ||||||||||||||
| Interest capitalized at end of period | $ | $ | $ | ||||||||||||||
| Capitalized interest as a percentage of inventory | 1.6 | % | 1.7 | % | |||||||||||||
As of December 31 , 20226.0 million impairment charge to reduce the carrying value of certain land held for future development to fair value. This impairment charge was included in cost of residential units in our consolidated statements of income.
50
5. INVESTMENTS IN UNCONSOLIDATED ENTITIES
We participate in a number of joint ventures and other investments with independent third parties. These entities generally focus on homebuilding, land development, and mortgage services to homebuyers. The Company’s investment in these entities is included in investments in unconsolidated entities in the Company’s consolidated balance sheets under the equity method of accounting.
A summary of the Company’s investments in unconsolidated entities is as follows (in thousands):
| December 31, 2022 | December 31, 2021 | |||||||||||||
| GB Challenger, LLC | $ | $ | ||||||||||||
| GBTM Sendera, LLC | ||||||||||||||
| EJB River Holdings, LLC | ||||||||||||||
| Green Brick Mortgage, LLC | ||||||||||||||
| BHome Mortgage, LLC | ||||||||||||||
| Total investment in unconsolidated entities | $ | $ | ||||||||||||
Challenger
In August 2017, the Company acquired a 49.9% ownership interest in GB Challenger, LLC (“Challenger”). Challenger constructs townhouses, single family homes, and luxury patio homes and operates in Colorado Springs and Denver, Colorado.
The Company’s investment in Challenger is carried at cost, as adjusted for the Company’s share of income or losses and distributions received, as well as for adjustments related to basis differences between the Company’s cost and the Company’s underlying equity in net assets recorded in Challenger’s financial statements as of the date of acquisition.
As of December 31 , 202249.9 million. The underlying 49.9 % equity in net assets of Challenger was $47.4 million as of December 31 , 20222.5 million difference represents the premium paid for the Company’s equity interest in excess of Challenger’s carrying value. This basis difference primarily relates to the estimated fair value of inventory, as well as the Challenger Homes trade name and capitalized acquisition costs. The amortization of the basis differences related to inventory is recognized as homes are delivered to homebuyers and the trade name is amortized over ten years. The amortization of the basis difference is a reduction of equity in income of unconsolidated entities.
The Company recognized $20.9 million, $14.8 million, and $11.9 million, related to Challenger in equity in income of unconsolidated entities during the years ended December 31 , 2022
GBTM Sendera, LLC
In August 2020, the joint venture GBTM Sendera, LLC (“GBTM Sendera”) was formed by GRBK Edgewood, LLC (“GRBK Edgewood”) and TM Sendera, LLC (“TM Sendera”) to acquire and develop a tract of land in Fort Worth, Texas. Each party holds a 50 % ownership interest in GBTM Sendera and share equally in the profits and losses of GBTM Sendera, with the exception of certain customary fees. The Company made capital contributions of $3.6 million during the year ended December 31 , 20229.8 million cash contribution was made by the Company during the year December 31, 2020.
As of December 31 , 202235.2 million and $8.3 million, respectively. As of December 31 , 202213.5 million, representing the Company’s investment in GBTM Sendera.
EJB River Holdings
In December 2018, the joint venture EJB River Holdings (“EJB”) was formed by TPG to acquire and develop a tract of land in Gwinnett County, Georgia. In May 2019, East Jones Bridge, LLC was admitted as a member, which resulted in TPG having a 50 % ownership interest in EJB River Holdings.
EJB River Holdings has borrowings of $12.7 million to finance its land acquisition and development. A wholly owned subsidiary of the Company provided a limited $2.0 million guarantee in connection with this debt. In the event EJB defaults on
51
one of its loans, the maximum potential amount of future payments that the Company could be required to make under its limited guarantee is $2.0 million. As of December 31 , 2022
As of December 31 , 202230.6 million and $13.5 million, respectively. As of December 31 , 202210.6 million, comprised of the sum of the Company’s investment in EJB of $8.6 million and the $2.0 million limited guarantee described above.
Green Brick Mortgage
In June 2018, the Company formed a joint venture with PrimeLending to provide mortgage loan origination services to our builders. The Company owned a 49.9 % equity interest in Green Brick Mortgage, LLC. In 2022, this joint venture was terminated and the Company incurred a de minimis loss upon dissolution.
BHome Mortgage
In May 2020, the Company established a joint venture, BHome Mortgage, LLC (“BHome Mortgage”) with First Continental Mortgage, Ltd., to provide mortgage related services to homebuyers. The Company owns 49 % of BHome Mortgage. BHome Mortgage received initial capital contributions of approximately $0.5 million from its two members in accordance with their membership interest during the year ended December 31, 2020.
Providence Title
In March 2018, the Company formed a joint venture with a title company in Georgia to provide title closing and settlement services to our Atlanta-based builder. The Company, through its controlled builder, TPG, owned a 49 % equity interest in Providence Group Title, LLC (“Providence Title”). In December 2020, this joint venture was terminated and the Company incurred a de minimis loss upon dissolution.
A summary of the financial information of the unconsolidated entities that are accounted for by the equity method, as described above, is as follows (in thousands):
| December 31, 2022 | December 31, 2021 | ||||||||||||||||
| Assets: | |||||||||||||||||
| Cash | $ | $ | |||||||||||||||
| Accounts receivable | |||||||||||||||||
| Bonds and notes receivable | |||||||||||||||||
| Loans held for sale, at fair value | |||||||||||||||||
| Inventory | |||||||||||||||||
| Other assets | |||||||||||||||||
| Total assets | $ | $ | |||||||||||||||
| Liabilities: | |||||||||||||||||
| Accounts payable | $ | $ | |||||||||||||||
| Accrued expenses and other liabilities | |||||||||||||||||
| Notes payable | |||||||||||||||||
| Total liabilities | $ | $ | |||||||||||||||
| Owners’ equity: | |||||||||||||||||
| Green Brick | $ | $ | |||||||||||||||
| Others | |||||||||||||||||
| Total owners’ equity | $ | $ | |||||||||||||||
| Total liabilities and owners’ equity | $ | $ | |||||||||||||||
52
| Years Ended December 31, | |||||||||||||||||
| 2022 | 2021 | 2020 | |||||||||||||||
| Revenues | $ | $ | $ | ||||||||||||||
| Costs and expenses | |||||||||||||||||
| Net earnings of unconsolidated entities | $ | $ | $ | ||||||||||||||
| Company’s share in net earnings of unconsolidated entities | $ | $ | $ | ||||||||||||||
A summary of the Company’s share in net earnings (losses) by unconsolidated entity is as follows (in thousands):
| Years Ended December 31, | ||||||||||||||||||||
| 2022 | 2021 | 2020 | ||||||||||||||||||
| GB Challenger, LLC | $ | $ | $ | |||||||||||||||||
| EJB River Holdings, LLC | ( | |||||||||||||||||||
| BHome Mortgage, LLC | ||||||||||||||||||||
| Green Brick Mortgage, LLC | ||||||||||||||||||||
| Providence Group Title, LLC | ||||||||||||||||||||
| Total net earnings from unconsolidated entities | $ | $ | $ | |||||||||||||||||
During the years ended December 31 , 2022
6. PROPERTY AND EQUIPMENT, NET
| December 31, 2022 | December 31, 2021 | ||||||||||
| Model home furnishings and capitalized sales office costs | $ | $ | |||||||||
| Office furniture and equipment | |||||||||||
| Leasehold improvements | |||||||||||
| Computers and equipment | |||||||||||
| Vehicles and field trailers | |||||||||||
| Less: accumulated depreciation | ( | ( | |||||||||
| Total property and equipment, net | $ | $ | |||||||||
Depreciation expense for the years ended December 31, 2022, 2021 and 2020 totaled $2.3 million, $2.7 million, and $3.6 million, respectively, and is included in selling, general and administrative expense in our consolidated statements of income.
7. ACCRUED EXPENSES
A summary of the Company’s accrued expenses is as follows (in thousands):
| December 31, 2022 | December 31, 2021 | |||||||||||||
Real estate development reserve to complete(1) | ||||||||||||||
| Warranty reserve | ||||||||||||||
| Accrued compensation | ||||||||||||||
| Other accrued expenses | ||||||||||||||
| Total accrued expenses | ||||||||||||||
(1)Our real estate development reserve to complete consists of estimated future costs to finish the development of our communities.
53
Warranties
| December 31, 2022 | December 31, 2021 | ||||||||||
| Warranty accrual, beginning of period | $ | $ | |||||||||
| Warranties issued | |||||||||||
| Changes in liability for existing warranties | ( | ||||||||||
| Settlements made | ( | ( | |||||||||
| Warranty accrual, end of period | $ | $ | |||||||||
8. DEBT
| 2023 | $ | ||||
| 2024 | |||||
| 2025 | |||||
| 2026 | |||||
| 2027 | |||||
| Thereafter | |||||
| Total | $ | ||||
Lines of Credit
| December 31, 2022 | December 31, 2021 | ||||||||||
| Secured Revolving Credit Facility | $ | $ | |||||||||
| Unsecured Revolving Credit Facility | |||||||||||
| Debt issuance costs, net of amortization | ( | ( | |||||||||
| Total borrowings on lines of credit, net | $ | $ | ( | ||||||||
Secured Revolving Credit Facility
The Company is party to a revolving credit facility (the “Secured Revolving Credit Facility”) with Inwood National Bank, which provides for an aggregate commitment amount of $35.0 million. Amounts outstanding under the Secured Revolving Credit Facility are secured by mortgages on real property and security interests in certain personal property (to the extent that such personal property is connected with the use and enjoyment of the real property) that is owned by certain of the Company’s subsidiaries. The entire unpaid principal balance and any accrued but unpaid interest is due and payable on the maturity date. On February 9, 2022, the Company entered into the Eighth Amendment to this credit agreement to extend its maturity date to May 1, 2025 and to reduce the minimum interest rate from 4.00% to 3.15%. All other material terms of the credit agreement, as amended, remained unchanged.
As of December 31 , 202235.0 million.
Outstanding borrowings under the amended Secured Revolving Credit Facility bear interest payable monthly at a floating rate per annum equal to the rate announced by Bank of America, N.A., from time to time, as its “Prime Rate” (the “Index”) with such adjustments to the interest rate being made on the effective date of any change in the Index, less 0.25%. Notwithstanding the foregoing, the interest may not, at any time, be less than 3.15 % per annum or more than the lesser amount of 18 % and the highest maximum rate allowed by applicable law.
54
The Secured Revolving Credit Facility is subject to a borrowing base limitation equal to the sum of 50 % of the total value of land and 65 % of the total value of lots owned by certain of the Company’s subsidiaries, each as determined by an independent appraiser, with the value of land being restricted from being more than 65 % of the borrowing base. The amended Secured Revolving Credit Facility is also subject to a non-usage fee equal to 0.25 % of the average unfunded amount of the commitment amount over a trailing 12 month period.
Fees and other debt issuance costs of $0.1 million were incurred during the year ended December 31 , 2022
Under the terms of the amended Secured Revolving Credit Facility, the Company is required, among other things, to maintain minimum multiples of tangible net worth in excess of the outstanding Secured Revolving Credit Facility balance, minimum interest coverage and maximum leverage. The Company was in compliance with these financial covenants under the Secured Revolving Credit Facility as of December 31 , 2022
Unsecured Revolving Credit Facility
The Company is party to a credit agreement, providing for a senior, unsecured revolving credit facility (the “Unsecured Revolving Credit Facility”). On December 9, 2022, the Company entered into the Tenth Amendment to this credit agreement which increased the secured outstanding commitments from $300.0 million to $325.0 million and extended the termination date by one year to December 14, 2025 . The Tenth Amendment also replaced LIBOR as the benchmark interest rate with the Secure Overnight Financing Rate (“SOFR”).
Outstanding advances under the Unsecured Revolving Credit Facility accrue interest at the benchmark rate plus 2.5 %. Interest on amounts borrowed under the Unsecured Revolving Credit Facility is payable in arrears on a monthly basis. The Company pays the lenders a commitment fee on the amount of the unused commitments on a monthly basis at a rate per annum equal to 0.45 %. As of December 31, 2022, the interest rate on outstanding borrowings under the Unsecured Revolving Credit Facility was 6.9 % per annum.
Outstanding borrowings under the Unsecured Revolving Credit Facility are subject to, among other things, a borrowing base. The borrowing base limitation is equal to the sum of: 100 % of unrestricted cash in excess of $15.0 million; 85 % of the book value of model homes, construction in progress homes, completed sold and speculative homes (subject to certain limitations on the age and number of speculative homes and model homes); 65 % of the book value of finished lots and land under development; and 50 % of the book value of entitled land (subject to certain limitations on the value of entitled land and land under development as a percentage of the borrowing base).
Fees and other debt issuance costs of $0.7 million, $2.8 million and $0.5 million were incurred during the years ended December 31 , 2022
Under the terms of the Unsecured Revolving Credit Facility, the Company is required to maintain compliance with various financial covenants, including a maximum leverage ratio, a minimum interest coverage ratio, and a minimum consolidated tangible net worth. The Company was in compliance with these financial covenants under the Unsecured Revolving Credit Facility as of December 31 , 2022
Senior Unsecured Notes
On August 8, 2019, the Company entered into a Note Purchase Agreement with Prudential Private Capital to issue $75.0 million aggregate principal amount of senior unsecured notes (the “2026 Notes”) due on August 8, 2026 at a fixed rate of 4.00 % per annum in a Section 4(a)(2) private placement transaction. The Company received net proceeds of $73.3 million and incurred debt issuance costs of approximately $1.7 million that were deferred and reduced the amount of debt on our consolidated balance sheet. The Company used the net proceeds from the issuance of the 2026 Notes to repay borrowings under the Company’s existing revolving credit facilities. Principal on the 2026 Notes is required to be paid in increments of $12.5 million on August 8, 2024 and $12.5 million on August 8, 2025. The final principal payment of $50.0 million is due on August
55
8, 2026. Optional prepayment is allowed with payment of a “make-whole” penalty which fluctuates depending on market interest rates. Interest is payable quarterly in arrears commencing November 8, 2019.
On August 26, 2020, the Company entered into a Note Purchase Agreement with The Prudential Insurance Company of America and Prudential Universal Reinsurance Company to issue $37.5 million aggregate principal amount of senior unsecured notes (the “2027 Notes”) due on August 26, 2027 at a fixed rate of 3.35 % per annum in a Section 4(a)(2) private placement transaction. The Company received net proceeds of $37.4 million and incurred debt issuance costs of approximately $0.1 million that were deferred and reduced the amount of debt on our consolidated balance sheet. The Company used the net proceeds from the issuance of the 2027 Notes to repay borrowings under the Company’s existing revolving credit facilities and for general corporate purposes. Optional prepayment is allowed with payment of a “make-whole” penalty which fluctuates depending on market interest rates. Interest is payable quarterly in arrears commencing on November 26, 2020.
On February 25, 2021, the Company entered into a Note Purchase Agreement with several purchasers to issue $125.0 million aggregate principal amount of senior unsecured notes (the “2028 Notes”) due on May 25, 2028 at a fixed rate of 3.25 % per annum in a Section 4(a)(2) private placement transaction. The Company received net proceeds of $124.4 million and incurred debt issuance costs of approximately $0.6 million that were deferred and reduced the amount of debt on our consolidated balance sheet. The Company used the net proceeds from the issuance of the 2028 Notes to repay borrowings under the Company’s existing revolving credit facilities and for general corporate purposes. Principal on the 2028 Notes is due in increments of $25.0 million on February 25, 2024; $25.0 million on February 25, 2025; $25.0 million on February 25, 2026; $25.0 million on February 25, 2027 and $25.0 million on February 25, 2028. Optional prepayment is allowed with payment of a “make-whole” penalty which fluctuates depending on market interest rates. Interest is payable quarterly in arrears commencing on May 25, 2021.
On December 28, 2021, the Company entered into a Note Purchase Agreement with several purchasers to issue $100.0 million aggregate principal amount of senior unsecured notes (the “2029 Notes”) due on December 28, 2029 at a fixed rate of 3.25 % per annum in a Section 4(a)(2) private placement transaction. The Company received net proceeds of $99.6 million and incurred debt issuance costs of approximately $0.4 million that were deferred and reduced the amount of debt on our consolidated balance sheet. The Company used the net proceeds from the issuance of the 2029 Notes to repay borrowings under the Company’s existing revolving credit facilities and for general corporate purposes. Principal on the 2029 Notes of $30.0 million is due on December 28, 2028. The remaining principal amount of $70.0 million is due on December 29, 2029. Optional prepayment is allowed with payment of a “make-whole” penalty which fluctuates depending on market interest rates. Interest is payable quarterly in arrears commencing on March 28, 2022.
Under the terms of the senior unsecured notes, the Company is required, among other things, to maintain compliance with various financial covenants, including maximum leverage ratios, a minimum interest coverage ratio, and a minimum consolidated tangible net worth. The Company was in compliance with these financial covenants under the Senior Unsecured Notes as of December 31 , 2022
Notes payable
On February 7, 2022, a subsidiary of the Company entered into a Promissory Note agreement with another homebuilder for $28.8 million in connection with the acquisition of a tract of land in Bastrop County, Texas. The Company agreed to pay $14.4 million per the governing Joint Ownership and Development Agreement. The Promissory Note matures on February 7, 2024 and carries an annual fixed rate of 0.6 %.
9. STOCKHOLDERS’ EQUITY
Common Stock
Pursuant to the Company’s amended and restated certificate of incorporation (“Certificate of Incorporation”), the Company is authorized to issue up to 100,000,000 shares of common stock, par value $0.01 per share. As of December 31 , 202246,032,930 shares of common stock issued outstanding.
Preferred Stock
Pursuant to the Company’s Certificate of Incorporation, the Company is authorized to issue up to 5,000,000 shares of preferred stock, par value $0.01 per share. The Board of Directors (the “Board”) has the authority, subject to any limitations imposed by law or NYSE rules, without further action by the stockholders, to issue such preferred stock in one or more series
56
and to fix the voting powers (if any), the preferences and relative, participating, optional or other special rights or privileges, if any, of such series and the qualifications, limitations or restrictions thereof. These rights, preferences and privileges may include, but are not limited to, dividend rights, conversion rights, voting rights, terms of redemption, liquidation preferences, sinking fund terms and the number of shares constituting any series or the designation of that series.
On December 23, 2021, the Company issued 2,000 shares of 5.75 % Series A Cumulative Perpetual Preferred Stock for $50.0 million. The Company pays cumulative cash dividends on the Series A Preferred Stock, when and as declared by the Board Of Directors, at the rate of 5.75% of the $25,000 liquidation preference per share. Dividends are payable quarterly in arrears, beginning on or about March 15, 2022.
The Company will have the option to redeem the shares, in whole or in part, at a redemption price equal to $25,000 per share on or after December 23, 2026, which is the fifth anniversary of the date of issuance of the Series A Preferred Stock, or upon change of control. Unless the Company decides to exercise the redemption option, upon the occurrence of a change of control, preferred stockholders will have the right to convert some or all of the Series A Preferred Stock into a number of shares of the Company’s common stock equal to the lesser of (i) the quotient obtained by dividing (A) the sum of (x) the liquidation preference to be converted, plus (y) the amount per such share equal to any accrued and unpaid dividends, by (B) the common stock price, and (ii) 1.7059.
The Company incurred $2.3 million in fees and expenses in connection with this transaction that reduced the amount of equity on our consolidated balance sheet during the year ended December 31, 2021.
The table below presents a summary of the perpetual preferred stock outstanding at December 31 , 2022
| Series | Description | Initial date of issuance | Total Shares Outstanding | Liquidation Preference per Share (in dollars) | Carrying Value | Per Annum Dividend Rate | Redemption Period | |||||||||||||||||||||||||||||||||||||
Series A(1) | 5.75% Cumulative Perpetual | December 2021 | 2,000 | $ | $ | % | n/a | |||||||||||||||||||||||||||||||||||||
(1) Ownership is held in the form of Depositary Shares, each representing a 1/1,000th interest in a share of preferred stock, paying a quarterly cash dividend, if and when declared.
Dividends
Dividends paid on our Series A preferred stock totaled 2.8 million during the year ended December 31 , 2022
On February 14, 2023, the Board declared a quarterly cash dividend of $0.359 per depositary share on the Series A Preferred Stock. The dividend is payable on March 15, 2023 to stockholders of record as of March 1, 2023.
Share Repurchase Programs
2021 Share Repurchase Program
On March 1, 2021, the Company’s Board of Directors (the “Board”) authorized a $50.0 million stock repurchase program (the “the 2021 Repurchase Plan”). The 2021 Repurchase Plan authorized the Company to purchase from time to time on or prior to December 31, 2022 , up to $50.0 million of our outstanding common stock through open market repurchases in compliance with Rule 10b-18 under the Exchange Act and/or in privately negotiated transactions at management’s discretion based on market and business conditions, applicable legal requirements and other factors. The 2021 Repurchase Plan may be modified or terminated by our Board at any time in its sole discretion.
During the year ended December 31 , 20222,423,644 shares for approximately $50.0 million. The Company completed the repurchases under the 2021 Repurchase Plan on April 29, 2022. The repurchased shares were subsequently retired.
2022 Share Repurchase Program
On April 27, 2022, the Board approved a stock repurchase program (the “2022 Repurchase Plan”) that authorizes the Company to purchase, from time to time, up to an additional $100.0 million of our outstanding common stock through open market repurchases in compliance with Rule 10b-18 under the Exchange Act and/or in privately negotiated transactions at management’s discretion based on market and business conditions, applicable legal requirements and other factors. The new
57
10. SHARE-BASED COMPENSATION
2014 Omnibus Equity Incentive Plan
On October 17, 2014, the Company’s stockholders approved the Green Brick Partners, Inc. 2014 Omnibus Equity Incentive Plan (the “2014 Equity Plan”). The purpose of the 2014 Equity Plan is to provide a means for the Company to attract and retain key personnel and to provide a means whereby current and prospective directors, officers, employees, consultants and advisors can acquire and maintain an equity interest in the Company, or be paid incentive compensation, which may (but need not) be measured by reference to the value of the Company’s common stock, thereby strengthening their commitment to the welfare of the Company and aligning their interests with those of the Company’s stockholders. The 2014 Equity Plan will terminate automatically on the tenth anniversary of the date it became effective. No awards will be granted under the 2014 Equity Plan after that date, but awards granted prior to that date may extend beyond that date.
Under the 2014 Equity Plan, awards of stock options, including both incentive stock options and nonqualified stock options, stock appreciation rights, restricted stock and restricted stock units, other share-based awards and performance compensation awards, may be granted. The maximum number of shares of the Company’s common stock that is authorized and reserved for issuance under the 2014 Equity Plan is 2,350,956 shares, subject to adjustment for certain corporate events or changes in the Company’s capital structure.
In general, the Company’s employees or those reasonably expected to become the Company’s employees, consultants and directors, are eligible for awards under the 2014 Equity Plan, provided that incentive stock options may be granted only to employees. The Company has six non-employee directors and approximately 550 employees (including employees of our builders) who are eligible to receive awards under the 2014 Equity Plan. Written agreements between the Company and each participant evidence the terms of each award granted under the 2014 Equity Plan.
If any award under the 2014 Equity Plan expires or otherwise terminates, in whole or in part, without having been exercised in full, the common stock withheld from issuance under that award will become available for future issuance under the plan. If shares issued under the 2014 Equity Plan are reacquired by the Company pursuant to the terms of any forfeiture provision, those shares will become available for future awards under the plan. Awards that can only be settled in cash will not be treated as shares of common stock granted for purposes of the 2014 Equity Plan. The maximum amount that can be paid to any single participant in any one calendar year pursuant to a cash bonus award under the 2014 Equity Plan is $2.0 million. As of December 31 , 20221,252,096 shares remain available for future grant of awards under the 2014 Equity Plan.
Share-Based Award Activity
During the years ended December 31 , 2022100 % vested and non-forfeitable on the grant date. Some members of the Board elected to defer up to 100 % of their annual retainer fee in the form of common stock. The RSAs granted to the Board will become fully vested on the earlier of (i) the first anniversary of the date of grant of the shares of restricted common stock or (ii) the date of the Company’s 2023 Annual Meeting of Stockholders. The fair value of the RSAs granted to EOs and non-employee members of the Board were recorded as share-based compensation expense on the grant date and over the vesting period, respectively. During the years ended December 31 , 202246,415 ; 41,318 , and 75,708 ; shares, respectively, of common stock from EOs, at a total cost of $1.1 million, $0.8 million, and $0.6 million, for the respective periods, to satisfy statutory minimum tax requirements upon grant of the RSAs.
2021 and 2022 Employee Stock Awards
On March 1, 2021, the Company’s Board of Directors approved an incentive program for eligible employees to participate in the Company’s new restricted stock award plan. This plan is being offered pursuant to the 2014 Omnibus Equity Plan. The Company incurred $0.3 million and $0.1 million share-based compensation expense related to employee awards issued during the years ended December 31 , 2022
58
| Number of Shares (in thousands) | Weighted Average Grant Date Fair Value per Share | ||||||||||
| Nonvested, December 31, 2019 | $ | ||||||||||
| Granted | $ | ||||||||||
| Vested | ( | $ | |||||||||
| Forfeited | $ | ||||||||||
| Nonvested, December 31, 2020 | $ | ||||||||||
| Granted | $ | ||||||||||
| Vested | ( | $ | |||||||||
| Forfeited | $ | ||||||||||
| Nonvested, December 31, 2021 | $ | ||||||||||
| Granted | $ | ||||||||||
| Vested | ( | $ | |||||||||
| Forfeited | ( | $ | |||||||||
| Nonvested, December 31, 2022 | $ | ||||||||||
Stock Options
Stock options granted to date were not granted under the 2014 Equity Plan. The stock options outstanding as of December 31 , 202210 years after the date on which they were granted. Compensation expense related to these options was expensed on a straight-line basis over the 5 year service period. All of the stock options outstanding as of December 31 , 2022no stock options granted during the years ended December 31 , 2022
| Number of Shares (in thousands) | Weighted Average Exercise Price per Share | Weighted Average Remaining Contractual Term (in years) | Aggregate Intrinsic Value (in thousands) | ||||||||||||||||||||
| Options outstanding, December 31, 2021 | $ | ||||||||||||||||||||||
| Granted | |||||||||||||||||||||||
| Exercised | |||||||||||||||||||||||
| Forfeited | |||||||||||||||||||||||
| Options outstanding, December 31, 2022 | $ | $ | |||||||||||||||||||||
| Options exercisable, December 31, 2022 | $ | $ | |||||||||||||||||||||
Share-Based Compensation Expense
Share-based compensation expense was $3.5 million, $3.1 million and $2.1 million for the years ended December 31, 2022, 2021 and 2020, respectively. Recognized tax benefit related to share-based compensation expense was $0.8 million, $0.6 million and $0.4 million for the years ended December 31 , 2022
As of December 31 , 20220.4 million which is expected to be recognized over a weighted-average period of 0.7 years. The total fair value of RSAs vested during the years ended December 31 , 20223.4 million, $3.0 million and $2.1 million, respectively.
As of December 31 , 2022
59
11. REVENUE RECOGNITION
Disaggregation of Revenue
The following reflects the disaggregation of revenue by primary geographic market, type of customer, product type, and timing of revenue recognition (in thousands):
| Years Ended December 31, | |||||||||||||||||||||||||||||||||||
| 2022 | 2021 | 2020 | |||||||||||||||||||||||||||||||||
| Residential units revenue | Land and lots revenue | Residential units revenue | Land and lots revenue | Residential units revenue | Land and lots revenue | ||||||||||||||||||||||||||||||
| Primary Geographical Market | |||||||||||||||||||||||||||||||||||
| Central | $ | $ | $ | $ | $ | $ | |||||||||||||||||||||||||||||
| Southeast | |||||||||||||||||||||||||||||||||||
| Total revenues | $ | $ | $ | $ | $ | $ | |||||||||||||||||||||||||||||
| Type of Customer | |||||||||||||||||||||||||||||||||||
| Homebuyers | $ | $ | $ | $ | $ | $ | |||||||||||||||||||||||||||||
| Homebuilders and Multi-family Developers | |||||||||||||||||||||||||||||||||||
| Total revenues | $ | $ | $ | $ | $ | $ | |||||||||||||||||||||||||||||
| Product Type | |||||||||||||||||||||||||||||||||||
| Residential units | $ | $ | $ | $ | $ | $ | |||||||||||||||||||||||||||||
| Land and lots | |||||||||||||||||||||||||||||||||||
| Total revenues | $ | $ | $ | $ | $ | $ | |||||||||||||||||||||||||||||
Timing of Revenue Recognition(1) | |||||||||||||||||||||||||||||||||||
| Transferred at a point in time | $ | $ | $ | $ | $ | $ | |||||||||||||||||||||||||||||
| Transferred over time | |||||||||||||||||||||||||||||||||||
| Total revenues | $ | $ | $ | $ | $ | $ | |||||||||||||||||||||||||||||
(1)Revenue recognized over time represents revenue from mechanic’s lien contracts.
Contract Balances
Opening and closing contract balances included in customer and builder deposits on the consolidated balance sheets are as follows (in thousands):
| December 31, 2021 | |||||||||||
| Customer and builder deposits | $ | $ | |||||||||
The difference between the opening and closing balances of customer and builder deposits results from the timing difference between the customer’s payment of a deposit and the Company’s delivery of the home, impacted slightly by terminations of contracts.
60
| 2022 | 2021 | ||||||||||
| Type of Customer | |||||||||||
| Homebuyers | $ | $ | |||||||||
| Homebuilders and Multi-Family Developers | |||||||||||
| Total deposits recognized as revenue | $ | $ | |||||||||
Performance Obligations
There was no revenue recognized during the years ended December 31 , 2022
Transaction Price Allocated to Remaining Performance Obligations
| 2023 | $ | ||||
| 2024 | |||||
| Total | $ | ||||
The timing of lot takedowns is contingent upon a number of factors, including customer needs, the number of lots being purchased, receipt of acceptance of the plat by the municipality, weather-related delays, and agreed-upon lot takedown schedules.
12. SEGMENT INFORMATION
The Company has three reportable segments - Builder operations Central, Builder operations Southeast, and Land development. Builder operations Central represents operations by our builders in Texas, whereas Builder operations Southeast represents operations by our builders in Georgia and Florida. The Land development segment acquires land for the development of residential lots that are transferred to our controlled builders or sold to third party homebuilders. The operations of the Company’s builders and land development were aggregated in three reportable segments based on similar economic characteristics, including geography, housing products, class of homebuyer, regulatory environments, and methods used to construct and sell homes.
Corporate operations are reported as a non-operating segment and include activities which support the Company’s builder operations, land development, title and mortgage operations through the centralization of certain administrative functions, such as finance, treasury, information technology and human resources, as well as development of strategic initiatives. Unallocated corporate expenses are reported in the corporate, other and unallocated segment as these activities do not share a majority of aggregation criteria with either the builder operations or land development segments.
While the operations of Challenger meet the criteria for an operating segment, they do not meet the quantitative thresholds of ASC 280, Segment Reporting (“ASC 280”) to be separately reported and disclosed. As such, Challenger’s results are included within the corporate, other and unallocated segment.
Green Brick Title, LLC (“Green Brick Title”) and BHome Mortgage operations are not economically similar to either builder operations or land development and do not meet the quantitative thresholds of ASC 280 to be separately reported and disclosed. As such, these entities’ results are included within the corporate, other and unallocated segment.
61
Operations of EJB River Holdings and GBTM Sendera do not meet the criteria for an operating segment, and they do not meet the quantitative thresholds of ASC 280 to be separately reported and disclosed. As such, these results are included within the corporate, other and unallocated segment.
Operational results of each reportable segment are not necessarily indicative of the results that would have been achieved had the reportable segment been an independent, stand-alone entity during the periods presented.
Financial information relating to the Company’s reportable segments is as follows (in thousands):
| Years Ended December 31, | |||||||||||||||||
| 2022 | 2021 | 2020 | |||||||||||||||
Revenues: (1) | |||||||||||||||||
| Builder operations | |||||||||||||||||
| Central | $ | $ | $ | ||||||||||||||
| Southeast | |||||||||||||||||
| Total builder operations | |||||||||||||||||
| Land development | |||||||||||||||||
| Total revenues | $ | $ | $ | ||||||||||||||
| Gross profit: | |||||||||||||||||
| Builder operations | |||||||||||||||||
| Central | $ | $ | $ | ||||||||||||||
| Southeast | |||||||||||||||||
| Total builder operations | |||||||||||||||||
| Land development | |||||||||||||||||
Corporate, other and unallocated (2) | ( | ( | ( | ||||||||||||||
| Total gross profit | $ | $ | $ | ||||||||||||||
Interest expense: (3) | |||||||||||||||||
| Builder operations | |||||||||||||||||
| Central | $ | $ | $ | ||||||||||||||
| Southeast | |||||||||||||||||
| Total builder operations | |||||||||||||||||
| Corporate, other and unallocated | ( | ( | ( | ||||||||||||||
| Total interest expense | $ | $ | $ | ||||||||||||||
| Income before income taxes: | |||||||||||||||||
| Builder operations | |||||||||||||||||
| Central | $ | $ | $ | ||||||||||||||
| Southeast | |||||||||||||||||
| Total builder operations | |||||||||||||||||
| Land development | |||||||||||||||||
Corporate, other and unallocated (4) | ( | ( | ( | ||||||||||||||
| Income before income taxes | $ | $ | $ | ||||||||||||||
62
| December 31, 2021 | |||||||||||
| Inventory: | |||||||||||
| Builder operations | |||||||||||
| Central | $ | $ | |||||||||
| Southeast | |||||||||||
| Total builder operations | |||||||||||
| Land development | |||||||||||
Corporate, other and unallocated (5) | |||||||||||
| Total inventory | $ | $ | |||||||||
Goodwill: | |||||||||||
| Builder operations - Southeast | $ | $ | |||||||||
(1)The sum of Builder operations Central and Southeast segments’ revenues does not equal residential units revenue included in the consolidated statements of income in periods when our builders have revenues from land or lot closings, which for the years ended December 31 , 20227.4 million, $28.5 million and $2.6 million, respectively.
(2)Corporate, other and unallocated gross loss is comprised of capitalized overhead and capitalized interest adjustments that are not allocated to builder operations and land development segments.
(3)Interest expense of Builder operations Central and Southeast segments represents an interest expense charged by Corporate, other and unallocated segment in relation to financing purchases of land and construction of some of the Company’s Dallas and Atlanta builders. Intercompany interest revenue of the Corporate, other and unallocated segment is eliminated in consolidation.
(4)Corporate, other and unallocated loss before income taxes includes results from Green Brick Title, Ventana Insurance, and investments in unconsolidated subsidiaries, in addition to capitalized cost adjustments that are not allocated to operating segments.
13. INCOME TAXES
Income Tax Expense
The components of current and deferred income tax expense are as follows (in thousands):
| Years Ended December 31, | |||||||||||||||||
| 2022 | 2021 | 2020 | |||||||||||||||
| Current income tax expense (benefit): | |||||||||||||||||
| Federal | $ | $ | $ | ||||||||||||||
| State | |||||||||||||||||
| Total current income tax expense | |||||||||||||||||
| Deferred income tax expense (benefit): | |||||||||||||||||
| Federal | ( | ( | ( | ||||||||||||||
| State | ( | ||||||||||||||||
| Total deferred income tax expense | ( | ( | ( | ||||||||||||||
| Total income tax expense | $ | $ | $ | ||||||||||||||
63
Effective Income Tax Rate Reconciliation
The income tax expense differs from the amount that would be computed by applying the statutory federal income tax rates of 21% for each of the years ended December 31 , 2022
| Years Ended December 31, | |||||||||||||||||
| 2022 | 2021 | 2020 | |||||||||||||||
| Tax on pre-tax book income (before reduction of noncontrolling interests) | $ | $ | $ | ||||||||||||||
| Tax effect of non-controlled earnings | ( | ( | ( | ||||||||||||||
| State income tax expense, net of federal benefit | |||||||||||||||||
| Tax credits | ( | ( | ( | ||||||||||||||
| Other | |||||||||||||||||
| Total income tax expense | $ | $ | $ | ||||||||||||||
| Effective income tax rate | % | % | % | ||||||||||||||
The change in the effective tax rate for year ended December 31 , 2022December 31 , 2022
Deferred Income Taxes
| December 31, 2022 | December 31, 2021 | ||||||||||
| Deferred tax assets: | |||||||||||
| Basis in partnerships | $ | $ | |||||||||
| Accrued expenses | |||||||||||
| Inventory | |||||||||||
| Change in fair value of contingent consideration | |||||||||||
| Lease liabilities - operating leases | |||||||||||
| Stock-based compensation | |||||||||||
| Other | |||||||||||
| Deferred tax assets, gross | |||||||||||
| Valuation allowance | |||||||||||
| Deferred tax assets, net | $ | $ | |||||||||
| Deferred tax liabilities: | |||||||||||
| Right-of-use assets - operating leases | $ | ( | $ | ( | |||||||
| Prepaid insurance | ( | ( | |||||||||
| Other | ( | ( | |||||||||
| Deferred tax liabilities | $ | ( | $ | ( | |||||||
| Total deferred income tax assets, net | $ | 16,448 | $ | 15,741 | |||||||
Uncertain Tax Positions
The Company establishes accruals for uncertain tax positions that reflect management’s best estimate of deductions and credits that may not be sustained on a more-likely-than-not basis. In accordance with ASC 740, Income Taxes, the Company recognizes the effect of income tax positions only if those positions have a more-likely-than-not chance of being sustained by the Company. Recognized income tax positions are measured at the largest amount that is considered greater than 50% likely of being realized. Changes in recognition or measurement are reflected in the period in which the change in judgment occurs. There were no uncertain tax positions as of December 31 , 2022
64
There were no expenses for interest and penalties related to uncertain tax positions for the years ended December 31 , 2022December 31 , 2022
Statutes of Limitations
The U.S. federal statute of limitations remains open for our 2019 and subsequent tax years.
The Company and its subsidiaries file returns in Texas, Georgia, Florida and Colorado.
The Texas statute of limitations remains open for the 2018 and subsequent tax years. Any adjustments relating to returns filed by the subsidiary partnerships would be borne by the subsidiary partnership entities.
The Georgia and Florida statute of limitations remains open for 2019 and subsequent tax years. Any adjustments relating to returns filed by the subsidiary partnerships would be borne by the partner.
The Company is not presently under examination by the Internal Revenue Service or state tax authority.
14. EMPLOYEE BENEFITS
15. EARNINGS PER COMMON SHARE
| Years Ended December 31, | |||||||||||||||||
| 2022 | 2021 | 2020 | |||||||||||||||
| Net income attributable to Green Brick Partners, Inc. | $ | $ | $ | ||||||||||||||
| Cumulative preferred stock dividends | ( | ( | |||||||||||||||
| Net income applicable to common stockholders | |||||||||||||||||
| Weighted-average number of common shares outstanding - basic | |||||||||||||||||
| Basic net income attributable to Green Brick Partners, Inc. per common share | $ | $ | $ | ||||||||||||||
| Weighted-average number of common shares outstanding - basic | |||||||||||||||||
| Dilutive effect of stock options and restricted stock awards | |||||||||||||||||
| Weighted-average number of common shares outstanding - diluted | |||||||||||||||||
| Diluted net income attributable to Green Brick Partners, Inc. per common share | $ | $ | $ | ||||||||||||||
| Years Ended December 31, | |||||||||||||||||
| 2022 | 2021 | 2020 | |||||||||||||||
| Antidilutive options to purchase common stock and restricted stock awards | ( | ||||||||||||||||
65
16. FAIR VALUE MEASUREMENTS
Fair Value of Financial Instruments
The Company’s financial instruments, none of which are held for trading purposes, include cash, restricted cash, receivables, earnest money deposits, other assets, accounts payable, accrued expenses, customer and builder deposits, borrowings on lines of credit, senior unsecured notes, and notes payable.
Per the fair value hierarchy, level 1 financial instruments include: cash, restricted cash, receivables, earnest money deposits, other assets, accounts payable, accrued expenses, and customer and builder deposits due to their short-term nature. The Company estimates that, due to the short-term nature of the underlying financial instruments or the proximity of the underlying transaction to the applicable reporting date, the fair value of level 1 financial instruments does not differ materially from the aggregate carrying values recorded in the consolidated financial statements as of December 31 , 2022
Level 2 financial instruments include borrowings on lines of credit, senior unsecured notes, and notes payable. Due to the short-term nature and floating interest rate terms, the carrying amounts of borrowings on lines of credit are deemed to approximate fair value. The estimated fair value of the senior unsecured notes as of December 31 , 2022306.1 million and $352.3 million, respectively.
Certain assets are required to be recorded at fair value on a non-recurring basis when events and circumstances indicate that the carrying value may not be recoverable. The Company recorded inventory impairments, which are included in the in cost of residential units in our consolidated statements of income and deducted from inventory of $6.0 million for the year ended December 31 , 2022
There were no transfers between the levels of the fair value hierarchy for any of our financial instruments as of December 31 , 2022
17. RELATED PARTY TRANSACTIONS
During 2022, 2021 and 2020, the Company had the following related party transactions through the normal course of business.
Corporate Officers
Trevor Brickman, the son of Green Brick’s Chief Executive Officer, is the President of Centre Living. Green Brick’s ownership interest in Centre Living is 90 % and Trevor Brickman’s ownership interest is 10 %. Green Brick has 90 % voting control over the operations of Centre Living. As such, 100% of Centre Living’s operations are included within our consolidated financial statements. During the years ended December 31, 2022 and 2021, Trevor Brickman made no cash contributions to Centre Living. Trevor Brickman made a $0.4 million cash contribution during the year ended December 31, 2020.
GRBK GHO
GRBK GHO leases office space from entities affiliated with the president of GRBK GHO. During the years ended December 31, 2022, 2021, and 2020, GRBK GHO incurred lease costs of $0.2 million, $0.2 million, and $0.1 million in each period, under such lease agreements. As of December 31, 2022, there were no amounts due to the affiliated entities related to such lease agreements.
GRBK GHO receives title closing services on the purchase of land and third-party lots from an entity affiliated with the president of GRBK GHO. During the years ended December 31, 2022, 2021, and 2020, GRBK GHO incurred de minimis fees related to such title closing services. As of December 31, 2022, no amounts were due to the title company affiliate.
18. COMMITMENTS AND CONTINGENCIES
Letters of Credit and Performance Bonds
During the ordinary course of business, certain regulatory agencies and municipalities require the Company to post letters of credit or performance bonds related to development projects. As of December 31 , 20225.0 million and $1.7 million respectively. The Company does not believe that it is likely that any material claims will be made under a letter of credit or performance bond in the foreseeable future.
66
Operating Leases
We have leases associated with office and design center space in Georgia, Texas, and Florida that, at the commencement date, each have a lease term of more than 12 months and are classified as operating leases. The exercise of any extension options available in such operating lease contracts is not reasonably certain.
The operating lease cost of $1.6 million, $1.4 million, and $1.3 million for these leases for the years ended December 31 , 2022December 31 , 20221.6 million and $1.3 million, respectively.
As of December 31 , 20224.3 years and 4.04 %, respectively.
The future annual undiscounted cash flows in relation to the operating leases and a reconciliation of such undiscounted cash flows to the operating lease liabilities recognized in the consolidated balance sheet as of December 31 , 2022
| 2023 | $ | ||||
| 2024 | |||||
| 2025 | |||||
| 2026 | |||||
| 2027 | |||||
| Thereafter | |||||
| Total future lease payments | |||||
| Less: Interest | |||||
| Present value of lease liabilities | $ | ||||
The Company elected the short-term lease recognition exemption for all leases that, at the commencement date, have a lease term of 12 months or less and do not include an option to purchase the underlying asset that the Company is reasonably certain to exercise. For such leases, the Company does not recognize right-of-use assets or lease liabilities and instead recognizes lease payments in the consolidated income statements on a straight-line basis. Short-term lease costs of $1.3 million, $0.7 million, and $0.4 million for each of the years ended December 31 , 2022
New Headquarters Lease
In October 2022, we entered into a lease agreement for a new corporate headquarters facility in Plano, Teas. The lease term is 94 months beginning on the lease commencement date. The lease commencement is expected to be in April 2023 when the office space is available for our use. The future lease payments related to this agreement are summarized below (in thousands):
| 2023 | $ | — | |||
| 2024 | 753 | ||||
| 2025 | 843 | ||||
| 2026 | 867 | ||||
| 2027 | 891 | ||||
| Thereafter | 2,894 | ||||
| Total future lease payments | $ | 6,248 | |||
Legal Matters
Lawsuits, claims and proceedings may be instituted or asserted against us in the normal course of business. The Company is also subject to local, state and federal laws and regulations related to land development activities, house construction standards, sales practices, title company regulations, employment practices and environmental protection. As a result, the Company may be subject to periodic examinations or inquiry by agencies administering these laws and regulations.
67
The Company records an accrual for legal claims and regulatory matters when they are probable of occurring and a potential loss is reasonably estimable. The Company accrues for these matters based on facts and circumstances specific to each matter and revises these estimates when necessary.
In view of the inherent difficulty of predicting outcomes of legal claims and related contingencies, the Company generally cannot predict their ultimate resolution, related timing or eventual loss. If evaluations indicate loss contingencies that could be material are not probable, but are reasonably possible, the Company will disclose their nature with an estimate of the possible range of losses or a statement that such loss is not reasonably estimable. We believe that the disposition of legal claims and related contingencies will not have a material adverse effect on our results of operations and cash flows or on our financial condition.
68
19. SUBSEQUENT EVENTS
None.
ITEM 9. CHANGES IN AND DISAGREEMENTS WITH ACCOUNTANTS ON ACCOUNTING AND FINANCIAL DISCLOSURE
None.
ITEM 9A. CONTROLS AND PROCEDURES
Evaluation of Disclosure Controls and Procedures
We have established disclosure controls and procedures that are designed to ensure that information required to be disclosed in reports filed or submitted under the Exchange Act, as amended, is recorded, processed, summarized and reported within the time periods specified in the rules and forms of the SEC and, as such, is accumulated and communicated to Green Brick’s management, including our Chief Executive Officer (“CEO”) and Chief Financial Officer (“CFO”), as appropriate to allow timely decisions regarding required disclosure. Management, together with our CEO and CFO, evaluated the effectiveness of our disclosure controls and procedures, as defined in Rule 13a-15(e) of the Exchange Act, as of December 31, 2022. Based on our evaluation, the CEO and CFO concluded that our disclosure controls and procedures were effective as of December 31, 2022.
Management’s Report on Internal Control over Financial Reporting
Green Brick’s management is responsible for establishing and maintaining adequate internal control over financial reporting, as such term is defined in Exchange Act Rule 13a-15(f). Internal control over financial reporting is a process designed to provide reasonable assurance regarding the reliability of financial reporting and the preparation of financial statements for external purposes in accordance with GAAP. Because of its inherent limitations, internal control over financial reporting may not prevent or detect misstatements. Also, projections of any evaluation of effectiveness to future periods are subject to the risk that controls may become inadequate because of changes in conditions, or that the degree of compliance with the policies or procedures may deteriorate.
Under the supervision and with the participation of our management, including the CEO and CFO, we conducted an evaluation of the effectiveness of our internal control over financial reporting as of December 31, 2022 based upon Internal Control-Integrated Framework (2013) issued by the Committee of Sponsoring Organizations of the Treadway Commission. Based on this evaluation, our management concluded that our internal control over financial reporting was effective as of December 31, 2022.
RSM US LLP, our independent registered public accounting firm, has audited our consolidated financial statements included in this report and has issued an attestation report on our internal control over financial reporting, which is included herein.
Changes in Internal Control over Financial Reporting
During the quarter ended December 31, 2022, there were no changes in our internal controls that have materially affected or are reasonably likely to have a material effect on our internal control over financial reporting.
69
Report of Independent Registered Public Accounting Firm
Stockholders and the Board of Directors
Green Brick Partners, Inc.
Opinion on the Internal Control Over Financial Reporting
We have audited Green Brick Partners, Inc. and subsidiaries' (the Company) internal control over financial reporting as of December 31, 2022, based on criteria established in Internal Control - Integrated Framework issued by the Committee of Sponsoring Organizations of the Treadway Commission in 2013. In our opinion, the Company maintained, in all material respects, effective internal control over financial reporting as of December 31, 2022, based on criteria established in Internal Control - Integrated Framework issued by the Committee of Sponsoring Organizations of the Treadway Commission in 2013.
We have also audited, in accordance with the standards of the Public Company Accounting Oversight Board (United States) (PCAOB), the consolidated financial statements of the Company and our report dated February 27, 2023 expressed an unqualified opinion.
Basis for Opinion
The Company’s management is responsible for maintaining effective internal control over financial reporting and for its assessment of the effectiveness of internal control over financial reporting in the accompanying Management’s Report on Internal Control over Financial Reporting. Our responsibility is to express an opinion on the Company’s internal control over financial reporting based on our audit. We are a public accounting firm registered with the PCAOB and are required to be independent with respect to the Company in accordance with U.S. federal securities laws and the applicable rules and regulations of the Securities and Exchange Commission and the PCAOB.
We conducted our audit in accordance with the standards of the PCAOB. Those standards require that we plan and perform the audit to obtain reasonable assurance about whether effective internal control over financial reporting was maintained in all material respects. Our audit included obtaining an understanding of internal control over financial reporting, assessing the risk that a material weakness exists, and testing and evaluating the design and operating effectiveness of internal control based on the assessed risk. Our audit also included performing such other procedures as we considered necessary in the circumstances. We believe that our audit provides a reasonable basis for our opinion.
Definition and Limitations of Internal Control Over Financial Reporting
A company’s internal control over financial reporting is a process designed to provide reasonable assurance regarding the reliability of financial reporting and the preparation of financial statements for external purposes in accordance with generally accepted accounting principles. A company’s internal control over financial reporting includes those policies and procedures that (1) pertain to the maintenance of records that, in reasonable detail, accurately and fairly reflect the transactions and dispositions of the assets of the company; (2) provide reasonable assurance that transactions are recorded as necessary to permit preparation of financial statements in accordance with generally accepted accounting principles, and that receipts and expenditures of the company are being made only in accordance with authorizations of management and directors of the company; and (3) provide reasonable assurance regarding prevention or timely detection of unauthorized acquisition, use or disposition of the company's assets that could have a material effect on the financial statements.
Because of its inherent limitations, internal control over financial reporting may not prevent or detect misstatements. Also, projections of any evaluation of effectiveness to future periods are subject to the risk that controls may become inadequate because of changes in conditions, or that the degree of compliance with the policies or procedures may deteriorate.
/s/ RSM US LLP
PCAOB ID: 49
Dallas, Texas
February 27, 2023
70
ITEM 9B. OTHER INFORMATION
Not applicable.
ITEM 9C. DISCLOSURE REGARDING FOREIGN JURISDICTIONS THAT PREVENT INSPECTIONS
Not applicable.
PART III
ITEM 10. DIRECTORS, EXECUTIVE OFFICERS AND CORPORATE GOVERNANCE
Information required by Part III, Item 10, is incorporated herein by reference to the proxy statement for our 2023 annual meeting of stockholders (“Proxy Statement”) to be filed with the SEC no later than 120 days after the end of our fiscal year.
ITEM 11. EXECUTIVE COMPENSATION
Information required by Part III, Item 11, is incorporated herein by reference to our Proxy Statement to be filed with the SEC no later than 120 days after the end of our fiscal year.
ITEM 12. SECURITY OWNERSHIP OF CERTAIN BENEFICIAL OWNERS AND MANAGEMENT AND RELATED STOCKHOLDER MATTERS
Information required by Part III, Item 12, is incorporated herein by reference to our Proxy Statement to be filed with the SEC no later than 120 days after the end of our fiscal year.
The following table summarizes information with respect to the Registrant’s compensation plans under which the Registrant’s equity securities are authorized for issuance as of December 31, 2022:
Equity Compensation Plan Information | ||||||||||||||||||||||||||
| As of December 31, 2022 | ||||||||||||||||||||||||||
(in thousands, except exercise price) | ||||||||||||||||||||||||||
| Number of Securities | ||||||||||||||||||||||||||
| Number of Securities | Weighted Average | Remaining Available for | ||||||||||||||||||||||||
| to be Issued | Exercise Price | Future Issuance Under | ||||||||||||||||||||||||
| Upon Exercise of | of Outstanding | Equity Compensation Plans | ||||||||||||||||||||||||
| Outstanding Options, | Options, Warrants | (Excluding Securities | ||||||||||||||||||||||||
| Warrants and Rights | and Rights | Reflected in first column (a)) | ||||||||||||||||||||||||
| (a) | (b) | (c) | ||||||||||||||||||||||||
Equity compensation plans approved by security holders | ||||||||||||||||||||||||||
2014 Omnibus Equity Incentive Plan | 538,479 | $ | 7.49 | (1) | 713,617 | |||||||||||||||||||||
Equity compensation plans not approved by security holders | — | — | ||||||||||||||||||||||||
Total | 538,479 | 713,617 | ||||||||||||||||||||||||
(1)Does not include 38,479 restricted stock awards as they do not have an exercise price.
ITEM 13. CERTAIN RELATIONSHIPS AND RELATED TRANSACTIONS, AND DIRECTOR INDEPENDENCE
Information required by Part III, Item 13, is incorporated herein by reference to our Proxy Statement to be filed with the SEC no later than 120 days after the end of our fiscal year.
ITEM 14. PRINCIPAL ACCOUNTANT FEES AND SERVICES
Information required by Part III, Item 14, is incorporated herein by reference to our Proxy Statement to be filed with the SEC no later than 120 days after the end of our fiscal year.
71
PART IV
ITEM 15. EXHIBITS AND FINANCIAL STATEMENT SCHEDULES
The following documents are filed as part of this Annual Report on Form 10-K:
(1) Financial Statements
See Part II, Item 8 of this Annual Report on Form 10-K.
(2) Financial Statement Schedules
Financial statements schedules are omitted because they are not required or applicable or the required information is included in the consolidated financial statements or notes thereto.
(3) Exhibits
The following exhibits are filed with this Annual Report on Form 10-K or are incorporated herein by reference:
| Number | Exhibit Description | |||||||
| 3.1 | ||||||||
| 3.2 | ||||||||
| 3.3 | ||||||||
| 4.1 | ||||||||
| 4.2 | ||||||||
| 4.3 | ||||||||
| 4.4 | Form of Depositary Receipt (attached to the Depositary Agreement in Exhibit 4.3) | |||||||
| 10.1 | ||||||||
| 10.2 | ||||||||
| 10.3 | ||||||||
| 10.4† | ||||||||
| 10.5† | ||||||||
| 10.6† | ||||||||
| 10.7† | ||||||||
| 10.8† | ||||||||
| 10.9†* | ||||||||
72
| Number | Exhibit Description | |||||||
| 10.10 | Tenth Amendment to the Credit Agreement (with Conformed Credit Agreement including the Second through the Ninth Amendment exhibit attached), dated as of December 9, 2022, by and among Green Brick Partners, Inc., the lenders named therein, and Flagstar Bank, N.A., as administrative agent (incorporated by reference to Exhibit 10.43 to the Company’s Current Report on Form 8-K filed December 14, 2022). | |||||||
| 10.36† | ||||||||
| 10.37† | ||||||||
| 10.38† | ||||||||
| 10.39 | ||||||||
| 10.40 | ||||||||
| 10.41 | ||||||||
| 10.42 | ||||||||
| 10.44 | ||||||||
| 10.45 | ||||||||
| 10.46 | ||||||||
| 10.49 | ||||||||
| 10.50 | ||||||||
| 21* | ||||||||
| 23.1* | ||||||||
| 31.1* | ||||||||
| 31.2* | ||||||||
| 32.1* | ||||||||
| 32.2* | ||||||||
| 101.INS** | XBRL Instance Document. | |||||||
| 101.SCH** | XBRL Taxonomy Extension Schema Document. | |||||||
| 101.CAL** | XBRL Taxonomy Extension Calculation Linkbase Document. | |||||||
| 101.DEF** | XBRL Taxonomy Extension Definition Linkbase Document. | |||||||
73
| Number | Exhibit Description | |||||||
| 101.LAB** | XBRL Taxonomy Extension Label Linkbase Document. | |||||||
| 101.PRE** | XBRL Taxonomy Extension Presentation Linkbase Document. | |||||||
| 104** | Cover Page Interactive Data File (embedded within the Inline XBRL document contained in Exhibit 101). | |||||||
* Filed with this Annual Report on Form 10-K.
** Submitted electronically herewith.
† Management Contract or Compensatory Plan.
# The Company hereby undertakes to furnish a copy of any omitted schedule or exhibit to such agreement to the SEC upon request.
ITEM 16. FORM 10-K SUMMARY
None.
74
SIGNATURES
Pursuant to the requirements of Section 13 or 15(d) of the Securities Exchange Act of 1934, the registrant has duly caused this report to be signed on its behalf by the undersigned, thereunto duly authorized on February 27, 2023.
| Green Brick Partners, Inc. | |||||
| /s/ James R. Brickman | |||||
| By: | James R. Brickman | ||||
| Its: | Chief Executive Officer | ||||
Pursuant to the requirements of the Securities Exchange Act of 1934, this report has been signed below by the following persons on behalf of the registrant and in the capacities and on the dates indicated below.
| Signature | Title | Date | ||||||||||||
| /s/ James R. Brickman | Chief Executive Officer and Director (Principal Executive Officer) | February 27, 2023 | ||||||||||||
| James R. Brickman | ||||||||||||||
| /s/ Richard A. Costello | Chief Financial Officer (Principal Financial Officer and Principal Accounting Officer) | February 27, 2023 | ||||||||||||
| Richard A. Costello | ||||||||||||||
/s/ Elizabeth K. Blake | Director | February 27, 2023 | ||||||||||||
Elizabeth K. Blake | ||||||||||||||
/s/ Harry Brandler | Director | February 27, 2023 | ||||||||||||
| Harry Brandler | ||||||||||||||
| /s/ David Einhorn | Chairman of the Board | February 27, 2023 | ||||||||||||
| David Einhorn | ||||||||||||||
/s/ Lila Manassa Murphy | Director | February 27, 2023 | ||||||||||||
Lila Manassa Murphy | ||||||||||||||
/s/ Kathleen Olsen | Director | February 27, 2023 | ||||||||||||
Kathleen Olsen | ||||||||||||||
/s/ Richard S. Press | Director | February 27, 2023 | ||||||||||||
Richard S. Press | ||||||||||||||
75