Table of Contents
Filed Pursuant to Rule 424(b)(3)
Registration Nos.
333-228404
333-228404-01
333-228404-02
333-228404-03
333-228404-04
333-228404-05
INVESCO DB MULTI-SECTOR COMMODITY TRUST
| Invesco DB Energy Fund | 22,000,000 | Common Units of Beneficial Interest | ||||
| Invesco DB Oil Fund | 81,400,000 | Common Units of Beneficial Interest | ||||
| Invesco DB Precious Metals Fund | 22,400,000 | Common Units of Beneficial Interest | ||||
| Invesco DB Gold Fund | 15,400,000 | Common Units of Beneficial Interest | ||||
| Invesco DB Base Metals Fund | 26,200,000 | Common Units of Beneficial Interest |
INVESTING IN THE SHARES INVOLVES SIGNIFICANT RISKS.
PLEASE REFER TO “RISK FACTORS” BEGINNING ON PAGE 15.
| • Futures trading is volatile and even a small movement in market prices could cause large losses.
• The success of each Fund’s trading program depends upon the skill of the Managing Owner and its trading principals.
• You could lose all or substantially all of your investment.
• Each of the Indexes is concentrated in a small number of commodities and some are highly concentrated in a single commodity. Concentration may result in greater volatility. |
• Investors in each Fund pay fees in connection with their investment in the Shares, including asset-based fees of 0.75% per annum. Additional charges include brokerage fees of approximately 0.03% with respect to Invesco DB Energy Fund, Invesco DB Oil Fund, Invesco DB Precious Metals Fund and Invesco DB Gold Fund and 0.05% with respect to Invesco DB Base Metals Fund per annum in the aggregate. |
Authorized Participants may offer to the public, from time to time, Shares from any Baskets they create. Shares offered to the public by Authorized Participants will be offered at a per-Share offering price that will vary depending on, among other factors, the trading price of the Shares of each Fund on the NYSE Arca, the NAV per Share and the supply of and demand for the Shares at the time of sale. Because the
-i-
Table of Contents
Shares will trade at market prices, rather than the NAV of each Fund, Shares may trade at prices greater than NAV (at a premium), at NAV, or less than NAV (at a discount). Authorized Participants will not receive from any Fund, the Managing Owner or any of their affiliates, any fee or other compensation in connection with their sale of Shares to the public.
An Authorized Participant may receive commissions or fees from investors who purchase Shares through their commission or fee-based brokerage accounts. In addition, the Managing Owner pays a distribution services fee to Invesco Distributors, Inc. and pays a marketing services fee to Deutsche Investment Management Americas Inc. (“DIMA”) without reimbursement from the Trust or any Fund. For more information regarding items of compensation paid to Financial Industry Regulatory Authority, Inc. (“FINRA”) members, please see the “Plan of Distribution” section on page 128.
These securities have not been approved or disapproved by the U.S. Securities and Exchange Commission (“SEC”) or any state securities commission nor has the SEC or any state securities commission passed upon the accuracy or adequacy of this Prospectus. Any representation to the contrary is a criminal offense. None of the Funds is a mutual fund or any other type of investment company within the meaning of the Investment Company Act of 1940, as amended, and is not subject to regulation thereunder.
THE COMMODITY FUTURES TRADING COMMISSION HAS NOT PASSED UPON THE MERITS OF PARTICIPATING IN THESE POOLS NOR HAS THE COMMISSION PASSED ON THE ADEQUACY OR ACCURACY OF THIS DISCLOSURE DOCUMENT.
December 13, 2018
-ii-
Table of Contents
COMMODITY FUTURES TRADING COMMISSION
RISK DISCLOSURE STATEMENT
YOU SHOULD CAREFULLY CONSIDER WHETHER YOUR FINANCIAL CONDITION PERMITS YOU TO PARTICIPATE IN A COMMODITY POOL. IN SO DOING, YOU SHOULD BE AWARE THAT COMMODITY INTEREST TRADING CAN QUICKLY LEAD TO LARGE LOSSES AS WELL AS GAINS. SUCH TRADING LOSSES CAN SHARPLY REDUCE THE NET ASSET VALUE OF THE POOL AND CONSEQUENTLY THE VALUE OF YOUR INTEREST IN THE POOL. IN ADDITION, RESTRICTIONS ON REDEMPTIONS MAY AFFECT YOUR ABILITY TO WITHDRAW YOUR PARTICIPATION IN THE POOL.
FURTHER, COMMODITY POOLS MAY BE SUBJECT TO SUBSTANTIAL CHARGES FOR MANAGEMENT, AND ADVISORY AND BROKERAGE FEES. IT MAY BE NECESSARY FOR THOSE POOLS THAT ARE SUBJECT TO THESE CHARGES TO MAKE SUBSTANTIAL TRADING PROFITS TO AVOID DEPLETION OR EXHAUSTION OF THEIR ASSETS. THIS DISCLOSURE DOCUMENT CONTAINS A COMPLETE DESCRIPTION OF EACH EXPENSE TO BE CHARGED THESE POOLS AT PAGE 81 AND A STATEMENT OF THE PERCENTAGE RETURNS NECESSARY TO BREAK EVEN, THAT IS, TO RECOVER THE AMOUNT OF YOUR INITIAL INVESTMENT, AT PAGE 31.
THIS BRIEF STATEMENT CANNOT DISCLOSE ALL THE RISKS AND OTHER FACTORS NECESSARY TO EVALUATE YOUR PARTICIPATION IN ANY OF THESE COMMODITY POOLS. THEREFORE, BEFORE YOU DECIDE TO PARTICIPATE IN ANY OF THESE COMMODITY POOLS, YOU SHOULD CAREFULLY STUDY THIS DISCLOSURE DOCUMENT, INCLUDING A DESCRIPTION OF THE PRINCIPAL RISK FACTORS OF THIS INVESTMENT, AT PAGES 15 THROUGH 29.
YOU SHOULD ALSO BE AWARE THAT THIS COMMODITY POOL MAY TRADE FOREIGN FUTURES OR OPTIONS CONTRACTS. TRANSACTIONS ON MARKETS LOCATED OUTSIDE THE UNITED STATES, INCLUDING MARKETS FORMALLY LINKED TO A UNITED STATES MARKET, MAY BE SUBJECT TO REGULATIONS WHICH OFFER DIFFERENT OR DIMINISHED PROTECTION TO THE POOL AND ITS PARTICIPANTS. FURTHER, UNITED STATES REGULATORY AUTHORITIES MAY BE UNABLE TO COMPEL THE ENFORCEMENT OF THE RULES OF REGULATORY AUTHORITIES OR MARKETS IN NON-UNITED STATES JURISDICTIONS WHERE TRANSACTIONS FOR THE POOL MAY BE EFFECTED.
THIS PROSPECTUS DOES NOT INCLUDE ALL OF THE INFORMATION OR EXHIBITS IN THE REGISTRATION STATEMENT OF THE TRUST OR FUNDS. YOU CAN READ AND COPY THE ENTIRE REGISTRATION STATEMENT AT THE PUBLIC REFERENCE FACILITIES MAINTAINED BY THE SEC IN WASHINGTON, D.C.
THE FUNDS FILE QUARTERLY AND ANNUAL REPORTS WITH THE SEC. YOU CAN READ AND COPY THESE REPORTS AT THE SEC PUBLIC REFERENCE FACILITIES IN WASHINGTON, D.C. PLEASE CALL THE SEC AT 1-800-SEC-0330 FOR FURTHER INFORMATION.
THE FILINGS OF THE TRUST AND FUNDS ARE POSTED AT THE SEC WEBSITE AT HTTP://WWW.SEC.GOV.
REGULATORY NOTICES
NO DEALER, SALESMAN OR ANY OTHER PERSON HAS BEEN AUTHORIZED TO GIVE ANY INFORMATION OR TO MAKE ANY REPRESENTATION NOT CONTAINED IN THIS PROSPECTUS, AND, IF GIVEN OR MADE, SUCH OTHER INFORMATION OR REPRESENTATION
-iii-
Table of Contents
MUST NOT BE RELIED UPON AS HAVING BEEN AUTHORIZED BY THE TRUST, ANY FUND, THE MANAGING OWNER, THE AUTHORIZED PARTICIPANTS OR ANY OTHER PERSON.
THIS PROSPECTUS DOES NOT CONSTITUTE AN OFFER OR SOLICITATION TO SELL OR A SOLICITATION OF AN OFFER TO BUY, NOR SHALL THERE BE ANY OFFER, SOLICITATION, OR SALE OF THE SHARES IN ANY JURISDICTION IN WHICH SUCH OFFER, SOLICITATION, OR SALE IS NOT AUTHORIZED OR TO ANY PERSON TO WHOM IT IS UNLAWFUL TO MAKE ANY SUCH OFFER, SOLICITATION, OR SALE.
THE BOOKS AND RECORDS OF EACH FUND ARE MAINTAINED AS FOLLOWS: ALL MARKETING MATERIALS ARE MAINTAINED AT THE OFFICES OF INVESCO DISTRIBUTORS, INC., 11 GREENWAY PLAZA, SUITE 1000, HOUSTON, TEXAS 77046-1173; TELEPHONE NUMBER (800) 983-0903; BASKET CREATION AND REDEMPTION BOOKS AND RECORDS, ACCOUNTING AND CERTAIN OTHER FINANCIAL BOOKS AND RECORDS (INCLUDING FUND ACCOUNTING RECORDS, LEDGERS WITH RESPECT TO ASSETS, LIABILITIES, CAPITAL, INCOME AND EXPENSES, THE REGISTRAR, TRANSFER JOURNALS AND RELATED DETAILS) AND TRADING AND RELATED DOCUMENTS RECEIVED FROM FUTURES COMMISSION MERCHANTS ARE MAINTAINED BY THE BANK OF NEW YORK MELLON, 2 HANSON PLACE, BROOKLYN, NEW YORK 11217, TELEPHONE NUMBER (718) 315-7500. ALL OTHER BOOKS AND RECORDS OF EACH FUND (INCLUDING MINUTE BOOKS AND OTHER GENERAL CORPORATE RECORDS, TRADING RECORDS AND RELATED REPORTS AND OTHER ITEMS RECEIVED FROM EACH FUND’S COMMODITY BROKERS) ARE MAINTAINED AT THE FUNDS’ PRINCIPAL OFFICE, C/O INVESCO CAPITAL MANAGEMENT LLC, 3500 LACEY ROAD, SUITE 700, DOWNERS GROVE, ILLINOIS 60515; TELEPHONE NUMBER (800) 983-0903. SHAREHOLDERS WILL HAVE THE RIGHT, DURING NORMAL BUSINESS HOURS, TO HAVE ACCESS TO AND COPY (UPON PAYMENT OF REASONABLE REPRODUCTION COSTS) SUCH BOOKS AND RECORDS IN PERSON OR BY THEIR AUTHORIZED ATTORNEY OR AGENT. MONTHLY ACCOUNT STATEMENTS FOR EACH FUND CONFORMING TO COMMODITY FUTURES TRADING COMMISSION (“CFTC”) AND THE NATIONAL FUTURES ASSOCIATION (“NFA”) REQUIREMENTS ARE POSTED ON THE MANAGING OWNER’S WEBSITE AT WWW.INVESCO.COM/ETFs. ADDITIONAL REPORTS MAY BE POSTED ON THE MANAGING OWNER’S WEBSITE IN THE DISCRETION OF THE MANAGING OWNER OR AS REQUIRED BY REGULATORY AUTHORITIES. INFORMATION ON THE MANAGING OWNER’S WEBSITE SHALL NOT BE DEEMED TO BE A PART OF THIS PROSPECTUS OR INCORPORATED BY REFERENCE HEREIN UNLESS OTHERWISE EXPRESSLY STATED. THERE WILL SIMILARLY BE DISTRIBUTED TO SHAREHOLDERS, NOT MORE THAN 90 DAYS AFTER THE CLOSE OF EACH FUND’S FISCAL YEAR, CERTIFIED AUDITED FINANCIAL STATEMENTS AND (IN NO EVENT LATER THAN MARCH 15 OF THE IMMEDIATELY FOLLOWING YEAR) THE TAX INFORMATION RELATING TO SHARES OF EACH FUND NECESSARY FOR THE PREPARATION OF SHAREHOLDERS’ ANNUAL FEDERAL INCOME TAX RETURNS.
THE DIVISION OF INVESTMENT MANAGEMENT OF THE SECURITIES AND EXCHANGE COMMISSION REQUIRES THAT THE FOLLOWING STATEMENT BE PROMINENTLY SET FORTH HEREIN: “NEITHER INVESCO DB MULTI-SECTOR COMMODITY TRUST NOR ANY SERIES THEREOF IS A MUTUAL FUND OR ANY OTHER TYPE OF INVESTMENT COMPANY WITHIN THE MEANING OF THE INVESTMENT COMPANY ACT OF 1940, AS AMENDED, AND IS NOT SUBJECT TO REGULATION THEREUNDER.”
AUTHORIZED PARTICIPANTS MAY BE REQUIRED TO DELIVER A PROSPECTUS WHEN TRANSACTING IN SHARES. SEE “PLAN OF DISTRIBUTION.”
-iv-
Table of Contents
-v-
Table of Contents
-1-
Table of Contents
-2-
Table of Contents
-3-
Table of Contents
-4-
Table of Contents
-5-
Table of Contents
-6-
Table of Contents
-7-
Table of Contents
-8-
Table of Contents
-9-
Table of Contents
-10-
Table of Contents
-11-
Table of Contents
Fees and Expenses
|
Management Fee |
Each Fund pays the Managing Owner a Management Fee, monthly in arrears, in an amount equal to 0.75% per annum of its daily NAV. The Management Fee is paid in consideration of the Managing Owner’s services related to the management of each Fund’s business and affairs, including the provision of commodity futures trading advisory services.
Each Fund may, for margin and/or cash management purposes, invest in money market mutual funds and/or T-Bill ETFs that are managed by affiliates of the Managing Owner. The indirect portion of the management fees that such Fund may incur through such investments is in addition to the Management Fee paid to the Managing Owner. The Managing Owner has contractually agreed to waive indefinitely the fees that it receives in an amount equal to the indirect management fees that each Fund incurs through its investments in affiliated money market mutual funds and/or affiliated T-Bill ETFs. The Managing Owner may terminate each waiver on 60 days’ notice. | |
| Offering Expenses | Expenses incurred in connection with the continuous offering of Shares are paid by the Managing Owner. | |
| Brokerage Commissions and Fees | Each Fund pays to the Commodity Broker all brokerage commissions, including applicable exchange fees, NFA fees, give-up fees, pit brokerage fees and other transaction related fees and expenses charged in connection with its trading activities. On average, total charges paid to the Commodity Broker are expected to be less than $6.00 per round-turn trade (except with respect to the Invesco DB Base Metals Fund, which is expected to be less than $13.00 per round-turn trade), although the Commodity Broker’s brokerage commissions and trading fees are determined on a contract-by-contract basis. The Managing Owner estimates the brokerage commissions and fees will be approximately (i) 0.03% of the NAV of each Fund with respect to Invesco DB Energy Fund, Invesco DB Oil Fund, Invesco DB Precious Metals Fund and Invesco DB Gold Fund and (ii) 0.05% of the NAV with respect to Invesco DB Base Metals Fund in any year, although the actual amount of brokerage commissions and fees in any year or any part of any year may be greater. | |
| Routine Operational, Administrative and Other Ordinary Expenses | The Managing Owner pays all of the routine operational, administrative and other ordinary expenses of each Fund, including, but not limited to, computer services, the fees and expenses of the Trustee, license and service fees paid to DIMA, as Marketing Agent and Index Sponsor, legal and accounting fees and expenses, tax preparation expenses, filing fees, and printing, mailing and duplication costs. | |
| Non-Recurring Fees and Expenses | Each Fund pays all non-recurring and unusual fees and expenses (referred to as extraordinary fees and expenses in the Trust Agreement), if any, as determined by the Managing Owner. Non-recurring and unusual fees and expenses include items such as legal claims and liabilities, litigation costs, indemnification expenses and other expenses that are not currently anticipated obligations of any Fund or of managed futures funds in general. |
-12-
Table of Contents
| Management Fee and Expenses to be Paid First out of Treasury Income, Money Market Income and/or T-Bill ETF Income |
The Management Fee and the brokerage commissions and fees of each Fund are paid first out of Treasury Income from such Fund’s holdings of Treasury Securities, Money Market Income from such Fund’s holdings of money market mutual funds (affiliated or otherwise) and T-Bill ETF Income from such Fund’s holdings of T-Bill ETFs (affiliated or otherwise), as applicable, on deposit with the Commodity Broker as margin, the Custodian, or otherwise. If the sum of the Treasury Income, the Money Market Income and the T-Bill ETF Income is not sufficient to cover the fees and expenses of each Fund that are payable by each Fund during any period, the excess of such fees and expenses over such Treasury Income, Money Market Income and T-Bill ETF Income will be paid out of income from futures trading, if any, or from sales of the Fund’s holdings in Treasury Securities, money market mutual funds, and/or holdings in T-Bill ETFs. | |
| Selling Commission | Retail investors may purchase and sell Shares through traditional brokerage accounts. Investors are expected to be charged a commission by their brokers in connection with purchases of Shares that will vary from investor to investor. Investors are encouraged to review the terms of their brokerage accounts for applicable charges. |
-13-
Table of Contents
SUMMARY (cont’d)
-14-
Table of Contents
-15-
Table of Contents
-16-
Table of Contents
-17-
Table of Contents
-18-
Table of Contents
-19-
Table of Contents
-20-
Table of Contents
-21-
Table of Contents
-22-
Table of Contents
-23-
Table of Contents
-24-
Table of Contents
-25-
Table of Contents
-26-
Table of Contents
-27-
Table of Contents
-28-
Table of Contents
-29-
Table of Contents
-30-
Table of Contents
-31-
Table of Contents
-32-
Table of Contents
The Breakeven Table, as presented, is an approximation only. Because a constant NAV per Share has been assumed, the actual capitalization of each Fund does not directly affect the level of its charges as a percentage of its NAV.
| Dollar Amount and Percentage of Expenses Per Fund | ||||||||||||||||||||||||||||||||||||||||
| DBE | DBO | DBP | DGL | DBB | ||||||||||||||||||||||||||||||||||||
| Expense1 | $ | % | $ | % | $ | % | $ | % | $ | % | ||||||||||||||||||||||||||||||
|
Management Fee2 |
$ | 0.14 | 0.75 | % | $ | 0.10 | 0.75 | % | $ | 0.26 | 0.75 | % | $ | 0.28 | 0.75 | % | $ | 0.12 | 0.75 | % | ||||||||||||||||||||
| Offering Expense Reimbursement |
$ | 0.00 | 0.00 | % | $ | 0.00 | 0.00 | % | $ | 0.00 | 0.00 | % | $ | 0.00 | 0.00 | % | $ | 0.00 | 0.00 | % | ||||||||||||||||||||
| Brokerage Commissions and Fees3 |
$ | 0.01 | 0.03 | % | $ | 0.00 | 0.03 | % | $ | 0.01 | 0.03 | % | $ | 0.01 | 0.03 | % | $ | 0.01 | 0.05 | % | ||||||||||||||||||||
| Routine Operational, Administrative and Other Ordinary Expenses4,5 |
$ | 0.00 | 0.00 | % | $ | 0.00 | 0.00 | % | $ | 0.00 | 0.00 | % | $ | 0.00 | 0.00 | % | $ | 0.00 | 0.00 | % | ||||||||||||||||||||
| Treasury Income, Money Market Income and T-Bill ETF Income |
$ | 0.39 | 2.14 | % | $ | 0.29 | 2.16 | % | $ | 0.76 | 2.21 | % | $ | 0.82 | 2.19 | % | $ | 0.36 | 2.15 | % | ||||||||||||||||||||
| 12-Month Breakeven6,7 |
$ | 0.00 | 0.00 | % | $ | 0.00 | 0.00 | % | $ | 0.00 | 0.00 | % | $ | 0.00 | 0.00 | % | $ | 0.00 | 0.00 | % | ||||||||||||||||||||
| 1. | See the “Charges” section for an explanation of the expenses included in the Breakeven Table. The Managing Owner pays a marketing services fee to the Marketing Agent and an index services fee to the Index Sponsor. Because the marketing services fee and the index services fee are not paid by the Funds, these fees are not included in the breakeven analysis. |
| 2. | The Managing Owner is responsible for paying the fees and expenses of the Administrator, Invesco Distributors, the Index Sponsor and the Marketing Agent from its own assets. |
| Each Fund may, for margin and/or cash management purposes, invest in money market mutual funds and/or T-Bill ETFs that are managed by affiliates of the Managing Owner. The indirect portion of the management fees that such Fund may incur through such investments is in addition to the Management Fee paid to the Managing Owner. The Managing Owner has contractually agreed to waive indefinitely the fees that it receives in an amount equal to the indirect management fees that each Fund incurs through its investments in affiliated money market mutual funds and/or affiliated T-Bill ETFs. The Managing Owner may terminate these waivers on 60 days’ notice. |
| As of the date of this prospectus, this waiver is approximately less than $0.01 per Share per annum for each of the Funds. |
| 3. | The actual amount of brokerage commissions and trading fees to be incurred will vary based upon the trading frequency of each Fund and the specific futures contracts traded. |
| 4. | The Managing Owner is responsible for paying all routine operational, administrative and other ordinary expenses of each Fund. |
| 5. | Authorized Participants pay a transaction fee in the amount of $500 per order to create and redeem Baskets and are subject to an additional processing charge for failure to timely deliver such orders. Because these transaction fees are de minimis in amount, are charged on a transaction-by-transaction basis (and not on a Basket-by-Basket basis), and are borne by the Authorized Participants, they have not been included in the Breakeven Table. |
| 6. | The table indicates that the breakeven amount during the first 12 months of an investment in each Fund is $0.00 and 0% of NAV. These figures reflect that, during those first 12 months, each Fund’s Treasury |
-33-
Table of Contents
| Income, Money Market Income, and T-Bill ETF Income are expected to exceed the Fund’s fees and expenses. |
| 7. | You may pay brokerage commissions in connection with purchases of the Shares. Because such brokerage commission rates are set by your broker, they will vary from investor to investor and have not been included in the Breakeven Table. Investors are encouraged to review the terms of their brokerage accounts for applicable charges. |
-34-
Table of Contents
PERFORMANCE OF INVESCO DB ENERGY FUND (TICKER: DBE),
A SERIES OF INVESCO DB MULTI-SECTOR COMMODITY TRUST
Name of Pool: Invesco DB Energy Fund
Type of Pool: Public, Exchange-Listed Commodity Pool
Inception of Trading: January 2007
Aggregate Gross Capital Subscriptions as of September 28, 20181: $1,720,195,035
NAV as of September 28, 20182: $228,093,458
NAV per Share as of September 28, 20183: $18.10
Worst Monthly Drawdown4: (17.05)% December 2014
Worst Peak-to-Valley Drawdown5: (81.53)% June 2008 — February 2016
| Monthly Rate of Return |
2018(%) | 2017(%) | 2016(%) | 2015(%) | 2014(%) | 2013(%) | ||||||
|
January |
4.18 | (4.78) | (7.98) | (7.30) | (2.85) | 4.68 | ||||||
|
February |
(5.20) | (0.76) | (4.09) | 10.39 | 4.31 | (3.75) | ||||||
|
March |
5.97 | (3.45) | 6.50 | (9.58) | (0.95) | 3.30 | ||||||
|
April |
5.76 | (3.02) | 12.50 | 13.44 | 0.82 | (4.43) | ||||||
|
May |
3.65 | (2.13) | 4.41 | (2.28) | 0.64 | (2.12) | ||||||
|
June |
2.15 | (3.01) | 1.95 | (1.71) | 3.43 | (0.11) | ||||||
|
July |
(2.98) | 5.78 | (10.36) | (14.82) | (5.34) | 5.47 | ||||||
|
August |
3.31 | 0.41 | 4.53 | 1.90 | (1.35) | 2.33 | ||||||
|
September |
5.60 | 4.63 | 5.70 | (9.47) | (6.36) | (3.91) | ||||||
|
October |
6.44 | (1.29) | 0.59 | (9.28) | (0.21) | |||||||
|
November |
2.48 | 4.40 | (7.99) | (15.25) | 1.35 | |||||||
|
December |
3.84 | 7.73 | (11.23) | (17.05) | 2.14 | |||||||
|
Compound Rate of Return6 |
24.06% | 5.72% | 23.77% | (34.91)% | (41.27)% | 4.18% |
| * | The Worst Peak-to-Valley Drawdown from June 2008 – February 2016 reflects the total return of the Fund, including the $0.44 per Share distribution made to Shareholders of record as of December 17, 2008. |
PAST PERFORMANCE IS NOT NECESSARILY INDICATIVE OF FUTURE RESULTS.
See accompanying Footnotes to Performance Information on page 40.
-35-
Table of Contents
PERFORMANCE OF INVESCO DB OIL FUND (TICKER: DBO),
A SERIES OF INVESCO DB MULTI-SECTOR COMMODITY TRUST
Name of Pool: Invesco DB Oil Fund
Type of Pool: Public, Exchange-Listed Commodity Pool
Inception of Trading: January 2007
Aggregate Gross Capital Subscriptions as of September 28, 20181: $3,869,818,265
NAV as of September 28, 20182: $403,668,947
NAV per Share as of September 28, 20183: $13.46
Worst Monthly Drawdown4: (20.83)% December 2014
Worst Peak-to-Valley Drawdown5: (85.91)% June 2008 — February 2016*
| Monthly Rate of Return |
2018(%) | 2017(%) | 2016(%) | 2015(%) | 2014(%) | 2013(%) | ||||||
|
January |
7.15 | (3.31) | (11.91) | (11.22) | (2.82) | 5.73 | ||||||
|
February |
(3.93) | (0.43) | (7.38) | 6.75 | 6.65 | (6.15) | ||||||
|
March |
6.28 | (5.59) | 5.27 | (8.16) | (0.10) | 4.96 | ||||||
|
April |
6.18 | (2.62) | 10.78 | 12.81 | (0.87) | (4.25) | ||||||
|
May |
0.51 | (2.92) | 5.56 | (2.56) | 3.69 | (1.93) | ||||||
|
June |
4.87 | (3.13) | 0.55 | (1.21) | 4.31 | 2.12 | ||||||
|
July |
(2.32) | 5.96 | (11.90) | (17.19) | (5.81) | 5.43 | ||||||
|
August |
3.52 | (2.11) | 4.46 | 3.95 | (1.99) | 1.97 | ||||||
|
September |
6.49 | 5.63 | 5.93 | (10.62) | (4.77) | (1.47) | ||||||
|
October |
4.76 | (3.58) | 3.28 | (10.88) | (1.31) | |||||||
|
November |
4.87 | 5.34 | (10.30) | (18.64) | (1.88) | |||||||
|
December |
5.37 | 6.62 | (13.21) | (20.83) | 3.98 | |||||||
|
Compound Rate of Return6 |
31.83% | 5.58% | 6.62% | (41.52)% | (43.97)% | 6.54% |
| * | The Worst Peak-to-Valley Drawdown from June 2008 – February 2016 reflects the total return of the Fund, including the $0.12 per Share distribution made to Shareholders of record as of December 17, 2008. |
PAST PERFORMANCE IS NOT NECESSARILY INDICATIVE OF FUTURE RESULTS.
See accompanying Footnotes to Performance Information on page 40.
-36-
Table of Contents
PERFORMANCE OF INVESCO DB PRECIOUS METALS FUND (TICKER: DBP),
A SERIES OF INVESCO DB MULTI-SECTOR COMMODITY TRUST
Name of Pool: Invesco DB Precious Metals Fund
Type of Pool: Public, Exchange-Listed Commodity Pool
Inception of Trading: January 2007
Aggregate Gross Capital Subscriptions as of September 28, 20181: $1,510,533,577
NAV as of September 28, 20182: $110,368,430
NAV per Share as of September 28, 20183: $34.49
Worst Monthly Drawdown4: (12.61)% June 2013
Worst Peak-to-Valley Drawdown5: (51.67)% August 2011 — December 2015
| Monthly Rate of Return |
2018(%) | 2017(%) | 2016(%) | 2015(%) | 2014(%) | 2013(%) | ||||||
|
January |
2.12 | 5.90 | 4.71 | 8.72 | 2.22 | (0.09) | ||||||
|
February |
(2.46) | 3.76 | 9.41 | (5.23) | 7.57 | (6.12) | ||||||
|
March |
0.16 | (0.63) | 0.76 | (2.04) | (3.85) | 0.73% | ||||||
|
April |
(0.39) | (0.05) | 6.47 | (0.68) | 0.12 | (9.34) | ||||||
|
May |
(1.12) | 0.39 | (6.76) | 1.06 | (3.81) | (6.11) | ||||||
|
June |
(3.42) | (3.01) | 9.95 | (2.64) | 7.47 | (12.61) | ||||||
|
July |
(2.70) | 1.67 | 3.56 | (6.54) | (3.30) | 6.05 | ||||||
|
August |
(3.02) | 3.89 | (4.75) | 2.40 | (0.75) | 8.64 | ||||||
|
September |
(0.43) | (3.11) | 1.02 | (1.36) | (7.47) | (5.64) | ||||||
|
October |
(0.84) | (4.22) | 3.20 | (3.90) | (0.14) | |||||||
|
November |
(0.08) | (8.04) | (7.40) | (0.58) | (6.42) | |||||||
|
December |
2.88 | (2.16) | (0.86) | 0.63 | (3.95) | |||||||
|
Compound Rate of Return6 |
(10.83)% | 10.87% | 8.21% | (11.78)% | (6.58)% | (31.40)% |
PAST PERFORMANCE IS NOT NECESSARILY INDICATIVE OF FUTURE RESULTS.
See accompanying Footnotes to Performance Information on page 40.
-37-
Table of Contents
PERFORMANCE OF INVESCO DB GOLD FUND (TICKER: DGL),
A SERIES OF INVESCO DB MULTI-SECTOR COMMODITY TRUST
Name of Pool: Invesco DB Gold Fund
Type of Pool: Public, Exchange-Listed Commodity Pool
Inception of Trading: January 2007
Aggregate Gross Capital Subscriptions as of September 28, 20181: $1,612,618,101
NAV as of September 28, 20182: $112,365,235
NAV per Share as of September 28, 20183: $37.45
Worst Monthly Drawdown4: (12.48)% June 2013
Worst Peak-to-Valley Drawdown5: (45.83)% August 2011 — December 2015
| Monthly Rate of Return |
2018(%) | 2017(%) | 2016(%) | 2015(%) | 2014(%) | 2013(%) | ||||||
|
January |
2.36 | 4.97 | 5.10 | 8.22 | 3.10 | (1.03) | ||||||
|
February |
(1.76) | 3.47 | 10.56 | (5.45) | 6.74 | (5.22) | ||||||
|
March |
0.36 | (0.50) | 0.08 | (2.62) | (3.04) | 0.97 | ||||||
|
April |
(0.53) | 1.37 | 4.46 | (0.10) | 0.86 | (7.94) | ||||||
|
May |
(1.46) | 0.30 | (5.86) | 0.49 | (4.03) | (5.63) | ||||||
|
June |
(3.75) | (2.58) | 8.44 | (1.53) | 6.24 | (12.48) | ||||||
|
July |
(2.43) | 1.82 | 2.05 | (6.79) | (3.34) | 7.18 | ||||||
|
August |
(2.07) | 3.86 | (3.69) | 3.37 | 0.25 | 6.36 | ||||||
|
September |
(0.82) | (2.67) | 0.57 | (1.59) | (6.21) | (5.11) | ||||||
|
October |
(1.05) | (3.34) | 2.30 | (3.49) | (0.34) | |||||||
|
November |
0.30 | (8.10) | (6.76) | 0.21 | (5.76) | |||||||
|
December |
2.60 | (1.93) | (0.57) | 0.73 | (4.05) | |||||||
|
Compound Rate of Return6 |
(9.78)% | 12.18% | 6.78% | (11.44) | (2.84)% | (29.81)% |
PAST PERFORMANCE IS NOT NECESSARILY INDICATIVE OF FUTURE RESULTS.
See accompanying Footnotes to Performance Information on page 40.
-38-
Table of Contents
PERFORMANCE OF INVESCO DB BASE METALS FUND (TICKER: DBB),
A SERIES OF INVESCO DB MULTI-SECTOR COMMODITY TRUST
Name of Pool: Invesco DB Base Metals Fund
Type of Pool: Public, Exchange-Listed Commodity Pool
Inception of Trading: January 2007
Aggregate Gross Capital Subscriptions as of September 28, 20181: $2,239,659,536
NAV as of September 28, 20182: $189,955,422
NAV per Share as of September 28, 20183: $16.66
Worst Monthly Drawdown4: (7.25)% November 2015
Worst Peak-to-Valley Drawdown5: (54.47)% February 2011 — November 2015
| Monthly Rate of Return |
2018(%) | 2017(%) | 2016(%) | 2015(%) | 2014(%) | 2013(%) | ||||||
|
January |
1.03 | 9.03 | (1.26) | (5.63) | (4.83) | 1.41 | ||||||
|
February |
(2.86) | 1.10 | 4.78 | 0.40 | 2.25 | (4.64) | ||||||
|
March |
(4.52) | (0.61) | 1.06 | 0.33 | (2.94) | (5.19) | ||||||
|
April |
2.75 | (3.11) | 6.61 | 7.96 | 0.76 | (3.65) | ||||||
|
May |
0.54 | (0.38) | (4.99) | (7.13) | 1.82 | 2.54 | ||||||
|
June |
(6.07) | 3.16 | 6.36 | (5.45) | 4.37 | (6.75) | ||||||
|
July |
(4.88) | 2.82 | 2.69 | (6.18) | 4.36 | 0.43 | ||||||
|
August |
(2.98) | 9.60 | (1.38) | (2.74) | 1.04 | 2.09 | ||||||
|
September |
2.40 | (1.63) | 3.69 | (3.04) | (5.10) | 1.15 | ||||||
|
October |
3.93 | 2.14 | (2.59) | 1.45 | 0.00 | |||||||
|
November |
(3.30) | 8.72 | (7.25) | (4.10) | (4.30) | |||||||
|
December |
6.71 | (4.10) | 3.04 | (3.23) | 4.61 | |||||||
|
Compound Rate of Return6 |
(14.08)% | 29.70% | 25.95% | (25.77)% | (4.71)% | (12.28)% |
PAST PERFORMANCE IS NOT NECESSARILY INDICATIVE OF FUTURE RESULTS.
See accompanying Footnotes to Performance Information on page 40.
-39-
Table of Contents
Footnotes to Performance Information
1. “Aggregate Gross Capital Subscriptions” is the aggregate of all amounts ever contributed to the relevant Fund, including investors who subsequently redeemed their investments.
2. “NAV” is the NAV of the relevant Fund as of Friday, September 28, 2018. As September 30, 2018 was a Sunday, the Funds did not engage in any trading or creation or redemption of Shares on that date.
3. “NAV per Share” is the NAV of the relevant Fund divided by the total number of Shares outstanding with respect to such Fund as of September 28, 2018.
4. “Worst Monthly Drawdown” is the largest single month loss sustained during the most recent five calendar years and year to date (if applicable). “Drawdown” as used in this section of the Prospectus means losses experienced by the relevant Fund over the specified period and is calculated on a rate of return basis, i.e., dividing net performance by beginning equity. “Drawdown” is measured on the basis of monthly returns only, and does not reflect intra-month figures. “Month” is the month of the Worst Monthly Drawdown.
5. “Worst Peak-to-Valley Drawdown” is the largest percentage decline in the NAV per Share during the last five years (and to the extent applicable, for a period beyond the most recent five calendar years if the starting date of the peak value extends beyond this period). This need not be a continuous decline, but can be a series of positive and negative returns where the negative returns are larger than the positive returns. “Worst Peak-to-Valley Drawdown” represents the greatest percentage decline from any month-end NAV per Share that occurs without such month-end NAV per Share being equaled or exceeded as of a subsequent month-end. For example, if the NAV per Share of a particular Fund declined by $1 in each of January and February, increased by $1 in March and declined again by $2 in April, a “peak-to-valley drawdown” analysis conducted as of the end of April would consider that “drawdown” to be still continuing and to be $3 in amount, whereas if the NAV per Share had increased by $2 in March, the January-February drawdown would have ended as of the end of February at the $2 level.
6. “Compound Rate of Return” of the relevant Fund is calculated by multiplying on a compound basis each of the monthly rates of return set forth in the respective charts above and not by adding or averaging such monthly rates of return. For periods of less than one year, the results are year-to-date.
EACH FUND’S PERFORMANCE INFORMATION FROM INCEPTION UP TO AND EXCLUDING FEBRUARY 23, 2015 IS A REFLECTION OF THE PERFORMANCE ASSOCIATED WITH ITS PREDECESSOR MANAGING OWNER. ALL THE PERFORMANCE INFORMATION ON AND AFTER FEBRUARY 23, 2015 REFLECTS THE PERFORMANCE ASSOCIATED WITH THE MANAGING OWNER.
-40-
Table of Contents
-41-
Table of Contents
-42-
Table of Contents
SECTOR INDEXES OVERVIEW
| Index |
Index Commodity |
Exchange |
Base Date | Index Base Weight | ||||||
| DBIQ-OY Energy ER™ |
Light, Sweet Crude Oil (WTI) | NYMEX (CL) | June 4, 1990 | 22.50 | % | |||||
| Heating Oil | NYMEX (HO) | 22.50 | % | |||||||
| Brent Crude Oil | ICE-UK (LCO) | 22.50 | % | |||||||
| RBOB Gasoline | NYMEX (XB) | 22.50 | % | |||||||
| Natural Gas | NYMEX (NG) | 10.00 | % | |||||||
| DBIQ-OY CL ER™2 |
Light, Sweet Crude Oil (WTI) | NYMEX (CL) | December 2, 1988 | 100.00 | % | |||||
| DBIQ-OY Precious Metals ER™ |
Gold | COMEX (GC) | December 2, 1988 | 80.00 | % | |||||
| Silver | COMEX (SI) | 20.00 | % | |||||||
| DBIQ-OY GC ER™2 |
Gold | COMEX (GC) | December 2, 1988 | 100.00 | % | |||||
| DBIQ-OY Industrial Metals ER™ |
Aluminum | LME (MAL) | September 3, 1997 | 33.33 | % | |||||
| Zinc | LME (MZN) | 33.33 | % | |||||||
| Copper — Grade A | LME (MCU) | 33.33 | % | |||||||
1 Connotes the exchanges on which the underlying futures contracts are traded.
2 DBIQ-OY CL ER™ and DBIQ-OY GC ER™ are Single Commodity Indexes.
Legend:
“COMEX” means the Commodity Exchange Inc., New York, a part of the CME Group, or its successor.
“ICE-UK” means ICE Futures Europe, or its successor.
“LME” means The London Metal Exchange Limited, or its successor.
“NYMEX” means the New York Mercantile Exchange, a part of the CME Group, or its successor.
-43-
Table of Contents
-44-
Table of Contents
-45-
Table of Contents
-46-
Table of Contents
-47-
Table of Contents
-48-
Table of Contents
ENERGY SECTOR DATA
RELATING TO
DBIQ OPTIMUM YIELD ENERGY INDEX EXCESS RETURN™
(DBIQ-OY ENERGY ER™)
-49-
Table of Contents
CLOSING LEVELS TABLES
DBIQ OPTIMUM YIELD ENERGY INDEX EXCESS RETURN™
| CLOSING LEVEL | INDEX CHANGES | |||||||||||||||
| High1 | Low2 | Annual3 | Since Inception4 | |||||||||||||
| 2008 |
1772.65 | 559.38 | -40.45 | % | 560.50 | % | ||||||||||
| 2009 |
862.18 | 518.29 | 25.76 | % | 730.64 | % | ||||||||||
| 2010 |
884.28 | 704.89 | 4.00 | % | 763.88 | % | ||||||||||
| 2011 |
1075.48 | 812.44 | 3.38 | % | 793.06 | % | ||||||||||
| 2012 |
1013.67 | 764.32 | 2.01 | % | 811.04 | % | ||||||||||
| 2013 |
976.99 | 872.41 | 4.77 | % | 854.50 | % | ||||||||||
| 2014 |
1020.64 | 580.57 | -39.18 | % | 480.57 | % | ||||||||||
| 2015 |
619.91 | 368.00 | -34.42 | % | 280.74 | % | ||||||||||
| 2016 |
473.21 | 301.44 | 24.27 | % | 373.17 | % | ||||||||||
| 2017 |
500.18 | 371.70 | 5.71 | % | 400.18 | % | ||||||||||
| 20185 |
616.16 | 475.49 | 23.19 | % | 516.16 | % | ||||||||||
THE PRIOR INDEX LEVELS AND CHANGES TO THE INDEX LEVELS SHOWN ABOVE DO NOT REPRESENT THE FUND’S PERFORMANCE AND ARE NOT INDICATIVE OF THE FUND’S FUTURE PERFORMANCE. THE INDEX SHOWN DOES NOT REFLECT ANY FEES OR EXPENSES ASSOCIATED WITH OPERATING A FUND OR ACTUAL TRADING.
Please refer to the “Notes” section below.
[Remainder of page left blank intentionally.]
-50-
Table of Contents
The Index Sponsor also maintains a separate index, DBIQ Optimum Yield Energy Index Total Return (“DBIQ Optimum Yield Energy TR™”) which the Fund does not track. DBIQ Optimum Yield Energy TR™ is calculated on a funded (total return) basis, which reflects the change in market value of the underlying index commodities and interest income from a notional basket of fixed income securities. DBIQ Optimum Yield Energy TR™ is included so that investors can evaluate an index with both futures and income components, as the particular Fund tracks the Index and expects to generate income from positions in Treasury Securities, money market funds, and/or T-Bill ETFs that are maintained for margin and/or cash management purposes.
DBIQ OPTIMUM YIELD ENERGY INDEX TOTAL RETURN™
| CLOSING LEVEL | INDEX CHANGES | |||||||||||||||
| High1 | Low2 | Annual3 | Since Inception4 | |||||||||||||
| 2008 |
3676.21 | 1165.04 | -39.62 | % | 1275.66 | % | ||||||||||
| 2009 |
1798.15 | 1079.73 | 25.94 | % | 1632.53 | % | ||||||||||
| 2010 |
1845.15 | 1471.50 | 4.14 | % | 1704.26 | % | ||||||||||
| 2011 |
2247.01 | 1697.62 | 3.43 | % | 1766.13 | % | ||||||||||
| 2012 |
2118.34 | 1597.67 | 2.10 | % | 1805.30 | % | ||||||||||
| 2013 |
2044.00 | 1824.93 | 4.83 | % | 1897.28 | % | ||||||||||
| 2014 |
2136.06 | 1215.17 | -39.16 | % | 1115.17 | % | ||||||||||
| 2015 |
1297.61 | 770.59 | -34.39 | % | 697.27 | % | ||||||||||
| 2016 |
994.06 | 631.32 | 24.67 | % | 894.00 | % | ||||||||||
| 2017 |
1060.63 | 783.57 | 6.70 | % | 960.63 | % | ||||||||||
| 20185 |
1324.50 | 1010.07 | 24.88 | % | 1224.50 | % | ||||||||||
THE FUND DOES NOT TRACK DBIQ OPTIMUM YIELD ENERGY INDEX TOTAL RETURN™.
THE PRIOR INDEX LEVELS AND CHANGES TO THE INDEX LEVELS SHOWN ABOVE DO NOT REPRESENT THE FUND’S PERFORMANCE AND ARE NOT INDICATIVE OF THE FUND’S FUTURE PERFORMANCE. THE INDEX SHOWN DOES NOT REFLECT ANY FEES OR EXPENSES ASSOCIATED WITH OPERATING A FUND OR ACTUAL TRADING.
Please refer to the “Notes” section below.
[Remainder of page left blank intentionally.]
-51-
Table of Contents
The following table presents various measures of performance for the Index (“DBIQ Optimum Yield Energy ERTM”), DBIQ Optimum Yield Energy TRTM, and S&P GSCI Energy Index Total Return (“S&P GSCI Energy Index TR”), which is a broad-based commodity index. The S&P GSCI Energy Index TR has been included to provide investors with an additional basis for evaluating the Fund.
All statistics based on data from June 4, 1990 to September 28, 2018.
| VARIOUS STATISTICAL MEASURES | DBIQ Optimum Yield Energy ER |
DBIQ Optimum Yield Energy TR |
S&P GSCI Energy Index TR |
|||||||||||||||||
| Annualized Changes to Index Level6 |
6.6% | 9.6% | 2.4% | |||||||||||||||||
| Average rolling 3 month daily volatility7 |
23.9% | 23.9% | 28.9% | |||||||||||||||||
| Sharpe Ratio8 |
0.28 | 0.28 | -0.01 | |||||||||||||||||
| % of months with positive change9 |
55% | 55% | 52% | |||||||||||||||||
| Average monthly positive change10 |
5.7% | 5.9% | 7.0% | |||||||||||||||||
| Average monthly negative change11 |
-5.1% | -5.0% | -6.4% | |||||||||||||||||
| ANNUALIZED INDEX LEVELS12 | DBIQ Optimum Yield Energy ER |
DBIQ Optimum Yield Energy TR |
S&P GSCI Energy Index TR |
|||||||||||||||||
| 1 year |
39.5% | 41.8% | 43.3% | |||||||||||||||||
| 3 year |
10.0% | 11.0% | 5.6% | |||||||||||||||||
| 5 year |
-7.8% | -7.3% | -12.3% | |||||||||||||||||
| 7 year |
-4.3% | -3.9% | -7.0% | |||||||||||||||||
| 10 year |
-6.7% | -6.4% | -11.9% | |||||||||||||||||
| 15 year |
4.1% | 5.4% | -3.4% | |||||||||||||||||
THE FUND DOES NOT TRACK DBIQ OPTIMUM YIELD ENERGY TR™ OR THE S&P GSCI ENERGY INDEX TR. THE VARIOUS STATISTICAL MEASURES AND ANNUALIZED INDEX LEVELS SHOWN ABOVE DO NOT REPRESENT THE FUND’S PERFORMANCE AND ARE NOT INDICATIVE OF THE FUND’S FUTURE PERFORMANCE.
Please refer to the “Notes” section below.
[Remainder of page left blank intentionally.]
-52-
Table of Contents
The following tables present additional information regarding the Index, DBIQ Optimum Yield Energy TRTM and S&P GSCI Energy Index TR.
COMPARISON OF DBIQ OPTIMUM YIELD ENERGY INDEX TOTAL RETURN™, DBIQ OPTIMUM YIELD ENERGY
INDEX EXCESS RETURN™ AND S&P GSCI ENERGY INDEX TR
(June 4, 1990 — September 28, 2018)

THE FUND TRACKS ONLY ITS OWN INDEX, DBIQ OPTIMUM YIELD ENERGY ERTM. THE PRIOR INDEX LEVELS SHOWN ABOVE DO NOT REPRESENT THE FUND’S PERFORMANCE AND ARE NOT INDICATIVE OF THE FUND’S FUTURE PERFORMANCE. THE INDEXES SHOWN DO NOT REFLECT ANY FEES OR EXPENSES ASSOCIATED WITH OPERATING A FUND OR ACTUAL TRADING.
[Remainder of page left blank intentionally.]
-53-
Table of Contents
COMPARISON OF DBIQ OPTIMUM YIELD ENERGY INDEX TOTAL RETURN™, DBIQ OPTIMUM YIELD ENERGY INDEX EXCESS
RETURN™ AND S&P GSCI ENERGY INDEX TR
(June 4, 1990 — September 28, 2018)

THE FUND TRACKS ONLY ITS OWN INDEX, DBIQ OPTIMUM YIELD ENERGY ERTM. THE PRIOR INDEX LEVELS SHOWN ABOVE DO NOT REPRESENT THE FUND’S PERFORMANCE AND ARE NOT INDICATIVE OF THE FUND’S FUTURE PERFORMANCE. THE INDEXES SHOWN DO NOT REFLECT ANY FEES OR EXPENSES ASSOCIATED WITH OPERATING A FUND OR ACTUAL TRADING.
[Remainder of page left blank intentionally.]
-54-
Table of Contents
CRUDE OIL SECTOR DATA
RELATING TO
DBIQ OPTIMUM YIELD CRUDE OIL INDEX EXCESS RETURN™
(DBIQ-OY CL ER™)
-55-
Table of Contents
CLOSING LEVELS TABLES
DBIQ OPTIMUM YIELD CRUDE OIL INDEX EXCESS RETURN™
| CLOSING LEVEL | INDEX CHANGES | |||||||||||||||
| High1 | Low2 | Annual3 | Since Inception4 | |||||||||||||
| 2008 |
3955.92 | 1188.78 | -41.61 | % | 1368.33 | % | ||||||||||
| 2009 |
2057.94 | 1147.41 | 36.08 | % | 1898.07 | % | ||||||||||
| 2010 |
2169.64 | 1673.17 | 3.20 | % | 1962.00 | % | ||||||||||
| 2011 |
2508.55 | 1642.90 | 1.97 | % | 2002.66 | % | ||||||||||
| 2012 |
2343.44 | 1685.62 | -8.17 | % | 1830.84 | % | ||||||||||
| 2013 |
2108.94 | 1796.69 | 7.08 | % | 1967.56 | % | ||||||||||
| 2014 |
2308.48 | 1203.05 | -41.81 | % | 1103.05 | % | ||||||||||
| 2015 |
1203.36 | 687.13 | -40.87 | % | 611.36 | % | ||||||||||
| 2016 |
765.81 | 528.35 | 7.09 | % | 661.77 | % | ||||||||||
| 2017 |
803.40 | 587.93 | 5.46 | % | 703.40 | % | ||||||||||
| 20185 |
1052.44 | 794.23 | 31.00 | % | 952.44 | % | ||||||||||
THE PRIOR INDEX LEVELS AND CHANGES TO THE INDEX LEVELS SHOWN ABOVE DO NOT REPRESENT THE FUND’S PERFORMANCE AND ARE NOT INDICATIVE OF THE FUND’S FUTURE PERFORMANCE. THE INDEX SHOWN DOES NOT REFLECT ANY FEES OR EXPENSES ASSOCIATED WITH OPERATING A FUND OR ACTUAL TRADING.
Please refer to the “Notes” section below.
[Remainder of page left blank intentionally.]
-56-
Table of Contents
The Index Sponsor also maintains a separate index, DBIQ Optimum Yield Crude Oil Index Total Return (“DBIQ Optimum Yield Crude Oil TR™”) which the Fund does not track. DBIQ Optimum Yield Crude Oil TR™ is calculated on a funded (total return) basis, which reflects the change in market value of the underlying index commodities and interest income from a notional basket of fixed income securities. DBIQ Optimum Yield Crude Oil TR™ is included so that investors can evaluate an index with both futures and income components, as the particular Fund tracks the Index and expects to generate income from positions in Treasury Securities, money market funds, and/or T-Bill ETFs that are maintained for margin and/or cash management purposes.
DBIQ OPTIMUM YIELD CRUDE OIL INDEX TOTAL RETURN™
| CLOSING LEVEL | INDEX CHANGES | |||||||||||||||
| High1 | Low2 | Annual3 | Since Inception4 | |||||||||||||
| 2008 |
9281.23 | 2799.96 | -40.80 | % | 3358.41 | % | ||||||||||
| 2009 |
4853.73 | 2703.20 | 36.28 | % | 4612.97 | % | ||||||||||
| 2010 |
5119.70 | 3948.54 | 3.34 | % | 4770.26 | % | ||||||||||
| 2011 |
5927.09 | 3882.20 | 2.02 | % | 4868.75 | % | ||||||||||
| 2012 |
5538.20 | 3984.72 | -8.09 | % | 4466.53 | % | ||||||||||
| 2013 |
4989.66 | 4250.26 | 7.14 | % | 4792.56 | % | ||||||||||
| 2014 |
5463.65 | 2847.65 | -41.80 | % | 2747.65 | % | ||||||||||
| 2015 |
2848.58 | 1627.14 | -40.84 | % | 1584.67 | % | ||||||||||
| 2016 |
1819.25 | 1251.36 | 7.43 | % | 1709.70 | % | ||||||||||
| 2017 |
1926.55 | 1401.60 | 6.46 | % | 1826.55 | % | ||||||||||
| 20185 |
2558.41 | 1907.72 | 32.80 | % | 2458.41 | % | ||||||||||
THE FUND DOES NOT TRACK DBIQ OPTIMUM YIELD CRUDE OIL INDEX TOTAL RETURN™.
THE PRIOR INDEX LEVELS AND CHANGES TO THE INDEX LEVELS SHOWN ABOVE DO NOT REPRESENT THE FUND’S PERFORMANCE AND ARE NOT INDICATIVE OF THE FUND’S FUTURE PERFORMANCE. THE INDEX SHOWN DOES NOT REFLECT ANY FEES OR EXPENSES ASSOCIATED WITH OPERATING A FUND OR ACTUAL TRADING.
Please refer to the “Notes” section below.
[Remainder of page left blank intentionally.]
-57-
Table of Contents
The following table presents various measures of performance for the Index (“DBIQ Optimum Yield Crude Oil ERTM”), DBIQ Optimum Yield Crude Oil TRTM, and S&P GSCI Crude Oil Index Total Return (“S&P GSCI Crude Oil Index TR”), which is a broad-based commodity index. The S&P GSCI Crude Oil Index TR has been included to provide investors with an additional basis for evaluating the Fund.
All statistics based on data from December 2, 1988 to September 28, 2018.
| VARIOUS STATISTICAL MEASURES | DBIQ Optimum Yield Crude Oil ER |
DBIQ Optimum Yield Crude Oil TR |
S&P GSCI Crude Oil Index TR |
|||||||||||||||||
| Annualized Changes to Index Level6 |
8.2% | 11.5% | 5.9% | |||||||||||||||||
| Average rolling 3 month daily volatility7 |
26.7% | 26.7% | 32.1% | |||||||||||||||||
| Sharpe Ratio8 |
0.31 | 0.32 | 0.09 | |||||||||||||||||
| % of months with positive change9 |
54% | 56% | 54% | |||||||||||||||||
| Average monthly positive change10 |
6.3% | 6.4% | 7.6% | |||||||||||||||||
| Average monthly negative change11 |
-5.6% | -5.4% | -7.0% | |||||||||||||||||
| ANNUALIZED INDEX LEVELS12 | DBIQ Optimum Yield Crude Oil ER |
DBIQ Optimum Yield Crude Oil TR |
S&P GSCI Crude Oil Index TR |
|||||||||||||||||
| 1 year |
51.6% | 54.1% | 48.6% | |||||||||||||||||
| 3 year |
6.0% | 7.0% | 2.9% | |||||||||||||||||
| 5 year |
-12.5% | -12.0% | -15.4% | |||||||||||||||||
| 7 year |
-6.7% | -6.3% | -8.7% | |||||||||||||||||
| 10 year |
-9.2% | -8.9% | -15.5% | |||||||||||||||||
| 15 year |
2.6% | 3.9% | -4.7% | |||||||||||||||||
THE FUND DOES NOT TRACK DBIQ OPTIMUM YIELD CRUDE OIL TR™ OR THE S&P GSCI CRUDE OIL INDEX TR. THE VARIOUS STATISTICAL MEASURES AND ANNUALIZED INDEX LEVELS SHOWN ABOVE DO NOT REPRESENT THE FUND’S PERFORMANCE AND ARE NOT INDICATIVE OF THE FUND’S FUTURE PERFORMANCE.
Please refer to the “Notes” section below.
[Remainder of page left blank intentionally.]
-58-
Table of Contents
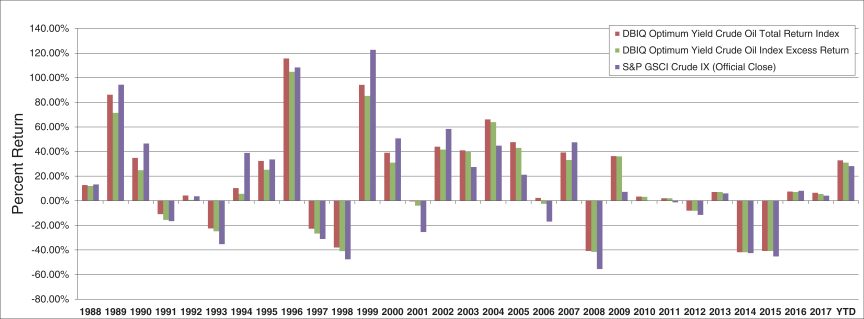
The following tables present additional information regarding the Index, DBIQ Optimum Yield Crude Oil TRTM and S&P GSCI Crude Oil Index TR.
COMPARISON OF DBIQ OPTIMUM YIELD CRUDE OIL INDEX TOTAL RETURN™, DBIQ OPTIMUM YIELD CRUDE OIL
INDEX EXCESS RETURN™ AND S&P GSCI CRUDE Oil Index TR (OFFICIAL CLOSE)
(December 2, 1988 — September 28, 2018)

THE FUND TRACKS ONLY ITS OWN INDEX, DBIQ OPTIMUM YIELD CRUDE OIL ERTM. THE PRIOR INDEX LEVELS SHOWN ABOVE DO NOT REPRESENT THE FUND’S PERFORMANCE AND ARE NOT INDICATIVE OF THE FUND’S FUTURE PERFORMANCE. THE INDEXES SHOWN DO NOT REFLECT ANY FEES OR EXPENSES ASSOCIATED WITH OPERATING A FUND OR ACTUAL TRADING.
[Remainder of page left blank intentionally.]
-59-
Table of Contents
COMPARISON OF DBIQ OPTIMUM YIELD CRUDE OIL INDEX TOTAL RETURN™, DBIQ OPTIMUM YIELD CRUDE OIL INDEX
EXCESS RETURN™ AND S&P GSCI CRUDE Oil Index TR (OFFICIAL CLOSE)
(December 2, 1988 — September 28, 2018)
THE FUND TRACKS ONLY ITS OWN INDEX, DBIQ OPTIMUM YIELD CRUDE OIL ERTM. THE PRIOR INDEX LEVELS SHOWN ABOVE DO NOT REPRESENT THE FUND’S PERFORMANCE AND ARE NOT INDICATIVE OF THE FUND’S FUTURE PERFORMANCE. THE INDEXES SHOWN DO NOT REFLECT ANY FEES OR EXPENSES ASSOCIATED WITH OPERATING A FUND OR ACTUAL TRADING.
[Remainder of page left blank intentionally.]
-60-
Table of Contents
PRECIOUS METALS SECTOR DATA
RELATING TO
DBIQ OPTIMUM YIELD PRECIOUS METALS INDEX EXCESS RETURN™
(DBIQ-OY PRECIOUS METALS ER™)
-61-
Table of Contents
CLOSING LEVELS TABLES
DBIQ OPTIMUM YIELD PRECIOUS METALS INDEX EXCESS RETURN™
| CLOSING LEVEL | INDEX CHANGES | |||||||||||||||
| High1 | Low2 | Annual3 | Since Inception4 | |||||||||||||
| 2008 |
111.75 | 70.48 | -4.17 | % | -11.67 | % | ||||||||||
| 2009 |
125.88 | 80.96 | 27.73 | % | 12.83 | % | ||||||||||
| 2010 |
156.43 | 106.48 | 38.64 | % | 56.43 | % | ||||||||||
| 2011 |
209.23 | 142.98 | 5.13 | % | 64.46 | % | ||||||||||
| 2012 |
193.25 | 160.55 | 6.30 | % | 74.82 | % | ||||||||||
| 2013 |
178.48 | 120.93 | -30.30 | % | 21.85 | % | ||||||||||
| 2014 |
138.62 | 111.68 | -5.55 | % | 15.08 | % | ||||||||||
| 2015 |
128.14 | 101.26 | -11.19 | % | 2.20 | % | ||||||||||
| 2016 |
135.49 | 103.07 | 8.76 | % | 11.15 | % | ||||||||||
| 2017 |
127.78 | 112.51 | 10.75 | % | 23.10 | % | ||||||||||
| 20185 |
128.01 | 107.74 | 11.47 | % | 8.98 | % | ||||||||||
THE PRIOR INDEX LEVELS AND CHANGES TO THE INDEX LEVELS SHOWN ABOVE DO NOT REPRESENT THE FUND’S PERFORMANCE AND ARE NOT INDICATIVE OF THE FUND’S FUTURE PERFORMANCE. THE INDEX SHOWN DOES NOT REFLECT ANY FEES OR EXPENSES ASSOCIATED WITH OPERATING A FUND OR ACTUAL TRADING.
Please refer to the “Notes” section below.
[Remainder of page left blank intentionally.]
-62-
Table of Contents
The Index Sponsor also maintains a separate index, DBIQ Optimum Yield Precious Metals Index Total Return (“DBIQ Optimum Yield Precious Metals TR™”) which the Fund does not track. DBIQ Optimum Yield Precious Metals TR™ is calculated on a funded (total return) basis, which reflects the change in market value of the underlying index commodities and interest income from a notional basket of fixed income securities. DBIQ Optimum Yield Precious Metals TR™ is included so that investors can evaluate an index with both futures and income components, as the particular Fund tracks the Index and expects to generate income from positions in Treasury Securities, money market funds, and/or T-Bill ETFs that are maintained for margin and/or cash management purposes.
DBIQ OPTIMUM YIELD PRECIOUS METALS INDEX TOTAL RETURN™
| CLOSING LEVEL | INDEX CHANGES | |||||||||||||||
| High1 | Low2 | Annual3 | Since Inception4 | |||||||||||||
| 2008 |
260.94 | 166.06 | -2.83 | % | 108.15 | % | ||||||||||
| 2009 |
297.04 | 190.78 | 27.92 | % | 166.26 | % | ||||||||||
| 2010 |
369.64 | 251.28 | 38.83 | % | 269.64 | % | ||||||||||
| 2011 |
494.63 | 337.88 | 5.18 | % | 288.80 | % | ||||||||||
| 2012 |
456.90 | 379.70 | 6.39 | % | 313.64 | % | ||||||||||
| 2013 |
422.32 | 286.27 | -30.26 | % | 188.46 | % | ||||||||||
| 2014 |
328.18 | 264.46 | -5.53 | % | 172.52 | % | ||||||||||
| 2015 |
303.44 | 239.89 | -11.15 | % | 142.13 | % | ||||||||||
| 2016 |
321.53 | 244.20 | 9.10 | % | 164.18 | % | ||||||||||
| 2017 |
305.45 | 267.43 | 11.78 | % | 195.31 | % | ||||||||||
| 20185 |
307.43 | 261.94 | -10.25 | % | 165.04 | % | ||||||||||
THE FUND DOES NOT TRACK DBIQ OPTIMUM YIELD PRECIOUS METALS INDEX TOTAL RETURN™. THE PRIOR INDEX LEVELS AND CHANGES TO THE INDEX LEVELS SHOWN ABOVE DO NOT REPRESENT THE FUND’S PERFORMANCE AND ARE NOT INDICATIVE OF THE FUND’S FUTURE PERFORMANCE. THE INDEX SHOWN DOES NOT REFLECT ANY FEES OR EXPENSES ASSOCIATED WITH OPERATING A FUND OR ACTUAL TRADING.
Please refer to the “Notes” section below.
[Remainder of page left blank intentionally.]
-63-
Table of Contents
The following table presents various measures of performance for the Index (“DBIQ Optimum Yield Precious Metals ERTM”), DBIQ Optimum Yield Precious Metals TRTM, and S&P GSCI Precious Metals Index Total Return (“S&P GSCI Precious Metals Index TR”), which is a broad-based commodity index. The S&P GSCI Precious Metals Index TR has been included to provide investors with an additional basis for evaluating the Fund.
All statistics based on data from December 2, 1988 to September 28, 2018.
| VARIOUS STATISTICAL MEASURES | DBIQ Optimum Yield Precious Metals ER |
DBIQ Optimum Yield Precious Metals TR |
S&P GSCI Precious Metals Index TR |
|||||||||||||||||
| Annualized Changes to Index Level6 |
0.3% | 3.3% | 3.5% | |||||||||||||||||
| Average rolling 3 month daily volatility7 |
16.1% | 16.1% | 15.4% | |||||||||||||||||
| Sharpe Ratio8 |
0.02 | 0.02 | 0.03 | |||||||||||||||||
| % of months with positive change9 |
46% | 50% | 51% | |||||||||||||||||
| Average monthly positive change10 |
4.1% | 4.1% | 3.8% | |||||||||||||||||
| Average monthly negative change11 |
-3.3% | -3.3% | -3.1% | |||||||||||||||||
| ANNUALIZED INDEX LEVELS12 | DBIQ Optimum Yield Precious Metals ER |
DBIQ Optimum Yield Precious Metals TR |
S&P GSCI Precious Metals Index TR |
|||||||||||||||||
| 1 year |
-9.8% | -8.3% | -8.2% | |||||||||||||||||
| 3 year |
0.4% | 1.3% | 1.3% | |||||||||||||||||
| 5 year |
-4.2% | -3.7% | -3.4% | |||||||||||||||||
| 7 year |
-6.3% | -5.9% | -5.6% | |||||||||||||||||
| 10 year |
1.9% | 2.3% | 2.2% | |||||||||||||||||
| 15 year |
5.9% | 7.2% | 6.9% | |||||||||||||||||
THE FUND DOES NOT TRACK DBIQ OPTIMUM YIELD PRECIOUS METALS TR™ OR THE S&P GSCI PRECIOUS METALS INDEX TR. THE VARIOUS STATISTICAL MEASURES AND ANNUALIZED INDEX LEVELS SHOWN ABOVE DO NOT REPRESENT THE FUND’S PERFORMANCE AND ARE NOT INDICATIVE OF THE FUND’S FUTURE PERFORMANCE.
Please refer to the “Notes” section below.
[Remainder of page left blank intentionally.]
-64-
Table of Contents
The following tables present additional information regarding the Index, DBIQ Optimum Yield Precious Metals TRTM and S&P GSCI Precious Metals Index TR.
COMPARISON OF DBIQ OPTIMUM YIELD PRECIOUS METALS INDEX TOTAL RETURN™, DBIQ OPTIMUM YIELD PRECIOUS
METALS INDEX EXCESS RETURN™ AND S&P GSCI PRECIOUS METALS INDEX TR
(December 2, 1988 — September 28, 2018)

THE FUND TRACKS ONLY ITS OWN INDEX, DBIQ OPTIMUM YIELD PRECIOUS METALS ERTM. THE PRIOR INDEX LEVELS SHOWN ABOVE DO NOT REPRESENT THE FUND’S PERFORMANCE AND ARE NOT INDICATIVE OF THE FUND’S FUTURE PERFORMANCE. THE INDEXES SHOWN DO NOT REFLECT ANY FEES OR EXPENSES ASSOCIATED WITH OPERATING A FUND OR ACTUAL TRADING.
[Remainder of page left blank intentionally.]
-65-
Table of Contents
COMPARISON OF DBIQ OPTIMUM YIELD PRECIOUS METALS INDEX TOTAL RETURN™, DBIQ OPTIMUM YIELD PRECIOUS
METALS INDEX EXCESS RETURN™ AND S&P GSCI PRECIOUS METALS INDEX TR
(December 2, 1988 — September 28, 2018)

THE FUND TRACKS ONLY ITS OWN INDEX, DBIQ OPTIMUM YIELD PRECIOUS METALS ERTM. THE PRIOR INDEX LEVELS SHOWN ABOVE DO NOT REPRESENT THE FUND’S PERFORMANCE AND ARE NOT INDICATIVE OF THE FUND’S FUTURE PERFORMANCE. THE INDEXES SHOWN DO NOT REFLECT ANY FEES OR EXPENSES ASSOCIATED WITH OPERATING A FUND OR ACTUAL TRADING.
[Remainder of page left blank intentionally.]
-66-
Table of Contents
GOLD SECTOR DATA
RELATING TO
DBIQ OPTIMUM YIELD GOLD INDEX EXCESS RETURN™
(DBIQ-OY GC ER™)
-67-
Table of Contents
CLOSING LEVELS TABLES
DBIQ OPTIMUM YIELD GOLD INDEX EXCESS RETURN™
| CLOSING LEVEL | INDEX CHANGES | |||||||||||||||
| High1 | Low2 | Annual3 | Since Inception4 | |||||||||||||
| 2008 |
102.34 | 70.49 | 1.73 | % | -11.99 | % | ||||||||||
| 2009 |
120.07 | 80.47 | 22.77 | % | 8.05 | % | ||||||||||
| 2010 |
139.11 | 103.64 | 28.75 | % | 39.11 | % | ||||||||||
| 2011 |
183.97 | 128.88 | 9.42 | % | 52.22 | % | ||||||||||
| 2012 |
173.42 | 148.72 | 6.01 | % | 61.38 | % | ||||||||||
| 2013 |
163.03 | 114.17 | -28.75 | % | 14.99 | % | ||||||||||
| 2014 |
131.79 | 108.91 | -1.88 | % | 12.82 | % | ||||||||||
| 2015 |
123.95 | 99.59 | -10.86 | % | 0.57 | % | ||||||||||
| 2016 |
129.41 | 101.72 | 7.27 | % | 7.88 | % | ||||||||||
| 2017 |
124.92 | 107.88 | 12.12 | % | 20.96 | % | ||||||||||
| 20185 |
126.04 | 107.34 | -10.41 | % | 8.37 | % | ||||||||||
THE PRIOR INDEX LEVELS AND CHANGES TO THE INDEX LEVELS SHOWN ABOVE DO NOT REPRESENT THE FUND’S PERFORMANCE AND ARE NOT INDICATIVE OF THE FUND’S FUTURE PERFORMANCE. THE INDEX DOES NOT REFLECT ANY FEES OR EXPENSES ASSOCIATED WITH OPERATING A FUND OR ACTUAL TRADING.
Please refer to the “Notes” section below.
[Remainder of page left blank intentionally.]
-68-
Table of Contents
The Index Sponsor also maintains a separate index, DBIQ Optimum Yield Gold Index Total Return (“DBIQ Optimum Yield Gold TR™”) which the Fund does not track. DBIQ Optimum Yield Gold TR™ is calculated on a funded (total return) basis, which reflects the change in market value of the underlying index commodities and interest income from a notional basket of fixed income securities. DBIQ Optimum Yield Gold TR™ is included so that investors can evaluate an index with both futures and income components, as the particular Fund tracks the Index and expects to generate income from positions in Treasury Securities, money market funds, and/or T-Bill ETFs that are maintained for margin and/or cash management purposes.
DBIQ OPTIMUM YIELD GOLD INDEX TOTAL RETURN™
| CLOSING LEVEL | INDEX CHANGES | |||||||||||||||
| High1 | Low2 | Annual3 | Since Inception4 | |||||||||||||
| 2008 |
238.99 | 166.08 | 3.15 | % | 107.38 | % | ||||||||||
| 2009 |
283.32 | 189.63 | 22.95 | % | 154.97 | % | ||||||||||
| 2010 |
328.71 | 244.58 | 28.92 | % | 228.71 | % | ||||||||||
| 2011 |
434.91 | 304.57 | 9.48 | % | 259.86 | % | ||||||||||
| 2012 |
410.02 | 351.68 | 6.10 | % | 281.82 | % | ||||||||||
| 2013 |
385.77 | 270.26 | -28.71 | % | 172.22 | % | ||||||||||
| 2014 |
312.03 | 257.90 | -1.85 | % | 167.17 | % | ||||||||||
| 2015 |
239.51 | 235.93 | -10.82 | % | 138.26 | % | ||||||||||
| 2016 |
307.02 | 241.02 | 7.62 | % | 156.41 | % | ||||||||||
| 2017 |
298.60 | 256.42 | 13.17 | % | 190.18 | % | ||||||||||
| 20185 |
302.69 | 260.40 | -9.17 | % | 163.56 | % | ||||||||||
THE FUND DOES NOT TRACK DBIQ OPTIMUM YIELD GOLD INDEX TOTAL RETURN™. THE PRIOR INDEX LEVELS AND CHANGES TO THE INDEX LEVELS SHOWN ABOVE DO NOT REPRESENT THE FUND’S PERFORMANCE AND ARE NOT INDICATIVE OF THE FUND’S FUTURE PERFORMANCE. THE INDEX SHOWN DOES NOT REFLECT ANY FEES OR EXPENSES ASSOCIATED WITH OPERATING A FUND OR ACTUAL TRADING.
Please refer to the “Notes” section below.
[Remainder of page left blank intentionally.]
-69-
Table of Contents
The following table presents various measures of performance for the Index (“DBIQ Optimum Yield Gold ERTM”), DBIQ Optimum Yield Gold TRTM, and the spot price of gold (“Gold Spot Fix pm”). The Gold Spot Fix pm has been included to provide investors with an additional basis for evaluating the Fund.
All statistics based on data from December 2, 1988 to September 28, 2018.
| VARIOUS STATISTICAL MEASURES | DBIQ Optimum Yield Gold ER |
DBIQ Optimum Yield Gold TR |
Gold Spot Fix pm |
|||||||||||||||||
| Annualized Changes to Index Level6 |
0.3% | 3.3% | 3.5% | |||||||||||||||||
| Average rolling 3 month daily volatility7 |
14.8% | 14.8% | 14.4% | |||||||||||||||||
| Sharpe Ratio8 |
0.02 | 0.02 | 0.03 | |||||||||||||||||
| % of months with positive change9 |
46% | 49% | 52% | |||||||||||||||||
| Average monthly positive change10 |
3.8% | 3.8% | 3.6% | |||||||||||||||||
| Average monthly negative change11 |
-3.1% | -2.9% | -3.1% | |||||||||||||||||
| ANNUALIZED INDEX LEVELS12 | DBIQ Optimum Yield Gold ER |
DBIQ Optimum Yield Gold TR |
Gold Spot Fix pm |
|||||||||||||||||
| 1 year |
-8.8% | -7.3% | -7.5% | |||||||||||||||||
| 3 year |
0.8% | 1.7% | 2.1% | |||||||||||||||||
| 5 year |
-3.1% | -2.6% | -2.2% | |||||||||||||||||
| 7 year |
-5.2% | -4.8% | -4.3% | |||||||||||||||||
| 10 year |
2.1% | 2.4% | 3.0% | |||||||||||||||||
| 15 year |
5.7% | 7.0% | 7.7% | |||||||||||||||||
THE FUND DOES NOT TRACK DBIQ OPTIMUM YIELD GOLD TR™ OR THE GOLD SPOT FIX PM. THE VARIOUS STATISTICAL MEASURES AND ANNUALIZED INDEX LEVELS SHOWN ABOVE DO NOT REPRESENT THE FUND’S PERFORMANCE AND ARE NOT INDICATIVE OF THE FUND’S FUTURE PERFORMANCE.
Please refer to the “Notes” section below.
[Remainder of page left blank intentionally.]
-70-
Table of Contents
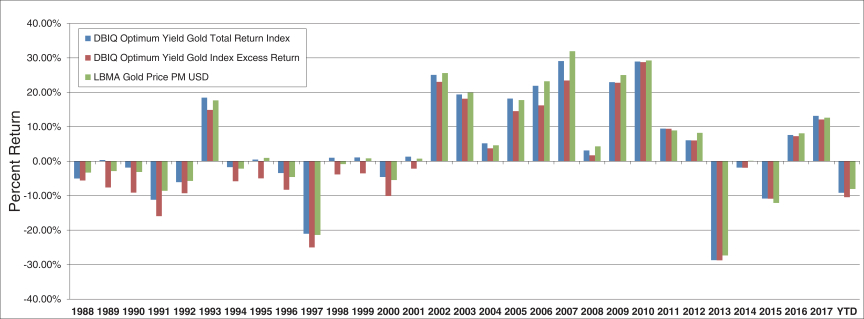
The following tables present additional information regarding the Index, DBIQ Optimum Yield Gold TRTM and Gold Spot Fix pm.
COMPARISON OF DBIQ OPTIMUM YIELD GOLD INDEX TOTAL RETURN™, DBIQ OPTIMUM YIELD GOLD INDEX EXCESS
RETURN™ AND GOLD SPOT FIX PM
(December 2, 1988 — September 28, 2018)

THE FUND TRACKS ONLY ITS OWN INDEX, DBIQ OPTIMUM YIELD GOLD ERTM. THE PRIOR INDEX LEVELS SHOWN ABOVE DO NOT REPRESENT THE FUND’S PERFORMANCE AND ARE NOT INDICATIVE OF THE FUND’S FUTURE PERFORMANCE. THE INDEXES SHOWN DO NOT REFLECT ANY FEES OR EXPENSES ASSOCIATED WITH OPERATING A FUND OR ACTUAL TRADING.
[Remainder of page left blank intentionally.]
-71-
Table of Contents
COMPARISON OF DBIQ OPTIMUM YIELD GOLD INDEX TOTAL RETURN™, DBIQ OPTIMUM YIELD GOLD INDEX EXCESS
RETURN™ AND GOLD SPOT FIX PM
(December 2, 1988 — September 28, 2018)
THE FUND TRACKS ONLY ITS OWN INDEX, DBIQ OPTIMUM YIELD GOLD ERTM. THE PRIOR INDEX LEVELS SHOWN ABOVE DO NOT REPRESENT THE FUND’S PERFORMANCE AND ARE NOT INDICATIVE OF THE FUND’S FUTURE PERFORMANCE. THE INDEXES SHOWN DO NOT REFLECT ANY FEES OR EXPENSES ASSOCIATED WITH OPERATING A FUND OR ACTUAL TRADING.
[Remainder of page left blank intentionally.]
-72-
Table of Contents
INDUSTRIAL METALS SECTOR DATA
RELATING TO
DBIQ OPTIMUM YIELD INDUSTRIAL METALS INDEX EXCESS RETURN™
(DBIQ-OY INDUSTRIAL METALS ER™)
-73-
Table of Contents
CLOSING LEVELS TABLES
DBIQ OPTIMUM YIELD INDUSTRIAL METALS INDEX EXCESS RETURN™
| CLOSING LEVEL | INDEX CHANGES | |||||||||||||||
| High1 | Low2 | Annual3 | Since Inception4 | |||||||||||||
| 2008 |
277.42 | 113.65 | -45.29 | % | 21.06 | % | ||||||||||
| 2009 |
228.32 | 111.76 | 88.53 | % | 128.23 | % | ||||||||||
| 2010 |
248.13 | 173.48 | 8.72 | % | 148.13 | % | ||||||||||
| 2011 |
261.54 | 184.74 | -22.19 | % | 93.08 | % | ||||||||||
| 2012 |
221.47 | 180.37 | 2.85 | % | 98.58 | % | ||||||||||
| 2013 |
205.25 | 166.93 | -11.26 | % | 76.22 | % | ||||||||||
| 2014 |
189.16 | 162.19 | -3.73 | % | 69.66 | % | ||||||||||
| 2015 |
179.14 | 122.14 | -24.82 | % | 27.55 | % | ||||||||||
| 2016 |
173.49 | 118.58 | 26.71 | % | 61.63 | % | ||||||||||
| 2017 |
210.62 | 159.97 | 29.71 | % | 109.65 | % | ||||||||||
| 20185 |
214.40 | 166.94 | -14.66 | % | 78.91 | % | ||||||||||
THE PRIOR INDEX LEVELS AND CHANGES TO THE INDEX LEVELS SHOWN ABOVE DO NOT REPRESENT THE FUND’S PERFORMANCE AND ARE NOT INDICATIVE OF THE FUND’S FUTURE PERFORMANCE. THE INDEX SHOWN DOES NOT REFLECT ANY FEES OR EXPENSES ASSOCIATED WITH OPERATING A FUND OR ACTUAL TRADING.
Please refer to the “Notes” section below.
[Remainder of page left blank intentionally.]
-74-
Table of Contents
The Index Sponsor also maintains a separate index, DBIQ Optimum Yield Industrial Metals Index Total Return (“DBIQ Optimum Yield Industrial Metals TR™”) which the Fund does not track. DBIQ Optimum Yield Industrial Metals TR™ is calculated on a funded (total return) basis, which reflects the change in market value of the underlying index commodities and interest income from a notional basket of fixed income securities. DBIQ Optimum Yield Industrial Metals TR™ is included so that investors can evaluate an index with both futures and income components, as the particular Fund tracks the Index and expects to generate income from positions in Treasury Securities, money market funds, and/or T-Bill ETFs that are maintained for margin and/or cash management purposes.
DBIQ OPTIMUM YIELD INDUSTRIAL METALS INDEX TOTAL RETURN™
| CLOSING LEVEL | INDEX CHANGES | |||||||||||||||
| High1 | Low2 | Annual3 | Since Inception4 | |||||||||||||
| 2008 |
404.06 | 167.11 | -44.52 | % | 78.00 | % | ||||||||||
| 2009 |
336.19 | 164.37 | 88.80 | % | 236.06 | % | ||||||||||
| 2010 |
365.85 | 255.58 | 8.87 | % | 265.85 | % | ||||||||||
| 2011 |
385.74 | 272.52 | -22.15 | % | 184.82 | % | ||||||||||
| 2012 |
326.71 | 266.17 | 2.94 | % | 193.18 | % | ||||||||||
| 2013 |
303.03 | 246.58 | -11.21 | % | 160.32 | % | ||||||||||
| 2014 |
279.49 | 239.60 | -3.70 | % | 150.69 | % | ||||||||||
| 2015 |
264.72 | 180.55 | -24.78 | % | 88.57 | % | ||||||||||
| 2016 |
257.17 | 175.31 | 27.11 | % | 139.70 | % | ||||||||||
| 2017 |
315.28 | 237.25 | 30.93 | % | 213.84 | % | ||||||||||
| 20185 |
322.50 | 252.70 | -13.49 | % | 171.50 | % | ||||||||||
THE FUND DOES NOT TRACK DBIQ OPTIMUM YIELD INDUSTRIAL METALS INDEX TOTAL RETURN™. THE PRIOR INDEX LEVELS AND CHANGES TO THE INDEX LEVELS SHOWN ABOVE DO NOT REPRESENT THE FUND’S PERFORMANCE AND ARE NOT INDICATIVE OF THE FUND’S FUTURE PERFORMANCE. THE INDEX SHOWN DOES NOT REFLECT ANY FEES OR EXPENSES ASSOCIATED WITH OPERATING A FUND OR ACTUAL TRADING.
Please refer to the “Notes” section below.
[Remainder of page left blank intentionally.]
-75-
Table of Contents
The following table presents various measures of performance for the Index (“DBIQ Optimum Yield Industrial Metals ERTM”), DBIQ Optimum Yield Industrial Metals TRTM, and S&P GSCI Industrial Metals Index Total Return (“S&P GSCI Industrial Metals Index TR”), which is a broad-based commodity index. The S&P GSCI Industrial Metals Index TR has been included to provide investors with an additional basis for evaluating the Fund.
All statistics based on data from September 3, 1997 to September 28, 2018.
| VARIOUS STATISTICAL MEASURES | DBIQ Optimum Yield Industrial Metals ER |
DBIQ Optimum Yield Industrial Metals TR |
S&P GSCI Industrial Metals Index TR |
|||||||||||||||||
| Annualized Changes to Index Level6 |
2.8% | 4.9% | 3.1% | |||||||||||||||||
| Average rolling 3 month daily volatility7 |
19.5% | 19.5% | 20.2% | |||||||||||||||||
| Sharpe Ratio8 |
0.14 | 0.15 | 0.05 | |||||||||||||||||
| % of months with positive change9 |
51% | 53% | 53% | |||||||||||||||||
| Average monthly positive change10 |
4.8% | 4.8% | 4.6% | |||||||||||||||||
| Average monthly negative change11 |
-4.1% | -4.1% | -4.4% | |||||||||||||||||
| ANNUALIZED INDEX LEVELS12 | DBIQ Optimum Yield Industrial Metals ER |
DBIQ Optimum Yield Industrial Metals TR |
S&P GSCI Industrial Metals Index TR |
|||||||||||||||||
| 1 year |
-8.5% | -7.0% | -3.7% | |||||||||||||||||
| 3 year |
9.4% | 10.4% | 7.7% | |||||||||||||||||
| 5 year |
0.4% | 0.9% | -1.4% | |||||||||||||||||
| 7 year |
-1.1% | -0.7% | -2.5% | |||||||||||||||||
| 10 year |
-0.9% | -0.6% | -2.5% | |||||||||||||||||
| 15 year |
7.3% | 8.6% | 5.7% | |||||||||||||||||
THE FUND DOES NOT TRACK DBIQ OPTIMUM YIELD INDUSTRIAL METALS TR™ OR THE S&P GSCI INDUSTRIAL METALS INDEX TR. THE VARIOUS STATISTICAL MEASURES AND ANNUALIZED INDEX LEVELS SHOWN ABOVE DO NOT REPRESENT THE FUND’S PERFORMANCE AND ARE NOT INDICATIVE OF THE FUND’S FUTURE PERFORMANCE.
Please refer to the “Notes” section below.
[Remainder of page left blank intentionally.]
-76-
Table of Contents
The following tables present additional information regarding the Index, DBIQ Optimum Yield Industrial Metals TRTM and S&P GSCI Industrial Metals Index TR.
COMPARISON OF DBIQ OPTIMUM YIELD INDUSTRIAL METALS INDEX TOTAL RETURN™, DBIQ OPTIMUM YIELD INDUSTRIAL METALS INDEX EXCESS RETURN™ AND S&P GSCI INDUSTRIAL METALS INDEX TR
(September 3, 1997 — September 28, 2018)

THE FUND TRACKS ONLY ITS OWN INDEX, DBIQ OPTIMUM YIELD INDUSTRIAL METALS ERTM. THE PRIOR INDEX LEVELS SHOWN ABOVE DO NOT REPRESENT THE FUND’S PERFORMANCE AND ARE NOT INDICATIVE OF THE FUND’S FUTURE PERFORMANCE. THE INDEXES SHOWN DO NOT REFLECT ANY FEES OR EXPENSES ASSOCIATED WITH OPERATING A FUND OR ACTUAL TRADING.
[Remainder of page left blank intentionally.]
-77-
Table of Contents
COMPARISON OF DBIQ OPTIMUM YIELD INDUSTRIAL METALS INDEX TOTAL RETURN™, DBIQ OPTIMUM YIELD INDUSTRIAL
METALS INDEX EXCESS RETURN™ AND S&P GSCI INDUSTRIAL METALS INDEX TR
(September 3, 1997 — September 28, 2018)

THE FUND TRACKS ONLY ITS OWN INDEX, DBIQ OPTIMUM YIELD INDUSTRIAL METALS ERTM. THE PRIOR INDEX LEVELS SHOWN ABOVE DO NOT REPRESENT THE FUND’S PERFORMANCE AND ARE NOT INDICATIVE OF THE FUND’S FUTURE PERFORMANCE. THE INDEXES SHOWN DO NOT REFLECT ANY FEES OR EXPENSES ASSOCIATED WITH OPERATING A FUND OR ACTUAL TRADING.
[Remainder of page left blank intentionally.]
-78-
Table of Contents
NOTES:
1. “High” reflects the highest closing level of the Index during the applicable year.
2. “Low” reflects the lowest closing level of the Index during the applicable year.
3. “Annual Index Changes” reflect the change to the Index level on an annual basis as of December 31 of each applicable year.
4. “Index Changes Since Inception” reflects the change of the Index level since inception on a compounded annual basis as of December 31 of each applicable year.
5. Closing levels as of September 28, 2018.
6. “Annualized Changes to Index Level” reflect the change to the applicable index level on an annual basis as of December 31 of each applicable year.
7. “Average rolling 3 month daily volatility.” The daily volatility reflects the relative rate at which the price of the applicable index moves up and down, which is found by calculating the annualized standard deviation of the daily change in price. In turn, an average of this value is calculated on a 3 month rolling basis.
8 “Sharpe Ratio” compares the annualized rate of return minus the annualized risk-free rate of return to the annualized variability – often referred to as the “standard deviation” – of the monthly rates of return. A Sharpe Ratio of 1:1 or higher indicates that, according to the measures used in calculating the ratio, the rate of return achieved by a particular strategy has equaled or exceeded the risks assumed by such strategy. The risk-free rates of return that were used in these calculations for the indexes with respect to the Invesco DB Energy Fund, Invesco DB Oil Fund, Invesco DB Precious Metals Fund, Invesco DB Gold Fund and Invesco DB Base Metals Fund were assumed to be 2.75%, 3.03%, 3.03%, 3.03% and 2.01%, respectively.
9. “% of months with positive change” during the period from inception to September 28, 2018.
10. “Average monthly positive change” during the period from inception to September 28, 2018.
11. “Average monthly negative change” during the period from inception to September 28, 2018.
12. “Annualized Index Levels” reflect the change to the level of the applicable index on an annual basis as of December 31 of each applicable time period (e.g., one year, three, five or seven years, as applicable).
-79-
Table of Contents
-80-
Table of Contents
-81-
Table of Contents
-82-
Table of Contents
-83-
Table of Contents
-84-
Table of Contents
-85-
Table of Contents
-86-
Table of Contents
-87-
Table of Contents
-88-
Table of Contents
-89-
Table of Contents
-90-
Table of Contents
-91-
Table of Contents
-92-
Table of Contents
-93-
Table of Contents
-94-
Table of Contents
-95-
Table of Contents
-96-
Table of Contents
-97-
Table of Contents
-98-
Table of Contents
-99-
Table of Contents
-100-
Table of Contents
-101-
Table of Contents
-102-
Table of Contents
-103-
Table of Contents
-104-
Table of Contents
-105-
Table of Contents
-106-
Table of Contents
-107-
Table of Contents
-108-
Table of Contents
-109-
Table of Contents
-110-
Table of Contents
-111-
Table of Contents
-112-
Table of Contents
-113-
Table of Contents
-114-
Table of Contents
-115-
Table of Contents
-116-
Table of Contents
-117-
Table of Contents
-118-
Table of Contents
-119-
Table of Contents
-120-
Table of Contents
-121-
Table of Contents
-122-
Table of Contents
-123-
Table of Contents
-124-
Table of Contents
-125-
Table of Contents
-126-
Table of Contents
-127-
Table of Contents
-128-
Table of Contents
-129-
Table of Contents
Summary of Items of Value Paid Pursuant to FINRA Rule 2310
| Nature of Payment | Recipient | Payor | Amount of Payment | Services Provided | ||||||
| Selling Commission | Authorized |
Shareholders |
No greater than 0.99% of the gross offering proceeds. |
Brokering purchases and sales of the Shares and creating and redeeming Baskets. | ||||||
| Distribution Services Fee | Invesco |
Managing |
Capped at $25,000 per Fund, per annum, not to exceed 0.25% of the gross offering proceeds. |
Assisting the Managing Owner with certain functions and duties relating to distribution and marketing, including reviewing and approving marketing materials, consulting with FINRA and ensuring compliance with FINRA marketing rules and maintaining certain books and records pertaining to the Trust and each Fund. | ||||||
| Marketing Services Fee | Marketing |
Managing |
A range from 0.05% — 0.345% per annum of the Total Average Net Assets (as defined herein) during each year calculated in U.S. dollars; not to exceed 8.75% of the gross offering proceeds. |
Assisting the Managing Owner by providing support to educate institutional investors about the Deutsche Bank indices and to complete governmental or institutional due diligence questionnaires or requests for proposals related to the Deutsche Bank indices. |
-130-
Table of Contents
-131-
Table of Contents
-132-
Table of Contents
-133-
Table of Contents
PART TWO
STATEMENT OF ADDITIONAL INFORMATION
INVESCO DB MULTI-SECTOR COMMODITY TRUST
Invesco DB Energy Fund
Invesco DB Oil Fund
Invesco DB Precious Metals Fund
Invesco DB Gold Fund
Invesco DB Base Metals Fund
Shares of Beneficial Interest
The Shares are speculative securities which involve the risk of loss.
Past performance is not necessarily indicative of future results.
See “Risk Factors” beginning at page 15 in Part One.
THIS PROSPECTUS IS IN TWO PARTS:
A DISCLOSURE DOCUMENT AND A STATEMENT OF ADDITIONAL INFORMATION.
THESE PARTS ARE BOUND TOGETHER, AND BOTH CONTAIN
IMPORTANT INFORMATION. YOU MUST READ THE
STATEMENT OF ADDITIONAL INFORMATION
IN CONJUNCTION WITH THE
DISCLOSURE DOCUMENT.
December 13, 2018
Invesco Capital Management LLC
Managing Owner
-134-
Table of Contents
-135-
Table of Contents
-136-
Table of Contents
-137-
Table of Contents
-138-