UNITED STATES
SECURITIES AND EXCHANGE COMMISSION
Washington, D.C. 20549
FORM 10-K
ANNUAL REPORT PURSUANT TO SECTION 13 OR 15(d) OF THE SECURITIES EXCHANGE ACT OF 1934 | |
For the fiscal year ended January 31, 2020
OR
TRANSITION REPORT PURSUANT TO SECTION 13 OR 15(d) OF THE SECURITIES EXCHANGE ACT OF 1934 | |
Commission File No. 001-38464
(Exact name of Registrant as specified in its charter)
(State or other jurisdiction of incorporation or organization) | (I.R.S. Employer Identification Number) | ||
(Address of principal executive offices) | (Zip Code) | ||
Registrant’s telephone number, including area code | |||
Securities registered pursuant to Section 12(b) of the Act:
Title of each class | Trading Symbol(s) | Name of each exchange on which registered |
Securities registered pursuant to Section 12(g) of the Act:
None. |
(Title of Class) |
Indicate by check mark if the registrant is a well-known seasoned issuer, as defined in Rule 405 of the Securities Act. Yes ☐ No ☒
Indicate by check mark if the registrant is not required to file reports pursuant to Section 13 or 15(d) of the Act. Yes ☐ No ☒
Indicate by check mark whether the registrant (1) has filed all reports required to be filed by Section 13 or 15(d) of the Securities Exchange Act of 1934 during the preceding 12 months, (or for such shorter period that the registrant was required to file such reports), and (2) has been subject to such filing requirements for the past 90 days. Yes ☒ No ☐
Indicate by check mark whether the registrant has submitted electronically every Interactive Data File required to be submitted pursuant to Rule 405 of Regulation S-T (§232.405 of this chapter) during the preceding 12 months (or for such shorter period that the registrant was required to submit such files). Yes ☒ No ☐
Indicate by check mark whether the registrant is a large accelerated filer, an accelerated filer, a non-accelerated filer, a smaller reporting company or an emerging growth company. See the definitions of “large accelerated filer,” “accelerated filer,” “smaller reporting company,” and "emerging growth company" in Rule 12b-2 of the Exchange Act:
☒ | Accelerated filer | ☐ | ||
Non-accelerated filer | ☐ | Smaller reporting company | ||
Emerging growth company | ||||
If an emerging growth company, indicate by check mark if the registrant has elected not to use the extended transition period for complying with any new or revised financial accounting standards provided pursuant to Section 13(a) of the Exchange Act. ☐
Indicate by check mark whether the registrant is a shell company (as defined by Rule 12b-2 of the Exchange Act). Yes ☐ No ☒
The aggregate market value of the stock of the Registrant as of July 31, 2019 (based on a closing price of $49.91 per share) held by non-affiliates was approximately $4.4 billion. As of March 20, 2020, there were 118,833,426 shares of the registrant’s common stock outstanding.
DOCUMENTS INCORPORATED BY REFERENCE
1
SMARTSHEET INC.
Form 10-K
For the Fiscal Year Ended January 31, 2020
TABLE OF CONTENTS | Page | |
PART I | ||
Item 1 | ||
Item 1A | ||
Item 1B | ||
Item 2 | ||
Item 3 | ||
Item 4 | ||
PART II | ||
Item 5 | ||
Item 6 | ||
Item 7 | ||
Item 7A | ||
Item 8 | ||
Item 9 | ||
Item 9A | ||
Item 9B | ||
PART III | ||
Item 10 | ||
Item 11 | ||
Item 12 | ||
Item 13 | ||
Item 14 | ||
PART IV | ||
Item 15 | ||
Item 16 | ||
2
SPECIAL NOTE REGARDING FORWARD-LOOKING STATEMENTS
Unless the context otherwise requires, references in this Annual Report on Form 10-K (“Annual Report”) to “Smartsheet,” “Company,” “our,” “us,” and “we” refer to Smartsheet Inc. and where appropriate, its consolidated subsidiaries.
This Annual Report contains forward-looking statements within the meaning of the “safe harbor” provisions of the Private Securities Litigation Reform Act of 1995. All statements in this Annual Report other than statements of historical fact, including but not limited to, statements regarding our future operating results and financial position, business plan and strategy, and market positioning, are forward-looking statements. We based these forward-looking statements on current expectations, estimates, forecasts, and projections as well as the beliefs and assumptions of management. Words such as “expect,” “anticipate,” “should,” “believe,” “hope,” “target,” “project,” “goals,” “estimate,” “potential,” “predict,” “may,” “will,” “might,” “could,” “intend,” “shall” and variations of these terms or the negative of these terms and similar expressions are intended to identify these forward-looking statements. The forward-looking statements are contained principally in “Management’s Discussion and Analysis of Financial Condition and Result of Operations” and “Risk Factors." Forward-looking statements contained in this Annual Report include, but are not limited to, statements about:
• | the effect of uncertainties related to the current novel COVID-19 coronavirus pandemic (“COVID-19”) on the U.S. and global markets, our business, operations and customers; |
• | the highly competitive nature of work execution software and product introductions, promotional activity by our competitors, and our ability to differentiate our platform and applications; |
• | our ability to introduce new and enhanced product offerings and the continued market adoption of our platform; |
• | the effect of litigation, complaints, or adverse publicity on our business; |
• | our ability to attract new customers and expand sales to existing customers; |
• | our ability to provide effective customer support; |
• | our ability to execute our “land-and-expand” strategy; |
• | the security and reliability of our co-location data centers and the public cloud infrastructure that we use; |
• | our ability to expand our sales force to address effectively the new industries, geographies, and types of organizations we intend to target; |
• | our ability to forecast and maintain an adequate rate of revenue growth and appropriately plan our expenses; |
• | our liquidity and working capital requirements; |
• | our ability to attract and retain qualified employees and key personnel; |
• | our ability to protect and enhance our brand and intellectual property; |
• | the costs related to defending intellectual property infringement and other claims; |
• | privacy and data protection laws, actual or perceived privacy or data breaches, other data security incidents, or the loss of data; |
• | future regulatory, judicial, and legislative changes in our industry; and |
• | future arrangements with, or investments in, other entities or associations, products, services or technologies. |
3
These and other factors that could cause actual results to differ from those implied by the forward-looking statements in this Form 10-K are more fully described in the section titled “Risk Factors” and elsewhere in this Annual Report. The risks described in the section titled “Risk Factors” are not exhaustive. Other sections of this Annual Report describe additional factors that could adversely affect our business, financial condition, or results of operations. New risk factors emerge from time to time and it is not possible for us to predict all such risk factors, nor can we assess the impact of all such risk factors on our business, or the extent to which any factor or combination of factors may cause actual results to differ materially from those contained in any forward-looking statements. All forward-looking statements attributable to us or persons acting on our behalf are expressly qualified in their entirety by the foregoing cautionary statements. We undertake no obligations to update or revise publicly any forward-looking statements, whether as a result of new information, future events, or otherwise.
You should not rely upon forward-looking statements as predictions of future events. Although we believe that the expectations reflected in the forward-looking statements are reasonable, we cannot guarantee that the future results, performance, or events and circumstances reflected in the forward-looking statements will be achieved or will occur. We undertake no obligation to update any of these forward-looking statements for any reason after the date of this Annual Report or to conform these statements to actual results or revised expectations.
You should read this Annual Report and the documents that we reference with the understanding that our actual future results, performance, and events and circumstances may be materially different from what we expect.
4
Part I
Item 1. Business
Overview
We are the platform for enterprise achievement, enabling teams and organizations to plan, capture, manage, automate, and report on work at scale, resulting in more efficient processes and better business outcomes. As of January 31, 2020, over 99,000 customers, including approximately 84,000 domain-based customers, relied on Smartsheet to implement, manage, and automate projects, processes, and initiatives across a broad array of departments and use cases.
The nature of work has changed and the majority of work is unstructured or dynamic. The growing volume and variety of information has complicated the process for executing work across teams that are increasingly multidisciplinary and geographically distributed. Unstructured or dynamic work is work that has historically been managed using a combination of email, spreadsheets, whiteboards, phone calls, and in-person meetings to communicate with team members and complete projects and processes. It is frequently changing, often ad-hoc, and highly reactive to new information. Rigid applications, such as ticketing, enterprise resource planning (“ERP”), or customer relationship management (“CRM”) systems are poorly suited to manage unstructured work. For nearly 30 years, organizations have primarily relied on lightweight tools to manage dynamic or unstructured work. Reliance on these tools limits visibility and accountability, creates information silos that slow decision-making, and results in delays, errors, and suboptimal outcomes.
Business users need technology solutions they can configure and modify on their own. Today, many systems within an enterprise require IT to implement and manage them. Most tools that focus on the business user require some coding knowledge to incorporate business logic for workflows, integrate data from third-party systems, and adapt to changing business needs.
Smartsheet was founded in 2005 with a vision to build a universal application for work execution that does not require coding capabilities. Our platform serves as a single source of truth across work projects, processes, and initiatives and fosters accountability and engagement within teams, leading to more efficient decision-making and better business outcomes. Our platform provides a number of solutions that eliminate the obstacles to capturing information, including a familiar and intuitive spreadsheet interface as well as easily customizable forms. Our reporting and automation capabilities further increase speed by reducing time spent on administration and repetitive work. We make it easy for teams to apply business logic to automate repetitive actions using an extensive list of conditions. Business users, with little or no training, can configure and modify our platform to customize workflows to suit their needs. Our familiar and intuitive user interface and functionality allow users to realize the benefits of our platform without changing the behaviors developed using everyday productivity tools.
People across organizations have similar needs no matter where they work or what they do. They need to manage workflows across teams, gain visibility into progress on company-wide projects and initiatives in real-time, capture inputs, track and report on deliverables, prioritize actions, and provide consistency in processes. Smartsheet is adaptable to manage virtually any type of work. Our customers use Smartsheet for over 2,000 documented use cases, including software migration planning, vendor and contract management, brand launches, compliance reporting, event planning, customer onboarding, budget approvals, patent application processing, talent acquisition, benefit and retirement tracking, sales enablement, pipeline management, sales operations, commissions calculations, marketing programs management, investor relations tracking, and website management, among others.
We have over 99,000 customers, including approximately 84,000 domain-based customers, over 90 companies in the Fortune 100, and over three-quarters of the companies in the Fortune 500. As of January 31, 2020, our Fortune 100 and Fortune 500 customers had annualized contract values (“ACVs”) ranging from less than $200 to over $3.0 million, and approximately one third of our Fortune 500 customers had ACVs lower than $5,000 per year. Our customers typically begin using our platform for a single initiative or project. Over time, as users realize the benefits of improved execution, adoption of our platform expands across an organization through new use cases and teams.
5
We deliver our cloud-based software platform through a subscription model. We have a digital sales model for self-service adoption through our website. We employ an efficient inside sales team that utilizes machine learning and lead scoring to respond to and convert other interested users within new and existing organizations. We also have a targeted field sales team dedicated to expanding our presence within existing enterprise relationships where we have identified significant opportunity for growth, and have developed partner relationships to support new customers, use cases and markets. This blended go-to-market model allows us to serve a larger, diverse user base without incurring excessive costs. The breadth of solutions we offer reflects the flexibility our users desire to purchase and use our platform in a way that most closely aligns with their needs and level of adoption.
Our Platform
Our platform is purpose-built to improve work execution for organizations and teams. We provide our customers with a robust set of capabilities to plan, capture, manage, automate, and report on work. Our platform enhances visibility and accountability in work execution and eliminates behaviors and processes that hinder productivity. We designed our platform to be accessible and valuable to all knowledge workers. Business users with no coding ability can share their work in Smartsheet across internal and external teams, and create and modify workflows to address specific use cases with our platform. Smartsheet offers multiple ways for customers to plan and manage their work using grids, projects, cards, and calendars; users can easily toggle between views to support their team’s preferred way of working.
We also offer capabilities and functionality to enable teams to accelerate execution while maintaining the flexibility to apply our platform to thousands of documented use cases. Our premium capabilities include Smartsheet Control Center and Dynamic View to enable customers to execute work at scale with consistency and security. These capabilities are monetized based on the value they create for customers, not on a per seat basis. During the year ended January 31, 2020, we added real-time resource management, capacity planning, and reporting software and expanded the number of Accelerators, which are pre-packaged solutions designed as best-in-class solutions to support specific use cases. As of January 31, 2020, we offered ten Accelerators, including Information Technology Project Management Office (“IT PMO”), Professional Services, Mergers and Acquisitions (“M&A”), Customer Engagement, Sales Rep Onboarding, General Data Protection Regulation (“GDPR”), Sales Forecasting, Campaign Management, Marketing Events, and Marketing Shared Services.
Benefits of our Platform
Automation across the organization saves time and minimizes manual processing
We enable users to organize their unstructured work and apply business logic to automate actions that shorten work execution timelines without the need to write code. Business logic is used to determine the conditions under which the following types of automated actions occur: update requests, intake and collection of information, sending of information, notifications, approval requests, and automated actions across systems. These elements of automation reduce errors and time spent by teams on administration.
Real-time visibility drives more informed, faster decision-making
Our platform is designed to provide a single source of truth for all stakeholders. We break down information silos across teams and provide real-time visibility into the status of work and the actions required by each stakeholder. This visibility ensures clear ownership of actions and outcomes. Teams feel empowered to take action, leading to stronger engagement and faster time to completion. Line of business managers benefit from visibility into progress against goals, allowing them to react quickly to real-time information and enabling faster and more informed decision-making.
Ease of use enables broad adoption
Our platform is designed for broad adoption within and across organizations for virtually any use case. Users can begin using Smartsheet within minutes and configure our platform for their needs with limited or no training. As of January 31, 2020, we had over 950,000 paying users and over 5.3 million additional free users which we refer to as collaborators. Collaborators inside or outside a user’s organization are invited to work on our platform by a paid user, and can use our platform with limited functionality. This strategy is designed to increase paid conversions for those seeking to enjoy the complete functionality of our platform while promoting greater usage within and across organizations. Teams and organizations buy into our platform because the productivity benefits derived through visibility and accountability are provided to all stakeholders. All team members can access the latest project information from a single location and can be held accountable without manual effort.
6
Multiple levels of integration to garner the most benefit from Smartsheet and other systems
We enable business users to engage with our platform through systems they currently use. Through our third-party Connectors, we extend the reach and consistency of data from systems, such as those offered by Salesforce, Atlassian, ServiceNow, and Microsoft. Our Connectors also allow users to apply business logic and automated actions, increasing the value of these existing applications to our users. We also integrate our platform into popular document and communication applications from Google, Microsoft, and others. Such functionality enables our users to incorporate documents directly into our platform or access our platform through the application of their choice. In addition, we offer extensible application programming interfaces (“APIs”) that enable a broad ecosystem of partners and customers to integrate directly into our platform, increasing the value of existing custom-built applications and improving the experience for our users.
Enterprise features and functionality for scalable adoption within businesses
Companies rely on Smartsheet to manage a diverse set of business processes. We provide the scalability, compliance, and security needed to operate reliably for our customers. Our platform provides consistent program execution, enabling teams and organizations to administer programs with management, visibility, and reporting at scale. Customers can use our professional services offerings to create and administer programs for specific use cases. We also provide user management and compliance features that enable organizations to control user access and audit activity within our platform. We provide enterprise-grade security controls and data governance to enable customer compliance with applicable privacy regulations.
Our Growth Strategies
Our goal is to make our platform accessible for every organization, team, and worker relying on collaborative work to achieve successful outcomes. We plan to pursue this goal with the following strategies.
Attract more customers to Smartsheet
We believe the need for a work execution platform such as ours is broad, and we believe there is significant opportunity to grow our paid user base. We will continue to invest in our digital sales model, direct sales force, brand, product, and partner marketing to continue to land new customers and increase enterprise adoption. In addition, we will continue to grow our professional services function, and develop new and enhanced premium solutions like our Connectors, Control Center, and Accelerators to help land larger accounts and increase the scale of our deployments with customers.
In August 2019, we announced that Smartsheet Gov achieved Provisional Authority to Operate (“P-ATO”) under the Federal Risk and Authorization Management Program (“FedRAMP”). This means the Smartsheet core platform has been fully approved for use by federal agencies and government contractors, giving them the ability to plan, capture, manage, automate, and report on work at scale. Additionally, Smartsheet can now be found on the AWS Gov Cloud Marketplace. This marketplace lists FedRAMP authorized offerings to help agencies research and select secure and compliant cloud providers available for federal use.
Expand within our existing customer base
Our customers frequently increase their use of our platform as they realize the value they derive from adopting Smartsheet. As a result, we are working with customers to help them define new use cases within existing deployments, and expand usage of Smartsheet to additional teams in their organizations that would benefit from our platform. There are more than 5.3 million existing collaborators that we are focused on converting to paid users. In addition to broader deployments, we enable our customers to further derive value from Smartsheet through premium solutions such as our Connectors, Control Center, Dynamic View and Accelerators. Our professional services, customer success, and training teams provide our customers with implementation, training, and support services to help them expand their use of, and realize the full benefit of, Smartsheet.
7
Expand internationally
For the year ended January 31, 2020, we derived approximately 21% of our revenue from customers outside the United States. We believe that there is significant opportunity to acquire new customers internationally. Our platform is available in eight languages. By expanding our direct and indirect sales force focused outside of the United States, establishing international sales territories, and partnering with strategic resellers, we plan to continue to grow our international sales. In October 2018, we opened our first international sales office in the U.K. focused on growing our presence within Western Europe. In September 2019, we established an additional international office in Australia focused on expanding our position in the Australian market and the Asia Pacific region.
Expand product features and functionality
We intend to continually increase the value we provide to our customers by investing in extending the capabilities of our platform. We have made, and will continue to make, significant investments in research and development to bolster our existing technology and enhance usability to improve our customers’ productivity. For example, during the year ended January 31, 2020, we expanded the number of Accelerators which provide our customers with fast and reliable deployment of Smartsheet across specific use-cases. Many of the high-value solutions that we are developing are intended to be packaged and priced separately from our core user subscriptions.
Make additional investments in partnerships and integrations
To help drive adoption of Smartsheet and deliver value to our customers, we offer extensive embedded functionality at no cost to complement and enhance the use of the most common productivity tools from providers such as Microsoft, Google, Slack, Box, and Dropbox. We offer powerful out-of-the-box Connectors with Salesforce, Adobe Creative Cloud, Atlassian, ServiceNow, and Microsoft that we sell for an additional fee on top of our user-based pricing. We intend to continue to invest in these integrations, develop new partnerships, and enhance our architecture to support a wider range of Connectors with leading enterprise applications to increase the value, awareness, and adoption of our platform.
Pursue selective strategic acquisitions
We plan to pursue strategic acquisitions that we believe will be complementary to our existing offering, enhance our technology, and increase the value proposition we deliver to our customers. Our recent acquisitions of Seattle-based Artefact Product Group, LLC (“10,000ft”) and TernPro, Inc. (“TernPro”) are examples, as the acquisitions were complementary to our existing product capabilities. 10,000ft accelerated our time to market for a resource planning software solution and we were able to leverage TernPro’s content mark-up and approval features to accelerate the delivery of new capabilities to our customers.
Our Technology
We believe our collective domain knowledge, technical expertise, and more than a decade of software development experience have allowed us to differentiate our platform from the competition. Our scalable multi-tenant architecture is designed to provide our customers with highly usable, secure, and reliable functionality.
Extensible technology platform
Our solutions are built on a common core platform that allows us to leverage shared components and services, enabling us to rapidly develop new features and functionalities on our existing platform without re-architecting the infrastructure. This also enables our products to seamlessly integrate with one another and provide our customers with a better user experience while leveraging our platform. We also offer a broad set of APIs that allow our customers the ability to integrate their Smartsheet account with other systems, or build their own applications on top of our extensible platform.
Integrated mobile capabilities
We have invested in our common core framework and mobile development teams to extend the high-performance functionality of our platform to smartphones and tablets. Our native mobile applications are built for both iOS and Android, and are designed to provide similar functionality to our desktop version, while also supporting mobile-first customer use cases.
8
Enterprise-grade security
Our customers frequently use our platform to store and manage highly-sensitive or proprietary information. Our approach to security includes a comprehensive information security program, governing the processing and security of customer information, and the appropriate physical, organizational, and technical controls designed to ensure the security of customer information collected, accessed, stored, or transmitted to or by Smartsheet. To ensure our controls remain up-to-date, we use external auditors to verify the adequacy of security measures and controls according to the American Institute of Certified Public Accountants (“AICPA”) SOC2 standards. In addition, we use external security experts to conduct penetration testing at least annually and make these audit and penetration test reports available to customers.
Scalable and reliable infrastructure
Our scalable architecture and monitoring telemetry are designed to provide a highly reliable and available platform. We maintain this reliability by utilizing a combination of third-party co-location centers and large public cloud providers, giving us the ability to scale our infrastructure efficiently and cost-effectively.
Our Products
Smartdashboards
Smartdashboards provide real-time visibility into the status of work to align individuals, managers, and executives. Our dashboards provide real-time status of key performance indicators, trends, summary reports, and important deadlines. Teams can customize Smartdashboards to view and interact with live data and metrics most critical to their projects.
Smartportals
Smartportals allow business users to create customized landing pages for teams to easily locate and access from any device the entire set of resources available for a project without IT assistance. This ease of configuration and organization of data eliminates time wasted searching for information, allowing teams to focus on work execution rather than administration.
Smartcards
Smartcards provide a powerful visualization tool for teams to organize, share, and act on workflows. The ability to understand the flow of work from multiple perspectives enables teams to display information in the most effective format, foster engagement, and shorten time to action.
Smartgrids
Smartgrids offer a unified, customized view of work to keep teams on task and on time by easily tracking multiple moving parts. Configurable to support thousands of use cases through an extensible data model, multiple column types and a unique hierarchical approach to Smartgrids allow business users to not only visually group data, but to also establish relationships between important data. With flexible formulas and conditional formatting, Smartgrids are the foundation for the Smartsheet work execution platform. The platform delivers new levels of clarity with a centralized source of all project information, bringing teams together with cloud-based, real-time access.
Smartprojects
Smartprojects offer a familiar and intuitive interface with capabilities that foster collaboration among teams and organizations to improve work execution. Business users rely on Smartprojects to create a single source of truth for all project-related information. This consistency of information aligns team objectives and eliminates information silos, fostering accountability and promoting faster decision-making.
Smartcalendars
Smartcalendars align teams and organizations by connecting deadlines to workflows, while offering a familiar interface to effectively communicate timing expectations. Smartcalendars provide a comprehensive view of activities and critical timelines, including third-party calendar applications such as iCal and Google Calendar.
9
Smartforms
Smartforms create and customize forms using a simple user-friendly interface. Smartforms enable business users to collect information in a structured and consistent format. By minimizing manual processing, teams can move quickly to analyze and take action on the results.
Smartautomation
Smartautomation automates repetitive processes and accelerates work by creating automated actions triggered based on preset conditions. Smartautomation offers a diverse and granular rule set critical to supporting the broad range of manual, repetitive processes teams encounter.
Smartintegrations
Smartintegrations enable organizations and teams to connect, sync, and extend their existing enterprise applications across their workflows to create seamless work execution. We offer native connections to popular productivity applications, such as Google G Suite, Microsoft Office 365, Box, and Dropbox.
Connectors
Connectors provide embedded integrations with industry-leading systems of record, including those from Salesforce, Atlassian, and ServiceNow. Connectors enable data to be synchronized in real-time, fostering visibility and interoperability across these business platforms. We also provide extensible APIs to build custom applications and deep integrations with line of business systems.
Control Center
Control Center enables organizations to achieve consistent work execution at the individual user level across large scale projects or initiatives while reducing operational risk. Control Center provides enterprises with real-time visibility into projects so they can react quickly to changing conditions. Without burdening the team with manual reporting, executives and managers can review the status of projects at scale without disrupting the speed of execution.
Accelerators
Accelerators are pre-packaged solutions for specific, repeatable use cases, which we launched in fiscal 2019. Accelerators are intended to deliver immediate business value by leveraging best practices gained from insights across the company’s thousands of customers. As of January 31, 2020, we offered ten Accelerators: IT PMO, Professional Services, M&A, Customer Engagement, Sales Rep Onboarding, GDPR, Sales Forecasting, Campaign Management, Marketing Events, and Marketing Shared Services.
Our Accelerator for IT PMO optimizes the entire IT project life cycle, from project prioritization through tracking, executive reporting, change management, and project archiving. The Accelerator delivers transparency, consistency and speed, with an easy-to-use interface that drives rapid user adoption.
Our Accelerator for Professional Services provides standardized plans, client reports and dashboards, consolidated portfolio reporting, and rich integrations with CRM systems like Salesforce, which help services leaders onboard customers effectively and on-time. This ensures a better experience and helps increase lifetime customer value.
Our Accelerator for M&A helps close acquisitions faster. Operational frameworks for evaluating acquisition targets, tracking due diligence activities, managing multiple workstreams, and planning the integration allow M&A leaders to navigate a complicated, high stakes process quickly and efficiently.
Our Accelerator for Customer Engagement solves sales management challenges with proven solutions for managing complex sales processes by providing clear program visibility, instant customer value and stakeholder engagement. This Accelerator provides complex sales deal alignment through better collaboration which increases deal closure success.
Our Accelerator for Sales Rep Onboarding helps sales training teams reduce onboarding costs and accelerates revenue attainment, while increasing sales rep retention. This Accelerator gives both sales reps and sales leadership better visibility into onboarding program effectiveness by linking progress to sales results.
Our Accelerator for GDPR allows organizations to create an integrated end-to-end operational framework for consistent, ongoing data privacy compliance, monitoring, and reporting. It helps to automate several key processes,
10
including privacy impact assessment and data mapping, identifying privacy risks, and remediation plans across an organization.
Our Accelerator for Sales Forecasting enables sales leaders to create accurate forecasts through collaborating on pipeline insights, and consistently rolling-up forecasts from the reps through to management.
Our Accelerator for Campaign Management combines a planning framework with an execution layer to take marketing campaigns to the next level. It also provides real time visibility into campaign status across departments and functions.
Our Accelerator for Marketing Events combines event planning best practices with Smartsheet’s collaboration features. Event owners can manage everything from planning to scheduling to execution, all the way through to lead collection and processing.
Our Accelerator for Marketing Shared Services helps customers manage high volume, complex service requests from across their entire organization. Teams can manage workflows from intake to completion, while providing transparency for business stakeholders.
In the future, we expect to release additional Accelerator packages based on customer needs and general market assessment.
Dynamic View
Dynamic View enables business users to collaborate using the same data set while maintaining confidentiality when working with vendors or across inter or intra departmental teams. Dynamic View enables mixed internal and external teams to collaborate confidentially with vendors without them knowing about each other. This premium application simplifies views into complex work like order management scenarios where the process is complex but each person only needs a partial view of their work. Dynamic View is ideal for managing departmental requests like business intelligence requests, marketing creative services, and sales tickets.
Data Uploader
Data Uploader allows business users to merge or replace data from virtually any system into Smartsheet so that a team’s key data sources live in the same place where work gets done. Data Uploader automates the data upload process to centralize the disparate data, drives collaboration, provides real-time visibility into multiple business systems, and empowers teams to be more efficient through effective work execution.
10,000ft
10,000ft enables businesses to plan and allocate resources across their projects, optimize resource allocation by function or skill set, track time against forecast, and gain real-time portfolio level visibility into the status of budgets and deliverables. This premium offering combined with the core Smartsheet platform provides customers an end to end solution for work execution and resource management that balances top down strategic planning with bottoms up work management.
Employees
As of January 31, 2020, we had a total of 1,588 employees, of which 1,051 were located at our headquarters in Bellevue, Washington.
Sales and Marketing
Our marketing and sales teams work closely together to provide an easy way for potential users to discover, try, adopt, and expand usage of Smartsheet over time. We include demand generation, customer success, customer support, and professional services under the sales organization to align these efforts to best support our customers.
Marketing
Our marketing organization is responsible for increasing awareness of, and generating demand for, our platform, and fostering our community of users. We target potential users across a wide variety of departments and functions in organizations of all sizes and industries. We employ brand marketing, content marketing, search marketing, social marketing, influencer marketing, advertising, and other techniques designed to increase brand awareness and traffic to our website and encourage new users to sign up for a 30-day free trial and purchase our subscription services online. We
11
engage frequently with respected technology analyst firms to educate them as to the benefits of our platform and accelerate the maturation of an appropriate market category.
We have also built marketing relationships with a number of technology companies, such as Microsoft and Google, to help promote and grow our user base and footprint. These partners offer access to our platform through links on their websites and expand our marketing reach. Additionally, in October 2019 we hosted our third annual global customer conference, Smartsheet ENGAGE to provide current and prospective users a better understanding of our platform through interactions with peers and training, and to highlight customer use cases and best practices.
Sales
Our sales organization is responsible for driving customer expansion and new customer opportunities. Our sales force is organized into separate teams focused on new customers, small to medium-sized businesses, large enterprises, geographic regions, and industries. Our assisted sales model relies on machine learning and lead scoring to identify users based on their likelihood to purchase our platform. Further, once we identify an opportunity for meaningful expansion within a customer organization, we can assign a customer success manager and an expansion sales representative to that customer. When an organization with more than 10,000 employees reaches a certain level of usage, we typically assign a field sales representative who is focused on growing adoption in these large accounts and expanding usage to a broader set of use cases.
Professional Services
Our professional services team provides our customers with implementation, training, and consulting services to help them realize the full benefits of Smartsheet. Our training programs include a mix of virtual and in-person offerings with different options focused either on helping onboard teams of users quickly or helping individuals achieve certification-level subject matter expertise. Our consulting and solution services teams provide configuration and use case optimization services.
Customer Support
Our platform is designed to minimize the need for customer support, as users can easily sign up and begin using it without assistance. We provide significant self-help resources including our extensive Help Portal and our active Community. Additionally, we provide free support channels for users based on their plan type with additional paid support offerings available. These include email and ticket submission for all users at no cost, along with access to phone support and subject matter expert appointments as part of our paid plans.
Customers
Our scalable collaborative work management platform helps teams and organizations of all sizes get work done fast and efficiently. As of January 31, 2020, we had approximately 84,000 domain-based customers with ACVs ranging from less than $200 to over $3.0 million. We define a domain-based customer as an organization with at least one paid user account associated with a unique domain name such as @cisco. An ISP customer is typically a small team or an individual that registers for our services with an email address hosted on a widely used domain such as @gmail, @outlook, or @yahoo.
Our domain-based customers include organizations across virtually all sectors, including aerospace, automotive, biotechnology, consumer, e-commerce, education, finance, government, healthcare, IT services, marketing, media, non-profit, publishing, software, technology, and travel.
Backlog
The majority of our invoiced customers sign up for subscription terms of one year and are invoiced for the full subscription term upfront. A smaller subset of customers with annual contract terms are invoiced on a quarterly or a semi-annual basis. Another small subset of customers sign multi-year subscription contracts but receive annual invoicing terms. When contract terms exceed invoicing terms, portions of those contracts which at a point in time are not invoiced are not recorded in revenue, deferred revenue, or elsewhere in our consolidated financial statements. Those contracted but uninvoiced amounts are considered by us to be backlog. As of January 31, 2020 and January 31, 2019, we had backlog of approximately $8.1 million and $5.2 million, respectively. As backlog amounts are not significant relative to our total customer contract value, we do not utilize backlog as a key management metric internally.
12
Research and Development
Our research and development team consists of our engineering, user experience, design, and product management teams. These groups are responsible for the design, development, testing, and delivery of new technologies and features for our platform. Our research and development team also includes our technical operations team which is responsible for scaling our platform and maintaining our co-location data centers and public cloud infrastructure. We are in the process of substantially migrating all of our operations to the public cloud infrastructure. We invest substantial resources in research and development to drive core technology innovation and bring new products to market.
Competition
The market for work execution software is rapidly evolving. We face competition from a number of vendors with a variety of product offerings. Our primary competition remains a combination of manual, email- and spreadsheet-based processes from providers such as Microsoft and Google that users have historically relied on to manage work. Certain of our features compete with current products and services offered by Airtable, Asana, Atlassian, Monday.com, Planview, Workfront, and Wrike. In addition, certain companies offer lightweight productivity solutions that compete with some of our platform’s features, including Asana and Workfront. Larger software vendors with substantial resources and smaller upstarts building on new technology platforms may also decide to enter our market by building or acquiring products that compete with our platform. We believe that the principal competitive factors in our market include:
• ease of deployment and use of applications;
• product features, quality, and functionality;
• ability to automate processes;
• ability to integrate with other applications and systems;
• capability for customization, configurability, integration, security, scalability, and reliability of applications
and solutions;
• vision for the market and product innovation;
• size of customer base and level of user adoption;
• pricing and total cost of ownership;
• strength of sales and marketing efforts;
• brand awareness and reputation; and
• customer experience, including support.
We believe we are positioned favorably against our competitors on the basis of the factors described above. Our ability to remain competitive will largely depend on our ongoing performance and the quality of our platform.
Intellectual Property
We rely on a combination of patents, trademarks, and trade secrets, as well as contractual provisions and restrictions, to protect our intellectual property. As of January 31, 2020, we had 10 issued and active patents, which expire between 2021 and 2036, as well as 9 pending patent applications in the United States. These patents and patent applications seek to protect proprietary inventions relevant to our business. While we believe our patents and patent applications in the aggregate are important to our competitive position, no single patent or patent application is material to us as a whole. We intend to pursue additional patent protection to the extent we believe it would be beneficial and cost effective.
As of January 31, 2020, we owned two U.S. and 23 international trademark registrations for the mark SMARTSHEET. We also own two pending trademark applications, and several domain names, including www.smartsheet.com.
13
Corporate Information
We were incorporated as Navigo Technologies, Inc. in Washington in June 2005. We changed our name to Smartsheet.com, Inc. in February 2006 and to Smartsheet Inc. in February 2017. Our principal executive offices are located at 10500 NE 8th Street, Suite 1300, Bellevue, Washington 98004. Our telephone number is (844) 324-2360. Our website address is www.smartsheet.com. Information contained on, or that can be accessed through, our website does not constitute part of this Annual Report.
Additional Information
We file annual, quarterly, and current reports, proxy statements, and other documents with the Securities and Exchange Commission (the “SEC”). Our reports filed with or furnished to the SEC pursuant to Section 13(a) and 15(d) of the Exchange Act of 1934 (the “Exchange Act”) are available, free of charge, on our Investor Relations website at investors.smartsheet.com as soon as reasonably practicable after we electronically file such material with, or furnish it to the SEC. The SEC maintains an Internet website that contains reports, proxy and information statements, and other information regarding issuers, including us, that file electronically with the SEC. The public can obtain any documents that we file with the SEC at www.sec.gov.
14
Item 1A. Risk Factors
Investing in our Class A common stock involves a high degree of risk. You should carefully consider the risks described below, as well as the other information in this Annual Report on Form 10-K, including our consolidated financial statements and the related notes and “Management’s Discussion and Analysis of Financial Condition and Results of Operations” before deciding whether to invest in our Class A common stock. The occurrence of any of the events or developments described below could materially and adversely affect our business, financial condition, results of operations, and growth prospects. In such an event, the market price of our Class A common stock could decline, and you may lose all or part of your investment. Additional risks and uncertainties not presently known to us or that we currently believe are not material may also impair our business, financial condition, results of operations, and growth prospects.
Risks Related to Our Business and Industry
It is difficult to predict our future operating results.
Our ability to accurately forecast our future operating results is limited and subject to a number of uncertainties, including planning for and modeling future growth. We have encountered, and will continue to encounter, risks and uncertainties frequently experienced by growing companies in rapidly changing industries. If our assumptions regarding these risks and uncertainties, which we use to plan our business, are incorrect or change due to industry or market developments, or if we do not address these risks successfully, our operating results could differ materially from our expectations and our business could suffer. Specifically, the current outbreak of COVID-19, which has been declared by the World Health Organization to be a global pandemic, has spread across the globe and is significantly impacting worldwide economic activity. COVID-19 could result in one or more of the following conditions that could affect us and our customers: increased risk in collectability of accounts receivable; reduced staff productivity due to working at home for extended periods; lost staff productivity due to illness and/or illness in the family; increased customer losses/churn; increased challenges in acquiring new customers; extreme currency exchange-rate fluctuations; and challenges with Internet infrastructure due to high loads. The duration and scope of the pandemic is highly uncertain. We continue to monitor the effect that the COVID-19 outbreak may have, and while it is not possible at this time to estimate the impact that COVID-19 could have on our business, the continued spread of COVID-19, and the measures taken by the governments of countries affected, will likely have an adverse impact on global economic conditions, which could have an adverse effect on our business and financial condition.
We have a history of cumulative losses and we cannot assure you that we will achieve profitability in the foreseeable future.
We have incurred losses in each period since we incorporated in 2005. We incurred net losses attributable to common shareholders of $95.9 million, $53.9 million, and $53.7 million during the years ended January 31, 2020, 2019, and 2018, respectively. As of January 31, 2020, we had an accumulated deficit of $256.5 million. These losses and accumulated deficit reflect the substantial investments we made to develop our products and services, acquire new customers, and maintain and expand existing customers. We expect our operating expenses to increase in the future due to anticipated increases in sales and marketing expenses, research and development expenses, operations costs, and general and administrative costs, and therefore we expect our losses to continue for the foreseeable future. Furthermore, to the extent we are successful in increasing our customer base, we will also incur increased losses due to upfront costs associated with acquiring new customers, particularly as a result of the nature of subscription revenue, which is generally recognized ratably over the term of the subscription period. You should not consider our recent revenue growth as indicative of our future performance. Our revenue growth could slow or our revenue could decline for a number of reasons, including slowing demand for our subscription solutions or professional services, reduced conversion from our free trial users or collaborators to paid users, increasing competition, or our failure to capitalize on growth opportunities. Accordingly, we cannot assure you that we will achieve profitability in the foreseeable future, nor that, if we do become profitable, we will sustain profitability.
The market in which we participate is highly competitive, and if we do not compete effectively, our operating results could be harmed.
15
The market for collaborative work management platforms is fragmented, increasingly competitive, and subject to rapidly changing technology and evolving standards. Our competitors range in size, from diversified global companies with significant research and development and marketing resources, to smaller startups building on new technology platforms whose narrower offerings may allow them to be more efficient in deploying technical, marketing, and financial resources.
Certain of our features compete with current or potential products and services offered by Airtable, Asana, Atlassian, Monday.com, Planview, Workfront, Wrike, and others. We also face competition from Google and Microsoft, who offer a range of productivity solutions including spreadsheets and email that have traditionally been used for work management. While we currently collaborate with Microsoft and Google, they may develop and introduce products that directly or indirectly compete with our platform. As we look to sell products and services to potential customers with existing internal solutions, we must convince their stakeholders that our platform is superior to the solutions that their organization has previously adopted and deployed. With the introduction of new technologies and market entrants, and the growth of existing market participants, we expect competition to continue to intensify in the future.
Many of our current and potential competitors, particularly large software companies, have longer operating histories, greater name recognition, more established customer bases, and significantly greater financial, operating, technical, marketing, and other resources than we do. As a result, our competitors may be able to leverage their relationships with distribution partners and customers based on other products or incorporate functionality into existing products to gain business in a manner that discourages users from purchasing our platform, including by selling at zero or negative margins or using product bundling. Further, our competitors may respond more quickly and effectively than we can to new or changing opportunities, technologies, standards, or customer requirements. We could lose customers if our competitors introduce new collaborative work management products, add new features to their current product offerings, acquire competitive products, reduce prices, form strategic alliances with other companies, or are acquired by third parties with greater available resources. We may also face increasing competition if our competitors provide products and services for free. If our competitors’ products or services are more widely adopted than ours, if they are successful in bringing their products or services to market sooner than ours, if their pricing is more competitive, or if their products or services are more technologically capable than ours, then our business, results of operations, and financial condition may be harmed.
If our security measures are breached or unauthorized access to customer data or our data is otherwise obtained, our platform may be perceived as not being secure, customers may reduce or stop using our platform, and we may incur significant liabilities.
Our products and services involve the storage, transmission, and processing of our customers’ sensitive and proprietary information, including business strategies, financial and operational data, personal or identifying information, and other data. As a result, unauthorized use of or access to this data could result in the loss, compromise, corruption, or destruction of our or our customers’ sensitive and proprietary information and lead to litigation, regulatory investigations and claims, indemnity obligations, loss of authorization under the Federal Risk and Authorization Management Program, and other liabilities. While we have security measures in place designed to protect the integrity of customer information and prevent data loss, misappropriation, and other security breaches and incidents, our platform is subject to ongoing threats, and we anticipate being required to expend significant resources in an effort to protect against security breaches and incidents. We have been subject to phishing attacks in the past, and may be subject to cyber-attacks, phishing attacks, malicious software programs, and other attacks in the future. These attacks may come from individual hackers, criminal groups, and state-sponsored organizations. In addition to these threats, the security, integrity, and availability of our and our customers’ data could be compromised by employee negligence, error or malfeasance, and product defects.
Additionally, we engage service providers to store and otherwise process some of our and our customers’ data, including sensitive and personal information. Our service providers may also be the targets of cyberattacks, malicious software programs, phishing attacks, and fraud. Our ability to monitor our service providers’ data security is limited, and, in any event, third parties may be able to circumvent those security measures, resulting in the unauthorized access to, or misuse, disclosure, loss, or destruction of our and our customers’ data.
16
A compromise of our or our service providers’ security measures due to any of the threats mentioned above could result in unauthorized access to, misuse, disclosure, loss or destruction of our customers’ or our data, or other disruption to our or our customers’ business operations, which could lead to litigation, regulatory investigations and proceedings, damage to our reputation and market position, and could cause us to incur significant liabilities, including fines, penalties, and other damages. Even the perception of inadequate security may damage our reputation and negatively impact our ability to win new customers and retain existing customers. Further, we could be required to expend significant capital and other resources to investigate and address any actual or suspected data security incident or breach, or to prevent further or additional security incidents or breaches. In addition, we may find it necessary or desirable to incur costs to provide remediation and incentives to customers or other business partners following a security breach or other security incident in an effort to maintain business relationships.
Techniques used to sabotage or obtain unauthorized access to systems or networks are constantly evolving and, in some instances, are not identified until launched against a target. We and our service providers may be unable to anticipate these techniques, react in a timely manner, or implement adequate preventative measures.
Further, not all of our customer and other agreements contain limitation of liability provisions and we cannot assure that any such limitation of liability provisions in our customer and user agreements or other contracts would be enforceable or adequate, or would otherwise protect us from any liabilities or damages with respect to any particular claim relating to a security breach or other security-related matter. We also cannot be sure that our existing insurance coverage will continue to be available on acceptable terms or will be available in sufficient amounts to cover claims related to a security incident, or that the insurer will not deny coverage as to any future claim. The successful assertion of claims against us that exceed available insurance coverage, or the occurrence of changes in our insurance policies, including premium increases or the imposition of large deductible or co-insurance requirements, could have a material adverse effect on our business, including our financial condition, operating results, and reputation.
If we are unable to attract new customers and maintain and expand sales to existing customers, our growth could be slower than we expect and our business may be harmed.
Our future growth depends in part upon increasing our customer base, and our ability to achieve significant growth in revenue in the future will depend, in large part, upon the effectiveness of our marketing efforts, both domestically and internationally, and our ability to predict customer demands and to attract new customers. This may be particularly challenging where an organization is reluctant to try a cloud-based collaborative work management platform or has already invested significantly in an existing solution. If we fail to predict customer demands or attract new customers and maintain and expand those customer relationships, our revenue and business may be harmed.
Our future growth also depends upon expanding sales of our platform and services to, and renewing subscriptions with, existing customers and their organizations. In order for us to improve our operating results, it is important that our existing customers increase their use of our platform through new use cases and new users, and purchase more subscriptions to our platform and our services and premium solutions. If our existing customers do not expand their use of our platform through their organization and purchase additional subscriptions, services, or premium solutions, our revenue may grow more slowly than expected, may not grow at all, or may decline.
Additionally, increasing upsell to enterprise customers requires increasingly sophisticated and costly sales efforts targeted at senior management. There can be no assurance that our efforts will result in increased sales to existing customers or upsells, and additional revenue. If our efforts to upsell to our customers are not successful, our business will suffer. Moreover, many of our subscriptions are sold for a one-year term. While many of our subscriptions provide for automatic renewal, our customers have no obligation to renew their subscription after the expiration of the term and we cannot assure you that our customers will renew subscriptions with a similar contract period or the same or greater number of users or premium solutions. Our customers’ renewal rates may decline or fluctuate as a result of a number of factors, including their satisfaction with our platform or services, our pricing or pricing structure, the pricing or capabilities of the products and services offered by our competitors, the effects of economic conditions, or reductions in our customers’ spending levels. If our customers do not renew their agreements with us, or renew on terms less favorable to us, our revenue may decline.
17
Our quarterly operating results may fluctuate significantly and may not fully reflect the underlying performance of our business.
Our quarterly operating results, including the levels of our revenue, billings, gross margin, profitability, cash flow, and deferred revenue may vary significantly in the future, and period-to-period comparisons of our operating results may not be meaningful. Accordingly, the results of any one quarter should not be relied upon as an indication of future performance. Our quarterly operating results may fluctuate as a result of a variety of factors, many of which are outside of our control, and as a result, may not fully reflect the underlying performance of our business. Fluctuations in quarterly operating results may reduce the value of our Class A common stock. Factors that may cause fluctuations in our quarterly results include, but are not limited to:
• | the impact of, including but not limited to the market volatility and economic disruption caused by, COVID-19 or any other worldwide pandemic; |
• | customers impacted by macroeconomic downturns and seeking bankruptcy protection or other similar relief; |
• | customers’ failure to pay amounts due to us, customers’ extending the time to pay amounts owed to us, our inability to collect amounts due, and the cost of enforcing the terms of our contracts, including litigation; |
• | our ability to attract new customers, including internationally; |
• | interest rate fluctuations which will cause our interest income to decrease during low interest rate environments; |
• | the addition or loss of large customers, including through acquisitions or consolidations; |
• | the mix of customers obtained through self-service on our website and sales-assisted channels; |
• | customer renewal rates and the extent to which customers purchase services and subscribe for additional users and products; |
• | the timing and growth of our business, in particular through our hiring of new employees and international expansion; |
• | our ability to hire, train, and maintain our sales force; |
• | the length and timing of sales cycles with a significant portion of our larger transactions occurring in the last few days and weeks of each quarter; |
• | the timing of recognition of revenue; |
• | the amount and timing of operating expenses; |
• | changes in our pricing policies or offerings, or those of our competitors; |
• | the timing and success of new product and service introductions by us or our competitors or any other change in the competitive dynamics of our industry, including consolidation or new entrants among competitors, customers, or strategic partners; |
• | customers delaying purchasing decisions in anticipation of new products or product enhancements by us or our competitors or otherwise; |
• | the timing and effectiveness of new sales and marketing initiatives; |
• | the timing of expenses related to the development or acquisition of technologies or businesses and potential future charges for impairment of goodwill from acquired companies; |
18
• | network or service outages, Internet disruptions, security breaches or perceived security breaches impacting us, and the costs associated with responding to and addressing such outages or breaches; |
• | changes in laws and regulations that affect our business, and any lawsuits or other proceedings involving us or our competitors; |
• | changes in foreign currency exchange rates or addition of currencies in which our sales are denominated; and |
• | general economic, industry, and market conditions. |
We depend on our co-location data centers, public cloud service providers, and computing infrastructure operated by third parties, and any service outages, delays, or disruptions in these operations could harm our business and operating results.
We host our platform and serve our customers from leased co-location data centers located in Chicago, Illinois, and Ashburn, Virginia and through public cloud service providers. We are in the process of consolidating the hosting of our platform through public cloud service providers exclusively. While we control and have access to our servers and the components of our network that are located in our leased co-location data centers, we do not control the operation of these facilities. Public cloud service providers run their own platforms that we access, and we are, therefore, vulnerable to service interruptions, delays, and outages. Our co-location data centers and public cloud service providers (collectively, our “Hosting Providers”) may experience events such as natural disasters, fires, power loss, telecommunications failures, or similar events. The systems, infrastructure, and services of our Hosting Providers may also be subject to human or software errors, viruses, security attacks (internal and external), fraud, spikes in customer usage, denial of service issues, break-ins, sabotage, intentional acts of vandalism, malware, phishing attacks, acts of terrorism, and other misconduct. Further, we have experienced in the past, and expect that in the future we may experience, periodic interruptions, delays, and outages in service and availability with our Hosting Providers due to a variety of factors, including Internet connectivity failures, infrastructure changes, human or software errors, website hosting disruptions, and capacity constraints. In some instances, we may not be able to identify the cause or causes of these performance problems within an acceptable period of time.
We may also be affected by other problems relating to our Hosting Providers, such as financial difficulties and bankruptcy. The occurrence of any such events or other unanticipated problems with our Hosting Providers could result in lengthy interruptions, delays, and outages in our service and noncompliance with our contractual obligations or business requirements.
Further, our Hosting Providers have no obligation to renew their agreements with us on commercially reasonable terms, or at all. If we are unable to renew agreements with these Hosting Providers on commercially reasonable terms, if our agreements with these Hosting Providers are prematurely terminated for any reason, if one of our Hosting Providers is acquired or ceases business, or if our migration to the public cloud results in interruptions, delays, outages, or needs to be halted or reversed, we may be required to transfer our servers and other infrastructure to new data center or public cloud facilities, and we may incur significant costs and possible service interruptions in connection with doing so.
Additionally, there are limited options for public cloud service providers capable of effectively supporting our infrastructure. Consolidation through a single, or select few, service provider(s) may result in a dependency on the selected provider(s). Consolidation may also negatively impact customer acquisition or expansion as customers or potential customers may object to certain providers for a variety of reasons, including that such providers do not meet their hosting requirements or that the providers operate in a competitive space; any such objections could harm our business and operating results.
Any issues with our Hosting Providers may result in errors, defects, disruptions, or other performance problems with our platform, which could harm our reputation and may damage our customers’ businesses. Interruptions in our platform’s operation might reduce our revenue, cause us to issue credits or refunds to customers, subject us to potential liability, cause customers to terminate their subscriptions, harm our renewal rates, and affect our reputation. Any of these events could harm our business and operating results.
19
We derive substantially all of our revenue from a single offering.
Although we offer additional solutions, we currently derive, and expect to continue to derive, substantially all of our revenue from our cloud-based collaborative work management platform. As such, the continued growth in market demand for our platform is critical to our continued success. Demand for our platform is affected by a number of factors, including continued market acceptance, the timing of development and release of competing products and services, price or product changes by us or by our competitors, technological changes, growth or contraction in the markets we serve, and general economic conditions and trends. In addition, some current and potential customers, particularly large organizations, may develop or acquire their own internal collaborative work management tools or continue to rely on traditional tools that would reduce or eliminate the demand for our platform. If demand for our platform declines for any of these or other reasons, our business could be adversely affected.
We have recently experienced rapid growth and expect our growth to continue. If we fail to manage our growth effectively, we may be unable to execute our business plan, maintain high levels of service and operational controls, or adequately address competitive challenges.
We have recently experienced a period of rapid growth in our personnel headcount and operations. During the period from January 31, 2016 to January 31, 2020 we grew from 274 employees to 1,588 employees. In addition, we have recently hired new members of management, and we have engaged temporary employees and contractors to supplement our employee base. We anticipate that we will continue to expand our operations and personnel headcount in the near term. This growth has made our operations more complex and has placed, and future growth will place, a significant strain on our management, administrative, operational, and financial infrastructure. Our success will depend in part on our ability to manage this growth and complexity effectively. To manage the expected growth of our operations and personnel, we will need to continue to improve our operational, financial, and management controls, processes, and documentation, and our reporting systems and procedures. Failure to effectively manage growth or complexity could result in difficulties growing and maintaining our customer base; cost increases; inefficient and ineffective responses to customer needs; delays in developing and deploying new features, integrations, or services; violations of law; breaches of contract; or other operational difficulties. Any of these difficulties could harm our business and operating results.
As a substantial portion of our sales efforts are targeted at enterprise and government customers, our sales cycle may become longer and more expensive, we may encounter implementation and configuration challenges, and we may have to delay revenue recognition for more complicated transactions, all of which could harm our business and operating results.
Our ability to increase revenue and achieve and maintain profitability depends, in large part, on widespread acceptance of our platform by large businesses, government agencies, and other organizations. In addition, to achieve acceptance of our platform by such customers, we will need to engage with and gain the acceptance of knowledge workers, who are often the initial adopters of our platform, and senior management. As a result, sales efforts targeted at enterprise and government customers involve greater costs, longer sales cycles, greater competition, increased operational burden, and less predictability in completing some of our sales. In the large enterprise and government agency markets, the customer’s decision to use our platform and services can sometimes be an organization-wide decision, in which case, we will likely be required to provide greater levels of customer education to familiarize potential customers with the use and benefits of our platform and services, as well as training and support. In addition, larger enterprises and government agencies may demand more features, configuration options, and integration and support services. They may also expect operational changes to satisfy their supplier requirements. As a result of these factors, these sales opportunities may require us to devote greater sales support, research and development, engineering, customer support, professional services resources, and other internal resources and processes to these customers, resulting in increased costs, lengthened sales cycles, and diversion of sales and professional services resources to a smaller number of customers. Moreover, these larger transactions may require us to delay revenue recognition on some of these transactions until the technical or implementation requirements have been met.
20
If our platform fails to perform properly, or if we are unable to scale our platform to meet the needs of our customers, our reputation could be harmed, our market share could decline, and we could be subject to liability claims.
Our platform is inherently complex and may contain material defects or errors. We provide regular updates to our platform, which may contain undetected defects when first introduced or released. Any defects in functionality or interruptions in the availability of our platform, or user error, could result in:
• | loss of, or delayed, market acceptance and sales; |
• | breach of contract or warranty claims; |
• | issuance of credits or other compensation for downtime; |
• | termination of subscription agreements, loss of customers, and issuance of refunds for prepaid amounts related to unused subscription fees for our platform; |
• | diversion of development and customer service resources; and |
• | harm to our reputation. |
The costs incurred in correcting any material defects or errors might be substantial and could harm our operating results.
Because of the large amount of data that we collect and manage, hardware failures, errors in our systems, user errors, or Internet outages could result in data loss or corruption that our customers may regard as significant. Furthermore, the availability and performance of our platform and services could be diminished or otherwise impacted by a number of factors, which may damage the perception of the reliability of our applications and reduce our revenue. These factors include but are not limited to customers’ inability to access the Internet; the failure of our network or software systems, including backup systems; simultaneous development efforts; computing vulnerabilities; security breaches; capacity issues or service failures experienced by our service providers; or variability in user traffic for our platform. We monitor vulnerabilities that may impact our business and the availability of our platform. Any such impact, and the costs incurred in addressing or correcting these vulnerabilities, may harm our operating results.
We may be required to issue credits or refunds for prepaid amounts related to unused fees, or otherwise be liable to our customers for damages they may incur resulting from certain of these events. In addition to potential liability, if we experience interruptions in the availability of our platform, our reputation could be harmed and we could lose customers.
Our insurance coverage may be inadequate or may not be available in the future on acceptable terms, or at all. In addition, our policy may not cover all claims made against us and defending a suit, regardless of its merit, could be costly and divert management’s attention.
Furthermore, we will need to ensure that our platform can scale to meet the evolving needs of our customers, particularly as we continue to focus on larger enterprise customers. We regularly monitor and update our platform to fix errors, add functionality, and improve scaling. Our customers have occasionally experienced outages and latency issues, sometimes during peak usage periods, including outages in July 2019. If we are not able to provide our platform at the scale required by our customers and correct any platform functionality defects and capacity limitations, potential customers may not adopt our platform and existing customers may not renew their agreements with us.
If we fail to manage our technical operations infrastructure, or experience service outages, interruptions, or delays in the deployment of our platform, we may be subject to liabilities and operating results may be harmed.
We have experienced significant growth in the number of users and data that our operations infrastructure supports. We seek to maintain sufficient excess capacity in our operations infrastructure to meet the needs of all of
21
our customers and users, as well as our own needs, and to ensure that our platform is accessible within an acceptable load time. We also seek to maintain excess capacity to facilitate the rapid provision of new customer deployments and the expansion of existing customer deployments. We need to properly manage our technological operations infrastructure in order to support version control, changes in hardware and software parameters, and the evolution of our platform. However, the provision of new hosting infrastructure requires significant lead-time. If we do not accurately predict or manage our infrastructure requirements, if our existing providers are unable to keep up with our needs for capacity, if they are unwilling or unable to allocate sufficient capacity to us, or if we are unable to contract with additional providers on commercially reasonable terms, our customers may experience service interruptions, delays, or outages that may subject us to financial penalties, cause us to issue credits or other compensation to customers, or result in other liabilities and customer losses. If our operations infrastructure fails to scale, customers may experience delays as we seek to obtain additional capacity, which could damage our reputation and our business. We may also be required to move or transfer our and our customers’ data. Despite precautions taken during this process, any unsuccessful data transfers may impair the delivery and performance of our platform.
If we do not keep pace with technological changes, our platform may become less competitive and our business may suffer.
Our industry is marked by rapid technological developments and innovations, and evolving industry standards. If we are unable to provide enhancements and new features and integrations for our existing platform, develop new products that achieve market acceptance, or innovate quickly enough to keep pace with rapid technological developments, our business could be harmed.
In addition, because our platform is designed to operate on a variety of systems, we will need to continuously modify, enhance, and improve our platform to keep pace with changes in Internet-related hardware; mobile operating systems such as iOS and Android; and other software, communication, browser, and database technologies. We may not be successful in either developing these modifications, enhancements, and improvements or in bringing them to market quickly or cost-effectively in response to market demands. Furthermore, uncertainties about the timing and nature of new network platforms or technologies, or modifications to existing platforms or technologies, could increase our research and development expenses. Any failure of our products to keep pace with technological changes or operate effectively with future network platforms and technologies, or to do so in a timely and cost-effective manner, could reduce the demand for our platform, result in customer dissatisfaction, and reduce our competitive advantage and harm our business.
Changes in privacy laws, regulations, and standards may reduce the effectiveness of our platform and harm our business.
Our customers can use our products and services to collect, use, and otherwise process personal information. National and state governments and data regulators in the countries in which we, our customers, and our service providers operate have adopted, are considering adopting, or may adopt laws, regulations, and standards regarding the collection, use, and other processing of personal information. Privacy laws and regulations can vary significantly by jurisdiction and are particularly stringent in Europe and certain other foreign jurisdictions such as Brazil, Canada, and China. The costs of compliance with, and other burdens imposed by, privacy laws, regulations, standards, and other obligations, such as the General Data Protection Regulation 2016/679 (“GDPR”), the California Consumer Privacy Act of 2018 (“CCPA”), or the Health Insurance Portability and Accountability Act (“HIPAA”), may limit the use and adoption of our products and services; reduce overall demand for our products and services; lead to regulatory investigations, litigation, and significant fines, penalties, or liabilities for actual or alleged noncompliance; slow the pace at which we close sales transactions; restrict our ability to make product or operational improvements; limit our ability to collect or utilize certain data; or create operational burden, any of which could harm our business. Moreover, if we or our service providers fail to comply with relevant laws, regulations, or contractual obligations, it may limit our ability to offer our products and services in certain jurisdictions, or damage our reputation and brand.
Any systems failure, security breach, or other incident that results in the release of, or unauthorized access to, personal information, or any failure or perceived failure by us to comply with our contractual obligations or any privacy laws or regulations, could result in proceedings against us by data regulators or others. Such proceedings
22
could result in the imposition of sanctions, fines, penalties, liabilities, or governmental orders requiring that we change our data handling practices, any of which could harm our business, operating results, and financial condition.
Additionally, privacy laws, regulations, and standards may be interpreted in new and differing manners in the future, may be modified, and may be inconsistent among jurisdictions. Future laws, regulations, and standards and changes in the interpretation thereof could result in any or all of the following for us, our customers, and our service providers: increased regulation, increased costs of compliance, penalties for non-compliance, and limitations on data processing. For example, data transfer mechanisms on which we rely, such as the Privacy Shield programs or the standard contractual clauses approved by the European Commission, have been subject to challenges and it is unclear whether they will continue to serve as valid means for the transfer of personal data to the United States. Additionally, Brexit could lead to further legislative and regulatory changes in the United Kingdom. It remains unclear how United Kingdom data protection laws or regulations will change as Brexit is effectuated and whether the United Kingdom will be deemed an adequate jurisdiction by the European Union. Further, the State of California recently adopted the CCPA, which provides new data privacy rights for consumers, expands the definition of “personal information,” and provides a private right of action to be brought against businesses that fail to comply. Recently, several amendments to the CCPA were signed into law in California and the California Attorney General has issued draft regulations; we continue to monitor these changes and their effects. The continued evolution of the CCPA may increase uncertainty, risk, and exposure.
The costs of compliance with, and other burdens imposed by privacy laws, regulations, and standards that are applicable to the businesses of our customers may reduce our or our customers’ ability and willingness to collect, use, and otherwise process certain types of information, which could limit the use, effectiveness, and adoption of our products and services and reduce overall demand. Further, if we or our customers are unable to transfer data between and among countries and regions in which we or our customers operate, it could decrease demand for our products and services, require us to modify or restrict our business operations, and impair our ability to maintain and grow our customer base and increase our revenue. Any changes we consider necessary or appropriate for compliance with privacy laws, regulations, standards, or contractual obligations may not be able to be made in a commercially reasonable manner, in a timely fashion, or at all. Even the perception of privacy concerns, whether or not valid, may inhibit the adoption, effectiveness or use of our products and services, and may damage our reputation and brand.
In addition to government regulation, privacy advocates and industry groups may establish or propose various new or different self-regulatory standards that may place additional burdens on us. Further, our customers may expect us to comply with more stringent privacy and data security requirements or standards. If we are unable to meet any of these standards or related contractual obligations, we could face litigation, harm to our reputation and market position, a loss of customers, reduced demand for our offerings, and harm to our business.
The loss of one or more of our key personnel could harm our business.
Our success depends largely upon the continued service of our senior management team, which provides leadership and contributions in the areas of product development, operations, security, marketing, sales, customer support, and general and administrative functions. From time to time, there may be changes in our senior management team resulting from the hiring or departure of executives, which could disrupt our business.
We do not have employment agreements with any member of our senior management team, and we do not maintain key person life insurance for any employee. The loss of one or more members of our senior management team, especially our President and Chief Executive Officer, Mark P. Mader, or other key employees may be disruptive to our business.
Our growth depends on our ability to expand our sales force.
In order to increase our revenue and achieve profitability, we must increase the size of our sales force, both in the United States and internationally, to generate additional revenue from new and existing customers. We intend to further increase our number of sales personnel but we may not be successful in doing so.
We believe that there is significant competition for sales personnel with the skills and technical knowledge that we require. Our ability to achieve revenue growth will depend, in large part, on our success in recruiting, training,
23
and retaining sufficient numbers of sales personnel to support our growth. New hires require significant training and may take considerable time before they achieve full productivity, particularly in new sales territories. Our recent hires and planned hires may not become productive as quickly as we expect, and we may be unable to hire or retain sufficient numbers of qualified individuals in the markets where we do business or plan to do business, which may cause us to have to explore new markets to find talent. In addition, as we continue to grow, a large percentage of our sales personnel may be new to our company and our platform, which may adversely affect our sales if we cannot train them quickly or effectively. Attrition rates may increase and we may face integration challenges as we continue to seek to expand our sales force. If we are unable to hire and train sufficient numbers of effective sales personnel, or the sales personnel are not successful in obtaining new customers or increasing sales to our existing customer base, our business could be adversely affected.
Our failure to attract, integrate, and retain highly qualified personnel could harm our business.
Our growth strategy depends on our ability to expand our organization with highly skilled personnel. Identifying, recruiting, training, and integrating qualified individuals will require significant time, expense, and attention. In addition to hiring new employees, we must continue to focus on retaining our best employees. Competition for highly skilled personnel is intense. We compete with many other companies for software developers with high levels of experience in designing, developing, and managing cloud-based software, as well as for skilled product development, marketing, sales, and operations professionals, and we may not be successful in attracting and retaining the professionals we need, particularly in the greater Seattle area where our headquarters are located. We have, from time to time, experienced, and we expect to continue to experience, difficulty in hiring and retaining employees with appropriate qualifications. In addition, certain immigration laws restrict or limit our ability to recruit internationally. Any changes to immigration policies that restrain the flow of technical and professional talent may inhibit our ability to recruit and retain highly qualified employees.
Additionally, many of the companies with which we compete for experienced personnel have greater resources than we have. If we hire employees from competitors or other companies, their former employers may attempt to assert that these employees, alone or with our inducement, have breached their legal obligations, resulting in a diversion of our time and resources. In addition, job candidates and existing employees often consider the value of the equity awards they receive in connection with their employment. If the perceived or actual value of our equity awards declines, it may reduce our ability to recruit and retain highly skilled employees. If we fail to attract new personnel or fail to retain and motivate our current personnel, our business and future growth prospects could be harmed.
If we cannot maintain our corporate culture as we grow, we could lose the innovation, teamwork, and passion that we believe contribute to our success, and our business may be harmed.
We believe that a critical component of our success has been our corporate culture. We have invested substantial time and resources in building our team. As we continue to grow, including expanding our presence domestically and internationally, and maintaining the controls associated with being a public company, we will need to preserve and maintain our corporate culture among a larger number of employees dispersed in various geographic regions. Any failure to preserve our culture could negatively affect our future success, including our ability to retain and recruit personnel and to effectively focus on and pursue our corporate objectives.
Failure to establish and maintain relationships with partners that can provide complementary technology offerings and software integrations could limit our ability to grow our business.
Our growth strategy includes expanding the use of our platform through complementary technology offerings and software integrations, such as third-party APIs. While we have established relationships with providers of complementary technology offerings and software integrations, we cannot assure you that we will be successful in maintaining relationships with these providers or establishing relationships with new providers. Third-party providers of complementary technology offerings and software integrations may decline to enter into, or may later terminate, relationships with us; change their features or platforms; restrict our access to their applications and platforms; or alter the terms governing use of and access to their applications and APIs in an adverse manner. Such changes could functionally limit or terminate our ability to use these third-party technology offerings and software integrations with our platform, which could negatively impact our offerings and harm our business.
24
Further, if we fail to integrate our platform with new third-party applications and platforms that our customers use, or to adapt to the data transfer requirements of such third-party applications and platforms, we may not be able to offer the functionality that our customers need, which would negatively impact our offerings and, as a result, could negatively affect our business, results of operations, and financial condition. In addition, we may benefit from these partners’ brand recognition, reputations, referrals, and customer bases. Any losses or shifts in the referrals from, or the market positions of, these partners generally, in relation to one another or to new competitors or technologies, could lead to losses in our relationships or customers, or a need to identify or transition to alternative channels for marketing our platform.
We rely on software and services from other parties. Defects in or the loss of access to software or services from third parties could negatively impact our business operations.
We use and rely on technologies and software from third parties to operate critical functions of our business, including cloud infrastructure services, customer relationship management services, and business management services. Our business would be disrupted if any of the third-party software or services we utilize were unavailable due to extended outages or interruptions, or if they are no longer available on commercially reasonable terms or at all. Such disruptions may adversely affect our ability to operate websites, process and fulfill transactions, respond to customer inquiries, and generally maintain cost-efficient operations. In the event of disruption, we may be required to seek replacement software or services from other parties, or to develop these components ourselves, which could result in increased costs, delays in the release of new product offerings, and reduced efficiencies in the operations of our impacted departments, until suitable technology can be identified and integrated. These disruptions, if they occur, could result in customer dissatisfaction, and harm our results of operations and financial condition.
Our business depends on a strong brand, and if we are not able to develop, maintain, and enhance our brand, our business and operating results may be harmed.
We believe that developing, maintaining, and enhancing our brand is critical to achieving widespread acceptance of our platform, attracting new customers, retaining existing customers, persuading existing customers to adopt additional solutions and services and expand their number of users, and hiring and retaining employees. We believe that the importance of our brand will increase as competition in our market further intensifies. Successful promotion of our brand will depend on a number of factors, including the effectiveness of our marketing efforts; our ability to provide a high-quality, reliable, and cost-effective platform; the perceived value of our platform; and our ability to provide a quality customer success experience.
Brand promotion activities require us to make substantial expenditures. We have begun to make more significant investments in the promotion of our brand, however, our ability to successfully promote our brand is uncertain. We anticipate that our expenditures on brand promotion will continue to increase in the near term as our market expands. The promotion of our brand, however, may not generate customer awareness or increase revenue, and any increase in revenue may not offset the expenses we incur in building and maintaining our brand. If we fail to successfully promote and maintain our brand, or if we incur substantial expenses in an unsuccessful attempt to promote and maintain our brand, we may fail to realize a sufficient return on our brand-building efforts, or fail to achieve the widespread brand awareness that is critical for broad customer adoption of our platform, which could harm our business and operating results.
Because we recognize revenue from subscriptions and support services over the term of the relevant service period, downturns or upturns in new sales or renewals may not be immediately reflected in our results of operations and may be difficult to discern.
We recognize subscription revenue from customers ratably over the terms of their subscription agreements, which are typically one year. As a result, most of the subscription revenue we report in each quarter is derived from the recognition of deferred revenue relating to subscriptions entered into during previous quarters. A decline in new or renewed subscriptions in any single quarter will likely only have a minor effect on our revenue for that quarter, and such a decline will reduce our revenue in future quarters. Accordingly, the effect of significant downturns in sales and market acceptance of our platform, and potential changes in our pricing policies or customer retention rates, may not be fully reflected in our operating results until future periods. We may be unable to adjust our cost structure to reflect the changes in revenue. Our subscription model also makes it difficult for us to rapidly increase
25
our revenue through additional sales in any period, as subscription revenue from new customers is recognized over the applicable subscription term.
We may not receive significant revenue from our current development efforts for several years, if at all.
Developing our platform is expensive and the investment in such technological development often involves a long return on investment cycle. We incurred research and development expenses of $95.5 million, $58.8 million, and $37.6 million during the years ended January 31, 2020, 2019, and 2018, respectively. We have made and expect to continue to make significant investments in development and related opportunities, such as maintaining authorization under the Federal Risk and Authorization Management Program. Accelerated product introductions and short product life cycles require high levels of expenditures that could adversely affect our operating results if not offset by revenue increases. We believe that we must continue to dedicate significant resources to our development efforts to maintain and improve our competitive position. However, we may not receive significant revenue from these investments for several years, if at all.
Our limited history with subscription and pricing models makes it difficult to accurately predict optimal pricing necessary to attract new customers and retain existing customers.
We have limited experience with respect to determining the optimal prices for our platform and services and, as a result, we have in the past, and expect in the future, that we will need to change our published and unpublished pricing models from time to time. As the market for our platform and services matures, or as competitors introduce new products or platforms that compete with ours, and as we expand into international markets, we may be unable to attract and retain customers at the same price or based on the same pricing models as we have historically, if at all, and some of our competitors may offer their products at a lower price. Pricing decisions may also affect the mix of adoption among our subscription plans and reduce our overall revenue. Moreover, larger enterprises may demand substantial price concessions. As a result, in the future we may be required to reduce our prices, which could harm our operating results.
Contractual disputes with, or commitments to, our customers may be costly, time-consuming, may result in terminations, and could harm our reputation.
The sale of our products and services is contract intensive and we are a party to contracts with our customers globally. Our contracts contain a wide variety of commitments, including security and privacy obligations, indemnification obligations, and regulatory requirements. Contract terms are not always standardized across our customers and may be subject to differing interpretations, which could result in disputes with our customers. If our customers notify us of an alleged contract breach or otherwise dispute any provision under our contracts, the resolution of such disputes in a manner adverse to us could negatively affect our operating results.
Certain of our customer agreements contain service level commitments. If we are unable to meet the stated service level commitments, including uptime requirements, we may be contractually obligated to provide these affected customers with service credits or refunds which could significantly affect our revenue in the period in which the uptime failure occurs or the period in which the credits are due. We could also face subscription terminations, which could significantly affect both our current and future revenue. Our platform experienced outages in July 2019 which resulted in the issuance of credits or other compensation to certain customers. Any additional service level failures could damage our reputation, which would also affect our future revenue and operating results.
We may be subject to litigation or regulatory proceedings for a variety of claims, which could adversely affect our results of operations, harm our reputation, or otherwise negatively impact our business.
From time to time, we may be involved as a party or an indemnitor in disputes or regulatory inquiries that arise in the ordinary course of business. These may include alleged claims, lawsuits, and proceedings involving labor and employment, wage and hour, commercial, securities law violations or other investor claims, and other matters. For example, an indemnification claim is currently being made against the Company in a lawsuit against a former director and shareholder to which we are not a party. Additionally, we sometimes engage contractors and other temporary workers to fill vacancies or otherwise provide services, and any incorrect classification of such staff could
26
result in liability or alleged claims, lawsuits, proceedings, or penalties. We expect that the number and significance of these potential disputes may increase as our business expands and our company grows larger.
Customers may make claims for damages arising from the use of our platform. There can be no assurance that contractual provisions will protect us from liability for damages in the event we are sued by customers or called upon to fulfill indemnification obligations. Although we carry general liability and director and officer liability insurance coverage, our insurance may not cover all potential claims to which we are exposed or may not be adequate to indemnify us for all liability that may be imposed. Any claims against us, whether meritorious or not, could be time consuming, result in costly litigation, require significant amounts of management time, and result in the diversion of significant operational resources. Because litigation is inherently unpredictable, we cannot assure you that the results of any of these actions will not have a material adverse effect on our business, financial condition, results of operations, and prospects.
Indemnity provisions in various agreements potentially expose us to substantial liability for intellectual property infringement and other losses.
Our agreements with customers and other third parties may include provisions under which we agree to provide certain defense and indemnity obligations for losses suffered or incurred as a result of third-party claims of intellectual property infringement or other liabilities relating to or arising from our contractual obligations. Indemnity payments and defense costs may be substantial and could harm our business, operating results, and financial condition. Any dispute involving a customer and relating to such indemnity obligations could have adverse effects on our relationship with that customer and other existing or potential customers, and may harm our business and operating results.
The loss of one or more of our key customers, or a failure to renew our subscription agreements with one or more of our key customers, could negatively affect our ability to market our platform.
We rely on our reputation and recommendations from key customers in order to promote subscriptions to our platform. The loss of, or failure to renew by, any of our key customers could have a significant effect on our revenue, reputation, and our ability to obtain new customers. In addition, acquisitions of our customers could lead to cancellation of such customers’ contracts, thereby reducing the number of our existing and potential customers.
Our platform uses third-party software and services that may be difficult to replace or may cause errors or failures of our platform that could lead to a loss of customers or harm to our reputation and our operating results.
We license third-party software and depend on services from various third parties to operate our platform. In the future, this software or these services may not be available to us on commercially reasonable terms, or at all. Any loss of the right to use any of the software or services could result in decreased functionality of our platform until equivalent technology is either developed by us or, if available from another provider, is identified, obtained, and integrated, which could harm our business. In addition, any errors or defects in or failures of the third-party software or services could result in errors or defects in our platform or cause our platform to fail, which could harm our business and be costly to correct. Such errors, defects, or failures could also harm our reputation and result in liability to third parties, including customers. Many of these providers attempt to limit their liability for errors, defects, and failures, which could limit our ability to recover from them and increase our operating costs.
We will need to maintain our relationships with third-party software and service providers and obtain software and services from such providers that do not contain errors or defects. Any failure to do so could adversely impact our ability to deliver our platform to our customers and could harm our operating results.
Our use of “open source” software could negatively affect our ability to offer and sell our products and subject us to possible litigation.
We use open source software in our platform and expect to continue to use open source software in the future. There are uncertainties regarding the proper interpretation of and compliance with open source licenses, and there is a risk that such licenses could be construed in a manner that imposes unanticipated conditions or restrictions on our
27
ability to use such open source software, and consequently to provide or distribute our platform. Additionally, we may from time to time face claims from third parties claiming ownership of, or seeking to enforce the terms of, an open source license, including by demanding release of the open source software, derivative works, or our proprietary source code that was developed using such software. These claims could also result in litigation and could require us to make our software source code freely available, devote additional research and development resources to change our platform, or incur additional costs and expenses, any of which could result in reputational harm and would have a negative effect on our business and operating results. In addition, if the license terms for the open source software we utilize change, we may be forced to re-engineer our platform or incur additional costs to comply with the changed license terms or to replace the affected open source software. Further, use of certain open source software can lead to greater risks than use of third-party commercial software, as open source licensors generally do not provide warranties or controls on the origin of software. Although we have implemented policies to regulate the use and incorporation of open source software into our platform, we cannot be certain that we have not incorporated open source software in our platform in a manner that is inconsistent with such policies.
If we fail to offer high-quality customer support, our business and reputation may be harmed.
Our customers rely on our customer support organization to resolve issues with their use of our platform and to respond to their inquiries relating to our platform. We may be unable to respond quickly enough to accommodate short-term increases in customer demand for support services. Increased customer demand for these services could increase costs and harm our operating results. Customers who elect not to purchase support may be unable to sufficiently address their support issues through self-service, and their support requests may not be prioritized once received by us; this may result in a poor customer experience. In addition, our sales process is highly dependent on the ease of use of our platform, our business reputation, and positive recommendations from our existing customers. Any failure to maintain a high-quality customer success and support organization, or a market perception that we do not maintain high-quality customer support, could harm our reputation, our ability to sell to existing and prospective customers, and our business.
Our long-term growth depends in part on being able to expand internationally on a profitable basis.
Historically, we have generated a majority of our revenue from customers in the United States. We are expanding internationally and plan to continue to expand our international operations as part of our growth strategy. There are certain risks inherent in conducting international business, including:
• | fluctuations in foreign currency exchange rates or adding additional currencies in which our sales are denominated; |
• | new, or changes in existing, regulatory requirements; |
• | tariffs, export and import restrictions, restrictions on foreign investments, sanctions, and other trade barriers or protection measures; |
• | costs of localizing our platform and services; |
• | lack of or delayed acceptance of localized versions of our platform and services; |
• | difficulties in and costs of staffing, managing, and operating our international operations; |
• | tax issues, including restrictions on repatriating earnings, and with respect to our corporate operating structure and intercompany arrangements; |
• | weaker intellectual property protection; |
• | the difficulty of, and burden and expense involved with, compliance with privacy, data protection, data residency, and information security laws and regulations, such as the GDPR; |
• | economic weakness or currency-related crises; |
28
• | the burden of complying with a wide variety of laws and regulations for foreign operations, including the U.S. Foreign Corrupt Practices Act (“FCPA”) of 1977, as amended, the U.K. Bribery Act 2010, import and export control laws, tariffs, trade barriers, economic sanctions and other regulatory or contractual limitations on our ability to sell products and services in certain foreign markets, and the risks and costs of non-compliance; |
• | generally longer payment cycles and greater difficulty in collecting accounts receivable; |
• | our ability to adapt to sales practices and customer requirements in different cultures; |
• | lack of brand recognition; |
• | political instability, uncertainty, or change, such as that caused by Brexit; |
• | health or similar issues, including epidemics or pandemics such as the current outbreak of COVID-19; |
• | security risks in the countries where we are doing business; and |
• | our ability to maintain our relationship with resellers to distribute our platform internationally. |
Any of these risks could adversely affect our business. For example, compliance with laws and regulations applicable to our international operations increases our cost of doing business in foreign jurisdictions. We may be unable to keep current with changes in government requirements as they change from time to time. Failure to comply with these regulations could have adverse effects on our business. In addition, in many foreign countries it is common for others to engage in business practices that are prohibited by our internal policies and procedures or applicable U.S. laws and regulations. As we grow, we continue to implement compliance procedures designed to prevent violations of these laws and regulations. There can be no assurance that all of our employees, contractors, resellers, and agents will comply with the formal policies we will implement, or applicable laws and regulations. Violations of laws or key control policies by our employees, contractors, resellers, or agents could result in delays in revenue recognition, financial reporting misstatements, fines, penalties, or the prohibition of the import or export of our products and services, and could have a material adverse effect on our business and results of operations.
Further, our limited experience in operating our business internationally increases the risk that any potential future expansion efforts that we may undertake will not be successful. If we invest substantial time and resources to expand our international operations and are unable to do so successfully, or in a timely manner, our business and results of operations will suffer.
Our forecasts of market growth may prove to be inaccurate, and even if the markets in which we compete achieve the forecasted growth, we cannot assure you that our business will grow at similar rates, if at all.
Growth forecasts are subject to significant uncertainty and are based on assumptions and estimates that may not prove to be accurate. Our forecasts, including the size and expected growth in the addressable market for collaborative work management platforms, may prove to be inaccurate. Even if these markets experience the forecasted growth, we may not grow our business at similar rates, or at all. Our growth is subject to many factors, including our success in implementing our business strategy, which is subject to many risks and uncertainties.
Changes in laws and regulations related to the Internet or changes in the Internet infrastructure itself may diminish the demand for our platform and services and could harm our business.
U.S. federal, state, or foreign government bodies or agencies have in the past adopted, and may in the future adopt, laws or regulations relating to Internet usage. The adoption of any laws or regulations that could reduce the growth, popularity, or use of the Internet, including laws or practices regarding Internet neutrality, could decrease the demand for, or the usage of, our platform and services, increase our cost of doing business, and harm our operating results. Changes in these laws or regulations could also require us to modify our platform in order to comply with these laws or regulations. In addition, government agencies or private organizations may begin to impose taxes, fees, or other charges for accessing the Internet or for commerce conducted via the Internet. These laws or charges could
29
limit the growth of Internet-related commerce or communications, or reduce demand for Internet-based services and platforms such as ours.
We use email as part of our platform for communication and workflow management. Internet service providers continually develop new technologies to filter messages deemed to be unwanted before they reach users’ inboxes, which may interfere with the deliverability of email messages from our platform. Government regulations, laws regarding electronic communications, and evolving practices regarding the use of email could restrict our use of email. Any deliverability issues or restrictions on our use of email would reduce functionality of our platform, impact user adoption, and harm our business.
In addition, the use of the Internet and, in particular, cloud-based solutions, could be adversely affected by delays in the development or adoption of new standards and protocols to handle increased demands of Internet activity, security, reliability, cost, ease of use, accessibility, and quality of service. The performance of the Internet has been adversely affected by “viruses,” “worms,” and similar malicious programs; businesses have experienced a variety of outages and other delays as a result of damage to Internet infrastructure. These issues could diminish the overall attractiveness of, and demand for, our platform.
Any failure to protect our intellectual property rights could impair our ability to protect our proprietary technology and our brand.
Our success and ability to compete depend in part upon our intellectual property. Unauthorized use of our intellectual property or a violation of our intellectual property rights by third parties may damage our brand and our reputation. In addition to certain patents and patent applications, we primarily rely on a combination of copyright, trademark, and trade secret protections, and confidentiality and license agreements with our employees, customers, partners, and others to protect our intellectual property rights. However, the steps we take to protect our intellectual property rights may be inadequate. We make business decisions about when to seek patent protection for a particular technology and when to rely upon trade secret protection, and the approach we select may ultimately prove to be inadequate. Even in cases where we seek patent protection, there is no assurance that the resulting patents will effectively protect every significant feature of our products and services. We also believe that the protection of our trademark rights is an important factor in product recognition, protecting our brand, and maintaining goodwill. If we do not adequately protect our rights in our trademarks from infringement and unauthorized use, any goodwill that we have developed in those trademarks could be lost or impaired, which could harm our brand and our business.
In order to protect our intellectual property rights, we may be required to spend significant resources to monitor and protect these rights. Litigation brought to protect and enforce our intellectual property rights could be costly, time-consuming, and distracting to management and could result in the impairment or loss of portions of our intellectual property. Any efforts to enforce our intellectual property rights may be met with defenses, counterclaims, and countersuits attacking the validity and enforceability of our intellectual property rights. Accordingly, we may not be able to prevent third parties from infringing upon or misappropriating our intellectual property. Remedies following any such infringement or misappropriation, including injunctive relief, may be insufficient to enjoin the infringement or misappropriation or otherwise address the damages sustained. Our failure to secure, protect, and enforce our intellectual property rights could seriously damage our brand and our business.
We may be sued by third parties for alleged infringement of their proprietary rights.
There is considerable patent and other intellectual property development activity in our industry. Our future success depends on our technology, platform, and services not infringing upon the intellectual property rights of others. Our competitors, as well as a number of other entities, including non-practicing entities and individuals, may own or claim to own intellectual property relating to our industry. From time to time, our competitors or other third parties may claim that we are infringing upon or misappropriating their intellectual property rights, and we may be found to be infringing upon such rights. Additionally, we rely on the feedback provided by our customers and users to inform decisions on potential changes to our products and services, and we negotiate agreements with our customers that may include license rights to intellectual property developed while performing professional services. Such feedback and license rights may provide a customer or user a basis for competing against us or contesting ownership of current or future intellectual property.
30
We cannot assure you that actions by other third parties alleging infringement by us of third- party intellectual property rights will not be asserted or prosecuted against us. In the future, others may claim that our technology, platform, or services infringe or violate their intellectual property rights, even if we are unaware of the intellectual property rights that others may claim. Any claims or litigation could cause us to incur significant expenses and, if successfully asserted against us, could require that we pay substantial damages or ongoing royalty payments, prevent us from offering our platform or services or using certain technologies, require that we implement expensive workarounds, or require that we comply with other unfavorable conditions.
We may also be obligated, without contractual limitation of liability provisions to limit our exposure, to indemnify our customers or business partners or pay substantial settlement costs, including royalty payments, in connection with any such claim or litigation, and to obtain licenses, modify our platform or services, or refund fees, which could be costly. In addition, we may incur substantial costs or take material action to resolve claims or litigation, whether or not successfully asserted against us, which could include payment of significant settlement, royalty, or license fees; modification of our products and services; or issuance of refunds to customers. Even if we were to prevail in such a dispute, any litigation regarding our intellectual property could be costly and time consuming and divert the attention of our management and key personnel from our business operations. During the course of any litigation, we may make announcements regarding the results of hearings and motions and other interim developments, which could cause the market price of our Class A common stock to decline if securities analysts and investors view those announcements negatively.
The requirements of being a public company, including maintaining adequate internal control over our financial and management systems, may strain our resources, divert management’s attention, and affect our ability to attract and retain executive management and qualified board members.
As a public company we incur significant legal, accounting, and other expenses. We are subject to reporting requirements of the Securities Exchange Act of 1934, as amended, (“Exchange Act”), the Sarbanes-Oxley Act of 2002 (the “Sarbanes-Oxley Act”), the rules subsequently implemented by the SEC, the rules and regulations of the listing standards of the New York Stock Exchange, and other applicable securities rules and regulations. Compliance with these rules and regulations will likely strain our financial and management systems, internal controls, and employees.
The Exchange Act requires, among other things, that we file annual, quarterly, and current reports with respect to our business and operating results. Moreover, the Sarbanes-Oxley Act requires, among other things, that we maintain effective disclosure controls and procedures, and internal control, over financial reporting. In order to maintain and, if required, improve our disclosure controls and procedures, and internal control over, financial reporting to meet this standard, significant resources and management oversight may be required. We have identified material weaknesses in our internal control over financial reporting, and if we cannot remediate such material weaknesses, we may not detect errors on a timely basis and our consolidated financial statements may be materially misstated. Effective internal control is necessary for us to produce reliable financial reports and is important to prevent fraud.
In addition, as of January 31, 2020 we are no longer an “emerging growth company,” and we are no longer permitted to rely on exemptions from certain requirements made available to emerging growth companies. For example, we are now required to comply with the auditor attestation requirements of Section 404 of the Sarbanes-Oxley Act. We have incurred and expect to continue to incur significant expenses and devote substantial management effort toward ensuring compliance with the auditor attestation requirements of Section 404 of the Sarbanes-Oxley Act. As a result of the complexity involved in complying with the rules and regulations applicable to public companies, our management’s attention may be diverted from other business concerns, which could harm our business, results of operations, and financial condition. To assist us in complying with these requirements we may need to hire more employees in the future, or engage outside consultants, which will increase our operating expenses.
Public company director and officer liability insurance is expensive, and we may be required to incur substantially higher costs to obtain and maintain the same or similar coverage. These factors could also make it more difficult for us to attract and retain qualified members of our board of directors and qualified executive officers.
31
We have identified material weaknesses in our internal control over financial reporting, which, if not remediated appropriately or timely, could result in adverse effects on the accuracy and timing of our financial reporting, inability to comply with securities law and exchange listing requirements, loss of investor confidence, and an adverse impact our stock price.
Internal controls related to the operation of technology systems are critical to maintaining adequate internal control over financial reporting. As disclosed in Part II, Item 9A of this Annual Report, management identified material weaknesses evidencing an ineffective control environment relating to (i) certain revenue and billing processes; (ii) ineffective information technology general controls in the areas of user access, program change-management, and computer operations controls over certain information technology systems that support the Company’s financial reporting processes; and (iii) insufficient resources with an appropriate level of controls knowledge and expertise commensurate with the Company’s financial reporting requirements. As a result, management concluded that our internal control over financial reporting was not effective as of January 31, 2020. We are implementing remedial measures and there can be no assurance that our efforts will be successful. These measures will result in additional technology and other expenses. We cannot assure you that the measures we have taken to date, and actions we may take in the future, will be sufficient to remediate the control deficiencies that led to the material weaknesses in our internal control over financial reporting or that they will prevent potential future material weaknesses. If we are unable to successfully remediate the existing or any future material weaknesses in our internal control over financial reporting, or identify any additional material weaknesses, the accuracy and timing of our financial reporting may be adversely affected, and as a result we may be unable to maintain compliance with securities law requirements regarding timely filing of periodic reports or the New York Stock Exchange listing requirements, which may cause investors to lose confidence in our financial reporting and our share price to decline.
We intend to evaluate acquisitions or investments in third-party technologies and businesses, but we may not realize the anticipated benefits from, and may have to pay substantial costs related to, any acquisitions, mergers, joint ventures, or investments that we undertake.
As part of our business strategy, we continually evaluate acquisitions of, or investments in, a wide array of potential strategic opportunities, including third-party technologies and businesses. We may be unable to identify suitable transaction candidates in the future or to make these transactions on a commercially reasonable basis, or at all. The evaluation of potential acquisitions and investments requires diversion of time and resources from normal business operations and may cost us to incur fees owed to outside advisors. Any transactions that we enter into could be material to our financial condition and results of operations. Such transactions may not result in the intended benefits to our business, and we may not successfully evaluate or utilize any acquired technology, offerings, or personnel, or accurately forecast the financial effect of a transaction. Although we conduct a reasonably extensive due diligence of any transaction target entity, such due diligence may not reveal every concern that may exist with respect to the target entity, the proposed transaction, and any subsequent integration. The process of integrating an acquired company, business, technology, or personnel into our own company is subject to various risks and challenges, including:
• | diverting management time and focus from operating our business to acquisition integration; |
• | disrupting our respective ongoing business operations; |
• | customer and industry acceptance of the acquired company’s offerings; |
• | implementing or remediating the controls, procedures, and policies of the acquired company; |
• | integrating acquired technologies in our own platform and technologies; |
• | our ability to ensure that we maintain quality and security standards for the acquired technology consistent with our brand; |
• | retaining and integrating acquired employees; |
• | failing to maintain important business relationships and contracts; |
32
• | failing to realize any anticipated synergies; |
• | using cash or equity that we may need in the future to operate our business or incurring debt on terms unfavorable to us or that we are unable to pay; |
• | liability for activities of the acquired company before the acquisition; |
• | litigation or other claims arising in connection with the acquired company; |
• | impairment charges associated with goodwill and other acquired intangible assets; and |
• | other unforeseen operating difficulties and expenditures. |
Our limited experience acquiring companies increases these risks. Our failure to address these risks or other problems we encounter with our acquisitions and investments could cause us to not realize the anticipated benefits of such acquisitions or investments, incur unanticipated liabilities, and harm our business.
We may need additional capital, and we cannot be certain that additional financing will be available on favorable terms, or at all.
We have funded our operations since inception primarily through equity financings, including our initial public offering (“IPO”) and subsequent registered offering, finance lease arrangements, subscription fees from our customers, and through proceeds from option exercises and the sale of our capital stock pursuant to our 2018 Employee Stock Purchase Plan. We do not know when or if our operations will generate sufficient cash to fund our ongoing operations. In the future, we may require additional capital to respond to business opportunities, challenges, acquisitions, declines in subscriptions for our platform, or unforeseen circumstances. A deterioration of current conditions in worldwide credit markets as a result of the COVID-19 pandemic could limit our ability to obtain external financing to fund our operations and capital expenditures. We may not be able to timely secure debt or equity financing on favorable terms, or at all. Any debt financing obtained by us could involve restrictive covenants relating to our capital raising activities and other financial and operational matters, which may make it more difficult for us to obtain additional capital and to pursue business opportunities, including potential acquisitions. Additionally, we may not be able to generate sufficient cash to service any debt financing obtained by us, which may force us to reduce or delay capital expenditures or sell assets or operations. If we raise additional funds through further issuances of equity, convertible debt securities, or other securities convertible into equity, our existing shareholders could suffer significant dilution in their percentage ownership of our company, and any new equity securities we issue could have rights, preferences, and privileges senior to those of holders of our common stock. If we are unable to obtain adequate financing or financing on terms satisfactory to us when we require it, our ability to continue to grow or support our business and to respond to business challenges could be significantly limited.
Our reported financial results may be harmed by changes in the accounting principles generally accepted in the United States.
Generally accepted accounting principles in the United States are subject to interpretation by the Financial Accounting Standards Board (“FASB”), the SEC, and various bodies formed to promulgate and interpret appropriate accounting principles. A change in these principles or interpretations could have a significant effect on our reported financial results, and may even affect the reporting of transactions completed before the announcement or effectiveness of a change. For example, in February 2016 the FASB issued ASU No. 2016-02, Leases: Topic 842 (“Topic 842”), for which we recorded material right-of-use assets and lease liabilities on the balance sheet upon adoption. We adopted Topic 842 using the modified retrospective transition method. Other companies in our industry may apply these accounting principles differently than we do, adversely affecting the comparability of our consolidated financial statements.
We could be subject to additional sales tax or other tax liabilities.
State, local, and foreign taxing jurisdictions have differing rules and regulations governing sales, use, value added, and other taxes, and these rules and regulations are subject to varying interpretations that may change over time. In particular, the applicability of sales taxes to our platform in various jurisdictions is unclear. It is possible that
33
we could face tax audits and that our liability for these taxes could exceed our estimates as taxing authorities could still assert that we are obligated to collect additional amounts as taxes from our customers and remit those taxes to those authorities. Additionally, we do not collect such transaction taxes in all jurisdictions in which we have sales, based on our understanding that such taxes are not applicable or an exemption from such taxes applies. If we become subject to tax audits in these jurisdictions and a successful assertion is made that we should be collecting sales, use, value added, or other taxes where we have not historically done so, it could result in substantial tax liabilities for past sales; discourage customers from purchasing our products; or otherwise harm our business, results of operations, and financial condition.
Further, an increasing number of states and foreign jurisdictions have considered or adopted laws or administrative practices, with or without notice, that impose new taxes on all or a portion of gross revenue or other similar amounts or impose additional obligations on remote sellers to collect transaction taxes such as sales, consumption, value added, or similar taxes. If new laws are adopted in a jurisdiction where we do not collect such taxes, we may not have sufficient lead time to build systems and processes to collect these taxes. Failure to comply with such laws or administrative practices, or a successful assertion by such states or foreign jurisdictions requiring us to collect taxes where we do not, could result in substantial tax liabilities, including for past sales, as well as penalties and interest. In addition, if the tax authorities in jurisdictions where we are already subject to sales tax or other indirect tax obligations were to successfully challenge our positions, our tax liability could increase substantially.
Our ability to use our net operating loss to offset future taxable income may be subject to certain limitations.
As of January 31, 2020, we had U.S. federal net operating loss carryforwards (“NOLs”), of approximately $205.6 million. In general, under Section 382 of the Internal Revenue Code of 1986, as amended (the “Code”), a corporation that undergoes an “ownership change” is subject to limitations on its ability to utilize its NOLs to offset future taxable income. As a result, our existing NOLs may be subject to limitations arising from previous ownership changes.
Future changes in our stock ownership, the causes of which may be outside of our control, could result in an ownership change under Section 382 of the Code. Our NOLs may also be impaired under state laws. Furthermore, our ability to utilize NOLs of companies that we may acquire in the future may be subject to limitations. There is also a risk that due to regulatory changes, such as suspensions on the use of NOLs, or other unforeseen reasons, our existing NOLs could expire or otherwise be unavailable to offset future income tax liabilities. For these reasons, we may not be able to realize a tax benefit from the use of our NOLs, whether or not we attain profitability.
Changes in tax laws or regulations could be enacted or existing tax laws or regulations could be applied to us or our customers in a manner that could increase the costs of our platform and services and harm our business.
Income, sales, use, or other tax laws, statutes, rules, regulations, or ordinances could be enacted or amended at any time, possibly with retroactive effect, and could be applied solely or disproportionately to products and services provided over the Internet. These enactments or amendments could reduce our sales activity by increasing gross sales prices, inclusive of tax, and ultimately harm our operating results and cash flows.
Additionally, any changes to or the reform of current U.S. tax laws that may be enacted in the future could impact the tax treatment of our foreign earnings. Currently, we have not accumulated significant foreign earnings; however, this could change on a go-forward basis as our international operations continue to develop. In addition, due to the expansion of our international business activities, any changes in the U.S. taxation of such activities may increase our worldwide effective tax rate and adversely affect our financial position and results of operations.
The application of U.S. federal, state, local, and international tax laws to services provided electronically is unclear and continuously evolving. Existing tax laws, statutes, rules, regulations, or ordinances could be interpreted or applied adversely to us, possibly with retroactive effect, which could require us or our customers to pay additional tax amounts, as well as require us or our customers to pay fines or penalties, as well as interest for past amounts. If we are unsuccessful in collecting such taxes due from our customers, we could be held liable for such costs, thereby adversely affecting our operating results and harming our business.
34
We may face exposure to foreign currency exchange rate fluctuations.
While we have historically transacted in U.S. dollars with the majority of our customers and vendors, we have transacted in some foreign currencies and may transact in more foreign currencies in the future. Accordingly, changes in the value of foreign currencies relative to the U.S. dollar can affect our revenue and operating results due to transactional and translational re-measurement that is reflected in our earnings. As a result of such foreign currency exchange rate fluctuations, it could be more difficult to detect underlying trends in our business and operating results. In addition, to the extent that fluctuations in currency exchange rates cause our operating results to differ from our expectations or the expectations of our investors, the trading price of our Class A common stock could be lowered. Our foreign currency exchange policy approves use of certain hedging instruments, including spot transactions, forward contracts, and purchased options with maturity of up to one year. The use, if any, of such hedging instruments may not offset any or more than a portion of the adverse financial effects of unfavorable movements in foreign exchange rates over the limited time the hedges are in place. Moreover, the use of hedging instruments may introduce additional risks if we are unable to structure effective hedges with such instruments.
Failure to comply with Federal Acquisition Regulations or anti-corruption and anti-money laundering laws, including the FCPA and similar laws associated with our activities outside of the United States, could subject us to penalties and other adverse consequences.
We are subject to Federal Acquisition Regulations, the FCPA, the U.S. domestic bribery statute contained in 18 U.S.C. § 201, the U.S. Travel Act, the USA PATRIOT Act, the U.K. Bribery Act 2010, and possibly other anti-bribery and anti-money laundering laws in countries in which we conduct activities. We face significant risks if we fail to comply with the FCPA and other anti-corruption laws that prohibit companies and their employees and third-party intermediaries from promising, authorizing, offering, or providing, directly or indirectly, improper payments or anything of value to foreign government officials, political parties, and private-sector recipients for the purpose of obtaining or retaining business, directing business to any person, or securing any advantage. In many foreign countries, particularly in countries with developing economies, it may be a local custom that businesses engage in practices that are prohibited by the FCPA or other applicable laws and regulations.
In addition, we use various third parties to sell access to our platform and services and conduct our business abroad and to the federal government. We or our third-party intermediaries may have direct or indirect interactions with officials and employees of government agencies or state-owned or affiliated entities and we can be held liable for the corrupt or other illegal activities of these third-party intermediaries, and our employees, representatives, contractors, partners, and agents, even if we do not explicitly authorize such activities. We have implemented an anti-corruption compliance program and adopted an anti-corruption policy, but we cannot assure you that all our employees and agents, as well as those companies to which we outsource certain of our business operations, will not take actions in violation of our policies and applicable law, for which we may be ultimately held responsible.
Any violation of Federal Acquisition Regulations, the FCPA, other applicable anti-corruption laws, or anti-money laundering laws could result in whistleblower complaints, adverse media coverage, investigations, loss of export privileges, severe criminal or civil sanctions and, in the case of the FCPA, suspension or debarment from U.S. government contracts, any of which could have a materially adverse effect on our reputation, business, operating results, and prospects. In addition, responding to any enforcement action may result in a significant diversion of management’s attention and resources and significant defense costs and other professional fees.
Governmental export or import controls could limit our ability to compete in foreign markets and subject us to liability if we violate them.
Our platform and services may be subject to U.S. export controls, and we incorporate encryption technology into certain features. U.S. export controls may require submission of a product classification and annual or semi-annual reports. Governmental regulation of encryption technology and regulation of imports or exports of encryption products, or our failure to obtain required import or export authorization for our platform and services, when applicable, could harm our international sales and adversely affect our revenue. Compliance with applicable regulatory requirements regarding the export of our platform and services may create delays in the introduction of our feature releases in international markets, prevent our customers with international operations from using our platform and services or, in some cases, prevent the export of our platform and services to some countries altogether.
35
Furthermore, U.S. export control laws and economic sanctions prohibit the shipment of certain products and services to countries, governments, and persons identified by U.S. sanction programs. If we fail to comply with export control regulations and such economic sanctions, we may be fined or other penalties could be imposed, including a denial of certain export privileges. In 2018, we determined that a small number of persons may have accessed our platform from one or more embargoed countries. We made an initial voluntary self-disclosure to the U.S. Department of Treasury’s Office of Foreign Assets Control (“OFAC”) to report these potential violations and OFAC issued a Cautionary Letter as a final enforcement response. While our controls are designed to prevent similar activity from occurring in the future, these controls may not be fully effective.
Moreover, any new export or import restrictions, new legislation, or shifting approaches in the enforcement or scope of existing regulations, could result in decreased use of our platform or services by, or in our decreased ability to export or sell our services or access to our platform to, existing or potential customers with international operations. Any decreased use of our platform or services, or limitation on our ability to export or sell our services or access to our platform, would likely adversely affect our business.
Our sales are generally more heavily weighted toward the end of each fiscal quarter, which could have an impact on the timing of our billings, revenue, and collections, and on the reporting of such metrics for any given quarter and subsequent quarters.
Our sales cycles are generally more heavily weighted toward the end of each fiscal quarter, with an increased volume of sales in the last few weeks and days of the quarter, and can otherwise be dependent on customer purchasing patterns and the timing of particularly large transactions. Any of the foregoing may have an impact on the timing of revenue recognition, billings, and cash collections, may cause significant fluctuations in our operating results and cash flows, may make it challenging for an investor to predict our performance on a quarterly or annual basis, and may prevent us from achieving our quarterly or annual forecasts.
Further, the concentration of contract negotiations in the last few weeks and days of the quarter may require us to expend more in the form of compensation for additional sales operations, legal, and finance employees and contractors. Compression of sales activity to the end of the quarter also greatly increases the likelihood that sales cycles will extend beyond the quarter in which they are forecasted to close for some sizable transactions, which may harm forecasting accuracy and adversely impact new customer acquisition metrics for the quarter in which they are forecasted to close.
Political developments and adverse societal, economic, and market conditions and reductions in productivity spending may harm our business.
Our business depends on the overall demand for cloud-based collaborative work management platforms and on the economic health of our current and prospective customers. The United States has experienced cyclical downturns from time to time that have resulted in a significant weakening of the economy, more limited availability of credit, a reduction in business confidence and activity, and other difficulties that may affect one or more of the industries to which we sell subscriptions and professional services.
Further, political developments impacting government spending and international trade, including government shutdowns in the United States, the United Kingdom's departure from the European Union, and trade disputes and tariffs, in particular with China, may negatively impact markets and cause weaker macroeconomic conditions. Brexit has created economic and political uncertainty, including volatility in global financial markets and the value of foreign currencies. The impact of Brexit may not be fully realized for several years or more. Uncertainty in the effects of Brexit may cause some of our customers or potential customers to curtail spending and may ultimately result in new regulatory, operational, and cost challenges to our United Kingdom and global operations. These adverse conditions could result in reductions in sales of our platform, longer sales cycles, reductions in subscription duration and value, slower adoption of new technologies, and increased price competition. Any of these events would likely have an adverse effect on our business, operating results, and financial position.
Our operations expose us to risks associated with public health crises, such as the current COVID-19 pandemic, which could harm our business and cause our operating results to suffer. The global spread of COVID-19 has created significant worldwide operational and economic volatility, uncertainty and disruption, and the extent to
36
which COVID-19 will adversely impact our business is highly uncertain, rapidly changing, and cannot be accurately predicted. A continued slowdown or downturn in the economy has begun to have, and we expect will continue to have, a negative impact on many of our customers.
In addition, the COVID-19 pandemic has significantly impacted areas where we operate and areas of customer and user concentration. The impact of COVID-19 has limited, for an indefinite period of time, the business activities of our employees, partners, and customers, including due to shutdowns that have been and may continue to be requested or mandated by governmental authorities. COVID-19 has required our employees to utilize alternative working arrangements and has restricted our employees’ ability to travel. The effects of these indefinite travel restrictions and alternative working arrangements are unknown, may negatively impact the productivity of our employee base, and may have a disproportionately negative impact on our sales and operations functions, which could have an adverse effect on our business, operating results, and financial condition. COVID-19 has also resulted in certain government closures and supply chain disruptions, which impact specific areas of our business, including by limiting our ability to complete background checks and screens necessary to hire and onboard employees and to provide necessary equipment to new and existing employees.
Uncertainty due to the COVID-19 pandemic, as well as general economic uncertainty and associated macroeconomic conditions, make it extremely difficult for us and our customers to accurately forecast and plan future business activities which could cause customers to delay or reduce their information technology spending. This could result in reductions in sales of our platform and services, longer sales cycles, reductions in subscription duration and value, slower adoption of new technologies, and increased price competition. Any of these events could harm our business and operating results. In addition, there can be no assurance that cloud-based collaborative work management and productivity spending levels will increase following any recovery.
Catastrophic events may disrupt our business.
Natural disasters or other catastrophic events may cause damage or disruptions to our operations. Our corporate headquarters are located in the greater Seattle area, an earthquake-prone region and an area that has been significantly affected by the COVID-19 pandemic. Additionally, we rely on our network and third-party infrastructure and enterprise applications, internal technology systems, and our website for our development, marketing, operational support, and sales activities. In the event of a major earthquake, hurricane, or catastrophic event such as fire, power loss, telecommunications failure, cyber-attack, war, or terrorist attack, our disaster recovery and business continuity plans may be inadequate and we may endure system interruptions, reputational harm, delays in our product development, lengthy interruptions in our platform and services, breaches of data security, loss of critical data, and inability to continue our operations, all of which could harm our operating results.
Risks Related to Ownership of Our Common Stock
The market price of our Class A common stock has been and will likely continue to be volatile, and you could lose all or part of your investment.
The market price of our Class A common stock has been, and will likely continue to be, volatile. Since shares of our Class A common stock were sold in our IPO at a price of $15.00 per share, our stock price has ranged from $18.06 to $55.79 through March 20, 2020. In addition to the factors discussed in this Annual Report, the trading prices of the securities of technology companies in general have been highly volatile.
The market price of our Class A common stock may continue to fluctuate significantly in response to numerous factors, many of which are beyond our control, including:
• | price and volume fluctuations in the overall stock market or in the trading volume of our shares or the size of our public float; |
• | negative publicity related to the real or perceived quality of our platform, as well as the failure to timely launch new features, integrations, or services that gain market acceptance; |
• | actual or anticipated fluctuations in our revenue or other operating metrics; |
37
• | changes in the financial projections we provide to the public or our failure to meet these projections; |
• | failure of securities analysts to initiate or maintain coverage of our company, changes in financial estimates by any securities analysts who follow our company, or our failure to meet the estimates or the expectations of investors; |
• | recruitment or departure of key personnel; |
• | changes in accounting standards, policies, guidelines, interpretations, or principles; |
• | the economy as a whole and market conditions in our industry; |
• | rumors and market speculation involving our company or other companies in our industry; |
• | actual or perceived failures or breaches of security or privacy, and the costs associated with responding to and addressing any such actual or perceived failures or breaches; |
• | announcements by us or our competitors of significant innovations, acquisitions, strategic partnerships, joint ventures, or capital commitments; |
• | new laws or regulations or new interpretations of existing laws or regulations applicable to our business; |
• | indemnity demands or lawsuits threatened or filed against us; |
• | other events or factors, including those resulting from war, incidents of terrorism, public health concerns or epidemics (such as the current COVID-19 pandemic), or responses to these events; |
• | sales or distributions of our Class A common stock held by our large institutional shareholders; and |
• | sales of additional shares of our Class A common stock by us or our shareholders. |
In addition, the stock markets have experienced extreme price and volume fluctuations that have affected and continue to affect the market prices of equity securities of many companies. In particular, the stock markets have been extremely volatile in response to the COVID-19 pandemic. Stock prices of many companies have fluctuated in a manner unrelated or disproportionate to the operating performance of those companies. In the past, shareholders have instituted securities class action litigation following periods of market volatility. If we were to become involved in securities litigation, it could subject us to substantial costs, divert resources and the attention of management from our business, and harm our business.
Sales of a substantial amount of our Class A common stock in the public markets, particularly sales by our directors, executive officers, and significant shareholders, or the perception that these sales may occur, may cause the market price of our Class A common stock to decline.
Shares held by our employees, executive officers, directors, and the majority of our security holders are currently tradeable in the public market, subject in certain cases to volume limitations under Rule 144 of the Securities Act of 1933, as amended (the “Securities Act”), various vesting agreements, as well as our insider trading policy. Sales of a substantial number of such shares, or the perception that such sales may occur, could cause our market price to fall or make it more difficult for you to sell your Class A common stock at a time and price that you deem appropriate.
In addition, as of January 31, 2020, we had options outstanding that, if fully exercised or settled, would result in the issuance of 9,076,671 shares of Class A common stock, and restricted stock units (“RSUs”) outstanding that, if fully settled, would result in the issuance of 3,138,330 shares of Class A common stock. We expect that all of the shares of Class A common stock issuable upon the exercise of stock options or settlement of RSUs, and the shares reserved for future issuance under our equity incentive plans, will be registered for public resale under the Securities Act. Accordingly, these shares will be freely tradable in the public market upon issuance subject to applicable vesting requirements.
38
In addition, certain holders of our Class A common stock are, subject to certain conditions, entitled, under contracts providing for registration rights, to require us to register shares owned by them for public sale in the United States.
We may also issue our shares of common stock or securities convertible into shares of our common stock from time to time in connection with a financing, acquisition, investment, or otherwise. Any further issuance could result in substantial dilution to our existing shareholders and cause the market price of our Class A common stock to decline.
If securities or industry analysts do not publish research, or publish inaccurate or unfavorable research, about our company, the price and trading volume of our Class A common stock could decline.
The trading market for our Class A common stock will depend in part on the research and reports that securities or industry analysts publish about our company, our market, and our competitors. We do not have any control over these analysts. If one or more of the analysts who cover us downgrade our shares or publish inaccurate or unfavorable research about our business, our share price would likely decline. If one or more of these analysts cease coverage of our company or fail to publish reports on our company on a regular basis, demand for our Class A common stock could decrease, which might cause our market price or trading volume to decline.
Provisions in our corporate charter documents and under Washington law could make an acquisition of our company, which may be beneficial to our shareholders, more difficult and may prevent attempts by our shareholders to replace or remove our current management.
Provisions in our amended and restated articles of incorporation and bylaws may discourage, delay, or prevent a merger, acquisition, or other change in control of our company that shareholders may consider favorable, including transactions in which you might otherwise receive a premium for your shares. These provisions could also limit the price that investors might be willing to pay in the future for shares of our common stock, thereby depressing the market price of our common stock. In addition, because our board of directors is responsible for appointing the members of our management team, these provisions may frustrate or prevent any attempts by our shareholders to replace or remove our current management by making it more difficult for shareholders to replace members of our board of directors. Among other things, these provisions:
• | established a classified board of directors so that not all members of our board are elected at one time; |
• | permit only the board of directors to establish the number of directors and fill vacancies on the board; |
• | eliminated the ability of our shareholders to call special meetings of shareholders; |
• | prohibit shareholder action by written consent unless the consent is unanimous, which requires all shareholder actions to be taken at a meeting of our shareholders; |
• | established advance notice requirements for nominations for election to our board or for proposing matters that can be acted upon by shareholders at annual shareholder meetings; |
• | prohibit cumulative voting; |
• | provide that directors may only be removed “for cause” and only with the approval of two-thirds of the voting power of our outstanding shares; |
• | require super-majority voting to amend some provisions in our amended and restated articles of incorporation and amended and restated bylaws; and |
• | authorized the issuance of “blank check” preferred stock that our board could use to implement a shareholder rights plan, also known as a “poison pill.” |
In addition, under Washington law, shareholders of public companies can act by written consent only by obtaining unanimous written consent. This limit on the ability of our shareholders to act by less than unanimous consent may lengthen the amount of time required to take shareholder action.
39
Moreover, because we are incorporated in the State of Washington, we are governed by the provisions of Chapter 23B.19 of the Washington Business Corporation Act (“WBCA”), which prohibits a “target corporation” from engaging in any of a broad range of business combinations with any “acquiring person,” which is defined as a person or group of persons who beneficially owns 10% or more of the voting securities of the “target corporation,” for a period of five years following the date on which the shareholder became an “acquiring person.”
Any of these provisions of our charter documents or Washington law could, under certain circumstances, depress the market price of our Class A common stock. See the section titled “Description of Capital Stock.”
Our amended and restated articles of incorporation designate the federal and state courts located within the State of Washington as the sole and exclusive forum for certain types of actions and proceedings that may be initiated by our shareholders, which could limit our shareholders’ ability to obtain a favorable judicial forum for disputes with us or our directors, officers, employees, or agents.
Our amended and restated articles of incorporation provide that, unless we consent in writing to an alternative forum, the federal courts located in the State of Washington are the sole and exclusive forum for claims under the Securities Act, and the federal and state courts located within the State of Washington (“Washington Courts”), are the sole and exclusive forum for any internal corporate proceedings (as defined in the WBCA), subject to such courts having personal jurisdiction over the indispensable parties named as defendants therein and the claim not being one that is vested in the exclusive jurisdiction of a court or forum other than in Washington Courts, or for which the Washington Courts do not have subject matter jurisdiction. Any person purchasing or otherwise acquiring any interest in any shares of our capital stock shall be deemed to have notice of and to have consented to this provision of our amended and restated articles of incorporation.
This choice of forum provision may limit our shareholders’ ability to bring a claim in a judicial forum that it finds favorable for internal corporate proceedings, which may discourage such lawsuits even though an action, if successful, might benefit our shareholders. Shareholders who do bring a claim in Washington Courts could face additional litigation costs in pursuing any such claim, particularly if they do not reside in or near the State of Washington. Washington Courts may also reach different judgments or results than would other courts, including courts where a shareholder considering an action may be located or would otherwise choose to bring the action, and such judgments or results may be more favorable to us than to our shareholders. Alternatively, if a court were to find this provision of our amended and restated articles of incorporation inapplicable to, or unenforceable in respect of, one or more of the specified types of actions or proceedings, we may incur additional costs associated with resolving such matters in other jurisdictions, which could have an adverse effect on our business, financial condition or results of operations.
Item 1B. Unresolved Staff Comments
None.
Item 2. Properties
Our corporate headquarters are located in Bellevue, Washington, where we currently lease approximately 178,000 square feet under lease agreements that expire at various times from 2021 through 2026.
We also lease facilities on a long-term basis in Boston, Massachusetts; London, England; and Edinburgh, Scotland; and in several other locations on a short-term basis.
We believe that our facilities are suitable to meet our current needs. We intend to expand our facilities or add new facilities as we add employees and enter new geographic markets, and we believe that suitable additional or alternative space will be available as needed to accommodate any such growth.
Item 3. Legal Proceedings
From time to time in the normal course of business, the Company may be subject to various legal matters such as threatened or pending claims or proceedings. We are not currently a party to any material legal proceedings or claims, nor are we aware of any pending or threatened litigation or claims against the Company that could have a
40
material adverse effect on our business, operating results, cash flows, or financial condition should such litigation or claim be resolved unfavorably. An indemnification claim has been made to the Company in a litigation in which a former director and shareholder are parties. At this time, the Company cannot reasonably estimate the magnitude of its indemnification obligation, if any.
Item 4. Mine Safety Disclosures
Not applicable.
Part II
Item 5. Market for Registrant's Common Equity, Related Shareholder Matters and Issuer Purchases of Equity Securities
Our Class A common stock has been listed on the New York Stock Exchange under the symbol "SMAR" since April 27, 2018. Prior to that date, there was no public trading market for our Class A common stock.
Our Class B common stock is not listed or traded on any stock exchange. There are no shares of Class B common stock outstanding.
Holders of Record
As of March 20, 2020, we had 81 holders of record of our Class A common stock. Because many of our shares of Class A common stock are held by brokers and other institutions on behalf of shareholders, we are unable to estimate the total number of beneficial owners of our Class A common stock represented by these holders.
Dividend Policy
We currently do not intend to declare or pay any cash dividends in the foreseeable future.
Stock Performance Graph
This stock performance graph shall not be deemed "soliciting material" or to be "filed" with the SEC for purposes of Section 18 of the Exchange Act, or otherwise subject to the liabilities under that Section, and shall not be deemed to be incorporated by reference into any filing of Smartsheet Inc. under the Securities Act or the Exchange Act.
We have presented below the cumulative total return to our shareholders between April 27, 2018 (the date our Class A common stock commenced trading on the New York Stock Exchange) through January 31, 2020 in comparison to the Standard & Poor’s 500 Index and Standard & Poor Information Technology Index. All values assume a $100 initial investment and data for the Standard & Poor’s 500 Index and Standard & Poor Information Technology Index assume reinvestment of dividends. The comparisons are based on historical data and are not indicative of, nor intended to, forecast the future performance of our Class A common stock.
41
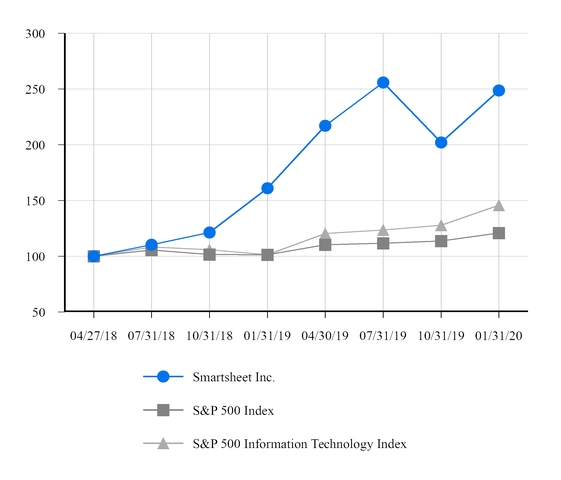
Company/Index | Base Period 4/27/2018 | 7/31/2018 | 10/31/2018 | 1/31/2019 | 4/30/2019 | 7/31/2019 | 10/31/2019 | 1/31/2020 | |||||||||||||||||||||||
Smartsheet Inc. | $ | 100.00 | $ | 110.26 | $ | 121.33 | $ | 160.92 | $ | 217.08 | $ | 255.95 | $ | 202.05 | $ | 248.62 | |||||||||||||||
S&P 500 Index | 100.00 | 105.54 | 101.53 | 101.26 | 110.33 | 111.63 | 113.77 | 120.81 | |||||||||||||||||||||||
S&P 500 Information Technology Index | 100.00 | 108.33 | 105.91 | 101.34 | 120.38 | 123.49 | 127.83 | 145.84 | |||||||||||||||||||||||
Securities Authorized for Issuance Under Equity Compensation Plans
The information required by this item with respect to our equity compensation plans is incorporated by reference to our Proxy Statement for the 2020 Annual Meeting of Shareholders to be filed with the Securities and Exchange Commission within 120 days of the fiscal year ended January 31, 2020.
Recent Sales of Unregistered Securities
None.
Use of Proceeds from Public Offering of Class A Common Stock
On April 26, 2018, our Registration Statement on Form S-1 (File No. 333-223914) was declared effective in connection with the IPO of our Class A common stock.
42
There has been no material change in the planned use of IPO proceeds from that described in the final prospectus filed with the SEC pursuant to Rule 424(b)(4) under the Securities Act of 1933 on April 27, 2018.
Issuer Purchases of Equity Securities
None.
Item 6. Selected Consolidated Financial and Other Data
The following selected consolidated statements of operations data for the years ended January 31, 2020, 2019, and 2018, and the consolidated balance sheet data as of January 31, 2020 and 2019 are derived from our audited consolidated financial statements included elsewhere in this Annual Report. We derived the selected consolidated statements of operations data for the years ended January 31, 2017 and 2016 from our audited consolidated financial statements and related notes thereto, which are not included in this Annual Report. Our historical results are not necessarily indicative of the results that may be expected in the future. You should read the following selected consolidated financial and other data in conjunction with the section titled “Management’s Discussion and Analysis of Financial Condition and Results of Operations” and our consolidated financial statements, the accompanying notes, and other financial information included elsewhere in this Annual Report.
43
Year Ended January 31, | |||||||||||||||||||
2020 | 2019 | 2018 | 2017 | 2016 | |||||||||||||||
(in thousands, except per share data) | |||||||||||||||||||
Consolidated Statements of Operations Data | |||||||||||||||||||
Revenue | |||||||||||||||||||
Subscription | $ | 244,058 | $ | 157,529 | $ | 100,368 | $ | 62,416 | $ | 39,568 | |||||||||
Professional services | 26,824 | 20,193 | 10,885 | 4,548 | 1,183 | ||||||||||||||
Total revenue | 270,882 | 177,722 | 111,253 | 66,964 | 40,751 | ||||||||||||||
Cost of revenue | |||||||||||||||||||
Subscription(1) | 32,707 | 19,297 | 13,008 | 10,117 | 6,961 | ||||||||||||||
Professional services(1) | 20,193 | 14,552 | 8,674 | 4,016 | 1,636 | ||||||||||||||
Total cost of revenue | 52,900 | 33,849 | 21,682 | 14,133 | 8,597 | ||||||||||||||
Gross profit | 217,982 | 143,873 | 89,571 | 52,831 | 32,154 | ||||||||||||||
Operating expenses | |||||||||||||||||||
Research and development(1) | 95,469 | 58,841 | 37,590 | 19,640 | 12,900 | ||||||||||||||
Sales and marketing(1) | 176,060 | 106,067 | 72,925 | 40,071 | 28,440 | ||||||||||||||
General and administrative(1) | 50,227 | 34,049 | 28,034 | 8,275 | 5,163 | ||||||||||||||
Total operating expenses | 321,756 | 198,957 | 138,549 | 67,986 | 46,503 | ||||||||||||||
Loss from operations | (103,774 | ) | (55,084 | ) | (48,978 | ) | (15,155 | ) | (14,349 | ) | |||||||||
Interest income | 8,410 | 3,307 | 540 | — | — | ||||||||||||||
Other income (expense), net | (462 | ) | (1,815 | ) | (975 | ) | (29 | ) | — | ||||||||||
Net loss before income tax provision (benefit) | (95,826 | ) | (53,592 | ) | (49,413 | ) | (15,184 | ) | (14,349 | ) | |||||||||
Income tax provision (benefit) | 114 | 293 | (307 | ) | — | — | |||||||||||||
Net loss | $ | (95,940 | ) | $ | (53,885 | ) | $ | (49,106 | ) | $ | (15,184 | ) | $ | (14,349 | ) | ||||
Deemed dividend(2) | — | — | (4,558 | ) | — | — | |||||||||||||
Net loss attributable to common shareholders | $ | (95,940 | ) | $ | (53,885 | ) | $ | (53,664 | ) | $ | (15,184 | ) | $ | (14,349 | ) | ||||
Net loss per share attributable to common shareholders, basic and diluted(3) | $ | (0.85 | ) | $ | (0.65 | ) | $ | (2.94 | ) | $ | (1.00 | ) | $ | (1.03 | ) | ||||
Weighted-average shares outstanding used to compute net loss per share attributable to common shareholders, basic and diluted(3) | 112,991 | 83,141 | 18,273 | 15,241 | 13,877 | ||||||||||||||
(1) | Amounts include share-based compensation expense as follows: |
Year Ended January 31, | |||||||||||||||||||
2020 | 2019 | 2018 | 2017 | 2016 | |||||||||||||||
(in thousands) | |||||||||||||||||||
Cost of subscription revenue | $ | 1,392 | $ | 346 | $ | 96 | $ | 35 | $ | 23 | |||||||||
Cost of professional services revenue | 1,259 | 466 | 67 | 26 | 4 | ||||||||||||||
Research and development | 14,260 | 5,873 | 6,029 | 452 | 235 | ||||||||||||||
Sales and marketing | 12,937 | 5,163 | 1,707 | 428 | 1,348 | ||||||||||||||
General and administrative | 7,716 | 4,055 | 10,565 | 193 | 69 | ||||||||||||||
Total share-based compensation expense | $ | 37,564 | $ | 15,903 | $ | 18,464 | $ | 1,134 | $ | 1,679 | |||||||||
44
Share-based compensation expense related to the 2017 Tender Offer, which is included in the table above, was as follows:
Year Ended January 31, | |||||||||||||||||||
2020 | 2019 | 2018 | 2017 | 2016 | |||||||||||||||
(in thousands) | |||||||||||||||||||
Cost of subscription revenue | $ | — | $ | — | $ | 53 | $ | — | $ | — | |||||||||
Cost of professional services revenue | — | — | 9 | — | — | ||||||||||||||
Research and development | — | — | 5,124 | — | — | ||||||||||||||
Sales and marketing | — | — | 583 | — | — | ||||||||||||||
General and administrative | — | — | 9,701 | — | — | ||||||||||||||
Total share-based compensation expense | $ | — | $ | — | $ | 15,470 | $ | — | $ | — | |||||||||
(2) | Please refer to Note 10 to our consolidated financial statements included elsewhere in this Annual Report for further information. |
(3) | Please refer to Note 5 to our consolidated financial statements included elsewhere in this Annual Report for an explanation of the calculations of our net loss per share attributable to common shareholders, basic and diluted. |
January 31, | |||||||||||||||||||
2020 | 2019 | 2018 | 2017 | 2016 | |||||||||||||||
(in thousands) | |||||||||||||||||||
Consolidated Balance Sheet Data: | |||||||||||||||||||
Cash, cash equivalents, and short-term investments | $ | 515,924 | $ | 213,085 | $ | 58,158 | $ | 32,235 | $ | 26,535 | |||||||||
Working capital | 397,722 | 110,887 | (1,234 | ) | (4,246 | ) | 7,681 | ||||||||||||
Total assets | 797,714 | 308,744 | 116,604 | 56,253 | 43,965 | ||||||||||||||
Deferred revenue, current and non-current | 158,809 | 96,133 | 57,281 | 32,712 | 19,572 | ||||||||||||||
Finance leases payable, current and non-current | 4,129 | 5,932 | 6,546 | 5,742 | — | ||||||||||||||
Operating lease liabilities, current and non-current | 60,933 | — | — | — | — | ||||||||||||||
Convertible preferred stock warrant liability | — | — | 1,272 | 477 | 283 | ||||||||||||||
Convertible preferred stock | — | — | 112,687 | 60,260 | 60,260 | ||||||||||||||
Total shareholders’ equity (deficit) | 514,060 | 166,992 | (80,741 | ) | (52,743 | ) | (39,604 | ) | |||||||||||
Key Business Metrics
We review the following key business metrics to evaluate our business, measure our performance, identify trends affecting our business, formulate business plans, and make strategic decisions.
January 31, | |||||||||||||||||||
2020 | 2019 | 2018 | 2017 | 2016 | |||||||||||||||
Domain-based customers(1) | 83,901 | 78,959 | 74,116 | 66,645 | 53,920 | ||||||||||||||
Average annualized contract value per domain-based customer | $ | 3,643 | $ | 2,454 | $ | 1,640 | $ | 1,106 | $ | 841 | |||||||||
Dollar-based net retention rate for all customers (trailing 12 months) | 135 | % | 134 | % | 130 | % | 122 | % | 113 | % | |||||||||
(1) Domain-based customers are defined as customers with a unique email domain name such as @cisco.
For additional information about our key business metrics, please see the section titled “Management’s Discussion and Analysis of Financial Condition and Results of Operations—Key Business Metrics.”
45
Item 7. Management’s Discussion and Analysis of Financial Condition and Results of Operations
The following discussion and analysis of our financial condition and results of operations should be read together with our consolidated financial statements and related notes included elsewhere in this Annual Report on Form 10-K. In addition to historical financial information, the following discussion contains forward-looking statements based upon current expectations that involve risks and uncertainties. These statements are often identified by the use of words such as “may,” “will,” “expect,” “believe,” “anticipate,” “intend,” “could,” “estimate,” or “continue,” and similar expressions or variations. Our actual results may differ materially from those anticipated in these forward-looking statements as a result of various factors, including but not limited to those discussed in the section titled “Risk Factors” and in other parts of this Annual Report on Form 10-K. Our fiscal year ends January 31. A discussion, analysis, and comparison of our financial condition, results of operations, and cash flows for the year ended January 31, 2019 to the year ended January 31, 2018 is included in Item 7 of Part II, "Management's Discussion and Analysis of Financial Condition and Results of Operations" in our Annual Report on Form 10-K for the year ended January 31, 2019 filed with the SEC on April 1, 2019.
Overview
We empower everyone to improve how they work. We are a leading cloud-based platform for work execution, enabling teams and organizations to plan, capture, manage, automate, and report on work at scale, resulting in more efficient processes and better business outcomes. We were founded in 2005 with a vision to build a universal application for work management that does not require coding capabilities.
Unstructured or dynamic work is work that has historically been managed using a combination of email, spreadsheets, whiteboards, phone calls, and in-person meetings to communicate with team members and complete projects and processes. It is frequently changing, often ad-hoc, and highly reactive to new information. Our platform helps manage this kind of unstructured work and serves as a single source of truth across work processes, fostering accountability and engagement within teams, leading to more efficient decision-making and better business outcomes.
We generate revenue primarily from the sale of subscriptions to our cloud-based platform. For subscriptions, customers select the plan that meets their needs and can begin using Smartsheet within minutes. We offer four subscription levels: Individual, Business, Enterprise, and Premier, the pricing for which varies by the capabilities provided. Customers can also purchase Connectors, which provide data integration and automation to third-party applications. We also offer Dynamic View, Data Uploader, Control Center and Accelerators, which enable customers to implement solutions for a specific use case or for large scale projects, initiatives, or processes. We acquired 10,000ft in May 2019 which augmented our product portfolio by providing resource allocation and planning. Professional services are offered to help customers create and administer solutions for specific use cases and for training purposes.
Customers can begin using our platform by purchasing a subscription directly from our website or through our sales force, starting a free trial, or working as a collaborator on a project.
COVID-19
In December 2019, the novel COVID-19 coronavirus (“COVID-19”) was reported in China and in March 2020 the World Health Organization declared it a pandemic. The extent of the impact of COVID-19 on our operational and financial performance will depend on certain developments, including the duration and spread of the outbreak, impact on our customers and our sales cycles, and impact on our employees, all of which are uncertain and cannot be predicted. At this time, the extent to which COVID-19 may impact our financial condition or results of operations is uncertain.
46
Key Business Metrics
We review the following key business metrics to evaluate our business, measure our performance, identify trends affecting our business, formulate business plans, and make strategic decisions.
January 31, | |||||||||||
2020 | 2019 | 2018 | |||||||||
Domain-based customers | 83,901 | 78,959 | 74,116 | ||||||||
Average annualized contract value per domain-based customer | $ | 3,643 | $ | 2,454 | $ | 1,640 | |||||
Dollar-based net retention rate for all customers (trailing 12 months) | 135 | % | 134 | % | 130 | % | |||||
Number of domain-based customers
We define domain-based customers as organizations with a unique email domain name such as @cisco. All other customers, which we designate as ISP customers, are typically small teams or individuals who register for our services with an email address hosted on a widely used domain such as @gmail, @outlook, or @yahoo.
In previous fiscal years, including the fiscal year ended January 31, 2020, we considered the number of domain-based customers using our platform to be an indicator of our market penetration, the growth of our business, and our potential future business opportunities.
Over time as our business has grown, an increasing percentage of our total annualized contract values has come from customers with higher annualized contract values. As of January 31, 2020, over 75% of our cumulative total annualized contract value from all customers came from the customers who paid us $5 thousand or more. Due to this concentration in contract value from certain domain-based customers, beginning with February 1, 2020, the count of domain-based customers will be replaced as a key business metric with the following three metrics:
• | Count of customers with annualized contract value (“ACV”) equal to or greater than $5 thousand |
• | Count of customers with ACV equal to or greater than $50 thousand |
• | Count of customers with ACV equal to or greater than $100 thousand |
Effective February 1, 2020, we consider the customer growth in these segments to provide better insight into the effectiveness of our growth strategies, our market penetration, and our potential for future business opportunities. Going forward, these metrics will not include domain-based customers with annualized contract values of under $5,000, which we no longer consider to be a key factor for evaluating our business. These revised metrics for the most recent fiscal years were as follows:
January 31, | ||||||||
2020 | 2019 | 2018 | ||||||
Customers with ACV of $5 thousand or more | 9,079 | 6,192 | 3,790 | |||||
Customers with ACV of $50 thousand or more | 961 | 444 | 189 | |||||
Customers with ACV of $100 thousand or more | 350 | 147 | 65 | |||||
Average ACV per domain-based customer
We use average annualized contract value (“ACV”) per domain-based customer to measure customer commitment to our platform and sales force productivity. We define average ACV per domain-based customer as total outstanding ACV for domain-based subscriptions as of the end of the reporting period divided by the number of domain-based customers as of the same date.
47
Dollar-based net retention rate
We calculate dollar-based net retention rate as of a period end by starting with the ACV from the cohort of all customers as of the 12 months prior to such period end (“Prior Period ACV”). We then calculate the ACV from these same customers as of the current period end (“Current Period ACV”). Current Period ACV includes any upsells and is net of contraction or attrition over the trailing 12 months, but excludes subscription revenue from new customers in the current period. We then divide the total Current Period ACV by the total Prior Period ACV to arrive at the dollar-based net retention rate.
The dollar-based net retention rate is used by us to evaluate the long-term value of our customer relationships and is driven by our ability to retain and expand the subscription revenue generated from our existing customers.
Components of Results of Operations
Revenue
Subscription revenue
Subscription revenue primarily consists of fees from customers for access to our cloud-based platform. We recognize subscription revenue ratably over the term of the subscription period beginning on the date access to our platform is provided, as no implementation work is required, assuming all other revenue recognition criteria have been met.
Professional services revenue
Professional services revenue primarily includes fees for consulting and training services. Our consulting services consist of platform configuration and use case optimization, and are primarily invoiced on a time and materials basis, with some smaller engagements being provided for a fixed fee. We recognize revenue for our consulting services as those services are delivered. Our training services are delivered either remotely or at the customer site. Training services are charged for on a fixed-fee basis and we recognize revenue as the training program is delivered. Our consulting and training services are generally considered to be distinct, for accounting purposes, and we recognize revenue as services are performed or upon completion of work.
Cost of revenue and gross margin
Cost of subscription revenue
Cost of subscription revenue primarily consists of expenses related to hosting our services and providing support, including employee-related costs such as salaries, wages, and related benefits, third-party hosting fees and payment processing fees, software and maintenance costs, allocated overhead, amortization of acquisition-related intangibles, costs of Connectors between Smartsheet and third-party applications, costs of outside services to supplement our internal teams, and travel-related expenses.
We intend to continue to invest in our platform infrastructure and our support organization. We currently utilize a combination of third-party co-location data centers and public cloud service providers. As our platform scales, we may require additional investments in infrastructure to host our platform and support our customers, which may negatively impact our subscription gross margin.
Cost of professional services revenue
Cost of professional services revenue consists primarily of employee-related costs for our consulting and training teams, allocated overhead, billable expenses, software-related costs, travel-related costs, and costs of outside services to supplement our internal teams.
Gross margin
Gross margin is calculated as gross profit expressed as a percentage of total revenue. Our gross margin may fluctuate from period to period as our revenue mix fluctuates, and as a result of the timing and amount of
48
investments to expand our hosting capacity, our continued building of application support and professional services teams, increased share-based compensation expense, as well as the relative proportions of total revenue provided by subscriptions or professional services in a given time period. As we continue to migrate more of our infrastructure to cloud-based hosting providers, we expect our gross margin to decline.
Operating expenses
Research and development
Research and development expenses consist primarily of employee-related costs, hardware- and software-related costs, overhead allocations, costs of outside services used to supplement our internal staff, travel-related costs, and marketing related costs. We consider continued investment in our development talent and our platform to be important for our growth. We expect our research and development expenses to increase in absolute dollars as our business grows and to gradually decrease over the long-term as a percentage of total revenue due to economies of scale.
Sales and marketing
Sales and marketing expenses consist primarily of employee-related costs, costs of general marketing and promotional activities, allocated overhead, travel-related expenses, software-related expenses, costs of outside services used to supplement our internal staff, and amortization of acquisition-related intangibles. Commissions earned by our sales force that are incremental to each customer contract, along with related fringe benefits and taxes, are capitalized and amortized over an estimated useful life of three years. We expect that sales and marketing expenses will increase in absolute dollars as we expect more of our future revenue to come from our inside and direct sales models, rather than through digital self-service sales. We expect sales and marketing costs to gradually decrease over the long-term as a percentage of total revenue due to economies of scale.
General and administrative
General and administrative expenses consist primarily of employee-related costs for accounting, finance, legal, IT, and human resources personnel. In addition, general and administrative expenses include non-personnel costs, such as legal, accounting, and other professional fees, allocated overhead, hardware and software costs, certain tax, license and insurance-related expenses, and travel-related expenses.
We are incurring additional expenses as a result of operating as a public company, including costs to comply with the rules and regulations applicable to companies listed on a national securities exchange, costs related to compliance and reporting obligations pursuant to the rules and regulations of the SEC, and increased expenses for insurance, investor relations, and professional services. We expect our general and administrative expenses to increase in absolute dollars as our business grows, and to gradually decrease over the long term as a percentage of total revenue due to economies of scale.
Interest income
Interest income consists of interest income from our investment holdings.
Other income (expense), net
Other income (expense), net primarily consists of interest expense associated with our finance leases, and foreign exchange gains and losses.
Income tax provision (benefit)
Our income tax provision has not been historically significant to our business as we have incurred operating losses to date. We maintain a valuation allowance on our U.S. federal, state and certain foreign deferred tax assets as we have concluded that it is not more likely than not that the deferred assets will be realized.
49
2017 Tender Offer
During the three months ended July 31, 2017, we facilitated a tender offer (“2017 Tender Offer”), in which our current and former employees and directors were able to sell a portion of their vested shares of common stock to certain existing investors. We recorded share-based compensation expense for the amount paid by our existing investors to our current and former employees and directors in excess of the estimated fair value of our common stock. That total amount resulted in $15.5 million incremental expense for the three months ended July 31, 2017, of which $0.1 million was recorded to cost of revenue, $5.1 million was recorded to research and development expense, $0.6 million was recorded to sales and marketing expense, and $9.7 million was recorded to general and administrative expense. In addition, the excess over the estimated fair value of the sale price of the common and convertible preferred stock sold by non-employees, totaling $4.6 million, was recorded as a deemed dividend within additional paid-in capital. Our quarterly trends in total operating expenses, operating loss, and net loss, were significantly impacted by this transaction, which took place and was completed during the three months ended July 31, 2017.
50
Results of Operations
The following tables set forth our results of operations for the periods presented and as a percentage of our total revenue for those periods:
Year Ended January 31, | |||||||||||
2020 | 2019 | 2018 | |||||||||
(in thousands) | |||||||||||
Revenue | |||||||||||
Subscription | $ | 244,058 | $ | 157,529 | $ | 100,368 | |||||
Professional services | 26,824 | 20,193 | 10,885 | ||||||||
Total revenue | 270,882 | 177,722 | 111,253 | ||||||||
Cost of revenue | |||||||||||
Subscription(1) | 32,707 | 19,297 | 13,008 | ||||||||
Professional services(1) | 20,193 | 14,552 | 8,674 | ||||||||
Total cost of revenue | 52,900 | 33,849 | 21,682 | ||||||||
Gross profit | 217,982 | 143,873 | 89,571 | ||||||||
Operating expenses | |||||||||||
Research and development(1) | 95,469 | 58,841 | 37,590 | ||||||||
Sales and marketing(1) | 176,060 | 106,067 | 72,925 | ||||||||
General and administrative(1) | 50,227 | 34,049 | 28,034 | ||||||||
Total operating expenses | 321,756 | 198,957 | 138,549 | ||||||||
Loss from operations | (103,774 | ) | (55,084 | ) | (48,978 | ) | |||||
Interest income | 8,410 | 3,307 | 540 | ||||||||
Other income (expense), net | (462 | ) | (1,815 | ) | (975 | ) | |||||
Net loss before income tax provision (benefit) | (95,826 | ) | (53,592 | ) | (49,413 | ) | |||||
Income tax provision (benefit) | 114 | 293 | (307 | ) | |||||||
Net loss | $ | (95,940 | ) | $ | (53,885 | ) | $ | (49,106 | ) | ||
(1) | Amounts include share-based compensation expense as follows: |
Year Ended January 31, | |||||||||||
2020 | 2019 | 2018 | |||||||||
(in thousands) | |||||||||||
Cost of subscription revenue | $ | 1,392 | $ | 346 | $ | 96 | |||||
Cost of professional services revenue | 1,259 | 466 | 67 | ||||||||
Research and development | 14,260 | 5,873 | 6,029 | ||||||||
Sales and marketing | 12,937 | 5,163 | 1,707 | ||||||||
General and administrative | 7,716 | 4,055 | 10,565 | ||||||||
Total share-based compensation expense | $ | 37,564 | $ | 15,903 | $ | 18,464 | |||||
51
Share-based compensation expense related to the 2017 Tender Offer, which is included in the table above, was as follows:
Year Ended January 31, | |||||||||||
2020 | 2019 | 2018 | |||||||||
(in thousands) | |||||||||||
Cost of subscription revenue | $ | — | $ | — | $ | 53 | |||||
Cost of professional services revenue | — | — | 9 | ||||||||
Research and development | — | — | 5,124 | ||||||||
Sales and marketing | — | — | 583 | ||||||||
General and administrative | — | — | 9,701 | ||||||||
Total share-based compensation expense | $ | — | $ | — | $ | 15,470 | |||||
The following table sets forth the components of our statements of operations data, for each of the periods presented, as a percentage of total revenue.
Year Ended January 31, | ||||||||
2020 | 2019 | 2018 | ||||||
Revenue | ||||||||
Subscription | 90 | % | 89 | % | 90 | % | ||
Professional services | 10 | 11 | 10 | |||||
Total revenue | 100 | 100 | 100 | |||||
Cost of revenue | ||||||||
Subscription | 12 | 11 | 12 | |||||
Professional services | 7 | 8 | 8 | |||||
Total cost of revenue | 20 | 19 | 19 | |||||
Gross profit | 80 | 81 | 81 | |||||
Operating expenses | ||||||||
Research and development | 35 | 33 | 34 | |||||
Sales and marketing | 65 | 60 | 66 | |||||
General and administrative | 19 | 19 | 25 | |||||
Total operating expenses | 119 | 112 | 125 | |||||
Loss from operations | (38 | ) | (31 | ) | (44 | ) | ||
Interest income | 3 | 2 | — | |||||
Other income (expense), net | — | (1 | ) | — | ||||
Net loss before income tax provision (benefit) | (35 | ) | (30 | ) | (44 | ) | ||
Income tax provision (benefit) | — | — | — | |||||
Net loss | (35 | )% | (30 | )% | (44 | )% | ||
52
Comparison of the years ended January 31, 2020 and 2019
Revenue
Year Ended January 31, | Change | |||||||||||||
2020 | 2019 | Amount | % | |||||||||||
(dollars in thousands) | ||||||||||||||
Revenue | ||||||||||||||
Subscription | $ | 244,058 | $ | 157,529 | $ | 86,529 | 55 | % | ||||||
Professional services | 26,824 | 20,193 | 6,631 | 33 | % | |||||||||
Total revenue | $ | 270,882 | $ | 177,722 | $ | 93,160 | 52 | % | ||||||
Percentage of total revenue | ||||||||||||||
Subscription revenue | 90 | % | 89 | % | ||||||||||
Professional services revenue | 10 | % | 11 | % | ||||||||||
The increase in subscription revenue between periods was driven by increased contributions from existing customers, as evidenced by our dollar-based net retention rate of 135% for the trailing 12-month period ended January 31, 2020, followed by contributions from new customers, as evidenced by the 6% increase in the number of domain-based customers.
The increase in professional services revenue was primarily driven by increasing demand for our consulting and training services.
Cost of revenue, gross profit, and gross margin
Year Ended January 31, | Change | |||||||||||||
2020 | 2019 | Amount | % | |||||||||||
(dollars in thousands) | ||||||||||||||
Cost of revenue | ||||||||||||||
Subscription | $ | 32,707 | $ | 19,297 | $ | 13,410 | 69 | % | ||||||
Professional services | 20,193 | 14,552 | 5,641 | 39 | % | |||||||||
Total cost of revenue | $ | 52,900 | $ | 33,849 | $ | 19,051 | 56 | % | ||||||
Gross profit | $ | 217,982 | $ | 143,873 | $ | 74,109 | 52 | % | ||||||
Gross margin | ||||||||||||||
Subscription | 87 | % | 88 | % | ||||||||||
Professional services | 25 | % | 28 | % | ||||||||||
Total gross margin | 80 | % | 81 | % | ||||||||||
Cost of subscription revenue increased $13.4 million, or 69%, for the year ended January 31, 2020 compared to the year ended January 31, 2019. The increase was primarily due to an increase of $5.8 million in employee-related expenses due to increased headcount, of which $1.0 million was related to share-based compensation expenses, an increase of $3.5 million in data center and hosting costs, an increase of $1.4 million in amortization of acquisition-related intangibles, an increase of $1.1 million in software-related costs, an increase of $0.9 million in allocated overhead costs, an increase of $0.5 million in credit card processing fees, and an increase of $0.1 million in professional services and fees.
53
Our gross margin for subscription revenue was 87% and 88% for the years ended January 31, 2020 and 2019, respectively. Our gross margin for subscription revenue decreased primarily due to increased share-based compensation expenses and amortization of acquisition-related intangibles, partially offset by data center and hosting costs which decreased as a percentage of revenue, year over year, due to economies of scale. As we migrate more of our infrastructure to cloud-based hosting providers, add new functionality, expand internationally, and serve more regulated markets, our gross margin for subscription revenue will likely decline.
Cost of professional services revenue increased $5.6 million, or 39%, for the year ended January 31, 2020 compared to the year ended January 31, 2019. The increase was primarily due to an increase of $4.7 million in employee-related expenses, of which $0.8 million was related to share-based compensation expenses, as we continued to grow our professional services offerings and workforce, an increase of $0.6 million in allocated overhead costs, an increase of $0.2 million in software-related costs, and an increase of $0.1 million in travel-related costs.
Our gross margin for professional services revenue was 25% and 28% for the year ended January 31, 2020 and 2019, respectively. We expect our gross margin for professional services to decline in the future as we expand our team to support increasing demand.
Operating expenses
Research and development expenses
Year Ended January 31, | Change | |||||||||||||
2020 | 2019 | Amount | % | |||||||||||
(dollars in thousands) | ||||||||||||||
Research and development | $ | 95,469 | $ | 58,841 | $ | 36,628 | 62 | % | ||||||
Percentage of total revenue | 35 | % | 33 | % | ||||||||||
Research and development expenses increased $36.6 million, or 62%, for the year ended January 31, 2020 as compared to the year ended January 31, 2019. The increase was primarily due to an increase of $29.8 million in employee-related expenses due to increased headcount, of which $8.4 million related to increased share-based compensation expenses, an increase of $2.4 million in costs of outside services used to supplement our internal staff, an increase of $2.3 million in software-related costs, and an increase of $2.0 million in allocated overhead expense.
Sales and marketing expenses
Year Ended January 31, | Change | |||||||||||||
2020 | 2019 | Amount | % | |||||||||||
(dollars in thousands) | ||||||||||||||
Sales and marketing | $ | 176,060 | $ | 106,067 | $ | 69,993 | 66 | % | ||||||
Percentage of total revenue | 65 | % | 60 | % | ||||||||||
Sales and marketing expenses increased $70.0 million, or 66%, for the year ended January 31, 2020 as compared to the year ended January 31, 2019. The increase was primarily due to an increase of $46.7 million in employee-related expenses due to increased headcount, of which $8.0 million related to increased share-based compensation expenses, an increase in marketing costs of $14.7 million, primarily due to a larger ENGAGE customer conference, investment in brand marketing, and pay-per-click advertising, an increase of $3.7 million in allocated overhead costs, an increase of $1.8 million in travel-related costs, an increase of $1.6 million in software-related costs, an increase of $0.9 million in amortization of acquisition-related intangibles, an increase of $0.4 million in costs of outside services used to supplement our internal staff, and an increase of $0.1 million in taxes, licenses and insurance.
54
General and administrative expenses
Year Ended January 31, | Change | |||||||||||||
2020 | 2019 | Amount | % | |||||||||||
(dollars in thousands) | ||||||||||||||
General and administrative | $ | 50,227 | $ | 34,049 | $ | 16,178 | 48 | % | ||||||
Percentage of total revenue | 19 | % | 19 | % | ||||||||||
General and administrative expenses increased $16.2 million, or 48%, for the year ended January 31, 2020 as compared to the year ended January 31, 2019. The increase was primarily due to an increase in employee-related expenses of $11.1 million, of which $3.7 million related to increased share-based compensation expenses, an increase of $3.9 million in costs for audit, accounting, legal, and other professional fees, an increase of $0.9 million in allocated overhead costs, an increase of $0.5 million in software-related costs, and an increase of $0.2 million in travel-related costs. This was offset by a decrease of $0.5 million in taxes, licenses, insurance, and other.
Interest income
Year Ended January 31, | Change | |||||||||||||
2020 | 2019 | Amount | % | |||||||||||
(dollars in thousands) | ||||||||||||||
Interest income | $ | 8,410 | $ | 3,307 | $ | 5,103 | 154 | % | ||||||
Percentage of total revenue | 3 | % | 2 | % | ||||||||||
For the year ended January 31, 2020 compared to the year ended January 31, 2019, the increase in interest income of $5.1 million was driven by higher monetary value of cash, cash equivalents, and short-term investments held in interest-bearing accounts and instruments. Our ability to earn interest in the future is dependent upon the interest rate environment, and our interest income may significantly decrease.
Other income (expense), net
Year Ended January 31, | Change | |||||||||||||
2020 | 2019 | Amount | % | |||||||||||
(dollars in thousands) | ||||||||||||||
Other income (expense), net | $ | (462 | ) | $ | (1,815 | ) | $ | 1,353 | 75 | % | ||||
Percentage of total revenue | — | % | (1 | )% | ||||||||||
For the year ended January 31, 2020 compared to the year ended January 31, 2019, the change in other income (expense), net was driven by a decrease of $1.3 million in warrant expense and a decrease of $0.1 million in interest expense.
Quarterly Results of Operations and Other Data
The following tables set forth selected unaudited quarterly statements of operations data for each of the eight fiscal quarters ended January 31, 2020, as well as the percentage of total revenue that each line item represents for each quarter. The information for each of these quarters has been prepared on the same basis as the audited annual consolidated financial statements included elsewhere in this Annual Report and, in the opinion of management, includes all adjustments, which consist only of normal recurring adjustments, necessary for the fair presentation of the results of operations for these periods. This data should be read in conjunction with our audited consolidated financial statements and related notes included elsewhere in this Annual Report. These quarterly results are not necessarily indicative of our results of operations to be expected for any future period.
55
Three Months Ended | |||||||||||||||||||||||||||||||
Jan. 31, 2020 | Oct. 31, 2019 | Jul. 31, 2019 | Apr. 30, 2019 | Jan. 31, 2019 | Oct. 31, 2018 | Jul. 31, 2018 | Apr. 30, 2018 | ||||||||||||||||||||||||
Revenue | |||||||||||||||||||||||||||||||
Subscription | $ | 71,067 | $ | 64,355 | $ | 58,315 | $ | 50,321 | $ | 46,482 | $ | 41,520 | $ | 37,470 | $ | 32,057 | |||||||||||||||
Professional services | 7,452 | 7,170 | 6,329 | 5,873 | 5,669 | 5,348 | 4,914 | 4,262 | |||||||||||||||||||||||
Total revenue | 78,519 | 71,525 | 64,644 | 56,194 | 52,151 | 46,868 | 42,384 | 36,319 | |||||||||||||||||||||||
Cost of revenue | |||||||||||||||||||||||||||||||
Subscription(1) | 9,657 | 8,867 | 7,982 | 6,201 | 5,600 | 4,873 | 4,588 | 4,236 | |||||||||||||||||||||||
Professional services(1) | 5,995 | 5,231 | 4,683 | 4,284 | 4,067 | 3,831 | 3,567 | 3,087 | |||||||||||||||||||||||
Total cost of revenue | 15,652 | 14,098 | 12,665 | 10,485 | 9,667 | 8,704 | 8,155 | 7,323 | |||||||||||||||||||||||
Gross profit | 62,867 | 57,427 | 51,979 | 45,709 | 42,484 | 38,164 | 34,229 | 28,996 | |||||||||||||||||||||||
Operating expenses | |||||||||||||||||||||||||||||||
Research and development(1) | 27,973 | 25,049 | 22,210 | 20,238 | 15,986 | 15,599 | 14,412 | 12,844 | |||||||||||||||||||||||
Sales and marketing(1) | 50,491 | 50,896 | 39,260 | 35,413 | 29,344 | 30,084 | 24,255 | 22,384 | |||||||||||||||||||||||
General and administrative(1) | 14,499 | 13,330 | 11,457 | 10,939 | 9,839 | 8,888 | 8,524 | 6,798 | |||||||||||||||||||||||
Total operating expenses | 92,963 | 89,275 | 72,927 | 66,590 | 55,169 | 54,571 | 47,191 | 42,026 | |||||||||||||||||||||||
Loss from operations | (30,096 | ) | (31,848 | ) | (20,948 | ) | (20,881 | ) | (12,685 | ) | (16,407 | ) | (12,962 | ) | (13,030 | ) | |||||||||||||||
Interest income | 2,337 | 2,810 | 2,114 | 1,149 | 1,216 | 1,016 | 908 | 168 | |||||||||||||||||||||||
Other income (expense), net | (219 | ) | 187 | (319 | ) | (112 | ) | (33 | ) | (156 | ) | (159 | ) | (1,468 | ) | ||||||||||||||||
Net loss before income tax provision (benefit) | (27,978 | ) | (28,851 | ) | (19,153 | ) | (19,844 | ) | (11,502 | ) | (15,547 | ) | (12,213 | ) | (14,330 | ) | |||||||||||||||
Income tax provision (benefit) | 182 | 5 | (39 | ) | (35 | ) | 183 | 22 | 88 | — | |||||||||||||||||||||
Net loss | $ | (28,160 | ) | $ | (28,856 | ) | $ | (19,114 | ) | $ | (19,809 | ) | $ | (11,685 | ) | $ | (15,569 | ) | $ | (12,301 | ) | $ | (14,330 | ) | |||||||
Net loss per share, basic and diluted | $ | (0.24 | ) | $ | (0.25 | ) | $ | (0.17 | ) | $ | (0.19 | ) | $ | (0.11 | ) | $ | (0.15 | ) | $ | (0.12 | ) | $ | (0.68 | ) | |||||||
(1) | Amounts include share-based compensation expense as follows: |
Three Months Ended | |||||||||||||||||||||||||||||||
Jan. 31, 2020 | Oct. 31, 2019 | Jul. 31, 2019 | Apr. 30, 2019 | Jan. 31, 2019 | Oct. 31, 2018 | Jul. 31, 2018 | Apr. 30, 2018 | ||||||||||||||||||||||||
Cost of subscription revenue | $ | 435 | $ | 366 | $ | 356 | $ | 235 | $ | 132 | $ | 96 | $ | 84 | $ | 34 | |||||||||||||||
Cost of professional services revenue | 401 | 343 | 298 | 217 | 120 | 149 | 150 | 47 | |||||||||||||||||||||||
Research and development | 4,737 | 3,934 | 3,317 | 2,272 | 1,278 | 2,552 | 1,378 | 665 | |||||||||||||||||||||||
Sales and marketing | 4,036 | 3,516 | 3,276 | 2,108 | 1,306 | 1,973 | 1,370 | 514 | |||||||||||||||||||||||
General and administrative | 2,243 | 2,170 | 1,839 | 1,464 | 1,083 | 1,274 | 1,116 | 582 | |||||||||||||||||||||||
Total share-based compensation expense | $ | 11,852 | $ | 10,329 | $ | 9,086 | $ | 6,296 | $ | 3,919 | $ | 6,044 | $ | 4,098 | $ | 1,842 | |||||||||||||||
56
All values from the statement of operations, expressed as percentage of total revenue were as follows:
Three Months Ended | |||||||||||||||||||||||
Jan. 31, 2020 | Oct. 31, 2019 | Jul. 31, 2019 | Apr. 30, 2019 | Jan. 31, 2019 | Oct. 31, 2018 | Jul. 31, 2018 | Apr. 30, 2018 | ||||||||||||||||
Revenue | |||||||||||||||||||||||
Subscription | 91 | % | 90 | % | 90 | % | 90 | % | 89 | % | 89 | % | 88 | % | 88 | % | |||||||
Professional services | 9 | 10 | 10 | 10 | 11 | 11 | 12 | 12 | |||||||||||||||
Total revenue | 100 | 100 | 100 | 100 | 100 | 100 | 100 | 100 | |||||||||||||||
Cost of revenue | |||||||||||||||||||||||
Subscription | 12 | 12 | 12 | 11 | 11 | 10 | 11 | 12 | |||||||||||||||
Professional services | 8 | 7 | 7 | 8 | 8 | 8 | 8 | 8 | |||||||||||||||
Total cost of revenue | 20 | 20 | 20 | 19 | 19 | 19 | 19 | 20 | |||||||||||||||
Gross profit | 80 | 80 | 80 | 81 | 81 | 81 | 81 | 80 | |||||||||||||||
Operating expenses | |||||||||||||||||||||||
Research and development | 36 | 35 | 34 | 36 | 31 | 33 | 34 | 35 | |||||||||||||||
Sales and marketing | 64 | 71 | 61 | 63 | 56 | 64 | 57 | 62 | |||||||||||||||
General and administrative | 18 | 19 | 18 | 19 | 19 | 19 | 20 | 19 | |||||||||||||||
Total operating expenses | 118 | 125 | 113 | 119 | 106 | 116 | 111 | 116 | |||||||||||||||
Loss from operations | (38 | ) | (45 | ) | (32 | ) | (37 | ) | (24 | ) | (35 | ) | (31 | ) | (36 | ) | |||||||
Interest income | 3 | 4 | 3 | 2 | 2 | 2 | 2 | — | |||||||||||||||
Other income (expense), net | — | — | — | — | — | — | — | (4 | ) | ||||||||||||||
Net loss before income tax provision (benefit) | (36 | ) | (40 | ) | (30 | ) | (35 | ) | (22 | ) | (33 | ) | (29 | ) | (39 | ) | |||||||
Income tax provision (benefit) | — | — | — | — | — | — | — | — | |||||||||||||||
Net loss | (36 | )% | (40 | )% | (30 | )% | (35 | )% | (22 | )% | (33 | )% | (29 | )% | (39 | )% | |||||||
Quarterly revenue trends
Our quarterly revenue increased sequentially in each of the periods presented due primarily to expansion within existing customers, increases in the number of new customers, and sales of new offerings.
We believe that our professional services business is subject to negative seasonal trends during the holiday period of our fourth fiscal quarter due to the fewer number of business days during this period. The growth in our business has offset this seasonal trend to date, but its impact may be more pronounced in future periods.
Quarterly cost of revenue and gross margin trends
Our quarterly gross margin has remained relatively consistent, varying between 80% and 81%, as we have invested in our own co-location data centers, which have generated economies of scale, partially offset by a proportional increase in lower-margin professional services revenue. As we continue to migrate more of our infrastructure to cloud-based hosting providers, we expect our gross margin to decline.
Quarterly operating expense trends
Total operating expenses generally increased for the fiscal quarters presented primarily due to the addition of personnel, related overhead, and investments in hardware and software in connection with the expansion of our business.
57
Our sales and marketing expenses as a percentage of total revenue generated in the three months ended October 31 of each year increased due to our ENGAGE customer conference. We intend to continue to host ENGAGE annually during our third fiscal quarter.
Our general and administrative expenses as a percentage of total revenue have increased since the quarter ended January 31, 2018 in preparation for, and as a result of, operating as a public company. We expect these expenses to increase in absolute dollars as our business grows, and to gradually decrease over the long-term as a percentage of total revenue due to economies of scale.
Non-GAAP Financial Measures
In addition to our results determined in accordance with generally accepted accounting principles in the United States (“GAAP”), we believe the following non-GAAP financial measures are useful in evaluating our operating performance. We use the below referenced non-GAAP financial measures, collectively, to evaluate our ongoing operations and for internal planning and forecasting purposes. We believe that non-GAAP financial measures, when taken collectively, may be helpful to investors because they provide consistency and comparability with past financial performance, and assist in comparisons with other companies, some of which use similar non-GAAP financial measures to supplement their GAAP results. The non-GAAP financial measures are presented for supplemental informational purposes only, and should not be considered a substitute for financial measures presented in accordance with GAAP, and may be different from similarly-titled non-GAAP measures used by other companies. A reconciliation is provided below for each non-GAAP financial measure to the most directly comparable financial measure stated in accordance with GAAP. Investors are encouraged to review the related GAAP financial measures and the reconciliation of these non-GAAP financial measures to their most directly comparable GAAP financial measures.
Limitations of non-GAAP financial measures
Our non-GAAP financial measures have limitations as analytical tools and you should not consider them in isolation or as a substitute for an analysis of our results under GAAP. There are a number of limitations related to the use of these non-GAAP financial measures versus their nearest GAAP equivalents. First, free cash flow and calculated billings are not substitutes for net cash used in operating activities and total revenue, respectively. Similarly, non-GAAP gross profit and non-GAAP operating loss are not substitutes for gross profit and operating loss, respectively. Second, other companies may calculate similar non-GAAP financial measures differently or may use other measures as tools for comparison. Additionally, the utility of free cash flow as a measure of our financial performance and liquidity is further limited as it does not represent the total increase or decrease in our cash balance for a given period. Furthermore, as calculated billings are affected by a combination of factors, including the timing of sales, the mix of monthly and annual subscriptions sold and the relative duration of subscriptions sold, and each of these elements has unique characteristics in the relationship between calculated billings and total revenue, our calculated billings activity is not closely correlated to revenue except over longer periods of time.
58
Non-GAAP gross profit and non-GAAP gross margin
We define non-GAAP gross profit as gross profit adjusted for share-based compensation expense and amortization of acquisition-related intangible assets. Non-GAAP gross margin represents non-GAAP gross profit as a percentage of total revenue.
Year Ended January 31, | |||||||||||
2020 | 2019 | 2018 | |||||||||
(dollars in thousands) | |||||||||||
Gross profit | $ | 217,982 | $ | 143,873 | $ | 89,571 | |||||
Add: | |||||||||||
Share-based compensation expense(1)(2) | 2,651 | 812 | 163 | ||||||||
Amortization of acquisition-related intangible assets | 1,831 | 456 | 38 | ||||||||
One-time costs of acquisition | 69 | — | — | ||||||||
Non-GAAP gross profit | $ | 222,533 | $ | 145,141 | $ | 89,772 | |||||
Gross margin | 80 | % | 81 | % | 81 | % | |||||
Non-GAAP gross margin | 82 | % | 82 | % | 81 | % | |||||
(1) | Share-based compensation expense for the year ended January 31, 2018 includes share-based compensation expense related to the 2017 Tender Offer. |
(2) | Includes amortization related to share-based compensation expense that was capitalized in internal-use software in previous periods. |
Non-GAAP operating loss and non-GAAP operating margin
We define non-GAAP operating loss as loss from operations adjusted for share-based compensation expense, amortization of acquisition-related intangible assets, and one-time costs of acquisition. Non-GAAP operating margin represents non-GAAP operating loss as a percentage of total revenue.
Year Ended January 31, | |||||||||||
2020 | 2019 | 2018 | |||||||||
(dollars in thousands) | |||||||||||
Loss from operations | $ | (103,774 | ) | $ | (55,084 | ) | $ | (48,978 | ) | ||
Add: | |||||||||||
Share-based compensation expense(1)(2) | 37,564 | 15,903 | 18,464 | ||||||||
Amortization of acquisition-related intangible assets | 2,734 | 480 | 40 | ||||||||
One-time acquisition costs | 686 | 196 | 195 | ||||||||
Non-GAAP operating loss | $ | (62,790 | ) | $ | (38,505 | ) | $ | (30,279 | ) | ||
Operating margin | (38 | )% | (31 | )% | (44 | )% | |||||
Non-GAAP operating margin | (23 | )% | (22 | )% | (21 | )% | |||||
(1) | Share-based compensation expense for the year ended January 31, 2018 includes share-based compensation expense related to the 2017 Tender Offer. |
(2) | Includes amortization related to share-based compensation expense that was capitalized in internal-use software in previous periods. |
59
Non-GAAP net loss
We define non-GAAP net loss as net loss adjusted for share-based compensation expense, amortization of acquisition-related intangible assets, one-time costs of acquisition, and remeasurement of convertible preferred stock warrant liability.
Year Ended January 31, | |||||||||||
2020 | 2019 | 2018 | |||||||||
(in thousands) | |||||||||||
Net loss | $ | (95,940 | ) | $ | (53,885 | ) | $ | (49,106 | ) | ||
Add: | |||||||||||
Share-based compensation expense(1)(2) | 37,564 | 15,903 | 18,464 | ||||||||
Amortization of acquisition-related intangible assets | 2,734 | 480 | 40 | ||||||||
One-time acquisition costs | 686 | 196 | 195 | ||||||||
Remeasurement of convertible preferred stock warrant liability | — | 1,326 | 795 | ||||||||
Non-GAAP net loss | $ | (54,956 | ) | $ | (35,980 | ) | $ | (29,612 | ) | ||
(1) | Share-based compensation expense for the year ended January 31, 2018 includes share-based compensation expense related to the 2017 Tender Offer. |
(2) | Includes amortization related to share-based compensation expense that was capitalized in internal-use software in previous periods. |
Free cash flow
We define free cash flow as net cash provided by (used in) operating activities less cash used for purchases of property and equipment, capitalized internal-use software, and payments on finance lease obligations. We believe free cash flow facilitates period-to-period comparisons of liquidity. We consider free cash flow to be a key performance metric because it measures the amount of cash we generate from our operations after our capital expenditures, payments on finance lease obligations and changes in working capital. We use free cash flow in conjunction with traditional GAAP measures as part of our overall assessment of our liquidity, including the preparation of our annual operating budget and quarterly forecasts, to evaluate the effectiveness of our business strategies, and to communicate with our board of directors concerning our liquidity.
Year Ended January 31, | |||||||||||
2020 | 2019 | 2018 | |||||||||
(in thousands) | |||||||||||
Net cash used in operating activities | $ | (10,870 | ) | $ | (2,855 | ) | $ | (13,581 | ) | ||
Less: | |||||||||||
Purchases of property and equipment | (5,153 | ) | (5,767 | ) | (6,006 | ) | |||||
Capitalized internal-use software | (6,699 | ) | (3,017 | ) | (3,350 | ) | |||||
Payments on principal of finance leases | (4,167 | ) | (3,253 | ) | (2,326 | ) | |||||
Free cash flow | $ | (26,889 | ) | $ | (14,892 | ) | $ | (25,263 | ) | ||
Calculated billings
We define calculated billings as total revenue plus the change in deferred revenue in the period. Because we recognize subscription revenue ratably over the subscription term, calculated billings can be used to measure our
60
subscription sales activity for a particular period, to compare subscription sales activity across particular periods, and as an indicator of future subscription revenue.
Because we generate most of our revenue from customers who are invoiced on an annual basis, and because we have a wide range of customers, from those who pay us less than $200 per year to those who pay us more than $3.0 million per year, we experience seasonality and variability that is tied to typical enterprise buying patterns and contract renewal dates of our largest customers. We expect that our billings trends will continue to vary in future periods based on the timing and size of new and renewal bookings.
Year Ended January 31, | |||||||||||
2020 | 2019 | 2018 | |||||||||
(in thousands) | |||||||||||
Total revenue | $ | 270,882 | $ | 177,722 | $ | 111,253 | |||||
Add: | |||||||||||
Deferred revenue (end of period) | 158,809 | 96,133 | 57,281 | ||||||||
Less: | |||||||||||
Deferred revenue (beginning of period) | 96,133 | 57,281 | 32,712 | ||||||||
Calculated billings | $ | 333,558 | $ | 216,574 | $ | 135,822 | |||||
Non-GAAP weighted average shares outstanding
We use non-GAAP weighted average shares outstanding in calculating non-GAAP earnings per share. Our number of non-GAAP weighted average shares outstanding is calculated after assuming conversion of all outstanding preferred stock into shares of common stock either at the beginning of the fiscal period presented or when issued, if later.
Year Ended January 31, | ||||||||
2020 | 2019 | 2018 | ||||||
(in thousands) | ||||||||
GAAP weighted-average shares outstanding used in computing net loss per share attributable to common shareholders, basic and diluted | 112,991 | 83,141 | 18,273 | |||||
Add: common shares that would have resulted from conversion of convertible preferred stock at the beginning of the period, or when granted (if later), on a weighted average basis | — | 16,698 | 66,595 | |||||
Non-GAAP weighted-average shares outstanding used in computing net loss per share attributable to common shareholders, basic and diluted | 112,991 | 99,839 | 84,868 | |||||
Liquidity and Capital Resources
As of January 31, 2020, our principal sources of liquidity were cash and cash equivalents totaling $515.9 million, which were held for working capital purposes. Our cash equivalents were comprised primarily of money market funds. We have generated significant operating losses and negative cash flows from operations as reflected in our accumulated deficit and consolidated statements of cash flows. We expect to continue to incur operating losses and negative cash flows from operations for the foreseeable future.
We have financed our operations primarily through payments received from customers for subscriptions and professional services, net proceeds we received through sales of equity securities, option exercises, and contributions from our Employee Stock Purchase Plan (“ESPP”), finance leases, and interest income.
61
We believe our existing cash, cash equivalents, and cash provided by sales of our products and services will be sufficient to meet our working capital and capital expenditure needs for at least the next 12 months. Our future capital requirements will depend on many factors, including our subscription growth rate, subscription renewal activity, billing frequency, the timing and extent of spending to support development efforts, the expansion of sales and marketing activities, the introduction of new and enhanced product offerings, and the continuing market adoption of our product. We may, in the future, enter into arrangements to acquire or invest in complementary businesses, services, and technologies, including intellectual property rights. We may be required to seek additional equity or debt financing. In the event that additional financing is required from outside sources, we may not be able to raise it on terms acceptable to us, or at all. If we are unable to raise additional capital or generate cash flows necessary to expand our operations and invest in new technologies, our ability to compete successfully could be reduced, and this could harm our results of operations.
A significant majority of our customers pay in advance for annual subscriptions. Therefore, a substantial source of our cash is from our deferred revenue, which is included on our balance sheet as a liability. Deferred revenue consists primarily of the unearned portion of billed fees for our subscriptions, which is recognized as revenue in accordance with our revenue recognition policy. As of January 31, 2020, we had deferred revenue of $158.8 million, of which $158.0 million was recorded as a current liability and was expected to be recognized as revenue in the subsequent 12 months, provided all recognition criteria are met.
Cash flows
The following table summarizes our cash flows for the periods indicated:
Year Ended January 31, | |||||||||||
2020 | 2019 | 2018 | |||||||||
Net cash used in operating activities | $ | (10,870 | ) | $ | (2,855 | ) | $ | (13,581 | ) | ||
Net cash used in investing activities | (90,043 | ) | (13,784 | ) | (809 | ) | |||||
Net cash provided by financing activities | 402,022 | 171,321 | 51,436 | ||||||||
Effects of changes in foreign currency exchange rates on cash, cash equivalents, and restricted cash | (25 | ) | (36 | ) | — | ||||||
Net increase in cash, cash equivalents, and restricted cash | $ | 301,084 | $ | 154,646 | $ | 37,046 | |||||
Operating activities
Our largest sources of operating cash are cash collections from our customers for subscription and professional services. Our primary uses of cash from operating activities are for employee-related expenditures and sales and marketing expenses. Historically, we have generated negative cash flows from operating activities during most fiscal years, and have supplemented working capital requirements through net proceeds from the sale of equity securities.
During the year ended January 31, 2020, net cash used in operating activities was $10.9 million, driven by our net loss of $95.9 million, adjusted for non-cash charges of $78.8 million, and net cash inflows of $6.3 million provided by changes in our operating assets and liabilities. Non-cash charges primarily consisted of share-based compensation, amortization of deferred commissions, depreciation of property and equipment, amortization of lease right-of-use assets, and amortization of intangible assets. Fluctuations in operating assets and liabilities included an increase in deferred revenue of $61.6 million, an increase in deferred commissions of $39.0 million, an increase in accounts receivable of $26.0 million, an increase in accounts payable and accrued expenses of $21.4 million, an increase in operating lease right-of-use assets of $12.2 million, an increase in operating lease liabilities of $5.6 million, an increase in prepaid expenses and other current assets of $3.9 million, a decrease in other long-term liabilities of $1.0 million, and an increase in other long-term assets of $0.3 million.
During the year ended January 31, 2019, net cash used in operating activities was $2.9 million, driven by our net loss of $53.9 million, adjusted for non-cash charges of $35.7 million, and net cash inflows of $15.3 million provided by changes in our operating assets and liabilities. Non-cash charges primarily consisted of share-based
62
compensation, amortization of deferred commissions, depreciation of property and equipment, remeasurement of the convertible preferred stock warrant liability, and amortization of intangible assets. Notable fluctuations in operating assets and liabilities included an increase in deferred revenue of $38.9 million, an increase in deferred commissions of $24.5 million, an increase in accounts receivable of $15.3 million, an increase in accounts payable and accrued expenses of $14.2 million, an increase in other long-term liabilities of $1.3 million, a decrease in prepaid expenses and other current assets of $0.5 million, and a decrease in other long-term assets of $0.2 million.
Investing activities
Net cash used in investing activities during the year ended January 31, 2020 of $90.0 million consisted of purchases of short-term investments of $100.5 million, payments for business acquisition, net of cash acquired, of $26.7 million, spend on capitalized internal-use software development of $6.7 million, purchases of property and equipment of $5.2 million, and a purchase of a long-term investment of $1.0 million. This was offset by proceeds from maturity of an investment of $50.0 million.
Net cash used in investing activities during the year ended January 31, 2019 of $13.8 million consisted of purchases of property and equipment of $5.8 million, payments for business acquisitions, net of cash acquired, of $5.0 million, and capitalized internal-use software development costs of $3.0 million.
Financing activities
Net cash provided by financing activities during the year ended January 31, 2020 of $402.0 million was primarily due to $379.8 million in proceeds from the follow-on offering, net of underwriters’ discounts and commissions, executed during the second quarter of this fiscal year and discussed further in Note 2 to our consolidated financial statements. Additionally, we had $15.9 million in proceeds from the exercise of stock options, and $11.3 million in proceeds from our ESPP, which were partially offset by principal payments on finance leases of $4.2 million, and payments of deferred offering costs of $0.8 million.
Net cash provided by financing activities during the year ended January 31, 2019 of $171.3 million was primarily due to $163.8 million in proceeds from the IPO, net of underwriters’ discounts and commissions, $7.1 million in proceeds from our ESPP, and $6.6 million in proceeds from the exercise of stock options. These proceeds were partially offset by principal payments on finance leases of $3.3 million, payments of deferred offering costs of $2.6 million, and taxes paid related to net share settlement of restricted stock units of $0.4 million.
Obligations and Other Commitments
Our contractual obligations consist primarily of obligations under our operating leases for office space, finance leases for our co-location data center-related equipment, our commitment with a cloud-based hosting service provider, and non-cancelable purchase commitments. The following table summarizes our contractual obligations as of January 31, 2020:
Payments Due by Period: | |||||||||||||||||||
Less than 1 year | 1 to 3 years | 3 to 5 years | More than 5 years | Total | |||||||||||||||
(in thousands) | |||||||||||||||||||
Operating lease obligations(1) | $ | 13,345 | $ | 24,055 | $ | 21,914 | $ | 12,961 | $ | 72,275 | |||||||||
Finance lease obligations | 2,599 | 1,712 | — | — | 4,311 | ||||||||||||||
Other obligations(2) | 15,128 | 6,565 | — | — | 21,693 | ||||||||||||||
Total contractual obligations | $ | 31,072 | $ | 32,332 | $ | 21,914 | $ | 12,961 | $ | 98,279 | |||||||||
(1) As of January 31, 2020, we had signed leases for additional office space that had not yet commenced. Future non-cancelable lease payments associated with these agreements totaled $42.3 million, payable over lease terms ranging from 7 to 9 years.
(2) Amounts include our commitment with a cloud-based hosting service provider for $5.0 million within one year and $3.5 million between one to three years.
63
Indemnification Agreements
In the ordinary course of business, we enter into agreements of varying scope and terms pursuant to which we agree to indemnify customers, vendors, lessors, business partners, and other parties with respect to certain matters, including, but not limited to, losses arising out of the breach of such agreements, services to be provided by us, or from intellectual property infringement claims made by third parties. In addition, we have entered into indemnification agreements with our directors and certain officers and employees that will require us, among other things, to indemnify them against certain liabilities that may arise by reason of their status or service as directors, officers, or employees. An indemnification claim has been made to the Company in a litigation in which a former director and shareholder are parties. At this time, the Company cannot reasonably estimate the magnitude of its indemnification obligation, if any. There are no other claims that we are aware of at this time that could have a material effect on our balance sheets, statements of operations and comprehensive loss, or statements of cash flows.
Off-Balance Sheet Arrangements
As of January 31, 2020, we did not have any relationships with organizations or financial partnerships, such as structured finance or special purpose entities that would have been established for the purpose of facilitating off-balance sheet arrangements or other contractually narrow or limited purposes.
Critical Accounting Policies and Estimates
Our discussion and analysis of our financial condition and results of operations are based upon our consolidated financial statements which have been prepared in accordance with GAAP. The preparation of these consolidated financial statements requires us to make estimates and judgments that affect the reported amounts of assets and liabilities and related disclosure of contingent assets and liabilities, revenue and expenses. Generally, we base our estimates on historical experience and on various other assumptions in accordance with GAAP that we believe to be reasonable under the circumstances. Actual results may differ from these estimates. We believe that the accounting policies discussed below are critical to understanding our historical and future performance, as these policies relate to the more significant areas involving management’s judgments and estimates.
Revenue recognition
We derive our revenue primarily from subscription services and professional services. Revenue is recognized when control of these services is transferred to our customers, in an amount that reflects the consideration we expect to be entitled to in exchange for those services, net of any sales taxes.
We determine revenue recognition through the following steps:
• | identification of the contract, or contracts, with a customer; |
• | identification of the performance obligations in the contract; |
• | determination of the transaction price; |
• | allocation of the transaction price to the performance obligations in the contract; and |
• | recognition of revenue when, or as, we satisfy a performance obligation. |
Subscription revenue
Subscription revenue primarily consists of fees from customers for access to our cloud-based platform. Our subscription revenue is recognized on a ratable basis over the subscription contract term, beginning on the date the access to our platform is provided, as no implementation work is required, if consideration we are entitled to receive is considered probable of collection. Subscription contracts generally have terms of one year or one month, are billed in advance, and are non-cancelable. The subscription arrangements do not allow the customer the contractual right to take possession of the platform; as such, the arrangements are considered to be service contracts.
64
Certain of our subscription contracts contain performance guarantees related to service continuity. To date, refunds related to such guarantees have been immaterial in all periods presented.
Professional services revenue
Professional services revenue primarily includes revenue recognized from fees for consulting and training services. Our consulting services consist of platform configuration and use case optimization, and are primarily invoiced on a time and materials basis, monthly in arrears. Services revenue is recognized over time, as service hours are delivered. Smaller consulting engagements are on occasion provided for a fixed fee. These smaller consulting arrangements are typically of short duration (less than three months). In these cases, revenue is recognized over time, based on the proportion of hours of work performed, compared to the total hours expected to complete the engagement. Configuration and use case optimization services do not result in significant customization or modification of the software platform or user interface.
Training services are billed in advance, on a fixed-fee basis, and revenue is recognized after the training program is delivered, or after the customer’s right to receive training services expires.
Associated out-of-pocket travel expenses related to the delivery of professional services are typically reimbursed by the customer. Out-of-pocket expense reimbursements are recognized as revenue at the point in time, or as, the distinct performance obligation to which they relate is delivered. Out-of-pocket expenses are recognized as cost of professional services revenue as incurred.
On occasion, we sell our subscriptions to third-party resellers. The price at which we sell to the reseller is typically discounted, as compared to the price at which we would sell to an end customer, in order to enable the reseller to realize a margin on the eventual sale to the end customer. As we retain a fixed amount of the contract from the reseller, and do not have visibility into the pricing provided by the reseller to the end customer, the revenue is recorded net of any reseller margin.
Contracts with multiple performance obligations
Some of our contracts with customers contain multiple performance obligations. We account for individual performance obligations separately, as they have been determined to be distinct, i.e., the services are separately identifiable from other items in the arrangement and the customer can benefit from them on their own or with other resources that are readily available to the customer. The transaction price is allocated to the distinct performance obligations on a relative stand-alone selling price basis. Stand-alone selling prices are determined based on the prices at which we separately sell subscription services, consulting services and training, and based on our overall pricing objectives, taking into consideration market conditions, value of our contracts, the types of offerings sold, customer demographics, and other factors.
Deferred revenue
Deferred revenue is recorded for subscription services contracts upon establishment of unconditional right to payment under a non-cancelable contract before transferring the related services to the customer. Deferred revenue for such services is amortized into revenue over time, as those subscription services are delivered.
Similarly, we record deferred revenue for fixed-fee professional services upon establishment of an unconditional right to payment under a non-cancelable contract. Deferred revenue for training services is recognized as revenue upon delivery of training services or upon expiration of customer’s right to receive such services. Deferred revenue for consulting services is recognized as hours of service are delivered to the customer.
Deferred commissions
The majority of sales commissions earned by our sales force are considered incremental and recoverable costs of obtaining a contract with a customer. Sales commission are paid on initial contracts and on any upsell contracts with a customer. No sales commissions are paid on customer renewals. Sales commissions are deferred and then amortized on a straight-line basis over a period of benefit that we have determined to be three years. We determined the period of benefit by taking into consideration our customer contracts, expected customer life, the expected life of
65
our technology and other factors. Amortization expense is included in sales and marketing expenses in the accompanying statements of operations.
Internal-use software development costs
The Company capitalizes certain qualifying costs incurred during the application development stage in connection with the development of internal-use software. Costs related to preliminary project activities and post-implementation activities are expensed in research and development (“R&D”) as incurred. R&D expenses consist primarily of employee-related costs, hardware- and software-related costs, costs of outside services used to supplement our internal staff, and overhead allocations.
Internal-use software costs of $8.1 million were capitalized in the year ended January 31, 2020, of which $5.8 million related to costs incurred during the application development stage of software development for the Company’s platform to which subscriptions are sold. Internal-use software costs of $3.5 million were capitalized in the year ended January 31, 2019, of which $1.5 million related to costs incurred during the application development stage of software development for the Company’s platform to which subscriptions are sold.
Capitalized software development costs are included within property and equipment, net on the balance sheets, and are amortized over the estimated useful life of the software, which is typically three years. The related amortization expense is recognized in the consolidated statements of comprehensive loss within the function that receives the benefit of the developed software. The Company evaluates the useful lives of these assets and tests for impairment whenever events or changes in circumstances occur that could impact the recoverability of these assets.
Leases
We determine if an arrangement is a lease at inception, and leases are classified at commencement as either operating or finance leases.
Right-of-use (“ROU”) assets and lease liabilities are recognized at commencement date based on the present value of the future minimum lease payments over the lease term. ROU assets also include any lease payments made. Operating lease ROU assets are presented separately in long-term assets and finance lease ROU assets are included in property and equipment, net on our consolidated balance sheets. As our operating leases do not provide an implicit rate, we use our incremental borrowing rate based on information available at the commencement date in determining the present value of future payments. This rate is an estimate of the collateralized borrowing rate we would incur on our future lease payments over a similar term based on the information available at commencement date. Our lease terms may include options to extend or terminate the lease when it is reasonably certain that we will exercise that option. At January 31, 2020, we did not include any options to extend leases in our lease terms as we were not reasonably certain to exercise them. The Company’s lease agreements do not contain residual value guarantees or covenants.
We utilize certain practical expedients and policy elections available under the lease accounting standard. Leases with a term of one year or less are not recognized on our consolidated balance sheets; we recognize lease expense for these leases on a straight-line basis over the lease term. Additionally, we have elected to include non-lease components with lease components for contracts containing real estate leases for the purpose of calculating lease right-of-use assets and liabilities, to the extent that they are fixed. Non-lease components that are not fixed are expensed as incurred as variable lease payments. Our real estate operating leases typically include non-lease components such as common-area maintenance costs.
ROU assets are subject to evaluation for impairment or disposal on a basis consistent with other long-lived assets.
Business combinations
When we acquire a business, the purchase price is allocated to the net tangible and identifiable intangible assets acquired based on their estimated fair values. Any residual purchase price is recorded as goodwill. The allocation of the purchase price requires management to make significant estimates in determining the fair values of assets acquired and liabilities assumed, especially with respect to intangible assets. These estimates can include, but are not
66
limited to, the cash flows that an asset is expected to generate in the future, the appropriate weighted-average cost of capital and the cost savings expected to be derived from acquiring an asset. These estimates are inherently uncertain and unpredictable. During the measurement period, which may be up to one year from the acquisition date, adjustments to the fair value of these tangible and intangible assets acquired and liabilities assumed may be recorded, with the corresponding offset to goodwill. Upon the conclusion of the measurement period or final determination of the fair value of assets acquired or liabilities assumed, whichever comes first, any subsequent adjustments are recorded to our consolidated statements of operations.
Goodwill on our consolidated balance sheets totaled $16.5 million and $5.5 million at January 31, 2020 and 2019, respectively. Goodwill is tested for impairment annually on September 1, or more frequently if events or changes in circumstances indicate that impairment may exist. Based on the annual assessment, no indicator of impairment was noted and therefore no goodwill impairments were recorded during the years ended January 31, 2020, 2019, or 2018.
Share-based compensation
The Company measures and recognizes compensation expense for all share-based awards granted to employees and directors, based on the estimated fair value of the award on the date of grant. Expense is recognized on a straight-line basis over the vesting period of the award based on the estimated portion of the award that is expected to vest.
We use the Black-Scholes option pricing model to measure the fair value of stock option awards when they are granted. We make several estimates in determining share-based compensation and these estimates generally require significant analysis and judgment to develop. These assumptions and estimates are as follows:
Fair value of common stock. As our stock was not publicly traded prior to our IPO, we were required to estimate the fair value of common stock, as discussed in “Valuation of Common Stock” below.
Expected term. The expected term of options represents the period that share-based awards are expected to be outstanding. We estimate the expected term using the simplified method due to the lack of historical exercise activity for our company.
Risk-free interest rate. The risk-free interest rate is based on the implied yield available at the time of the option grant in the U.S. Treasury securities at maturity with a term equivalent to the expected term of the option.
Expected volatility. Expected volatility is based on an average volatility of stock prices for a group of publicly traded peer companies. In considering peer companies, we assess characteristics such as industry, state of development, size and financial leverage.
Dividend yield. We have never declared or paid any cash dividends and do not plan to pay cash dividends in the foreseeable future, and, therefore, use an expected dividend yield of zero.
If any assumptions used in the Black-Scholes option pricing model change significantly, share-based compensation for future awards may differ materially compared with the awards granted previously.
In addition to the assumptions used in the Black-Scholes option pricing model, we must also estimate a forfeiture rate to calculate the share-based compensation expense for awards. Our forfeiture rate is derived from historical employee termination behavior. If the actual number of forfeitures differs from these estimates, additional adjustments to compensation expense will be required.
Valuation of common stock
Given the absence of an active market for our common stock prior to our IPO, our board of directors was required to estimate the fair value of our common stock at the time of each option grant based upon several factors, including its consideration of input from management and contemporaneous third-party valuations.
67
The exercise price for all stock options granted was at the estimated fair value of the underlying common stock, as estimated on the date of grant by our board of directors in accordance with the guidelines outlined in the American Institute of Certified Public Accountants, Valuation of Privately-Held-Company Equity Securities Issued as Compensation. Each fair value estimate was based on a variety of factors, which included the following:
•contemporaneous valuations performed by an unrelated third-party valuation firm;
•the prices, rights, preferences and privileges of our preferred stock relative to those of our common stock;
•the lack of marketability of our common stock;
•our actual operating and financial performance;
•current business conditions and projections;
•hiring of key personnel and the experience of our management;
•our history and the timing of the introduction of new applications and capabilities;
•our stage of development;
•the likelihood of achieving a liquidity event, such as an initial public offering or a merger or acquisition of our business given prevailing market conditions;
•the market performance of comparable publicly traded companies; and
•U.S. and global capital market conditions.
In valuing our common stock, our board of directors determined the equity value of our business using valuation methods they deemed appropriate under the circumstances applicable at the valuation date.
One method, the market approach, estimates value based on a comparison of our company to comparable public companies in a similar line of business. To determine our peer group of companies, we considered public enterprise cloud-based application providers and selected those that are similar to us in size, stage of life cycle, and financial leverage. From the comparable companies, a representative market value multiple is determined which is applied to our operating results to estimate the value of our company. The market value multiple was determined based on consideration of the last 12-month revenue and the implied multiples for each of the comparable companies.
Another method, the prior sale of our stock approach, estimates value by considering any prior arm’s length sales of our equity. When considering prior sales of our equity, the valuation considers the size of the equity sale, the relationship of the parties involved in the transaction, the timing of the equity sale, and our financial condition at the time of the sale.
Once an equity value was determined, our board of directors used one of the following methods to allocate the equity value to each of our classes of stock: (1) the option pricing method, or OPM; or (2) a probability weighted expected return method, or PWERM.
The OPM treats common stock and preferred stock as call options on a business, with exercise prices based on the liquidation preference of the preferred stock. Therefore, the common stock only has value if the funds available for distribution to the holders of common stock exceed the value of the liquidation preference of the preferred stock at the time of a liquidity event, such as a merger, sale, or initial public offering, assuming the business has funds available to make a liquidation preference meaningful and collectible by shareholders. The common stock is modeled as a call option with a claim on the business at an exercise price equal to the remaining value immediately after the preferred stock is liquidated. The OPM uses the Black-Scholes option pricing model to price the call option.
68
The estimated value of the common stock derived from the OPM is then discounted by a non-marketability factor due to the fact that shareholders of private companies do not have access to trading markets similar to those enjoyed by shareholders of public companies, which impacts liquidity.
The PWERM employs various market approach calculations depending upon the likelihood of various liquidation scenarios. For each of the various scenarios, an equity value is estimated and the rights and preferences for each shareholder class are considered to allocate the equity value to common shares. The common stock value is then multiplied by a discount factor reflecting the calculated discount rate and the timing of the event. Lastly, the common stock value is multiplied by an estimated probability for each scenario. The probability and timing of each scenario were based on discussions between our board of directors and our management team. Under the PWERM, the value of our common stock is based upon possible future exit events for our company.
Subsequent to the closing of the IPO on May 1, 2018, the fair value of our common stock is represented by the price quoted on the New York Stock Exchange.
Recent accounting pronouncements
See the sections titled “Summary of Significant Accounting Policies—Recently adopted accounting pronouncements” and “Recent accounting pronouncements not yet adopted” in Note 2 to our Consolidated Financial Statements for more information.
Item 7A. Quantitative and Qualitative Disclosures about Market Risk
Interest rate risk
We had cash and cash equivalents totaling $515.9 million as of January 31, 2020, of which $303.9 million was invested in money market funds. We had cash and cash equivalents totaling $213.1 million as of January 31, 2019, of which $211.1 million was invested in money market funds. Our cash and cash equivalents are held for working capital purposes. We do not enter into investments for trading or speculative purposes.
Our cash equivalents and our investment portfolio are subject to market risk due to changes in interest rates. Fixed rate securities may have their market value adversely affected due to a rise in interest rates. Due in part to these factors, our future investment income may fall short of our expectations due to changes in interest rates or we may suffer losses in principal if we are forced to sell securities that decline in market value due to changes in interest rates. However, because we classify our short-term investments as “available for sale,” no gains or losses are recognized due to changes in interest rates unless such securities are sold prior to maturity or declines in fair value are determined to be other-than-temporary.
A hypothetical 10% relative change in interest rates would not have had a material impact on the value of our cash equivalents and short-term investments as of January 31, 2020, and 2019, respectively.
Foreign currency exchange risk
Due to our international operations, although our sales contracts are primarily denominated in U.S. dollars, we have foreign currency risks related to revenue denominated in other currencies, such as the British Pound Sterling, Euro, Canadian dollar, and Australian dollar, as well as expenses denominated in the British Pound Sterling and Australian dollar. Changes in the relative value of the U.S. dollar to other currencies may negatively affect revenue and other operating results as expressed in U.S. dollars. We have not engaged in the hedging of foreign currency transactions to date. We do not believe that an immediate 10% increase or decrease in the relative value of the U.S. dollar to other currencies would have a material effect on our operating results.
69
Item 8. Financial Statements and Supplementary Data
Index to the Consolidated Financial Statements
70
Report of Independent Registered Public Accounting Firm
To the Board of Directors and Shareholders of Smartsheet Inc.
Opinions on the Financial Statements and Internal Control over Financial Reporting
We have audited the accompanying consolidated balance sheets of Smartsheet Inc. and its subsidiaries (the “Company”) as of January 31, 2020 and 2019, and the related consolidated statements of operations, of comprehensive loss, of change in convertible preferred stock and shareholders’ equity (deficit) and of cash flows for each of the three years in the period ended January 31, 2020, including the related notes (collectively referred to as the “consolidated financial statements”). We also have audited the Company’s internal control over financial reporting as of January 31, 2020, based on criteria established in Internal Control - Integrated Framework (2013) issued by the Committee of Sponsoring Organizations of the Treadway Commission (COSO).
In our opinion, the consolidated financial statements referred to above present fairly, in all material respects, the financial position of the Company as of January 31, 2020 and 2019, and the results of its operations and its cash flows for each of the three years in the period ended January 31, 2020 in conformity with accounting principles generally accepted in the United States of America. Also in our opinion, the Company did not maintain, in all material respects, effective internal control over financial reporting as of January 31, 2020, based on criteria established in Internal Control - Integrated Framework (2013) issued by the COSO because material weaknesses in internal control over financial reporting existed as of that date related to (i) an ineffective control environment as the Company had an insufficient complement of resources with an appropriate level of controls knowledge and expertise commensurate with the Company’s financial reporting requirements which contributed to additional material weaknesses in that the Company, (ii) did not design and maintain effective information technology general controls for certain information systems relevant to the preparation of the financial statements, and (iii) did not design and maintain effective controls related to the completeness, accuracy and occurrence of order entry and pricing during the billing and revenue processes.
A material weakness is a deficiency, or a combination of deficiencies, in internal control over financial reporting, such that there is a reasonable possibility that a material misstatement of the annual or interim financial statements will not be prevented or detected on a timely basis. The material weaknesses referred to above are described in Management’s Annual Report on Internal Control over Financial Reporting appearing under Item 9A. We considered these material weaknesses in determining the nature, timing, and extent of audit tests applied in our audit of the 2020 consolidated financial statements, and our opinion regarding the effectiveness of the Company’s internal control over financial reporting does not affect our opinion on those consolidated financial statements.
Change in Accounting Principle
As discussed in Note 2 to the consolidated financial statements, the Company changed the manner in which it accounts for leases in fiscal year 2020.
Basis for Opinions
The Company’s management is responsible for these consolidated financial statements, for maintaining effective internal control over financial reporting, and for its assessment of the effectiveness of internal control over financial reporting included in management's report referred to above. Our responsibility is to express opinions on the Company’s consolidated financial statements and on the Company's internal control over financial reporting based on our audits. We are a public accounting firm registered with the Public Company Accounting Oversight Board (United States) (PCAOB) and are required to be independent with respect to the Company in accordance with the U.S. federal securities laws and the applicable rules and regulations of the Securities and Exchange Commission and the PCAOB.
We conducted our audits in accordance with the standards of the PCAOB. Those standards require that we plan and perform the audits to obtain reasonable assurance about whether the consolidated financial statements are free of material misstatement, whether due to error or fraud, and whether effective internal control over financial reporting was maintained in all material respects.
71
Our audits of the consolidated financial statements included performing procedures to assess the risks of material misstatement of the consolidated financial statements, whether due to error or fraud, and performing procedures that respond to those risks. Such procedures included examining, on a test basis, evidence regarding the amounts and disclosures in the consolidated financial statements. Our audits also included evaluating the accounting principles used and significant estimates made by management, as well as evaluating the overall presentation of the consolidated financial statements. Our audit of internal control over financial reporting included obtaining an understanding of internal control over financial reporting, assessing the risk that a material weakness exists, and testing and evaluating the design and operating effectiveness of internal control based on the assessed risk. Our audits also included performing such other procedures as we considered necessary in the circumstances. We believe that our audits provide a reasonable basis for our opinions.
Definition and Limitations of Internal Control over Financial Reporting
A company’s internal control over financial reporting is a process designed to provide reasonable assurance regarding the reliability of financial reporting and the preparation of financial statements for external purposes in accordance with generally accepted accounting principles. A company’s internal control over financial reporting includes those policies and procedures that (i) pertain to the maintenance of records that, in reasonable detail, accurately and fairly reflect the transactions and dispositions of the assets of the company; (ii) provide reasonable assurance that transactions are recorded as necessary to permit preparation of financial statements in accordance with generally accepted accounting principles, and that receipts and expenditures of the company are being made only in accordance with authorizations of management and directors of the company; and (iii) provide reasonable assurance regarding prevention or timely detection of unauthorized acquisition, use, or disposition of the company’s assets that could have a material effect on the financial statements.
Because of its inherent limitations, internal control over financial reporting may not prevent or detect misstatements. Also, projections of any evaluation of effectiveness to future periods are subject to the risk that controls may become inadequate because of changes in conditions, or that the degree of compliance with the policies or procedures may deteriorate.
Critical Audit Matters
The critical audit matters communicated below are matters arising from the current period audit of the consolidated financial statements that were communicated or required to be communicated to the audit committee and that (i) relate to accounts or disclosures that are material to the consolidated financial statements and (ii) involved our especially challenging, subjective, or complex judgments. The communication of critical audit matters does not alter in any way our opinion on the consolidated financial statements, taken as a whole, and we are not, by communicating the critical audit matters below, providing separate opinions on the critical audit matters or on the accounts or disclosures to which they relate.
Acquisition of Artefact Product Group LLC - Fair value of finite-lived software technology and customer relationships intangible assets
As described in Note 8 to the consolidated financial statements, the Company completed the acquisition of Artefact Product Group, LLC on May 1, 2019 for a total purchase price of $27.8 million, of which $8.0 million in finite-lived software technology intangible assets and $8.0 million in finite-lived customer relationships intangible assets were recorded. Management valued the finite-lived software technology using the relief-from-royalty method under the income approach. This method reflects the present value of the projected cash flows that are expected to be generated from the licensing of the asset to third parties. Management applied judgment in estimating the fair value of the finite-lived software technology which involved the use of significant assumptions with respect to the base year revenue and the royalty rate. Management valued the finite-lived customer relationships using the multi-period excess-earnings method. This method involves forecasting the net earnings to be generated by the asset, reducing them by appropriate returns on contributory assets, and then discounting the resulting net returns to a present value using an appropriate discount rate. Management applied judgment in estimating the fair value of the finite-lived customer relationships which involved the use of the significant assumption of the royalty rate impacting the returns on contributory assets for software technology.
72
The principal considerations for our determination that performing procedures relating to the fair value of finite-lived software technology and customer relationships intangible assets from the acquisition of Artefact Product Group, LLC is a critical audit matter are (i) there was a high degree of auditor judgment and subjectivity in applying procedures relating to the fair value measurements of finite-lived software technology and customer relationships acquired due to the significant amount of judgment by management when developing the estimates, (ii) significant audit effort was required in evaluating the significant assumptions relating to the estimates, such as base year revenue and the royalty rate as it relates to the estimation of fair value of finite-lived software technology and the royalty rate impacting the returns on contributory assets for software technology as it relates to the estimation of fair value of finite-lived customer relationships, and (iii) the audit effort involved the use of professionals with specialized skill and knowledge to assist in performing these procedures and evaluating the audit evidence obtained from these procedures.
Addressing the matter involved performing procedures and evaluating audit evidence in connection with forming our overall opinion on the consolidated financial statements. These procedures included testing the effectiveness of controls relating to the acquisition accounting, including controls over management’s valuation of the finite-lived software technology and customer relationships and controls over the development of the assumptions related to base year revenue, the royalty rate, and the royalty rate impacting the returns on contributory assets for software technology. These procedures also included, among others, (i) reading the purchase agreement, and (ii) testing management’s process for estimating the fair value of finite-lived software technology and customer relationships. Testing management’s process included evaluating the appropriateness of the valuation methods, testing completeness and accuracy of the data used in the valuation methods, and evaluating the reasonableness of significant assumptions, including base year revenue, the royalty rate, and the royalty rate impacting the returns on contributory assets for software technology. Evaluating the reasonableness of base year revenue involved considering the past performance of the acquired business, as well as economic and industry forecasts. The royalty rates were evaluated by obtaining evidence to support the reasonableness of the assumption and evaluating whether it was consistent with industry and peer data. Professionals with specialized skill and knowledge were used to assist in the evaluation of the Company’s valuation methods and certain significant assumptions, including the royalty rates.
Consolidated Financial Statements - Impact of Control Environment and Information Technology General Controls
The completeness and accuracy of the consolidated financial statements, including the financial condition, results of operations and cash flows, is dependent on, in part, the Company’s ability to (i) design and maintain an effective control environment, including maintaining a sufficient complement of resources with an appropriate level of controls knowledge and expertise commensurate with financial reporting requirements, and (ii) design and maintain effective information technology general controls for certain information systems relevant to the preparation of the financial statements, including user access controls, program change management controls and computer operations controls.
The principal considerations for our determination that performing procedures relating to the consolidated financial statements - impact of control environment and information technology general controls is a critical audit matter are there was a high degree of auditor judgment, subjectivity and effort in performing procedures and evaluating audit evidence related to the consolidated financial statements and information systems. As described above in the “Opinions on the Financial Statements and Internal Control over Financial Reporting” section, material weaknesses related to (i) the control environment, and (ii) information technology general controls existed as of January 31, 2020.
Addressing the matter involved performing procedures and evaluating audit evidence in connection with forming our overall opinion on the consolidated financial statements. These procedures included, among others, evaluating the nature and extent of audit procedures performed and evidence obtained. These procedures also included manually testing the completeness and accuracy of system reports or other information generated by the Company’s information technology systems.
Revenue Recognition - Subscription and Professional Services Revenues
73
As described in Note 2 to the consolidated financial statements, the Company recognizes revenue when control of services is transferred to the Company’s customers, in an amount that reflects the consideration the Company expects to be entitled to in exchange for those services, net of any sales taxes. The Company’s subscription and professional services revenues were $244.1 million and $26.8 million, respectively, for the year ended January 31, 2020. As disclosed by management, the completeness, accuracy and occurrence of subscription and professional services revenues are dependent on customer orders being completely and accurately entered and recognized in the Company’s billing and revenue processes.
The principal considerations for our determination that performing procedures relating to revenue recognition - subscription and professional services revenues is a critical audit matter are there was a high degree of auditor judgment, subjectivity and effort in performing procedures and evaluating audit evidence related to the accuracy and occurrence of revenue. As described above in the “Opinions on the Financial Statements and Internal Control over Financial Reporting” section, a material weakness related to the Company’s billing and revenue processes existed as of January 31, 2020.
Addressing the matter involved performing procedures and evaluating audit evidence in connection with forming our overall opinion on the consolidated financial statements. These procedures included, among others, evaluating the nature and extent of audit procedures performed and evidence obtained relating to subscription and professional services revenues. These procedures also included obtaining and inspecting source documents including, where applicable, cash receipts from customers.
/s/ PricewaterhouseCoopers LLP
Seattle, Washington
March 31, 2020
We have served as the Company's auditor since 2012.
74
SMARTSHEET INC.
Consolidated Statements of Operations
(in thousands, except per share data)
Year Ended January 31, | |||||||||||
2020 | 2019 | 2018 | |||||||||
Revenue | |||||||||||
Subscription | $ | $ | $ | ||||||||
Professional services | |||||||||||
Total revenue | |||||||||||
Cost of revenue | |||||||||||
Subscription | |||||||||||
Professional services | |||||||||||
Total cost of revenue | |||||||||||
Gross profit | |||||||||||
Operating expenses | |||||||||||
Research and development | |||||||||||
Sales and marketing | |||||||||||
General and administrative | |||||||||||
Total operating expenses | |||||||||||
Loss from operations | ( | ) | ( | ) | ( | ) | |||||
Interest income | |||||||||||
Other income (expense), net | ( | ) | ( | ) | ( | ) | |||||
Net loss before income tax provision (benefit) | ( | ) | ( | ) | ( | ) | |||||
Income tax provision (benefit) | ( | ) | |||||||||
Net loss | $ | ( | ) | $ | ( | ) | $ | ( | ) | ||
Deemed dividend | ( | ) | |||||||||
Net loss attributable to common shareholders | $ | ( | ) | $ | ( | ) | $ | ( | ) | ||
Net loss per share attributable to common shareholders, basic and diluted | $ | ( | ) | $ | ( | ) | $ | ( | ) | ||
Weighted-average shares outstanding used to compute net loss per share attributable to common shareholders, basic and diluted | |||||||||||
See notes to consolidated financial statements.
75
SMARTSHEET INC.
Consolidated Statements of Comprehensive Loss
(in thousands)
Year Ended January 31, | |||||||||||
2020 | 2019 | 2018 | |||||||||
Net loss | $ | ( | ) | $ | ( | ) | $ | ( | ) | ||
Other comprehensive loss: | |||||||||||
Net unrealized loss on available-for-sale securities | ( | ) | |||||||||
Comprehensive loss | $ | ( | ) | $ | ( | ) | $ | ( | ) | ||
See notes to consolidated financial statements.
76
SMARTSHEET INC.
Consolidated Balance Sheets
(in thousands, except share data)
January 31, | |||||||
2020 | 2019 | ||||||
Assets | |||||||
Current assets | |||||||
Cash and cash equivalents | $ | $ | |||||
Short-term investments | |||||||
Accounts receivable, net of allowances of $2,989 and $1,234, respectively | |||||||
Prepaid expenses and other current assets | |||||||
Total current assets | |||||||
Long-term assets | |||||||
Restricted cash | |||||||
Deferred commissions | |||||||
Property and equipment, net | |||||||
Operating lease right-of-use assets | — | ||||||
Intangible assets, net | |||||||
Goodwill | |||||||
Other long-term assets | |||||||
Total assets | $ | $ | |||||
Liabilities and shareholders’ equity | |||||||
Current liabilities | |||||||
Accounts payable | $ | $ | |||||
Accrued compensation and related benefits | |||||||
Other accrued liabilities | |||||||
Operating lease liabilities, current | — | ||||||
Finance lease liabilities, current | |||||||
Deferred revenue | |||||||
Total current liabilities | |||||||
Operating lease liabilities, non-current | — | ||||||
Finance lease liabilities, non-current | |||||||
Deferred revenue, non-current | |||||||
Other long-term liabilities | |||||||
Total liabilities | |||||||
Commitments and contingencies (Note 13) | |||||||
Shareholders’ equity: | |||||||
Preferred stock, no par value; 10,000,000 shares authorized, no shares issued or outstanding as of January 31, 2020 and January 31, 2019 | |||||||
Class A common stock, no par value; 500,000,000 shares authorized, 118,194,159 shares issued and outstanding as of January 31, 2020; 500,000,000 shares authorized, 48,003,701 shares issued and outstanding as of January 31, 2019 | |||||||
Class B common stock, no par value; 500,000,000 shares authorized, no shares issued and outstanding as of January 31, 2020; 500,000,000 shares authorized, 56,967,742 shares issued and outstanding as of January 31, 2019 | |||||||
Additional paid-in capital | |||||||
Accumulated deficit | ( | ) | ( | ) | |||
Total shareholders’ equity | |||||||
Total liabilities and shareholders’ equity | $ | $ | |||||
See notes to consolidated financial statements.
77
SMARTSHEET INC.
Consolidated Statements of Change in Convertible Preferred Stock and Shareholders’ Equity (Deficit)
(dollars in thousands)
Convertible Preferred Stock | Common Stock (Class A and B) | Additional Paid-in Capital | Accumulated Deficit | Accumulated Other Comprehensive Income (Loss) | Total Shareholders’ Equity (Deficit) | |||||||||||||||||||||||||
Shares | Amount | Shares | Amount | |||||||||||||||||||||||||||
Balances at January 31, 2017 | $ | $ | $ | $ | ( | ) | $ | $ | ( | ) | ||||||||||||||||||||
Issuance of convertible preferred stock | — | — | — | — | — | — | ||||||||||||||||||||||||
Stock option exercises | — | — | — | — | — | |||||||||||||||||||||||||
Share-based compensation expense | — | — | — | — | — | — | ||||||||||||||||||||||||
Comprehensive loss | — | — | — | — | — | ( | ) | ( | ) | ( | ) | |||||||||||||||||||
Balances at January 31, 2018 | ( | ) | ( | ) | ||||||||||||||||||||||||||
Issuance of common stock under employee stock plans | — | — | — | — | — | |||||||||||||||||||||||||
Taxes paid related to net share settlement of equity awards | — | — | — | — | ( | ) | — | — | ( | ) | ||||||||||||||||||||
Issuance of common stock upon net exercise of warrant | — | — | — | — | — | |||||||||||||||||||||||||
Issuance of common stock in connection with initial public offering, net of underwriting discounts and issuance costs | — | — | — | — | — | |||||||||||||||||||||||||
Conversion of convertible preferred stock to common stock in connection with initial public offering | ( | ) | ( | ) | — | — | — | |||||||||||||||||||||||
Share-based compensation expense | — | — | — | — | — | — | ||||||||||||||||||||||||
Comprehensive loss | — | — | — | — | — | ( | ) | — | ( | ) | ||||||||||||||||||||
Balances at January 31, 2019 | ( | ) | ||||||||||||||||||||||||||||
Issuance of common stock under employee stock plans | — | — | — | — | — | |||||||||||||||||||||||||
Issuance of common stock in connection with follow-on public offering, net of underwriting discounts, commissions and issuance costs | — | — | — | — | — | |||||||||||||||||||||||||
Share-based compensation expense | — | — | — | — | — | — | ||||||||||||||||||||||||
Comprehensive loss | — | — | — | — | — | ( | ) | — | ( | ) | ||||||||||||||||||||
Balances at January 31, 2020 | $ | $ | $ | $ | ( | ) | $ | $ | ||||||||||||||||||||||
See notes to consolidated financial statements.
78
SMARTSHEET INC.
Consolidated Statements of Cash Flows
(in thousands)
Year Ended January 31, | |||||||||||
2020 | 2019 | 2018 | |||||||||
Cash flows from operating activities | |||||||||||
Net loss | $ | ( | ) | $ | ( | ) | $ | ( | ) | ||
Adjustments to reconcile net loss to net cash used in operating activities: | |||||||||||
Share-based compensation expense | |||||||||||
Remeasurement of convertible preferred stock warrant liability | |||||||||||
Depreciation of property and equipment | |||||||||||
Amortization of deferred commission costs | |||||||||||
Unrealized foreign currency loss | |||||||||||
Gain on disposal of assets | |||||||||||
Amortization of intangible assets | |||||||||||
Non-cash operating lease costs | — | — | |||||||||
Amortization of premiums, accretion of discounts and gain on investments | |||||||||||
Changes in operating assets and liabilities: | |||||||||||
Accounts receivable | ( | ) | ( | ) | ( | ) | |||||
Prepaid expenses and other current assets | ( | ) | ( | ) | |||||||
Operating lease right-of-use assets | ( | ) | — | — | |||||||
Other long-term assets | ( | ) | ( | ) | |||||||
Accounts payable | |||||||||||
Other accrued liabilities | |||||||||||
Accrued compensation and related benefits | |||||||||||
Deferred commissions | ( | ) | ( | ) | ( | ) | |||||
Other long-term liabilities | ( | ) | |||||||||
Deferred revenue | |||||||||||
Operating lease liabilities | — | — | |||||||||
Net cash used in operating activities | ( | ) | ( | ) | ( | ) | |||||
Cash flows from investing activities | |||||||||||
Purchases of short-term investments | ( | ) | |||||||||
Purchases of long-term investments | ( | ) | |||||||||
Proceeds from maturity of investments | |||||||||||
Proceeds from sales of investments | |||||||||||
Purchases of property and equipment | ( | ) | ( | ) | ( | ) | |||||
Proceeds from sale of property and equipment | |||||||||||
Capitalized internal-use software development costs | ( | ) | ( | ) | ( | ) | |||||
Purchases of intangible assets | ( | ) | |||||||||
Payments for business acquisition, net of cash acquired | ( | ) | ( | ) | ( | ) | |||||
Net cash used in investing activities | ( | ) | ( | ) | ( | ) | |||||
Cash flows from financing activities | |||||||||||
Proceeds from initial public offering of common stock, net of underwriters' discounts and commissions | |||||||||||
Proceeds from follow-on offering of common stock, net of underwriters' discounts and commissions | |||||||||||
Payments on principal of finance leases | ( | ) | ( | ) | ( | ) | |||||
Payments of deferred offering costs | ( | ) | ( | ) | ( | ) | |||||
Proceeds from issuance of convertible preferred stock | |||||||||||
Proceeds from exercise of stock options | |||||||||||
Taxes paid related to net share settlement of restricted stock units | ( | ) | |||||||||
Proceeds from Employee Stock Purchase Plan | |||||||||||
Net cash provided by financing activities | |||||||||||
Effects of changes in foreign currency exchange rates on cash, cash equivalents, and restricted cash | ( | ) | ( | ) | |||||||
Net increase in cash, cash equivalents, and restricted cash | |||||||||||
Cash, cash equivalents, and restricted cash at beginning of period | |||||||||||
Cash, cash equivalents, and restricted cash at end of period | $ | $ | $ | ||||||||
79
Supplemental disclosures | |||||||||||
Cash paid for interest | $ | $ | $ | ||||||||
Cash paid for income taxes | |||||||||||
Purchases of fixed assets under finance leases | |||||||||||
Right-of-use assets obtained in exchange for new operating lease liabilities | — | — | |||||||||
Accrued purchases of property and equipment (including internal-use software) | |||||||||||
Deemed dividends on convertible preferred stock | ( | ) | |||||||||
Deferred offering costs, accrued but not yet paid | |||||||||||
Share-based compensation capitalized in internal-use software development costs | |||||||||||
See notes to consolidated financial statements.
80
SMARTSHEET INC.
Notes to Consolidated Financial Statements
1. Overview and Basis of Presentation
Description of business
Smartsheet Inc. (the “Company,” “we,” “our”) was incorporated in the State of Washington in 2005, and is headquartered in Bellevue, Washington. The Company is a leading cloud-based platform for work execution, enabling teams and organizations to plan, capture, manage, automate, and report on work at scale. Customers access their accounts online via a web-based interface or a mobile application. Some customers also purchase the Company’s professional services, which primarily consist of consulting and training services.
Collapse of dual class common stock structure
On September 19, 2019, all outstanding shares of the Company’s Class B common stock automatically converted into the same number of shares of the Company's Class A common stock, pursuant to the terms of the Company's amended and restated articles of incorporation (the “Articles”). No additional shares of Class B common stock will be issued following this conversion.
The conversion occurred pursuant to the Articles, which provides that each share of Class B common stock would convert automatically, without further action by the Company, into one share of Class A common stock at the close of business on the date on which the outstanding shares of Class B common stock represented less than 15 % of the aggregate number of shares of Class A common stock and Class B common stock then outstanding. In accordance with the Articles, the shares of Class B common stock that converted as a result of the automatic conversion were retired and will not be reissued by the Company.
Follow-on offering
On June 14, 2019, we completed a public equity offering in which we issued and sold 9,025,000 shares of Class A common stock, inclusive of the exercised over-allotment option, at a public offering price of $43.50 per share. In addition, 5,810,000 shares of the Company’s common stock were sold by selling shareholders of the Company, inclusive of the over-allotment, as part of this offering. We received net proceeds of $379.0 million after deducting underwriting discounts and commissions of $12.8 million and other issuance costs of $0.9 million. We did not receive any proceeds from the sale of common stock by selling shareholders.
Initial public offering
On May 1, 2018, we completed our initial public offering (“IPO”) in which we issued and sold 11,745,088 shares of Class A common stock, inclusive of the over-allotment, at a public offering price of $15.00 per share. We received net proceeds of $160.4 million after deducting underwriting discounts and commissions of $12.3 million and other issuance costs of $3.4 million. Immediately prior to the closing of our IPO, all shares of our convertible preferred stock automatically converted into an aggregate of 68.5 million shares of Class B common stock. In addition, we authorized for future issuance a total of 500 million shares of each Class A and Class B common stock, and 10 million shares of preferred stock.
Basis of presentation
The accompanying consolidated financial statements have been prepared in conformity with accounting principles generally accepted in the United States of America (“GAAP”), and applicable rules and regulations of the Securities and Exchange Commission (“SEC”) regarding financial reporting. The Company’s fiscal year ends on January 31.
The consolidated financial statements include the results of Smartsheet Inc. and its wholly owned subsidiaries, which are located in the United States, the United Kingdom, and Australia. All intercompany balances and transactions have been eliminated upon consolidation.
In the opinion of management, the information contained herein reflects all adjustments necessary for a fair presentation of our consolidated financial statements. All such adjustments are of a normal, recurring nature.
81
Use of estimates
The preparation of the consolidated financial statements in conformity with GAAP requires management to make estimates, judgments, and assumptions that affect the reported amounts of assets and liabilities, disclosure of contingent assets and liabilities at the date of the consolidated financial statements, and the reported amounts of revenue and expenses during the reporting periods. The Company bases its estimates on historical experience and on other assumptions that its management believes are reasonable under the circumstances. Actual results could differ from those estimates. The Company’s most significant estimates and judgments involve revenue recognition with respect to the allocation of transaction consideration for the Company’s offerings; determination of the amortization period for capitalized sales commission costs; capitalization of internal-use software development costs; valuation of assets and liabilities acquired as part of business combinations; and incremental borrowing rate estimates for operating leases, among others.
In December 2019, the novel COVID-19 coronavirus (“COVID-19”) was reported in China and in March 2020 the World Health Organization declared it a pandemic. The extent of the impact of COVID-19 on our operational and financial performance will depend on certain developments, including the duration and spread of the outbreak, impact on our customers and our sales cycles, and impact on our employees, all of which are uncertain and cannot be predicted. As of the date of issuance of the financial statements, we are not aware of any specific event or circumstance that would require us to update our estimates, judgments or revise the carrying value of our assets or liabilities. These estimates may change, as new events occur and additional information is obtained, and are recognized in the consolidated financial statements as soon as they become known. Actual results could differ from those estimates and any such differences may be material to our financial statements.
Liquidity
The Company continues to be subject to the risks and challenges associated with companies at a similar stage of development, including the ability to raise additional capital to support future growth. Since inception through January 31, 2020, the Company has incurred losses from operations and accumulated a deficit of $256.5 million. Historically, the Company has financed its operations primarily through the sale of equity securities and customer payments. The Company believes its existing cash will be sufficient to meet its working capital and capital expenditure needs for at least the next 12 months.
2. Summary of Significant Accounting Policies
Segment information
The Company operates as one operating segment. The Company’s chief operating decision maker is its Chief Executive Officer, who reviews consolidated financial information for purposes of making operating decisions, assessing financial performance, and allocating resources.
Revenue recognition
The Company derives its revenue primarily from subscription services and professional services. Revenue is recognized when control of these services is transferred to the Company’s customers, in an amount that reflects the consideration the Company expects to be entitled to in exchange for those services, net of any sales taxes.
The Company determines revenue recognition through the following steps:
• | identification of the contract, or contracts, with a customer; |
• | identification of the performance obligations in the contract; |
• | determination of the transaction price; |
• | allocation of the transaction price to the performance obligations in the contract; and |
• | recognition of revenue when, or as, the Company satisfies a performance obligation. |
82
Subscription revenue
Subscription revenue primarily consists of fees from customers for access to the Company’s cloud-based platform. Subscription revenue is recognized on a ratable basis over the subscription contract term, beginning on the date the access to the Company’s platform is provided, as no implementation work is required, if consideration the Company is entitled to receive is probable of collection. Subscription contracts generally have terms of one year or one month, are billed in advance, and are non-cancelable. The subscription arrangements do not allow the customer the contractual right to take possession of the platform; as such, the arrangements are considered to be service contracts.
Certain of the Company’s subscription contracts contain performance guarantees related to service continuity. To date, refunds related to such guarantees have been immaterial in all periods presented.
Professional services revenue
Professional services revenue primarily includes revenue recognized from fees for consulting and training services. The Company’s consulting services consist of platform configuration and use case optimization, and are primarily invoiced on a time and materials basis, monthly in arrears. Services revenue is recognized over time, as service hours are delivered. Smaller consulting engagements are, on occasion, provided for a fixed fee. These smaller consulting arrangements are typically of short duration (less than three months). In these cases, revenue is recognized over time, based on the proportion of hours of work performed, compared to the total hours expected to complete the engagement. Configuration and use case optimization services do not result in significant customization or modification of the software platform or user interface.
Training services are billed in advance, on a fixed-fee basis, and revenue is recognized after the training program is delivered, or after the customer’s right to receive training services expires.
Associated out-of-pocket travel expenses related to the delivery of professional services are typically reimbursed by the customer. Out-of-pocket expense reimbursements are recognized as revenue at the point in time, or as the distinct performance obligation to which they relate is delivered. Out-of-pocket expenses are recognized as cost of professional services as incurred.
On occasion, the Company sells its subscriptions to third-party resellers. The price at which the Company sells to the reseller is typically discounted, as compared to the price at which the Company would sell to an end customer, in order to enable the reseller to realize a margin on the eventual sale to the end customer. As the Company retains a fixed amount of the contract from the reseller, and does not have visibility into the pricing provided by the reseller to the end customer, the revenue is recorded net of any reseller margin.
Contracts with multiple performance obligations
Some of the Company’s contracts with customers contain multiple performance obligations. The Company accounts for individual performance obligations separately, as they have been determined to be distinct, i.e., the services are separately identifiable from other items in the arrangement and the customer can benefit from them on its own or with other resources that are readily available to the customer. The transaction price is allocated to the distinct performance obligations on a relative stand-alone selling price basis. Stand-alone selling prices are determined based on the prices at which the Company separately sells subscription, consulting, and training services, and based on the Company’s overall pricing objectives, taking into consideration market conditions, value of the Company’s contracts, the types of offerings sold, customer demographics, and other factors.
Accounts receivable
Accounts receivable are primarily comprised of trade receivables that are recorded at the invoice amount, net of an allowance for doubtful accounts. Subscription fees billed in advance of the related subscription term represent contract liabilities and are presented as accounts receivable and deferred revenues upon establishment of the unconditional right to invoice, typically upon signing of the non-cancelable service agreement. Our typical payment terms provide for customer payment within 30 days of the date of the contract.
83
The allowance for doubtful accounts is based on the Company’s assessment of the collectability of accounts by considering the composition of the accounts receivable aging and historical trends on collectability. Amounts deemed uncollectible are recorded to the allowance for doubtful accounts in the consolidated balance sheets with an offsetting decrease in related deferred revenue and a reduction of revenue or charge to general and administrative expense in the statements of operations. During the year ended January 31, 2020, activity related to the Company’s provision for doubtful accounts was as follows (in thousands):
Balance at January 31, 2018 | $ | ||
Write-offs | ( | ) | |
Additions, net | |||
Balance at January 31, 2019 | |||
Write-offs | ( | ) | |
Additions, net | |||
Balance at January 31, 2020 | $ | ||
Activity related to the Company’s provision for doubtful accounts during the year ended January 31, 2018 was as follows (in thousands):
Balance at January 31, 2017 | $ | ||
Additions, net of write-offs | |||
Balance at January 31, 2018 | $ | ||
Deferred revenue
Deferred revenue is recorded for subscription services contracts upon establishment of unconditional right to payment under a non-cancelable contract before transferring the related services to the customer. Deferred revenue for such services is amortized into revenue over time, as those subscription services are delivered.
Similarly, the Company records deferred revenue for fixed-fee professional services upon establishment of an unconditional right to payment under a non-cancelable contract. Deferred revenue for training services is recognized as revenue upon delivery of training services or upon expiration of customer’s right to receive such services. Deferred revenue for consulting services is recognized as hours of service are delivered to the customer.
Deferred commissions
The majority of sales commissions earned by the Company’s sales force are considered incremental and recoverable costs of obtaining a contract with a customer. Sales commissions are paid on initial contracts and on any upsell contracts with a customer. No sales commissions are paid on customer renewals. Sales commissions are deferred and then amortized on a straight-line basis over a period of benefit that the Company has determined to be three years. The Company determined the period of benefit by taking into consideration its customer contracts, expected customer life, the expected life of its technology, and other factors. Amortization expense is included in sales and marketing expenses in the accompanying statements of operations.
Overhead allocations
The Company allocates shared costs, such as facilities (including rent, utilities, and depreciation on equipment shared by all departments), and information technology costs to all departments based on headcount. As such, allocated shared costs are reflected in each cost of revenue and operating expense category.
Cash, cash equivalents, and short-term investments
The Company considers all highly liquid investments with an original maturity of three months or less from date of purchase to be cash equivalents. Investments with terms greater than three months but less than or equal to
84
twelve months are included in short-term investments. Interest income earned on cash, cash equivalents, and short-term investments is recorded in interest income in the accompanying statements of operations.
Restricted cash
Restricted cash as of January 31, 2020 primarily consisted of $0.9 million related to security deposits for the Company’s Bellevue, Boston, London, and Edinburgh leases.
Restricted cash as of January 31, 2019 consisted of $1.8 million related to collateral for irrevocable letters of credit (entered into during the year ended January 31, 2019) for additional office space in Bellevue, and $0.8 million primarily related to security deposits for the Company’s Bellevue, Boston, London, and Edinburgh leases.
Restricted cash as of January 31, 2018 consisted of $2.4 million related to collateral for irrevocable letters of credit and $0.5 million related to security deposits. The letters of credit that were outstanding as of January 31, 2018 were still in effect as of January 31, 2020; however, the requirement to maintain $2.4 million in collateral for those letters of credit was removed during the year ended January 31, 2019, and the restricted cash balance was reduced by this amount.
January 31, | |||||||||||
2020 | 2019 | 2018 | |||||||||
Cash and cash equivalents | $ | $ | $ | ||||||||
Restricted cash | |||||||||||
Total cash, cash equivalents, and restricted cash shown in the consolidated statements of cash flows | $ | $ | $ | ||||||||
Property and equipment
Property and equipment are recorded at cost, net of accumulated depreciation and amortization. Depreciation is computed using the straight-line method over the following estimated useful lives:
Computer equipment | |
Computer software | |
Furniture and fixtures | 5-7 years |
Leasehold improvements are amortized over the shorter of the expected useful lives of the assets or the related lease term. Maintenance and repairs that do not improve or extend the lives of the respective assets are expensed as incurred.
Internal-use software development costs
The Company capitalizes certain qualifying costs incurred during the application development stage in connection with the development of internal-use software. Costs related to preliminary project activities and post-implementation activities are expensed in research and development (“R&D”) as incurred. R&D expenses consist primarily of employee-related costs, hardware- and software-related costs, costs of outside services used to supplement our internal staff, and overhead allocations.
Internal-use software costs of $8.1 million were capitalized in the year ended January 31, 2020, of which $5.8 million related to costs incurred during the application development stage of software development for the Company’s platform to which subscriptions are sold. Internal-use software costs of $3.5 million were capitalized in
85
the year ended January 31, 2019, of which $1.5 million related to costs incurred during the application development stage of software development for the Company’s platform to which subscriptions are sold.
Capitalized software development costs are included within property and equipment, net on the balance sheets, and are amortized over the estimated useful life of the software, which is typically three years . The related amortization expense is recognized in the consolidated statements of comprehensive loss within the function that receives the benefit of the developed software. Amortization expense of capitalized internal-use software costs totaled $2.3 million, $1.0 million and $0.2 million for the years ended January 31, 2020, 2019 and 2018, respectively. The Company evaluates the useful lives of these assets and tests for impairment whenever events or changes in circumstances occur that could impact the recoverability of these assets.
Business combinations
When we acquire a business, the purchase price is allocated to the net tangible and identifiable intangible assets acquired based on their estimated fair values. Any residual purchase price is recorded as goodwill. The allocation of the purchase price requires management to make significant estimates in determining the fair values of assets acquired and liabilities assumed, especially with respect to intangible assets. These estimates can include, but are not limited to, the cash flows that an asset is expected to generate in the future, the appropriate weighted-average cost of capital, and the cost savings expected to be derived from acquiring an asset. These estimates are inherently uncertain and unpredictable. During the measurement period, which may be up to one year from the acquisition date, adjustments to the fair value of these tangible and intangible assets acquired and liabilities assumed may be recorded, with the corresponding offset to goodwill. Upon the conclusion of the measurement period or final determination of the fair value of assets acquired or liabilities assumed, whichever comes first, any subsequent adjustments are recorded to our consolidated statements of operations.
Goodwill & Acquired Intangible Assets
The Company evaluates goodwill for impairment at the reporting unit level on an annual basis (September 1), or whenever events or changes in circumstances indicate that impairment may exist. When evaluating goodwill for impairment, the Company may first perform a qualitative assessment to determine whether it is more likely than not that a reporting unit is impaired. If the Company does not perform a qualitative assessment, or if the Company determines that it is not more likely than not that the fair value of the reporting unit exceeds its carrying amount, the Company calculates the estimated fair value of the reporting unit. Fair value is the price a willing buyer would pay for the reporting unit and is typically calculated using a discounted cash flow model. If the carrying amount of the reporting unit exceeds the estimated fair value, an impairment charge is recorded to reduce the carrying value to the estimated fair value.
Acquired intangible assets consist of identifiable intangible assets, primarily software technology and customer relationships, resulting from our acquisitions. Intangible assets are recorded at fair value on the date of acquisition and amortized over their estimated useful lives.
Impairment of long-lived assets
Long-lived assets, such as property and equipment and intangible assets, are reviewed for impairment whenever events or changes in circumstances indicate that the carrying amount of an asset group may not be recoverable. Recoverability of an asset group is measured by comparing the carrying amount to the estimated undiscounted future cash flows expected to be generated. If the carrying amount exceeds the undiscounted cash flows, the assets are determined to be impaired and an impairment charge is recognized as the amount by which the carrying amount exceeds its fair value. No impairments of long-lived assets were recorded during any of the periods presented.
Leases
We determine if an arrangement is a lease at inception, and leases are classified at commencement as either operating or finance leases.
Right-of-use (“ROU”) assets and lease liabilities are recognized at commencement date based on the present value of the future minimum lease payments over the lease term. ROU assets also include any lease payments made.
86
Operating lease ROU assets are presented separately in long-term assets and finance lease ROU assets are included in property and equipment, net on our consolidated balance sheets. As our operating leases do not provide an implicit rate, we use our incremental borrowing rate based on information available at the commencement date in determining the present value of future payments. This rate is an estimate of the collateralized borrowing rate we would incur on our future lease payments over a similar term based on the information available at commencement date. Our lease terms may include options to extend or terminate the lease when it is reasonably certain that we will exercise that option. At January 31, 2020, we did not include any options to extend leases in our lease terms as we were not reasonably certain to exercise them. The Company’s lease agreements do not contain residual value guarantees or covenants.
We utilize certain practical expedients and policy elections available under the lease accounting standard. Leases with a term of one year or less are not recognized on our consolidated balance sheets; we recognize lease expense for these leases on a straight-line basis over the lease term. Additionally, we have elected to include non-lease components with lease components for contracts containing real estate leases for the purpose of calculating lease right-of-use assets and liabilities, to the extent that they are fixed. Non-lease components that are not fixed are expensed as incurred as variable lease payments. Our real estate operating leases typically include non-lease components such as common-area maintenance costs.
ROU assets are subject to evaluation for impairment or disposal on a basis consistent with other long-lived assets.
Self-funded health insurance
Advertising expenses
Deferred offering costs
Deferred offering costs of $3.4 million, primarily consisting of legal, accounting, and other fees related to the IPO, were offset against proceeds upon the closing of the IPO on May 1, 2018. Deferred offering costs of $0.9 million were offset against proceeds upon the closing of the follow-on offering on June 14, 2019.
Convertible preferred stock warrant liability
The Company classified its warrant to purchase convertible preferred stock as a liability. The Company adjusted the carrying value of the warrant liability to fair value at the end of each reporting period utilizing the Black-Scholes option pricing model. The convertible preferred stock warrant liability was included on the Company’s consolidated balance sheets and its revaluation was recorded as an expense in other income (expense), net for the fiscal years ended 2018 and 2019. Upon the closing of the IPO on May 1, 2018, the related warrant liability was reclassified to additional paid-in capital.
Share-based compensation
The Company measures and recognizes compensation expense for all share-based awards granted to employees and directors, based on the estimated fair value of the award on the date of grant. Expense is recognized on a straight-line basis over the vesting period of the award based on the estimated portion of the award that is expected to vest.
87
The Company uses the Black-Scholes option pricing model to measure the fair value of stock option awards when they are granted. The Company makes several estimates in determining share-based compensation and these estimates generally require significant analysis and judgment to develop.
Income taxes
Income taxes are accounted for using the asset and liability method. Under this method, the Company recognizes deferred tax assets and liabilities for the expected future tax consequences of temporary differences between the carrying amounts and the tax basis of assets and liabilities. Deferred tax assets and liabilities are measured using the enacted tax rates expected to apply to taxable income in the years in which the temporary differences are expected to be recovered or settled. The Company records a valuation allowance to reduce deferred tax assets to an amount for which realization is more likely than not.
The Company evaluates and accounts for uncertain tax positions using a two-step approach. The first step is to evaluate if the weight of available evidence indicates that it is more likely than not that the tax position will be sustained in an audit. The second step is to measure the tax benefit as the largest amount that is more than 50% likely to be realized upon ultimate settlement. The Company reflects interest and penalties related to income tax liabilities as a component of income tax expense.
Financial instruments that potentially subject the Company to concentrations of credit risk are primarily cash, cash equivalents, short-term investments, and accounts receivable. The Company maintains its cash accounts with financial institutions where deposits, at times, exceed the Federal Deposit Insurance Corporation (“FDIC”) limits.
No individual customers represented more than 10% of accounts receivable as of the years ended January 31, 2020 or 2019. No individual customers represented more than 10% of revenue for the years ended January 31, 2020, 2019, or 2018.
Net loss per share
Prior to the IPO, holders of the Company’s convertible preferred stock participated in dividends with holders of the Company’s common stock, but they were not contractually required to share in net losses. Accordingly, during those periods of income, the Company was required to use the two-class method of calculating earnings per share. The two-class method requires that earnings per share be calculated separately for each class of security. As the Company incurred losses during the periods presented, the Company used the methods described below to calculate net loss per share.
The Company calculates basic net loss per share by dividing net loss attributable to common shareholders by the weighted-average number of the Company’s common stock shares outstanding during the respective period. Net loss attributable to common shareholders is net loss minus convertible preferred stock dividends declared, of which there were none during the periods presented.
The Company calculates diluted net loss per share using the treasury stock and if-converted methods, which consider the potential impacts of outstanding stock options, restricted stock units (“RSUs”), shares issuable pursuant to our Employee Stock Purchase Plan (“ESPP”), warrants, and convertible preferred stock. Under these methods, the numerator and denominator of the net loss per share calculation are adjusted for these securities if the impact of doing so increases net loss per share. During the periods presented, the impact is to decrease net loss per share and therefore the Company is precluded from adjusting its calculation for these securities. As a result, diluted net loss per share is calculated using the same formula as basic net loss per share.
88
Recently adopted accounting pronouncements
We adopted Accounting Standard Update (“ASU”) 2016-02, Leases - Topic 842 (“ASC 842”) on February 1, 2019 using the optional transition method described in ASU 2018-11, Leases - Targeted Improvements. Under the optional transition method, we recognized the cumulative effect of initially applying the guidance as an adjustment to the operating lease ROU assets and operating lease liabilities on our consolidated balance sheet on February 1, 2019 without retrospective application to comparative periods.
The new lease standard requires lessees to recognize ROU assets and lease liabilities on the balance sheet for operating leases, and also requires additional quantitative and qualitative disclosures to enable users of the financial statements to assess the amount, timing, and uncertainty of cash flows arising from leases. In adopting ASC 842, we utilized certain practical expedients available under the standard. These practical expedients include waiving reassessment of conclusions reached under the previous lease standard as to whether contracts contain leases and not recording ROU assets or lease liabilities for leases with terms of 12 months or less.
As a result of implementing this guidance, we recognized a $53.4 million net operating ROU asset and a $55.3 million operating lease liability, inclusive of $1.9 million previously classified as deferred rent, in our consolidated balance sheet as of February 1, 2019. The adoption of ASC 842 did not have an impact on our accumulated deficit on our consolidated balance sheet as of February 1, 2019 and is not expected to have a material impact on our consolidated statements of operations and comprehensive loss.
See Note 12, Leases, for additional information regarding our leases.
Recent accounting pronouncements not yet adopted
In June 2016, the FASB issued ASU 2016-13, including subsequent amendments, Measurement of Credit Losses on Financial Instruments (Topic 326) (“ASU 2016-13”) and has modified the standard thereafter, which modifies the accounting methodology for most financial instruments. The guidance establishes a new “expected loss model” that requires entities to estimate current expected credit losses on financial instruments by using all practical and relevant information. Additionally, any expected credit losses are to be reflected as allowances rather than reductions in the amortized cost of available-for-sale debt securities. This guidance is effective for interim and annual periods beginning after December 15, 2019, and early adoption is permitted. The Company does not expect the adoption of this standard to have a material effect on our consolidated financial statements.
In August 2018, the FASB issued ASU 2018-15, Intangibles - Goodwill and Other-Internal-Use Software (“ASU 2018-15”), which aligns the requirements for capitalizing implementation costs incurred in a hosting arrangement that is a service contract with the requirements for capitalizing implementation costs incurred to develop or obtain internal-use software. This guidance is effective for interim and annual reporting periods beginning after December 15, 2019, and early adoption is permitted. The Company does not expect adoption of this ASU to have a material effect on the Company’s consolidated financial statements.
In December 2019, the FASB issued ASU 2019-12, Income Taxes (Topic 740) (“ASU 2019-12”), which simplifies certain aspects of accounting for income taxes. The guidance is effective for interim and annual reporting periods beginning after December 15, 2020, and early adoption is permitted. The Company does not expect adoption of this ASU to have a material effect on the Company’s consolidated financial statements.
3. Revenue from Contracts with Customers
During the years ended January 31, 2020, 2019, and 2018 the Company recognized $93.0 million, $55.3 million, and $32.0 million of subscription revenue, respectively, and $2.1 million, $1.5 million, and $0.6 million of professional services revenue, respectively, which were included in the deferred revenue balance as of January 31, 2019, 2018, and 2017, respectively.
As of January 31, 2020, including amounts already invoiced and amounts contracted but not yet invoiced, approximately $166.9 million of revenue was expected to be recognized from remaining performance obligations, of which $163.0 million related to subscription services and $3.9 million related to professional services.
89
Approximately 96 % of revenue related to remaining performance obligations is expected to be recognized in the next 12 months.
4. Deferred Commissions
Deferred commissions were $48.3 million as of January 31, 2020 and $29.0 million as of January 31, 2019.
Amortization expense for deferred commissions was $19.8 million, $10.8 million, and $5.0 million for the years ended January 31, 2020, 2019, and 2018, respectively. Deferred commissions are amortized over a period of three years and the amortization expense is recorded in sales and marketing on the Company’s consolidated statements of operations.
5. Net Loss Per Share
The following tables present calculations for basic and diluted net loss per share (in thousands, except per share data):
Year Ended January 31, | |||||||||||
2020 | 2019 | 2018 | |||||||||
Numerator: | |||||||||||
Net loss attributable to common shareholders | $ | ( | ) | $ | ( | ) | $ | ( | ) | ||
Denominator: | |||||||||||
Weighted-average common shares outstanding | |||||||||||
Net loss per share, basic and diluted | $ | ( | ) | $ | ( | ) | $ | ( | ) | ||
January 31, | ||||||||
2020 | 2019 | 2018 | ||||||
Convertible preferred shares (as converted) | ||||||||
Convertible preferred stock warrant | ||||||||
Shares subject to outstanding common stock awards | ||||||||
Shares issuable pursuant to the Employee Stock Purchase Plan | ||||||||
Total potentially dilutive shares | ||||||||
6. Fair Value Measurements
Assets and liabilities recorded at fair value in the consolidated financial statements are categorized based upon the level of judgment associated with the inputs used to measure their fair value. The lowest level of significant input determines the placement of the fair value measurement within the following hierarchical levels:
• | Level 1: Observable inputs that reflect quoted prices (unadjusted) for identical assets or liabilities in active markets. |
• | Level 2: Observable inputs, other than Level 1 prices, such as quoted prices for similar assets or liabilities, quoted prices in markets that are not active, or other inputs that are observable or can be corroborated by observable market data for substantially the full term of the assets or liabilities. |
• | Level 3: Unobservable inputs that are supported by little or no market activity. |
90
The following tables present information about the Company’s financial assets and liabilities that are measured at fair value and indicates the fair value hierarchy of the valuation inputs used (in thousands) as of:
January 31, 2020 | |||||||||||||||
Level 1 | Level 2 | Level 3 | Total | ||||||||||||
Assets: | |||||||||||||||
Cash equivalents: | |||||||||||||||
Money market funds | $ | $ | $ | $ | |||||||||||
Certificates of deposit | |||||||||||||||
Short-term investments: | |||||||||||||||
Certificates of deposit | |||||||||||||||
Total assets | $ | $ | $ | $ | |||||||||||
January 31, 2019 | |||||||||||||||
Level 1 | Level 2 | Level 3 | Total | ||||||||||||
Assets: | |||||||||||||||
Cash equivalents: | |||||||||||||||
Money market funds | $ | $ | $ | $ | |||||||||||
Restricted cash: | |||||||||||||||
Certificates of deposit | |||||||||||||||
Total assets | $ | $ | $ | $ | |||||||||||
The carrying amounts of certain financial instruments, including cash held in banks, accounts receivable, and accounts payable, approximate fair value due to their short-term maturities and are excluded from the fair value tables above.
It is the Company’s policy to recognize transfers of assets and liabilities between levels of the fair value hierarchy at the end of a reporting period. The Company does not transfer out of Level 3 and into Level 2 until observable inputs become available and reliable.
7. Property and Equipment, Net
As of the dates specified below, property and equipment (in thousands) consisted of the following:
January 31, | |||||||
2020 | 2019 | ||||||
Computer equipment | $ | $ | |||||
Computer software, purchased and developed | |||||||
Furniture and fixtures | |||||||
Leasehold improvements | |||||||
Total property and equipment | |||||||
Less: accumulated depreciation | ( | ) | ( | ) | |||
Total property and equipment, net | $ | $ | |||||
Depreciation expense was $10.7 million, $7.2 million, and $4.0 million for the years ended January 31, 2020, 2019, and 2018, respectively.
91
Property and equipment includes $14.2 million and $11.8 million of data center equipment purchased under finance leases at January 31, 2020 and 2019, respectively. Accumulated depreciation related to these leased assets was $10.2 million and $6.1 million at January 31, 2020 and 2019, respectively. Depreciation expense on finance leases, which is included in total depreciation expense described immediately above, was $4.3 million, $3.6 million, and $2.2 million for the years ended January 31, 2020, 2019, and 2018, respectively. These leased assets are included in the computer equipment category in the table above.
8. Business Combinations
On May 1, 2019, we acquired 100 % of the outstanding equity of Artefact Product Group, LLC (“Artefact Product Group” or “10,000ft”), a Washington limited liability company, pursuant to an Agreement and Plan of Merger (the “Merger Agreement”). The acquisition is complementary to our existing product capabilities and accelerates our time to market for a resource planning software solution. The aggregate consideration paid in exchange for all of the outstanding equity interests of Artefact Product Group was approximately $27.8 million in cash, after a working capital adjustment of $0.2 million and excluding cash acquired. Of the cash paid at closing, as of January 31, 2020, a total of $2.8 million remains held in escrow for another three-month period to secure our indemnification rights under the Merger Agreement.
We accounted for the transaction as a business combination using the acquisition method of accounting. We allocated the purchase price to the tangible and identifiable intangible assets acquired and liabilities assumed based on their respective estimated fair values on the acquisition date. Excess purchase price consideration was recorded as goodwill, and is primarily attributable to the acquired assembled workforce and expected growth from the expansion of the acquired product offerings and customer base. The goodwill recognized upon acquisition is expected to be deductible for U.S. federal income tax purposes.
We engaged a third-party valuation specialist to aid our analysis of the fair value of the acquired intangibles. All estimates, key assumptions, and forecasts were either provided by or reviewed by us. While we chose to utilize a third-party valuation specialist for assistance, the fair value analysis and related valuations reflect the conclusions of management and not those of any third party.
10,000ft’s results of operations have been included in the Company’s consolidated results of operations since the acquisition date. The purchase price allocation as of the acquisition date was based on a preliminary valuation and is subject to revision as more detailed analyses are completed and additional information about the fair value of assets acquired and liabilities assumed becomes available.
The major classes of assets and liabilities to which the Company preliminarily allocated the purchase price, net of the $0.2 million working capital adjustment, were as follows (in thousands):
May 1, 2019 | |||
Cash | $ | ||
Current Assets | |||
Intangible Assets | |||
Goodwill | |||
Current Liabilities | ( | ) | |
Deferred Revenue | ( | ) | |
Total | $ | ||
The estimated useful lives and fair values of the identifiable intangible assets at acquisition date were as follows (dollars in thousands):
92
Fair Value | Expected Useful Life | ||||
Software Technology | $ | ||||
Customer Relationships | |||||
Trade Name | |||||
Total intangible assets | $ | ||||
The significant identified intangible assets, software technology and customer relationships, were valued as follows:
Software technology - we valued the finite-lived software technology using the relief-from-royalty method under the income approach. This method reflects the present value of the projected cash flows that are expected to be generated from the licensing of the asset to third parties. We applied judgment which involved the use of significant assumptions with respect to the base year revenue and the royalty rate.
Customer relationships - we valued the finite-lived customer relationships using the multi-period excess-earnings method. This method involves forecasting the net earnings to be generated by the asset, reducing them by appropriate returns on contributory assets, and then discounting the resulting net returns to a present value using an appropriate discount rate. We applied judgment which involved the use of the significant assumption of the royalty rate impacting the returns on contributory assets for software technology.
Fiscal 2019 Acquisition
On January 11, 2019, Smartsheet Inc. purchased 100 % of the issued and outstanding capital stock of TernPro, Inc. in an all-cash transaction for a total purchase price of $6.0 million. As a result of this acquisition, the Company recorded goodwill of $5.2 million; identifiable intangible assets of $0.8 million, of which $0.5 million related to acquired software technology, and $0.3 million related to customer relationships; and other net assets of less than $0.1 million. In addition, the Company recorded a long-term liability of $1.0 million related to a holdback payable on the 18-month anniversary of the closing date. As of January 31, 2020, the liability of $1.0 million is classified as short-term, and is included within other accrued liabilities on the consolidated balance sheet.
9. Goodwill and Net Intangible Assets
The changes in the carrying amount of goodwill during the twelve months ended January 31, 2020 were as follows (in thousands):
Goodwill balance as of January 31, 2019 | $ | ||
Addition - acquisition of 10,000ft | |||
Working capital adjustment - acquisition of 10,000ft | ( | ) | |
Goodwill balance as of January 31, 2020 | $ | ||
93
The following table presents the components of net intangible assets (in thousands):
As of January 31, 2020 | As of January 31, 2019 | ||||||||||||||||||||||
Gross Carrying Amount | Accumulated Amortization | Net Carrying Amount | Gross Carrying Amount | Accumulated Amortization | Net Carrying Amount | ||||||||||||||||||
Acquired software technology | $ | $ | ( | ) | $ | $ | $ | ( | ) | $ | |||||||||||||
Acquired customer relationships | ( | ) | ( | ) | |||||||||||||||||||
Trade names | ( | ) | |||||||||||||||||||||
Patents | ( | ) | ( | ) | |||||||||||||||||||
Domain name | |||||||||||||||||||||||
Total | $ | $ | ( | ) | $ | $ | $ | ( | ) | $ | |||||||||||||
The components of intangible assets acquired as of the periods presented were as follows (in thousands):
As of January 31, 2020 | As of January 31, 2019 | |||||||||||
Net Carrying Amount | Weighted Average Life (Years) | Net Carrying Amount | Weighted Average Life (Years) | |||||||||
Acquired software technology | $ | $ | ||||||||||
Acquired customer relationships | ||||||||||||
Trade names | — | |||||||||||
Total | $ | $ | ||||||||||
Amortization expense was $2.8 million, $0.5 million, and $0.1 million for the twelve months ended January 31, 2020, 2019, and 2018, respectively.
As of January 31, 2020, estimated remaining amortization expense for the finite-lived intangible assets by fiscal year is as follows (in thousands):
2021 | $ | |||
2022 | ||||
2023 | ||||
2024 | ||||
2025 | ||||
Thereafter | ||||
Total | $ | |||
10. Share-Based Compensation
The Company has issued incentive and non-qualifying stock options to employees and non-employee directors under the 2005 Stock Option/Restricted Stock Plan (“2005 Plan”), the 2015 Equity Incentive Plan (“2015 Plan”), and the 2018 Equity Incentive Plan (“2018 Plan”).
The Company has also issued RSUs to employees pursuant to the 2015 Plan and the 2018 Plan.
Employee stock options are granted with exercise prices at the fair value of the underlying common stock on the grant date, in general vest based on continuous employment over four years , and expire 10 years from the date of grant. Employee RSUs are measured based on the grant date fair value of the awards and in general vest based on continuous employment over four years . Shares offered under our equity plans are authorized but unissued.
Stock options
The following table includes a summary of the option activity during the year ended January 31, 2020:
94
Options Outstanding | Weighted-Average Exercise Price | Weighted-Average Remaining Contractual Term (years) | Aggregate Intrinsic Value (in thousands) | |||||||||
Outstanding at January 31, 2019 | $ | $ | ||||||||||
Granted | ||||||||||||
Exercised | ( | ) | ||||||||||
Forfeited or canceled | ( | ) | ||||||||||
Outstanding at January 31, 2020 | ||||||||||||
Exercisable at January 31, 2020 | ||||||||||||
Vested and expected to vest at January 31, 2020 | ||||||||||||
The weighted-average grant date fair value per share of stock options granted during the years ended January 31, 2020, 2019, and 2018 was $17.11 , $4.66 , and $2.36 , respectively. The total grant date fair value of stock options vested was $11.1 million, $5.8 million, and $2.4 million during the years ended January 31, 2020, 2019, and 2018, respectively.
The intrinsic value of options exercised was $136.6 million, $66.7 million, and $17.8 million during the years ended January 31, 2020, 2019, and 2018, respectively.
Restricted stock units
The following table includes a summary of the RSU activity during the year ended January 31, 2020:
Number of Shares Underlying Outstanding RSUs | Weighted-Average Grant-Date Fair Value per RSU | |||||
Outstanding at January 31, 2019 | $ | |||||
Granted | ||||||
Vested | ( | ) | ||||
Forfeited or canceled | ( | ) | ||||
Outstanding at January 31, 2020 | ||||||
An RSU award entitles the holder to receive shares of the Company’s common stock as the award vests, which is based on continued service. Non-vested RSUs do not have non-forfeitable rights to dividends or dividend equivalents.
The weighted-average grant date fair value of RSUs granted during the years ended January 31, 2020 and 2019 was $41.62 and $26.12 , respectively.
2018 Employee Stock Purchase Plan
In April 2018, we adopted our 2018 ESPP. The ESPP became effective on April 26, 2018, with the effective date of our IPO.
Under our ESPP, eligible employees are able to acquire shares of our common stock by accumulating funds through payroll deductions of up to 15 % of their compensation, subject to plan limitations. Purchases are accomplished through participation in discrete offering periods. Each offering period is six months (commencing each March 25 and September 25) and consists of one six-month purchase period, unless otherwise determined by our board of directors or our compensation committee. The purchase price for shares of our common stock purchased under our ESPP is 85 % of the lesser of the fair market value of our common stock on (i) the first trading
95
day of the applicable offering period or (ii) the last trading day of the purchase period in the applicable offering period.
The following table includes a summary of shares available for issuance under our 2018 Plan and our 2018 ESPP during the year ended January 31, 2020:
Shares Available for Issuance | |||||
2018 Plan | 2018 ESPP | ||||
Balance at January 31, 2019 | |||||
Authorized | |||||
Granted | ( | ) | ( | ) | |
Forfeited | |||||
Balance at January 31, 2020 | |||||
The aggregate number of shares reserved for issuance under our ESPP will increase automatically on February 1 of each of the first 10 calendar years after the first offering date under the ESPP by the number of shares equal to 1 % of the total outstanding shares of our Class A common stock and Class B common stock as of the immediately preceding January 31 (rounded to the nearest whole share) or such lesser number of shares as may be determined by our board of directors in any particular year. The aggregate number of shares issued over the term of our ESPP, subject to stock-splits, recapitalizations or similar events, may not exceed 20,400,000 shares of our Class A common stock.
As of January 31, 2020, $5.4 million has been withheld on behalf of employees for a future purchase under the ESPP and is recorded in accrued compensation and related benefits.
Valuation assumptions
The fair value of employee stock options and ESPP purchase rights was estimated using a Black-Scholes option pricing model with the following assumptions:
Year Ended January 31, | ||||||||
2020 | 2019 | 2018 | ||||||
Employee Stock Options | ||||||||
Risk-free interest rate | 2.28%-2.59% | 2.7%-2.9% | 1.8%-2.6% | |||||
Expected volatility | 42.3%-42.5% | 40.2%-40.8% | 41.7%-46.0% | |||||
Expected term (in years) | 6.19-6.25 | |||||||
Expected dividend yield | % | % | % | |||||
Employee Stock Purchase Plan | ||||||||
Risk-free interest rate | 1.9%-2.5% | 2.0%-2.4% | N/A | |||||
Expected volatility | 38.3%-51.1% | 38.3%-42.2% | N/A | |||||
Expected term (in years) | 0.49-0.50 | 0.33-0.49 | N/A | |||||
Expected dividend yield | % | % | N/A | |||||
The risk-free interest rate used in the Black-Scholes option pricing model is based on the U.S. Treasury yield that corresponds with the expected term at the time of grant. The expected term of an option is determined using the simplified method, which is calculated as the average of the contractual life and the vesting period. The expected term for the ESPP purchase rights is estimated using the offering period, which is typically six months . We estimate volatility for options using volatilities of a group of public companies in a similar industry, stage of life cycle, and size; and volatility of ESPP purchase rights using our own volatility history. The Company does not currently issue dividends and does not expect to for the foreseeable future. In addition to the assumptions used in the Black-Scholes option pricing model, we must also estimate a forfeiture rate to calculate the share-based compensation expense for
96
awards. Our forfeiture rate is derived from historical employee termination behavior. If the actual number of forfeitures differs from these estimates, additional adjustments to compensation expense will be required.
Given the absence of an active market for the Company’s common stock prior to the IPO, the board of directors was required to estimate the fair value of the Company’s common stock at the time of each option grant based on several factors, including consideration of input from management and contemporaneous third-party valuations. These valuations included consideration of enterprise value and assessment of other common stock and convertible preferred stock transactions occurring during the period.
Share-based compensation expense
Share-based compensation expense included in the consolidated statements of operations was as follows (in thousands):
Year Ended January 31, | |||||||||||
2020 | 2019 | 2018 | |||||||||
Cost of subscription revenue | $ | $ | $ | ||||||||
Cost of professional services revenue | |||||||||||
Research and development | |||||||||||
Sales and marketing | |||||||||||
General and administrative | |||||||||||
Total share-based compensation | $ | $ | $ | ||||||||
In the year ended January 31, 2018, subsequent to the sale of the Company’s Series F convertible preferred stock, the Company facilitated a tender offer (the “2017 Tender Offer”) in which certain of the Company’s current and former employees and directors sold shares of common and convertible preferred stock to other existing shareholders. The sale of shares by the employees, directors, and other shareholders was facilitated by the Company. A total of 6,477,843 shares of common and convertible preferred stock were tendered for a total purchase price of $55.0 million. Our quarterly trends in total operating expenses, operating loss, and net loss, were significantly impacted by this transaction, which took place and was completed during the three months ended July 31, 2017.
The premium over the fair value of the shares of common and convertible preferred stock that was paid by existing investors to current employees and directors, totaling $15.5 million, was recorded as share-based compensation expense for the year ended January 31, 2018. The excess over the fair value of the sale price of the shares of common and convertible preferred stock sold by non-employees, totaling $4.6 million, was recorded as a deemed dividend within additional paid-in capital in the year ended January 31, 2018.
Share-based compensation expense related to the 2017 Tender Offer, which is included in the table above, was as follows (in thousands):
Year Ended January 31, | |||||||||||
2020 | 2019 | 2018 | |||||||||
Cost of subscription revenue | $ | $ | $ | ||||||||
Cost of professional services revenue | |||||||||||
Research and development | |||||||||||
Sales and marketing | |||||||||||
General and administrative | |||||||||||
Total share-based compensation expense | $ | $ | $ | ||||||||
As of January 31, 2020, there was a total of $124.1 million of unrecognized share-based compensation expense, which is expected to be recognized over a weighted-average period of 3.1 years.
97
11. Income Taxes
The Company is liable for income taxes in the United States, the United Kingdom, and Australia.
U.S. and international components of loss before provision for income taxes were as follows (in thousands):
Year Ended January 31, | |||||||||||
2020 | 2019 | 2018 | |||||||||
United States | $ | ( | ) | $ | ( | ) | $ | ( | ) | ||
Foreign | ( | ) | |||||||||
Loss before provision for income taxes | $ | ( | ) | $ | ( | ) | $ | ( | ) | ||
The expense (benefit) for income taxes consisted of (in thousands):
Year Ended January 31, | |||||||||||
2020 | 2019 | 2018 | |||||||||
Current: | |||||||||||
Federal | $ | $ | $ | ||||||||
State | |||||||||||
Foreign | |||||||||||
Total current provision for income taxes | |||||||||||
Deferred and other: | |||||||||||
Federal | ( | ) | |||||||||
State | ( | ) | |||||||||
Foreign | ( | ) | |||||||||
Total deferred tax expense (benefit) | ( | ) | |||||||||
Total tax expense (benefit) | $ | $ | $ | ( | ) | ||||||
Income tax expense for the year ended January 31, 2020 was recognized primarily due to state and foreign income taxes.
Income tax expense for the year ended January 31, 2019 was recognized primarily due to changes in purchase accounting related to the acquisition of Converse.AI that reduced the overall acquired deferred tax liability. As a result, the increase in the valuation allowance was recognized in income tax expense.
On December 22, 2017, the U.S. government enacted comprehensive tax legislation commonly referred to as the “Tax Cuts and Jobs Act” (“TCJA”). The TCJA made broad and complex changes to the Internal Revenue Code, including but not limited to, a reduction in the U.S. corporate income tax rate to 21%, requiring a one-time transition tax on certain unrepatriated earnings of foreign subsidiaries, a general elimination of U.S. federal income taxes on dividends from foreign subsidiaries, and a new provision designed to tax global intangible low-taxed income (“GILTI”).
The reduction in the corporate tax rate reduced the Company’s effective tax rate in future periods. Since the Company has a January 31 fiscal year end, the U.S. entity had a blended tax rate of 32.9 % for the fiscal year ended January 31, 2018. As of January 31, 2018, the Company also remeasured its U.S. deferred tax assets and liabilities based upon the rates at which they were expected to reverse in the future. The result of the remeasurement was an $11.1 million reduction to the Company’s U.S. federal net deferred tax assets. A corresponding change was recorded to the valuation allowance.
98
The TCJA subjects a U.S. shareholder to tax on GILTI earned by certain foreign subsidiaries. An entity can make an accounting policy election to either recognize deferred taxes for temporary basis differences expected to reverse as a GILTI in future years or to provide for the tax expense related to GILTI in the year the tax is incurred as period expense. The Company has elected to account for GILTI in the year the tax is incurred as a period cost.
The reconciliation of federal statutory income tax to the Company’s provision for income taxes is as follows (in thousands):
Year Ended January 31, | |||||||||||
2020 | 2019 | 2018 | |||||||||
Expected provision at statutory federal rate | $ | ( | ) | $ | ( | ) | $ | ( | ) | ||
Tax credits | ( | ) | ( | ) | ( | ) | |||||
Change in valuation allowance | |||||||||||
Share-based compensation | ( | ) | ( | ) | |||||||
Impact of tax reform | |||||||||||
Other | |||||||||||
Total income tax provision (benefit) | $ | $ | $ | ( | ) | ||||||
U.S. federal tax net operating loss carryforwards were approximately $205.6 million and $82.3 million at January 31, 2020 and 2019, respectively, which will expire on various dates, starting in 2025.
As of January 31, 2020 and 2019, the Company’s tax credit carryforwards for income tax purposes were approximately $12.1 and $6.3 million, respectively, net of uncertain tax positions for research and development credits. If not used, a portion of the tax credit carryforwards will begin to expire in 2031.
Deferred income taxes reflect the net tax effects of loss and credit carryforwards and temporary differences between the carrying amounts of assets and liabilities for financial reporting purposes and the amounts used for income tax purposes.
99
The tax effects of temporary differences and related deferred tax assets and liabilities as of January 31, 2020 and 2019 were as follows (in thousands):
January 31, | |||||||
2020 | 2019 | ||||||
Deferred tax assets: | |||||||
Net operating loss carryforwards | $ | $ | |||||
Deferred revenue | |||||||
Lease liabilities | — | ||||||
Tax credits | |||||||
Share-based compensation | |||||||
Accrued compensation | |||||||
Other | |||||||
Total deferred tax assets | |||||||
Valuation allowance | ( | ) | ( | ) | |||
Total deferred tax assets, net | |||||||
Deferred tax liabilities: | |||||||
Lease right-of-use assets | ( | ) | — | ||||
Capitalized commissions | ( | ) | ( | ) | |||
Property and equipment | ( | ) | |||||
Intangibles | ( | ) | ( | ) | |||
Total deferred tax liabilities | ( | ) | ( | ) | |||
Net deferred tax assets | $ | $ | |||||
Management assesses the available positive and negative evidence to estimate whether sufficient future taxable income will be generated to permit use of the existing deferred tax assets. A significant piece of objective negative evidence evaluated was the cumulative loss incurred over the three-year period ended January 31, 2020. Such objective evidence limits the ability to consider other subjective evidence, such as the Company’s projections for future growth. On the basis of this evaluation, the Company has established a full valuation allowance equal to its U.S. and U.K. net deferred tax assets due to the uncertainty of future realization of the net deferred tax assets. The valuation allowance increased by $54.5 million during the period ended January 31, 2020. The increase in the valuation allowance was primarily related to U.S. federal and state losses incurred during the period.
The calculation of the Company’s tax obligations involves dealing with uncertainties in the application of complex tax laws and regulations. ASC 740, Income Taxes, provides that a tax benefit from an uncertain tax position may be recognized when it is more likely than not that the position will be sustained upon examination, including resolutions of any related appeals or litigation processes, on the basis of the technical merits. The Company has assessed its income tax positions and recorded tax benefits for all years subject to examination, based upon its evaluation of the facts, circumstances, and information available at each period end. For those tax positions where the Company has determined there is a greater than 50% likelihood that a tax benefit will be sustained, the Company has recorded the largest amount of tax benefit that may potentially be realized upon ultimate settlement with a taxing authority that has full knowledge of all relevant information. For those income tax positions where it is determined there is less than 50% likelihood that a tax benefit will be sustained, no tax benefit has been recognized.
The following is a tabular reconciliation of the total amounts of unrecognized tax benefits:
100
Year Ended January 31, | |||||||||||
2020 | 2019 | 2018 | |||||||||
Balance, beginning of the year | $ | $ | $ | ||||||||
Increases to tax positions taken during the current year | |||||||||||
Increases to tax positions taken in prior years | |||||||||||
Decreases to tax positions taken in prior years | ( | ) | |||||||||
Balance, end of year | $ | $ | $ | ||||||||
Although the Company believes that it has adequately reserved for its uncertain tax positions, it can provide no assurance that the final tax outcome of these matters will not be materially different. The Company makes adjustments to its reserves when facts and circumstances change, such as the closing of a tax audit or the refinement of an estimate. To the extent that the final tax outcome of these matters is different than the amounts recorded, such differences will affect the provision for income taxes in the period in which such determination is made.
No liability was recorded for uncertain tax positions, or related interest or penalties, as of January 31, 2020 and 2019. As of January 31, 2020 and 2019, the Company had $3.3 million and $1.4 million of unrecognized tax benefits, respectively, of which the total amount that would impact the effective tax rate, if recognized, is $3.3 million and $1.4 million, respectively. Any impact on the effective tax rate for unrecognized tax benefits would be offset by the impact of the Company's full valuation allowance on its U.S. federal and state deferred tax assets.
In the U.S., the Company’s tax years from 2005 to present remain effectively open to examination by the Internal Revenue Service, as well as various state and foreign jurisdictions.
Interest or penalties, if incurred, are recognized as a component of income tax expense. Penalties and interest recognized were no t material for the years ended January 31, 2020, 2019, and 2018.
12. Leases
The Company has operating leases primarily related to corporate offices and certain equipment, and finance leases primarily related to data center equipment. Our leases have remaining lease terms of less than 1 year to 7 years, some of which include options to extend the leases for up to 5 years.
The components of lease expense recorded in the consolidated statements of operations and comprehensive loss were as follows (in thousands):
Twelve Months Ended January 31, 2020 | |||
Operating lease cost | $ | ||
Finance lease cost: | |||
Amortization of assets | |||
Interest on lease liabilities | |||
Short-term lease cost | |||
Variable lease cost | |||
Total lease costs | $ | ||
101
Supplemental balance sheet information related to leases was as follows (in thousands):
Financial Statement Line Item | January 31, 2020 | ||||
Assets: | |||||
Operating lease assets | Operating lease right-of-use assets | $ | |||
Finance lease assets | Property and equipment, net | ||||
Total leased assets | $ | ||||
Liabilities: | |||||
Current | |||||
Operating lease liabilities | Operating lease liabilities, current | $ | |||
Finance lease liabilities | Finance lease liabilities, current | ||||
Non-current | |||||
Operating lease liabilities | Operating lease liabilities, non-current | ||||
Finance lease liabilities | Finance lease liabilities, non-current | ||||
Total lease liabilities | $ | ||||
Other information related to leases was as follows (dollars in thousands):
Twelve Months Ended January 31, 2020 | |||||
Supplemental cash flow information: | |||||
Cash paid for amounts included in the measurement of lease liabilities: | |||||
Operating cash flows related to operating leases* | $ | ||||
Operating cash flows related to finance leases | |||||
Financing cash flows related to finance leases | |||||
Right-of-use assets obtained in exchange for lease obligations: | |||||
Operating leases | |||||
Finance leases | |||||
Weighted-average remaining lease term (in years): | |||||
Operating leases | |||||
Finance leases | |||||
Weighted-average discount rate: | |||||
Operating leases | % | ||||
Finance leases | % | ||||
102
As of January 31, 2020, remaining maturities of lease liabilities were as follows (in thousands):
Operating Leases | Finance Leases | ||||||
Fiscal 2021 | $ | $ | |||||
Fiscal 2022 | |||||||
Fiscal 2023 | |||||||
Fiscal 2024 | |||||||
Fiscal 2025 | |||||||
Thereafter | |||||||
Total lease payments | $ | $ | |||||
Less: imputed interest | ( | ) | ( | ) | |||
Total | $ | $ | |||||
As of January 31, 2020, we had signed leases for additional office space that had not yet commenced. Future non-cancelable lease payments associated with these agreements totaled $42.3 million, payable over lease terms ranging from 7 to 9 years.
Total rent and related operating expenses recorded under Topic 840, the previous lease standard, totaled $8.9 million, and $5.0 million for the years ended January 31, 2019, and 2018, respectively.
As of January 31, 2019, future minimum annual lease payments (in thousands) related to the lease agreements mentioned above were as follows:
Operating Leases | Capital Leases | Total | |||||||||
Fiscal 2020 | $ | $ | $ | ||||||||
Fiscal 2021 | |||||||||||
Fiscal 2022 | |||||||||||
Fiscal 2023 | |||||||||||
Fiscal 2024 | |||||||||||
Thereafter | |||||||||||
Total minimum lease payments | $ | $ | $ | ||||||||
Less: amount representing interest | |||||||||||
Present value of capital lease obligations | $ | ||||||||||
13. Commitments and Contingencies
Lease Commitments
We have entered into various non-cancelable lease agreements related to corporate offices and certain equipment, and finance leases primarily related to data center equipment. For additional information regarding our lease agreements, see Note 12.
103
Purchase Commitments
The Company entered into a three-year commitment with a cloud-based hosting service provider for $15.0 million in the period ended January 31, 2019. As of January 31, 2020, $8.5 million of the total commitment amount remained unpaid, of which the greater of our on-demand usage or $5.0 million is to be paid in fiscal 2021, and an amount equal to the total commitment less the upfront payments and monthly charges incurred through fiscal 2021 is to be paid in fiscal 2022.
Legal matters
From time to time in the normal course of business, the Company may be subject to various legal matters such as threatened or pending claims or proceedings. We are not currently a party to any material legal proceedings or claims, nor are we aware of any pending or threatened litigation or claims against the Company that could have a material adverse effect on our business, operating results, cash flows, or financial condition should such litigation or claim be resolved unfavorably. An indemnification claim has been made to the Company in a litigation in which a former director and shareholder are parties. At this time, the Company cannot reasonably estimate the magnitude of its indemnification obligation, if any.
14. 401(k) and Pension Plans
In March 2008, the Company initiated a 401(k) plan for the benefit of its employees. No employer contributions were made to the 401(k) plan by the Company during the fiscal years ended January 31, 2020, 2019, or 2018.
In January 2018, the Company began contributing to a pension plan for the benefit of its employees based in the United Kingdom. In January 2020, the Company began contributing to a pension plan for the benefit of its employees based in Australia. Contributions to the plans by the Company were no t material during the years ended January 31, 2020, 2019 and 2018.
15. Related Party Transactions
Certain members of the board of directors serve as directors of, or are executive officers of, and in some cases are investors in, companies that are customers or vendors of the Company. Certain of the Company’s executive officers also serve as directors of, or serve in an advisory capacity to, companies that are customers or vendors of the Company. Related-party transactions were no t material as of and for the years ended January 31, 2020, 2019, and 2018.
16. Geographic Information
Revenue by geographic location is determined by the location of the Company’s customers. The following table sets forth revenue (in thousands) by geographic area:
Year Ended January 31, | |||||||||||
2020 | 2019 | 2018 | |||||||||
United States | $ | $ | $ | ||||||||
EMEA | |||||||||||
Asia Pacific | |||||||||||
Americas other than the United States | |||||||||||
Total | $ | $ | $ | ||||||||
No individual country other than the United States contributed more than 10% of total revenue during any of the periods presented.
104
Property and equipment by geographic location is based on the location of the legal entity that owns the asset. As of January 31, 2020 and January 31, 2019, there was no significant property and equipment owned by the Company outside of the United States.
17. Subsequent Events
Item 9. Changes in and Disagreements with Accountants on Accounting and Financial Disclosure
None.
Item 9A. Controls and Procedures
Evaluation of Disclosure Controls and Procedures
Under the supervision and with the participation of our management, including our principal executive officer (Chief Executive Officer) and principal financial officer (Chief Financial Officer), we conducted an evaluation (pursuant to Rule 13a-15(b) of the Exchange Act) of the effectiveness of our disclosure controls and procedures, as defined in Rule 13a-15(e) under the Exchange Act, as of January 31, 2020.
Disclosure controls and procedures are controls and other procedures that are designed to ensure that information required to be disclosed in our reports filed or submitted under the Exchange Act is recorded, processed, summarized, and reported, within the time periods specified in the SEC’s rules and forms. Disclosure controls and procedures include controls and procedures designed to ensure that information required to be disclosed in our reports filed or submitted under the Exchange Act is accumulated and communicated to management, including our Chief Executive Officer and Chief Financial Officer, to allow timely decisions regarding required disclosure.
Based on the evaluation of our disclosure controls and procedures, our Chief Executive Officer and Chief Financial Officer concluded that our disclosure controls and procedures were ineffective as of January 31, 2020 due to the material weaknesses identified in our internal control over financial reporting described below. Following identification of the material weaknesses and prior to filing this Annual Report on Form 10-K, we completed substantive procedures for the year ended January 31, 2020. Based on these procedures, management concluded that our consolidated financial statements included in this Form 10-K have been prepared in accordance with U.S. GAAP. Our Chief Executive Officer and Chief Financial Officer have certified that, based on their knowledge, the financial statements, and other financial information included in this Form 10-K, fairly present in all material respects the financial condition, results of operations and cash flows of the Company as of, and for, the periods presented in this Form 10-K.
Management’s Report on Internal Control over Financial Reporting
Our management, including our Chief Executive Officer and Chief Financial Officer, is responsible for establishing and maintaining adequate internal control over financial reporting (as defined in Rules 13a-15(f) and 15d-15(f) under the Exchange Act). Internal control over financial reporting is a process designed to provide reasonable assurance regarding the reliability of financial reporting and the preparation of financial statements for external purposes in accordance with U.S. GAAP. Our internal control over financial reporting includes those policies and procedures that: (i) pertain to the maintenance of records that, in reasonable detail, accurately and fairly reflect the transactions and dispositions of our assets; (ii) provide reasonable assurance that transactions are recorded as necessary to permit preparation of financial statements in accordance with U.S. GAAP, and that our receipts and expenditures are being made only in accordance with authorizations of our management and directors; and (iii) provide reasonable assurance regarding prevention or timely detection of unauthorized acquisition, use, or disposition of our assets that could have a material effect on the financial statements.
105
Under the supervision and with the participation of our management, including our Chief Executive Officer and Chief Financial Officer, we conducted an evaluation of the effectiveness of our internal control over financial reporting as of January 31, 2020, based on the framework in Internal Control — Integrated Framework issued by the Committee of Sponsoring Organizations of the Treadway Commission (COSO) (2013 framework).
A material weakness is a deficiency, or a combination of deficiencies, in internal control over financial reporting, such that there is a reasonable possibility that a material misstatement of the company's annual or interim financial statements will not be prevented or detected on a timely basis.
We identified a material weakness related to an ineffective control environment as we did not maintain a sufficient complement of resources with an appropriate level of controls knowledge and expertise commensurate with our financial reporting requirements. This contributed to additional material weaknesses as follows:
• | We did not design and maintain effective information technology (“IT”) general controls for certain information systems that are relevant to the preparation of our financial statements. Specifically, we did not design and maintain: (i) program change management controls for certain financial systems to ensure that information technology program and data changes affecting financial IT applications and underlying accounting records are identified, tested, authorized and implemented appropriately; (ii) user access controls to ensure appropriate segregation of duties that adequately restrict user and privileged access to certain financial applications, programs, and data to appropriate Company personnel; and (iii) computer operations controls to ensure that critical batch jobs are monitored and data backups are authorized and monitored. |
• | We did not design and maintain effective controls relating to the completeness, accuracy and occurrence of order entry and pricing during our billing and revenue processes. This material weakness was impacted by the material weakness related to the design and maintenance of the Company’s IT general controls. |
Because of these material weaknesses, our management has concluded that as of January 31, 2020, the Company did not maintain effective internal control over financial reporting.
These material weaknesses did not result in a misstatement to the financial statements and there are no changes to previously released financial results. However, these material weaknesses could result in misstatements of account balances or disclosures that would result in a material misstatement to the annual or interim consolidated financial statements that would not be prevented or detected.
The effectiveness of the Company's internal control over financial reporting as of January 31, 2020 has been audited by PricewaterhouseCoopers LLP, an independent registered public accounting firm, as stated in their report, which is included in Item 8 of this Annual Report on Form 10-K.
Remediation Activities
The Company is working to remediate the material weaknesses in its internal control over financial reporting.
• Control environment. The Company is hiring additional qualified staff with appropriate controls knowledge and expertise. Specifically, we are increasing our internal audit function and third-party resources, as necessary, to supplement internal staff.
• IT general controls. The Company is hiring additional qualified staff with appropriate controls knowledge and expertise. In addition, investments are being made in systems and tools to automate controls in our systems to better support control requirements relating to proper segregation of duties, access management, and change management processes.
• Revenue. In addition to remediating IT general control deficiencies impacting our revenue and billing processes, we will enhance certain processes and controls in our order entry and revenue recognition processes, and also formalize internal control over financial reporting for certain existing procedures in our billing and revenue recognition processes.
106
We believe that these actions will remediate the material weaknesses. The material weaknesses will not be considered remediated, however, until the applicable controls operate for a sufficient period of time and management has concluded, through testing, that these controls are operating effectively.
Changes in Internal Control Over Financial Reporting
We concluded that the following changes during the quarter ended January 31, 2020 have materially affected, or are reasonably likely to materially affect, our internal control over financial reporting.
During the quarter ended January 31, 2020, we identified the material weaknesses relating to our IT general controls and subscription and professional services billing and revenue processes, as described above.
Item 9B. Other Information
None.
Part III
Item 10. Directors, Executive Officers and Corporate Governance
The information required by this item is incorporated by reference to our Proxy Statement relating to our 2020 Annual Meeting of Shareholders. The Proxy Statement will be filed with the Securities and Exchange Commission within 120 days of the fiscal year ended January 31, 2020.
Item 11. Executive Compensation
The information required by this item is incorporated by reference to our Proxy Statement relating to our 2020 Annual Meeting of Shareholders. The Proxy Statement will be filed with the Securities and Exchange Commission within 120 days of the fiscal year ended January 31, 2020.
Item 12. Security Ownership of Certain Beneficial Owners and Management and Related Shareholder Matters
The information required by this item is incorporated by reference to our Proxy Statement relating to our 2020 Annual Meeting of Shareholders. The Proxy Statement will be filed with the Securities and Exchange Commission within 120 days of the fiscal year ended January 31, 2020.
Item 13. Certain Relationships and Related Transactions, and Director Independence
The information required by this item is incorporated by reference to our Proxy Statement relating to our 2020 Annual Meeting of Shareholders. The Proxy Statement will be filed with the Securities and Exchange Commission within 120 days of the fiscal year ended January 31, 2020.
Item 14. Principal Accountant Fees and Services
The information required by this item is incorporated by reference to our Proxy Statement relating to our 2020 Annual Meeting of Shareholders. The Proxy Statement will be filed with the Securities and Exchange Commission within 120 days of the fiscal year ended January 31, 2020.
Part III
107
Item 15. Exhibits
The following documents are filed as a part of this Annual Report on Form 10-K:
(a) Financial Statements
The information concerning our financial statements, and Report of Independent Registered Public Accounting Firm required by this Item is incorporated by reference herein to the section of this Annual Report on Form 10-K in Item 8, entitled “Financial Statements and Supplementary Data.”
(b) Financial Statement Schedules
All schedules have been omitted because the required information is not present or not present in amounts sufficient to require submission of the schedules, or because the information required is included in Item 8, entitled “Financial Statements and Supplementary Data.”
(c) Exhibits
Incorporated by Reference | |||||||
Exhibit Number | Exhibit Title | Form | File No. | Exhibit | Filing Date | Filed Herewith | |
3.1 | 10-Q | 001-38464 | 3.1 | June 12, 2018 | |||
3.2 | 10-Q | 001-38464 | 3.2 | June 12, 2018 | |||
4.1 | S-1/A | 333-223914 | 4.1 | April 16, 2018 | |||
4.2 | S-1 | 333-223914 | 4.2 | March 26, 2018 | |||
4.3 | X | ||||||
10.1⸶ | S-1/A | 333-223914 | 10.1 | April 16, 2018 | |||
10.2⸶ | S-1 | 333-223914 | 10.2 | March 26, 2018 | |||
10.3⸶ | S-1/A | 333-223914 | 10.3 | April 16, 2018 | |||
10.4⸶ | S-1/A | 333-223914 | 10.4 | April 16, 2018 | |||
10.5⸶ | S-1/A | 333-223914 | 10.5 | April 16, 2018 | |||
10.6⸶ | S-1 | 333-223914 | 10.6 | March 26, 2018 | |||
10.7⸶ | S-1 | 333-223914 | 10.7 | March 26, 2018 | |||
10.8⸶ | S-1 | 333-223914 | 10.8 | March 26, 2018 | |||
10.10⸶ | S-1 | 333-223914 | 10.10 | March 26, 2018 | |||
10.11⸶ | S-1 | 333-223914 | 10.11 | March 26, 2018 | |||
10.12⸶ | S-1 | 333-223914 | 10.12 | March 26, 2018 | |||
10.13⸶ | S-1 | 333-223914 | 10.13 | March 26, 2018 | |||
108
10.14 | S-1 | 333-223914 | 10.14 | March 26, 2018 | |||
10.15 | 10-K | 001-38464 | 10.15 | April 1, 2019 | |||
10.16 | 10-K | 001-38464 | 10.16 | April 1, 2019 | |||
10.17 | 10-K | 001-38464 | 10.17 | April 1, 2019 | |||
10.18 | 10-K | 001-38464 | 10.18 | April 1, 2019 | |||
10.19⸶ | 10-K | 001-38464 | 10.19 | April 1, 2019 | |||
10.20 | 10-Q | 001-38464 | 10.2 | June 7, 2019 | |||
10.21 | 10-Q | 001-38464 | 10.1 | June 7, 2019 | |||
21.1 | X | ||||||
23.1 | X | ||||||
24.1 | X | ||||||
31.1 | X | ||||||
31.2 | X | ||||||
32.1* | X | ||||||
32.2* | X | ||||||
101.INS | XBRL Instance Document | X | |||||
101.SCH | XBRL Taxonomy Extension Schema Document | X | |||||
101.CAL | XBRL Taxonomy Extension Calculation Linkbase Document | X | |||||
101.DEF | XBRL Taxonomy Extension Definition Linkbase Document | X | |||||
101.LAB | XBRL Taxonomy Extension Label Linkbase Document | X | |||||
101.PRE | XBRL Taxonomy Extension Presentation Linkbase Document | X | |||||
104 | The cover page from the Registrant’s Annual Report on Form 10-K for the year ended January 31, 2020, formatted in Inline XBRL (included in Exhibit 101) | X | |||||
⸶ | Indicates a management contract or compensatory plan. |
* | This certification is deemed not filed for purposes of Section 18 of the Exchange Act, or otherwise subject to the liability of that section, nor shall it be deemed incorporated by reference into any filing under the Securities Act or the Exchange Act. |
109
Item 16. Form 10-K Summary
None.
110
SIGNATURES
Pursuant to the requirements of the Securities Exchange Act of 1934, the registrant has duly caused this report to be signed on its behalf by the undersigned hereunto duly authorized.
SMARTSHEET INC. | |||
By: | /s/ Mark P. Mader | ||
Name: | Mark P. Mader | ||
Title: | Chief Executive Officer and President | ||
(Principal Executive Officer) | |||
Date: | March 31, 2020 | ||
SMARTSHEET INC. | |||
By: | /s/ Jennifer E. Ceran | ||
Name: | Jennifer E. Ceran | ||
Title: | Chief Financial Officer and Treasurer | ||
(Principal Financial and Accounting Officer) | |||
Date: | March 31, 2020 | ||
111
POWER OF ATTORNEY
KNOW ALL PERSONS BY THESE PRESENTS, that each person whose signature appears below constitutes and appoints Mark P. Mader and Jennifer E. Ceran, and each of them, as his or her true and lawful attorneys-in-fact, proxies, and agents, with full power of substitution, for him or her in any and all capacities, to sign any and all amendments to this Annual Report on Form 10-K, and to file the same, with all exhibits thereto and other documents in connection therewith, with the Securities and Exchange Commission, hereby ratifying and confirming all that each of said attorneys-in-fact, proxies, and agents, or substitute or substitutes may do or cause to be done by virtue hereof.
Pursuant to the requirements of the Securities Exchange Act of 1934, this report has been signed below by the following persons on behalf of the Registrant and in the capacities and on the dates indicated:
Name | Title | Date |
/s/ Mark P. Mader | Chief Executive Officer and President | March 31, 2020 |
Mark P. Mader | (Principal Executive Officer) | |
/s/ Jennifer E. Ceran | Chief Financial Officer and Treasurer | March 31, 2020 |
Jennifer E. Ceran | (Principal Financial and Accounting Officer) | |
/s/ Geoffrey T. Barker | Chair of the Board of Directors | March 31, 2020 |
Geoffrey T. Barker | ||
/s/ Brent Frei | Director | March 31, 2020 |
Brent Frei | ||
/s/ Elena Gomez | Director | March 31, 2020 |
Elena Gomez | ||
/s/ Michael Gregoire | Director | March 31, 2020 |
Michael Gregoire | ||
/s/ Matthew McIlwain | Director | March 31, 2020 |
Matthew McIlwain | ||
/s/ James N. White | Director | March 31, 2020 |
James N. White | ||
/s/ Magdalena Yesil | Director | March 31, 2020 |
Magdalena Yesil | ||
112