UNITED STATES
SECURITIES AND EXCHANGE COMMISSION
Washington, D.C. 20549
FORM N-CSR
CERTIFIED SHAREHOLDER REPORT OF REGISTERED
MANAGEMENT INVESTMENT COMPANIES
Investment Company Act file number 811-21991
Fidelity Rutland Square Trust II
(Exact name of registrant as specified in charter)
245 Summer St., Boston, MA 02210
(Address of principal executive offices) (Zip code)
Christina H. Lee, Secretary
245 Summer St.
Boston, Massachusetts 02210
(Name and address of agent for service)
Registrant's telephone number, including area code:
617-563-7000
Date of fiscal year end: | February 28 |
Date of reporting period: | August 31, 2021 |
Item 1.
Reports to Stockholders
Strategic Advisers® Core Income Fund
Offered exclusively to certain managed account clients of Strategic Advisers LLC or its affiliates - not available for sale to the general public
Semi-Annual Report
August 31, 2021

Contents
To view a fund's proxy voting record for the 12-month period ended June 30, visit http://www.fidelity.com/proxyvotingresults or visit the Securities and Exchange Commission's (SEC) web site at http://www.sec.gov.
You may also call 1-800-544-3455 to request a free copy of the proxy voting guidelines.
Standard & Poor's, S&P and S&P 500 are registered service marks of The McGraw-Hill Companies, Inc. and have been licensed for use by Fidelity Distributors Corporation.
Other third-party marks appearing herein are the property of their respective owners.
All other marks appearing herein are registered or unregistered trademarks or service marks of FMR LLC or an affiliated company. © 2021 FMR LLC. All rights reserved.
This report and the financial statements contained herein are submitted for the general information of the shareholders of the Fund. This report is not authorized for distribution to prospective investors in the Fund unless preceded or accompanied by an effective prospectus.
A fund files its complete schedule of portfolio holdings with the SEC for the first and third quarters of each fiscal year on Form N-PORT. Forms N-PORT are available on the SEC’s web site at http://www.sec.gov. A fund's Forms N-PORT may be reviewed and copied at the SEC’s Public Reference Room in Washington, DC. Information regarding the operation of the SEC's Public Reference Room may be obtained by calling 1-800-SEC-0330.
For a complete list of a fund's portfolio holdings, view the most recent holdings listing, semiannual report, or annual report on Fidelity's web site at http://www.fidelity.com, http://www.institutional.fidelity.com, or http://www.401k.com, as applicable.
NOT FDIC INSURED •MAY LOSE VALUE •NO BANK GUARANTEE
Neither the Fund nor Fidelity Distributors Corporation is a bank.
Note to Shareholders:
Early in 2020, the outbreak and spread of COVID-19 emerged as a public health emergency that had a major influence on financial markets, primarily based on its impact on the global economy and corporate earnings. On March 11, 2020, the World Health Organization declared the COVID-19 outbreak a pandemic, citing sustained risk of further global spread. The pandemic prompted a number of measures to limit the spread of COVID-19, including travel and border restrictions, quarantines, and restrictions on large gatherings. In turn, these resulted in lower consumer activity, diminished demand for a wide range of products and services, disruption in manufacturing and supply chains, and – given the wide variability in outcomes regarding the outbreak – significant market uncertainty and volatility. To help stem the turmoil, the U.S. government took unprecedented action – in concert with the U.S. Federal Reserve and central banks around the world – to help support consumers, businesses, and the broader economy, and to limit disruption to the financial system.
In general, the overall impact of the pandemic lessened in 2021, amid a resilient economy and widespread distribution of three COVID-19 vaccines granted emergency use authorization from the U.S. Food and Drug Administration (FDA) early in the year. Still, the situation remains dynamic, and the extent and duration of its influence on financial markets and the economy is highly uncertain, due in part to a recent spike in cases based on highly contagious variants of the coronavirus.
Extreme events such as the COVID-19 crisis are exogenous shocks that can have significant adverse effects on mutual funds and their investments. Although multiple asset classes may be affected by market disruption, the duration and impact may not be the same for all types of assets. Fidelity is committed to helping you stay informed amid news about COVID-19 and during increased market volatility, and we continue to take extra steps to be responsive to customer needs. We encourage you to visit us online, where we offer ongoing updates, commentary, and analysis on the markets and our funds.
Investment Summary (Unaudited)
The information in the following tables is based on the direct investments of the Fund.Top Ten Holdings as of August 31, 2021
| (by issuer, excluding cash equivalents) | % of fund's net assets |
| PIMCO Total Return Fund Institutional Class | 13.9 |
| Fidelity SAI Total Bond Fund | 13.8 |
| U.S. Treasury Obligations | 7.8 |
| Western Asset Core Plus Bond Fund Class I | 7.6 |
| Western Asset Core Bond Fund Class I | 5.3 |
| Uniform Mortgage Backed Securities | 4.0 |
| DoubleLine Total Return Bond Fund Class N | 3.2 |
| Voya Intermediate Bond Fund Class I | 3.0 |
| PIMCO Mortgage Opportunities Fund Institutional Class | 2.7 |
| PIMCO Income Fund Institutional Class | 2.4 |
Asset Allocation (% of fund's net assets)
| As of August 31, 2021 | ||
| Corporate Bonds | 10.8% | |
| U.S. Government and U.S. Government Agency Obligations | 17.6% | |
| Asset-Backed Securities | 2.2% | |
| CMOs and Other Mortgage Related Securities | 2.2% | |
| Municipal Securities | 0.2% | |
| High Yield Fixed-Income Funds | 1.3% | |
| Intermediate-Term Bond Funds | 60.2% | |
| Long Government Bond Funds | 2.9% | |
| Sector Funds | 0.2% | |
| Other Investments | 0.5% | |
| Intermediate Government Funds | 2.0% | |
| Short-Term Investments and Net Other Assets (Liabilities)* | (0.1)% | |

* Short-Term Investments and Net Other Assets (Liabilities) are not included in the pie chart
Asset allocations of funds in the pie chart reflect the categorizations of assets as defined by Morningstar as of the reporting date.
Percentages in the above tables are adjusted for the effect of TBA Sale Commitments.
Schedule of Investments August 31, 2021 (Unaudited)
Showing Percentage of Net Assets
| Nonconvertible Bonds - 10.8% | |||
| Principal Amount(a) | Value | ||
| COMMUNICATION SERVICES - 1.1% | |||
| Diversified Telecommunication Services - 0.4% | |||
| Altice France SA: | |||
| 5.125% 1/15/29 (b) | $300,000 | $302,190 | |
| 5.125% 7/15/29 (b) | 275,000 | 278,031 | |
| 7.375% 5/1/26 (b) | 224,000 | 232,505 | |
| 8.125% 2/1/27 (b) | 135,000 | 146,644 | |
| AT&T, Inc.: | |||
| 1.7% 3/25/26 | 700,000 | 709,206 | |
| 2.55% 12/1/33 (b) | 7,873,000 | 7,913,032 | |
| 3.5% 6/1/41 | 4,880,000 | 5,142,015 | |
| 3.5% 9/15/53 (b) | 423,000 | 434,508 | |
| 3.55% 9/15/55 (b) | 1,590,000 | 1,626,965 | |
| 3.65% 9/15/59 (b) | 8,915,000 | 9,171,242 | |
| 3.8% 12/1/57 (b) | 29,933,000 | 31,836,491 | |
| 4.3% 2/15/30 | 3,709,000 | 4,315,116 | |
| 4.5% 5/15/35 | 1,980,000 | 2,347,838 | |
| 4.5% 3/9/48 | 6,650,000 | 7,875,813 | |
| 4.75% 5/15/46 | 49,080,000 | 59,968,039 | |
| 4.9% 6/15/42 | 7,000,000 | 8,752,999 | |
| 5.15% 11/15/46 | 10,160,000 | 13,064,731 | |
| 6.2% 3/15/40 | 2,433,000 | 3,320,709 | |
| 6.3% 1/15/38 | 2,523,000 | 3,588,512 | |
| C&W Senior Financing Designated Activity Co.: | |||
| 6.875% 9/15/27 (b) | 305,000 | 323,300 | |
| 7.5% 10/15/26 (b) | 710,000 | 738,400 | |
| Cablevision Lightpath LLC 3.875% 9/15/27 (b) | 10,000 | 9,888 | |
| Cogent Communications Group, Inc. 3.5% 5/1/26 (b) | 165,000 | 168,828 | |
| Frontier Communications Holdings LLC: | |||
| 5% 5/1/28 (b) | 215,000 | 224,675 | |
| 5.875% 10/15/27 (b) | 95,000 | 101,553 | |
| Level 3 Financing, Inc.: | |||
| 3.4% 3/1/27 (b) | 965,000 | 1,016,936 | |
| 3.625% 1/15/29 (b) | 135,000 | 130,950 | |
| 3.875% 11/15/29 (b) | 2,500,000 | 2,684,375 | |
| 4.25% 7/1/28 (b) | 1,520,000 | 1,538,179 | |
| 5.375% 5/1/25 | 400,000 | 409,200 | |
| Lumen Technologies, Inc.: | |||
| 4.5% 1/15/29 (b) | 235,000 | 229,713 | |
| 5.125% 12/15/26 (b) | 185,000 | 191,290 | |
| 5.625% 4/1/25 | 175,000 | 189,387 | |
| 6.875% 1/15/28 | 15,000 | 16,859 | |
| 7.6% 9/15/39 | 1,464,000 | 1,625,040 | |
| 7.65% 3/15/42 | 1,000,000 | 1,114,595 | |
| Qwest Corp. 7.25% 9/15/25 | 203,000 | 240,352 | |
| Sable International Finance Ltd. 5.75% 9/7/27 (b) | 585,000 | 612,788 | |
| Sprint Capital Corp.: | |||
| 6.875% 11/15/28 | 1,695,000 | 2,209,399 | |
| 8.75% 3/15/32 | 555,000 | 849,938 | |
| Sprint Spectrum Co. LLC: | |||
| 4.738% 9/20/29 (b) | 1,284,375 | 1,372,290 | |
| 5.152% 9/20/29 (b) | 9,350,000 | 10,767,928 | |
| Telecom Italia SpA 5.303% 5/30/24 (b) | 370,000 | 401,709 | |
| Telenet Finance Luxembourg Notes SARL 5.5% 3/1/28 (b) | 400,000 | 420,600 | |
| Verizon Communications, Inc.: | |||
| 2.1% 3/22/28 | 1,235,000 | 1,267,744 | |
| 2.65% 11/20/40 | 1,265,000 | 1,227,350 | |
| 2.987% 10/30/56 | 1,660,000 | 1,601,422 | |
| 3.4% 3/22/41 | 5,350,000 | 5,731,934 | |
| 4.016% 12/3/29 | 3,871,000 | 4,452,769 | |
| 4.272% 1/15/36 | 4,090,000 | 4,889,829 | |
| 4.5% 8/10/33 | 945,000 | 1,143,639 | |
| 4.522% 9/15/48 | 2,711,000 | 3,405,370 | |
| 5.012% 4/15/49 | 156,000 | 208,308 | |
| Virgin Media Finance PLC 5% 7/15/30 (b) | 270,000 | 279,572 | |
| 212,822,695 | |||
| Entertainment - 0.0% | |||
| Netflix, Inc.: | |||
| 4.375% 11/15/26 | 165,000 | 186,656 | |
| 4.875% 4/15/28 | 145,000 | 169,469 | |
| 4.875% 6/15/30 (b) | 70,000 | 83,778 | |
| 5.375% 11/15/29 (b) | 120,000 | 147,580 | |
| 5.875% 11/15/28 | 635,000 | 787,400 | |
| 6.375% 5/15/29 | 55,000 | 70,469 | |
| The Walt Disney Co. 3.6% 1/13/51 | 3,415,000 | 3,940,261 | |
| 5,385,613 | |||
| Interactive Media & Services - 0.0% | |||
| Tencent Holdings Ltd. 3.84% 4/22/51 (b) | 2,435,000 | 2,654,199 | |
| Media - 0.5% | |||
| Altice Financing SA: | |||
| 5% 1/15/28 (b) | 200,000 | 199,840 | |
| 5.75% 8/15/29 (b) | 315,000 | 323,568 | |
| Altice France Holding SA: | |||
| 4% 2/15/28 (Reg. S) | EUR | 4,800,000 | 5,412,558 |
| 8% 5/15/27 (Reg. S) | EUR | 4,800,000 | 6,051,920 |
| CCO Holdings LLC/CCO Holdings Capital Corp.: | |||
| 4% 3/1/23 (b) | 2,450,000 | 2,464,823 | |
| 4.5% 8/15/30 (b) | 180,000 | 188,075 | |
| 4.5% 5/1/32 | 3,322,000 | 3,470,992 | |
| 4.5% 6/1/33 (b) | 2,110,000 | 2,186,488 | |
| 5.75% 2/15/26 (b) | 822,000 | 845,633 | |
| Charter Communications Operating LLC/Charter Communications Operating Capital Corp.: | |||
| 3.7% 4/1/51 | 1,780,000 | 1,791,778 | |
| 3.9% 6/1/52 | 10,598,000 | 10,940,744 | |
| 4.464% 7/23/22 | 11,002,000 | 11,320,055 | |
| 4.908% 7/23/25 | 7,565,000 | 8,559,763 | |
| 5.375% 4/1/38 | 450,000 | 556,161 | |
| 5.375% 5/1/47 | 37,824,000 | 46,544,512 | |
| 5.75% 4/1/48 | 14,203,000 | 18,267,867 | |
| 6.384% 10/23/35 | 2,985,000 | 3,989,989 | |
| 6.484% 10/23/45 | 1,645,000 | 2,293,967 | |
| Comcast Corp.: | |||
| 2.937% 11/1/56 (b) | 1,940,000 | 1,921,657 | |
| 2.987% 11/1/63 (b) | 1,667,000 | 1,640,431 | |
| 3.75% 4/1/40 | 470,000 | 539,667 | |
| 3.999% 11/1/49 | 10,000 | 11,887 | |
| 4.65% 7/15/42 | 2,891,000 | 3,671,064 | |
| COX Communications, Inc.: | |||
| 1.8% 10/1/30 (b) | 975,000 | 942,416 | |
| 2.6% 6/15/31 (b) | 1,750,000 | 1,791,540 | |
| 3.15% 8/15/24 (b) | 1,550,000 | 1,648,250 | |
| CSC Holdings LLC: | |||
| 4.125% 12/1/30 (b) | 215,000 | 215,269 | |
| 4.5% 11/15/31 (b) | 220,000 | 221,426 | |
| 4.625% 12/1/30 (b) | 170,000 | 167,236 | |
| 5.75% 1/15/30 (b) | 1,000,000 | 1,056,700 | |
| Diamond Sports Group LLC/Diamond Sports Finance Co. 5.375% 8/15/26 (b) | 2,275,000 | 1,509,690 | |
| Discovery Communications LLC: | |||
| 3.625% 5/15/30 | 4,338,000 | 4,752,265 | |
| 4% 9/15/55 | 1,620,000 | 1,734,327 | |
| 4.65% 5/15/50 | 11,727,000 | 13,913,906 | |
| 5.3% 5/15/49 | 7,295,000 | 9,311,036 | |
| DISH DBS Corp.: | |||
| 5.875% 11/15/24 | 200,000 | 215,000 | |
| 7.75% 7/1/26 | 550,000 | 629,998 | |
| Fox Corp.: | |||
| 5.476% 1/25/39 | 2,474,000 | 3,210,616 | |
| 5.576% 1/25/49 | 1,641,000 | 2,257,317 | |
| Gray Television, Inc. 4.75% 10/15/30 (b) | 100,000 | 98,830 | |
| LCPR Senior Secured Financing DAC 5.125% 7/15/29 (b) | 200,000 | 207,000 | |
| Radiate Holdco LLC/Radiate Financial Service Ltd. 4.5% 9/15/26 (b) | 345,000 | 359,224 | |
| SES Global Americas Holdings GP 5.3% 3/25/44 (b) | 2,000,000 | 2,336,448 | |
| Sinclair Television Group, Inc. 4.125% 12/1/30 (b) | 1,950,000 | 1,906,125 | |
| Sirius XM Radio, Inc.: | |||
| 3.875% 9/1/31 (b) | 80,000 | 79,656 | |
| 4.125% 7/1/30 (b) | 65,000 | 66,541 | |
| 5.5% 7/1/29 (b) | 1,000,000 | 1,095,000 | |
| Tegna, Inc. 4.75% 3/15/26 (b) | 225,000 | 238,781 | |
| Time Warner Cable LLC: | |||
| 5.5% 9/1/41 | 2,591,000 | 3,235,774 | |
| 5.875% 11/15/40 | 5,543,000 | 7,147,035 | |
| 6.55% 5/1/37 | 8,522,000 | 11,629,126 | |
| 7.3% 7/1/38 | 6,393,000 | 9,312,875 | |
| ViacomCBS, Inc.: | |||
| 3.875% 4/1/24 | 1,630,000 | 1,745,784 | |
| 4.2% 5/19/32 | 650,000 | 750,316 | |
| 4.6% 1/15/45 | 5,565,000 | 6,706,524 | |
| 5.85% 9/1/43 | 220,000 | 303,832 | |
| Virgin Media Secured Finance PLC: | |||
| 4.5% 8/15/30 (b) | 1,932,000 | 1,959,628 | |
| 5.5% 5/15/29 (b) | 175,000 | 187,469 | |
| Ziggo BV: | |||
| 4.875% 1/15/30 (b) | 115,000 | 118,450 | |
| 5.5% 1/15/27 (b) | 477,000 | 493,022 | |
| 226,747,871 | |||
| Wireless Telecommunication Services - 0.2% | |||
| Digicel International Finance Ltd. / Digicel International Holdings Ltd.: | |||
| 8% 12/31/26 (b) | 2,650,000 | 2,583,750 | |
| 8.75% 5/25/24 (b) | 300,000 | 311,531 | |
| 8.75% 5/25/24 (b) | 400,000 | 413,575 | |
| 13% 12/31/25 pay-in-kind (b)(c) | 2,070,000 | 2,057,063 | |
| Intelsat Jackson Holdings SA: | |||
| 5.5% 8/1/23 (d) | 2,500,000 | 1,300,000 | |
| 9.75% 7/15/25 (b)(d) | 5,500,000 | 2,970,000 | |
| Millicom International Cellular SA: | |||
| 4.5% 4/27/31 (b) | 200,000 | 209,038 | |
| 5.125% 1/15/28 (b) | 346,500 | 360,533 | |
| Rogers Communications, Inc. 3% 3/15/23 | 150,000 | 154,791 | |
| SoftBank Group Corp. 5.375% 7/30/22 (Reg. S) | 200,000 | 204,500 | |
| Sprint Corp. 7.875% 9/15/23 | 5,977,000 | 6,771,642 | |
| T-Mobile U.S.A., Inc.: | |||
| 2.05% 2/15/28 | 1,450,000 | 1,476,245 | |
| 2.25% 2/15/26 | 3,450,000 | 3,523,313 | |
| 2.625% 4/15/26 | 220,000 | 226,050 | |
| 2.625% 2/15/29 | 275,000 | 278,438 | |
| 3% 2/15/41 | 2,945,000 | 2,925,254 | |
| 3.3% 2/15/51 | 6,575,000 | 6,594,462 | |
| 3.75% 4/15/27 | 13,910,000 | 15,395,171 | |
| 3.875% 4/15/30 | 17,434,000 | 19,533,402 | |
| 4.375% 4/15/40 | 200,000 | 233,006 | |
| 4.5% 4/15/50 | 3,381,000 | 4,053,988 | |
| Vodafone Group PLC 4.25% 9/17/50 | 3,525,000 | 4,148,716 | |
| 75,724,468 | |||
| TOTAL COMMUNICATION SERVICES | 523,334,846 | ||
| CONSUMER DISCRETIONARY - 0.5% | |||
| Auto Components - 0.0% | |||
| Adient Global Holdings Ltd. 4.875% 8/15/26 (b) | 2,000,000 | 2,055,000 | |
| American Axle & Manufacturing, Inc. 6.25% 4/1/25 | 450,000 | 464,985 | |
| Dana, Inc. 5.625% 6/15/28 | 500,000 | 537,460 | |
| IHO Verwaltungs GmbH 3.75% 9/15/26 pay-in-kind(Reg. S) (c) | EUR | 2,500,000 | 3,010,310 |
| Patrick Industries, Inc. 4.75% 5/1/29 (b) | 110,000 | 112,475 | |
| 6,180,230 | |||
| Automobiles - 0.1% | |||
| Ford Motor Co.: | |||
| 4.75% 1/15/43 | 2,000,000 | 2,157,500 | |
| 5.291% 12/8/46 | 1,925,000 | 2,180,217 | |
| 9% 4/22/25 | 1,250,000 | 1,527,125 | |
| 9.625% 4/22/30 | 500,000 | 712,945 | |
| General Motors Co.: | |||
| 6.25% 10/2/43 | 8,095,000 | 11,082,132 | |
| 6.6% 4/1/36 | 575,000 | 786,383 | |
| 6.75% 4/1/46 | 1,850,000 | 2,676,629 | |
| General Motors Financial Co., Inc.: | |||
| 2.4% 4/10/28 | 1,895,000 | 1,932,041 | |
| 3.45% 4/10/22 | 4,650,000 | 4,712,186 | |
| 3.7% 5/9/23 | 11,800,000 | 12,333,768 | |
| 4% 1/15/25 | 2,855,000 | 3,104,702 | |
| 4.25% 5/15/23 | 1,875,000 | 1,987,358 | |
| 4.375% 9/25/21 | 7,321,000 | 7,339,754 | |
| 52,532,740 | |||
| Diversified Consumer Services - 0.1% | |||
| Adtalem Global Education, Inc. 5.5% 3/1/28 (b) | 1,225,000 | 1,254,094 | |
| California Institute of Technology 3.65% 9/1/19 | 535,000 | 630,279 | |
| ERAC U.S.A. Finance LLC 3.3% 12/1/26 (b) | 8,865,000 | 9,674,967 | |
| Ingersoll-Rand Global Holding Co. Ltd. 4.25% 6/15/23 | 425,000 | 452,764 | |
| Massachusetts Institute of Technology 2.989% 7/1/50 | 1,215,000 | 1,351,119 | |
| President and Fellows of Harvard College: | |||
| 3.15% 7/15/46 | 190,000 | 215,649 | |
| 3.3% 7/15/56 | 190,000 | 224,606 | |
| Service Corp. International 5.125% 6/1/29 | 270,000 | 294,422 | |
| Trustees of Boston University 4.061% 10/1/48 | 450,000 | 566,619 | |
| University of Pennsylvania Trustees: | |||
| 2.396% 10/1/50 | 495,000 | 486,168 | |
| 3.61% 2/15/2119 | 285,000 | 332,039 | |
| University of Southern California 3.841% 10/1/47 | 705,000 | 874,655 | |
| Yale University 2.402% 4/15/50 | 1,815,000 | 1,792,266 | |
| 18,149,647 | |||
| Hotels, Restaurants & Leisure - 0.1% | |||
| 1011778 BC Unlimited Liability Co./New Red Finance, Inc.: | |||
| 4% 10/15/30 (b) | 5,000,000 | 4,972,400 | |
| 4.375% 1/15/28 (b) | 280,000 | 284,200 | |
| 5.75% 4/15/25 (b) | 90,000 | 94,838 | |
| Aramark Services, Inc. 5% 2/1/28 (b) | 1,990,000 | 2,069,237 | |
| Brinker International, Inc. 3.875% 5/15/23 | 1,066,000 | 1,098,513 | |
| Caesars Entertainment, Inc. 6.25% 7/1/25 (b) | 380,000 | 401,641 | |
| Carnival Corp.: | |||
| 4% 8/1/28 (b) | 225,000 | 226,125 | |
| 7.625% 3/1/26 (b) | 75,000 | 79,499 | |
| Hilton Domestic Operating Co., Inc.: | |||
| 3.625% 2/15/32 (b) | 325,000 | 322,563 | |
| 3.75% 5/1/29 (b) | 255,000 | 260,100 | |
| 4% 5/1/31 (b) | 970,000 | 1,000,313 | |
| 5.375% 5/1/25 (b) | 400,000 | 419,644 | |
| International Game Technology PLC 6.5% 2/15/25 (b) | 800,000 | 892,000 | |
| Marriott International, Inc.: | |||
| 3.125% 6/15/26 | 1,090,000 | 1,164,456 | |
| 3.6% 4/15/24 | 860,000 | 917,510 | |
| McDonald's Corp. 4.7% 12/9/35 | 1,685,000 | 2,099,589 | |
| MGM Resorts International: | |||
| 4.625% 9/1/26 | 500,000 | 527,650 | |
| 6.75% 5/1/25 | 100,000 | 106,000 | |
| NCL Finance Ltd. 6.125% 3/15/28 (b) | 40,000 | 40,200 | |
| Royal Caribbean Cruises Ltd.: | |||
| 5.5% 8/31/26 (b) | 280,000 | 283,850 | |
| 9.125% 6/15/23 (b) | 55,000 | 59,950 | |
| 11.5% 6/1/25 (b) | 95,000 | 109,013 | |
| Scientific Games Corp. 8.625% 7/1/25 (b) | 500,000 | 539,794 | |
| Starbucks Corp. 1.3% 5/7/22 | 3,742,000 | 3,766,453 | |
| Yum! Brands, Inc. 7.75% 4/1/25 (b) | 330,000 | 355,539 | |
| 22,091,077 | |||
| Household Durables - 0.2% | |||
| Brookfield Residential Properties, Inc./Brookfield Residential U.S. Corp. 4.875% 2/15/30 (b) | 500,000 | 504,830 | |
| Century Communities, Inc.: | |||
| 3.875% 8/15/29 (b) | 135,000 | 137,052 | |
| 6.75% 6/1/27 | 275,000 | 293,829 | |
| Lennar Corp.: | |||
| 4.75% 11/29/27 | 9,350,000 | 10,880,689 | |
| 5% 6/15/27 | 12,100,000 | 14,080,891 | |
| 5.25% 6/1/26 | 2,920,000 | 3,372,600 | |
| Newell Brands, Inc. 5.875% 4/1/36 | 30,000 | 37,575 | |
| Taylor Morrison Communities, Inc./Monarch Communities, Inc. 5.875% 4/15/23 (b) | 298,000 | 313,972 | |
| Tempur Sealy International, Inc. 4% 4/15/29 (b) | 1,675,000 | 1,716,875 | |
| Toll Brothers Finance Corp.: | |||
| 4.35% 2/15/28 | 29,675,000 | 32,865,063 | |
| 4.375% 4/15/23 | 5,000,000 | 5,212,500 | |
| 4.875% 11/15/25 | 35,000 | 39,419 | |
| 4.875% 3/15/27 | 7,917,000 | 8,975,899 | |
| 5.875% 2/15/22 | 12,000,000 | 12,105,000 | |
| 90,536,194 | |||
| Internet & Direct Marketing Retail - 0.0% | |||
| Match Group Holdings II LLC 4.125% 8/1/30 (b) | 70,000 | 73,325 | |
| Leisure Products - 0.0% | |||
| Hasbro, Inc.: | |||
| 2.6% 11/19/22 | 2,485,000 | 2,548,228 | |
| 3% 11/19/24 | 5,655,000 | 6,006,533 | |
| Mattel, Inc. 5.45% 11/1/41 | 20,000 | 24,050 | |
| 8,578,811 | |||
| Specialty Retail - 0.0% | |||
| Adient U.S. LLC 9% 4/15/25 (b) | 1,000,000 | 1,090,221 | |
| AutoNation, Inc. 4.75% 6/1/30 | 953,000 | 1,124,039 | |
| AutoZone, Inc.: | |||
| 1.65% 1/15/31 | 255,000 | 245,212 | |
| 3.75% 4/18/29 | 1,200,000 | 1,352,565 | |
| 4% 4/15/30 | 6,924,000 | 7,930,762 | |
| Bath & Body Works, Inc. 6.625% 10/1/30 (b) | 345,000 | 397,613 | |
| Michaels Companies, Inc. 5.25% 5/1/28 (b) | 110,000 | 112,888 | |
| O'Reilly Automotive, Inc. 1.75% 3/15/31 | 420,000 | 407,415 | |
| Sally Holdings LLC 8.75% 4/30/25 (b) | 3,067,000 | 3,335,363 | |
| The Home Depot, Inc.: | |||
| 4.875% 2/15/44 | 1,075,000 | 1,450,965 | |
| 5.875% 12/16/36 | 300,000 | 430,215 | |
| 17,877,258 | |||
| Textiles, Apparel & Luxury Goods - 0.0% | |||
| Crocs, Inc. 4.125% 8/15/31 (b) | 120,000 | 120,600 | |
| The William Carter Co. 5.625% 3/15/27 (b) | 875,000 | 914,375 | |
| Wolverine World Wide, Inc. 4% 8/15/29 (b) | 170,000 | 172,317 | |
| 1,207,292 | |||
| TOTAL CONSUMER DISCRETIONARY | 217,226,574 | ||
| CONSUMER STAPLES - 0.7% | |||
| Beverages - 0.4% | |||
| Anheuser-Busch Companies LLC / Anheuser-Busch InBev Worldwide, Inc.: | |||
| 4.7% 2/1/36 | 2,765,000 | 3,408,672 | |
| 4.9% 2/1/46 | 13,210,000 | 16,855,158 | |
| Anheuser-Busch InBev Finance, Inc.: | |||
| 4.7% 2/1/36 | 9,871,000 | 12,075,631 | |
| 4.9% 2/1/46 | 12,306,000 | 15,541,302 | |
| Anheuser-Busch InBev Worldwide, Inc.: | |||
| 3.5% 6/1/30 | 8,175,000 | 9,105,404 | |
| 4.35% 6/1/40 | 4,618,000 | 5,538,574 | |
| 4.375% 4/15/38 | 2,500,000 | 2,983,395 | |
| 4.5% 6/1/50 | 8,175,000 | 10,163,149 | |
| 4.6% 6/1/60 | 5,007,000 | 6,240,963 | |
| 4.75% 1/23/29 | 1,190,000 | 1,414,797 | |
| 4.75% 4/15/58 | 6,987,000 | 8,882,995 | |
| 5.45% 1/23/39 | 5,390,000 | 7,120,481 | |
| 5.55% 1/23/49 | 15,352,000 | 21,340,881 | |
| 5.8% 1/23/59 (Reg. S) | 15,062,000 | 22,304,942 | |
| Bacardi Ltd.: | |||
| 4.45% 5/15/25 (b) | 2,060,000 | 2,281,969 | |
| 4.7% 5/15/28 (b) | 563,000 | 657,522 | |
| 5.3% 5/15/48 (b) | 1,050,000 | 1,399,892 | |
| Constellation Brands, Inc.: | |||
| 2.25% 8/1/31 | 1,060,000 | 1,060,917 | |
| 3.7% 12/6/26 | 1,200,000 | 1,332,481 | |
| 4.4% 11/15/25 | 480,000 | 540,624 | |
| 4.75% 11/15/24 | 5,595,000 | 6,262,082 | |
| Diageo Capital PLC 2.125% 4/29/32 | 390,000 | 394,276 | |
| PepsiCo, Inc.: | |||
| 2.625% 3/19/27 | 839,000 | 903,953 | |
| 2.75% 3/5/22 | 900,000 | 911,800 | |
| 3.1% 7/17/22 | 260,000 | 265,364 | |
| Primo Water Holdings, Inc. 4.375% 4/30/29 (b) | 220,000 | 222,092 | |
| 159,209,316 | |||
| Food & Staples Retailing - 0.0% | |||
| Albertsons Companies LLC/Safeway, Inc./New Albertson's, Inc./Albertson's LLC: | |||
| 3.5% 3/15/29 (b) | 80,000 | 80,800 | |
| 4.875% 2/15/30 (b) | 300,000 | 327,375 | |
| Alimentation Couche-Tard, Inc. 2.95% 1/25/30 (b) | 1,800,000 | 1,888,994 | |
| Bellis Finco PLC 4% 2/16/27 (b) | GBP | 9,000,000 | 12,281,788 |
| C&S Group Enterprises LLC 5% 12/15/28 (b) | 2,000,000 | 1,980,000 | |
| Co-Operative Group Ltd. 5.125% 5/17/24 (Reg. S) | GBP | 725,000 | 1,060,322 |
| Kroger Co. 2.65% 10/15/26 | 430,000 | 458,526 | |
| U.S. Foods, Inc. 6.25% 4/15/25 (b) | 185,000 | 194,944 | |
| Walgreens Boots Alliance, Inc. 3.3% 11/18/21 | 2,632,000 | 2,635,568 | |
| 20,908,317 | |||
| Food Products - 0.2% | |||
| Darling Ingredients, Inc. 5.25% 4/15/27 (b) | 300,000 | 313,329 | |
| Hormel Foods Corp. 0.65% 6/3/24 | 895,000 | 896,564 | |
| JBS U.S.A. Lux SA / JBS Food Co.: | |||
| 5.5% 1/15/30 (b) | 15,375,000 | 17,351,456 | |
| 6.5% 4/15/29 (b) | 19,275,000 | 21,828,938 | |
| Kraft Heinz Foods Co.: | |||
| 3.75% 4/1/30 | 653,000 | 721,715 | |
| 3.875% 5/15/27 | 235,000 | 259,018 | |
| 4.25% 3/1/31 | 7,220,000 | 8,336,347 | |
| 4.375% 6/1/46 | 8,790,000 | 10,191,678 | |
| 4.875% 10/1/49 | 250,000 | 310,525 | |
| 5% 7/15/35 | 920,000 | 1,140,756 | |
| 5.2% 7/15/45 | 4,602,000 | 5,905,440 | |
| 7.125% 8/1/39 (b) | 9,093,000 | 13,802,275 | |
| Lamb Weston Holdings, Inc. 4.875% 5/15/28 (b) | 345,000 | 383,675 | |
| Pilgrim's Pride Corp.: | |||
| 3.5% 3/1/32 (b)(e) | 3,000,000 | 3,064,050 | |
| 4.25% 4/15/31 (b) | 2,825,000 | 3,042,066 | |
| 5.875% 9/30/27 (b) | 500,000 | 533,635 | |
| Post Holdings, Inc.: | |||
| 4.625% 4/15/30 (b) | 2,880,000 | 2,940,674 | |
| 5.5% 12/15/29 (b) | 270,000 | 289,238 | |
| TreeHouse Foods, Inc. 4% 9/1/28 | 505,000 | 486,744 | |
| Tyson Foods, Inc. 4% 3/1/26 | 2,520,000 | 2,811,525 | |
| 94,609,648 | |||
| Household Products - 0.0% | |||
| Central Garden & Pet Co. 4.125% 4/30/31 (b) | 1,325,000 | 1,344,875 | |
| Diamond BC BV 5.625% 8/15/25 (Reg. S) | EUR | 500,000 | 598,392 |
| Spectrum Brands Holdings, Inc. 3.875% 3/15/31 (b) | 2,500,000 | 2,468,125 | |
| 4,411,392 | |||
| Tobacco - 0.1% | |||
| Altria Group, Inc.: | |||
| 3.4% 2/4/41 | 5,850,000 | 5,623,525 | |
| 4.25% 8/9/42 | 365,000 | 387,026 | |
| BAT Capital Corp.: | |||
| 3.215% 9/6/26 | 740,000 | 789,950 | |
| 3.557% 8/15/27 | 2,140,000 | 2,315,825 | |
| 4.39% 8/15/37 | 1,000,000 | 1,087,258 | |
| 4.54% 8/15/47 | 11,635,000 | 12,470,275 | |
| 4.7% 4/2/27 | 325,000 | 369,199 | |
| BAT International Finance PLC 3.95% 6/15/25 (b) | 6,600,000 | 7,215,990 | |
| Imperial Tobacco Finance PLC: | |||
| 3.125% 7/26/24 (b) | 4,250,000 | 4,481,162 | |
| 4.25% 7/21/25 (b) | 1,500,000 | 1,647,044 | |
| Philip Morris International, Inc.: | |||
| 1.125% 5/1/23 | 955,000 | 966,810 | |
| 3.875% 8/21/42 | 530,000 | 585,688 | |
| Reynolds American, Inc. 5.7% 8/15/35 | 635,000 | 776,328 | |
| 38,716,080 | |||
| TOTAL CONSUMER STAPLES | 317,854,753 | ||
| ENERGY - 1.2% | |||
| Energy Equipment & Services - 0.0% | |||
| Baker Hughes Co. 4.08% 12/15/47 | 145,000 | 166,347 | |
| Halliburton Co.: | |||
| 4.75% 8/1/43 | 245,000 | 279,872 | |
| 6.7% 9/15/38 | 170,000 | 234,169 | |
| Precision Drilling Corp. 7.125% 1/15/26 (b) | 115,000 | 117,588 | |
| Transocean Phoenix 2 Ltd. 7.75% 10/15/24 (b) | 134,750 | 136,771 | |
| Transocean Poseidon Ltd. 6.875% 2/1/27 (b) | 120,000 | 116,100 | |
| Transocean Proteus Ltd. 6.25% 12/1/24 (b) | 2,200,000 | 2,167,000 | |
| Transocean, Inc. 11.5% 1/30/27 (b) | 140,000 | 141,033 | |
| U.S.A. Compression Partners LP 6.875% 9/1/27 | 2,575,000 | 2,696,952 | |
| 6,055,832 | |||
| Oil, Gas & Consumable Fuels - 1.2% | |||
| Aethon United BR LP / Aethon United Finance Corp. 8.25% 2/15/26 (b) | 125,000 | 135,625 | |
| Aker BP ASA 2.875% 1/15/26 (b) | 7,120,000 | 7,512,514 | |
| Antero Resources Corp. 8.375% 7/15/26 (b) | 1,104,000 | 1,250,280 | |
| Apache Corp. 5.25% 2/1/42 | 210,000 | 232,050 | |
| Cenovus Energy, Inc.: | |||
| 5.25% 6/15/37 | 3,195,000 | 3,813,773 | |
| 5.4% 6/15/47 | 385,000 | 474,199 | |
| Cheniere Energy Partners LP 4% 3/1/31 (b) | 220,000 | 231,550 | |
| Chesapeake Energy Corp.: | |||
| 5.5% 2/1/26 (b) | 330,000 | 344,843 | |
| 5.875% 2/1/29 (b) | 105,000 | 112,088 | |
| Chevron Corp. 2.355% 12/5/22 | 840,000 | 858,210 | |
| Chevron U.S.A., Inc.: | |||
| 5.25% 11/15/43 | 295,000 | 406,017 | |
| 6% 3/1/41 | 360,000 | 532,002 | |
| CNOOC Finance (2013) Ltd. 2.875% 9/30/29 | 1,615,000 | 1,679,398 | |
| Columbia Pipeline Group, Inc. 4.5% 6/1/25 | 1,418,000 | 1,586,383 | |
| Comstock Resources, Inc. 6.75% 3/1/29 (b) | 130,000 | 136,435 | |
| ConocoPhillips Co.: | |||
| 2.4% 2/15/31 (b) | 410,000 | 422,023 | |
| 3.75% 10/1/27 (b) | 915,000 | 1,029,108 | |
| 4.3% 8/15/28 (b) | 2,915,000 | 3,378,336 | |
| 6.95% 4/15/29 | 425,000 | 575,138 | |
| Continental Resources, Inc. 5.75% 1/15/31 (b) | 770,000 | 938,438 | |
| Crestwood Midstream Partners LP/Crestwood Midstream Finance Corp. 5.75% 4/1/25 | 1,657,000 | 1,692,211 | |
| CrownRock LP/CrownRock Finance, Inc. 5% 5/1/29 (b) | 40,000 | 41,087 | |
| CVR Energy, Inc.: | |||
| 5.25% 2/15/25 (b) | 330,000 | 323,400 | |
| 5.75% 2/15/28 (b) | 40,000 | 39,494 | |
| DCP Midstream Operating LP: | |||
| 3.875% 3/15/23 | 17,626,000 | 18,110,715 | |
| 5.125% 5/15/29 | 355,000 | 394,050 | |
| 5.375% 7/15/25 | 345,000 | 379,931 | |
| 5.6% 4/1/44 | 3,773,000 | 4,320,085 | |
| 5.625% 7/15/27 | 260,000 | 295,445 | |
| 5.85% 5/21/43 (b)(c) | 7,892,000 | 7,300,100 | |
| Devon Energy Corp. 5.6% 7/15/41 | 175,000 | 218,806 | |
| Diamondback Energy, Inc.: | |||
| 3.125% 3/24/31 | 4,710,000 | 4,903,301 | |
| 3.25% 12/1/26 | 4,500,000 | 4,821,324 | |
| 3.5% 12/1/29 | 1,150,000 | 1,238,273 | |
| Ecopetrol SA: | |||
| 5.375% 6/26/26 | 1,340,000 | 1,472,995 | |
| 5.875% 9/18/23 | 2,218,000 | 2,385,681 | |
| EG Global Finance PLC: | |||
| 4.375% 2/7/25 (Reg. S) | EUR | 4,000,000 | 4,662,876 |
| 6.25% 10/30/25 (Reg. S) | EUR | 5,600,000 | 6,795,622 |
| 6.75% 2/7/25 (b) | 220,000 | 226,050 | |
| 8.5% 10/30/25 (b) | 380,000 | 398,050 | |
| Enable Midstream Partners LP 3.9% 5/15/24 (c) | 1,210,000 | 1,286,470 | |
| Enbridge, Inc.: | |||
| 4% 10/1/23 | 3,799,000 | 4,033,510 | |
| 4.25% 12/1/26 | 1,943,000 | 2,183,582 | |
| Endeavor Energy Resources LP/EER Finance, Inc.: | |||
| 5.5% 1/30/26 (b) | 20,000 | 20,704 | |
| 5.75% 1/30/28 (b) | 180,000 | 189,450 | |
| 6.625% 7/15/25 (b) | 45,000 | 47,720 | |
| Energean Israel Finance Ltd.: | |||
| 4.875% 3/30/26 (Reg. S) (b) | 96,000 | 98,266 | |
| 5.375% 3/30/28 (Reg. S) (b) | 1,315,000 | 1,341,997 | |
| Energy Transfer LP: | |||
| 3.75% 5/15/30 | 2,964,000 | 3,218,221 | |
| 3.9% 7/15/26 | 1,005,000 | 1,103,298 | |
| 4.2% 9/15/23 | 1,452,000 | 1,545,752 | |
| 4.25% 3/15/23 | 1,373,000 | 1,435,416 | |
| 4.5% 4/15/24 | 1,723,000 | 1,871,343 | |
| 4.75% 1/15/26 | 250,000 | 280,281 | |
| 4.95% 6/15/28 | 4,954,000 | 5,738,259 | |
| 5% 5/15/50 | 11,610,000 | 13,602,557 | |
| 5.15% 3/15/45 | 2,260,000 | 2,623,042 | |
| 5.25% 4/15/29 | 2,803,000 | 3,301,843 | |
| 5.3% 4/15/47 | 225,000 | 266,130 | |
| 5.35% 5/15/45 | 1,400,000 | 1,661,162 | |
| 5.4% 10/1/47 | 8,931,000 | 10,841,014 | |
| 5.8% 6/15/38 | 2,762,000 | 3,406,528 | |
| 6% 6/15/48 | 2,449,000 | 3,129,061 | |
| 6.25% 4/15/49 | 1,925,000 | 2,548,435 | |
| 6.625% 10/15/36 | 900,000 | 1,188,800 | |
| EnLink Midstream LLC 5.625% 1/15/28 (b) | 220,000 | 229,900 | |
| Enterprise Products Operating LP: | |||
| 3.125% 7/31/29 | 1,225,000 | 1,325,794 | |
| 3.2% 2/15/52 | 275,000 | 276,139 | |
| 3.7% 1/31/51 | 65,000 | 70,432 | |
| 4.85% 3/15/44 | 2,725,000 | 3,380,355 | |
| EOG Resources, Inc. 3.9% 4/1/35 | 205,000 | 236,059 | |
| EQM Midstream Partners LP: | |||
| 6.5% 7/1/27 (b) | 125,000 | 139,375 | |
| 6.5% 7/15/48 | 220,000 | 248,446 | |
| EQT Corp.: | |||
| 3.9% 10/1/27 | 180,000 | 194,324 | |
| 5% 1/15/29 | 70,000 | 79,612 | |
| Equinor ASA: | |||
| 3.7% 4/6/50 | 920,000 | 1,075,332 | |
| 3.95% 5/15/43 | 300,000 | 353,478 | |
| Exxon Mobil Corp.: | |||
| 2.397% 3/6/22 | 1,575,000 | 1,587,325 | |
| 3.452% 4/15/51 | 4,000,000 | 4,423,288 | |
| 4.114% 3/1/46 | 705,000 | 843,211 | |
| Galaxy Pipeline Assets BidCo Ltd. 2.16% 3/31/34 (b) | 565,000 | 560,763 | |
| Gulfstream Natural Gas System LLC 6.19% 11/1/25 (b) | 3,640,000 | 4,316,053 | |
| Hess Corp.: | |||
| 4.3% 4/1/27 | 1,117,000 | 1,241,011 | |
| 5.6% 2/15/41 | 2,846,000 | 3,551,317 | |
| 5.8% 4/1/47 | 4,517,000 | 5,874,808 | |
| 7.125% 3/15/33 | 1,335,000 | 1,802,015 | |
| 7.3% 8/15/31 | 1,849,000 | 2,514,517 | |
| 7.875% 10/1/29 | 5,583,000 | 7,658,773 | |
| Hess Midstream Partners LP: | |||
| 5.125% 6/15/28 (b) | 110,000 | 115,225 | |
| 5.625% 2/15/26 (b) | 669,000 | 694,670 | |
| Holly Energy Partners LP/Holly Energy Finance Corp. 5% 2/1/28 (b) | 375,000 | 382,613 | |
| KazMunaiGaz National Co.: | |||
| 3.5% 4/14/33 (b) | 1,420,000 | 1,488,160 | |
| 3.5% 4/14/33 (Reg. S) | 400,000 | 419,200 | |
| 5.75% 4/19/47 (Reg. S) | 200,000 | 249,500 | |
| Kinder Morgan Energy Partners LP: | |||
| 4.15% 3/1/22 | 885,000 | 901,625 | |
| 4.15% 2/1/24 | 425,000 | 455,922 | |
| 5.8% 3/15/35 | 1,200,000 | 1,540,827 | |
| Kinder Morgan, Inc. 3.25% 8/1/50 | 190,000 | 185,912 | |
| Lundin Energy Finance BV 3.1% 7/15/31 (b) | 1,295,000 | 1,313,951 | |
| Magellan Midstream Partners LP: | |||
| 3.25% 6/1/30 | 475,000 | 511,619 | |
| 3.95% 3/1/50 | 1,210,000 | 1,318,986 | |
| 4.2% 10/3/47 | 695,000 | 778,303 | |
| 4.25% 9/15/46 | 65,000 | 73,447 | |
| Marathon Petroleum Corp. 3.8% 4/1/28 | 5,590,000 | 6,169,187 | |
| MEG Energy Corp.: | |||
| 5.875% 2/1/29 (b) | 300,000 | 308,973 | |
| 7.125% 2/1/27 (b) | 220,000 | 231,497 | |
| MPLX LP: | |||
| 3 month U.S. LIBOR + 1.100% 1.2231% 9/9/22 (c)(f) | 3,115,000 | 3,114,922 | |
| 4.125% 3/1/27 | 505,000 | 566,670 | |
| 4.5% 7/15/23 | 160,000 | 169,952 | |
| 4.5% 4/15/38 | 900,000 | 1,029,318 | |
| 4.7% 4/15/48 | 1,450,000 | 1,694,669 | |
| 4.8% 2/15/29 | 3,385,000 | 3,962,679 | |
| 4.875% 12/1/24 | 2,489,000 | 2,769,475 | |
| 5.2% 3/1/47 | 3,275,000 | 4,030,224 | |
| 5.5% 2/15/49 | 4,516,000 | 5,831,541 | |
| Occidental Petroleum Corp.: | |||
| 3.5% 8/15/29 | 2,729,000 | 2,828,035 | |
| 4.1% 2/15/47 | 265,000 | 259,098 | |
| 4.2% 3/15/48 | 125,000 | 122,423 | |
| 4.3% 8/15/39 | 439,000 | 446,683 | |
| 4.4% 4/15/46 | 200,000 | 204,408 | |
| 4.4% 8/15/49 | 1,809,000 | 1,823,128 | |
| 5.55% 3/15/26 | 6,488,000 | 7,234,120 | |
| 6.2% 3/15/40 | 65,000 | 77,520 | |
| 6.45% 9/15/36 | 4,545,000 | 5,681,250 | |
| 6.6% 3/15/46 | 6,475,000 | 8,191,587 | |
| 7.5% 5/1/31 | 8,596,000 | 11,247,264 | |
| 7.875% 9/15/31 | 40,000 | 53,136 | |
| 8.875% 7/15/30 | 145,000 | 198,982 | |
| ONEOK Partners LP 6.65% 10/1/36 | 400,000 | 541,892 | |
| ONEOK, Inc.: | |||
| 3.1% 3/15/30 | 2,600,000 | 2,733,421 | |
| 4.45% 9/1/49 | 8,455,000 | 9,536,531 | |
| 4.95% 7/13/47 | 365,000 | 429,627 | |
| Ovintiv Exploration, Inc. 5.375% 1/1/26 | 310,000 | 350,480 | |
| Ovintiv, Inc.: | |||
| 5.15% 11/15/41 | 3,000,000 | 3,338,079 | |
| 8.125% 9/15/30 | 6,179,000 | 8,420,904 | |
| Parsley Energy LLC/Parsley Finance Corp. 5.625% 10/15/27 (b) | 1,920,000 | 2,063,424 | |
| PBF Holding Co. LLC/PBF Finance Corp.: | |||
| 6% 2/15/28 | 190,000 | 124,450 | |
| 9.25% 5/15/25 (b) | 475,000 | 458,375 | |
| Petrobras Global Finance BV: | |||
| 5.093% 1/15/30 | 1,080,000 | 1,176,930 | |
| 5.6% 1/3/31 | 3,234,000 | 3,618,523 | |
| 7.375% 1/17/27 | 1,160,000 | 1,420,420 | |
| Petroleos Mexicanos: | |||
| 3.75% 2/21/24 (Reg. S) | EUR | 2,300,000 | 2,786,673 |
| 4.75% 2/26/29 (Reg. S) | EUR | 1,100,000 | 1,286,892 |
| 6.5% 3/13/27 | 35,040,000 | 37,089,840 | |
| 6.5% 1/23/29 | 1,190,000 | 1,230,044 | |
| 6.75% 9/21/47 | 11,150,000 | 9,795,275 | |
| 6.84% 1/23/30 | 10,852,000 | 11,326,775 | |
| 7.69% 1/23/50 | 85,755,000 | 81,876,301 | |
| Petronas Capital Ltd.: | |||
| 2.48% 1/28/32 (b) | 200,000 | 203,428 | |
| 3.5% 4/21/30 (b) | 1,000,000 | 1,103,114 | |
| Phillips 66 Co. 2.15% 12/15/30 | 300,000 | 295,614 | |
| Phillips 66 Partners LP: | |||
| 3.75% 3/1/28 | 495,000 | 540,771 | |
| 4.9% 10/1/46 | 525,000 | 626,310 | |
| Pioneer Natural Resources Co.: | |||
| 0.75% 1/15/24 | 95,000 | 94,331 | |
| 1.9% 8/15/30 | 1,470,000 | 1,418,649 | |
| 2.15% 1/15/31 | 325,000 | 318,406 | |
| Plains All American Pipeline LP/PAA Finance Corp.: | |||
| 3.55% 12/15/29 | 2,689,000 | 2,848,236 | |
| 3.6% 11/1/24 | 1,877,000 | 2,000,836 | |
| 3.65% 6/1/22 | 10,550,000 | 10,714,511 | |
| 3.8% 9/15/30 | 260,000 | 280,038 | |
| 4.5% 12/15/26 | 2,100,000 | 2,359,103 | |
| 5.15% 6/1/42 | 4,285,000 | 4,825,645 | |
| PT Pertamina Persero 3.1% 8/27/30 (b) | 600,000 | 626,316 | |
| Qatar Petroleum: | |||
| 1.375% 9/12/26 (b) | 1,000,000 | 1,001,055 | |
| 3.125% 7/12/41 (b) | 1,145,000 | 1,177,919 | |
| Regency Energy Partners LP/Regency Energy Finance Corp. 5.875% 3/1/22 | 2,310,000 | 2,339,656 | |
| Rockies Express Pipeline LLC: | |||
| 4.8% 5/15/30 (b) | 1,331,000 | 1,376,500 | |
| 4.95% 7/15/29 (b) | 2,375,000 | 2,470,879 | |
| Sabine Pass Liquefaction LLC 4.5% 5/15/30 | 9,948,000 | 11,523,425 | |
| Santos Finance Ltd. 3.649% 4/29/31 (b) | 4,800,000 | 4,960,639 | |
| Saudi Arabian Oil Co.: | |||
| 1.625% 11/24/25 (Reg. S) | 200,000 | 202,000 | |
| 2.25% 11/24/30 (b) | 600,000 | 597,000 | |
| Schlumberger Investment SA 3.65% 12/1/23 | 210,000 | 223,387 | |
| Shell International Finance BV 3.25% 5/11/25 | 1,465,000 | 1,587,298 | |
| SM Energy Co. 6.625% 1/15/27 | 300,000 | 301,500 | |
| Spectra Energy Partners LP 4.75% 3/15/24 | 6,000,000 | 6,539,933 | |
| Suncor Energy, Inc.: | |||
| 3.75% 3/4/51 | 3,940,000 | 4,297,866 | |
| 6.8% 5/15/38 | 350,000 | 502,366 | |
| Sunoco LP/Sunoco Finance Corp.: | |||
| 4.5% 5/15/29 | 255,000 | 258,188 | |
| 5.5% 2/15/26 | 560,000 | 575,350 | |
| 5.875% 3/15/28 | 55,000 | 58,094 | |
| 6% 4/15/27 | 5,000 | 5,225 | |
| Tallgrass Energy Partners LP / Tallgrass Energy Finance Corp.: | |||
| 6% 12/31/30 (b) | 2,450,000 | 2,491,944 | |
| 6% 9/1/31 (b) | 225,000 | 225,281 | |
| Targa Resources Partners LP/Targa Resources Partners Finance Corp.: | |||
| 4.875% 2/1/31 | 290,000 | 315,462 | |
| 5.5% 3/1/30 | 55,000 | 60,638 | |
| 5.875% 4/15/26 | 400,000 | 418,500 | |
| The Williams Companies, Inc.: | |||
| 3.5% 11/15/30 | 10,592,000 | 11,624,868 | |
| 3.6% 3/15/22 | 660,000 | 667,750 | |
| 3.7% 1/15/23 | 2,512,000 | 2,602,841 | |
| 3.75% 6/15/27 | 1,635,000 | 1,816,218 | |
| 4.85% 3/1/48 | 100,000 | 122,859 | |
| 4.9% 1/15/45 | 470,000 | 573,390 | |
| 6.3% 4/15/40 | 800,000 | 1,097,295 | |
| Total Capital International SA: | |||
| 2.7% 1/25/23 | 1,375,000 | 1,421,937 | |
| 2.829% 1/10/30 | 800,000 | 859,837 | |
| Transcontinental Gas Pipe Line Co. LLC: | |||
| 3.25% 5/15/30 | 1,910,000 | 2,067,708 | |
| 4.6% 3/15/48 | 350,000 | 427,773 | |
| TransMontaigne Partners LP 6.125% 2/15/26 | 233,000 | 238,825 | |
| Valero Energy Corp. 4% 4/1/29 | 820,000 | 907,051 | |
| Venture Global Calcasieu Pass LLC: | |||
| 3.875% 8/15/29 (b) | 340,000 | 350,407 | |
| 4.125% 8/15/31 (b) | 335,000 | 351,331 | |
| Western Gas Partners LP: | |||
| 3.95% 6/1/25 | 1,126,000 | 1,179,485 | |
| 4.65% 7/1/26 | 2,085,000 | 2,247,630 | |
| 4.75% 8/15/28 | 1,465,000 | 1,611,940 | |
| 5.3% 2/1/30 | 335,000 | 375,404 | |
| 555,204,593 | |||
| TOTAL ENERGY | 561,260,425 | ||
| FINANCIALS - 4.0% | |||
| Banks - 2.0% | |||
| Banco Santander SA 3.49% 5/28/30 | 800,000 | 870,372 | |
| Bank of America Corp.: | |||
| 3 month U.S. LIBOR + 0.640% 2.015% 2/13/26 (c)(f) | 1,554,000 | 1,600,404 | |
| 1.658% 3/11/27 (c) | 8,135,000 | 8,224,339 | |
| 1.734% 7/22/27 (c) | 13,095,000 | 13,269,754 | |
| 2.087% 6/14/29 (c) | 5,615,000 | 5,695,721 | |
| 2.496% 2/13/31 (c) | 1,450,000 | 1,491,008 | |
| 2.651% 3/11/32 (c) | 16,000,000 | 16,585,519 | |
| 2.687% 4/22/32 (c) | 2,615,000 | 2,717,668 | |
| 3.093% 10/1/25 (c) | 746,000 | 794,411 | |
| 3.3% 1/11/23 | 3,572,000 | 3,719,764 | |
| 3.419% 12/20/28 (c) | 8,640,000 | 9,489,142 | |
| 3.5% 4/19/26 | 5,358,000 | 5,899,359 | |
| 3.95% 4/21/25 | 12,493,000 | 13,681,390 | |
| 3.97% 3/5/29 (c) | 10,565,000 | 11,920,172 | |
| 4% 1/22/25 | 43,905,000 | 47,985,009 | |
| 4.078% 4/23/40 (c) | 7,865,000 | 9,262,824 | |
| 4.1% 7/24/23 | 13,989,000 | 14,976,988 | |
| 4.2% 8/26/24 | 2,028,000 | 2,222,789 | |
| 4.25% 10/22/26 | 10,727,000 | 12,181,441 | |
| 4.271% 7/23/29 (c) | 3,660,000 | 4,208,135 | |
| 4.45% 3/3/26 | 2,065,000 | 2,329,149 | |
| Banque Federative du Credit Mutuel SA 3 month U.S. LIBOR + 0.730% 0.8643% 7/20/22 (b)(c)(f) | 8,041,000 | 8,086,808 | |
| Barclays PLC: | |||
| 2.645% 6/24/31 (c) | 2,015,000 | 2,053,295 | |
| 2.667% 3/10/32 (c) | 10,165,000 | 10,343,581 | |
| 2.852% 5/7/26 (c) | 10,143,000 | 10,735,085 | |
| 4.337% 1/10/28 | 250,000 | 281,784 | |
| 4.836% 5/9/28 | 6,667,000 | 7,557,005 | |
| 4.95% 1/10/47 | 1,435,000 | 1,882,544 | |
| 4.972% 5/16/29 (c) | 15,000,000 | 17,624,847 | |
| 5.088% 6/20/30 (c) | 13,438,000 | 15,688,165 | |
| 5.2% 5/12/26 | 1,701,000 | 1,954,075 | |
| BNP Paribas SA: | |||
| U.S. Secured Overnight Fin. Rate (SOFR) Indx + 1.000% 1.323% 1/13/27 (b)(c)(f) | 9,875,000 | 9,793,706 | |
| 2.219% 6/9/26 (b)(c) | 9,163,000 | 9,431,967 | |
| CIT Group, Inc.: | |||
| 3.929% 6/19/24 (c) | 1,375,000 | 1,442,031 | |
| 4.75% 2/16/24 | 2,480,000 | 2,675,300 | |
| 5% 8/1/23 | 7,000,000 | 7,542,500 | |
| 6.125% 3/9/28 | 4,840,000 | 5,936,647 | |
| Citigroup, Inc.: | |||
| 1.462% 6/9/27 (c) | 7,955,000 | 7,978,313 | |
| 2.561% 5/1/32 (c) | 1,695,000 | 1,743,383 | |
| 2.572% 6/3/31 (c) | 2,100,000 | 2,168,319 | |
| 2.666% 1/29/31 (c) | 12,890,000 | 13,392,729 | |
| 4.075% 4/23/29 (c) | 26,130,000 | 29,629,237 | |
| 4.3% 11/20/26 | 2,129,000 | 2,416,311 | |
| 4.4% 6/10/25 | 17,376,000 | 19,330,397 | |
| 4.412% 3/31/31 (c) | 13,726,000 | 16,081,505 | |
| 4.45% 9/29/27 | 4,630,000 | 5,302,440 | |
| 4.6% 3/9/26 | 3,500,000 | 3,987,104 | |
| 4.65% 7/30/45 | 700,000 | 911,608 | |
| 4.75% 5/18/46 | 10,000,000 | 12,883,449 | |
| 5.5% 9/13/25 | 8,267,000 | 9,606,673 | |
| Citizens Financial Group, Inc. 2.638% 9/30/32 | 9,574,000 | 9,733,899 | |
| Commonwealth Bank of Australia 3.61% 9/12/34 (b)(c) | 3,419,000 | 3,663,975 | |
| HAT Holdings I LLC/HAT Holdings II LLC 3.375% 6/15/26 (b) | 145,000 | 147,762 | |
| HSBC Holdings PLC: | |||
| 0.976% 5/24/25 (c) | 2,530,000 | 2,531,277 | |
| 1.589% 5/24/27 (c) | 860,000 | 863,113 | |
| 2.013% 9/22/28 (c) | 8,090,000 | 8,166,534 | |
| 2.206% 8/17/29 (c) | 3,790,000 | 3,821,988 | |
| 4.041% 3/13/28 (c) | 3,380,000 | 3,764,674 | |
| 4.25% 3/14/24 | 1,872,000 | 2,018,835 | |
| 4.292% 9/12/26 (c) | 3,000,000 | 3,332,252 | |
| 4.95% 3/31/30 | 1,855,000 | 2,240,295 | |
| ING Groep NV 1.726% 4/1/27 (c) | 5,935,000 | 6,024,286 | |
| Intesa Sanpaolo SpA: | |||
| 5.017% 6/26/24 (b) | 31,005,000 | 33,656,216 | |
| 5.71% 1/15/26 (b) | 7,646,000 | 8,598,354 | |
| Japan Bank International Cooperation 3.25% 7/20/23 | 400,000 | 421,932 | |
| JPMorgan Chase & Co.: | |||
| 1.578% 4/22/27 (c) | 1,090,000 | 1,100,218 | |
| 1.764% 11/19/31 (c) | 4,860,000 | 4,706,696 | |
| 2.005% 3/13/26 (c) | 7,285,000 | 7,512,809 | |
| 2.182% 6/1/28 (c) | 2,305,000 | 2,377,077 | |
| 2.522% 4/22/31 (c) | 1,525,000 | 1,577,955 | |
| 2.525% 11/19/41 (c) | 19,325,000 | 18,758,444 | |
| 2.58% 4/22/32 (c) | 4,950,000 | 5,107,731 | |
| 2.776% 4/25/23 (c) | 2,000,000 | 2,031,766 | |
| 2.956% 5/13/31 (c) | 5,386,000 | 5,703,624 | |
| 3.509% 1/23/29 (c) | 3,150,000 | 3,480,973 | |
| 3.875% 9/10/24 | 250,000 | 272,137 | |
| 3.882% 7/24/38 (c) | 4,990,000 | 5,801,387 | |
| 3.964% 11/15/48 (c) | 1,270,000 | 1,501,793 | |
| 4.005% 4/23/29 (c) | 2,290,000 | 2,598,447 | |
| 4.125% 12/15/26 | 4,475,000 | 5,080,691 | |
| Lloyds Banking Group PLC: | |||
| 1.627% 5/11/27 (c) | 2,000,000 | 2,007,192 | |
| 3.87% 7/9/25 (c) | 5,375,000 | 5,820,749 | |
| 4.375% 3/22/28 | 1,365,000 | 1,570,866 | |
| NatWest Markets PLC 2.375% 5/21/23 (b) | 10,828,000 | 11,193,384 | |
| Peoples United Bank 4% 7/15/24 | 40,000 | 42,907 | |
| PNC Financial Services Group, Inc. 3.9% 4/29/24 | 375,000 | 406,030 | |
| Rabobank Nederland 4.375% 8/4/25 | 7,713,000 | 8,621,707 | |
| Royal Bank of Scotland Group PLC: | |||
| 1.642% 6/14/27 (c) | 545,000 | 548,352 | |
| 3.073% 5/22/28 (c) | 5,799,000 | 6,187,994 | |
| 4.269% 3/22/25 (c) | 5,781,000 | 6,266,078 | |
| 4.8% 4/5/26 | 15,438,000 | 17,664,280 | |
| 5.125% 5/28/24 | 25,198,000 | 27,908,561 | |
| 6% 12/19/23 | 40,605,000 | 45,239,267 | |
| 6.1% 6/10/23 | 35,526,000 | 38,728,288 | |
| 6.125% 12/15/22 | 5,889,000 | 6,296,682 | |
| Santander UK Group Holdings PLC: | |||
| 1.089% 3/15/25 (c) | 6,685,000 | 6,704,603 | |
| 1.673% 6/14/27 (c) | 4,715,000 | 4,730,661 | |
| 4.796% 11/15/24 (c) | 2,850,000 | 3,097,136 | |
| Societe Generale: | |||
| 1.488% 12/14/26 (b)(c) | 9,875,000 | 9,822,252 | |
| 4.25% 4/14/25 (b) | 21,901,000 | 23,786,726 | |
| Sumitomo Mitsui Banking Corp. 3.95% 7/19/23 | 250,000 | 266,648 | |
| Synchrony Bank 3% 6/15/22 | 5,477,000 | 5,581,261 | |
| Truist Financial Corp. 2.7% 1/27/22 | 540,000 | 544,341 | |
| UniCredit SpA: | |||
| 3.127% 6/3/32 (b)(c) | 2,515,000 | 2,563,361 | |
| 6.572% 1/14/22 (b) | 7,600,000 | 7,761,081 | |
| Wells Fargo & Co.: | |||
| 2.164% 2/11/26 (c) | 5,410,000 | 5,615,607 | |
| 2.188% 4/30/26 (c) | 4,250,000 | 4,414,322 | |
| 2.406% 10/30/25 (c) | 5,834,000 | 6,096,342 | |
| 2.572% 2/11/31 (c) | 585,000 | 607,435 | |
| 2.879% 10/30/30 (c) | 12,290,000 | 13,068,791 | |
| 3% 2/19/25 | 4,715,000 | 5,033,437 | |
| 4.125% 8/15/23 | 280,000 | 299,505 | |
| 4.3% 7/22/27 | 21,880,000 | 25,078,329 | |
| 4.478% 4/4/31 (c) | 24,095,000 | 28,542,254 | |
| 4.65% 11/4/44 | 1,385,000 | 1,725,527 | |
| 5.013% 4/4/51 (c) | 2,285,000 | 3,181,748 | |
| Westpac Banking Corp. 4.11% 7/24/34 (c) | 4,937,000 | 5,451,366 | |
| 926,658,376 | |||
| Capital Markets - 1.1% | |||
| Affiliated Managers Group, Inc. 4.25% 2/15/24 | 1,847,000 | 2,006,094 | |
| Ares Capital Corp.: | |||
| 3.875% 1/15/26 | 13,816,000 | 14,864,596 | |
| 4.2% 6/10/24 | 12,032,000 | 12,939,177 | |
| Bank of New York Mellon Corp. 3.4% 5/15/24 | 750,000 | 805,091 | |
| Credit Suisse Group AG: | |||
| 1.305% 2/2/27 (b)(c) | 6,900,000 | 6,788,421 | |
| 2.193% 6/5/26 (b)(c) | 2,965,000 | 3,041,961 | |
| 2.593% 9/11/25 (b)(c) | 15,060,000 | 15,675,554 | |
| 3.091% 5/14/32 (b)(c) | 12,305,000 | 12,835,078 | |
| 3.75% 3/26/25 | 15,667,000 | 16,992,091 | |
| 4.194% 4/1/31 (b)(c) | 12,540,000 | 14,206,113 | |
| 4.55% 4/17/26 | 6,559,000 | 7,432,767 | |
| CyrusOne LP/CyrusOne Finance Corp.: | |||
| 2.15% 11/1/30 | 1,000,000 | 950,800 | |
| 2.9% 11/15/24 | 4,000,000 | 4,192,720 | |
| Deutsche Bank AG 4.5% 4/1/25 | 13,996,000 | 15,080,687 | |
| Deutsche Bank AG New York Branch: | |||
| 3.3% 11/16/22 | 10,180,000 | 10,515,943 | |
| 5% 2/14/22 | 14,609,000 | 14,904,629 | |
| Goldman Sachs Group, Inc.: | |||
| 1.431% 3/9/27 (c) | 15,505,000 | 15,563,608 | |
| 1.992% 1/27/32 (c) | 3,845,000 | 3,769,219 | |
| 2.383% 7/21/32 (c) | 10,590,000 | 10,706,186 | |
| 2.876% 10/31/22 (c) | 12,744,000 | 12,795,193 | |
| 3.814% 4/23/29 (c) | 7,695,000 | 8,619,248 | |
| 4.017% 10/31/38 (c) | 6,495,000 | 7,600,075 | |
| 4.223% 5/1/29 (c) | 3,475,000 | 3,978,533 | |
| 6.75% 10/1/37 | 50,999,000 | 74,306,372 | |
| Intercontinental Exchange, Inc. 3.75% 12/1/25 | 3,162,000 | 3,487,979 | |
| Jefferies Group, Inc. 2.75% 10/15/32 | 1,655,000 | 1,688,907 | |
| LPL Holdings, Inc. 4% 3/15/29 (b) | 445,000 | 454,479 | |
| Macquarie Group Ltd. 1.34% 1/12/27 (b)(c) | 5,861,000 | 5,842,219 | |
| Morgan Stanley: | |||
| 1.512% 7/20/27 (c) | 10,390,000 | 10,431,303 | |
| 1.593% 5/4/27 (c) | 5,800,000 | 5,854,538 | |
| 1.794% 2/13/32 (c) | 4,715,000 | 4,558,249 | |
| 2.699% 1/22/31 (c) | 21,825,000 | 22,852,501 | |
| 3.125% 7/27/26 | 37,616,000 | 40,818,192 | |
| 3.217% 4/22/42 (c) | 605,000 | 648,575 | |
| 3.622% 4/1/31 (c) | 13,084,000 | 14,654,955 | |
| 3.7% 10/23/24 | 21,259,000 | 23,155,915 | |
| 3.772% 1/24/29 (c) | 4,085,000 | 4,562,840 | |
| 3.875% 1/27/26 | 625,000 | 696,861 | |
| 4% 7/23/25 | 1,000,000 | 1,109,416 | |
| 4.35% 9/8/26 | 2,070,000 | 2,351,902 | |
| 4.431% 1/23/30 (c) | 2,525,000 | 2,943,464 | |
| 5% 11/24/25 | 40,891,000 | 47,057,336 | |
| MSCI, Inc. 3.25% 8/15/33 (b) | 90,000 | 92,813 | |
| Nomura Holdings, Inc.: | |||
| 2.608% 7/14/31 | 755,000 | 762,875 | |
| 2.648% 1/16/25 | 675,000 | 707,275 | |
| Raymond James Financial, Inc. 3.75% 4/1/51 | 1,500,000 | 1,697,318 | |
| State Street Corp.: | |||
| 2.2% 3/3/31 | 12,290,000 | 12,542,413 | |
| 2.825% 3/30/23 (c) | 887,000 | 900,194 | |
| 2.901% 3/30/26 (c) | 833,000 | 889,531 | |
| UBS AG London Branch 0.7% 8/9/24 (b) | 4,415,000 | 4,418,709 | |
| 505,750,915 | |||
| Consumer Finance - 0.5% | |||
| AerCap Ireland Capital Ltd./AerCap Global Aviation Trust: | |||
| 2.875% 8/14/24 | 7,954,000 | 8,295,557 | |
| 3.15% 2/15/24 | 2,065,000 | 2,159,397 | |
| 3.5% 5/26/22 | 393,000 | 400,512 | |
| 4.125% 7/3/23 | 5,132,000 | 5,419,359 | |
| 4.45% 4/3/26 | 4,282,000 | 4,696,587 | |
| 4.875% 1/16/24 | 11,491,000 | 12,471,787 | |
| 6.5% 7/15/25 | 4,320,000 | 5,040,429 | |
| Ally Financial, Inc.: | |||
| 1.45% 10/2/23 | 2,261,000 | 2,294,939 | |
| 3.05% 6/5/23 | 11,748,000 | 12,215,730 | |
| 3.875% 5/21/24 | 6,322,000 | 6,816,697 | |
| 5.125% 9/30/24 | 2,688,000 | 3,016,390 | |
| 5.75% 11/20/25 | 1,765,000 | 2,022,058 | |
| 5.8% 5/1/25 | 6,894,000 | 7,978,834 | |
| 8% 11/1/31 | 305,000 | 447,117 | |
| Capital One Financial Corp.: | |||
| 3.65% 5/11/27 | 15,820,000 | 17,656,880 | |
| 3.8% 1/31/28 | 7,795,000 | 8,748,083 | |
| Discover Financial Services: | |||
| 3.95% 11/6/24 | 8,102,000 | 8,819,121 | |
| 4.1% 2/9/27 | 645,000 | 725,567 | |
| 4.5% 1/30/26 | 6,463,000 | 7,296,330 | |
| Ford Motor Credit Co. LLC: | |||
| 2.9% 2/16/28 | 275,000 | 273,969 | |
| 3.339% 3/28/22 | 6,970,000 | 7,042,349 | |
| 4% 11/13/30 | 345,000 | 363,975 | |
| 4.063% 11/1/24 | 22,139,000 | 23,399,816 | |
| 4.125% 8/17/27 | 185,000 | 197,950 | |
| 4.271% 1/9/27 | 85,000 | 90,950 | |
| 4.687% 6/9/25 | 180,000 | 195,197 | |
| 5.113% 5/3/29 | 400,000 | 452,000 | |
| 5.125% 6/16/25 | 135,000 | 148,163 | |
| 5.584% 3/18/24 | 8,575,000 | 9,282,438 | |
| 5.596% 1/7/22 | 14,820,000 | 15,014,142 | |
| GE Capital International Funding Co.: | |||
| 3.373% 11/15/25 | 825,000 | 902,017 | |
| 4.418% 11/15/35 | 15,460,000 | 18,765,507 | |
| John Deere Capital Corp. 2.65% 6/24/24 | 615,000 | 651,818 | |
| OneMain Finance Corp.: | |||
| 4% 9/15/30 | 500,000 | 501,070 | |
| 5.375% 11/15/29 | 1,679,000 | 1,834,308 | |
| 6.875% 3/15/25 | 1,165,000 | 1,319,363 | |
| Synchrony Financial: | |||
| 2.85% 7/25/22 | 2,029,000 | 2,071,312 | |
| 3.95% 12/1/27 | 8,719,000 | 9,717,648 | |
| 4.25% 8/15/24 | 6,050,000 | 6,566,321 | |
| 4.375% 3/19/24 | 7,165,000 | 7,755,343 | |
| 5.15% 3/19/29 | 13,451,000 | 15,928,312 | |
| 238,995,342 | |||
| Diversified Financial Services - 0.2% | |||
| 1MDB Global Investments Ltd. 4.4% 3/9/23 | 1,000,000 | 1,007,500 | |
| Athene Global Funding 1.608% 6/29/26 (b) | 3,350,000 | 3,370,227 | |
| Brixmor Operating Partnership LP: | |||
| 2.5% 8/16/31 | 570,000 | 573,007 | |
| 4.05% 7/1/30 | 12,288,000 | 13,908,545 | |
| 4.125% 6/15/26 | 5,706,000 | 6,380,446 | |
| 4.125% 5/15/29 | 6,724,000 | 7,661,155 | |
| Equitable Holdings, Inc. 3.9% 4/20/23 | 827,000 | 870,766 | |
| Greystone Commercial Capital Trust 1 month U.S. LIBOR + 2.270% 2.3628% 5/31/25 (b)(c)(f)(g) | 7,700,000 | 7,700,000 | |
| HCRX Investments Holdco LP 4.5% 8/1/29 (b) | 1,555,000 | 1,575,040 | |
| Icahn Enterprises LP/Icahn Enterprises Finance Corp.: | |||
| 5.25% 5/15/27 | 140,000 | 145,425 | |
| 6.25% 5/15/26 | 914,000 | 963,128 | |
| 6.375% 12/15/25 | 205,000 | 211,150 | |
| Park Aerospace Holdings Ltd. 5.5% 2/15/24 (b) | 8,593,000 | 9,428,808 | |
| Pine Street Trust I 4.572% 2/15/29 (b) | 7,798,000 | 8,951,191 | |
| Pine Street Trust II 5.568% 2/15/49 (b) | 7,800,000 | 10,411,405 | |
| Power Finance Corp. Ltd. 6.15% 12/6/28 (b) | 3,050,000 | 3,620,541 | |
| Sasol Financing International PLC 4.5% 11/14/22 | 1,790,000 | 1,834,750 | |
| VMED O2 UK Financing I PLC 4.25% 1/31/31 (b) | 495,000 | 497,485 | |
| Voya Financial, Inc. 3.125% 7/15/24 | 3,436,000 | 3,652,044 | |
| 82,762,613 | |||
| Insurance - 0.2% | |||
| ACE INA Holdings, Inc.: | |||
| 2.7% 3/13/23 | 145,000 | 150,295 | |
| 3.15% 3/15/25 | 1,765,000 | 1,907,797 | |
| American International Group, Inc. 4.5% 7/16/44 | 2,785,000 | 3,451,233 | |
| Arch Capital Finance LLC 4.011% 12/15/26 | 1,920,000 | 2,176,624 | |
| Baylor Scott & White Holdings: | |||
| Series 2021, 2.839% 11/15/50 | 120,000 | 122,464 | |
| 1.777% 11/15/30 | 870,000 | 862,418 | |
| CNA Financial Corp.: | |||
| 3.9% 5/1/29 | 1,400,000 | 1,577,369 | |
| 3.95% 5/15/24 | 1,400,000 | 1,510,416 | |
| Everest Reinsurance Holdings, Inc. 3.5% 10/15/50 | 955,000 | 1,040,687 | |
| Fairfax Financial Holdings Ltd. 3.375% 3/3/31 (b) | 4,595,000 | 4,848,571 | |
| Farmers Exchange Capital III 5.454% 10/15/54 (b)(c) | 3,335,000 | 4,203,342 | |
| Five Corners Funding Trust II 2.85% 5/15/30 (b) | 11,420,000 | 12,141,681 | |
| Liberty Mutual Group, Inc. 4.569% 2/1/29 (b) | 9,380,000 | 11,021,725 | |
| Lincoln National Corp.: | |||
| 3.05% 1/15/30 | 130,000 | 140,287 | |
| 4.35% 3/1/48 | 165,000 | 201,285 | |
| 6.3% 10/9/37 | 110,000 | 156,743 | |
| Markel Corp.: | |||
| 3.45% 5/7/52 | 690,000 | 725,846 | |
| 4.15% 9/17/50 | 445,000 | 526,687 | |
| 4.3% 11/1/47 | 525,000 | 633,171 | |
| Marsh & McLennan Companies, Inc. 3.5% 6/3/24 | 1,140,000 | 1,221,638 | |
| Nationwide Mutual Insurance Co. 3 month U.S. LIBOR + 2.290% 2.4089% 12/15/24 (b)(c)(f) | 5,490,000 | 5,496,857 | |
| New York Life Insurance Co. 3.75% 5/15/50 (b) | 5,070,000 | 5,852,701 | |
| Pricoa Global Funding I 5.375% 5/15/45 (c) | 5,278,000 | 5,860,918 | |
| Protective Life Global Funding 1.9% 7/6/28 (b) | 2,595,000 | 2,639,226 | |
| Prudential Financial, Inc. 4.5% 11/16/21 | 1,118,000 | 1,127,313 | |
| Swiss Re Finance Luxembourg SA 5% 4/2/49 (b)(c) | 3,200,000 | 3,675,194 | |
| Teachers Insurance & Annuity Association of America: | |||
| 3.3% 5/15/50 (b) | 3,310,000 | 3,562,676 | |
| 4.375% 9/15/54 (b)(c) | 2,100,000 | 2,200,227 | |
| The Chubb Corp. 6% 5/11/37 | 130,000 | 190,834 | |
| Unum Group: | |||
| 4% 6/15/29 | 5,961,000 | 6,693,466 | |
| 5.75% 8/15/42 | 2,238,000 | 2,818,750 | |
| Willis Group North America, Inc. 2.95% 9/15/29 | 3,000,000 | 3,184,551 | |
| 91,922,992 | |||
| Thrifts & Mortgage Finance - 0.0% | |||
| Home Point Capital, Inc. 5% 2/1/26 (b) | 300,000 | 259,500 | |
| Nationstar Mortgage Holdings, Inc. 6% 1/15/27 (b) | 500,000 | 526,875 | |
| Nationwide Building Society: | |||
| 3.622% 4/26/23 (b)(c) | 3,265,000 | 3,332,576 | |
| 4.363% 8/1/24 (b)(c) | 1,250,000 | 1,333,541 | |
| PennyMac Financial Services, Inc. 4.25% 2/15/29 (b) | 1,200,000 | 1,155,000 | |
| Quicken Loans LLC 5.25% 1/15/28 (b) | 300,000 | 316,500 | |
| 6,923,992 | |||
| TOTAL FINANCIALS | 1,853,014,230 | ||
| HEALTH CARE - 0.9% | |||
| Biotechnology - 0.1% | |||
| AbbVie, Inc.: | |||
| 3.2% 11/21/29 | 1,500,000 | 1,639,531 | |
| 4.05% 11/21/39 | 18,245,000 | 21,437,254 | |
| 4.25% 11/21/49 | 510,000 | 618,675 | |
| 4.4% 11/6/42 | 3,405,000 | 4,142,185 | |
| 4.55% 3/15/35 | 400,000 | 486,728 | |
| 4.7% 5/14/45 | 4,450,000 | 5,614,427 | |
| 4.875% 11/14/48 | 585,000 | 766,017 | |
| Amgen, Inc.: | |||
| 2.6% 8/19/26 | 3,925,000 | 4,179,476 | |
| 2.8% 8/15/41 | 1,545,000 | 1,531,089 | |
| 3% 1/15/52 | 3,650,000 | 3,653,464 | |
| 4.4% 5/1/45 | 1,450,000 | 1,785,052 | |
| 4.663% 6/15/51 | 175,000 | 227,049 | |
| Gilead Sciences, Inc. 4.5% 2/1/45 | 565,000 | 698,624 | |
| Regeneron Pharmaceuticals, Inc. 2.8% 9/15/50 | 505,000 | 477,908 | |
| 47,257,479 | |||
| Health Care Equipment & Supplies - 0.0% | |||
| Abbott Laboratories 4.9% 11/30/46 | 305,000 | 423,898 | |
| Avantor Funding, Inc. 3.875% 7/15/28 (Reg. S) | EUR | 2,500,000 | 3,120,569 |
| Becton, Dickinson & Co.: | |||
| 3.7% 6/6/27 | 118,000 | 131,615 | |
| 3.734% 12/15/24 | 234,000 | 254,026 | |
| Fresenius U.S. Finance II, Inc. 4.5% 1/15/23 (b) | 4,787,000 | 4,996,127 | |
| Hologic, Inc. 3.25% 2/15/29 (b) | 225,000 | 230,558 | |
| Stryker Corp.: | |||
| 3.375% 5/15/24 | 335,000 | 358,472 | |
| 3.375% 11/1/25 | 305,000 | 332,209 | |
| 3.5% 3/15/26 | 675,000 | 741,396 | |
| Teleflex, Inc. 4.25% 6/1/28 (b) | 60,000 | 62,475 | |
| 10,651,345 | |||
| Health Care Providers & Services - 0.5% | |||
| AHS Hospital Corp. 2.78% 7/1/51 | 315,000 | 320,491 | |
| AmerisourceBergen Corp. 2.7% 3/15/31 | 5,980,000 | 6,209,425 | |
| Anthem, Inc.: | |||
| 3.3% 1/15/23 | 3,395,000 | 3,529,060 | |
| 3.6% 3/15/51 | 3,750,000 | 4,221,062 | |
| 3.65% 12/1/27 | 2,965,000 | 3,318,445 | |
| 4.625% 5/15/42 | 975,000 | 1,220,456 | |
| Ascension Health: | |||
| 2.532% 11/15/29 | 295,000 | 312,085 | |
| 3.106% 11/15/39 | 610,000 | 666,020 | |
| 4.847% 11/15/53 | 45,000 | 65,255 | |
| BayCare Health System, Inc. 3.831% 11/15/50 | 2,320,000 | 2,866,926 | |
| Centene Corp.: | |||
| 2.45% 7/15/28 | 6,335,000 | 6,426,620 | |
| 2.625% 8/1/31 | 2,980,000 | 3,020,975 | |
| 3% 10/15/30 | 1,638,000 | 1,690,150 | |
| 3.375% 2/15/30 | 5,670,000 | 5,925,150 | |
| 4.25% 12/15/27 | 5,825,000 | 6,152,656 | |
| 4.625% 12/15/29 | 7,750,000 | 8,500,898 | |
| Children's Health System of Texas 2.511% 8/15/50 | 360,000 | 344,856 | |
| Childrens Hospital Corp. 4.115% 1/1/47 | 265,000 | 338,801 | |
| Cigna Corp.: | |||
| 2.375% 3/15/31 | 655,000 | 672,399 | |
| 2.4% 3/15/30 | 2,370,000 | 2,442,191 | |
| 3.25% 4/15/25 | 5,000 | 5,392 | |
| 3.4% 3/15/50 | 1,755,000 | 1,867,028 | |
| 3.4% 3/15/51 | 4,490,000 | 4,794,708 | |
| 4.375% 10/15/28 | 14,599,000 | 17,034,888 | |
| 4.5% 2/25/26 | 4,775,000 | 5,423,126 | |
| 4.8% 7/15/46 | 2,375,000 | 3,039,312 | |
| CommonSpirit Health: | |||
| 2.76% 10/1/24 | 575,000 | 605,464 | |
| 2.782% 10/1/30 | 695,000 | 726,984 | |
| 3.347% 10/1/29 | 250,000 | 271,409 | |
| 4.35% 11/1/42 | 2,500,000 | 2,951,778 | |
| Community Health Systems, Inc. 4.75% 2/15/31 (b) | 560,000 | 571,262 | |
| CVS Health Corp.: | |||
| 2.7% 8/21/40 | 9,385,000 | 9,215,863 | |
| 3.625% 4/1/27 | 2,341,000 | 2,597,890 | |
| 4.3% 3/25/28 | 653,000 | 751,859 | |
| 4.78% 3/25/38 | 1,320,000 | 1,642,712 | |
| 5.05% 3/25/48 | 8,780,000 | 11,621,790 | |
| 5.125% 7/20/45 | 1,670,000 | 2,203,974 | |
| 5.3% 12/5/43 | 655,000 | 872,783 | |
| DaVita HealthCare Partners, Inc.: | |||
| 3.75% 2/15/31 (b) | 1,900,000 | 1,877,609 | |
| 4.625% 6/1/30 (b) | 125,000 | 130,645 | |
| Fresenius Medical Care U.S. Finance II, Inc. 5.875% 1/31/22 (b) | 1,800,000 | 1,839,444 | |
| Fresenius Medical Care U.S. Finance III, Inc. 1.875% 12/1/26 (b) | 660,000 | 666,206 | |
| HCA Holdings, Inc.: | |||
| 2.375% 7/15/31 | 1,040,000 | 1,039,189 | |
| 3.5% 9/1/30 | 525,000 | 563,346 | |
| 3.5% 7/15/51 | 5,260,000 | 5,371,410 | |
| 4.125% 6/15/29 | 5,911,000 | 6,687,525 | |
| 4.5% 2/15/27 | 1,050,000 | 1,189,933 | |
| 4.75% 5/1/23 | 205,000 | 218,600 | |
| 5.25% 6/15/49 | 5,250,000 | 6,852,008 | |
| 5.375% 2/1/25 | 305,000 | 343,506 | |
| 5.875% 2/15/26 | 1,135,000 | 1,316,373 | |
| 7.75% 7/15/36 | 2,700,000 | 3,837,375 | |
| Humana, Inc.: | |||
| 2.15% 2/3/32 | 670,000 | 668,550 | |
| 3.125% 8/15/29 | 2,600,000 | 2,808,765 | |
| Kaiser Foundation Hospitals: | |||
| 2.81% 6/1/41 | 6,570,000 | 6,785,393 | |
| 4.15% 5/1/47 | 200,000 | 252,091 | |
| Laboratory Corp. of America Holdings 3.25% 9/1/24 | 720,000 | 767,759 | |
| Memorial Sloan-Kettring Cancer Center: | |||
| 2.955% 1/1/50 | 290,000 | 303,442 | |
| 4.2% 7/1/55 | 140,000 | 183,537 | |
| 5% 7/1/42 | 225,000 | 311,558 | |
| Methodist Hospital 2.705% 12/1/50 | 820,000 | 826,877 | |
| Molina Healthcare, Inc. 3.875% 11/15/30 (b) | 4,745,000 | 5,059,356 | |
| Mount Sinai Hospital 3.737% 7/1/49 | 460,000 | 518,001 | |
| New York & Presbyterian Hospital: | |||
| 4.024% 8/1/45 | 600,000 | 747,111 | |
| 4.063% 8/1/56 | 390,000 | 505,237 | |
| Nidda Healthcare Holding AG 3.5% 9/30/24 (Reg. S) | EUR | 3,000,000 | 3,550,064 |
| NYU Hospitals Center 4.368% 7/1/47 | 810,000 | 977,740 | |
| Owens & Minor, Inc. 4.5% 3/31/29 (b) | 65,000 | 66,459 | |
| PeaceHealth Obligated Group 1.375% 11/15/25 | 165,000 | 167,486 | |
| Prime Healthcare Services 7.25% 11/1/25 (b) | 1,325,000 | 1,417,750 | |
| Providence St. Joseph Health Obligated Group: | |||
| 2.532% 10/1/29 | 2,405,000 | 2,532,054 | |
| 2.746% 10/1/26 | 180,000 | 192,954 | |
| Quest Diagnostics, Inc.: | |||
| 4.7% 3/30/45 | 100,000 | 124,855 | |
| 5.75% 1/30/40 | 68,000 | 87,944 | |
| Stanford Health Care 3.027% 8/15/51 | 680,000 | 722,235 | |
| Sutter Health 4.091% 8/15/48 | 1,140,000 | 1,410,610 | |
| Tenet Healthcare Corp.: | |||
| 4.625% 7/15/24 | 240,000 | 243,300 | |
| 4.875% 1/1/26 (b) | 1,160,000 | 1,203,268 | |
| 5.125% 11/1/27 (b) | 5,000,000 | 5,262,500 | |
| Toledo Hospital 5.325% 11/15/28 | 2,792,000 | 3,202,272 | |
| UnitedHealth Group, Inc.: | |||
| 3.05% 5/15/41 | 680,000 | 721,313 | |
| 3.25% 5/15/51 | 2,592,000 | 2,839,646 | |
| 3.875% 8/15/59 | 30,000 | 36,270 | |
| 4.25% 4/15/47 | 770,000 | 964,333 | |
| 4.25% 6/15/48 | 575,000 | 725,325 | |
| 6.875% 2/15/38 | 700,000 | 1,088,451 | |
| 203,649,818 | |||
| Health Care Technology - 0.0% | |||
| IQVIA, Inc.: | |||
| 1.75% 3/15/26 (b) | EUR | 625,000 | 748,175 |
| 5% 10/15/26(b) | 230,000 | 236,900 | |
| 985,075 | |||
| Life Sciences Tools & Services - 0.0% | |||
| Agilent Technologies, Inc. 2.3% 3/12/31 | 1,245,000 | 1,263,789 | |
| Charles River Laboratories International, Inc.: | |||
| 3.75% 3/15/29 (b) | 75,000 | 77,313 | |
| 4.25% 5/1/28 (b) | 330,000 | 345,645 | |
| Thermo Fisher Scientific, Inc.: | |||
| 2.8% 10/15/41 | 520,000 | 531,363 | |
| 4.133% 3/25/25 | 290,000 | 320,236 | |
| 2,538,346 | |||
| Pharmaceuticals - 0.3% | |||
| AstraZeneca Finance LLC 2.25% 5/28/31 | 510,000 | 526,576 | |
| Bausch Health Companies, Inc.: | |||
| 5.25% 2/15/31 (b) | 6,021,000 | 5,615,787 | |
| 6.25% 2/15/29 (b) | 500,000 | 496,250 | |
| Bayer U.S. Finance II LLC: | |||
| 2.2% 7/15/22 (b) | 2,100,000 | 2,124,947 | |
| 4.25% 12/15/25 (b) | 54,704,000 | 60,902,940 | |
| 4.4% 7/15/44 (b) | 2,131,000 | 2,490,477 | |
| 4.625% 6/25/38 (b) | 570,000 | 682,956 | |
| 4.875% 6/25/48 (b) | 4,430,000 | 5,611,158 | |
| Bristol-Myers Squibb Co.: | |||
| 4.25% 10/26/49 | 3,280,000 | 4,175,765 | |
| 5% 8/15/45 | 672,000 | 925,296 | |
| Catalent Pharma Solutions 3.125% 2/15/29 (b) | 275,000 | 271,690 | |
| Elanco Animal Health, Inc.: | |||
| 5.272% 8/28/23 (c) | 4,020,000 | 4,306,425 | |
| 5.9% 8/28/28 (c) | 1,693,000 | 1,981,843 | |
| GlaxoSmithKline Capital PLC 2.85% 5/8/22 | 710,000 | 722,697 | |
| GlaxoSmithKline Capital, Inc. 2.8% 3/18/23 | 875,000 | 908,821 | |
| Jazz Securities DAC 4.375% 1/15/29 (b) | 95,000 | 98,444 | |
| Johnson & Johnson 3.625% 3/3/37 | 1,260,000 | 1,483,156 | |
| Merck & Co., Inc. 3.4% 3/7/29 | 1,400,000 | 1,572,878 | |
| Mylan NV: | |||
| 4.2% 11/29/23 | 1,100,000 | 1,176,971 | |
| 5.2% 4/15/48 | 1,780,000 | 2,216,966 | |
| 5.4% 11/29/43 | 580,000 | 733,667 | |
| Organon & Co. / Organon Foreign Debt Co-Issuer BV: | |||
| 4.125% 4/30/28 (b) | 65,000 | 67,061 | |
| 5.125% 4/30/31 (b) | 1,190,000 | 1,248,262 | |
| Pfizer, Inc. 2.55% 5/28/40 | 1,410,000 | 1,435,732 | |
| Takeda Pharmaceutical Co. Ltd.: | |||
| 2.05% 3/31/30 | 3,575,000 | 3,565,072 | |
| 3.025% 7/9/40 | 510,000 | 526,885 | |
| Utah Acquisition Sub, Inc.: | |||
| 3.95% 6/15/26 | 2,804,000 | 3,108,066 | |
| 5.25% 6/15/46 | 190,000 | 234,023 | |
| Viatris, Inc.: | |||
| 1.65% 6/22/25 (b) | 1,160,000 | 1,178,604 | |
| 2.7% 6/22/30 (b) | 5,898,000 | 6,035,114 | |
| 3.85% 6/22/40 (b) | 12,189,000 | 13,202,388 | |
| 4% 6/22/50 (b) | 6,572,000 | 7,154,732 | |
| Wyeth LLC 6.45% 2/1/24 | 1,875,000 | 2,144,840 | |
| Zoetis, Inc. 3.25% 2/1/23 | 5,975,000 | 6,175,800 | |
| 145,102,289 | |||
| TOTAL HEALTH CARE | 410,184,352 | ||
| INDUSTRIALS - 0.5% | |||
| Aerospace & Defense - 0.2% | |||
| BAE Systems PLC 3.4% 4/15/30 (b) | 2,985,000 | 3,272,215 | |
| Bombardier, Inc.: | |||
| 6% 2/15/28 (b) | 3,750,000 | 3,782,175 | |
| 7.125% 6/15/26 (b) | 2,780,000 | 2,932,900 | |
| 7.875% 4/15/27 (b) | 485,000 | 508,498 | |
| BWX Technologies, Inc.: | |||
| 4.125% 6/30/28 (b) | 200,000 | 205,500 | |
| 4.125% 4/15/29 (b) | 325,000 | 334,344 | |
| General Dynamics Corp.: | |||
| 2.25% 11/15/22 | 650,000 | 662,428 | |
| 3.25% 4/1/25 | 1,905,000 | 2,057,462 | |
| Howmet Aerospace, Inc.: | |||
| 5.95% 2/1/37 | 575,000 | 725,219 | |
| 6.75% 1/15/28 | 345,000 | 425,404 | |
| Lockheed Martin Corp. 2.9% 3/1/25 | 1,345,000 | 1,437,444 | |
| Moog, Inc. 4.25% 12/15/27 (b) | 360,000 | 369,900 | |
| Northrop Grumman Corp. 4.75% 6/1/43 | 545,000 | 706,028 | |
| Raytheon Technologies Corp. 4.125% 11/16/28 | 490,000 | 563,707 | |
| Teledyne Technologies, Inc.: | |||
| 2.25% 4/1/28 | 1,675,000 | 1,717,040 | |
| 2.75% 4/1/31 | 4,505,000 | 4,698,153 | |
| Textron, Inc. 2.45% 3/15/31 | 2,045,000 | 2,075,884 | |
| The Boeing Co.: | |||
| 1.167% 2/4/23 | 4,000,000 | 4,002,898 | |
| 1.433% 2/4/24 | 1,000,000 | 1,002,202 | |
| 2.196% 2/4/26 | 2,125,000 | 2,132,994 | |
| 2.25% 6/15/26 | 810,000 | 831,987 | |
| 3.6% 5/1/34 | 1,850,000 | 1,959,200 | |
| 3.625% 2/1/31 | 12,650,000 | 13,719,225 | |
| 4.508% 5/1/23 | 1,500,000 | 1,589,181 | |
| 4.875% 5/1/25 | 2,035,000 | 2,274,828 | |
| 5.04% 5/1/27 | 4,430,000 | 5,107,081 | |
| 5.15% 5/1/30 | 4,430,000 | 5,241,416 | |
| 5.805% 5/1/50 | 5,835,000 | 7,925,129 | |
| 5.93% 5/1/60 | 4,430,000 | 6,157,401 | |
| TransDigm, Inc.: | |||
| 4.875% 5/1/29 (b) | 220,000 | 218,625 | |
| 6.25% 3/15/26 (b) | 915,000 | 960,750 | |
| 7.5% 3/15/27 | 40,000 | 42,300 | |
| 8% 12/15/25 (b) | 465,000 | 497,550 | |
| 80,137,068 | |||
| Air Freight & Logistics - 0.0% | |||
| Cargo Aircraft Management, Inc. 4.75% 2/1/28 (b) | 160,000 | 165,200 | |
| Airlines - 0.1% | |||
| American Airlines, Inc. equipment trust certificate 3.2% 12/15/29 | 424,980 | 432,007 | |
| Mexico City Airport Trust: | |||
| 4.25% 10/31/26 (b) | 4,270,000 | 4,610,575 | |
| 5.5% 7/31/47 (b) | 2,250,000 | 2,336,203 | |
| Southwest Airlines Co.: | |||
| 2.625% 2/10/30 | 735,000 | 749,116 | |
| 4.75% 5/4/23 | 1,550,000 | 1,654,833 | |
| 5.125% 6/15/27 | 5,340,000 | 6,243,209 | |
| United Airlines pass-thru Trust Series 2013-1A Class O, 4.3% 2/15/27 | 133,857 | 144,543 | |
| United Airlines, Inc.: | |||
| 4.15% 10/11/25 | 518,344 | 549,327 | |
| 4.375% 4/15/26 (b) | 1,740,000 | 1,805,076 | |
| 4.625% 4/15/29 (b) | 370,000 | 383,875 | |
| 18,908,764 | |||
| Building Products - 0.0% | |||
| Advanced Drain Systems, Inc. 5% 9/30/27 (b) | 400,000 | 416,000 | |
| Owens Corning 4.3% 7/15/47 | 5,110,000 | 6,012,690 | |
| Standard Industries, Inc./New Jersey 4.75% 1/15/28 (b) | 3,618,000 | 3,756,479 | |
| 10,185,169 | |||
| Commercial Services & Supplies - 0.0% | |||
| ADT Corp. 4.125% 8/1/29 (b) | 115,000 | 114,852 | |
| Advocate Health & Hospitals Corp. 3.387% 10/15/49 | 510,000 | 570,499 | |
| Allied Universal Holdco LLC / Allied Universal Finance Corp. 6% 6/1/29 (b) | 1,175,000 | 1,174,894 | |
| Atlas Luxco 4 SARL / Allied Universal Holdco LLC / Allied Universal Finance Corp.: | |||
| 4.625% 6/1/28 (b) | 830,000 | 833,631 | |
| 4.625% 6/1/28 (b) | 520,000 | 521,300 | |
| Cintas Corp. No. 2 3.7% 4/1/27 | 1,035,000 | 1,161,174 | |
| Legends Hospitality Holding Co. LLC/Legends Hospitality Co-Issuer, Inc. 5% 2/1/26 (b) | 60,000 | 61,800 | |
| Madison IAQ LLC 4.125% 6/30/28 (b) | 85,000 | 85,467 | |
| Nielsen Co. SARL (Luxembourg) 5% 2/1/25 (b) | 115,000 | 117,875 | |
| Nielsen Finance LLC/Nielsen Finance Co.: | |||
| 5.625% 10/1/28 (b) | 205,000 | 215,506 | |
| 5.875% 10/1/30 (b) | 205,000 | 220,119 | |
| Pitney Bowes, Inc.: | |||
| 6.875% 3/15/27 (b) | 55,000 | 58,575 | |
| 7.25% 3/15/29 (b) | 110,000 | 118,111 | |
| PowerTeam Services LLC 9.033% 12/4/25 (b) | 108,000 | 117,990 | |
| Stericycle, Inc. 3.875% 1/15/29 (b) | 530,000 | 539,386 | |
| Waste Management, Inc. 2.9% 9/15/22 | 375,000 | 382,389 | |
| 6,293,568 | |||
| Construction & Engineering - 0.0% | |||
| AECOM 5.125% 3/15/27 | 1,905,000 | 2,127,847 | |
| Arcosa, Inc. 4.375% 4/15/29 (b) | 65,000 | 66,923 | |
| Dycom Industries, Inc. 4.5% 4/15/29 (b) | 165,000 | 169,538 | |
| 2,364,308 | |||
| Electrical Equipment - 0.0% | |||
| ABB Finance (U.S.A.), Inc. 2.875% 5/8/22 | 115,000 | 117,052 | |
| Sensata Technologies BV: | |||
| 4% 4/15/29 (b) | 170,000 | 175,875 | |
| 4.875% 10/15/23 (b) | 300,000 | 321,210 | |
| Wesco Distribution, Inc.: | |||
| 7.125% 6/15/25 (b) | 1,500,000 | 1,613,535 | |
| 7.25% 6/15/28 (b) | 1,250,000 | 1,390,238 | |
| 3,617,910 | |||
| Industrial Conglomerates - 0.0% | |||
| General Electric Co. 3.45% 5/15/24 | 85,000 | 90,564 | |
| Machinery - 0.1% | |||
| Fortive Corp. 3.15% 6/15/26 | 275,000 | 298,777 | |
| Pentair Finance SA 4.5% 7/1/29 | 7,920,000 | 9,195,146 | |
| Westinghouse Air Brake Tech Co.: | |||
| 3.45% 11/15/26 | 740,000 | 794,788 | |
| 4.95% 9/15/28 | 8,835,000 | 10,283,897 | |
| Xylem, Inc. 4.875% 10/1/21 | 525,000 | 526,927 | |
| 21,099,535 | |||
| Marine - 0.0% | |||
| Seaspan Corp. 5.5% 8/1/29 (b) | 115,000 | 117,588 | |
| Professional Services - 0.0% | |||
| ASGN, Inc. 4.625% 5/15/28 (b) | 110,000 | 114,842 | |
| Booz Allen Hamilton, Inc.: | |||
| 3.875% 9/1/28 (b) | 320,000 | 329,843 | |
| 4% 7/1/29 (b) | 45,000 | 46,631 | |
| Equifax, Inc. 2.6% 12/1/24 | 1,245,000 | 1,309,906 | |
| IHS Markit Ltd.: | |||
| 4% 3/1/26 (b) | 1,195,000 | 1,320,475 | |
| 4.125% 8/1/23 | 365,000 | 386,787 | |
| 5% 11/1/22 (b) | 11,013,000 | 11,439,203 | |
| TriNet Group, Inc. 3.5% 3/1/29 (b) | 165,000 | 166,238 | |
| Verisk Analytics, Inc. 4.125% 9/12/22 | 690,000 | 714,706 | |
| 15,828,631 | |||
| Road & Rail - 0.0% | |||
| CSX Corp. 6.15% 5/1/37 | 1,375,000 | 1,946,428 | |
| Union Pacific Corp.: | |||
| 2.973% 9/16/62 | 200,000 | 197,327 | |
| 3.25% 2/5/50 | 1,760,000 | 1,875,575 | |
| 3.6% 9/15/37 | 790,000 | 895,044 | |
| 3.799% 4/6/71 (b) | 315,000 | 361,023 | |
| XPO Logistics, Inc. 6.25% 5/1/25 (b) | 1,810,000 | 1,911,813 | |
| 7,187,210 | |||
| Trading Companies & Distributors - 0.1% | |||
| Air Lease Corp.: | |||
| 2.25% 1/15/23 | 1,711,000 | 1,752,191 | |
| 3% 9/15/23 | 800,000 | 833,814 | |
| 3.375% 7/1/25 | 7,608,000 | 8,144,938 | |
| 3.75% 2/1/22 | 4,752,000 | 4,790,816 | |
| 4.25% 2/1/24 | 7,846,000 | 8,451,706 | |
| 4.25% 9/15/24 | 9,907,000 | 10,767,908 | |
| United Rentals North America, Inc.: | |||
| 3.75% 1/15/32 | 825,000 | 842,531 | |
| 3.875% 2/15/31 | 400,000 | 414,036 | |
| 4.875% 1/15/28 | 2,000,000 | 2,120,000 | |
| 38,117,940 | |||
| Transportation Infrastructure - 0.0% | |||
| Avolon Holdings Funding Ltd.: | |||
| 2.528% 11/18/27 (b) | 4,546,000 | 4,513,037 | |
| 3.625% 5/1/22 (b) | 2,155,000 | 2,192,904 | |
| 3.95% 7/1/24 (b) | 2,862,000 | 3,052,964 | |
| 4.375% 5/1/26 (b) | 3,477,000 | 3,778,219 | |
| 5.25% 5/15/24 (b) | 4,140,000 | 4,539,245 | |
| 18,076,369 | |||
| TOTAL INDUSTRIALS | 222,189,824 | ||
| INFORMATION TECHNOLOGY - 0.4% | |||
| Communications Equipment - 0.0% | |||
| Cisco Systems, Inc. 3% 6/15/22 | 310,000 | 316,770 | |
| Electronic Equipment & Components - 0.0% | |||
| Dell International LLC/EMC Corp.: | |||
| 5.45% 6/15/23 | 6,100,000 | 6,574,111 | |
| 6.02% 6/15/26 | 2,112,000 | 2,522,370 | |
| Sensata Technologies, Inc. 3.75% 2/15/31 (b) | 590,000 | 592,950 | |
| SYNNEX Corp. 1.75% 8/9/26 (b) | 6,930,000 | 6,898,173 | |
| TTM Technologies, Inc. 4% 3/1/29 (b) | 130,000 | 131,625 | |
| 16,719,229 | |||
| IT Services - 0.1% | |||
| Austin BidCo, Inc. 7.125% 12/15/28 (b) | 60,000 | 60,825 | |
| Automatic Data Processing, Inc. 1.7% 5/15/28 | 695,000 | 707,272 | |
| Banff Merger Sub, Inc. 9.75% 9/1/26 (b) | 500,000 | 524,375 | |
| Fidelity National Information Services, Inc. 3.1% 3/1/41 | 3,540,000 | 3,685,880 | |
| Fiserv, Inc.: | |||
| 2.75% 7/1/24 | 105,000 | 110,906 | |
| 3.5% 7/1/29 | 7,395,000 | 8,123,312 | |
| 3.85% 6/1/25 | 1,490,000 | 1,635,081 | |
| Gartner, Inc.: | |||
| 3.625% 6/15/29 (b) | 65,000 | 66,903 | |
| 3.75% 10/1/30 (b) | 105,000 | 109,872 | |
| 4.5% 7/1/28 (b) | 165,000 | 174,694 | |
| Genpact Luxembourg SARL / Genpact U.S.A., Inc. 1.75% 4/10/26 | 960,000 | 970,263 | |
| Go Daddy Operating Co. LLC / GD Finance Co., Inc. 3.5% 3/1/29 (b) | 330,000 | 325,875 | |
| IBM Corp. 2.85% 5/15/40 | 480,000 | 489,810 | |
| MasterCard, Inc. 3.375% 4/1/24 | 870,000 | 934,420 | |
| Square, Inc. 2.75% 6/1/26 (b) | 110,000 | 113,163 | |
| Tempo Acquisition LLC 5.75% 6/1/25 (b) | 5,000,000 | 5,274,000 | |
| Twilio, Inc.: | |||
| 3.625% 3/15/29 | 80,000 | 82,576 | |
| 3.875% 3/15/31 | 85,000 | 88,825 | |
| Visa, Inc. 2.7% 4/15/40 | 145,000 | 150,763 | |
| 23,628,815 | |||
| Semiconductors & Semiconductor Equipment - 0.1% | |||
| Broadcom, Inc.: | |||
| 1.95% 2/15/28 (b) | 1,620,000 | 1,619,237 | |
| 2.45% 2/15/31 (b) | 12,129,000 | 12,020,026 | |
| 2.6% 2/15/33 (b) | 12,129,000 | 12,011,835 | |
| 3.15% 11/15/25 | 413,000 | 442,262 | |
| 3.419% 4/15/33 (b) | 2,872,000 | 3,047,501 | |
| 3.5% 2/15/41 (b) | 19,161,000 | 19,744,335 | |
| 3.75% 2/15/51 (b) | 5,224,000 | 5,437,620 | |
| 4.11% 9/15/28 | 2,135,000 | 2,393,200 | |
| Entegris, Inc.: | |||
| 3.625% 5/1/29 (b) | 275,000 | 284,185 | |
| 4.375% 4/15/28 (b) | 325,000 | 343,749 | |
| Intel Corp. 3.05% 8/12/51 | 2,688,000 | 2,771,145 | |
| NXP BV/NXP Funding LLC 3.875% 9/1/22 (b) | 1,969,000 | 2,032,149 | |
| ON Semiconductor Corp. 3.875% 9/1/28 (b) | 125,000 | 131,339 | |
| Qorvo, Inc. 4.375% 10/15/29 | 200,000 | 221,750 | |
| Teledyne FLIR LLC 2.5% 8/1/30 | 245,000 | 250,112 | |
| 62,750,445 | |||
| Software - 0.1% | |||
| CDK Global, Inc. 4.875% 6/1/27 | 500,000 | 525,000 | |
| Crowdstrike Holdings, Inc. 3% 2/15/29 | 125,000 | 126,050 | |
| Fair Isaac Corp. 4% 6/15/28 (b) | 500,000 | 517,500 | |
| Intuit, Inc. 1.35% 7/15/27 | 200,000 | 201,959 | |
| Microsoft Corp. 2.921% 3/17/52 | 2,767,000 | 2,975,515 | |
| NortonLifeLock, Inc. 5% 4/15/25 (b) | 370,000 | 374,040 | |
| Nuance Communications, Inc. 5.625% 12/15/26 | 600,000 | 622,671 | |
| Open Text Corp. 3.875% 2/15/28 (b) | 490,000 | 511,438 | |
| Oracle Corp.: | |||
| 2.5% 4/1/25 | 6,499,000 | 6,817,427 | |
| 2.8% 4/1/27 | 7,964,000 | 8,496,479 | |
| 2.875% 3/25/31 | 2,300,000 | 2,422,499 | |
| 2.95% 5/15/25 | 935,000 | 995,188 | |
| 3.6% 4/1/50 | 1,300,000 | 1,355,927 | |
| 3.85% 4/1/60 | 6,500,000 | 6,985,456 | |
| 3.95% 3/25/51 | 4,425,000 | 4,886,949 | |
| 4.125% 5/15/45 | 850,000 | 952,704 | |
| ServiceNow, Inc. 1.4% 9/1/30 | 1,005,000 | 953,785 | |
| SS&C Technologies, Inc. 5.5% 9/30/27 (b) | 775,000 | 820,686 | |
| 40,541,273 | |||
| Technology Hardware, Storage & Peripherals - 0.1% | |||
| Apple, Inc.: | |||
| 2.7% 8/5/51 | 2,700,000 | 2,688,207 | |
| 3.25% 2/23/26 | 7,150,000 | 7,831,046 | |
| 3.85% 8/4/46 | 1,330,000 | 1,590,323 | |
| Hewlett Packard Enterprise Co. 4.4% 10/15/22 (c) | 5,700,000 | 5,912,667 | |
| 18,022,243 | |||
| TOTAL INFORMATION TECHNOLOGY | 161,978,775 | ||
| MATERIALS - 0.2% | |||
| Chemicals - 0.1% | |||
| Axalta Coating Systems/Dutch Holding BV 4.75% 6/15/27 (b) | 240,000 | 251,990 | |
| CF Industries Holdings, Inc.: | |||
| 4.95% 6/1/43 | 285,000 | 351,573 | |
| 5.15% 3/15/34 | 300,000 | 374,640 | |
| 5.375% 3/15/44 | 525,000 | 683,219 | |
| Consolidated Energy Finance SA 6.5% 5/15/26 (b) | 375,000 | 379,688 | |
| DuPont de Nemours, Inc. 4.493% 11/15/25 | 2,625,000 | 2,964,221 | |
| FMC Corp. 4.5% 10/1/49 | 900,000 | 1,078,455 | |
| INEOS Quattro Finance 2 PLC 3.375% 1/15/26 (b) | 275,000 | 278,438 | |
| International Flavors & Fragrances, Inc. 1.23% 10/1/25 (b) | 3,285,000 | 3,275,386 | |
| LYB International Finance BV: | |||
| 4.875% 3/15/44 | 845,000 | 1,070,841 | |
| 5.25% 7/15/43 | 5,455,000 | 7,130,421 | |
| LYB International Finance III LLC: | |||
| 3.375% 5/1/30 | 2,495,000 | 2,747,412 | |
| 3.375% 10/1/40 | 165,000 | 174,452 | |
| 4.2% 5/1/50 | 150,000 | 175,922 | |
| Methanex Corp.: | |||
| 5.125% 10/15/27 | 320,000 | 348,400 | |
| 5.25% 12/15/29 | 155,000 | 169,079 | |
| 5.65% 12/1/44 | 105,000 | 114,217 | |
| Nutrien Ltd. 4.9% 6/1/43 | 1,225,000 | 1,580,064 | |
| OCI NV: | |||
| 3.125% 11/1/24 (Reg. S) | EUR | 2,500,000 | 3,003,887 |
| 3.625% 10/15/25 (Reg. S) | EUR | 3,082,000 | 3,786,985 |
| Olin Corp.: | |||
| 5% 2/1/30 | 195,000 | 209,288 | |
| 5.125% 9/15/27 | 700,000 | 727,125 | |
| 5.625% 8/1/29 | 195,000 | 215,192 | |
| Sasol Financing U.S.A. LLC: | |||
| 4.375% 9/18/26 | 810,000 | 838,350 | |
| 5.875% 3/27/24 | 1,500,000 | 1,595,906 | |
| Sherwin-Williams Co. 4.5% 6/1/47 | 210,000 | 263,067 | |
| The Chemours Co. LLC 4.625% 11/15/29 (b) | 530,000 | 526,301 | |
| The Dow Chemical Co.: | |||
| 3.625% 5/15/26 | 3,020,000 | 3,342,458 | |
| 4.625% 10/1/44 | 295,000 | 366,208 | |
| The Scotts Miracle-Gro Co.: | |||
| 4% 4/1/31 (b) | 1,575,000 | 1,578,938 | |
| 4.5% 10/15/29 | 1,971,000 | 2,059,695 | |
| Valvoline, Inc. 4.25% 2/15/30 (b) | 2,270,000 | 2,355,125 | |
| W. R. Grace & Co.-Conn.: | |||
| 4.875% 6/15/27 (b) | 125,000 | 129,688 | |
| 5.625% 10/1/24 (b) | 400,000 | 438,000 | |
| Westlake Chemical Corp. 3.125% 8/15/51 | 1,920,000 | 1,860,155 | |
| 46,444,786 | |||
| Construction Materials - 0.0% | |||
| Martin Marietta Materials, Inc.: | |||
| 2.4% 7/15/31 | 1,055,000 | 1,079,466 | |
| 2.5% 3/15/30 | 755,000 | 780,883 | |
| Summit Materials LLC/Summit Materials Finance Corp. 5.25% 1/15/29 (b) | 1,000,000 | 1,058,750 | |
| Vulcan Materials Co. 4.5% 6/15/47 | 915,000 | 1,128,703 | |
| 4,047,802 | |||
| Containers & Packaging - 0.0% | |||
| Ardagh Packaging Finance PLC/Ardagh MP Holdings U.S.A., Inc.: | |||
| 4.125% 8/15/26 (b) | 10,000 | 10,397 | |
| 4.75% 7/15/27 (Reg. S) | GBP | 3,650,000 | 5,138,027 |
| 5.25% 8/15/27 (b) | 310,000 | 320,850 | |
| Berry Global, Inc.: | |||
| 0.95% 2/15/24 (b) | 965,000 | 968,042 | |
| 1.57% 1/15/26 (b) | 3,005,000 | 3,031,504 | |
| 4.875% 7/15/26 (b) | 5,360,000 | 5,652,388 | |
| Intelligent Packaging Ltd. Finco, Inc. 6% 9/15/28 (b) | 40,000 | 41,800 | |
| International Paper Co.: | |||
| 5% 9/15/35 | 370,000 | 468,090 | |
| 5.15% 5/15/46 | 46,000 | 61,678 | |
| OI European Group BV 4% 3/15/23 (b) | 290,000 | 300,092 | |
| Trivium Packaging Finance BV 5.5% 8/15/26 (b) | 205,000 | 216,004 | |
| Westrock Rkt LLC 4.9% 3/1/22 | 185,000 | 189,018 | |
| 16,397,890 | |||
| Metals & Mining - 0.1% | |||
| Alcoa Nederland Holding BV 4.125% 3/31/29 (b) | 110,000 | 116,059 | |
| Barrick North America Finance LLC: | |||
| 5.7% 5/30/41 | 1,155,000 | 1,596,708 | |
| 5.75% 5/1/43 | 560,000 | 786,427 | |
| Barrick PD Australia Finance Pty Ltd. 5.95% 10/15/39 | 1,240,000 | 1,735,944 | |
| Cleveland-Cliffs, Inc.: | |||
| 4.625% 3/1/29 (b) | 110,000 | 115,775 | |
| 4.875% 3/1/31 (b) | 110,000 | 118,250 | |
| Corporacion Nacional del Cobre de Chile (Codelco) 3.15% 1/14/30 (Reg. S) | 1,040,000 | 1,097,070 | |
| FMG Resources (August 2006) Pty Ltd. 4.5% 9/15/27 (b) | 5,000 | 5,425 | |
| Freeport-McMoRan, Inc. 5.4% 11/14/34 | 570,000 | 714,749 | |
| HudBay Minerals, Inc. 4.5% 4/1/26 (b) | 55,000 | 55,286 | |
| Indonesia Asahan Aluminium Tbk PT: | |||
| 4.75% 5/15/25 (Reg. S) | 500,000 | 545,055 | |
| 6.53% 11/15/28 (b) | 1,950,000 | 2,396,428 | |
| 6.53% 11/15/28 (Reg. S) | 488,000 | 599,722 | |
| Kaiser Aluminum Corp. 4.625% 3/1/28 (b) | 415,000 | 430,563 | |
| Kinross Gold Corp. 4.5% 7/15/27 | 8,840,000 | 10,156,694 | |
| Newmont Corp.: | |||
| 2.25% 10/1/30 | 725,000 | 730,055 | |
| 2.8% 10/1/29 | 1,595,000 | 1,678,630 | |
| 5.45% 6/9/44 | 185,000 | 256,394 | |
| Novelis Corp. 3.875% 8/15/31 (b) | 115,000 | 116,047 | |
| Southern Copper Corp. 5.875% 4/23/45 | 455,000 | 632,678 | |
| Steel Dynamics, Inc.: | |||
| 2.4% 6/15/25 | 365,000 | 380,584 | |
| 3.45% 4/15/30 | 5,400,000 | 5,915,780 | |
| Teck Resources Ltd.: | |||
| 6% 8/15/40 | 1,255,000 | 1,620,020 | |
| 6.25% 7/15/41 | 2,050,000 | 2,729,359 | |
| 34,529,702 | |||
| Paper & Forest Products - 0.0% | |||
| Celulosa Arauco y Constitucion SA 4.5% 8/1/24 | 1,850,000 | 1,995,503 | |
| Clearwater Paper Corp. 4.75% 8/15/28 (b) | 1,500,000 | 1,540,050 | |
| Suzano Austria GmbH 6% 1/15/29 | 963,000 | 1,147,956 | |
| 4,683,509 | |||
| TOTAL MATERIALS | 106,103,689 | ||
| REAL ESTATE - 0.8% | |||
| Equity Real Estate Investment Trusts (REITs) - 0.6% | |||
| Alexandria Real Estate Equities, Inc. 4.9% 12/15/30 | 5,395,000 | 6,639,033 | |
| American Campus Communities Operating Partnership LP 3.625% 11/15/27 | 5,645,000 | 6,180,237 | |
| American Homes 4 Rent LP: | |||
| 2.375% 7/15/31 | 704,000 | 707,057 | |
| 3.375% 7/15/51 | 1,089,000 | 1,122,012 | |
| Boston Properties, Inc.: | |||
| 3.85% 2/1/23 | 1,175,000 | 1,219,907 | |
| 4.5% 12/1/28 | 5,210,000 | 6,097,814 | |
| Corporate Office Properties LP: | |||
| 2.25% 3/15/26 | 1,775,000 | 1,830,701 | |
| 2.75% 4/15/31 | 5,797,000 | 5,915,762 | |
| 5% 7/1/25 | 3,453,000 | 3,885,184 | |
| Duke Realty LP 3.25% 6/30/26 | 805,000 | 875,272 | |
| Global Net Lease, Inc. / Global Net Lease Operating Partnership LP 3.75% 12/15/27 (b) | 275,000 | 271,906 | |
| GLP Capital LP/GLP Financing II, Inc.: | |||
| 5.25% 6/1/25 | 1,200,000 | 1,345,326 | |
| 5.375% 11/1/23 | 2,000,000 | 2,167,444 | |
| 5.375% 4/15/26 | 11,435,000 | 13,110,456 | |
| Healthcare Realty Trust, Inc. 3.875% 5/1/25 | 2,750,000 | 2,974,789 | |
| Healthcare Trust of America Holdings LP: | |||
| 3.1% 2/15/30 | 1,715,000 | 1,834,960 | |
| 3.5% 8/1/26 | 1,786,000 | 1,952,742 | |
| Healthpeak Properties, Inc. 3% 1/15/30 | 925,000 | 990,194 | |
| Hudson Pacific Properties LP: | |||
| 3.25% 1/15/30 | 1,750,000 | 1,860,458 | |
| 4.65% 4/1/29 | 10,503,000 | 12,232,245 | |
| Kimco Realty Corp. 1.9% 3/1/28 | 815,000 | 821,622 | |
| Lexington Corporate Properties Trust: | |||
| 2.7% 9/15/30 | 894,000 | 918,448 | |
| 4.4% 6/15/24 | 1,319,000 | 1,422,345 | |
| MGM Growth Properties Operating Partnership LP: | |||
| 4.5% 9/1/26 | 400,000 | 435,716 | |
| 4.625% 6/15/25 (b) | 65,000 | 69,862 | |
| 5.625% 5/1/24 | 1,185,000 | 1,291,650 | |
| MPT Operating Partnership LP/MPT Finance Corp.: | |||
| 2.5% 3/24/26 | GBP | 4,400,000 | 6,183,151 |
| 5% 10/15/27 | 2,650,000 | 2,805,688 | |
| Omega Healthcare Investors, Inc.: | |||
| 3.25% 4/15/33 | 5,000,000 | 5,045,799 | |
| 3.375% 2/1/31 | 3,399,000 | 3,505,261 | |
| 3.625% 10/1/29 | 7,647,000 | 8,148,533 | |
| 4.375% 8/1/23 | 1,368,000 | 1,452,345 | |
| 4.5% 1/15/25 | 2,793,000 | 3,065,049 | |
| 4.5% 4/1/27 | 1,500,000 | 1,685,246 | |
| 4.75% 1/15/28 | 7,569,000 | 8,600,951 | |
| 4.95% 4/1/24 | 1,152,000 | 1,255,186 | |
| 5.25% 1/15/26 | 5,841,000 | 6,663,008 | |
| Park Intermediate Holdings LLC 5.875% 10/1/28 (b) | 1,100,000 | 1,171,500 | |
| Realty Income Corp.: | |||
| 3% 1/15/27 | 585,000 | 633,585 | |
| 3.25% 1/15/31 | 1,177,000 | 1,299,938 | |
| Retail Opportunity Investments Partnership LP: | |||
| 4% 12/15/24 | 877,000 | 940,648 | |
| 5% 12/15/23 | 626,000 | 674,953 | |
| Retail Properties America, Inc.: | |||
| 4% 3/15/25 | 6,865,000 | 7,328,157 | |
| 4.75% 9/15/30 | 10,799,000 | 12,093,195 | |
| SBA Communications Corp.: | |||
| 3.125% 2/1/29 (b) | 220,000 | 216,150 | |
| 3.875% 2/15/27 | 400,000 | 415,712 | |
| 4.875% 9/1/24 | 200,000 | 203,000 | |
| Senior Housing Properties Trust 4.75% 2/15/28 | 2,917,000 | 2,953,463 | |
| Service Properties Trust: | |||
| 4.375% 2/15/30 | 200,000 | 192,111 | |
| 4.95% 2/15/27 | 485,000 | 485,000 | |
| 4.95% 10/1/29 | 100,000 | 99,000 | |
| 5.5% 12/15/27 | 100,000 | 107,232 | |
| Simon Property Group LP: | |||
| 1.75% 2/1/28 | 915,000 | 918,208 | |
| 2.45% 9/13/29 | 360,000 | 371,798 | |
| 3.375% 10/1/24 | 2,795,000 | 3,001,718 | |
| 3.5% 9/1/25 | 55,000 | 60,000 | |
| 3.75% 2/1/24 | 275,000 | 294,008 | |
| SITE Centers Corp.: | |||
| 3.625% 2/1/25 | 2,396,000 | 2,540,235 | |
| 4.25% 2/1/26 | 5,582,000 | 6,078,746 | |
| Spirit Realty LP 2.7% 2/15/32 | 6,280,000 | 6,324,096 | |
| Store Capital Corp.: | |||
| 2.75% 11/18/30 | 1,957,000 | 1,992,903 | |
| 4.625% 3/15/29 | 2,475,000 | 2,838,415 | |
| Uniti Group LP / Uniti Group Finance, Inc. 4.75% 4/15/28 (b) | 95,000 | 97,019 | |
| Uniti Group, Inc. 7.875% 2/15/25 (b) | 2,800,000 | 2,992,500 | |
| Ventas Realty LP: | |||
| 3% 1/15/30 | 10,008,000 | 10,556,400 | |
| 3.125% 6/15/23 | 1,414,000 | 1,473,257 | |
| 3.25% 10/15/26 | 1,900,000 | 2,053,822 | |
| 3.85% 4/1/27 | 1,150,000 | 1,287,493 | |
| 4% 3/1/28 | 2,712,000 | 3,046,118 | |
| 4.125% 1/15/26 | 1,628,000 | 1,814,393 | |
| 4.75% 11/15/30 | 13,000,000 | 15,497,606 | |
| VEREIT Operating Partnership LP: | |||
| 2.2% 6/15/28 | 791,000 | 809,789 | |
| 2.85% 12/15/32 | 1,553,000 | 1,643,089 | |
| 3.1% 12/15/29 | 6,085,000 | 6,548,531 | |
| 3.4% 1/15/28 | 1,880,000 | 2,052,925 | |
| VICI Properties, Inc.: | |||
| 3.5% 2/15/25 (b) | 125,000 | 128,125 | |
| 4.25% 12/1/26 (b) | 670,000 | 703,780 | |
| 4.625% 12/1/29 (b) | 250,000 | 271,875 | |
| Vornado Realty LP: | |||
| 2.15% 6/1/26 | 1,762,000 | 1,803,711 | |
| 3.4% 6/1/31 | 6,373,000 | 6,658,325 | |
| Weingarten Realty Investors 3.375% 10/15/22 | 472,000 | 483,504 | |
| Welltower, Inc.: | |||
| 2.7% 2/15/27 | 340,000 | 360,805 | |
| 2.75% 1/15/31 | 6,560,000 | 6,844,781 | |
| 2.8% 6/1/31 | 2,305,000 | 2,411,466 | |
| Weyerhaeuser Co. 4% 4/15/30 | 1,625,000 | 1,857,814 | |
| WP Carey, Inc.: | |||
| 2.25% 4/1/33 | 4,760,000 | 4,651,674 | |
| 3.85% 7/15/29 | 1,725,000 | 1,925,316 | |
| 4% 2/1/25 | 5,544,000 | 6,040,793 | |
| 4.6% 4/1/24 | 7,436,000 | 8,089,629 | |
| 271,921,670 | |||
| Real Estate Management & Development - 0.2% | |||
| Brandywine Operating Partnership LP: | |||
| 3.95% 2/15/23 | 4,006,000 | 4,169,027 | |
| 3.95% 11/15/27 | 5,608,000 | 6,139,941 | |
| 4.1% 10/1/24 | 4,892,000 | 5,288,303 | |
| 4.55% 10/1/29 | 1,707,000 | 1,930,592 | |
| CBRE Group, Inc. 4.875% 3/1/26 | 12,670,000 | 14,582,431 | |
| Essex Portfolio LP: | |||
| 1.7% 3/1/28 | 5,465,000 | 5,442,219 | |
| 3.875% 5/1/24 | 2,685,000 | 2,882,640 | |
| Howard Hughes Corp.: | |||
| 4.125% 2/1/29 (b) | 300,000 | 301,500 | |
| 5.375% 8/1/28 (b) | 850,000 | 901,000 | |
| Kennedy-Wilson, Inc. 4.75% 2/1/30 | 225,000 | 230,933 | |
| Mattamy Group Corp. 4.625% 3/1/30 (b) | 1,500,000 | 1,537,500 | |
| Mid-America Apartments LP 4% 11/15/25 | 1,296,000 | 1,437,061 | |
| Post Apartment Homes LP 3.375% 12/1/22 | 1,800,000 | 1,851,559 | |
| SL Green Realty Corp. 3.25% 10/15/22 | 7,000,000 | 7,191,105 | |
| Sun Communities Operating LP 2.7% 7/15/31 | 3,288,000 | 3,348,081 | |
| Tanger Properties LP: | |||
| 2.75% 9/1/31 | 4,140,000 | 4,037,269 | |
| 3.125% 9/1/26 | 3,497,000 | 3,657,558 | |
| 3.75% 12/1/24 | 3,352,000 | 3,658,420 | |
| 3.875% 12/1/23 | 597,000 | 637,181 | |
| 3.875% 7/15/27 | 13,369,000 | 14,533,438 | |
| Taylor Morrison Communities, Inc./Monarch Communities, Inc.: | |||
| 5.125% 8/1/30 (b) | 2,500,000 | 2,734,950 | |
| 5.75% 1/15/28 (b) | 280,000 | 315,700 | |
| 5.875% 6/15/27 (b) | 1,500,000 | 1,698,750 | |
| 88,507,158 | |||
| TOTAL REAL ESTATE | 360,428,828 | ||
| UTILITIES - 0.5% | |||
| Electric Utilities - 0.3% | |||
| AEP Texas, Inc.: | |||
| 2.1% 7/1/30 | 1,100,000 | 1,090,593 | |
| 3.45% 5/15/51 | 560,000 | 592,946 | |
| 3.8% 10/1/47 | 725,000 | 806,763 | |
| AEP Transmission Co. LLC: | |||
| 3.75% 12/1/47 | 850,000 | 981,015 | |
| 4% 12/1/46 | 375,000 | 452,087 | |
| Alabama Power Co.: | |||
| 3.75% 3/1/45 | 650,000 | 753,673 | |
| 3.85% 12/1/42 | 700,000 | 818,764 | |
| 4.1% 1/15/42 | 225,000 | 262,101 | |
| Alliant Energy Finance LLC 1.4% 3/15/26 (b) | 2,300,000 | 2,286,475 | |
| Arizona Public Service Co. 2.6% 8/15/29 | 340,000 | 357,979 | |
| Atlantic City Electric Co. 2.3% 3/15/31 | 425,000 | 439,815 | |
| CenterPoint Energy Houston Electric LLC 3.95% 3/1/48 | 1,235,000 | 1,481,443 | |
| Clearway Energy Operating LLC: | |||
| 4.75% 3/15/28 (b) | 60,000 | 63,522 | |
| 5% 9/15/26 | 520,000 | 533,650 | |
| Cleco Corporate Holdings LLC 3.375% 9/15/29 | 4,448,000 | 4,649,256 | |
| Commonwealth Edison Co.: | |||
| 3.7% 8/15/28 | 250,000 | 285,422 | |
| 3.7% 3/1/45 | 315,000 | 362,896 | |
| 4.35% 11/15/45 | 205,000 | 257,473 | |
| Dominion Energy South Carolina: | |||
| 5.1% 6/1/65 | 275,000 | 406,863 | |
| 5.45% 2/1/41 | 185,000 | 257,731 | |
| DPL, Inc. 4.35% 4/15/29 | 2,480,000 | 2,728,000 | |
| DTE Electric Co.: | |||
| 2.25% 3/1/30 | 150,000 | 155,111 | |
| 3.75% 8/15/47 | 900,000 | 1,044,986 | |
| Duke Energy Carolinas LLC: | |||
| 2.95% 12/1/26 | 370,000 | 400,830 | |
| 4% 9/30/42 | 1,750,000 | 2,070,575 | |
| 4.25% 12/15/41 | 1,550,000 | 1,879,034 | |
| 6.1% 6/1/37 | 775,000 | 1,078,107 | |
| Duke Energy Florida LLC 6.35% 9/15/37 | 675,000 | 1,007,551 | |
| Duquesne Light Holdings, Inc. 2.775% 1/7/32 (b) | 4,273,000 | 4,336,973 | |
| ENEL Finance International NV 2.25% 7/12/31 (b) | 5,660,000 | 5,638,917 | |
| Entergy Louisiana LLC 2.4% 10/1/26 | 1,070,000 | 1,125,558 | |
| Entergy, Inc. 1.75% 3/15/31 | 1,475,000 | 1,420,074 | |
| Eskom Holdings SOC Ltd. 6.75% 8/6/23 (b) | 1,000,000 | 1,043,500 | |
| Evergy Kansas Central 4.125% 3/1/42 | 655,000 | 785,423 | |
| Eversource Energy 1.65% 8/15/30 | 520,000 | 502,285 | |
| Exelon Corp. 5.625% 6/15/35 | 150,000 | 198,794 | |
| FirstEnergy Corp.: | |||
| 3.4% 3/1/50 | 3,431,000 | 3,414,874 | |
| 4.75% 3/15/23 | 12,580,000 | 13,098,296 | |
| 7.375% 11/15/31 | 9,948,000 | 13,893,676 | |
| Florida Power & Light Co.: | |||
| 3.8% 12/15/42 | 750,000 | 890,216 | |
| 5.25% 2/1/41 | 250,000 | 348,028 | |
| Fortis, Inc. 3.055% 10/4/26 | 301,000 | 325,101 | |
| Hydro-Quebec 8.05% 7/7/24 | 1,455,000 | 1,751,805 | |
| InterGen NV 7% 6/30/23 (b) | 230,000 | 227,700 | |
| IPALCO Enterprises, Inc. 3.7% 9/1/24 | 2,644,000 | 2,834,481 | |
| Jersey Central Power & Light Co.: | |||
| 2.75% 3/1/32 (b) | 3,560,000 | 3,702,051 | |
| 4.3% 1/15/26 (b) | 2,000,000 | 2,225,674 | |
| Louisville Gas & Electric Co. 5.125% 11/15/40 | 345,000 | 447,067 | |
| Mong Duong Finance Holdings BV 5.125% 5/7/29 (Reg. S) | 250,000 | 250,438 | |
| NextEra Energy Capital Holdings, Inc.: | |||
| 3 month U.S. LIBOR + 0.270% 0.4008% 2/22/23 (c)(f) | 5,000,000 | 5,000,479 | |
| 2.25% 6/1/30 | 840,000 | 855,837 | |
| 2.75% 11/1/29 | 1,450,000 | 1,530,226 | |
| NextEra Energy Partners LP 4.25% 9/15/24 (b) | 27,000 | 28,418 | |
| Northern States Power Co.: | |||
| 3.6% 9/15/47 | 20,000 | 23,070 | |
| 6.25% 6/1/36 | 370,000 | 541,495 | |
| NRG Energy, Inc.: | |||
| 2% 12/2/25 (b) | 3,120,000 | 3,187,428 | |
| 3.375% 2/15/29 (b) | 45,000 | 45,225 | |
| 3.625% 2/15/31 (b) | 645,000 | 656,288 | |
| 3.875% 2/15/32 (b) | 1,000,000 | 1,013,950 | |
| 5.75% 1/15/28 | 245,000 | 261,844 | |
| 6.625% 1/15/27 | 285,000 | 295,608 | |
| Pacific Gas & Electric Co.: | |||
| 1.75% 6/16/22 | 1,025,000 | 1,024,548 | |
| 3.95% 12/1/47 | 1,225,000 | 1,161,424 | |
| 4.5% 7/1/40 | 445,000 | 449,033 | |
| 4.55% 7/1/30 | 3,080,000 | 3,277,285 | |
| 4.95% 7/1/50 | 785,000 | 830,895 | |
| PacifiCorp: | |||
| 2.9% 6/15/52 | 1,025,000 | 1,023,701 | |
| 5.25% 6/15/35 | 1,375,000 | 1,795,861 | |
| 5.75% 4/1/37 | 900,000 | 1,235,195 | |
| Pattern Energy Operations LP 4.5% 8/15/28 (b) | 90,000 | 94,051 | |
| PECO Energy Co.: | |||
| 2.8% 6/15/50 | 380,000 | 383,756 | |
| 3.9% 3/1/48 | 785,000 | 948,463 | |
| PG&E Corp.: | |||
| 5% 7/1/28 | 1,155,000 | 1,146,338 | |
| 5.25% 7/1/30 | 735,000 | 723,975 | |
| PPL Electric Utilities Corp.: | |||
| 4.125% 6/15/44 | 700,000 | 851,680 | |
| 4.15% 10/1/45 | 555,000 | 680,580 | |
| 6.25% 5/15/39 | 250,000 | 370,623 | |
| PT Perusahaan Listrik Negara 1.875% 11/5/31 (b) | EUR | 1,500,000 | 1,737,695 |
| Public Service Electric & Gas Co.: | |||
| 3.6% 12/1/47 | 410,000 | 468,679 | |
| 3.65% 9/1/28 | 685,000 | 778,513 | |
| 3.65% 9/1/42 | 125,000 | 143,105 | |
| 3.95% 5/1/42 | 405,000 | 481,925 | |
| Puget Sound Energy, Inc. 5.764% 7/15/40 | 285,000 | 394,004 | |
| Southern California Edison Co.: | |||
| 3.5% 10/1/23 | 675,000 | 710,909 | |
| 3.6% 2/1/45 | 2,335,000 | 2,360,249 | |
| 3.9% 12/1/41 | 120,000 | 124,016 | |
| 5.55% 1/15/37 | 430,000 | 533,872 | |
| Tampa Electric Co. 4.45% 6/15/49 | 600,000 | 775,282 | |
| Virginia Electric & Power Co.: | |||
| 6% 1/15/36 | 470,000 | 662,145 | |
| 6% 5/15/37 | 950,000 | 1,342,462 | |
| Vistra Operations Co. LLC: | |||
| 3.7% 1/30/27 (b) | 2,900,000 | 3,077,321 | |
| 4.375% 5/1/29 (b) | 1,000,000 | 1,015,000 | |
| 5% 7/31/27 (b) | 195,000 | 202,332 | |
| 5.5% 9/1/26 (b) | 770,000 | 791,984 | |
| 5.625% 2/15/27 (b) | 5,625,000 | 5,857,369 | |
| Wisconsin Power & Light Co. 4.1% 10/15/44 | 240,000 | 285,400 | |
| Xcel Energy, Inc.: | |||
| 0.5% 10/15/23 | 155,000 | 155,309 | |
| 4% 6/15/28 | 2,700,000 | 3,077,886 | |
| 140,378,325 | |||
| Gas Utilities - 0.0% | |||
| AmeriGas Partners LP/AmeriGas Finance Corp.: | |||
| 5.75% 5/20/27 | 679,000 | 763,875 | |
| 5.875% 8/20/26 | 5,200,000 | 5,850,000 | |
| Atmos Energy Corp. 3.375% 9/15/49 | 520,000 | 573,553 | |
| Nakilat, Inc. 6.067% 12/31/33 (b) | 648,784 | 800,153 | |
| Southern Co. Gas Capital Corp. 4.4% 6/1/43 | 615,000 | 741,569 | |
| 8,729,150 | |||
| Independent Power and Renewable Electricity Producers - 0.1% | |||
| Calpine Corp.: | |||
| 5% 2/1/31 (b) | 3,365,000 | 3,423,888 | |
| 5.125% 3/15/28 (b) | 1,375,000 | 1,399,063 | |
| PSEG Power LLC 3.85% 6/1/23 | 4,175,000 | 4,406,562 | |
| TerraForm Power Operating LLC 5% 1/31/28 (b) | 645,000 | 696,600 | |
| The AES Corp.: | |||
| 3.3% 7/15/25 (b) | 10,697,000 | 11,429,424 | |
| 3.95% 7/15/30 (b) | 9,327,000 | 10,398,672 | |
| 31,754,209 | |||
| Multi-Utilities - 0.1% | |||
| Ameren Illinois Co.: | |||
| 4.15% 3/15/46 | 935,000 | 1,149,701 | |
| 4.5% 3/15/49 | 295,000 | 387,437 | |
| Berkshire Hathaway Energy Co.: | |||
| 3.7% 7/15/30 | 1,280,000 | 1,457,758 | |
| 4.05% 4/15/25 | 16,081,000 | 17,769,566 | |
| 6.125% 4/1/36 | 3,050,000 | 4,291,376 | |
| CenterPoint Energy, Inc. 2.95% 3/1/30 | 150,000 | 159,809 | |
| Consolidated Edison Co. of New York, Inc.: | |||
| 3.7% 11/15/59 | 1,650,000 | 1,798,802 | |
| 3.95% 4/1/50 | 1,808,000 | 2,098,709 | |
| 4.3% 12/1/56 | 300,000 | 365,200 | |
| Dominion Energy, Inc. 7% 6/15/38 | 150,000 | 226,126 | |
| Empresas Publicas de Medellin 4.375% 2/15/31 (Reg. S) | 400,000 | 394,000 | |
| NiSource, Inc.: | |||
| 2.95% 9/1/29 | 11,346,000 | 12,086,988 | |
| 4.8% 2/15/44 | 190,000 | 241,503 | |
| 5.95% 6/15/41 | 640,000 | 909,626 | |
| NorthWestern Energy Corp. 4.176% 11/15/44 | 260,000 | 305,588 | |
| Puget Energy, Inc.: | |||
| 2.379% 6/15/28 (b) | 185,000 | 187,423 | |
| 3.65% 5/15/25 | 324,000 | 348,785 | |
| 4.1% 6/15/30 | 5,059,000 | 5,673,356 | |
| 5.625% 7/15/22 | 4,555,000 | 4,706,183 | |
| 6% 9/1/21 | 4,353,000 | 4,353,000 | |
| San Diego Gas & Electric Co.: | |||
| 3.32% 4/15/50 | 910,000 | 979,851 | |
| 3.6% 9/1/23 | 100,000 | 105,278 | |
| 3.75% 6/1/47 | 710,000 | 806,096 | |
| Sempra Energy 4% 2/1/48 | 715,000 | 808,728 | |
| WEC Energy Group, Inc. 3 month U.S. LIBOR + 2.110% 2.2373% 5/15/67 (c)(f) | 1,012,000 | 950,572 | |
| 62,561,461 | |||
| TOTAL UTILITIES | 243,423,145 | ||
| TOTAL NONCONVERTIBLE BONDS | |||
| (Cost $4,653,081,059) | 4,976,999,441 | ||
| U.S. Government and Government Agency Obligations - 9.1% | |||
| U.S. Government Agency Obligations - 0.1% | |||
| Fannie Mae: | |||
| 0.5% 6/17/25 | $1,685,000 | $1,680,663 | |
| 0.625% 4/22/25 | 1,625,000 | 1,629,363 | |
| 0.75% 10/8/27 | 980,000 | 965,398 | |
| 0.875% 8/5/30 | 705,000 | 675,034 | |
| 1.625% 10/15/24 | 1,295,000 | 1,342,780 | |
| 1.625% 1/7/25 | 705,000 | 732,966 | |
| 1.875% 9/24/26 | 290,000 | 305,389 | |
| 2% 10/5/22 | 430,000 | 438,828 | |
| 2.5% 2/5/24 | 665,000 | 700,764 | |
| 2.875% 9/12/23 | 505,000 | 532,086 | |
| 6.25% 5/15/29 | 255,000 | 348,772 | |
| 6.625% 11/15/30 | 670,000 | 973,156 | |
| Federal Home Loan Bank: | |||
| 3% 10/12/21 | 1,165,000 | 1,168,926 | |
| 3.25% 11/16/28 | 1,815,000 | 2,075,653 | |
| Freddie Mac: | |||
| 0.375% 4/20/23 | 885,000 | 888,998 | |
| 0.375% 5/5/23 | 3,065,000 | 3,075,973 | |
| 6.25% 7/15/32 | 40,000 | 59,351 | |
| Tennessee Valley Authority: | |||
| 0.75% 5/15/25 | 845,000 | 849,215 | |
| 2.875% 2/1/27 | 1,060,000 | 1,168,988 | |
| 5.25% 9/15/39 | 150,000 | 216,408 | |
| 7.125% 5/1/30 | 460,000 | 674,787 | |
| TOTAL U.S. GOVERNMENT AGENCY OBLIGATIONS | 20,503,498 | ||
| U.S. Treasury Inflation-Protected Obligations - 0.0% | |||
| U.S. Treasury Inflation-Indexed Bonds 0.125% 2/15/51 | 6,501,441 | 7,384,915 | |
| U.S. Treasury Obligations - 9.0% | |||
| U.S. Treasury Bills, yield at date of purchase 0.02% to 0.05% 11/4/21 to 2/17/22 | 536,595,000 | 536,511,812 | |
| U.S. Treasury Bonds: | |||
| 1.375% 11/15/40 | 39,605,000 | 36,659,378 | |
| 1.375% 8/15/50 | 82,430,000 | 72,100,491 | |
| 1.625% 11/15/50 | 93,855,000 | 87,325,479 | |
| 1.875% 2/15/41 | 80,090,000 | 80,703,189 | |
| 2% 8/15/51 | 6,703,000 | 6,822,397 | |
| 2.25% 5/15/41 | 69,400,000 | 74,258,000 | |
| 2.375% 5/15/51 | 537,882,000 | 594,023,434 | |
| 2.5% 2/15/46 | 88,210,000 | 98,509,206 | |
| 3% 2/15/47 | 12,460,000 | 15,240,624 | |
| 3.625% 8/15/43 | 33,790,000 | 44,597,520 | |
| 6.25% 8/15/23 | 11,080,000 | 12,384,930 | |
| stripped coupon: | |||
| 0% 2/15/29 | 1,020,000 | 929,134 | |
| 0% 2/15/36 | 1,100,000 | 857,675 | |
| 0% 11/15/36 | 1,975,000 | 1,509,619 | |
| 0% 5/15/39 | 5,425,000 | 3,873,884 | |
| 0% 8/15/39 | 8,745,000 | 6,220,117 | |
| 0% 8/15/40 | 22,665,000 | 15,664,312 | |
| 0% 2/15/41 | 590,000 | 402,773 | |
| 0% 5/15/41 | 27,200,000 | 18,372,099 | |
| 0% 11/15/41 | 850,000 | 564,448 | |
| 0% 5/15/42 | 2,635,000 | 1,732,301 | |
| 0% 8/15/42 | 490,000 | 319,459 | |
| 0% 11/15/42 | 1,280,000 | 828,168 | |
| 0% 5/15/44 | 7,670,000 | 4,819,884 | |
| U.S. Treasury Notes: | |||
| 0.125% 9/30/22 | 340,000 | 340,133 | |
| 0.125% 6/30/23 | 358,990,000 | 358,723,561 | |
| 0.125% 7/31/23 | 179,130,000 | 178,920,081 | |
| 0.125% 8/31/23 | 3,195,000 | 3,189,883 | |
| 0.125% 9/15/23 | 34,020,000 | 33,950,897 | |
| 0.25% 9/30/25 | 60,505,000 | 59,557,246 | |
| 0.375% 8/15/24 | 31,245,000 | 31,220,590 | |
| 0.375% 4/30/25 | 33,015,000 | 32,797,050 | |
| 0.375% 12/31/25 | 25,040,000 | 24,710,372 | |
| 0.5% 3/15/23 | 34,900,000 | 35,093,586 | |
| 0.5% 2/28/26 | 24,520,000 | 24,297,788 | |
| 0.625% 7/31/26 | 148,465,000 | 147,444,303 | |
| 0.75% 3/31/26 | 43,110,000 | 43,163,888 | |
| 0.75% 4/30/26 | 31,945,000 | 31,969,957 | |
| 0.75% 8/31/26 | 86,420,000 | 86,318,726 | |
| 0.875% 6/30/26 | 117,245,000 | 117,895,344 | |
| 0.875% 11/15/30 | 378,700,000 | 365,948,459 | |
| 1.125% 8/31/28 | 11,100,000 | 11,129,484 | |
| 1.125% 2/15/31 | 84,723,000 | 83,584,535 | |
| 1.25% 4/30/28 | 326,095,000 | 330,515,117 | |
| 1.25% 6/30/28 | 8,095,000 | 8,194,923 | |
| 1.25% 8/15/31 | 45,231,000 | 44,997,778 | |
| 1.375% 2/15/23 | 6,950,000 | 7,075,426 | |
| 1.625% 11/15/22 | 42,535,000 | 43,309,270 | |
| 1.625% 4/30/23 | 21,075,000 | 21,588,703 | |
| 1.625% 5/15/31 | 6,044,000 | 6,231,931 | |
| 1.75% 9/30/22 | 15,955,000 | 16,237,329 | |
| 1.875% 4/30/22 | 4,065,000 | 4,113,748 | |
| 1.875% 9/30/22 | 1,213,000 | 1,236,170 | |
| 2% 10/31/22 | 39,230,000 | 40,091,221 | |
| 2% 2/15/25 | 10,415,000 | 10,947,548 | |
| 2% 8/15/25 | 6,760,000 | 7,128,367 | |
| 2.125% 6/30/22 | 10,330,000 | 10,505,933 | |
| 2.125% 7/31/24 | 50,715,000 | 53,282,447 | |
| 2.125% 5/15/25 | 33,680,000 | 35,604,759 | |
| 2.625% 2/15/29 | 47,860,000 | 53,027,384 | |
| 2.875% 5/15/28 | 21,370,000 | 23,924,383 | |
| 3.125% 11/15/28 | 16,555,000 | 18,893,394 | |
| TOTAL U.S. TREASURY OBLIGATIONS | 4,122,392,047 | ||
| Other Government Related - 0.0% | |||
| Private Export Funding Corp. Secured: | |||
| 1.4% 7/15/28 | 2,605,000 | 2,631,160 | |
| 3.55% 1/15/24 | 755,000 | 809,930 | |
| TOTAL OTHER GOVERNMENT RELATED | 3,441,090 | ||
| TOTAL U.S. GOVERNMENT AND GOVERNMENT AGENCY OBLIGATIONS | |||
| (Cost $3,999,741,081) | 4,153,721,550 | ||
| U.S. Government Agency - Mortgage Securities - 9.7% | |||
| Fannie Mae - 2.1% | |||
| 12 month U.S. LIBOR + 1.550% 1.803% 6/1/36 (c)(f) | 2,829 | 2,974 | |
| 12 month U.S. LIBOR + 1.820% 2.2% 2/1/35 (c)(f) | 26,203 | 27,725 | |
| 12 month U.S. LIBOR + 1.950% 2.202% 7/1/37 (c)(f) | 7,841 | 8,334 | |
| 1.5% 9/1/50 to 6/1/51 | 22,474,545 | 22,122,767 | |
| 2% 8/1/31 to 7/1/51 | 92,771,221 | 95,054,518 | |
| 2.5% 6/1/28 to 8/1/51 | 199,153,297 | 208,031,601 | |
| 3% 2/1/27 to 12/1/50 (h)(i)(j) | 274,736,093 | 291,362,804 | |
| 3.5% 5/1/29 to 4/1/50 (h)(i) | 111,944,102 | 120,519,912 | |
| 4% 11/1/31 to 11/1/49 | 90,205,272 | 98,435,527 | |
| 4.5% 6/1/24 to 9/1/49 | 48,266,565 | 53,301,606 | |
| 5% 6/1/24 to 2/1/49 | 31,838,948 | 35,811,636 | |
| 5.261% 8/1/41 (c) | 271,154 | 306,014 | |
| 5.5% 11/1/36 to 1/1/40 | 1,654,230 | 1,924,154 | |
| 6% to 6% 2/1/34 to 1/1/42 (i) | 10,732,501 | 12,635,185 | |
| 6.5% 2/1/36 | 1,324 | 1,570 | |
| 6.612% 2/1/39 (c) | 194,442 | 215,524 | |
| TOTAL FANNIE MAE | 939,761,851 | ||
| Freddie Mac - 1.4% | |||
| 6 month U.S. LIBOR + 2.680% 2.906% 10/1/35 (c)(f) | 3,805 | 4,028 | |
| 1.5% 11/1/50 to 6/1/51 | 5,080,304 | 5,000,234 | |
| 2% 1/1/32 to 7/1/51 | 69,717,398 | 71,175,535 | |
| 2.5% 3/1/28 to 8/1/51 | 142,924,215 | 149,504,368 | |
| 3% 10/1/28 to 8/1/50 | 181,087,934 | 192,394,860 | |
| 3.5% 2/1/29 to 11/1/48 | 122,351,786 | 131,928,689 | |
| 3.5% 8/1/47 | 6,540,454 | 7,031,006 | |
| 4% 6/1/33 to 6/1/48 | 64,676,586 | 70,613,560 | |
| 4.5% 7/1/25 to 12/1/48 | 26,146,148 | 28,913,126 | |
| 5% 10/1/33 to 12/1/47 | 4,971,871 | 5,635,930 | |
| 6% 7/1/37 to 9/1/38 | 136,242 | 161,923 | |
| 6.5% 9/1/39 | 401,076 | 479,306 | |
| TOTAL FREDDIE MAC | 662,842,565 | ||
| Ginnie Mae - 2.2% | |||
| 3.5% 9/20/40 to 11/20/50 | 69,650,092 | 74,649,654 | |
| 4.5% 5/15/39 to 3/20/49 | 19,390,346 | 21,546,889 | |
| 5.5% 6/15/36 to 3/20/41 | 160,448 | 184,329 | |
| 2% 3/20/51 to 7/20/51 | 4,397,873 | 4,494,620 | |
| 2% 9/1/51 (e) | 7,250,000 | 7,403,120 | |
| 2% 9/1/51 (e) | 5,750,000 | 5,871,440 | |
| 2% 9/1/51 (e) | 1,900,000 | 1,940,128 | |
| 2% 9/1/51 (e) | 2,625,000 | 2,680,440 | |
| 2% 9/1/51 (e) | 1,800,000 | 1,838,016 | |
| 2% 9/1/51 (e) | 2,075,000 | 2,118,824 | |
| 2% 9/1/51 (e) | 2,700,000 | 2,757,024 | |
| 2% 9/1/51 (e) | 2,500,000 | 2,552,800 | |
| 2% 9/1/51 (e) | 19,200,000 | 19,605,504 | |
| 2% 9/1/51 (e) | 26,225,000 | 26,778,872 | |
| 2% 9/1/51 (e) | 11,100,000 | 11,334,432 | |
| 2% 9/1/51 (e) | 12,375,000 | 12,636,360 | |
| 2% 9/1/51 (e) | 4,850,000 | 4,952,432 | |
| 2% 9/1/51 (e) | 4,350,000 | 4,441,872 | |
| 2% 9/1/51 (e) | 9,950,000 | 10,160,144 | |
| 2% 9/1/51 (e) | 6,200,000 | 6,330,944 | |
| 2% 9/1/51 (e) | 8,900,000 | 9,087,968 | |
| 2% 9/1/51 (e) | 5,550,000 | 5,667,216 | |
| 2% 10/1/51 (e) | 10,100,000 | 10,295,163 | |
| 2% 10/1/51 (e) | 11,150,000 | 11,365,453 | |
| 2% 10/1/51 (e) | 10,000,000 | 10,193,231 | |
| 2% 10/1/51 (e) | 11,050,000 | 11,263,520 | |
| 2% 10/1/51 (e) | 34,200,000 | 34,860,850 | |
| 2% 10/1/51 (e) | 17,725,000 | 18,067,502 | |
| 2.5% 8/20/46 to 8/20/51 | 90,569,168 | 94,000,517 | |
| 2.5% 9/1/51 (e) | 4,000,000 | 4,147,882 | |
| 2.5% 9/1/51 (e) | 5,300,000 | 5,495,943 | |
| 2.5% 9/1/51 (e) | 3,100,000 | 3,214,608 | |
| 2.5% 9/1/51 (e) | 3,850,000 | 3,992,336 | |
| 2.5% 10/1/51 (e) | 5,500,000 | 5,692,810 | |
| 2.5% 10/1/51 (e) | 26,800,000 | 27,739,509 | |
| 2.5% 10/1/51 (e) | 33,550,000 | 34,726,139 | |
| 2.5% 10/1/51 (e) | 13,225,000 | 13,688,620 | |
| 2.5% 10/1/51 (e) | 22,425,000 | 23,211,138 | |
| 3% 8/20/42 to 6/20/51 | 118,681,038 | 124,646,973 | |
| 3% 9/1/51 (e) | 4,950,000 | 5,174,683 | |
| 3% 9/1/51 (e) | 300,000 | 313,617 | |
| 3% 9/1/51 (e) | 2,800,000 | 2,927,094 | |
| 3% 9/1/51 (e) | 1,500,000 | 1,568,086 | |
| 3% 9/1/51 (e) | 3,100,000 | 3,240,711 | |
| 3% 9/1/51 (e) | 6,950,000 | 7,265,465 | |
| 3% 9/1/51 (e) | 2,200,000 | 2,299,859 | |
| 3% 9/1/51 (e) | 6,950,000 | 7,265,465 | |
| 3% 9/1/51 (e) | 700,000 | 731,773 | |
| 3% 9/1/51 (e) | 800,000 | 836,312 | |
| 3% 9/1/51 (e) | 7,250,000 | 7,579,082 | |
| 3% 9/1/51 (e) | 7,750,000 | 8,101,777 | |
| 3% 9/1/51 (e) | 4,550,000 | 4,756,527 | |
| 3% 9/1/51 (e) | 1,950,000 | 2,038,512 | |
| 3% 9/1/51 (e) | 4,550,000 | 4,756,527 | |
| 3% 9/1/51 (e) | 2,700,000 | 2,822,555 | |
| 3% 9/1/51 (e) | 1,950,000 | 2,038,512 | |
| 3% 9/1/51 (e) | 1,150,000 | 1,202,199 | |
| 3% 9/1/51 (e) | 1,500,000 | 1,568,086 | |
| 3% 9/1/51 (e) | 800,000 | 836,312 | |
| 3% 9/1/51 (e) | 1,000,000 | 1,045,391 | |
| 3% 9/1/51 (e) | 550,000 | 574,965 | |
| 3.5% 9/1/51 (e) | 7,950,000 | 8,365,512 | |
| 3.5% 9/1/51 (e) | 7,950,000 | 8,365,512 | |
| 3.5% 9/1/51 (e) | 5,400,000 | 5,682,234 | |
| 3.5% 9/1/51 (e) | 5,400,000 | 5,682,234 | |
| 3.5% 9/1/51 (e) | 3,200,000 | 3,367,250 | |
| 3.5% 9/1/51 (e) | 2,150,000 | 2,262,371 | |
| 3.5% 9/1/51 (e) | 1,075,000 | 1,131,186 | |
| 3.5% 9/1/51 (e) | 1,600,000 | 1,683,625 | |
| 3.5% 9/1/51 (e) | 8,300,000 | 8,733,804 | |
| 3.5% 9/1/51 (e) | 5,650,000 | 5,945,301 | |
| 3.5% 9/1/51 (e) | 2,350,000 | 2,472,824 | |
| 3.5% 9/1/51 (e) | 3,450,000 | 3,630,316 | |
| 3.5% 9/1/51 (e) | 3,325,000 | 3,498,783 | |
| 3.5% 9/1/51 (e) | 2,250,000 | 2,367,598 | |
| 3.5% 9/1/51 (e) | 3,375,000 | 3,551,396 | |
| 3.5% 9/1/51 (e) | 2,275,000 | 2,393,904 | |
| 3.5% 9/1/51 (e) | 5,300,000 | 5,577,008 | |
| 3.5% 9/1/51 (e) | 4,000,000 | 4,209,062 | |
| 3.5% 9/1/51 (e) | 3,000,000 | 3,156,797 | |
| 3.5% 9/1/51 (e) | 350,000 | 368,293 | |
| 3.5% 9/1/51 (e) | 500,000 | 526,133 | |
| 3.5% 9/1/51 (e) | 2,350,000 | 2,472,824 | |
| 3.5% 9/1/51 (e) | 3,450,000 | 3,630,316 | |
| 3.5% 9/1/51 (e) | 4,600,000 | 4,840,422 | |
| 3.5% 9/1/51 (e) | 6,800,000 | 7,155,406 | |
| 3.5% 9/1/51 (e) | 850,000 | 894,426 | |
| 3.5% 9/1/51 (e) | 550,000 | 578,746 | |
| 3.5% 9/1/51 (e) | 8,450,000 | 8,891,644 | |
| 3.5% 9/1/51 (e) | 5,750,000 | 6,050,527 | |
| 3.5% 9/1/51 (e) | 350,000 | 368,293 | |
| 3.5% 9/1/51 (e) | 500,000 | 526,133 | |
| 3.5% 9/1/51 (e) | 5,050,000 | 5,313,941 | |
| 3.5% 9/1/51 (e) | 3,450,000 | 3,630,316 | |
| 3.5% 9/1/51 (e) | 2,650,000 | 2,788,504 | |
| 3.5% 9/1/51 (e) | 1,800,000 | 1,894,078 | |
| 4% 5/20/40 to 5/20/49 | 90,830,660 | 98,443,306 | |
| 5% 6/20/34 to 6/20/48 | 15,699,761 | 17,305,412 | |
| TOTAL GINNIE MAE | 992,334,169 | ||
| Uniform Mortgage Backed Securities - 4.0% | |||
| 1.5% 9/1/36 (e) | 3,400,000 | 3,453,602 | |
| 1.5% 9/1/36 (e) | 3,700,000 | 3,758,332 | |
| 1.5% 9/1/36 (e) | 2,300,000 | 2,336,260 | |
| 1.5% 9/1/36 (e) | 2,400,000 | 2,437,837 | |
| 1.5% 10/1/36 (e) | 11,525,000 | 11,686,438 | |
| 1.5% 10/1/36 (e) | 13,300,000 | 13,486,301 | |
| 1.5% 10/1/36 (e) | 18,975,000 | 19,240,794 | |
| 1.5% 10/1/36 (e) | 11,800,000 | 11,965,290 | |
| 1.5% 9/1/51 (e) | 4,800,000 | 4,718,178 | |
| 1.5% 9/1/51 (e) | 5,800,000 | 5,701,131 | |
| 1.5% 9/1/51 (e) | 7,100,000 | 6,978,971 | |
| 1.5% 9/1/51 (e) | 3,850,000 | 3,784,372 | |
| 1.5% 9/1/51 (e) | 3,750,000 | 3,686,076 | |
| 1.5% 9/1/51 (e) | 3,900,000 | 3,833,519 | |
| 1.5% 9/1/51 (e) | 3,900,000 | 3,833,519 | |
| 1.5% 9/1/51 (e) | 3,100,000 | 3,047,156 | |
| 1.5% 9/1/51 (e) | 3,300,000 | 3,243,747 | |
| 1.5% 9/1/51 (e) | 3,700,000 | 3,636,929 | |
| 1.5% 9/1/51 (e) | 2,200,000 | 2,162,498 | |
| 1.5% 9/1/51 (e) | 1,100,000 | 1,081,249 | |
| 1.5% 9/1/51 (e) | 3,700,000 | 3,636,929 | |
| 1.5% 9/1/51 (e) | 4,600,000 | 4,521,587 | |
| 1.5% 9/1/51 (e) | 3,300,000 | 3,243,747 | |
| 1.5% 9/1/51 (e) | 3,100,000 | 3,047,156 | |
| 1.5% 9/1/51 (e) | 6,450,000 | 6,340,051 | |
| 1.5% 9/1/51 (e) | 3,850,000 | 3,784,372 | |
| 1.5% 9/1/51 (e) | 2,350,000 | 2,309,941 | |
| 1.5% 9/1/51 (e) | 7,000,000 | 6,880,676 | |
| 1.5% 9/1/51 (e) | 550,000 | 540,625 | |
| 1.5% 9/1/51 (e) | 7,100,000 | 6,978,971 | |
| 1.5% 9/1/51 (e) | 2,650,000 | 2,604,827 | |
| 1.5% 9/1/51 (e) | 1,200,000 | 1,179,544 | |
| 1.5% 9/1/51 (e) | 3,700,000 | 3,636,929 | |
| 1.5% 9/1/51 (e) | 4,550,000 | 4,472,439 | |
| 1.5% 9/1/51 (e) | 450,000 | 442,329 | |
| 1.5% 10/1/51 (e) | 3,900,000 | 3,826,512 | |
| 1.5% 10/1/51 (e) | 3,900,000 | 3,826,512 | |
| 1.5% 10/1/51 (e) | 5,200,000 | 5,102,015 | |
| 1.5% 10/1/51 (e) | 4,600,000 | 4,513,321 | |
| 1.5% 10/1/51 (e) | 3,650,000 | 3,581,222 | |
| 1.5% 10/1/51 (e) | 3,550,000 | 3,483,107 | |
| 1.5% 10/1/51 (e) | 3,450,000 | 3,384,991 | |
| 1.5% 10/1/51 (e) | 3,600,000 | 3,532,164 | |
| 2% 10/1/36 (e) | 8,025,000 | 8,292,320 | |
| 2% 10/1/36 (e) | 7,950,000 | 8,214,822 | |
| 2% 10/1/36 (e) | 7,550,000 | 7,801,497 | |
| 2% 10/1/36 (e) | 13,050,000 | 13,484,707 | |
| 2% 10/1/36 (e) | 9,700,000 | 10,023,116 | |
| 2% 10/1/36 (e) | 7,075,000 | 7,310,675 | |
| 2% 9/1/51 (e) | 14,050,000 | 14,250,106 | |
| 2% 9/1/51 (e) | 2,600,000 | 2,637,030 | |
| 2% 9/1/51 (e) | 1,200,000 | 1,217,091 | |
| 2% 9/1/51 (e) | 1,600,000 | 1,622,788 | |
| 2% 9/1/51 (e) | 750,000 | 760,682 | |
| 2% 9/1/51 (e) | 14,300,000 | 14,503,666 | |
| 2% 9/1/51 (e) | 750,000 | 760,682 | |
| 2% 9/1/51 (e) | 1,600,000 | 1,622,788 | |
| 2% 9/1/51 (e) | 2,800,000 | 2,839,879 | |
| 2% 9/1/51 (e) | 2,000,000 | 2,028,485 | |
| 2% 9/1/51 (e) | 12,500,000 | 12,678,030 | |
| 2% 9/1/51 (e) | 14,900,000 | 15,112,212 | |
| 2% 9/1/51 (e) | 14,150,000 | 14,351,530 | |
| 2% 9/1/51 (e) | 16,000,000 | 16,227,878 | |
| 2% 9/1/51 (e) | 13,300,000 | 13,489,424 | |
| 2% 9/1/51 (e) | 15,050,000 | 15,264,348 | |
| 2% 9/1/51 (e) | 7,325,000 | 7,429,326 | |
| 2% 9/1/51 (e) | 13,300,000 | 13,489,424 | |
| 2% 9/1/51 (e) | 16,000,000 | 16,227,878 | |
| 2% 9/1/51 (e) | 14,200,000 | 14,402,242 | |
| 2% 9/1/51 (e) | 16,575,000 | 16,811,068 | |
| 2% 9/1/51 (e) | 8,925,000 | 9,052,113 | |
| 2% 9/1/51 (e) | 11,550,000 | 11,714,500 | |
| 2% 9/1/51 (e) | 950,000 | 963,530 | |
| 2% 9/1/51 (e) | 9,750,000 | 9,888,863 | |
| 2% 9/1/51 (e) | 13,675,000 | 13,869,765 | |
| 2% 9/1/51 (e) | 7,200,000 | 7,302,545 | |
| 2% 9/1/51 (e) | 6,550,000 | 6,643,288 | |
| 2% 9/1/51 (e) | 5,850,000 | 5,933,318 | |
| 2% 9/1/51 (e) | 12,850,000 | 13,033,015 | |
| 2% 9/1/51 (e) | 14,100,000 | 14,300,818 | |
| 2% 9/1/51 (e) | 12,200,000 | 12,373,757 | |
| 2% 9/1/51 (e) | 2,700,000 | 2,738,454 | |
| 2% 9/1/51 (e) | 15,300,000 | 15,517,909 | |
| 2% 9/1/51 (e) | 13,550,000 | 13,742,985 | |
| 2% 9/1/51 (e) | 4,600,000 | 4,665,515 | |
| 2% 9/1/51 (e) | 13,075,000 | 13,261,219 | |
| 2% 9/1/51 (e) | 8,450,000 | 8,570,348 | |
| 2% 9/1/51 (e) | 5,850,000 | 5,933,318 | |
| 2% 9/1/51 (e) | 14,775,000 | 14,985,431 | |
| 2% 9/1/51 (e) | 7,300,000 | 7,403,970 | |
| 2% 9/1/51 (e) | 6,525,000 | 6,617,932 | |
| 2% 9/1/51 (e) | 8,250,000 | 8,367,500 | |
| 2% 9/1/51 (e) | 7,375,000 | 7,480,038 | |
| 2% 9/1/51(e) | 4,550,000 | 4,614,803 | |
| 2% 9/1/51 (e) | 8,400,000 | 8,519,636 | |
| 2% 9/1/51 (e) | 5,650,000 | 5,730,470 | |
| 2% 10/1/51 (e) | 24,050,000 | 24,347,436 | |
| 2% 10/1/51 (e) | 14,050,000 | 14,223,762 | |
| 2% 10/1/51 (e) | 6,450,000 | 6,529,770 | |
| 2% 10/1/51 (e) | 8,600,000 | 8,706,360 | |
| 2% 10/1/51 (e) | 14,300,000 | 14,476,854 | |
| 2% 10/1/51 (e) | 23,300,000 | 23,588,160 | |
| 2% 10/1/51 (e) | 25,200,000 | 25,511,658 | |
| 2% 10/1/51 (e) | 9,750,000 | 9,870,582 | |
| 2% 10/1/51 (e) | 7,200,000 | 7,289,045 | |
| 2% 10/1/51 (e) | 7,200,000 | 7,289,045 | |
| 2% 10/1/51 (e) | 13,900,000 | 14,071,907 | |
| 2% 10/1/51 (e) | 6,950,000 | 7,035,953 | |
| 2% 10/1/51 (e) | 14,200,000 | 14,375,617 | |
| 2% 10/1/51 (e) | 6,950,000 | 7,035,953 | |
| 2% 10/1/51 (e) | 12,850,000 | 13,008,921 | |
| 2% 10/1/51 (e) | 12,950,000 | 13,110,158 | |
| 2% 10/1/51 (e) | 25,850,000 | 26,169,697 | |
| 2% 10/1/51 (e) | 17,675,000 | 17,893,594 | |
| 2% 10/1/51 (e) | 50,900,000 | 51,529,501 | |
| 2% 10/1/51 (e) | 15,050,000 | 15,236,129 | |
| 2% 10/1/51 (e) | 14,750,000 | 14,932,419 | |
| 2% 10/1/51 (e) | 24,200,000 | 24,499,291 | |
| 2% 10/1/51 (e) | 14,300,000 | 14,476,854 | |
| 2% 10/1/51 (e) | 14,200,000 | 14,375,617 | |
| 2% 10/1/51 (e) | 24,750,000 | 25,056,093 | |
| 2% 10/1/51 (e) | 14,050,000 | 14,223,762 | |
| 2% 10/1/51 (e) | 13,950,000 | 14,122,525 | |
| 2.5% 9/1/51 (e) | 6,300,000 | 6,544,126 | |
| 2.5% 9/1/51 (e) | 6,700,000 | 6,959,626 | |
| 2.5% 9/1/51 (e) | 375,000 | 389,531 | |
| 2.5% 9/1/51 (e) | 7,500,000 | 7,790,627 | |
| 2.5% 9/1/51 (e) | 7,100,000 | 7,375,126 | |
| 2.5% 9/1/51 (e) | 4,100,000 | 4,258,876 | |
| 2.5% 9/1/51 (e) | 100,000 | 103,875 | |
| 2.5% 9/1/51 (e) | 3,700,000 | 3,843,376 | |
| 2.5% 9/1/51 (e) | 5,100,000 | 5,297,626 | |
| 2.5% 9/1/51 (e) | 2,000,000 | 2,077,500 | |
| 2.5% 9/1/51 (e) | 4,875,000 | 5,063,907 | |
| 2.5% 9/1/51 (e) | 12,225,000 | 12,698,721 | |
| 2.5% 9/1/51 (e) | 18,950,000 | 19,684,316 | |
| 2.5% 9/1/51 (e) | 1,475,000 | 1,532,157 | |
| 2.5% 9/1/51 (e) | 15,250,000 | 15,840,941 | |
| 2.5% 9/1/51 (e) | 16,550,000 | 17,191,316 | |
| 2.5% 9/1/51 (e) | 6,500,000 | 6,751,876 | |
| 2.5% 9/1/51 (e) | 19,025,000 | 19,762,223 | |
| 2.5% 9/1/51 (e) | 1,450,000 | 1,506,188 | |
| 2.5% 9/1/51 (e) | 2,400,000 | 2,493,000 | |
| 2.5% 9/1/51 (e) | 1,000,000 | 1,038,750 | |
| 2.5% 9/1/51 (e) | 7,250,000 | 7,530,939 | |
| 2.5% 9/1/51 (e) | 3,450,000 | 3,583,688 | |
| 2.5% 9/1/51 (e) | 2,100,000 | 2,181,375 | |
| 2.5% 9/1/51 (e) | 450,000 | 467,438 | |
| 2.5% 10/1/51 (e) | 13,675,000 | 14,177,132 | |
| 2.5% 10/1/51 (e) | 17,425,000 | 18,064,829 | |
| 2.5% 10/1/51 (e) | 10,500,000 | 10,885,550 | |
| 2.5% 10/1/51 (e) | 11,350,000 | 11,766,761 | |
| 2.5% 10/1/51 (e) | 10,550,000 | 10,937,385 | |
| 2.5% 10/1/51 (e) | 18,300,000 | 18,971,958 | |
| 2.5% 10/1/51 (e) | 2,925,000 | 3,032,403 | |
| 2.5% 10/1/51 (e) | 16,275,000 | 16,872,602 | |
| 2.5% 10/1/51 (e) | 12,775,000 | 13,244,085 | |
| 2.5% 10/1/51 (e) | 22,375,000 | 23,196,588 | |
| 2.5% 10/1/51 (e) | 8,075,000 | 8,371,506 | |
| 2.5% 10/1/51 (e) | 7,775,000 | 8,060,490 | |
| 2.5% 10/1/51 (e) | 12,700,000 | 13,166,331 | |
| 2.5% 10/1/51 (e) | 11,750,000 | 12,181,448 | |
| 2.5% 10/1/51 (e) | 5,500,000 | 5,701,955 | |
| 2.5% 10/1/51 (e) | 14,650,000 | 15,187,933 | |
| 2.5% 10/1/51 (e) | 18,200,000 | 18,868,286 | |
| 2.5% 10/1/51 (e) | 12,050,000 | 12,492,464 | |
| 2.5% 10/1/51 (e) | 6,100,000 | 6,323,986 | |
| 3% 9/1/51 (e) | 13,650,000 | 14,278,113 | |
| 3% 9/1/51 (e) | 13,650,000 | 14,278,113 | |
| 3% 9/1/51 (e) | 4,100,000 | 4,288,664 | |
| 3% 9/1/51 (e) | 6,400,000 | 6,694,500 | |
| 3% 9/1/51 (e) | 400,000 | 418,406 | |
| 3% 9/1/51 (e) | 4,650,000 | 4,863,973 | |
| 3% 9/1/51 (e) | 2,150,000 | 2,248,934 | |
| 3% 9/1/51 (e) | 2,750,000 | 2,876,543 | |
| 3% 9/1/51 (e) | 1,300,000 | 1,359,820 | |
| 3% 9/1/51 (e) | 1,300,000 | 1,359,820 | |
| 3% 9/1/51 (e) | 2,750,000 | 2,876,543 | |
| 3% 9/1/51 (e) | 6,950,000 | 7,269,808 | |
| 3% 9/1/51 (e) | 7,750,000 | 8,106,621 | |
| 3% 9/1/51 (e) | 5,800,000 | 6,066,890 | |
| 3% 9/1/51 (e) | 7,550,000 | 7,897,418 | |
| 3% 9/1/51 (e) | 10,350,000 | 10,826,261 | |
| 3% 9/1/51 (e) | 1,950,000 | 2,039,730 | |
| 3% 9/1/51 (e) | 1,300,000 | 1,359,820 | |
| 3% 9/1/51 (e) | 5,200,000 | 5,439,281 | |
| 3% 9/1/51 (e) | 3,000,000 | 3,138,047 | |
| 3% 9/1/51 (e) | 2,750,000 | 2,876,543 | |
| 3% 9/1/51 (e) | 10,500,000 | 10,983,164 | |
| 3% 9/1/51 (e) | 8,350,000 | 8,734,230 | |
| 3% 9/1/51 (e) | 2,500,000 | 2,615,039 | |
| 3% 9/1/51 (e) | 7,000,000 | 7,322,109 | |
| 3% 9/1/51 (e) | 2,000,000 | 2,092,031 | |
| 3% 9/1/51 (e) | 1,000,000 | 1,046,016 | |
| 3% 9/1/51 (e) | 2,500,000 | 2,615,039 | |
| 3% 9/1/51 (e) | 7,100,000 | 7,426,711 | |
| 3% 9/1/51 (e) | 5,100,000 | 5,334,680 | |
| 3% 9/1/51 (e) | 2,350,000 | 2,458,137 | |
| 3% 9/1/51 (e) | 2,500,000 | 2,615,039 | |
| 3% 9/1/51 (e) | 4,100,000 | 4,288,664 | |
| 3% 9/1/51 (e) | 2,950,000 | 3,085,746 | |
| 3% 9/1/51 (e) | 3,000,000 | 3,138,047 | |
| 3% 9/1/51 (e) | 7,100,000 | 7,426,711 | |
| 3% 9/1/51 (e) | 6,500,000 | 6,799,101 | |
| 3% 9/1/51 (e) | 10,850,000 | 11,349,269 | |
| 3% 9/1/51 (e) | 2,150,000 | 2,248,934 | |
| 3% 9/1/51 (e) | 2,750,000 | 2,876,543 | |
| 3% 9/1/51 (e) | 2,750,000 | 2,876,543 | |
| 3% 9/1/51 (e) | 2,950,000 | 3,085,746 | |
| 3% 9/1/51 (e) | 4,700,000 | 4,916,273 | |
| 3% 10/1/51 (e) | 7,550,000 | 7,893,289 | |
| 3% 10/1/51 (e) | 5,800,000 | 6,063,719 | |
| 3% 10/1/51 (e) | 7,550,000 | 7,893,289 | |
| 3% 10/1/51 (e) | 5,800,000 | 6,063,719 | |
| 3.5% 9/1/51 (e) | 2,900,000 | 3,067,656 | |
| 3.5% 9/1/51 (e) | 300,000 | 317,344 | |
| 3.5% 9/1/51 (e) | 2,500,000 | 2,644,531 | |
| 3.5% 9/1/51 (e) | 1,250,000 | 1,322,266 | |
| 3.5% 9/1/51 (e) | 100,000 | 105,781 | |
| 3.5% 9/1/51 (e) | 5,300,000 | 5,606,406 | |
| 3.5% 9/1/51 (e) | 6,400,000 | 6,770,000 | |
| 3.5% 9/1/51 (e) | 14,250,000 | 15,073,828 | |
| 3.5% 9/1/51 (e) | 6,750,000 | 7,140,234 | |
| 3.5% 9/1/51 (e) | 7,450,000 | 7,880,703 | |
| 3.5% 9/1/51 (e) | 3,500,000 | 3,702,344 | |
| 3.5% 9/1/51 (e) | 5,800,000 | 6,135,313 | |
| 3.5% 9/1/51 (e) | 2,750,000 | 2,908,984 | |
| 3.5% 10/1/51 (e) | 7,750,000 | 8,202,588 | |
| 3.5% 10/1/51 (e) | 3,600,000 | 3,810,234 | |
| TOTAL UNIFORM MORTGAGE BACKED SECURITIES | 1,849,978,227 | ||
| TOTAL U.S. GOVERNMENT AGENCY - MORTGAGE SECURITIES | |||
| (Cost $4,399,882,065) | 4,444,916,812 | ||
| Asset-Backed Securities - 2.2% | |||
| AASET Trust: | |||
| Series 2018-1A Class A, 3.844% 1/16/38 (b) | $2,906,485 | $2,855,867 | |
| Series 2019-1 Class A, 3.844% 5/15/39 (b) | 4,511,403 | 4,468,103 | |
| Series 2019-2: | |||
| Class A, 3.376% 10/16/39 (b) | 7,327,458 | 7,156,156 | |
| Class B, 4.458% 10/16/39 (b) | 1,333,003 | 1,108,581 | |
| Accredited Mortgage Loan Trust Series 2006-1 Class M1, 1 month U.S. LIBOR + 0.330% 0.5843% 4/25/36 (c)(f) | 2,414,000 | 2,295,377 | |
| Aegis Asset Backed Securities Trust Series 2005-5 Class M1, 1 month U.S. LIBOR + 0.640% 0.7294% 12/25/35 (f) | 11,165,000 | 11,111,816 | |
| Affirm, Inc. Series 2021-A Class A, 0.88% 8/15/25 (b) | 2,207,000 | 2,211,376 | |
| AIG CLO LLC Series 2021-1A Class A1R, 3 month U.S. LIBOR + 1.120% 1.2543% 4/20/32 (b)(c)(f) | 7,500,000 | 7,502,865 | |
| AIMCO CLO Ltd. Series 2020-11A Class A1, 3 month U.S. LIBOR + 1.380% 1.5061% 10/15/31 (b)(c)(f) | 5,211,000 | 5,215,085 | |
| Allegany Park CLO, Ltd. / Allegany Series 2020-1A Class A, 3 month U.S. LIBOR + 1.330% 1.4643% 1/20/33 (b)(c)(f) | 3,880,000 | 3,884,714 | |
| Allegro CLO X, Ltd. / Allegro CLO X LLC Series 2021-1A Class AR, 3 month U.S. LIBOR + 1.150% 1.3383% 7/20/32 (b)(c)(f) | 16,000,000 | 16,009,728 | |
| Allegro CLO, Ltd. Series 2021-1A Class A, 3 month U.S. LIBOR + 1.140% 1.2907% 7/20/34 (b)(c)(f) | 4,673,000 | 4,676,505 | |
| Ameriquest Mortgage Securities, Inc. Series 2004-R10 Class M3, 1 month U.S. LIBOR + 1.200% 1.2844% 11/25/34 (c)(f) | 3,108,480 | 3,118,471 | |
| Anchorage Capital CLO 17, Ltd. Series 2021-17A Class A1, 3 month U.S. LIBOR + 1.170% 1.3197% 7/15/34 (b)(c)(f) | 10,500,000 | 10,507,739 | |
| Apollo Aviation Securitization Equity Trust Series 2020-1A: | |||
| Class A, 3.351% 1/16/40 (b) | 3,554,780 | 3,523,233 | |
| Class B, 4.335% 1/16/40 (b) | 609,253 | 436,946 | |
| Ares CLO Series 2019-54A Class A, 3 month U.S. LIBOR + 1.320% 1.4461% 10/15/32 (b)(c)(f) | 7,102,000 | 7,104,905 | |
| Ares LV CLO Ltd. Series 2021-55A Class A1R, 3 month U.S. LIBOR + 1.130% 1.2561% 7/15/34 (b)(c)(f) | 5,889,000 | 5,895,613 | |
| Ares XXXIV CLO Ltd. Series 2020-2A Class AR2, 3 month U.S. LIBOR + 1.250% 1.3839% 4/17/33 (b)(c)(f) | 15,169,000 | 15,193,058 | |
| Argent Securities, Inc. pass-thru certificates Series 2005-W5 Class A2D, 1 month U.S. LIBOR + 0.640% 0.7244% 1/25/36 (c)(f) | 2,935,474 | 2,854,641 | |
| Atlas Senior Loan Fund XVI, Ltd. / Atlas Senior Loan Fund XVI LLC Series 2021-16A Class A, 3 month U.S. LIBOR + 1.270% 1.4043% 1/20/34 (b)(c)(f) | 2,000,000 | 2,002,780 | |
| Babson CLO Ltd./Cayman Islands Series 2020-1A Class A1, 3 month U.S. LIBOR + 1.400% 1.5261% 10/15/32 (b)(c)(f) | 8,259,000 | 8,263,410 | |
| Battalion CLO X Ltd. / Battalion CLO X LLC Series 2021-10A Class A1R2, 3 month U.S. LIBOR + 1.170% 1.2953% 1/25/35 (b)(c)(f) | 12,000,000 | 12,006,708 | |
| Battalion CLO XI Ltd. / Battalion CLO XI LLC Series 2021-11A Class AR, 3 month U.S. LIBOR + 1.150% 1.2753% 4/24/34 (b)(c)(f) | 22,750,000 | 22,776,208 | |
| Beechwood Park CLO Ltd. Series 2019-1A Class A1, 3 month U.S. LIBOR + 1.330% 1.4639% 1/17/33 (b)(c)(f) | 3,340,000 | 3,345,040 | |
| Bellemeade Re Ltd.: | |||
| Series 2019-4A Class M1A, 1 month U.S. LIBOR + 1.400% 1.4844% 10/25/29 (b)(c)(f) | 3,882,508 | 3,902,123 | |
| Series 2021-1A: | |||
| Class M1A, U.S. 30-Day Avg. Secured Overnight Fin. Rate (SOFR) Indx + 1.750% 1.8% 3/25/31 (b)(c)(f) | 4,850,000 | 4,876,475 | |
| Class M1C, U.S. 30-Day Avg. Secured Overnight Fin. Rate (SOFR) Indx + 2.950% 3% 3/25/31 (b)(c)(f) | 2,140,000 | 2,224,970 | |
| Blackbird Capital Aircraft: | |||
| Series 2016-1A: | |||
| Class A, 4.213% 12/16/41 (b) | 7,818,989 | 7,875,125 | |
| Class AA, 2.487% 12/16/41 (b)(c) | 1,180,031 | 1,187,953 | |
| Series 2021-1A Class A, 2.443% 7/15/46 (b) | 8,545,261 | 8,618,724 | |
| BlackRock Rainier CLO VI, Ltd. / BlackRock Rainier CLO VI LLC Series 2021-6A Class A, 3 month U.S. LIBOR + 1.700% 1.8343% 4/20/33 (b)(c)(f) | 8,500,000 | 8,506,877 | |
| BlueMountain CLO XXVIII, Ltd. / BlueMountain CLO XXVIII LLC Series 2021-28A Class A, 3 month U.S. LIBOR + 1.260% 1.3861% 4/15/34 (b)(c)(f) | 3,000,000 | 3,003,411 | |
| Bristol Park CLO, Ltd. Series 2020-1A Class AR, 3 month U.S. LIBOR + 0.990% 1.1161% 4/15/29 (b)(c)(f) | 8,338,000 | 8,324,017 | |
| CarMax Auto Owner Trust Series 2021-1 Class D, 1.28% 7/15/27 | 200,000 | 199,657 | |
| Carrington Mortgage Loan Trust Series 2005-FRE1: | |||
| Class M1, 1 month U.S. LIBOR + 0.700% 0.7894% 12/25/35 (c)(f) | 3,535,607 | 3,509,721 | |
| Class M2, 1 month U.S. LIBOR + 0.730% 0.8194% 12/25/35 (f) | 10,000,000 | 9,496,336 | |
| Cascade Funding Mortgage Trust Series 2021-HB6 Class A, 0.8983% 6/25/36 (b) | 4,934,430 | 4,935,794 | |
| Castlelake Aircraft Securitization Trust Series 2019-1A: | |||
| Class A, 3.967% 4/15/39 (b) | 6,733,413 | 6,736,893 | |
| Class B, 5.095% 4/15/39 (b) | 2,927,377 | 2,811,274 | |
| Castlelake Aircraft Structured Trust Series 2018-1 Class A, 4.125% 6/15/43 (b) | 6,199,274 | 6,196,251 | |
| Cedar Funding Ltd. Series 2019-10A Class A, 3 month U.S. LIBOR + 1.340% 1.4743% 10/20/32 (b)(c)(f) | 5,957,000 | 5,962,439 | |
| Cedar Funding XII CLO Ltd. / Cedar Funding XII CLO LLC Series 2020-12A Class A, 3 month U.S. LIBOR + 1.270% 1.3953% 10/25/32 (b)(c)(f) | 3,330,000 | 3,330,649 | |
| Cent CLO Ltd. / Cent CLO Series 2020-29A Class A1N, 3 month U.S. LIBOR + 1.700% 1.8343% 7/20/31 (b)(c)(f) | 6,998,000 | 7,017,503 | |
| Citi Mortgage Loan Trust Series 2007-1 Class 1A, 1 month U.S. LIBOR + 1.350% 1.4344% 10/25/37 (b)(c)(f) | 1,575,649 | 1,589,495 | |
| Citibank Credit Card Issuance Trust: | |||
| Series 2018-A3 Class A3, 3.29% 5/23/25 | 700,000 | 736,377 | |
| Series 2018-A7 Class A7, 3.96% 10/13/30 | 2,100,000 | 2,471,009 | |
| Consumer Loan Underlying Bond Credit Trust Series 2019-HP1 Class A, 2.59% 12/15/26 (b) | 2,208,700 | 2,224,436 | |
| CoreVest American Finance Trust Series 2020-2 Class B, 4.244% 5/15/52 (b) | 3,200,000 | 3,537,909 | |
| Crestline Denali CLO XVII, LLC Series 2018-1A Class AR, 3 month U.S. LIBOR + 1.060% 1.1861% 10/15/31 (b)(c)(f) | 25,000,000 | 25,001,500 | |
| DB Master Finance LLC Series 2017-1A: | |||
| Class A2I, 3.629% 11/20/47 (b) | 4,174,590 | 4,202,309 | |
| Class A2II, 4.03% 11/20/47 (b) | 7,056,080 | 7,488,124 | |
| Dryden CLO, Ltd. Series 2019-76A Class A1, 3 month U.S. LIBOR + 1.330% 1.4643% 10/20/32 (b)(c)(f) | 7,395,000 | 7,400,006 | |
| Dryden CLO, Ltd. / Dryden CLO, LLC Series 2020-85A Class A1, 3 month U.S. LIBOR + 1.350% 1.4761% 10/15/32 (b)(c)(f) | 5,609,000 | 5,611,434 | |
| Dryden Senior Loan Fund: | |||
| Series 2020-78A Class A, 3 month U.S. LIBOR + 1.180% 1.3139% 4/17/33 (b)(c)(f) | 5,400,000 | 5,405,135 | |
| Series 2021-72A Class BR, 3 month U.S. LIBOR + 1.600% 1.8059% 5/15/32 (b)(c)(f) | 6,000,000 | 6,002,964 | |
| Eaton Vance CLO, Ltd.: | |||
| Series 2020-1A Class A, 3 month U.S. LIBOR + 1.650% 1.7761% 10/15/30 (b)(c)(f) | 6,500,000 | 6,500,000 | |
| Series 2020-2A Class A1, 3 month U.S. LIBOR + 1.370% 1.4961% 10/15/32 (b)(c)(f) | 5,900,000 | 5,906,154 | |
| Eaton Vance CLO, Ltd. / Eaton Vance CLO LLC Series 2021-1A Class A13R, 3 month U.S. LIBOR + 1.250% 1.3761% 1/15/34 (b)(c)(f) | 7,240,000 | 7,246,994 | |
| EFS Volunteer No. 2 LLC Series 2012-1 Class A2, 1 month U.S. LIBOR + 1.350% 1.4344% 3/25/36 (b)(c)(f) | 1,183,829 | 1,210,690 | |
| Elevation CLO, Ltd. Series 2021-13A Class A1, 3 month U.S. LIBOR + 1.190% 1.3396% 7/15/34 (b)(c)(f) | 8,500,000 | 8,503,077 | |
| Elmwood CLO II Ltd. Series 2021-2A Class AR, 3 month U.S. LIBOR + 1.150% 1.2843% 4/20/34 (b)(c)(f) | 35,000,000 | 35,040,040 | |
| Encore Credit Receivables Trust Series 2005-4 Class M4, 1 month U.S. LIBOR + 0.900% 0.9844% 1/25/36 (c)(f) | 4,800,000 | 4,762,952 | |
| Enterprise Fleet Financing LLC Series 2021-1 Class A2, 0.44% 12/21/26 (b) | 6,174,000 | 6,182,213 | |
| Finance of America HECM Buyout Series 2021-HB1 Class A, 0.8754% 2/25/31 (b)(c) | 3,859,596 | 3,859,533 | |
| Flatiron CLO Ltd.: | |||
| Series 2019-1A Class A, 3 month U.S. LIBOR + 1.320% 1.4448% 11/16/32 (b)(c)(f) | 7,901,000 | 7,906,720 | |
| Series 2021-1A Class A1, 3 month U.S. LIBOR + 1.110% 1.2613% 7/19/34 (b)(c)(f) | 4,210,000 | 4,214,113 | |
| Flatiron CLO Ltd. / Flatiron CLO LLC Series 2020-1A Class A, 3 month U.S. LIBOR + 1.300% 1.4309% 11/20/33 (b)(c)(f) | 5,700,000 | 5,709,103 | |
| Ford Credit Auto Owner Trust Series 2021-1 Class C, 1.91% 10/17/33 (b) | 1,190,000 | 1,200,146 | |
| Greywolf CLO II, Ltd. Series 2021-1A Class A1SR, 3 month U.S. LIBOR + 1.140% 1.2661% 4/15/34 (b)(c)(f) | 35,000,000 | 35,034,125 | |
| Henley CLO IV DAC Series 2021-4A Class A, 3 month EURIBOR + 0.900% 0.9% 4/25/34 (b)(c)(f) | EUR | 2,000,000 | 2,356,236 |
| Home Re, Ltd.: | |||
| Series 2021-1: | |||
| Class M1A, 1 month U.S. LIBOR + 1.050% 1.1344% 7/25/33 (b)(c)(f) | 305,000 | 303,870 | |
| Class M1B, 1 month U.S. LIBOR + 1.550% 1.6344% 7/25/33 (b)(c)(f) | 165,000 | 164,288 | |
| Class M1C, 1 month U.S. LIBOR + 2.300% 2.3844% 7/25/33 (b)(c)(f) | 745,000 | 740,242 | |
| Series 2021-2: | |||
| Class M1B, U.S. 30-Day Avg. Secured Overnight Fin. Rate (SOFR) Indx + 1.600% 1.65% 1/25/34 (b)(c)(f) | 665,000 | 665,446 | |
| Class M1C, U.S. 30-Day Avg. Secured Overnight Fin. Rate (SOFR) Indx + 2.800% 2.85% 1/25/34 (b)(c)(f) | 990,000 | 991,400 | |
| Horizon Aircraft Finance I Ltd. Series 2018-1 Class A, 4.458% 12/15/38 (b) | 3,482,159 | 3,540,904 | |
| Horizon Aircraft Finance Ltd. Series 2019-1 Class A, 3.721% 7/15/39 (b) | 4,108,668 | 4,110,277 | |
| HSI Asset Securitization Corp. Trust Series 2007-HE1 Class 1A1, 1 month U.S. LIBOR + 0.140% 0.2244% 1/25/37 (c)(f) | 2,975,873 | 2,619,923 | |
| Invesco Euro CLO I DAC Series 2021-1A Class A1R, 3 month EURIBOR + 0.650% 0.65% 7/15/31 (b)(c)(f) | EUR | 10,000,000 | 11,753,894 |
| JMP Credit Advisors CLO IV, Ltd. / JMP Credit Advisors CLO IV LLC Series 2019-1A Class AR, 3 month U.S. LIBOR + 1.280% 1.4139% 7/17/29 (b)(c)(f) | 1,970,236 | 1,970,465 | |
| JPMorgan Chase Bank NA - CACLN Series 2021-2 Class E, 2.28% 12/26/28 (b) | 1,100,000 | 1,100,686 | |
| KKR Financial CLO Ltd. Series 2021-33A Class A, 3 month U.S. LIBOR + 1.170% 1.2728% 7/20/34 (b)(c)(f) | 13,000,000 | 13,017,082 | |
| Lanark Master Issuer PLC Series 2020-1A Class 1A, 2.277% 12/22/69 (b)(c) | 6,383,000 | 6,523,662 | |
| LCM XXIV Ltd. / LCM XXIV LLC Series 2021-24A Class AR, 3 month U.S. LIBOR + 0.980% 1.1143% 3/20/30 (b)(c)(f) | 7,500,000 | 7,502,168 | |
| Lendmark Funding Trust Series 2021-1A: | |||
| Class A, 1.9% 11/20/31 (b) | 4,200,000 | 4,262,931 | |
| Class B, 2.47% 11/20/31 (b) | 150,000 | 152,553 | |
| Logan CLO I, Ltd. / Logan CLO I LLC Series 2021-1A Class A, 3 month U.S. LIBOR + 1.160% 1.3125% 7/20/34 (b)(c)(f) | 12,500,000 | 12,506,863 | |
| Madison Park Funding Ltd. Series 2021-10A Class AR3, 3 month U.S. LIBOR + 1.010% 1.1443% 1/20/29 (b)(c)(f) | 2,949,048 | 2,949,818 | |
| Madison Park Funding XLV Ltd./Madison Park Funding XLV LLC Series 2021-45A Class AR, 3 month U.S. LIBOR + 1.120% 1.2461% 7/15/34 (b)(c)(f) | 4,233,000 | 4,234,575 | |
| Madison Park Funding XVII, Ltd. Series 2021-17A Class AR2, 3 month U.S. LIBOR + 1.000% 1.1343% 7/21/30 (b)(c)(f) | 7,000,000 | 6,999,979 | |
| Madison Park Funding XXXIII Ltd. Series 2019-33A Class A, 3 month U.S. LIBOR + 1.330% 1.4561% 10/15/32 (b)(c)(f) | 3,846,000 | 3,853,746 | |
| Madison Park Funding XXXIV, Ltd. Series 2021-34A Class AR, 3 month U.S. LIBOR + 1.200% 1.2453% 4/25/32 (b)(c)(f) | 20,000,000 | 20,016,980 | |
| Madison Park Funding XXXVIII, Ltd. Series 2021-38A Class A, 3 month U.S. LIBOR + 1.120% 1.2543% 7/17/34 (b)(c)(f) | 12,500,000 | 12,509,225 | |
| Magnetite CLO Ltd. Series 2021-27A Class AR, 3 month U.S. LIBOR + 1.140% 0% 10/20/34 (b)(c)(f) | 1,417,000 | 1,417,000 | |
| Magnetite VII Ltd. Series 2018-7A Class A1R2, 3 month U.S. LIBOR + 0.800% 0.9261% 1/15/28 (b)(c)(f) | 6,883,606 | 6,887,640 | |
| Magnetite XXI Ltd. Series 2019-24A Class A, 3 month U.S. LIBOR + 1.330% 1.4561% 1/15/33 (b)(c)(f) | 17,576,000 | 17,587,512 | |
| Marlette Funding Trust: | |||
| Series 2019-4A Class A, 2.39% 12/17/29 (b) | 706,782 | 709,357 | |
| Series 2020-1A Class A, 2.24% 3/15/30 (b) | 26,673 | 26,688 | |
| MASTR Asset Backed Securities Trust: | |||
| Series 2005-NC2 Class A4, 1 month U.S. LIBOR + 0.700% 0.7844% 11/25/35 (c)(f) | 10,999,499 | 8,241,105 | |
| Series 2005-WF1 Class M7, 1 month U.S. LIBOR + 1.720% 1.8094% 6/25/35 (c)(f) | 1,816,559 | 1,832,814 | |
| MDPK Series 2021-48A Class A, 3 month U.S. LIBOR + 1.150% 1.2839% 4/19/33 (b)(c)(f) | 5,000,000 | 5,000,940 | |
| Metlife Securitization Trust Series 2019-1A Class A1A, 3.75% 4/25/58 (b) | 2,105,282 | 2,164,378 | |
| MidOcean Credit CLO V Series 2018-5A Class AR, 3 month U.S. LIBOR + 1.120% 1.2539% 7/19/28 (b)(c)(f) | 1,106,606 | 1,106,753 | |
| Milos CLO, Ltd. Series 2020-1A Class AR, 3 month U.S. LIBOR + 1.070% 1.2043% 10/20/30 (b)(c)(f) | 8,353,000 | 8,353,560 | |
| Morgan Stanley ABS Capital I Trust: | |||
| Series 2006-HE4 Class A4, 1 month U.S. LIBOR + 0.480% 0.5644% 6/25/36 (f) | 4,136,955 | 2,733,066 | |
| Series 2007-NC3 Class A2D, 1 month U.S. LIBOR + 0.260% 0.3444% 5/25/37 (c)(f) | 2,555,971 | 2,268,648 | |
| Mortgage Repurchase Agreement Financing Trust Series 2020-5 Class A1, 1 month U.S. LIBOR + 1.000% 1.0951% 8/10/23 (b)(c)(f) | 12,613,000 | 12,743,318 | |
| Mountain View CLO XIV, Ltd. Series 2019-1A Class B, 3 month U.S. LIBOR + 2.000% 2.0269% 4/15/29 (b)(c)(f) | 1,250,000 | 1,250,350 | |
| Nationstar HECM Loan Trust Series 2020-1A Class A1, 1.2686% 9/25/30 (b) | 6,816,423 | 6,812,818 | |
| Nationstar Home Equity Loan Trust Series 2006-B Class M2, 1 month U.S. LIBOR + 0.360% 0.4444% 9/25/36 (c)(f) | 8,141,000 | 7,806,305 | |
| Navient Private Education Refi Loan Trust Series 2021-A Class B, 2.24% 5/15/69 (b) | 100,000 | 100,974 | |
| Navient Student Loan Trust: | |||
| Series 2015-1 Class A2, 1 month U.S. LIBOR + 0.600% 0.6844% 4/25/40 (c)(f) | 455,449 | 458,331 | |
| Series 2016-2A Class A3, 1 month U.S. LIBOR + 1.500% 1.5844% 6/25/65 (b)(c)(f) | 1,475,000 | 1,529,746 | |
| Newcastle Mortgage Securities Trust Series 2007-1 Class 2A3, 1 month U.S. LIBOR + 0.230% 0.3144% 4/25/37 (f) | 4,091,562 | 4,021,436 | |
| Northwoods Capital XV, Ltd. Series 2021-15A Class A1R, 3 month U.S. LIBOR + 1.210% 1.3445% 6/20/34 (b)(c)(f) | 23,750,000 | 23,767,053 | |
| OCP CLO Ltd. / OCP CLO LLC Series 2021-18A Class AR, 3 month U.S. LIBOR + 1.090% 1.2243% 7/20/32 (b)(c)(f) | 18,000,000 | 18,028,188 | |
| Octagon Investment Partners 31, Ltd. / Octagon Investment Partners 31 LLC Series 2021-1A Class AR, 3 month U.S. LIBOR + 1.050% 1.1843% 7/20/30 (b)(c)(f) | 3,000,000 | 2,998,590 | |
| Oportun Funding XIV, LLC Series 2021-A: | |||
| Class A, 1.21% 3/8/28 (b) | 600,000 | 602,077 | |
| Class B, 1.76% 3/8/28 (b) | 400,000 | 401,330 | |
| Oportun Funding, LLC Series 2020-1 Class B, 3.45% 5/15/24 (b) | 2,000,000 | 2,035,294 | |
| Palmer Square CLO, Ltd. Series 2021-1A Class A1, 3 month U.S. LIBOR + 1.190% 1.3243% 4/20/34 (b)(c)(f) | 6,000,000 | 6,004,896 | |
| Park Avenue Institutional Advisers CLO Ltd. / Park Avenue Institutional Advisers CLO LLC Series 2021-1A Class A1AR, 3 month U.S. LIBOR + 1.000% 1.1343% 10/20/31 (b)(c)(f) | 12,750,000 | 12,756,949 | |
| Park Avenue Institutional Advisers CLO, Ltd. Series 2021-1A Class A1R, 3 month U.S. LIBOR + 1.240% 1.3648% 2/14/34 (b)(c)(f) | 2,000,000 | 1,996,608 | |
| Peace Park CLO, Ltd. Series 2021-1A Class A, 3 month U.S. LIBOR + 1.130% 3% 10/20/34 (b)(c)(e)(f) | 2,337,000 | 2,337,000 | |
| Planet Fitness Master Issuer LLC Series 2019-1A Class A2, 3.858% 12/5/49 (b) | 6,121,775 | 6,314,305 | |
| PMT Credit Risk Transfer Trust Series 2021-1R Class A, 1 month U.S. LIBOR + 2.900% 2.9961% 2/27/24 (b)(c)(f) | 5,122,060 | 5,212,265 | |
| Recette CLO, Ltd. Series 2021-1A Class ARR, 3 month U.S. LIBOR + 1.080% 1.2143% 4/20/34 (b)(c)(f) | 4,700,000 | 4,705,382 | |
| RMF Buyout Issuance Trust Series 2020-1 Class A, 2.1582% 2/25/30 (b) | 119,574 | 119,653 | |
| Rockland Park CLO Ltd. Series 2021-1A Class A, 3 month U.S. LIBOR + 1.120% 1.12% 4/20/34 (b)(c)(f) | 7,250,000 | 7,258,280 | |
| Romark CLO-IV Ltd. / Romark CLO-IV LLC Series 2021-4A Class A1, 3 month U.S. LIBOR + 1.170% 1.3203% 7/10/34 (b)(c)(f) | 13,250,000 | 13,259,368 | |
| Santander Drive Auto Receivables Trust Series 2021-1 Class D, 1.13% 11/16/26 | 2,800,000 | 2,811,173 | |
| Sapphire Aviation Finance Series 2020-1A: | |||
| Class A, 3.228% 3/15/40 (b) | 6,660,023 | 6,647,263 | |
| Class B, 4.335% 3/15/40 (b) | 665,815 | 586,333 | |
| Saratoga Investment Corp. CLO, Ltd. / Saratoga Investment Corp. CLO, Inc. Series 2021-1A Class AR3, 3 month U.S. LIBOR + 1.320% 1.4543% 4/20/33 (b)(c)(f) | 12,000,000 | 11,999,952 | |
| SBA Tower Trust: | |||
| Series 2019, 2.836% 1/15/50 (b) | 8,004,000 | 8,364,192 | |
| 1.884% 7/15/50 (b) | 2,753,000 | 2,812,319 | |
| 2.328% 7/15/52 (b) | 2,105,000 | 2,164,950 | |
| Securitized Asset Backed Receivables LLC Trust Series 2006-CB5 Class A3, 1 month U.S. LIBOR + 0.280% 0.3644% 6/25/36 (c)(f) | 2,717,471 | 2,095,998 | |
| Sixth Street CLO XVII, Ltd. / Sixth Street CLO XVII LLC Series 2021-17A Class A, 3 month U.S. LIBOR + 1.240% 1.4093% 1/20/34 (b)(c)(f) | 5,000,000 | 5,012,225 | |
| SoFi Consumer Loan Program Trust Series 2019-4 Class A, 2.45% 8/25/28 (b) | 1,204,199 | 1,209,563 | |
| Sound Point CLO VII-R, Ltd. Series 2021-3RA Class A1R, 3 month U.S. LIBOR + 1.070% 1.2079% 10/23/31 (b)(c)(f) | 10,250,000 | 10,250,595 | |
| Soundview Home Loan Trust Series 2007-NS1 Class A4, 1 month U.S. LIBOR + 0.300% 0.3844% 1/25/37 (c)(f) | 7,309,000 | 7,046,328 | |
| Store Master Funding Series 2021-1A Class A1, 2.12% 6/20/51 (b) | 1,498,750 | 1,523,479 | |
| Symphony CLO XXIII Ltd. Series 2020-23A Class A, 3 month U.S. LIBOR + 1.320% 1.4461% 1/15/34 (b)(c)(f) | 3,410,000 | 3,413,028 | |
| Taconic Park CLO, Ltd. Series 2020-1A Class A1R, 3 month U.S. LIBOR + 1.000% 1.1343% 1/20/29 (b)(c)(f) | 5,538,000 | 5,545,144 | |
| TCW CLO, Ltd. / TCW CLO, LLC Series 2021-1A Class A1RR, 3 month U.S. LIBOR + 1.160% 0% 4/20/34 (b)(c)(f) | 5,500,000 | 5,503,707 | |
| Terwin Mortgage Trust Series 2003-4HE Class A1, 1 month U.S. LIBOR + 0.860% 0.9444% 9/25/34 (c)(f) | 3,983 | 3,722 | |
| TH MSR Issuer Trust Series 2019-FT1 Class A, 1 month U.S. LIBOR + 2.800% 2.8844% 6/25/24 (b)(c)(f) | 1,250,000 | 1,236,863 | |
| Thunderbolt Aircraft Lease Ltd. Series 2018-A Class A, 4.147% 9/15/38 (b)(c) | 9,767,058 | 9,736,395 | |
| Thunderbolt III Aircraft Lease Ltd. Series 2019-1 Class A, 3.671% 11/15/39 (b) | 9,941,854 | 9,870,978 | |
| Towd Point Mortgage Trust: | |||
| Series 2019-1 Class A1, 3.7158% 3/25/58 (b)(c) | 1,880,090 | 1,985,174 | |
| Series 2020-4 Class A1, 1.75% 10/25/60 (b) | 2,763,563 | 2,803,815 | |
| Tralee CLO VII Ltd. / Tralee CLO VII LLC Series 2021-7A Class A1, 3 month U.S. LIBOR + 1.320% 1.5585% 4/25/34 (b)(c)(f) | 12,000,000 | 11,986,056 | |
| Upstart Securitization Trust: | |||
| Series 2021-1 Class A, 0.87% 3/20/31 (b) | 649,199 | 650,493 | |
| Series 2021-2 Class A, 0.91% 6/20/31 (b) | 8,905,001 | 8,914,393 | |
| Series 2021-3 Class A, 0.83% 7/20/31 (b) | 13,537,000 | 13,546,396 | |
| Venture 43 CLO, Ltd. Series 2021-43A Class A1, 3 month U.S. LIBOR + 1.240% 1.3809% 4/15/34 (b)(c)(f) | 15,200,000 | 15,219,714 | |
| VOLT XCIV LLC Series 2021-NPL3 Class A1, 2.2395% 2/27/51 (b) | 5,169,961 | 5,177,462 | |
| Voya CLO Ltd. Series 2019-2A Class A, 3 month U.S. LIBOR + 1.270% 1.4043% 7/20/32 (b)(c)(f) | 8,868,000 | 8,869,073 | |
| Voya CLO Ltd./Voya CLO LLC: | |||
| Series 2020-2A Class A1, 3 month U.S. LIBOR + 1.600% 1.7339% 7/19/31 (b)(c)(f) | 6,400,000 | 6,400,000 | |
| Series 2020-3A Class A1, 3 month U.S. LIBOR + 1.300% 1.4343% 10/20/31 (b)(c)(f) | 7,500,000 | 7,501,530 | |
| Series 2021-2A Class A1R, 3 month U.S. LIBOR + 1.160% 1.16% 7/19/34 (b)(c)(f) | 15,930,000 | 15,931,641 | |
| Voya CLO, Ltd. Series 2021-1A Class AR, 3 month U.S. LIBOR + 1.150% 1.15% 7/16/34 (b)(c)(f) | 3,924,000 | 3,924,761 | |
| TOTAL ASSET-BACKED SECURITIES | |||
| (Cost $993,269,704) | 995,629,580 | ||
| Collateralized Mortgage Obligations - 0.7% | |||
| Private Sponsor - 0.6% | |||
| Ajax Mortgage Loan Trust sequential payer Series 2021-E Class A1, 1.74% 12/25/60 (b) | 2,038,141 | 2,070,084 | |
| Alternative Loan Trust floater Series 2007-OH3 Class A1B, 1 month U.S. LIBOR + 0.220% 0.3044% 9/25/47 (f) | 2,230,468 | 2,139,915 | |
| BCAP LLC Trust sequential payer: | |||
| Series 2010-RR4 Class 31A6, 6.4604% 1/26/37 (b)(c) | 4,109,491 | 3,934,080 | |
| Series 2012-RR5 Class 8A5, 0.4836% 7/26/36 (b)(c) | 14,181 | 14,102 | |
| Brass PLC Series 2021-10A Class A1, 0.669% 4/16/69 (b)(c) | 3,949,975 | 3,952,601 | |
| Cascade Funding Mortgage Trust Series 2021-HB5 Class A, 0.8006% 2/25/31 (b) | 4,759,045 | 4,759,796 | |
| Central Park Funding Trust floater: | |||
| Series 2021-1 Class PT, 1 month U.S. LIBOR + 2.750% 2.8379% 8/29/22 (b)(c)(f) | 12,427,084 | 12,709,422 | |
| Series 2021-2 Class PT, 3.0873% 10/27/22 (b)(c) | 15,544,510 | 15,602,406 | |
| CFMT LLC Series 2020-HB4 Class A, 0.9461% 12/26/30 (b) | 3,507,855 | 3,514,087 | |
| CIM Trust sequential payer: | |||
| Series 2021-R1 Class A2, 2.4% 8/25/56 (b) | 8,530,466 | 8,543,009 | |
| Series 2021-R3 Class A1A, 1.951% 6/25/57 (b) | 11,013,027 | 11,144,082 | |
| Series 2021-R4 Class A1A, 2% 5/1/61 (b) | 10,871,217 | 10,922,857 | |
| Citigroup Mortgage Loan Trust Series 2005-9 Class 22A1, 6% 11/25/35 | 1,632,564 | 1,669,919 | |
| Connecticut Avenue Securities Trust floater Series 2020-R01 Class 1M2, 1 month U.S. LIBOR + 2.050% 2.1344% 1/25/40 (b)(c)(f) | 773,826 | 777,572 | |
| CSMC floater Series 2015-1R Class 6A1, 1 month U.S. LIBOR + 0.280% 0.3816% 5/27/37 (b)(c)(f) | 341,993 | 336,112 | |
| CSMC Trust sequential payer: | |||
| Series 2020-RPL2 Class A12, 3.43% 2/25/60 (b)(c) | 754,149 | 779,181 | |
| Series 2020-RPL3 Class A1, 2.691% 3/25/60 (b)(c) | 5,065,845 | 5,116,371 | |
| Series 2020-RPL4 Class A1, 2% 1/25/60 (b) | 2,605,558 | 2,653,518 | |
| CWALT, Inc. Series 2005-13CB Class A8, 5.5% 5/25/35 | 2,494,988 | 2,502,878 | |
| Eagle Re Ltd. floater Series 2021-1: | |||
| Class M1B, U.S. 30-Day Avg. Secured Overnight Fin. Rate (SOFR) Indx + 2.150% 2.2% 10/25/33 (b)(c)(f) | 1,125,000 | 1,133,656 | |
| Class M1C, U.S. 30-Day Avg. Secured Overnight Fin. Rate (SOFR) Indx + 2.700% 2.75% 10/25/33 (b)(c)(f) | 1,735,000 | 1,771,873 | |
| GMAC Mortgage Loan Trust Series 2005-AR6 Class 2A1, 3.2414% 11/19/35 (c) | 1,853,800 | 1,822,287 | |
| GSR Mortgage Loan Trust floater Series 2006-OA1 Class 1A1, 1 month U.S. LIBOR + 0.440% 0.5244% 8/25/46 (c)(f) | 19,273,562 | 6,244,016 | |
| Lanark Master Issuer PLC Series 2019-2A Class 1A, 2.71% 12/22/69 (b)(c) | 5,800,000 | 5,897,370 | |
| Legacy Mortgage Asset Trust sequential payer Series 2021-SL1 Class A, 1.991% 9/25/60 (b) | 3,199,041 | 3,205,522 | |
| Merrill Lynch Mortgage Investors Trust floater Series 2006-A2 Class 1A, 1 month U.S. LIBOR + 0.180% 0.2644% 2/25/36 (f) | 6,894,190 | 4,571,683 | |
| Mortgage Repurchase Agreement Financing Trust Series 2020-4 Class A1, 1 month U.S. LIBOR + 1.350% 1.4451% 4/23/23 (b)(c)(f) | 16,662,000 | 16,712,936 | |
| MRA Issuance Trust floater: | |||
| Series 2021-10 Class A1X, 1 month U.S. LIBOR + 1.500% 1.5958% 2/22/23 (b)(c)(f) | 14,920,000 | 14,933,398 | |
| Series 2021-9 Class A1X, 1 month U.S. LIBOR + 1.200% 1.2958% 11/15/21 (b)(c)(f) | 13,000,000 | 13,001,248 | |
| Series 2021-EBO3: | |||
| Class A1X, 1 month U.S. LIBOR + 1.750% 1.8458% 3/31/23 (b)(c)(f) | 5,570,000 | 5,564,903 | |
| Class A2, 1 month U.S. LIBOR + 2.750% 2.8458% 3/31/23 (b)(c)(f) | 6,430,000 | 6,424,097 | |
| New Residential Mortgage Loan Trust: | |||
| Series 2019-5A Class A1B, 3.5% 8/25/59 (b) | 1,655,194 | 1,729,519 | |
| Series 2020-1A Class A1B, 3.5% 10/25/59 (b) | 2,866,009 | 3,048,609 | |
| New York Mortgage Trust sequential payer Series 2021-SP1 Class A1, 1.6696% 8/25/61 (b) | 5,529,000 | 5,531,389 | |
| Preston Ridge Partners Mortgage Trust: | |||
| Series 2021-1 Class A1, 2.115% 1/25/26 (b) | 4,697,627 | 4,699,984 | |
| Series 2021-RPL1 Class A1, 1.319% 7/25/51 (b) | 2,699,514 | 2,703,770 | |
| RALI Trust: | |||
| Series 2006-QS4 Class A4, 6% 4/25/36 | 1,887,890 | 1,819,802 | |
| Series 2007-QS3 Class A5, 6.25% 2/25/37 | 3,033,995 | 2,957,772 | |
| Series 2007-QS8 Class A5, 6% 6/25/37 | 1,139,326 | 1,108,422 | |
| Retiro Mortgage Securities floater Series 2021-1A Class A1, 2.000% x 3 month EURIBOR 1.453% 7/30/75 (b)(c)(f) | EUR | 1,940,707 | 2,277,963 |
| RMF Buyout Issuance Trust: | |||
| sequential payer Series 2020-2 Class A, 1.7063% 6/25/30 (b) | 7,684,450 | 7,703,346 | |
| Series 2020-HB1 Class A1, 1.7188% 10/25/50 (b) | 1,599,733 | 1,621,804 | |
| Sequoia Mortgage Trust floater Series 2004-6 Class A3B, 6 month U.S. LIBOR + 0.880% 1.0386% 7/20/34 (c)(f) | 1,001 | 980 | |
| Silverstone Master Issuer PLC floater Series 2019-1A Class 1A, 3 month U.S. LIBOR + 0.570% 0.7043% 1/21/70 (b)(c)(f) | 2,661,450 | 2,662,807 | |
| Thornburg Mortgage Securities Trust floater Series 2003-4 Class A1, 1 month U.S. LIBOR + 0.640% 0.7244% 9/25/43 (c)(f) | 1,748,021 | 1,725,616 | |
| WaMu Mortgage pass-thru certificates floater Series 2005-AR2 Class 2A1B, 1 month U.S. LIBOR + 0.740% 0.8244% 1/25/45 (f) | 1,957,116 | 1,948,538 | |
| TOTAL PRIVATE SPONSOR | 215,965,302 | ||
| U.S. Government Agency - 0.1% | |||
| Fannie Mae: | |||
| planned amortization class Series 2012-149: | |||
| Class DA, 1.75% 1/25/43 | 844,961 | 865,425 | |
| Class GA, 1.75% 6/25/42 | 914,855 | 937,419 | |
| Series 2005-79 Class ZC, 5.9% 9/25/35 | 227,727 | 260,492 | |
| Series 2007-75 Class JI, 6.540% - 1 month U.S. LIBOR 6.4606% 8/25/37 (c)(k)(l) | 787,261 | 169,428 | |
| Series 2010-135 Class ZA, 4.5% 12/25/40 | 471,949 | 527,507 | |
| Series 2010-150 Class ZC, 4.75% 1/25/41 | 732,009 | 828,969 | |
| Series 2010-95 Class ZC, 5% 9/25/40 | 1,542,334 | 1,730,345 | |
| Series 2011-4 Class PZ, 5% 2/25/41 | 260,370 | 318,510 | |
| Series 2012-100 Class WI, 3% 9/25/27 (k) | 391,161 | 27,520 | |
| Series 2012-14 Class JS, 6.650% - 1 month U.S. LIBOR 6.5656% 12/25/30 (c)(k)(l) | 93,530 | 5,244 | |
| Series 2012-9 Class SH, 6.550% - 1 month U.S. LIBOR 6.4656% 6/25/41 (c)(k)(l) | 84,365 | 3,783 | |
| Series 2013-133 Class IB, 3% 4/25/32 (k) | 194,690 | 6,715 | |
| Series 2013-134 Class SA, 6.050% - 1 month U.S. LIBOR 5.9656% 1/25/44 (c)(k)(l) | 134,549 | 24,949 | |
| Series 2013-44 Class DJ, 1.85% 5/25/33 | 8,192,630 | 8,374,481 | |
| Series 2013-51 Class GI, 3% 10/25/32 (k) | 595,388 | 40,222 | |
| Series 2015-42 Class IL, 6% 6/25/45 (k) | 775,182 | 149,761 | |
| Series 2015-70 Class JC, 3% 10/25/45 | 639,452 | 676,215 | |
| Series 2017-30 Class AI, 5.5% 5/25/47 (k) | 435,319 | 84,569 | |
| Freddie Mac: | |||
| planned amortization class: | |||
| Series 2020-4960 Class PB, 1.5% 10/25/49 | 4,188,369 | 4,250,365 | |
| Series 4135 Class AB, 1.75% 6/15/42 | 687,975 | 704,962 | |
| sequential payer Series 3871 Class KB, 5.5% 6/15/41 | 552,825 | 643,617 | |
| Series 2017-4683 Class LM, 3% 5/15/47 | 928,323 | 980,337 | |
| Series 2933 Class ZM, 5.75% 2/15/35 | 474,439 | 552,481 | |
| Series 2996 Class ZD, 5.5% 6/15/35 | 312,119 | 360,213 | |
| Series 3237 Class C, 5.5% 11/15/36 | 426,712 | 485,140 | |
| Series 3955 Class YI, 3% 11/15/21 (k) | 3,351 | 6 | |
| Series 3980 Class EP, 5% 1/15/42 | 2,377,279 | 2,703,895 | |
| Series 4055 Class BI, 3.5% 5/15/31 (k) | 200,513 | 8,733 | |
| Series 4149 Class IO, 3% 1/15/33 (k) | 304,239 | 33,039 | |
| Series 4314 Class AI, 5% 3/15/34 (k) | 70,188 | 4,058 | |
| Series 4427 Class LI, 3.5% 2/15/34 (k) | 426,261 | 32,409 | |
| Series 4471 Class PA 4% 12/15/40 | 370,867 | 397,046 | |
| Freddie Mac Multi-family Structured pass-thru certificates Series 4386 Class AZ, 4.5% 11/15/40 | 653,411 | 710,197 | |
| Freddie Mac Seasoned Credit Risk Transfer Trust Series 2018-3 Class M55D, 4% 8/25/57 | 2,315,320 | 2,505,645 | |
| Freddie Mac STACR REMIC Trust floater: | |||
| Series 2019-DNA4 Class B1, 1 month U.S. LIBOR + 2.700% 2.7844% 10/25/49 (b)(c)(f) | 9,700,000 | 9,765,127 | |
| Series 2020-DNA6 Class B1, U.S. 30-Day Avg. Secured Overnight Fin. Rate (SOFR) Indx + 3.000% 3.05% 12/25/50 (b)(c)(f) | 3,910,000 | 3,950,006 | |
| Series 2021-DNA2 Class B1, U.S. 30-Day Avg. Secured Overnight Fin. Rate (SOFR) Indx + 3.400% 3.45% 8/25/33 (b)(c)(f) | 4,380,000 | 4,518,084 | |
| Series 2021-HQA1: | |||
| Class B1, U.S. 30-Day Avg. Secured Overnight Fin. Rate (SOFR) Indx + 3.000% 3.05% 8/25/33 (b)(c)(f) | 2,700,000 | 2,716,478 | |
| Class M2, U.S. 30-Day Avg. Secured Overnight Fin. Rate (SOFR) Indx + 2.250% 2.3% 8/25/33 (b)(c)(f) | 3,900,000 | 3,948,291 | |
| Freddie Mac. STACR REMIC Trust floater Series 2020-DNA1 Class B1, 1 month U.S. LIBOR + 2.300% 2.3844% 1/25/50 (b)(c)(f) | 6,600,000 | 6,581,802 | |
| Ginnie Mae guaranteed REMIC pass-thru certificates: | |||
| floater: | |||
| Series 2010-H27 Class FA, 1 month U.S. LIBOR + 0.380% 0.4829% 12/20/60 (c)(f)(m) | 858,553 | 859,817 | |
| Series 2011-H20 Class FA, 1 month U.S. LIBOR + 0.550% 0.6529% 9/20/61 (c)(f)(m) | 3,632,318 | 3,650,399 | |
| Series 2012-H18 Class NA, 1 month U.S. LIBOR + 0.520% 0.6229% 8/20/62 (c)(f)(m) | 638,709 | 641,463 | |
| Series 2012-H21 Class DF, 1 month U.S. LIBOR + 0.650% 0.7529% 5/20/61 (c)(f)(m) | 5,857 | 5,906 | |
| Series 2013-H19 Class FC, 1 month U.S. LIBOR + 0.600% 0.7029% 8/20/63 (c)(f)(m) | 1,936,462 | 1,943,293 | |
| Series 2019-128 Class FH, 1 month U.S. LIBOR + 0.500% 0.5884% 10/20/49 (c)(f) | 387,098 | 390,497 | |
| Series 2019-153 Class FB, 1 month U.S. LIBOR + 0.450% 0.5384% 12/20/49 (c)(f) | 4,476,659 | 4,519,038 | |
| Series 2019-23 Class NF, 1 month U.S. LIBOR + 0.450% 0.5384% 2/20/49 (c)(f) | 1,800,390 | 1,824,350 | |
| Series 2019-98 Class FN, 1 month U.S. LIBOR + 0.500% 0.5884% 8/20/49 (c)(f) | 527,088 | 533,652 | |
| Series 2020-32 Class GF, 1 month U.S. LIBOR + 0.400% 0.4884% 3/20/50 (c)(f) | 4,214,391 | 4,246,861 | |
| planned amortization class: | |||
| Series 2010-158 Class MS, 10.000% - 1 month U.S. LIBOR 9.8232% 12/20/40 (c)(l) | 672,260 | 801,459 | |
| Series 2016-69 Class WA, 3% 2/20/46 | 415,690 | 440,464 | |
| Series 2017-134 Class BA, 2.5% 11/20/46 | 1,062,180 | 1,104,801 | |
| sequential payer: | |||
| Series 2010-160 Class DY, 4% 12/20/40 | 1,381,946 | 1,497,289 | |
| Series 2010-170 Class B, 4% 12/20/40 | 311,956 | 338,045 | |
| Series 2017-139 Class BA, 3% 9/20/47 | 4,422,943 | 4,723,624 | |
| Series 2010-116 Class QB, 4% 9/16/40 | 2,360,367 | 2,549,470 | |
| Series 2010-14 Class SN, 5.950% - 1 month U.S. LIBOR 5.8545% 2/16/40 (c)(k)(l) | 410,494 | 68,167 | |
| Series 2011-94 Class SA, 6.100% - 1 month U.S. LIBOR 6.0116% 7/20/41 (c)(k)(l) | 102,724 | 19,067 | |
| Series 2013-149 Class MA, 2.5% 5/20/40 | 1,433,479 | 1,474,719 | |
| Series 2015-H13 Class HA, 2.5% 8/20/64 (m) | 25,236 | 25,764 | |
| Series 2017-H06 Class FA, U.S. TREASURY 1 YEAR INDEX + 0.350% 0.43% 8/20/66 (c)(f)(m) | 2,586,988 | 2,563,422 | |
| TOTAL U.S. GOVERNMENT AGENCY | 95,105,052 | ||
| TOTAL COLLATERALIZED MORTGAGE OBLIGATIONS | |||
| (Cost $309,745,888) | 311,070,354 | ||
| Commercial Mortgage Securities - 2.2% | |||
| Arbor Multifamily Mortgage Securities Trust sequential payer Series 2021-MF2 Class A4, 2.2515% 6/15/54 (b) | 9,500,000 | 9,731,732 | |
| Ashford Hospitality Trust floater Series 2018-ASHF Class A, 1 month U.S. LIBOR + 0.900% 0.996% 4/15/35 (b)(c)(f) | 3,546,916 | 3,542,860 | |
| BAMLL Commercial Mortgage Securities Trust: | |||
| floater sequential payer Series 2020-JGDN Class A, 1 month U.S. LIBOR + 2.750% 2.846% 11/15/30 (b)(c)(f) | 5,954,000 | 6,047,230 | |
| sequential payer Series 2019-BPR: | |||
| Class AMP, 3.287% 11/5/32 (b) | 6,500,000 | 6,705,350 | |
| Class ANM, 3.112% 11/5/32 (b) | 4,963,000 | 5,170,205 | |
| Series 2019-BPR: | |||
| Class BNM, 3.465% 11/5/32 (b) | 1,113,000 | 1,109,066 | |
| Class CNM, 3.8425% 11/5/32 (b)(c) | 461,000 | 442,199 | |
| BANK: | |||
| sequential payer: | |||
| Series 2019-BN21: | |||
| Class A4, 2.6% 10/17/52 | 4,400,000 | 4,641,220 | |
| Class A5, 2.851% 10/17/52 | 838,000 | 903,396 | |
| Series 2020-BN28 Class A3, 1.584% 3/15/63 | 9,000,000 | 8,826,442 | |
| Series 2021-BN31 Class A3, 1.771% 2/15/54 | 2,000,000 | 1,984,909 | |
| Series 2021-BN32 Class A4, 2.349% 4/15/54 | 20,000,000 | 20,788,992 | |
| Series 2021-BN33 Class A4, 2.27% 5/15/64 | 9,000,000 | 9,294,664 | |
| Series 2021-BN31 Class XB, 0.9762% 2/15/54 (c)(k) | 7,000,000 | 531,977 | |
| Series 2021-BN33 Class XA, 1.1766% 5/15/64 (c)(k) | 8,995,944 | 724,234 | |
| Series 2021-BN34 Class XB, 0.6267% 6/15/63 (c)(k) | 171,794,000 | 8,244,824 | |
| Bayview Commercial Asset Trust floater: | |||
| Series 2005-3A Class A2, 1 month U.S. LIBOR + 0.600% 0.6844% 11/25/35 (b)(c)(f) | 18,837 | 17,990 | |
| Series 2005-4A: | |||
| Class A2, 1 month U.S. LIBOR + 0.580% 0.6694% 1/25/36 (b)(c)(f) | 48,563 | 46,853 | |
| Class M1, 1 month U.S. LIBOR + 0.670% 0.7594% 1/25/36 (b)(c)(f) | 15,675 | 15,235 | |
| Series 2006-4A Class A2, 1 month U.S. LIBOR + 0.400% 0.4894% 12/25/36 (b)(c)(f) | 108,290 | 103,076 | |
| Series 2007-1 Class A2, 1 month U.S. LIBOR + 0.270% 0.3544% 3/25/37 (b)(c)(f) | 28,834 | 27,477 | |
| Series 2007-2A: | |||
| Class A1, 1 month U.S. LIBOR + 0.270% 0.3544% 7/25/37 (b)(c)(f) | 81,240 | 77,924 | |
| Class A2, 1 month U.S. LIBOR + 0.320% 0.4044% 7/25/37 (b)(c)(f) | 76,062 | 71,018 | |
| Class M1, 1 month U.S. LIBOR + 0.370% 0.4544% 7/25/37 (b)(c)(f) | 25,890 | 23,405 | |
| Series 2007-3: | |||
| Class A2, 1 month U.S. LIBOR + 0.290% 0.3744% 7/25/37 (b)(c)(f) | 27,824 | 26,541 | |
| Class M1, 1 month U.S. LIBOR + 0.310% 0.3944% 7/25/37 (b)(c)(f) | 14,745 | 13,177 | |
| Class M2, 1 month U.S. LIBOR + 0.340% 0.4244% 7/25/37 (b)(c)(f) | 15,771 | 14,002 | |
| Class M3, 1 month U.S. LIBOR + 0.370% 0.4544% 7/25/37 (b)(c)(f) | 25,260 | 22,901 | |
| Class M4, 1 month U.S. LIBOR + 0.500% 0.5844% 7/25/37 (b)(c)(f) | 39,877 | 35,927 | |
| Class M5, 1 month U.S. LIBOR + 0.600% 0.6844% 7/25/37 (b)(c)(f) | 16,778 | 16,960 | |
| BBCMS Mortgage Trust sequential payer: | |||
| Series 2019-C4 Class A4, 2.661% 8/15/52 | 4,000,000 | 4,197,424 | |
| Series 2021-C9 Class A4, 2.021% 2/15/54 | 10,000,000 | 10,124,537 | |
| Benchmark Commercial Mortgage Trust Series 2018-B3 Class A3, 3.746% 4/10/51 | 1,700,000 | 1,832,140 | |
| Benchmark Mortgage Trust: | |||
| sequential payer: | |||
| Series 2018-B4 Class A5, 4.121% 7/15/51 | 949,000 | 1,094,803 | |
| Series 2019-B10 Class A4, 3.717% 3/15/62 | 1,673,000 | 1,895,820 | |
| Series 2019-B13 Class A4, 2.952% 8/15/57 | 7,629,000 | 8,252,359 | |
| Series 2020-B18 Class A4, 1.672% 7/15/53 | 10,000,000 | 9,855,180 | |
| Series 2020-B19: | |||
| Class A3, 1.787% 9/15/53 | 5,800,000 | 5,877,712 | |
| Class A4, 1.546% 9/15/53 | 12,500,000 | 12,280,533 | |
| Series 2020-B22 Class A4, 1.685% 1/15/54 | 3,175,000 | 3,107,436 | |
| Series 2021-B23 Class A4A1, 1.823% 2/15/54 | 2,000,000 | 1,986,862 | |
| Series 2021-B24 Class A4, 2.2638% 3/15/54 | 17,600,000 | 18,118,614 | |
| Series 2021-B26 Class A4, 2.295% 6/15/54 | 8,800,000 | 9,089,846 | |
| Series 2019-B12 Class XA, 1.201% 8/15/52 (c)(k) | 39,964,792 | 2,415,492 | |
| Series 2019-B14 Class XA, 0.9105% 12/15/62 (c)(k) | 22,849,814 | 1,045,601 | |
| BFLD Trust floater sequential payer Series 2020-OBRK Class A, 1 month U.S. LIBOR + 2.050% 2.146% 11/15/28 (b)(c)(f) | 7,501,000 | 7,582,891 | |
| BHMS floater Series 2018-ATLS Class A, 1 month U.S. LIBOR + 1.250% 1.3455% 7/15/35 (b)(c)(f) | 10,931,821 | 10,947,111 | |
| BLOX Trust floater sequential payer Series 2021-BLOX Class A, 1 month U.S. LIBOR + 0.750% 0.85% 9/15/26 (b)(c)(f) | 8,921,000 | 8,921,000 | |
| BX Commercial Mortgage Trust: | |||
| floater: | |||
| Series 2020-BXLP: | |||
| Class B, 1 month U.S. LIBOR + 1.000% 1.096% 12/15/36 (b)(c)(f) | 4,198,167 | 4,198,166 | |
| Class C, 1 month U.S. LIBOR + 1.120% 1.216% 12/15/36 (b)(c)(f) | 3,479,450 | 3,478,406 | |
| Class D, 1 month U.S. LIBOR + 1.250% 1.346% 12/15/36 (b)(c)(f) | 4,809,358 | 4,807,918 | |
| Class G, 1 month U.S. LIBOR + 2.500% 2.596% 12/15/36 (b)(c)(f) | 6,130,776 | 6,128,954 | |
| Series 2021-VINO Class A, 1 month U.S. LIBOR + 0.650% 0.7483% 5/15/38 (b)(c)(f) | 5,200,000 | 5,203,268 | |
| floater sequential payer: | |||
| Series 2019-CALM Class A, 1 month U.S. LIBOR + 0.870% 0.972% 11/15/32 (b)(c)(f) | 1,900,000 | 1,901,189 | |
| Series 2020-BXLP Class A, 1 month U.S. LIBOR + 0.800% 0.896% 12/15/36 (b)(c)(f) | 8,311,446 | 8,322,343 | |
| Series 2020-FOX Class A, 1 month U.S. LIBOR + 1.000% 1.096% 11/15/32 (b)(c)(f) | 4,969,841 | 4,979,190 | |
| BX Trust: | |||
| floater: | |||
| Series 2018-EXCL: | |||
| Class A, 1 month U.S. LIBOR + 1.088% 1.1836% 9/15/37 (b)(c)(f) | 3,551,251 | 3,551,428 | |
| Class B, 1 month U.S. LIBOR + 1.320% 1.421% 9/15/37 (b)(c)(f) | 4,059,046 | 4,005,742 | |
| Class D, 1 month U.S. LIBOR + 2.620% 2.721% 9/15/37 (b)(c)(f) | 2,310,343 | 1,949,215 | |
| Series 2018-IND: | |||
| Class B, 1 month U.S. LIBOR + 0.900% 0.996% 11/15/35 (b)(c)(f) | 910,000 | 910,849 | |
| Class F, 1 month U.S. LIBOR + 1.800% 1.896% 11/15/35 (b)(c)(f) | 2,713,900 | 2,718,892 | |
| Series 2019-IMC: | |||
| Class B, 1 month U.S. LIBOR + 1.300% 1.396% 4/15/34 (b)(c)(f) | 4,464,000 | 4,452,879 | |
| Class C, 1 month U.S. LIBOR + 1.600% 1.696% 4/15/34 (b)(c)(f) | 2,952,000 | 2,942,996 | |
| Class D, 1 month U.S. LIBOR + 1.900% 1.996% 4/15/34 (b)(c)(f) | 3,099,000 | 3,081,924 | |
| Series 2019-XL: | |||
| Class B, 1 month U.S. LIBOR + 1.080% 1.176% 10/15/36 (b)(c)(f) | 3,584,510 | 3,589,000 | |
| Class C, 1 month U.S. LIBOR + 1.250% 1.346% 10/15/36 (b)(c)(f) | 4,506,777 | 4,512,421 | |
| Class D, 1 month U.S. LIBOR + 1.450% 1.546% 10/15/36 (b)(c)(f) | 6,382,590 | 6,392,586 | |
| Class E, 1 month U.S. LIBOR + 1.800% 1.896% 10/15/36 (b)(c)(f) | 8,968,870 | 8,982,918 | |
| Class G, 1 month U.S. LIBOR + 2.300% 2.396% 10/15/36 (b)(c)(f) | 16,532,892 | 16,584,719 | |
| Series 2020-BXLP Class E, 1 month U.S. LIBOR + 1.600% 1.696% 12/15/36 (b)(c)(f) | 4,411,329 | 4,415,606 | |
| floater sequential payer: | |||
| Series 2021-MFM1 Class A, 1 month U.S. LIBOR + 0.700% 0.7955% 1/15/34 (b)(c)(f) | 3,562,000 | 3,565,345 | |
| Series 2021-SOAR Class A, 0.766% 6/15/38 (b)(c) | 7,620,000 | 7,632,209 | |
| floater, sequential payer Series 2019-IMC Class A, 1 month U.S. LIBOR + 1.000% 1.096% 4/15/34 (b)(c)(f) | 6,200,000 | 6,199,999 | |
| BXMT, Ltd. floater Series 2020-FL3 Class A, U.S. 30-Day Avg. Secured Overnight Fin. Rate (SOFR) Indx + 1.400% 1.5645% 3/15/37 (b)(f) | 20,100,000 | 20,175,343 | |
| CD Commercial Mortgage Trust Series 2017-CD6 Class A3, 3.104% 11/13/50 | 2,500,000 | 2,612,422 | |
| CF Hippolyta Issuer LLC sequential payer: | |||
| Series 2020-1: | |||
| Class A1, 1.69% 7/15/60 (b) | 17,488,056 | 17,821,118 | |
| Class A2, 1.99% 7/15/60 (b) | 6,978,827 | 7,111,992 | |
| Series 2021-1A Class A1, 1.53% 3/15/61 (b) | 8,897,568 | 9,066,568 | |
| CFCRE Mortgage Trust sequential payer Series 2016-C6 Class A2, 2.95% 11/10/49 | 947,640 | 1,015,206 | |
| CGDB Commercial Mortgage Trust floater Series 2019-MOB: | |||
| Class A, 1 month U.S. LIBOR + 0.950% 1.0455% 11/15/36 (b)(c)(f) | 3,687,000 | 3,686,999 | |
| Class B, 1 month U.S. LIBOR + 1.250% 1.3455% 11/15/36 (b)(c)(f) | 1,400,000 | 1,399,165 | |
| CGMS Commercial Mortgage Trust Series 2017-MDRA Class A, 3.656% 7/10/30 (b) | 4,982,000 | 5,019,898 | |
| CHC Commercial Mortgage Trust floater Series 2019-CHC: | |||
| Class A, 1 month U.S. LIBOR + 1.120% 1.216% 6/15/34 (b)(c)(f) | 13,955,140 | 13,955,136 | |
| Class B, 1 month U.S. LIBOR + 1.500% 1.596% 6/15/34 (b)(c)(f) | 2,103,645 | 2,101,132 | |
| Class C, 1 month U.S. LIBOR + 1.750% 1.846% 6/15/34 (b)(c)(f) | 2,376,653 | 2,366,253 | |
| CIM Retail Portfolio Trust floater Series 2021-RETL: | |||
| Class A, 1 month U.S. LIBOR + 1.400% 1.496% 8/15/36 (b)(c)(f) | 5,048,000 | 5,054,115 | |
| Class B, 1 month U.S. LIBOR + 1.900% 1.996% 8/15/36 (b)(c)(f) | 1,554,000 | 1,555,936 | |
| Class C, 1 month U.S. LIBOR + 2.300% 2.396% 8/15/36 (b)(c)(f) | 1,156,000 | 1,157,443 | |
| Class D, 1 month U.S. LIBOR + 3.050% 3.146% 8/15/36 (b)(c)(f) | 1,427,000 | 1,428,780 | |
| Citigroup Commercial Mortgage Trust: | |||
| floater Series 2020-WSS Class A, 1 month U.S. LIBOR + 1.950% 2.0455% 2/15/39 (b)(c)(f) | 6,045,385 | 6,256,698 | |
| sequential payer Series 2016-GC37 Class A3, 3.05% 4/10/49 | 3,106,002 | 3,269,808 | |
| Series 2015-GC29 Class XA, 1.1722% 4/10/48 (c)(k) | 30,201,015 | 969,887 | |
| Series 2015-GC33 Class XA, 1.0341% 9/10/58 (c)(k) | 18,282,553 | 558,095 | |
| Series 2016-C2 Class A3, 2.575% 8/10/49 | 2,800,000 | 2,926,390 | |
| Series 2016-GC36 Class A4, 3.349% 2/10/49 | 2,500,000 | 2,671,987 | |
| Series 2016-P6 Class XA, 0.8588% 12/10/49 (c)(k) | 16,412,288 | 386,728 | |
| COMM Mortgage Trust: | |||
| floater Series 2021-LBA Class E, 1 month U.S. LIBOR + 1.800% 1.896% 3/15/38 (b)(c)(f) | 3,975,000 | 3,974,997 | |
| sequential payer: | |||
| Series 2013-CR7 Class AM, 3.314% 3/10/46 (b) | 1,700,000 | 1,761,494 | |
| Series 2014-CR18 Class A5, 3.828% 7/15/47 | 1,610,000 | 1,738,261 | |
| Series 2014-CR17 Class XA, 1.1226% 5/10/47 (c)(k) | 17,969,313 | 370,651 | |
| Series 2014-CR20 Class XA, 1.1515% 11/10/47 (c)(k) | 16,924,045 | 460,190 | |
| Series 2014-LC17 Class XA, 0.8809% 10/10/47 (c)(k) | 36,446,990 | 641,143 | |
| Series 2014-UBS6: | |||
| Class A5, 3.644% 12/10/47 | 3,900,000 | 4,220,104 | |
| Class XA, 1.0257% 12/10/47 (c)(k) | 10,596,118 | 239,240 | |
| Series 2015-CR23 Class A3, 3.23% 5/10/48 | 2,500,000 | 2,656,288 | |
| Series 2015-CR24 Class A4, 3.432% 8/10/48 | 1,422,827 | 1,515,967 | |
| Series 2015-PC1 Class A4, 3.62% 7/10/50 | 1,462,650 | 1,520,452 | |
| Core Industrial Trust floater Series 2019-CORE Class A, 1 month U.S. LIBOR + 0.880% 0.976% 12/15/31 (b)(c)(f) | 424,204 | 424,496 | |
| Credit Suisse Mortgage Trust: | |||
| floater Series 2019-ICE4 Class A, 1 month U.S. LIBOR + 0.980% 1.076% 5/15/36 (b)(c)(f) | 5,263,000 | 5,278,445 | |
| sequential payer Series 2020-NET Class A, 2.2569% 8/15/37 (b) | 2,253,000 | 2,337,796 | |
| Series 2018-SITE: | |||
| Class A, 4.284% 4/15/36 (b) | 5,237,000 | 5,508,960 | |
| Class B, 4.5349% 4/15/36 (b) | 1,543,000 | 1,612,883 | |
| Class C, 4.9414% 4/15/36 (b)(c) | 1,033,000 | 1,072,027 | |
| Class D, 4.9414% 4/15/36 (b)(c) | 2,066,000 | 2,084,949 | |
| CSAIL Commercial Mortgage Trust: | |||
| sequential payer Series 2021-C20 Class A2, 2.4862% 3/15/54 | 16,000,000 | 16,694,150 | |
| Series 2016-C7 Class A4, 3.21% 11/15/49 | 3,186,022 | 3,405,251 | |
| CSMC Commercial Mortgage Trust sequential payer Series 2016-NXSR Class A4, 3.7948% 12/15/49 | 2,000,000 | 2,216,614 | |
| DBUBS Mortgage Trust Series 2011-LC3A Class C, 5.5573% 8/10/44 (b)(c) | 809,688 | 808,679 | |
| DBWF Mortgage Trust Series 2018-AMXP Class B, 4.122% 5/5/35 (b)(c) | 762,000 | 768,899 | |
| DOLP Trust sequential payer Series 2021-NYC Class A, 2.956% 5/10/41 (b) | 13,500,000 | 14,475,845 | |
| Extended Stay America Trust floater Series 2021-ESH: | |||
| Class A, 1 month U.S. LIBOR + 1.080% 1.176% 7/15/38 (b)(c)(f) | 3,697,000 | 3,708,419 | |
| Class B, 1 month U.S. LIBOR + 1.380% 1.476% 7/15/38 (b)(c)(f) | 2,105,000 | 2,112,978 | |
| Class C, 1 month U.S. LIBOR + 1.700% 1.796% 7/15/38 (b)(c)(f) | 1,552,000 | 1,559,776 | |
| Class D, 1 month U.S. LIBOR + 2.250% 2.346% 7/15/38 (b)(c)(f) | 3,136,000 | 3,159,444 | |
| Freddie Mac: | |||
| floater: | |||
| Series 2021-F104 Class A/S, U.S. 30-Day Avg. Secured Overnight Fin. Rate (SOFR) Indx + 0.250% 0.3% 1/25/31 (c)(f) | 3,800,000 | 3,805,270 | |
| Series 2021-F108 Class A/S, U.S. 30-Day Avg. Secured Overnight Fin. Rate (SOFR) Indx + 0.250% 0.3% 2/25/31 (c)(f) | 11,600,000 | 11,610,317 | |
| Series 2021-F109 Class A/S, U.S. 30-Day Avg. Secured Overnight Fin. Rate (SOFR) Indx + 0.240% 0.29% 3/25/31 (c)(f) | 12,800,000 | 12,811,535 | |
| Series 2021-F110 Class A/S, U.S. 30-Day Avg. Secured Overnight Fin. Rate (SOFR) Indx + 0.240% 0.29% 3/25/31 (c)(f) | 9,300,000 | 9,308,293 | |
| Series 2021-F111 Class A/S, U.S. 30-Day Avg. Secured Overnight Fin. Rate (SOFR) Indx + 0.240% 0.29% 3/25/31 (c)(f) | 7,799,662 | 7,806,698 | |
| Series 2021-F112 Class A/S, U.S. 30-Day Avg. Secured Overnight Fin. Rate (SOFR) Indx + 0.230% 0.28% 4/25/31 (c)(f) | 17,400,000 | 17,400,000 | |
| Series 2021-F113 Class A/S, U.S. 30-Day Avg. Secured Overnight Fin. Rate (SOFR) Indx + 0.230% 0.28% 5/25/28 (c)(f) | 15,011,748 | 15,030,765 | |
| Series 2021-F114 Class A/S, 0.27% 5/25/31 (c) | 23,610,000 | 23,577,668 | |
| Series 2021-F115 Class A/S, U.S. 30-Day Avg. Secured Overnight Fin. Rate (SOFR) Indx + 0.210% 0.26% 6/25/31 (c)(f) | 20,923,000 | 20,884,841 | |
| Series 2019-K095 Class X1, 1.0822% 6/25/29 (c)(k) | 13,955,760 | 921,950 | |
| Series 2020-K106 Class X1, 1.4774% 1/25/30 (c)(k) | 60,805,567 | 6,068,256 | |
| Series 2020-K111 Class X1, 1.6811% 5/25/30 (c)(k) | 24,945,552 | 2,989,607 | |
| Series 2021-K124 Class X1, 0.812% 12/25/30 (c)(k) | 6,495,830 | 389,213 | |
| Series 2021-K741 Class X1, 0.6575% 12/25/27 (c)(k) | 140,878,752 | 4,630,952 | |
| Greystone Commercial Capital Trust floater Series 2021-3 Class A, 1 month U.S. LIBOR + 2.230% 0% 8/17/23 (b)(c)(f) | 7,000,000 | 6,999,300 | |
| GS Mortgage Securities Corp. Trust floater Series 2019-BOCA Class A, 1 month U.S. LIBOR + 1.200% 1.296% 6/15/38 (b)(c)(f) | 6,630,000 | 6,630,180 | |
| GS Mortgage Securities Trust: | |||
| floater: | |||
| Series 2018-3PCK Class A, 1 month U.S. LIBOR + 1.450% 1.546% 9/15/31 (b)(c)(f) | 17,575,000 | 17,491,830 | |
| Series 2018-HART Class A, 1 month U.S. LIBOR + 1.090% 1.19% 10/15/31 (b)(c)(f) | 4,013,000 | 4,012,999 | |
| Series 2021-RENT Class C, 1 month U.S. LIBOR + 1.550% 1.638% 11/21/35 (b)(c)(f) | 3,525,000 | 3,527,103 | |
| sequential payer: | |||
| Series 2014-GC18 Class A3, 3.801% 1/10/47 | 868,155 | 902,808 | |
| Series 2015-GS1 Class A3, 3.734% 11/10/48 | 13,884,000 | 15,292,550 | |
| Series 2020-GSA2 Class A4, 1.721% 12/12/53 | 4,940,000 | 4,867,221 | |
| Series 2011-GC5 Class A/S, 5.209% 8/10/44 (b)(c) | 13,290,746 | 13,343,752 | |
| Series 2015-GC30 Class A3, 3.119% 5/10/50 | 1,940,264 | 2,059,358 | |
| Series 2015-GC34 Class XA, 1.3748% 10/10/48 (c)(k) | 5,586,349 | 231,478 | |
| Series 2019-GC40 Class A3, 2.904% 7/10/52 | 2,000,000 | 2,151,801 | |
| Series 2021-RENT: | |||
| Class D, 1 month U.S. LIBOR + 1.850% 1.938% 11/21/35 (b)(c)(f) | 2,175,000 | 2,177,698 | |
| Class XCP, 2.8236% 11/21/35 (b)(c)(k) | 72,804,200 | 819,535 | |
| JP Morgan Chase Commercial Mortgage Securities Trust floater Series 2018-PHH Class A, 1 month U.S. LIBOR + 0.910% 2.56% 6/15/35 (b)(c)(f) | 2,936,330 | 2,942,527 | |
| JPMBB Commercial Mortgage Securities Trust: | |||
| sequential payer Series 2015-C29 Class A3A2, 3.3423% 5/15/48 (b) | 4,232,044 | 4,486,490 | |
| Series 2013-C14 Class A/S, 4.4093% 8/15/46 | 3,088,000 | 3,245,576 | |
| Series 2014-C19 Class XA, 0.8157% 4/15/47 (c)(k) | 2,848,970 | 42,817 | |
| Series 2015-C30 Class A4, 3.5508% 7/15/48 | 1,900,000 | 2,045,808 | |
| JPMorgan Chase Commercial Mortgage Securities Corp. Series 2012-LC9 Class A/S, 3.3533% 12/15/47 (b) | 750,000 | 766,397 | |
| JPMorgan Chase Commercial Mortgage Securities Trust: | |||
| floater: | |||
| Series 2018-LAQ Class A, 1 month U.S. LIBOR + 1.000% 1.096% 6/15/32 (b)(c)(f) | 1,669,069 | 1,669,600 | |
| Series 2019-BKWD Class A, 1 month U.S. LIBOR + 1.000% 1.096% 9/15/29 (b)(c)(f) | 6,300,000 | 6,307,821 | |
| sequential payer Series 2013-LC11 Class A5, 2.9599% 4/15/46 | 1,800,000 | 1,855,168 | |
| Series 2012-C8 Class A/S, 3.4239% 10/15/45 (b) | 2,000,000 | 2,043,003 | |
| Series 2012-CBX Class A/S, 4.2707% 6/15/45 | 1,177,000 | 1,204,387 | |
| Series 2018-WPT: | |||
| Class AFX, 4.2475% 7/5/33 (b) | 2,700,000 | 2,857,101 | |
| Class CFX, 4.9498% 7/5/33 (b) | 919,000 | 966,510 | |
| Class DFX, 5.3503% 7/5/33 (b) | 1,414,000 | 1,485,553 | |
| Class EFX, 5.5422% 7/5/33 (b) | 1,934,000 | 1,994,299 | |
| Class XAFX, 1.2948% 7/5/33 (b)(c)(k) | 10,000,000 | 183,504 | |
| Series 2019-COR4 Class A3, 3.7629% 3/10/52 | 5,400,000 | 6,025,565 | |
| Series 2021-MHC Class XCP, 1 month U.S. LIBOR + 0.000% 1.4212% 4/15/38 (b)(c)(f)(k) | 164,060,500 | 3,768,699 | |
| LIFE Mortgage Trust floater Series 2021-BMR: | |||
| Class A, 1 month U.S. LIBOR + 0.700% 0.796% 3/15/38 (b)(c)(f) | 6,931,000 | 6,937,523 | |
| Class B, 1 month U.S. LIBOR + 0.880% 0.976% 3/15/38 (b)(c)(f) | 1,672,000 | 1,673,575 | |
| Class C, 1 month U.S. LIBOR + 1.100% 1.196% 3/15/38 (b)(c)(f) | 1,052,000 | 1,052,990 | |
| MBRT floater Series 2019-MBR Class A, 1 month U.S. LIBOR + 0.850% 0.946% 11/15/36 (b)(c)(f) | 6,000,000 | 6,000,302 | |
| Merit floater Series 2020-HILL Class A, 1 month U.S. LIBOR + 1.150% 1.246% 8/15/37 (b)(c)(f) | 1,982,257 | 1,987,198 | |
| MHC Commercial Mortgage Trust: | |||
| floater Series 2021-MHC Class E, 1 month U.S. LIBOR + 2.100% 2.1965% 4/15/38 (b)(c)(f) | 5,425,000 | 5,425,013 | |
| floater sequential payer Series 2021-MHC Class A, 1 month U.S. LIBOR + 0.800% 0.8965% 4/15/38 (b)(c)(f) | 4,900,000 | 4,902,919 | |
| Morgan Stanley BAML Trust: | |||
| sequential payer: | |||
| Series 2015-C21 Class A3, 3.077% 3/15/48 | 3,704,791 | 3,839,940 | |
| Series 2016-C28 Class A3, 3.272% 1/15/49 | 3,842,931 | 4,077,420 | |
| Series 2016-C29 Class ASB, 3.14% 5/15/49 | 470,748 | 495,748 | |
| Series 2015-C25: | |||
| Class A4, 3.372% 10/15/48 | 2,800,000 | 3,018,336 | |
| Class XA, 1.1987% 10/15/48 (c)(k) | 9,969,257 | 338,298 | |
| Series 2015-C26 Class A4, 3.252% 10/15/48 | 3,200,000 | 3,403,078 | |
| Series 2016-C32 Class A3, 3.459% 12/15/49 | 5,100,000 | 5,560,616 | |
| Morgan Stanley Capital I Trust: | |||
| floater Series 2018-BOP Class A, 1 month U.S. LIBOR + 0.850% 0.946% 8/15/33 (b)(c)(f) | 6,888,548 | 6,888,547 | |
| floater sequential payer Series 2019-NUGS Class A, 1 month U.S. LIBOR + 0.950% 2.45% 12/15/36 (b)(c)(f) | 5,200,000 | 5,221,271 | |
| sequential payer: | |||
| Series 2019-MEAD Class A, 3.17% 11/10/36 (b) | 13,482,000 | 14,149,730 | |
| Series 2021-L6 Class A3, 2.196% 6/15/54 | 7,000,000 | 7,121,232 | |
| Series 2015-UBS8 Class A3, 3.54% 12/15/48 | 3,000,000 | 3,242,699 | |
| Series 2016-UB12 Class A3, 3.337% 12/15/49 | 2,000,000 | 2,143,211 | |
| Series 2018-H4 Class A4, 4.31% 12/15/51 | 3,237,000 | 3,790,510 | |
| Series 2019-MEAD: | |||
| Class B, 3.283% 11/10/36 (b)(c) | 1,558,000 | 1,603,542 | |
| Class C, 3.283% 11/10/36 (b)(c) | 1,495,000 | 1,518,016 | |
| Class D, 3.283% 11/10/36 (b)(c) | 2,340,000 | 2,337,157 | |
| Series 2021-L6 Class XA, 1.3563% 6/15/54 (k) | 12,641,975 | 1,109,892 | |
| ONE Mortgage Trust floater Series 2021-PARK Class E, 1 month U.S. LIBOR + 1.750% 1.846% 3/15/36 (b)(c)(f) | 5,759,000 | 5,758,997 | |
| Prima Capital Ltd. floater Series 2021-9A Class B, 1 month U.S. LIBOR + 1.800% 1.8884% 12/15/37 (b)(c)(f) | 2,053,000 | 2,052,998 | |
| RETL floater Series 2019-RVP Class C, 1 month U.S. LIBOR + 2.100% 2.196% 3/15/36 (b)(c)(f) | 5,156,378 | 5,143,665 | |
| RLGH Trust floater Series 2021-TROT Class A, 1 month U.S. LIBOR + 0.800% 0.896% 4/15/36 (b)(c)(f) | 1,900,000 | 1,900,536 | |
| SFAVE Commercial Mortgage Securities Trust Series 2015-5AVE: | |||
| Class A1, 3.872% 1/5/43 (b)(c) | 740,000 | 794,070 | |
| Class A2A, 3.659% 1/5/43 (b)(c) | 9,930,000 | 11,084,865 | |
| U.S. sequential payer Series 2018-USDC Class A, 4.106% 5/13/38 (b) | 4,000,000 | 4,389,636 | |
| UBS Commercial Mortgage Trust: | |||
| sequential payer Series 2018-C12 Class A5, 4.2962% 8/15/51 | 3,000,000 | 3,458,246 | |
| Series 2012-C1 Class A/S, 4.171% 5/10/45 | 6,570,000 | 6,659,206 | |
| Series 2017-C1 Class A3, 3.283% 11/15/50 | 5,500,000 | 5,956,086 | |
| Series 2017-C7 Class XA, 1.1739% 12/15/50 (c)(k) | 17,099,091 | 822,610 | |
| Series 2018-C11 Class A3, 4.3124% 6/15/51 | 4,100,000 | 4,513,342 | |
| Series 2018-C13 Class A3, 4.0694% 10/15/51 | 6,000,000 | 6,690,127 | |
| Series 2018-C9 Class ASB, 4.09% 3/15/51 | 3,300,000 | 3,660,729 | |
| UBS-Barclays Commercial Mortgage Trust: | |||
| floater Series 2013-C6 Class A3, 1 month U.S. LIBOR + 0.790% 0.8865% 4/10/46 (b)(c)(f) | 5,266,886 | 5,254,414 | |
| Series 2012-C3 Class A/S, 3.814% 8/10/49 (b) | 1,400,000 | 1,441,207 | |
| VLS Commercial Mortgage Trust: | |||
| sequential payer Series 2020-LAB Class A, 2.13% 10/10/42 (b) | 3,760,000 | 3,812,134 | |
| Series 2020-LAB: | |||
| Class B, 2.453% 10/10/42 (b) | 300,000 | 307,187 | |
| Class X, 0.5162% 10/10/42(b)(c)(k) | 8,700,000 | 302,389 | |
| Wells Fargo Commercial Mortgage Trust: | |||
| floater Series 2021-FCMT Class A, 1 month U.S. LIBOR + 1.200% 1.296% 5/15/31 (b)(c)(f) | 4,470,000 | 4,486,758 | |
| sequential payer: | |||
| Series 2015-C29 Class ASB, 3.4% 6/15/48 | 1,124,983 | 1,179,258 | |
| Series 2016-C34 Class A4, 3.096% 6/15/49 | 6,124,000 | 6,530,655 | |
| Series 2016-LC24 Class A3, 2.684% 10/15/49 | 3,300,000 | 3,479,623 | |
| Series 2021-C59 Class A4, 2.343% 4/15/54 | 5,000,000 | 5,156,248 | |
| Series 2015-C31 Class XA, 1.1239% 11/15/48 (c)(k) | 6,713,352 | 226,686 | |
| Series 2017-C42 Class XA, 1.0289% 12/15/50 (c)(k) | 35,337,471 | 1,664,345 | |
| Series 2018-C46 Class XA, 1.1018% 8/15/51 (c)(k) | 15,576,712 | 677,638 | |
| Series 2018-C48 Class A5, 4.302% 1/15/52 | 3,181,000 | 3,715,402 | |
| WF-RBS Commercial Mortgage Trust: | |||
| Series 2012-C9 Class A/S, 3.388% 11/15/45 | 400,000 | 409,663 | |
| Series 2014-C24 Class XA, 0.9977% 11/15/47 (c)(k) | 6,138,404 | 141,428 | |
| Series 2014-LC14 Class XA, 1.4285% 3/15/47 (c)(k) | 8,415,888 | 208,311 | |
| TOTAL COMMERCIAL MORTGAGE SECURITIES | |||
| (Cost $979,455,187) | 992,581,831 | ||
| Municipal Securities - 0.2% | |||
| Bay Area Toll Auth. San Francisco Bay Toll Bridge Rev. Series 2009 F2, 6.263% 4/1/49 | 3,385,000 | 5,553,877 | |
| California Gen. Oblig. Series 2009, 7.5% 4/1/34 | 205,000 | 323,541 | |
| Colorado Reg'l. Trans. District Sales Tax Rev. (Fastracks Proj.) Series 2010 B, 5.844% 11/1/50 | 45,000 | 73,077 | |
| District of Columbia Income Tax Rev. Series 2010 F, 5.582% 12/1/35 | 75,000 | 99,529 | |
| Illinois Gen. Oblig.: | |||
| Series 2003: | $ | $ | |
| 4.95% 6/1/23 | 3,899,636 | 4,134,268 | |
| 5.1% 6/1/33 | 22,850,000 | 27,142,107 | |
| Series 2010-1, 6.63% 2/1/35 | 3,845,000 | 4,856,817 | |
| Series 2010-3: | |||
| 6.725% 4/1/35 | 2,510,000 | 3,186,395 | |
| 7.35% 7/1/35 | 4,655,000 | 6,069,216 | |
| Jobsohio Beverage Sys. Statewide Series 2020 A, 2.833% 1/1/38 | 325,000 | 344,254 | |
| Los Angeles Dept. Arpt. Rev. Series C: | |||
| 2.063% 5/15/34 | 500,000 | 496,436 | |
| 2.163% 5/15/35 | 500,000 | 495,598 | |
| Los Angeles Dept. of Wtr. & Pwr. Rev. Series 2010 A, 5.716% 7/1/39 | 190,000 | 272,887 | |
| Los Angeles Unified School District Series KRY, 5.75% 7/1/34 | 1,535,000 | 2,069,860 | |
| Massachusetts Commonwealth Trans. Fund Rev. (Accelerated Bridge Prog.) Series 2010 A, 5.731% 6/1/40 | 150,000 | 209,078 | |
| Miami-Dade County Aviation Rev. Series 2019 E, 2.529% 10/1/30 | 2,000,000 | 2,077,154 | |
| Michigan Fin. Auth. Rev. Series 2019 T, 3.384% 12/1/40 | 545,000 | 613,365 | |
| New Jersey Econ. Dev. Auth. State Pension Fdg. Rev. Series 1997, 7.425% 2/15/29 (Nat'l. Pub. Fin. Guarantee Corp. Insured) | 9,315,000 | 12,088,783 | |
| New Jersey Tpk. Auth. Tpk. Rev.: | |||
| Series 2009 E, 7.414% 1/1/40 | 1,620,000 | 2,702,865 | |
| Series 2010 A, 7.102% 1/1/41 | 855,000 | 1,383,900 | |
| Series 2021 B: | |||
| 1.963% 1/1/32 | 1,000,000 | 1,002,964 | |
| 2.113% 1/1/33 | 1,050,000 | 1,060,454 | |
| New York City Gen. Oblig. Series A3, 2.8% 8/1/30 | 3,250,000 | 3,506,274 | |
| New York City Transitional Fin. Auth. Rev.: | |||
| Series 2010 C2, 5.767% 8/1/36 | 900,000 | 1,161,725 | |
| Series 2021 E3, 1.97% 2/1/33 | 2,015,000 | 2,010,814 | |
| Series A3, 3.88% 8/1/31 | 1,170,000 | 1,335,290 | |
| Series A5, 2.69% 5/1/33 | 2,015,000 | 2,112,611 | |
| Series B2, 3.14% 8/1/28 | 2,735,000 | 3,004,949 | |
| New York State Dorm. Auth.: | |||
| Series 2019 F, 3.11% 2/15/39 | 3,250,000 | 3,614,048 | |
| Series 2021 C, 2.202% 3/15/34 | 945,000 | 961,562 | |
| Ohio State Univ. Gen. Receipts: | |||
| Series 2010 C, 4.91% 6/1/40 | 140,000 | 189,739 | |
| Series 2011 A, 4.8% 6/1/11 | 1,403,000 | 2,091,758 | |
| Port Auth. of New York & New Jersey 174th Series, 4.458% 10/1/62 | 515,000 | 707,799 | |
| Salt River Proj. Agricultural Impt. & Pwr. District Elec. Sys. Rev. Series 2010 A, 4.839% 1/1/41 | 750,000 | 1,000,864 | |
| Texas Private Activity Bond Surface Trans. Corp. (NTE Mobility Partners LLC North Tarrant Express Managed Lanes Proj.) Series 2019 B, 3.922% 12/31/49 | 555,000 | 636,688 | |
| Univ. of California Revs. Series 2015 J, 4.131% 5/15/45 | 1,750,000 | 2,094,718 | |
| Univ. of Michigan Rev. Series 2020 B, 2.437% 4/1/40 | 1,050,000 | 1,075,402 | |
| Univ. of Virginia Gen. Rev. Series 2021 B, 2.584% 11/1/51 | 1,320,000 | 1,342,353 | |
| TOTAL MUNICIPAL SECURITIES | |||
| (Cost $92,697,786) | 103,103,019 | ||
| Foreign Government and Government Agency Obligations - 0.2% | |||
| Arab Republic of Egypt 7.6003% 3/1/29 (b) | $632,000 | $691,566 | |
| Brazil Minas SPE 5.333% 2/15/28 (Reg. S) | 2,786,000 | 2,997,214 | |
| Brazilian Federative Republic: | |||
| 2.875% 6/6/25 | 1,000,000 | 1,033,500 | |
| 3.875% 6/12/30 | 990,000 | 993,898 | |
| 4.5% 5/30/29 | 200,000 | 211,600 | |
| CBB International Sukuk Co. 7 SPC 6.875% 10/5/25 (Reg. S) | 500,000 | 575,625 | |
| Colombian Republic: | |||
| 3% 1/30/30 | 1,800,000 | 1,760,963 | |
| 4.5% 1/28/26 | 550,000 | 597,541 | |
| 10.375% 1/28/33 | 1,350,000 | 2,006,691 | |
| Dominican Republic: | |||
| 4.5% 1/30/30 (b) | 1,500,000 | 1,558,875 | |
| 5.95% 1/25/27 (b) | 1,100,000 | 1,247,125 | |
| 6% 7/19/28 (b) | 1,250,000 | 1,431,250 | |
| Emirate of Abu Dhabi 2.5% 9/30/29 (Reg. S) | 1,200,000 | 1,269,000 | |
| Hungarian Republic: | |||
| 1.75% 6/5/35 (Reg. S) | EUR | 1,370,000 | 1,745,824 |
| 7.625% 3/29/41 | 580,000 | 985,928 | |
| Indonesian Republic: | |||
| 1.1% 3/12/33 | EUR | 3,500,000 | 4,080,967 |
| 2.8% 6/23/30 (b) | 1,300,000 | 1,351,838 | |
| 2.85% 2/14/30 | 400,000 | 420,325 | |
| 3.4% 9/18/29 | 420,000 | 459,060 | |
| 3.5% 1/11/28 | 4,450,000 | 4,906,959 | |
| Israeli State: | |||
| 3.875% 7/3/50 | 1,750,000 | 2,060,625 | |
| 4% 6/30/22 | 1,700,000 | 1,751,510 | |
| Italian Republic 2.375% 10/17/24 | 3,800,000 | 3,953,847 | |
| Kingdom of Saudi Arabia: | |||
| 3.25% 10/26/26 (Reg. S) | 550,000 | 597,300 | |
| 3.625% 3/4/28 (Reg. S) | 1,000,000 | 1,105,813 | |
| Panamanian Republic: | |||
| 3.16% 1/23/30 | 3,020,000 | 3,194,216 | |
| 3.875% 3/17/28 | 200,000 | 221,288 | |
| 4.3% 4/29/53 | 615,000 | 687,954 | |
| 4.5% 4/16/50 | 400,000 | 456,950 | |
| Peruvian Republic 2.844% 6/20/30 | 1,630,000 | 1,680,734 | |
| Philippine Republic: | |||
| 1.648% 6/10/31 | 400,000 | 392,544 | |
| 2.457% 5/5/30 | 600,000 | 631,566 | |
| 3.7% 3/1/41 | 1,010,000 | 1,115,293 | |
| Quebec Province yankee 7.125% 2/9/24 | 810,000 | 937,988 | |
| Republic of Paraguay: | |||
| 2.739% 1/29/33 (b) | 400,000 | 393,575 | |
| 4.95% 4/28/31 (b) | 400,000 | 463,200 | |
| Republic of Serbia: | |||
| 1.5% 6/26/29 (Reg. S) | EUR | 794,000 | 955,000 |
| 1.65% 3/3/33 (b) | EUR | 1,200,000 | 1,404,502 |
| 2.125% 12/1/30 (b) | 1,430,000 | 1,377,537 | |
| 3.125% 5/15/27 (Reg. S) | EUR | 712,000 | 938,057 |
| Romanian Republic: | |||
| 3% 2/14/31 (Reg. S) | 864,000 | 901,152 | |
| 3.875% 10/29/35 (b) | EUR | 1,210,000 | 1,671,856 |
| 4.125% 3/11/39 | EUR | 2,740,000 | 3,803,042 |
| South African Republic 4.85% 9/30/29 | 1,940,000 | 2,050,095 | |
| State of Qatar: | |||
| 3.4% 4/16/25 (b) | 3,165,000 | 3,438,575 | |
| 3.75% 4/16/30 (Reg. S) | 400,000 | 455,950 | |
| 4.5% 4/23/28 (Reg. S) | 1,400,000 | 1,650,513 | |
| 5.103% 4/23/48 (b) | 2,200,000 | 2,957,350 | |
| Sultanate of Oman 5.625% 1/17/28 (Reg. S) | 525,000 | 555,188 | |
| Turkish Republic 7.25% 12/23/23 | 2,200,000 | 2,382,600 | |
| Ukraine Government: | |||
| 4.375% 1/27/30 (b) | EUR | 1,800,000 | 2,023,333 |
| 6.75% 6/20/26 (Reg. S) | EUR | 1,450,000 | 1,886,827 |
| 7.75% 9/1/22 (b) | 2,800,000 | 2,927,400 | |
| 8.994% 2/1/24 (Reg. S) | 2,250,000 | 2,503,125 | |
| United Mexican States: | |||
| 2.659% 5/24/31 | 2,988,000 | 2,954,945 | |
| 3.75% 1/11/28 | 1,370,000 | 1,514,107 | |
| 4.15% 3/28/27 | 275,000 | 313,638 | |
| 4.28% 8/14/41 | 400,000 | 428,075 | |
| 4.5% 4/22/29 | 200,000 | 229,350 | |
| 4.75% 4/27/32 | 400,000 | 462,700 | |
| 4.75% 3/8/44 | 2,366,000 | 2,657,757 | |
| Uruguay Republic: | |||
| 4.375% 1/23/31 | 610,000 | 718,961 | |
| 4.975% 4/20/55 | 525,000 | 690,638 | |
| 5.1% 6/18/50 | 2,185,000 | 2,909,874 | |
| TOTAL FOREIGN GOVERNMENT AND GOVERNMENT AGENCY OBLIGATIONS | |||
| (Cost $95,874,249) | 96,732,299 | ||
| Bank Loan Obligations - 0.1% | |||
| COMMUNICATION SERVICES - 0.0% | |||
| Diversified Telecommunication Services - 0.0% | |||
| Level 3 Financing, Inc. Tranche B 1LN, term loan 3 month U.S. LIBOR + 1.750% 1.8346% 3/1/27 (c)(f)(n) | 2,000,000 | 1,970,000 | |
| Lumen Technologies, Inc. Tranche B 1LN, term loan 3 month U.S. LIBOR + 2.250% 2.3346% 3/15/27 (c)(f)(n) | 3,233,586 | 3,191,808 | |
| 5,161,808 | |||
| Media - 0.0% | |||
| CSC Holdings LLC Tranche B 5LN, term loan 3 month U.S. LIBOR + 2.500% 2.5951% 4/15/27 (c)(f)(n) | 797,975 | 787,290 | |
| Diamond Sports Group LLC Tranche B 1LN, term loan 3 month U.S. LIBOR + 3.250% 3.34% 8/24/26 (c)(f)(n) | 498,731 | 310,251 | |
| DIRECTV Financing LLC 1LN, term loan 1 month U.S. LIBOR + 5.000% 5.75% 8/2/27 (c)(f)(n) | 500,000 | 499,715 | |
| iHeartCommunications, Inc. 1LN, term loan 3 month U.S. LIBOR + 3.000% 3.0846% 5/1/26 (c)(f)(n) | 538,996 | 533,945 | |
| Neptune Finco Corp. Tranche B, term loan 3 month U.S. LIBOR + 2.250% 2.3451% 7/17/25 (c)(f)(n) | 595,337 | 586,192 | |
| Sinclair Television Group, Inc. Tranche B 1LN, term loan 3 month U.S. LIBOR + 2.500% 2.59% 9/30/26 (c)(f)(n) | 596,962 | 584,127 | |
| Virgin Media Bristol LLC Tranche N, term loan 3 month U.S. LIBOR + 2.500% 2.5955% 1/31/28 (c)(f)(n) | 2,000,000 | 1,977,500 | |
| 5,279,020 | |||
| Wireless Telecommunication Services - 0.0% | |||
| Digicel International Finance Ltd. Tranche B, term loan 3 month U.S. LIBOR + 3.250% 5.96% 5/25/24 (c)(f)(n) | 648,316 | 623,194 | |
| TOTAL COMMUNICATION SERVICES | 11,064,022 | ||
| CONSUMER DISCRETIONARY - 0.0% | |||
| Diversified Consumer Services - 0.0% | |||
| Adtalem Global Education, Inc. Tranche B 1LN, term loan 3 month U.S. LIBOR + 4.500% 5.25% 2/12/28 (c)(f)(n) | 375,000 | 375,281 | |
| Spin Holdco, Inc. Tranche B 1LN, term loan 3 month U.S. LIBOR + 4.000% 4.75% 3/4/28 (c)(f)(n) | 847,875 | 848,299 | |
| 1,223,580 | |||
| Hotels, Restaurants & Leisure - 0.0% | |||
| Caesars Resort Collection LLC Tranche B 1LN, term loan 3 month U.S. LIBOR + 2.750% 2.8346% 12/22/24 (c)(f)(n) | 3,339 | 3,309 | |
| Churchill Downs, Inc. Tranche B, term loan 3 month U.S. LIBOR + 2.000% 4.35% 12/27/24 (c)(f)(n) | 1,094,330 | 1,082,019 | |
| Penn National Gaming, Inc. Tranche B, term loan 3 month U.S. LIBOR + 2.250% 3% 10/15/25 (c)(f)(n) | 1,988,612 | 1,980,220 | |
| 3,065,548 | |||
| Specialty Retail - 0.0% | |||
| Michaels Companies, Inc. 1LN, term loan 3 month U.S. LIBOR + 4.250% 5% 4/15/28 (c)(f)(n) | 1,750,000 | 1,750,000 | |
| TOTAL CONSUMER DISCRETIONARY | 6,039,128 | ||
| CONSUMER STAPLES - 0.0% | |||
| Food & Staples Retailing - 0.0% | |||
| BJ's Wholesale Club, Inc. Tranche B 1LN, term loan 3 month U.S. LIBOR + 2.000% 2.0966% 2/3/24 (c)(f)(n) | 503,297 | 502,718 | |
| Food Products - 0.0% | |||
| JBS U.S.A. Lux SA Tranche B 1LN, term loan 3 month U.S. LIBOR + 2.000% 2.0846% 5/1/26 (c)(f)(n) | 2,984,733 | 2,964,228 | |
| TOTAL CONSUMER STAPLES | 3,466,946 | ||
| ENERGY - 0.0% | |||
| Oil, Gas & Consumable Fuels - 0.0% | |||
| Buckeye Partners LP 1LN, term loan 3 month U.S. LIBOR + 2.250% 11/1/26 (f)(n)(o) | 248,750 | 245,874 | |
| FINANCIALS - 0.0% | |||
| Diversified Financial Services - 0.0% | |||
| Avolon TLB Borrower 1 (U.S.) LLC Tranche B3 1LN, term loan 3 month U.S. LIBOR + 1.750% 2.5% 1/15/25 (c)(f)(n) | 725,000 | 720,541 | |
| Insurance - 0.0% | |||
| AmWINS Group, Inc. Tranche B 1LN, term loan 3 month U.S. LIBOR + 2.250% 3% 2/19/28 (c)(f)(n) | 2,986,247 | 2,955,966 | |
| Mortgage Real Estate Investment Trusts - 0.0% | |||
| Blackstone Mortgage Trust, Inc. Tranche B, term loan 3 month U.S. LIBOR + 2.250% 2.6536% 4/23/26 (c)(f)(n) | 498,731 | 492,497 | |
| TOTAL FINANCIALS | 4,169,004 | ||
| HEALTH CARE - 0.1% | |||
| Health Care Providers & Services - 0.0% | |||
| Gentiva Health Services, Inc. Tranche B 1LN, term loan 3 month U.S. LIBOR + 2.750% 2.875% 7/2/25 (c)(f)(n) | 2,943,820 | 2,936,461 | |
| Horizon Pharma U.S.A., Inc. Tranche B 1LN, term loan 3 month U.S. LIBOR + 2.000% 2.5% 3/15/28 (c)(f)(n) | 2,244,375 | 2,233,153 | |
| Icon Luxembourg Sarl Tranche B 1LN, term loan 1 month U.S. LIBOR + 2.500% 3% 7/1/28 (c)(f)(n) | 1,028,699 | 1,027,629 | |
| Indigo Merger Sub, Inc. Tranche B 1LN, term loan 1 month U.S. LIBOR + 2.500% 3% 7/1/28 (c)(f)(n) | 256,301 | 256,034 | |
| 6,453,277 | |||
| Health Care Technology - 0.0% | |||
| IQVIA, Inc. Tranche B2 1LN, term loan 3 month U.S. LIBOR + 2.000% 1/18/25 (f)(n)(o) | 795,866 | 788,902 | |
| Pharmaceuticals - 0.1% | |||
| Elanco Animal Health, Inc. Tranche B 1LN, term loan 3 month U.S. LIBOR + 1.750% 1.8458% 8/1/27 (c)(f)(n) | 2,982,417 | 2,928,615 | |
| Grifols, S.A. Tranche B 1LN, term loan 3 month U.S. LIBOR + 2.000% 2.082% 11/15/27 (c)(f)(n) | 1,741,162 | 1,716,785 | |
| Jazz Financing Lux SARL Tranche B 1LN, term loan 1 month U.S. LIBOR + 3.500% 4% 5/5/28 (c)(f)(n) | 1,245,000 | 1,245,000 | |
| Organon & Co. Tranche B 1LN, term loan 3 month U.S. LIBOR + 3.000% 3.5% 6/2/28 (c)(f)(n) | 2,000,000 | 2,005,840 | |
| Valeant Pharmaceuticals International, Inc. Tranche B 2LN, term loan 3 month U.S. LIBOR + 2.750% 2.8346% 11/27/25 (c)(f)(n) | 2,645,560 | 2,629,025 | |
| 10,525,265 | |||
| TOTAL HEALTH CARE | 17,767,444 | ||
| INDUSTRIALS - 0.0% | |||
| Airlines - 0.0% | |||
| United Airlines, Inc. Tranche B 1LN, term loan 3 month U.S. LIBOR + 3.750% 4.5% 4/21/28 (c)(f)(n) | 648,375 | 649,036 | |
| Commercial Services & Supplies - 0.0% | |||
| Intrado Corp. Tranche B 1LN, term loan 3 month U.S. LIBOR + 4.000% 5.5678% 10/10/24 (c)(f)(n) | 1,178,016 | 1,137,456 | |
| Road & Rail - 0.0% | |||
| Genesee & Wyoming, Inc. 1LN, term loan 3 month U.S. LIBOR + 2.000% 2.1473% 12/30/26 (c)(f)(n) | 721,348 | 713,232 | |
| TOTAL INDUSTRIALS | 2,499,724 | ||
| INFORMATION TECHNOLOGY - 0.0% | |||
| Communications Equipment - 0.0% | |||
| CommScope, Inc. Tranche B 1LN, term loan 3 month U.S. LIBOR + 3.250% 3.3346% 4/4/26 (c)(f)(n) | 1,594,424 | 1,574,892 | |
| IT Services - 0.0% | |||
| Peraton Corp. Tranche B 1LN, term loan 3 month U.S. LIBOR + 3.750% 4.5% 2/1/28 (c)(f)(n) | 1,246,875 | 1,246,613 | |
| Software - 0.0% | |||
| Change Healthcare Holdings LLC Tranche B, term loan 3 month U.S. LIBOR + 2.500% 4.2859% 3/1/24 (c)(f)(n) | 991,412 | 988,933 | |
| McAfee LLC Tranche B, term loan 3 month U.S. LIBOR + 3.750% 3.8346% 9/29/24 (c)(f)(n) | 1,724,346 | 1,724,139 | |
| SS&C Technologies, Inc.: | |||
| Tranche B 3LN, term loan 3 month U.S. LIBOR + 1.750% 1.8346% 4/16/25 (c)(f)(n) | 251,052 | 247,086 | |
| Tranche B 4LN, term loan 3 month U.S. LIBOR + 1.750% 1.8346% 4/16/25 (c)(f)(n) | 193,339 | 190,285 | |
| Tranche B 5LN, term loan 3 month U.S. LIBOR + 1.750% 1.8346% 4/16/25 (c)(f)(n) | 595,074 | 586,487 | |
| 3,736,930 | |||
| TOTAL INFORMATION TECHNOLOGY | 6,558,435 | ||
| MATERIALS - 0.0% | |||
| Chemicals - 0.0% | |||
| Solenis International LP Tranche 1LN, term loan 3 month U.S. LIBOR + 4.000% 12/18/23 (f)(n)(o) | 6,615,681 | 6,606,221 | |
| Starfruit U.S. Holdco LLC Tranche B, term loan 3 month U.S. LIBOR + 2.750% 2.8379% 10/1/25 (c)(f)(n) | 2,168,606 | 2,142,279 | |
| Zep, Inc. Tranche B 1LN, term loan 3 month U.S. LIBOR + 4.000% 8/11/24 (f)(n)(o) | 1,492,248 | 1,440,019 | |
| 10,188,519 | |||
| Containers & Packaging - 0.0% | |||
| Berry Global, Inc. Tranche Z 1LN, term loan 3 month U.S. LIBOR + 1.750% 1.8563% 7/1/26 (c)(f)(n) | 536,162 | 531,026 | |
| TOTAL MATERIALS | 10,719,545 | ||
| REAL ESTATE - 0.0% | |||
| Real Estate Management & Development - 0.0% | |||
| Brookfield Retail Holdings VII Sub 3 LLC Tranche A2 LN, term loan 3 month U.S. LIBOR + 3.000% 8/24/23 (f)(n)(o) | 985,450 | 982,168 | |
| VICI Properties, LLC Tranche B 1LN, term loan 3 month U.S. LIBOR + 1.750% 1.8379% 12/22/24 (c)(f)(n) | 3,600,000 | 3,577,896 | |
| 4,560,064 | |||
| UTILITIES - 0.0% | |||
| Electric Utilities - 0.0% | |||
| Vistra Operations Co. LLC Tranche B 3LN, term loan 3 month U.S. LIBOR + 1.750% 1.8362% 12/31/25 (c)(f)(n) | 497,231 | 490,662 | |
| Independent Power and Renewable Electricity Producers - 0.0% | |||
| Calpine Corp. Tranche B9 1LN, term loan 3 month U.S. LIBOR + 2.000% 4/5/26 (f)(n)(o) | 3,233,503 | 3,177,660 | |
| TOTAL UTILITIES | 3,668,322 | ||
| TOTAL BANK LOAN OBLIGATIONS | |||
| (Cost $71,277,987) | 70,758,508 | ||
| Bank Notes - 0.0% | |||
| Discover Bank: | |||
| 3.45% 7/27/26 | $435,000 | $474,785 | |
| 4.682% 8/9/28 (c) | 3,503,000 | 3,724,500 | |
| Regions Bank 6.45% 6/26/37 | 2,533,000 | 3,634,009 | |
| Truist Bank: | |||
| 2.25% 3/11/30 | 625,000 | 639,745 | |
| 2.75% 5/1/23 | 645,000 | 670,514 | |
| TOTAL BANK NOTES | |||
| (Cost $7,591,492) | 9,143,553 | ||
| Shares | Value | ||
| Fixed-Income Funds - 66.6% | |||
| High Yield Fixed-Income Funds - 1.3% | |||
| iShares iBoxx $ High Yield Corporate Bond ETF | 810,000 | $71,352,900 | |
| Stone Harbor Emerging Markets Debt Fund | 25,215,255 | 250,639,636 | |
| TCW Emerging Markets Income Fund Class N | 23,622,679 | 250,636,622 | |
| TOTAL HIGH YIELD FIXED-INCOME FUNDS | 572,629,158 | ||
| Intermediate Government Funds - 2.0% | |||
| Fidelity SAI U.S. Treasury Bond Index Fund (p) | 89,837,480 | 915,443,916 | |
| Intermediate-Term Bond Funds - 60.2% | |||
| American Funds The Bond Fund of America Class F2 | 45,398,066 | 616,505,742 | |
| Baird Aggregate Bond Fund Class Institutional | 41,600,300 | 481,315,473 | |
| Baird Core Plus Bond Fund - Institutional Class | 69,512,447 | 830,673,744 | |
| DoubleLine Total Return Bond Fund Class N | 137,167,524 | 1,448,489,056 | |
| Fidelity SAI Total Bond Fund (p) | 594,627,854 | 6,344,679,204 | |
| Fidelity U.S. Bond Index Fund (p) | 24,670,390 | 300,978,752 | |
| John Hancock Bond Fund Class R6 | 25,877,895 | 429,314,286 | |
| JPMorgan Core Plus Bond Fund Class A | 55,628,676 | 479,519,187 | |
| PIMCO Income Fund Institutional Class | 92,755,823 | 1,120,490,336 | |
| PIMCO Investment Grade Credit Bond Fund Institutional Class | 64,827,400 | 718,287,594 | |
| PIMCO Mortgage Opportunities Fund Institutional Class | 112,490,572 | 1,232,896,665 | |
| PIMCO Total Return Fund Institutional Class | 609,348,624 | 6,361,599,587 | |
| Voya Intermediate Bond Fund Class I | 131,302,542 | 1,368,172,486 | |
| Western Asset Core Bond Fund Class I | 180,574,462 | 2,410,669,066 | |
| Western Asset Core Plus Bond Fund Class I | 284,142,767 | 3,469,383,181 | |
| TOTAL INTERMEDIATE-TERM BOND FUNDS | 27,612,974,359 | ||
| Long Government Bond Funds - 2.9% | |||
| Fidelity SAI Long-Term Treasury Bond Index Fund (p) | 37,225,937 | 425,492,461 | |
| iShares 20+ Year Treasury Bond ETF (q) | 6,072,060 | 903,704,690 | |
| TOTAL LONG GOVERNMENT BOND FUNDS | 1,329,197,151 | ||
| Sector Funds - 0.2% | |||
| Columbia Mortgage Opportunities Fund Class A | 7,884,080 | 84,517,339 | |
| TOTAL FIXED-INCOME FUNDS | |||
| (Cost $29,647,286,845) | 30,514,761,923 | ||
| Principal Amount(a) | Value | ||
| Preferred Securities - 0.2% | |||
| ENERGY - 0.0% | |||
| Oil, Gas & Consumable Fuels - 0.0% | |||
| BP Capital Markets PLC 4.375% (c)(r) | 6,695,000 | 7,259,913 | |
| Energy Transfer LP: | |||
| 6.5% (c)(r) | 3,770,000 | 3,917,359 | |
| 6.625% (c)(r) | 730,000 | 704,859 | |
| 11,882,131 | |||
| FINANCIALS - 0.2% | |||
| Banks - 0.2% | |||
| Bank of America Corp. 4.3% (c)(r) | 7,090,000 | 7,340,558 | |
| Bank of Nova Scotia 4.65% (c)(r) | 12,927,000 | 13,308,876 | |
| Barclays Bank PLC 7.625% 11/21/22 | 27,412,000 | 30,155,714 | |
| Citigroup, Inc. 3.875% (c)(r) | 4,320,000 | 4,450,568 | |
| JPMorgan Chase & Co. 4.6% (c)(r) | 7,120,000 | 7,467,097 | |
| 62,722,813 | |||
| Capital Markets - 0.0% | |||
| Goldman Sachs Group, Inc. 3.65% (c)(r) | 1,750,000 | 1,769,177 | |
| Consumer Finance - 0.0% | |||
| Ally Financial, Inc. 4.7% (c)(r) | 350,000 | 369,135 | |
| American Express Co. 3.55% (c)(r) | 2,270,000 | 2,316,066 | |
| 2,685,201 | |||
| TOTAL FINANCIALS | 67,177,191 | ||
| TOTAL PREFERRED SECURITIES | |||
| (Cost $79,526,067) | 79,059,322 | ||
| Shares | Value | ||
| Money Market Funds - 4.3% | |||
| Fidelity Cash Central Fund 0.06% (s) | 905,718,831 | 905,899,975 | |
| Fidelity Investments Money Market Government Portfolio Institutional Class 0.01% (p)(t) | 493,060,991 | 493,060,991 | |
| Fidelity Securities Lending Cash Central Fund 0.06% (s)(u) | 435,313,534 | 435,357,065 | |
| State Street Institutional U.S. Government Money Market Fund Premier Class 0.03% (t) | 151,074,149 | 151,074,149 | |
| TOTAL MONEY MARKET FUNDS | |||
| (Cost $1,985,388,534) | 1,985,392,180 | ||
| TOTAL INVESTMENT IN SECURITIES - 106.3% | |||
| (Cost $47,314,817,944) | 48,733,870,372 | ||
| NET OTHER ASSETS (LIABILITIES) - (6.3)% | (2,889,083,319) | ||
| NET ASSETS - 100% | $45,844,787,053 |
| TBA Sale Commitments | ||
| Principal Amount | Value | |
| Ginnie Mae | ||
| 2% 9/1/51 | $(10,100,000) | $(10,313,312) |
| 2% 9/1/51 | (11,150,000) | (11,385,488) |
| 2% 9/1/51 | (10,000,000) | (10,211,200) |
| 2% 9/1/51 | (11,050,000) | (11,283,376) |
| 2.5% 9/1/51 | (6,300,000) | (6,532,914) |
| 2.5% 9/1/51 | (6,700,000) | (6,947,702) |
| 3% 9/1/51 | (3,000,000) | (3,136,172) |
| 3% 9/1/51 | (2,800,000) | (2,927,094) |
| 3% 9/1/51 | (4,950,000) | (5,174,683) |
| 3% 9/1/51 | (300,000) | (313,617) |
| 3% 9/1/51 | (2,800,000) | (2,927,094) |
| 3% 9/1/51 | (4,650,000) | (4,861,066) |
| 3% 9/1/51 | (1,500,000) | (1,568,086) |
| 3% 9/1/51 | (3,100,000) | (3,240,711) |
| 3% 9/1/51 | (2,150,000) | (2,247,590) |
| 3% 9/1/51 | (2,750,000) | (2,874,824) |
| 3% 9/1/51 | (1,300,000) | (1,359,008) |
| 3% 9/1/51 | (6,950,000) | (7,265,465) |
| 3% 9/1/51 | (1,300,000) | (1,359,008) |
| 3% 9/1/51 | (2,200,000) | (2,299,859) |
| 3% 9/1/51 | (700,000) | (731,773) |
| 3% 9/1/51 | (800,000) | (836,312) |
| 3% 9/1/51 | (7,250,000) | (7,579,082) |
| 3% 9/1/51 | (2,750,000) | (2,874,824) |
| 3% 9/1/51 | (6,950,000) | (7,265,465) |
| 3% 9/1/51 | (7,750,000) | (8,101,777) |
| TOTAL GINNIE MAE | (125,617,502) | |
| Uniform Mortgage Backed Securities | ||
| 1.5% 9/1/51 | (450,000) | (442,329) |
| 1.5% 9/1/51 | (550,000) | (540,625) |
| 1.5% 9/1/51 | (350,000) | (344,034) |
| 1.5% 9/1/51 | (300,000) | (294,886) |
| 1.5% 9/1/51 | (50,000) | (49,148) |
| 1.5% 9/1/51 | (50,000) | (49,148) |
| 1.5% 9/1/51 | (3,900,000) | (3,833,519) |
| 1.5% 9/1/51 | (3,900,000) | (3,833,519) |
| 1.5% 9/1/51 | (3,900,000) | (3,833,519) |
| 1.5% 9/1/51 | (3,900,000) | (3,833,519) |
| 1.5% 9/1/51 | (5,200,000) | (5,111,359) |
| 1.5% 9/1/51 | (4,600,000) | (4,521,587) |
| 1.5% 9/1/51 | (3,650,000) | (3,587,781) |
| 1.5% 9/1/51 | (3,550,000) | (3,489,486) |
| 1.5% 9/1/51 | (3,450,000) | (3,391,190) |
| 1.5% 9/1/51 | (3,600,000) | (3,538,633) |
| 1.5% 9/1/51 | (6,450,000) | (6,340,051) |
| 1.5% 9/1/51 | (3,850,000) | (3,784,372) |
| 1.5% 9/1/51 | (2,350,000) | (2,309,941) |
| 1.5% 9/1/51 | (7,000,000) | (6,880,676) |
| 1.5% 9/1/51 | (550,000) | (540,625) |
| 1.5% 9/1/51 | (7,100,000) | (6,978,971) |
| 1.5% 9/1/51 | (2,650,000) | (2,604,827) |
| 1.5% 9/1/51 | (1,200,000) | (1,179,544) |
| 1.5% 9/1/51 | (3,700,000) | (3,636,929) |
| 1.5% 9/1/51 | (4,550,000) | (4,472,439) |
| 1.5% 9/1/51 | (450,000) | (442,329) |
| 2% 9/1/51 | (4,550,000) | (4,614,803) |
| 2% 9/1/51 | (14,050,000) | (14,250,106) |
| 2% 9/1/51 | (13,950,000) | (14,148,681) |
| 2% 9/1/51 | (8,400,000) | (8,519,636) |
| 2% 9/1/51 | (5,650,000) | (5,730,470) |
| 2% 9/1/51 | (14,050,000) | (14,250,106) |
| 2% 9/1/51 | (14,050,000) | (14,250,106) |
| 2% 9/1/51 | (14,300,000) | (14,503,666) |
| 2% 9/1/51 | (14,300,000) | (14,503,666) |
| 2% 9/1/51 | (7,200,000) | (7,302,545) |
| 2% 9/1/51 | (7,200,000) | (7,302,545) |
| 2% 9/1/51 | (1,000,000) | (1,014,242) |
| 2% 9/1/51 | (6,950,000) | (7,048,985) |
| 2% 9/1/51 | (6,950,000) | (7,048,985) |
| 2% 9/1/51 | (13,900,000) | (14,097,969) |
| 2% 9/1/51 | (14,200,000) | (14,402,242) |
| 2% 9/1/51 | (12,850,000) | (13,033,015) |
| 2% 9/1/51 | (12,950,000) | (13,134,439) |
| 2% 9/1/51 | (15,050,000) | (15,264,348) |
| 2% 9/1/51 | (14,750,000) | (14,960,075) |
| 2% 9/1/51 | (1,600,000) | (1,622,788) |
| 2% 9/1/51 | (1,550,000) | (1,572,076) |
| 2% 9/1/51 | (11,550,000) | (11,714,500) |
| 2% 9/1/51 | (950,000) | (963,530) |
| 2% 9/1/51 | (4,600,000) | (4,665,515) |
| 2% 9/1/51 | (12,200,000) | (12,373,757) |
| 2% 9/1/51 | (2,700,000) | (2,738,454) |
| 2% 9/1/51 | (4,550,000) | (4,614,803) |
| 2% 9/1/51 | (4,600,000) | (4,665,515) |
| 2% 9/1/51 | (14,300,000) | (14,503,666) |
| 2% 9/1/51 | (2,250,000) | (2,282,045) |
| 2% 9/1/51 | (14,200,000) | (14,402,242) |
| 2% 9/1/51 | (2,200,000) | (2,231,333) |
| 2% 9/1/51 | (8,450,000) | (8,570,348) |
| 2% 9/1/51 | (5,850,000) | (5,933,318) |
| 2.5% 9/1/51 | (7,200,000) | (7,479,001) |
| 2.5% 9/1/51 | (7,800,000) | (8,102,252) |
| 2.5% 9/1/51 | (375,000) | (389,531) |
| 2.5% 9/1/51 | (7,550,000) | (7,842,564) |
| 2.5% 9/1/51 | (7,200,000) | (7,479,001) |
| 2.5% 9/1/51 | (10,500,000) | (10,906,877) |
| 2.5% 9/1/51 | (11,350,000) | (11,789,815) |
| 2.5% 9/1/51 | (12,700,000) | (13,192,128) |
| 2.5% 9/1/51 | (2,400,000) | (2,493,000) |
| 2.5% 9/1/51 | (7,250,000) | (7,530,939) |
| 2.5% 9/1/51 | (1,000,000) | (1,038,750) |
| 2.5% 9/1/51 | (11,750,000) | (12,205,315) |
| 2.5% 9/1/51 | (3,450,000) | (3,583,688) |
| 2.5% 9/1/51 | (2,100,000) | (2,181,375) |
| 2.5% 10/1/51 | (6,500,000) | (6,738,674) |
| 3% 9/1/51 | (7,550,000) | (7,897,418) |
| 3% 9/1/51 | (2,300,000) | (2,405,836) |
| 3% 9/1/51 | (13,650,000) | (14,278,113) |
| 3% 9/1/51 | (13,650,000) | (14,278,113) |
| 3% 9/1/51 | (4,100,000) | (4,288,664) |
| 3% 9/1/51 | (6,400,000) | (6,694,500) |
| 3% 9/1/51 | (400,000) | (418,406) |
| 3% 9/1/51 | (4,650,000) | (4,863,973) |
| 3% 9/1/51 | (2,150,000) | (2,248,934) |
| 3% 9/1/51 | (2,750,000) | (2,876,543) |
| 3% 9/1/51 | (1,300,000) | (1,359,820) |
| 3% 9/1/51 | (1,300,000) | (1,359,820) |
| 3% 9/1/51 | (2,750,000) | (2,876,543) |
| 3% 9/1/51 | (6,950,000) | (7,269,808) |
| 3% 9/1/51 | (12,500,000) | (13,075,195) |
| 3% 9/1/51 | (8,300,000) | (8,681,929) |
| 3% 9/1/51 | (4,250,000) | (4,445,566) |
| 3% 9/1/51 | (7,750,000) | (8,106,621) |
| 3% 9/1/51 | (14,900,000) | (15,585,632) |
| 3% 9/1/51 | (15,350,000) | (16,056,339) |
| 3% 9/1/51 | (10,350,000) | (10,826,261) |
| 3% 9/1/51 | (1,950,000) | (2,039,730) |
| 3% 9/1/51 | (1,300,000) | (1,359,820) |
| 3% 9/1/51 | (2,750,000) | (2,876,543) |
| 3% 9/1/51 | (5,200,000) | (5,439,281) |
| 3% 9/1/51 | (2,350,000) | (2,458,137) |
| 3% 9/1/51 | (7,100,000) | (7,426,711) |
| 3% 9/1/51 | (2,750,000) | (2,876,543) |
| 3% 9/1/51 | (2,750,000) | (2,876,543) |
| 3% 9/1/51 | (2,950,000) | (3,085,746) |
| 3% 9/1/51 | (4,700,000) | (4,916,273) |
| 3% 9/1/51 | (5,800,000) | (6,066,890) |
| 3% 10/1/51 | (7,550,000) | (7,893,289) |
| 3% 10/1/51 | (7,550,000) | (7,893,289) |
| 3% 10/1/51 | (5,800,000) | (6,063,719) |
| 3% 10/1/51 | (5,800,000) | (6,063,719) |
| 3.5% 9/1/51 | (7,750,000) | (8,198,047) |
| 3.5% 9/1/51 | (300,000) | (317,344) |
| 3.5% 9/1/51 | (2,500,000) | (2,644,531) |
| 3.5% 9/1/51 | (1,250,000) | (1,322,266) |
| 3.5% 9/1/51 | (100,000) | (105,781) |
| 3.5% 9/1/51 | (5,300,000) | (5,606,406) |
| 3.5% 9/1/51 | (3,200,000) | (3,385,000) |
| 3.5% 9/1/51 | (4,000,000) | (4,231,258) |
| 3.5% 9/1/51 | (3,000,000) | (3,173,438) |
| 3.5% 9/1/51 | (225,000) | (238,008) |
| 3.5% 9/1/51 | (3,600,000) | (3,808,125) |
| TOTAL UNIFORM MORTGAGE BACKED SECURITIES | (747,312,887) | |
| TOTAL TBA SALE COMMITMENTS | ||
| (Proceeds $872,280,315) | $(872,930,389) |
| Futures Contracts | |||||
| Number of contracts | Expiration Date | Notional Amount | Value | Unrealized Appreciation/(Depreciation) | |
| Purchased | |||||
| Treasury Contracts | |||||
| CBOT 10-Year U.S. Treasury Note Contracts (United States) | 20 | Dec. 2021 | $2,669,063 | $4,591 | $4,591 |
| CBOT 5-Year U.S. Treasury Note Contracts (United States) | 20 | Dec. 2021 | 2,474,375 | 124 | 124 |
| CBOT Ultra Long Term U.S. Treasury Bond Contracts (United States) | 179 | Dec. 2021 | 35,313,344 | 86,004 | 86,004 |
| TOTAL PURCHASED | 90,719 | ||||
| Sold | |||||
| Treasury Contracts | |||||
| CBOT 10-Year U.S. Treasury Note Contracts (United States) | 1 | Dec. 2021 | 133,453 | 196 | 196 |
| CBOT 2-Year U.S. Treasury Note Contracts (United States) | 1,240 | Dec. 2021 | 273,206,875 | (157,818) | (157,818) |
| CBOT 5-Year U.S. Treasury Note Contracts (United States) | 8 | Dec. 2021 | 989,750 | (690) | (690) |
| CBOT Long Term U.S. Treasury Bond Contracts (United States) | 100 | Dec. 2021 | 16,296,875 | 121,293 | 121,293 |
| TOTAL SOLD | (37,019) | ||||
| TOTAL FUTURES CONTRACTS | $53,700 |
The notional amount of futures purchased as a percentage of Net Assets is 0.1%
The notional amount of futures sold as a percentage of Net Assets is 0.6%
| Forward Foreign Currency Contracts | ||||||
| Currency Purchased | Currency Sold | Counterparty | Settlement Date | Unrealized Appreciation/(Depreciation) | ||
| EUR | 68,504,962 | USD | 80,370,021 | BNP Paribas | 9/2/21 | $517,213 |
| EUR | 2,135,767 | USD | 2,495,511 | Jpmorgan Chase Bank, N.A. | 9/2/21 | 26,296 |
| GBP | 18,121,351 | USD | 24,826,251 | BNP Paribas | 9/2/21 | 87,889 |
| USD | 83,305,693 | EUR | 70,640,729 | Jpmorgan Chase Bank, N.A. | 9/2/21 | (103,347) |
| USD | 24,991,028 | GBP | 18,121,351 | Citibank N.A. | 9/2/21 | 76,889 |
| USD | 80,421,606 | EUR | 68,504,962 | BNP Paribas | 10/4/21 | (519,952) |
| USD | 24,828,407 | GBP | 18,121,351 | BNP Paribas | 10/4/21 | (87,876) |
| TOTAL FORWARD FOREIGN CURRENCY CONTRACTS | $(2,888) | |||||
| Unrealized Appreciation | 708,287 | |||||
| Unrealized Depreciation | (711,175) | |||||
Swaps
| Underlying Reference | Maturity Date | Clearinghouse / Counterparty | Fixed Payment Received/(Paid) | Payment Frequency | Notional Amount | Value | Upfront Premium Received/(Paid) | Unrealized Appreciation/(Depreciation) |
| Credit Default Swaps | ||||||||
| Buy Protection | ||||||||
| CMBX N.A. AAA Index Series 13 | Dec. 2072 | Citigroup Global Markets Ltd. | (0.5%) | Monthly | $1,450,000 | $(2,840) | $8,491 | $5,651 |
| CMBX N.A. AAA Index Series 13 | Dec. 2072 | Citigroup Global Markets Ltd. | (0.5%) | Monthly | 1,420,000 | (2,781) | 6,490 | 3,709 |
| CMBX N.A. AAA Index Series 13 | Dec. 2072 | Goldman Sachs & Co. LLC | (0.5%) | Monthly | 3,090,000 | (6,051) | 8,406 | 2,355 |
| CMBX N.A. AAA Index Series 13 | Dec. 2072 | JPMorgan Securities LLC | (0.5%) | Monthly | 600,000 | (1,175) | 3,159 | 1,984 |
| TOTAL CREDIT DEFAULT SWAPS | $(12,847) | $26,546 | $13,699 | |||||
Swaps
| Payment Received | Payment Frequency | Payment Paid | Payment Frequency | Clearinghouse / Counterparty(1)(2) | Maturity Date | Notional Amount | Value | Upfront Premium Received/(Paid)(3) | Unrealized Appreciation/(Depreciation) |
| Interest Rate Swaps | |||||||||
| 0.25% | Semi - annual | 3-month LIBOR(4) | Quarterly | LCH | Sep. 2023 | $67,291,000 | $64,460 | $0 | $64,460 |
| 1.03% | Semi - annual | 3-month LIBOR(4) | Quarterly | CME | Jul. 2025 | 59,390,000 | (56,183) | 0 | (56,183) |
| 1.03% | Semi - annual | 3-month LIBOR(4) | Quarterly | CME | Jul. 2025 | 43,930,000 | (36,359) | 0 | (36,359) |
| 1.07% | Semi - annual | 3-month LIBOR(4) | Quarterly | CME | Jul. 2025 | 29,695,000 | (30,318) | 0 | (30,318) |
| 0.5% | Semi - annual | 3-month LIBOR(4) | Quarterly | LCH | Sep. 2026 | 21,053,000 | 193,709 | 0 | 193,709 |
| 1% | Semi - annual | 3-month LIBOR(4) | Quarterly | LCH | Sep. 2031 | 2,947,000 | 80,962 | 0 | 80,962 |
| 3-month LIBOR | Quarterly | 1% | Semi - annual | LCH | Sep. 2031 | 948,000 | (27,322) | 0 | (27,322) |
| 1.25% | Semi - annual | 3-month LIBOR(4) | Quarterly | LCH | Sep. 2051 | 939,000 | 80,003 | 0 | 80,003 |
| 3-month LIBOR | Quarterly | 1.77% | Semi - annual | CME | Jul. 2053 | 4,960,000 | 5,822 | 0 | 5,822 |
| 3-month LIBOR | Quarterly | 1.79% | Semi - annual | CME | Jul. 2053 | 3,675,000 | 4,364 | 0 | 4,364 |
| 3-month LIBOR | Quarterly | 1.81% | Semi - annual | CME | Jul. 2053 | 2,480,000 | 14,824 | 0 | 14,824 |
| TOTAL INTEREST RATE SWAPS | $293,962 | $0 | $293,962 | ||||||
(1) Swaps with LCH Clearnet Group (LCH) are centrally cleared over-the-counter (OTC) swaps.
(2) Swaps with CME Group (CME) and LCH Clearnet Group (LCH) are centrally cleared over-the-counter (OTC) swaps.
(3) Any premiums for centrally cleared over-the-counter (OTC) swaps are recorded periodically throughout the term of the swap to variation margin and included in unrealized appreciation (depreciation).
(4) Represents floating rate.
Currency Abbreviations
EUR – European Monetary Unit
GBP – British pound
Security Type Abbreviations
ETF – Exchange-Traded Fund
Legend
(a) Amount is stated in United States dollars unless otherwise noted.
(b) Security exempt from registration under Rule 144A of the Securities Act of 1933. These securities may be resold in transactions exempt from registration, normally to qualified institutional buyers. At the end of the period, the value of these securities amounted to $2,663,367,198 or 5.8% of net assets.
(c) Coupon rates for floating and adjustable rate securities reflect the rates in effect at period end.
(d) Non-income producing - Security is in default.
(e) Security or a portion of the security purchased on a delayed delivery or when-issued basis.
(f) Coupon is indexed to a floating interest rate which may be multiplied by a specified factor and/or subject to caps or floors.
(g) Level 3 security
(h) Security or a portion of the security was pledged to cover margin requirements for futures contracts. At period end, the value of securities pledged amounted to $985,672.
(i) Security or a portion of the security was pledged to cover margin requirements for centrally cleared OTC swaps. At period end, the value of securities pledged amounted to $1,448,943.
(j) Security or a portion of the security has been segregated as collateral for mortgage-backed or asset-backed securities purchased on a delayed delivery or when-issued basis. At period end, the value of securities pledged amounted to $105,889.
(k) Security represents right to receive monthly interest payments on an underlying pool of mortgages or assets. Principal shown is the outstanding par amount of the pool as of the end of the period.
(l) Coupon is inversely indexed to a floating interest rate multiplied by a specified factor. The price may be considerably more volatile than the price of a comparable fixed rate security.
(m) Represents an investment in an underlying pool of reverse mortgages which typically do not require regular principal and interest payments as repayment is deferred until a maturity event.
(n) Remaining maturities of bank loan obligations may be less than the stated maturities shown as a result of contractual or optional prepayments by the borrower. Such prepayments cannot be predicted with certainty.
(o) The coupon rate will be determined upon settlement of the loan after period end.
(p) Affiliated Fund
(q) Security or a portion of the security is on loan at period end.
(r) Security is perpetual in nature with no stated maturity date.
(s) Affiliated fund that is generally available only to investment companies and other accounts managed by Fidelity Investments. The rate quoted is the annualized seven-day yield of the fund at period end. A complete unaudited listing of the fund's holdings as of its most recent quarter end is available upon request. In addition, each Fidelity Central Fund's financial statements are available on the SEC's website or upon request.
(t) The rate quoted is the annualized seven-day yield of the fund at period end.
(u) Investment made with cash collateral received from securities on loan.
Affiliated Central Funds
Fiscal year to date information regarding the Fund's investments in Fidelity Central Funds, including the ownership percentage, is presented below.
| Fund | Value, beginning of period | Purchases | Sales Proceeds | Dividend Income | Realized Gain/Loss | Change in Unrealized appreciation (depreciation) | Value, end of period | % ownership, end of period |
| Fidelity Cash Central Fund 0.06% | $499,673,965 | $1,140,106,541 | $733,880,531 | $173,267 | $-- | $-- | $905,899,975 | 1.4% |
| Fidelity Securities Lending Cash Central Fund 0.06% | 815,150,050 | 3,042,143,907 | 3,421,936,892 | 1,286,328 | -- | -- | 435,357,065 | 1.3% |
| Total | $1,314,824,015 | $4,182,250,448 | $4,155,817,423 | $1,459,595 | $-- | $-- | $1,341,257,040 |
Amounts in the income column in the above table include any capital gain distributions from underlying funds, which are presented in the corresponding line-item in the Statement of Operations, if applicable. Amount for Fidelity Securities Lending Cash Central Fund represents the income earned on investing cash collateral, less rebates paid to borrowers and any lending agent fees associated with the loan, plus any premium payments received for lending certain types of securities.
Affiliated Underlying Funds
Fiscal year to date information regarding the Fund's investments in affiliated Underlying Funds is presented below. Exchanges between classes of the same affiliated Underlying Funds may occur. If an underlying Fund changes its name, the name presented below is the name in effect at period end.
| Affiliate | Value, beginning of period | Purchases | Sales Proceeds | Dividend Income | Realized Gain (loss) | Change in Unrealized appreciation (depreciation) | Value, end of period |
| Fidelity Investments Money Market Government Portfolio Institutional Class 0.01% | $289,245,261 | $1,665,178,107 | $1,461,362,377 | $31,905 | $-- | $-- | $493,060,991 |
| Fidelity SAI Long-Term Treasury Bond Index Fund | -- | 425,625,929 | -- | 636,126 | -- | (133,468) | 425,492,461 |
| Fidelity SAI Total Bond Fund | 6,210,522,165 | 72,989,034 | 10,000,000 | 72,988,347 | (229,446) | 71,397,451 | 6,344,679,204 |
| Fidelity SAI U.S. Treasury Bond Index Fund | 443,836,473 | 461,538,722 | -- | 3,538,739 | -- | 10,068,721 | 915,443,916 |
| Fidelity U.S. Bond Index Fund | 90,464,916 | 218,495,934 | 10,000,000 | 1,534,661 | (348,923) | 2,366,825 | 300,978,752 |
| Total | $7,034,068,815 | $2,843,827,726 | $1,481,362,377 | $78,729,778 | $(578,369) | $83,699,529 | $8,479,655,324 |
Amounts in the income column in the above table include any capital gain distributions from underlying funds, which are presented in the corresponding line-item in the Statement of Operations, if applicable.
Investment Valuation
The following is a summary of the inputs used, as of August 31, 2021, involving the Fund's assets and liabilities carried at fair value. The inputs or methodology used for valuing securities may not be an indication of the risk associated with investing in those securities. For more information on valuation inputs, and their aggregation into the levels used below, please refer to the Investment Valuation section in the accompanying Notes to Financial Statements.
| Valuation Inputs at Reporting Date: | ||||
| Description | Total | Level 1 | Level 2 | Level 3 |
| Investments in Securities: | ||||
| Corporate Bonds | $4,976,999,441 | $-- | $4,969,299,441 | $7,700,000 |
| U.S. Government and Government Agency Obligations | 4,153,721,550 | -- | 4,153,721,550 | -- |
| U.S. Government Agency - Mortgage Securities | 4,444,916,812 | -- | 4,444,916,812 | -- |
| Asset-Backed Securities | 995,629,580 | -- | 995,629,580 | -- |
| Collateralized Mortgage Obligations | 311,070,354 | -- | 311,070,354 | -- |
| Commercial Mortgage Securities | 992,581,831 | -- | 992,581,831 | -- |
| Municipal Securities | 103,103,019 | -- | 103,103,019 | -- |
| Foreign Government and Government Agency Obligations | 96,732,299 | -- | 96,732,299 | -- |
| Bank Loan Obligations | 70,758,508 | -- | 70,758,508 | -- |
| Bank Notes | 9,143,553 | -- | 9,143,553 | -- |
| Fixed-Income Funds | 30,514,761,923 | 30,514,761,923 | -- | -- |
| Preferred Securities | 79,059,322 | -- | 79,059,322 | -- |
| Money Market Funds | 1,985,392,180 | 1,985,392,180 | -- | -- |
| Total Investments in Securities: | $48,733,870,372 | $32,500,154,103 | $16,226,016,269 | $7,700,000 |
| Derivative Instruments: | ||||
| Assets | ||||
| Futures Contracts | $212,208 | $212,208 | $-- | $-- |
| Forward Foreign Currency Contracts | 708,287 | -- | 708,287 | -- |
| Swaps | 444,144 | -- | 444,144 | -- |
| Total Assets | $1,364,639 | $212,208 | $1,152,431 | $-- |
| Liabilities | ||||
| Futures Contracts | $(158,508) | $(158,508) | $-- | $-- |
| Forward Foreign Currency Contracts | ( 711,175) | -- | ( 711,175) | |
| Swaps | (163,029) | -- | (163,029) | -- |
| Total Liabilities | $(1,032,712) | $(158,508) | $(874,204) | $-- |
| Total Derivative Instruments: | $331,927 | $53,700 | $278,227 | $-- |
| Other Financial Instruments: | ||||
| TBA Sale Commitments | $(872,930,389) | $-- | $(872,930,389) | $-- |
| Total Other Financial Instruments: | $(872,930,389) | $-- | $(872,930,389) | $-- |
Value of Derivative Instruments
The following table is a summary of the Fund's value of derivative instruments by primary risk exposure as of August 31, 2021. For additional information on derivative instruments, please refer to the Derivative Instruments section in the accompanying Notes to Financial Statements.
| Primary Risk Exposure / Derivative Type | Value | |
| Asset | Liability | |
| Credit Risk | ||
| Swaps(a) | $0 | $(12,847) |
| Total Credit Risk | 0 | (12,847) |
| Foreign Exchange Risk | ||
| Forward Foreign Currency Contracts(b) | 708,287 | (711,175) |
| Total Foreign Exchange Risk | 708,287 | (711,175) |
| Interest Rate Risk | ||
| Futures Contracts(c) | 212,208 | (158,508) |
| Swaps(d) | 444,144 | (150,182) |
| Total Interest Rate Risk | 656,352 | (308,690) |
| Total Value of Derivatives | $1,364,639 | $(1,032,712) |
(a) For bi-lateral over-the-counter (OTC) swaps, reflects gross value which is presented in the Statement of Assets and Liabilities in the bi-lateral OTC swaps, at value line-items.
(b) Gross value is presented in the Statement of Assets and Liabilities in the unrealized appreciation/depreciation on forward foreign currency contracts line-items.
(c) Reflects gross cumulative appreciation (depreciation) on futures contracts as presented in the Schedule of Investments. In the Statement of Assets and Liabilities, the period end daily variation margin is included in receivable or payable for daily variation margin on futures contracts, and the net cumulative appreciation (depreciation) is included in Total accumulated earnings (loss).
(d) For centrally cleared over-the-counter (OTC) swaps, reflects gross cumulative appreciation (depreciation) as presented in the Schedule of Investments. In the Statement of Assets and Liabilities, the period end daily variation margin for centrally cleared OTC swaps is included in receivable or payable for daily variation margin on centrally cleared OTC swaps, and the net cumulative appreciation (depreciation) for centrally cleared OTC swaps is included in Total accumulated earnings (loss).
See accompanying notes which are an integral part of the financial statements.
Financial Statements
Statement of Assets and Liabilities
| August 31, 2021 (Unaudited) | ||
| Assets | ||
| Investment in securities, at value (including securities loaned of $423,540,414) — See accompanying schedule: Unaffiliated issuers (cost $37,882,442,806) | $38,912,958,008 | |
| Fidelity Central Funds (cost $1,341,253,394) | 1,341,257,040 | |
| Other affiliated issuers (cost $8,091,121,744) | 8,479,655,324 | |
| Total Investment in Securities (cost $47,314,817,944) | $48,733,870,372 | |
| Segregated cash with brokers for derivative instruments | 2,143,000 | |
| Cash | 1,011,934 | |
| Foreign currency held at value (cost $193,452) | 191,956 | |
| Receivable for investments sold | ||
| Regular delivery | 7,994,894 | |
| Delayed delivery | 751,716,473 | |
| Receivable for TBA sale commitments | 872,280,315 | |
| Unrealized appreciation on forward foreign currency contracts | 708,287 | |
| Receivable for fund shares sold | 15,334,178 | |
| Dividends receivable | 1,069,618 | |
| Interest receivable | 72,157,293 | |
| Distributions receivable from Fidelity Central Funds | 96,727 | |
| Receivable for daily variation margin on centrally cleared OTC swaps | 1,413,069 | |
| Prepaid expenses | 75,262 | |
| Other receivables | 482,992 | |
| Total assets | 50,460,546,370 | |
| Liabilities | ||
| Payable for investments purchased | ||
| Regular delivery | $123,171,401 | |
| Delayed delivery | 3,161,208,916 | |
| TBA sale commitments, at value | $872,930,389 | |
| Unrealized depreciation on forward foreign currency contracts | 711,175 | |
| Payable for fund shares redeemed | 16,469,258 | |
| Distributions payable | 3,493,328 | |
| Bi-lateral OTC swaps, at value | 12,847 | |
| Accrued management fee | 1,155,106 | |
| Payable for daily variation margin on futures contracts | 110,754 | |
| Other payables and accrued expenses | 1,139,078 | |
| Collateral on securities loaned | 435,357,065 | |
| Total liabilities | 4,615,759,317 | |
| Net Assets | $45,844,787,053 | |
| Net Assets consist of: | ||
| Paid in capital | $44,396,296,860 | |
| Total accumulated earnings (loss) | 1,448,490,193 | |
| Net Assets | $45,844,787,053 | |
| Net Asset Value, offering price and redemption price per share ($45,844,787,053 ÷ 4,163,897,810 shares) | $11.01 |
See accompanying notes which are an integral part of the financial statements.
Statement of Operations
| Six months ended August 31, 2021 (Unaudited) | ||
| Investment Income | ||
| Dividends: | ||
| Unaffiliated issuers | $269,373,999 | |
| Affiliated issuers | 78,641,818 | |
| Interest | 144,000,277 | |
| Income from Fidelity Central Funds (including $1,286,328 from security lending) | 1,459,595 | |
| Total income | 493,475,689 | |
| Expenses | ||
| Management fee | $60,921,434 | |
| Custodian fees and expenses | 118,033 | |
| Independent trustees' fees and expenses | 163,414 | |
| Registration fees | 828,010 | |
| Audit | 39,231 | |
| Legal | 47,229 | |
| Miscellaneous | 133,808 | |
| Total expenses before reductions | 62,251,159 | |
| Expense reductions | (54,263,479) | |
| Total expenses after reductions | 7,987,680 | |
| Net investment income (loss) | 485,488,009 | |
| Realized and Unrealized Gain (Loss) | ||
| Net realized gain (loss) on: | ||
| Investment securities: | ||
| Unaffiliated issuers | (32,762,360) | |
| Affiliated issuers | (578,369) | |
| Forward foreign currency contracts | 1,945,748 | |
| Foreign currency transactions | 288,153 | |
| Futures contracts | 11,390,242 | |
| Swaps | (602,143) | |
| Written options | (106,069) | |
| Capital gain distributions from underlying funds: | ||
| Unaffiliated issuers | 29,696,474 | |
| Affiliated issuers | 87,960 | |
| Total net realized gain (loss) | 9,359,636 | |
| Change in net unrealized appreciation (depreciation) on: | ||
| Investment securities: | ||
| Unaffiliated issuers | 327,545,157 | |
| Affiliated issuers | 83,699,529 | |
| Forward foreign currency contracts | (30,235) | |
| Assets and liabilities in foreign currencies | (76,930) | |
| Futures contracts | 1,188,617 | |
| Swaps | 631,118 | |
| Written options | 853,446 | |
| Delayed delivery commitments | (321,106) | |
| Total change in net unrealized appreciation (depreciation) | 413,489,596 | |
| Net gain (loss) | 422,849,232 | |
| Net increase (decrease) in net assets resulting from operations | $908,337,241 |
See accompanying notes which are an integral part of the financial statements.
Statement of Changes in Net Assets
| Six months ended August 31, 2021 (Unaudited) | Year ended February 28, 2021 | |
| Increase (Decrease) in Net Assets | ||
| Operations | ||
| Net investment income (loss) | $485,488,009 | $1,039,722,572 |
| Net realized gain (loss) | 9,359,636 | 1,562,646,711 |
| Change in net unrealized appreciation (depreciation) | 413,489,596 | (1,242,447,959) |
| Net increase (decrease) in net assets resulting from operations | 908,337,241 | 1,359,921,324 |
| Distributions to shareholders | (761,297,944) | (1,992,768,826) |
| Share transactions | ||
| Proceeds from sales of shares | 5,803,636,293 | 7,744,921,184 |
| Reinvestment of distributions | 739,587,665 | 1,942,678,899 |
| Cost of shares redeemed | (2,351,736,534) | (13,889,572,514) |
| Net increase (decrease) in net assets resulting from share transactions | 4,191,487,424 | (4,201,972,431) |
| Total increase (decrease) in net assets | 4,338,526,721 | (4,834,819,933) |
| Net Assets | ||
| Beginning of period | 41,506,260,332 | 46,341,080,265 |
| End of period | $45,844,787,053 | $41,506,260,332 |
| Other Information | ||
| Shares | ||
| Sold | 532,150,693 | 690,530,666 |
| Issued in reinvestment of distributions | 68,065,043 | 172,992,449 |
| Redeemed | (215,619,508) | (1,247,267,147) |
| Net increase (decrease) | 384,596,228 | (383,744,032) |
See accompanying notes which are an integral part of the financial statements.
Financial Highlights
Strategic Advisers Core Income Fund
| Six months ended (Unaudited) August 31, | Years endedFebruary 28, | |||||
| 2021 | 2021 | 2020 A | 2019 | 2018 | 2017 | |
| Selected Per–Share Data | ||||||
| Net asset value, beginning of period | $10.98 | $11.13 | $10.38 | $10.38 | $10.50 | $10.40 |
| Income from Investment Operations | ||||||
| Net investment income (loss)B | .122 | .286 | .354 | .324 | .270 | .300 |
| Net realized and unrealized gain (loss) | .103 | .116 | .796 | (.009) | (.106) | .174 |
| Total from investment operations | .225 | .402 | 1.150 | .315 | .164 | .474 |
| Distributions from net investment income | (.112) | (.292) | (.350) | (.309) | (.270) | (.297) |
| Distributions from net realized gain | (.083) | (.260) | (.050) | (.006) | (.014) | (.077) |
| Total distributions | (.195) | (.552) | (.400) | (.315) | (.284) | (.374) |
| Net asset value, end of period | $11.01 | $10.98 | $11.13 | $10.38 | $10.38 | $10.50 |
| Total ReturnC,D | 2.09% | 3.59% | 11.25% | 3.10% | 1.54% | 4.60% |
| Ratios to Average Net AssetsE,F | ||||||
| Expenses before reductions | .28%G | .28% | .28% | .30% | .31% | .31% |
| Expenses net of fee waivers, if any | .04%G | .03% | .03% | .05% | .06% | .06% |
| Expenses net of all reductions | .04%G | .03% | .03% | .05% | .06% | .06% |
| Net investment income (loss) | 2.22%G | 2.54% | 3.28% | 3.15% | 2.55% | 2.84% |
| Supplemental Data | ||||||
| Net assets, end of period (000 omitted) | $45,844,787 | $41,506,260 | $46,341,080 | $38,032,654 | $35,706,144 | $30,150,207 |
| Portfolio turnover rateH | 108%G | 109% | 65% | 78% | 45% | 52% |
A For the year ended February 29.
B Calculated based on average shares outstanding during the period.
C Total returns for periods of less than one year are not annualized.
D Total returns would have been lower if certain expenses had not been reduced during the applicable periods shown.
E Fees and expenses of any underlying mutual funds or exchange-traded funds (ETFs) are not included in the Fund's expense ratio. The Fund indirectly bears its proportionate share of these expenses. For additional expense information related to investments in Fidelity Central Funds, please refer to the "Investments in Fidelity Central Funds" note found in the Notes to Financial Statements section of the most recent Annual or Semi-Annual report.
F Expense ratios reflect operating expenses of the class. Expenses before reductions do not reflect amounts reimbursed, waived, or reduced through arrangements with the investment advisor, brokerage services, or other offset arrangements, if applicable, and do not represent the amount paid by the class during periods when reimbursements, waivers or reductions occur.
G Annualized
H Amount does not include the portfolio activity of any underlying mutual funds or exchange-traded funds (ETFs).
See accompanying notes which are an integral part of the financial statements.
Notes to Financial Statements (Unaudited)
For the period ended August 31, 2021
1. Organization.
Strategic Advisers Core Income Fund (the Fund) is a fund of Fidelity Rutland Square Trust II (the Trust), and is authorized to issue an unlimited number of shares. The Trust is registered under the Investment Company Act of 1940, as amended (the 1940 Act), as an open-end management investment company organized as a Delaware statutory trust. The Fund is offered exclusively to certain managed account clients of Strategic Advisers LLC (Strategic Advisers), an affiliate of Fidelity Management & Research Company LLC (FMR).
2. Significant Accounting Policies.
The Fund is an investment company and applies the accounting and reporting guidance of the Financial Accounting Standards Board (FASB) Accounting Standards Codification Topic 946 Financial Services - Investment Companies. The financial statements have been prepared in conformity with accounting principles generally accepted in the United States of America (GAAP), which require management to make certain estimates and assumptions at the date of the financial statements. Actual results could differ from those estimates. Subsequent events, if any, through the date that the financial statements were issued have been evaluated in the preparation of the financial statements. The Fund's Schedule of Investments lists any underlying mutual funds or exchange-traded funds (ETFs) but does not include the underlying holdings of these funds. The following summarizes the significant accounting policies of the Fund:
Investment Valuation. Investments are valued as of 4:00 p.m. Eastern time on the last calendar day of the period. The Board of Trustees (the Board) has delegated the day to day responsibility for the valuation of the Fund's investments to the Fair Value Committee (the Committee) established by the Fund's investment adviser. In accordance with valuation policies and procedures approved by the Board, the Fund attempts to obtain prices from one or more third party pricing vendors or brokers to value its investments. When current market prices, quotations or currency exchange rates are not readily available or reliable, investments will be fair valued in good faith by the Committee, in accordance with procedures adopted by the Board. Factors used in determining fair value vary by investment type and may include market or investment specific events, changes in interest rates and credit quality. The frequency with which these procedures are used cannot be predicted and they may be utilized to a significant extent. The Committee oversees the Fund's valuation policies and procedures and reports to the Board on the Committee's activities and fair value determinations. The Board monitors the appropriateness of the procedures used in valuing the Fund's investments and ratifies the fair value determinations of the Committee.
The Fund categorizes the inputs to valuation techniques used to value its investments into a disclosure hierarchy consisting of three levels as shown below:
- Level 1 – quoted prices in active markets for identical investments
- Level 2 – other significant observable inputs (including quoted prices for similar investments, interest rates, prepayment speeds, etc.)
- Level 3 – unobservable inputs (including the Fund's own assumptions based on the best information available)
Valuation techniques used to value the Fund's investments by major category are as follows:
Debt securities, including restricted securities, are valued based on evaluated prices received from third party pricing vendors or from brokers who make markets in such securities. Corporate bonds, bank notes, bank loan obligations, foreign government and government agency obligations, municipal securities, preferred securities and U.S. government and government agency obligations are valued by pricing vendors who utilize matrix pricing which considers yield or price of bonds of comparable quality, coupon, maturity and type or by broker-supplied prices. Asset backed securities, collateralized mortgage obligations, commercial mortgage securities and U.S. government agency mortgage securities are valued by pricing vendors who utilize matrix pricing which considers prepayment speed assumptions, attributes of the collateral, yield or price of bonds of comparable quality, coupon, maturity and type or by broker-supplied prices. Swaps are marked-to-market daily based on valuations from third party pricing vendors, registered derivatives clearing organizations (clearinghouses) or broker-supplied valuations. These pricing sources may utilize inputs such as interest rate curves, credit spread curves, default possibilities and recovery rates. When independent prices are unavailable or unreliable, debt securities and swaps may be valued utilizing pricing methodologies which consider similar factors that would be used by third party pricing vendors. For foreign debt securities, when significant market or security specific events arise, valuations may be determined in good faith in accordance with procedures adopted by the Board. Debt securities and swaps are generally categorized as Level 2 in the hierarchy but may be Level 3 depending on the circumstances.
Exchange-Traded Funds (ETFs) are valued at their last sale price or official closing price as reported by a third party pricing vendor on the primary market or exchange on which they are traded and are categorized as Level 1 in the hierarchy. In the event there were no sales during the day but the exchange reports a closing bid level, ETFs are valued at the closing bid and would be categorized as Level 1 in the hierarchy. In the event there was no closing bid, ETFs may be valued by another method that the Board believes reflects fair value in accordance with the Board's fair value pricing policies and may be categorized as Level 2 in the hierarchy.
Futures contracts are valued at the settlement price established each day by the board of trade or exchange on which they are traded and are categorized as Level 1 in the hierarchy. Investments in open-end mutual funds, including the Fidelity Central Funds, are valued at their closing net asset value (NAV) each business day and are categorized as Level 1 in the hierarchy. If an unaffiliated open-end mutual fund's NAV is unavailable, shares of that fund may be valued by another method that the Board believes reflects fair value in accordance with the Board's fair value pricing policies and is categorized as Level 2 in the hierarchy.
Changes in valuation techniques may result in transfers in or out of an assigned level within the disclosure hierarchy. The aggregate value of investments by input level as of August 31, 2021 is included at the end of the Fund's Schedule of Investments.
Foreign Currency. Foreign-denominated assets, including investment securities, and liabilities are translated into U.S. dollars at the exchange rates at period end. Purchases and sales of investment securities, income and dividends received, and expenses denominated in foreign currencies are translated into U.S. dollars at the exchange rate in effect on the transaction date.
The effects of exchange rate fluctuations on investments are included with the net realized and unrealized gain (loss) on investment securities. Other foreign currency transactions resulting in realized and unrealized gain (loss) are disclosed separately.
Realized gains and losses on foreign currency transactions arise from the disposition of foreign currency, realized changes in the value of foreign currency between the trade and settlement dates on security transactions, and the difference between the amounts of dividends, interest and foreign withholding taxes recorded on transaction date and the U.S. dollar equivalent of the amounts actually received or paid. Unrealized gains and losses on assets and liabilities in foreign currencies arise from changes in the value of foreign currency, and from assets and liabilities denominated in foreign currencies, other than investments, which are held at period end.
Investment Transactions and Income. For financial reporting purposes, the Fund's investment holdings and NAV include trades executed through the end of the last business day of the period. The NAV per share for processing shareholder transactions is calculated as of the close of business of the New York Stock Exchange (NYSE), normally 4:00 p.m. Eastern time and includes trades executed through the end of the prior business day. Gains and losses on securities sold are determined on the basis of identified cost. Dividend income is recorded on the ex-dividend date, except for certain dividends from foreign securities where the ex-dividend date may have passed, which are recorded as soon as the Fund is informed of the ex-dividend date. Non-cash dividends included in dividend income, if any, are recorded at the fair market value of the securities received. Income and capital gain distributions from Fidelity Central Funds, if any, are recorded on the ex-dividend date. Income and capital gain distributions from any underlying mutual funds or exchange-traded funds (ETFs) are recorded on the ex-dividend date. Certain distributions received by the Fund represent a return of capital or capital gain. The Fund determines the components of these distributions subsequent to the ex-dividend date, based upon receipt of tax filings or other correspondence relating to the underlying investment. These distributions are recorded as a reduction of cost of investments and/or as a realized gain. Interest income is accrued as earned and includes coupon interest and amortization of premium and accretion of discount on debt securities as applicable. Paid in Kind (PIK) income is recorded at the fair market value of the securities received. The principal amount on inflation-indexed securities is periodically adjusted to the rate of inflation and interest is accrued based on the principal amount. The adjustments to principal due to inflation are reflected as increases or decreases to Interest in the accompanying Statement of Operations. Investment income is recorded net of foreign taxes withheld where recovery of such taxes is uncertain. Debt obligations may be placed on non-accrual status and related interest income may be reduced by ceasing current accruals and writing off interest receivables when the collection of all or a portion of interest has become doubtful based on consistently applied procedures. A debt obligation is removed from non-accrual status when the issuer resumes interest payments or when collectability of interest is reasonably assured.
Expenses. Expenses directly attributable to a fund are charged to that fund. Expenses attributable to more than one fund are allocated among the respective funds on the basis of relative net assets or other appropriate methods. Expenses included in the accompanying financial statements reflect the expenses of that fund and do not include any expenses associated with any underlying mutual funds or exchange-traded funds. Although not included in a fund's expenses, a fund indirectly bears its proportionate share of these expenses through the net asset value of each underlying mutual fund or exchange-traded fund. Expense estimates are accrued in the period to which they relate and adjustments are made when actual amounts are known.
Deferred Trustee Compensation. Under a Deferred Compensation Plan (the Plan) for certain Funds, certain independent Trustees have elected to defer receipt of a portion of their annual compensation. Deferred amounts are invested in affiliated mutual funds, are marked-to-market and remain in a fund until distributed in accordance with the Plan. The investment of deferred amounts and the offsetting payable to the Trustees presented below are included in the accompanying Statement of Assets and Liabilities in other receivables and other payables and accrued expenses, as applicable.
| Strategic Advisers Core Income Fund | $482,992 |
Income Tax Information and Distributions to Shareholders. Each year, the Fund intends to qualify as a regulated investment company under Subchapter M of the Internal Revenue Code, including distributing substantially all of its taxable income and realized gains. As a result, no provision for U.S. Federal income taxes is required. The Fund files a U.S. federal tax return, in addition to state and local tax returns as required. The Fund's federal income tax returns are subject to examination by the Internal Revenue Service (IRS) for a period of three fiscal years after they are filed. State and local tax returns may be subject to examination for an additional fiscal year depending on the jurisdiction. Foreign taxes are provided for based on the Fund's understanding of the tax rules and rates that exist in the foreign markets in which it invests.
Distributions are declared and recorded daily and paid monthly from net investment income. Distributions from realized gains, if any, are declared and recorded on the ex-dividend date. Income and capital gain distributions are determined in accordance with income tax regulations, which may differ from GAAP.
Capital accounts within the financial statements are adjusted for permanent book-tax differences. These adjustments have no impact on net assets or the results of operations. Capital accounts are not adjusted for temporary book-tax differences which will reverse in a subsequent period.
Book-tax differences are primarily due to the short-term gain distributions from the Underlying Funds, futures contracts, swaps, foreign currency transactions, market discount, partnerships, deferred trustees compensation, capital loss carryforwards and losses deferred due to wash sales and futures contracts.
As of period end, the cost and unrealized appreciation (depreciation) in securities, and derivatives if applicable, for federal income tax purposes were as follows:
| Gross unrealized appreciation | $1,706,091,070 |
| Gross unrealized depreciation | (287,681,936) |
| Net unrealized appreciation (depreciation) | $1,418,409,134 |
| Tax cost | $47,315,169,637 |
Delayed Delivery Transactions and When-Issued Securities. During the period, certain Funds transacted in securities on a delayed delivery or when-issued basis. Payment and delivery may take place after the customary settlement period for that security. The price of the underlying securities and the date when the securities will be delivered and paid for are fixed at the time the transaction is negotiated. Securities purchased on a delayed delivery or when-issued basis are identified as such in the Schedule of Investments. Compensation for interest forgone in the purchase of a delayed delivery or when-issued debt security may be received. With respect to purchase commitments, each applicable Fund identifies securities as segregated in its records with a value at least equal to the amount of the commitment. Payables and receivables associated with the purchases and sales of delayed delivery securities having the same coupon, settlement date and broker are offset. Delayed delivery or when-issued securities that have been purchased from and sold to different brokers are reflected as both payables and receivables in the Statement of Assets and Liabilities under the caption "Delayed delivery", as applicable. Losses may arise due to changes in the value of the underlying securities or if the counterparty does not perform under the contract's terms, or if the issuer does not issue the securities due to political, economic, or other factors.
To-Be-Announced (TBA) Securities and Mortgage Dollar Rolls. TBA securities involve buying or selling mortgage-backed securities (MBS) on a forward commitment basis. A TBA transaction typically does not designate the actual security to be delivered and only includes an approximate principal amount; however delivered securities must meet specified terms defined by industry guidelines, including issuer, rate and current principal amount outstanding on underlying mortgage pools. Funds may enter into a TBA transaction with the intent to take possession of or deliver the underlying MBS, or a fund may elect to extend the settlement by entering into either a mortgage or reverse mortgage dollar roll. Mortgage dollar rolls are transactions where a fund sells TBA securities and simultaneously agrees to repurchase MBS on a later date at a lower price and with the same counterparty. Reverse mortgage dollar rolls involve the purchase and simultaneous agreement to sell TBA securities on a later date at a lower price. Transactions in mortgage dollar rolls and reverse mortgage dollar rolls are accounted for as purchases and sales and may result in an increase to a fund's portfolio turnover rate.
Purchases and sales of TBA securities involve risks similar to those discussed above for delayed delivery and when-issued securities. Also, if the counterparty in a mortgage dollar roll or a reverse mortgage dollar roll transaction files for bankruptcy or becomes insolvent, a fund's right to repurchase or sell securities may be limited. Additionally, when a fund sells TBA securities without already owning or having the right to obtain the deliverable securities (an uncovered forward commitment to sell), it incurs a risk of loss because it could have to purchase the securities at a price that is higher than the price at which it sold them. A fund may be unable to purchase the deliverable securities if the corresponding market is illiquid.
TBA securities subject to a forward commitment to sell at period end are included at the end of the Schedule of Investments under the caption "TBA Sale Commitments." The proceeds and value of these commitments are reflected in the Statement of Assets and Liabilities as "Receivable for TBA sale commitments" and "TBA sale commitments, at value," respectively.
Restricted Securities (including Private Placements). Funds may invest in securities that are subject to legal or contractual restrictions on resale. These securities generally may be resold in transactions exempt from registration or to the public if the securities are registered. Disposal of these securities may involve time-consuming negotiations and expense, and prompt sale at an acceptable price may be difficult. Information regarding restricted securities held at period end is included at the end of the Schedule of Investments, if applicable.
Loans and Other Direct Debt Instruments. Direct debt instruments are interests in amounts owed to lenders by corporate or other borrowers. These instruments may be in the form of loans, trade claims or other receivables and may include standby financing commitments such as revolving credit facilities that obligate a fund to supply additional cash to the borrower on demand. Loans may be acquired through assignment, participation, or may be made directly to a borrower. Such instruments are presented in the Bank Loan Obligations section in the Schedule of Investments. Certain funds may also invest in unfunded loan commitments, which are contractual obligations for future funding. Information regarding unfunded commitments is included at the end of the Schedule of Investments, if applicable.
3. Derivative Instruments.
Risk Exposures and the Use of Derivative Instruments. The Fund's investment objective allows the Fund to enter into various types of derivative contracts, including futures contracts, forward foreign currency contracts, options and swaps. Derivatives are investments whose value is primarily derived from underlying assets, indices or reference rates and may be transacted on an exchange or over-the-counter (OTC). Derivatives may involve a future commitment to buy or sell a specified asset based on specified terms, to exchange future cash flows at periodic intervals based on a notional principal amount, or for one party to make one or more payments upon the occurrence of specified events in exchange for periodic payments from the other party.
The Fund used derivatives to increase returns, to gain exposure to certain types of assets, to facilitate transactions in foreign-denominated securities and to manage exposure to certain risks as defined below. The success of any strategy involving derivatives depends on analysis of numerous economic factors, and if the strategies for investment do not work as intended, the Fund may not achieve its objectives.
The Fund's use of derivatives increased or decreased its exposure to the following risks:
| Credit Risk | Credit risk relates to the ability of the issuer of a financial instrument to make further principal or interest payments on an obligation or commitment that it has to the Fund. |
| Foreign Exchange Risk | Foreign exchange rate risk relates to fluctuations in the value of an asset or liability due to changes in currency exchange rates. |
| Interest Rate Risk | Interest rate risk relates to the fluctuations in the value of interest-bearing securities due to changes in the prevailing levels of market interest rates. |
The Fund is also exposed to additional risks from investing in derivatives, such as liquidity risk and counterparty credit risk. Liquidity risk is the risk that the Fund will be unable to close out the derivative in the open market in a timely manner. Counterparty credit risk is the risk that the counterparty will not be able to fulfill its obligation to the Fund. Derivative counterparty credit risk is managed through formal evaluation of the creditworthiness of all potential counterparties. On certain OTC derivatives such as forward foreign currency contracts, options and bi-lateral swaps, the Fund attempts to reduce its exposure to counterparty credit risk by entering into an International Swaps and Derivatives Association, Inc. (ISDA) Master Agreement with each of its counterparties. The ISDA Master Agreement gives the Fund the right to terminate all transactions traded under such agreement upon the deterioration in the credit quality of the counterparty beyond specified levels. The ISDA Master Agreement gives each party the right, upon an event of default by the other party or a termination of the agreement, to close out all transactions traded under such agreement and to net amounts owed under each transaction to one net payable by one party to the other. To mitigate counterparty credit risk on bi-lateral OTC derivatives, the Fund receives collateral in the form of cash or securities once the Fund's net unrealized appreciation on outstanding derivative contracts under an ISDA Master Agreement exceeds certain applicable thresholds, subject to certain minimum transfer provisions. The collateral received is held in segregated accounts with the Fund's custodian bank in accordance with the collateral agreements entered into between the Fund, the counterparty and the Fund's custodian bank. The Fund could experience delays and costs in gaining access to the collateral even though it is held by the Fund's custodian bank. The Fund's maximum risk of loss from counterparty credit risk related to bi-lateral OTC derivatives is generally the aggregate unrealized appreciation and unpaid counterparty payments in excess of any collateral pledged by the counterparty to the Fund. The Fund may be required to pledge collateral for the benefit of the counterparties on bi-lateral OTC derivatives in an amount not less than each counterparty's unrealized appreciation on outstanding derivative contracts, subject to certain minimum transfer provisions, and any such pledged collateral is identified in the Schedule of Investments. Exchange-traded futures contracts are not covered by the ISDA Master Agreement; however Counterparty credit risk related to exchange-traded futures contracts may be mitigated by the protection provided by the exchange on which they trade. Counterparty credit risk related to centrally cleared OTC swaps may be mitigated by the protection provided by the clearinghouse.
Investing in derivatives may involve greater risks than investing in the underlying assets directly and, to varying degrees, may involve risk of loss in excess of any initial investment and collateral received and amounts recognized in the Statement of Assets and Liabilities. In addition, there may be the risk that the change in value of the derivative contract does not correspond to the change in value of the underlying instrument.
Net Realized Gain (Loss) and Change in Net Unrealized Appreciation (Depreciation) on Derivatives. The table below, which reflects the impacts of derivatives on the financial performance of the Fund, summarizes the net realized gain (loss) and change in net unrealized appreciation (depreciation) for derivatives during the period as presented in the Statement of Operations.
| Primary Risk Exposure / Derivative Type | Net Realized Gain (Loss) | Change in Net Unrealized Appreciation (Depreciation) |
| Credit Risk | ||
| Swaps | (120,642) | 124,265 |
| Foreign Exchange Risk | ||
| Forward Foreign Currency Contracts | 1,945,748 | (30,235) |
| Interest Rate Risk | ||
| Futures Contracts | 11,390,242 | 1,188,617 |
| Purchased Options | (61,892) | (45,267) |
| Written Options | (106,069) | 853,446 |
| Swaps | (481,501) | 506,853 |
| Total Interest Rate Risk | 10,740,780 | 2,503,649 |
| Totals | $12,565,886 | $2,597,679 |
A summary of the value of derivatives by primary risk exposure as of period end, if any, is included at the end of the Schedule of Investments.
Forward Foreign Currency Contracts. Forward foreign currency contracts represent obligations to purchase or sell foreign currency on a specified future date at a price fixed at the time the contracts are entered into. The Fund used forward foreign currency contracts to facilitate transactions in foreign-denominated securities and to manage exposure to certain foreign currencies.
Forward foreign currency contracts are valued daily and fluctuations in exchange rates on open contracts are recorded as unrealized appreciation or (depreciation) and reflected in the Statement of Assets and Liabilities. When the contract is closed, the Fund realizes a gain or loss equal to the difference between the closing value and the value at the time it was opened. Non-deliverable forward foreign currency exchange contracts are settled with the counterparty in cash without the delivery of foreign currency. The net realized gain (loss) and change in net unrealized appreciation (depreciation) on forward foreign currency contracts during the period is presented in the Statement of Operations.
Any open forward foreign currency contracts at period end are presented in the Schedule of Investments under the caption "Forward Foreign Currency Contracts." The contract amount and unrealized appreciation (depreciation) reflects each contract's exposure to the underlying currency at period end and is representative of volume of activity during the period.
Futures Contracts. A futures contract is an agreement between two parties to buy or sell a specified underlying instrument for a fixed price at a specified future date. The Fund used futures contracts to manage its exposure to the bond market and fluctuations in interest rates.
Upon entering into a futures contract, a fund is required to deposit either cash or securities (initial margin) with a clearing broker in an amount equal to a certain percentage of the face value of the contract. Futures contracts are marked-to-market daily and subsequent daily payments (variation margin) are made or received by a fund depending on the daily fluctuations in the value of the futures contracts and are recorded as unrealized appreciation or (depreciation). This receivable and/or payable, if any, is included in daily variation margin on futures contracts in the Statement of Assets and Liabilities. Realized gain or (loss) is recorded upon the expiration or closing of a futures contract. The net realized gain (loss) and change in net unrealized appreciation (depreciation) on futures contracts during the period is presented in the Statement of Operations.
Any open futures contracts at period end are presented in the Schedule of Investments under the caption "Futures Contracts". The notional amount at value reflects each contract's exposure to the underlying instrument or index at period end and is representative of volume of activity during the period. Securities deposited to meet initial margin requirements are identified in the Schedule of Investments. Cash deposited to meet initial margin requirements is presented as segregated cash with brokers for derivative instruments in the Statement of Assets and Liabilities.
Options. Options give the purchaser the right, but not the obligation, to buy (call) or sell (put) an underlying security or financial instrument at an agreed exercise or strike price between or on certain dates. Options obligate the seller (writer) to buy (put) or sell (call) an underlying instrument at the exercise or strike price or cash settle an underlying derivative instrument if the holder exercises the option on or before the expiration date. The Fund uses OTC options, such as swaptions, which are options where the underlying instrument is a swap, to manage its exposure to fluctuations in interest rates.
Upon entering into an options contract, a fund will pay or receive a premium. Premiums paid on purchased options are reflected as cost of investments and premiums received on written options are reflected as a liability on the Statement of Assets and Liabilities. Certain options may be purchased or written with premiums to be paid or received on a future date. Options are valued daily and any unrealized appreciation (depreciation) is reflected on the Statement of Assets and Liabilities. When an option is exercised, the cost or proceeds of the underlying instrument purchased or sold is adjusted by the amount of the premium. When an option is closed the Fundwill realize a gain or loss depending on whether the proceeds or amount paid for the closing sale transaction is greater or less than the premium received or paid. When an option expires, gains and losses are realized to the extent of premiums received and paid, respectively. The net realized and unrealized gains (losses) on purchased options are included in the Statement of Operations in net realized gain (loss) and change in net unrealized appreciation (depreciation) on investment securities. The net realized gain (loss) and change in net unrealized appreciation (depreciation) on written options are presented in the Statement of Operations.
Any open options at period end are presented in the Schedule of Investments under the captions "Purchased Options," "Purchased Swaptions," "Written Options" and "Written Swaptions," as applicable.
Writing puts and buying calls tend to increase exposure to the underlying instrument while buying puts and writing calls tend to decrease exposure to the underlying instrument. For purchased options, risk of loss is limited to the premium paid, and for written options, risk of loss is the change in value in excess of the premium received.
Swaps. A swap is a contract between two parties to exchange future cash flows at periodic intervals based on a notional principal amount. A bi-lateral OTC swap is a transaction between a fund and a dealer counterparty where cash flows are exchanged between the two parties for the life of the swap. A centrally cleared OTC swap is a transaction executed between a fund and a dealer counterparty, then cleared by a futures commission merchant (FCM) through a clearinghouse. Once cleared, the clearinghouse serves as a central counterparty, with whom a fund exchanges cash flows for the life of the transaction, similar to transactions in futures contracts.
Bi-lateral OTC swaps are marked-to-market daily and changes in value are reflected in the Statement of Assets and Liabilities in the bi-lateral OTC swaps at value line items. Any upfront premiums paid or received upon entering a bi-lateral OTC swap to compensate for differences between stated terms of the swap and prevailing market conditions (e.g. credit spreads, interest rates or other factors) are recorded in net unrealized appreciation (depreciation) in the Statement of Assets and Liabilities and amortized to realized gain or (loss) ratably over the term of the swap. Any unamortized upfront premiums are presented in the Schedule of Investments.
Centrally cleared OTC swaps require a fund to deposit either cash or securities (initial margin) with the FCM, at the instruction of and for the benefit of the clearinghouse. Securities deposited to meet initial margin requirements are identified in the Schedule of Investments. Cash deposited to meet initial margin requirements is presented in segregated cash with brokers for derivative instruments in the Statement of Assets and Liabilities. Centrally cleared OTC swaps are marked-to-market daily and subsequent payments (variation margin) are made or received depending on the daily fluctuations in the value of the swaps and are recorded as unrealized appreciation or (depreciation). These daily payments, if any, are included in receivable or payable for daily variation margin on centrally cleared OTC swaps in the Statement of Assets and Liabilities. Any premiums for centrally cleared OTC swaps are recorded periodically throughout the term of the swap to variation margin and included in unrealized appreciation (depreciation) in the Statement of Assets and Liabilities. Any premiums are recognized as realized gain (loss) upon termination or maturity of the swap.
For both bi-lateral and centrally cleared OTC swaps, payments are exchanged at specified intervals, accrued daily commencing with the effective date of the contract and recorded as realized gain or (loss). Some swaps may be terminated prior to the effective date and realize a gain or loss upon termination. The net realized gain (loss) and change in net unrealized appreciation (depreciation) on swaps during the period is presented in the Statement of Operations.
Any open swaps at period end are included in the Schedule of Investments under the caption "Swaps" and are representative of volume of activity during the period.
Credit Default Swaps. Credit default swaps enable the Fund to buy or sell protection against specified credit events on a single-name issuer or a traded credit index. Under the terms of a credit default swap the buyer of protection (buyer) receives credit protection in exchange for making periodic payments to the seller of protection (seller) based on a fixed percentage applied to a notional principal amount. In return for these payments, the seller will be required to make a payment upon the occurrence of one or more specified credit events. The Fund enters into credit default swaps as a seller to gain credit exposure to an issuer and/or as a buyer to obtain a measure of protection against defaults of an issuer. Periodic payments are made over the life of the contract by the buyer provided that no credit event occurs.
For credit default swaps on most corporate and sovereign issuers, credit events include bankruptcy, failure to pay or repudiation/moratorium. For credit default swaps on corporate or sovereign issuers, the obligation that may be put to the seller is not limited to the specific reference obligation described in the Schedule of Investments. For credit default swaps on asset-backed securities, a credit event may be triggered by events such as failure to pay principal, maturity extension, rating downgrade or write-down. For credit default swaps on asset-backed securities, the reference obligation described represents the security that may be put to the seller. For credit default swaps on a traded credit index, a specified credit event may affect all or individual underlying securities included in the index.
As a seller, if an underlying credit event occurs, the Fund will pay a net settlement amount of cash equal to the notional amount of the swap less the recovery value of the reference obligation or underlying securities comprising an index. Only in the event of the industry's inability to value the underlying asset will the Fund be required to take delivery of the reference obligation or underlying securities comprising an index and pay an amount equal to the notional amount of the swap.
As a buyer, if an underlying credit event occurs, the Fund will receive a net settlement amount of cash equal to the notional amount of the swap less the recovery value of the reference obligation or underlying securities comprising an index. Only in the event of the industry's inability to value the underlying asset will the Fund be required to deliver the reference obligation or underlying securities comprising an index in exchange for payment of an amount equal to the notional amount of the swap.
Typically, the value of each credit default swap and credit rating disclosed for each reference obligation in the Schedule of Investments, where the Fund is the seller, can be used as measures of the current payment/performance risk of the swap. As the value of the swap changes as a positive or negative percentage of the total notional amount, the payment/performance risk may decrease or increase, respectively. In addition to these measures, the investment adviser monitors a variety of factors including cash flow assumptions, market activity and market sentiment as part of its ongoing process of assessing payment/performance risk.
Interest Rate Swaps. Interest rate swaps are agreements between counterparties to exchange cash flows, one based on a fixed rate, and the other on a floating rate. The Fund entered into interest rate swaps to manage its exposure to interest rate changes. Changes in interest rates can have an effect on both the value of bond holdings as well as the amount of interest income earned. In general, the value of bonds can fall when interest rates rise and can rise when interest rates fall.
4. Purchases and Sales of Investments.
Purchases and sales of securities, other than short-term securities, U.S. government securities and in-kind transactions, as applicable, are noted in the table below.
| Purchases ($) | Sales ($) | |
| Strategic Advisers Core Income Fund | 16,247,115,395 | 13,246,763,548 |
5. Fees and Other Transactions with Affiliates.
Management Fee. Strategic Advisers (the investment adviser) provides the Fund with investment management related services. For these services, the Fund pays a monthly management fee to the investment adviser. The management fee is calculated by adding the annual management fee rate of .25% of the Fund's average net assets throughout the month to the aggregate of the fee rates, payable monthly by the investment adviser, to the Fund's sub-advisers. The Fund's maximum aggregate management fee will not exceed .60% of the Fund's average net assets. For the reporting period, the total annualized management fee rate was .28% of the Fund's average net assets.
During the period, the investment adviser waived a portion of its management fee as described in the Expense Reductions note.
Sub-Advisers. FIAM LLC (an affiliate of the investment adviser), PGIM, Inc. and TCW Investment Management LLC each served as a sub-adviser for the Fund during the period. Sub-advisers provide discretionary investment advisory services for their allocated portion of the Fund's assets and are paid as described in the Management Fee note.
Interfund Trades. Funds may purchase from or sell securities to other funds affiliated with each sub-adviser under procedures adopted by the Board. The procedures have been designed to ensure these interfund trades are executed in accordance with Rule 17a-7 of the 1940 Act. Any interfund trades are included within the respective purchases and sales amounts shown in the Purchases and Sales of Investments note.
Other. During the period, the investment adviser reimbursed the Fund for certain losses as follows:
| Amount ($) | |
| Strategic Advisers Core Income Fund | 105,516 |
6. Investments in Fidelity Central Funds.
Funds may invest in Fidelity Central Funds, which are open-end investment companies generally available only to other investment companies and accounts managed by the investment adviser and its affiliates. The Schedule of Investments lists any Fidelity Central Funds held as an investment as of period end, but does not include the underlying holdings of each Fidelity Central Fund. An investing fund indirectly bears its proportionate share of the expenses of the underlying Fidelity Central Funds.
Based on its investment objective, each Fidelity Central Fund may invest or participate in various investment vehicles or strategies that are similar to those of the investing fund. These strategies are consistent with the investment objectives of the investing fund and may involve certain economic risks which may cause a decline in value of each of the Fidelity Central Funds and thus a decline in the value of the investing fund.
| Fidelity Central Fund | Investment Manager | Investment Objective | Investment Practices | Expense Ratio(a) |
| Fidelity Money Market Central Funds | Fidelity Management & Research Company LLC (FMR) | Each fund seeks to obtain a high level of current income consistent with the preservation of capital and liquidity. | Short-term Investments | Less than .005% to .01% |
(a) Expenses expressed as a percentage of average net assets and are as of each underlying Central Fund's most recent annual or semi-annual shareholder report.
A complete unaudited list of holdings for each Fidelity Central Fund is available upon request or at the Securities and Exchange Commission website at www.sec.gov. In addition, the financial statements of the Fidelity Central Funds, which are not covered by the Report of Independent Registered Public Accounting Firm, are available on the Securities and Exchange Commission website or upon request.
7. Committed Line of Credit.
Certain Funds participate with other funds managed by the investment adviser or an affiliate in a $4.25 billion credit facility (the "line of credit") to be utilized for temporary or emergency purposes to fund shareholder redemptions or for other short-term liquidity purposes. The participating funds have agreed to pay commitment fees on their pro-rata portion of the line of credit, which are reflected in Miscellaneous expenses on the Statement of Operations, and are listed below. During the period, there were no borrowings on this line of credit.
| Amount | |
| Strategic Advisers Core Income Fund | $38,422 |
8. Security Lending.
Funds lend portfolio securities through a lending agent from time to time in order to earn additional income. On the settlement date of the loan, a fund receives collateral (in the form of U.S. Treasury obligations, letters of credit and/or cash) against the loaned securities and maintains collateral in an amount not less than 100% of the market value of the loaned securities during the period of the loan. The market value of the loaned securities is determined at the close of business of a fund and any additional required collateral is delivered to a fund on the next business day. A fund or borrower may terminate the loan at any time, and if the borrower defaults on its obligation to return the securities loaned because of insolvency or other reasons, a fund may apply collateral received from the borrower against the obligation. A fund may experience delays and costs in recovering the securities loaned. Any cash collateral received is invested in the Fidelity Securities Lending Cash Central Fund. Any loaned securities are identified as such in the Schedule of Investments, and the value of loaned securities and cash collateral at period end, as applicable, are presented in the Statement of Assets and Liabilities. Security lending income represents the income earned on investing cash collateral, less rebates paid to borrowers and any lending agent fees associated with the loan, plus any premium payments received for lending certain types of securities. Security lending income is presented in the Statement of Operations as a component of income from Fidelity Central Funds.
9. Expense Reductions.
The investment adviser has contractually agreed to waive the Fund's management fee in an amount equal to .25% of the Fund's average net assets until September 30, 2023. During the period, this waiver reduced the Fund's management fee by $ 54,260,412.
Commissions paid to certain brokers with whom the investment adviser, or its affiliates, places trades on behalf of the Fund include an amount in addition to trade execution, which may be rebated back to the Fund to offset expenses. This amount totaled $7 for the period.
Through arrangements with the Fund's custodian, credits realized as a result of certain uninvested cash balances were used to reduce the Fund's expenses by $3,060.
10. Other.
Fund's organizational documents provide former and current trustees and officers with a limited indemnification against liabilities arising in connection with the performance of their duties to the fund. In the normal course of business, the fund may also enter into contracts that provide general indemnifications. The fund's maximum exposure under these arrangements is unknown as this would be dependent on future claims that may be made against the fund. The risk of material loss from such claims is considered remote.
Funds do not invest in underlying mutual funds for the purpose of exercising management or control; however, investments by funds within their principal investment strategies may represent a significant portion of the underlying mutual fund's net assets. At the end of the period, certain Funds were the owners of record of 10% or more of the total outstanding shares of the following underlying mutual funds as shown below.
| Fund | Strategic Advisers Core Income Fund |
| Fidelity SAI Long-Term Treasury Bond Index Fund | 18% |
| Fidelity SAI Total Bond Fund | 35% |
11. Coronavirus (COVID-19) Pandemic.
An outbreak of COVID-19 first detected in China during December 2019 has since spread globally and was declared a pandemic by the World Health Organization during March 2020. Developments that disrupt global economies and financial markets, such as the COVID-19 pandemic, may magnify factors that affect the Fund's performance.
Shareholder Expense Example
As a shareholder, you incur two types of costs: (1) transaction costs, which may include sales charges (loads) on purchase payments or redemption proceeds, as applicable and (2) ongoing costs, which generally include management fees, distribution and/or service (12b-1) fees and other Fund expenses. This Example is intended to help you understand your ongoing costs (in dollars) of investing in a fund and to compare these costs with the ongoing costs of investing in other mutual funds.
The Example is based on an investment of $1,000 invested at the beginning of the period and held for the entire period (March 1, 2021 to August 31, 2021).
Actual Expenses
The first line of the accompanying table provides information about actual account values and actual expenses. You may use the information in this line, together with the amount you invested, to estimate the expenses that you paid over the period. Simply divide your account value by $1,000.00 (for example, an $8,600 account value divided by $1,000.00 = 8.6), then multiply the result by the number in the first line for a class/Fund under the heading entitled "Expenses Paid During Period" to estimate the expenses you paid on your account during this period. If any fund is a shareholder of any underlying mutual funds or exchange-traded funds (ETFs) (the Underlying Funds), such fund indirectly bears its proportional share of the expenses of the Underlying Funds in addition to the direct expenses incurred presented in the table. These fees and expenses are not included in the annualized expense ratio used to calculate the expense estimate in the table below.
Hypothetical Example for Comparison Purposes
The second line of the accompanying table provides information about hypothetical account values and hypothetical expenses based on the actual expense ratio and an assumed rate of return of 5% per year before expenses, which is not the actual return. The hypothetical account values and expenses may not be used to estimate the actual ending account balance or expenses you paid for the period. You may use this information to compare the ongoing costs of investing in the Fund and other funds. To do so, compare this 5% hypothetical example with the 5% hypothetical examples that appear in the shareholder reports of the other funds. If any fund is a shareholder of any Underlying Funds, such fund indirectly bears its proportional share of the expenses of the Underlying Funds in addition to the direct expenses as presented in the table. These fees and expenses are not included in the annualized expense ratio used to calculate the expense estimate in the table below.
Please note that the expenses shown in the table are meant to highlight your ongoing costs only and do not reflect any transaction costs. Therefore, the second line of the table is useful in comparing ongoing costs only, and will not help you determine the relative total costs of owning different funds.
| Annualized Expense Ratio-A | Beginning Account Value March 1, 2021 | Ending Account Value August 31, 2021 | Expenses Paid During Period-B March 1, 2021 to August 31, 2021 |
|
| Strategic Advisers Core Income Fund | .04% | |||
| Actual | $1,000.00 | $1,020.90 | $.20 | |
| Hypothetical-C | $1,000.00 | $1,025.00 | $.20 |
A Annualized expense ratio reflects expenses net of applicable fee waivers.
B Expenses are equal to the annualized expense ratio, multiplied by the average account value over the period, multiplied by 184/ 365 (to reflect the one-half year period). The fees and expenses of any Underlying Funds are not included in each annualized expense ratio.
C 5% return per year before expenses
![]()
SSC-SANN-1021
1.912889.111
Strategic Advisers® Emerging Markets Fund
Offered exclusively to certain managed account clients of Strategic Advisers LLC or its affiliates - not available for sale to the general public
Semi-Annual Report
August 31, 2021
Contents
To view a fund's proxy voting record for the 12-month period ended June 30, visit http://www.fidelity.com/proxyvotingresults or visit the Securities and Exchange Commission's (SEC) web site at http://www.sec.gov.
You may also call 1-800-544-3455 to request a free copy of the proxy voting guidelines.
Standard & Poor's, S&P and S&P 500 are registered service marks of The McGraw-Hill Companies, Inc. and have been licensed for use by Fidelity Distributors Corporation.
Other third-party marks appearing herein are the property of their respective owners.
All other marks appearing herein are registered or unregistered trademarks or service marks of FMR LLC or an affiliated company. © 2021 FMR LLC. All rights reserved.
This report and the financial statements contained herein are submitted for the general information of the shareholders of the Fund. This report is not authorized for distribution to prospective investors in the Fund unless preceded or accompanied by an effective prospectus.
A fund files its complete schedule of portfolio holdings with the SEC for the first and third quarters of each fiscal year on Form N-PORT. Forms N-PORT are available on the SEC’s web site at http://www.sec.gov. A fund's Forms N-PORT may be reviewed and copied at the SEC’s Public Reference Room in Washington, DC. Information regarding the operation of the SEC's Public Reference Room may be obtained by calling 1-800-SEC-0330.
For a complete list of a fund's portfolio holdings, view the most recent holdings listing, semiannual report, or annual report on Fidelity's web site at http://www.fidelity.com, http://www.institutional.fidelity.com, or http://www.401k.com, as applicable.
NOT FDIC INSURED •MAY LOSE VALUE •NO BANK GUARANTEE
Neither the Fund nor Fidelity Distributors Corporation is a bank.
Note to Shareholders:
Early in 2020, the outbreak and spread of COVID-19 emerged as a public health emergency that had a major influence on financial markets, primarily based on its impact on the global economy and corporate earnings. On March 11, 2020, the World Health Organization declared the COVID-19 outbreak a pandemic, citing sustained risk of further global spread. The pandemic prompted a number of measures to limit the spread of COVID-19, including travel and border restrictions, quarantines, and restrictions on large gatherings. In turn, these resulted in lower consumer activity, diminished demand for a wide range of products and services, disruption in manufacturing and supply chains, and – given the wide variability in outcomes regarding the outbreak – significant market uncertainty and volatility. To help stem the turmoil, the U.S. government took unprecedented action – in concert with the U.S. Federal Reserve and central banks around the world – to help support consumers, businesses, and the broader economy, and to limit disruption to the financial system.
In general, the overall impact of the pandemic lessened in 2021, amid a resilient economy and widespread distribution of three COVID-19 vaccines granted emergency use authorization from the U.S. Food and Drug Administration (FDA) early in the year. Still, the situation remains dynamic, and the extent and duration of its influence on financial markets and the economy is highly uncertain, due in part to a recent spike in cases based on highly contagious variants of the coronavirus.
Extreme events such as the COVID-19 crisis are exogenous shocks that can have significant adverse effects on mutual funds and their investments. Although multiple asset classes may be affected by market disruption, the duration and impact may not be the same for all types of assets. Fidelity is committed to helping you stay informed amid news about COVID-19 and during increased market volatility, and we continue to take extra steps to be responsive to customer needs. We encourage you to visit us online, where we offer ongoing updates, commentary, and analysis on the markets and our funds.
Investment Summary (Unaudited)
The information in the following tables is based on the direct investments of the Fund.Top Ten Holdings as of August 31, 2021
| (excluding cash equivalents) | % of fund's net assets |
| Fidelity Advisor Emerging Markets Fund - Class Z | 7.0 |
| Fidelity SAI Emerging Markets Low Volatility Index Fund | 5.7 |
| Fidelity SAI Emerging Markets Value Index Fund | 5.4 |
| Taiwan Semiconductor Manufacturing Co. Ltd. | 4.0 |
| Fidelity SAI Emerging Markets Index Fund | 3.7 |
| Tencent Holdings Ltd. | 3.4 |
| Goldman Sachs Emerging Markets Equity Fund Institutional Shares | 3.1 |
| Samsung Electronics Co. Ltd. | 2.9 |
| Invesco Developing Markets Fund Class R6 | 2.4 |
| Aberdeen Emerging Markets Fund Institutional Service Class | 2.2 |
| 39.8 |
Top Five Market Sectors as of August 31, 2021
| (stocks only) | % of fund's net assets |
| Information Technology | 13.9 |
| Financials | 12.1 |
| Consumer Discretionary | 10.2 |
| Communication Services | 5.9 |
| Materials | 4.0 |
Geographic Diversification (% of fund's net assets)
| As of August 31, 2021 | ||
| United States of America* | 43.6% | |
| Cayman Islands | 12.5% | |
| Taiwan | 8.6% | |
| Korea (South) | 8.0% | |
| China | 5.9% | |
| India | 5.8% | |
| Brazil | 3.7% | |
| Russia | 1.8% | |
| South Africa | 1.7% | |
| Other | 8.4% | |

* Includes Short-Term investments and Net Other Assets (Liabilities).
Percentages are based on country or territory of incorporation and are adjusted for the effect of futures contracts, if applicable.
Asset Allocation (% of fund's net assets)
| As of August 31, 2021 | ||
| Common Stocks | 55.3% | |
| Preferred Stocks | 1.9% | |
| Diversifed Emerging Markets Funds | 34.2% | |
| Other | 1.8% | |
| Short-Term Investments and Net Other Assets (Liabilities) | 6.8% | |

Asset allocations of funds in the pie chart reflect the categorizations of assets as defined by Morningstar as of the reporting date.
Schedule of Investments August 31, 2021 (Unaudited)
Showing Percentage of Net Assets
| Common Stocks - 55.3% | |||
| Shares | Value | ||
| COMMUNICATION SERVICES - 5.9% | |||
| Diversified Telecommunication Services - 0.2% | |||
| Hellenic Telecommunications Organization SA | 129,032 | $2,538,988 | |
| KT Corp. | 196,383 | 5,552,732 | |
| LG Uplus Corp. | 525,384 | 6,369,500 | |
| Saudi Telecom Co. | 94,675 | 3,407,664 | |
| Telkom SA Ltd. (a) | 405,832 | 1,068,622 | |
| 18,937,506 | |||
| Entertainment - 0.9% | |||
| Bilibili, Inc.: | |||
| ADR (a) | 207,532 | 16,650,292 | |
| Class Z (a) | 103,120 | 8,215,122 | |
| FriendTimes, Inc. | 248,252 | 45,326 | |
| G-bits Network Technology Xiamen Co. Ltd. (A Shares) | 20,389 | 1,156,966 | |
| Gravity Co. Ltd. ADR (a) | 1,120 | 112,336 | |
| HUYA, Inc. ADR (a)(b) | 41,326 | 441,775 | |
| IGG, Inc. | 421,000 | 403,275 | |
| International Games Systems Co. Ltd. | 174,000 | 4,177,611 | |
| NCSOFT Corp. | 7,992 | 4,551,469 | |
| NetDragon WebSoft, Inc. | 152,000 | 340,060 | |
| NetEase, Inc. | 17,900 | 342,674 | |
| NetEase, Inc. ADR | 358,157 | 34,891,655 | |
| NHN Corp. (a) | 2,843 | 173,194 | |
| Sea Ltd. ADR (a) | 41,446 | 14,022,011 | |
| TEN Square Games SA | 1,452 | 194,477 | |
| Tencent Music Entertainment Group ADR (a) | 108,400 | 958,256 | |
| Webzen, Inc. (a) | 16,665 | 390,416 | |
| Workpoint Entertainment PCL NVDR | 188,500 | 130,866 | |
| 87,197,781 | |||
| Interactive Media & Services - 4.5% | |||
| Autohome, Inc. ADR Class A | 140,300 | 6,209,678 | |
| Baidu, Inc.: | |||
| Class A | 97,456 | 1,914,673 | |
| sponsored ADR(a) | 63,676 | 9,998,406 | |
| Kakao Corp. | 19,608 | 2,622,510 | |
| Kuaishou Technology Class B (c) | 290,000 | 3,150,776 | |
| Mail.Ru Group Ltd. GDR (Reg. S) (a) | 129,792 | 2,611,415 | |
| NAVER Corp. | 133,249 | 50,475,501 | |
| Sohu.Com Ltd. ADR (a) | 3,439 | 80,473 | |
| Tencent Holdings Ltd. | 5,538,972 | 342,102,415 | |
| Tongdao Liepin Group (a) | 1,213,800 | 2,150,597 | |
| Yandex NV Series A (a) | 536,767 | 41,277,382 | |
| 462,593,826 | |||
| Media - 0.0% | |||
| Astro Malaysia Holdings Bhd | 193,200 | 50,194 | |
| Cheil Worldwide, Inc. | 31,153 | 620,961 | |
| China South Publishing & Media Group Co. Ltd. (A Shares) | 60,765 | 81,826 | |
| Chinese Universe Publishing and Media Group Co. Ltd. (A Shares) | 922,641 | 1,479,493 | |
| Cyfrowy Polsat SA | 14,739 | 140,688 | |
| Focus Media Information Technology Co. Ltd. (A Shares) | 983,700 | 1,094,743 | |
| Korea Business News Co. Ltd. | 8,585 | 55,707 | |
| Media Prima Bhd (a) | 364,400 | 46,021 | |
| Shandong Publishing & Media Co. Ltd. (A Shares) | 206,000 | 178,238 | |
| Woongjin Holdings Co. Ltd. | 38,650 | 124,397 | |
| 3,872,268 | |||
| Wireless Telecommunication Services - 0.3% | |||
| America Movil S.A.B. de CV: | |||
| Series L | 4,234,000 | 4,167,804 | |
| Series L sponsored ADR | 160,329 | 3,136,035 | |
| Bharti Airtel Ltd. | 2,030,534 | 18,483,312 | |
| MTN Group Ltd. (a) | 247,060 | 2,269,525 | |
| SK Telecom Co. Ltd. | 3,715 | 955,610 | |
| Turkcell Iletisim Hizmet A/S | 594,924 | 1,172,465 | |
| VEON Ltd. sponsored ADR (a) | 201,858 | 442,069 | |
| 30,626,820 | |||
| TOTAL COMMUNICATION SERVICES | 603,228,201 | ||
| CONSUMER DISCRETIONARY - 10.1% | |||
| Auto Components - 0.3% | |||
| Anhui Zhongding Sealing Parts Co. Ltd. (A Shares) | 376,840 | 1,039,406 | |
| Balkrishna Industries Ltd. | 50,806 | 1,598,260 | |
| Changchun Faway Automobile Components Co. Ltd. (A Shares) | 187,754 | 267,361 | |
| Chaowei Power Holdings Ltd. | 68,000 | 21,071 | |
| Cheng Shin Rubber Industry Co. Ltd. | 180,000 | 242,443 | |
| DTR Automotive Corp. | 1,408 | 58,864 | |
| Fras-Le SA | 12,400 | 37,650 | |
| Fuyao Glass Industries Group Co. Ltd. (A Shares) | 1,217,433 | 9,026,118 | |
| Hankook Tire Co. Ltd. | 29,749 | 1,196,218 | |
| Huayu Automotive Systems Co. Ltd. (A Shares) | 2,302,098 | 8,266,701 | |
| Hwa Shin Co. Ltd. | 19,062 | 145,238 | |
| Hyundai Mobis | 18,136 | 4,342,668 | |
| MAHLE Metal Leve SA | 72,228 | 552,591 | |
| Mando Corp. (a) | 4,875 | 255,338 | |
| Nexteer Auto Group Ltd. | 506,000 | 569,925 | |
| Ningbo Huaxiang Electronic Co. Ltd. (A Shares) | 224,686 | 801,966 | |
| Somboon Advance Technology PCL unit | 71,100 | 46,276 | |
| Sri Trang Agro-Industry PCL | 1,675,800 | 1,973,668 | |
| Tianneng Power International Ltd. (b) | 1,495,826 | 2,000,217 | |
| Tupy SA | 18,900 | 81,437 | |
| Yoo Sung Enterprise | 12,624 | 38,071 | |
| 32,561,487 | |||
| Automobiles - 1.3% | |||
| Bajaj Auto Ltd. | 238,049 | 12,164,480 | |
| BYD Co. Ltd. (H Shares) | 134,000 | 4,504,962 | |
| Dongfeng Motor Group Co. Ltd. (H Shares) | 2,272,000 | 2,488,919 | |
| Eicher Motors Ltd. | 135,200 | 4,965,451 | |
| Great Wall Motor Co. Ltd. (H Shares) | 4,558,500 | 20,983,009 | |
| Hyundai Motor Co. | 53,957 | 9,893,704 | |
| Kia Corp. | 364,531 | 26,768,016 | |
| Li Auto, Inc. ADR (a) | 442,100 | 13,643,206 | |
| Loncin Motor Co. Ltd. | 295,300 | 170,945 | |
| Maruti Suzuki India Ltd. | 141,228 | 13,253,568 | |
| PT Astra International Tbk | 7,696,200 | 2,819,467 | |
| SAIC Motor Corp. Ltd. (A Shares) | 1,657,613 | 4,956,906 | |
| Tofas Turk Otomobil Fabrikasi A/S | 52,674 | 266,141 | |
| UMW Holdings Bhd | 79,400 | 60,357 | |
| XPeng, Inc.: | |||
| ADR (a) | 394,600 | 16,770,500 | |
| Class A | 165,400 | 3,400,531 | |
| 137,110,162 | |||
| Distributors - 0.0% | |||
| Inter Cars SA | 261 | 27,666 | |
| Xinhua Winshare Publishing and Media Co. Ltd. | 178,000 | 124,732 | |
| 152,398 | |||
| Diversified Consumer Services - 0.0% | |||
| Human Soft Holding Co. KSCC | 24,130 | 272,917 | |
| New Oriental Education & Technology Group, Inc. sponsored ADR | 521,500 | 1,178,590 | |
| Visang Education, Inc. | 8,025 | 68,623 | |
| YDUQS Participacoes SA | 385,998 | 1,910,283 | |
| 3,430,413 | |||
| Hotels, Restaurants & Leisure - 0.8% | |||
| Huazhu Group Ltd. ADR (a) | 147,479 | 7,121,761 | |
| Jiumaojiu International Holdings Ltd. (c) | 681,000 | 2,285,338 | |
| MakeMyTrip Ltd. (a) | 45,188 | 1,166,754 | |
| Sands China Ltd. (a) | 2,080,722 | 6,684,525 | |
| Shangri-La Asia Ltd. (a) | 3,668,000 | 3,225,880 | |
| Songcheng Performance Development Co. Ltd. (A Shares) | 2,454,441 | 5,804,922 | |
| Tongcheng-Elong Holdings Ltd. (a) | 1,945,600 | 4,527,880 | |
| Trip.com Group Ltd. ADR (a) | 355,909 | 10,851,665 | |
| Yum China Holdings, Inc. | 16,250 | 1,000,810 | |
| Yum China Holdings, Inc. | 567,425 | 34,930,683 | |
| 77,600,218 | |||
| Household Durables - 0.9% | |||
| Ecovacs Robotics Co. Ltd. Class A | 149,921 | 3,403,952 | |
| Gree Electric Appliances, Inc. of Zhuhai (A Shares) | 775,331 | 4,932,299 | |
| Haier Smart Home Co. Ltd. (A Shares) | 2,285,822 | 9,573,938 | |
| Hisense Home Appliances Group Co. Ltd. (H Shares) | 27,000 | 31,695 | |
| LG Electronics, Inc. | 148,700 | 18,220,130 | |
| Midea Group Co. Ltd. (A Shares) | 3,988,792 | 40,747,949 | |
| Q Technology (Group) Co. Ltd. (a) | 192,000 | 336,727 | |
| Skyworth Group Ltd. (a) | 2,127,457 | 664,706 | |
| TCL Electronics Holdings Ltd. | 591,000 | 313,074 | |
| Viomi Technology Co. Ltd. ADR Class A (a)(b) | 71,922 | 365,364 | |
| Zhejiang Supor Cookware Co. Ltd. | 1,067,907 | 8,064,634 | |
| 86,654,468 | |||
| Internet & Direct Marketing Retail - 4.8% | |||
| Alibaba Group Holding Ltd. (a) | 2,381,092 | 49,859,096 | |
| Alibaba Group Holding Ltd. sponsored ADR (a) | 1,097,732 | 183,310,267 | |
| Americanas SA (a) | 720,246 | 5,761,077 | |
| Baozun, Inc.: | |||
| Class A (a) | 42,500 | 331,873 | |
| sponsored ADR (a) | 2,057 | 49,533 | |
| Coupang, Inc. Class A (a)(b) | 186,330 | 5,582,447 | |
| D-MARKET Electronic Services & Trading ADR | 239,315 | 2,091,613 | |
| JD Health International, Inc. (c) | 722,050 | 6,712,253 | |
| JD.com, Inc.: | |||
| Class A (a) | 399,330 | 15,694,299 | |
| sponsored ADR (a) | 1,111,171 | 87,293,594 | |
| Leju Holdings Ltd. ADR (a) | 9,926 | 14,492 | |
| Meituan Class B (a)(c) | 1,833,000 | 58,609,390 | |
| MercadoLibre, Inc. (a) | 12,161 | 22,710,059 | |
| momo.com, Inc. | 71,700 | 4,446,250 | |
| Naspers Ltd. Class N | 44,057 | 7,601,554 | |
| Ozon Holdings PLC ADR | 50,343 | 2,650,056 | |
| PChome Online, Inc. | 59,000 | 230,402 | |
| Pinduoduo, Inc. ADR (a) | 260,300 | 26,035,206 | |
| Prosus NV | 162,941 | 14,422,808 | |
| Vipshop Holdings Ltd. ADR (a) | 54,410 | 804,724 | |
| 494,210,993 | |||
| Leisure Products - 0.0% | |||
| Bafang Electric Suzhou Co. Ltd. (A Shares) | 60,928 | 2,012,104 | |
| Goodbaby International Holdings Ltd. (a) | 214,000 | 35,495 | |
| Xiamen Comfort Science & Technology Group Co. Ltd. (A Shares) | 110,100 | 250,169 | |
| 2,297,768 | |||
| Multiline Retail - 0.3% | |||
| El Puerto de Liverpool S.A.B. Dcv Class C | 28,077 | 124,490 | |
| Falabella SA | 54,422 | 215,551 | |
| Lojas Renner SA | 1,985,960 | 14,617,784 | |
| Magazine Luiza SA | 1,368,979 | 4,829,074 | |
| Pepco Group NV (a)(c) | 541,726 | 7,609,326 | |
| Savezon I&C Corp. | 11,337 | 33,799 | |
| Shinsegae Co. Ltd. | 1,551 | 360,011 | |
| Woolworths Holdings Ltd. | 59,920 | 262,553 | |
| 28,052,588 | |||
| Specialty Retail - 0.4% | |||
| Bermaz Auto Bhd | 91,200 | 35,760 | |
| Cashbuild Ltd. | 1,161 | 22,737 | |
| China Harmony Auto Holding Ltd. | 321,500 | 181,058 | |
| China Yongda Automobiles Services Holdings Ltd. | 259,000 | 434,250 | |
| Dogus Otomotiv Servis ve Ticaret A/S | 27,632 | 93,031 | |
| Fawaz Abdulaziz Al Hokair & Co. (a) | 57,800 | 343,653 | |
| Foschini Group Ltd./The (a) | 292,800 | 3,009,382 | |
| Lewis Group Ltd. | 11,913 | 34,953 | |
| LOTTE Hi-Mart Co. Ltd. | 289 | 7,818 | |
| Motus Holdings Ltd. | 73,393 | 467,502 | |
| Mr Price Group Ltd. | 608,009 | 9,121,234 | |
| Petrobras Distribuidora SA | 291,100 | 1,530,713 | |
| Pop Mart International Group Ltd. (c) | 206,600 | 1,560,634 | |
| Pou Sheng International (Holdings) Ltd. (a) | 291,000 | 58,743 | |
| Saudi Co. for Hardware CJSC | 29,022 | 498,311 | |
| Shan-Loong Transportation Co. Ltd. | 56,000 | 71,681 | |
| Shinsegae International Co. Ltd. | 1,095 | 187,082 | |
| SSI Group, Inc. (a) | 143,000 | 3,313 | |
| United Electronics Co. | 55,933 | 2,132,514 | |
| Zhongsheng Group Holdings Ltd. Class H | 2,668,000 | 22,297,797 | |
| 42,092,166 | |||
| Textiles, Apparel & Luxury Goods - 1.3% | |||
| adidas AG | 7,182 | 2,547,860 | |
| Anta Sports Products Ltd. | 662,000 | 13,618,860 | |
| Cabbeen Fashion Ltd. | 84,000 | 36,722 | |
| CECEP COSTIN New Materials Group Ltd. (a)(d) | 741,000 | 28,583 | |
| China Lilang Ltd. | 55,756 | 34,841 | |
| ECLAT Textile Co. Ltd. | 363,000 | 7,310,927 | |
| Fila Holdings Corp. | 37,177 | 1,440,366 | |
| Filatex India Ltd. (a) | 68,988 | 85,536 | |
| Huvis Corp. | 9,132 | 81,950 | |
| Hyosung TNC Co. Ltd. | 7,073 | 4,742,167 | |
| JNBY Design Ltd. | 295,720 | 702,660 | |
| KPR Mill Ltd. | 4,147 | 100,786 | |
| LG Fashion Corp. | 7,144 | 113,426 | |
| Li Ning Co. Ltd. | 5,346,000 | 71,830,356 | |
| Mirza International Ltd. (a) | 85,473 | 67,897 | |
| Monte Carlo Fashions Ltd. (a) | 10,276 | 49,513 | |
| Pou Chen Corp. | 787,000 | 937,650 | |
| Rupa & Co. Ltd. | 20,832 | 123,848 | |
| Shenzhou International Group Holdings Ltd. | 1,340,100 | 29,048,178 | |
| Sutlej Textiles & Industries Ltd. | 12,472 | 10,651 | |
| Vardhman Textiles Ltd. (a) | 183 | 4,621 | |
| Weiqiao Textile Co. Ltd. (H Shares) | 139,556 | 51,678 | |
| Welspun India Ltd. (a) | 290,155 | 504,732 | |
| XTEP International Holdings Ltd. | 251,000 | 427,937 | |
| Zhejiang Semir Garment Co. Ltd. (A Shares) | 431,700 | 632,111 | |
| 134,533,856 | |||
| TOTAL CONSUMER DISCRETIONARY | 1,038,696,517 | ||
| CONSUMER STAPLES - 3.6% | |||
| Beverages - 0.8% | |||
| Anheuser-Busch InBev SA NV | 76,625 | 4,699,583 | |
| Arca Continental S.A.B. de CV | 155,532 | 1,001,851 | |
| Beijing Yanjing Brewery Co. Ltd. (A Shares) | 1,526,870 | 1,576,334 | |
| Budweiser Brewing Co. APAC Ltd. (c) | 1,746,100 | 4,368,926 | |
| China Resources Beer Holdings Co. Ltd. | 1,652,000 | 13,594,173 | |
| Fomento Economico Mexicano S.A.B. de CV sponsored ADR | 88,548 | 7,677,997 | |
| Heineken NV (Bearer) | 119,312 | 13,059,358 | |
| Kweichow Moutai Co. Ltd. (A Shares) | 88,174 | 21,263,190 | |
| Thai Beverage PCL | 17,314,300 | 8,757,279 | |
| Wuliangye Yibin Co. Ltd. (A Shares) | 234,901 | 7,333,135 | |
| 83,331,826 | |||
| Food & Staples Retailing - 1.0% | |||
| Atacadao SA | 1,301,200 | 4,567,336 | |
| Bid Corp. Ltd. (a) | 71,316 | 1,570,437 | |
| Bim Birlesik Magazalar A/S JSC | 476,211 | 4,114,202 | |
| Clicks Group Ltd. | 198,405 | 4,132,479 | |
| CP ALL PCL (For. Reg.) | 9,288,900 | 18,713,110 | |
| Magnit OJSC | 52,655 | 3,989,726 | |
| President Chain Store Corp. | 537,000 | 5,543,589 | |
| Raia Drogasil SA | 3,308,972 | 16,356,719 | |
| Sendas Distribuidora SA | 407,000 | 1,323,136 | |
| Shoprite Holdings Ltd. | 806,883 | 10,212,232 | |
| Wal-Mart de Mexico SA de CV Series V | 6,248,509 | 22,232,546 | |
| X5 Retail Group NV GDR (Reg. S) | 195,159 | 6,465,618 | |
| Yifeng Pharmacy Chain Co. Ltd. | 440,978 | 3,538,363 | |
| 102,759,493 | |||
| Food Products - 1.2% | |||
| Angel Yeast Co. Ltd. (A Shares) | 742,000 | 4,601,969 | |
| AVI Ltd. | 402,650 | 2,106,073 | |
| Charoen Pokphand Foods PCL (For. Reg.) | 1,156,500 | 967,782 | |
| China Mengniu Dairy Co. Ltd. | 12,173,496 | 73,174,490 | |
| Dwarikesh Sugar Industries Ltd. | 174,073 | 168,463 | |
| Inner Mongoli Yili Industries Co. Ltd. (A Shares) | 148,500 | 781,724 | |
| JBS SA | 2,539,329 | 15,307,280 | |
| Marfrig Global Foods SA | 274,386 | 1,087,292 | |
| Minerva SA | 62,300 | 100,725 | |
| PT Japfa Comfeed Indonesia Tbk | 1,180,600 | 149,825 | |
| SLC Agricola SA | 141,300 | 1,113,283 | |
| Tata Consumer Products Ltd. | 144,212 | 1,709,862 | |
| Uni-President China Holdings Ltd. | 140,000 | 132,666 | |
| Unified-President Enterprises Corp. | 5,014,000 | 13,107,904 | |
| Universal Robina Corp. | 1,138,040 | 3,457,221 | |
| 117,966,559 | |||
| Household Products - 0.0% | |||
| Hindustan Unilever Ltd. | 20,645 | 770,915 | |
| Opple Lighting Co. Ltd. (A Shares) | 57,064 | 202,617 | |
| 973,532 | |||
| Personal Products - 0.6% | |||
| AMOREPACIFIC Corp. | 24,310 | 4,772,199 | |
| Colgate-Palmolive Ltd. | 49,248 | 1,143,119 | |
| Dabur India Ltd. | 44,657 | 380,452 | |
| Emami Ltd. | 10,684 | 87,463 | |
| LG Household & Health Care Ltd. | 24,676 | 31,108,362 | |
| Natura & Co. Holding SA (a) | 2,446,058 | 24,418,951 | |
| Organic Tea Cosmetics Holdings Co. Ltd. (a) | 4,513 | 2,847 | |
| Proya Cosmetics Co. Ltd. (A Shares) | 56,300 | 1,369,789 | |
| 63,283,182 | |||
| Tobacco - 0.0% | |||
| ITC Ltd. | 280,801 | 813,330 | |
| TOTAL CONSUMER STAPLES | 369,127,922 | ||
| ENERGY - 2.2% | |||
| Energy Equipment & Services - 0.1% | |||
| Ezion Holdings Ltd. warrants 4/16/23 (a)(d) | 5,020,014 | 5,862 | |
| Offshore Oil Enginering Co. Ltd. (A Shares) | 1,070,200 | 752,040 | |
| Yantai Jereh Oilfield Services (A Shares) | 1,108,072 | 6,321,843 | |
| 7,079,745 | |||
| Oil, Gas & Consumable Fuels - 2.1% | |||
| Aldrees Petroleum and Transport Services Co. | 4,834 | 88,542 | |
| Anhui Hengyan Coal Industry & Electricity Power Co. Ltd. (A Shares) | 2,504,500 | 2,988,793 | |
| China Coal Energy Co. Ltd. (H Shares) | 4,901,000 | 3,503,663 | |
| China Merchants Energy Shipping Co. Ltd. (A Shares) | 4,172,760 | 2,803,068 | |
| China Petroleum & Chemical Corp. (H Shares) | 32,646,000 | 15,707,221 | |
| Empresas COPEC SA | 719,063 | 6,689,369 | |
| Gazprom OAO sponsored ADR (Reg. S) | 1,517,353 | 12,600,099 | |
| Grupa Lotos SA | 6,853 | 104,204 | |
| Hindustan Petroleum Corp. Ltd. | 643,806 | 2,352,794 | |
| Indian Oil Corp. Ltd. | 1,315,262 | 1,998,558 | |
| Lukoil PJSC | 165,638 | 14,162,082 | |
| Lukoil PJSC sponsored ADR | 364,875 | 30,926,805 | |
| MOL Hungarian Oil and Gas PLC Series A (For. Reg.) | 136,011 | 1,115,278 | |
| Novatek PJSC GDR (Reg. S) | 157,767 | 37,390,779 | |
| Oil & Natural Gas Corp. Ltd. | 980,532 | 1,620,309 | |
| PetroChina Co. Ltd. (H Shares) | 20,438,000 | 8,927,727 | |
| Petronet LNG Ltd. | 1,375,049 | 4,290,019 | |
| Polish Oil & Gas Co. SA | 1,350,590 | 2,221,510 | |
| PT Adaro Energy Tbk | 1,702,400 | 150,396 | |
| PT Indo Tambangraya Megah Tbk | 67,100 | 75,274 | |
| PTT PCL (For. Reg.) | 2,994,800 | 3,550,321 | |
| Rabigh Refining & Petrochemical Co. (a) | 931,805 | 6,116,469 | |
| Reliance Industries Ltd. | 1,317,009 | 40,767,143 | |
| Reliance Industries Ltd. sponsored GDR (c) | 99,000 | 6,123,150 | |
| Rosneft Oil Co. OJSC | 1,004,042 | 7,319,822 | |
| Saudi Arabian Oil Co. | 145,159 | 1,360,370 | |
| Susco Public Co. Ltd. unit | 49,300 | 5,165 | |
| Tatneft PAO sponsored ADR | 28,136 | 1,120,938 | |
| Tsakos Energy Navigation Ltd. | 3,003 | 22,823 | |
| 216,102,691 | |||
| TOTAL ENERGY | 223,182,436 | ||
| FINANCIALS - 11.3% | |||
| Banks - 7.6% | |||
| Absa Group Ltd. | 1,024,128 | 11,142,823 | |
| Abu Dhabi Commercial Bank PJSC | 388,270 | 793,844 | |
| Agricultural Bank of China Ltd. (H Shares) | 5,158,980 | 1,731,279 | |
| Al Rajhi Bank | 991,242 | 31,978,106 | |
| Alpha Bank AE (a) | 1,551,672 | 2,153,677 | |
| Axis Bank Ltd. (a) | 1,201,359 | 12,952,103 | |
| Banco do Brasil SA | 480,959 | 2,830,429 | |
| Banco Santander Chile sponsored ADR | 440,010 | 9,262,211 | |
| Bank Albilad (a) | 198,539 | 2,262,922 | |
| Bank Millennium SA (a) | 95,055 | 163,796 | |
| Bank of Communications Co. Ltd. (H Shares) | 4,195,703 | 2,411,432 | |
| Bank Polska Kasa Opieki SA | 56,940 | 1,593,663 | |
| BNK Financial Group, Inc. | 49,906 | 334,169 | |
| Capitec Bank Holdings Ltd. | 133,033 | 17,379,346 | |
| China CITIC Bank Corp. Ltd. (H Shares) | 4,095,000 | 1,884,949 | |
| China Construction Bank Corp. (H Shares) | 65,324,000 | 47,069,740 | |
| China Everbright Bank Co. Ltd. (H Shares) | 1,519,900 | 545,233 | |
| China Merchants Bank Co. Ltd. (H Shares) | 3,793,000 | 31,334,210 | |
| CIMB Group Holdings Bhd | 2,889,500 | 3,412,905 | |
| Commercial International Bank SAE sponsored GDR | 2,462,256 | 7,152,854 | |
| Credicorp Ltd. (United States) | 96,400 | 10,279,132 | |
| CTBC Financial Holding Co. Ltd. | 6,847,000 | 5,694,280 | |
| DGB Financial Group Co. Ltd. | 16,476 | 129,374 | |
| E.SUN Financial Holdings Co. Ltd. | 8,579,450 | 8,251,857 | |
| EFG Eurobank Ergasias SA (a) | 1,523,419 | 1,451,613 | |
| First Abu Dhabi Bank PJSC | 2,392,184 | 11,071,459 | |
| Grupo Financiero Banorte S.A.B. de CV Series O | 5,862,547 | 38,700,283 | |
| Grupo Financiero Inbursa S.A.B. de CV Series O (a) | 320,573 | 306,942 | |
| Gulf Bank | 829,317 | 661,909 | |
| Habib Bank Ltd. | 282,507 | 212,623 | |
| Hana Financial Group, Inc. | 649,010 | 25,228,902 | |
| HDFC Bank Ltd. | 2,480,949 | 53,780,932 | |
| HDFC Bank Ltd. sponsored ADR | 210,661 | 16,496,863 | |
| ICICI Bank Ltd. | 3,030,837 | 29,705,718 | |
| ICICI Bank Ltd. sponsored ADR | 1,993,542 | 39,113,294 | |
| Industrial & Commercial Bank of China Ltd. (H Shares) | 60,906,310 | 33,917,174 | |
| KakaoBank Corp. (a) | 5,023 | 363,645 | |
| Kasikornbank PCL NVDR | 3,319,300 | 12,653,770 | |
| KB Financial Group, Inc. | 528,508 | 24,053,168 | |
| Komercni Banka A/S (a) | 111,281 | 4,277,484 | |
| Kotak Mahindra Bank Ltd. (a) | 473,640 | 11,386,033 | |
| Malayan Banking Bhd | 1,130,418 | 2,284,222 | |
| mBank SA (a) | 648 | 62,767 | |
| National Bank of Greece SA (a) | 3,812,037 | 11,531,723 | |
| Nedbank Group Ltd. | 181,193 | 2,307,595 | |
| Nova Ljubljanska banka d.d. unit | 819,776 | 13,502,910 | |
| OTP Bank PLC (a) | 551,562 | 33,304,969 | |
| Powszechna Kasa Oszczednosci Bank SA (a) | 448,849 | 4,927,771 | |
| PT Bank Bukopin Tbk (a) | 5,600 | 186 | |
| PT Bank Central Asia Tbk | 7,603,700 | 17,459,855 | |
| PT Bank Mandiri (Persero) Tbk | 42,726,400 | 18,265,144 | |
| PT Bank Rakyat Indonesia Tbk | 16,579,700 | 4,568,499 | |
| Qatar National Bank SAQ (a) | 241,753 | 1,272,839 | |
| Santander Bank Polska SA | 5,279 | 416,239 | |
| Saudi Investment Bank/The | 64,122 | 279,691 | |
| Sberbank of Russia | 471,385 | 2,117,037 | |
| Sberbank of Russia | 4,063,081 | 18,231,853 | |
| Sberbank of Russia sponsored ADR | 3,216,479 | 57,398,068 | |
| Shinhan Financial Group Co. Ltd. | 628,122 | 20,934,867 | |
| Siam Commercial Bank PCL (For. Reg.) | 2,140,000 | 7,063,691 | |
| Sinopac Holdings Co. | 3,628,000 | 1,869,359 | |
| Standard Bank Group Ltd. | 416,846 | 4,267,390 | |
| State Bank of India | 2,461,876 | 14,377,901 | |
| Taishin Financial Holdings Co. Ltd. | 1,101,000 | 770,334 | |
| TCS Group Holding PLC GDR | 189,381 | 16,722,342 | |
| The Saudi National Bank | 553,080 | 8,965,597 | |
| TISCO Financial Group PCL | 602,300 | 1,754,725 | |
| United Bank Ltd. | 280,158 | 203,664 | |
| Woori Financial Group, Inc. | 181,129 | 1,758,299 | |
| Yapi ve Kredi Bankasi A/S | 244,422 | 77,590 | |
| 782,823,273 | |||
| Capital Markets - 0.3% | |||
| Alexander Forbes Group Holdings Ltd. | 888 | 245 | |
| B3 SA - Brasil Bolsa Balcao | 4,337,040 | 11,801,298 | |
| Boursa Kuwait Securities Co. KPSC | 76,300 | 423,748 | |
| East Money Information Co. Ltd. (A Shares) | 239,500 | 1,147,325 | |
| Hong Kong Exchanges and Clearing Ltd. | 136,400 | 8,607,592 | |
| Kiwoom Securities Co. Ltd. | 2,237 | 227,772 | |
| Korea Investment Holdings Co. Ltd. | 60,259 | 4,955,266 | |
| Noah Holdings Ltd. sponsored ADR (a) | 34,004 | 1,325,476 | |
| VLS Finance Ltd. | 24,557 | 66,517 | |
| XP, Inc. Class A (a) | 70,664 | 3,437,804 | |
| 31,993,043 | |||
| Consumer Finance - 0.4% | |||
| 360 DigiTech, Inc. ADR (a) | 152,580 | 3,478,824 | |
| AEON Credit Service Bhd | 2,000 | 5,802 | |
| Bajaj Finance Ltd. | 40,051 | 4,131,043 | |
| Commercial Facilities Co. SAK | 58,234 | 38,926 | |
| Kaspi.KZ JSC: | |||
| unit (c) | 50,616 | 5,790,470 | |
| unit | 69,699 | 7,973,566 | |
| Kruk SA | 4,717 | 390,400 | |
| Samsung Card Co. Ltd. | 17,668 | 519,869 | |
| Shriram Transport Finance Co. Ltd. | 783,679 | 14,531,433 | |
| 36,860,333 | |||
| Diversified Financial Services - 0.5% | |||
| Chailease Holding Co. Ltd. | 1,606,268 | 15,478,392 | |
| FirstRand Ltd. | 5,165,118 | 22,006,309 | |
| Meritz Financial Holdings Co. | 5,647 | 140,090 | |
| Rec Ltd. | 1,021,326 | 2,123,825 | |
| Yuanta Financial Holding Co. Ltd. | 16,703,960 | 15,099,761 | |
| 54,848,377 | |||
| Insurance - 2.0% | |||
| AIA Group Ltd. | 6,893,584 | 82,314,406 | |
| Cathay Financial Holding Co. Ltd. | 360,000 | 775,817 | |
| China Life Insurance Co. Ltd. (H Shares) | 5,888,000 | 9,872,726 | |
| China Pacific Insurance (Group) Co. Ltd. (H Shares) | 2,122,600 | 5,976,887 | |
| China Taiping Insurance Group Ltd. | 1,238,600 | 1,809,140 | |
| Fubon Financial Holding Co. Ltd. | 3,701,000 | 11,374,928 | |
| HDFC Standard Life Insurance Co. Ltd. (c) | 204,930 | 2,016,264 | |
| Hyundai Fire & Marine Insurance Co. Ltd. | 49,606 | 1,095,787 | |
| ICICI Lombard General Insurance Co. Ltd. (c) | 26,092 | 570,332 | |
| PICC Property & Casualty Co. Ltd. (H Shares) | 11,168,000 | 10,094,702 | |
| Ping An Insurance Group Co. of China Ltd. (H Shares) | 5,465,500 | 42,319,819 | |
| Porto Seguro SA | 367,969 | 4,068,382 | |
| Powszechny Zaklad Ubezpieczen SA | 698,693 | 7,406,221 | |
| Samsung Fire & Marine Insurance Co. Ltd. | 63,119 | 12,308,942 | |
| Sanlam Ltd. | 2,396,896 | 10,632,887 | |
| Sul America SA unit | 231,520 | 1,314,132 | |
| 203,951,372 | |||
| Thrifts & Mortgage Finance - 0.5% | |||
| Housing Development Finance Corp. Ltd. | 1,006,713 | 38,618,886 | |
| LIC Housing Finance Ltd. | 1,548,355 | 8,537,591 | |
| 47,156,477 | |||
| TOTAL FINANCIALS | 1,157,632,875 | ||
| HEALTH CARE - 1.7% | |||
| Biotechnology - 0.1% | |||
| InnoCare Pharma Ltd. (a)(c) | 407,000 | 1,138,194 | |
| Innovent Biologics, Inc. (a)(c) | 225,000 | 1,813,898 | |
| Remegen Co. Ltd. (H Shares) (a)(c) | 47,500 | 613,794 | |
| Zai Lab Ltd. (a) | 94,300 | 13,454,370 | |
| 17,020,256 | |||
| Health Care Equipment & Supplies - 0.3% | |||
| Angelalign Technology, Inc. (c) | 800 | 39,705 | |
| Peijia Medical Ltd. (a)(c) | 871,000 | 2,558,981 | |
| Rayence Co. Ltd. | 12,372 | 166,006 | |
| Shenzhen Mindray Bio-Medical Electronics Co. Ltd. (A Shares) | 457,425 | 23,222,778 | |
| Top Glove Corp. Bhd | 1,420,800 | 1,367,140 | |
| 27,354,610 | |||
| Health Care Providers & Services - 0.3% | |||
| Apollo Hospitals Enterprise Ltd. | 21,145 | 1,440,434 | |
| Bangkok Chain Hospital PCL | 1,839,300 | 1,282,636 | |
| Hapvida Participacoes e Investimentos SA (c) | 4,199,747 | 11,955,650 | |
| Mediclinic International PLC (a) | 1,860,126 | 8,003,296 | |
| National Medical Care Co. | 37,993 | 672,604 | |
| Neuca SA | 233 | 56,879 | |
| Rede D'Oregon Sao Luiz SA (c) | 194,411 | 2,587,485 | |
| Shanghai Pharmaceuticals Holding Co. Ltd. (H Shares) | 666,100 | 1,322,359 | |
| 27,321,343 | |||
| Health Care Technology - 0.0% | |||
| Medlive Technology Co. Ltd. | 588,500 | 2,489,460 | |
| Life Sciences Tools & Services - 0.5% | |||
| Hangzhou Tigermed Consulting Co. Ltd. (H Shares) (c) | 125,100 | 2,219,725 | |
| Pharmaron Beijing Co. Ltd. (H Shares) (c) | 333,800 | 7,407,811 | |
| WuXi AppTec Co. Ltd. | 230,200 | 4,731,772 | |
| WuXi AppTec Co. Ltd. (H Shares) (c) | 620,756 | 12,371,302 | |
| Wuxi Biologics (Cayman), Inc. (a)(c) | 1,459,000 | 22,588,176 | |
| 49,318,786 | |||
| Pharmaceuticals - 0.5% | |||
| Aspen Pharmacare Holdings Ltd. | 250,066 | 3,375,988 | |
| Aurobindo Pharma Ltd. | 41,989 | 418,618 | |
| China Medical System Holdings Ltd. | 258,000 | 505,554 | |
| Cipla Ltd. (a) | 571,969 | 7,431,183 | |
| Consun Pharmaceutical Group Ltd. | 25,517 | 12,041 | |
| Dr. Reddy's Laboratories Ltd. | 10,602 | 683,329 | |
| Hansoh Pharmaceutical Group Co. Ltd. (c) | 1,642,000 | 4,486,368 | |
| Jiangsu Hengrui Medicine Co. Ltd. (A Shares) | 277,336 | 1,940,283 | |
| Richter Gedeon PLC | 1,009,013 | 30,241,752 | |
| Sihuan Pharmaceutical Holdings Group Ltd. | 748,000 | 222,165 | |
| Sino Biopharmaceutical Ltd. | 4,051,500 | 3,391,248 | |
| Sun Pharmaceutical Industries Ltd. | 183,283 | 1,994,981 | |
| 54,703,510 | |||
| TOTAL HEALTH CARE | 178,207,965 | ||
| INDUSTRIALS - 2.4% | |||
| Aerospace & Defense - 0.0% | |||
| Embraer SA (a) | 351,900 | 1,593,854 | |
| Air Freight & Logistics - 0.1% | |||
| InPost SA | 96,209 | 1,874,380 | |
| SF Holding Co. Ltd. (A Shares) | 788,774 | 7,034,711 | |
| Sinotrans Ltd. (H Shares) | 256,000 | 104,343 | |
| 9,013,434 | |||
| Airlines - 0.0% | |||
| Azul SA sponsored ADR (a)(b) | 113,766 | 2,501,714 | |
| Copa Holdings SA Class A (a) | 16,614 | 1,250,204 | |
| 3,751,918 | |||
| Building Products - 0.1% | |||
| Bawan Co. | 67,521 | 725,490 | |
| Dare Power Dekor Home Co. Ltd. (A Shares) | 1,207,978 | 2,445,610 | |
| Everest Industries Ltd. | 8,635 | 52,170 | |
| HSIL Ltd. | 19,766 | 59,270 | |
| Kajaria Ceramics Ltd. | 28,685 | 462,099 | |
| LX Hausys Ltd. | 1,397 | 106,200 | |
| SCG Ceramics PCL NVDR (a) | 567,400 | 49,591 | |
| Sung Kwang Bend Co. Ltd. | 9,981 | 77,770 | |
| Xinyi Glass Holdings Ltd. | 923,000 | 3,880,719 | |
| ZBOM Home Collection Co. Ltd. | 318,156 | 1,188,770 | |
| Zhejiang Weixing New Building Materials Co. Ltd. (A Shares) | 838,086 | 2,563,279 | |
| 11,610,968 | |||
| Commercial Services & Supplies - 0.0% | |||
| Binjiang Service Group Co. Ltd. | 24,000 | 68,969 | |
| China Everbright International Ltd. | 153,000 | 105,837 | |
| Country Garden Services Holdings Co. Ltd. | 242,000 | 1,843,599 | |
| Greentown Service Group Co. Ltd. | 1,494,000 | 1,598,221 | |
| UE Furniture Co. Ltd. | 14,800 | 24,832 | |
| 3,641,458 | |||
| Construction & Engineering - 0.4% | |||
| Budimex SA | 65 | 5,023 | |
| China Railway Group Ltd. (H Shares) | 3,212,993 | 1,540,925 | |
| DL E&C Co. Ltd. (a) | 15,458 | 1,880,722 | |
| DL Holdings Co. Ltd. | 2,851 | 177,864 | |
| Hyundai Engineering & Construction Co. Ltd. | 5,027 | 240,743 | |
| Larsen & Toubro Ltd. | 1,136,266 | 26,045,757 | |
| Metallurgical Corp. China Ltd. (H Shares) | 5,023,882 | 2,002,460 | |
| Murray & Roberts Holdings Ltd. (a) | 72,316 | 51,276 | |
| Orascom Construction PLC | 1,460 | 6,882 | |
| Praj Industries Ltd. | 21,698 | 98,867 | |
| Sinopec Engineering Group Co. Ltd. (H Shares) | 450,000 | 238,960 | |
| Suzhou Gold Mantis Consolidated Co. Ltd. | 1,238,300 | 1,360,832 | |
| Voltas Ltd. | 434,356 | 5,929,369 | |
| 39,579,680 | |||
| Electrical Equipment - 0.2% | |||
| China High Speed Transmission Equipment Group Co. Ltd. (a) | 269,210 | 194,532 | |
| DONGYANG E&P, Inc. | 21,665 | 352,389 | |
| Electrical Industries Co. | 57,362 | 508,515 | |
| Graphite India Ltd. | 394,700 | 3,460,544 | |
| Harbin Electric Machinery Co. Ltd.(H Shares) | 98,000 | 32,257 | |
| Hongfa Technology Co. Ltd. (A Shares) | 372,726 | 3,595,897 | |
| Jiangsu Zhongtian Technology Co. Ltd. (A Shares) | 729,400 | 917,861 | |
| Korea Electric Terminal Co. Ltd. | 1,145 | 81,807 | |
| Middle East Specialized Cables Co. (a) | 124,342 | 767,793 | |
| Sungrow Power Supply Co. Ltd. (A Shares) | 292,800 | 7,127,956 | |
| Weg SA | 563,500 | 3,875,234 | |
| Zhongshan Broad-Ocean Motor Co. Ltd. (A Shares) | 597,488 | 786,083 | |
| 21,700,868 | |||
| Industrial Conglomerates - 0.3% | |||
| Astra Industrial Group | 30,578 | 353,823 | |
| CITIC Pacific Ltd. | 4,480,000 | 5,575,915 | |
| CJ Corp. | 2,147 | 188,040 | |
| Doosan Co. Ltd. | 2,463 | 190,213 | |
| Enka Insaat ve Sanayi A/S | 76,205 | 100,519 | |
| Fosun International Ltd. | 1,480,500 | 1,873,123 | |
| Hanwha Corp. | 83,235 | 2,499,409 | |
| Hong Leong Industries Bhd | 3,000 | 6,690 | |
| Koc Holding A/S | 1,059,880 | 2,936,288 | |
| LG Corp. | 92,864 | 7,636,466 | |
| LT Group, Inc. | 133,500 | 22,994 | |
| Mannai Corp. | 86,440 | 94,963 | |
| Nava Bharat Ventures Ltd. (a) | 69,851 | 104,225 | |
| SM Investments Corp. | 335,290 | 6,815,222 | |
| 28,397,890 | |||
| Machinery - 0.6% | |||
| Ador Welding Ltd. (a) | 1,754 | 16,375 | |
| Canny Elevator Co. Ltd. (A Shares) | 207,800 | 276,608 | |
| China International Marine Containers Group Co. Ltd. (H Shares) | 484,354 | 1,061,195 | |
| Cimc Enric Holdings Ltd. | 503,016 | 739,896 | |
| DY POWER Corp. | 5,022 | 65,868 | |
| Elgi Equipments Ltd. | 55,168 | 149,356 | |
| Estun Automation Co. Ltd. (A Shares) (a) | 556,400 | 2,655,101 | |
| Grindwell Norton Ltd. | 21,250 | 376,043 | |
| Guangxi Liugong Machinery Co. Ltd. (A Shares) | 323,892 | 424,624 | |
| Guangzhou KDT Machinery Co. Ltd. (A Shares) | 57,080 | 351,013 | |
| Haitian International Holdings Ltd. | 420,000 | 1,609,268 | |
| Hangcha Group Co. Ltd. (A Shares) | 213,394 | 611,047 | |
| HIWIN Technologies Corp. | 548,003 | 6,459,682 | |
| Industrias Romi SA | 59,300 | 248,746 | |
| Kirloskar Brothers Ltd. | 3,519 | 18,203 | |
| Kirloskar Oil Engines Ltd. | 16,592 | 49,593 | |
| NRB Bearings Ltd. (a) | 71,935 | 132,972 | |
| S&T Corp. | 1,510 | 26,776 | |
| Sany Heavy Industry Co. Ltd. (A Shares) | 251,611 | 1,021,523 | |
| Schaeffler India Ltd. | 1,523 | 151,371 | |
| Shandong Himile Mechanical Science & Technology Co. Ltd. (A Shares) | 608,100 | 2,483,904 | |
| Shanghai Hanbell Precise Machinery Co. Ltd. (A Shares) | 151,979 | 612,320 | |
| Sinotruk Hong Kong Ltd. | 1,442,072 | 2,840,590 | |
| Techtronic Industries Co. Ltd. | 458,000 | 10,158,214 | |
| Turk Traktor ve Ziraat Makinalari A/S | 1,531 | 31,719 | |
| Weichai Power Co. Ltd.: | |||
| (A Shares) | 550,202 | 1,709,189 | |
| (H Shares) | 7,108,000 | 17,931,193 | |
| XCMG Construction Machinery Co. Ltd. (A Shares) | 718,500 | 725,095 | |
| Yutong Bus Co. Ltd. | 65,500 | 124,700 | |
| Zhejiang Sanhua Intelligent Controls Co. Ltd. (A Shares) | 3,005,330 | 11,745,567 | |
| 64,807,751 | |||
| Marine - 0.2% | |||
| COSCO SHIPPING Holdings Co. Ltd. (H Shares) | 3,999,250 | 7,558,901 | |
| Evergreen Marine Corp. (Taiwan) | 1,330,000 | 6,540,353 | |
| Qatar Navigation QPSC | 6,188 | 12,730 | |
| Yang Ming Marine Transport Corp. (a) | 368,000 | 1,776,396 | |
| 15,888,380 | |||
| Professional Services - 0.1% | |||
| Anhui Transport Consulting & Design Institute Co. Ltd. (A Shares) | 74,200 | 102,445 | |
| Centre Testing International Group Co. Ltd. (A Shares) | 1,191,137 | 4,863,590 | |
| Renrui Human Resources Technology Holdings Ltd. | 4,376 | 5,244 | |
| Sporton International, Inc. | 370,200 | 3,078,753 | |
| 8,050,032 | |||
| Road & Rail - 0.2% | |||
| Container Corp. of India Ltd. | 25,910 | 241,356 | |
| Globaltrans Investment PLC GDR (Reg. S) | 8,980 | 73,636 | |
| Localiza Rent A Car SA | 849,565 | 9,112,105 | |
| TuSimple Holdings, Inc. (a) | 24,775 | 1,037,082 | |
| United International Transportation Co. | 354,251 | 4,779,135 | |
| 15,243,314 | |||
| Trading Companies & Distributors - 0.0% | |||
| BOC Aviation Ltd. Class A (c) | 616,800 | 4,623,551 | |
| CITIC Resources Holdings Ltd. (a) | 590,000 | 36,792 | |
| LX International Corp. | 10,711 | 256,475 | |
| Somany Home Innovation Ltd. | 7,738 | 39,724 | |
| 4,956,542 | |||
| Transportation Infrastructure - 0.2% | |||
| Airports of Thailand PCL (For. Reg.) | 1,222,700 | 2,415,841 | |
| Grupo Aeroportuario del Sureste S.A.B. de CV: | |||
| Series B | 373,320 | 6,699,648 | |
| Series B sponsored ADR (a) | 26,843 | 4,798,992 | |
| Grupo Aeroportuario Norte S.A.B. de CV (a) | 545,600 | 3,293,322 | |
| Zhejiang Expressway Co. Ltd. (H Shares) | 1,226,000 | 1,075,072 | |
| 18,282,875 | |||
| TOTAL INDUSTRIALS | 246,518,964 | ||
| INFORMATION TECHNOLOGY - 13.6% | |||
| Communications Equipment - 0.1% | |||
| Accton Technology Corp. | 685,000 | 6,947,588 | |
| Unizyx Holding Corp. | 86,000 | 78,674 | |
| 7,026,262 | |||
| Electronic Equipment & Components - 1.3% | |||
| Alviva Holdings Ltd. | 11,198 | 11,594 | |
| AU Optronics Corp. | 3,526,000 | 2,227,743 | |
| Coretronic Corp. | 106,400 | 215,447 | |
| Delta Electronics, Inc. | 324,000 | 3,169,005 | |
| General Interface Solution Holding Ltd. | 151,000 | 586,943 | |
| Goldtek Technology Co. Ltd. | 6,713 | 21,676 | |
| Hon Hai Precision Industry Co. Ltd. (Foxconn) | 13,358,626 | 53,616,123 | |
| Innolux Corp. | 1,731,000 | 1,079,684 | |
| Largan Precision Co. Ltd. | 186,000 | 18,024,299 | |
| LG Display Co. Ltd. (a) | 57,396 | 1,010,138 | |
| LG Innotek Co. Ltd. | 27,755 | 5,149,106 | |
| Redington (India) Ltd. | 53,882 | 113,930 | |
| Samsung Electro-Mechanics Co. Ltd. | 19,944 | 3,175,125 | |
| Samsung SDI Co. Ltd. | 32,319 | 22,114,813 | |
| Simplo Technology Co. Ltd. | 3,000 | 34,278 | |
| SINBON Electronics Co. Ltd. | 158,000 | 1,231,161 | |
| Sirtec International Co. Ltd. | 1,000 | 953 | |
| Sunny Optical Technology Group Co. Ltd. | 86,200 | 2,606,798 | |
| Unimicron Technology Corp. | 3,091,000 | 16,485,482 | |
| Utechzone Co. Ltd. | 48,000 | 101,012 | |
| Wasion Holdings Ltd. | 54,000 | 17,705 | |
| Wuxi Lead Intelligent Equipment Co. Ltd. (A Shares) | 347,040 | 4,007,179 | |
| Yageo Corp. | 281,600 | 4,882,384 | |
| 139,882,578 | |||
| IT Services - 1.6% | |||
| Digital China Holdings Ltd. (H Shares) | 653,000 | 407,209 | |
| Globant SA (a) | 38,053 | 12,263,721 | |
| HCL Technologies Ltd. | 686,474 | 11,125,525 | |
| Hinduja Global Solutions Ltd. | 1,905 | 71,838 | |
| Infosys Ltd. | 1,200,518 | 28,041,101 | |
| Infosys Ltd. sponsored ADR | 1,838,932 | 43,803,360 | |
| MindTree Consulting Ltd. | 111,574 | 5,547,652 | |
| Mphasis BFL Ltd. | 81,525 | 3,238,716 | |
| Network International Holdings PLC (a)(c) | 505,549 | 2,719,051 | |
| PagSeguro Digital Ltd. (a) | 140,224 | 8,339,121 | |
| StoneCo Ltd. Class A (a) | 71,202 | 3,313,741 | |
| Systex Corp. | 33,000 | 102,141 | |
| Tata Consultancy Services Ltd. | 362,040 | 18,791,331 | |
| Tech Mahindra Ltd. | 612,308 | 12,150,727 | |
| Wipro Ltd. | 1,232,209 | 10,813,852 | |
| WNS Holdings Ltd. sponsored ADR (a) | 13,554 | 1,124,169 | |
| 161,853,255 | |||
| Semiconductors & Semiconductor Equipment - 7.3% | |||
| Advanced Analog Technology, Inc. | 51,000 | 163,755 | |
| Alcor Micro Corp. | 226,000 | 416,763 | |
| Ardentec Corp. | 343,000 | 890,490 | |
| ASE Technology Holding Co. Ltd. | 3,521,000 | 16,247,827 | |
| ASML Holding NV (Netherlands) | 6,515 | 5,433,430 | |
| ChipMOS TECHNOLOGIES, Inc. | 216,000 | 459,242 | |
| D&O Green Technologies Bhd | 37,600 | 46,943 | |
| eGalax_eMPIA Technology, Inc. | 99,910 | 308,155 | |
| Elan Microelectronics Corp. | 69,000 | 392,953 | |
| eMemory Technology, Inc. | 307,000 | 18,094,084 | |
| Everlight Electronics Co. Ltd. | 73,000 | 146,232 | |
| Generalplus Technology, Inc. | 41,000 | 110,891 | |
| Global Unichip Corp. | 226,000 | 3,534,314 | |
| Greatek Electronics, Inc. | 49,000 | 158,928 | |
| Himax Technologies, Inc. sponsored ADR (b) | 112,555 | 1,324,772 | |
| JMicron Technology Corp. (a) | 7,834 | 56,512 | |
| King Yuan Electronics Co. Ltd. | 1,448,000 | 2,387,504 | |
| LONGi Green Energy Technology Co. Ltd. | 739,052 | 10,233,503 | |
| Lx Semicon Co. Ltd. | 9,519 | 948,693 | |
| Macroblock, Inc. | 68,000 | 631,906 | |
| Macronix International Co. Ltd. | 73,000 | 106,375 | |
| Malaysian Pacific Industries Bhd | 12,286 | 130,101 | |
| MediaTek, Inc. | 2,506,000 | 81,642,537 | |
| MLS Co. Ltd. (A Shares) | 552,731 | 1,434,721 | |
| Nanya Technology Corp. | 252,000 | 605,033 | |
| Novatek Microelectronics Corp. | 318,000 | 5,162,786 | |
| Parade Technologies Ltd. | 6,000 | 379,664 | |
| Phison Electronics Corp. | 57,000 | 880,062 | |
| Powertech Technology, Inc. | 807,000 | 3,282,742 | |
| Radiant Opto-Electronics Corp. | 462,000 | 1,653,818 | |
| Raydium Semiconductor Corp. | 45,280 | 627,070 | |
| Realtek Semiconductor Corp. | 895,000 | 17,928,478 | |
| Sigurd Microelectronics Corp. | 212,000 | 498,264 | |
| Silergy Corp. | 167,000 | 24,033,121 | |
| Silicon Motion Tech Corp. sponsored ADR | 8,585 | 640,956 | |
| SK Hynix, Inc. | 553,469 | 50,862,192 | |
| Sonix Technology Co. Ltd. | 222,000 | 726,461 | |
| Taiwan Semiconductor Manufacturing Co. Ltd. | 18,791,900 | 413,061,837 | |
| Taiwan Semiconductor Manufacturing Co. Ltd. sponsored ADR | 486,907 | 57,946,802 | |
| United Microelectronics Corp. | 6,093,000 | 13,835,021 | |
| Vanguard International Semiconductor Corp. | 1,616,000 | 8,647,961 | |
| ViTrox Corp. Bhd | 6,000 | 27,048 | |
| Winbond Electronics Corp. | 1,629,000 | 1,737,616 | |
| 747,837,563 | |||
| Software - 0.1% | |||
| Asseco Poland SA | 16,805 | 368,116 | |
| Avast PLC (c) | 555,857 | 4,568,507 | |
| Birlasoft Ltd. | 33,607 | 192,149 | |
| Cheetah Mobile, Inc. ADR (a)(b) | 13,583 | 27,573 | |
| Cyient Ltd. | 29,158 | 390,680 | |
| Genesis Technology, Inc. | 15,000 | 35,255 | |
| KPIT Engineering Ltd. | 63,382 | 292,622 | |
| Nucleus Software Exports Ltd. | 31,536 | 238,494 | |
| Oracle Financial Services Soft | 1,081 | 69,639 | |
| Shenzhen Kingdom Sci-Tech Co. Ltd. (A Shares) | 259,103 | 495,691 | |
| 6,678,726 | |||
| Technology Hardware, Storage & Peripherals - 3.2% | |||
| Acer, Inc. | 427,000 | 389,080 | |
| ASUSTeK Computer, Inc. | 330,000 | 3,866,069 | |
| Chicony Electronics Co. Ltd. | 62,000 | 175,984 | |
| Compal Electronics, Inc. | 1,420,000 | 1,175,803 | |
| Getac Technology Corp. | 131,818 | 249,280 | |
| Lenovo Group Ltd. | 8,802,000 | 9,755,542 | |
| Lite-On Technology Corp. | 2,172,000 | 4,806,422 | |
| Micro-Star International Co. Ltd. | 397,000 | 1,873,319 | |
| Qisda Corp. | 197,000 | 211,916 | |
| Samsung Electronics Co. Ltd. | 4,565,271 | 302,144,081 | |
| Wiwynn Corp. | 81,000 | 2,840,975 | |
| Xiaomi Corp. Class B (a)(c) | 1,790,800 | 5,756,385 | |
| 333,244,856 | |||
| TOTAL INFORMATION TECHNOLOGY | 1,396,523,240 | ||
| MATERIALS - 3.8% | |||
| Chemicals - 0.7% | |||
| China BlueChemical Ltd. (H Shares) | 162,000 | 50,199 | |
| China Risun Group Ltd. Class H | 238,000 | 168,001 | |
| China Sanjiang Fine Chemicals Ltd. | 329,000 | 131,559 | |
| China XLX Fertiliser Ltd. | 138,724 | 103,096 | |
| Fertilizantes Heringer SA (a) | 86,500 | 396,132 | |
| Finolex Industries Ltd. (a) | 24,457 | 56,306 | |
| Formosa Plastics Corp. | 902,000 | 3,343,036 | |
| Fufeng Group Ltd. | 437,000 | 166,879 | |
| Gujarat Narmada Valley Fertilizers Co. | 54,694 | 249,362 | |
| Gujarat State Fertilizers & Chemicals Ltd. | 97,251 | 136,043 | |
| Hansol Chemical Co. Ltd. | 60,668 | 15,207,505 | |
| Kolon Industries, Inc. | 19,850 | 1,490,157 | |
| LG Chemical Ltd. | 37,369 | 24,441,781 | |
| Mangalore Chemicals & Fertilizers Ltd. (a) | 50,959 | 52,390 | |
| National Fertilizers Ltd. (a) | 63,071 | 47,162 | |
| National Industrialization Co. (a) | 108,426 | 603,603 | |
| Phillips Carbon Black Ltd. | 197,247 | 659,734 | |
| PhosAgro OJSC GDR (Reg. S) | 42,690 | 840,993 | |
| Polyplex Corp. Ltd. | 8,102 | 168,518 | |
| Saudi Basic Industries Corp. | 214,894 | 7,047,208 | |
| Saudi Industrial Investment Group | 259,082 | 2,479,815 | |
| Saudi Kayan Petrochemical Co. (a) | 423,737 | 2,103,603 | |
| Shandong Sinocera Functional Material Co. Ltd. (A Shares) | 389,683 | 2,760,056 | |
| Sharda Cropchem Ltd. | 25,945 | 112,243 | |
| Sinopec Shanghai Petrochemical Co. Ltd. (H Shares) | 224,000 | 48,386 | |
| Sociedad Quimica y Minera de Chile SA (PN-B) sponsored ADR | 71,784 | 3,743,536 | |
| Solar Industries India Ltd. | 203,700 | 4,884,963 | |
| Taekwang Industrial Co. Ltd. | 168 | 160,186 | |
| Unipar Carbocloro SA | 5,600 | 106,124 | |
| UPL Ltd. | 150,254 | 1,526,720 | |
| 73,285,296 | |||
| Construction Materials - 0.4% | |||
| Anhui Conch Cement Co. Ltd. (H Shares) | 1,311,000 | 7,096,555 | |
| Arabian Cement Co. | 9,255 | 107,955 | |
| Asia Cement (China) Holdings Corp. | 259,584 | 191,581 | |
| Beijing Oriental Yuhong Waterproof Technology Co. Ltd. (A Shares) | 278,950 | 2,089,740 | |
| CEMEX S.A.B. de CV sponsored ADR (a) | 1,260,490 | 10,336,018 | |
| China National Building Materials Co. Ltd. (H Shares) | 4,594,442 | 6,285,462 | |
| Eastern Province Cement Co. | 11,834 | 163,121 | |
| JK Cement Ltd. | 168,500 | 7,556,180 | |
| NCL Industries Ltd. | 21,490 | 68,711 | |
| Qatar National Cement Co. QSC (a) | 28,165 | 38,678 | |
| Ultratech Cement Ltd. | 27,184 | 2,918,635 | |
| 36,852,636 | |||
| Containers & Packaging - 0.0% | |||
| CPMC Holdings Ltd. | 104,000 | 62,180 | |
| Klabin SA unit (a) | 477,578 | 2,430,006 | |
| 2,492,186 | |||
| Metals & Mining - 2.5% | |||
| African Rainbow Minerals Ltd. | 32,510 | 580,049 | |
| Aluminum Corp. of China Ltd. (H Shares) (a) | 2,832,000 | 2,055,034 | |
| Angang Steel Co. Ltd. (H Shares) | 1,995,654 | 1,526,740 | |
| Anglo American Platinum Ltd. | 37,024 | 4,201,435 | |
| AngloGold Ashanti Ltd. | 176,828 | 2,996,008 | |
| Ann Joo Resources Bhd | 500 | 307 | |
| Baoshan Iron & Steel Co. Ltd. (A Shares) | 5,250,001 | 8,280,451 | |
| Barrick Gold Corp. | 596,300 | 11,967,741 | |
| China Molybdenum Co. Ltd. (A Shares) | 3,100,700 | 3,753,072 | |
| China Zhongwang Holdings Ltd. (a)(d) | 350,800 | 75,776 | |
| Companhia Siderurgica Nacional SA (CSN) | 410,662 | 2,768,561 | |
| Fangda Special Steel Technology Co. Ltd. (A Shares) | 3,222,300 | 4,049,883 | |
| First Quantum Minerals Ltd. | 180,525 | 3,760,312 | |
| Gold Fields Ltd. | 454,277 | 4,314,424 | |
| Grupa Kety SA | 325 | 56,342 | |
| Grupo Mexico SA de CV Series B | 3,411,966 | 15,892,722 | |
| Hindalco Industries Ltd. | 1,405,272 | 9,020,971 | |
| Hunan Valin Steel Co. Ltd. (A Shares) | 3,698,518 | 4,465,219 | |
| Impala Platinum Holdings Ltd. | 2,283,231 | 34,980,708 | |
| KGHM Polska Miedz SA (Bearer) | 128,727 | 5,992,461 | |
| Korea Zinc Co. Ltd. | 31,532 | 14,474,891 | |
| Kumba Iron Ore Ltd. | 93,581 | 4,206,756 | |
| National Aluminium Co. Ltd. | 39,774 | 49,478 | |
| Novolipetsk Steel OJSC GDR (Reg. S) | 62,411 | 2,084,527 | |
| Polyus PJSC | 8,925 | 1,609,294 | |
| Polyus PJSC unit | 21,135 | 1,873,618 | |
| POSCO | 79,573 | 22,914,291 | |
| POSCO sponsored ADR | 30,911 | 2,207,045 | |
| PT Aneka Tambang Tbk | 6,639,700 | 1,112,630 | |
| Shanxi Taigang Stainless Steel Co. Ltd. (A Shares) | 346,704 | 542,538 | |
| Sibanye Stillwater Ltd. | 2,212,637 | 9,036,533 | |
| Southern Copper Corp. | 103,798 | 6,496,717 | |
| Tata Steel Ltd. | 660,548 | 13,131,550 | |
| Ternium SA sponsored ADR | 235,866 | 12,826,393 | |
| Vale SA | 1,050,800 | 20,053,559 | |
| Vale SA sponsored ADR | 1,270,302 | 24,224,659 | |
| Xinyu Iron & Steel Co. Ltd. | 2,900,747 | 3,946,564 | |
| 261,529,259 | |||
| Paper & Forest Products - 0.2% | |||
| Dexco SA | 1,779,927 | 7,094,511 | |
| Nine Dragons Paper (Holdings) Ltd. | 528,000 | 722,334 | |
| Suzano Papel e Celulose SA (a) | 999,000 | 11,785,217 | |
| 19,602,062 | |||
| TOTAL MATERIALS | 393,761,439 | ||
| REAL ESTATE - 0.4% | |||
| Equity Real Estate Investment Trusts (REITs) - 0.0% | |||
| Link (REIT) | 317,200 | 2,918,136 | |
| Real Estate Management & Development - 0.4% | |||
| Agile Property Holdings Ltd. | 3,373,238 | 3,868,785 | |
| Ayala Land, Inc. | 11,271,700 | 7,663,575 | |
| China Overseas Land and Investment Ltd. | 3,002,000 | 6,909,180 | |
| Emaar Properties PJSC (a) | 5,766,024 | 6,593,061 | |
| Gemdale Properties and Investment Corp. Ltd. | 586,000 | 65,551 | |
| Greenland Holdings Corp. Ltd. (A Shares) | 36,781 | 25,334 | |
| Hang Lung Properties Ltd. | 1,253,000 | 3,009,475 | |
| K Wah International Holdings Ltd. | 273,792 | 120,043 | |
| KWG Property Holding Ltd. | 1,094,500 | 1,153,964 | |
| Longfor Properties Co. Ltd. (c) | 285,000 | 1,234,916 | |
| Powerlong Real Estate Holding Ltd. | 195,417 | 158,546 | |
| Sun Hung Kai Properties Ltd. | 216,500 | 3,050,923 | |
| Sunac China Holdings Ltd. | 747,000 | 1,911,333 | |
| Xinyuan Real Estate Co. Ltd. ADR | 2,500 | 5,700 | |
| Yuexiu Property Co. Ltd. | 178,289 | 167,115 | |
| 35,937,501 | |||
| TOTAL REAL ESTATE | 38,855,637 | ||
| UTILITIES - 0.3% | |||
| Electric Utilities - 0.0% | |||
| PGE Polska Grupa Energetyczna SA (a) | 140,794 | 370,902 | |
| Saudi Electricity Co. | 37,630 | 273,895 | |
| Tauron Polska Energia SA (a) | 35,515 | 33,650 | |
| 678,447 | |||
| Gas Utilities - 0.3% | |||
| China Gas Holdings Ltd. | 1,775,600 | 5,148,189 | |
| China Tian Lun Gas Holding Ltd. (a) | 178,000 | 182,636 | |
| Daesung Energy Co. Ltd. | 20,047 | 110,536 | |
| ENN Energy Holdings Ltd. | 731,200 | 14,468,969 | |
| Indraprastha Gas Ltd. | 649,141 | 4,857,145 | |
| Kunlun Energy Co. Ltd. | 948,000 | 1,004,381 | |
| 25,771,856 | |||
| TOTAL UTILITIES | 26,450,303 | ||
| TOTAL COMMON STOCKS | |||
| (Cost $3,984,460,955) | 5,672,185,499 | ||
| Nonconvertible Preferred Stocks - 1.9% | |||
| CONSUMER DISCRETIONARY - 0.1% | |||
| Automobiles - 0.1% | |||
| Hyundai Motor Co. | 44,865 | 3,968,110 | |
| Textiles, Apparel & Luxury Goods - 0.0% | |||
| Alpargatas SA (PN) (a) | 57,200 | 663,395 | |
| TOTAL CONSUMER DISCRETIONARY | 4,631,505 | ||
| CONSUMER STAPLES - 0.1% | |||
| Beverages - 0.1% | |||
| Ambev SA sponsored ADR | 2,118,000 | 6,904,680 | |
| ENERGY - 0.3% | |||
| Oil, Gas & Consumable Fuels - 0.3% | |||
| Petroleo Brasileiro SA - Petrobras: | |||
| (PN) (non-vtg.) | 1,753,700 | 9,221,610 | |
| (PN) sponsored ADR (non-vtg.) | 309,181 | 3,249,492 | |
| sponsored ADR | 1,670,905 | 18,112,610 | |
| 30,583,712 | |||
| FINANCIALS - 0.8% | |||
| Banks - 0.8% | |||
| Banco Bradesco SA (PN) | 819,523 | 3,669,057 | |
| Banco do Estado Rio Grande do Sul SA Class B | 51,110 | 123,357 | |
| Itau Unibanco Holding SA | 7,731,936 | 46,264,814 | |
| Itau Unibanco Holding SA sponsored ADR | 2,931,595 | 17,384,358 | |
| Itausa-Investimentos Itau SA (PN) | 8,043,846 | 17,983,070 | |
| Sberbank of Russia | 145,250 | 614,846 | |
| Sberbank of Russia (Russia) | 128,031 | 541,958 | |
| 86,581,460 | |||
| INDUSTRIALS - 0.1% | |||
| Aerospace & Defense - 0.0% | |||
| Forjas Taurus SA (a) | 149,300 | 649,080 | |
| Airlines - 0.1% | |||
| Azul SA (a) | 1,176,100 | 8,581,700 | |
| TOTAL INDUSTRIALS | 9,230,780 | ||
| INFORMATION TECHNOLOGY - 0.3% | |||
| Technology Hardware, Storage & Peripherals - 0.3% | |||
| Samsung Electronics Co. Ltd. | 455,559 | 27,831,080 | |
| MATERIALS - 0.2% | |||
| Chemicals - 0.1% | |||
| Braskem SA (PN-A) (a) | 281,026 | 3,586,467 | |
| LG Chemical Ltd. | 11,485 | 3,428,935 | |
| Unipar Carbocloro SA | 21,300 | 372,507 | |
| 7,387,909 | |||
| Metals & Mining - 0.1% | |||
| Bradespar SA (PN) | 37,400 | 456,759 | |
| Gerdau SA | 2,562,960 | 14,037,098 | |
| Metalurgica Gerdau SA (PN) | 412,500 | 1,031,489 | |
| Usinas Siderurgicas de Minas Gerais SA - Usiminas (PN-A) (non-vtg.) | 131,900 | 471,654 | |
| 15,997,000 | |||
| TOTAL MATERIALS | 23,384,909 | ||
| UTILITIES - 0.0% | |||
| Electric Utilities - 0.0% | |||
| Companhia Energetica de Minas Gerais (CEMIG) (PN) | 644,991 | 1,685,199 | |
| Companhia Paranaense de Energia-COPEL (PN-B) | 310,000 | 410,072 | |
| 2,095,271 | |||
| TOTAL NONCONVERTIBLE PREFERRED STOCKS | |||
| (Cost $155,984,353) | 191,243,397 | ||
| Equity Funds - 35.9% | |||
| Diversified Emerging Markets Funds - 35.9% | |||
| Aberdeen Emerging Markets Fund Institutional Service Class | 10,693,873 | 221,683,979 | |
| Artisan Developing World Fund Investor Shares | 3,341,137 | 88,540,133 | |
| Brandes Emerging Markets Value Fund Class A | 16,711,242 | 149,064,278 | |
| Calvert Emerging Markets Equity Fund Class A | 45 | 998 | |
| Fidelity Advisor Emerging Markets Fund - Class Z (e) | 14,977,222 | 714,713,029 | |
| Fidelity SAI Emerging Markets Index Fund (e) | 22,429,841 | 381,755,890 | |
| Fidelity SAI Emerging Markets Low Volatility Index Fund (e) | 50,681,873 | 589,937,003 | |
| Fidelity SAI Emerging Markets Value Index Fund (e) | 37,732,224 | 557,304,954 | |
| GMO Emerging Markets Fund - Class III | 1,924,381 | 71,817,883 | |
| Goldman Sachs Emerging Markets Equity Fund Institutional Shares | 10,110,478 | 321,412,084 | |
| Invesco Developing Markets Fund Class R6 | 4,625,320 | 246,252,024 | |
| Invesco Emerging Markets Innovators Fund Class A | 4,958,391 | 63,963,244 | |
| iShares MSCI China ETF (b) | 2,226,845 | 157,638,358 | |
| iShares MSCI EM ESG Optimized ETF (b) | 209,609 | 9,046,724 | |
| iShares MSCI South Korea Index ETF | 546,222 | 47,351,985 | |
| Lazard Emerging Markets Equity Portfolio Open Shares | 842,137 | 16,724,849 | |
| Matthews Korea Fund Investor Class | 4,457,127 | 28,258,185 | |
| Matthews Pacific Tiger Fund Investor Class | 135 | 4,684 | |
| Xtrackers Harvest CSI 300 China ETF Class A (b) | 599,313 | 22,707,970 | |
| TOTAL EQUITY FUNDS | |||
| (Cost $2,693,322,202) | 3,688,178,254 | ||
| Other - 0.1% | |||
| Commodity Funds - Broad Basket - 0.1% | |||
| Fidelity SAI Inflation-Focused Fund (e) | |||
| (Cost $6,768,588) | 858,825 | 11,310,724 | |
| Principal Amount | |||
| U.S. Treasury Obligations - 0.3% | |||
| U.S. Treasury Bills, yield at date of purchase 0.02% to 0.05% 9/9/21 to 11/26/21 (f) | |||
| (Cost $33,497,801) | 33,500,000 | 33,497,323 | |
| Shares | |||
| Money Market Funds - 8.2% | |||
| Fidelity Cash Central Fund 0.06% (g) | 6,181,976 | 6,183,212 | |
| Fidelity Securities Lending Cash Central Fund 0.06% (g)(h) | 183,205,540 | 183,223,861 | |
| State Street Institutional U.S. Government Money Market Fund Premier Class 0.03% (i) | 650,148,437 | 650,148,437 | |
| TOTAL MONEY MARKET FUNDS | |||
| (Cost $839,555,510) | 839,555,510 | ||
| TOTAL INVESTMENT IN SECURITIES - 101.7% | |||
| (Cost $7,713,589,409) | 10,435,970,707 | ||
| NET OTHER ASSETS (LIABILITIES) - (1.7)% | (175,035,570) | ||
| NET ASSETS - 100% | $10,260,935,137 |
| Futures Contracts | |||||
| Number of contracts | Expiration Date | Notional Amount | Value | Unrealized Appreciation/(Depreciation) | |
| Purchased | |||||
| Equity Index Contracts | |||||
| ICE E-mini MSCI Emerging Markets Index Contracts (United States) | 8,790 | Sept. 2021 | $570,998,400 | $776,408 | $776,408 |
The notional amount of futures purchased as a percentage of Net Assets is 5.6%
For the period, the average monthly notional amount at value for futures contracts in the aggregate was $296,423,365.
Security Type Abbreviations
ETF – Exchange-Traded Fund
Legend
(a) Non-income producing
(b) Security or a portion of the security is on loan at period end.
(c) Security exempt from registration under Rule 144A of the Securities Act of 1933. These securities may be resold in transactions exempt from registration, normally to qualified institutional buyers. At the end of the period, the value of these securities amounted to $187,480,358 or 1.8% of net assets.
(d) Level 3 security
(e) Affiliated Fund
(f) Security or a portion of the security was pledged to cover margin requirements for futures contracts. At period end, the value of securities pledged amounted to $32,373,358.
(g) Affiliated fund that is generally available only to investment companies and other accounts managed by Fidelity Investments. The rate quoted is the annualized seven-day yield of the fund at period end. A complete unaudited listing of the fund's holdings as of its most recent quarter end is available upon request. In addition, each Fidelity Central Fund's financial statements are available on the SEC's website or upon request.
(h) Investment made with cash collateral received from securities on loan.
(i) The rate quoted is the annualized seven-day yield of the fund at period end.
Affiliated Central Funds
Fiscal year to date information regarding the Fund's investments in Fidelity Central Funds, including the ownership percentage, is presented below.
| Fund | Value, beginning of period | Purchases | Sales Proceeds | Dividend Income | Realized Gain/Loss | Change in Unrealized appreciation (depreciation) | Value, end of period | % ownership, end of period |
| Fidelity Cash Central Fund 0.06% | $8,973,295 | $163,720,857 | $166,510,940 | $1,569 | $-- | $-- | $6,183,212 | 0.0% |
| Fidelity Securities Lending Cash Central Fund 0.06% | 213,463,969 | 1,171,498,263 | 1,201,738,371 | 1,021,887 | -- | -- | 183,223,861 | 0.6% |
| Total | $222,437,264 | $1,335,219,120 | $1,368,249,311 | $1,023,456 | $-- | $-- | $189,407,073 |
Amounts in the income column in the above table include any capital gain distributions from underlying funds, which are presented in the corresponding line-item in the Statement of Operations, if applicable. Amount for Fidelity Securities Lending Cash Central Fund represents the income earned on investing cash collateral, less rebates paid to borrowers and any lending agent fees associated with the loan, plus any premium payments received for lending certain types of securities.
Affiliated Underlying Funds
Fiscal year to date information regarding the Fund's investments in affiliated Underlying Funds is presented below. Exchanges between classes of the same affiliated Underlying Funds may occur. If an underlying Fund changes its name, the name presented below is the name in effect at period end.
| Affiliate | Value, beginning of period | Purchases | Sales Proceeds | Dividend Income | Realized Gain (loss) | Change in Unrealized appreciation (depreciation) | Value, end of period |
| Fidelity Advisor Emerging Markets Fund - Class Z | $-- | $-- | $-- | $-- | $-- | $307,130,258 | $714,713,029 |
| Fidelity Emerging Markets Fund | 684,589,409 | 30,000,000 | -- | -- | -- | (307,006,638) | -- |
| Fidelity SAI Emerging Markets Index Fund | 438,038,233 | -- | 50,000,000 | -- | 17,889,027 | (24,171,370) | 381,755,890 |
| Fidelity SAI Emerging Markets Low Volatility Index Fund | 518,268,483 | 27,000,000 | -- | -- | -- | 44,668,520 | 589,937,003 |
| Fidelity SAI Emerging Markets Value Index Fund | 323,147,760 | 218,000,000 | -- | -- | -- | 16,157,194 | 557,304,954 |
| Fidelity SAI Inflation-Focused Fund | 9,687,545 | -- | -- | -- | -- | 1,623,179 | 11,310,724 |
| Total | $1,973,731,430 | $275,000,000 | $50,000,000 | $-- | $17,889,027 | $38,401,143 | $2,255,021,600 |
Investment Valuation
The following is a summary of the inputs used, as of August 31, 2021, involving the Fund's assets and liabilities carried at fair value. The inputs or methodology used for valuing securities may not be an indication of the risk associated with investing in those securities. For more information on valuation inputs, and their aggregation into the levels used below, please refer to the Investment Valuation section in the accompanying Notes to Financial Statements.
| Valuation Inputs at Reporting Date: | ||||
| Description | Total | Level 1 | Level 2 | Level 3 |
| Investments in Securities: | ||||
| Equities: | ||||
| Communication Services | $603,228,201 | $246,059,648 | $357,168,553 | $-- |
| Consumer Discretionary | 1,043,328,022 | 856,542,754 | 186,756,685 | 28,583 |
| Consumer Staples | 376,032,602 | 371,333,019 | 4,699,583 | -- |
| Energy | 253,766,148 | 229,125,338 | 24,634,948 | 5,862 |
| Financials | 1,244,214,335 | 917,529,720 | 326,684,615 | -- |
| Health Care | 178,207,965 | 141,482,090 | 36,725,875 | -- |
| Industrials | 255,749,744 | 255,749,744 | -- | -- |
| Information Technology | 1,424,354,320 | 933,683,371 | 490,670,949 | -- |
| Materials | 417,146,348 | 340,773,574 | 76,296,998 | 75,776 |
| Real Estate | 38,855,637 | 38,855,637 | -- | -- |
| Utilities | 28,545,574 | 28,545,574 | -- | -- |
| Equity Funds | 3,688,178,254 | 3,688,178,254 | -- | -- |
| Other | 11,310,724 | 11,310,724 | -- | -- |
| Other Short-Term Investments | 33,497,323 | -- | 33,497,323 | -- |
| Money Market Funds | 839,555,510 | 839,555,510 | -- | -- |
| Total Investments in Securities: | $10,435,970,707 | $8,898,724,957 | $1,537,135,529 | $110,221 |
| Derivative Instruments: | ||||
| Assets | ||||
| Futures Contracts | $776,408 | $776,408 | $-- | $-- |
| Total Assets | $776,408 | $776,408 | $-- | $-- |
| Total Derivative Instruments: | $776,408 | $776,408 | $-- | $-- |
Value of Derivative Instruments
The following table is a summary of the Fund's value of derivative instruments by primary risk exposure as of August 31, 2021. For additional information on derivative instruments, please refer to the Derivative Instruments section in the accompanying Notes to Financial Statements.
| Primary Risk Exposure / Derivative Type | Value | |
| Asset | Liability | |
| Equity Risk | ||
| Futures Contracts(a) | $776,408 | $0 |
| Total Equity Risk | 776,408 | 0 |
| Total Value of Derivatives | $776,408 | $0 |
(a) Reflects gross cumulative appreciation (depreciation) on futures contracts as presented in the Schedule of Investments. In the Statement of Assets and Liabilities, the period end daily variation margin is included in receivable or payable for daily variation margin on futures contracts, and the net cumulative appreciation (depreciation) is included in Total accumulated earnings (loss).
Other Information
Distribution of the direct investments by country of issue, as a percentage of Total Net Assets, is as follows (Unaudited):
| United States of America | 43.6% |
| Cayman Islands | 12.5% |
| Taiwan | 8.6% |
| Korea (South) | 8.0% |
| China | 5.9% |
| India | 5.8% |
| Brazil | 3.7% |
| Russia | 1.8% |
| South Africa | 1.7% |
| Hong Kong | 1.5% |
| Mexico | 1.3% |
| Others (Individually Less Than 1%) | 5.6% |
| 100.0% |
See accompanying notes which are an integral part of the financial statements.
Financial Statements
Statement of Assets and Liabilities
| August 31, 2021 (Unaudited) | ||
| Assets | ||
| Investment in securities, at value (including securities loaned of $182,591,068) — See accompanying schedule: Unaffiliated issuers (cost $5,893,839,902) | $7,991,542,034 | |
| Fidelity Central Funds (cost $189,407,073) | 189,407,073 | |
| Other affiliated issuers (cost $1,630,342,434) | 2,255,021,600 | |
| Total Investment in Securities (cost $7,713,589,409) | $10,435,970,707 | |
| Cash | 14,676,576 | |
| Foreign currency held at value (cost $13,757,787) | 13,760,966 | |
| Receivable for investments sold | 27,717,011 | |
| Receivable for fund shares sold | 4,997,788 | |
| Dividends receivable | 6,604,559 | |
| Interest receivable | 13,352 | |
| Distributions receivable from Fidelity Central Funds | 146,418 | |
| Receivable for daily variation margin on futures contracts | 8,322,703 | |
| Prepaid expenses | 17,547 | |
| Other receivables | 395,394 | |
| Total assets | 10,512,623,021 | |
| Liabilities | ||
| Payable for investments purchased | $42,707,658 | |
| Payable for fund shares redeemed | 3,031,249 | |
| Accrued management fee | 2,506,994 | |
| Other payables and accrued expenses | 20,268,691 | |
| Collateral on securities loaned | 183,173,292 | |
| Total liabilities | 251,687,884 | |
| Net Assets | $10,260,935,137 | |
| Net Assets consist of: | ||
| Paid in capital | $7,449,805,596 | |
| Total accumulated earnings (loss) | 2,811,129,541 | |
| Net Assets | $10,260,935,137 | |
| Net Asset Value, offering price and redemption price per share ($10,260,935,137 ÷ 751,012,249 shares) | $13.66 |
See accompanying notes which are an integral part of the financial statements.
Statement of Operations
| Six months ended August 31, 2021 (Unaudited) | ||
| Investment Income | ||
| Dividends: | ||
| Unaffiliated issuers | $82,940,598 | |
| Interest | 43,051 | |
| Income from Fidelity Central Funds (including $1,021,887 from security lending) | 1,023,456 | |
| Income before foreign taxes withheld | 84,007,105 | |
| Less foreign taxes withheld | (8,994,585) | |
| Total income | 75,012,520 | |
| Expenses | ||
| Management fee | $27,437,339 | |
| Custodian fees and expenses | 757,770 | |
| Independent trustees' fees and expenses | 37,123 | |
| Registration fees | 197,353 | |
| Audit | 55,061 | |
| Legal | 12,468 | |
| Miscellaneous | 30,700 | |
| Total expenses before reductions | 28,527,814 | |
| Expense reductions | (12,465,092) | |
| Total expenses after reductions | 16,062,722 | |
| Net investment income (loss) | 58,949,798 | |
| Realized and Unrealized Gain (Loss) | ||
| Net realized gain (loss) on: | ||
| Investment securities: | ||
| Unaffiliated issuers (net of foreign taxes of $230,788) | 71,603,792 | |
| Affiliated issuers | 17,889,027 | |
| Foreign currency transactions | (2,130,193) | |
| Futures contracts | 6,218,498 | |
| Total net realized gain (loss) | 93,581,124 | |
| Change in net unrealized appreciation (depreciation) on: | ||
| Investment securities: | ||
| Unaffiliated issuers (net of increase in deferred foreign taxes of $7,293,072) | (310,512,361) | |
| Affiliated issuers | 38,401,143 | |
| Assets and liabilities in foreign currencies | 379,205 | |
| Futures contracts | (1,091,376) | |
| Total change in net unrealized appreciation (depreciation) | (272,823,389) | |
| Net gain (loss) | (179,242,265) | |
| Net increase (decrease) in net assets resulting from operations | $(120,292,467) |
See accompanying notes which are an integral part of the financial statements.
Statement of Changes in Net Assets
| Six months ended August 31, 2021 (Unaudited) | Year ended February 28, 2021 | |
| Increase (Decrease) in Net Assets | ||
| Operations | ||
| Net investment income (loss) | $58,949,798 | $91,514,399 |
| Net realized gain (loss) | 93,581,124 | 219,539,578 |
| Change in net unrealized appreciation (depreciation) | (272,823,389) | 2,384,371,428 |
| Net increase (decrease) in net assets resulting from operations | (120,292,467) | 2,695,425,405 |
| Distributions to shareholders | (22,658,533) | (90,024,462) |
| Share transactions | ||
| Proceeds from sales of shares | 1,690,313,139 | 3,358,154,783 |
| Reinvestment of distributions | 20,736,407 | 81,913,668 |
| Cost of shares redeemed | (521,394,703) | (1,649,482,798) |
| Net increase (decrease) in net assets resulting from share transactions | 1,189,654,843 | 1,790,585,653 |
| Total increase (decrease) in net assets | 1,046,703,843 | 4,395,986,596 |
| Net Assets | ||
| Beginning of period | 9,214,231,294 | 4,818,244,698 |
| End of period | $10,260,935,137 | $9,214,231,294 |
| Other Information | ||
| Shares | ||
| Sold | 123,290,401 | 324,339,792 |
| Issued in reinvestment of distributions | 1,504,819 | 6,168,199 |
| Redeemed | (37,601,573) | (138,988,515) |
| Net increase (decrease) | 87,193,647 | 191,519,476 |
See accompanying notes which are an integral part of the financial statements.
Financial Highlights
Strategic Advisers Emerging Markets Fund
| Six months ended (Unaudited) August 31, | Years endedFebruary 28, | |||||
| 2021 | 2021 | 2020 A | 2019 | 2018 | 2017 | |
| Selected Per–Share Data | ||||||
| Net asset value, beginning of period | $13.88 | $10.20 | $10.23 | $11.75 | $9.14 | $7.15 |
| Income from Investment Operations | ||||||
| Net investment income (loss)B | .08 | .15 | .23C | .17 | .14 | .10 |
| Net realized and unrealized gain (loss) | (.27) | 3.66 | (.03) | (1.53) | 2.62 | 1.99 |
| Total from investment operations | (.19) | 3.81 | .20 | (1.36) | 2.76 | 2.09 |
| Distributions from net investment income | (.02) | (.13) | (.23) | (.16) | (.15) | (.10) |
| Distributions from net realized gain | (.02) | – | – | – | –D | (.01) |
| Total distributions | (.03)E | (.13) | (.23) | (.16) | (.15) | (.10)E |
| Net asset value, end of period | $13.66 | $13.88 | $10.20 | $10.23 | $11.75 | $9.14 |
| Total ReturnF,G | (1.34)% | 37.42% | 1.80% | (11.48)% | 30.23% | 29.40% |
| Ratios to Average Net AssetsH,I | ||||||
| Expenses before reductions | .59%J | .59% | .64% | .66% | .70% | .60% |
| Expenses net of fee waivers, if any | .34%J | .34% | .39% | .41% | .45% | .35% |
| Expenses net of all reductions | .33%J | .34% | .39% | .40% | .45% | .35% |
| Net investment income (loss) | 1.21%J | 1.28% | 2.20%C | 1.60% | 1.36% | 1.23% |
| Supplemental Data | ||||||
| Net assets, end of period (000 omitted) | $10,260,935 | $9,214,231 | $4,818,245 | $4,660,765 | $5,070,379 | $4,599,443 |
| Portfolio turnover rateK | 32%J | 43% | 39% | 57% | 31% | 23% |
A For the year ended February 29.
B Calculated based on average shares outstanding during the period.
C Net investment income per share reflects one or more large, non-recurring dividend(s) which amounted to $.03 per share. Excluding such non-recurring dividend(s), the ratio of net investment income (loss) to average net assets would have been 1.87%.
D Amount represents less than $.005 per share.
E Total distributions per share do not sum due to rounding.
F Total returns for periods of less than one year are not annualized.
G Total returns would have been lower if certain expenses had not been reduced during the applicable periods shown.
H Fees and expenses of any underlying mutual funds or exchange-traded funds (ETFs) are not included in the Fund's expense ratio. The Fund indirectly bears its proportionate share of these expenses. For additional expense information related to investments in Fidelity Central Funds, please refer to the "Investments in Fidelity Central Funds" note found in the Notes to Financial Statements section of the most recent Annual or Semi-Annual report.
I Expense ratios reflect operating expenses of the class. Expenses before reductions do not reflect amounts reimbursed, waived, or reduced through arrangements with the investment advisor, brokerage services, or other offset arrangements, if applicable, and do not represent the amount paid by the class during periods when reimbursements, waivers or reductions occur.
J Annualized
K Amount does not include the portfolio activity of any underlying mutual funds or exchange-traded funds (ETFs).
See accompanying notes which are an integral part of the financial statements.
Notes to Financial Statements (Unaudited)
For the period ended August 31, 2021
1. Organization.
Strategic Advisers Emerging Markets Fund (the Fund) is a fund of Fidelity Rutland Square Trust II (the Trust), and is authorized to issue an unlimited number of shares. The Trust is registered under the Investment Company Act of 1940, as amended (the 1940 Act), as an open-end management investment company organized as a Delaware statutory trust. The Fund is offered exclusively to certain managed account clients of Strategic Advisers LLC (Strategic Advisers), an affiliate of Fidelity Management & Research Company LLC (FMR). The Fund's investments in emerging markets can be subject to social, economic, regulatory, and political uncertainties and can be extremely volatile.
2. Significant Accounting Policies.
The Fund is an investment company and applies the accounting and reporting guidance of the Financial Accounting Standards Board (FASB) Accounting Standards Codification Topic 946 Financial Services - Investment Companies. The financial statements have been prepared in conformity with accounting principles generally accepted in the United States of America (GAAP), which require management to make certain estimates and assumptions at the date of the financial statements. Actual results could differ from those estimates. Subsequent events, if any, through the date that the financial statements were issued have been evaluated in the preparation of the financial statements. The Fund's Schedule of Investments lists any underlying mutual funds or exchange-traded funds (ETFs) but does not include the underlying holdings of these funds. The following summarizes the significant accounting policies of the Fund:
Investment Valuation. Investments are valued as of 4:00 p.m. Eastern time on the last calendar day of the period. The Board of Trustees (the Board) has delegated the day to day responsibility for the valuation of the Fund's investments to the Fair Value Committee (the Committee) established by the Fund's investment adviser. In accordance with valuation policies and procedures approved by the Board, the Fund attempts to obtain prices from one or more third party pricing vendors or brokers to value its investments. When current market prices, quotations or currency exchange rates are not readily available or reliable, investments will be fair valued in good faith by the Committee, in accordance with procedures adopted by the Board. Factors used in determining fair value vary by investment type and may include market or investment specific events, changes in interest rates and credit quality. The frequency with which these procedures are used cannot be predicted and they may be utilized to a significant extent. The Committee oversees the Fund's valuation policies and procedures and reports to the Board on the Committee's activities and fair value determinations. The Board monitors the appropriateness of the procedures used in valuing the Fund's investments and ratifies the fair value determinations of the Committee.
The Fund categorizes the inputs to valuation techniques used to value its investments into a disclosure hierarchy consisting of three levels as shown below:
- Level 1 – quoted prices in active markets for identical investments
- Level 2 – other significant observable inputs (including quoted prices for similar investments, interest rates, prepayment speeds, etc.)
- Level 3 – unobservable inputs (including the Fund's own assumptions based on the best information available)
Valuation techniques used to value the Fund's investments by major category are as follows:
Equity securities, including restricted securities, for which market quotations are readily available, are valued at the last reported sale price or official closing price as reported by a third party pricing vendor on the primary market or exchange on which they are traded and are categorized as Level 1 in the hierarchy. In the event there were no sales during the day or closing prices are not available, securities are valued at the last quoted bid price or may be valued using the last available price and are generally categorized as Level 2 in the hierarchy. For foreign equity securities, when market or security specific events arise, comparisons to the valuation of American Depositary Receipts (ADRs), futures contracts, Exchange-Traded Funds (ETFs) and certain indexes as well as quoted prices for similar securities may be used and would be categorized as Level 2 in the hierarchy. For equity securities, including restricted securities, where observable inputs are limited, assumptions about market activity and risk are used and these securities may be categorized as Level 3 in the hierarchy.
Debt securities, including restricted securities, are valued based on evaluated prices received from third party pricing vendors or from brokers who make markets in such securities. U.S. government and government agency obligations are valued by pricing vendors who utilize matrix pricing which considers yield or price of bonds of comparable quality, coupon, maturity and type or by broker-supplied prices. When independent prices are unavailable or unreliable, debt securities may be valued utilizing pricing methodologies which consider similar factors that would be used by third party pricing vendors. Debt securities are generally categorized as Level 2 in the hierarchy but may be Level 3 depending on the circumstances. ETFs are valued at their last sale price or official closing price as reported by a third party pricing vendor on the primary market or exchange on which they are traded and are categorized as Level 1 in the hierarchy. In the event there were no sales during the day but the exchange reports a closing bid level, ETFs are valued at the closing bid and would be categorized as Level 1 in the hierarchy. In the event there was no closing bid, ETFs may be valued by another method that the Board believes reflects fair value in accordance with the Board's fair value pricing policies and may be categorized as Level 2 in the hierarchy.
Futures contracts are valued at the settlement price established each day by the board of trade or exchange on which they are traded and are categorized as Level 1 in the hierarchy. Investments in open-end mutual funds, including the Fidelity Central Funds, are valued at their closing net asset value (NAV) each business day and are categorized as Level 1 in the hierarchy. If an unaffiliated open-end mutual fund's NAV is unavailable, shares of that fund may be valued by another method that the Board believes reflects fair value in accordance with the Board's fair value pricing policies and is categorized as Level 2 in the hierarchy.
Changes in valuation techniques may result in transfers in or out of an assigned level within the disclosure hierarchy. The aggregate value of investments by input level as of August 31, 2021 is included at the end of the Fund's Schedule of Investments.
Foreign Currency. Certain Funds may use foreign currency contracts to facilitate transactions in foreign-denominated securities. Gains and losses from these transactions may arise from changes in the value of the foreign currency or if the counterparties do not perform under the contracts' terms.
Foreign-denominated assets, including investment securities, and liabilities are translated into U.S. dollars at the exchange rates at period end. Purchases and sales of investment securities, income and dividends received, and expenses denominated in foreign currencies are translated into U.S. dollars at the exchange rate in effect on the transaction date.
The effects of exchange rate fluctuations on investments are included with the net realized and unrealized gain (loss) on investment securities. Other foreign currency transactions resulting in realized and unrealized gain (loss) are disclosed separately.
Investment Transactions and Income. For financial reporting purposes, the Fund's investment holdings and NAV include trades executed through the end of the last business day of the period. The NAV per share for processing shareholder transactions is calculated as of the close of business of the New York Stock Exchange (NYSE), normally 4:00 p.m. Eastern time and includes trades executed through the end of the prior business day. Gains and losses on securities sold are determined on the basis of identified cost. Dividend income is recorded on the ex-dividend date, except for certain dividends from foreign securities where the ex-dividend date may have passed, which are recorded as soon as the Fund is informed of the ex-dividend date. Non-cash dividends included in dividend income, if any, are recorded at the fair market value of the securities received. Income and capital gain distributions from Fidelity Central Funds, if any, are recorded on the ex-dividend date. Income and capital gain distributions from any underlying mutual funds or exchange-traded funds (ETFs) are recorded on the ex-dividend date. Interest income is accrued as earned and includes coupon interest and amortization of premium and accretion of discount on debt securities as applicable. Investment income is recorded net of foreign taxes withheld where recovery of such taxes is uncertain.
Expenses. Expenses directly attributable to a fund are charged to that fund. Expenses attributable to more than one fund are allocated among the respective funds on the basis of relative net assets or other appropriate methods. Expenses included in the accompanying financial statements reflect the expenses of that fund and do not include any expenses associated with any underlying mutual funds or exchange-traded funds. Although not included in a fund's expenses, a fund indirectly bears its proportionate share of these expenses through the net asset value of each underlying mutual fund or exchange-traded fund. Expense estimates are accrued in the period to which they relate and adjustments are made when actual amounts are known.
Deferred Trustee Compensation. Under a Deferred Compensation Plan (the Plan) for certain Funds, certain independent Trustees have elected to defer receipt of a portion of their annual compensation. Deferred amounts are invested in affiliated mutual funds, are marked-to-market and remain in a fund until distributed in accordance with the Plan. The investment of deferred amounts and the offsetting payable to the Trustees presented below are included in the accompanying Statement of Assets and Liabilities in other receivables and other payables and accrued expenses, as applicable.
| Strategic Advisers Emerging Markets Fund | $69,135 |
Income Tax Information and Distributions to Shareholders. Each year, the Fund intends to qualify as a regulated investment company under Subchapter M of the Internal Revenue Code, including distributing substantially all of its taxable income and realized gains. As a result, no provision for U.S. Federal income taxes is required. The Fund files a U.S. federal tax return, in addition to state and local tax returns as required. The Fund's federal income tax returns are subject to examination by the Internal Revenue Service (IRS) for a period of three fiscal years after they are filed. State and local tax returns may be subject to examination for an additional fiscal year depending on the jurisdiction. Foreign taxes are provided for based on the Fund's understanding of the tax rules and rates that exist in the foreign markets in which it invests. The Fund is subject to a tax imposed on capital gains by certain countries in which it invests. An estimated deferred tax liability for net unrealized appreciation on the applicable securities is included in Other payables and accrued expenses on the Statement of Assets & Liabilities.
Distributions are declared and recorded on the ex-dividend date. Income and capital gain distributions are determined in accordance with income tax regulations, which may differ from GAAP.
Capital accounts within the financial statements are adjusted for permanent book-tax differences. These adjustments have no impact on net assets or the results of operations. Capital accounts are not adjusted for temporary book-tax differences which will reverse in a subsequent period.
Book-tax differences are primarily due to futures contracts, foreign currency transactions, certain foreign taxes, passive foreign investment companies (PFIC), market discount, partnerships, deferred trustees compensation, capital loss carryforwards and losses due to wash sales and excise tax regulations.
As of period end, the cost and unrealized appreciation (depreciation) in securities, and derivatives if applicable, for federal income tax purposes were as follows:
| Gross unrealized appreciation | $2,922,197,654 |
| Gross unrealized depreciation | (230,290,688) |
| Net unrealized appreciation (depreciation) | $2,691,906,966 |
| Tax cost | $7,744,840,149 |
Restricted Securities (including Private Placements). Funds may invest in securities that are subject to legal or contractual restrictions on resale. These securities generally may be resold in transactions exempt from registration or to the public if the securities are registered. Disposal of these securities may involve time-consuming negotiations and expense, and prompt sale at an acceptable price may be difficult. Information regarding restricted securities held at period end is included at the end of the Schedule of Investments, if applicable.
3. Derivative Instruments.
Risk Exposures and the Use of Derivative Instruments. The Fund's investment objective allows the Fund to enter into various types of derivative contracts, including futures contracts. Derivatives are investments whose value is primarily derived from underlying assets, indices or reference rates and may be transacted on an exchange or over-the-counter (OTC). Derivatives may involve a future commitment to buy or sell a specified asset based on specified terms, to exchange future cash flows at periodic intervals based on a notional principal amount, or for one party to make one or more payments upon the occurrence of specified events in exchange for periodic payments from the other party.
The Fund used derivatives to increase returns and to manage exposure to certain risks as defined below. The success of any strategy involving derivatives depends on analysis of numerous economic factors, and if the strategies for investment do not work as intended, the Fund may not achieve its objectives.
The Fund's use of derivatives increased or decreased its exposure to the following risk:
| Equity Risk | Equity risk relates to the fluctuations in the value of financial instruments as a result of changes in market prices (other than those arising from interest rate risk or foreign exchange risk), whether caused by factors specific to an individual investment, its issuer, or all factors affecting all instruments traded in a market or market segment. |
The Fund is also exposed to additional risks from investing in derivatives, such as liquidity risk and counterparty credit risk. Liquidity risk is the risk that the Fund will be unable to close out the derivative in the open market in a timely manner. Counterparty credit risk is the risk that the counterparty will not be able to fulfill its obligation to the Fund. Counterparty credit risk related to exchange-traded futures contracts may be mitigated by the protection provided by the exchange on which they trade.
Investing in derivatives may involve greater risks than investing in the underlying assets directly and, to varying degrees, may involve risk of loss in excess of any initial investment and collateral received and amounts recognized in the Statement of Assets and Liabilities. In addition, there may be the risk that the change in value of the derivative contract does not correspond to the change in value of the underlying instrument.
Futures Contracts. A futures contract is an agreement between two parties to buy or sell a specified underlying instrument for a fixed price at a specified future date. The Fund used futures contracts to manage its exposure to the stock market.
Upon entering into a futures contract, a fund is required to deposit either cash or securities (initial margin) with a clearing broker in an amount equal to a certain percentage of the face value of the contract. Futures contracts are marked-to-market daily and subsequent daily payments (variation margin) are made or received by a fund depending on the daily fluctuations in the value of the futures contracts and are recorded as unrealized appreciation or (depreciation). This receivable and/or payable, if any, is included in daily variation margin on futures contracts in the Statement of Assets and Liabilities. Realized gain or (loss) is recorded upon the expiration or closing of a futures contract. The net realized gain (loss) and change in net unrealized appreciation (depreciation) on futures contracts during the period is presented in the Statement of Operations.
Any open futures contracts at period end are presented in the Schedule of Investments under the caption "Futures Contracts". The notional amount at value reflects each contract's exposure to the underlying instrument or index at period end. Securities deposited to meet initial margin requirements are identified in the Schedule of Investments.
4. Purchases and Sales of Investments.
Purchases and sales of securities, other than short-term securities and in-kind transactions, as applicable, are noted in the table below.
| Purchases ($) | Sales ($) | |
| Strategic Advisers Emerging Markets Fund | 2,215,704,632 | 1,514,528,553 |
5. Fees and Other Transactions with Affiliates.
Management Fee. Strategic Advisers (the investment adviser) provides the Fund with investment management related services. For these services, the Fund pays a monthly management fee to the investment adviser. The management fee is calculated by adding the annual management fee rate of .25% of the Fund's average net assets throughout the month to the aggregate of the fee rates, payable monthly by the investment adviser, to the Fund's sub-advisers. The Fund's maximum aggregate management fee will not exceed 1.20% of the Fund's average net assets. For the reporting period, the total annualized management fee rate was .56% of the Fund's average net assets.
During the period, the investment adviser waived a portion of its management fee as described in the Expense Reductions note.
Sub-Advisers. Acadian Asset Management LLC, Causeway Capital Management, LLC, FIAM LLC (an affiliate of the investment adviser), FIL Investment Advisors, Schroder Investment Management North America, Inc., Somerset Capital Management LLP and T. Rowe Price Associates, Inc. each served as a sub-adviser for the Fund during the period. Sub-advisers provide discretionary investment advisory services for their allocated portion of the Fund's assets and are paid as described in the Management Fee note.
Geode Capital Management, LLC (Geode) has been retained to serve as a sub-adviser for the Fund. As of the date of this report, however, Geode has not been allocated any portion of the Fund's assets. Geode in the future may provide discretionary investment advisory services for an allocated portion of the Fund's assets and will be paid by the investment adviser for providing these services.
Brokerage Commissions. A portion of portfolio transactions were placed with brokerage firms which are affiliates of the investment adviser. Brokerage commissions are included in net realized gain (loss) and change in net unrealized appreciation (depreciation) in the Statement of Operations. The commissions paid to these affiliated firms were as follows:
| Amount | |
| Strategic Advisers Emerging Markets Fund | $5,019 |
Interfund Trades. Funds may purchase from or sell securities to other funds affiliated with each sub-adviser under procedures adopted by the Board. The procedures have been designed to ensure these interfund trades are executed in accordance with Rule 17a-7 of the 1940 Act. Any interfund trades are included within the respective purchases and sales amounts shown in the Purchases and Sales of Investments note and are noted in the table below.
| Purchases ($) | Sales ($) | |
| Strategic Advisers Emerging Markets Fund | 12,102,671 | 3,918,241 |
6. Investments in Fidelity Central Funds.
Funds may invest in Fidelity Central Funds, which are open-end investment companies generally available only to other investment companies and accounts managed by the investment adviser and its affiliates. The Schedule of Investments lists any Fidelity Central Funds held as an investment as of period end, but does not include the underlying holdings of each Fidelity Central Fund. An investing fund indirectly bears its proportionate share of the expenses of the underlying Fidelity Central Funds.
Based on its investment objective, each Fidelity Central Fund may invest or participate in various investment vehicles or strategies that are similar to those of the investing fund. These strategies are consistent with the investment objectives of the investing fund and may involve certain economic risks which may cause a decline in value of each of the Fidelity Central Funds and thus a decline in the value of the investing fund.
| Fidelity Central Fund | Investment Manager | Investment Objective | Investment Practices | Expense Ratio(a) |
| Fidelity Money Market Central Funds | Fidelity Management & Research Company LLC (FMR) | Each fund seeks to obtain a high level of current income consistent with the preservation of capital and liquidity. | Short-term Investments | Less than .005% to .01% |
(a) Expenses expressed as a percentage of average net assets and are as of each underlying Central Fund's most recent annual or semi-annual shareholder report.
A complete unaudited list of holdings for each Fidelity Central Fund is available upon request or at the Securities and Exchange Commission website at www.sec.gov. In addition, the financial statements of the Fidelity Central Funds, which are not covered by the Report of Independent Registered Public Accounting Firm, are available on the Securities and Exchange Commission website or upon request.
7. Committed Line of Credit.
Certain Funds participate with other funds managed by the investment adviser or an affiliate in a $4.25 billion credit facility (the "line of credit") to be utilized for temporary or emergency purposes to fund shareholder redemptions or for other short-term liquidity purposes. The participating funds have agreed to pay commitment fees on their pro-rata portion of the line of credit, which are reflected in Miscellaneous expenses on the Statement of Operations, and are listed below. During the period, there were no borrowings on this line of credit.
| Amount | |
| Strategic Advisers Emerging Markets Fund | $8,828 |
8. Security Lending.
Funds lend portfolio securities through a lending agent from time to time in order to earn additional income. On the settlement date of the loan, a fund receives collateral (in the form of U.S. Treasury obligations, letters of credit and/or cash) against the loaned securities and maintains collateral in an amount not less than 100% of the market value of the loaned securities during the period of the loan. The market value of the loaned securities is determined at the close of business of a fund and any additional required collateral is delivered to a fund on the next business day. A fund or borrower may terminate the loan at any time, and if the borrower defaults on its obligation to return the securities loaned because of insolvency or other reasons, a fund may apply collateral received from the borrower against the obligation. A fund may experience delays and costs in recovering the securities loaned. Any cash collateral received is invested in the Fidelity Securities Lending Cash Central Fund. Any loaned securities are identified as such in the Schedule of Investments, and the value of loaned securities and cash collateral at period end, as applicable, are presented in the Statement of Assets and Liabilities. Security lending income represents the income earned on investing cash collateral, less rebates paid to borrowers and any lending agent fees associated with the loan, plus any premium payments received for lending certain types of securities. Security lending income is presented in the Statement of Operations as a component of income from Fidelity Central Funds.
9. Expense Reductions.
The investment adviser has contractually agreed to waive the Fund's management fee in an amount equal to .25% of the Fund's average net assets until September 30, 2024. During the period, this waiver reduced the Fund's management fee by $12,141,679.
Commissions paid to certain brokers with whom the investment adviser, or its affiliates, places trades on behalf of the Fund include an amount in addition to trade execution, which may be rebated back to the Fund to offset expenses. This amount totaled $323,413 for the period.
10. Other.
Fund's organizational documents provide former and current trustees and officers with a limited indemnification against liabilities arising in connection with the performance of their duties to the fund. In the normal course of business, the fund may also enter into contracts that provide general indemnifications. The fund's maximum exposure under these arrangements is unknown as this would be dependent on future claims that may be made against the fund. The risk of material loss from such claims is considered remote.
Funds do not invest in underlying mutual funds for the purpose of exercising management or control; however, investments by funds within their principal investment strategies may represent a significant portion of the underlying mutual fund's net assets. At the end of the period, certain Funds were the owners of record of 10% or more of the total outstanding shares of the following underlying mutual funds as shown below.
| Fund | Strategic Advisers Emerging Markets Fund |
| Fidelity SAI Emerging Markets Low Volatility Index Fund | 33% |
| Fidelity SAI Emerging Markets Value Index Fund | 29% |
11. Coronavirus (COVID-19) Pandemic.
An outbreak of COVID-19 first detected in China during December 2019 has since spread globally and was declared a pandemic by the World Health Organization during March 2020. Developments that disrupt global economies and financial markets, such as the COVID-19 pandemic, may magnify factors that affect the Fund's performance.
Shareholder Expense Example
As a shareholder, you incur two types of costs: (1) transaction costs, which may include sales charges (loads) on purchase payments or redemption proceeds, as applicable and (2) ongoing costs, which generally include management fees, distribution and/or service (12b-1) fees and other Fund expenses. This Example is intended to help you understand your ongoing costs (in dollars) of investing in a fund and to compare these costs with the ongoing costs of investing in other mutual funds.
The Example is based on an investment of $1,000 invested at the beginning of the period and held for the entire period (March 1, 2021 to August 31, 2021).
Actual Expenses
The first line of the accompanying table provides information about actual account values and actual expenses. You may use the information in this line, together with the amount you invested, to estimate the expenses that you paid over the period. Simply divide your account value by $1,000.00 (for example, an $8,600 account value divided by $1,000.00 = 8.6), then multiply the result by the number in the first line for a class/Fund under the heading entitled "Expenses Paid During Period" to estimate the expenses you paid on your account during this period. If any fund is a shareholder of any underlying mutual funds or exchange-traded funds (ETFs) (the Underlying Funds), such fund indirectly bears its proportional share of the expenses of the Underlying Funds in addition to the direct expenses incurred presented in the table. These fees and expenses are not included in the annualized expense ratio used to calculate the expense estimate in the table below.
Hypothetical Example for Comparison Purposes
The second line of the accompanying table provides information about hypothetical account values and hypothetical expenses based on the actual expense ratio and an assumed rate of return of 5% per year before expenses, which is not the actual return. The hypothetical account values and expenses may not be used to estimate the actual ending account balance or expenses you paid for the period. You may use this information to compare the ongoing costs of investing in the Fund and other funds. To do so, compare this 5% hypothetical example with the 5% hypothetical examples that appear in the shareholder reports of the other funds. If any fund is a shareholder of any Underlying Funds, such fund indirectly bears its proportional share of the expenses of the Underlying Funds in addition to the direct expenses as presented in the table. These fees and expenses are not included in the annualized expense ratio used to calculate the expense estimate in the table below.
Please note that the expenses shown in the table are meant to highlight your ongoing costs only and do not reflect any transaction costs. Therefore, the second line of the table is useful in comparing ongoing costs only, and will not help you determine the relative total costs of owning different funds.
| Annualized Expense Ratio-A | Beginning Account Value March 1, 2021 | Ending Account Value August 31, 2021 | Expenses Paid During Period-B March 1, 2021 to August 31, 2021 |
|
| Strategic Advisers Emerging Markets Fund | .34% | |||
| Actual | $1,000.00 | $986.60 | $1.70 | |
| Hypothetical-C | $1,000.00 | $1,023.49 | $1.73 |
A Annualized expense ratio reflects expenses net of applicable fee waivers.
B Expenses are equal to the annualized expense ratio, multiplied by the average account value over the period, multiplied by 184/ 365 (to reflect the one-half year period). The fees and expenses of any Underlying Funds are not included in each annualized expense ratio.
C 5% return per year before expenses
Board Approval of New Sub-Subadvisory Agreement
Strategic Advisers Emerging Markets Fund
In March 2021, the Board of Trustees, including the Independent Trustees (together, the Board) voted to approve a new sub-subadvisory agreement among T. Rowe Price Associates, Inc. (TRPA) and T. Rowe Price Singapore Private Ltd. (T. Rowe Singapore) with respect to the fund (New Agreement). The Board, assisted by the advice of fund counsel and Independent Trustees' counsel, considered a broad range of information.In considering whether to approve the New Agreement, the Board reached a determination, with the assistance of fund counsel and Independent Trustees' counsel and through the exercise of its business judgment, that the approval of the New Agreement is in the best interests of the fund and its shareholders and does not involve a conflict of interest from which Strategic Advisers or its affiliates derive an inappropriate advantage. Also, the Board found that the fees to be charged under the New Agreement bear a reasonable relationship to the services to be rendered and will be based on services provided that will be in addition to, rather than duplicative of services provided under the advisory contract of any underlying fund in which the fund may invest. The Board's decision to approve the New Agreement was not based on any single factor, but rather was based on a comprehensive consideration of all the information provided to the Board. In addition, individual Trustees did not necessarily attribute the same weight or importance to each factor. Nature, Extent, and Quality of Services Provided. The Board considered the backgrounds of the investment personnel that will provide services to the fund, and also considered the fund's investment objective, strategies and related investment philosophy and current sub-adviser line-up. The Board also considered the structures of the investment personnel compensation programs and whether such structures provide appropriate incentives to act in the best interests of the fund.The Board noted that the New Agreement is for T. Rowe Singapore to act a sub-subadviser to the fund alongside an existing sub-sub-adviser, T. Rowe Price International Limited (T. Rowe International), for an existing investment mandate that is sub-advised by TRPA. The Board noted that it previously received and considered materials relating to the nature, extent and quality of services provided by Strategic Advisers, TRPA, and T. Rowe International, including the resources dedicated to investment management and support services, as well as shareholder and administrative services, in connection with its annual renewal of the fund's management contract, sub-advisory agreements and sub-subadvisory agreements at its September 2020 meeting. The Board noted its familiarity with the nature, extent and quality of services provided by TRPA and T. Rowe International to the fund for the investment mandate, and to other Strategic Advisers funds for different investment mandates, and considered that other than the appointment of a new co-portfolio manager from T. Rowe Singapore for the investment mandate, the New Agreement will not result in any changes to (i) the nature, extent and quality of the sub-advisory or sub-subadvisory services provided; (ii) the investment process or strategies employed in the management of the fund's assets; or (ii) the day-to-day management of the fund. The Board considered supplemental information provided by T. Rowe Singapore in the Board's March 2021 materials. Resources Dedicated to Investment Management and Support Services. The Board reviewed the general qualifications and capabilities of T. Rowe Singapore's investment staff, use of technology, and approach to managing and compensating investment personnel. The Board noted that T. Rowe Singapore's analysts have extensive resources, tools, and capabilities that allow them to conduct sophisticated quantitative and/or fundamental analysis. Additionally, in its deliberations, the Board considered T. Rowe Singapore's trading capabilities and resources and compliance infrastructure, which are integral parts of the investment management process. The Board also considered T. Rowe Singapore's investments in business continuity planning, and TRPA's and T. Rowe International's success in continuously providing services to the fund notwithstanding the severe disruptions caused by the COVID-19 pandemic. Shareholder and Administrative Services. The Board considered: (i) the nature, extent, quality, and cost of advisory services to be performed by T. Rowe Singapore under the New Agreement; and (ii) the resources to be devoted to the fund's compliance policies and procedures. Investment Performance. The Board considered the historical investment performance of TRPA and T. Rowe International and their portfolio managers in managing the fund under the investment mandate, and that the approval of the New Agreement will not result in any changes (i) to the fund's investment processes or strategies or (ii) except for the addition of a new T. Rowe Singapore co-portfolio manager, in the persons primarily responsible for the day-to-day management of the fund.Based on its review, the Board concluded that the nature, extent, and quality of services that will be provided to the fund under the New Agreement should benefit the fund's shareholders. Competitiveness of Management Fee and Total Fund Expenses. The Board noted that the New Agreement will not result in changes to the maximum aggregate annual management fee payable by the fund or Strategic Advisers' portion of the management fee. The Board considered Strategic Advisers' contractual agreement to waive its portion of the fund's management fee.The Board considered that TRPA, and not the fund, will compensate T. Rowe Singapore under the terms of the New Agreement and that the fund and Strategic Advisers are not responsible for any such fees or expenses. The Board also considered that the New Agreement will not result in any changes to (i) the fees paid under the sub-advisory agreement among Strategic Advisers, TRPA, and the Trust on behalf of the fund, or (ii) the fact that TRPA, and not the fund, compensates T. Rowe International under the terms of the sub-subadvisory agreement between TRPA and T. Rowe International, for the existing investment mandate.Based on its review, the Board concluded that the fund's management fee structure and any changes to projected total expenses bear a reasonable relationship to the services that the fund and its shareholders will receive and the other factors considered.Because the New Agreement was negotiated at arm's length and will have no impact on the maximum management fees payable by the fund or Strategic Advisers' portion of the management fee, the Board did not consider the costs of services and profitability to be significant factors in its decision to approve the New Agreement. Potential Fall-Out Benefits. The Board considered that it reviews information regarding the potential of direct and indirect benefits to Strategic Advisers and its affiliates from their relationships with the fund, including non-advisory fee compensation paid to affiliates of Strategic Advisers, if any, as well as information regarding potential fall-out benefits accruing to each sub-adviser, if any, as a result of its relationship with the fund, during its annual renewal of the fund's management contract, sub-advisory agreements, and sub-subadvisory agreements. The Board considered Strategic Advisers' representation that it does not anticipate that the approval of the New Agreement will have a significant impact on the profitability of, or potential fall-out benefits to, Strategic Advisers or its affiliates. Possible Economies of Scale. The Board considered that it reviews whether there have been economies of scale in connection with the management of the fund during its annual renewal of the fund's management contract, sub-advisory agreements, and sub-subadvisory agreements. The Board noted that it did not consider the possible realization of economies of scale to be a significant factor in its decision to approve the New Agreement because the fund will not bear any additional management fees or expenses under the New Agreement. Conclusion. Based on its evaluation of all of the conclusions noted above, and after considering all factors it believed relevant, the Board concluded that the New Agreement's fee structure bears a reasonable relationship to the services to be rendered and that the New Agreement is in the best interests of the fund and its shareholders and should be approved. The Board also concluded that the fees to be charged under the New Agreement will be based on services provided that will be in addition to, rather than duplicative of, services provided under the advisory contract of any underlying fund in which the fund may invest. In addition, the Board concluded that the approval of the New Agreement does not involve a conflict of interest from which Strategic Advisers or its affiliates derive an inappropriate advantage.Board Approval of Amended Sub-Advisory Agreement
Strategic Advisers Emerging Markets Fund
In June 2021, the Board of Trustees, including the Independent Trustees (together, the Board) voted to approve amendments to the fee schedules for the investment mandates in the existing sub-advisory agreements among Strategic Advisers LLC (Strategic Advisers), each of Acadian Asset Management LLC, Causeway Capital Management LLC (Causeway), and Schroder Investment Management North America Inc. (each, a Sub-Adviser), and Fidelity Rutland Square Trust II (Trust) on behalf of the fund, and also voted to approve an amendment in the existing sub-advisory agreement among Strategic Advisers, Causeway, and the Trust on behalf of the fund to add certain additional representations from Causeway regarding a participating affiliate arrangement (each, an Amended Sub-Advisory Agreement). The Board noted that the updated fee schedules in the Amended Sub-Advisory Agreements will result in the same or lower fees at all asset levels. The Board also noted that no other material contract terms are impacted by the Amended Sub-Advisory Agreements. The Board, assisted by the advice of fund counsel and Independent Trustees' counsel, considered a broad range of information.In considering whether to approve each Amended Sub-Advisory Agreement, the Board reached a determination, with the assistance of fund counsel and Independent Trustees' counsel and through the exercise of its business judgment, that the approval of each Amended Sub-Advisory Agreement is in the best interests of the fund and its shareholders and that the approval of such agreement does not involve a conflict of interest from which Strategic Advisers or its affiliates derive an inappropriate advantage. Also, the Board found that the fees to be charged under each Amended Sub-Advisory Agreement bear a reasonable relationship to the services to be rendered and will be based on services provided that will be in addition to, rather than duplicative of services provided under the advisory contract of any underlying fund in which the fund may invest. The Board's decision to approve each Amended Sub-Advisory Agreement was not based on any single factor, but rather was based on a comprehensive consideration of all the information provided to the Board. In addition, individual Trustees did not necessarily attribute the same weight or importance to each factor. Nature, Extent, and Quality of Services Provided. The Board considered the backgrounds of the investment personnel that will provide services to the fund, and also considered the fund's investment objective, strategies and related investment philosophy and current sub-adviser line-up, as well as the structures of the investment personnel compensation programs and whether such structures provide appropriate incentives to act in the best interests of the fund, at its September 2020 meeting. The Board considered the detailed information provided by Strategic Advisers and each Sub-Adviser in the June 2021 annual contract renewal materials.The Board noted that it had approved the existing sub-advisory agreement with each Sub-Adviser at its September 2020 meeting and that each Amended Sub-Advisory Agreement will not result in any changes to: (i) the nature, extent and quality of the sub-advisory services provided; (ii) the investment process or strategies employed in the management of the fund's assets; or (iii) the day-to-day management of the fund or the persons primarily responsible for such management. Investment Performance. The Board did not consider performance to be a material factor in its decision to approve each Amended Sub-Advisory Agreement because the approval of each Amended Sub-Advisory Agreement will not result in any changes (i) to the fund's investment processes or strategies; or (ii) in the persons primarily responsible for the day-to-day management of the fund.Based on its review, the Board concluded that the nature, extent, and quality of services that will be provided to the fund under each Amended Sub-Advisory Agreement will continue to benefit the fund's shareholders.Competitiveness of Management Fee and Total Fund Expenses.
The Board noted that each Amended Sub-Advisory Agreement will not result in changes to the maximum aggregate annual management fee payable by the fund or Strategic Advisers' portion of the management fee. The Board considered Strategic Advisers' contractual agreement to waive its portion of the fund's management fee. The Board considered that each Amended Sub-Advisory Agreement will or has the potential to result in a decrease in the total management fees of the fund. Based on its review, the Board concluded that the fund's management fee structure and any changes to projected total expenses bear a reasonable relationship to the services that the fund and its shareholders will receive and the other factors considered.Because each Amended Sub-Advisory Agreement was negotiated at arm's length and will have no impact on the maximum management fees payable by the fund, the Board did not consider the costs of services and profitability of the relationship with the fund to Strategic Advisers to be significant factors in its decision to approve each Amended Sub-Advisory Agreement. Potential Fall-Out Benefits. The Board considered that it reviews information regarding the potential of direct and indirect benefits to Strategic Advisers and its affiliates from their relationships with the fund, including non-advisory fee compensation paid to affiliates of Strategic Advisers, if any, as well as information regarding potential fall-out benefits accruing to each Sub-Adviser, if any, as a result of its relationship with the fund, during its annual renewal of the fund's management contract, sub-advisory agreements, and sub-subadvisory agreements. The Board considered Strategic Advisers' representation that it does not anticipate that the approval of each Amended Sub-Advisory Agreement will have a significant impact on the profitability of, or potential fall-out benefits to, Strategic Advisers or its affiliates. Possible Economies of Scale. The Board considered that it reviews whether there have been economies of scale in connection with the management of the fund during its annual renewal of the fund's management contract, sub-advisory agreements, and sub-subadvisory agreements. The Board noted that each Amended Sub-Advisory Agreement will continue to provide for breakpoints that have the potential to reduce sub-advisory fees paid to the Sub-Adviser as assets allocated to the Sub-Adviser grow. The Board also noted that it did not consider the possible realization of economies of scale to be a significant factor in its decision to approve each Amended Sub-Advisory Agreement because the fund will not bear any additional management fees or expenses under each Amended Sub-Advisory Agreement. Conclusion. Based on its evaluation of all of the conclusions noted above, and after considering all factors it believed relevant, the Board concluded that each Amended Sub-Advisory Agreement's fee structure bears a reasonable relationship to the services to be rendered and that each Amended Sub-Advisory Agreement is in the best interests of the fund and its shareholders and should be approved. The Board also concluded that the sub-advisory fees to be charged under each Amended Sub-Advisory Agreement will be based on services provided that will be in addition to, rather than duplicative of, services provided under the advisory contract of any underlying fund in which the fund may invest. In addition, the Board concluded that the approval of each Amended Sub-Advisory Agreement does not involve a conflict of interest from which Strategic Advisers or its affiliates derive an inappropriate advantage.
![]()
SAE-SANN-1021
1.918361.111
Strategic Advisers® Income Opportunities Fund
Offered exclusively to certain managed account clients of Strategic Advisers LLC or its affiliates - not available for sale to the general public
Semi-Annual Report
August 31, 2021
Contents
To view a fund's proxy voting record for the 12-month period ended June 30, visit http://www.fidelity.com/proxyvotingresults or visit the Securities and Exchange Commission's (SEC) web site at http://www.sec.gov.
You may also call 1-800-544-3455 to request a free copy of the proxy voting guidelines.
Standard & Poor's, S&P and S&P 500 are registered service marks of The McGraw-Hill Companies, Inc. and have been licensed for use by Fidelity Distributors Corporation.
Other third-party marks appearing herein are the property of their respective owners.
All other marks appearing herein are registered or unregistered trademarks or service marks of FMR LLC or an affiliated company. © 2021 FMR LLC. All rights reserved.
This report and the financial statements contained herein are submitted for the general information of the shareholders of the Fund. This report is not authorized for distribution to prospective investors in the Fund unless preceded or accompanied by an effective prospectus.
A fund files its complete schedule of portfolio holdings with the SEC for the first and third quarters of each fiscal year on Form N-PORT. Forms N-PORT are available on the SEC’s web site at http://www.sec.gov. A fund's Forms N-PORT may be reviewed and copied at the SEC’s Public Reference Room in Washington, DC. Information regarding the operation of the SEC's Public Reference Room may be obtained by calling 1-800-SEC-0330.
For a complete list of a fund's portfolio holdings, view the most recent holdings listing, semiannual report, or annual report on Fidelity's web site at http://www.fidelity.com, http://www.institutional.fidelity.com, or http://www.401k.com, as applicable.
NOT FDIC INSURED •MAY LOSE VALUE •NO BANK GUARANTEE
Neither the Fund nor Fidelity Distributors Corporation is a bank.
Note to Shareholders:
Early in 2020, the outbreak and spread of COVID-19 emerged as a public health emergency that had a major influence on financial markets, primarily based on its impact on the global economy and corporate earnings. On March 11, 2020, the World Health Organization declared the COVID-19 outbreak a pandemic, citing sustained risk of further global spread. The pandemic prompted a number of measures to limit the spread of COVID-19, including travel and border restrictions, quarantines, and restrictions on large gatherings. In turn, these resulted in lower consumer activity, diminished demand for a wide range of products and services, disruption in manufacturing and supply chains, and – given the wide variability in outcomes regarding the outbreak – significant market uncertainty and volatility. To help stem the turmoil, the U.S. government took unprecedented action – in concert with the U.S. Federal Reserve and central banks around the world – to help support consumers, businesses, and the broader economy, and to limit disruption to the financial system.
In general, the overall impact of the pandemic lessened in 2021, amid a resilient economy and widespread distribution of three COVID-19 vaccines granted emergency use authorization from the U.S. Food and Drug Administration (FDA) early in the year. Still, the situation remains dynamic, and the extent and duration of its influence on financial markets and the economy is highly uncertain, due in part to a recent spike in cases based on highly contagious variants of the coronavirus.
Extreme events such as the COVID-19 crisis are exogenous shocks that can have significant adverse effects on mutual funds and their investments. Although multiple asset classes may be affected by market disruption, the duration and impact may not be the same for all types of assets. Fidelity is committed to helping you stay informed amid news about COVID-19 and during increased market volatility, and we continue to take extra steps to be responsive to customer needs. We encourage you to visit us online, where we offer ongoing updates, commentary, and analysis on the markets and our funds.
Investment Summary (Unaudited)
The information in the following tables is based on the direct investments of the Fund.Top Ten Holdings as of August 31, 2021
| (excluding cash equivalents) | % of fund's net assets |
| Artisan High Income Fund Investor Shares | 11.5 |
| BlackRock High Yield Bond Portfolio Class K | 11.2 |
| Fidelity Capital & Income Fund | 10.8 |
| MainStay High Yield Corporate Bond Fund Class A | 7.6 |
| Vanguard High-Yield Corporate Fund Admiral Shares | 7.6 |
| Eaton Vance Income Fund of Boston Class A | 3.9 |
| CCO Holdings LLC/CCO Holdings Capital Corp. | 0.9 |
| Bombardier, Inc. | 0.8 |
| Bausch Health Companies, Inc. | 0.7 |
| Tenet Healthcare Corp. | 0.5 |
Asset Allocation (% of fund's net assets)
| As of August 31, 2021 | ||
| Corporate Bonds | 41.8% | |
| Municipal Securities | 0.1% | |
| High Yield Fixed-Income Funds | 52.6% | |
| Stocks | 0.6% | |
| Other Investments | 3.3% | |
| Short-Term Investments and Net Other Assets (Liabilities) | 1.6% | |
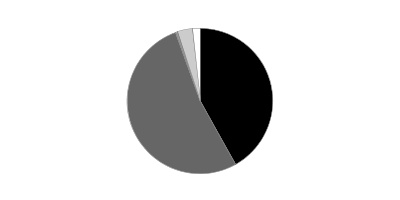
Asset allocations of funds in the pie chart reflect the categorizations of assets as defined by Morningstar as of the reporting date.
Schedule of Investments August 31, 2021 (Unaudited)
Showing Percentage of Net Assets
| Corporate Bonds - 41.8% | |||
| Principal Amount(a) | Value | ||
| Convertible Bonds - 0.1% | |||
| COMMUNICATION SERVICES - 0.0% | |||
| Media - 0.0% | |||
| DISH Network Corp. 3.375% 8/15/26 | 540,000 | 563,276 | |
| ENERGY - 0.1% | |||
| Oil, Gas & Consumable Fuels - 0.1% | |||
| Cheniere Energy, Inc. 4.25% 3/15/45 | 2,000,000 | 1,672,171 | |
| Mesquite Energy, Inc. 15% 7/15/23 (b)(c) | 589,916 | 1,911,328 | |
| Mesquite Energy, Inc. 15% 7/15/23 (b)(c) | 341,613 | 1,219,558 | |
| 4,803,057 | |||
| TOTAL CONVERTIBLE BONDS | 5,366,333 | ||
| Nonconvertible Bonds - 41.7% | |||
| COMMUNICATION SERVICES - 7.1% | |||
| Diversified Telecommunication Services - 2.0% | |||
| Altice France SA: | |||
| 5.125% 1/15/29 (d) | 6,602,000 | 6,650,195 | |
| 5.125% 7/15/29 (d) | 8,575,000 | 8,669,497 | |
| 5.5% 1/15/28 (d) | 3,660,000 | 3,765,225 | |
| 8.125% 2/1/27 (d) | 2,980,000 | 3,237,025 | |
| C&W Senior Financing Designated Activity Co. 6.875% 9/15/27 (d) | 14,665,000 | 15,544,900 | |
| Cablevision Lightpath LLC: | |||
| 3.875% 9/15/27 (d) | 2,627,000 | 2,597,446 | |
| 5.625% 9/15/28 (d) | 1,960,000 | 1,974,112 | |
| Connect Finco SARL / Connect U.S. Finco LLC 6.75% 10/1/26 (d) | 1,515,000 | 1,571,813 | |
| Consolidated Communications, Inc.: | |||
| 5% 10/1/28 (d) | 570,000 | 585,333 | |
| 6.5% 10/1/28 (d) | 995,000 | 1,088,281 | |
| Embarq Corp. 7.995% 6/1/36 | 825,000 | 868,313 | |
| Frontier Communications Holdings LLC: | |||
| 5% 5/1/28 (d) | 5,405,000 | 5,648,225 | |
| 5.875% 10/15/27 (d) | 5,084,000 | 5,434,694 | |
| 5.875% 11/1/29 | 2,160,000 | 2,196,158 | |
| 6.75% 5/1/29 (d) | 2,590,000 | 2,771,818 | |
| Level 3 Financing, Inc.: | |||
| 3.625% 1/15/29 (d) | 1,357,000 | 1,316,290 | |
| 3.75% 7/15/29 (d) | 2,200,000 | 2,145,000 | |
| 4.25% 7/1/28 (d) | 1,915,000 | 1,937,903 | |
| 4.625% 9/15/27 (d) | 2,470,000 | 2,547,188 | |
| Lumen Technologies, Inc.: | |||
| 4.5% 1/15/29 (d) | 6,165,000 | 6,026,288 | |
| 5.125% 12/15/26 (d) | 5,310,000 | 5,490,540 | |
| 5.375% 6/15/29 (d) | 1,295,000 | 1,329,732 | |
| 6.875% 1/15/28 | 613,000 | 688,963 | |
| 7.6% 9/15/39 | 3,134,000 | 3,478,740 | |
| 7.65% 3/15/42 | 1,587,000 | 1,768,862 | |
| Northwest Fiber LLC/Northwest Fiber Finance Sub, Inc.: | |||
| 6% 2/15/28 (d) | 340,000 | 338,300 | |
| 10.75% 6/1/28 (d) | 2,061,000 | 2,318,625 | |
| Sable International Finance Ltd. 5.75% 9/7/27 (d) | 2,930,000 | 3,069,175 | |
| Sprint Capital Corp.: | |||
| 6.875% 11/15/28 | 6,077,000 | 7,921,248 | |
| 8.75% 3/15/32 | 6,534,000 | 10,006,298 | |
| Switch Ltd. 4.125% 6/15/29 (d) | 750,000 | 773,438 | |
| Telecom Italia Capital SA: | |||
| 6% 9/30/34 | 1,642,000 | 1,867,282 | |
| 7.2% 7/18/36 | 1,153,000 | 1,451,685 | |
| 7.721% 6/4/38 | 250,000 | 324,338 | |
| Telenet Finance Luxembourg Notes SARL 5.5% 3/1/28 (d) | 2,400,000 | 2,523,600 | |
| Virgin Media Finance PLC 5% 7/15/30 (d) | 335,000 | 346,876 | |
| Windstream Escrow LLC 7.75% 8/15/28 (d) | 4,911,000 | 5,073,726 | |
| Zayo Group Holdings, Inc.: | |||
| 4% 3/1/27 (d) | 2,630,000 | 2,600,281 | |
| 6.125% 3/1/28 (d) | 5,288,000 | 5,380,540 | |
| 133,327,953 | |||
| Entertainment - 0.2% | |||
| AMC Entertainment Holdings, Inc. 12% 6/15/26 pay-in-kind (d)(e) | 1,099,120 | 990,494 | |
| Cinemark U.S.A., Inc. 5.25% 7/15/28 (d) | 1,115,000 | 1,059,250 | |
| National CineMedia LLC: | |||
| 5.75% 8/15/26 | 475,000 | 356,250 | |
| 5.875% 4/15/28 (d) | 400,000 | 349,000 | |
| Netflix, Inc.: | |||
| 5.375% 11/15/29 (d) | 1,360,000 | 1,672,569 | |
| 5.875% 11/15/28 | 2,365,000 | 2,932,600 | |
| 6.375% 5/15/29 | 6,490,000 | 8,315,313 | |
| 15,675,476 | |||
| Media - 4.0% | |||
| Advantage Sales & Marketing, Inc. 6.5% 11/15/28 (d) | 5,659,000 | 5,913,655 | |
| Altice Financing SA: | |||
| 5% 1/15/28 (d) | 8,585,000 | 8,578,132 | |
| 5.75% 8/15/29 (d) | 7,950,000 | 8,166,240 | |
| Altice France Holding SA: | |||
| 6% 2/15/28 (d) | 11,710,000 | 11,607,538 | |
| 10.5% 5/15/27 (d) | 1,555,000 | 1,708,556 | |
| CCO Holdings LLC/CCO Holdings Capital Corp.: | |||
| 4.25% 2/1/31 (d) | 11,600,000 | 11,904,500 | |
| 4.25% 1/15/34 (d) | 1,115,000 | 1,125,035 | |
| 4.5% 8/15/30 (d) | 3,765,000 | 3,933,898 | |
| 4.5% 5/1/32 | 13,729,000 | 14,344,746 | |
| 4.5% 6/1/33 (d) | 5,840,000 | 6,051,700 | |
| 4.75% 3/1/30 (d) | 2,756,000 | 2,916,068 | |
| 5% 2/1/28 (d) | 8,128,000 | 8,514,893 | |
| 5.125% 5/1/27 (d) | 3,150,000 | 3,291,152 | |
| 5.375% 6/1/29 (d) | 5,635,000 | 6,156,238 | |
| 5.5% 5/1/26 (d) | 4,760,000 | 4,903,324 | |
| 5.75% 2/15/26 (d) | 1,496,000 | 1,539,010 | |
| Clear Channel Outdoor Holdings, Inc.: | |||
| 7.5% 6/1/29 (d) | 1,475,000 | 1,526,625 | |
| 7.75% 4/15/28 (d) | 2,650,000 | 2,762,625 | |
| Clear Channel Worldwide Holdings, Inc. 5.125% 8/15/27 (d) | 665,000 | 684,518 | |
| CSC Holdings LLC: | |||
| 3.375% 2/15/31 (d) | 1,020,000 | 970,336 | |
| 4.125% 12/1/30 (d) | 3,352,000 | 3,356,190 | |
| 4.625% 12/1/30 (d) | 13,502,000 | 13,282,457 | |
| 5% 11/15/31 (d) | 1,160,000 | 1,154,200 | |
| 5.25% 6/1/24 | 976,000 | 1,052,860 | |
| 5.5% 4/15/27 (d) | 860,000 | 899,670 | |
| 5.75% 1/15/30 (d) | 3,390,000 | 3,582,213 | |
| 6.5% 2/1/29 (d) | 2,635,000 | 2,908,381 | |
| 7.5% 4/1/28 (d) | 4,510,000 | 4,938,450 | |
| Diamond Sports Group LLC/Diamond Sports Finance Co.: | |||
| 5.375% 8/15/26 (d) | 9,480,000 | 6,290,928 | |
| 6.625% 8/15/27 (d) | 15,605,000 | 6,710,150 | |
| DIRECTV Holdings LLC/DIRECTV Financing, Inc. 5.875% 8/15/27 (d) | 1,275,000 | 1,332,375 | |
| DISH DBS Corp.: | |||
| 5% 3/15/23 | 926,000 | 966,513 | |
| 5.125% 6/1/29 | 3,260,000 | 3,243,635 | |
| 5.875% 11/15/24 | 1,514,000 | 1,627,550 | |
| 7.375% 7/1/28 | 3,475,000 | 3,739,543 | |
| 7.75% 7/1/26 | 5,529,000 | 6,333,193 | |
| Dolya Holdco 18 DAC 5% 7/15/28 (d) | 2,412,000 | 2,499,435 | |
| Gray Television, Inc.: | |||
| 4.75% 10/15/30 (d) | 1,885,000 | 1,862,946 | |
| 7% 5/15/27 (d) | 2,175,000 | 2,332,688 | |
| iHeartCommunications, Inc.: | |||
| 5.25% 8/15/27 (d) | 1,490,000 | 1,561,222 | |
| 6.375% 5/1/26 | 335,000 | 353,844 | |
| 8.375% 5/1/27 | 12,390,000 | 13,161,897 | |
| LCPR Senior Secured Financing DAC 6.75% 10/15/27 (d) | 345,000 | 368,719 | |
| Midas Opco Holdings LLC 5.625% 8/15/29 (d) | 4,320,000 | 4,422,600 | |
| News Corp. 3.875% 5/15/29 (d) | 1,150,000 | 1,182,488 | |
| Nexstar Broadcasting, Inc.: | |||
| 4.75% 11/1/28 (d) | 3,100,000 | 3,223,318 | |
| 5.625% 7/15/27 (d) | 993,000 | 1,054,268 | |
| Outfront Media Capital LLC / Corp.: | |||
| 4.25% 1/15/29 (d) | 350,000 | 350,875 | |
| 6.25% 6/15/25 (d) | 355,000 | 377,046 | |
| Radiate Holdco LLC/Radiate Financial Service Ltd.: | |||
| 4.5% 9/15/26 (d) | 5,547,000 | 5,775,703 | |
| 6.5% 9/15/28 (d) | 8,035,000 | 8,195,700 | |
| Scripps Escrow II, Inc.: | |||
| 3.875% 1/15/29 (d) | 600,000 | 603,156 | |
| 5.375% 1/15/31 (d) | 450,000 | 445,382 | |
| Scripps Escrow, Inc. 5.875% 7/15/27 (d) | 200,000 | 205,308 | |
| Sinclair Television Group, Inc.: | |||
| 5.125% 2/15/27 (d) | 2,315,000 | 2,248,444 | |
| 5.5% 3/1/30 (d) | 1,030,000 | 1,009,297 | |
| 5.875% 3/15/26 (d) | 925,000 | 946,969 | |
| Sirius XM Radio, Inc.: | |||
| 3.125% 9/1/26 (d) | 1,500,000 | 1,528,425 | |
| 3.875% 9/1/31 (d) | 620,000 | 617,334 | |
| 4% 7/15/28 (d) | 4,785,000 | 4,886,083 | |
| 4.125% 7/1/30 (d) | 2,200,000 | 2,252,173 | |
| 5% 8/1/27 (d) | 800,000 | 839,000 | |
| 5.375% 7/15/26 (d) | 800,000 | 821,504 | |
| 5.5% 7/1/29 (d) | 1,895,000 | 2,075,025 | |
| Tegna, Inc.: | |||
| 4.625% 3/15/28 | 1,195,000 | 1,240,171 | |
| 5% 9/15/29 | 430,000 | 455,220 | |
| Townsquare Media, Inc. 6.875% 2/1/26 (d) | 1,655,000 | 1,754,300 | |
| Univision Communications, Inc.: | |||
| 4.5% 5/1/29 (d) | 4,840,000 | 4,909,696 | |
| 5.125% 2/15/25 (d) | 3,720,000 | 3,785,100 | |
| 6.625% 6/1/27 (d) | 5,415,000 | 5,863,362 | |
| 9.5% 5/1/25 (d) | 1,222,000 | 1,331,980 | |
| Urban One, Inc. 7.375% 2/1/28 (d) | 460,000 | 495,650 | |
| Virgin Media Secured Finance PLC: | |||
| 4.5% 8/15/30 (d) | 2,200,000 | 2,231,460 | |
| 5.5% 5/15/29 (d) | 1,010,000 | 1,081,963 | |
| VTR Finance BV 6.375% 7/15/28 (d) | 660,000 | 699,600 | |
| Ziggo Bond Co. BV: | |||
| 5.125% 2/28/30 (d) | 1,385,000 | 1,421,980 | |
| 6% 1/15/27 (d) | 2,145,000 | 2,244,206 | |
| Ziggo BV: | |||
| 4.875% 1/15/30 (d) | 1,820,000 | 1,874,600 | |
| 5.5% 1/15/27 (d) | 2,678,000 | 2,767,954 | |
| 265,375,188 | |||
| Wireless Telecommunication Services - 0.9% | |||
| Digicel Group Holdings Ltd. 10% 4/1/24 pay-in-kind (f) | 1,355,957 | 1,340,499 | |
| Digicel Group Ltd. 6.75% 3/1/23 (d) | 7,925,000 | 7,489,125 | |
| Digicel International Finance Ltd. / Digicel International Holdings Ltd.: | |||
| 8% 12/31/26 (d) | 1,250,000 | 1,218,750 | |
| 8.75% 5/25/24 (d) | 4,070,000 | 4,208,126 | |
| 8.75% 5/25/24 (d) | 5,075,000 | 5,270,070 | |
| 13% 12/31/25 pay-in-kind (d)(f) | 3,675,906 | 3,652,932 | |
| Intelsat Jackson Holdings SA: | |||
| 5.5% 8/1/23 (g) | 3,685,000 | 1,916,200 | |
| 8% 2/15/24 (d) | 200,000 | 207,500 | |
| 8.5% 10/15/24 (d)(g) | 7,200,000 | 3,888,000 | |
| 9.5% 9/30/22 (d) | 3,325,000 | 3,956,750 | |
| 9.75% 7/15/25 (d)(g) | 50,000 | 27,000 | |
| Millicom International Cellular SA 4.5% 4/27/31 (d) | 175,000 | 182,908 | |
| Sprint Corp.: | |||
| 7.125% 6/15/24 | 11,230,000 | 12,914,500 | |
| 7.625% 2/15/25 | 2,235,000 | 2,645,681 | |
| 7.625% 3/1/26 | 1,000,000 | 1,232,950 | |
| 7.875% 9/15/23 | 4,850,000 | 5,494,808 | |
| T-Mobile U.S.A., Inc.: | |||
| 2.625% 2/15/29 | 1,175,000 | 1,189,688 | |
| 2.875% 2/15/31 | 1,100,000 | 1,130,250 | |
| Telesat Canada/Telesat LLC 6.5% 10/15/27 (d) | 865,000 | 730,666 | |
| 58,696,403 | |||
| TOTAL COMMUNICATION SERVICES | 473,075,020 | ||
| CONSUMER DISCRETIONARY - 7.2% | |||
| Auto Components - 0.8% | |||
| Adient Global Holdings Ltd. 4.875% 8/15/26 (d) | 5,415,000 | 5,563,913 | |
| Allison Transmission, Inc. 5.875% 6/1/29 (d) | 1,016,000 | 1,117,600 | |
| American Axle & Manufacturing, Inc.: | |||
| 5% 10/1/29 | 3,125,000 | 3,124,063 | |
| 6.25% 4/1/25 | 729,000 | 753,276 | |
| 6.25% 3/15/26 | 1,000,000 | 1,030,000 | |
| 6.5% 4/1/27 | 3,355,000 | 3,522,750 | |
| 6.875% 7/1/28 | 550,000 | 594,255 | |
| Cooper Standard Auto, Inc. 5.625% 11/15/26 (d) | 1,775,000 | 1,493,219 | |
| Dana Financing Luxembourg SARL 5.75% 4/15/25 (d) | 1,615,000 | 1,665,469 | |
| Dana, Inc.: | |||
| 4.25% 9/1/30 | 1,170,000 | 1,216,543 | |
| 5.375% 11/15/27 | 120,000 | 126,600 | |
| 5.625% 6/15/28 | 3,140,000 | 3,375,249 | |
| Nesco Holdings II, Inc. 5.5% 4/15/29 (d) | 1,250,000 | 1,296,625 | |
| Panther BF Aggregator 2 LP / Panther Finance Co., Inc.: | |||
| 6.25% 5/15/26 (d) | 113,000 | 119,074 | |
| 8.5% 5/15/27 (d) | 7,420,000 | 7,920,850 | |
| Patrick Industries, Inc.: | |||
| 4.75% 5/1/29 (d) | 1,375,000 | 1,405,938 | |
| 7.5% 10/15/27 (d) | 700,000 | 759,500 | |
| Tenneco, Inc.: | |||
| 5% 7/15/26 | 2,300,000 | 2,298,229 | |
| 5.125% 4/15/29 (d) | 5,545,000 | 5,752,383 | |
| 5.375% 12/15/24 | 1,710,000 | 1,720,346 | |
| 7.875% 1/15/29 (d) | 2,630,000 | 2,958,750 | |
| The Goodyear Tire & Rubber Co.: | |||
| 5% 7/15/29 (d) | 3,100,000 | 3,277,816 | |
| 5.25% 4/30/31 | 1,620,000 | 1,733,400 | |
| 5.25% 7/15/31 (d) | 1,680,000 | 1,797,180 | |
| 9.5% 5/31/25 | 490,000 | 542,822 | |
| 55,165,850 | |||
| Automobiles - 0.5% | |||
| Ford Motor Co.: | |||
| 4.75% 1/15/43 | 5,613,000 | 6,055,024 | |
| 5.291% 12/8/46 | 6,800,000 | 7,701,544 | |
| 8.5% 4/21/23 | 715,000 | 790,969 | |
| 9% 4/22/25 | 8,045,000 | 9,828,577 | |
| 9.625% 4/22/30 | 4,145,000 | 5,910,314 | |
| PM General Purchaser LLC 9.5% 10/1/28 (d) | 3,305,000 | 3,593,857 | |
| 33,880,285 | |||
| Diversified Consumer Services - 0.5% | |||
| Adtalem Global Education, Inc. 5.5% 3/1/28 (d) | 8,000,000 | 8,190,000 | |
| Carriage Services, Inc. 4.25% 5/15/29 (d) | 850,000 | 851,326 | |
| GEMS MENASA Cayman Ltd. 7.125% 7/31/26 (d) | 5,625,000 | 5,807,813 | |
| Service Corp. International: | |||
| 3.375% 8/15/30 | 1,890,000 | 1,902,663 | |
| 4% 5/15/31 | 3,080,000 | 3,190,818 | |
| 5.125% 6/1/29 | 660,000 | 719,697 | |
| Sotheby's 7.375% 10/15/27 (d) | 5,260,000 | 5,581,123 | |
| WASH Multifamily Acquisition, Inc. 5.75% 4/15/26 (d) | 4,975,000 | 5,205,243 | |
| 31,448,683 | |||
| Hotels, Restaurants & Leisure - 3.6% | |||
| 1011778 BC Unlimited Liability Co./New Red Finance, Inc.: | |||
| 3.5% 2/15/29 (d) | 825,000 | 820,875 | |
| 3.875% 1/15/28 (d) | 200,000 | 202,500 | |
| 4% 10/15/30 (d) | 9,824,000 | 9,769,772 | |
| 5.75% 4/15/25 (d) | 255,000 | 268,706 | |
| Affinity Gaming LLC 6.875% 12/15/27 (d) | 3,130,000 | 3,324,999 | |
| Aramark Services, Inc. 5% 2/1/28 (d) | 3,785,000 | 3,935,709 | |
| Boyd Gaming Corp.: | |||
| 4.75% 12/1/27 | 1,220,000 | 1,258,125 | |
| 4.75% 6/15/31 (d) | 1,425,000 | 1,471,640 | |
| 8.625% 6/1/25 (d) | 1,239,000 | 1,344,067 | |
| Brinker International, Inc.: | |||
| 3.875% 5/15/23 | 950,000 | 978,975 | |
| 5% 10/1/24 (d) | 2,315,000 | 2,448,113 | |
| Caesars Entertainment, Inc.: | |||
| 6.25% 7/1/25 (d) | 4,614,000 | 4,876,767 | |
| 8.125% 7/1/27 (d) | 8,289,000 | 9,161,832 | |
| Caesars Resort Collection LLC: | |||
| 5.25% 10/15/25 (d) | 7,150,000 | 7,251,530 | |
| 5.75% 7/1/25 (d) | 770,000 | 809,078 | |
| Carnival Corp.: | |||
| 4% 8/1/28 (d) | 3,740,000 | 3,758,700 | |
| 5.75% 3/1/27 (d) | 6,555,000 | 6,703,864 | |
| 6.65% 1/15/28 | 210,000 | 226,162 | |
| 7.625% 3/1/26 (d) | 8,190,000 | 8,681,236 | |
| 9.875% 8/1/27 (d) | 1,340,000 | 1,544,350 | |
| 11.5% 4/1/23 (d) | 1,065,000 | 1,195,755 | |
| Carrols Restaurant Group, Inc. 5.875% 7/1/29 (d) | 1,425,000 | 1,375,125 | |
| CCM Merger, Inc. 6.375% 5/1/26 (d) | 1,450,000 | 1,529,750 | |
| Cedar Fair LP 5.25% 7/15/29 | 825,000 | 845,114 | |
| Cedar Fair LP/Canada's Wonderland Co.: | |||
| 5.375% 4/15/27 | 1,130,000 | 1,158,250 | |
| 5.5% 5/1/25 (d) | 2,070,000 | 2,157,975 | |
| 6.5% 10/1/28 | 75,000 | 81,279 | |
| Churchill Downs, Inc.: | |||
| 4.75% 1/15/28 (d) | 140,000 | 146,412 | |
| 5.5% 4/1/27 (d) | 875,000 | 908,906 | |
| Dave & Buster's, Inc. 7.625% 11/1/25 (d) | 2,365,000 | 2,506,900 | |
| Everi Holdings, Inc. 5% 7/15/29 (d) | 350,000 | 358,225 | |
| Expedia, Inc.: | |||
| 4.625% 8/1/27 | 240,000 | 271,414 | |
| 6.25% 5/1/25 (d) | 925,000 | 1,067,611 | |
| Golden Entertainment, Inc. 7.625% 4/15/26 (d) | 5,121,000 | 5,428,260 | |
| Golden Nugget, Inc. 6.75% 10/15/24 (d) | 4,010,000 | 4,019,223 | |
| Hilton Domestic Operating Co., Inc.: | |||
| 3.625% 2/15/32 (d) | 4,725,000 | 4,689,563 | |
| 3.75% 5/1/29 (d) | 300,000 | 306,000 | |
| 4% 5/1/31 (d) | 2,830,000 | 2,918,438 | |
| 4.875% 1/15/30 | 507,000 | 545,025 | |
| 5.375% 5/1/25 (d) | 380,000 | 398,662 | |
| 5.75% 5/1/28 (d) | 1,520,000 | 1,641,874 | |
| Hilton Worldwide Finance LLC/Hilton Worldwide Finance Corp. 4.875% 4/1/27 | 2,375,000 | 2,463,849 | |
| International Game Technology PLC: | |||
| 4.125% 4/15/26 (d) | 945,000 | 981,430 | |
| 5.25% 1/15/29 (d) | 3,550,000 | 3,789,625 | |
| 6.25% 1/15/27 (d) | 6,056,000 | 6,903,840 | |
| 6.5% 2/15/25 (d) | 500,000 | 557,500 | |
| Jacobs Entertainment, Inc. 7.875% 2/1/24 (d) | 2,745,000 | 2,868,525 | |
| LHMC Finco SARL 7.875% 12/20/23 (d) | 1,565,000 | 1,589,884 | |
| Life Time, Inc. 5.75% 1/15/26 (d) | 2,020,000 | 2,070,500 | |
| Marriott International, Inc. 5.75% 5/1/25 | 645,000 | 740,995 | |
| Marriott Ownership Resorts, Inc. 6.125% 9/15/25 (d) | 820,000 | 862,025 | |
| MCE Finance Ltd.: | |||
| 5.375% 12/4/29 (d) | 1,355,000 | 1,402,012 | |
| 5.75% 7/21/28 (d) | 1,425,000 | 1,485,563 | |
| Merlin Entertainments PLC 5.75% 6/15/26 (d) | 200,000 | 206,500 | |
| MGM China Holdings Ltd.: | |||
| 4.75% 2/1/27 (d) | 1,015,000 | 1,028,956 | |
| 5.25% 6/18/25 (d) | 515,000 | 531,583 | |
| 5.875% 5/15/26 (d) | 1,965,000 | 2,058,706 | |
| MGM Resorts International: | |||
| 4.75% 10/15/28 | 5,688,000 | 5,972,400 | |
| 5.5% 4/15/27 | 2,259,000 | 2,458,809 | |
| 6% 3/15/23 | 905,000 | 958,169 | |
| 6.75% 5/1/25 | 2,750,000 | 2,915,000 | |
| Midwest Gaming Borrower LLC / Midwest Gaming Financial Corp. 4.875% 5/1/29 (d) | 2,715,000 | 2,735,363 | |
| Motion Bondco DAC 6.625% 11/15/27 (d) | 3,400,000 | 3,417,000 | |
| NCL Corp. Ltd.: | |||
| 5.875% 3/15/26 (d) | 2,780,000 | 2,786,950 | |
| 10.25% 2/1/26 (d) | 1,970,000 | 2,275,744 | |
| NCL Finance Ltd. 6.125% 3/15/28 (d) | 1,235,000 | 1,241,175 | |
| Peninsula Pacific Entertainment LLC 8.5% 11/15/27 (d) | 5,250,000 | 5,610,938 | |
| Penn National Gaming, Inc.: | |||
| 4.125% 7/1/29 (d) | 650,000 | 649,188 | |
| 5.625% 1/15/27 (d) | 3,150,000 | 3,260,250 | |
| Premier Entertainment Sub LLC: | |||
| 5.625% 9/1/29 (d) | 1,900,000 | 1,948,089 | |
| 5.875% 9/1/31 (d) | 1,900,000 | 1,947,500 | |
| Raptor Acquisition Corp. / Raptor Co-Issuer LLC 4.875% 11/1/26 (d) | 1,095,000 | 1,109,290 | |
| Royal Caribbean Cruises Ltd.: | |||
| 4.25% 7/1/26 (d) | 2,640,000 | 2,574,000 | |
| 5.5% 8/31/26 (d) | 3,910,000 | 3,963,763 | |
| 5.5% 4/1/28 (d) | 5,070,000 | 5,113,881 | |
| 9.125% 6/15/23 (d) | 710,000 | 773,900 | |
| 10.875% 6/1/23 (d) | 1,065,000 | 1,198,570 | |
| Scientific Games Corp.: | |||
| 5% 10/15/25 (d) | 2,200,000 | 2,262,810 | |
| 7% 5/15/28 (d) | 345,000 | 371,893 | |
| 7.25% 11/15/29 (d) | 3,780,000 | 4,219,425 | |
| 8.25% 3/15/26 (d) | 6,945,000 | 7,386,893 | |
| 8.625% 7/1/25 (d) | 3,569,000 | 3,853,048 | |
| SeaWorld Parks & Entertainment, Inc. 5.25% 8/15/29 (d) | 1,975,000 | 1,968,759 | |
| Six Flags Theme Park, Inc. 7% 7/1/25 (d) | 270,000 | 288,563 | |
| Station Casinos LLC: | |||
| 4.5% 2/15/28 (d) | 1,994,000 | 2,023,910 | |
| 5% 10/1/25 (d) | 640,000 | 647,200 | |
| Studio City Finance Ltd. 5% 1/15/29 (d) | 2,135,000 | 2,097,371 | |
| Travel+Leisure Co. 4.625% 3/1/30 (d) | 75,000 | 77,250 | |
| Vail Resorts, Inc. 6.25% 5/15/25 (d) | 605,000 | 644,628 | |
| Viking Cruises Ltd.: | |||
| 5.875% 9/15/27 (d) | 675,000 | 653,063 | |
| 7% 2/15/29 (d) | 780,000 | 788,619 | |
| 13% 5/15/25 (d) | 1,175,000 | 1,360,063 | |
| Viking Ocean Cruises Ship VII Ltd. 5.625% 2/15/29 (d) | 845,000 | 840,775 | |
| Voc Escrow Ltd. 5% 2/15/28 (d) | 1,200,000 | 1,186,500 | |
| Wyndham Hotels & Resorts, Inc. 4.375% 8/15/28 (d) | 1,065,000 | 1,101,945 | |
| Wynn Las Vegas LLC/Wynn Las Vegas Capital Corp. 5.25% 5/15/27 (d) | 3,635,000 | 3,816,750 | |
| Wynn Macau Ltd.: | |||
| 5.125% 12/15/29 (d) | 1,275,000 | 1,267,031 | |
| 5.5% 1/15/26 (d) | 945,000 | 971,980 | |
| 5.5% 10/1/27 (d) | 2,495,000 | 2,526,188 | |
| 5.625% 8/26/28 (d) | 3,500,000 | 3,545,360 | |
| Wynn Resorts Finance LLC / Wynn Resorts Capital Corp.: | |||
| 5.125% 10/1/29 (d) | 2,130,000 | 2,215,200 | |
| 7.75% 4/15/25 (d) | 1,229,000 | 1,305,813 | |
| Yum! Brands, Inc.: | |||
| 4.625% 1/31/32 | 2,180,000 | 2,359,327 | |
| 5.35% 11/1/43 | 1,755,000 | 1,948,050 | |
| 6.875% 11/15/37 | 2,560,000 | 3,321,600 | |
| 7.75% 4/1/25 (d) | 770,000 | 829,590 | |
| 240,717,837 | |||
| Household Durables - 0.6% | |||
| Apex Tool Group LLC / BC Mountain Finance, Inc. 9% 2/15/23 (d) | 810,000 | 812,025 | |
| Ashton Woods U.S.A. LLC/Ashton Woods Finance Co.: | |||
| 4.625% 8/1/29 (d) | 1,125,000 | 1,125,000 | |
| 6.625% 1/15/28 (d) | 2,000,000 | 2,125,000 | |
| Beazer Homes U.S.A., Inc.: | |||
| 5.875% 10/15/27 | 2,175,000 | 2,293,538 | |
| 7.25% 10/15/29 | 7,175,000 | 7,937,344 | |
| Brookfield Residential Properties, Inc./Brookfield Residential U.S. Corp.: | |||
| 4.875% 2/15/30 (d) | 2,379,000 | 2,401,981 | |
| 5% 6/15/29 (d) | 2,080,000 | 2,108,600 | |
| 6.25% 9/15/27 (d) | 2,113,000 | 2,230,097 | |
| CD&R Smokey Buyer, Inc. 6.75% 7/15/25 (d) | 170,000 | 180,955 | |
| Century Communities, Inc.: | |||
| 3.875% 8/15/29 (d) | 350,000 | 355,320 | |
| 5.875% 7/15/25 | 500,000 | 514,690 | |
| 6.75% 6/1/27 | 1,450,000 | 1,549,282 | |
| KB Home: | |||
| 4% 6/15/31 | 1,025,000 | 1,066,000 | |
| 4.8% 11/15/29 | 2,225,000 | 2,464,188 | |
| 6.875% 6/15/27 | 1,400,000 | 1,673,000 | |
| M/I Homes, Inc. 4.95% 2/1/28 | 2,110,000 | 2,210,225 | |
| Meritage Homes Corp. 5.125% 6/6/27 | 1,686,000 | 1,906,364 | |
| Picasso Finance Sub, Inc. 6.125% 6/15/25 (d) | 421,000 | 445,208 | |
| STL Holding Co. LLC 7.5% 2/15/26 (d) | 1,250,000 | 1,325,000 | |
| Taylor Morrison Communities, Inc./Monarch Communities, Inc. 5.875% 4/15/23 (d) | 910,000 | 958,775 | |
| Tempur Sealy International, Inc. 4% 4/15/29 (d) | 850,000 | 871,250 | |
| TopBuild Corp. 3.625% 3/15/29 (d) | 1,000,000 | 1,000,980 | |
| TRI Pointe Homes, Inc.: | |||
| 5.25% 6/1/27 | 975,000 | 1,057,875 | |
| 5.7% 6/15/28 | 1,080,000 | 1,203,179 | |
| 39,815,876 | |||
| Internet & Direct Marketing Retail - 0.3% | |||
| Angi Group LLC 3.875% 8/15/28 (d) | 305,000 | 299,663 | |
| Match Group Holdings II LLC 4.125% 8/1/30 (d) | 399,000 | 417,953 | |
| Millennium Escrow Corp. 6.625% 8/1/26 (d) | 875,000 | 898,809 | |
| Photo Holdings Merger Sub, Inc. 8.5% 10/1/26 (d) | 2,960,000 | 3,211,600 | |
| Terrier Media Buyer, Inc. 8.875% 12/15/27 (d) | 10,699,000 | 11,394,435 | |
| 16,222,460 | |||
| Leisure Products - 0.1% | |||
| Mattel, Inc.: | |||
| 3.375% 4/1/26 (d) | 325,000 | 337,604 | |
| 3.75% 4/1/29 (d) | 1,830,000 | 1,921,134 | |
| 5.45% 11/1/41 | 1,124,000 | 1,351,610 | |
| 5.875% 12/15/27 (d) | 600,000 | 654,750 | |
| 6.2% 10/1/40 | 2,810,000 | 3,610,850 | |
| Vista Outdoor, Inc. 4.5% 3/15/29 (d) | 1,425,000 | 1,441,031 | |
| 9,316,979 | |||
| Multiline Retail - 0.0% | |||
| LSF9 Atlantis Holdings LLC / Victra Finance Corp. 7.75% 2/15/26 (d) | 995,000 | 1,037,487 | |
| Specialty Retail - 0.6% | |||
| Academy Ltd. 6% 11/15/27 (d) | 419,000 | 448,854 | |
| Adient U.S. LLC 9% 4/15/25 (d) | 3,830,000 | 4,175,548 | |
| Ambience Merger Sub, Inc.: | |||
| 4.875% 7/15/28 (d) | 250,000 | 251,458 | |
| 7.125% 7/15/29 (d) | 1,460,000 | 1,461,825 | |
| Bath & Body Works, Inc.: | |||
| 5.25% 2/1/28 | 240,000 | 268,799 | |
| 6.625% 10/1/30 (d) | 2,135,000 | 2,460,588 | |
| 6.694% 1/15/27 | 930,000 | 1,091,848 | |
| 6.95% 3/1/33 | 205,000 | 247,538 | |
| 7.5% 6/15/29 | 745,000 | 863,090 | |
| 9.375% 7/1/25 (d) | 960,000 | 1,242,000 | |
| Caleres, Inc. 6.25% 8/15/23 | 750,000 | 751,875 | |
| Constellation Automotive Financing PLC 4.875% 7/15/27 (d) | GBP | 360,000 | 493,659 |
| Jaguar Land Rover Automotive PLC: | |||
| 5.875% 1/15/28 (d) | 845,000 | 871,449 | |
| 7.75% 10/15/25 (d) | 2,485,000 | 2,708,153 | |
| LBM Acquisition LLC 6.25% 1/15/29 (d) | 1,550,000 | 1,558,913 | |
| LCM Investments Holdings 4.875% 5/1/29 (d) | 2,355,000 | 2,419,763 | |
| Lithia Motors, Inc. 3.875% 6/1/29 (d) | 1,345,000 | 1,410,300 | |
| Metis Merger Sub LLC 6.5% 5/15/29 (d) | 4,310,000 | 4,310,000 | |
| Park River Holdings, Inc. 5.625% 2/1/29 (d) | 3,800,000 | 3,612,470 | |
| PetSmart, Inc. / PetSmart Finance Corp.: | |||
| 4.75% 2/15/28 (d) | 250,000 | 260,313 | |
| 7.75% 2/15/29 (d) | 3,500,000 | 3,845,625 | |
| Rent-A-Center, Inc. 6.375% 2/15/29 (d) | 345,000 | 371,738 | |
| Sally Holdings LLC: | |||
| 5.625% 12/1/25 | 4,123,000 | 4,256,998 | |
| 8.75% 4/30/25 (d) | 800,000 | 870,000 | |
| Specialty Building Products Holdings LLC 6.375% 9/30/26 (d) | 1,140,000 | 1,199,850 | |
| 41,452,654 | |||
| Textiles, Apparel & Luxury Goods - 0.2% | |||
| Crocs, Inc. 4.125% 8/15/31 (d) | 1,500,000 | 1,507,500 | |
| Levi Strauss & Co. 3.5% 3/1/31 (d) | 1,565,000 | 1,611,950 | |
| The William Carter Co.: | |||
| 5.5% 5/15/25 (d) | 1,975,000 | 2,073,750 | |
| 5.625% 3/15/27 (d) | 2,005,000 | 2,095,225 | |
| Wolverine World Wide, Inc. 4% 8/15/29 (d) | 3,330,000 | 3,375,388 | |
| 10,663,813 | |||
| TOTAL CONSUMER DISCRETIONARY | 479,721,924 | ||
| CONSUMER STAPLES - 1.7% | |||
| Beverages - 0.1% | |||
| Primo Water Holdings, Inc. 4.375% 4/30/29 (d) | 3,125,000 | 3,154,719 | |
| Triton Water Holdings, Inc. 6.25% 4/1/29 (d) | 5,395,000 | 5,339,593 | |
| 8,494,312 | |||
| Food & Staples Retailing - 0.5% | |||
| Albertsons Companies LLC/Safeway, Inc./New Albertson's, Inc./Albertson's LLC: | |||
| 3.5% 3/15/29 (d) | 9,205,000 | 9,297,050 | |
| 4.875% 2/15/30 (d) | 2,500,000 | 2,728,125 | |
| 5.875% 2/15/28 (d) | 3,210,000 | 3,442,725 | |
| 7.5% 3/15/26 (d) | 1,565,000 | 1,703,526 | |
| C&S Group Enterprises LLC 5% 12/15/28 (d) | 6,310,000 | 6,246,900 | |
| Iceland Bondco PLC 4.625% 3/15/25 (Reg. S) | GBP | 1,055,000 | 1,412,882 |
| New Albertsons LP: | |||
| 7.45% 8/1/29 | 615,000 | 714,938 | |
| 8% 5/1/31 | 415,000 | 505,781 | |
| Performance Food Group, Inc. 5.5% 10/15/27 (d) | 3,964,000 | 4,127,515 | |
| Sigma Holdco BV 7.875% 5/15/26 (d) | 705,000 | 706,763 | |
| U.S. Foods, Inc. 4.75% 2/15/29 (d) | 2,435,000 | 2,492,831 | |
| United Natural Foods, Inc. 6.75% 10/15/28 (d) | 890,000 | 961,200 | |
| 34,340,236 | |||
| Food Products - 1.0% | |||
| B&G Foods, Inc. 5.25% 9/15/27 | 4,730,000 | 4,912,105 | |
| Chobani LLC/Finance Corp., Inc.: | |||
| 4.625% 11/15/28 (d) | 1,520,000 | 1,579,265 | |
| 7.5% 4/15/25 (d) | 5,580,000 | 5,829,984 | |
| JBS U.S.A. LLC/JBS U.S.A. Finance, Inc. 6.75% 2/15/28 (d) | 1,050,000 | 1,151,063 | |
| JBS U.S.A. Lux SA / JBS Food Co.: | |||
| 3.75% 12/1/31 (d) | 3,670,000 | 3,870,841 | |
| 5.5% 1/15/30 (d) | 2,775,000 | 3,131,726 | |
| 6.5% 4/15/29 (d) | 8,350,000 | 9,456,375 | |
| Kraft Heinz Foods Co.: | |||
| 4.375% 6/1/46 | 2,875,000 | 3,333,456 | |
| 4.875% 10/1/49 | 2,035,000 | 2,527,675 | |
| 5% 7/15/35 | 625,000 | 774,970 | |
| 5% 6/4/42 | 825,000 | 1,043,102 | |
| 5.2% 7/15/45 | 650,000 | 834,102 | |
| 5.5% 6/1/50 | 1,325,000 | 1,765,334 | |
| 6.5% 2/9/40 | 400,000 | 579,267 | |
| 6.875% 1/26/39 | 690,000 | 1,030,378 | |
| 7.125% 8/1/39 (d) | 525,000 | 796,898 | |
| Pilgrim's Pride Corp.: | |||
| 3.5% 3/1/32 (d)(h) | 700,000 | 714,945 | |
| 4.25% 4/15/31 (d) | 225,000 | 242,288 | |
| 5.875% 9/30/27 (d) | 5,915,000 | 6,312,902 | |
| Post Holdings, Inc.: | |||
| 4.5% 9/15/31 (d) | 4,315,000 | 4,352,756 | |
| 4.625% 4/15/30 (d) | 4,379,000 | 4,471,255 | |
| 5.5% 12/15/29 (d) | 3,064,000 | 3,282,310 | |
| 5.625% 1/15/28 (d) | 690,000 | 726,225 | |
| 5.75% 3/1/27 (d) | 580,000 | 607,086 | |
| TreeHouse Foods, Inc. 4% 9/1/28 | 1,200,000 | 1,156,620 | |
| 64,482,928 | |||
| Household Products - 0.0% | |||
| Central Garden & Pet Co.: | |||
| 4.125% 10/15/30 | 47,000 | 48,226 | |
| 4.125% 4/30/31 (d) | 750,000 | 761,250 | |
| Energizer Holdings, Inc.: | |||
| 4.375% 3/31/29 (d) | 500,000 | 501,435 | |
| 4.75% 6/15/28 (d) | 559,000 | 574,373 | |
| Spectrum Brands Holdings, Inc.: | |||
| 5% 10/1/29 (d) | 480,000 | 504,000 | |
| 5.5% 7/15/30 (d) | 10,000 | 10,738 | |
| 2,400,022 | |||
| Personal Products - 0.0% | |||
| Prestige Brands, Inc. 3.75% 4/1/31 (d) | 1,357,000 | 1,340,038 | |
| Tobacco - 0.1% | |||
| Vector Group Ltd. 5.75% 2/1/29 (d) | 3,500,000 | 3,561,250 | |
| TOTAL CONSUMER STAPLES | 114,618,786 | ||
| ENERGY - 6.0% | |||
| Energy Equipment & Services - 0.4% | |||
| Archrock Partners LP / Archrock Partners Finance Corp. 6.875% 4/1/27 (d) | 865,000 | 898,519 | |
| Exterran Energy Solutions LP 8.125% 5/1/25 | 1,185,000 | 1,066,500 | |
| Nabors Industries Ltd.: | |||
| 7.25% 1/15/26 (d) | 1,950,000 | 1,813,500 | |
| 7.5% 1/15/28 (d) | 3,400,000 | 3,094,000 | |
| Nabors Industries, Inc. 5.75% 2/1/25 | 3,200,000 | 2,700,000 | |
| NuStar Logistics LP 5.75% 10/1/25 | 4,205,000 | 4,520,375 | |
| Precision Drilling Corp.: | |||
| 6.875% 1/15/29 (d) | 525,000 | 528,063 | |
| 7.125% 1/15/26 (d) | 1,000,000 | 1,022,500 | |
| Transocean Guardian Ltd. 5.875% 1/15/24 (d) | 894,450 | 849,728 | |
| Transocean Phoenix 2 Ltd. 7.75% 10/15/24 (d) | 572,000 | 580,580 | |
| Transocean Pontus Ltd. 6.125% 8/1/25 (d) | 1,015,050 | 1,004,900 | |
| Transocean Poseidon Ltd. 6.875% 2/1/27 (d) | 665,000 | 643,388 | |
| Transocean Proteus Ltd. 6.25% 12/1/24 (d) | 668,250 | 658,226 | |
| Transocean Sentry Ltd. 5.375% 5/15/23 (d) | 978,705 | 937,110 | |
| Transocean, Inc.: | |||
| 7.5% 1/15/26 (d) | 1,676,000 | 1,282,140 | |
| 8% 2/1/27 (d) | 625,000 | 459,375 | |
| 11.5% 1/30/27 (d) | 500,000 | 503,690 | |
| U.S.A. Compression Partners LP: | |||
| 6.875% 4/1/26 | 780,000 | 810,459 | |
| 6.875% 9/1/27 | 580,000 | 607,469 | |
| 23,980,522 | |||
| Oil, Gas & Consumable Fuels - 5.6% | |||
| Aethon United BR LP / Aethon United Finance Corp. 8.25% 2/15/26 (d) | 2,640,000 | 2,864,400 | |
| Antero Midstream Partners LP/Antero Midstream Finance Corp.: | |||
| 5.375% 6/15/29 (d) | 2,050,000 | 2,098,616 | |
| 5.75% 3/1/27 (d) | 3,425,000 | 3,527,750 | |
| 5.75% 1/15/28 (d) | 1,710,000 | 1,780,538 | |
| Antero Resources Corp.: | |||
| 5% 3/1/25 | 3,590,000 | 3,661,800 | |
| 5.375% 3/1/30 (d) | 1,750,000 | 1,780,503 | |
| 7.625% 2/1/29 (d) | 2,275,000 | 2,502,500 | |
| 8.375% 7/15/26 (d) | 1,154,000 | 1,306,905 | |
| Apache Corp.: | |||
| 4.25% 1/15/30 | 400,000 | 430,528 | |
| 4.625% 11/15/25 | 770,000 | 833,302 | |
| 5.1% 9/1/40 | 1,650,000 | 1,835,625 | |
| 5.25% 2/1/42 | 125,000 | 138,125 | |
| 5.35% 7/1/49 | 200,000 | 223,040 | |
| 6% 1/15/37 | 55,000 | 64,763 | |
| 7.75% 12/15/29 | 625,000 | 762,500 | |
| Ascent Resources - Utica LLC/ARU Finance Corp.: | |||
| 7% 11/1/26 (d) | 2,755,000 | 2,806,656 | |
| 9% 11/1/27 (d) | 1,836,000 | 2,441,880 | |
| California Resources Corp. 7.125% 2/1/26 (d) | 1,580,000 | 1,657,467 | |
| Cheniere Corpus Christi Holdings LLC: | |||
| 5.875% 3/31/25 | 300,000 | 340,824 | |
| 7% 6/30/24 | 295,000 | 334,550 | |
| Cheniere Energy Partners LP: | |||
| 4% 3/1/31 (d) | 2,375,000 | 2,499,688 | |
| 4.5% 10/1/29 | 1,440,000 | 1,551,600 | |
| 5.625% 10/1/26 | 365,000 | 377,739 | |
| Cheniere Energy, Inc. 4.625% 10/15/28 | 9,101,000 | 9,601,555 | |
| Chesapeake Energy Corp.: | |||
| 5.5% 2/1/26 (d) | 1,415,000 | 1,478,647 | |
| 5.875% 2/1/29 (d) | 1,515,000 | 1,617,263 | |
| Citgo Holding, Inc. 9.25% 8/1/24 (d) | 5,785,000 | 5,796,570 | |
| Citgo Petroleum Corp.: | |||
| 6.375% 6/15/26 (d) | 7,211,000 | 7,319,165 | |
| 7% 6/15/25 (d) | 10,723,000 | 10,991,075 | |
| CNX Resources Corp. 7.25% 3/14/27 (d) | 3,546,000 | 3,758,760 | |
| Comstock Resources, Inc.: | |||
| 5.875% 1/15/30 (d) | 5,285,000 | 5,299,217 | |
| 6.75% 3/1/29 (d) | 6,325,000 | 6,638,088 | |
| 7.5% 5/15/25 (d) | 468,000 | 484,380 | |
| Continental Resources, Inc.: | |||
| 4.375% 1/15/28 | 1,240,000 | 1,391,900 | |
| 4.9% 6/1/44 | 1,590,000 | 1,790,594 | |
| 5.75% 1/15/31 (d) | 2,720,000 | 3,315,000 | |
| Coronado Finance Pty Ltd. 10.75% 5/15/26 (d) | 1,025,000 | 1,126,475 | |
| Crestwood Midstream Partners LP/Crestwood Midstream Finance Corp.: | |||
| 5.625% 5/1/27 (d) | 7,624,000 | 7,700,240 | |
| 5.75% 4/1/25 | 1,648,000 | 1,683,020 | |
| 6% 2/1/29 (d) | 2,605,000 | 2,657,100 | |
| CrownRock LP/CrownRock Finance, Inc.: | |||
| 5% 5/1/29 (d) | 1,000,000 | 1,027,185 | |
| 5.625% 10/15/25 (d) | 275,000 | 283,231 | |
| CVR Energy, Inc.: | |||
| 5.25% 2/15/25 (d) | 2,694,000 | 2,640,120 | |
| 5.75% 2/15/28 (d) | 4,972,000 | 4,909,054 | |
| DCP Midstream Operating LP: | |||
| 5.125% 5/15/29 | 1,770,000 | 1,964,700 | |
| 5.625% 7/15/27 | 1,960,000 | 2,227,197 | |
| 6.75% 9/15/37 (d) | 1,350,000 | 1,677,375 | |
| 8.125% 8/16/30 | 1,540,000 | 2,052,050 | |
| Delek Logistics Partners LP 7.125% 6/1/28 (d) | 2,865,000 | 3,036,742 | |
| EG Global Finance PLC: | |||
| 6.75% 2/7/25 (d) | 3,610,000 | 3,709,275 | |
| 8.5% 10/30/25 (d) | 5,189,000 | 5,435,478 | |
| Endeavor Energy Resources LP/EER Finance, Inc.: | |||
| 5.5% 1/30/26 (d) | 3,150,000 | 3,260,943 | |
| 5.75% 1/30/28 (d) | 5,715,000 | 6,015,038 | |
| 6.625% 7/15/25 (d) | 600,000 | 636,270 | |
| EnLink Midstream LLC 5.625% 1/15/28 (d) | 390,000 | 407,550 | |
| EnLink Midstream Partners LP: | |||
| 5.05% 4/1/45 | 530,000 | 486,357 | |
| 5.45% 6/1/47 | 1,085,000 | 1,021,929 | |
| 5.6% 4/1/44 | 180,000 | 171,000 | |
| EQM Midstream Partners LP: | |||
| 4.125% 12/1/26 | 475,000 | 484,234 | |
| 5.5% 7/15/28 | 50,000 | 54,562 | |
| 6.5% 7/1/27 (d) | 1,967,000 | 2,193,205 | |
| EQT Corp.: | |||
| 3.9% 10/1/27 | 2,338,000 | 2,524,058 | |
| 5% 1/15/29 | 835,000 | 949,662 | |
| 6.625% 2/1/25 (f) | 1,300,000 | 1,490,086 | |
| 7.5% 2/1/30 | 2,347,000 | 3,049,387 | |
| Global Partners LP/GLP Finance Corp.: | |||
| 6.875% 1/15/29 | 2,895,000 | 3,003,215 | |
| 7% 8/1/27 | 2,337,000 | 2,428,260 | |
| Gulfport Energy Corp. 8% 5/17/26 (d) | 1,200,000 | 1,276,038 | |
| Harvest Midstream I LP 7.5% 9/1/28 (d) | 1,775,000 | 1,872,448 | |
| Hess Corp.: | |||
| 7.3% 8/15/31 | 165,000 | 224,389 | |
| 7.875% 10/1/29 | 80,000 | 109,744 | |
| Hess Midstream Partners LP: | |||
| 4.25% 2/15/30 (d) | 615,000 | 622,688 | |
| 5.125% 6/15/28 (d) | 3,020,000 | 3,163,450 | |
| Hilcorp Energy I LP/Hilcorp Finance Co.: | |||
| 5.75% 10/1/25 (d) | 2,605,000 | 2,631,050 | |
| 5.75% 2/1/29 (d) | 1,120,000 | 1,136,800 | |
| 6% 2/1/31 (d) | 1,190,000 | 1,222,725 | |
| 6.25% 11/1/28 (d) | 3,663,000 | 3,785,308 | |
| Holly Energy Partners LP/Holly Energy Finance Corp. 5% 2/1/28 (d) | 2,600,000 | 2,652,780 | |
| Independence Energy Finance LLC 7.25% 5/1/26 (d) | 1,630,000 | 1,646,300 | |
| Magnolia Oil & Gas Operating LLC 6% 8/1/26 (d) | 3,630,000 | 3,738,900 | |
| MEG Energy Corp.: | |||
| 5.875% 2/1/29 (d) | 2,530,000 | 2,605,672 | |
| 6.5% 1/15/25 (d) | 1,397,000 | 1,442,403 | |
| 7.125% 2/1/27 (d) | 3,332,000 | 3,506,130 | |
| Mesquite Energy, Inc. 7.25% 2/15/23 (c)(d)(g) | 3,242,000 | 0 | |
| Murphy Oil U.S.A., Inc. 3.75% 2/15/31 (d) | 750,000 | 756,675 | |
| New Fortress Energy, Inc.: | |||
| 6.5% 9/30/26 (d) | 8,430,000 | 8,473,836 | |
| 6.75% 9/15/25 (d) | 8,649,000 | 8,778,735 | |
| NGL Energy Operating LLC/NGL Energy Finance Corp. 7.5% 2/1/26 (d) | 13,145,000 | 13,342,175 | |
| NGL Energy Partners LP/NGL Energy Finance Corp. 7.5% 11/1/23 | 1,750,000 | 1,636,250 | |
| Occidental Petroleum Corp.: | |||
| 3% 2/15/27 | 850,000 | 852,125 | |
| 3.5% 8/15/29 | 1,585,000 | 1,642,520 | |
| 4.1% 2/15/47 | 500,000 | 488,865 | |
| 4.3% 8/15/39 | 305,000 | 310,338 | |
| 4.4% 4/15/46 | 400,000 | 408,816 | |
| 4.625% 6/15/45 | 225,000 | 232,875 | |
| 5.5% 12/1/25 | 100,000 | 111,500 | |
| 5.55% 3/15/26 | 150,000 | 167,250 | |
| 5.875% 9/1/25 | 225,000 | 253,139 | |
| 6.125% 1/1/31 | 3,010,000 | 3,639,692 | |
| 6.2% 3/15/40 | 295,000 | 351,820 | |
| 6.375% 9/1/28 | 680,000 | 804,685 | |
| 6.45% 9/15/36 | 2,305,000 | 2,881,250 | |
| 6.625% 9/1/30 | 3,060,000 | 3,816,279 | |
| 6.95% 7/1/24 | 756,000 | 851,589 | |
| 7.15% 5/15/28 | 1,325,000 | 1,538,564 | |
| 7.5% 5/1/31 | 4,115,000 | 5,384,189 | |
| 7.875% 9/15/31 | 700,000 | 929,887 | |
| 7.95% 6/15/39 | 1,225,000 | 1,611,916 | |
| 8% 7/15/25 | 2,660,000 | 3,205,300 | |
| 8.5% 7/15/27 | 1,640,000 | 2,068,811 | |
| 8.875% 7/15/30 | 7,100,000 | 9,743,259 | |
| Ovintiv Exploration, Inc. 5.625% 7/1/24 | 930,000 | 1,036,491 | |
| Ovintiv, Inc.: | |||
| 6.5% 8/15/34 | 1,160,000 | 1,541,764 | |
| 6.5% 2/1/38 | 550,000 | 759,916 | |
| 6.625% 8/15/37 | 250,000 | 343,319 | |
| Parkland Corp. 4.5% 10/1/29 (d) | 1,075,000 | 1,101,875 | |
| PBF Holding Co. LLC/PBF Finance Corp. 9.25% 5/15/25 (d) | 7,543,000 | 7,278,995 | |
| Range Resources Corp.: | |||
| 4.875% 5/15/25 | 1,800,000 | 1,863,000 | |
| 5% 3/15/23 | 1,104,000 | 1,132,240 | |
| 8.25% 1/15/29 (d) | 520,000 | 577,231 | |
| 9.25% 2/1/26 | 1,575,000 | 1,722,286 | |
| Rockies Express Pipeline LLC: | |||
| 3.6% 5/15/25 (d) | 1,925,000 | 1,981,268 | |
| 4.8% 5/15/30 (d) | 100,000 | 103,419 | |
| 4.95% 7/15/29 (d) | 1,070,000 | 1,113,196 | |
| 6.875% 4/15/40 (d) | 785,000 | 865,463 | |
| 7.5% 7/15/38 (d) | 2,800,000 | 3,122,000 | |
| SM Energy Co.: | |||
| 5.625% 6/1/25 | 1,245,000 | 1,249,009 | |
| 6.5% 7/15/28 | 1,070,000 | 1,075,211 | |
| 6.75% 9/15/26 | 290,000 | 291,450 | |
| Southwestern Energy Co. 5.375% 3/15/30 | 3,750,000 | 3,900,863 | |
| Sunoco LP/Sunoco Finance Corp.: | |||
| 4.5% 5/15/29 | 3,360,000 | 3,402,000 | |
| 5.5% 2/15/26 | 1,458,000 | 1,497,964 | |
| 5.875% 3/15/28 | 240,000 | 253,500 | |
| 6% 4/15/27 | 1,000,000 | 1,044,910 | |
| Tallgrass Energy Partners LP / Tallgrass Energy Finance Corp.: | |||
| 5.5% 1/15/28 (d) | 2,398,000 | 2,421,980 | |
| 6% 3/1/27 (d) | 8,970,000 | 9,283,950 | |
| 6% 12/31/30 (d) | 5,885,000 | 5,985,751 | |
| 6% 9/1/31 (d) | 3,470,000 | 3,474,338 | |
| 7.5% 10/1/25 (d) | 1,875,000 | 2,020,275 | |
| Targa Resources Partners LP/Targa Resources Partners Finance Corp.: | |||
| 4% 1/15/32 (d) | 4,940,000 | 5,173,810 | |
| 4.875% 2/1/31 | 2,922,000 | 3,178,552 | |
| 5% 1/15/28 | 250,000 | 262,500 | |
| 5.375% 2/1/27 | 3,800,000 | 3,937,750 | |
| 5.5% 3/1/30 | 967,000 | 1,066,118 | |
| 5.875% 4/15/26 | 2,715,000 | 2,840,569 | |
| 6.5% 7/15/27 | 1,585,000 | 1,716,111 | |
| 6.875% 1/15/29 | 3,680,000 | 4,137,056 | |
| Venture Global Calcasieu Pass LLC: | |||
| 3.875% 8/15/29 (d) | 2,870,000 | 2,957,851 | |
| 4.125% 8/15/31 (d) | 3,140,000 | 3,293,075 | |
| Vine Energy Holdings LLC 6.75% 4/15/29 (d) | 3,805,000 | 4,109,400 | |
| Western Gas Partners LP: | |||
| 4.35% 2/1/25 (e) | 1,550,000 | 1,628,771 | |
| 5.3% 2/1/30 | 3,050,000 | 3,417,861 | |
| 5.45% 4/1/44 | 75,000 | 85,294 | |
| 5.5% 8/15/48 | 1,025,000 | 1,174,747 | |
| 6.5% 2/1/50 | 350,000 | 412,631 | |
| 371,363,436 | |||
| TOTAL ENERGY | 395,343,958 | ||
| FINANCIALS - 2.4% | |||
| Capital Markets - 0.2% | |||
| AssuredPartners, Inc. 5.625% 1/15/29 (d) | 890,000 | 895,767 | |
| Broadstreet Partners, Inc. 5.875% 4/15/29 (d) | 800,000 | 806,224 | |
| Drawbridge Special Opportunities Fund LP/Drawbridge Special Opportunities Finance Corp. 3.875% 2/15/26 (d) | 630,000 | 651,918 | |
| Jefferies Finance LLC/JFIN Co-Issuer Corp. 5% 8/15/28 (d) | 2,050,000 | 2,101,250 | |
| LPL Holdings, Inc.: | |||
| 4% 3/15/29 (d) | 4,600,000 | 4,697,980 | |
| 4.375% 5/15/31 (d) | 240,000 | 248,400 | |
| MidCap Financial Issuer Trust: | |||
| 5.625% 1/15/30 (d) | 1,305,000 | 1,298,475 | |
| 6.5% 5/1/28 (d) | 2,570,000 | 2,689,402 | |
| MSCI, Inc.: | |||
| 3.25% 8/15/33 (d) | 655,000 | 675,469 | |
| 4% 11/15/29 (d) | 875,000 | 936,250 | |
| 15,001,135 | |||
| Consumer Finance - 0.6% | |||
| Ford Motor Credit Co. LLC: | |||
| 4% 11/13/30 | 1,000,000 | 1,055,000 | |
| 5.125% 6/16/25 | 3,370,000 | 3,698,575 | |
| goeasy Ltd.: | |||
| 4.375% 5/1/26 (d) | 1,075,000 | 1,108,594 | |
| 5.375% 12/1/24 (d) | 100,000 | 103,000 | |
| Navient Corp.: | |||
| 4.875% 3/15/28 | 1,680,000 | 1,709,400 | |
| 5% 3/15/27 | 3,230,000 | 3,391,500 | |
| 6.125% 3/25/24 | 2,435,000 | 2,640,027 | |
| 6.75% 6/25/25 | 1,255,000 | 1,399,325 | |
| 6.75% 6/15/26 | 700,000 | 788,375 | |
| 7.25% 9/25/23 | 1,215,000 | 1,334,832 | |
| OneMain Finance Corp.: | |||
| 3.875% 9/15/28 | 3,050,000 | 3,064,274 | |
| 4% 9/15/30 | 875,000 | 876,873 | |
| 5.375% 11/15/29 | 2,865,000 | 3,130,013 | |
| 6.125% 3/15/24 | 1,395,000 | 1,503,113 | |
| 6.625% 1/15/28 | 3,701,000 | 4,271,805 | |
| 6.875% 3/15/25 | 2,711,000 | 3,070,208 | |
| 7.125% 3/15/26 | 4,569,000 | 5,334,308 | |
| 8.875% 6/1/25 | 2,895,000 | 3,174,947 | |
| SLM Corp. 4.2% 10/29/25 | 700,000 | 754,250 | |
| 42,408,419 | |||
| Diversified Financial Services - 0.7% | |||
| Cosan Luxembourg SA 7% 1/20/27 (d) | 1,315,000 | 1,379,353 | |
| HCRX Investments Holdco LP 4.5% 8/1/29 (d) | 725,000 | 734,343 | |
| Icahn Enterprises LP/Icahn Enterprises Finance Corp.: | |||
| 4.375% 2/1/29 | 2,000,000 | 2,007,500 | |
| 5.25% 5/15/27 | 9,261,000 | 9,619,864 | |
| 6.25% 5/15/26 | 5,285,000 | 5,569,069 | |
| MPH Acquisition Holdings LLC 5.5% 9/1/28 (d) | 1,000,000 | 1,016,250 | |
| P&L Development LLC/PLD Finance Corp. 7.75% 11/15/25 (d) | 2,300,000 | 2,394,875 | |
| Shift4 Payments LLC / Shift4 Payments Finance Sub, Inc. 4.625% 11/1/26 (d) | 365,000 | 378,585 | |
| United Shore Financial Services LLC 5.5% 4/15/29 (d) | 870,000 | 852,600 | |
| Venator Finance SARL/Venator Capital Management Ltd.: | |||
| 5.75% 7/15/25 (d) | 3,625,000 | 3,421,094 | |
| 9.5% 7/1/25 (d) | 825,000 | 915,750 | |
| Verscend Escrow Corp. 9.75% 8/15/26 (d) | 7,840,000 | 8,281,000 | |
| VMED O2 UK Financing I PLC: | |||
| 4.25% 1/31/31 (d) | 2,337,000 | 2,348,732 | |
| 4.75% 7/15/31 (d) | 3,550,000 | 3,644,111 | |
| 42,563,126 | |||
| Insurance - 0.5% | |||
| Acrisure LLC / Acrisure Finance, Inc.: | |||
| 4.25% 2/15/29 (d) | 1,045,000 | 1,034,550 | |
| 6% 8/1/29 (d) | 1,875,000 | 1,846,875 | |
| 7% 11/15/25 (d) | 1,160,000 | 1,181,750 | |
| 10.125% 8/1/26 (d) | 4,035,000 | 4,529,288 | |
| Alliant Holdings Intermediate LLC: | |||
| 4.25% 10/15/27 (d) | 329,000 | 329,823 | |
| 6.75% 10/15/27 (d) | 9,924,000 | 10,320,960 | |
| AmWINS Group, Inc. 4.875% 6/30/29 (d) | 4,865,000 | 4,944,056 | |
| Genworth Mortgage Holdings, Inc. 6.5% 8/15/25 (d) | 1,565,000 | 1,690,200 | |
| GTCR AP Finance, Inc. 8% 5/15/27 (d) | 1,035,000 | 1,094,513 | |
| HUB International Ltd. 7% 5/1/26 (d) | 3,825,000 | 3,957,345 | |
| 30,929,360 | |||
| Mortgage Real Estate Investment Trusts - 0.0% | |||
| Starwood Property Trust, Inc. 5.5% 11/1/23 (d) | 1,425,000 | 1,494,469 | |
| Thrifts & Mortgage Finance - 0.4% | |||
| Freedom Mortgage Corp.: | |||
| 6.625% 1/15/27 (d) | 1,300,000 | 1,244,750 | |
| 7.625% 5/1/26 (d) | 1,575,000 | 1,579,064 | |
| Home Point Capital, Inc. 5% 2/1/26 (d) | 3,450,000 | 2,984,250 | |
| LD Holdings Group LLC: | |||
| 6.125% 4/1/28 (d) | 1,625,000 | 1,597,139 | |
| 6.5% 11/1/25 (d) | 675,000 | 688,500 | |
| MGIC Investment Corp. 5.25% 8/15/28 | 355,000 | 380,489 | |
| Nationstar Mortgage Holdings, Inc.: | |||
| 5.125% 12/15/30 (d) | 2,015,000 | 2,065,556 | |
| 5.5% 8/15/28 (d) | 3,030,000 | 3,147,413 | |
| 6% 1/15/27 (d) | 2,662,000 | 2,805,083 | |
| Pennymac Financial Services, Inc.: | |||
| 4.25% 2/15/29 (d) | 2,725,000 | 2,622,813 | |
| 5.375% 10/15/25 (d) | 2,210,000 | 2,286,864 | |
| Quicken Loans LLC 5.25% 1/15/28 (d) | 3,585,000 | 3,782,175 | |
| 25,184,096 | |||
| TOTAL FINANCIALS | 157,580,605 | ||
| HEALTH CARE - 3.2% | |||
| Biotechnology - 0.0% | |||
| Emergent BioSolutions, Inc. 3.875% 8/15/28 (d) | 47,000 | 45,825 | |
| Health Care Equipment & Supplies - 0.2% | |||
| AdaptHealth LLC: | |||
| 4.625% 8/1/29 (d) | 3,063,000 | 3,071,576 | |
| 5.125% 3/1/30 (d) | 1,255,000 | 1,271,164 | |
| 6.125% 8/1/28 (d) | 785,000 | 836,025 | |
| Avantor Funding, Inc. 4.625% 7/15/28 (d) | 4,300,000 | 4,546,820 | |
| Hologic, Inc.: | |||
| 3.25% 2/15/29 (d) | 1,785,000 | 1,829,090 | |
| 4.625% 2/1/28 (d) | 160,000 | 170,200 | |
| Teleflex, Inc. 4.25% 6/1/28 (d) | 270,000 | 281,138 | |
| 12,006,013 | |||
| Health Care Providers & Services - 1.9% | |||
| AMN Healthcare: | |||
| 4% 4/15/29 (d) | 1,522,000 | 1,569,563 | |
| 4.625% 10/1/27 (d) | 2,065,000 | 2,152,763 | |
| Centene Corp.: | |||
| 3.375% 2/15/30 | 1,945,000 | 2,032,525 | |
| 4.625% 12/15/29 | 1,400,000 | 1,535,646 | |
| Community Health Systems, Inc.: | |||
| 4.75% 2/15/31 (d) | 2,465,000 | 2,514,571 | |
| 5.625% 3/15/27 (d) | 5,145,000 | 5,427,975 | |
| 6% 1/15/29 (d) | 2,810,000 | 2,996,163 | |
| 6.125% 4/1/30 (d) | 1,985,000 | 2,000,781 | |
| 6.875% 4/15/29 (d) | 2,345,000 | 2,435,869 | |
| 8% 3/15/26 (d) | 3,080,000 | 3,296,986 | |
| 8% 12/15/27 (d) | 2,945,000 | 3,243,181 | |
| DaVita HealthCare Partners, Inc.: | |||
| 3.75% 2/15/31 (d) | 5,520,000 | 5,454,947 | |
| 4.625% 6/1/30 (d) | 11,320,000 | 11,831,211 | |
| HCA Holdings, Inc.: | |||
| 3.5% 9/1/30 | 4,075,000 | 4,372,638 | |
| 5.625% 9/1/28 | 275,000 | 327,938 | |
| 5.875% 2/15/26 | 875,000 | 1,014,825 | |
| 5.875% 2/1/29 | 2,030,000 | 2,461,375 | |
| 7.05% 12/1/27 | 515,000 | 645,038 | |
| LifePoint Health, Inc.: | |||
| 4.375% 2/15/27 (d) | 624,000 | 622,440 | |
| 6.75% 4/15/25 (d) | 3,260,000 | 3,431,150 | |
| MEDNAX, Inc. 6.25% 1/15/27 (d) | 2,525,000 | 2,660,719 | |
| ModivCare Escrow Issuer, Inc. 5% 10/1/29 (d) | 435,000 | 446,519 | |
| Molina Healthcare, Inc.: | |||
| 3.875% 11/15/30 (d) | 855,000 | 911,644 | |
| 4.375% 6/15/28 (d) | 840,000 | 880,950 | |
| Owens & Minor, Inc. 4.5% 3/31/29 (d) | 625,000 | 639,031 | |
| Prime Healthcare Services 7.25% 11/1/25 (d) | 3,050,000 | 3,263,500 | |
| Radiology Partners, Inc. 9.25% 2/1/28 (d) | 2,710,000 | 2,906,475 | |
| Regionalcare Hospital Partners 9.75% 12/1/26 (d) | 6,163,000 | 6,555,891 | |
| RegionalCare Hospital Partners Holdings, Inc. 5.375% 1/15/29 (d) | 1,225,000 | 1,203,367 | |
| RP Escrow Issuer LLC 5.25% 12/15/25 (d) | 3,905,000 | 3,996,523 | |
| Sabra Health Care LP 5.125% 8/15/26 | 725,000 | 817,997 | |
| Select Medical Corp. 6.25% 8/15/26 (d) | 770,000 | 814,275 | |
| Tenet Healthcare Corp.: | |||
| 4.25% 6/1/29 (d) | 6,225,000 | 6,360,643 | |
| 4.625% 7/15/24 | 3,372,000 | 3,418,365 | |
| 4.625% 6/15/28 (d) | 1,864,000 | 1,929,240 | |
| 4.875% 1/1/26 (d) | 1,520,000 | 1,576,696 | |
| 5.125% 11/1/27 (d) | 1,800,000 | 1,894,500 | |
| 6.125% 10/1/28 (d) | 12,890,000 | 13,607,393 | |
| 6.25% 2/1/27 (d) | 5,750,000 | 5,994,375 | |
| 6.875% 11/15/31 | 1,420,000 | 1,611,700 | |
| 7.5% 4/1/25 (d) | 2,150,000 | 2,300,500 | |
| Vizient, Inc. 6.25% 5/15/27 (d) | 125,000 | 130,938 | |
| 123,288,826 | |||
| Health Care Technology - 0.0% | |||
| IQVIA, Inc. 5% 5/15/27 (d) | 1,275,000 | 1,332,286 | |
| Life Sciences Tools & Services - 0.0% | |||
| Charles River Laboratories International, Inc.: | |||
| 3.75% 3/15/29 (d) | 725,000 | 747,359 | |
| 4.25% 5/1/28 (d) | 120,000 | 125,689 | |
| 873,048 | |||
| Pharmaceuticals - 1.1% | |||
| Bausch Health Companies, Inc.: | |||
| 4.875% 6/1/28 (d) | 4,035,000 | 4,145,963 | |
| 5% 1/30/28 (d) | 6,245,000 | 5,956,169 | |
| 5% 2/15/29 (d) | 1,415,000 | 1,321,299 | |
| 5.25% 1/30/30 (d) | 4,792,000 | 4,504,480 | |
| 5.25% 2/15/31 (d) | 2,100,000 | 1,958,670 | |
| 6.25% 2/15/29 (d) | 10,698,000 | 10,617,765 | |
| 7% 1/15/28 (d) | 7,025,000 | 7,280,464 | |
| 7.25% 5/30/29 (d) | 3,885,000 | 4,001,550 | |
| Catalent Pharma Solutions 3.125% 2/15/29 (d) | 675,000 | 666,876 | |
| Endo Luxembourg Finance Co. I SARL / Endo U.S., Inc. 6.125% 4/1/29 (d) | 1,200,000 | 1,188,000 | |
| Jazz Securities DAC 4.375% 1/15/29 (d) | 4,325,000 | 4,481,781 | |
| Organon & Co. / Organon Foreign Debt Co-Issuer BV: | |||
| 4.125% 4/30/28 (d) | 3,590,000 | 3,703,803 | |
| 5.125% 4/30/31 (d) | 5,375,000 | 5,638,160 | |
| Teva Pharmaceutical Finance LLC 6.15% 2/1/36 | 995,000 | 1,104,450 | |
| Teva Pharmaceutical Finance Netherlands III BV: | |||
| 6% 4/15/24 | 390,000 | 408,443 | |
| 6.75% 3/1/28 | 1,500,000 | 1,695,000 | |
| 7.125% 1/31/25 | 2,850,000 | 3,112,770 | |
| Valeant Pharmaceuticals International, Inc.: | |||
| 8.5% 1/31/27 (d) | 10,229,000 | 11,000,778 | |
| 9.25% 4/1/26 (d) | 2,385,000 | 2,569,838 | |
| 75,356,259 | |||
| TOTAL HEALTH CARE | 212,902,257 | ||
| INDUSTRIALS - 5.1% | |||
| Aerospace & Defense - 1.5% | |||
| Bombardier, Inc.: | |||
| 6% 2/15/28 (d) | 4,315,000 | 4,352,023 | |
| 7.125% 6/15/26 (d) | 5,350,000 | 5,644,250 | |
| 7.5% 12/1/24 (d) | 5,320,000 | 5,545,036 | |
| 7.5% 3/15/25 (d) | 17,755,000 | 18,239,179 | |
| 7.875% 4/15/27 (d) | 14,110,000 | 14,793,630 | |
| BWX Technologies, Inc. 4.125% 6/30/28 (d) | 3,685,000 | 3,786,338 | |
| Moog, Inc. 4.25% 12/15/27 (d) | 3,792,000 | 3,896,280 | |
| Spirit Aerosystems, Inc. 7.5% 4/15/25 (d) | 1,700,000 | 1,799,875 | |
| The Boeing Co.: | |||
| 5.15% 5/1/30 | 4,755,000 | 5,625,944 | |
| 5.805% 5/1/50 | 5,785,000 | 7,857,219 | |
| 5.93% 5/1/60 | 2,425,000 | 3,370,586 | |
| TransDigm, Inc.: | |||
| 4.625% 1/15/29 (d) | 4,965,000 | 4,902,938 | |
| 5.5% 11/15/27 | 11,559,000 | 11,833,526 | |
| 6.25% 3/15/26 (d) | 3,715,000 | 3,900,750 | |
| 7.5% 3/15/27 | 3,145,000 | 3,325,838 | |
| 8% 12/15/25 (d) | 2,915,000 | 3,119,050 | |
| 101,992,462 | |||
| Airlines - 0.4% | |||
| Air Canada: | |||
| 3.875% 8/15/26 (d) | 810,000 | 814,050 | |
| 4.625% 8/15/29 (d) | CAD | 720,000 | 578,157 |
| American Airlines, Inc. 11.75% 7/15/25 (d) | 2,805,000 | 3,482,408 | |
| American Airlines, Inc. / AAdvantage Loyalty IP Ltd.: | |||
| 5.5% 4/20/26 (d) | 3,385,000 | 3,567,790 | |
| 5.75% 4/20/29 (d) | 5,795,000 | 6,257,818 | |
| Delta Air Lines, Inc.: | |||
| 7% 5/1/25 (d) | 1,055,000 | 1,234,160 | |
| 7.375% 1/15/26 | 1,450,000 | 1,707,089 | |
| Delta Air Lines, Inc. / SkyMiles IP Ltd.: | |||
| 4.5% 10/20/25 (d) | 240,000 | 257,400 | |
| 4.75% 10/20/28 (d) | 1,030,000 | 1,146,672 | |
| Hawaiian Brand Intellectual Property Ltd. / HawaiianMiles Loyalty Ltd. 5.75% 1/20/26 (d) | 1,815,000 | 1,911,431 | |
| Mileage Plus Holdings LLC 6.5% 6/20/27 (d) | 1,430,000 | 1,553,481 | |
| United Airlines, Inc.: | |||
| 4.375% 4/15/26 (d) | 2,600,000 | 2,697,240 | |
| 4.625% 4/15/29 (d) | 2,095,000 | 2,173,563 | |
| 27,381,259 | |||
| Building Products - 0.3% | |||
| Advanced Drain Systems, Inc. 5% 9/30/27 (d) | 1,450,000 | 1,508,000 | |
| Cornerstone Building Brands, Inc. 6.125% 1/15/29 (d) | 1,500,000 | 1,603,575 | |
| CP Atlas Buyer, Inc. 7% 12/1/28 (d) | 245,000 | 249,900 | |
| Forterra Finance LLC/FRTA Finance Corp. 6.5% 7/15/25 (d) | 905,000 | 969,481 | |
| Griffon Corp. 5.75% 3/1/28 | 3,400,000 | 3,608,046 | |
| Jeld-Wen, Inc.: | |||
| 4.625% 12/15/25 (d) | 450,000 | 458,568 | |
| 4.875% 12/15/27 (d) | 1,276,000 | 1,330,230 | |
| Masonite International Corp.: | |||
| 3.5% 2/15/30 (d) | 725,000 | 726,617 | |
| 5.375% 2/1/28 (d) | 100,000 | 106,252 | |
| New Enterprise Stone & Lime Co., Inc. 6.25% 3/15/26 (d) | 1,055,000 | 1,084,013 | |
| PGT Innovations, Inc. 6.75% 8/1/26 (d) | 920,000 | 965,264 | |
| Shea Homes Ltd. Partnership/Corp. 4.75% 2/15/28 (d) | 3,175,000 | 3,318,685 | |
| Standard Industries, Inc./New Jersey: | |||
| 3.375% 1/15/31 (d) | 950,000 | 915,563 | |
| 4.375% 7/15/30 (d) | 3,745,000 | 3,847,276 | |
| 4.75% 1/15/28 (d) | 1,856,000 | 1,927,038 | |
| 5% 2/15/27 (d) | 180,000 | 186,075 | |
| 22,804,583 | |||
| Commercial Services & Supplies - 1.3% | |||
| ACCO Brands Corp. 4.25% 3/15/29 (d) | 2,200,000 | 2,210,670 | |
| ADT Corp. 4.125% 8/1/29 (d) | 3,550,000 | 3,545,421 | |
| Allied Universal Holdco LLC / Allied Universal Finance Corp.: | |||
| 6% 6/1/29 (d) | 3,180,000 | 3,179,714 | |
| 6.625% 7/15/26 (d) | 4,604,000 | 4,920,525 | |
| 9.75% 7/15/27 (d) | 3,310,000 | 3,620,313 | |
| APX Group, Inc. 6.75% 2/15/27 (d) | 1,310,000 | 1,396,788 | |
| Atlas Luxco 4 SARL / Allied Universal Holdco LLC / Allied Universal Finance Corp.: | |||
| 4.625% 6/1/28 (d) | 2,715,000 | 2,726,878 | |
| 4.625% 6/1/28 (d) | 3,585,000 | 3,593,963 | |
| Brand Energy & Infrastructure Services, Inc. 8.5% 7/15/25 (d) | 5,369,000 | 5,409,268 | |
| CoreCivic, Inc. 8.25% 4/15/26 | 3,665,000 | 3,868,774 | |
| GFL Environmental, Inc.: | |||
| 4.375% 8/15/29 (d) | 2,170,000 | 2,180,850 | |
| 4.75% 6/15/29 (d) | 1,515,000 | 1,556,663 | |
| Intrado Corp. 8.5% 10/15/25 (d) | 5,112,000 | 4,907,520 | |
| IPD BV 5.5% 12/1/25 (d) | EUR | 245,000 | 300,942 |
| LBC Tank Terminals Holding Netherlands BV 6.875% 5/15/23 (d) | 3,065,000 | 3,058,870 | |
| Legends Hospitality Holding Co. LLC/Legends Hospitality Co-Issuer, Inc. 5% 2/1/26 (d) | 3,285,000 | 3,383,550 | |
| Madison IAQ LLC: | |||
| 4.125% 6/30/28 (d) | 4,620,000 | 4,645,364 | |
| 5.875% 6/30/29 (d) | 5,475,000 | 5,605,031 | |
| Nielsen Finance LLC/Nielsen Finance Co.: | |||
| 4.5% 7/15/29 (d) | 2,470,000 | 2,447,523 | |
| 4.75% 7/15/31 (d) | 1,275,000 | 1,259,652 | |
| 5.625% 10/1/28 (d) | 4,324,000 | 4,545,605 | |
| 5.875% 10/1/30 (d) | 3,189,000 | 3,424,189 | |
| PowerTeam Services LLC 9.033% 12/4/25 (d) | 2,260,000 | 2,469,050 | |
| Prime Securities Services Borrower LLC/Prime Finance, Inc.: | |||
| 3.375% 8/31/27 (d) | 47,000 | 45,353 | |
| 5.75% 4/15/26 (d) | 1,137,000 | 1,230,049 | |
| 6.25% 1/15/28 (d) | 1,845,000 | 1,911,881 | |
| Staples, Inc.: | |||
| 7.5% 4/15/26 (d) | 3,015,000 | 3,052,688 | |
| 10.75% 4/15/27 (d) | 2,495,000 | 2,432,625 | |
| Stericycle, Inc. 3.875% 1/15/29 (d) | 1,640,000 | 1,669,044 | |
| The Brink's Co. 4.625% 10/15/27 (d) | 850,000 | 892,781 | |
| 85,491,544 | |||
| Construction & Engineering - 0.2% | |||
| Amsted Industries, Inc.: | |||
| 4.625% 5/15/30 (d) | 1,490,000 | 1,549,600 | |
| 5.625% 7/1/27 (d) | 1,605,000 | 1,681,238 | |
| Cloud Crane LLC 10.125% 8/1/24 (d) | 4,720,000 | 4,855,700 | |
| Great Lakes Dredge & Dock Corp. 5.25% 6/1/29 (d) | 625,000 | 645,313 | |
| Pike Corp. 5.5% 9/1/28 (d) | 6,464,000 | 6,569,040 | |
| SRS Distribution, Inc.: | |||
| 4.625% 7/1/28 (d) | 795,000 | 819,248 | |
| 6.125% 7/1/29 (d) | 179,000 | 185,713 | |
| 16,305,852 | |||
| Electrical Equipment - 0.1% | |||
| Sensata Technologies BV 4% 4/15/29 (d) | 2,055,000 | 2,126,021 | |
| Wesco Distribution, Inc.: | |||
| 7.125% 6/15/25 (d) | 1,975,000 | 2,124,488 | |
| 7.25% 6/15/28 (d) | 1,015,000 | 1,128,873 | |
| 5,379,382 | |||
| Industrial Conglomerates - 0.0% | |||
| Ladder Capital Finance Holdings LLLP/Ladder Capital Finance Corp.: | |||
| 4.25% 2/1/27 (d) | 915,000 | 919,575 | |
| 4.75% 6/15/29 (d) | 1,700,000 | 1,738,250 | |
| 2,657,825 | |||
| Machinery - 0.3% | |||
| Colfax Corp. 6.375% 2/15/26 (d) | 409,000 | 429,961 | |
| Hillenbrand, Inc.: | |||
| 3.75% 3/1/31 | 380,000 | 382,850 | |
| 5% 9/15/26 (f) | 25,000 | 27,888 | |
| 5.75% 6/15/25 | 155,000 | 163,913 | |
| Meritor, Inc. 6.25% 6/1/25 (d) | 735,000 | 781,797 | |
| Mueller Water Products, Inc. 4% 6/15/29 (d) | 1,965,000 | 2,044,700 | |
| Terex Corp. 5% 5/15/29 (d) | 1,475,000 | 1,550,594 | |
| Titan International, Inc. 7% 4/30/28 (d) | 1,325,000 | 1,384,903 | |
| Vertical Holdco GmbH 7.625% 7/15/28 (d) | 3,170,000 | 3,433,522 | |
| Vertical U.S. Newco, Inc. 5.25% 7/15/27 (d) | 6,415,000 | 6,777,897 | |
| 16,978,025 | |||
| Marine - 0.1% | |||
| Seaspan Corp. 5.5% 8/1/29 (d) | 3,395,000 | 3,471,388 | |
| Professional Services - 0.2% | |||
| ASGN, Inc. 4.625% 5/15/28 (d) | 870,000 | 908,297 | |
| Booz Allen Hamilton, Inc.: | |||
| 3.875% 9/1/28 (d) | 2,050,000 | 2,113,058 | |
| 4% 7/1/29 (d) | 1,070,000 | 1,108,788 | |
| CoreLogic, Inc. 4.5% 5/1/28 (d) | 1,250,000 | 1,246,825 | |
| Dun & Bradstreet Corp. 6.875% 8/15/26 (d) | 4,339,000 | 4,572,221 | |
| Science Applications Internati 4.875% 4/1/28 (d) | 2,095,000 | 2,187,997 | |
| TriNet Group, Inc. 3.5% 3/1/29 (d) | 2,400,000 | 2,418,000 | |
| 14,555,186 | |||
| Road & Rail - 0.2% | |||
| Avis Budget Car Rental LLC/Avis Budget Finance, Inc.: | |||
| 4.75% 4/1/28 (d) | 1,475,000 | 1,520,666 | |
| 5.75% 7/15/27 (d) | 1,450,000 | 1,509,813 | |
| Uber Technologies, Inc.: | |||
| 7.5% 5/15/25 (d) | 540,000 | 575,775 | |
| 7.5% 9/15/27 (d) | 3,635,000 | 3,962,150 | |
| Watco Companies LLC / Watco Finance Corp. 6.5% 6/15/27 (d) | 1,595,000 | 1,706,650 | |
| XPO Logistics, Inc. 6.25% 5/1/25 (d) | 710,000 | 749,938 | |
| 10,024,992 | |||
| Trading Companies & Distributors - 0.4% | |||
| Alta Equipment Group, Inc. 5.625% 4/15/26 (d) | 1,000,000 | 1,027,500 | |
| Fortress Transportation & Infrastructure Investors LLC 5.5% 5/1/28 (d) | 500,000 | 507,750 | |
| Foundation Building Materials, Inc. 6% 3/1/29 (d) | 1,625,000 | 1,601,925 | |
| H&E Equipment Services, Inc. 3.875% 12/15/28 (d) | 6,685,000 | 6,713,077 | |
| United Rentals North America, Inc.: | |||
| 3.75% 1/15/32 | 2,015,000 | 2,057,819 | |
| 3.875% 2/15/31 | 3,300,000 | 3,415,797 | |
| 4% 7/15/30 | 3,350,000 | 3,509,125 | |
| 4.875% 1/15/28 | 4,310,000 | 4,568,600 | |
| 5.25% 1/15/30 | 2,400,000 | 2,631,000 | |
| 26,032,593 | |||
| Transportation Infrastructure - 0.1% | |||
| First Student Bidco, Inc./First Transit Parent, Inc. 4% 7/31/29 (d) | 3,140,000 | 3,116,010 | |
| TOTAL INDUSTRIALS | 336,191,101 | ||
| INFORMATION TECHNOLOGY - 1.8% | |||
| Communications Equipment - 0.2% | |||
| Commscope Technologies LLC 6% 6/15/25 (d) | 1,040,000 | 1,057,680 | |
| CommScope, Inc. 6% 3/1/26 (d) | 2,823,000 | 2,961,892 | |
| Hughes Satellite Systems Corp. 6.625% 8/1/26 | 3,210,000 | 3,647,363 | |
| SSL Robotics LLC 9.75% 12/31/23 (d) | 1,581,000 | 1,723,290 | |
| ViaSat, Inc.: | |||
| 5.625% 9/15/25 (d) | 2,625,000 | 2,669,599 | |
| 5.625% 4/15/27 (d) | 1,155,000 | 1,198,313 | |
| 6.5% 7/15/28 (d) | 355,000 | 374,450 | |
| 13,632,587 | |||
| Electronic Equipment & Components - 0.1% | |||
| Brightstar Escrow Corp. 9.75% 10/15/25 (d) | 2,085,000 | 2,246,588 | |
| Sensata Technologies, Inc. 3.75% 2/15/31 (d) | 1,400,000 | 1,407,000 | |
| TTM Technologies, Inc. 4% 3/1/29 (d) | 5,135,000 | 5,199,188 | |
| 8,852,776 | |||
| IT Services - 0.8% | |||
| Acuris Finance U.S. 5% 5/1/28 (d) | 4,185,000 | 4,153,613 | |
| Alliance Data Systems Corp. 4.75% 12/15/24 (d) | 1,775,000 | 1,821,594 | |
| Arches Buyer, Inc.: | |||
| 4.25% 6/1/28 (d) | 3,110,000 | 3,160,538 | |
| 6.125% 12/1/28 (d) | 3,910,000 | 4,035,628 | |
| Banff Merger Sub, Inc. 9.75% 9/1/26 (d) | 9,062,000 | 9,503,773 | |
| CDW LLC/CDW Finance Corp. 3.25% 2/15/29 | 1,605,000 | 1,647,131 | |
| Gartner, Inc.: | |||
| 3.625% 6/15/29 (d) | 2,225,000 | 2,290,137 | |
| 3.75% 10/1/30 (d) | 1,520,000 | 1,590,528 | |
| 4.5% 7/1/28 (d) | 1,185,000 | 1,254,619 | |
| GCI LLC 4.75% 10/15/28 (d) | 850,000 | 891,438 | |
| Go Daddy Operating Co. LLC / GD Finance Co., Inc.: | |||
| 3.5% 3/1/29 (d) | 1,075,000 | 1,061,563 | |
| 5.25% 12/1/27 (d) | 735,000 | 774,837 | |
| Presidio Holdings, Inc.: | |||
| 4.875% 2/1/27 (d) | 660,000 | 683,100 | |
| 8.25% 2/1/28 (d) | 865,000 | 938,352 | |
| Rackspace Hosting, Inc.: | |||
| 3.5% 2/15/28 (d) | 2,275,000 | 2,184,000 | |
| 5.375% 12/1/28 (d) | 14,645,000 | 14,494,596 | |
| RP Crown Parent, LLC 7.375% 10/15/24 (d) | 600,000 | 611,064 | |
| Sabre GLBL, Inc.: | |||
| 7.375% 9/1/25 (d) | 660,000 | 697,950 | |
| 9.25% 4/15/25 (d) | 820,000 | 945,050 | |
| Tempo Acquisition LLC 5.75% 6/1/25 (d) | 1,505,000 | 1,587,474 | |
| Twilio, Inc. 3.875% 3/15/31 | 805,000 | 841,225 | |
| 55,168,210 | |||
| Semiconductors & Semiconductor Equipment - 0.0% | |||
| ON Semiconductor Corp. 3.875% 9/1/28 (d) | 810,000 | 851,075 | |
| Software - 0.6% | |||
| Ascend Learning LLC: | |||
| 6.875% 8/1/25 (d) | 1,535,000 | 1,559,944 | |
| 6.875% 8/1/25 (d) | 590,000 | 599,588 | |
| Black Knight InfoServ LLC 3.625% 9/1/28 (d) | 6,680,000 | 6,763,500 | |
| Boxer Parent Co., Inc.: | |||
| 6.5% 10/2/25 (d) | EUR | 210,000 | 260,380 |
| 7.125% 10/2/25 (d) | 3,605,000 | 3,858,972 | |
| 9.125% 3/1/26 (d) | 415,000 | 435,331 | |
| BY Crown Parent LLC / BY Bond Finance, Inc. 4.25% 1/31/26 (d) | 3,325,000 | 3,499,563 | |
| CDK Global, Inc. 5.25% 5/15/29 (d) | 1,105,000 | 1,201,378 | |
| Clarivate Science Holdings Corp.: | |||
| 3.875% 7/1/28 (d) | 2,505,000 | 2,549,389 | |
| 4.875% 7/1/29 (d) | 3,120,000 | 3,218,186 | |
| Crowdstrike Holdings, Inc. 3% 2/15/29 | 1,170,000 | 1,179,828 | |
| Elastic NV 4.125% 7/15/29 (d) | 2,225,000 | 2,259,421 | |
| Fair Isaac Corp. 5.25% 5/15/26 (d) | 1,225,000 | 1,398,080 | |
| ION Trading Technologies Ltd. 5.75% 5/15/28 (d) | 3,905,000 | 4,031,913 | |
| LogMeIn, Inc. 5.5% 9/1/27 (d) | 650,000 | 674,375 | |
| NortonLifeLock, Inc. 5% 4/15/25 (d) | 1,300,000 | 1,314,196 | |
| Open Text Corp.: | |||
| 3.875% 2/15/28 (d) | 800,000 | 835,000 | |
| 5.875% 6/1/26 (d) | 325,000 | 335,481 | |
| SS&C Technologies, Inc. 5.5% 9/30/27 (d) | 1,380,000 | 1,461,351 | |
| Veritas U.S., Inc./Veritas Bermuda Ltd. 7.5% 9/1/25 (d) | 1,285,000 | 1,336,027 | |
| 38,771,903 | |||
| Technology Hardware, Storage & Peripherals - 0.1% | |||
| NCR Corp.: | |||
| 5% 10/1/28 (d) | 675,000 | 698,625 | |
| 5.125% 4/15/29 (d) | 1,725,000 | 1,788,545 | |
| 5.25% 10/1/30 (d) | 1,805,000 | 1,886,225 | |
| 4,373,395 | |||
| TOTAL INFORMATION TECHNOLOGY | 121,649,946 | ||
| MATERIALS - 3.5% | |||
| Chemicals - 1.2% | |||
| Avient Corp. 5.75% 5/15/25 (d) | 100,000 | 105,550 | |
| Axalta Coating Systems LLC 3.375% 2/15/29 (d) | 1,095,000 | 1,073,100 | |
| Axalta Coating Systems/Dutch Holding BV 4.75% 6/15/27 (d) | 1,050,000 | 1,102,458 | |
| Consolidated Energy Finance SA: | |||
| 3 month U.S. LIBOR + 3.750% 3.8689% 6/15/22 (d)(f)(i) | 661,000 | 661,001 | |
| 6.5% 5/15/26 (d) | 3,205,000 | 3,245,063 | |
| 6.875% 6/15/25 (d) | 715,000 | 738,238 | |
| Cornerstone Chemical Co. 6.75% 8/15/24 (d) | 2,050,000 | 1,837,313 | |
| CVR Partners LP 6.125% 6/15/28 (d) | 1,265,000 | 1,293,463 | |
| Element Solutions, Inc. 3.875% 9/1/28 (d) | 47,000 | 47,940 | |
| Gpd Companies, Inc. 10.125% 4/1/26 (d) | 1,535,000 | 1,655,881 | |
| GrafTech Finance, Inc. 4.625% 12/15/28 (d) | 1,985,000 | 2,024,700 | |
| Hexion, Inc. 7.875% 7/15/27 (d) | 1,550,000 | 1,646,875 | |
| Ingevity Corp. 3.875% 11/1/28 (d) | 375,000 | 376,406 | |
| Kraton Polymers LLC/Kraton Polymers Capital Corp. 5.25% 5/15/26 (d) | EUR | 360,000 | 436,419 |
| Kronos Acquisition Holdings, Inc. / KIK Custom Products, Inc.: | |||
| 5% 12/31/26 (d) | 3,450,000 | 3,432,750 | |
| 7% 12/31/27 (d) | 2,160,000 | 2,100,600 | |
| Methanex Corp.: | |||
| 5.125% 10/15/27 | 3,661,000 | 3,985,914 | |
| 5.25% 12/15/29 | 1,383,000 | 1,508,618 | |
| 5.65% 12/1/44 | 2,787,000 | 3,031,643 | |
| NOVA Chemicals Corp.: | |||
| 4.25% 5/15/29 (d) | 1,215,000 | 1,221,075 | |
| 4.875% 6/1/24 (d) | 800,000 | 846,000 | |
| 5.25% 6/1/27 (d) | 3,875,000 | 4,140,166 | |
| OCI NV 4.625% 10/15/25 (d) | 1,240,000 | 1,298,280 | |
| Olin Corp. 5% 2/1/30 | 1,330,000 | 1,427,449 | |
| Rain CII Carbon LLC/CII Carbon Corp. 7.25% 4/1/25 (d) | 2,075,000 | 2,145,529 | |
| SCIH Salt Holdings, Inc.: | |||
| 4.875% 5/1/28 (d) | 1,600,000 | 1,611,680 | |
| 6.625% 5/1/29 (d) | 575,000 | 565,484 | |
| The Chemours Co. LLC: | |||
| 4.625% 11/15/29 (d) | 2,815,000 | 2,795,351 | |
| 5.375% 5/15/27 | 1,300,000 | 1,411,826 | |
| 5.75% 11/15/28 (d) | 9,695,000 | 10,276,700 | |
| The Scotts Miracle-Gro Co.: | |||
| 4% 4/1/31 (d) | 1,275,000 | 1,278,188 | |
| 4.375% 2/1/32 (d) | 650,000 | 659,120 | |
| 4.5% 10/15/29 | 1,555,000 | 1,624,975 | |
| TPC Group, Inc.: | |||
| 10.5% 8/1/24 (d) | 4,960,000 | 4,588,000 | |
| 10.875% 8/1/24 (d) | 911,763 | 957,351 | |
| Tronox, Inc.: | |||
| 4.625% 3/15/29 (d) | 4,040,000 | 4,096,358 | |
| 6.5% 5/1/25 (d) | 2,075,000 | 2,189,125 | |
| Univar Solutions U.S.A., Inc. 5.125% 12/1/27 (d) | 1,510,000 | 1,577,950 | |
| Valvoline, Inc.: | |||
| 3.625% 6/15/31 (d) | 750,000 | 746,250 | |
| 4.25% 2/15/30 (d) | 1,389,000 | 1,441,088 | |
| W. R. Grace & Co.-Conn. 4.875% 6/15/27 (d) | 1,195,000 | 1,239,813 | |
| W.R. Grace Holding LLC 5.625% 8/15/29 (d) | 4,050,000 | 4,217,063 | |
| 82,658,753 | |||
| Construction Materials - 0.2% | |||
| CEMEX S.A.B. de CV 5.45% 11/19/29 (d) | 200,000 | 219,100 | |
| SRM Escrow Issuer LLC 6% 11/1/28 (d) | 3,950,000 | 4,187,000 | |
| Summit Materials LLC/Summit Materials Finance Corp.: | |||
| 5.25% 1/15/29 (d) | 2,230,000 | 2,361,013 | |
| 6.5% 3/15/27 (d) | 2,375,000 | 2,493,750 | |
| U.S. Concrete, Inc. 5.125% 3/1/29 (d) | 2,750,000 | 3,005,523 | |
| White Cap Buyer LLC 6.875% 10/15/28 (d) | 1,270,000 | 1,350,963 | |
| 13,617,349 | |||
| Containers & Packaging - 0.6% | |||
| ARD Finance SA 6.5% 6/30/27 pay-in-kind (d)(f) | 3,805,000 | 4,007,350 | |
| Ardagh Metal Packaging Finance U.S.A. LLC/Ardagh Metal Packaging Finance PLC 4% 9/1/29 (d) | 5,060,000 | 5,157,405 | |
| Ardagh Packaging Finance PLC/Ardagh MP Holdings U.S.A., Inc.: | |||
| 4.125% 8/15/26 (d) | 605,000 | 629,019 | |
| 5.25% 4/30/25 (d) | 440,000 | 460,350 | |
| 5.25% 8/15/27 (d) | 2,959,000 | 3,062,565 | |
| 5.25% 8/15/27 (d) | 3,065,000 | 3,172,275 | |
| BWAY Holding Co.: | |||
| 7.25% 4/15/25 (d) | 885,000 | 874,867 | |
| 8.5% 4/15/24 (d) | 400,000 | 413,000 | |
| Flex Acquisition Co., Inc. 6.875% 1/15/25 (d) | 3,509,000 | 3,548,476 | |
| Graham Packaging Co., Inc. 7.125% 8/15/28 (d) | 320,000 | 341,123 | |
| Intelligent Packaging Holdco I 9% 1/15/26 pay-in-kind (d)(f) | 1,016,000 | 1,056,640 | |
| Intelligent Packaging Ltd. Finco, Inc. 6% 9/15/28 (d) | 1,287,000 | 1,344,915 | |
| Intertape Polymer Group, Inc. 4.375% 6/15/29 (d) | 2,070,000 | 2,112,207 | |
| Owens-Brockway Glass Container, Inc.: | |||
| 6.375% 8/15/25 (d) | 650,000 | 725,563 | |
| 6.625% 5/13/27 (d) | 1,775,000 | 1,914,480 | |
| Pactiv LLC: | |||
| 7.95% 12/15/25 | 690,000 | 783,150 | |
| 8.375% 4/15/27 | 175,000 | 202,125 | |
| Trivium Packaging Finance BV: | |||
| 5.5% 8/15/26 (d) | 3,339,000 | 3,518,238 | |
| 8.5% 8/15/27 (d) | 3,297,000 | 3,547,572 | |
| 36,871,320 | |||
| Metals & Mining - 1.4% | |||
| Alcoa Nederland Holding BV: | |||
| 5.5% 12/15/27 (d) | 1,340,000 | 1,442,175 | |
| 6.125% 5/15/28 (d) | 940,000 | 1,022,250 | |
| 7% 9/30/26 (d) | 2,010,000 | 2,100,068 | |
| Allegheny Technologies, Inc. 5.875% 12/1/27 | 4,835,000 | 5,070,706 | |
| Arconic Corp.: | |||
| 6% 5/15/25 (d) | 525,000 | 555,739 | |
| 6.125% 2/15/28 (d) | 1,550,000 | 1,656,857 | |
| Big River Steel LLC/BRS Finance Corp. 6.625% 1/31/29 (d) | 3,911,000 | 4,253,213 | |
| Cleveland-Cliffs, Inc. 9.875% 10/17/25 (d) | 453,000 | 525,480 | |
| Compass Minerals International, Inc. 6.75% 12/1/27 (d) | 690,000 | 730,538 | |
| Constellium NV: | |||
| 3.75% 4/15/29 (d) | 975,000 | 969,833 | |
| 5.875% 2/15/26 (d) | 1,500,000 | 1,539,450 | |
| Eldorado Gold Corp.: | |||
| 6.25% 9/1/29 (d) | 2,850,000 | 2,878,500 | |
| 9.5% 6/1/24 (d) | 2,864,000 | 3,140,555 | |
| First Quantum Minerals Ltd.: | |||
| 6.5% 3/1/24 (d) | 2,185,000 | 2,227,608 | |
| 6.875% 3/1/26 (d) | 2,545,000 | 2,637,958 | |
| 6.875% 10/15/27 (d) | 4,470,000 | 4,816,425 | |
| 7.25% 4/1/23 (d) | 8,950,000 | 9,101,031 | |
| 7.5% 4/1/25 (d) | 1,081,000 | 1,123,902 | |
| FMG Resources (August 2006) Pty Ltd.: | |||
| 4.375% 4/1/31 (d) | 1,955,000 | 2,105,731 | |
| 4.5% 9/15/27 (d) | 20,000 | 21,700 | |
| 5.125% 5/15/24 (d) | 1,260,000 | 1,355,256 | |
| Freeport-McMoRan, Inc.: | |||
| 4.375% 8/1/28 | 1,175,000 | 1,245,500 | |
| 4.55% 11/14/24 | 1,800,000 | 1,948,500 | |
| 4.625% 8/1/30 | 1,195,000 | 1,315,994 | |
| 5% 9/1/27 | 570,000 | 599,925 | |
| 5.25% 9/1/29 | 585,000 | 647,420 | |
| 5.4% 11/14/34 | 2,215,000 | 2,777,488 | |
| 5.45% 3/15/43 | 2,840,000 | 3,631,451 | |
| Hecla Mining Co. 7.25% 2/15/28 | 4,830,000 | 5,228,427 | |
| HudBay Minerals, Inc.: | |||
| 4.5% 4/1/26 (d) | 2,155,000 | 2,166,206 | |
| 6.125% 4/1/29 (d) | 3,619,000 | 3,890,425 | |
| IAMGOLD Corp. 5.75% 10/15/28 (d) | 2,275,000 | 2,253,672 | |
| Joseph T. Ryerson & Son, Inc. 8.5% 8/1/28 (d) | 930,000 | 1,036,922 | |
| Kaiser Aluminum Corp.: | |||
| 4.5% 6/1/31 (d) | 1,875,000 | 1,942,969 | |
| 4.625% 3/1/28 (d) | 1,814,000 | 1,882,025 | |
| New Gold, Inc.: | |||
| 6.375% 5/15/25 (d) | 1,623,000 | 1,673,719 | |
| 7.5% 7/15/27 (d) | 4,195,000 | 4,404,750 | |
| Novelis Corp. 4.75% 1/30/30 (d) | 2,085,000 | 2,220,525 | |
| TMS International Corp. 6.25% 4/15/29 (d) | 675,000 | 707,535 | |
| United States Steel Corp. 6.875% 3/1/29 | 2,540,000 | 2,774,950 | |
| 91,623,378 | |||
| Paper & Forest Products - 0.1% | |||
| Mercer International, Inc.: | |||
| 5.125% 2/1/29 | 870,000 | 876,682 | |
| 5.5% 1/15/26 | 160,000 | 163,168 | |
| SPA Holdings 3 OY 4.875% 2/4/28 (d) | 2,755,000 | 2,775,663 | |
| 3,815,513 | |||
| TOTAL MATERIALS | 228,586,313 | ||
| REAL ESTATE - 2.0% | |||
| Equity Real Estate Investment Trusts (REITs) - 1.1% | |||
| CTR Partnership LP/CareTrust Capital Corp. 3.875% 6/30/28 (d) | 1,200,000 | 1,233,000 | |
| MGM Growth Properties Operating Partnership LP: | |||
| 3.875% 2/15/29 (d) | 950,000 | 1,007,000 | |
| 4.5% 1/15/28 | 2,400,000 | 2,634,000 | |
| 4.625% 6/15/25 (d) | 140,000 | 150,472 | |
| 5.75% 2/1/27 | 660,000 | 759,752 | |
| MPT Operating Partnership LP/MPT Finance Corp.: | |||
| 4.625% 8/1/29 | 300,000 | 320,750 | |
| 5% 10/15/27 | 4,214,000 | 4,461,573 | |
| Park Intermediate Holdings LLC: | |||
| 4.875% 5/15/29 (d) | 1,005,000 | 1,035,150 | |
| 5.875% 10/1/28 (d) | 665,000 | 708,225 | |
| 7.5% 6/1/25 (d) | 5,234,000 | 5,600,380 | |
| RHP Hotel Properties LP/RHP Finance Corp. 4.5% 2/15/29 (d) | 650,000 | 658,125 | |
| RLJ Lodging Trust LP 3.75% 7/1/26 (d) | 635,000 | 640,556 | |
| SBA Communications Corp. 4.875% 9/1/24 | 1,425,000 | 1,446,375 | |
| Senior Housing Properties Trust: | |||
| 4.375% 3/1/31 | 2,050,000 | 2,011,563 | |
| 4.75% 5/1/24 | 1,375,000 | 1,418,154 | |
| 4.75% 2/15/28 | 1,650,000 | 1,670,625 | |
| 9.75% 6/15/25 | 3,955,000 | 4,350,500 | |
| The GEO Group, Inc. 6% 4/15/26 | 650,000 | 549,250 | |
| Uniti Group LP / Uniti Group Finance, Inc.: | |||
| 4.75% 4/15/28 (d) | 6,775,000 | 6,918,969 | |
| 6.5% 2/15/29 (d) | 16,120,000 | 16,799,942 | |
| Uniti Group, Inc.: | |||
| 7.125% 12/15/24 (d) | 3,000,000 | 3,085,500 | |
| 7.875% 2/15/25 (d) | 10,830,000 | 11,574,563 | |
| VICI Properties, Inc.: | |||
| 4.125% 8/15/30 (d) | 1,225,000 | 1,307,688 | |
| 4.25% 12/1/26 (d) | 575,000 | 603,990 | |
| 4.625% 12/1/29 (d) | 3,296,000 | 3,584,400 | |
| XHR LP 4.875% 6/1/29 (d) | 505,000 | 520,150 | |
| 75,050,652 | |||
| Real Estate Management & Development - 0.9% | |||
| DTZ U.S. Borrower LLC 6.75% 5/15/28 (d) | 3,765,000 | 4,077,156 | |
| Five Point Operation Co. LP 7.875% 11/15/25 (d) | 4,919,000 | 5,144,536 | |
| Forestar Group, Inc.: | |||
| 3.85% 5/15/26 (d) | 1,850,000 | 1,866,188 | |
| 5% 3/1/28 (d) | 1,677,000 | 1,731,503 | |
| Greystar Real Estate Partners 5.75% 12/1/25 (d) | 2,771,000 | 2,833,348 | |
| Howard Hughes Corp.: | |||
| 4.125% 2/1/29 (d) | 3,440,000 | 3,457,200 | |
| 4.375% 2/1/31 (d) | 2,980,000 | 3,006,075 | |
| 5.375% 8/1/28 (d) | 3,990,000 | 4,229,400 | |
| Hunt Companies, Inc. 5.25% 4/15/29 (d) | 4,075,000 | 3,993,500 | |
| Kennedy-Wilson, Inc. 4.75% 2/1/30 | 2,790,000 | 2,863,572 | |
| Mattamy Group Corp.: | |||
| 4.625% 3/1/30 (d) | 2,675,000 | 2,741,875 | |
| 5.25% 12/15/27 (d) | 2,050,000 | 2,137,125 | |
| Realogy Group LLC/Realogy Co-Issuer Corp.: | |||
| 5.75% 1/15/29 (d) | 2,865,000 | 2,998,366 | |
| 7.625% 6/15/25 (d) | 255,000 | 274,559 | |
| 9.375% 4/1/27 (d) | 975,000 | 1,076,156 | |
| Shimao Property Holdings Ltd. 5.6% 7/15/26 (Reg. S) | 800,000 | 833,400 | |
| Taylor Morrison Communities, Inc./Monarch Communities, Inc.: | |||
| 5.125% 8/1/30 (d) | 3,758,000 | 4,111,177 | |
| 5.75% 1/15/28 (d) | 4,020,000 | 4,532,550 | |
| 5.875% 6/15/27 (d) | 1,725,000 | 1,953,563 | |
| 6.625% 7/15/27 (d) | 2,498,000 | 2,663,493 | |
| Weekley Homes LLC/Weekley Finance Corp. 4.875% 9/15/28 (d) | 280,000 | 290,150 | |
| WeWork Companies, Inc. 7.875% 5/1/25 (d) | 865,000 | 852,025 | |
| 57,666,917 | |||
| TOTAL REAL ESTATE | 132,717,569 | ||
| UTILITIES - 1.7% | |||
| Electric Utilities - 1.1% | |||
| Clearway Energy Operating LLC: | |||
| 3.75% 2/15/31 (d) | 2,550,000 | 2,591,042 | |
| 4.75% 3/15/28 (d) | 265,000 | 280,556 | |
| FirstEnergy Corp. 7.375% 11/15/31 | 600,000 | 837,978 | |
| NextEra Energy Partners LP: | |||
| 4.25% 9/15/24 (d) | 110,000 | 115,775 | |
| 4.5% 9/15/27 (d) | 1,025,000 | 1,104,438 | |
| NRG Energy, Inc.: | |||
| 3.375% 2/15/29 (d) | 2,045,000 | 2,055,225 | |
| 3.625% 2/15/31 (d) | 2,255,000 | 2,294,463 | |
| 3.875% 2/15/32 (d) | 1,050,000 | 1,064,648 | |
| 5.25% 6/15/29 (d) | 3,872,000 | 4,203,830 | |
| 5.75% 1/15/28 | 325,000 | 347,344 | |
| 6.625% 1/15/27 | 4,191,000 | 4,346,989 | |
| NSG Holdings II LLC/NSG Holdings, Inc. 7.75% 12/15/25 (d) | 1,061,350 | 1,143,604 | |
| Pacific Gas & Electric Co. 4.55% 7/1/30 | 1,640,000 | 1,745,048 | |
| Pattern Energy Operations LP 4.5% 8/15/28 (d) | 220,000 | 229,902 | |
| PG&E Corp.: | |||
| 5% 7/1/28 | 7,966,000 | 7,906,255 | |
| 5.25% 7/1/30 | 14,010,000 | 13,799,850 | |
| Vistra Operations Co. LLC: | |||
| 4.375% 5/1/29 (d) | 6,455,000 | 6,551,825 | |
| 5% 7/31/27 (d) | 4,953,000 | 5,139,233 | |
| 5.5% 9/1/26 (d) | 3,295,000 | 3,389,072 | |
| 5.625% 2/15/27 (d) | 9,542,000 | 9,936,180 | |
| 69,083,257 | |||
| Gas Utilities - 0.2% | |||
| AmeriGas Partners LP/AmeriGas Finance Corp.: | |||
| 5.5% 5/20/25 | 2,190,000 | 2,406,263 | |
| 5.625% 5/20/24 | 1,464,000 | 1,601,250 | |
| 5.75% 5/20/27 | 2,655,000 | 2,986,875 | |
| 5.875% 8/20/26 | 3,750,000 | 4,218,750 | |
| Suburban Propane Partners LP/Suburban Energy Finance Corp. 5.875% 3/1/27 | 1,915,000 | 1,998,781 | |
| Superior Plus LP / Superior General Partner, Inc. 4.5% 3/15/29 (d) | 1,455,000 | 1,507,089 | |
| 14,719,008 | |||
| Independent Power and Renewable Electricity Producers - 0.4% | |||
| Atlantica Sustainable Infrastructure PLC 4.125% 6/15/28 (d) | 625,000 | 655,125 | |
| Calpine Corp.: | |||
| 4.5% 2/15/28 (d) | 2,857,000 | 2,942,710 | |
| 4.625% 2/1/29 (d) | 425,000 | 426,371 | |
| 5% 2/1/31 (d) | 6,590,000 | 6,705,325 | |
| 5.125% 3/15/28 (d) | 14,913,000 | 15,173,978 | |
| 5.25% 6/1/26 (d) | 396,000 | 408,375 | |
| TerraForm Global, Inc. 6.125% 3/1/26 (d) | 1,180,000 | 1,213,925 | |
| 27,525,809 | |||
| Water Utilities - 0.0% | |||
| Solaris Midstream Holdings LLC 7.625% 4/1/26 (d) | 825,000 | 874,574 | |
| TOTAL UTILITIES | 112,202,648 | ||
| TOTAL NONCONVERTIBLE BONDS | 2,764,590,127 | ||
| TOTAL CORPORATE BONDS | |||
| (Cost $2,672,042,041) | 2,769,956,460 | ||
| Municipal Securities - 0.1% | |||
| Puerto Rico Commonwealth Pub. Impt. Gen. Oblig.: | |||
| Series 2006 E, 5.25% 7/1/25 | $640,000 | $602,400 | |
| Series 2011 E, 5.5% 7/1/31 | 450,000 | 419,625 | |
| Series 2012 A, 5.25% 7/1/23 | 250,000 | 223,750 | |
| Series 2014 A, 8% 7/1/35 | 3,610,000 | 3,009,838 | |
| TOTAL MUNICIPAL SECURITIES | |||
| (Cost $4,027,176) | 4,255,613 | ||
| Shares | Value | ||
| Common Stocks - 0.4% | |||
| COMMUNICATION SERVICES - 0.1% | |||
| Media - 0.0% | |||
| Liberty Broadband Corp. Class C (j) | 5,000 | $956,600 | |
| Wireless Telecommunication Services - 0.1% | |||
| T-Mobile U.S., Inc. (j) | 16,000 | 2,192,320 | |
| TOTAL COMMUNICATION SERVICES | 3,148,920 | ||
| CONSUMER DISCRETIONARY - 0.0% | |||
| Hotels, Restaurants & Leisure - 0.0% | |||
| CEC Brands LLC warrants 12/30/25 (c)(j) | 18,027 | 0 | |
| ENERGY - 0.2% | |||
| Energy Equipment & Services - 0.0% | |||
| Jonah Energy Parent LLC (c) | 29,131 | 1,345,852 | |
| Oil, Gas & Consumable Fuels - 0.2% | |||
| Chesapeake Energy Corp. | 112,011 | 6,251,334 | |
| Chesapeake Energy Corp. (b) | 644 | 35,942 | |
| Extraction Oil & Gas, Inc. (j) | 40,857 | 1,860,219 | |
| Mesquite Energy, Inc. (c)(j) | 46,770 | 1,610,771 | |
| 9,758,266 | |||
| TOTAL ENERGY | 11,104,118 | ||
| MATERIALS - 0.0% | |||
| Metals & Mining - 0.0% | |||
| Constellium NV (j) | 90,000 | 1,819,800 | |
| UTILITIES - 0.1% | |||
| Gas Utilities - 0.1% | |||
| Ferrellgas Partners LP Class B (j) | 23,547 | 5,804,336 | |
| Independent Power and Renewable Electricity Producers - 0.0% | |||
| Vistra Corp. | 93,700 | 1,788,733 | |
| Multi-Utilities - 0.0% | |||
| Sempra Energy | 5,000 | 661,800 | |
| TOTAL UTILITIES | 8,254,869 | ||
| TOTAL COMMON STOCKS | |||
| (Cost $14,784,944) | 24,327,707 | ||
| Convertible Preferred Stocks - 0.2% | |||
| HEALTH CARE - 0.1% | |||
| Health Care Equipment & Supplies - 0.0% | |||
| Danaher Corp. Series B, 5.00% | 1,525 | 2,618,425 | |
| Life Sciences Tools & Services - 0.1% | |||
| Avantor, Inc. Series A, 6.25% | 29,155 | 3,529,213 | |
| TOTAL HEALTH CARE | 6,147,638 | ||
| UTILITIES - 0.1% | |||
| Electric Utilities - 0.1% | |||
| American Electric Power Co., Inc.: | |||
| 6.125% | 23,550 | 1,250,333 | |
| 6.125% | 25,550 | 1,301,006 | |
| NextEra Energy, Inc. 5.279% | 58,200 | 3,106,716 | |
| Southern Co. 6.75% | 33,100 | 1,752,645 | |
| 7,410,700 | |||
| TOTAL CONVERTIBLE PREFERRED STOCKS | |||
| (Cost $11,092,609) | 13,558,338 | ||
| Principal Amount(a) | Value | ||
| Bank Loan Obligations - 3.2% | |||
| COMMUNICATION SERVICES - 0.4% | |||
| Diversified Telecommunication Services - 0.1% | |||
| Altice France SA Tranche B 13LN, term loan 3 month U.S. LIBOR + 4.000% 4.1248% 8/14/26 (f)(i)(k) | 1,674,289 | 1,668,010 | |
| Iridium Satellite LLC 1LN, term loan 3 month U.S. LIBOR + 3.750% 4.75% 11/4/26 (f)(i)(k) | 3,243,618 | 3,236,515 | |
| Northwest Fiber LLC Tranche B 1LN, term loan 3 month U.S. LIBOR + 3.750% 3.8466% 4/30/27 (f)(i)(k) | 1,730,663 | 1,727,201 | |
| 6,631,726 | |||
| Media - 0.0% | |||
| Diamond Sports Group LLC Tranche B 1LN, term loan 3 month U.S. LIBOR + 3.250% 3.34% 8/24/26 (f)(i)(k) | 2,093,426 | 1,302,279 | |
| iHeartCommunications, Inc. 1LN, term loan 3 month U.S. LIBOR + 3.000% 3.0846% 5/1/26 (f)(i)(k) | 665,323 | 659,089 | |
| WideOpenWest Finance LLC Tranche B, term loan 3 month U.S. LIBOR + 3.250% 4.25% 8/19/23 (f)(i)(k) | 1,435,346 | 1,432,274 | |
| 3,393,642 | |||
| Wireless Telecommunication Services - 0.3% | |||
| CCI Buyer, Inc. Tranche B 1LN, term loan 3 month U.S. LIBOR + 4.000% 4.75% 12/17/27 (f)(i)(k) | 1,002,488 | 1,004,372 | |
| Crown Subsea Communications Holding, Inc. Tranche B 1LN, term loan 1 month U.S. LIBOR + 5.000% 5.75% 4/20/27 (f)(i)(k) | 1,504,705 | 1,512,861 | |
| Intelsat Jackson Holdings SA: | |||
| Tranche B, term loan 3 month U.S. LIBOR + 3.750% 8% 11/27/23 (f)(i)(k) | 5,965,000 | 6,050,777 | |
| Tranche B-4, term loan 3 month U.S. LIBOR + 5.500% 8.75% 1/2/24 (f)(i)(k) | 3,131,000 | 3,182,849 | |
| Tranche B-5, term loan 8.625% 1/2/24 (k) | 1,549,000 | 1,573,443 | |
| Tranche DD 1LN, term loan 3 month U.S. LIBOR + 5.500% 6.5% 7/13/22 (f)(i)(k) | 1,345,082 | 1,350,543 | |
| Xplornet Communications, Inc. 1LN, term loan 3 month U.S. LIBOR + 4.750% 4.8346% 6/10/27 (f)(i)(k) | 4,309,229 | 4,300,008 | |
| 18,974,853 | |||
| TOTAL COMMUNICATION SERVICES | 29,000,221 | ||
| CONSUMER DISCRETIONARY - 0.3% | |||
| Auto Components - 0.0% | |||
| Clarios Global LP Tranche B 1LN, term loan 3 month U.S. LIBOR + 3.250% 3.3346% 4/30/26 (f)(i)(k) | 390,079 | 385,527 | |
| Hotels, Restaurants & Leisure - 0.3% | |||
| City Football Group Ltd. Tranche B 1LN, term loan 1 month U.S. LIBOR + 3.500% 4% 7/21/28 (f)(i)(k) | 3,140,000 | 3,120,375 | |
| Golden Entertainment, Inc. Tranche B, term loan 3 month U.S. LIBOR + 3.000% 3.75% 10/20/24 (f)(i)(k) | 3,860,337 | 3,826,559 | |
| Golden Nugget LLC Tranche B 1LN, term loan 3 month U.S. LIBOR + 2.500% 3.25% 10/4/23 (f)(i)(k) | 5,192,508 | 5,155,538 | |
| Life Time, Inc. Tranche B 1LN, term loan 3 month U.S. LIBOR + 4.750% 5.75% 12/15/24 (f)(i)(k) | 2,464,930 | 2,450,904 | |
| Scientific Games Corp. Tranche B 5LN, term loan 3 month U.S. LIBOR + 2.750% 2.8346% 8/14/24 (f)(i)(k) | 1,696,846 | 1,680,641 | |
| 16,234,017 | |||
| Internet & Direct Marketing Retail - 0.0% | |||
| Bass Pro Group LLC Tranche B 1LN, term loan 3 month U.S. LIBOR + 4.250% 5% 3/5/28 (f)(i)(k) | 1,567,125 | 1,572,344 | |
| Specialty Retail - 0.0% | |||
| Mavis Tire Express Services TopCo LP 1LN, term loan 3 month U.S. LIBOR + 4.000% 5/4/28 (i)(k)(l) | 1,235,000 | 1,234,308 | |
| TOTAL CONSUMER DISCRETIONARY | 19,426,196 | ||
| CONSUMER STAPLES - 0.0% | |||
| Food & Staples Retailing - 0.0% | |||
| Kouti BV Tranche B 1LN, term loan 3 month EURIBOR + 3.750% 7/1/28 (i)(k)(l) | EUR | 510,000 | 600,225 |
| Food Products - 0.0% | |||
| BellRing Brands LLC Tranche B 1LN, term loan 3 month U.S. LIBOR + 4.000% 4.75% 10/21/24 (f)(i)(k) | 895,336 | 897,717 | |
| TOTAL CONSUMER STAPLES | 1,497,942 | ||
| ENERGY - 0.2% | |||
| Oil, Gas & Consumable Fuels - 0.2% | |||
| Ascent Resources - Utica LLC/ARU Finance Corp. 2LN, term loan 3 month U.S. LIBOR + 9.000% 11/1/25 (i)(k)(l) | 3,503,000 | 3,789,090 | |
| BCP Raptor LLC Tranche B, term loan 3 month U.S. LIBOR + 4.250% 5.25% 6/24/24 (f)(i)(k) | 5,950,544 | 5,892,704 | |
| Citgo Holding, Inc. Tranche B 1LN, term loan 3 month U.S. LIBOR + 7.000% 8% 8/1/23 (f)(i)(k) | 369,361 | 363,266 | |
| Citgo Petroleum Corp. Tranche B 1LN, term loan 3 month U.S. LIBOR + 6.250% 7.25% 3/28/24 (f)(i)(k) | 673,379 | 673,588 | |
| EG America LLC Tranche B 1LN, term loan: | |||
| 3 month U.S. LIBOR + 4.000% 4.1473% 2/6/25 (f)(i)(k) | 1,665,698 | 1,653,472 | |
| 3 month U.S. LIBOR + 4.250% 4.75% 3/10/26 (f)(i)(k) | 865,565 | 862,969 | |
| EG Finco Ltd. Tranche B, term loan 3 month U.S. LIBOR + 4.000% 4.1473% 2/6/25 (f)(i)(k) | 1,112,126 | 1,103,963 | |
| Mesquite Energy, Inc.: | |||
| 1LN, term loan 3 month U.S. LIBOR + 8.000% 0% (c)(g)(i)(k) | 864,602 | 0 | |
| term loan 3 month U.S. LIBOR + 0.000% 0% (c)(g)(i)(k) | 373,000 | 0 | |
| Prairie ECI Acquiror LP 1LN, term loan 3 month U.S. LIBOR + 4.750% 3/11/26 (i)(k)(l) | 765,000 | 738,225 | |
| Stonepeak Lonestar Holdings LLC Tranche B 1LN, term loan 3 month U.S. LIBOR + 4.500% 4.7178% 10/19/26 (f)(i)(k) | 828,251 | 830,148 | |
| 15,907,425 | |||
| FINANCIALS - 0.5% | |||
| Insurance - 0.5% | |||
| Alliant Holdings Intermediate LLC Tranche B3 1LN, term loan 3 month U.S. LIBOR + 3.750% 4.25% 11/5/27 (f)(i)(k) | 2,589,553 | 2,589,242 | |
| Asurion LLC: | |||
| Tranche B3 2LN, term loan 3 month U.S. LIBOR + 5.250% 5.3346% 1/31/28 (f)(i)(k) | 7,288,677 | 7,249,610 | |
| Tranche B4 2LN, term loan 1 month U.S. LIBOR + 5.250% 5.3346% 1/20/29 (f)(i)(k) | 13,930,000 | 13,851,713 | |
| Tranche B8 1LN, term loan 3 month U.S. LIBOR + 3.250% 3.3346% 12/23/26 (f)(i)(k) | 2,293,475 | 2,247,972 | |
| Tranche B9 1LN, term loan 3 month U.S. LIBOR + 3.250% 3.3346% 7/31/27 (f)(i)(k) | 2,219,438 | 2,174,583 | |
| HUB International Ltd. Tranche B, term loan 3 month U.S. LIBOR + 2.750% 2.8752% 4/25/25 (f)(i)(k) | 2,956,918 | 2,921,672 | |
| 31,034,792 | |||
| HEALTH CARE - 0.2% | |||
| Health Care Equipment & Supplies - 0.0% | |||
| Insulet Corp. Tranche B 1LN, term loan 1 month U.S. LIBOR + 3.250% 3.75% 5/4/28 (f)(i)(k) | 220,000 | 219,725 | |
| Health Care Providers & Services - 0.2% | |||
| ADMI Corp. Tranche B 1LN, term loan 3 month U.S. LIBOR + 4.000% 12/23/27 (i)(k)(l) | 2,001,775 | 1,972,169 | |
| Gainwell Acquisition Corp. Tranche B 1LN, term loan 3 month U.S. LIBOR + 4.000% 4.75% 10/1/27 (f)(i)(k) | 7,745,539 | 7,764,903 | |
| RegionalCare Hospital Partners Holdings, Inc. Tranche B, term loan 3 month U.S. LIBOR + 3.750% 3.8346% 11/16/25 (f)(i)(k) | 1,397,609 | 1,386,973 | |
| U.S. Radiology Specialists, Inc. Tranche B 1LN, term loan 3 month U.S. LIBOR + 5.500% 6.25% 12/15/27 (f)(i)(k) | 1,044,750 | 1,048,344 | |
| U.S. Renal Care, Inc. Tranche B 1LN, term loan 3 month U.S. LIBOR + 5.000% 5.125% 6/13/26 (f)(i)(k) | 2,395,092 | 2,393,798 | |
| 14,566,187 | |||
| Pharmaceuticals - 0.0% | |||
| Jazz Financing Lux SARL Tranche B 1LN, term loan 1 month U.S. LIBOR + 3.500% 4% 5/5/28 (f)(i)(k) | 560,000 | 560,000 | |
| TOTAL HEALTH CARE | 15,345,912 | ||
| INDUSTRIALS - 0.5% | |||
| Air Freight & Logistics - 0.0% | |||
| Dynasty Acquisition Co., Inc. Tranche B 1LN, term loan 3 month U.S. LIBOR + 3.500% 3.6473% 4/8/26 (f)(i)(k) | 1,483,674 | 1,442,636 | |
| Airlines - 0.2% | |||
| AAdvantage Loyalty IP Ltd. Tranche B 1LN, term loan 3 month U.S. LIBOR + 4.750% 5.5% 4/20/28 (f)(i)(k) | 3,550,000 | 3,653,163 | |
| Mileage Plus Holdings LLC Tranche B 1LN, term loan 3 month U.S. LIBOR + 5.250% 6.25% 7/2/27 (f)(i)(k) | 3,420,000 | 3,625,200 | |
| SkyMiles IP Ltd. Tranche B 1LN, term loan 3 month U.S. LIBOR + 3.750% 4.75% 10/20/27 (f)(i)(k) | 2,060,000 | 2,183,209 | |
| United Airlines, Inc. Tranche B 1LN, term loan 3 month U.S. LIBOR + 3.750% 4.5% 4/21/28 (f)(i)(k) | 5,521,163 | 5,526,794 | |
| 14,988,366 | |||
| Commercial Services & Supplies - 0.1% | |||
| Allied Universal Holdco LLC Tranche B 1LN, term loan 1 month U.S. LIBOR + 3.750% 4.25% 5/14/28 (f)(i)(k) | 970,000 | 969,593 | |
| Brand Energy & Infrastructure Services, Inc. Tranche B, term loan 3 month U.S. LIBOR + 4.250% 5.25% 6/21/24 (f)(i)(k) | 1,430,400 | 1,410,331 | |
| CoreCivic, Inc. Tranche B 1LN, term loan 3 month U.S. LIBOR + 4.500% 5.5% 12/18/24 (f)(i)(k) | 284,161 | 281,084 | |
| Intrado Corp. Tranche B 1LN, term loan 3 month U.S. LIBOR + 4.000% 5.5678% 10/10/24 (f)(i)(k) | 5,259,089 | 5,078,019 | |
| 7,739,027 | |||
| Construction & Engineering - 0.0% | |||
| Landry's Finance Acquisition Co. Tranche B 1LN, term loan 3 month U.S. LIBOR + 12.000% 13% 10/4/23 (f)(i)(k) | 35,863 | 38,732 | |
| Machinery - 0.1% | |||
| Apex Tool Group, LLC Tranche B 1LN, term loan 3 month U.S. LIBOR + 5.500% 8/21/24 (i)(k)(l) | 2,816,903 | 2,820,114 | |
| Professional Services - 0.1% | |||
| CoreLogic, Inc. 2LN, term loan 0% 4/13/29 (f)(k) | 755,000 | 764,438 | |
| Dun & Bradstreet Corp. Tranche B 1LN, term loan 3 month U.S. LIBOR + 4.000% 2/8/26 (i)(k)(l) | 2,726,888 | 2,704,745 | |
| 3,469,183 | |||
| TOTAL INDUSTRIALS | 30,498,058 | ||
| INFORMATION TECHNOLOGY - 0.9% | |||
| Communications Equipment - 0.0% | |||
| Radiate Holdco LLC Tranche B 1LN, term loan 3 month U.S. LIBOR + 3.500% 4.25% 9/10/26 (f)(i)(k) | 696,500 | 694,599 | |
| Electronic Equipment & Components - 0.0% | |||
| Tiger Merger Sub Co. 1LN, term loan 3 month U.S. LIBOR + 3.500% 7/1/25 (i)(k)(l) | 645,125 | 644,951 | |
| IT Services - 0.3% | |||
| Acuris Finance U.S., Inc. 1LN, term loan 3 month U.S. LIBOR + 4.000% 4.5% 2/16/28 (f)(i)(k) | 694,010 | 693,580 | |
| Camelot Finance SA Tranche B 1LN, term loan 3 month U.S. LIBOR + 3.000% 4% 10/31/26 (f)(i)(k) | 1,587,025 | 1,587,025 | |
| GTT Communications, Inc. Tranche B, term loan 3 month U.S. LIBOR + 2.750% 2.9% 5/31/25 (f)(i)(k) | 5,726,998 | 4,498,557 | |
| Peraton Corp.: | |||
| 2LN, term loan 0% 2/1/29 (f)(k) | 550,000 | 550,000 | |
| Tranche B 1LN, term loan 3 month U.S. LIBOR + 3.750% 4.5% 2/1/28 (f)(i)(k) | 5,944,927 | 5,943,678 | |
| RP Crown Parent, LLC Tranche B 1LN, term loan 3 month U.S. LIBOR + 3.000% 1/30/26 (i)(k)(l) | 497,565 | 496,321 | |
| Tempo Acquisition LLC Tranche B 1LN, term loan 3 month U.S. LIBOR + 3.250% 3.75% 10/31/26 (f)(i)(k) | 2,714,436 | 2,713,866 | |
| Verscend Holding Corp. Tranche B 1LN, term loan 3 month U.S. LIBOR + 4.000% 4.0846% 8/27/25 (f)(i)(k) | 994,898 | 992,659 | |
| 17,475,686 | |||
| Software - 0.6% | |||
| Ascend Learning LLC: | |||
| Tranche B 1LN, term loan 3 month U.S. LIBOR + 3.750% 4.75% 7/12/24 (f)(i)(k) | 1,042,125 | 1,043,105 | |
| Tranche B, term loan 3 month U.S. LIBOR + 3.000% 4% 7/12/24 (f)(i)(k) | 967,461 | 966,078 | |
| Boxer Parent Co., Inc. Tranche B 1LN, term loan 3 month U.S. LIBOR + 3.750% 3.8346% 10/2/25 (f)(i)(k) | 174,988 | 173,766 | |
| Epicor Software Corp. 2LN, term loan 3 month U.S. LIBOR + 7.750% 8.75% 7/31/28 (f)(i)(k) | 25,000 | 25,688 | |
| Finastra U.S.A., Inc.: | |||
| Tranche 2LN, term loan 3 month U.S. LIBOR + 7.250% 8.25% 6/13/25 (f)(i)(k) | 2,450,000 | 2,461,221 | |
| Tranche B 1LN, term loan 3 month U.S. LIBOR + 3.500% 4.5% 6/13/24 (f)(i)(k) | 1,424,930 | 1,406,948 | |
| Greeneden U.S. Holdings II LLC Tranche B 1LN, term loan 3 month U.S. LIBOR + 4.000% 4.75% 12/1/27 (f)(i)(k) | 1,417,875 | 1,420,243 | |
| Informatica Corp. Tranche B 1LN, term loan 7.125% 2/14/25 (k) | 475,000 | 483,550 | |
| McAfee LLC Tranche B, term loan 3 month U.S. LIBOR + 3.750% 3.8346% 9/29/24 (f)(i)(k) | 3,850,566 | 3,850,104 | |
| Polaris Newco LLC Tranche B 1LN, term loan 1 month U.S. LIBOR + 4.000% 4.5% 6/2/28 (f)(i)(k) | 1,845,000 | 1,842,786 | |
| Proofpoint, Inc.: | |||
| 2LN, term loan 0% 5/27/29 (f)(k) | 520,000 | 527,150 | |
| Tranche B 1LN, term loan 1 month U.S. LIBOR + 3.250% 6/9/28 (i)(k)(l) | 1,295,000 | 1,286,725 | |
| Rackspace Technology Global, Inc. Tranche B 1LN, term loan 3 month U.S. LIBOR + 2.750% 3.5% 2/15/28 (f)(i)(k) | 2,286,125 | 2,260,635 | |
| RealPage, Inc. 2LN, term loan 3 month U.S. LIBOR + 0.000% 2/17/29 (i)(k)(l) | 1,475,000 | 1,502,656 | |
| Renaissance Holding Corp. Tranche B 2LN, term loan 3 month U.S. LIBOR + 7.000% 7.0846% 5/31/26 (f)(i)(k) | 690,000 | 690,145 | |
| Skillsoft Tranche B 1LN, term loan 1 month U.S. LIBOR + 4.750% 7/1/28 (i)(k)(l) | 2,025,000 | 2,028,807 | |
| TIBCO Software, Inc.: | |||
| 2LN, term loan 3 month U.S. LIBOR + 7.750% 2/14/28 (i)(k)(l) | 2,000,000 | 2,016,260 | |
| Tranche B2 1LN, term loan 3 month U.S. LIBOR + 3.750% 7/3/26 (i)(k)(l) | 3,863,390 | 3,834,414 | |
| UKG, Inc.: | |||
| 2LN, term loan 3 month U.S. LIBOR + 6.750% 7.5% 5/3/27 (f)(i)(k) | 4,520,000 | 4,584,998 | |
| Tranche B 1LN, term loan 3 month U.S. LIBOR + 3.250% 4% 5/4/26 (f)(i)(k) | 6,508,656 | 6,508,656 | |
| 38,913,935 | |||
| TOTAL INFORMATION TECHNOLOGY | 57,729,171 | ||
| MATERIALS - 0.2% | |||
| Chemicals - 0.2% | |||
| Consolidated Energy Finance SA Tranche B 1LN, term loan 3 month U.S. LIBOR + 3.500% 4% 5/7/25 (c)(f)(i)(k) | 2,640,000 | 2,574,000 | |
| Hexion, Inc. Tranche B 1LN, term loan 3 month U.S. LIBOR + 3.500% 3.65% 7/1/26 (f)(i)(k) | 1,335,117 | 1,332,887 | |
| Solenis International LP: | |||
| Tranche 1LN, term loan 3 month U.S. LIBOR + 4.000% 12/18/23 (i)(k)(l) | 3,020,082 | 3,015,763 | |
| Tranche B 1LN, term loan 3 month U.S. LIBOR + 8.500% 6/18/24 (i)(k)(l) | 3,340,000 | 3,328,878 | |
| 10,251,528 | |||
| REAL ESTATE - 0.0% | |||
| Real Estate Management & Development - 0.0% | |||
| Brookfield Retail Holdings VII Sub 3 LLC Tranche B, term loan 3 month U.S. LIBOR + 2.500% 8/24/25 (i)(k)(l) | 984,810 | 961,115 | |
| UTILITIES - 0.0% | |||
| Electric Utilities - 0.0% | |||
| Heritage Power LLC Tranche B 1LN, term loan 3 month U.S. LIBOR + 4.750% 6/28/26 (i)(k)(l) | 1,717,283 | 1,536,969 | |
| TOTAL BANK LOAN OBLIGATIONS | |||
| (Cost $211,446,033) | 213,189,329 | ||
| Shares | Value | ||
| Fixed-Income Funds - 52.6% | |||
| High Yield Fixed-Income Funds - 52.6% | |||
| Artisan High Income Fund Investor Shares | 74,299,488 | 762,312,645 | |
| BlackRock High Yield Bond Portfolio Class K | 93,500,032 | 740,520,250 | |
| Eaton Vance Income Fund of Boston Class A | 45,371,389 | 255,440,922 | |
| Fidelity Capital & Income Fund (m) | 62,801,152 | 717,189,159 | |
| MainStay High Yield Corporate Bond Fund Class A | 88,563,317 | 503,039,639 | |
| Vanguard High-Yield Corporate Fund Admiral Shares | 83,223,355 | 500,172,366 | |
| TOTAL HIGH YIELD FIXED-INCOME FUNDS | |||
| (Cost $3,202,405,276) | 3,478,674,981 | ||
| Principal Amount(a) | Value | ||
| Preferred Securities - 0.1% | |||
| ENERGY - 0.0% | |||
| Oil, Gas & Consumable Fuels - 0.0% | |||
| DCP Midstream Partners LP 7.375% (f)(n) | 700,000 | 686,502 | |
| FINANCIALS - 0.1% | |||
| Banks - 0.1% | |||
| Banco Do Brasil SA 9% (Reg. S) (f)(n) | 1,600,000 | 1,823,114 | |
| Citigroup, Inc. 3.875% (f)(n) | 1,625,000 | 1,674,114 | |
| Itau Unibanco Holding SA 6.125% (d)(f)(n) | 1,515,000 | 1,560,877 | |
| 5,058,105 | |||
| INDUSTRIALS - 0.0% | |||
| Industrial Conglomerates - 0.0% | |||
| General Electric Co. 3.4489% (f)(i)(n) | 1,191,000 | 1,164,170 | |
| UTILITIES - 0.0% | |||
| Multi-Utilities - 0.0% | |||
| NiSource, Inc. 5.65% (f)(n) | 795,000 | 840,348 | |
| TOTAL PREFERRED SECURITIES | |||
| (Cost $7,144,501) | 7,749,125 | ||
| U.S. Government and Government Agency Obligations – 0.0% | |||
| U.S. Treasury Bills, yield at date of purchase 0.1% 11/4/21(o) | |||
| (Cost $499,912) | 500,000 | 499,958 | |
| Shares | Value | ||
| Money Market Funds - 1.3% | |||
| Fidelity Cash Central Fund 0.06% (p) | 23,497,699 | 23,502,398 | |
| State Street Institutional U.S. Government Money Market Fund Premier Class 0.03% (q) | 63,008,838 | 63,008,838 | |
| TOTAL MONEY MARKET FUNDS | |||
| (Cost $86,511,092) | 86,511,236 | ||
| TOTAL INVESTMENT IN SECURITIES - 99.7% | |||
| (Cost $6,209,953,584) | 6,598,722,747 | ||
| NET OTHER ASSETS (LIABILITIES) - 0.3% | 20,070,171 | ||
| NET ASSETS - 100% | $6,618,792,918 |
| Futures Contracts | |||||
| Number of contracts | Expiration Date | Notional Amount | Value | Unrealized Appreciation/(Depreciation) | |
| Purchased | |||||
| Treasury Contracts | |||||
| CBOT 10-Year U.S. Treasury Note Contracts (United States) | 145 | Dec. 2021 | $19,350,703 | $5,323 | $5,323 |
| CBOT 10-Year U.S. Treasury Note Contracts (United States) | 204 | Sept. 2021 | 27,345,563 | 381,468 | 381,468 |
| CBOT 2-Year U.S. Treasury Note Contracts (United States) | 175 | Dec. 2021 | 38,557,422 | 24,387 | 24,387 |
| CBOT 5-Year U.S. Treasury Note Contracts (United States) | 543 | Dec. 2021 | 67,179,281 | 95,357 | 95,357 |
| CBOT Long Term U.S. Treasury Bond Contracts (United States) | 77 | Dec. 2021 | 12,548,594 | (10,666) | (10,666) |
| TOTAL PURCHASED | 495,869 | ||||
| Sold | |||||
| Treasury Contracts | |||||
| CBOT 10-Year U.S. Treasury Note Contracts (United States) | 204 | Sept. 2021 | 27,345,563 | (176,099) | (176,099) |
| CBOT Ultra Long Term U.S. Treasury Bond Contracts (United States) | 46 | Dec. 2021 | 9,074,938 | 34,794 | 34,794 |
| TOTAL SOLD | ( 141,305) | ||||
| TOTAL FUTURES CONTRACTS | $354,564 |
The notional amount of futures purchased as a percentage of Net Assets is 2.5%
The notional amount of futures sold as a percentage of Net Assets is 0.6%
| Forward Foreign Currency Contracts | ||||||
| Currency Purchased | Currency Sold | Counterparty | Settlement Date | Unrealized Appreciation/(Depreciation) | ||
| USD | 574,159 | CAD | 720,000 | HSBC Bank USA | 10/22/21 | $3,522 |
| USD | 1,474,006 | GBP | 1,075,055 | HSBC Bank USA | 10/22/21 | (4,193) |
| USD | 495,259 | GBP | 360,000 | HSBC Bank USA | 10/22/21 | 260 |
| USD | 166,299 | EUR | 141,057 | Citibank NA | 11/19/21 | (509) |
| USD | 337,947 | EUR | 286,388 | Citibank NA | 11/19/21 | (725) |
| USD | 338,528 | EUR | 286,388 | Citibank NA | 11/19/21 | (144) |
| TOTAL FORWARD FOREIGN CURRENCY CONTRACTS | $(1,789) | |||||
| Unrealized Appreciation | 3,782 | |||||
| Unrealized Depreciation | (5,571) | |||||
Swaps
| Underlying Reference | Rating(1) | Maturity Date | Clearinghouse / Counterparty(2) | Fixed Payment Received/(Paid) | Payment Frequency | Notional Amount(3) | Value(1) | Upfront Premium Received/(Paid)(4) | Unrealized Appreciation/(Depreciation) |
| Credit Default Swaps | |||||||||
| Sell Protection | |||||||||
| American Airlines Group, Inc. | Caa1 | Dec. 2021 | Citibank, N.A. | 5% | Quarterly | $1,265,000 | $24,727 | $2,228 | $26,955 |
| American Airlines Group, Inc. | Caa1 | Jun. 2023 | ICE | 5% | Quarterly | 349,000 | 14,429 | 0 | 14,429 |
| CDX N.A. HY SERIES 36 5YR | NR | Jun. 2026 | ICE | 5% | Quarterly | 23,875,000 | (36,064) | 0 | (36,064) |
| Royal Caribbean Cruises Ltd. | B2 | Dec. 2023 | Citibank, N.A. | 5% | Quarterly | 860,000 | 45,222 | 18,540 | 63,762 |
| TOTAL CREDIT DEFAULT SWAPS | $48,314 | $20,768 | $69,082 | ||||||
(1) Ratings are presented for credit default swaps in which the Fund has sold protection on the underlying referenced debt. Ratings for an underlying index represent a weighted average of the ratings of all securities included in the index. The credit rating or value can be measures of the current payment/performance risk. Ratings are from Moody's Investors Service, Inc. Where Moody's® ratings are not available, S&P® ratings are disclosed and are indicated as such. All ratings are as of the report date and do not reflect subsequent changes.
(2) Swaps with Intercontinental Exchange (ICE) are centrally cleared over-the-counter (OTC) swaps.
(3) The notional amount of each credit default swap where the Fund has sold protection approximates the maximum potential amount of future payments that the Fund could be required to make if a credit event were to occur.
(4) Any premiums for centrally cleared over-the-counter (OTC) swaps are recorded periodically throughout the term of the swap to variation margin and included in unrealized appreciation (depreciation).
Currency Abbreviations
CAD – Canadian dollar
EUR – European Monetary Unit
GBP – British pound
Legend
(a) Amount is stated in United States dollars unless otherwise noted.
(b) Restricted securities (including private placements) - Investment in securities not registered under the Securities Act of 1933 (excluding 144A issues). At the end of the period, the value of restricted securities (excluding 144A issues) amounted to $3,166,828 or 0.0% of net assets.
(c) Level 3 security
(d) Security exempt from registration under Rule 144A of the Securities Act of 1933. These securities may be resold in transactions exempt from registration, normally to qualified institutional buyers. At the end of the period, the value of these securities amounted to $2,108,751,669 or 31.9% of net assets.
(e) Security initially issued at one coupon which converts to a higher coupon at a specified date. The rate shown is the rate at period end.
(f) Coupon rates for floating and adjustable rate securities reflect the rates in effect at period end.
(g) Non-income producing - Security is in default.
(h) Security or a portion of the security purchased on a delayed delivery or when-issued basis.
(i) Coupon is indexed to a floating interest rate which may be multiplied by a specified factor and/or subject to caps or floors.
(j) Non-income producing
(k) Remaining maturities of bank loan obligations may be less than the stated maturities shown as a result of contractual or optional prepayments by the borrower. Such prepayments cannot be predicted with certainty.
(l) The coupon rate will be determined upon settlement of the loan after period end.
(m) Affiliated Fund
(n) Security is perpetual in nature with no stated maturity date.
(o) Security or a portion of the security was pledged to cover margin requirements for centrally cleared OTC swaps. At period end, the value of securities pledged amounted to $300,975.
(p) Affiliated fund that is generally available only to investment companies and other accounts managed by Fidelity Investments. The rate quoted is the annualized seven-day yield of the fund at period end. A complete unaudited listing of the fund's holdings as of its most recent quarter end is available upon request. In addition, each Fidelity Central Fund's financial statements are available on the SEC's website or upon request.
(q) The rate quoted is the annualized seven-day yield of the fund at period end.
Additional information on each restricted holding is as follows:
| Security | Acquisition Date | Acquisition Cost |
| Chesapeake Energy Corp. | 2/10/21 | $6,099 |
| Mesquite Energy, Inc. 15% 7/15/23 | 11/5/20 - 7/15/21 | $589,916 |
| Mesquite Energy, Inc. 15% 7/15/23 | 7/10/20 - 7/15/21 | $341,613 |
Affiliated Central Funds
Fiscal year to date information regarding the Fund's investments in Fidelity Central Funds, including the ownership percentage, is presented below.
| Fund | Value, beginning of period | Purchases | Sales Proceeds | Dividend Income | Realized Gain/Loss | Change in Unrealized appreciation (depreciation) | Value, end of period | % ownership, end of period |
| Fidelity Cash Central Fund 0.06% | $17,438,712 | $337,438,603 | $331,374,916 | $6,922 | $-- | $(1) | $23,502,398 | 0.0% |
| Total | $17,438,712 | $337,438,603 | $331,374,916 | $6,922 | $-- | $(1) | $23,502,398 |
Amounts in the income column in the above table include any capital gain distributions from underlying funds, which are presented in the corresponding line-item in the Statement of Operations, if applicable.
Affiliated Underlying Funds
Fiscal year to date information regarding the Fund's investments in affiliated Underlying Funds is presented below. Exchanges between classes of the same affiliated Underlying Funds may occur. If an underlying Fund changes its name, the name presented below is the name in effect at period end.
| Affiliate | Value, beginning of period | Purchases | Sales Proceeds | Dividend Income | Realized Gain (loss) | Change in Unrealized appreciation (depreciation) | Value, end of period |
| Fidelity Capital & Income Fund | $630,675,085 | $145,362,044 | $85,000,000 | $21,808,485 | $569,024 | $25,583,006 | $717,189,159 |
| Total | $630,675,085 | $145,362,044 | $85,000,000 | $21,808,485 | $569,024 | $25,583,006 | $717,189,159 |
Amounts in the income column in the above table include any capital gain distributions from underlying funds, which are presented in the corresponding line-item in the Statement of Operations, if applicable.
Investment Valuation
The following is a summary of the inputs used, as of August 31, 2021, involving the Fund's assets and liabilities carried at fair value. The inputs or methodology used for valuing securities may not be an indication of the risk associated with investing in those securities. For more information on valuation inputs, and their aggregation into the levels used below, please refer to the Investment Valuation section in the accompanying Notes to Financial Statements.
| Valuation Inputs at Reporting Date: | ||||
| Description | Total | Level 1 | Level 2 | Level 3 |
| Investments in Securities: | ||||
| Equities: | ||||
| Communication Services | $3,148,920 | $3,148,920 | $-- | $-- |
| Consumer Discretionary | -- | -- | -- | -- |
| Energy | 11,104,118 | 8,147,495 | -- | 2,956,623 |
| Health Care | 6,147,638 | -- | 6,147,638 | -- |
| Materials | 1,819,800 | 1,819,800 | -- | -- |
| Utilities | 15,665,569 | 8,254,869 | 7,410,700 | -- |
| Corporate Bonds | 2,769,956,460 | -- | 2,766,825,574 | 3,130,886 |
| Municipal Securities | 4,255,613 | -- | 4,255,613 | -- |
| Bank Loan Obligations | 213,189,329 | -- | 210,615,329 | 2,574,000 |
| Fixed-Income Funds | 3,478,674,981 | 3,478,674,981 | -- | -- |
| Preferred Securities | 7,749,125 | -- | 7,749,125 | -- |
| Money Market Funds | 86,511,236 | 86,511,236 | -- | -- |
| Other Short-Term Investments | 499,958 | -- | 499,958 | -- |
| Total Investments in Securities: | $6,598,722,747 | $3,586,557,301 | $3,003,503,937 | $8,661,509 |
| Derivative Instruments: | ||||
| Assets | ||||
| Futures Contracts | $541,329 | $541,329 | $-- | $-- |
| Forward Foreign Currency Contracts | 3,782 | -- | 3,782 | -- |
| Swaps | 84,378 | -- | 84,378 | -- |
| Total Assets | $629,489 | $541,329 | $88,160 | $-- |
| Liabilities | ||||
| Futures Contracts | $(186,765) | $(186,765) | $-- | $-- |
| Forward Foreign Currency Contracts | (5,571) | -- | (5,571) | |
| Swaps | (36,064) | -- | (36,064) | -- |
| Total Liabilities | $(228,400) | $(186,765) | $(41,635) | $-- |
| Total Derivative Instruments: | $401,089 | $354,564 | $46,525 | $-- |
Value of Derivative Instruments
The following table is a summary of the Fund's value of derivative instruments by primary risk exposure as of August 31, 2021. For additional information on derivative instruments, please refer to the Derivative Instruments section in the accompanying Notes to Financial Statements.
| Primary Risk Exposure / Derivative Type | Value | |
| Asset | Liability | |
| Credit Risk | ||
| Swaps(a),(b) | $84,378 | $(36,064) |
| Total Credit Risk | 84,378 | (36,064) |
| Foreign Exchange Risk | ||
| Forward Foreign Currency Contracts(c) | 3,782 | (5,571) |
| Total Foreign Exchange Risk | 3,782 | (5,571) |
| Interest Rate Risk | ||
| Futures Contracts(d) | 541,329 | (186,765) |
| Total Interest Rate Risk | 541,329 | (186,765) |
| Total Value of Derivatives | $629,489 | $(228,400) |
(a) For bi-lateral over-the-counter (OTC) swaps, reflects gross value which is presented in the Statement of Assets and Liabilities in the bi-lateral OTC swaps, at value line-items.
(b) For centrally cleared over-the-counter (OTC) swaps, reflects gross cumulative appreciation (depreciation) as presented in the Schedule of Investments. In the Statement of Assets and Liabilities, the period end daily variation margin for centrally cleared OTC swaps is included in receivable or payable for daily variation margin on centrally cleared OTC swaps, and the net cumulative appreciation (depreciation) for centrally cleared OTC swaps is included in Total accumulated earnings (loss).
(c) Gross value is presented in the Statement of Assets and Liabilities in the unrealized appreciation/depreciation on forward foreign currency contracts line-items.
(d) Reflects gross cumulative appreciation (depreciation) on futures contracts as presented in the Schedule of Investments. In the Statement of Assets and Liabilities, the period end daily variation margin is included in receivable or payable for daily variation margin on futures contracts, and the net cumulative appreciation (depreciation) is included in Total accumulated earnings (loss).
See accompanying notes which are an integral part of the financial statements.
Financial Statements
Statement of Assets and Liabilities
| August 31, 2021 (Unaudited) | ||
| Assets | ||
| Investment in securities, at value — See accompanying schedule: Unaffiliated issuers (cost $5,575,822,414) | $5,858,031,190 | |
| Fidelity Central Funds (cost $23,502,254) | 23,502,398 | |
| Other affiliated issuers (cost $610,628,916) | 717,189,159 | |
| Total Investment in Securities (cost $6,209,953,584) | $6,598,722,747 | |
| Segregated cash with brokers for derivative instruments | 2,890,000 | |
| Cash | 716,355 | |
| Foreign currency held at value (cost $19,803) | 19,969 | |
| Receivable for investments sold | 8,001,812 | |
| Unrealized appreciation on forward foreign currency contracts | 3,782 | |
| Receivable for fund shares sold | 1,790,731 | |
| Dividends receivable | 77,548 | |
| Interest receivable | 41,610,601 | |
| Distributions receivable from Fidelity Central Funds | 1,077 | |
| Bi-lateral OTC swaps, at value | 69,949 | |
| Prepaid expenses | 12,594 | |
| Other receivables | 66,951 | |
| Total assets | 6,653,984,116 | |
| Liabilities | ||
| Payable for investments purchased | ||
| Regular delivery | $29,246,035 | |
| Delayed delivery | 700,000 | |
| Unrealized depreciation on forward foreign currency contracts | 5,571 | |
| Payable for fund shares redeemed | 2,071,362 | |
| Distributions payable | 151,739 | |
| Accrued management fee | 704,517 | |
| Payable for daily variation margin on futures contracts | 5,609 | |
| Payable for daily variation margin on centrally cleared OTC swaps | 2,120,262 | |
| Other payables and accrued expenses | 186,103 | |
| Total liabilities | 35,191,198 | |
| Net Assets | $6,618,792,918 | |
| Net Assets consist of: | ||
| Paid in capital | $6,293,261,498 | |
| Total accumulated earnings (loss) | 325,531,420 | |
| Net Assets | $6,618,792,918 | |
| Net Asset Value, offering price and redemption price per share ($6,618,792,918 ÷ 678,358,510 shares) | $9.76 |
See accompanying notes which are an integral part of the financial statements.
Statement of Operations
| Six months ended August 31, 2021 (Unaudited) | ||
| Investment Income | ||
| Dividends: | ||
| Unaffiliated issuers | $75,402,544 | |
| Affiliated issuers | 11,355,675 | |
| Interest | 83,483,705 | |
| Income from Fidelity Central Funds | 6,922 | |
| Total income | 170,248,846 | |
| Expenses | ||
| Management fee | $13,449,384 | |
| Custodian fees and expenses | 27,861 | |
| Independent trustees' fees and expenses | 27,862 | |
| Registration fees | 141,083 | |
| Audit | 26,588 | |
| Legal | 11,308 | |
| Miscellaneous | 18,725 | |
| Total expenses before reductions | 13,702,811 | |
| Expense reductions | (8,953,435) | |
| Total expenses after reductions | 4,749,376 | |
| Net investment income (loss) | 165,499,470 | |
| Realized and Unrealized Gain (Loss) | ||
| Net realized gain (loss) on: | ||
| Investment securities: | ||
| Unaffiliated issuers | 37,075,133 | |
| Affiliated issuers | 569,024 | |
| Forward foreign currency contracts | 60,549 | |
| Foreign currency transactions | (18,202) | |
| Futures contracts | 244,895 | |
| Swaps | 940,577 | |
| Capital gain distributions from underlying funds: | ||
| Affiliated issuers | 10,452,810 | |
| Total net realized gain (loss) | 49,324,786 | |
| Change in net unrealized appreciation (depreciation) on: | ||
| Investment securities: | ||
| Unaffiliated issuers | 46,073,742 | |
| Fidelity Central Funds | (1) | |
| Other affiliated issuers | 25,583,006 | |
| Forward foreign currency contracts | (12,370) | |
| Assets and liabilities in foreign currencies | 1,310 | |
| Futures contracts | 797,524 | |
| Swaps | (200,046) | |
| Total change in net unrealized appreciation (depreciation) | 72,243,165 | |
| Net gain (loss) | 121,567,951 | |
| Net increase (decrease) in net assets resulting from operations | $287,067,421 |
See accompanying notes which are an integral part of the financial statements.
Statement of Changes in Net Assets
| Six months ended August 31, 2021 (Unaudited) | Year ended February 28, 2021 | |
| Increase (Decrease) in Net Assets | ||
| Operations | ||
| Net investment income (loss) | $165,499,470 | $223,750,676 |
| Net realized gain (loss) | 49,324,786 | 67,447 |
| Change in net unrealized appreciation (depreciation) | 72,243,165 | 274,107,308 |
| Net increase (decrease) in net assets resulting from operations | 287,067,421 | 497,925,431 |
| Distributions to shareholders | (154,243,804) | (215,618,456) |
| Share transactions | ||
| Proceeds from sales of shares | 569,273,226 | 5,331,038,074 |
| Reinvestment of distributions | 153,015,511 | 213,924,130 |
| Cost of shares redeemed | (1,440,362,192) | (665,279,956) |
| Net increase (decrease) in net assets resulting from share transactions | (718,073,455) | 4,879,682,248 |
| Total increase (decrease) in net assets | (585,249,838) | 5,161,989,223 |
| Net Assets | ||
| Beginning of period | 7,204,042,756 | 2,042,053,533 |
| End of period | $6,618,792,918 | $7,204,042,756 |
| Other Information | ||
| Shares | ||
| Sold | 59,090,728 | 582,425,242 |
| Issued in reinvestment of distributions | 15,809,417 | 23,146,938 |
| Redeemed | (148,625,543) | (72,541,960) |
| Net increase (decrease) | (73,725,398) | 533,030,220 |
See accompanying notes which are an integral part of the financial statements.
Financial Highlights
Strategic Advisers Income Opportunities Fund
| Six months ended (Unaudited) August 31, | Years endedFebruary 28, | |||||
| 2021 | 2021 | 2020 A | 2019 | 2018 | 2017 | |
| Selected Per–Share Data | ||||||
| Net asset value, beginning of period | $9.58 | $9.32 | $9.34 | $9.53 | $9.57 | $8.48 |
| Income from Investment Operations | ||||||
| Net investment income (loss)B | .224 | .473 | .515 | .513 | .489 | .493 |
| Net realized and unrealized gain (loss) | .164 | .241 | (.001) | (.222) | (.050) | 1.091 |
| Total from investment operations | .388 | .714 | .514 | .291 | .439 | 1.584 |
| Distributions from net investment income | (.208) | (.454) | (.530) | (.469) | (.479) | (.494) |
| Distributions from net realized gain | – | – | (.004) | (.012) | – | – |
| Total distributions | (.208) | (.454) | (.534) | (.481) | (.479) | (.494) |
| Net asset value, end of period | $9.76 | $9.58 | $9.32 | $9.34 | $9.53 | $9.57 |
| Total ReturnC,D | 4.09% | 8.05% | 5.57% | 3.21% | 4.66% | 19.08% |
| Ratios to Average Net AssetsE,F | ||||||
| Expenses before reductions | .38%G | .39% | .34% | .36% | .38% | .29% |
| Expenses net of fee waivers, if any | .13%G | .14% | .09% | .11% | .13% | .04% |
| Expenses net of all reductions | .13%G | .14% | .09% | .11% | .13% | .04% |
| Net investment income (loss) | 4.59%G | 5.10% | 5.44% | 5.49% | 5.09% | 5.40% |
| Supplemental Data | ||||||
| Net assets, end of period (000 omitted) | $6,618,793 | $7,204,043 | $2,042,054 | $2,642,485 | $3,047,435 | $3,318,071 |
| Portfolio turnover rateH | 35%G | 43% | 40% | 22% | 33% | 38% |
A For the year ended February 29.
B Calculated based on average shares outstanding during the period.
C Total returns for periods of less than one year are not annualized.
D Total returns would have been lower if certain expenses had not been reduced during the applicable periods shown.
E Fees and expenses of any underlying mutual funds or exchange-traded funds (ETFs) are not included in the Fund's expense ratio. The Fund indirectly bears its proportionate share of these expenses. For additional expense information related to investments in Fidelity Central Funds, please refer to the "Investments in Fidelity Central Funds" note found in the Notes to Financial Statements section of the most recent Annual or Semi-Annual report.
F Expense ratios reflect operating expenses of the class. Expenses before reductions do not reflect amounts reimbursed, waived, or reduced through arrangements with the investment advisor, brokerage services, or other offset arrangements, if applicable, and do not represent the amount paid by the class during periods when reimbursements, waivers or reductions occur.
G Annualized
H Amount does not include the portfolio activity of any underlying mutual funds or exchange-traded funds (ETFs).
See accompanying notes which are an integral part of the financial statements.
Notes to Financial Statements (Unaudited)
For the period ended August 31, 2021
1. Organization.
Strategic Advisers Income Opportunities Fund (the Fund) is a fund of Fidelity Rutland Square Trust II (the Trust), and is authorized to issue an unlimited number of shares. The Trust is registered under the Investment Company Act of 1940, as amended (the 1940 Act), as an open-end management investment company organized as a Delaware statutory trust. The Fund is offered exclusively to certain managed account clients of Strategic Advisers LLC (Strategic Advisers), an affiliate of Fidelity Management & Research Company LLC (FMR).
2. Significant Accounting Policies.
The Fund is an investment company and applies the accounting and reporting guidance of the Financial Accounting Standards Board (FASB) Accounting Standards Codification Topic 946 Financial Services - Investment Companies. The financial statements have been prepared in conformity with accounting principles generally accepted in the United States of America (GAAP), which require management to make certain estimates and assumptions at the date of the financial statements. Actual results could differ from those estimates. Subsequent events, if any, through the date that the financial statements were issued have been evaluated in the preparation of the financial statements. The Fund's Schedule of Investments lists any underlying mutual funds or exchange-traded funds (ETFs) but does not include the underlying holdings of these funds. The following summarizes the significant accounting policies of the Fund:
Investment Valuation. Investments are valued as of 4:00 p.m. Eastern time on the last calendar day of the period. The Board of Trustees (the Board) has delegated the day to day responsibility for the valuation of the Fund's investments to the Fair Value Committee (the Committee) established by the Fund's investment adviser. In accordance with valuation policies and procedures approved by the Board, the Fund attempts to obtain prices from one or more third party pricing vendors or brokers to value its investments. When current market prices, quotations or currency exchange rates are not readily available or reliable, investments will be fair valued in good faith by the Committee, in accordance with procedures adopted by the Board. Factors used in determining fair value vary by investment type and may include market or investment specific events, changes in interest rates and credit quality. The frequency with which these procedures are used cannot be predicted and they may be utilized to a significant extent. The Committee oversees the Fund's valuation policies and procedures and reports to the Board on the Committee's activities and fair value determinations. The Board monitors the appropriateness of the procedures used in valuing the Fund's investments and ratifies the fair value determinations of the Committee.
The Fund categorizes the inputs to valuation techniques used to value its investments into a disclosure hierarchy consisting of three levels as shown below:
- Level 1 – quoted prices in active markets for identical investments
- Level 2 – other significant observable inputs (including quoted prices for similar investments, interest rates, prepayment speeds, etc.)
- Level 3 – unobservable inputs (including the Fund's own assumptions based on the best information available)
Valuation techniques used to value the Fund's investments by major category are as follows:
Debt securities, including restricted securities, are valued based on evaluated prices received from third party pricing vendors or from brokers who make markets in such securities. Corporate bonds, bank loan obligations, municipal securities, preferred securities and U.S. government and government agency obligations are valued by pricing vendors who utilize matrix pricing which considers yield or price of bonds of comparable quality, coupon, maturity and type or by broker-supplied prices. Swaps are marked-to-market daily based on valuations from third party pricing vendors, registered derivatives clearing organizations (clearinghouses) or broker-supplied valuations. These pricing sources may utilize inputs such as interest rate curves, credit spread curves, default possibilities and recovery rates. When independent prices are unavailable or unreliable, debt securities and swaps may be valued utilizing pricing methodologies which consider similar factors that would be used by third party pricing vendors. For foreign debt securities, when significant market or security specific events arise, valuations may be determined in good faith in accordance with procedures adopted by the Board. Debt securities and swaps are generally categorized as Level 2 in the hierarchy but may be Level 3 depending on the circumstances. The Fund invests a significant portion of its assets in below investment grade securities. The value of these securities can be more volatile due to changes in the credit quality of the issuer and is sensitive to changes in economic, market and regulatory conditions.
Equity securities, including restricted securities, for which market quotations are readily available, are valued at the last reported sale price or official closing price as reported by a third party pricing vendor on the primary market or exchange on which they are traded and are categorized as Level 1 in the hierarchy. In the event there were no sales during the day or closing prices are not available, securities are valued at the last quoted bid price or may be valued using the last available price and are generally categorized as Level 2 in the hierarchy. For foreign equity securities, when market or security specific events arise, comparisons to the valuation of American Depositary Receipts (ADRs), futures contracts, Exchange-Traded Funds (ETFs) and certain indexes as well as quoted prices for similar securities may be used and would be categorized as Level 2 in the hierarchy. For equity securities, including restricted securities, where observable inputs are limited, assumptions about market activity and risk are used and these securities may be categorized as Level 3 in the hierarchy.
The U.S. dollar value of foreign currency contracts is determined using currency exchange rates supplied by a pricing service and are categorized as Level 2 in the hierarchy. Futures contracts are valued at the settlement price established each day by the board of trade or exchange on which they are traded and are categorized as Level 1 in the hierarchy. Investments in open-end mutual funds, including the Fidelity Central Funds, are valued at their closing net asset value (NAV) each business day and are categorized as Level 1 in the hierarchy. If an unaffiliated open-end mutual fund's NAV is unavailable, shares of that fund may be valued by another method that the Board believes reflects fair value in accordance with the Board's fair value pricing policies and is categorized as Level 2 in the hierarchy.
Changes in valuation techniques may result in transfers in or out of an assigned level within the disclosure hierarchy. The aggregate value of investments by input level as of August 31, 2021 is included at the end of the Fund's Schedule of Investments.
Foreign Currency. Foreign-denominated assets, including investment securities, and liabilities are translated into U.S. dollars at the exchange rates at period end. Purchases and sales of investment securities, income and dividends received, and expenses denominated in foreign currencies are translated into U.S. dollars at the exchange rate in effect on the transaction date.
The effects of exchange rate fluctuations on investments are included with the net realized and unrealized gain (loss) on investment securities. Other foreign currency transactions resulting in realized and unrealized gain (loss) are disclosed separately.
Realized gains and losses on foreign currency transactions arise from the disposition of foreign currency, realized changes in the value of foreign currency between the trade and settlement dates on security transactions, and the difference between the amounts of dividends, interest and foreign withholding taxes recorded on transaction date and the U.S. dollar equivalent of the amounts actually received or paid. Unrealized gains and losses on assets and liabilities in foreign currencies arise from changes in the value of foreign currency, and from assets and liabilities denominated in foreign currencies, other than investments, which are held at period end.
Investment Transactions and Income. For financial reporting purposes, the Fund's investment holdings and NAV include trades executed through the end of the last business day of the period. The NAV per share for processing shareholder transactions is calculated as of the close of business of the New York Stock Exchange (NYSE), normally 4:00 p.m. Eastern time and includes trades executed through the end of the prior business day. Gains and losses on securities sold are determined on the basis of identified cost. Dividend income is recorded on the ex-dividend date, except for certain dividends from foreign securities where the ex-dividend date may have passed, which are recorded as soon as the Fund is informed of the ex-dividend date. Non-cash dividends included in dividend income, if any, are recorded at the fair market value of the securities received. Income and capital gain distributions from Fidelity Central Funds, if any, are recorded on the ex-dividend date. Income and capital gain distributions from any underlying mutual funds or exchange-traded funds (ETFs) are recorded on the ex-dividend date. Certain distributions received by the Fund represent a return of capital or capital gain. The Fund determines the components of these distributions subsequent to the ex-dividend date, based upon receipt of tax filings or other correspondence relating to the underlying investment. These distributions are recorded as a reduction of cost of investments and/or as a realized gain. Interest income is accrued as earned and includes coupon interest and amortization of premium and accretion of discount on debt securities as applicable. Paid in Kind (PIK) income is recorded at the fair market value of the securities received. Investment income is recorded net of foreign taxes withheld where recovery of such taxes is uncertain. Debt obligations may be placed on non-accrual status and related interest income may be reduced by ceasing current accruals and writing off interest receivables when the collection of all or a portion of interest has become doubtful based on consistently applied procedures. A debt obligation is removed from non-accrual status when the issuer resumes interest payments or when collectability of interest is reasonably assured.
Expenses. Expenses directly attributable to a fund are charged to that fund. Expenses attributable to more than one fund are allocated among the respective funds on the basis of relative net assets or other appropriate methods. Expenses included in the accompanying financial statements reflect the expenses of that fund and do not include any expenses associated with any underlying mutual funds or exchange-traded funds. Although not included in a fund's expenses, a fund indirectly bears its proportionate share of these expenses through the net asset value of each underlying mutual fund or exchange-traded fund. Expense estimates are accrued in the period to which they relate and adjustments are made when actual amounts are known.
Deferred Trustee Compensation. Under a Deferred Compensation Plan (the Plan) for certain Funds, certain independent Trustees have elected to defer receipt of a portion of their annual compensation. Deferred amounts are invested in affiliated mutual funds, are marked-to-market and remain in a fund until distributed in accordance with the Plan. The investment of deferred amounts and the offsetting payable to the Trustees presented below are included in the accompanying Statement of Assets and Liabilities in other receivables and other payables and accrued expenses, as applicable.
| Strategic Advisers Income Opportunities Fund | $66,951 |
Income Tax Information and Distributions to Shareholders. Each year, the Fund intends to qualify as a regulated investment company under Subchapter M of the Internal Revenue Code, including distributing substantially all of its taxable income and realized gains. As a result, no provision for U.S. Federal income taxes is required. The Fund files a U.S. federal tax return, in addition to state and local tax returns as required. The Fund's federal income tax returns are subject to examination by the Internal Revenue Service (IRS) for a period of three fiscal years after they are filed. State and local tax returns may be subject to examination for an additional fiscal year depending on the jurisdiction. Foreign taxes are provided for based on the Fund's understanding of the tax rules and rates that exist in the foreign markets in which it invests.
Distributions are declared and recorded daily and paid monthly from net investment income. Distributions from realized gains, if any, are declared and recorded on the ex-dividend date. Income and capital gain distributions are determined in accordance with income tax regulations, which may differ from GAAP.
Capital accounts within the financial statements are adjusted for permanent book-tax differences. These adjustments have no impact on net assets or the results of operations. Capital accounts are not adjusted for temporary book-tax differences which will reverse in a subsequent period.
Book-tax differences are primarily due to the short-term gain distributions from the underlying mutual funds or exchange-traded funds (ETFs), futures contracts, swaps, foreign currency transactions, market discount, partnerships, equity-debt classifications and contingent interest, deferred Trustees compensation, capital loss carryforwards and losses deferred due to wash sales and futures contracts.
As of period end, the cost and unrealized appreciation (depreciation) in securities, and derivatives if applicable, for federal income tax purposes were as follows:
| Gross unrealized appreciation | $413,042,825 |
| Gross unrealized depreciation | (20,890,336) |
| Net unrealized appreciation (depreciation) | $392,152,489 |
| Tax cost | $6,206,992,115 |
Capital loss carryforwards are only available to offset future capital gains of the Fund to the extent provided by regulations and may be limited. The capital loss carryforward information presented below, including any applicable limitation, is estimated as of prior fiscal period end and is subject to adjustment.
| No expiration | |
| Short-term | $(4,873,923) |
| Long-term | (123,794,329) |
| Total capital loss carryforward | $(128,668,252) |
Delayed Delivery Transactions and When-Issued Securities. During the period, certain Funds transacted in securities on a delayed delivery or when-issued basis. Payment and delivery may take place after the customary settlement period for that security. The price of the underlying securities and the date when the securities will be delivered and paid for are fixed at the time the transaction is negotiated. Securities purchased on a delayed delivery or when-issued basis are identified as such in the Schedule of Investments. Compensation for interest forgone in the purchase of a delayed delivery or when-issued debt security may be received. With respect to purchase commitments, each applicable Fund identifies securities as segregated in its records with a value at least equal to the amount of the commitment. Payables and receivables associated with the purchases and sales of delayed delivery securities having the same coupon, settlement date and broker are offset. Delayed delivery or when-issued securities that have been purchased from and sold to different brokers are reflected as both payables and receivables in the Statement of Assets and Liabilities under the caption "Delayed delivery", as applicable. Losses may arise due to changes in the value of the underlying securities or if the counterparty does not perform under the contract's terms, or if the issuer does not issue the securities due to political, economic, or other factors.
Restricted Securities (including Private Placements). Funds may invest in securities that are subject to legal or contractual restrictions on resale. These securities generally may be resold in transactions exempt from registration or to the public if the securities are registered. Disposal of these securities may involve time-consuming negotiations and expense, and prompt sale at an acceptable price may be difficult. Information regarding restricted securities held at period end is included at the end of the Schedule of Investments, if applicable.
Loans and Other Direct Debt Instruments. Direct debt instruments are interests in amounts owed to lenders by corporate or other borrowers. These instruments may be in the form of loans, trade claims or other receivables and may include standby financing commitments such as revolving credit facilities that obligate a fund to supply additional cash to the borrower on demand. Loans may be acquired through assignment, participation, or may be made directly to a borrower. Such instruments are presented in the Bank Loan Obligations section in the Schedule of Investments. Certain funds may also invest in unfunded loan commitments, which are contractual obligations for future funding. Information regarding unfunded commitments is included at the end of the Schedule of Investments, if applicable.
3. Derivative Instruments.
Risk Exposures and the Use of Derivative Instruments. The Fund's investment objective allows the Fund to enter into various types of derivative contracts, including futures contracts, forward foreign currency contracts and swaps. Derivatives are investments whose value is primarily derived from underlying assets, indices or reference rates and may be transacted on an exchange or over-the-counter (OTC). Derivatives may involve a future commitment to buy or sell a specified asset based on specified terms, to exchange future cash flows at periodic intervals based on a notional principal amount, or for one party to make one or more payments upon the occurrence of specified events in exchange for periodic payments from the other party.
The Fund used derivatives to increase returns, to gain exposure to certain types of assets, to facilitate transactions in foreign-denominated securities and to manage exposure to certain risks as defined below. The success of any strategy involving derivatives depends on analysis of numerous economic factors, and if the strategies for investment do not work as intended, the Fund may not achieve its objectives.
The Fund's use of derivatives increased or decreased its exposure to the following risks:
| Credit Risk | Credit risk relates to the ability of the issuer of a financial instrument to make further principal or interest payments on an obligation or commitment that it has to the Fund. |
| Foreign Exchange Risk | Foreign exchange rate risk relates to fluctuations in the value of an asset or liability due to changes in currency exchange rates. |
| Interest Rate Risk | Interest rate risk relates to the fluctuations in the value of interest-bearing securities due to changes in the prevailing levels of market interest rates. |
The Fund is also exposed to additional risks from investing in derivatives, such as liquidity risk and counterparty credit risk. Liquidity risk is the risk that the Fund will be unable to close out the derivative in the open market in a timely manner. Counterparty credit risk is the risk that the counterparty will not be able to fulfill its obligation to the Fund. Derivative counterparty credit risk is managed through formal evaluation of the creditworthiness of all potential counterparties. On certain OTC derivatives such as forward foreign currency contracts and bi-lateral swaps, the Fund attempts to reduce its exposure to counterparty credit risk by entering into an International Swaps and Derivatives Association, Inc. (ISDA) Master Agreement with each of its counterparties. The ISDA Master Agreement gives the Fund the right to terminate all transactions traded under such agreement upon the deterioration in the credit quality of the counterparty beyond specified levels. The ISDA Master Agreement gives each party the right, upon an event of default by the other party or a termination of the agreement, to close out all transactions traded under such agreement and to net amounts owed under each transaction to one net payable by one party to the other. To mitigate counterparty credit risk on bi-lateral OTC derivatives, the Fund receives collateral in the form of cash or securities once the Fund's net unrealized appreciation on outstanding derivative contracts under an ISDA Master Agreement exceeds certain applicable thresholds, subject to certain minimum transfer provisions. The collateral received is held in segregated accounts with the Fund's custodian bank in accordance with the collateral agreements entered into between the Fund, the counterparty and the Fund's custodian bank. The Fund could experience delays and costs in gaining access to the collateral even though it is held by the Fund's custodian bank. The Fund's maximum risk of loss from counterparty credit risk related to bi-lateral OTC derivatives is generally the aggregate unrealized appreciation and unpaid counterparty payments in excess of any collateral pledged by the counterparty to the Fund. The Fund may be required to pledge collateral for the benefit of the counterparties on bi-lateral OTC derivatives in an amount not less than each counterparty's unrealized appreciation on outstanding derivative contracts, subject to certain minimum transfer provisions, and any such pledged collateral is identified in the Schedule of Investments. Exchange-traded futures contracts are not covered by the ISDA Master Agreement; however counterparty credit risk related to exchange-traded futures contracts may be mitigated by the protection provided by the exchange on which they trade. Counterparty credit risk related to centrally cleared OTC swaps may be mitigated by the protection provided by the clearinghouse.
Investing in derivatives may involve greater risks than investing in the underlying assets directly and, to varying degrees, may involve risk of loss in excess of any initial investment and collateral received and amounts recognized in the Statement of Assets and Liabilities. In addition, there may be the risk that the change in value of the derivative contract does not correspond to the change in value of the underlying instrument.
Net Realized Gain (Loss) and Change in Net Unrealized Appreciation (Depreciation) on Derivatives. The table below, which reflects the impacts of derivatives on the financial performance of the Fund, summarizes the net realized gain (loss) and change in net unrealized appreciation (depreciation) for derivatives during the period as presented in the Statement of Operations.
| Primary Risk Exposure / Derivative Type | Net Realized Gain (Loss) | Change in Net Unrealized Appreciation (Depreciation) |
| Credit Risk | ||
| Swaps | $940,577 | $(200,046) |
| Total Credit Risk | 940,577 | (200,046) |
| Foreign Exchange Risk | ||
| Forward Foreign Currency Contracts | 60,549 | (12,370) |
| Total Foreign Exchange Risk | 60,549 | (12,370) |
| Interest Rate Risk | ||
| Futures Contracts | 244,895 | 797,524 |
| Total Interest Rate Risk | 244,895 | 797,524 |
| Totals | $1,246,021 | $585,108 |
A summary of the value of derivatives by primary risk exposure as of period end is included at the end of the Schedule of Investments.
Forward Foreign Currency Contracts. Forward foreign currency contracts represent obligations to purchase or sell foreign currency on a specified future date at a price fixed at the time the contracts are entered into. The Fund used forward foreign currency contracts to facilitate transactions in foreign-denominated securities and to manage exposure to certain foreign currencies.
Forward foreign currency contracts are valued daily and fluctuations in exchange rates on open contracts are recorded as unrealized appreciation or (depreciation) and reflected in the Statement of Assets and Liabilities. When the contract is closed, the Fund realizes a gain or loss equal to the difference between the closing value and the value at the time it was opened. Non-deliverable forward foreign currency exchange contracts are settled with the counterparty in cash without the delivery of foreign currency. The net realized gain (loss) and change in net unrealized appreciation (depreciation) on forward foreign currency contracts during the period is presented in the Statement of Operations.
Any open forward foreign currency contracts at period end are presented in the Schedule of Investments under the caption "Forward Foreign Currency Contracts." The contract amount and unrealized appreciation (depreciation) reflects each contract's exposure to the underlying currency at period end and is representative of volume of activity during the period.
Futures Contracts. A futures contract is an agreement between two parties to buy or sell a specified underlying instrument for a fixed price at a specified future date. The Fund used futures contracts to manage its exposure to the bond market and fluctuations in interest rates.
Upon entering into a futures contract, a fund is required to deposit either cash or securities (initial margin) with a clearing broker in an amount equal to a certain percentage of the face value of the contract. Futures contracts are marked-to-market daily and subsequent daily payments (variation margin) are made or received by a fund depending on the daily fluctuations in the value of the futures contracts and are recorded as unrealized appreciation or (depreciation). This receivable and/or payable, if any, is included in daily variation margin on futures contracts in the Statement of Assets and Liabilities. Realized gain or (loss) is recorded upon the expiration or closing of a futures contract. The net realized gain (loss) and change in net unrealized appreciation (depreciation) on futures contracts during the period is presented in the Statement of Operations.
Any open futures contracts at period end are presented in the Schedule of Investments under the caption "Futures Contracts". The notional amount at value reflects each contract's exposure to the underlying instrument or index at period end and is representative of volume of activity during the period. Cash deposited to meet initial margin requirements is presented as segregated cash with brokers for derivative instruments in the Statement of Assets and Liabilities.
Swaps. A swap is a contract between two parties to exchange future cash flows at periodic intervals based on a notional principal amount. A bi-lateral OTC swap is a transaction between a fund and a dealer counterparty where cash flows are exchanged between the two parties for the life of the swap. A centrally cleared OTC swap is a transaction executed between a fund and a dealer counterparty, then cleared by a futures commission merchant (FCM) through a clearinghouse. Once cleared, the clearinghouse serves as a central counterparty, with whom a fund exchanges cash flows for the life of the transaction, similar to transactions in futures contracts.
Bi-lateral OTC swaps are marked-to-market daily and changes in value are reflected in the Statement of Assets and Liabilities in the bi-lateral OTC swaps at value line items. Any upfront premiums paid or received upon entering a bi-lateral OTC swap to compensate for differences between stated terms of the swap and prevailing market conditions (e.g. credit spreads, interest rates or other factors) are recorded in net unrealized appreciation (depreciation) in the Statement of Assets and Liabilities and amortized to realized gain or (loss) ratably over the term of the swap. Any unamortized upfront premiums are presented in the Schedule of Investments.
Centrally cleared OTC swaps require a fund to deposit either cash or securities (initial margin) with the FCM, at the instruction of and for the benefit of the clearinghouse. Cash deposited to meet initial margin requirements is presented in segregated cash with brokers for derivative instruments in the Statement of Assets and Liabilities. Centrally cleared OTC swaps are marked-to-market daily and subsequent payments (variation margin) are made or received depending on the daily fluctuations in the value of the swaps and are recorded as unrealized appreciation or (depreciation). These daily payments, if any, are included in receivable or payable for daily variation margin on centrally cleared OTC swaps in the Statement of Assets and Liabilities. Any premiums for centrally cleared OTC swaps are recorded periodically throughout the term of the swap to variation margin and included in unrealized appreciation (depreciation) in the Statement of Assets and Liabilities. Any premiums are recognized as realized gain (loss) upon termination or maturity of the swap.
For both bi-lateral and centrally cleared OTC swaps, payments are exchanged at specified intervals, accrued daily commencing with the effective date of the contract and recorded as realized gain or (loss). Some swaps may be terminated prior to the effective date and realize a gain or loss upon termination. The net realized gain (loss) and change in net unrealized appreciation (depreciation) on swaps during the period is presented in the Statement of Operations.
Any open swaps at period end are included in the Schedule of Investments under the caption "Swaps" and are representative of volume of activity during the period.
Credit Default Swaps. Credit default swaps enable the Fund to buy or sell protection against specified credit events on a single-name issuer or a traded credit index. Under the terms of a credit default swap the buyer of protection (buyer) receives credit protection in exchange for making periodic payments to the seller of protection (seller) based on a fixed percentage applied to a notional principal amount. In return for these payments, the seller will be required to make a payment upon the occurrence of one or more specified credit events. The Fund enters into credit default swaps as a seller to gain credit exposure to an issuer and/or as a buyer to obtain a measure of protection against defaults of an issuer. Periodic payments are made over the life of the contract by the buyer provided that no credit event occurs.
For credit default swaps on most corporate and sovereign issuers, credit events include bankruptcy, failure to pay or repudiation/moratorium. For credit default swaps on corporate or sovereign issuers, the obligation that may be put to the seller is not limited to the specific reference obligation described in the Schedule of Investments. For credit default swaps on asset-backed securities, a credit event may be triggered by events such as failure to pay principal, maturity extension, rating downgrade or write-down. For credit default swaps on asset-backed securities, the reference obligation described represents the security that may be put to the seller. For credit default swaps on a traded credit index, a specified credit event may affect all or individual underlying securities included in the index.
As a seller, if an underlying credit event occurs, the Fund will pay a net settlement amount of cash equal to the notional amount of the swap less the recovery value of the reference obligation or underlying securities comprising an index. Only in the event of the industry's inability to value the underlying asset will the Fund be required to take delivery of the reference obligation or underlying securities comprising an index and pay an amount equal to the notional amount of the swap.
As a buyer, if an underlying credit event occurs, the Fund will receive a net settlement amount of cash equal to the notional amount of the swap less the recovery value of the reference obligation or underlying securities comprising an index. Only in the event of the industry's inability to value the underlying asset will the Fund be required to deliver the reference obligation or underlying securities comprising an index in exchange for payment of an amount equal to the notional amount of the swap.
Typically, the value of each credit default swap and credit rating disclosed for each reference obligation in the Schedule of Investments, where the Fund is the seller, can be used as measures of the current payment/performance risk of the swap. As the value of the swap changes as a positive or negative percentage of the total notional amount, the payment/performance risk may decrease or increase, respectively. In addition to these measures, the investment adviser monitors a variety of factors including cash flow assumptions, market activity and market sentiment as part of its ongoing process of assessing payment/performance risk.
4. Purchases and Sales of Investments.
Purchases and sales of securities, other than short-term securities and in-kind transactions, as applicable, are noted in the table below.
| Purchases ($) | Sales ($) | |
| Strategic Advisers Income Opportunities Fund | 1,222,480,234 | 1,920,714,062 |
Prior Fiscal Year Unaffiliated Exchanges In-Kind. During the prior period, the Fund redeemed 80,136,437 shares of T. Rowe Price High Yield Fund Advisor Class in exchange for investments, including interest and cash with a value of $510,469,102. The Fund had a net realized gain of $15,328,811 on the Fund's redemptions of T. Rowe Price High Yield Fund Advisor Class shares. The Fund recognized a net realized gain on the exchanges for federal income tax purposes.
5. Fees and Other Transactions with Affiliates.
Management Fee. Strategic Advisers (the investment adviser) provides the Fund with investment management related services. For these services, the Fund pays a monthly management fee to the investment adviser. The management fee is calculated by adding the annual management fee rate of .25% of the Fund's average net assets throughout the month to the aggregate of the fee rates, payable monthly by the investment adviser, to the Fund's sub-advisers. The Fund's maximum aggregate management fee will not exceed .75% of the Fund's average net assets. For the reporting period, the total annualized management fee rate was .37% of the Fund's average net assets.
During the period, the investment adviser waived a portion of its management fee as described in the Expense Reductions note.
Sub-Adviser. FIAM LLC (an affiliate of the investment adviser), PGIM, Inc. and T. Rowe Price Associates, Inc. each served as a sub-adviser for the Fund during the period. Sub-advisers provide discretionary investment advisory services for their allocated portion of the Fund's assets and are paid as described in the Management Fee note.
Interfund Trades. Funds may purchase from or sell securities to other funds affiliated with each sub-adviser under procedures adopted by the Board. The procedures have been designed to ensure these interfund trades are executed in accordance with Rule 17a-7 of the 1940 Act. Any interfund trades are included within the respective purchases and sales amounts shown in the Purchases and Sales of Investments note.
6. Investments in Fidelity Central Funds.
Funds may invest in Fidelity Central Funds, which are open-end investment companies generally available only to other investment companies and accounts managed by the investment adviser and its affiliates. The Schedule of Investments lists any Fidelity Central Funds held as an investment as of period end, but does not include the underlying holdings of each Fidelity Central Fund. An investing fund indirectly bears its proportionate share of the expenses of the underlying Fidelity Central Funds.
Based on its investment objective, each Fidelity Central Fund may invest or participate in various investment vehicles or strategies that are similar to those of the investing fund. These strategies are consistent with the investment objectives of the investing fund and may involve certain economic risks which may cause a decline in value of each of the Fidelity Central Funds and thus a decline in the value of the investing fund.
| Fidelity Central Fund | Investment Manager | Investment Objective | Investment Practices | Expense Ratio(a) |
| Fidelity Money Market Central Funds | Fidelity Management & Research Company LLC (FMR) | Each fund seeks to obtain a high level of current income consistent with the preservation of capital and liquidity. | Short-term Investments | Less than .005% to .01% |
(a) Expenses expressed as a percentage of average net assets and are as of each underlying Central Fund's most recent annual or semi-annual shareholder report.
A complete unaudited list of holdings for each Fidelity Central Fund is available upon request or at the Securities and Exchange Commission website at www.sec.gov. In addition, the financial statements of the Fidelity Central Funds, which are not covered by the Report of Independent Registered Public Accounting Firm, are available on the Securities and Exchange Commission website or upon request.
7. Committed Line of Credit.
Certain Funds participate with other funds managed by the investment adviser or an affiliate in a $4.25 billion credit facility (the "line of credit") to be utilized for temporary or emergency purposes to fund shareholder redemptions or for other short-term liquidity purposes. The participating funds have agreed to pay commitment fees on their pro-rata portion of the line of credit, which are reflected in Miscellaneous expenses on the Statement of Operations, and are listed below. During the period, there were no borrowings on this line of credit.
| Amount | |
| Strategic Advisers Income Opportunities Fund | $6,592 |
8. Expense Reductions.
The investment adviser has contractually agreed to waive the Fund's management fee in an amount equal to .25% of the Fund's average net assets until September 30, 2023. During the period, this waiver reduced the Fund's management fee by $ 8,947,905.
Commissions paid to certain brokers with whom the investment adviser, or its affiliates, places trades on behalf of the Fund include an amount in addition to trade execution, which may be rebated back to the Fund to offset expenses. This amount totaled $5,530 for the period.
9. Other.
Fund's organizational documents provide former and current trustees and officers with a limited indemnification against liabilities arising in connection with the performance of their duties to the fund. In the normal course of business, the fund may also enter into contracts that provide general indemnifications. The fund's maximum exposure under these arrangements is unknown as this would be dependent on future claims that may be made against the fund. The risk of material loss from such claims is considered remote.
10. Coronavirus (COVID-19) Pandemic.
An outbreak of COVID-19 first detected in China during December 2019 has since spread globally and was declared a pandemic by the World Health Organization during March 2020. Developments that disrupt global economies and financial markets, such as the COVID-19 pandemic, may magnify factors that affect the Fund's performance.
Shareholder Expense Example
As a shareholder, you incur two types of costs: (1) transaction costs, which may include sales charges (loads) on purchase payments or redemption proceeds, as applicable and (2) ongoing costs, which generally include management fees, distribution and/or service (12b-1) fees and other Fund expenses. This Example is intended to help you understand your ongoing costs (in dollars) of investing in a fund and to compare these costs with the ongoing costs of investing in other mutual funds.
The Example is based on an investment of $1,000 invested at the beginning of the period and held for the entire period (March 1, 2021 to August 31, 2021).
Actual Expenses
The first line of the accompanying table provides information about actual account values and actual expenses. You may use the information in this line, together with the amount you invested, to estimate the expenses that you paid over the period. Simply divide your account value by $1,000.00 (for example, an $8,600 account value divided by $1,000.00 = 8.6), then multiply the result by the number in the first line for a class/Fund under the heading entitled "Expenses Paid During Period" to estimate the expenses you paid on your account during this period. If any fund is a shareholder of any underlying mutual funds or exchange-traded funds (ETFs) (the Underlying Funds), such fund indirectly bears its proportional share of the expenses of the Underlying Funds in addition to the direct expenses incurred presented in the table. These fees and expenses are not included in the annualized expense ratio used to calculate the expense estimate in the table below.
Hypothetical Example for Comparison Purposes
The second line of the accompanying table provides information about hypothetical account values and hypothetical expenses based on the actual expense ratio and an assumed rate of return of 5% per year before expenses, which is not the actual return. The hypothetical account values and expenses may not be used to estimate the actual ending account balance or expenses you paid for the period. You may use this information to compare the ongoing costs of investing in the Fund and other funds. To do so, compare this 5% hypothetical example with the 5% hypothetical examples that appear in the shareholder reports of the other funds. If any fund is a shareholder of any Underlying Funds, such fund indirectly bears its proportional share of the expenses of the Underlying Funds in addition to the direct expenses as presented in the table. These fees and expenses are not included in the annualized expense ratio used to calculate the expense estimate in the table below.
Please note that the expenses shown in the table are meant to highlight your ongoing costs only and do not reflect any transaction costs. Therefore, the second line of the table is useful in comparing ongoing costs only, and will not help you determine the relative total costs of owning different funds.
| Annualized Expense Ratio-A | Beginning Account Value March 1, 2021 | Ending Account Value August 31, 2021 | Expenses Paid During Period-B March 1, 2021 to August 31, 2021 |
|
| Strategic Advisers Income Opportunities Fund | .13% | |||
| Actual | $1,000.00 | $1,040.90 | $.67 | |
| Hypothetical-C | $1,000.00 | $1,024.55 | $.66 |
A Annualized expense ratio reflects expenses net of applicable fee waivers.
B Expenses are equal to the annualized expense ratio, multiplied by the average account value over the period, multiplied by 184/ 365 (to reflect the one-half year period). The fees and expenses of any Underlying Funds are not included in each annualized expense ratio.
C 5% return per year before expenses
Board Approval of Amended Sub-Advisory Agreement
Strategic Advisers Income Opportunities Fund
In March 2021, the Board of Trustees, including the Independent Trustees (together, the Board) voted to approve an amendment to lower the fee schedule in the existing sub-advisory agreement among Strategic Advisers LLC (Strategic Advisers), T. Rowe Price Associates, Inc. (TRPA), and Fidelity Rutland Square Trust II (Trust) on behalf of the fund (Amended Sub-Advisory Agreement). The Board noted that the updated fee schedule in the Amended Sub-Advisory Agreement will result in the same or lower fees at all asset levels. The Board also noted that no other material contract terms are impacted by the Amended Sub-Advisory Agreement. The Board, assisted by the advice of fund counsel and Independent Trustees' counsel, considered a broad range of information.In considering whether to approve the Amended Sub-Advisory Agreement, the Board reached a determination, with the assistance of fund counsel and Independent Trustees' counsel and through the exercise of its business judgment, that the approval of the Amended Sub-Advisory Agreement is in the best interests of the fund and its shareholders and that the approval of such agreement does not involve a conflict of interest from which Strategic Advisers or its affiliates derive an inappropriate advantage. Also, the Board found that the fees to be charged under the Amended Sub-Advisory Agreement bear a reasonable relationship to the services to be rendered and will be based on services provided that will be in addition to, rather than duplicative of services provided under the advisory contract of any underlying fund in which the fund may invest. The Board's decision to approve the Amended Sub-Advisory Agreement was not based on any single factor, but rather was based on a comprehensive consideration of all the information provided to the Board. In addition, individual Trustees did not necessarily attribute the same weight or importance to each factor. Nature, Extent, and Quality of Services Provided. The Board considered the backgrounds of the investment personnel that will provide services to the fund, and also considered the fund's investment objective, strategies and related investment philosophy and current sub-adviser line-up, as well as the structures of the investment personnel compensation programs and whether such structures provide appropriate incentives to act in the best interests of the fund, at its September 2020 meeting. The Board considered the detailed information provided by Strategic Advisers and by TRPA with respect to the other funds it sub-advises in the June 2020 annual contract renewal materials.The Board noted that it had approved the existing sub-advisory agreement with TRPA at its September 2020 meeting and that the Amended Sub-Advisory Agreement will not result in any changes to: (i) the nature, extent and quality of the sub-advisory services provided; (ii) the investment process or strategies employed in the management of the fund's assets; or (iii) the day-to-day management of the fund or the persons primarily responsible for such management. Investment Performance. The Board did not consider performance to be a material factor in its decision to approve the Amended Sub-Advisory Agreement because the approval of the Amended Sub-Advisory Agreement will not result in any changes (i) to the fund's investment processes or strategies; or (ii) in the persons primarily responsible for the day-to-day management of the fund.Based on its review, the Board concluded that the nature, extent, and quality of services that will be provided to the fund under the Amended Sub-Advisory Agreement will continue to benefit the fund's shareholders. Competitiveness of Management Fee and Total Fund Expenses. The Board noted that the Amended Sub-Advisory Agreement will not result in changes to the maximum aggregate annual management fee payable by the fund or Strategic Advisers' portion of the management fee. The Board considered Strategic Advisers' contractual agreement to waive its portion of the fund's management fee. The Board considered that the Amended Sub-Advisory Agreement is expected to result in a decrease in the total management fee rate of the fund. Based on its review, the Board concluded that the fund's management fee structure and any changes to projected total expenses bear a reasonable relationship to the services that the fund and its shareholders will receive and the other factors considered.Because the Amended Sub-Advisory Agreement was negotiated at arm's length and will have no impact on the maximum management fees payable by the fund, the Board did not consider the costs of services and profitability of the relationship with the fund to Strategic Advisers to be significant factors in its decision to approve the Amended Sub-Advisory Agreement. Potential Fall-Out Benefits. The Board considered that it reviews information regarding the potential of direct and indirect benefits to Strategic Advisers and its affiliates from their relationships with the fund, including non-advisory fee compensation paid to affiliates of Strategic Advisers, if any, as well as information regarding potential fall-out benefits accruing to each sub-adviser, if any, as a result of its relationship with the fund, during its annual renewal of the fund's management contract, sub-advisory agreements, and sub-subadvisory agreements. The Board considered Strategic Advisers' representation that it does not anticipate that the approval of the Amended Sub-Advisory Agreement will have a significant impact on the profitability of, or potential fall-out benefits to, Strategic Advisers or its affiliates. Possible Economies of Scale. The Board considered that it reviews whether there have been economies of scale in connection with the management of the fund during its annual renewal of the fund's management contract, sub-advisory agreements, and sub-subadvisory agreements. The Board noted that the Amended Sub-Advisory Agreement will continue to provide for breakpoints that have the potential to reduce sub-advisory fees paid to the sub-adviser as assets allocated to the sub-adviser grow. The Board also noted that it did not consider the possible realization of economies of scale to be a significant factor in its decision to approve the Amended Sub-Advisory Agreement because the fund will not bear any additional management fees or expenses under the Amended Sub-Advisory Agreement. Conclusion. Based on its evaluation of all of the conclusions noted above, and after considering all factors it believed relevant, the Board concluded that the Amended Sub-Advisory Agreement's fee structure bears a reasonable relationship to the services to be rendered and that the Amended Sub-Advisory Agreement is in the best interests of the fund and its shareholders and should be approved. The Board also concluded that the sub-advisory fees to be charged under the Amended Sub-Advisory Agreement will be based on services provided that will be in addition to, rather than duplicative of, services provided under the advisory contract of any underlying fund in which the fund may invest. In addition, the Board concluded that the approval of the Amended Sub-Advisory Agreement does not involve a conflict of interest from which Strategic Advisers or its affiliates derive an inappropriate advantage.Board Approval of Investment Advisory Contracts and Management Fees
Strategic Advisers Income Opportunities Fund
In June 2021, the Board of Trustees, including the Independent Trustees (together, the Board) voted to approve an amendment to the existing sub-advisory agreement among Strategic Advisers LLC (Strategic Advisers), PGIM, Inc. (PGIM or Sub-Adviser), and Fidelity Rutland Square Trust II (Trust) on behalf of the fund to broaden the applicability of the most favored nation provision in the agreement by removing an exception (Amended Sub-Advisory Agreement). The Board also noted that no other material contract terms are impacted by the Amended Sub-Advisory Agreement. The Board, assisted by the advice of fund counsel and Independent Trustees' counsel, considered a broad range of information.In considering whether to approve the Amended Sub-Advisory Agreement, the Board reached a determination, with the assistance of fund counsel and Independent Trustees' counsel and through the exercise of its business judgment, that the approval of the Amended Sub-Advisory Agreement is in the best interests of the fund and its shareholders and that the approval of such agreement does not involve a conflict of interest from which Strategic Advisers or its affiliates derive an inappropriate advantage. Also, the Board found that the fees to be charged under the Amended Sub-Advisory Agreement bear a reasonable relationship to the services to be rendered and will be based on services provided that will be in addition to, rather than duplicative of services provided under the advisory contract of any underlying fund in which the fund may invest. The Board's decision to approve the Amended Sub-Advisory Agreement was not based on any single factor, but rather was based on a comprehensive consideration of all the information provided to the Board. In addition, individual Trustees did not necessarily attribute the same weight or importance to each factor. Nature, Extent, and Quality of Services Provided. The Board considered the backgrounds of the investment personnel that will provide services to the fund, and also considered the fund's investment objective, strategies and related investment philosophy and current sub-adviser line-up, as well as the structures of the investment personnel compensation programs and whether such structures provide appropriate incentives to act in the best interests of the fund, at its December 2019 meeting. The Board considered the detailed information provided by Strategic Advisers and the Sub-Adviser in the June 2021 annual contract renewal materials.The Board noted that it had approved the existing sub-advisory agreement with the Sub-Adviser at its December 2019 meeting and that the Amended Sub-Advisory Agreement will not result in any changes to: (i) the nature, extent and quality of the sub-advisory services provided; (ii) the investment process or strategies employed in the management of the fund's assets; or (iii) the day-to-day management of the fund or the persons primarily responsible for such management. Investment Performance. The Board did not consider performance to be a material factor in its decision to approve the Amended Sub-Advisory Agreement because the approval of the Amended Sub-Advisory Agreement will not result in any changes (i) to the fund's investment processes or strategies; or (ii) in the persons primarily responsible for the day-to-day management of the fund.Based on its review, the Board concluded that the nature, extent, and quality of services that will be provided to the fund under the Amended Sub-Advisory Agreement will continue to benefit the fund's shareholders.Competitiveness of Management Fee and Total Fund Expenses.
The Board noted that the Amended Sub-Advisory Agreement will not result in changes to the amount and nature of the fees that are currently paid by Strategic Advisers to PGIM. The Board also noted that the Amended Sub-Advisory Agreement will not result in changes to the maximum aggregate annual management fee payable by the fund or Strategic Advisers' portion of the management fee. The Board considered Strategic Advisers' contractual agreement to waive its portion of the fund's management fee. Based on its review, the Board concluded that the fund's management fee structure and projected total expenses bear a reasonable relationship to the services that the fund and its shareholders will receive and the other factors considered.Because the Amended Sub-Advisory Agreement was negotiated at arm's length and will have no impact on the maximum management fees payable by the fund, the Board did not consider the costs of services and profitability of the relationship with the fund to Strategic Advisers to be significant factors in its decision to approve the Amended Sub-Advisory Agreement. Potential Fall-Out Benefits. The Board considered that it reviews information regarding the potential of direct and indirect benefits to Strategic Advisers and its affiliates from their relationships with the fund, including non-advisory fee compensation paid to affiliates of Strategic Advisers, if any, as well as information regarding potential fall-out benefits accruing to the Sub-Adviser, if any, as a result of its relationship with the fund, during its annual renewal of the fund's management contract, sub-advisory agreements, and sub-subadvisory agreements. The Board considered Strategic Advisers' representation that it does not anticipate that the approval of the Amended Sub-Advisory Agreement will have a significant impact on the profitability of, or potential fall-out benefits to, Strategic Advisers or its affiliates. Possible Economies of Scale. The Board considered that it reviews whether there have been economies of scale in connection with the management of the fund during its annual renewal of the fund's management contract, sub-advisory agreements, and sub-subadvisory agreements. The Board noted that the Amended Sub-Advisory Agreement will continue to provide for breakpoints that have the potential to reduce sub-advisory fees paid to the Sub-Adviser as assets allocated to the Sub-Adviser grow. The Board also noted that it did not consider the possible realization of economies of scale to be a significant factor in its decision to approve the Amended Sub-Advisory Agreement because the fund will not bear any additional management fees or expenses under the Amended Sub-Advisory Agreement. Conclusion. Based on its evaluation of all of the conclusions noted above, and after considering all factors it believed relevant, the Board concluded that the Amended Sub-Advisory Agreement's fee structure bears a reasonable relationship to the services to be rendered and that the Amended Sub-Advisory Agreement is in the best interests of the fund and its shareholders and should be approved. The Board also concluded that the sub-advisory fees to be charged under the Amended Sub-Advisory Agreement will be based on services provided that will be in addition to, rather than duplicative of, services provided under the advisory contract of any underlying fund in which the fund may invest. In addition, the Board concluded that the approval of the Amended Sub-Advisory Agreement does not involve a conflict of interest from which Strategic Advisers or its affiliates derive an inappropriate advantage.
![]()
SRQ-SANN-1021
1.912883.111
Strategic Advisers® International Fund
Offered exclusively to certain managed account clients of Strategic Advisers LLC or its affiliates - not available for sale to the general public
Semi-Annual Report
August 31, 2021
Contents
To view a fund's proxy voting record for the 12-month period ended June 30, visit http://www.fidelity.com/proxyvotingresults or visit the Securities and Exchange Commission's (SEC) web site at http://www.sec.gov.
You may also call 1-800-544-3455 to request a free copy of the proxy voting guidelines.
Standard & Poor's, S&P and S&P 500 are registered service marks of The McGraw-Hill Companies, Inc. and have been licensed for use by Fidelity Distributors Corporation.
Other third-party marks appearing herein are the property of their respective owners.
All other marks appearing herein are registered or unregistered trademarks or service marks of FMR LLC or an affiliated company. © 2021 FMR LLC. All rights reserved.
This report and the financial statements contained herein are submitted for the general information of the shareholders of the Fund. This report is not authorized for distribution to prospective investors in the Fund unless preceded or accompanied by an effective prospectus.
A fund files its complete schedule of portfolio holdings with the SEC for the first and third quarters of each fiscal year on Form N-PORT. Forms N-PORT are available on the SEC’s web site at http://www.sec.gov. A fund's Forms N-PORT may be reviewed and copied at the SEC’s Public Reference Room in Washington, DC. Information regarding the operation of the SEC's Public Reference Room may be obtained by calling 1-800-SEC-0330.
For a complete list of a fund's portfolio holdings, view the most recent holdings listing, semiannual report, or annual report on Fidelity's web site at http://www.fidelity.com, http://www.institutional.fidelity.com, or http://www.401k.com, as applicable.
NOT FDIC INSURED •MAY LOSE VALUE •NO BANK GUARANTEE
Neither the Fund nor Fidelity Distributors Corporation is a bank.
Note to Shareholders:
Early in 2020, the outbreak and spread of COVID-19 emerged as a public health emergency that had a major influence on financial markets, primarily based on its impact on the global economy and corporate earnings. On March 11, 2020, the World Health Organization declared the COVID-19 outbreak a pandemic, citing sustained risk of further global spread. The pandemic prompted a number of measures to limit the spread of COVID-19, including travel and border restrictions, quarantines, and restrictions on large gatherings. In turn, these resulted in lower consumer activity, diminished demand for a wide range of products and services, disruption in manufacturing and supply chains, and – given the wide variability in outcomes regarding the outbreak – significant market uncertainty and volatility. To help stem the turmoil, the U.S. government took unprecedented action – in concert with the U.S. Federal Reserve and central banks around the world – to help support consumers, businesses, and the broader economy, and to limit disruption to the financial system.
In general, the overall impact of the pandemic lessened in 2021, amid a resilient economy and widespread distribution of three COVID-19 vaccines granted emergency use authorization from the U.S. Food and Drug Administration (FDA) early in the year. Still, the situation remains dynamic, and the extent and duration of its influence on financial markets and the economy is highly uncertain, due in part to a recent spike in cases based on highly contagious variants of the coronavirus.
Extreme events such as the COVID-19 crisis are exogenous shocks that can have significant adverse effects on mutual funds and their investments. Although multiple asset classes may be affected by market disruption, the duration and impact may not be the same for all types of assets. Fidelity is committed to helping you stay informed amid news about COVID-19 and during increased market volatility, and we continue to take extra steps to be responsive to customer needs. We encourage you to visit us online, where we offer ongoing updates, commentary, and analysis on the markets and our funds.
Investment Summary (Unaudited)
The information in the following tables is based on the direct investments of the Fund.Top Ten Holdings as of August 31, 2021
| (excluding cash equivalents) | % of fund's net assets |
| Fidelity Advisor International Discovery Fund - Class Z | 5.3 |
| Fidelity SAI Japan Stock Index Fund | 5.2 |
| Fidelity SAI International Value Index Fund | 4.2 |
| Oakmark International Fund Investor Class | 4.0 |
| Artisan International Value Fund Investor Class | 3.9 |
| Fidelity Overseas Fund | 3.6 |
| WCM Focused International Growth Fund Investor Class | 3.1 |
| Fidelity Diversified International Fund | 3.0 |
| JOHCM International Select Fund Investor Shares | 2.7 |
| Fidelity SAI International Index Fund | 2.6 |
| 37.6 |
Top Five Market Sectors as of August 31, 2021
| (stocks only) | % of fund's net assets |
| Industrials | 8.4 |
| Information Technology | 7.1 |
| Financials | 6.2 |
| Health Care | 5.0 |
| Consumer Staples | 5.0 |
Geographic Diversification (% of fund's net assets)
| As of August 31, 2021 | ||
| United States of America* | 56.7% | |
| Japan | 8.0% | |
| United Kingdom | 5.9% | |
| Switzerland | 5.1% | |
| France | 4.9% | |
| Germany | 4.6% | |
| Netherlands | 2.8% | |
| Sweden | 0.8% | |
| Canada | 1.1% | |
| Other | 10.1% | |

* Includes Short-Term investments and Net Other Assets (Liabilities).
Percentages are based on country or territory of incorporation and are adjusted for the effect of futures contracts, if applicable.
Asset Allocation (% of fund's net assets)
| As of August 31, 2021 | ||
| Common Stocks | 44.0% | |
| Preferred Stocks | 0.4% | |
| Europe Stock Funds | 0.4% | |
| Foreign Large Blend Funds | 9.2% | |
| Foreign Large Growth Funds | 19.2% | |
| Foreign Large Value Funds | 11.1% | |
| Foreign Small Mid Growth Funds | 0.9% | |
| Foreign Small Mid Blend Funds | 1.5% | |
| Foreign Small Mid Value Funds | 1.1% | |
| Other | 6.5% | |
| Short-Term Investments and Net Other Assets (Liabilities) | 5.7% | |

Asset allocations of funds in the pie chart reflect the categorizations of assets as defined by Morningstar as of the reporting date.
Schedule of Investments August 31, 2021 (Unaudited)
Showing Percentage of Net Assets
| Common Stocks - 44.0% | |||
| Shares | Value | ||
| COMMUNICATION SERVICES - 1.6% | |||
| Diversified Telecommunication Services - 0.4% | |||
| Cellnex Telecom SA (a) | 142,847 | $9,782,663 | |
| Deutsche Telekom AG | 216,749 | 4,608,789 | |
| Hellenic Telecommunications Organization SA | 346,950 | 6,827,004 | |
| Internet Initiative Japan, Inc. | 8,300 | 289,329 | |
| Koninklijke KPN NV | 1,630,204 | 5,222,143 | |
| KT Corp. | 164,909 | 4,662,804 | |
| Liberty Global PLC Class C (b) | 486,600 | 14,101,668 | |
| Nippon Telegraph & Telephone Corp. | 1,181,700 | 31,483,788 | |
| Nippon Telegraph & Telephone Corp. sponsored ADR | 7,923 | 212,099 | |
| NOS SGPS | 74,987 | 316,091 | |
| Orange SA | 653,614 | 7,431,069 | |
| Proximus | 26,927 | 527,940 | |
| Telecom Italia SpA (Risparmio Shares) | 7,680,092 | 3,708,015 | |
| Telstra Corp. Ltd. | 64,914 | 182,353 | |
| 89,355,755 | |||
| Entertainment - 0.4% | |||
| CTS Eventim AG (b) | 51,718 | 3,335,426 | |
| Konami Holdings Corp. | 21,600 | 1,370,431 | |
| NetEase, Inc. | 358,675 | 6,866,402 | |
| NetEase, Inc. ADR | 240,025 | 23,383,236 | |
| Nintendo Co. Ltd. | 39,200 | 18,833,227 | |
| Nintendo Co. Ltd. ADR | 37,985 | 2,282,139 | |
| Sea Ltd. ADR (b) | 40,081 | 13,560,204 | |
| Square Enix Holdings Co. Ltd. | 178,300 | 10,388,611 | |
| Ubisoft Entertainment SA (b) | 139,600 | 8,867,662 | |
| 88,887,338 | |||
| Interactive Media & Services - 0.4% | |||
| Bengo4.Com, Inc. (b) | 16,200 | 1,023,406 | |
| carsales.com Ltd. | 229,365 | 4,211,578 | |
| Info Edge India Ltd. | 34,221 | 2,900,114 | |
| Kakao Corp. | 67,018 | 8,963,453 | |
| NAVER Corp. | 61,419 | 23,265,877 | |
| REA Group Ltd. | 28,794 | 3,233,362 | |
| Scout24 AG (a) | 104,370 | 8,774,323 | |
| SEEK Ltd. | 190,255 | 4,528,951 | |
| Tencent Holdings Ltd. | 561,100 | 34,655,107 | |
| Trustpilot Group PLC (a)(b)(c) | 420,871 | 2,499,701 | |
| Yandex NV Series A (b) | 89,037 | 6,846,945 | |
| Z Holdings Corp. | 1,106,600 | 7,212,037 | |
| 108,114,854 | |||
| Media - 0.2% | |||
| Arnoldo Mondadori Editore SpA (b) | 66,040 | 145,661 | |
| CyberAgent, Inc. | 688,600 | 12,649,735 | |
| Eutelsat Communications | 171,546 | 1,981,373 | |
| Hakuhodo DY Holdings, Inc. | 132,500 | 2,084,784 | |
| Informa PLC (b) | 1,266,069 | 9,242,878 | |
| Mediaset SpA | 109,336 | 340,820 | |
| Publicis Groupe SA | 59,246 | 3,883,886 | |
| SES SA (France) (depositary receipt) | 62,583 | 522,289 | |
| Stroer Out-of-Home Media AG | 65,599 | 5,398,685 | |
| WPP PLC | 975,335 | 13,224,427 | |
| WPP PLC ADR (c) | 50,688 | 3,441,715 | |
| 52,916,253 | |||
| Wireless Telecommunication Services - 0.2% | |||
| Advanced Info Service PCL (For. Reg.) | 1,014,200 | 5,909,487 | |
| KDDI Corp. | 463,400 | 14,164,006 | |
| Millicom International Cellular SA (b)(c) | 7,500 | 282,675 | |
| SoftBank Group Corp. | 275,200 | 15,508,557 | |
| Tele2 AB (B Shares) | 129,128 | 1,935,547 | |
| Vodafone Group PLC sponsored ADR (c) | 749,078 | 12,786,761 | |
| 50,587,033 | |||
| TOTAL COMMUNICATION SERVICES | 389,861,233 | ||
| CONSUMER DISCRETIONARY - 4.1% | |||
| Auto Components - 0.5% | |||
| Aisin Seiki Co. Ltd. | 46,000 | 1,758,215 | |
| Autoliv, Inc. (depositary receipt) (c) | 70,131 | 6,244,739 | |
| Bridgestone Corp. | 188,700 | 8,685,877 | |
| Compagnie Generale des Etablissements Michelin SCA Series B | 65,349 | 10,579,735 | |
| Continental AG (b) | 86,845 | 11,670,897 | |
| DENSO Corp. | 109,900 | 7,701,941 | |
| Eagle Industry Co. Ltd. | 41,300 | 469,254 | |
| JTEKT Corp. | 73,600 | 665,655 | |
| Koito Manufacturing Co. Ltd. | 200,000 | 12,234,695 | |
| Magna International, Inc. Class A | 190,796 | 15,055,712 | |
| Musashi Seimitsu Industry Co. Ltd. | 44,100 | 776,455 | |
| NGK Spark Plug Co. Ltd. | 12,100 | 186,095 | |
| Piolax, Inc. | 60,500 | 839,186 | |
| Shoei Co. Ltd. | 18,300 | 803,427 | |
| Stanley Electric Co. Ltd. | 201,200 | 5,025,657 | |
| Sumitomo Rubber Industries Ltd. | 226,000 | 2,709,576 | |
| Toyoda Gosei Co. Ltd. | 11,100 | 236,095 | |
| Toyota Industries Corp. | 420,600 | 35,516,739 | |
| TPR Co. Ltd. | 19,100 | 258,162 | |
| Valeo SA | 412,347 | 11,724,040 | |
| Yorozu Corp. | 17,400 | 188,527 | |
| 133,330,679 | |||
| Automobiles - 0.3% | |||
| Honda Motor Co. Ltd. | 417,900 | 12,648,430 | |
| Honda Motor Co. Ltd. sponsored ADR | 86,139 | 2,606,566 | |
| Isuzu Motors Ltd. | 121,900 | 1,542,379 | |
| Mazda Motor Corp. (b) | 322,300 | 2,797,768 | |
| Mitsubishi Motors Corp. of Japan (b) | 418,300 | 1,068,421 | |
| Nissan Motor Co. Ltd. (b) | 752,100 | 3,945,588 | |
| Nissan Motor Co. Ltd. sponsored ADR (b)(c) | 68,800 | 723,088 | |
| Porsche Automobil Holding SE ADR | 82,300 | 827,938 | |
| Renault SA (b) | 89,223 | 3,313,259 | |
| Stellantis NV | 496,064 | 9,921,054 | |
| Suzuki Motor Corp. | 175,800 | 7,599,916 | |
| Toyota Motor Corp. | 279,600 | 24,351,300 | |
| Yamaha Motor Co. Ltd. | 314,100 | 7,994,183 | |
| 79,339,890 | |||
| Distributors - 0.0% | |||
| B&S Group SARL (a) | 89,741 | 928,224 | |
| Inchcape PLC | 679,229 | 8,586,640 | |
| Tadiran Group Ltd. | 329 | 42,861 | |
| 9,557,725 | |||
| Hotels, Restaurants & Leisure - 0.5% | |||
| Aristocrat Leisure Ltd. | 288,110 | 9,625,723 | |
| Compass Group PLC (b) | 2,100,652 | 43,399,374 | |
| Entain PLC (b) | 429,700 | 11,419,643 | |
| Evolution AB (a) | 66,032 | 10,639,252 | |
| Flutter Entertainment PLC (b) | 52,746 | 10,235,893 | |
| Food & Life Companies Ltd. (c) | 71,300 | 3,065,482 | |
| Greggs PLC | 32,864 | 1,374,469 | |
| Marston's PLC (b) | 673,775 | 799,894 | |
| Sands China Ltd. (b) | 6,270,000 | 20,142,996 | |
| Trainline PLC (a)(b) | 381,278 | 1,917,524 | |
| Yum China Holdings, Inc. | 152,144 | 9,365,985 | |
| 121,986,235 | |||
| Household Durables - 0.5% | |||
| Barratt Developments PLC | 641,100 | 6,513,667 | |
| Crest Nicholson Holdings PLC | 75,968 | 438,458 | |
| Crompton Greaves Consumer Electricals Ltd. | 415,728 | 2,698,063 | |
| Electra Consumer Products 1970 Ltd. | 1,912 | 106,156 | |
| Forbo Holding AG (Reg.) | 439 | 940,560 | |
| Iida Group Holdings Co. Ltd. | 11,700 | 297,352 | |
| Nikon Corp. | 510,700 | 5,380,187 | |
| Panasonic Corp. | 907,100 | 10,844,448 | |
| Persimmon PLC | 574,387 | 23,217,062 | |
| Sangetsu Corp. | 10,500 | 153,565 | |
| Sekisui Chemical Co. Ltd. | 24,300 | 416,136 | |
| Sekisui House Ltd. | 153,000 | 3,049,848 | |
| Sony Group Corp. | 544,300 | 56,278,106 | |
| 110,333,608 | |||
| Internet & Direct Marketing Retail - 0.5% | |||
| Alibaba Group Holding Ltd. (b) | 551,916 | 11,556,896 | |
| Alibaba Group Holding Ltd. sponsored ADR (b) | 19,438 | 3,245,952 | |
| Allegro.eu SA (a)(b) | 221,415 | 4,104,977 | |
| ASKUL Corp. | 31,200 | 488,922 | |
| ASOS PLC (b) | 193,245 | 10,319,123 | |
| Boohoo.Com PLC (b) | 468,798 | 1,822,078 | |
| Coupang, Inc. Class A (b)(c) | 61,813 | 1,851,917 | |
| HelloFresh AG (b) | 75,413 | 8,127,927 | |
| JD.com, Inc. Class A (b) | 160,400 | 6,303,973 | |
| Meituan Class B (a)(b) | 175,100 | 5,598,748 | |
| MercadoLibre, Inc. (b) | 4,866 | 9,087,012 | |
| Ocado Group PLC (b) | 121,841 | 3,372,039 | |
| Prosus NV | 91,709 | 8,117,670 | |
| Rakuten Group, Inc. | 1,492,200 | 15,625,273 | |
| THG PLC | 388,293 | 3,285,814 | |
| Zalando SE (a)(b) | 189,109 | 20,944,644 | |
| ZOZO, Inc. | 86,700 | 3,305,972 | |
| 117,158,937 | |||
| Leisure Products - 0.1% | |||
| Sega Sammy Holdings, Inc. | 560,200 | 7,566,761 | |
| SHIMANO, Inc. | 15,500 | 4,550,743 | |
| Thule Group AB (a) | 53,347 | 2,911,708 | |
| Yamaha Corp. | 110,200 | 6,500,914 | |
| 21,530,126 | |||
| Multiline Retail - 0.1% | |||
| Harvey Norman Holdings Ltd. | 80,288 | 315,993 | |
| Magazine Luiza SA | 936,900 | 3,304,915 | |
| Marks & Spencer Group PLC (b) | 737,812 | 1,820,814 | |
| Next PLC | 84,531 | 9,192,800 | |
| Shinsegae Co. Ltd. | 2,718 | 630,890 | |
| Tokmanni Group Corp. | 20,527 | 591,389 | |
| Wesfarmers Ltd. | 78,906 | 3,460,535 | |
| 19,317,336 | |||
| Specialty Retail - 0.2% | |||
| Geo Holdings Corp. | 16,700 | 181,094 | |
| H&M Hennes & Mauritz AB (B Shares) (b) | 317,635 | 6,366,356 | |
| Halfords Group PLC | 126,511 | 632,423 | |
| JD Sports Fashion PLC | 24,975 | 346,631 | |
| Kingfisher PLC | 5,997,135 | 28,876,356 | |
| Mekonomen AB (b) | 70,377 | 1,321,998 | |
| Sleep Country Canada Holdings, Inc. (a) | 9,400 | 253,096 | |
| USS Co. Ltd. | 96,400 | 1,595,641 | |
| WH Smith PLC (b) | 696,791 | 15,634,284 | |
| 55,207,879 | |||
| Textiles, Apparel & Luxury Goods - 1.4% | |||
| adidas AG | 81,238 | 28,819,695 | |
| adidas AG sponsored ADR | 3,088 | 548,120 | |
| Asics Corp. | 33,800 | 717,384 | |
| Brunello Cucinelli SpA (b) | 40,160 | 2,366,204 | |
| Burberry Group PLC | 209,962 | 5,367,749 | |
| Canada Goose Holdings, Inc. (b) | 79,020 | 3,031,997 | |
| Compagnie Financiere Richemont SA: | |||
| ADR | 21,100 | 231,784 | |
| warrants 11/22/23 (b) | 562,417 | 288,655 | |
| Series A | 694,008 | 76,598,519 | |
| Dr. Martens Ltd. (b) | 936,378 | 5,440,465 | |
| Essilor International SA | 183,783 | 36,078,716 | |
| Gildan Activewear, Inc. | 541 | 20,797 | |
| Hermes International SCA | 4,382 | 6,439,101 | |
| Hugo Boss AG | 19,372 | 1,081,001 | |
| Kering SA | 33,477 | 26,641,850 | |
| Li Ning Co. Ltd. | 1,050,000 | 14,108,095 | |
| lululemon athletica, Inc. (b) | 27,092 | 10,841,406 | |
| LVMH Moet Hennessy Louis Vuitton SE | 104,760 | 77,607,294 | |
| Moncler SpA | 212,240 | 13,582,649 | |
| Pandora A/S | 44,544 | 5,332,663 | |
| Puma AG | 92,373 | 11,212,336 | |
| Salvatore Ferragamo Italia SpA (b) | 71,453 | 1,458,725 | |
| Samsonite International SA (a)(b) | 1,750,200 | 3,663,573 | |
| Seiren Co. Ltd. | 23,100 | 401,885 | |
| Swatch Group AG (Bearer) | 13,741 | 3,874,339 | |
| Swatch Group AG (Bearer) (Reg.) | 86,127 | 4,735,457 | |
| TSI Holdings Co. Ltd. (b) | 14,600 | 41,140 | |
| 340,531,599 | |||
| TOTAL CONSUMER DISCRETIONARY | 1,008,294,014 | ||
| CONSUMER STAPLES - 4.8% | |||
| Beverages - 1.2% | |||
| Anheuser-Busch InBev SA NV | 244,600 | 15,001,867 | |
| Carabao Group PCL | 386,400 | 1,676,616 | |
| Carlsberg A/S Series B | 4,849 | 846,508 | |
| Coca-Cola European Partners PLC | 104,657 | 6,042,895 | |
| Coca-Cola European Partners PLC | 3,930 | 229,883 | |
| Davide Campari Milano NV | 292,313 | 4,041,690 | |
| Diageo PLC | 1,864,727 | 89,642,419 | |
| Heineken Holding NV | 199,796 | 18,518,866 | |
| Heineken NV (Bearer) (c) | 242,189 | 26,508,924 | |
| ITO EN Ltd. | 399,200 | 25,255,029 | |
| Kirin Holdings Co. Ltd. | 1,589,700 | 28,812,996 | |
| Kweichow Moutai Co. Ltd. (A Shares) | 14,807 | 3,570,713 | |
| Pernod Ricard SA | 346,312 | 72,765,160 | |
| Royal Unibrew A/S | 21,089 | 2,723,602 | |
| Suntory Beverage & Food Ltd. | 32,900 | 1,317,316 | |
| Treasury Wine Estates Ltd. | 1,312 | 12,122 | |
| 296,966,606 | |||
| Food & Staples Retailing - 0.3% | |||
| Carrefour SA | 44,406 | 883,486 | |
| Casino Guichard Perrachon SA (b) | 131,236 | 3,807,291 | |
| G-7 Holdings, Inc. | 13,300 | 481,153 | |
| Heiwado Co. Ltd. | 56,100 | 1,117,258 | |
| J Sainsbury PLC | 185,458 | 775,130 | |
| Jeronimo Martins SGPS SA | 77,771 | 1,648,315 | |
| LIFE Corp. | 13,600 | 537,745 | |
| Matsumotokiyoshi Holdings Co. Ltd. | 11,300 | 523,838 | |
| Metcash Ltd. | 522,182 | 1,558,569 | |
| Ministop Co. Ltd. | 21,100 | 272,728 | |
| North West Co., Inc. | 9,200 | 261,128 | |
| Okuwa Co. Ltd. | 10,000 | 101,077 | |
| Qol Holdings Co. Ltd. | 60,100 | 853,850 | |
| Seven & i Holdings Co. Ltd. | 884,700 | 38,720,452 | |
| Sugi Holdings Co. Ltd. | 70,000 | 5,408,353 | |
| Tesco PLC | 5,592,552 | 19,633,339 | |
| Welcia Holdings Co. Ltd. | 135,400 | 4,781,430 | |
| Zur Rose Group AG (b) | 5,107 | 2,197,279 | |
| 83,562,421 | |||
| Food Products - 1.5% | |||
| Barry Callebaut AG | 2,902 | 7,396,416 | |
| Chacha Food Co. Ltd. (A Shares) | 226,000 | 1,280,645 | |
| Danone SA | 789,400 | 57,646,553 | |
| Dydo Group Holdings, Inc. | 2,100 | 107,276 | |
| Ezaki Glico Co. Ltd. | 209,600 | 7,925,610 | |
| Foshan Haitian Flavouring & Food Co. Ltd. (A Shares) | 207,870 | 3,055,937 | |
| Itoham Yonekyu Holdings, Inc. | 127,800 | 863,113 | |
| Kerry Group PLC Class A | 112,601 | 16,512,841 | |
| La Doria SpA | 41,028 | 882,646 | |
| Lindt & Spruengli AG (participation certificate) | 429 | 5,045,405 | |
| Mitsui Sugar Co. Ltd. | 3,200 | 56,283 | |
| Mowi ASA | 521,000 | 13,956,454 | |
| Nestle SA (Reg. S) | 1,749,978 | 221,002,714 | |
| Nippon Suisan Kaisha Co. Ltd. | 136,700 | 752,990 | |
| Nissin Food Holdings Co. Ltd. | 70,800 | 5,508,776 | |
| Orior AG | 9,536 | 978,852 | |
| Riken Vitamin Co. Ltd. | 23,000 | 381,121 | |
| Schouw & Co. | 812 | 88,056 | |
| Toyo Suisan Kaisha Ltd. | 486,800 | 20,155,197 | |
| Wilmar International Ltd. | 2,885,300 | 8,884,780 | |
| Yakult Honsha Co. Ltd. | 1,700 | 97,968 | |
| Yamazaki Baking Co. Ltd. | 33,400 | 547,989 | |
| 373,127,622 | |||
| Household Products - 0.4% | |||
| Colgate-Palmolive Co. | 276,743 | 21,572,117 | |
| Essity AB (B Shares) | 229,500 | 7,361,489 | |
| Lion Corp. | 270,800 | 4,610,357 | |
| Reckitt Benckiser Group PLC | 811,777 | 61,972,049 | |
| 95,516,012 | |||
| Personal Products - 1.1% | |||
| Blackmores Ltd. | 7,854 | 573,410 | |
| Kao Corp. | 695,700 | 42,027,198 | |
| Kobayashi Pharmaceutical Co. Ltd. | 262,800 | 20,567,268 | |
| Kose Corp. | 47,100 | 5,694,042 | |
| L'Oreal SA | 197,623 | 92,473,973 | |
| Pola Orbis Holdings, Inc. | 148,400 | 3,242,772 | |
| Proya Cosmetics Co. Ltd. (A Shares) | 85,000 | 2,068,065 | |
| Rohto Pharmaceutical Co. Ltd. | 581,300 | 18,282,034 | |
| Unilever PLC | 1,592,088 | 88,647,362 | |
| 273,576,124 | |||
| Tobacco - 0.3% | |||
| British American Tobacco PLC: | |||
| (United Kingdom) | 1,214,258 | 45,550,917 | |
| sponsored ADR | 209,612 | 7,900,276 | |
| Imperial Brands PLC | 441,100 | 9,348,370 | |
| Japan Tobacco, Inc. | 58,100 | 1,126,194 | |
| Scandinavian Tobacco Group A/S (a) | 39,591 | 803,361 | |
| 64,729,118 | |||
| TOTAL CONSUMER STAPLES | 1,187,477,903 | ||
| ENERGY - 1.2% | |||
| Energy Equipment & Services - 0.1% | |||
| Core Laboratories NV | 57,274 | 1,578,471 | |
| Tenaris SA | 263,651 | 2,653,727 | |
| WorleyParsons Ltd. | 937,063 | 7,184,128 | |
| 11,416,326 | |||
| Oil, Gas & Consumable Fuels - 1.1% | |||
| BP PLC | 7,647,884 | 31,113,850 | |
| BP PLC sponsored ADR | 163,459 | 3,998,207 | |
| Cairn Energy PLC | 1,969,091 | 5,205,955 | |
| ENEOS Holdings, Inc. | 1,032,500 | 3,998,984 | |
| Eni SpA | 2,939,969 | 36,272,154 | |
| Eni SpA sponsored ADR | 4,900 | 120,442 | |
| Equinor ASA | 661,854 | 14,063,422 | |
| Galp Energia SGPS SA Class B | 923,341 | 9,444,773 | |
| Gazprom OAO | 2,193,850 | 9,147,594 | |
| Idemitsu Kosan Co. Ltd. | 326,200 | 7,821,802 | |
| INPEX Corp. | 534,400 | 3,682,000 | |
| Japan Petroleum Exploration Co. Ltd. | 18,600 | 320,722 | |
| Lukoil PJSC | 35,755 | 3,057,060 | |
| Lundin Petroleum AB | 181,100 | 5,531,982 | |
| Neste Oyj | 191,498 | 11,653,775 | |
| Oil Search Ltd. ADR | 1,823,492 | 4,989,069 | |
| OMV AG | 123,777 | 6,858,805 | |
| Reliance Industries Ltd. | 24,740 | 548,478 | |
| Reliance Industries Ltd. | 624,027 | 19,316,343 | |
| Repsol SA | 539,539 | 6,182,674 | |
| Rosneft Oil Co. OJSC | 420,640 | 3,066,615 | |
| Royal Dutch Shell PLC | 72,464 | 1,425,461 | |
| Royal Dutch Shell PLC: | |||
| Class B sponsored ADR | 196,199 | 7,724,355 | |
| Class B (United Kingdom) | 177,103 | 3,484,965 | |
| rights (b)(d) | 177,103 | 42,312 | |
| rights (b)(d) | 72,464 | 17,535 | |
| San-Ai Oil Co. Ltd. | 24,600 | 307,011 | |
| Santos Ltd. | 2,187,400 | 9,681,164 | |
| TC Energy Corp. | 155,191 | 7,368,082 | |
| Total SA | 1,536,146 | 67,947,775 | |
| 284,393,366 | |||
| TOTAL ENERGY | 295,809,692 | ||
| FINANCIALS - 6.2% | |||
| Banks - 2.5% | |||
| ABN AMRO Group NV GDR (a) | 26,761 | 373,552 | |
| AIB Group PLC (b) | 5,914,413 | 17,842,697 | |
| Australia & New Zealand Banking Group Ltd. | 395,508 | 8,057,949 | |
| Banco Bilbao Vizcaya Argentaria SA | 3,361,005 | 21,997,761 | |
| Barclays PLC | 7,944,941 | 20,143,694 | |
| BNP Paribas SA | 569,330 | 36,066,986 | |
| CaixaBank SA | 9,107,938 | 28,293,328 | |
| Chiba Bank Ltd. | 719,600 | 4,493,616 | |
| Close Brothers Group PLC | 131,904 | 2,798,203 | |
| Credicorp Ltd. (United States) | 91,371 | 9,742,890 | |
| DBS Group Holdings Ltd. | 1,081,000 | 24,097,267 | |
| DNB Bank ASA | 863,519 | 18,235,281 | |
| Erste Group Bank AG | 176,985 | 7,075,895 | |
| First International Bank of Israel | 9,258 | 334,498 | |
| Grupo Financiero Banorte S.A.B. de CV Series O | 1,125,389 | 7,429,002 | |
| HDFC Bank Ltd. | 1,529,623 | 33,158,501 | |
| Hokuhoku Financial Group, Inc. | 16,800 | 128,884 | |
| ING Groep NV: | |||
| (Certificaten Van Aandelen) | 3,250,176 | 44,834,164 | |
| sponsored ADR (c) | 23,900 | 329,342 | |
| Intesa Sanpaolo SpA | 2,240,025 | 6,338,949 | |
| Jyske Bank A/S (Reg.) (b) | 89,619 | 3,917,327 | |
| KBC Groep NV | 243,400 | 20,502,727 | |
| Lloyds Banking Group PLC | 37,667,229 | 22,549,690 | |
| Mebuki Financial Group, Inc. | 1,188,700 | 2,658,003 | |
| Mediobanca SpA | 136,500 | 1,608,500 | |
| Mitsubishi UFJ Financial Group, Inc. | 4,309,000 | 23,378,235 | |
| Mitsubishi UFJ Financial Group, Inc. sponsored ADR (c) | 118,679 | 646,801 | |
| National Bank of Canada | 217,327 | 17,249,733 | |
| NatWest Group PLC | 4,731,184 | 13,861,448 | |
| Nordea Bank ABP | 540,491 | 6,348,090 | |
| North Pacific Bank Ltd. | 1,058,100 | 2,442,916 | |
| PT Bank Central Asia Tbk | 6,264,900 | 14,385,660 | |
| PT Bank Mandiri (Persero) Tbk | 22,537,300 | 9,634,489 | |
| Raiffeisen International Bank-Holding AG | 37,121 | 891,515 | |
| Resona Holdings, Inc. | 164,100 | 634,980 | |
| Sberbank of Russia | 3,241,260 | 14,544,179 | |
| Shinsei Bank Ltd. | 246,400 | 3,057,183 | |
| Shizuoka Bank Ltd. | 230,400 | 1,805,252 | |
| Skandinaviska Enskilda Banken AB (A Shares) | 189,338 | 2,542,952 | |
| Sparebank 1 Sr Bank ASA (primary capital certificate) | 22,183 | 299,286 | |
| Standard Chartered PLC (United Kingdom) | 584,166 | 3,652,684 | |
| Sumitomo Mitsui Financial Group, Inc. | 1,184,100 | 40,870,068 | |
| Sumitomo Mitsui Trust Holdings, Inc. | 154,100 | 5,033,401 | |
| Svenska Handelsbanken AB (A Shares) | 1,270,106 | 14,271,807 | |
| Swedbank AB (A Shares) | 1,108,719 | 21,407,478 | |
| Sydbank A/S | 118,832 | 3,479,188 | |
| The Hachijuni Bank Ltd. | 706,000 | 2,432,159 | |
| UniCredit SpA | 4,309,655 | 53,776,591 | |
| United Overseas Bank Ltd. | 584,800 | 11,126,620 | |
| 610,781,421 | |||
| Capital Markets - 1.3% | |||
| 3i Group PLC | 344,788 | 6,340,175 | |
| Amundi SA (a) | 60,700 | 5,744,473 | |
| B3 SA - Brasil Bolsa Balcao | 1,262,700 | 3,435,869 | |
| Banca Generali SpA | 20,156 | 895,802 | |
| Brewin Dolphin Holding PLC | 224,851 | 1,230,363 | |
| Bridgepoint Group Holdings Ltd. | 804,362 | 5,595,738 | |
| Credit Suisse Group AG | 3,323,667 | 35,209,327 | |
| Credit Suisse Group AG sponsored ADR | 262,808 | 2,777,881 | |
| Daiwa Securities Group, Inc. | 552,600 | 3,126,787 | |
| Deutsche Borse AG | 98,300 | 16,957,495 | |
| Euronext NV (a) | 298,701 | 34,651,911 | |
| Hong Kong Exchanges and Clearing Ltd. | 175,500 | 11,075,018 | |
| IG Group Holdings PLC | 168,600 | 2,170,804 | |
| Intermediate Capital Group PLC | 199,939 | 6,041,997 | |
| Japan Exchange Group, Inc. | 29,300 | 697,511 | |
| Julius Baer Group Ltd. | 465,768 | 31,790,345 | |
| Jupiter Fund Management PLC | 142,203 | 522,006 | |
| London Stock Exchange Group PLC | 107,186 | 11,741,571 | |
| Macquarie Group Ltd. | 302,025 | 36,840,601 | |
| Man Group PLC | 1,761,161 | 5,244,606 | |
| Netwealth Group Ltd. | 161,351 | 1,843,727 | |
| Nomura Holdings, Inc. | 1,657,900 | 8,006,400 | |
| Partners Group Holding AG | 10,153 | 18,005,429 | |
| Platinum Asset Management Ltd. | 328,001 | 954,998 | |
| Polar Capital Holdings PLC | 33,961 | 409,949 | |
| Ratos AB (B Shares) | 85,737 | 566,814 | |
| UBS Group AG | 3,277,601 | 54,689,318 | |
| Vontobel Holdings AG | 5,866 | 548,967 | |
| XP, Inc. Class A (b) | 70,671 | 3,438,144 | |
| 310,554,026 | |||
| Consumer Finance - 0.0% | |||
| Hoist Finance AB (a)(b) | 34,970 | 138,997 | |
| Diversified Financial Services - 0.4% | |||
| Challenger Ltd. | 765,260 | 3,610,877 | |
| Element Fleet Management Corp. | 942,604 | 10,392,440 | |
| EXOR NV | 72,100 | 6,010,325 | |
| Groupe Bruxelles Lambert SA | 118,729 | 13,612,378 | |
| Hypoport AG (b) | 3,509 | 2,423,802 | |
| Industrivarden AB: | |||
| (A Shares) | 58,039 | 2,136,079 | |
| (C Shares) | 100,658 | 3,508,674 | |
| Investment AB Oresund | 21,591 | 423,841 | |
| Investor AB: | |||
| (A Shares) | 73,161 | 1,754,959 | |
| (B Shares) | 716,636 | 17,140,568 | |
| L E Lundbergforetagen AB | 79,909 | 5,100,427 | |
| M&G PLC | 144,018 | 407,886 | |
| Mitsubishi UFJ Lease & Finance Co. Ltd. | 751,700 | 4,024,463 | |
| ORIX Corp. | 1,691,000 | 31,532,850 | |
| Sofina SA | 4,834 | 2,136,980 | |
| 104,216,549 | |||
| Insurance - 2.0% | |||
| AEGON NV | 664,320 | 3,280,240 | |
| AEGON NV rights (b)(d) | 664,320 | 62,752 | |
| AIA Group Ltd. | 4,202,600 | 50,182,100 | |
| Allianz SE | 126,681 | 29,763,148 | |
| Aon PLC | 104,558 | 29,993,508 | |
| ASR Nederland NV | 100,014 | 4,572,504 | |
| Aviva PLC | 3,447,501 | 19,153,519 | |
| AXA SA | 2,040,795 | 57,333,088 | |
| Beazley PLC (b) | 406,909 | 2,190,203 | |
| Clal Insurance Enterprises Holdings Ltd. (b) | 7,936 | 166,498 | |
| Coface SA | 124,507 | 1,530,391 | |
| Dai-ichi Mutual Life Insurance Co. | 467,900 | 9,227,006 | |
| Direct Line Insurance Group PLC | 1,080,241 | 4,589,173 | |
| Gjensidige Forsikring ASA | 18,220 | 426,043 | |
| Hiscox Ltd. (b) | 964,889 | 12,188,595 | |
| Japan Post Insurance Co. Ltd. | 18,500 | 335,477 | |
| MAPFRE SA (Reg.) | 841,212 | 1,813,695 | |
| MS&AD Insurance Group Holdings, Inc. | 151,300 | 4,889,074 | |
| MS&AD Insurance Group Holdings, Inc. ADR | 5,200 | 84,136 | |
| Muenchener Rueckversicherungs-Gesellschaft AG in Muenchen | 79,262 | 23,158,501 | |
| NN Group NV | 181,649 | 9,430,776 | |
| NN Group NV: | |||
| ADR | 2,300 | 59,478 | |
| rights (b)(d) | 181,649 | 199,468 | |
| PICC Property & Casualty Co. Ltd. (H Shares) | 7,236,000 | 6,540,586 | |
| Ping An Insurance Group Co. of China Ltd. (H Shares) | 1,885,500 | 14,599,583 | |
| Prudential PLC (b) | 1,652,351 | 34,426,116 | |
| Sampo Oyj (A Shares) | 305,975 | 15,802,386 | |
| Sompo Holdings, Inc. | 468,500 | 20,560,087 | |
| Storebrand ASA (A Shares) | 1,133,020 | 10,063,180 | |
| Sun Life Financial, Inc. | 312,083 | 16,068,570 | |
| Swiss Life Holding AG | 16,814 | 8,769,169 | |
| Swiss Re Ltd. | 138,656 | 12,758,018 | |
| T&D Holdings, Inc. | 156,200 | 1,895,442 | |
| Talanx AG | 119,100 | 5,411,339 | |
| The Phoenix Holdings Ltd. | 18,007 | 192,206 | |
| Tokio Marine Holdings, Inc. | 487,100 | 23,807,087 | |
| Tokio Marine Holdings, Inc. ADR | 3,647 | 177,901 | |
| Wustenrot & Wurttembergische AG | 29,459 | 648,368 | |
| Zurich Insurance Group Ltd. | 158,665 | 69,620,854 | |
| 505,970,265 | |||
| Thrifts & Mortgage Finance - 0.0% | |||
| Housing Development Finance Corp. Ltd. | 215,757 | 8,276,733 | |
| Paragon Banking Group PLC | 135,436 | 1,046,468 | |
| 9,323,201 | |||
| TOTAL FINANCIALS | 1,540,984,459 | ||
| HEALTH CARE - 4.9% | |||
| Biotechnology - 0.0% | |||
| Genmab A/S (b) | 20,055 | 9,495,413 | |
| Vitrolife AB | 68,021 | 4,189,509 | |
| 13,684,922 | |||
| Health Care Equipment & Supplies - 1.0% | |||
| Alcon, Inc. (Switzerland) | 238,548 | 19,651,718 | |
| ASAHI INTECC Co. Ltd. | 138,100 | 4,180,094 | |
| Carl Zeiss Meditec AG | 32,527 | 7,185,810 | |
| Coloplast A/S Series B | 31,755 | 5,500,731 | |
| Elekta AB (B Shares) (c) | 529,169 | 6,631,897 | |
| Hoya Corp. | 142,900 | 23,094,687 | |
| InMode Ltd. (b) | 27,953 | 3,658,489 | |
| Koninklijke Philips Electronics NV | 1,184,735 | 54,596,309 | |
| Medacta Group SA (a)(b) | 1,219 | 190,354 | |
| Medartis Holding AG (a)(b) | 566 | 78,248 | |
| Nihon Kohden Corp. | 512,900 | 17,226,428 | |
| Olympus Corp. | 1,370,900 | 28,803,666 | |
| Shenzhen Mindray Bio-Medical Electronics Co. Ltd. (A Shares) | 63,200 | 3,208,569 | |
| Siemens Healthineers AG (a) | 197,634 | 13,744,689 | |
| Smith & Nephew PLC | 775,455 | 14,849,212 | |
| Straumann Holding AG | 6,891 | 13,319,214 | |
| Terumo Corp. | 558,400 | 23,332,862 | |
| Venus MedTech Hangzhou, Inc. (H Shares) (a)(b) | 110,000 | 521,186 | |
| 239,774,163 | |||
| Health Care Providers & Services - 0.2% | |||
| Aier Eye Hospital Group Co. Ltd. (A Shares) | 639,602 | 4,177,752 | |
| Amplifon SpA | 68,306 | 3,571,284 | |
| CVS Group PLC (b) | 171,583 | 5,885,727 | |
| Dr Lal Pathlabs Ltd. (a) | 77,048 | 4,279,089 | |
| Estia Health Ltd. | 51,256 | 86,991 | |
| Fresenius Medical Care AG & Co. KGaA | 20,543 | 1,579,551 | |
| Fresenius Medical Care AG & Co. KGaA sponsored ADR | 4,161 | 160,531 | |
| Fresenius SE & Co. KGaA | 634,775 | 33,015,941 | |
| Notre Dame Intermedica Participacoes SA | 179,000 | 2,767,320 | |
| Spire Healthcare Group PLC (a)(b) | 38,142 | 123,233 | |
| 55,647,419 | |||
| Health Care Technology - 0.0% | |||
| Agfa-Gevaert NV (b) | 12,059 | 61,440 | |
| Alibaba Health Information Technology Ltd. (b) | 830,000 | 1,361,732 | |
| CompuGroup Medical AG | 31,632 | 2,950,609 | |
| M3, Inc. | 99,800 | 6,713,810 | |
| Pro Medicus Ltd. | 53,217 | 2,455,372 | |
| 13,542,963 | |||
| Life Sciences Tools & Services - 0.5% | |||
| Agilent Technologies, Inc. | 34,307 | 6,019,849 | |
| Bachem Holding AG (B Shares) | 714 | 522,391 | |
| BICO Group AB (b) | 32,422 | 2,164,109 | |
| Bruker Corp. | 68,890 | 6,083,676 | |
| Eurofins Scientific SA | 75,383 | 10,688,138 | |
| Evotec OAI AG (b) | 130,530 | 6,488,591 | |
| Hangzhou Tigermed Consulting Co. Ltd. (A Shares) | 181,100 | 3,758,399 | |
| ICON PLC (b) | 43,582 | 11,146,968 | |
| Lonza Group AG | 22,155 | 18,749,795 | |
| QIAGEN NV (Germany) (b) | 296,717 | 16,420,839 | |
| Sartorius Stedim Biotech | 26,273 | 15,932,819 | |
| Siegfried Holding AG | 4,147 | 4,005,483 | |
| Tecan Group AG | 6,908 | 4,213,069 | |
| WuXi AppTec Co. Ltd. | 169,056 | 3,474,954 | |
| Wuxi Biologics (Cayman), Inc. (a)(b) | 804,500 | 12,455,235 | |
| 122,124,315 | |||
| Pharmaceuticals - 3.2% | |||
| Astellas Pharma, Inc. | 2,260,700 | 38,159,523 | |
| AstraZeneca PLC: | |||
| (United Kingdom) | 265,308 | 31,026,032 | |
| sponsored ADR | 499,404 | 29,105,265 | |
| Bayer AG | 821,216 | 45,684,962 | |
| Bayer AG sponsored ADR | 8,400 | 116,340 | |
| GlaxoSmithKline PLC | 193,752 | 3,897,440 | |
| GlaxoSmithKline PLC sponsored ADR (c) | 1,038,283 | 42,299,649 | |
| Ipca Laboratories Ltd. | 57,971 | 2,046,479 | |
| Ipsen SA | 52,808 | 5,280,056 | |
| Kyowa Hakko Kirin Co., Ltd. | 497,600 | 16,260,255 | |
| Novartis AG | 1,199,990 | 110,988,138 | |
| Novartis AG sponsored ADR | 203,416 | 18,793,604 | |
| Novo Nordisk A/S: | |||
| Series B | 597,814 | 59,847,140 | |
| Series B sponsored ADR | 45,213 | 4,519,944 | |
| Ono Pharmaceutical Co. Ltd. | 25,900 | 622,457 | |
| Otsuka Holdings Co. Ltd. | 283,200 | 12,049,804 | |
| Recordati SpA | 1,551 | 101,749 | |
| Roche Holding AG: | |||
| (participation certificate) | 444,075 | 178,320,612 | |
| sponsored ADR | 9,029 | 453,436 | |
| Sanofi SA | 989,085 | 102,507,398 | |
| Sanofi SA sponsored ADR | 14,066 | 728,337 | |
| Santen Pharmaceutical Co. Ltd. | 2,120,700 | 31,613,398 | |
| Sumitomo Dainippon Pharma Co., Ltd. | 13,000 | 233,023 | |
| Takeda Pharmaceutical Co. Ltd. | 1,408,900 | 46,895,962 | |
| Takeda Pharmaceutical Co. Ltd. ADR | 216,511 | 3,591,917 | |
| 785,142,920 | |||
| TOTAL HEALTH CARE | 1,229,916,702 | ||
| INDUSTRIALS - 8.4% | |||
| Aerospace & Defense - 0.7% | |||
| Airbus Group NV (b) | 433,703 | 59,328,895 | |
| Dassault Aviation SA | 4,800 | 5,412,558 | |
| Kongsberg Gruppen ASA | 17,768 | 495,381 | |
| Leonardo SpA (b) | 542,753 | 4,420,622 | |
| Meggitt PLC (b) | 903,184 | 10,296,529 | |
| MTU Aero Engines AG | 94,964 | 21,792,221 | |
| Rolls-Royce Holdings PLC (b) | 39,101,779 | 61,664,383 | |
| Safran SA | 158,929 | 19,936,937 | |
| Senior Engineering Group PLC (b) | 325,958 | 795,903 | |
| Thales SA | 5,653 | 573,631 | |
| 184,717,060 | |||
| Air Freight & Logistics - 0.3% | |||
| Bpost SA (b) | 95,367 | 921,669 | |
| Deutsche Post AG | 423,029 | 29,759,703 | |
| Deutsche Post AG ADR | 2,200 | 155,232 | |
| DSV Panalpina A/S | 97,805 | 24,924,109 | |
| InPost SA | 134,473 | 2,619,853 | |
| Konoike Transport Co. Ltd. | 14,400 | 179,190 | |
| Oesterreichische Post AG | 8,328 | 382,023 | |
| SBS Co. Ltd. | 4,900 | 176,376 | |
| SG Holdings Co. Ltd. | 66,900 | 1,819,432 | |
| Yamato Holdings Co. Ltd. | 42,200 | 1,074,035 | |
| 62,011,622 | |||
| Airlines - 0.4% | |||
| Air Canada (b)(c) | 1,333,600 | 25,907,768 | |
| InterGlobe Aviation Ltd. (a)(b) | 152,968 | 3,992,735 | |
| Japan Airlines Co. Ltd. (b) | 321,200 | 6,834,788 | |
| Ryanair Holdings PLC sponsored ADR (b) | 513,243 | 55,276,271 | |
| 92,011,562 | |||
| Building Products - 0.4% | |||
| AGC, Inc. | 49,700 | 2,403,345 | |
| AGC, Inc. ADR | 9,900 | 94,842 | |
| Aica Kogyo Co. Ltd. | 60,600 | 2,032,577 | |
| ASSA ABLOY AB (B Shares) | 45,439 | 1,454,081 | |
| Belimo Holding AG (Reg.) | 5,060 | 2,638,438 | |
| Central Glass Co. Ltd. | 10,400 | 209,862 | |
| Compagnie de St. Gobain | 6,966 | 504,986 | |
| Daikin Industries Ltd. | 212,800 | 53,103,510 | |
| Dorma Kaba Holding AG | 192 | 138,483 | |
| Geberit AG (Reg.) | 25,426 | 21,245,946 | |
| Kingspan Group PLC (Ireland) | 96,225 | 10,995,918 | |
| LIXIL Group Corp. | 31,800 | 926,410 | |
| Nibe Industrier AB (B Shares) | 473,528 | 6,601,280 | |
| Noritz Corp. | 22,700 | 391,418 | |
| Reliance Worldwide Corp. Ltd. | 87,659 | 375,784 | |
| Sekisui Jushi Corp. | 52,600 | 1,045,163 | |
| Takasago Thermal Engineering Co. Ltd. | 31,900 | 616,746 | |
| 104,778,789 | |||
| Commercial Services & Supplies - 0.3% | |||
| A-Living Smart City Services C (H Shares) (a) | 648,000 | 2,566,188 | |
| Befesa SA (a) | 15,615 | 1,266,650 | |
| Brambles Ltd. | 1,220,324 | 10,810,936 | |
| Country Garden Services Holdings Co. Ltd. | 437,000 | 3,329,144 | |
| Daiseki Co. Ltd. | 7,560 | 306,138 | |
| Intrum AB | 27,426 | 818,701 | |
| ISS Holdings A/S (b) | 55,370 | 1,270,797 | |
| Loomis AB (B Shares) | 1,951 | 60,546 | |
| Nippon Kanzai Co. Ltd. | 61,300 | 1,479,915 | |
| Okamura Corp. | 38,100 | 585,967 | |
| Rentokil Initial PLC | 996,597 | 7,952,475 | |
| Ritchie Bros. Auctioneers, Inc. | 199,044 | 12,471,310 | |
| Secom Co. Ltd. | 285,000 | 21,618,188 | |
| Securitas AB (B Shares) | 150,910 | 2,505,126 | |
| Sohgo Security Services Co., Ltd. | 158,200 | 7,168,359 | |
| Tomra Systems ASA | 96,520 | 5,932,690 | |
| Toppan, Inc. | 191,600 | 3,291,588 | |
| 83,434,718 | |||
| Construction & Engineering - 0.1% | |||
| Balfour Beatty PLC | 1,513,180 | 5,949,931 | |
| Kajima Corp. | 189,900 | 2,456,281 | |
| Sanki Engineering Co. Ltd. | 52,000 | 706,631 | |
| Sweco AB (B Shares) (c) | 119,797 | 2,100,399 | |
| Tokyu Construction Co. Ltd. | 118,700 | 810,287 | |
| VINCI SA | 179,342 | 19,246,691 | |
| Voltas Ltd. | 133,523 | 1,822,715 | |
| 33,092,935 | |||
| Electrical Equipment - 1.2% | |||
| ABB Ltd.: | |||
| (Reg.) | 1,028,761 | 38,058,672 | |
| sponsored ADR (c) | 25,400 | 939,546 | |
| Ceres Power Holdings PLC (b)(c) | 97,742 | 1,584,347 | |
| Daihen Corp. | 17,400 | 758,378 | |
| Havells India Ltd. | 159,448 | 2,772,434 | |
| Legrand SA | 668,567 | 76,707,518 | |
| Mitsubishi Electric Corp. | 1,079,600 | 14,773,784 | |
| Prysmian SpA | 494,790 | 18,619,196 | |
| Schneider Electric SA | 641,961 | 114,696,926 | |
| Siemens Energy AG (b) | 480,600 | 13,948,375 | |
| Signify NV (a) | 35,373 | 1,980,575 | |
| Sinfonia Technology Co. Ltd. | 4,900 | 53,269 | |
| Ushio, Inc. | 23,600 | 426,673 | |
| 285,319,693 | |||
| Industrial Conglomerates - 1.0% | |||
| CK Hutchison Holdings Ltd. | 2,742,400 | 20,010,569 | |
| DCC PLC (United Kingdom) | 272,012 | 23,111,698 | |
| Hitachi Ltd. | 846,780 | 46,835,943 | |
| Jardine Matheson Holdings Ltd. | 3,000 | 162,960 | |
| Latour Investment AB (B Shares) | 118,171 | 4,112,284 | |
| Lifco AB | 150,010 | 4,439,745 | |
| Melrose Industries PLC | 9,772,232 | 22,536,462 | |
| Nolato AB (B Shares) | 265,350 | 3,065,710 | |
| Siemens AG | 588,354 | 97,604,883 | |
| Toshiba Corp. | 449,390 | 19,504,952 | |
| 241,385,206 | |||
| Machinery - 2.0% | |||
| Airtac International Group | 68,000 | 2,077,669 | |
| Alstom SA | 553,640 | 23,802,722 | |
| Amada Co. Ltd. | 85,400 | 866,304 | |
| Andritz AG | 11,396 | 654,761 | |
| Atlas Copco AB: | |||
| (A Shares) | 349,306 | 23,979,382 | |
| (B Shares) | 13,164 | 761,517 | |
| Bodycote PLC | 61,153 | 810,915 | |
| Burckhardt Compression Holding AG | 374 | 147,640 | |
| CNH Industrial NV | 828,425 | 13,694,279 | |
| Electrolux Professional AB (b) | 125,363 | 981,322 | |
| Epiroc AB (A Shares) | 611,202 | 13,411,179 | |
| FANUC Corp. | 256,700 | 55,924,934 | |
| Furukawa Co. Ltd. | 15,900 | 179,212 | |
| GEA Group AG | 840,096 | 38,794,905 | |
| Harmonic Drive Systems, Inc. | 39,700 | 2,197,637 | |
| IMI PLC | 1,198,493 | 30,038,448 | |
| Indutrade AB | 192,476 | 6,356,797 | |
| Jingjin Environmental Protection Co. Ltd. | 166,400 | 1,030,229 | |
| Kawasaki Heavy Industries Ltd. (b) | 183,200 | 3,899,963 | |
| KION Group AG | 174,706 | 18,693,466 | |
| Kitz Corp. | 61,200 | 453,375 | |
| Knorr-Bremse AG | 141,583 | 16,993,250 | |
| Kubota Corp. | 819,900 | 16,950,984 | |
| Misumi Group, Inc. | 133,500 | 5,296,800 | |
| Mitsubishi Heavy Industries Ltd. | 99,100 | 2,620,387 | |
| Mitsuboshi Belting Ltd. | 21,400 | 391,567 | |
| Morgan Advanced Materials PLC | 35,343 | 194,851 | |
| Nachi-Fujikoshi Corp. | 1,300 | 50,870 | |
| NGK Insulators Ltd. | 113,800 | 1,887,788 | |
| Nissei ASB Machine Co. Ltd. | 4,500 | 173,431 | |
| Nordson Corp. | 37,200 | 8,875,920 | |
| NTN Corp. (b) | 911,800 | 2,088,566 | |
| Rational AG | 1,253 | 1,433,024 | |
| Rieter Holding AG (Reg.) (b) | 646 | 155,195 | |
| Rotork PLC | 989,431 | 4,538,025 | |
| Ryobi Ltd. | 23,900 | 282,851 | |
| Schindler Holding AG (participation certificate) | 140,234 | 45,297,534 | |
| Shima Seiki Manufacturing Ltd. | 4,200 | 79,713 | |
| Sintokogio Ltd. | 45,100 | 319,346 | |
| SMC Corp. | 95,700 | 61,335,336 | |
| Spirax-Sarco Engineering PLC | 214,715 | 47,556,868 | |
| Sumitomo Heavy Industries Ltd. | 8,200 | 214,662 | |
| Techtronic Industries Co. Ltd. | 1,089,500 | 24,164,572 | |
| THK Co. Ltd. | 153,100 | 3,552,827 | |
| Tsugami Corp. | 7,200 | 102,357 | |
| VAT Group AG (a) | 12,734 | 5,334,166 | |
| Vesuvius PLC | 69,537 | 537,289 | |
| Volvo AB (B Shares) | 444,878 | 10,060,142 | |
| Wartsila Corp. | 272,874 | 3,867,963 | |
| 503,112,940 | |||
| Marine - 0.1% | |||
| A.P. Moller - Maersk A/S: | |||
| Series A | 3,326 | 9,003,890 | |
| Series B | 2,400 | 6,837,025 | |
| Atlas Corp. (c) | 28,905 | 433,864 | |
| DFDS A/S (b) | 2,987 | 170,735 | |
| Nippon Yusen KK | 133,500 | 10,763,487 | |
| 27,209,001 | |||
| Professional Services - 1.1% | |||
| Adecco SA (Reg.) | 39,840 | 2,217,901 | |
| Altech Corp. | 10,300 | 180,600 | |
| BayCurrent Consulting, Inc. | 1,600 | 795,528 | |
| Benefit One, Inc. | 93,500 | 3,752,238 | |
| Centre Testing International Group Co. Ltd. (A Shares) | 739,000 | 3,017,447 | |
| Experian PLC | 903,610 | 39,858,362 | |
| Intertek Group PLC | 315,068 | 22,828,124 | |
| McMillan Shakespeare Ltd. | 10,810 | 98,851 | |
| Nihon M&A Center, Inc. | 206,800 | 6,184,357 | |
| NOMURA Co. Ltd. | 24,800 | 203,558 | |
| Outsourcing, Inc. | 28,300 | 483,607 | |
| Persol Holdings Co. Ltd. | 292,400 | 6,835,911 | |
| Randstad NV | 60,222 | 4,429,974 | |
| Recruit Holdings Co. Ltd. | 307,600 | 18,112,165 | |
| RELX PLC: | |||
| (Euronext N.V.) | 347,235 | 10,446,742 | |
| (London Stock Exchange) | 503,607 | 15,107,821 | |
| rights (b)(d) | 410,861 | 81,540 | |
| SGS SA (Reg.) | 11,956 | 37,575,067 | |
| TechnoPro Holdings, Inc. | 458,000 | 12,285,216 | |
| Teleperformance | 59,762 | 26,419,155 | |
| Wolters Kluwer NV | 477,599 | 54,937,575 | |
| Wolters Kluwer NV rights (b)(d) | 477,599 | 304,520 | |
| 266,156,259 | |||
| Road & Rail - 0.1% | |||
| Canadian National Railway Co. | 177,570 | 20,886,449 | |
| Central Japan Railway Co. | 49,400 | 7,240,604 | |
| Hankyu Hanshin Holdings, Inc. | 5,100 | 152,747 | |
| Nikkon Holdings Co. Ltd. | 9,000 | 187,993 | |
| Nippon Express Co. Ltd. | 25,000 | 1,702,041 | |
| Sankyu, Inc. | 13,000 | 606,190 | |
| The Go-Ahead Group PLC (b) | 6,430 | 83,364 | |
| 30,859,388 | |||
| Trading Companies & Distributors - 0.6% | |||
| AddTech AB (B Shares) | 120,419 | 2,525,751 | |
| AerCap Holdings NV (b) | 8,600 | 463,798 | |
| Ashtead Group PLC | 627,242 | 49,068,493 | |
| Beijer Ref AB (B Shares) | 177,483 | 4,076,405 | |
| Brenntag AG | 67,911 | 6,851,084 | |
| Bunzl PLC | 427,528 | 15,494,062 | |
| Diploma PLC | 69,352 | 2,923,388 | |
| Emeco Holdings Ltd. | 139,655 | 115,957 | |
| Hanwa Co. Ltd. | 6,300 | 188,974 | |
| IMCD NV | 21,384 | 4,212,822 | |
| Itochu Corp. | 108,000 | 3,250,357 | |
| Kanamoto Co. Ltd. | 5,700 | 130,305 | |
| Marubeni Corp. | 416,400 | 3,314,092 | |
| Mitsubishi Corp. | 414,700 | 12,480,768 | |
| Mitsui & Co. Ltd. | 358,800 | 7,921,876 | |
| MonotaRO Co. Ltd. | 181,900 | 4,022,749 | |
| Nagase & Co. Ltd. | 46,100 | 760,546 | |
| Rexel SA | 428,300 | 8,958,745 | |
| Sumitomo Corp. | 834,500 | 11,791,394 | |
| Toromont Industries Ltd. | 24,465 | 2,057,026 | |
| Toyota Tsusho Corp. | 18,400 | 813,671 | |
| Wakita & Co. Ltd. | 17,400 | 160,374 | |
| Yamazen Co. Ltd. | 12,000 | 119,438 | |
| Yuasa Trading Co. Ltd. | 27,400 | 740,197 | |
| 142,442,272 | |||
| Transportation Infrastructure - 0.1% | |||
| Aena SME SA (a)(b) | 157,337 | 25,116,870 | |
| Beijing Capital International Airport Co. Ltd. (H Shares) | 13,422,000 | 8,093,807 | |
| Grupo Aeroportuario del Sureste S.A.B. de CV Series B sponsored ADR (b) | 12,549 | 2,243,510 | |
| The Sumitomo Warehouse Co. Ltd. | 21,300 | 346,175 | |
| 35,800,362 | |||
| TOTAL INDUSTRIALS | 2,092,331,807 | ||
| INFORMATION TECHNOLOGY - 7.1% | |||
| Communications Equipment - 0.2% | |||
| Ericsson: | |||
| (B Shares) | 1,714,081 | 20,303,477 | |
| (B Shares) sponsored ADR | 447,795 | 5,292,937 | |
| Nokia Corp. (b) | 3,073,452 | 18,435,211 | |
| Nokia Corp. sponsored ADR (b) | 281,500 | 1,677,740 | |
| 45,709,365 | |||
| Electronic Equipment & Components - 1.2% | |||
| ALSO Holding AG | 2,106 | 677,278 | |
| Basler AG | 922 | 160,250 | |
| Enplas Corp. | 34,600 | 989,111 | |
| Halma PLC | 924,499 | 38,169,555 | |
| Hamamatsu Photonics K.K. | 148,300 | 8,654,147 | |
| Hexagon AB (B Shares) | 1,166,401 | 20,226,188 | |
| Hirose Electric Co. Ltd. | 172,390 | 28,722,526 | |
| Keyence Corp. | 46,600 | 28,011,253 | |
| Kyocera Corp. | 330,400 | 20,560,091 | |
| Largan Precision Co. Ltd. | 40,000 | 3,876,193 | |
| Macnica Fuji Electronics Holdings, Inc. | 22,400 | 539,766 | |
| Murata Manufacturing Co. Ltd. | 607,700 | 50,097,461 | |
| OMRON Corp. | 380,600 | 35,909,903 | |
| Renishaw PLC | 29,634 | 2,200,084 | |
| Samsung SDI Co. Ltd. | 10,629 | 7,273,070 | |
| Sanshin Electronic Co. Ltd. | 20,400 | 302,806 | |
| Shimadzu Corp. | 759,300 | 34,060,315 | |
| Softwareone Holding AG | 74,348 | 2,102,772 | |
| Spectris PLC | 332,979 | 18,037,170 | |
| Topcon Corp. | 125,700 | 2,134,324 | |
| Yokogawa Electric Corp. | 496,200 | 7,771,237 | |
| 310,475,500 | |||
| IT Services - 1.3% | |||
| Adyen BV (a)(b) | 7,331 | 23,670,046 | |
| Amadeus IT Holding SA Class A (b) | 1,424,171 | 86,971,830 | |
| BASE, Inc. (b)(c) | 128,400 | 1,335,178 | |
| Bechtle AG | 55,017 | 3,976,932 | |
| Capgemini SA | 74,200 | 16,659,355 | |
| CGI, Inc. Class A (b) | 56,921 | 5,086,461 | |
| Dlocal Ltd. | 27,961 | 1,789,504 | |
| EPAM Systems, Inc. (b) | 21,433 | 13,563,017 | |
| Fujitsu Ltd. | 222,240 | 41,007,790 | |
| Globant SA (b) | 15,144 | 4,880,608 | |
| GMO Payment Gateway, Inc. | 23,900 | 3,143,508 | |
| Locaweb Servicos de Internet SA (a) | 807,888 | 3,826,328 | |
| Mitsubishi Research Institute, Inc. | 13,900 | 539,499 | |
| Nomura Research Institute Ltd. | 840,300 | 31,583,334 | |
| NTT Data Corp. | 1,066,400 | 19,202,276 | |
| Nuvei Corp. (a) | 64,457 | 8,354,657 | |
| OBIC Co. Ltd. | 94,500 | 17,995,501 | |
| SHIFT, Inc. (b) | 15,800 | 3,610,526 | |
| Softcat PLC | 101,158 | 2,940,089 | |
| TIS, Inc. | 183,000 | 5,173,204 | |
| Visa, Inc. Class A | 47,715 | 10,931,507 | |
| Wix.com Ltd. (b) | 71,060 | 15,781,005 | |
| Worldline SA (a)(b) | 78,139 | 6,944,608 | |
| Zuken, Inc. | 6,600 | 218,970 | |
| 329,185,733 | |||
| Semiconductors & Semiconductor Equipment - 2.1% | |||
| Advantest Corp. | 44,500 | 3,850,748 | |
| ams AG (b) | 239,500 | 4,872,383 | |
| Analog Devices, Inc. | 160,381 | 26,134,084 | |
| ASM International NV (Netherlands) | 4,097 | 1,589,613 | |
| ASMedia Technology, Inc. | 32,000 | 2,400,926 | |
| ASML Holding NV | 17,275 | 14,390,766 | |
| ASML Holding NV (Netherlands) | 167,579 | 139,758,835 | |
| BE Semiconductor Industries NV | 24,369 | 2,217,301 | |
| Broadcom, Inc. | 33,260 | 16,537,205 | |
| Disco Corp. | 28,200 | 8,215,334 | |
| GlobalWafers Co. Ltd. | 76,000 | 2,390,801 | |
| Infineon Technologies AG | 908,374 | 38,676,520 | |
| MediaTek, Inc. | 400,000 | 13,031,530 | |
| NAURA Technology Group Co. Ltd. | 86,200 | 4,747,825 | |
| NXP Semiconductors NV | 214,416 | 46,127,314 | |
| Renesas Electronics Corp. (b) | 494,000 | 5,289,703 | |
| Silergy Corp. | 17,000 | 2,446,485 | |
| SK Hynix, Inc. | 167,343 | 15,378,335 | |
| Sumco Corp. | 62,000 | 1,309,149 | |
| Taiwan Semiconductor Manufacturing Co. Ltd. | 1,724,000 | 37,894,976 | |
| Taiwan Semiconductor Manufacturing Co. Ltd. sponsored ADR | 879,895 | 104,716,304 | |
| Texas Instruments, Inc. | 45,343 | 8,656,432 | |
| Tokyo Electron Ltd. | 68,900 | 29,585,384 | |
| 530,217,953 | |||
| Software - 1.5% | |||
| ANSYS, Inc. (b) | 93,519 | 34,168,102 | |
| Atlassian Corp. PLC (b) | 31,334 | 11,501,458 | |
| Avast PLC (a) | 323,872 | 2,661,856 | |
| Aveva Group PLC | 74,332 | 4,226,800 | |
| Cadence Design Systems, Inc. (b) | 515,652 | 84,298,789 | |
| Check Point Software Technologies Ltd. (b) | 180,012 | 22,614,908 | |
| Constellation Software, Inc. | 9,739 | 16,505,237 | |
| Dassault Systemes SA | 635,140 | 36,225,927 | |
| Descartes Systems Group, Inc. (Canada) (b) | 92,176 | 7,226,353 | |
| Enghouse Systems Ltd. | 32,311 | 1,562,985 | |
| Kinaxis, Inc. (b) | 23,081 | 3,744,477 | |
| Nemetschek Se | 26,864 | 2,633,367 | |
| Netcompany Group A/S (a) | 27,831 | 3,592,551 | |
| NICE Systems Ltd. sponsored ADR (b) | 14,368 | 4,176,778 | |
| Open Text Corp. | 55,650 | 3,051,290 | |
| Pexip Holding ASA (b) | 146,879 | 1,140,332 | |
| Rakus Co. Ltd. | 105,900 | 3,744,498 | |
| Sage Group PLC | 275,091 | 2,807,066 | |
| SAP SE | 716,680 | 107,652,521 | |
| TeamViewer AG (a)(b) | 54,654 | 1,820,468 | |
| Temenos Group AG | 72,734 | 11,548,483 | |
| Topicus.Com, Inc. | 3,161 | 320,773 | |
| Weimob, Inc. (a)(b) | 731,000 | 1,067,723 | |
| 368,292,742 | |||
| Technology Hardware, Storage & Peripherals - 0.8% | |||
| Brother Industries Ltd. | 170,700 | 3,503,528 | |
| Canon, Inc. | 159,900 | 3,804,361 | |
| Canon, Inc. sponsored ADR (c) | 109,103 | 2,597,742 | |
| FUJIFILM Holdings Corp. | 66,900 | 5,514,241 | |
| Logitech International SA (Reg.) | 23,151 | 2,367,305 | |
| Ricoh Co. Ltd. | 286,500 | 2,916,693 | |
| Riso Kagaku Corp. | 19,000 | 402,227 | |
| Samsung Electronics Co. Ltd. | 2,460,915 | 162,871,142 | |
| Seiko Epson Corp. | 215,000 | 4,006,272 | |
| 187,983,511 | |||
| TOTAL INFORMATION TECHNOLOGY | 1,771,864,804 | ||
| MATERIALS - 4.0% | |||
| Chemicals - 2.5% | |||
| Air Liquide SA | 66,624 | 11,941,842 | |
| Air Water, Inc. | 90,700 | 1,462,544 | |
| Akzo Nobel NV | 495,589 | 61,091,405 | |
| Alujain Holding (b) | 29,990 | 516,531 | |
| Asahi Kasei Corp. | 828,800 | 8,558,077 | |
| BASF AG | 849,474 | 65,714,640 | |
| Christian Hansen Holding A/S | 36,453 | 3,363,895 | |
| Clariant AG (Reg.) | 250,308 | 5,269,930 | |
| Covestro AG (a) | 175,385 | 11,369,013 | |
| Croda International PLC | 325,767 | 40,972,132 | |
| Daicel Chemical Industries Ltd. | 235,300 | 1,894,976 | |
| Denka Co. Ltd. | 232,060 | 8,142,086 | |
| Ems-Chemie Holding AG | 840 | 910,401 | |
| Evonik Industries AG | 263,898 | 8,911,690 | |
| Givaudan SA | 15,990 | 80,233,743 | |
| Icl Group Ltd. | 57,903 | 409,570 | |
| Johnson Matthey PLC | 318,389 | 12,865,094 | |
| JSR Corp. | 49,300 | 1,709,581 | |
| Kansai Paint Co. Ltd. | 792,200 | 20,529,584 | |
| Koninklijke DSM NV | 4,613 | 981,786 | |
| Kuraray Co. Ltd. | 419,100 | 3,942,812 | |
| Linde PLC | 108,341 | 34,181,196 | |
| Linde PLC | 47,400 | 14,911,566 | |
| Mitsubishi Chemical Holdings Corp. | 192,500 | 1,689,920 | |
| Mitsubishi Gas Chemical Co., Inc. | 12,200 | 230,105 | |
| Mitsui Chemicals, Inc. | 163,500 | 5,647,412 | |
| Nippon Sanso Holdings Corp. | 292,100 | 7,089,097 | |
| Nitto Denko Corp. | 200,000 | 15,197,928 | |
| Novozymes A/S Series B | 435,465 | 35,179,034 | |
| Orica Ltd. | 178,946 | 1,724,058 | |
| PhosAgro OJSC | 53,731 | 3,569,410 | |
| Pidilite Industries Ltd. | 77,433 | 2,420,451 | |
| Shin-Etsu Chemical Co. Ltd. | 64,100 | 10,587,259 | |
| Sika AG | 158,367 | 57,086,483 | |
| Solvay SA Class A | 23,646 | 3,097,726 | |
| Sumitomo Chemical Co. Ltd. | 428,800 | 2,174,889 | |
| Symrise AG | 284,834 | 40,559,920 | |
| Takasago International Corp. | 3,000 | 78,889 | |
| Teijin Ltd. | 128,400 | 1,847,541 | |
| Tessenderlo Group (b) | 4,094 | 169,673 | |
| Tokuyama Corp. | 19,900 | 397,946 | |
| Toray Industries, Inc. | 1,324,500 | 8,930,729 | |
| Tosoh Corp. | 102,400 | 1,859,703 | |
| Transfar Zhilian Co. Ltd. | 665,000 | 893,433 | |
| Umicore SA | 139,937 | 9,209,954 | |
| Yara International ASA | 191,174 | 9,600,203 | |
| 619,125,857 | |||
| Construction Materials - 0.1% | |||
| Cementir SpA | 11,392 | 128,996 | |
| CSR Ltd. | 46,808 | 186,621 | |
| HeidelbergCement AG | 257,500 | 22,377,574 | |
| Holcim Ltd. | 6,258 | 356,721 | |
| James Hardie Industries PLC CDI | 200,134 | 7,765,482 | |
| Taiheiyo Cement Corp. | 33,600 | 770,251 | |
| 31,585,645 | |||
| Containers & Packaging - 0.2% | |||
| Amcor PLC unit | 497,620 | 6,366,953 | |
| Fuji Seal International, Inc. | 14,700 | 330,438 | |
| Sig Combibloc Group AG | 150,424 | 4,605,939 | |
| Smurfit Kappa Group PLC | 410,108 | 23,524,137 | |
| Toyo Seikan Group Holdings Ltd. | 56,800 | 790,961 | |
| 35,618,428 | |||
| Metals & Mining - 1.2% | |||
| Agnico Eagle Mines Ltd. (Canada) | 221,458 | 12,743,511 | |
| Alumina Ltd. | 471,129 | 613,485 | |
| Anglo American PLC (United Kingdom) | 87,735 | 3,705,532 | |
| Antofagasta PLC | 487,657 | 9,761,828 | |
| Aperam SA | 20,481 | 1,256,546 | |
| Aperam SA rights (b)(d) | 20,481 | 10,580 | |
| ArcelorMittal SA (Netherlands) | 1,003,217 | 33,635,254 | |
| BHP Group Ltd. | 319,265 | 10,563,403 | |
| BHP Group Ltd. sponsored ADR (c) | 69,100 | 4,570,274 | |
| BHP Group PLC | 623,366 | 19,384,161 | |
| BHP Group PLC ADR | 270,205 | 16,925,641 | |
| BlueScope Steel Ltd. | 235,419 | 4,339,963 | |
| Boliden AB | 29,714 | 1,036,096 | |
| Evraz PLC | 38,032 | 308,710 | |
| Ferrexpo PLC | 109,178 | 570,993 | |
| Fortescue Metals Group Ltd. | 447,100 | 6,868,596 | |
| Franco-Nevada Corp. (c) | 293,456 | 42,809,477 | |
| Glencore Xstrata PLC | 4,790,103 | 21,592,517 | |
| Hitachi Metals Ltd. (b) | 102,700 | 1,983,707 | |
| IGO Ltd. | 2,098,033 | 14,810,975 | |
| JFE Holdings, Inc. | 364,400 | 5,912,412 | |
| Maanshan Iron & Steel Co. Ltd. (A Shares) | 1,526,800 | 1,446,285 | |
| Mitsubishi Materials Corp. | 149,900 | 3,073,894 | |
| MMC Norilsk Nickel PJSC | 4,796 | 1,575,271 | |
| Nippon Steel & Sumitomo Metal Corp. | 194,200 | 3,968,201 | |
| Norsk Hydro ASA | 327,809 | 2,263,001 | |
| Novolipetsk Steel OJSC | 230,760 | 777,857 | |
| Rio Tinto Ltd. | 141,724 | 11,618,178 | |
| Rio Tinto PLC | 136,644 | 10,109,505 | |
| Rio Tinto PLC sponsored ADR (c) | 191,534 | 14,378,457 | |
| Sandfire Resources NL | 68,739 | 326,859 | |
| South32 Ltd. | 3,093,663 | 7,106,351 | |
| SSAB Svenskt Stal AB (B Shares) (b) | 258,762 | 1,230,322 | |
| Tokyo Steel Manufacturing Co. Ltd. | 55,300 | 597,159 | |
| Uacj Corp. (b) | 7,800 | 193,485 | |
| Vale SA | 218,200 | 4,164,148 | |
| Vale SA sponsored ADR | 181,627 | 3,463,627 | |
| Voestalpine AG | 83,146 | 3,769,906 | |
| Wheaton Precious Metals Corp. | 211,190 | 9,517,904 | |
| 292,984,071 | |||
| Paper & Forest Products - 0.0% | |||
| Stora Enso Oyj (R Shares) | 490,977 | 9,608,877 | |
| TOTAL MATERIALS | 988,922,878 | ||
| REAL ESTATE - 0.7% | |||
| Equity Real Estate Investment Trusts (REITs) - 0.2% | |||
| Big Yellow Group PLC | 138,837 | 2,910,921 | |
| British Land Co. PLC | 1,695,400 | 12,358,542 | |
| Great Portland Estates PLC | 744,746 | 7,991,649 | |
| Scentre Group unit | 2,722,001 | 5,675,148 | |
| Segro PLC | 506,174 | 8,935,527 | |
| Warehouses de Pauw | 90,783 | 4,174,058 | |
| 42,045,845 | |||
| Real Estate Management & Development - 0.5% | |||
| Airport City Ltd. (b) | 7,864 | 143,954 | |
| CK Asset Holdings Ltd. | 1,497,100 | 9,759,365 | |
| Daito Trust Construction Co. Ltd. | 2,800 | 307,449 | |
| Deutsche Wohnen SE (Bearer) | 149,997 | 9,308,847 | |
| Dios Fastigheter AB | 60,129 | 708,634 | |
| ESR Cayman Ltd. (a)(b) | 2,278,600 | 6,943,512 | |
| Grand City Properties SA | 544,859 | 14,938,407 | |
| Hang Lung Group Ltd. | 205,000 | 513,459 | |
| Hongkong Land Holdings Ltd. | 92,300 | 387,660 | |
| LEG Immobilien AG | 191,540 | 30,531,715 | |
| Lendlease Group unit | 910,900 | 7,956,445 | |
| Mitsui Fudosan Co. Ltd. | 580,000 | 13,306,549 | |
| Nomura Real Estate Holdings, Inc. | 58,100 | 1,486,629 | |
| Swire Pacific Ltd. (A Shares) | 28,000 | 189,728 | |
| TAG Immobilien AG | 338,691 | 11,465,402 | |
| Vonovia SE | 228,244 | 15,404,569 | |
| 123,352,324 | |||
| TOTAL REAL ESTATE | 165,398,169 | ||
| UTILITIES - 1.0% | |||
| Electric Utilities - 0.4% | |||
| Chubu Electric Power Co., Inc. | 507,800 | 6,134,311 | |
| CLP Holdings Ltd. | 734,000 | 7,337,688 | |
| Enel SpA | 4,482,484 | 40,837,401 | |
| Iberdrola SA | 1,189,921 | 14,744,876 | |
| Kansai Electric Power Co., Inc. | 523,800 | 5,261,092 | |
| Origin Energy Ltd. | 424,659 | 1,382,434 | |
| ORSTED A/S (a) | 92,249 | 14,661,530 | |
| Shikoku Electric Power Co., Inc. | 71,000 | 497,578 | |
| Tohoku Electric Power Co., Inc. | 69,900 | 534,980 | |
| 91,391,890 | |||
| Gas Utilities - 0.1% | |||
| APA Group unit | 652,201 | 4,379,940 | |
| Beijing Enterprises Holdings Ltd. | 942,500 | 3,247,723 | |
| China Resource Gas Group Ltd. | 1,238,000 | 7,513,208 | |
| Osaka Gas Co. Ltd. | 282,900 | 5,304,938 | |
| Tokyo Gas Co. Ltd. | 293,600 | 5,647,026 | |
| 26,092,835 | |||
| Independent Power and Renewable Electricity Producers - 0.0% | |||
| EDP Renovaveis SA | 193,455 | 5,144,063 | |
| Electric Power Development Co. Ltd. | 332,400 | 4,967,192 | |
| Scatec Solar AS (a) | 72,066 | 1,490,349 | |
| Solaria Energia y Medio Ambiente SA (b) | 75,802 | 1,503,654 | |
| 13,105,258 | |||
| Multi-Utilities - 0.5% | |||
| AGL Energy Ltd. | 32,573 | 153,696 | |
| Centrica PLC (b) | 1,064,550 | 760,485 | |
| E.ON AG | 648,898 | 8,564,431 | |
| ENGIE | 3,025,114 | 43,334,332 | |
| National Grid PLC | 814,791 | 10,538,689 | |
| RWE AG | 975,281 | 38,105,221 | |
| Veolia Environnement SA | 664,000 | 22,775,723 | |
| 124,232,577 | |||
| TOTAL UTILITIES | 254,822,560 | ||
| TOTAL COMMON STOCKS | |||
| (Cost $7,240,295,264) | 10,925,684,221 | ||
| Nonconvertible Preferred Stocks - 0.4% | |||
| CONSUMER DISCRETIONARY - 0.2% | |||
| Automobiles - 0.2% | |||
| Bayerische Motoren Werke AG (BMW) (non-vtg.) | 103,495 | 8,664,102 | |
| Hyundai Motor Co. | 6,336 | 560,391 | |
| Porsche Automobil Holding SE (Germany) | 52,448 | 5,306,067 | |
| Volkswagen AG | 102,187 | 24,288,315 | |
| 38,818,875 | |||
| CONSUMER STAPLES - 0.2% | |||
| Household Products - 0.2% | |||
| Henkel AG & Co. KGaA | 426,688 | 41,685,393 | |
| FINANCIALS - 0.0% | |||
| Banks - 0.0% | |||
| Sberbank of Russia (Russia) | 309,120 | 1,308,511 | |
| Insurance - 0.0% | |||
| Samsung Fire & Marine Insurance Co. Ltd. | 567 | 84,152 | |
| TOTAL FINANCIALS | 1,392,663 | ||
| INFORMATION TECHNOLOGY - 0.0% | |||
| Technology Hardware, Storage & Peripherals - 0.0% | |||
| Samsung Electronics Co. Ltd. | 63,712 | 3,892,303 | |
| MATERIALS - 0.0% | |||
| Metals & Mining - 0.0% | |||
| Companhia Siderurgica Nacional SA (CSN) sponsored ADR | 36,911 | 248,780 | |
| Gerdau SA sponsored ADR | 68,300 | 370,186 | |
| 618,966 | |||
| TOTAL NONCONVERTIBLE PREFERRED STOCKS | |||
| (Cost $67,486,641) | 86,408,200 | ||
| Equity Funds - 49.9% | |||
| Diversified Emerging Markets Funds - 0.0% | |||
| Matthews Pacific Tiger Fund Investor Class | 19,976 | 691,763 | |
| Europe Stock Funds - 0.4% | |||
| WisdomTree Europe Hedged Equity ETF (c) | 1,131,853 | 90,084,180 | |
| Foreign Large Blend Funds - 9.2% | |||
| Artisan International Value Fund Investor Class | 21,322,280 | 978,905,866 | |
| Fidelity SAI International Index Fund (e) | 44,452,558 | 648,118,289 | |
| Fidelity SAI International Low Volatility Index Fund (e) | 15,289,643 | 182,405,437 | |
| Harbor International Fund Institutional Class | 9,619 | 473,749 | |
| Morgan Stanley Institutional Fund, Inc. International Equity Portfolio Class I | 28,053,450 | 484,483,075 | |
| TOTAL FOREIGN LARGE BLEND FUNDS | 2,294,386,416 | ||
| Foreign Large Growth Funds - 19.2% | |||
| American Funds EuroPacific Growth Fund Class F2 | 1,004,486 | 72,182,367 | |
| Fidelity Advisor International Discovery Fund - Class Z (e) | 21,838,420 | 1,309,868,418 | |
| Fidelity Diversified International Fund (e) | 13,766,677 | 740,509,552 | |
| Fidelity Overseas Fund (e) | 12,692,417 | 890,880,734 | |
| Fidelity SAI International Momentum Index Fund (e) | 16,843,480 | 244,398,893 | |
| Fidelity SAI International Quality Index Fund (e) | 206,696 | 3,061,161 | |
| Invesco Oppenheimer International Growth Fund Class R6 | 836,208 | 44,862,558 | |
| JOHCM International Select Fund Investor Shares | 21,090,269 | 686,277,368 | |
| WCM Focused International Growth Fund Investor Class | 27,076,379 | 781,153,541 | |
| TOTAL FOREIGN LARGE GROWTH FUNDS | 4,773,194,592 | ||
| Foreign Large Value Funds - 11.1% | |||
| Fidelity SAI International Value Index Fund (e) | 104,007,065 | 1,054,631,637 | |
| iShares MSCI EAFE Value ETF (c) | 2,278,820 | 118,407,487 | |
| Oakmark International Fund Investor Class | 34,152,531 | 988,715,761 | |
| Pear Tree Polaris Foreign Value Fund Institutional Shares | 24,069,472 | 593,553,183 | |
| TOTAL FOREIGN LARGE VALUE FUNDS | 2,755,308,068 | ||
| Foreign Small Mid Blend Funds - 1.5% | |||
| Fidelity Advisor International Small Cap Fund - Class Z (e) | 1,882,710 | 66,666,761 | |
| Fidelity SAI International Small Cap Index Fund (e) | 16,290,463 | 168,280,482 | |
| Victory Trivalent International Small-Cap Fund Class I | 6,837,577 | 129,093,452 | |
| TOTAL FOREIGN SMALL MID BLEND FUNDS | 364,040,695 | ||
| Foreign Small Mid Growth Funds - 0.9% | |||
| Fidelity Advisor International Small Cap Opportunities Fund - Class Z (e) | 3,210,721 | 93,207,231 | |
| Oberweis International Opportunities Institutional Fund | 1,770,695 | 33,413,017 | |
| T. Rowe Price International Discovery Fund | 1,006,218 | 104,878,142 | |
| Wasatch International Growth Fund Investor Class | 100 | 3,968 | |
| TOTAL FOREIGN SMALL MID GROWTH FUNDS | 231,502,358 | ||
| Foreign Small Mid Value Funds - 1.1% | |||
| Brandes International Small Cap Equity Fund Class A | 3,237,883 | 46,690,267 | |
| Oakmark International Small Cap Fund Investor Class | 2,797,030 | 59,073,264 | |
| Segall Bryant & Hamill International Small Cap Fund Retail Class | 4,713,344 | 59,623,803 | |
| Transamerica International Small Cap Value Fund Class I | 5,682,172 | 95,574,140 | |
| TOTAL FOREIGN SMALL MID VALUE FUNDS | 260,961,474 | ||
| Sector Funds - 0.0% | |||
| SPDR Dow Jones International Real Estate ETF (c) | 201,575 | 7,667,913 | |
| Other - 6.5% | |||
| Fidelity Advisor Japan Fund - Class Z (e) | 3,488,090 | 72,482,510 | |
| Fidelity Japan Smaller Companies Fund (e) | 6,966,190 | 126,157,704 | |
| Fidelity SAI Japan Stock Index Fund (e) | 126,429,831 | 1,290,848,579 | |
| iShares MSCI Australia ETF (c) | 4,610,307 | 119,499,157 | |
| Matthews Japan Fund Investor Class | 198 | 4,837 | |
| TOTAL OTHER | 1,608,992,787 | ||
| TOTAL EQUITY FUNDS | |||
| (Cost $8,894,059,034) | 12,386,830,246 | ||
| Principal Amount | |||
| U.S. Treasury Obligations - 0.2% | |||
| U.S. Treasury Bills, yield at date of purchase 0.01% to 0.05% 9/2/21 to 11/26/21 (f) | |||
| (Cost $61,367,172) | 61,370,000 | 61,367,146 | |
| Value | |||
| Money Market Funds - 5.9% | |||
| Fidelity Securities Lending Cash Central Fund 0.06% (g)(h) | 143,767,811 | 143,782,188 | |
| State Street Institutional U.S. Government Money Market Fund Premier Class 0.03% (i) | 1,332,886,918 | 1,332,886,918 | |
| TOTAL MONEY MARKET FUNDS | |||
| (Cost $1,476,669,106) | 1,476,669,106 | ||
| TOTAL INVESTMENT IN SECURITIES - 100.4% | |||
| (Cost $17,739,877,217) | 24,936,958,919 | ||
| NET OTHER ASSETS (LIABILITIES) - (0.4)% | (104,145,549) | ||
| NET ASSETS - 100% | $24,832,813,370 |
| Futures Contracts | |||||
| Number of contracts | Expiration Date | Notional Amount | Value | Unrealized Appreciation/(Depreciation) | |
| Purchased | |||||
| Equity Index Contracts | |||||
| CME Nikkei 225 Index Contracts (United States) | 1,086 | Sept. 2021 | $152,420,100 | $(5,868,809) | $(5,868,809) |
| ICE E-mini MSCI EAFE Index Contracts (United States) | 8,599 | Sept. 2021 | 1,011,027,425 | 2,381,485 | 2,381,485 |
| TOTAL FUTURES CONTRACTS | $(3,487,324) |
The notional amount of futures purchased as a percentage of Net Assets is 4.7%
Security Type Abbreviations
ETF – Exchange-Traded Fund
Legend
(a) Security exempt from registration under Rule 144A of the Securities Act of 1933. These securities may be resold in transactions exempt from registration, normally to qualified institutional buyers. At the end of the period, the value of these securities amounted to $271,782,586 or 1.1% of net assets.
(b) Non-income producing
(c) Security or a portion of the security is on loan at period end.
(d) Security or a portion of the security purchased on a delayed delivery or when-issued basis.
(e) Affiliated Fund
(f) Security or a portion of the security was pledged to cover margin requirements for futures contracts. At period end, the value of securities pledged amounted to $61,266,146.
(g) Affiliated fund that is generally available only to investment companies and other accounts managed by Fidelity Investments. The rate quoted is the annualized seven-day yield of the fund at period end. A complete unaudited listing of the fund's holdings as of its most recent quarter end is available upon request. In addition, each Fidelity Central Fund's financial statements are available on the SEC's website or upon request.
(h) Investment made with cash collateral received from securities on loan.
(i) The rate quoted is the annualized seven-day yield of the fund at period end.
Affiliated Central Funds
Fiscal year to date information regarding the Fund's investments in Fidelity Central Funds, including the ownership percentage, is presented below.
| Fund | Value, beginning of period | Purchases | Sales Proceeds | Dividend Income | Realized Gain/Loss | Change in Unrealized appreciation (depreciation) | Value, end of period | % ownership, end of period |
| Fidelity Securities Lending Cash Central Fund 0.06% | $288,584,994 | $2,812,756,471 | $2,957,559,277 | $1,189,695 | $-- | $-- | $143,782,188 | 0.4% |
| Total | $288,584,994 | $2,812,756,471 | $2,957,559,277 | $1,189,695 | $-- | $-- | $143,782,188 |
Amounts in the income column in the above table include any capital gain distributions from underlying funds, which are presented in the corresponding line-item in the Statement of Operations, if applicable. Amount for Fidelity Securities Lending Cash Central Fund represents the income earned on investing cash collateral, less rebates paid to borrowers and any lending agent fees associated with the loan, plus any premium payments received for lending certain types of securities.
Affiliated Underlying Funds
Fiscal year to date information regarding the Fund's investments in affiliated Underlying Funds is presented below. Exchanges between classes of the same affiliated Underlying Funds may occur. If an underlying Fund changes its name, the name presented below is the name in effect at period end.
| Affiliate | Value, beginning of period | Purchases | Sales Proceeds | Dividend Income | Realized Gain (loss) | Change in Unrealized appreciation (depreciation) | Value, end of period |
| Fidelity Advisor International Discovery Fund - Class Z | $-- | $-- | $-- | $-- | $-- | $688,560,246 | $1,309,868,418 |
| Fidelity Advisor International Small Cap Fund - Class Z | -- | -- | -- | -- | -- | 15,906,101 | 66,666,761 |
| Fidelity Advisor International Small Cap Opportunities Fund - Class Z | -- | -- | -- | -- | -- | 32,059,023 | 93,207,231 |
| Fidelity Advisor Japan Fund - Class Z | -- | -- | -- | -- | -- | 37,245,688 | 72,482,510 |
| Fidelity Advisor Japan Fund Class I | 69,518,224 | -- | -- | -- | -- | (34,281,402) | -- |
| Fidelity Diversified International Fund | 631,176,275 | 62,000,000 | 38,000,000 | -- | 16,688,668 | 68,644,609 | 740,509,552 |
| Fidelity International Discovery Fund | 1,206,053,461 | -- | 28,000,001 | -- | 11,674,040 | (568,419,328) | -- |
| Fidelity International Small Cap Fund | 55,266,613 | 5,630,394 | -- | -- | -- | (10,136,347) | -- |
| Fidelity International Small Cap Opportunities Fund | 76,339,729 | -- | -- | -- | -- | (15,191,521) | -- |
| Fidelity Japan Smaller Companies Fund | 119,888,133 | -- | -- | -- | -- | 6,269,571 | 126,157,704 |
| Fidelity Overseas Fund | 580,010,044 | 202,000,001 | 10,000,000 | -- | 2,524,348 | 116,346,341 | 890,880,734 |
| Fidelity SAI International Index Fund | -- | 639,000,000 | -- | -- | -- | 9,118,289 | 648,118,289 |
| Fidelity SAI International Low Volatility Index Fund | 147,984,370 | 168,000,000 | 140,000,000 | -- | 3,755,982 | 2,665,085 | 182,405,437 |
| Fidelity SAI International Momentum Index Fund | 24,583,116 | 233,000,000 | 20,000,000 | -- | 4,318,725 | 2,497,052 | 244,398,893 |
| Fidelity SAI International Quality Index Fund | 17,608,498 | -- | 15,000,000 | -- | 3,082,407 | (2,629,744) | 3,061,161 |
| Fidelity SAI International Small Cap Index Fund | -- | 165,857,984 | -- | -- | -- | 2,422,498 | 168,280,482 |
| Fidelity SAI International Value Index Fund | -- | 1,026,000,000 | -- | -- | -- | 28,631,637 | 1,054,631,637 |
| Fidelity SAI Japan Stock Index Fund | -- | 1,293,369,252 | -- | -- | -- | (2,520,673) | 1,290,848,579 |
| Total | $2,928,428,463 | $3,794,857,631 | $251,000,001 | $-- | $42,044,170 | $377,187,125 | $6,891,517,388 |
Investment Valuation
The following is a summary of the inputs used, as of August 31, 2021, involving the Fund's assets and liabilities carried at fair value. The inputs or methodology used for valuing securities may not be an indication of the risk associated with investing in those securities. For more information on valuation inputs, and their aggregation into the levels used below, please refer to the Investment Valuation section in the accompanying Notes to Financial Statements.
| Valuation Inputs at Reporting Date: | ||||
| Description | Total | Level 1 | Level 2 | Level 3 |
| Investments in Securities: | ||||
| Equities: | ||||
| Communication Services | $389,861,233 | $224,333,252 | $165,527,981 | $-- |
| Consumer Discretionary | 1,047,112,889 | 633,286,492 | 413,826,397 | -- |
| Consumer Staples | 1,229,163,296 | 630,066,076 | 599,097,220 | -- |
| Energy | 295,809,692 | 135,685,007 | 160,124,685 | -- |
| Financials | 1,542,377,122 | 931,620,437 | 610,756,685 | -- |
| Health Care | 1,229,916,702 | 567,268,711 | 662,647,991 | -- |
| Industrials | 2,092,331,807 | 1,424,349,748 | 667,982,059 | -- |
| Information Technology | 1,775,757,107 | 1,352,053,065 | 423,704,042 | -- |
| Materials | 989,541,844 | 835,932,405 | 153,609,439 | -- |
| Real Estate | 165,398,169 | 165,398,169 | -- | -- |
| Utilities | 254,822,560 | 188,701,594 | 66,120,966 | -- |
| Equity Funds | 12,386,830,246 | 12,386,830,246 | -- | -- |
| Other Short-Term Investments | 61,367,146 | -- | 61,367,146 | -- |
| Money Market Funds | 1,476,669,106 | 1,476,669,106 | -- | -- |
| Total Investments in Securities: | $24,936,958,919 | $20,952,194,308 | $3,984,764,611 | $-- |
| Derivative Instruments: | ||||
| Assets | ||||
| Futures Contracts | $2,381,485 | $2,381,485 | $-- | $-- |
| Total Assets | $2,381,485 | $2,381,485 | $-- | $-- |
| Liabilities | ||||
| Futures Contracts | $(5,868,809) | $(5,868,809) | $-- | $-- |
| Total Liabilities | $(5,868,809) | $(5,868,809) | $-- | $-- |
| Total Derivative Instruments: | $(3,487,324) | $(3,487,324) | $-- | $-- |
Value of Derivative Instruments
The following table is a summary of the Fund's value of derivative instruments by primary risk exposure as of August 31, 2021. For additional information on derivative instruments, please refer to the Derivative Instruments section in the accompanying Notes to Financial Statements.
| Primary Risk Exposure / Derivative Type | Value | |
| Asset | Liability | |
| Equity Risk | ||
| Futures Contracts(a) | $2,381,485 | $(5,868,809) |
| Total Equity Risk | 2,381,485 | (5,868,809) |
| Total Value of Derivatives | $2,381,485 | $(5,868,809) |
(a) Reflects gross cumulative appreciation (depreciation) on futures contracts as presented in the Schedule of Investments. In the Statement of Assets and Liabilities, the period end daily variation margin is included in receivable or payable for daily variation margin on futures contracts, and the net cumulative appreciation (depreciation) is included in Total accumulated earnings (loss).
Other Information
Distribution of the direct investments by country of issue, as a percentage of Total Net Assets, is as follows (Unaudited):
| United States of America | 56.7% |
| Japan | 8.0% |
| United Kingdom | 5.9% |
| Switzerland | 5.1% |
| France | 4.9% |
| Germany | 4.6% |
| Netherlands | 2.8% |
| Canada | 1.1% |
| Korea (South) | 1.0% |
| Ireland | 1.0% |
| Others (Individually Less Than 1%) | 8.9% |
| 100.0% |
See accompanying notes which are an integral part of the financial statements.
Financial Statements
Statement of Assets and Liabilities
| August 31, 2021 (Unaudited) | ||
| Assets | ||
| Investment in securities, at value (including securities loaned of $139,287,220) — See accompanying schedule: Unaffiliated issuers (cost $12,267,055,778) | $17,901,659,343 | |
| Fidelity Central Funds (cost $143,782,188) | 143,782,188 | |
| Other affiliated issuers (cost $5,329,039,251) | 6,891,517,388 | |
| Total Investment in Securities (cost $17,739,877,217) | $24,936,958,919 | |
| Foreign currency held at value (cost $8,210,681) | 8,228,678 | |
| Receivable for investments sold | 21,474,638 | |
| Receivable for fund shares sold | 11,311,970 | |
| Dividends receivable | 17,386,155 | |
| Reclaims receivable | 22,606,583 | |
| Interest receivable | 26,914 | |
| Distributions receivable from Fidelity Central Funds | 66,735 | |
| Receivable for daily variation margin on futures contracts | 1,092,785 | |
| Prepaid expenses | 37,430 | |
| Other receivables | 578,133 | |
| Total assets | 25,019,768,940 | |
| Liabilities | ||
| Payable for investments purchased | ||
| Regular delivery | $28,892,411 | |
| Delayed delivery | 718,706 | |
| Payable for fund shares redeemed | 7,132,944 | |
| Accrued management fee | 3,010,334 | |
| Other payables and accrued expenses | 3,337,839 | |
| Collateral on securities loaned | 143,863,336 | |
| Total liabilities | 186,955,570 | |
| Net Assets | $24,832,813,370 | |
| Net Assets consist of: | ||
| Paid in capital | $16,624,139,750 | |
| Total accumulated earnings (loss) | 8,208,673,620 | |
| Net Assets | $24,832,813,370 | |
| Net Asset Value, offering price and redemption price per share ($24,832,813,370 ÷ 1,848,384,624 shares) | $13.43 |
See accompanying notes which are an integral part of the financial statements.
Statement of Operations
| Six months ended August 31, 2021 (Unaudited) | ||
| Investment Income | ||
| Dividends: | ||
| Unaffiliated issuers | $170,110,184 | |
| Interest | 225,034 | |
| Income from Fidelity Central Funds (including $1,189,695 from security lending) | 1,189,695 | |
| Income before foreign taxes withheld | 171,524,913 | |
| Less foreign taxes withheld | (18,462,300) | |
| Total income | 153,062,613 | |
| Expenses | ||
| Management fee | $44,690,391 | |
| Custodian fees and expenses | 413,244 | |
| Independent trustees' fees and expenses | 81,637 | |
| Registration fees | 170,922 | |
| Audit | 103,556 | |
| Legal | 26,036 | |
| Miscellaneous | 67,409 | |
| Total expenses before reductions | 45,553,195 | |
| Expense reductions | (27,470,524) | |
| Total expenses after reductions | 18,082,671 | |
| Net investment income (loss) | 134,979,942 | |
| Realized and Unrealized Gain (Loss) | ||
| Net realized gain (loss) on: | ||
| Investment securities: | ||
| Unaffiliated issuers (net of foreign taxes of $2,658) | 916,636,246 | |
| Affiliated issuers | 42,044,170 | |
| Foreign currency transactions | 64,186 | |
| Futures contracts | 40,471,126 | |
| Capital gain distributions from underlying funds: | ||
| Unaffiliated issuers | 2,904,930 | |
| Total net realized gain (loss) | 1,002,120,658 | |
| Change in net unrealized appreciation (depreciation) on: | ||
| Investment securities: | ||
| Unaffiliated issuers (net of increase in deferred foreign taxes of $1,091,366) | 487,628,239 | |
| Affiliated issuers | 377,187,125 | |
| Assets and liabilities in foreign currencies | (680,581) | |
| Futures contracts | (20,923,384) | |
| Total change in net unrealized appreciation (depreciation) | 843,211,399 | |
| Net gain (loss) | 1,845,332,057 | |
| Net increase (decrease) in net assets resulting from operations | $1,980,311,999 |
See accompanying notes which are an integral part of the financial statements.
Statement of Changes in Net Assets
| Six months ended August 31, 2021 (Unaudited) | Year ended February 28, 2021 | |
| Increase (Decrease) in Net Assets | ||
| Operations | ||
| Net investment income (loss) | $134,979,942 | $214,759,146 |
| Net realized gain (loss) | 1,002,120,658 | 446,337,309 |
| Change in net unrealized appreciation (depreciation) | 843,211,399 | 4,033,667,020 |
| Net increase (decrease) in net assets resulting from operations | 1,980,311,999 | 4,694,763,475 |
| Distributions to shareholders | (502,474,146) | (345,007,315) |
| Share transactions | ||
| Proceeds from sales of shares | 4,348,278,455 | 4,467,737,246 |
| Reinvestment of distributions | 480,040,476 | 334,019,828 |
| Cost of shares redeemed | (1,273,654,702) | (4,447,769,615) |
| Net increase (decrease) in net assets resulting from share transactions | 3,554,664,229 | 353,987,459 |
| Total increase (decrease) in net assets | 5,032,502,082 | 4,703,743,619 |
| Net Assets | ||
| Beginning of period | 19,800,311,288 | 15,096,567,669 |
| End of period | $24,832,813,370 | $19,800,311,288 |
| Other Information | ||
| Shares | ||
| Sold | 330,563,413 | 435,963,931 |
| Issued in reinvestment of distributions | 37,386,330 | 31,687,641 |
| Redeemed | (97,740,429) | (409,722,398) |
| Net increase (decrease) | 270,209,314 | 57,929,174 |
See accompanying notes which are an integral part of the financial statements.
Financial Highlights
Strategic Advisers International Fund
| Six months ended (Unaudited) August 31, | Years endedFebruary 28, | |||||
| 2021 | 2021 | 2020 A | 2019 | 2018 | 2017 | |
| Selected Per–Share Data | ||||||
| Net asset value, beginning of period | $12.55 | $9.93 | $10.03 | $11.43 | $9.78 | $8.74 |
| Income from Investment Operations | ||||||
| Net investment income (loss)B | .08 | .13 | .20 | .21 | .19 | .17 |
| Net realized and unrealized gain (loss) | 1.12 | 2.71 | .06 | (.98) | 1.82 | 1.07 |
| Total from investment operations | 1.20 | 2.84 | .26 | (.77) | 2.01 | 1.24 |
| Distributions from net investment income | (.02) | (.14) | (.22) | (.18) | (.18) | (.18) |
| Distributions from net realized gain | (.29) | (.08) | (.14) | (.44) | (.18) | (.02) |
| Total distributions | (.32)C | (.22) | (.36) | (.63)C | (.36) | (.20) |
| Net asset value, end of period | $13.43 | $12.55 | $9.93 | $10.03 | $11.43 | $9.78 |
| Total ReturnD,E | 9.65% | 28.99% | 2.35% | (6.57)% | 20.53% | 14.33% |
| Ratios to Average Net AssetsF,G | ||||||
| Expenses before reductions | .41%H | .43% | .44% | .45% | .50% | .48% |
| Expenses net of fee waivers, if any | .16%H | .18% | .19% | .20% | .25% | .23% |
| Expenses net of all reductions | .16%H | .18% | .19% | .20% | .24% | .22% |
| Net investment income (loss) | 1.23%H | 1.25% | 1.91% | 1.95% | 1.68% | 1.81% |
| Supplemental Data | ||||||
| Net assets, end of period (000 omitted) | $24,832,813 | $19,800,311 | $15,096,568 | $15,904,961 | $17,256,557 | $16,141,374 |
| Portfolio turnover rateI | 41%H | 41% | 33% | 39% | 33% | 28% |
A For the year ended February 29.
B Calculated based on average shares outstanding during the period.
C Total distributions per share do not sum due to rounding.
D Total returns for periods of less than one year are not annualized.
E Total returns would have been lower if certain expenses had not been reduced during the applicable periods shown.
F Fees and expenses of any underlying mutual funds or exchange-traded funds (ETFs) are not included in the Fund's expense ratio. The Fund indirectly bears its proportionate share of these expenses. For additional expense information related to investments in Fidelity Central Funds, please refer to the "Investments in Fidelity Central Funds" note found in the Notes to Financial Statements section of the most recent Annual or Semi-Annual report.
G Expense ratios reflect operating expenses of the class. Expenses before reductions do not reflect amounts reimbursed, waived, or reduced through arrangements with the investment advisor, brokerage services, or other offset arrangements, if applicable, and do not represent the amount paid by the class during periods when reimbursements, waivers or reductions occur.
H Annualized
I Amount does not include the portfolio activity of any underlying mutual funds or exchange-traded funds (ETFs).
See accompanying notes which are an integral part of the financial statements.
Notes to Financial Statements (Unaudited)
For the period ended August 31, 2021
1. Organization.
Strategic Advisers International Fund (the Fund) is a fund of Fidelity Rutland Square Trust II (the Trust), and is authorized to issue an unlimited number of shares. The Trust is registered under the Investment Company Act of 1940, as amended (the 1940 Act), as an open-end management investment company organized as a Delaware statutory trust. The Fund is offered exclusively to certain managed account clients of Strategic Advisers LLC (Strategic Advisers), an affiliate of Fidelity Management & Research Company LLC (FMR).
2. Significant Accounting Policies.
The Fund is an investment company and applies the accounting and reporting guidance of the Financial Accounting Standards Board (FASB) Accounting Standards Codification Topic 946 Financial Services - Investment Companies. The financial statements have been prepared in conformity with accounting principles generally accepted in the United States of America (GAAP), which require management to make certain estimates and assumptions at the date of the financial statements. Actual results could differ from those estimates. Subsequent events, if any, through the date that the financial statements were issued have been evaluated in the preparation of the financial statements. The Fund's Schedule of Investments lists any underlying mutual funds or exchange-traded funds (ETFs) but does not include the underlying holdings of these funds. The following summarizes the significant accounting policies of the Fund:
Investment Valuation. Investments are valued as of 4:00 p.m. Eastern time on the last calendar day of the period. The Board of Trustees (the Board) has delegated the day to day responsibility for the valuation of the Fund's investments to the Fair Value Committee (the Committee) established by the Fund's investment adviser. In accordance with valuation policies and procedures approved by the Board, the Fund attempts to obtain prices from one or more third party pricing vendors or brokers to value its investments. When current market prices, quotations or currency exchange rates are not readily available or reliable, investments will be fair valued in good faith by the Committee, in accordance with procedures adopted by the Board. Factors used in determining fair value vary by investment type and may include market or investment specific events, changes in interest rates and credit quality. The frequency with which these procedures are used cannot be predicted and they may be utilized to a significant extent. The Committee oversees the Fund's valuation policies and procedures and reports to the Board on the Committee's activities and fair value determinations. The Board monitors the appropriateness of the procedures used in valuing the Fund's investments and ratifies the fair value determinations of the Committee.
The Fund categorizes the inputs to valuation techniques used to value its investments into a disclosure hierarchy consisting of three levels as shown below:
- Level 1 – quoted prices in active markets for identical investments
- Level 2 – other significant observable inputs (including quoted prices for similar investments, interest rates, prepayment speeds, etc.)
- Level 3 – unobservable inputs (including the Fund's own assumptions based on the best information available)
Valuation techniques used to value the Fund's investments by major category are as follows:
Equity securities, including restricted securities, for which market quotations are readily available, are valued at the last reported sale price or official closing price as reported by a third party pricing vendor on the primary market or exchange on which they are traded and are categorized as Level 1 in the hierarchy. In the event there were no sales during the day or closing prices are not available, securities are valued at the last quoted bid price or may be valued using the last available price and are generally categorized as Level 2 in the hierarchy. For foreign equity securities, when market or security specific events arise, comparisons to the valuation of American Depositary Receipts (ADRs), futures contracts, Exchange-Traded Funds (ETFs) and certain indexes as well as quoted prices for similar securities may be used and would be categorized as Level 2 in the hierarchy. For equity securities, including restricted securities, where observable inputs are limited, assumptions about market activity and risk are used and these securities may be categorized as Level 3 in the hierarchy.
Debt securities, including restricted securities, are valued based on evaluated prices received from third party pricing vendors or from brokers who make markets in such securities. U.S. government and government agency obligations are valued by pricing vendors who utilize matrix pricing which considers yield or price of bonds of comparable quality, coupon, maturity and type or by broker-supplied prices. When independent prices are unavailable or unreliable, debt securities may be valued utilizing pricing methodologies which consider similar factors that would be used by third party pricing vendors. Debt securities are generally categorized as Level 2 in the hierarchy but may be Level 3 depending on the circumstances. ETFs are valued at their last sale price or official closing price as reported by a third party pricing vendor on the primary market or exchange on which they are traded and are categorized as Level 1 in the hierarchy. In the event there were no sales during the day but the exchange reports a closing bid level, ETFs are valued at the closing bid and would be categorized as Level 1 in the hierarchy. In the event there was no closing bid, ETFs may be valued by another method that the Board believes reflects fair value in accordance with the Board's fair value pricing policies and may be categorized as Level 2 in the hierarchy.
Futures contracts are valued at the settlement price established each day by the board of trade or exchange on which they are traded and are categorized as Level 1 in the hierarchy. Investments in open-end mutual funds, including the Fidelity Central Funds, are valued at their closing net asset value (NAV) each business day and are categorized as Level 1 in the hierarchy. If an unaffiliated open-end mutual fund's NAV is unavailable, shares of that fund may be valued by another method that the Board believes reflects fair value in accordance with the Board's fair value pricing policies and is categorized as Level 2 in the hierarchy.
Changes in valuation techniques may result in transfers in or out of an assigned level within the disclosure hierarchy. The aggregate value of investments by input level as of August 31, 2021 is included at the end of the Fund's Schedule of Investments.
Foreign Currency. Certain Funds may use foreign currency contracts to facilitate transactions in foreign-denominated securities. Gains and losses from these transactions may arise from changes in the value of the foreign currency or if the counterparties do not perform under the contracts' terms.
Foreign-denominated assets, including investment securities, and liabilities are translated into U.S. dollars at the exchange rates at period end. Purchases and sales of investment securities, income and dividends received, and expenses denominated in foreign currencies are translated into U.S. dollars at the exchange rate in effect on the transaction date.
The effects of exchange rate fluctuations on investments are included with the net realized and unrealized gain (loss) on investment securities. Other foreign currency transactions resulting in realized and unrealized gain (loss) are disclosed separately.
Investment Transactions and Income. For financial reporting purposes, the Fund's investment holdings and NAV include trades executed through the end of the last business day of the period. The NAV per share for processing shareholder transactions is calculated as of the close of business of the New York Stock Exchange (NYSE), normally 4:00 p.m. Eastern time and includes trades executed through the end of the prior business day. Gains and losses on securities sold are determined on the basis of identified cost and include proceeds received from litigation. Dividend income is recorded on the ex-dividend date, except for certain dividends from foreign securities where the ex-dividend date may have passed, which are recorded as soon as the Fund is informed of the ex-dividend date. Non-cash dividends included in dividend income, if any, are recorded at the fair market value of the securities received. Income and capital gain distributions from Fidelity Central Funds, if any, are recorded on the ex-dividend date. Income and capital gain distributions from any underlying mutual funds or exchange-traded funds (ETFs) are recorded on the ex-dividend date. Interest income is accrued as earned and includes coupon interest and amortization of premium and accretion of discount on debt securities as applicable. Investment income is recorded net of foreign taxes withheld where recovery of such taxes is uncertain. Funds may file withholding tax reclaims in certain jurisdictions to recover a portion of amounts previously withheld. Any withholding tax reclaims income is included in the Statement of Operations in foreign taxes withheld. Any receivables for withholding tax reclaims are included in the Statement of Assets and Liabilities in reclaims receivable.
Expenses. Expenses directly attributable to a fund are charged to that fund. Expenses attributable to more than one fund are allocated among the respective funds on the basis of relative net assets or other appropriate methods. Expenses included in the accompanying financial statements reflect the expenses of that fund and do not include any expenses associated with any underlying mutual funds or exchange-traded funds. Although not included in a fund's expenses, a fund indirectly bears its proportionate share of these expenses through the net asset value of each underlying mutual fund or exchange-traded fund. Expense estimates are accrued in the period to which they relate and adjustments are made when actual amounts are known.
Deferred Trustee Compensation. Under a Deferred Compensation Plan (the Plan) for certain Funds, certain independent Trustees have elected to defer receipt of a portion of their annual compensation. Deferred amounts are invested in affiliated mutual funds, are marked-to-market and remain in a fund until distributed in accordance with the Plan. The investment of deferred amounts and the offsetting payable to the Trustees presented below are included in the accompanying Statement of Assets and Liabilities in other receivables and other payables and accrued expenses, as applicable.
| Strategic Advisers International Fund | $338,151 |
Income Tax Information and Distributions to Shareholders. Each year, the Fund intends to qualify as a regulated investment company under Subchapter M of the Internal Revenue Code, including distributing substantially all of its taxable income and realized gains. As a result, no provision for U.S. Federal income taxes is required. The Fund files a U.S. federal tax return, in addition to state and local tax returns as required. The Fund's federal income tax returns are subject to examination by the Internal Revenue Service (IRS) for a period of three fiscal years after they are filed. State and local tax returns may be subject to examination for an additional fiscal year depending on the jurisdiction. Foreign taxes are provided for based on the Fund's understanding of the tax rules and rates that exist in the foreign markets in which it invests. The Fund is subject to a tax imposed on capital gains by certain countries in which it invests. An estimated deferred tax liability for net unrealized appreciation on the applicable securities is included in Other payables and accrued expenses on the Statement of Assets & Liabilities.
Distributions are declared and recorded on the ex-dividend date. Income and capital gain distributions are determined in accordance with income tax regulations, which may differ from GAAP.
Capital accounts within the financial statements are adjusted for permanent book-tax differences. These adjustments have no impact on net assets or the results of operations. Capital accounts are not adjusted for temporary book-tax differences which will reverse in a subsequent period.
Book-tax differences are primarily due to the short-term gain distributions from the underlying mutual funds or exchange-traded funds (ETFs), futures contracts, foreign currency transactions, passive foreign investment companies (PFIC), market discount, deferred trustees compensation and losses deferred due to wash sales.
As of period end, the cost and unrealized appreciation (depreciation) in securities, and derivatives if applicable, for federal income tax purposes were as follows:
| Gross unrealized appreciation | $7,361,643,620 |
| Gross unrealized depreciation | (216,239,554) |
| Net unrealized appreciation (depreciation) | $7,145,404,066 |
| Tax cost | $17,788,067,529 |
Delayed Delivery Transactions and When-Issued Securities. During the period, certain Funds transacted in securities on a delayed delivery or when-issued basis. Payment and delivery may take place after the customary settlement period for that security. The price of the underlying securities and the date when the securities will be delivered and paid for are fixed at the time the transaction is negotiated. Securities purchased on a delayed delivery or when-issued basis are identified as such in the Schedule of Investments. Compensation for interest forgone in the purchase of a delayed delivery or when-issued debt security may be received. With respect to purchase commitments, each applicable Fund identifies securities as segregated in its records with a value at least equal to the amount of the commitment. Payables and receivables associated with the purchases and sales of delayed delivery securities having the same coupon, settlement date and broker are offset. Delayed delivery or when-issued securities that have been purchased from and sold to different brokers are reflected as both payables and receivables in the Statement of Assets and Liabilities under the caption "Delayed delivery", as applicable. Losses may arise due to changes in the value of the underlying securities or if the counterparty does not perform under the contract's terms, or if the issuer does not issue the securities due to political, economic, or other factors.
Restricted Securities (including Private Placements). Funds may invest in securities that are subject to legal or contractual restrictions on resale. These securities generally may be resold in transactions exempt from registration or to the public if the securities are registered. Disposal of these securities may involve time-consuming negotiations and expense, and prompt sale at an acceptable price may be difficult. Information regarding restricted securities held at period end is included at the end of the Schedule of Investments, if applicable.
3. Derivative Instruments.
Risk Exposures and the Use of Derivative Instruments. The Fund's investment objective allows the Fund to enter into various types of derivative contracts, including futures contracts. Derivatives are investments whose value is primarily derived from underlying assets, indices or reference rates and may be transacted on an exchange or over-the-counter (OTC). Derivatives may involve a future commitment to buy or sell a specified asset based on specified terms, to exchange future cash flows at periodic intervals based on a notional principal amount, or for one party to make one or more payments upon the occurrence of specified events in exchange for periodic payments from the other party.
The Fund used derivatives to increase returns and to manage exposure to certain risks as defined below. The success of any strategy involving derivatives depends on analysis of numerous economic factors, and if the strategies for investment do not work as intended, the Fund may not achieve its objectives.
The Fund's use of derivatives increased or decreased its exposure to the following risk:
| Equity Risk | Equity risk relates to the fluctuations in the value of financial instruments as a result of changes in market prices (other than those arising from interest rate risk or foreign exchange risk), whether caused by factors specific to an individual investment, its issuer, or all factors affecting all instruments traded in a market or market segment. |
The Fund is also exposed to additional risks from investing in derivatives, such as liquidity risk and counterparty credit risk. Liquidity risk is the risk that the Fund will be unable to close out the derivative in the open market in a timely manner. Counterparty credit risk is the risk that the counterparty will not be able to fulfill its obligation to the Fund. Counterparty credit risk related to exchange-traded futures contracts may be mitigated by the protection provided by the exchange on which they trade.
Investing in derivatives may involve greater risks than investing in the underlying assets directly and, to varying degrees, may involve risk of loss in excess of any initial investment and collateral received and amounts recognized in the Statement of Assets and Liabilities. In addition, there may be the risk that the change in value of the derivative contract does not correspond to the change in value of the underlying instrument.
Futures Contracts. A futures contract is an agreement between two parties to buy or sell a specified underlying instrument for a fixed price at a specified future date. The Fund used futures contracts to manage its exposure to the stock market.
Upon entering into a futures contract, a fund is required to deposit either cash or securities (initial margin) with a clearing broker in an amount equal to a certain percentage of the face value of the contract. Futures contracts are marked-to-market daily and subsequent daily payments (variation margin) are made or received by a fund depending on the daily fluctuations in the value of the futures contracts and are recorded as unrealized appreciation or (depreciation). This receivable and/or payable, if any, is included in daily variation margin on futures contracts in the Statement of Assets and Liabilities. Realized gain or (loss) is recorded upon the expiration or closing of a futures contract. The net realized gain (loss) and change in net unrealized appreciation (depreciation) on futures contracts during the period is presented in the Statement of Operations.
Any open futures contracts at period end are presented in the Schedule of Investments under the caption "Futures Contracts". The notional amount at value reflects each contract's exposure to the underlying instrument or index at period end and is representative of volume of activity during the period. Securities deposited to meet initial margin requirements are identified in the Schedule of Investments.
4. Purchases and Sales of Investments.
Purchases and sales of securities, other than short-term securities and in-kind transactions, as applicable, are noted in the table below.
| Purchases ($) | Sales ($) | |
| Strategic Advisers International Fund | 6,489,374,876 | 4,311,150,909 |
5. Fees and Other Transactions with Affiliates.
Management Fee. Strategic Advisers (the investment adviser) provides the Fund with investment management related services. For these services, the Fund pays a monthly management fee to the investment adviser. The management fee is calculated by adding the annual management fee rate of .25% of the Fund's average net assets throughout the month to the aggregate of the fee rates, payable monthly by the investment adviser, to the Fund's sub-advisers. The Fund's maximum aggregate management fee will not exceed 1.00% of the Fund's average net assets. For the reporting period, the total annualized management fee rate was .41% of the Fund's average net assets.
During the period, the investment adviser waived a portion of its management fee as described in the Expense Reductions note.
Sub-Advisers. Arrowstreet Capital, Limited Partnership, Causeway Capital Management, LLC, Massachusetts Financial Services Company (MFS), Thompson, Siegel & Walmsley LLC, T. Rowe Price Associates, Inc. and William Blair Investment Management, LLC each served as a sub-adviser for the Fund during the period. Sub-advisers provide discretionary investment advisory services for their allocated portion of the Fund's assets and are paid as described in the Management Fee note.
FIAM LLC (an affiliate of the investment adviser), FIL Investment Advisors and Geode Capital Management, LLC, have been retained to serve as a sub-adviser for the Fund. As of the date of this report, these sub-advisers have not been allocated any portion of the Fund's assets. These sub-advisers in the future may provide discretionary investment advisory services for an allocated portion of the Fund's assets and will be paid by the investment adviser for providing these services.
Brokerage Commissions. A portion of portfolio transactions were placed with brokerage firms which are affiliates of the investment adviser. Brokerage commissions are included in net realized gain (loss) and change in net unrealized appreciation (depreciation) in the Statement of Operations. The commissions paid to these affiliated firms were as follows:
| Amount | |
| Strategic Advisers International Fund | $258 |
Interfund Trades. Funds may purchase from or sell securities to other funds affiliated with each sub-adviser under procedures adopted by the Board. The procedures have been designed to ensure these interfund trades are executed in accordance with Rule 17a-7 of the 1940 Act. Any interfund trades are included within the respective purchases and sales amounts shown in the Purchases and Sales of Investments note.
Other. During the period, the investment adviser reimbursed the Fund for certain losses as follows:
| Amount ($) | |
| Strategic Advisers International Fund | 5,243 |
6. Investments in Fidelity Central Funds.
Funds may invest in Fidelity Central Funds, which are open-end investment companies generally available only to other investment companies and accounts managed by the investment adviser and its affiliates. The Schedule of Investments lists any Fidelity Central Funds held as an investment as of period end, but does not include the underlying holdings of each Fidelity Central Fund. An investing fund indirectly bears its proportionate share of the expenses of the underlying Fidelity Central Funds.
Based on its investment objective, each Fidelity Central Fund may invest or participate in various investment vehicles or strategies that are similar to those of the investing fund. These strategies are consistent with the investment objectives of the investing fund and may involve certain economic risks which may cause a decline in value of each of the Fidelity Central Funds and thus a decline in the value of the investing fund.
| Fidelity Central Fund | Investment Manager | Investment Objective | Investment Practices | Expense Ratio(a) |
| Fidelity Money Market Central Funds | Fidelity Management & Research Company LLC (FMR) | Each fund seeks to obtain a high level of current income consistent with the preservation of capital and liquidity. | Short-term Investments | Less than .005% to .01% |
(a) Expenses expressed as a percentage of average net assets and are as of each underlying Central Fund's most recent annual or semi-annual shareholder report.
A complete unaudited list of holdings for each Fidelity Central Fund is available upon request or at the Securities and Exchange Commission website at www.sec.gov. In addition, the financial statements of the Fidelity Central Funds, which are not covered by the Report of Independent Registered Public Accounting Firm, are available on the Securities and Exchange Commission website or upon request.
7. Committed Line of Credit.
Certain Funds participate with other funds managed by the investment adviser or an affiliate in a $4.25 billion credit facility (the "line of credit") to be utilized for temporary or emergency purposes to fund shareholder redemptions or for other short-term liquidity purposes. The participating funds have agreed to pay commitment fees on their pro-rata portion of the line of credit, which are reflected in Miscellaneous expenses on the Statement of Operations, and are listed below. During the period, there were no borrowings on this line of credit.
| Amount | |
| Strategic Advisers International Fund | $19,125 |
8. Security Lending.
Funds lend portfolio securities through a lending agent from time to time in order to earn additional income. On the settlement date of the loan, a fund receives collateral (in the form of U.S. Treasury obligations, letters of credit and/or cash) against the loaned securities and maintains collateral in an amount not less than 100% of the market value of the loaned securities during the period of the loan. The market value of the loaned securities is determined at the close of business of a fund and any additional required collateral is delivered to a fund on the next business day. A fund or borrower may terminate the loan at any time, and if the borrower defaults on its obligation to return the securities loaned because of insolvency or other reasons, a fund may apply collateral received from the borrower against the obligation. A fund may experience delays and costs in recovering the securities loaned. Any cash collateral received is invested in the Fidelity Securities Lending Cash Central Fund. Any loaned securities are identified as such in the Schedule of Investments, and the value of loaned securities and cash collateral at period end, as applicable, are presented in the Statement of Assets and Liabilities. Security lending income represents the income earned on investing cash collateral, less rebates paid to borrowers and any lending agent fees associated with the loan, plus any premium payments received for lending certain types of securities. Security lending income is presented in the Statement of Operations as a component of income from Fidelity Central Funds.
9. Expense Reductions.
The investment adviser has contractually agreed to waive the Fund's management fee in an amount equal to .25% of the Fund's average net assets until September 30, 2024. During the period, this waiver reduced the Fund's management fee by $27,470,267.
In addition, through arrangements with the Fund's custodian, credits realized as a result of certain uninvested cash balances were used to reduce the Fund's expenses by $257.
10. Other.
Fund's organizational documents provide former and current trustees and officers with a limited indemnification against liabilities arising in connection with the performance of their duties to the fund. In the normal course of business, the fund may also enter into contracts that provide general indemnifications. The fund's maximum exposure under these arrangements is unknown as this would be dependent on future claims that may be made against the fund. The risk of material loss from such claims is considered remote.
Funds do not invest in underlying mutual funds for the purpose of exercising management or control; however, investments by funds within their principal investment strategies may represent a significant portion of the underlying mutual fund's net assets. At the end of the period, certain Funds were the owners of record of 10% or more of the total outstanding shares of the following underlying mutual funds as shown below.
| Fund | Strategic Advisers International Fund |
| Fidelity International Discovery Fund | 11% |
| Fidelity SAI International Index Fund | 10% |
| Fidelity SAI International Momentum Index Fund | 24% |
| Fidelity SAI International Small Cap Index Fund | 19% |
| Fidelity SAI International Value Index Fund | 17% |
| Fidelity SAI Japan Stock Index Fund | 84% |
11. Coronavirus (COVID-19) Pandemic.
An outbreak of COVID-19 first detected in China during December 2019 has since spread globally and was declared a pandemic by the World Health Organization during March 2020. Developments that disrupt global economies and financial markets, such as the COVID-19 pandemic, may magnify factors that affect the Fund's performance.
Shareholder Expense Example
As a shareholder, you incur two types of costs: (1) transaction costs, which may include sales charges (loads) on purchase payments or redemption proceeds, as applicable and (2) ongoing costs, which generally include management fees, distribution and/or service (12b-1) fees and other Fund expenses. This Example is intended to help you understand your ongoing costs (in dollars) of investing in a fund and to compare these costs with the ongoing costs of investing in other mutual funds.
The Example is based on an investment of $1,000 invested at the beginning of the period and held for the entire period (March 1, 2021 to August 31, 2021).
Actual Expenses
The first line of the accompanying table provides information about actual account values and actual expenses. You may use the information in this line, together with the amount you invested, to estimate the expenses that you paid over the period. Simply divide your account value by $1,000.00 (for example, an $8,600 account value divided by $1,000.00 = 8.6), then multiply the result by the number in the first line for a class/Fund under the heading entitled "Expenses Paid During Period" to estimate the expenses you paid on your account during this period. If any fund is a shareholder of any underlying mutual funds or exchange-traded funds (ETFs) (the Underlying Funds), such fund indirectly bears its proportional share of the expenses of the Underlying Funds in addition to the direct expenses incurred presented in the table. These fees and expenses are not included in the annualized expense ratio used to calculate the expense estimate in the table below.
Hypothetical Example for Comparison Purposes
The second line of the accompanying table provides information about hypothetical account values and hypothetical expenses based on the actual expense ratio and an assumed rate of return of 5% per year before expenses, which is not the actual return. The hypothetical account values and expenses may not be used to estimate the actual ending account balance or expenses you paid for the period. You may use this information to compare the ongoing costs of investing in the Fund and other funds. To do so, compare this 5% hypothetical example with the 5% hypothetical examples that appear in the shareholder reports of the other funds. If any fund is a shareholder of any Underlying Funds, such fund indirectly bears its proportional share of the expenses of the Underlying Funds in addition to the direct expenses as presented in the table. These fees and expenses are not included in the annualized expense ratio used to calculate the expense estimate in the table below.
Please note that the expenses shown in the table are meant to highlight your ongoing costs only and do not reflect any transaction costs. Therefore, the second line of the table is useful in comparing ongoing costs only, and will not help you determine the relative total costs of owning different funds.
| Annualized Expense Ratio-A | Beginning Account Value March 1, 2021 | Ending Account Value August 31, 2021 | Expenses Paid During Period-B March 1, 2021 to August 31, 2021 |
|
| Strategic Advisers International Fund | .16% | |||
| Actual | $1,000.00 | $1,096.50 | $.85 | |
| Hypothetical-C | $1,000.00 | $1,024.40 | $.82 |
A Annualized expense ratio reflects expenses net of applicable fee waivers.
B Expenses are equal to the annualized expense ratio, multiplied by the average account value over the period, multiplied by 184/ 365 (to reflect the one-half year period). The fees and expenses of any Underlying Funds are not included in each annualized expense ratio.
C 5% return per year before expenses
Board Approval of Amended Sub-Advisory Agreement
Strategic Advisers International Fund
In June 2021, the Board of Trustees, including the Independent Trustees (together, the Board) voted to approve amendments to the fee schedules for the investment mandates in the existing sub-advisory agreements among Strategic Advisers LLC (Strategic Advisers), each of Causeway Capital Management LLC (Causeway), Massachusetts Financial Services Company (MFS) (with respect to only one of two investment mandates), and Thompson, Siegel & Walmsley LLC (TSW) (each, a Sub-Adviser), and Fidelity Rutland Square Trust II (Trust) on behalf of the fund, and also voted to approve an amendment in the existing sub-advisory agreement among Strategic Advisers, Causeway, and the Trust on behalf of the fund to add certain additional representations from Causeway regarding a participating affiliate arrangement (each, an Amended Sub-Advisory Agreement). The Board noted that the updated fee schedules in the Amended Sub-Advisory Agreements will result in the same or lower fees at all asset levels. The Board also noted that no other material contract terms are impacted by the Amended Sub-Advisory Agreements. The Board, assisted by the advice of fund counsel and Independent Trustees' counsel, considered a broad range of information.In considering whether to approve each Amended Sub-Advisory Agreement, the Board reached a determination, with the assistance of fund counsel and Independent Trustees' counsel and through the exercise of its business judgment, that the approval of each Amended Sub-Advisory Agreement is in the best interests of the fund and its shareholders and that the approval of such agreement does not involve a conflict of interest from which Strategic Advisers or its affiliates derive an inappropriate advantage. Also, the Board found that the fees to be charged under each Amended Sub-Advisory Agreement bear a reasonable relationship to the services to be rendered and will be based on services provided that will be in addition to, rather than duplicative of services provided under the advisory contract of any underlying fund in which the fund may invest. The Board's decision to approve each Amended Sub-Advisory Agreement was not based on any single factor, but rather was based on a comprehensive consideration of all the information provided to the Board. In addition, individual Trustees did not necessarily attribute the same weight or importance to each factor. Nature, Extent, and Quality of Services Provided. The Board considered the backgrounds of the investment personnel that will provide services to the fund, and also considered the fund's investment objective, strategies and related investment philosophy and current sub-adviser line-up, as well as the structures of the investment personnel compensation programs and whether such structures provide appropriate incentives to act in the best interests of the fund, at its September 2020 meeting. The Board considered the detailed information provided by Strategic Advisers and each Sub-Adviser in the June 2021 annual contract renewal materials.The Board noted that it had approved the existing sub-advisory agreement with each Sub-Adviser at its September 2020 meeting and that each Amended Sub-Advisory Agreement will not result in any changes to: (i) the nature, extent and quality of the sub-advisory services provided; (ii) the investment process or strategies employed in the management of the fund's assets; or (iii) the day-to-day management of the fund or the persons primarily responsible for such management. Investment Performance. The Board did not consider performance to be a material factor in its decision to approve each Amended Sub-Advisory Agreement because the approval of each Amended Sub-Advisory Agreement will not result in any changes (i) to the fund's investment processes or strategies; or (ii) in the persons primarily responsible for the day-to-day management of the fund.Based on its review, the Board concluded that the nature, extent, and quality of services that will be provided to the fund under each Amended Sub-Advisory Agreement will continue to benefit the fund's shareholders.Competitiveness of Management Fee and Total Fund Expenses.
The Board noted that each Amended Sub-Advisory Agreement will not result in changes to the maximum aggregate annual management fee payable by the fund or Strategic Advisers' portion of the management fee. The Board considered Strategic Advisers' contractual agreement to waive its portion of the fund's management fee. The Board considered that each Amended Sub-Advisory Agreement will or has the potential to result in a decrease in the total management fees of the fund. Based on its review, the Board concluded that the fund's management fee structure and any changes to projected total expenses bear a reasonable relationship to the services that the fund and its shareholders will receive and the other factors considered.Because each Amended Sub-Advisory Agreement was negotiated at arm's length and will have no impact on the maximum management fees payable by the fund, the Board did not consider the costs of services and profitability of the relationship with the fund to Strategic Advisers to be significant factors in its decision to approve each Amended Sub-Advisory Agreement. Potential Fall-Out Benefits. The Board considered that it reviews information regarding the potential of direct and indirect benefits to Strategic Advisers and its affiliates from their relationships with the fund, including non-advisory fee compensation paid to affiliates of Strategic Advisers, if any, as well as information regarding potential fall-out benefits accruing to each Sub-Adviser, if any, as a result of its relationship with the fund, during its annual renewal of the fund's management contract, sub-advisory agreements, and sub-subadvisory agreements. The Board considered Strategic Advisers' representation that it does not anticipate that the approval of each Amended Sub-Advisory Agreement will have a significant impact on the profitability of, or potential fall-out benefits to, Strategic Advisers or its affiliates. Possible Economies of Scale. The Board considered that it reviews whether there have been economies of scale in connection with the management of the fund during its annual renewal of the fund's management contract, sub-advisory agreements, and sub-subadvisory agreements. The Board noted that each Amended Sub-Advisory Agreement will continue to provide for breakpoints that have the potential to reduce sub-advisory fees paid to the Sub-Adviser as assets allocated to the Sub-Adviser grow. The Board also noted that it did not consider the possible realization of economies of scale to be a significant factor in its decision to approve each Amended Sub-Advisory Agreement because the fund will not bear any additional management fees or expenses under each Amended Sub-Advisory Agreement. Conclusion. Based on its evaluation of all of the conclusions noted above, and after considering all factors it believed relevant, the Board concluded that each Amended Sub-Advisory Agreement's fee structure bears a reasonable relationship to the services to be rendered and that each Amended Sub-Advisory Agreement is in the best interests of the fund and its shareholders and should be approved. The Board also concluded that the sub-advisory fees to be charged under each Amended Sub-Advisory Agreement will be based on services provided that will be in addition to, rather than duplicative of, services provided under the advisory contract of any underlying fund in which the fund may invest. In addition, the Board concluded that the approval of each Amended Sub-Advisory Agreement does not involve a conflict of interest from which Strategic Advisers or its affiliates derive an inappropriate advantage.Board Approval of New Sub-Advisory Agreement
Strategic Advisers International Fund
In June 2021, the Board of Trustees, including the Independent Trustees (together, the Board) voted to approve a new sub-advisory agreement among Strategic Advisers LLC (Strategic Advisers), Thompson, Siegel & Walmsley LLC (TSW or Sub-Adviser), and Fidelity Rutland Square Trust II (Trust) on behalf of the fund (New Sub-Advisory Agreement) through September 30, 2021, with the understanding that the Board will consider the renewal of the New Sub-Advisory Agreement in September 2021. The Board noted that TSW is an existing sub-adviser to the fund and that the New Sub-Advisory Agreement will take effect upon consummation of a transaction pursuant to which Pendal Group Limited will acquire 100% of the equity interests in TSW (Transaction). The Board, assisted by the advice of fund counsel and Independent Trustees' counsel, considered a broad range of information.In considering whether to approve the New Sub-Advisory Agreement, the Board reached a determination, with the assistance of fund counsel and Independent Trustees' counsel and through the exercise of its business judgment, that the approval of the New Sub-Advisory Agreement is in the best interests of the fund and its shareholders and that the approval of such agreement does not involve a conflict of interest from which Strategic Advisers or its affiliates derive an inappropriate advantage. Also, the Board found that the sub-advisory fees to be charged under the New Sub-Advisory Agreement bear a reasonable relationship to the services to be rendered and will be based upon services provided that will be in addition to, rather than duplicative of services provided under the advisory contract of any underlying fund in which the fund may invest.The Board noted that it had approved an existing sub-advisory agreement with the Sub-Adviser at its September 2020 meeting. The Board further noted that the Transaction is not expected to result in any changes to: (i) the nature, extent and quality of the sub-advisory services provided; (ii) the investment process or strategies employed in the management of the fund's assets; or (iii) the day-to-day management of the fund or the persons primarily responsible for such management. The Board also considered the detailed information provided by Strategic Advisers and the Sub-Adviser in the June 2021 annual contract renewal materials.In connection with its consideration of future renewals of the New Sub-Advisory Agreement, the Board will consider: (i) the nature, extent and quality of services provided to the fund, including investment performance; (ii) the competitiveness of the management fee and total expenses for the fund; (iii) the costs of the services and profitability, including the revenues earned and the expenses incurred in conducting the business of developing, marketing, distributing, managing, administering, and servicing the fund and its shareholders; and (iv) whether there have been economies of scale in respect of the Fidelity funds, whether the Strategic Advisers funds (including the fund) have appropriately benefited from any such economies of scale, and whether there is the potential for realization of any further economies.The Board concluded that the New Sub-Advisory Agreement is in the best interests of the fund and its shareholders and should be approved through September 31, 2021, with the understanding that the Board will consider the renewal of the New Sub-Advisory Agreement in September 2021. The Board also concluded that the sub-advisory fees to be charged under the New Sub-Advisory Agreement will be based on services provided that will be in addition to, rather than duplicative of, services provided under the advisory contract of any underlying fund in which the fund may invest. In addition, the Board concluded that the approval of the New Sub-Advisory Agreement does not involve a conflict of interest from which Strategic Advisers or its affiliates derive an inappropriate advantage.
![]()
SIT-SANN-1021
1.912867.111
Strategic Advisers® Fidelity® International Fund
Offered exclusively to certain managed account clients of Strategic Advisers LLC or its affiliates - not available for sale to the general public
Semi-Annual Report
August 31, 2021
Contents
To view a fund's proxy voting record for the 12-month period ended June 30, visit http://www.fidelity.com/proxyvotingresults or visit the Securities and Exchange Commission's (SEC) web site at http://www.sec.gov.
You may also call 1-800-544-3455 to request a free copy of the proxy voting guidelines.
Standard & Poor's, S&P and S&P 500 are registered service marks of The McGraw-Hill Companies, Inc. and have been licensed for use by Fidelity Distributors Corporation.
Other third-party marks appearing herein are the property of their respective owners.
All other marks appearing herein are registered or unregistered trademarks or service marks of FMR LLC or an affiliated company. © 2021 FMR LLC. All rights reserved.
This report and the financial statements contained herein are submitted for the general information of the shareholders of the Fund. This report is not authorized for distribution to prospective investors in the Fund unless preceded or accompanied by an effective prospectus.
A fund files its complete schedule of portfolio holdings with the SEC for the first and third quarters of each fiscal year on Form N-PORT. Forms N-PORT are available on the SEC’s web site at http://www.sec.gov. A fund's Forms N-PORT may be reviewed and copied at the SEC’s Public Reference Room in Washington, DC. Information regarding the operation of the SEC's Public Reference Room may be obtained by calling 1-800-SEC-0330.
For a complete list of a fund's portfolio holdings, view the most recent holdings listing, semiannual report, or annual report on Fidelity's web site at http://www.fidelity.com, http://www.institutional.fidelity.com, or http://www.401k.com, as applicable.
NOT FDIC INSURED •MAY LOSE VALUE •NO BANK GUARANTEE
Neither the Fund nor Fidelity Distributors Corporation is a bank.
Note to Shareholders:
Early in 2020, the outbreak and spread of COVID-19 emerged as a public health emergency that had a major influence on financial markets, primarily based on its impact on the global economy and corporate earnings. On March 11, 2020, the World Health Organization declared the COVID-19 outbreak a pandemic, citing sustained risk of further global spread. The pandemic prompted a number of measures to limit the spread of COVID-19, including travel and border restrictions, quarantines, and restrictions on large gatherings. In turn, these resulted in lower consumer activity, diminished demand for a wide range of products and services, disruption in manufacturing and supply chains, and – given the wide variability in outcomes regarding the outbreak – significant market uncertainty and volatility. To help stem the turmoil, the U.S. government took unprecedented action – in concert with the U.S. Federal Reserve and central banks around the world – to help support consumers, businesses, and the broader economy, and to limit disruption to the financial system.
In general, the overall impact of the pandemic lessened in 2021, amid a resilient economy and widespread distribution of three COVID-19 vaccines granted emergency use authorization from the U.S. Food and Drug Administration (FDA) early in the year. Still, the situation remains dynamic, and the extent and duration of its influence on financial markets and the economy is highly uncertain, due in part to a recent spike in cases based on highly contagious variants of the coronavirus.
Extreme events such as the COVID-19 crisis are exogenous shocks that can have significant adverse effects on mutual funds and their investments. Although multiple asset classes may be affected by market disruption, the duration and impact may not be the same for all types of assets. Fidelity is committed to helping you stay informed amid news about COVID-19 and during increased market volatility, and we continue to take extra steps to be responsive to customer needs. We encourage you to visit us online, where we offer ongoing updates, commentary, and analysis on the markets and our funds.
Investment Summary (Unaudited)
The information in the following tables is based on the direct investments of the Fund.Top Ten Holdings as of August 31, 2021
| (excluding cash equivalents) | % of fund's net assets |
| Fidelity SAI International Value Index Fund | 18.1 |
| Fidelity Overseas Fund | 11.4 |
| Fidelity Advisor International Discovery Fund - Class Z | 10.9 |
| Fidelity Diversified International Fund | 9.6 |
| Fidelity International Capital Appreciation Fund | 8.1 |
| Fidelity SAI International Low Volatility Index Fund | 5.7 |
| Fidelity SAI International Index Fund | 4.8 |
| Fidelity SAI International Small Cap Index Fund | 2.1 |
| Fidelity Advisor Japan Fund - Class Z | 2.0 |
| Fidelity SAI Japan Stock Index Fund | 1.0 |
| 73.7 |
Asset Allocation (% of fund's net assets)
| As of August 31, 2021 | ||
| Common Stocks | 15.3% | |
| Foreign Large Blend Funds | 11.4% | |
| Foreign Large Growth Funds | 41.4% | |
| Foreign Large Value Funds | 19.1% | |
| Foreign Small Mid Growth Funds | 0.5% | |
| Foreign Small Mid Blend Funds | 2.1% | |
| Other | 3.2% | |
| Sector Funds | 0.5% | |
| Short-Term Investments and Net Other Assets (Liabilities) | 6.5% | |
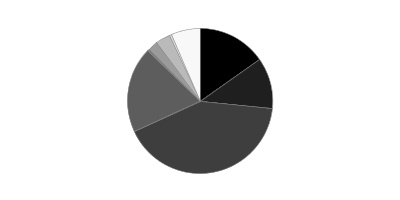
Asset allocations of funds in the pie chart reflect the categorizations of assets as defined by Morningstar as of the reporting date.
Schedule of Investments August 31, 2021 (Unaudited)
Showing Percentage of Net Assets
| Common Stocks - 15.3% | |||
| Shares | Value | ||
| COMMUNICATION SERVICES - 0.8% | |||
| Diversified Telecommunication Services - 0.4% | |||
| Cellnex Telecom SA (a) | 629,231 | $43,091,941 | |
| Deutsche Telekom AG | 1,434,318 | 30,498,268 | |
| Elisa Corp. (A Shares) | 224,597 | 14,384,063 | |
| 87,974,272 | |||
| Entertainment - 0.1% | |||
| Sea Ltd. ADR (b) | 60,150 | 20,349,948 | |
| Interactive Media & Services - 0.1% | |||
| Z Holdings Corp. | 3,589,800 | 23,395,779 | |
| Media - 0.1% | |||
| Informa PLC (b) | 873,645 | 6,378,005 | |
| Schibsted ASA (A Shares) | 255,901 | 13,657,080 | |
| WPP PLC | 650,971 | 8,826,422 | |
| 28,861,507 | |||
| Wireless Telecommunication Services - 0.1% | |||
| SoftBank Group Corp. | 414,500 | 23,358,637 | |
| Vodafone Group PLC | 6,032,130 | 10,131,395 | |
| 33,490,032 | |||
| TOTAL COMMUNICATION SERVICES | 194,071,538 | ||
| CONSUMER DISCRETIONARY - 1.9% | |||
| Auto Components - 0.1% | |||
| DENSO Corp. | 345,300 | 24,199,091 | |
| Automobiles - 0.5% | |||
| Daimler AG (Germany) | 514,009 | 43,345,950 | |
| Ferrari NV | 51,462 | 11,162,302 | |
| Isuzu Motors Ltd. | 1,505,300 | 19,046,290 | |
| Toyota Motor Corp. | 635,500 | 55,347,821 | |
| 128,902,363 | |||
| Hotels, Restaurants & Leisure - 0.2% | |||
| Aristocrat Leisure Ltd. | 236,228 | 7,892,351 | |
| Compass Group PLC (b) | 587,739 | 12,142,661 | |
| Evolution AB (a) | 69,032 | 11,122,620 | |
| Sands China Ltd. (b) | 4,324,200 | 13,891,921 | |
| 45,049,553 | |||
| Household Durables - 0.2% | |||
| Sony Group Corp. | 417,700 | 43,188,251 | |
| Vistry Group PLC | 669,248 | 11,133,399 | |
| 54,321,650 | |||
| Internet & Direct Marketing Retail - 0.3% | |||
| Deliveroo PLC Class A (a)(b)(c) | 2,294,086 | 10,988,620 | |
| Delivery Hero AG (a)(b) | 97,785 | 14,155,352 | |
| Ocado Group PLC (b) | 319,685 | 8,847,516 | |
| Prosus NV | 164,440 | 14,555,493 | |
| THG PLC | 1,468,569 | 12,427,327 | |
| ZOZO, Inc. | 360,300 | 13,738,658 | |
| 74,712,966 | |||
| Multiline Retail - 0.1% | |||
| B&M European Value Retail SA | 1,378,812 | 10,596,738 | |
| Pan Pacific International Holdings Ltd. | 279,500 | 5,327,560 | |
| 15,924,298 | |||
| Specialty Retail - 0.1% | |||
| JD Sports Fashion PLC | 467,697 | 6,491,219 | |
| Nitori Holdings Co. Ltd. | 43,900 | 8,213,924 | |
| WH Smith PLC (b) | 272,848 | 6,122,041 | |
| 20,827,184 | |||
| Textiles, Apparel & Luxury Goods - 0.4% | |||
| Hermes International SCA | 12,849 | 18,880,878 | |
| LVMH Moet Hennessy Louis Vuitton SE | 87,004 | 64,453,465 | |
| Moncler SpA | 173,858 | 11,126,330 | |
| 94,460,673 | |||
| TOTAL CONSUMER DISCRETIONARY | 458,397,778 | ||
| CONSUMER STAPLES - 1.4% | |||
| Beverages - 0.4% | |||
| Anheuser-Busch InBev SA NV | 150,955 | 9,258,409 | |
| Asahi Group Holdings | 386,800 | 17,980,232 | |
| Diageo PLC | 735,595 | 35,362,021 | |
| Heineken NV (Bearer) | 130,444 | 14,277,817 | |
| Pernod Ricard SA | 112,988 | 23,740,413 | |
| 100,618,892 | |||
| Food & Staples Retailing - 0.3% | |||
| Seven & i Holdings Co. Ltd. | 487,500 | 21,336,295 | |
| Tesco PLC | 4,218,928 | 14,811,063 | |
| Tsuruha Holdings, Inc. | 162,700 | 20,482,616 | |
| Zur Rose Group AG (b) | 35,565 | 15,301,785 | |
| 71,931,759 | |||
| Food Products - 0.4% | |||
| Nestle SA (Reg. S) | 673,872 | 85,102,522 | |
| Household Products - 0.0% | |||
| Reckitt Benckiser Group PLC | 146,063 | 11,150,628 | |
| Personal Products - 0.2% | |||
| Kao Corp. | 250,000 | 15,102,486 | |
| L'Oreal SA | 35,974 | 16,833,358 | |
| Shiseido Co. Ltd. | 221,200 | 14,663,560 | |
| 46,599,404 | |||
| Tobacco - 0.1% | |||
| Swedish Match Co. AB | 2,962,005 | 27,349,664 | |
| TOTAL CONSUMER STAPLES | 342,752,869 | ||
| ENERGY - 0.5% | |||
| Oil, Gas & Consumable Fuels - 0.5% | |||
| Idemitsu Kosan Co. Ltd. | 748,600 | 17,950,341 | |
| Neste Oyj | 233,892 | 14,233,698 | |
| Royal Dutch Shell PLC: | |||
| Class A (United Kingdom) | 2,350,337 | 46,582,387 | |
| rights (b)(d) | 2,350,337 | 561,530 | |
| Total SA | 853,799 | 37,765,774 | |
| 117,093,730 | |||
| FINANCIALS - 2.8% | |||
| Banks - 1.4% | |||
| Bankinter SA | 2,380,592 | 13,950,417 | |
| BNP Paribas SA | 438,721 | 27,792,922 | |
| Commonwealth Bank of Australia | 264,488 | 19,371,838 | |
| Erste Group Bank AG | 272,247 | 10,884,488 | |
| FinecoBank SpA | 850,174 | 15,675,008 | |
| Hang Seng Bank Ltd. | 1,321,100 | 23,644,912 | |
| Intesa Sanpaolo SpA | 2,076,848 | 5,877,182 | |
| KBC Groep NV | 398,408 | 33,559,780 | |
| Lloyds Banking Group PLC | 28,120,540 | 16,834,513 | |
| Mitsubishi UFJ Financial Group, Inc. | 4,959,400 | 26,906,943 | |
| National Australia Bank Ltd. | 1,951,222 | 39,338,899 | |
| NatWest Group PLC | 3,538,946 | 10,368,423 | |
| Societe Generale Series A | 709,751 | 22,338,787 | |
| Standard Chartered PLC (United Kingdom) | 3,347,442 | 20,930,945 | |
| Swedbank AB (A Shares) | 894,508 | 17,271,428 | |
| United Overseas Bank Ltd. | 1,434,003 | 27,283,868 | |
| 332,030,353 | |||
| Capital Markets - 0.3% | |||
| Bridgepoint Group Holdings Ltd. | 761,358 | 5,296,570 | |
| EQT AB | 208,174 | 10,607,177 | |
| Hong Kong Exchanges and Clearing Ltd. | 256,000 | 16,155,012 | |
| Macquarie Group Ltd. | 110,704 | 13,503,524 | |
| Nordnet AB | 475,557 | 8,627,253 | |
| UBS Group AG | 783,015 | 13,065,213 | |
| 67,254,749 | |||
| Diversified Financial Services - 0.2% | |||
| Investor AB (B Shares) | 772,154 | 18,468,452 | |
| ORIX Corp. | 1,890,300 | 35,249,288 | |
| 53,717,740 | |||
| Insurance - 0.9% | |||
| AIA Group Ltd. | 4,108,200 | 49,054,895 | |
| AXA SA | 700,391 | 19,676,439 | |
| Hiscox Ltd. (b) | 707,964 | 8,943,088 | |
| Legal & General Group PLC | 5,720,475 | 21,250,676 | |
| NN Group NV | 310,215 | 16,105,611 | |
| NN Group NV rights (b)(d) | 310,215 | 340,646 | |
| Prudential PLC (b) | 1,076,727 | 22,433,205 | |
| Talanx AG | 373,186 | 16,955,803 | |
| Tokio Marine Holdings, Inc. | 495,800 | 24,232,301 | |
| Zurich Insurance Group Ltd. | 71,634 | 31,432,391 | |
| 210,425,055 | |||
| TOTAL FINANCIALS | 663,427,897 | ||
| HEALTH CARE - 1.9% | |||
| Biotechnology - 0.1% | |||
| Argenx SE (b) | 37,723 | 12,586,014 | |
| Health Care Equipment & Supplies - 0.4% | |||
| GN Store Nord A/S | 111,359 | 8,379,065 | |
| Hoya Corp. | 244,700 | 39,547,025 | |
| Koninklijke Philips Electronics NV | 122,349 | 5,638,226 | |
| Olympus Corp. | 876,400 | 18,413,840 | |
| Siemens Healthineers AG (a) | 397,942 | 27,675,344 | |
| 99,653,500 | |||
| Life Sciences Tools & Services - 0.3% | |||
| Eurofins Scientific SA | 137,450 | 19,488,274 | |
| Lonza Group AG | 30,783 | 26,051,679 | |
| PolyPeptide Group AG (a)(b) | 83,075 | 12,047,349 | |
| Sartorius Stedim Biotech | 36,657 | 22,230,022 | |
| 79,817,324 | |||
| Pharmaceuticals - 1.1% | |||
| Astellas Pharma, Inc. | 368,300 | 6,216,726 | |
| AstraZeneca PLC (United Kingdom) | 505,235 | 59,083,922 | |
| Daiichi Sankyo Kabushiki Kaisha | 552,400 | 13,127,753 | |
| Roche Holding AG (participation certificate) | 255,109 | 102,440,338 | |
| Sanofi SA | 514,439 | 53,315,745 | |
| UCB SA | 338,710 | 38,745,396 | |
| 272,929,880 | |||
| TOTAL HEALTH CARE | 464,986,718 | ||
| INDUSTRIALS - 2.6% | |||
| Aerospace & Defense - 0.2% | |||
| Airbus Group NV (b) | 215,098 | 29,424,575 | |
| BAE Systems PLC | 2,539,021 | 19,836,407 | |
| 49,260,982 | |||
| Air Freight & Logistics - 0.3% | |||
| Deutsche Post AG | 622,246 | 43,774,437 | |
| DSV Panalpina A/S | 60,150 | 15,328,308 | |
| Yamato Holdings Co. Ltd. | 368,300 | 9,373,631 | |
| 68,476,376 | |||
| Building Products - 0.2% | |||
| ASSA ABLOY AB (B Shares) | 408,623 | 13,076,229 | |
| Compagnie de St. Gobain | 224,099 | 16,245,597 | |
| Kingspan Group PLC (Ireland) | 109,439 | 12,505,921 | |
| Nibe Industrier AB (B Shares) | 1,038,336 | 14,475,062 | |
| 56,302,809 | |||
| Commercial Services & Supplies - 0.1% | |||
| Park24 Co. Ltd. (b) | 458,700 | 8,851,703 | |
| Rentokil Initial PLC | 1,202,206 | 9,593,158 | |
| 18,444,861 | |||
| Construction & Engineering - 0.2% | |||
| Ferrovial SA | 577,827 | 16,729,242 | |
| VINCI SA | 181,517 | 19,480,108 | |
| 36,209,350 | |||
| Electrical Equipment - 0.1% | |||
| Mitsubishi Electric Corp. | 621,000 | 8,498,073 | |
| Vestas Wind Systems A/S | 184,923 | 7,466,565 | |
| 15,964,638 | |||
| Industrial Conglomerates - 0.3% | |||
| Hitachi Ltd. | 782,700 | 43,291,638 | |
| Siemens AG | 225,160 | 37,352,879 | |
| 80,644,517 | |||
| Machinery - 0.5% | |||
| Alfa Laval AB | 168,354 | 6,828,234 | |
| FANUC Corp. | 75,500 | 16,448,510 | |
| Indutrade AB | 409,561 | 13,526,341 | |
| Minebea Mitsumi, Inc. | 433,000 | 11,150,198 | |
| Misumi Group, Inc. | 654,100 | 25,952,338 | |
| Sandvik AB | 381,288 | 9,730,128 | |
| SMC Corp. | 19,000 | 12,177,339 | |
| Techtronic Industries Co. Ltd. | 648,500 | 14,383,410 | |
| 110,196,498 | |||
| Professional Services - 0.3% | |||
| Experian PLC | 475,437 | 20,971,592 | |
| Persol Holdings Co. Ltd. | 556,200 | 13,003,194 | |
| Recruit Holdings Co. Ltd. | 549,600 | 32,361,658 | |
| Teleperformance | 35,410 | 15,653,798 | |
| 81,990,242 | |||
| Trading Companies & Distributors - 0.3% | |||
| Ashtead Group PLC | 105,073 | 8,219,752 | |
| Brenntag AG | 177,045 | 17,860,880 | |
| Ferguson PLC | 110,348 | 15,937,340 | |
| Itochu Corp. | 586,100 | 17,639,205 | |
| Rexel SA | 660,157 | 13,808,495 | |
| 73,465,672 | |||
| Transportation Infrastructure - 0.1% | |||
| Aena SME SA (a)(b) | 126,691 | 20,224,622 | |
| Auckland International Airport Ltd. (b) | 2,362,890 | 12,004,725 | |
| 32,229,347 | |||
| TOTAL INDUSTRIALS | 623,185,292 | ||
| INFORMATION TECHNOLOGY - 1.4% | |||
| Communications Equipment - 0.0% | |||
| Ericsson (B Shares) | 685,050 | 8,114,492 | |
| Electronic Equipment & Components - 0.1% | |||
| Keyence Corp. | 33,700 | 20,257,065 | |
| IT Services - 0.5% | |||
| Adyen BV (a)(b) | 8,048 | 25,985,068 | |
| Amadeus IT Holding SA Class A (b) | 120,410 | 7,353,245 | |
| Capgemini SA | 78,577 | 17,642,078 | |
| Edenred SA | 112,304 | 6,364,942 | |
| Fujitsu Ltd. | 127,700 | 23,563,241 | |
| TIS, Inc. | 635,900 | 17,976,176 | |
| Worldline SA (a)(b) | 182,152 | 16,188,769 | |
| 115,073,519 | |||
| Semiconductors & Semiconductor Equipment - 0.6% | |||
| ASM Pacific Technology Ltd. | 715,000 | 8,512,944 | |
| ASML Holding NV (Netherlands) | 85,933 | 71,667,070 | |
| Infineon Technologies AG | 281,277 | 11,976,141 | |
| Lasertec Corp. | 25,400 | 5,557,224 | |
| Renesas Electronics Corp. (b) | 1,163,900 | 12,462,927 | |
| Tokyo Electron Ltd. | 48,500 | 20,825,706 | |
| 131,002,012 | |||
| Software - 0.1% | |||
| NICE Systems Ltd. (b) | 62,030 | 18,095,790 | |
| Temenos Group AG | 37,656 | 5,978,905 | |
| 24,074,695 | |||
| Technology Hardware, Storage & Peripherals - 0.1% | |||
| FUJIFILM Holdings Corp. | 339,800 | 28,008,057 | |
| TOTAL INFORMATION TECHNOLOGY | 326,529,840 | ||
| MATERIALS - 1.2% | |||
| Chemicals - 0.3% | |||
| Akzo Nobel NV | 71,441 | 8,806,554 | |
| Corbion NV | 172,685 | 9,281,428 | |
| NOF Corp. | 96,000 | 5,314,184 | |
| Shin-Etsu Chemical Co. Ltd. | 145,500 | 24,031,921 | |
| Sika AG | 70,783 | 25,515,117 | |
| 72,949,204 | |||
| Construction Materials - 0.2% | |||
| CRH PLC | 467,835 | 24,783,989 | |
| HeidelbergCement AG | 144,482 | 12,555,948 | |
| 37,339,937 | |||
| Metals & Mining - 0.6% | |||
| Anglo American PLC (United Kingdom) | 713,021 | 30,114,805 | |
| ArcelorMittal SA (Netherlands) | 475,622 | 15,946,367 | |
| Fortescue Metals Group Ltd. | 1,408,452 | 21,637,414 | |
| Iluka Resources Ltd. | 3,708,264 | 27,127,805 | |
| Lynas Rare Earths Ltd. (b) | 5,329,133 | 26,821,868 | |
| Rio Tinto PLC | 392,793 | 29,060,500 | |
| 150,708,759 | |||
| Paper & Forest Products - 0.1% | |||
| Mondi PLC | 482,187 | 13,291,843 | |
| UPM-Kymmene Corp. | 503,037 | 20,450,075 | |
| 33,741,918 | |||
| TOTAL MATERIALS | 294,739,818 | ||
| REAL ESTATE - 0.4% | |||
| Equity Real Estate Investment Trusts (REITs) - 0.2% | |||
| Big Yellow Group PLC | 534,678 | 11,210,306 | |
| Goodman Group unit | 601,342 | 10,175,159 | |
| National Storage REIT unit | 5,328,649 | 9,121,725 | |
| 30,507,190 | |||
| Real Estate Management & Development - 0.2% | |||
| Grainger Trust PLC | 2,030,516 | 8,916,546 | |
| Kerry Properties Ltd. | 2,160,500 | 7,361,442 | |
| LEG Immobilien AG | 84,995 | 13,548,309 | |
| Sino Land Ltd. | 11,466,861 | 16,896,313 | |
| Vonovia SE | 114,913 | 7,755,670 | |
| 54,478,280 | |||
| TOTAL REAL ESTATE | 84,985,470 | ||
| UTILITIES - 0.4% | |||
| Electric Utilities - 0.4% | |||
| Enel SpA | 3,044,571 | 27,737,381 | |
| Energias de Portugal SA | 3,264,607 | 17,931,993 | |
| Iberdrola SA | 2,575,618 | 31,915,704 | |
| ORSTED A/S (a) | 82,609 | 13,129,403 | |
| 90,714,481 | |||
| Multi-Utilities - 0.0% | |||
| RWE AG | 398,021 | 15,551,085 | |
| TOTAL UTILITIES | 106,265,566 | ||
| TOTAL COMMON STOCKS | |||
| (Cost $3,202,843,581) | 3,676,436,516 | ||
| Nonconvertible Preferred Stocks - 0.0% | |||
| CONSUMER DISCRETIONARY - 0.0% | |||
| Automobiles - 0.0% | |||
| Volkswagen AG | |||
| (Cost $2,579,722) | 17,349 | 4,123,597 | |
| Equity Funds - 78.2% | |||
| Foreign Large Blend Funds - 11.4% | |||
| Fidelity Pacific Basin Fund (e) | 4,884,671 | 222,154,829 | |
| Fidelity SAI International Index Fund (e) | 78,194,542 | 1,140,076,428 | |
| Fidelity SAI International Low Volatility Index Fund (e) | 114,694,737 | 1,368,308,216 | |
| TOTAL FOREIGN LARGE BLEND FUNDS | 2,730,539,473 | ||
| Foreign Large Growth Funds - 41.4% | |||
| Fidelity Advisor International Discovery Fund - Class Z (e) | 43,697,004 | 2,620,946,300 | |
| Fidelity Diversified International Fund (e) | 42,701,009 | 2,296,887,297 | |
| Fidelity International Capital Appreciation Fund (e) | 62,559,979 | 1,935,605,756 | |
| Fidelity Overseas Fund (e) | 38,936,171 | 2,732,929,811 | |
| Fidelity SAI International Momentum Index Fund (e) | 15,720,751 | 228,108,095 | |
| Fidelity SAI International Quality Index Fund (e) | 7,712,532 | 114,222,593 | |
| TOTAL FOREIGN LARGE GROWTH FUNDS | 9,928,699,852 | ||
| Foreign Large Value Funds - 19.1% | |||
| Fidelity Advisor International Value Fund - Class Z (e) | 25,377,058 | 241,843,362 | |
| Fidelity SAI International Value Index Fund (e) | 428,393,472 | 4,343,909,807 | |
| TOTAL FOREIGN LARGE VALUE FUNDS | 4,585,753,169 | ||
| Foreign Small Mid Blend Funds - 2.1% | |||
| Fidelity SAI International Small Cap Index Fund (e) | 47,904,853 | 494,857,129 | |
| Foreign Small Mid Growth Funds - 0.5% | |||
| Fidelity Advisor International Small Cap Opportunities Fund - Class Z (e) | 4,149,171 | 120,450,434 | |
| Sector Funds - 0.5% | |||
| Fidelity Advisor International Real Estate Fund - Class Z (e) | 7,949,002 | 121,381,261 | |
| Other - 3.2% | |||
| Fidelity Advisor Japan Fund - Class Z (e) | 23,108,707 | 480,198,931 | |
| Fidelity Japan Smaller Companies Fund (e) | 2,649,961 | 47,990,789 | |
| Fidelity SAI Japan Stock Index Fund (e) | 24,010,471 | 245,146,911 | |
| TOTAL OTHER | 773,336,631 | ||
| TOTAL EQUITY FUNDS | |||
| (Cost $14,657,525,902) | 18,755,017,949 | ||
| Other - 0.0% | |||
| Commodity Funds - Broad Basket - 0.0% | |||
| Fidelity SAI Inflation-Focused Fund (e) | |||
| (Cost $6,768,588) | 858,825 | 11,310,724 | |
| Principal Amount | |||
| U.S. Treasury Obligations - 0.3% | |||
| U.S. Treasury Bills, yield at date of purchase 0.01% to 0.06% 9/9/21 to 12/2/21 (f) | |||
| (Cost $73,076,328) | $73,080,000 | 73,076,384 | |
| Shares | |||
| Money Market Funds - 6.1% | |||
| Fidelity Securities Lending Cash Central Fund 0.06% (g)(h) | 10,430,707 | 10,431,750 | |
| State Street Institutional U.S. Government Money Market Fund Premier Class 0.03% (i) | 1,447,596,608 | 1,447,596,608 | |
| TOTAL MONEY MARKET FUNDS | |||
| (Cost $1,458,028,358) | 1,458,028,358 | ||
| TOTAL INVESTMENT IN SECURITIES - 99.9% | |||
| (Cost $19,400,822,479) | 23,977,993,528 | ||
| NET OTHER ASSETS (LIABILITIES) - 0.1% | 19,442,624 | ||
| NET ASSETS - 100% | $23,997,436,152 |
| Futures Contracts | |||||
| Number of contracts | Expiration Date | Notional Amount | Value | Unrealized Appreciation/(Depreciation) | |
| Purchased | |||||
| Equity Index Contracts | |||||
| CME Nikkei 225 Index Contracts (United States) | 250 | Sept. 2021 | $35,087,500 | $(1,351,015) | $(1,351,015) |
| ICE E-mini MSCI EAFE Index Contracts (United States) | 11,806 | Sept. 2021 | 1,388,090,450 | (3,270,616) | (3,270,616) |
| TOTAL FUTURES CONTRACTS | $(4,621,631) |
The notional amount of futures purchased as a percentage of Net Assets is 5.9%
For the period, the average monthly notional amount at value for futures contracts in the aggregate was $1,286,678,389.
Legend
(a) Security exempt from registration under Rule 144A of the Securities Act of 1933. These securities may be resold in transactions exempt from registration, normally to qualified institutional buyers. At the end of the period, the value of these securities amounted to $194,609,088 or 0.8% of net assets.
(b) Non-income producing
(c) Security or a portion of the security is on loan at period end.
(d) Security or a portion of the security purchased on a delayed delivery or when-issued basis.
(e) Affiliated Fund
(f) Security or a portion of the security was pledged to cover margin requirements for futures contracts. At period end, the value of securities pledged amounted to $73,076,384.
(g) Affiliated fund that is generally available only to investment companies and other accounts managed by Fidelity Investments. The rate quoted is the annualized seven-day yield of the fund at period end. A complete unaudited listing of the fund's holdings as of its most recent quarter end is available upon request. In addition, each Fidelity Central Fund's financial statements are available on the SEC's website or upon request.
(h) Investment made with cash collateral received from securities on loan.
(i) The rate quoted is the annualized seven-day yield of the fund at period end.
Affiliated Central Funds
Fiscal year to date information regarding the Fund's investments in Fidelity Central Funds, including the ownership percentage, is presented below.
| Fund | Value, beginning of period | Purchases | Sales Proceeds | Dividend Income | Realized Gain/Loss | Change in Unrealized appreciation (depreciation) | Value, end of period | % ownership, end of period |
| Fidelity Securities Lending Cash Central Fund 0.06% | $896,800 | $359,066,292 | $349,531,342 | $218,232 | $-- | $-- | $10,431,750 | 0.0% |
| Total | $896,800 | $359,066,292 | $349,531,342 | $218,232 | $-- | $-- | $10,431,750 |
Amounts in the income column in the above table include any capital gain distributions from underlying funds, which are presented in the corresponding line-item in the Statement of Operations, if applicable. Amount for Fidelity Securities Lending Cash Central Fund represents the income earned on investing cash collateral, less rebates paid to borrowers and any lending agent fees associated with the loan, plus any premium payments received for lending certain types of securities.
Affiliated Underlying Funds
Fiscal year to date information regarding the Fund's investments in affiliated Underlying Funds is presented below. Exchanges between classes of the same affiliated Underlying Funds may occur. If an underlying Fund changes its name, the name presented below is the name in effect at period end.
| Affiliate | Value, beginning of period | Purchases(a) | Sales Proceeds(a) | Dividend Income | Realized Gain (loss) | Change in Unrealized appreciation (depreciation) | Value, end of period |
| Fidelity Advisor International Discovery Fund Class Z | $-- | $-- | $-- | $-- | $-- | $719,026,117 | $2,620,946,300 |
| Fidelity Advisor International Real Estate Fund Class Z | -- | -- | -- | -- | -- | 36,615,746 | 121,381,261 |
| Fidelity Advisor International Real Estate Fund Class I | 106,764,209 | -- | -- | -- | -- | (21,998,694) | -- |
| Fidelity Advisor International Small Cap Opportunities Fund Class Z | -- | -- | -- | -- | -- | 60,867,314 | 120,450,434 |
| Fidelity Advisor International Value Fund Class Z | -- | -- | -- | -- | -- | 34,092,647 | 241,843,362 |
| Fidelity Advisor Japan Fund Class Z | -- | -- | -- | -- | -- | 145,256,756 | 480,198,931 |
| Fidelity Advisor Japan Fund Class I | 435,775,664 | 24,999,999 | -- | -- | -- | (125,833,488) | -- |
| Fidelity Advisor Overseas Fund Class I | 91,215,843 | -- | 98,196,962 | -- | 50,899,070 | (43,917,951) | -- |
| Fidelity Diversified International Fund | 1,828,735,209 | 208,000,000 | -- | -- | -- | 260,152,088 | 2,296,887,297 |
| Fidelity International Capital Appreciation Fund | 1,570,087,796 | 176,000,000 | -- | -- | -- | 189,517,960 | 1,935,605,756 |
| Fidelity International Discovery Fund | 2,016,080,656 | 366,000,000 | -- | -- | -- | (480,160,473) | -- |
| Fidelity International Small Cap Opportunities Fund | 98,652,775 | -- | -- | -- | -- | (39,069,655) | -- |
| Fidelity International Value Fund | 222,303,028 | -- | -- | -- | -- | (14,552,313) | -- |
| Fidelity Japan Smaller Companies Fund | 45,605,825 | -- | -- | -- | -- | 2,384,964 | 47,990,789 |
| Fidelity Overseas Fund | 1,834,480,517 | 519,196,963 | -- | -- | -- | 379,252,331 | 2,732,929,811 |
| Fidelity Pacific Basin Fund | 220,347,501 | -- | -- | -- | -- | 1,807,328 | 222,154,829 |
| Fidelity SAI Inflation-Focused Fund | 9,687,545 | -- | -- | -- | -- | 1,623,179 | 11,310,724 |
| Fidelity SAI International Index Fund | 256,720,329 | 846,000,000 | -- | -- | -- | 37,356,099 | 1,140,076,428 |
| Fidelity SAI International Low Volatility Index Fund | 1,065,869,771 | 168,000,000 | -- | -- | -- | 134,438,445 | 1,368,308,216 |
| Fidelity SAI International Momentum Index Fund | -- | 222,000,000 | -- | -- | -- | 6,108,095 | 228,108,095 |
| Fidelity SAI International Quality Index Fund | -- | 111,000,000 | -- | -- | -- | 3,222,593 | 114,222,593 |
| Fidelity SAI International Small Cap Index Fund | -- | 486,975,847 | -- | -- | -- | 7,881,282 | 494,857,129 |
| Fidelity SAI International Value Index Fund | 3,180,979,210 | 901,000,002 | -- | -- | -- | 261,930,595 | 4,343,909,807 |
| Fidelity SAI Japan Stock Index Fund | -- | 244,490,738 | -- | -- | -- | 656,173 | 245,146,911 |
| $12,983,305,878 | $4,273,663,549 | $98,196,962 | $-- | $50,899,070 | $1,556,657,138 | $18,766,328,673 |
(a) Includes the value of shares purchased or redeemed through in-kind transactions, if applicable.
Investment Valuation
The following is a summary of the inputs used, as of August 31, 2021, involving the Fund's assets and liabilities carried at fair value. The inputs or methodology used for valuing securities may not be an indication of the risk associated with investing in those securities. For more information on valuation inputs, and their aggregation into the levels used below, please refer to the Investment Valuation section in the accompanying Notes to Financial Statements.
| Valuation Inputs at Reporting Date: | ||||
| Description | Total | Level 1 | Level 2 | Level 3 |
| Investments in Securities: | ||||
| Equities: | ||||
| Communication Services | $194,071,538 | $121,256,816 | $72,814,722 | $-- |
| Consumer Discretionary | 462,521,375 | 250,727,839 | 211,793,536 | -- |
| Consumer Staples | 342,752,869 | 187,068,226 | 155,684,643 | -- |
| Energy | 117,093,730 | 32,184,039 | 84,909,691 | -- |
| Financials | 663,427,897 | 401,401,075 | 262,026,822 | -- |
| Health Care | 464,986,718 | 231,922,473 | 233,064,245 | -- |
| Industrials | 623,185,292 | 427,737,717 | 195,447,575 | -- |
| Information Technology | 326,529,840 | 222,309,210 | 104,220,630 | -- |
| Materials | 294,739,818 | 186,748,603 | 107,991,215 | -- |
| Real Estate | 84,985,470 | 84,985,470 | -- | -- |
| Utilities | 106,265,566 | 46,612,481 | 59,653,085 | -- |
| Equity Funds | 18,755,017,949 | 18,755,017,949 | -- | -- |
| Other | 11,310,724 | 11,310,724 | -- | -- |
| Other Short-Term Investments | 73,076,384 | -- | 73,076,384 | -- |
| Money Market Funds | 1,458,028,358 | 1,458,028,358 | -- | -- |
| Total Investments in Securities: | $23,977,993,528 | $22,417,310,980 | $1,560,682,548 | $-- |
| Derivative Instruments: | ||||
| Liabilities | ||||
| Futures Contracts | $(4,621,631) | $(4,621,631) | $-- | $-- |
| Total Liabilities | $(4,621,631) | $(4,621,631) | $-- | $-- |
| Total Derivative Instruments: | $(4,621,631) | $(4,621,631) | $-- | $-- |
Value of Derivative Instruments
The following table is a summary of the Fund's value of derivative instruments by primary risk exposure as of August 31, 2021. For additional information on derivative instruments, please refer to the Derivative Instruments section in the accompanying Notes to Financial Statements.
| Primary Risk Exposure / Derivative Type | Value | |
| Asset | Liability | |
| Equity Risk | ||
| Futures Contracts(a) | $0 | $(4,621,631) |
| Total Equity Risk | 0 | (4,621,631) |
| Total Value of Derivatives | $0 | $(4,621,631) |
(a) Reflects gross cumulative appreciation (depreciation) on futures contracts as presented in the Schedule of Investments. In the Statement of Assets and Liabilities, the period end daily variation margin is included in receivable or payable for daily variation margin on futures contracts, and the net cumulative appreciation (depreciation) is included in Total accumulated earnings (loss).
See accompanying notes which are an integral part of the financial statements.
Financial Statements
Statement of Assets and Liabilities
| August 31, 2021 (Unaudited) | ||
| Assets | ||
| Investment in securities, at value (including securities loaned of $9,527,379) — See accompanying schedule: Unaffiliated issuers (cost $4,726,096,239) | $5,201,233,105 | |
| Fidelity Central Funds (cost $10,431,750) | 10,431,750 | |
| Other affiliated issuers (cost $14,664,294,490) | 18,766,328,673 | |
| Total Investment in Securities (cost $19,400,822,479) | $23,977,993,528 | |
| Foreign currency held at value (cost $1,552,375) | 1,553,463 | |
| Receivable for investments sold | 1,718,289 | |
| Receivable for fund shares sold | 33,356,024 | |
| Dividends receivable | 11,410,614 | |
| Interest receivable | 24,277 | |
| Distributions receivable from Fidelity Central Funds | 10,119 | |
| Prepaid expenses | 29,720 | |
| Other receivables | 173,505 | |
| Total assets | 24,026,269,539 | |
| Liabilities | ||
| Payable to custodian bank | $964 | |
| Payable for investments purchased | ||
| Regular delivery | 7,893,402 | |
| Delayed delivery | 902,176 | |
| Payable for fund shares redeemed | 6,975,920 | |
| Accrued management fee | 740,110 | |
| Payable for daily variation margin on futures contracts | 809,802 | |
| Other payables and accrued expenses | 1,079,263 | |
| Collateral on securities loaned | 10,431,750 | |
| Total liabilities | 28,833,387 | |
| Net Assets | $23,997,436,152 | |
| Net Assets consist of: | ||
| Paid in capital | $19,099,626,534 | |
| Total accumulated earnings (loss) | 4,897,809,618 | |
| Net Assets | $23,997,436,152 | |
| Net Asset Value, offering price and redemption price per share ($23,997,436,152 ÷ 1,804,320,708 shares) | $13.30 |
See accompanying notes which are an integral part of the financial statements.
Statement of Operations
| Six months ended August 31, 2021 (Unaudited) | ||
| Investment Income | ||
| Dividends: | ||
| Unaffiliated issuers | $41,363,992 | |
| Interest | 202,613 | |
| Income from Fidelity Central Funds (including $218,232 from security lending) | 218,232 | |
| Income before foreign taxes withheld | 41,784,837 | |
| Less foreign taxes withheld | (3,539,817) | |
| Total income | 38,245,020 | |
| Expenses | ||
| Management fee | $27,917,572 | |
| Custodian fees and expenses | 101,590 | |
| Independent trustees' fees and expenses | 71,147 | |
| Registration fees | 1,126,042 | |
| Audit | 41,209 | |
| Legal | 19,565 | |
| Miscellaneous | 53,275 | |
| Total expenses before reductions | 29,330,400 | |
| Expense reductions | (25,036,109) | |
| Total expenses after reductions | 4,294,291 | |
| Net investment income (loss) | 33,950,729 | |
| Realized and Unrealized Gain (Loss) | ||
| Net realized gain (loss) on: | ||
| Investment securities: | ||
| Unaffiliated issuers | 146,458,839 | |
| Affiliated issuers | 50,899,070 | |
| Foreign currency transactions | 1,065,714 | |
| Futures contracts | 108,109,258 | |
| Total net realized gain (loss) | 306,532,881 | |
| Change in net unrealized appreciation (depreciation) on: | ||
| Investment securities: | ||
| Unaffiliated issuers | 152,236,172 | |
| Affiliated issuers | 1,556,657,138 | |
| Assets and liabilities in foreign currencies | (31,000) | |
| Futures contracts | 3,514,939 | |
| Total change in net unrealized appreciation (depreciation) | 1,712,377,249 | |
| Net gain (loss) | 2,018,910,130 | |
| Net increase (decrease) in net assets resulting from operations | $2,052,860,859 |
See accompanying notes which are an integral part of the financial statements.
Statement of Changes in Net Assets
| Six months ended August 31, 2021 (Unaudited) | Year ended February 28, 2021 | |
| Increase (Decrease) in Net Assets | ||
| Operations | ||
| Net investment income (loss) | $33,950,729 | $112,803,628 |
| Net realized gain (loss) | 306,532,881 | 318,571,285 |
| Change in net unrealized appreciation (depreciation) | 1,712,377,249 | 2,609,813,396 |
| Net increase (decrease) in net assets resulting from operations | 2,052,860,859 | 3,041,188,309 |
| Distributions to shareholders | (320,270,581) | (176,688,495) |
| Share transactions | ||
| Proceeds from sales of shares | 6,653,341,177 | 7,273,826,049 |
| Reinvestment of distributions | 314,612,839 | 170,192,601 |
| Cost of shares redeemed | (1,153,348,103) | (2,634,283,129) |
| Net increase (decrease) in net assets resulting from share transactions | 5,814,605,913 | 4,809,735,521 |
| Total increase (decrease) in net assets | 7,547,196,191 | 7,674,235,335 |
| Net Assets | ||
| Beginning of period | 16,450,239,961 | 8,776,004,626 |
| End of period | $23,997,436,152 | $16,450,239,961 |
| Other Information | ||
| Shares | ||
| Sold | 517,334,336 | 691,055,376 |
| Issued in reinvestment of distributions | 25,148,908 | 15,779,119 |
| Redeemed | (90,552,879) | (246,537,198) |
| Net increase (decrease) | 451,930,365 | 460,297,297 |
See accompanying notes which are an integral part of the financial statements.
Financial Highlights
Strategic Advisers Fidelity International Fund
| Six months ended (Unaudited) August 31, | Years endedFebruary 28, | |||||
| 2021 | 2021 | 2020 A | 2019 | 2018 | 2017 | |
| Selected Per–Share Data | ||||||
| Net asset value, beginning of period | $12.16 | $9.84 | $9.66 | $10.69 | $8.94 | $8.19 |
| Income from Investment Operations | ||||||
| Net investment income (loss)B | .02 | .10 | .20 | .16 | .12 | .14 |
| Net realized and unrealized gain (loss) | 1.35 | 2.37 | .31 | (.85) | 1.85 | .76 |
| Total from investment operations | 1.37 | 2.47 | .51 | (.69) | 1.97 | .90 |
| Distributions from net investment income | (.01) | (.08) | (.19) | (.15) | (.11) | (.13) |
| Distributions from net realized gain | (.22) | (.07) | (.14) | (.20) | (.11) | (.02) |
| Total distributions | (.23) | (.15) | (.33) | (.34)C | (.22) | (.15) |
| Net asset value, end of period | $13.30 | $12.16 | $9.84 | $9.66 | $10.69 | $8.94 |
| Total ReturnD,E | 11.36% | 25.35% | 5.10% | (6.41)% | 22.01% | 11.11% |
| Ratios to Average Net AssetsF,G | ||||||
| Expenses before reductions | .30%H | .28% | .29% | .35% | .38% | .39% |
| Expenses net of fee waivers, if any | .05%H | .03% | .04% | .10% | .13% | .14% |
| Expenses net of all reductions | .04%H | .03% | .04% | .09% | .13% | .14% |
| Net investment income (loss) | .34%H | .93% | 1.97% | 1.65% | 1.16% | 1.58% |
| Supplemental Data | ||||||
| Net assets, end of period (000 omitted) | $23,997,436 | $16,450,240 | $8,776,005 | $6,342,369 | $4,740,524 | $3,593,237 |
| Portfolio turnover rateI | 15%H | 6% | 6% | 9% | 13% | 14% |
A For the year ended February 29.
B Calculated based on average shares outstanding during the period.
C Total distributions per share do not sum due to rounding.
D Total returns for periods of less than one year are not annualized.
E Total returns would have been lower if certain expenses had not been reduced during the applicable periods shown.
F Fees and expenses of any underlying mutual funds or exchange-traded funds (ETFs) are not included in the Fund's expense ratio. The Fund indirectly bears its proportionate share of these expenses. For additional expense information related to investments in Fidelity Central Funds, please refer to the "Investments in Fidelity Central Funds" note found in the Notes to Financial Statements section of the most recent Annual or Semi-Annual report.
G Expense ratios reflect operating expenses of the class. Expenses before reductions do not reflect amounts reimbursed, waived, or reduced through arrangements with the investment advisor, brokerage services, or other offset arrangements, if applicable, and do not represent the amount paid by the class during periods when reimbursements, waivers or reductions occur.
H Annualized
I Amount does not include the portfolio activity of any underlying mutual funds or exchange-traded funds (ETFs).
See accompanying notes which are an integral part of the financial statements.
Notes to Financial Statements (Unaudited)
For the period ended August 31, 2021
1. Organization.
Strategic Advisers Fidelity International Fund (the Fund) is a fund of Fidelity Rutland Square Trust II (the Trust), and is authorized to issue an unlimited number of shares. The Trust is registered under the Investment Company Act of 1940, as amended (the 1940 Act), as an open-end management investment company organized as a Delaware statutory trust. The Fund is offered exclusively to certain managed account clients of Strategic Advisers LLC (Strategic Advisers), an affiliate of Fidelity Management & Research Company LLC (FMR).
2. Significant Accounting Policies.
The Fund is an investment company and applies the accounting and reporting guidance of the Financial Accounting Standards Board (FASB) Accounting Standards Codification Topic 946 Financial Services - Investment Companies. The financial statements have been prepared in conformity with accounting principles generally accepted in the United States of America (GAAP), which require management to make certain estimates and assumptions at the date of the financial statements. Actual results could differ from those estimates. Subsequent events, if any, through the date that the financial statements were issued have been evaluated in the preparation of the financial statements. The Fund's Schedule of Investments lists any underlying mutual funds or exchange-traded funds (ETFs) but does not include the underlying holdings of these funds. The following summarizes the significant accounting policies of the Fund:
Investment Valuation. Investments are valued as of 4:00 p.m. Eastern time on the last calendar day of the period. The Board of Trustees (the Board) has delegated the day to day responsibility for the valuation of the Fund's investments to the Fair Value Committee (the Committee) established by the Fund's investment adviser. In accordance with valuation policies and procedures approved by the Board, the Fund attempts to obtain prices from one or more third party pricing vendors or brokers to value its investments. When current market prices, quotations or currency exchange rates are not readily available or reliable, investments will be fair valued in good faith by the Committee, in accordance with procedures adopted by the Board. Factors used in determining fair value vary by investment type and may include market or investment specific events, changes in interest rates and credit quality. The frequency with which these procedures are used cannot be predicted and they may be utilized to a significant extent. The Committee oversees the Fund's valuation policies and procedures and reports to the Board on the Committee's activities and fair value determinations. The Board monitors the appropriateness of the procedures used in valuing the Fund's investments and ratifies the fair value determinations of the Committee.
The Fund categorizes the inputs to valuation techniques used to value its investments into a disclosure hierarchy consisting of three levels as shown below:
- Level 1 – quoted prices in active markets for identical investments
- Level 2 – other significant observable inputs (including quoted prices for similar investments, interest rates, prepayment speeds, etc.)
- Level 3 – unobservable inputs (including the Fund's own assumptions based on the best information available)
Valuation techniques used to value the Fund's investments by major category are as follows:
Equity securities, including restricted securities, for which market quotations are readily available, are valued at the last reported sale price or official closing price as reported by a third party pricing vendor on the primary market or exchange on which they are traded and are categorized as Level 1 in the hierarchy. In the event there were no sales during the day or closing prices are not available, securities are valued at the last quoted bid price or may be valued using the last available price and are generally categorized as Level 2 in the hierarchy. For foreign equity securities, when market or security specific events arise, comparisons to the valuation of American Depositary Receipts (ADRs), futures contracts, Exchange-Traded Funds (ETFs) and certain indexes as well as quoted prices for similar securities may be used and would be categorized as Level 2 in the hierarchy. For equity securities, including restricted securities, where observable inputs are limited, assumptions about market activity and risk are used and these securities may be categorized as Level 3 in the hierarchy.
Debt securities, including restricted securities, are valued based on evaluated prices received from third party pricing vendors or from brokers who make markets in such securities. U.S. government and government agency obligations are valued by pricing vendors who utilize matrix pricing which considers yield or price of bonds of comparable quality, coupon, maturity and type or by broker-supplied prices. When independent prices are unavailable or unreliable, debt securities may be valued utilizing pricing methodologies which consider similar factors that would be used by third party pricing vendors. Debt securities are generally categorized as Level 2 in the hierarchy but may be Level 3 depending on the circumstances.
Futures contracts are valued at the settlement price established each day by the board of trade or exchange on which they are traded and are categorized as Level 1 in the hierarchy. Investments in open-end mutual funds, including the Fidelity Central Funds, are valued at their closing net asset value (NAV) each business day and are categorized as Level 1 in the hierarchy. If an unaffiliated open-end mutual fund's NAV is unavailable, shares of that fund may be valued by another method that the Board believes reflects fair value in accordance with the Board's fair value pricing policies and is categorized as Level 2 in the hierarchy.
Changes in valuation techniques may result in transfers in or out of an assigned level within the disclosure hierarchy. The aggregate value of investments by input level as of August 31, 2021 is included at the end of the Fund's Schedule of Investments.
Foreign Currency. Certain Funds may use foreign currency contracts to facilitate transactions in foreign-denominated securities. Gains and losses from these transactions may arise from changes in the value of the foreign currency or if the counterparties do not perform under the contracts' terms.
Foreign-denominated assets, including investment securities, and liabilities are translated into U.S. dollars at the exchange rates at period end. Purchases and sales of investment securities, income and dividends received, and expenses denominated in foreign currencies are translated into U.S. dollars at the exchange rate in effect on the transaction date.
The effects of exchange rate fluctuations on investments are included with the net realized and unrealized gain (loss) on investment securities. Other foreign currency transactions resulting in realized and unrealized gain (loss) are disclosed separately.
Investment Transactions and Income. For financial reporting purposes, the Fund's investment holdings and NAV include trades executed through the end of the last business day of the period. The NAV per share for processing shareholder transactions is calculated as of the close of business of the New York Stock Exchange (NYSE), normally 4:00 p.m. Eastern time and includes trades executed through the end of the prior business day. Gains and losses on securities sold are determined on the basis of identified cost. Dividend income is recorded on the ex-dividend date, except for certain dividends from foreign securities where the ex-dividend date may have passed, which are recorded as soon as the Fund is informed of the ex-dividend date. Non-cash dividends included in dividend income, if any, are recorded at the fair market value of the securities received. Income and capital gain distributions from Fidelity Central Funds, if any, are recorded on the ex-dividend date. Income and capital gain distributions from any underlying mutual funds or exchange-traded funds (ETFs) are recorded on the ex-dividend date. Interest income is accrued as earned and includes coupon interest and amortization of premium and accretion of discount on debt securities as applicable. Investment income is recorded net of foreign taxes withheld where recovery of such taxes is uncertain.
Expenses. Expenses directly attributable to a fund are charged to that fund. Expenses attributable to more than one fund are allocated among the respective funds on the basis of relative net assets or other appropriate methods. Expenses included in the accompanying financial statements reflect the expenses of that fund and do not include any expenses associated with any underlying mutual funds or exchange-traded funds. Although not included in a fund's expenses, a fund indirectly bears its proportionate share of these expenses through the net asset value of each underlying mutual fund or exchange-traded fund. Expense estimates are accrued in the period to which they relate and adjustments are made when actual amounts are known.
Deferred Trustee Compensation. Under a Deferred Compensation Plan (the Plan) for certain Funds, certain independent Trustees have elected to defer receipt of a portion of their annual compensation. Deferred amounts are invested in affiliated mutual funds, are marked-to-market and remain in a fund until distributed in accordance with the Plan. The investment of deferred amounts and the offsetting payable to the Trustees presented below are included in the accompanying Statement of Assets and Liabilities in other receivables and other payables and accrued expenses, as applicable.
| Strategic Advisers Fidelity International Fund | $51,393 |
Income Tax Information and Distributions to Shareholders. Each year, the Fund intends to qualify as a regulated investment company under Subchapter M of the Internal Revenue Code, including distributing substantially all of its taxable income and realized gains. As a result, no provision for U.S. Federal income taxes is required. The Fund files a U.S. federal tax return, in addition to state and local tax returns as required. The Fund's federal income tax returns are subject to examination by the Internal Revenue Service (IRS) for a period of three fiscal years after they are filed. State and local tax returns may be subject to examination for an additional fiscal year depending on the jurisdiction. Foreign taxes are provided for based on the Fund's understanding of the tax rules and rates that exist in the foreign markets in which it invests.
Distributions are declared and recorded on the ex-dividend date. Income and capital gain distributions are determined in accordance with income tax regulations, which may differ from GAAP.
Capital accounts within the financial statements are adjusted for permanent book-tax differences. These adjustments have no impact on net assets or the results of operations. Capital accounts are not adjusted for temporary book-tax differences which will reverse in a subsequent period.
Book-tax differences are primarily due to the short-term gain distributions from the underlying mutual funds or exchange-traded funds (ETFs), futures contracts, foreign currency transactions, passive foreign investment companies (PFIC), market discount, deferred Trustees compensation and losses deferred due to wash sales.
As of period end, the cost and unrealized appreciation (depreciation) in securities, and derivatives if applicable, for federal income tax purposes were as follows:
| Gross unrealized appreciation | $4,642,550,209 |
| Gross unrealized depreciation | (88,842,898) |
| Net unrealized appreciation (depreciation) | $4,553,707,311 |
| Tax cost | $19,419,664,586 |
Delayed Delivery Transactions and When-Issued Securities. During the period, certain Funds transacted in securities on a delayed delivery or when-issued basis. Payment and delivery may take place after the customary settlement period for that security. The price of the underlying securities and the date when the securities will be delivered and paid for are fixed at the time the transaction is negotiated. Securities purchased on a delayed delivery or when-issued basis are identified as such in the Schedule of Investments. Compensation for interest forgone in the purchase of a delayed delivery or when-issued debt security may be received. With respect to purchase commitments, each applicable Fund identifies securities as segregated in its records with a value at least equal to the amount of the commitment. Payables and receivables associated with the purchases and sales of delayed delivery securities having the same coupon, settlement date and broker are offset. Delayed delivery or when-issued securities that have been purchased from and sold to different brokers are reflected as both payables and receivables in the Statement of Assets and Liabilities under the caption "Delayed delivery", as applicable. Losses may arise due to changes in the value of the underlying securities or if the counterparty does not perform under the contract's terms, or if the issuer does not issue the securities due to political, economic, or other factors.
Restricted Securities (including Private Placements). Funds may invest in securities that are subject to legal or contractual restrictions on resale. These securities generally may be resold in transactions exempt from registration or to the public if the securities are registered. Disposal of these securities may involve time-consuming negotiations and expense, and prompt sale at an acceptable price may be difficult. Information regarding restricted securities held at period end is included at the end of the Schedule of Investments, if applicable.
3. Derivative Instruments.
Risk Exposures and the Use of Derivative Instruments. The Fund's investment objective allows the Fund to enter into various types of derivative contracts, including futures contracts. Derivatives are investments whose value is primarily derived from underlying assets, indices or reference rates and may be transacted on an exchange or over-the-counter (OTC). Derivatives may involve a future commitment to buy or sell a specified asset based on specified terms, to exchange future cash flows at periodic intervals based on a notional principal amount, or for one party to make one or more payments upon the occurrence of specified events in exchange for periodic payments from the other party.
The Fund used derivatives to increase returns and to manage exposure to certain risks as defined below. The success of any strategy involving derivatives depends on analysis of numerous economic factors, and if the strategies for investment do not work as intended, the Fund may not achieve its objectives.
The Fund's use of derivatives increased or decreased its exposure to the following risk:
| Equity Risk | Equity risk relates to the fluctuations in the value of financial instruments as a result of changes in market prices (other than those arising from interest rate risk or foreign exchange risk), whether caused by factors specific to an individual investment, its issuer, or all factors affecting all instruments traded in a market or market segment. |
The Fund is also exposed to additional risks from investing in derivatives, such as liquidity risk and counterparty credit risk. Liquidity risk is the risk that the Fund will be unable to close out the derivative in the open market in a timely manner. Counterparty credit risk is the risk that the counterparty will not be able to fulfill its obligation to the Fund. Counterparty credit risk related to exchange-traded futures contracts may be mitigated by the protection provided by the exchange on which they trade.
Investing in derivatives may involve greater risks than investing in the underlying assets directly and, to varying degrees, may involve risk of loss in excess of any initial investment and collateral received and amounts recognized in the Statement of Assets and Liabilities. In addition, there may be the risk that the change in value of the derivative contract does not correspond to the change in value of the underlying instrument.
Futures Contracts. A futures contract is an agreement between two parties to buy or sell a specified underlying instrument for a fixed price at a specified future date. The Fund used futures contracts to manage its exposure to the stock market.
Upon entering into a futures contract, a fund is required to deposit either cash or securities (initial margin) with a clearing broker in an amount equal to a certain percentage of the face value of the contract. Futures contracts are marked-to-market daily and subsequent daily payments (variation margin) are made or received by a fund depending on the daily fluctuations in the value of the futures contracts and are recorded as unrealized appreciation or (depreciation). This receivable and/or payable, if any, is included in daily variation margin on futures contracts in the Statement of Assets and Liabilities. Realized gain or (loss) is recorded upon the expiration or closing of a futures contract. The net realized gain (loss) and change in net unrealized appreciation (depreciation) on futures contracts during the period is presented in the Statement of Operations.
Any open futures contracts at period end are presented in the Schedule of Investments under the caption "Futures Contracts". The notional amount at value reflects each contract's exposure to the underlying instrument or index at period end. Securities deposited to meet initial margin requirements are identified in the Schedule of Investments.
4. Purchases and Sales of Investments.
Purchases and sales of securities, other than short-term securities and in-kind transactions, as applicable, are noted in the table below.
| Purchases ($) | Sales ($) | |
| Strategic Advisers Fidelity International Fund | 6,436,940,078 | 1,383,193,578 |
5. Fees and Other Transactions with Affiliates.
Management Fee. Strategic Advisers (the investment adviser) provides the Fund with investment management related services. For these services, the Fund pays a monthly management fee to the investment adviser. The management fee is calculated by adding the annual management fee rate of .25% of the Fund's average net assets throughout the month to the aggregate of the fee rates, payable monthly by the investment adviser, to the Fund's sub-advisers. The Fund's maximum aggregate management fee will not exceed 1.00% of the Fund's average net assets. For the reporting period, the total annualized management fee rate was .28% of the Fund's average net assets.
During the period, the investment adviser waived a portion of its management fee as described in the Expense Reductions note.
Sub-Advisers. FIAM LLC (an affiliate of the investment adviser) served as a sub-adviser for the Fund during the period. Sub-advisers provide discretionary investment advisory services for their allocated portion of the Fund's assets and are paid as described in the Management Fee note.
FIL Investment Advisors and Geode Capital Management, LLC have been retained to serve as a sub-adviser for the Fund. As of the date of this report, however, these sub-advisers have not been allocated any portion of the Fund's assets. These sub-advisers in the future may provide discretionary investment advisory services for an allocated portion of the Fund's assets and will be paid by the investment adviser for providing these services.
Interfund Trades. Funds may purchase from or sell securities to other funds affiliated with each sub-adviser under procedures adopted by the Board. The procedures have been designed to ensure these interfund trades are executed in accordance with Rule 17a-7 of the 1940 Act. Any interfund trades are included within the respective purchases and sales amounts shown in the Purchases and Sales of Investments note and are noted in the table below.
| Purchases ($) | Sales ($) | |
| Strategic Advisers Fidelity International Fund | 28,416,160 | 430,170 |
Reallocation of Underlying Fund Investments. During the period, the investment adviser reallocated investments of the Fund. This involved a taxable redemption of the Fund's interest in Fidelity Advisor Overseas Fund for investments and cash and exchanges of those investments and cash for shares of Fidelity Overseas Fund, which are afliated investment companies managed by FMR. The Fund redeemed 3,075,382 shares of Fidelity Advisor Overseas Fund in exchange for 1,544,949 shares of Fidelity Overseas Fund with a value of $ 98,196,961. The net realized gain of $50,899,070 on the Fund's redemptions of Fidelity Advisor Overseas Fund shares is included in "Net realized gain (loss) on Other affiliated issuers." in the accompanying Statement of Operations. The Fund recognized net gain on the exchanges for federal income tax purposes.
Other. During the period, the investment adviser reimbursed the Fund for certain losses as follows:
| Amount ($) | |
| Strategic Advisers Fidelity International Fund | 122,112 |
6. Investments in Fidelity Central Funds.
Funds may invest in Fidelity Central Funds, which are open-end investment companies generally available only to other investment companies and accounts managed by the investment adviser and its affiliates. The Schedule of Investments lists any Fidelity Central Funds held as an investment as of period end, but does not include the underlying holdings of each Fidelity Central Fund. An investing fund indirectly bears its proportionate share of the expenses of the underlying Fidelity Central Funds.
Based on its investment objective, each Fidelity Central Fund may invest or participate in various investment vehicles or strategies that are similar to those of the investing fund. These strategies are consistent with the investment objectives of the investing fund and may involve certain economic risks which may cause a decline in value of each of the Fidelity Central Funds and thus a decline in the value of the investing fund.
| Fidelity Central Fund | Investment Manager | Investment Objective | Investment Practices | Expense Ratio(a) |
| Fidelity Money Market Central Funds | Fidelity Management & Research Company LLC (FMR) | Each fund seeks to obtain a high level of current income consistent with the preservation of capital and liquidity. | Short-term Investments | Less than .005% to .01% |
(a) Expenses expressed as a percentage of average net assets and are as of each underlying Central Fund's most recent annual or semi-annual shareholder report.
A complete unaudited list of holdings for each Fidelity Central Fund is available upon request or at the Securities and Exchange Commission website at www.sec.gov. In addition, the financial statements of the Fidelity Central Funds, which are not covered by the Report of Independent Registered Public Accounting Firm, are available on the Securities and Exchange Commission website or upon request.
7. Committed Line of Credit.
Certain Funds participate with other funds managed by the investment adviser or an affiliate in a $4.25 billion credit facility (the "line of credit") to be utilized for temporary or emergency purposes to fund shareholder redemptions or for other short-term liquidity purposes. The participating funds have agreed to pay commitment fees on their pro-rata portion of the line of credit, which are reflected in Miscellaneous expenses on the Statement of Operations, and are listed below. During the period, there were no borrowings on this line of credit.
| Amount | |
| Strategic Advisers Fidelity International Fund | $16,208 |
8. Security Lending.
Funds lend portfolio securities through a lending agent from time to time in order to earn additional income. On the settlement date of the loan, a fund receives collateral (in the form of U.S. Treasury obligations, letters of credit and/or cash) against the loaned securities and maintains collateral in an amount not less than 100% of the market value of the loaned securities during the period of the loan. The market value of the loaned securities is determined at the close of business of a fund and any additional required collateral is delivered to a fund on the next business day. A fund or borrower may terminate the loan at any time, and if the borrower defaults on its obligation to return the securities loaned because of insolvency or other reasons, a fund may apply collateral received from the borrower against the obligation. A fund may experience delays and costs in recovering the securities loaned. Any cash collateral received is invested in the Fidelity Securities Lending Cash Central Fund. Any loaned securities are identified as such in the Schedule of Investments, and the value of loaned securities and cash collateral at period end, as applicable, are presented in the Statement of Assets and Liabilities. Security lending income represents the income earned on investing cash collateral, less rebates paid to borrowers and any lending agent fees associated with the loan, plus any premium payments received for lending certain types of securities. Security lending income is presented in the Statement of Operations as a component of income from Fidelity Central Funds.
9. Expense Reductions.
The investment adviser has contractually agreed to waive the Fund's management fee in an amount equal to .25% of the Fund's average net assets until September 30, 2023. During the period, this waiver reduced the Fund's management fee by $24,719,820.
Commissions paid to certain brokers with whom the investment adviser, or its affiliates, places trades on behalf of the Fund include an amount in addition to trade execution, which may be rebated back to the Fund to offset expenses. This amount totaled $316,102 for the period.
In addition, through arrangements with the Fund's custodian, credits realized as a result of certain uninvested cash balances were used to reduce the Fund's expenses by $187.
10. Other.
Fund's organizational documents provide former and current trustees and officers with a limited indemnification against liabilities arising in connection with the performance of their duties to the fund. In the normal course of business, the fund may also enter into contracts that provide general indemnifications. The fund's maximum exposure under these arrangements is unknown as this would be dependent on future claims that may be made against the fund. The risk of material loss from such claims is considered remote.
Funds do not invest in underlying mutual funds for the purpose of exercising management or control; however, investments by funds within their principal investment strategies may represent a significant portion of the underlying mutual fund's net assets. At the end of the period, certain Funds were the owners of record of 10% or more of the total outstanding shares of the following underlying mutual funds as shown below.
| Fund | Strategic Advisers Fidelity International Fund |
| Fidelity International Discovery Fund | 23% |
| Fidelity International Real Estate Fund | 12% |
| Fidelity International Value Fund | 35% |
| Fidelity Japan Fund | 59% |
| Fidelity SAI International Index Fund | 18% |
| Fidelity SAI International Low Volatility Index Fund | 23% |
| Fidelity SAI International Momentum Index Fund | 22% |
| Fidelity SAI International Quality Index Fund | 19% |
| Fidelity SAI International Small Cap Index Fund | 55% |
| Fidelity SAI International Value Index Fund | 72% |
| Fidelity SAI Japan Stock Index Fund | 16% |
11. Coronavirus (COVID-19) Pandemic.
An outbreak of COVID-19 first detected in China during December 2019 has since spread globally and was declared a pandemic by the World Health Organization during March 2020. Developments that disrupt global economies and financial markets, such as the COVID-19 pandemic, may magnify factors that affect the Fund's performance.
Shareholder Expense Example
As a shareholder, you incur two types of costs: (1) transaction costs, which may include sales charges (loads) on purchase payments or redemption proceeds, as applicable and (2) ongoing costs, which generally include management fees, distribution and/or service (12b-1) fees and other Fund expenses. This Example is intended to help you understand your ongoing costs (in dollars) of investing in a fund and to compare these costs with the ongoing costs of investing in other mutual funds.
The Example is based on an investment of $1,000 invested at the beginning of the period and held for the entire period (March 1, 2021 to August 31, 2021).
Actual Expenses
The first line of the accompanying table provides information about actual account values and actual expenses. You may use the information in this line, together with the amount you invested, to estimate the expenses that you paid over the period. Simply divide your account value by $1,000.00 (for example, an $8,600 account value divided by $1,000.00 = 8.6), then multiply the result by the number in the first line for a class/Fund under the heading entitled "Expenses Paid During Period" to estimate the expenses you paid on your account during this period. If any fund is a shareholder of any underlying mutual funds or exchange-traded funds (ETFs) (the Underlying Funds), such fund indirectly bears its proportional share of the expenses of the Underlying Funds in addition to the direct expenses incurred presented in the table. These fees and expenses are not included in the annualized expense ratio used to calculate the expense estimate in the table below.
Hypothetical Example for Comparison Purposes
The second line of the accompanying table provides information about hypothetical account values and hypothetical expenses based on the actual expense ratio and an assumed rate of return of 5% per year before expenses, which is not the actual return. The hypothetical account values and expenses may not be used to estimate the actual ending account balance or expenses you paid for the period. You may use this information to compare the ongoing costs of investing in the Fund and other funds. To do so, compare this 5% hypothetical example with the 5% hypothetical examples that appear in the shareholder reports of the other funds. If any fund is a shareholder of any Underlying Funds, such fund indirectly bears its proportional share of the expenses of the Underlying Funds in addition to the direct expenses as presented in the table. These fees and expenses are not included in the annualized expense ratio used to calculate the expense estimate in the table below.
Please note that the expenses shown in the table are meant to highlight your ongoing costs only and do not reflect any transaction costs. Therefore, the second line of the table is useful in comparing ongoing costs only, and will not help you determine the relative total costs of owning different funds.
| Annualized Expense Ratio-A | Beginning Account Value March 1, 2021 | Ending Account Value August 31, 2021 | Expenses Paid During Period-B March 1, 2021 to August 31, 2021 |
|
| Strategic Advisers Fidelity International Fund | .05% | |||
| Actual | $1,000.00 | $1,113.60 | $.27 | |
| Hypothetical-C | $1,000.00 | $1,024.95 | $.26 |
A Annualized expense ratio reflects expenses net of applicable fee waivers.
B Expenses are equal to the annualized expense ratio, multiplied by the average account value over the period, multiplied by 184/ 365 (to reflect the one-half year period). The fees and expenses of any Underlying Funds are not included in each annualized expense ratio.
C 5% return per year before expenses
![]()
SIL-SANN-1021
1.912841.111
Strategic Advisers® Small-Mid Cap Fund
Offered exclusively to certain managed account clients of Strategic Advisers LLC or its affiliates - not available for sale to the general public
Semi-Annual Report
August 31, 2021
Contents
To view a fund's proxy voting record for the 12-month period ended June 30, visit http://www.fidelity.com/proxyvotingresults or visit the Securities and Exchange Commission's (SEC) web site at http://www.sec.gov.
You may also call 1-800-544-3455 to request a free copy of the proxy voting guidelines.
Standard & Poor's, S&P and S&P 500 are registered service marks of The McGraw-Hill Companies, Inc. and have been licensed for use by Fidelity Distributors Corporation.
Other third-party marks appearing herein are the property of their respective owners.
All other marks appearing herein are registered or unregistered trademarks or service marks of FMR LLC or an affiliated company. © 2021 FMR LLC. All rights reserved.
This report and the financial statements contained herein are submitted for the general information of the shareholders of the Fund. This report is not authorized for distribution to prospective investors in the Fund unless preceded or accompanied by an effective prospectus.
A fund files its complete schedule of portfolio holdings with the SEC for the first and third quarters of each fiscal year on Form N-PORT. Forms N-PORT are available on the SEC’s web site at http://www.sec.gov. A fund's Forms N-PORT may be reviewed and copied at the SEC’s Public Reference Room in Washington, DC. Information regarding the operation of the SEC's Public Reference Room may be obtained by calling 1-800-SEC-0330.
For a complete list of a fund's portfolio holdings, view the most recent holdings listing, semiannual report, or annual report on Fidelity's web site at http://www.fidelity.com, http://www.institutional.fidelity.com, or http://www.401k.com, as applicable.
NOT FDIC INSURED •MAY LOSE VALUE •NO BANK GUARANTEE
Neither the Fund nor Fidelity Distributors Corporation is a bank.
Note to Shareholders:
Early in 2020, the outbreak and spread of COVID-19 emerged as a public health emergency that had a major influence on financial markets, primarily based on its impact on the global economy and corporate earnings. On March 11, 2020, the World Health Organization declared the COVID-19 outbreak a pandemic, citing sustained risk of further global spread. The pandemic prompted a number of measures to limit the spread of COVID-19, including travel and border restrictions, quarantines, and restrictions on large gatherings. In turn, these resulted in lower consumer activity, diminished demand for a wide range of products and services, disruption in manufacturing and supply chains, and – given the wide variability in outcomes regarding the outbreak – significant market uncertainty and volatility. To help stem the turmoil, the U.S. government took unprecedented action – in concert with the U.S. Federal Reserve and central banks around the world – to help support consumers, businesses, and the broader economy, and to limit disruption to the financial system.
In general, the overall impact of the pandemic lessened in 2021, amid a resilient economy and widespread distribution of three COVID-19 vaccines granted emergency use authorization from the U.S. Food and Drug Administration (FDA) early in the year. Still, the situation remains dynamic, and the extent and duration of its influence on financial markets and the economy is highly uncertain, due in part to a recent spike in cases based on highly contagious variants of the coronavirus.
Extreme events such as the COVID-19 crisis are exogenous shocks that can have significant adverse effects on mutual funds and their investments. Although multiple asset classes may be affected by market disruption, the duration and impact may not be the same for all types of assets. Fidelity is committed to helping you stay informed amid news about COVID-19 and during increased market volatility, and we continue to take extra steps to be responsive to customer needs. We encourage you to visit us online, where we offer ongoing updates, commentary, and analysis on the markets and our funds.
Investment Summary (Unaudited)
The information in the following tables is based on the direct investments of the Fund.Top Ten Holdings as of August 31, 2021
| (excluding cash equivalents) | % of fund's net assets |
| Fidelity Small Cap Index Fund | 7.1 |
| T. Rowe Price Institutional Small-Cap Stock Fund | 2.4 |
| Fidelity Advisor Small Cap Growth Fund - Class Z | 1.8 |
| Fidelity SAI Small-Mid Cap 500 Index Fund | 1.2 |
| Fidelity SAI Real Estate Index Fund | 1.1 |
| j2 Global, Inc. | 1.0 |
| ON Semiconductor Corp. | 0.8 |
| Vulcan Value Partners Small Cap Fund | 0.7 |
| PIMCO StocksPLUS Small Fund Institutional Class | 0.7 |
| Fidelity Small Cap Discovery Fund | 0.7 |
| 17.5 |
Top Five Market Sectors as of August 31, 2021
| (stocks only) | % of fund's net assets |
| Industrials | 16.2 |
| Information Technology | 15.0 |
| Consumer Discretionary | 13.1 |
| Financials | 12.1 |
| Health Care | 10.7 |
Asset Allocation (% of fund's net assets)
| As of August 31, 2021 | ||
| Common Stocks | 81.9% | |
| Mid-Cap Blend Funds | 1.2% | |
| Small Blend Funds | 9.2% | |
| Small Growth Funds | 4.2% | |
| Sector Funds | 1.1% | |
| Short-Term Investments and Net Other Assets (Liabilities) | 2.4% | |

Asset allocations of funds in the pie chart reflect the categorizations of assets as defined by Morningstar as of the reporting date.
Schedule of Investments August 31, 2021 (Unaudited)
Showing Percentage of Net Assets
| Common Stocks - 81.9% | |||
| Shares | Value | ||
| COMMUNICATION SERVICES - 1.6% | |||
| Diversified Telecommunication Services - 0.2% | |||
| Bandwidth, Inc. (a) | 100,588 | $10,350,505 | |
| Liberty Latin America Ltd.: | |||
| Class A (a) | 132,330 | 1,887,026 | |
| Class C (a) | 224,400 | 3,229,116 | |
| Lumen Technologies, Inc. | 463,300 | 5,698,590 | |
| 21,165,237 | |||
| Entertainment - 0.1% | |||
| Sciplay Corp. (A Shares) (a) | 7,486 | 140,063 | |
| World Wrestling Entertainment, Inc. Class A | 136,855 | 7,131,514 | |
| 7,271,577 | |||
| Interactive Media & Services - 0.6% | |||
| Alphabet, Inc. Class C (a) | 3,240 | 9,425,938 | |
| CarGurus, Inc. Class A (a) | 248,015 | 7,534,696 | |
| Cars.com, Inc. (a) | 198,000 | 2,518,560 | |
| Facebook, Inc. Class A (a) | 28,540 | 10,827,505 | |
| IAC (a) | 55,267 | 7,298,007 | |
| Match Group, Inc. (a) | 24,339 | 3,345,152 | |
| QuinStreet, Inc. (a) | 417,976 | 7,485,950 | |
| Twitter, Inc. (a) | 32,644 | 2,105,538 | |
| Yelp, Inc. (a) | 113,708 | 4,378,895 | |
| ZipRecruiter, Inc. (a) | 310,258 | 7,815,399 | |
| 62,735,640 | |||
| Media - 0.7% | |||
| AMC Networks, Inc. Class A (a) | 93,565 | 4,447,144 | |
| Audacy, Inc. Class A (a) | 862,300 | 3,061,165 | |
| Criteo SA sponsored ADR (a) | 217,628 | 8,167,579 | |
| Gray Television, Inc. | 335,150 | 7,621,311 | |
| iHeartMedia, Inc. (a) | 24,100 | 599,608 | |
| Interpublic Group of Companies, Inc. | 22,000 | 819,060 | |
| Magnite, Inc. (a) | 8,900 | 258,278 | |
| National CineMedia, Inc. | 3 | 8 | |
| News Corp. Class A | 27,900 | 626,913 | |
| Nexstar Broadcasting Group, Inc. Class A | 88,440 | 13,243,890 | |
| Ocean Outdoor Ltd. (a)(b) | 1,223,674 | 10,890,699 | |
| Sirius XM Holdings, Inc. (c) | 382,440 | 2,397,899 | |
| TechTarget, Inc. (a) | 6,800 | 575,144 | |
| Tegna, Inc. | 370,718 | 6,569,123 | |
| ViacomCBS, Inc. Class B | 144,600 | 5,993,670 | |
| 65,271,491 | |||
| TOTAL COMMUNICATION SERVICES | 156,443,945 | ||
| CONSUMER DISCRETIONARY - 13.1% | |||
| Auto Components - 0.9% | |||
| Adient PLC (a) | 21,800 | 857,612 | |
| BorgWarner, Inc. | 133,700 | 5,706,316 | |
| Cooper-Standard Holding, Inc. (a) | 227,655 | 5,299,808 | |
| Dana, Inc. | 396,509 | 9,222,799 | |
| Dorman Products, Inc. (a) | 9,439 | 885,945 | |
| Fox Factory Holding Corp. (a) | 35,752 | 5,494,010 | |
| Gentex Corp. | 228,995 | 7,053,046 | |
| LCI Industries | 108,515 | 15,372,235 | |
| Lear Corp. | 94,336 | 15,088,100 | |
| Magna International, Inc. Class A | 37,408 | 2,951,865 | |
| Standard Motor Products, Inc. | 38,990 | 1,672,281 | |
| The Goodyear Tire & Rubber Co. (a) | 953,842 | 15,108,857 | |
| 84,712,874 | |||
| Automobiles - 0.3% | |||
| Fisker, Inc. (a)(c) | 117,060 | 1,632,987 | |
| Harley-Davidson, Inc. | 293,296 | 11,593,991 | |
| Thor Industries, Inc. | 99,758 | 11,315,550 | |
| 24,542,528 | |||
| Distributors - 1.1% | |||
| LKQ Corp. (a) | 1,094,157 | 57,651,132 | |
| Pool Corp. | 95,151 | 47,033,139 | |
| 104,684,271 | |||
| Diversified Consumer Services - 1.7% | |||
| 2U, Inc. (a) | 982,220 | 36,371,607 | |
| Adtalem Global Education, Inc. (a) | 87,900 | 3,252,300 | |
| American Public Education, Inc. (a) | 6,146 | 161,640 | |
| Bright Horizons Family Solutions, Inc. (a) | 96,037 | 13,998,353 | |
| Carriage Services, Inc. | 5,406 | 249,919 | |
| Chegg, Inc. (a) | 135,948 | 11,313,593 | |
| Frontdoor, Inc. (a) | 937,877 | 40,910,195 | |
| Grand Canyon Education, Inc. (a) | 127,030 | 11,323,454 | |
| H&R Block, Inc. | 182,891 | 4,691,154 | |
| Houghton Mifflin Harcourt Co. (a) | 470,513 | 6,337,810 | |
| Mister Car Wash, Inc. | 244,437 | 4,690,746 | |
| Service Corp. International | 70,596 | 4,430,605 | |
| Strategic Education, Inc. | 37,342 | 2,923,132 | |
| Stride, Inc. (a) | 396,451 | 13,574,482 | |
| Terminix Global Holdings, Inc. (a) | 43,512 | 1,811,405 | |
| WW International, Inc. (a) | 78,877 | 1,707,687 | |
| 157,748,082 | |||
| Hotels, Restaurants & Leisure - 1.4% | |||
| Caesars Entertainment, Inc. (a) | 7,100 | 721,573 | |
| Churchill Downs, Inc. | 26,000 | 5,473,000 | |
| Dine Brands Global, Inc. (a) | 109,730 | 9,076,866 | |
| Full House Resorts, Inc. (a) | 925,058 | 7,936,998 | |
| Hilton Grand Vacations, Inc. (a) | 115,340 | 5,039,205 | |
| International Game Technology PLC (a) | 133,615 | 2,871,386 | |
| Kura Sushi U.S.A., Inc. Class A (a) | 155,661 | 7,909,135 | |
| Marriott Vacations Worldwide Corp. (a) | 28,140 | 4,208,337 | |
| Papa John's International, Inc. | 79,867 | 10,185,439 | |
| Planet Fitness, Inc. (a) | 237,970 | 19,346,961 | |
| Playa Hotels & Resorts NV (a) | 1,138,364 | 8,321,441 | |
| Scientific Games Corp. Class A (a) | 122,690 | 8,876,622 | |
| Travel+Leisure Co. | 78,374 | 4,291,760 | |
| Vail Resorts, Inc. (a) | 86,559 | 26,387,511 | |
| Wendy's Co. | 462,330 | 10,642,837 | |
| Wingstop, Inc. | 21,499 | 3,696,323 | |
| 134,985,394 | |||
| Household Durables - 1.6% | |||
| Cavco Industries, Inc. (a) | 2,820 | 720,510 | |
| Century Communities, Inc. | 47,933 | 3,360,103 | |
| Ethan Allen Interiors, Inc. | 7,242 | 173,953 | |
| Helen of Troy Ltd. (a) | 12,551 | 3,002,074 | |
| Hooker Furniture Corp. | 3,894 | 121,337 | |
| Installed Building Products, Inc. | 81,862 | 10,165,623 | |
| iRobot Corp. (a)(c) | 9,298 | 754,254 | |
| KB Home | 190,179 | 8,183,402 | |
| La-Z-Boy, Inc. | 138,410 | 4,845,734 | |
| LGI Homes, Inc. (a) | 22,902 | 3,671,878 | |
| M.D.C. Holdings, Inc. | 145,800 | 7,618,050 | |
| Meritage Homes Corp. (a) | 24,962 | 2,784,261 | |
| Mohawk Industries, Inc. (a) | 19,463 | 3,849,003 | |
| NVR, Inc. (a) | 1,083 | 5,609,875 | |
| PulteGroup, Inc. | 399,594 | 21,522,133 | |
| Purple Innovation, Inc. (a) | 212,706 | 5,190,026 | |
| Skyline Champion Corp. (a) | 173,073 | 10,855,139 | |
| Sonos, Inc. (a) | 226,123 | 8,983,867 | |
| Taylor Morrison Home Corp. (a) | 406,508 | 11,418,810 | |
| Tempur Sealy International, Inc. | 399,500 | 17,857,650 | |
| Toll Brothers, Inc. | 42,269 | 2,707,752 | |
| TopBuild Corp. (a) | 40,877 | 8,943,479 | |
| Whirlpool Corp. | 45,800 | 10,146,074 | |
| 152,484,987 | |||
| Internet & Direct Marketing Retail - 0.8% | |||
| 1stDibs.com, Inc. (c) | 123,318 | 2,011,317 | |
| Amazon.com, Inc. (a) | 3,138 | 10,891,339 | |
| CarParts.com, Inc. (a) | 358,848 | 6,197,305 | |
| Etsy, Inc. (a) | 81,960 | 17,724,670 | |
| Overstock.com, Inc. (a) | 122,917 | 8,868,462 | |
| PetMed Express, Inc. (c) | 6,690 | 184,243 | |
| Porch Group, Inc. Class A (a) | 618,820 | 12,376,400 | |
| Qurate Retail, Inc. Series A | 387,606 | 4,275,294 | |
| Revolve Group, Inc. (a) | 10,925 | 627,751 | |
| Shutterstock, Inc. | 91,811 | 10,582,136 | |
| The RealReal, Inc. (a) | 21,000 | 261,240 | |
| Waitr Holdings, Inc. (a)(c) | 2,530,670 | 3,315,178 | |
| 77,315,335 | |||
| Leisure Products - 0.7% | |||
| Brunswick Corp. | 306,850 | 29,724,560 | |
| Callaway Golf Co. (a) | 487,872 | 13,689,688 | |
| Hasbro, Inc. | 23,766 | 2,336,435 | |
| Latham Group, Inc. (a) | 166,204 | 3,651,502 | |
| Malibu Boats, Inc. Class A (a) | 42,201 | 3,021,592 | |
| Polaris, Inc. | 56,459 | 6,761,530 | |
| Smith & Wesson Brands, Inc. | 17,545 | 423,361 | |
| Sturm, Ruger & Co., Inc. | 48,277 | 3,774,779 | |
| YETI Holdings, Inc. (a) | 24,738 | 2,457,473 | |
| 65,840,920 | |||
| Multiline Retail - 0.1% | |||
| Franchise Group, Inc. | 87,068 | 3,023,872 | |
| Kohl's Corp. | 87,200 | 5,005,280 | |
| Ollie's Bargain Outlet Holdings, Inc. (a) | 29,700 | 2,149,686 | |
| 10,178,838 | |||
| Specialty Retail - 2.5% | |||
| Academy Sports & Outdoors, Inc. | 98,039 | 4,340,187 | |
| Advance Auto Parts, Inc. | 73,985 | 15,007,857 | |
| America's Car Mart, Inc. (a) | 40,662 | 5,258,816 | |
| AutoNation, Inc. (a) | 18,179 | 1,983,147 | |
| Barnes & Noble Education, Inc. (a) | 108,622 | 886,356 | |
| Caleres, Inc. | 214,803 | 5,282,006 | |
| Destination XL Group, Inc. (a)(c) | 512,470 | 3,069,695 | |
| Five Below, Inc. (a) | 38,159 | 8,120,617 | |
| Floor & Decor Holdings, Inc. Class A (a) | 77,730 | 9,584,109 | |
| Foot Locker, Inc. | 273,051 | 15,479,261 | |
| Genesco, Inc. (a) | 163,145 | 10,119,884 | |
| Group 1 Automotive, Inc. | 49,407 | 8,173,894 | |
| Haverty Furniture Companies, Inc. | 109,807 | 3,912,423 | |
| Lithia Motors, Inc. Class A (sub. vtg.) | 29,493 | 9,771,031 | |
| MarineMax, Inc. (a) | 7,304 | 355,120 | |
| Murphy U.S.A., Inc. | 47,956 | 7,446,608 | |
| National Vision Holdings, Inc. (a) | 128,996 | 7,737,180 | |
| Penske Automotive Group, Inc. | 90,200 | 8,111,686 | |
| Rent-A-Center, Inc. | 145,012 | 9,147,357 | |
| Sally Beauty Holdings, Inc. (a) | 2,308,530 | 42,915,573 | |
| Sleep Number Corp. (a) | 25,432 | 2,352,714 | |
| Sonic Automotive, Inc. Class A (sub. vtg.) | 77,500 | 3,916,850 | |
| The Aaron's Co., Inc. | 128,600 | 3,410,472 | |
| The Buckle, Inc. | 9,447 | 365,882 | |
| The Children's Place Retail Stores, Inc. (a) | 27,003 | 2,344,941 | |
| The ODP Corp. (a) | 99,500 | 4,693,415 | |
| TravelCenters of America LLC (a) | 276,777 | 11,616,331 | |
| Vroom, Inc. (a) | 642,920 | 17,268,831 | |
| Williams-Sonoma, Inc. | 71,339 | 13,318,991 | |
| Winmark Corp. | 994 | 208,372 | |
| Zumiez, Inc. (a) | 83,142 | 3,341,477 | |
| 239,541,083 | |||
| Textiles, Apparel & Luxury Goods - 2.0% | |||
| Canada Goose Holdings, Inc. (a) | 184,920 | 7,095,380 | |
| Capri Holdings Ltd. (a) | 263,170 | 14,871,737 | |
| Carter's, Inc. | 204,442 | 20,930,772 | |
| Columbia Sportswear Co. | 9,900 | 1,009,899 | |
| Crocs, Inc. (a) | 86,225 | 12,314,655 | |
| Deckers Outdoor Corp. (a) | 3,000 | 1,255,350 | |
| Hanesbrands, Inc. | 1,324,069 | 24,733,609 | |
| Kontoor Brands, Inc. | 131,770 | 7,110,309 | |
| Lakeland Industries, Inc. (a) | 2,618 | 62,492 | |
| Levi Strauss & Co. Class A | 40,600 | 1,064,126 | |
| Ralph Lauren Corp. | 83,631 | 9,712,068 | |
| Rocky Brands, Inc. | 61,511 | 3,055,866 | |
| Skechers U.S.A., Inc. Class A (sub. vtg.) (a) | 1,196,627 | 60,345,900 | |
| Steven Madden Ltd. | 254,435 | 10,296,984 | |
| Tapestry, Inc. | 196,280 | 7,914,010 | |
| Under Armour, Inc. Class C (non-vtg.) (a) | 426,482 | 8,555,229 | |
| Wolverine World Wide, Inc. | 116,520 | 4,178,407 | |
| 194,506,793 | |||
| TOTAL CONSUMER DISCRETIONARY | 1,246,541,105 | ||
| CONSUMER STAPLES - 3.3% | |||
| Beverages - 0.1% | |||
| Molson Coors Beverage Co. Class B | 255,526 | 12,145,151 | |
| National Beverage Corp. | 7,693 | 358,109 | |
| 12,503,260 | |||
| Food & Staples Retailing - 0.8% | |||
| BJ's Wholesale Club Holdings, Inc. (a) | 390,138 | 22,105,219 | |
| Casey's General Stores, Inc. | 73,987 | 15,134,781 | |
| Ingles Markets, Inc. Class A | 86,395 | 5,865,357 | |
| Performance Food Group Co. (a) | 356,251 | 17,890,925 | |
| PriceSmart, Inc. | 7,704 | 651,835 | |
| SpartanNash Co. | 128,500 | 2,762,750 | |
| Sprouts Farmers Market LLC (a) | 124,700 | 3,105,030 | |
| U.S. Foods Holding Corp. (a) | 22,300 | 758,200 | |
| Weis Markets, Inc. | 82,922 | 4,722,408 | |
| 72,996,505 | |||
| Food Products - 1.4% | |||
| Flowers Foods, Inc. | 64,978 | 1,567,919 | |
| Fresh Del Monte Produce, Inc. | 181,414 | 5,964,892 | |
| Freshpet, Inc. (a) | 71,338 | 9,141,251 | |
| Hostess Brands, Inc. Class A (a) | 421,947 | 6,734,274 | |
| Ingredion, Inc. | 108,145 | 9,501,620 | |
| J&J Snack Foods Corp. | 4,943 | 809,466 | |
| John B. Sanfilippo & Son, Inc. | 2,928 | 248,851 | |
| Lamb Weston Holdings, Inc. | 194,246 | 12,655,127 | |
| Lancaster Colony Corp. | 6,457 | 1,144,439 | |
| Nomad Foods Ltd. (a) | 1,675,911 | 44,227,291 | |
| Oatly Group AB ADR (a)(c) | 210,557 | 3,836,349 | |
| Pilgrim's Pride Corp. (a) | 238,600 | 6,642,624 | |
| SunOpta, Inc. (a) | 1,129,211 | 10,648,460 | |
| The Hain Celestial Group, Inc. (a) | 276,998 | 10,362,495 | |
| The J.M. Smucker Co. | 70,000 | 8,656,900 | |
| Tootsie Roll Industries, Inc. | 5,882 | 186,165 | |
| 132,328,123 | |||
| Household Products - 0.5% | |||
| Energizer Holdings, Inc. | 146,018 | 5,744,348 | |
| Reynolds Consumer Products, Inc. | 353,340 | 9,992,455 | |
| Spectrum Brands Holdings, Inc. | 438,942 | 34,263,813 | |
| WD-40 Co. | 4,511 | 1,080,971 | |
| 51,081,587 | |||
| Personal Products - 0.4% | |||
| elf Beauty, Inc. (a) | 453,853 | 14,046,750 | |
| Herbalife Nutrition Ltd. (a) | 38,106 | 1,956,362 | |
| MediFast, Inc. | 47,875 | 10,910,713 | |
| Nu Skin Enterprises, Inc. Class A | 166,524 | 8,429,445 | |
| The Honest Co., Inc. | 13,488 | 130,442 | |
| USANA Health Sciences, Inc. (a) | 3,917 | 380,067 | |
| 35,853,779 | |||
| Tobacco - 0.1% | |||
| Universal Corp. | 81,079 | 4,102,597 | |
| Vector Group Ltd. | 42,292 | 635,226 | |
| 4,737,823 | |||
| TOTAL CONSUMER STAPLES | 309,501,077 | ||
| ENERGY - 2.0% | |||
| Energy Equipment & Services - 0.2% | |||
| Cactus, Inc. | 66,450 | 2,492,540 | |
| Championx Corp. (a) | 271,844 | 6,342,121 | |
| Dril-Quip, Inc. (a) | 162,323 | 3,944,449 | |
| Helmerich & Payne, Inc. | 164,322 | 4,423,548 | |
| Nextier Oilfield Solutions, Inc.(a) | 364,513 | 1,312,247 | |
| 18,514,905 | |||
| Oil, Gas & Consumable Fuels - 1.8% | |||
| APA Corp. | 28,700 | 559,076 | |
| ARC Resources Ltd. | 1,202,072 | 8,594,815 | |
| Baytex Energy Corp. (a) | 3,963,069 | 6,816,479 | |
| Cenovus Energy, Inc. | 539,275 | 4,465,197 | |
| Cimarex Energy Co. | 120,808 | 7,758,290 | |
| CNX Resources Corp. (a) | 258,150 | 2,932,584 | |
| Delek U.S. Holdings, Inc. | 198,518 | 3,396,643 | |
| Devon Energy Corp. | 184,000 | 5,437,200 | |
| Diamondback Energy, Inc. | 146,274 | 11,283,576 | |
| Enerplus Corp. (c) | 483,619 | 2,863,024 | |
| Enviva Partners LP | 320,627 | 17,326,683 | |
| Green Plains, Inc. (a) | 436,670 | 15,327,117 | |
| HollyFrontier Corp. | 629,018 | 20,336,152 | |
| Kosmos Energy Ltd. (a) | 955,592 | 2,255,197 | |
| Laredo Petroleum, Inc. (a) | 99,282 | 5,364,206 | |
| Magnolia Oil & Gas Corp. Class A | 46,500 | 729,120 | |
| Matador Resources Co. | 126,717 | 3,643,114 | |
| National Energy Services Reunited Corp. (a) | 170,186 | 1,931,611 | |
| Northern Oil & Gas, Inc. | 418,353 | 6,944,660 | |
| PDC Energy, Inc. | 163,476 | 6,825,123 | |
| Range Resources Corp. (a) | 39,600 | 578,952 | |
| Renewable Energy Group, Inc. (a) | 5,900 | 285,678 | |
| Rex American Resources Corp. (a) | 32,538 | 2,757,921 | |
| SandRidge Energy, Inc. (a) | 954,652 | 8,496,403 | |
| Southwestern Energy Co. (a) | 601,500 | 2,736,825 | |
| Viper Energy Partners LP | 181,522 | 3,361,787 | |
| Whiting Petroleum Corp. (a) | 48,748 | 2,288,719 | |
| World Fuel Services Corp. | 409,967 | 13,266,532 | |
| 168,562,684 | |||
| TOTAL ENERGY | 187,077,589 | ||
| FINANCIALS - 12.1% | |||
| Banks - 4.0% | |||
| Ameris Bancorp | 44,298 | 2,181,234 | |
| Associated Banc-Corp. | 61,100 | 1,259,882 | |
| Bank OZK | 321,797 | 13,653,847 | |
| BankUnited, Inc. | 373,702 | 15,706,695 | |
| Cathay General Bancorp | 102,900 | 4,093,362 | |
| Citizens Financial Group, Inc. | 216,200 | 9,467,398 | |
| Comerica, Inc. | 164,305 | 12,143,783 | |
| Commerce Bancshares, Inc. | 115,194 | 8,146,520 | |
| Cullen/Frost Bankers, Inc. | 81,505 | 9,309,501 | |
| East West Bancorp, Inc. | 64,052 | 4,697,574 | |
| Fifth Third Bancorp | 236,800 | 9,202,048 | |
| First Citizens Bancshares, Inc. | 20,014 | 17,966,568 | |
| First Hawaiian, Inc. | 464,271 | 12,957,804 | |
| First Horizon National Corp. | 1,426,238 | 23,376,041 | |
| First Merchants Corp. | 69,634 | 2,865,439 | |
| Fulton Financial Corp. | 239,600 | 3,797,660 | |
| Hancock Whitney Corp. | 82,900 | 3,810,084 | |
| Hanmi Financial Corp. | 108,800 | 2,097,664 | |
| Hilltop Holdings, Inc. | 21,414 | 716,727 | |
| Hope Bancorp, Inc. | 340,100 | 4,689,979 | |
| Huntington Bancshares, Inc. | 277,518 | 4,309,855 | |
| Investors Bancorp, Inc. | 267,445 | 3,827,138 | |
| KeyCorp | 420,100 | 8,536,432 | |
| Midland States Bancorp, Inc. | 91,357 | 2,311,332 | |
| PacWest Bancorp | 284,897 | 12,122,367 | |
| Peoples Bancorp, Inc. | 40,051 | 1,251,193 | |
| Pinnacle Financial Partners, Inc. | 55,510 | 5,380,029 | |
| Preferred Bank, Los Angeles | 36,949 | 2,360,672 | |
| Regions Financial Corp. | 392,500 | 8,018,775 | |
| ServisFirst Bancshares, Inc. | 175,566 | 12,890,056 | |
| Signature Bank | 85,560 | 22,188,275 | |
| South State Corp. | 31,914 | 2,188,662 | |
| SVB Financial Group (a) | 34,604 | 19,360,938 | |
| Synovus Financial Corp. | 366,406 | 15,792,099 | |
| Texas Capital Bancshares, Inc. (a) | 161,109 | 10,953,801 | |
| Umpqua Holdings Corp. | 826,082 | 16,083,817 | |
| Valley National Bancorp | 312,678 | 4,077,321 | |
| Webster Financial Corp. | 257,762 | 13,022,136 | |
| Western Alliance Bancorp. | 246,356 | 24,034,491 | |
| Wintrust Financial Corp. | 166,360 | 12,450,382 | |
| Zions Bancorp NA | 338,165 | 19,579,754 | |
| 382,879,335 | |||
| Capital Markets - 2.7% | |||
| Ares Management Corp. | 95,850 | 7,397,703 | |
| Artisan Partners Asset Management, Inc. | 116,278 | 6,041,805 | |
| B. Riley Financial, Inc. | 169,024 | 11,077,833 | |
| Cohen & Steers, Inc. | 7,796 | 683,787 | |
| Diamond Hill Investment Group, Inc. | 951 | 174,062 | |
| Donnelley Financial Solutions, Inc. (a) | 115,106 | 3,838,785 | |
| Evercore, Inc. Class A | 77,340 | 10,799,758 | |
| FactSet Research Systems, Inc. | 50,986 | 19,385,897 | |
| Federated Hermes, Inc. | 31,015 | 1,049,237 | |
| Focus Financial Partners, Inc. Class A (a) | 337,269 | 17,497,516 | |
| FS KKR Capital Corp. | 161,834 | 3,736,747 | |
| Greenhill & Co., Inc. | 4,793 | 70,649 | |
| Hamilton Lane, Inc. Class A | 10,328 | 888,931 | |
| Houlihan Lokey | 17,004 | 1,533,761 | |
| Jefferies Financial Group, Inc. | 106,500 | 3,936,240 | |
| Lazard Ltd. Class A | 322,532 | 15,288,017 | |
| LPL Financial | 323,156 | 47,778,615 | |
| Moelis & Co. Class A | 317,377 | 19,661,505 | |
| Morningstar, Inc. | 53,434 | 14,319,778 | |
| Newtek Business Services Corp. | 41,100 | 1,192,722 | |
| Oaktree Specialty Lending Corp. | 926,370 | 6,790,292 | |
| Open Lending Corp. (a) | 64,708 | 2,392,255 | |
| PJT Partners, Inc. | 7,874 | 621,889 | |
| Prospect Capital Corp. | 53,000 | 420,820 | |
| SEI Investments Co. | 39,296 | 2,468,182 | |
| Sprott, Inc. (a) | 8,515 | 285,934 | |
| StepStone Group, Inc. Class A | 227,052 | 10,868,979 | |
| Stifel Financial Corp. | 165,220 | 11,416,702 | |
| Victory Capital Holdings, Inc. | 686,863 | 24,060,811 | |
| WisdomTree Investments, Inc. | 1,547,256 | 9,763,185 | |
| 255,442,397 | |||
| Consumer Finance - 1.1% | |||
| Ally Financial, Inc. | 188,915 | 9,993,604 | |
| Encore Capital Group, Inc. (a) | 92,297 | 4,541,935 | |
| Enova International, Inc. (a) | 219,821 | 7,249,697 | |
| First Cash Financial Services, Inc. | 13,100 | 1,122,539 | |
| Navient Corp. | 1,100,242 | 25,536,617 | |
| OneMain Holdings, Inc. | 219,729 | 12,706,928 | |
| PRA Group, Inc. (a) | 73,957 | 3,106,194 | |
| PROG Holdings, Inc. | 243,247 | 11,510,448 | |
| Regional Management Corp. | 95,000 | 5,645,850 | |
| SLM Corp. | 746,506 | 13,996,988 | |
| Synchrony Financial | 201,825 | 10,040,794 | |
| 105,451,594 | |||
| Diversified Financial Services - 0.3% | |||
| A-Mark Precious Metals, Inc. | 1,535 | 74,463 | |
| Banco Latinoamericano de Comercio Exterior SA Series E | 75,700 | 1,291,442 | |
| Cannae Holdings, Inc. (a) | 242,566 | 7,742,707 | |
| ECN Capital Corp. | 814,147 | 6,619,015 | |
| Voya Financial, Inc. | 235,190 | 15,282,646 | |
| 31,010,273 | |||
| Insurance - 3.1% | |||
| Alleghany Corp. (a) | 7,710 | 5,217,280 | |
| American Equity Investment Life Holding Co. | 168,717 | 5,346,642 | |
| American Financial Group, Inc. | 144,181 | 19,888,327 | |
| Amerisafe, Inc. | 6,373 | 366,766 | |
| Assurant, Inc. | 31,530 | 5,363,568 | |
| Assured Guaranty Ltd. | 217,812 | 10,860,106 | |
| Axis Capital Holdings Ltd. | 276,297 | 14,138,117 | |
| BRP Group, Inc. (a) | 280,380 | 10,556,307 | |
| CNA Financial Corp. | 224,225 | 9,944,379 | |
| CNO Financial Group, Inc. | 339,200 | 8,296,832 | |
| Crawford & Co. Class B | 124,426 | 1,175,826 | |
| Employers Holdings, Inc. | 62,037 | 2,554,063 | |
| Enstar Group Ltd. (a) | 4,358 | 1,005,260 | |
| Erie Indemnity Co. Class A | 8,234 | 1,458,159 | |
| Everest Re Group Ltd. | 68,806 | 18,226,709 | |
| Fidelity National Financial, Inc. | 235,126 | 11,481,203 | |
| First American Financial Corp. | 197,546 | 13,932,919 | |
| Genworth Financial, Inc. Class A (a) | 734,306 | 2,753,648 | |
| Globe Life, Inc. | 27,514 | 2,643,270 | |
| GoHealth, Inc. (a) | 190,523 | 925,942 | |
| Goosehead Insurance | 25,778 | 3,783,695 | |
| Hanover Insurance Group, Inc. | 110,930 | 15,675,518 | |
| HCI Group, Inc. | 45,264 | 5,054,178 | |
| Heritage Insurance Holdings, Inc. | 127,900 | 895,300 | |
| Kinsale Capital Group, Inc. | 124,459 | 22,632,869 | |
| Lincoln National Corp. | 138,400 | 9,501,160 | |
| Old Republic International Corp. | 461,114 | 11,988,964 | |
| Primerica, Inc. | 12,982 | 1,985,467 | |
| ProAssurance Corp. | 183,795 | 4,686,773 | |
| Reinsurance Group of America, Inc. | 58,786 | 6,808,595 | |
| RenaissanceRe Holdings Ltd. | 32,074 | 5,026,958 | |
| RLI Corp. | 140,481 | 15,344,740 | |
| Ryan Specialty Group Holdings, Inc. (c) | 266,367 | 8,766,138 | |
| Selective Insurance Group, Inc. | 67,378 | 5,630,779 | |
| Stewart Information Services Corp. | 74,182 | 4,669,757 | |
| Trean Insurance Group, Inc. (a) | 3,524 | 35,980 | |
| Universal Insurance Holdings, Inc. | 101,536 | 1,445,873 | |
| Unum Group | 241,300 | 6,423,406 | |
| White Mountains Insurance Group Ltd. | 12,315 | 13,802,775 | |
| 290,294,248 | |||
| Mortgage Real Estate Investment Trusts - 0.3% | |||
| AGNC Investment Corp. | 204,741 | 3,339,326 | |
| Annaly Capital Management, Inc. | 512,600 | 4,454,494 | |
| Ares Commercial Real Estate Corp. | 103,272 | 1,629,632 | |
| Blackstone Mortgage Trust, Inc. | 80,753 | 2,649,506 | |
| Chimera Investment Corp. | 176,100 | 2,697,852 | |
| MFA Financial, Inc. | 419,200 | 2,012,160 | |
| New Residential Investment Corp. | 113,200 | 1,236,144 | |
| Redwood Trust, Inc. | 219,495 | 2,737,103 | |
| Starwood Property Trust, Inc. | 189,807 | 4,897,021 | |
| 25,653,238 | |||
| Thrifts & Mortgage Finance - 0.6% | |||
| Axos Financial, Inc. (a) | 139,813 | 6,778,134 | |
| Essent Group Ltd. | 173,981 | 8,191,025 | |
| Federal Agricultural Mortgage Corp. Class C (non-vtg.) | 68,098 | 6,666,794 | |
| HomeStreet, Inc. | 66,800 | 2,728,780 | |
| Merchants Bancorp | 5,310 | 194,718 | |
| MGIC Investment Corp. | 589,386 | 8,999,924 | |
| Mr. Cooper Group, Inc. (a) | 114,109 | 4,436,558 | |
| NMI Holdings, Inc. (a) | 107,224 | 2,420,046 | |
| PennyMac Financial Services, Inc. | 76,006 | 5,058,199 | |
| Radian Group, Inc. | 196,700 | 4,648,021 | |
| Walker & Dunlop, Inc. | 62,126 | 6,899,092 | |
| 57,021,291 | |||
| TOTAL FINANCIALS | 1,147,752,376 | ||
| HEALTH CARE - 10.7% | |||
| Biotechnology - 2.3% | |||
| ACADIA Pharmaceuticals, Inc. (a) | 140,063 | 2,452,503 | |
| Adagio Theraputics, Inc. | 220,346 | 7,456,509 | |
| ADC Therapeutics SA (a)(c) | 71,876 | 2,096,623 | |
| Agios Pharmaceuticals, Inc. (a) | 123,626 | 5,523,610 | |
| Albireo Pharma, Inc. (a) | 55,935 | 1,708,814 | |
| Allakos, Inc. (a) | 40,691 | 3,628,010 | |
| Allogene Therapeutics, Inc. (a) | 81,760 | 1,949,976 | |
| Applied Genetic Technologies Corp. (a)(c) | 859,379 | 3,050,795 | |
| Arena Pharmaceuticals, Inc. (a) | 52,783 | 2,793,276 | |
| Arrowhead Pharmaceuticals, Inc. (a) | 36,230 | 2,431,758 | |
| Ascendis Pharma A/S sponsored ADR (a) | 40,023 | 6,272,805 | |
| BeyondSpring, Inc. (a)(c) | 17,280 | 541,037 | |
| Biohaven Pharmaceutical Holding Co. Ltd. (a) | 83,634 | 10,976,126 | |
| BioMarin Pharmaceutical, Inc. (a) | 46,540 | 3,919,133 | |
| Blueprint Medicines Corp. (a) | 42,272 | 3,942,709 | |
| C4 Therapeutics, Inc. | 120,631 | 4,840,922 | |
| CareDx, Inc. (a) | 45,805 | 3,356,590 | |
| Catalyst Pharmaceutical Partners, Inc. (a) | 659,800 | 3,635,498 | |
| Celldex Therapeutics, Inc. (a) | 2,700 | 142,155 | |
| Coherus BioSciences, Inc. (a) | 112,370 | 1,795,673 | |
| Deciphera Pharmaceuticals, Inc. (a) | 128,834 | 4,058,271 | |
| Dyadic International, Inc. (a)(c) | 349,994 | 2,211,962 | |
| Emergent BioSolutions, Inc. (a) | 77,405 | 4,882,707 | |
| Erasca, Inc. | 66,340 | 1,586,189 | |
| Exact Sciences Corp. (a) | 36,841 | 3,845,464 | |
| Fate Therapeutics, Inc. (a) | 54,492 | 3,991,539 | |
| Forte Biosciences, Inc. (a)(c) | 80,953 | 2,381,637 | |
| Global Blood Therapeutics, Inc. (a) | 72,940 | 2,092,649 | |
| Halozyme Therapeutics, Inc. (a) | 137,810 | 5,786,642 | |
| Heron Therapeutics, Inc. (a) | 536,801 | 6,264,468 | |
| Horizon Therapeutics PLC (a) | 68,180 | 7,369,576 | |
| ImmunoGen, Inc. (a) | 103,600 | 626,780 | |
| Insmed, Inc. (a) | 63,209 | 1,772,380 | |
| Instil Bio, Inc. (a)(c) | 107,899 | 2,033,896 | |
| Intellia Therapeutics, Inc. (a) | 25,100 | 4,029,303 | |
| Iovance Biotherapeutics, Inc. (a) | 178,587 | 4,298,589 | |
| Ironwood Pharmaceuticals, Inc. Class A (a) | 563,500 | 7,381,850 | |
| Karyopharm Therapeutics, Inc. (a)(c) | 133,553 | 774,607 | |
| Kodiak Sciences, Inc. (a) | 85,376 | 8,040,712 | |
| Krystal Biotech, Inc. (a) | 6,400 | 370,816 | |
| Legend Biotech Corp. ADR (a) | 57,177 | 2,189,307 | |
| Ligand Pharmaceuticals, Inc. Class B (a) | 55,236 | 7,307,723 | |
| Natera, Inc. (a) | 10,200 | 1,207,986 | |
| Neurocrine Biosciences, Inc. (a) | 53,589 | 5,101,673 | |
| Precision BioSciences, Inc. (a) | 114,053 | 1,433,646 | |
| PTC Therapeutics, Inc. (a) | 14,400 | 628,560 | |
| Puma Biotechnology, Inc. (a) | 43,560 | 329,749 | |
| Recro Pharma, Inc. (a) | 880,651 | 2,139,982 | |
| Repligen Corp. (a) | 39,805 | 11,264,019 | |
| Springworks Therapeutics, Inc. (a) | 69,614 | 5,228,011 | |
| Turning Point Therapeutics, Inc. (a) | 37,990 | 2,925,990 | |
| Twist Bioscience Corp. (a) | 25,710 | 2,910,629 | |
| Ultragenyx Pharmaceutical, Inc. (a) | 32,858 | 3,163,897 | |
| United Therapeutics Corp. (a) | 46,200 | 9,927,456 | |
| Veracyte, Inc. (a) | 244,386 | 11,757,410 | |
| Viking Therapeutics, Inc. (a)(c) | 725,099 | 4,792,904 | |
| Vir Biotechnology, Inc. (a) | 50,356 | 2,595,348 | |
| 221,218,849 | |||
| Health Care Equipment & Supplies - 2.9% | |||
| Abiomed, Inc. (a) | 18,047 | 6,568,386 | |
| Atricure, Inc. (a) | 79,980 | 5,888,128 | |
| Atrion Corp. | 464 | 322,044 | |
| AxoGen, Inc. (a) | 827,265 | 14,113,141 | |
| Axonics Modulation Technologies, Inc. (a) | 17,200 | 1,289,656 | |
| Butterfly Network, Inc. Class A (a)(c) | 34,100 | 421,476 | |
| Envista Holdings Corp. (a) | 341,564 | 14,615,524 | |
| Globus Medical, Inc. (a) | 25,370 | 2,070,192 | |
| Haemonetics Corp. (a) | 76,493 | 4,799,936 | |
| Hill-Rom Holdings, Inc. | 58,393 | 8,500,853 | |
| Hologic, Inc. (a) | 215,758 | 17,077,246 | |
| ICU Medical, Inc. (a) | 44,990 | 8,968,757 | |
| Inari Medical, Inc. (a) | 67,363 | 5,514,335 | |
| Insulet Corp. (a) | 16,585 | 4,939,179 | |
| Integra LifeSciences Holdings Corp. (a) | 206,811 | 15,558,392 | |
| Merit Medical Systems, Inc. (a) | 342,453 | 24,577,852 | |
| Neogen Corp. (a) | 35,148 | 1,538,779 | |
| Nevro Corp. (a) | 36,263 | 4,424,086 | |
| Ortho Clinical Diagnostics Holdings PLC | 667,224 | 13,638,059 | |
| Quidel Corp. (a) | 93,050 | 11,998,798 | |
| Semler Scientific, Inc. (a) | 31,981 | 3,389,986 | |
| Silk Road Medical, Inc. (a) | 82,043 | 4,863,509 | |
| STERIS PLC | 226,141 | 48,622,576 | |
| Talis Biomedical Corp. | 295,110 | 2,378,587 | |
| Tandem Diabetes Care, Inc. (a) | 41,090 | 4,609,065 | |
| Teleflex, Inc. | 26,701 | 10,559,177 | |
| The Cooper Companies, Inc. | 12,664 | 5,707,791 | |
| TransMedics Group, Inc. (a) | 66,132 | 2,161,194 | |
| ViewRay, Inc. (a) | 176,600 | 1,066,664 | |
| West Pharmaceutical Services, Inc. | 55,591 | 25,106,007 | |
| 275,289,375 | |||
| Health Care Providers & Services - 2.6% | |||
| Acadia Healthcare Co., Inc. (a) | 85,626 | 5,661,591 | |
| Alignment Healthcare, Inc. (a)(c) | 124,283 | 2,196,081 | |
| Amedisys, Inc. (a) | 20,850 | 3,824,933 | |
| AMN Healthcare Services, Inc. (a) | 85,778 | 9,737,519 | |
| Cano Health, Inc. (a)(c) | 1,636,810 | 19,592,616 | |
| Castle Biosciences, Inc. (a) | 57,130 | 4,383,585 | |
| Chemed Corp. | 29,761 | 14,187,069 | |
| Corvel Corp. (a) | 3,006 | 495,419 | |
| DaVita HealthCare Partners, Inc. (a) | 97,664 | 12,771,521 | |
| dentalcorp Holdings Ltd. (a) | 1,043,268 | 13,180,907 | |
| Encompass Health Corp. | 230,598 | 18,090,413 | |
| Guardant Health, Inc. (a) | 43,559 | 5,543,754 | |
| HealthEquity, Inc. (a) | 197,191 | 12,653,746 | |
| Henry Schein, Inc. (a) | 182,301 | 13,780,133 | |
| LHC Group, Inc. (a) | 14,500 | 2,708,020 | |
| MEDNAX, Inc. (a) | 751,191 | 24,120,743 | |
| Molina Healthcare, Inc. (a) | 107,659 | 28,935,509 | |
| National Healthcare Corp. | 4,063 | 300,053 | |
| National Research Corp. Class A | 4,456 | 240,624 | |
| Owens & Minor, Inc. | 48,800 | 1,819,264 | |
| Patterson Companies, Inc. | 75,035 | 2,299,072 | |
| PetIQ, Inc. Class A (a) | 113,797 | 2,953,032 | |
| Premier, Inc. | 452,564 | 16,826,330 | |
| Progyny, Inc. (a) | 17,800 | 994,486 | |
| Quest Diagnostics, Inc. | 37,500 | 5,731,125 | |
| R1 RCM, Inc. (a) | 222,887 | 4,395,332 | |
| Select Medical Holdings Corp. | 93,621 | 3,236,478 | |
| U.S. Physical Therapy, Inc. | 4,232 | 496,837 | |
| Universal Health Services, Inc. Class B | 109,375 | 17,036,250 | |
| 248,192,442 | |||
| Health Care Technology - 0.5% | |||
| Certara, Inc. | 237,582 | 7,975,628 | |
| Change Healthcare, Inc. (a) | 489,532 | 10,686,484 | |
| iCAD, Inc. (a) | 254,474 | 3,068,956 | |
| Inovalon Holdings, Inc. Class A (a) | 307,765 | 12,572,200 | |
| Omnicell, Inc. (a) | 90,762 | 14,092,616 | |
| Phreesia, Inc. (a) | 14,300 | 1,023,165 | |
| 49,419,049 | |||
| Life Sciences Tools & Services - 1.6% | |||
| 10X Genomics, Inc. (a) | 42,089 | 7,404,297 | |
| Avantor, Inc. (a) | 335,365 | 13,226,796 | |
| Bio-Rad Laboratories, Inc. Class A (a) | 9,737 | 7,836,532 | |
| Bruker Corp. | 48,603 | 4,292,131 | |
| Charles River Laboratories International, Inc. (a) | 13,260 | 5,885,584 | |
| Harvard Bioscience, Inc. (a) | 1,175,499 | 9,709,622 | |
| ICON PLC (a) | 61,320 | 15,683,816 | |
| Inotiv, Inc. (a) | 289,360 | 7,532,041 | |
| Medpace Holdings, Inc. (a) | 23,498 | 4,284,860 | |
| PPD, Inc. (a) | 88,290 | 4,088,710 | |
| Sotera Health Co. | 945,218 | 23,120,032 | |
| Syneos Health, Inc. (a) | 470,138 | 43,619,404 | |
| 146,683,825 | |||
| Pharmaceuticals - 0.8% | |||
| Aerie Pharmaceuticals, Inc. (a) | 140,005 | 2,087,475 | |
| Arvinas Holding Co. LLC (a) | 49,480 | 4,265,671 | |
| Catalent, Inc. (a) | 144,054 | 18,790,404 | |
| Innoviva, Inc. (a) | 267,362 | 4,079,944 | |
| Jazz Pharmaceuticals PLC (a) | 113,444 | 14,941,709 | |
| Lannett Co., Inc. (a)(c) | 177,600 | 625,152 | |
| Pacira Biosciences, Inc. (a) | 42,785 | 2,536,723 | |
| Prestige Brands Holdings, Inc. (a) | 74,492 | 4,275,096 | |
| Reata Pharmaceuticals, Inc. (a) | 31,289 | 3,332,591 | |
| Revance Therapeutics, Inc. (a) | 466,331 | 12,488,344 | |
| Supernus Pharmaceuticals, Inc. (a) | 121,510 | 3,345,170 | |
| Zogenix, Inc. (a) | 67,300 | 996,713 | |
| 71,764,992 | |||
| TOTAL HEALTH CARE | 1,012,568,532 | ||
| INDUSTRIALS - 16.2% | |||
| Aerospace & Defense - 0.7% | |||
| Axon Enterprise, Inc. (a) | 51,838 | 9,427,777 | |
| BWX Technologies, Inc. | 81,680 | 4,690,882 | |
| Curtiss-Wright Corp. | 62,006 | 7,551,091 | |
| HEICO Corp. Class A | 10,300 | 1,176,672 | |
| Howmet Aerospace, Inc. | 229,658 | 7,291,642 | |
| Huntington Ingalls Industries, Inc. | 95,151 | 19,426,980 | |
| Moog, Inc. Class A | 52,400 | 4,162,656 | |
| Spirit AeroSystems Holdings, Inc. Class A | 253,650 | 9,953,226 | |
| Textron, Inc. | 83,010 | 6,032,337 | |
| 69,713,263 | |||
| Air Freight & Logistics - 0.6% | |||
| Air Transport Services Group, Inc. (a) | 363,465 | 9,955,306 | |
| Atlas Air Worldwide Holdings, Inc. (a) | 91,000 | 6,658,470 | |
| C.H. Robinson Worldwide, Inc. | 235,816 | 21,237,589 | |
| Forward Air Corp. | 117,318 | 10,343,928 | |
| GXO Logistics, Inc. (a) | 93,416 | 7,640,495 | |
| Hub Group, Inc. Class A (a) | 35,879 | 2,518,706 | |
| 58,354,494 | |||
| Airlines - 0.3% | |||
| Alaska Air Group, Inc. (a) | 195,804 | 11,227,401 | |
| JetBlue Airways Corp. (a) | 247,500 | 3,744,675 | |
| SkyWest, Inc. (a) | 280,309 | 13,076,415 | |
| 28,048,491 | |||
| Building Products - 1.5% | |||
| A.O. Smith Corp. | 44,681 | 3,249,202 | |
| Advanced Drain Systems, Inc. | 38,000 | 4,337,700 | |
| Allegion PLC | 5,527 | 795,833 | |
| Apogee Enterprises, Inc. | 76,492 | 3,287,626 | |
| Armstrong World Industries, Inc. | 185,302 | 19,258,437 | |
| Builders FirstSource, Inc. (a) | 164,584 | 8,770,681 | |
| Caesarstone Sdot-Yam Ltd. | 170,213 | 2,212,769 | |
| Carlisle Companies, Inc. | 13,030 | 2,745,942 | |
| Fortune Brands Home & Security, Inc. | 163,885 | 15,957,482 | |
| Lennox International, Inc. | 34,394 | 11,528,181 | |
| Masonite International Corp. (a) | 212,649 | 25,449,832 | |
| Owens Corning | 122,268 | 11,682,707 | |
| Simpson Manufacturing Co. Ltd. | 14,301 | 1,618,158 | |
| Tecnoglass, Inc. | 651,158 | 14,885,472 | |
| Trex Co., Inc. (a) | 97,362 | 10,686,453 | |
| 136,466,475 | |||
| Commercial Services & Supplies - 3.0% | |||
| ABM Industries, Inc. | 422,288 | 20,911,702 | |
| ACCO Brands Corp. | 423,170 | 3,965,103 | |
| ACV Auctions, Inc. Class A (a) | 297,606 | 6,074,138 | |
| ADT, Inc. | 762,380 | 6,525,973 | |
| Charah Solutions, Inc. (a)(c) | 1,346,761 | 6,222,036 | |
| Cimpress PLC (a) | 102,506 | 9,736,020 | |
| Clean Harbors, Inc. (a) | 166,059 | 17,040,975 | |
| Copart, Inc. (a) | 32,691 | 4,717,965 | |
| CoreCivic, Inc. (a) | 494,732 | 4,808,795 | |
| Deluxe Corp. | 73,600 | 2,822,560 | |
| Driven Brands Holdings, Inc. | 639,014 | 19,093,738 | |
| Harsco Corp. (a) | 517,395 | 9,437,285 | |
| Healthcare Services Group, Inc. | 239,892 | 6,275,575 | |
| Herman Miller, Inc. | 346,689 | 14,571,339 | |
| HNI Corp. | 14,195 | 537,849 | |
| IAA, Inc. (a) | 359,834 | 19,114,382 | |
| KAR Auction Services, Inc. (a) | 579,690 | 9,802,558 | |
| Marlowe PLC (a) | 1,664,226 | 18,418,892 | |
| MSA Safety, Inc. | 106,110 | 17,278,952 | |
| Ritchie Bros. Auctioneers, Inc. | 500,172 | 31,305,765 | |
| Rollins, Inc. | 73,054 | 2,843,262 | |
| Stericycle, Inc. (a) | 145,279 | 10,111,418 | |
| The Brink's Co. | 216,077 | 16,888,578 | |
| UniFirst Corp. | 32,424 | 7,427,366 | |
| Viad Corp. (a) | 34,832 | 1,504,394 | |
| Waste Connections, Inc. (United States) | 153,714 | 19,861,386 | |
| 287,298,006 | |||
| Construction & Engineering - 0.5% | |||
| AECOM (a) | 175,583 | 11,511,221 | |
| Argan, Inc. | 86,151 | 3,988,791 | |
| Comfort Systems U.S.A., Inc. | 63,231 | 4,804,291 | |
| EMCOR Group, Inc. | 39,956 | 4,854,654 | |
| MasTec, Inc. (a) | 61,800 | 5,650,992 | |
| MYR Group, Inc. (a) | 5,527 | 574,863 | |
| Willscot Mobile Mini Holdings (a) | 598,733 | 17,722,497 | |
| 49,107,309 | |||
| Electrical Equipment - 1.6% | |||
| Acuity Brands, Inc. | 43,087 | 7,950,844 | |
| AMETEK, Inc. | 38,622 | 5,251,433 | |
| Atkore, Inc. (a) | 165,288 | 15,333,768 | |
| Babcock & Wilcox Enterprises, Inc. (a) | 914,925 | 6,678,953 | |
| EnerSys | 29,732 | 2,515,030 | |
| Generac Holdings, Inc. (a) | 89,907 | 39,287,561 | |
| GrafTech International Ltd. | 626,722 | 6,937,813 | |
| Hubbell, Inc. Class B | 17,913 | 3,692,048 | |
| nVent Electric PLC | 55,498 | 1,906,911 | |
| Plug Power, Inc. (a) | 6,000 | 156,360 | |
| Regal Beloit Corp. | 88,438 | 13,214,406 | |
| Sensata Technologies, Inc. PLC (a) | 568,411 | 33,638,563 | |
| Shoals Technologies Group, Inc. | 114,109 | 3,716,530 | |
| Vertiv Holdings Co. | 246,350 | 6,939,680 | |
| 147,219,900 | |||
| Machinery - 3.5% | |||
| AGCO Corp. | 77,000 | 10,596,740 | |
| Allison Transmission Holdings, Inc. | 259,860 | 9,609,623 | |
| Altra Industrial Motion Corp. | 39,145 | 2,292,331 | |
| Barnes Group, Inc. | 15,366 | 732,497 | |
| Chart Industries, Inc. (a) | 57,240 | 10,782,871 | |
| Colfax Corp. (a) | 62,100 | 2,991,357 | |
| Commercial Vehicle Group, Inc. (a) | 416,966 | 4,382,313 | |
| Crane Co. | 145,111 | 14,767,946 | |
| Donaldson Co., Inc. | 41,605 | 2,818,739 | |
| Douglas Dynamics, Inc. | 122,364 | 4,862,745 | |
| Energy Recovery, Inc. (a) | 197,412 | 4,033,127 | |
| Evoqua Water Technologies Corp. (a) | 120,760 | 4,699,979 | |
| Flowserve Corp. | 37,900 | 1,473,173 | |
| Franklin Electric Co., Inc. | 12,649 | 1,074,912 | |
| Gorman-Rupp Co. | 6,199 | 217,399 | |
| Graco, Inc. | 55,673 | 4,365,877 | |
| Hillenbrand, Inc. | 126,444 | 5,869,530 | |
| Hillman Solutions Corp. Class A (a)(c) | 500,203 | 6,142,493 | |
| IDEX Corp. | 62,620 | 14,026,880 | |
| Ingersoll Rand, Inc. (a) | 112,112 | 5,944,178 | |
| ITT, Inc. | 90,581 | 8,665,884 | |
| John Bean Technologies Corp. | 57,623 | 8,406,619 | |
| Lincoln Electric Holdings, Inc. | 148,922 | 20,791,000 | |
| Meritor, Inc. (a) | 178,422 | 4,232,170 | |
| Middleby Corp. (a) | 164,061 | 30,013,319 | |
| Nordson Corp. | 78,042 | 18,620,821 | |
| Omega Flex, Inc. | 969 | 147,288 | |
| Oshkosh Corp. | 174,891 | 20,039,011 | |
| RBC Bearings, Inc. (a) | 56,631 | 13,111,209 | |
| Snap-On, Inc. | 99,503 | 22,383,200 | |
| Tennant Co. | 190,947 | 14,126,259 | |
| Terex Corp. | 51,621 | 2,635,252 | |
| Timken Co. | 182,130 | 13,393,840 | |
| Toro Co. | 236,597 | 26,011,474 | |
| TriMas Corp. (a) | 16,999 | 545,838 | |
| Wabash National Corp. | 159,704 | 2,481,800 | |
| Woodward, Inc. | 148,739 | 17,988,495 | |
| 335,278,189 | |||
| Marine - 0.6% | |||
| Genco Shipping & Trading Ltd. | 8,500 | 165,665 | |
| Kirby Corp. (a) | 205,944 | 11,036,539 | |
| Matson, Inc. | 537,403 | 42,546,196 | |
| 53,748,400 | |||
| Professional Services - 1.9% | |||
| Acacia Research Corp. (a) | 1,781,123 | 10,847,039 | |
| Alight, Inc. Class A (a)(c) | 2,136,389 | 23,478,915 | |
| ASGN, Inc. (a) | 103,224 | 11,580,701 | |
| Barrett Business Services, Inc. | 2,525 | 195,688 | |
| Booz Allen Hamilton Holding Corp. Class A | 73,137 | 5,990,652 | |
| CACI International, Inc. Class A (a) | 15,880 | 4,089,735 | |
| CoStar Group, Inc. (a) | 82,563 | 6,996,389 | |
| Dun & Bradstreet Holdings, Inc. (a) | 622,929 | 11,418,289 | |
| Exponent, Inc. | 17,091 | 1,997,938 | |
| FTI Consulting, Inc. (a) | 31,948 | 4,463,455 | |
| Jacobs Engineering Group, Inc. | 39,610 | 5,345,766 | |
| Kforce, Inc. | 6,408 | 374,355 | |
| Korn Ferry | 186,345 | 13,172,728 | |
| LegalZoom.com, Inc. | 46,500 | 1,591,695 | |
| Manpower, Inc. | 78,245 | 9,500,508 | |
| Nielsen Holdings PLC | 94,595 | 2,030,009 | |
| Robert Half International, Inc. | 167,502 | 17,319,707 | |
| Science Applications Internati | 88,216 | 7,430,434 | |
| TransUnion Holding Co., Inc. | 128,270 | 15,588,653 | |
| TriNet Group, Inc. (a) | 324,672 | 29,895,798 | |
| 183,308,454 | |||
| Road & Rail - 0.9% | |||
| ArcBest Corp. | 43,500 | 2,902,755 | |
| Daseke, Inc. (a) | 942,330 | 8,905,019 | |
| Heartland Express, Inc. | 219,837 | 3,688,865 | |
| HyreCar, Inc. (a) | 126,426 | 1,421,028 | |
| Knight-Swift Transportation Holdings, Inc. Class A | 466,390 | 24,219,633 | |
| Landstar System, Inc. | 92,160 | 15,485,645 | |
| Saia, Inc. (a) | 16,420 | 3,942,935 | |
| TFI International, Inc. | 51,090 | 5,778,279 | |
| Werner Enterprises, Inc. | 49,013 | 2,311,453 | |
| XPO Logistics, Inc. (a) | 100,748 | 8,756,009 | |
| Yellow Corp. (a) | 340,768 | 2,075,277 | |
| 79,486,898 | |||
| Trading Companies & Distributors - 1.1% | |||
| Air Lease Corp. Class A | 18,200 | 723,268 | |
| Alta Equipment Group, Inc. (a) | 585,956 | 7,769,777 | |
| BlueLinx Corp. (a)(c) | 192,025 | 11,052,959 | |
| Boise Cascade Co. | 12,934 | 748,232 | |
| Custom Truck One Source, Inc. Class A (a)(c) | 544,128 | 4,663,177 | |
| EVI Industries, Inc. (a)(c) | 148,989 | 3,623,412 | |
| GATX Corp. | 52,570 | 4,819,618 | |
| H&E Equipment Services, Inc. | 38,550 | 1,312,628 | |
| Herc Holdings, Inc. (a) | 84,810 | 11,148,275 | |
| MRC Global, Inc. (a) | 624,777 | 5,123,171 | |
| MSC Industrial Direct Co., Inc. Class A | 35,892 | 3,022,465 | |
| SiteOne Landscape Supply, Inc. (a) | 62,601 | 12,526,460 | |
| Triton International Ltd. | 288,705 | 15,797,938 | |
| United Rentals, Inc. (a) | 11,100 | 3,914,415 | |
| Univar, Inc. (a) | 73,303 | 1,730,684 | |
| Watsco, Inc. | 10,844 | 3,019,186 | |
| WESCO International, Inc. (a) | 125,800 | 14,721,116 | |
| 105,716,781 | |||
| Transportation Infrastructure - 0.0% | |||
| Macquarie Infrastructure Co. LLC (a) | 24,197 | 964,250 | |
| TOTAL INDUSTRIALS | 1,534,710,910 | ||
| INFORMATION TECHNOLOGY - 15.0% | |||
| Communications Equipment - 0.4% | |||
| Ciena Corp. (a) | 58,400 | 3,336,392 | |
| CommScope Holding Co., Inc. (a) | 308,161 | 4,868,944 | |
| DZS, Inc. (a) | 239,615 | 3,309,083 | |
| F5 Networks, Inc. (a) | 17,400 | 3,542,118 | |
| Juniper Networks, Inc. | 318,576 | 9,232,332 | |
| Lumentum Holdings, Inc. (a) | 90,890 | 7,874,710 | |
| NETGEAR, Inc. (a) | 10,052 | 359,158 | |
| Radware Ltd. (a) | 123,321 | 4,227,444 | |
| 36,750,181 | |||
| Electronic Equipment & Components - 2.3% | |||
| Arrow Electronics, Inc. (a) | 112,168 | 13,597,005 | |
| Avnet, Inc. | 319,436 | 12,924,381 | |
| Badger Meter, Inc. | 9,608 | 1,028,921 | |
| Belden, Inc. | 772,122 | 44,203,985 | |
| Cognex Corp. | 245,920 | 21,793,430 | |
| CTS Corp. | 10,663 | 374,058 | |
| ePlus, Inc. (a) | 47,714 | 5,163,609 | |
| Flex Ltd. (a) | 180,501 | 3,353,709 | |
| Identiv, Inc. (a) | 576,720 | 10,242,547 | |
| Insight Enterprises, Inc. (a) | 76,115 | 7,831,472 | |
| IPG Photonics Corp. (a) | 11,835 | 2,019,998 | |
| Jabil, Inc. | 199,800 | 12,343,644 | |
| Kimball Electronics, Inc. (a) | 8,310 | 200,853 | |
| Littelfuse, Inc. | 20,226 | 5,772,500 | |
| Methode Electronics, Inc. Class A | 72,400 | 3,371,668 | |
| Napco Security Technolgies, Inc. (a) | 3,890 | 152,216 | |
| Novanta, Inc. (a) | 50,959 | 7,807,938 | |
| OSI Systems, Inc. (a) | 9,700 | 959,718 | |
| Powerfleet, Inc. (a) | 926,170 | 6,594,330 | |
| Rogers Corp. (a) | 6,163 | 1,309,083 | |
| Sanmina Corp. (a) | 184,511 | 7,284,494 | |
| ScanSource, Inc. (a) | 80,091 | 2,849,638 | |
| SYNNEX Corp. | 134,260 | 17,060,418 | |
| Trimble, Inc. (a) | 190,479 | 17,946,931 | |
| TTM Technologies, Inc. (a) | 206,100 | 2,885,400 | |
| Vishay Intertechnology, Inc. | 248,300 | 5,455,151 | |
| 214,527,097 | |||
| IT Services - 3.0% | |||
| Amdocs Ltd. | 152,461 | 11,744,071 | |
| Broadridge Financial Solutions, Inc. | 84,279 | 14,514,529 | |
| Cass Information Systems, Inc. | 3,949 | 178,021 | |
| Computer Services, Inc. | 133,471 | 7,741,318 | |
| Concentrix Corp. (a) | 92,621 | 16,059,555 | |
| CSG Systems International, Inc. | 10,745 | 518,016 | |
| Digitalocean Holdings, Inc. (a) | 62,648 | 3,864,129 | |
| DXC Technology Co. (a) | 163,984 | 6,021,492 | |
| Euronet Worldwide, Inc. (a) | 243,363 | 32,423,252 | |
| EVERTEC, Inc. | 116,763 | 5,400,289 | |
| EVO Payments, Inc. Class A (a) | 15,290 | 388,978 | |
| Gartner, Inc. (a) | 2,600 | 802,724 | |
| Genpact Ltd. | 125,670 | 6,519,760 | |
| GoDaddy, Inc. (a) | 12,500 | 916,375 | |
| Hackett Group, Inc. | 8,916 | 174,754 | |
| International Money Express, Inc. (a) | 771,108 | 14,065,010 | |
| Jack Henry & Associates, Inc. | 67,578 | 11,919,408 | |
| Maximus, Inc. | 107,450 | 9,357,821 | |
| MoneyGram International, Inc. (a) | 1,857,510 | 16,699,015 | |
| MongoDB, Inc. Class A (a) | 25,650 | 10,050,440 | |
| Perficient, Inc. (a) | 10,890 | 1,298,306 | |
| PFSweb, Inc. (a) | 679,885 | 9,042,471 | |
| Rackspace Technology, Inc. (a)(c) | 480,521 | 6,712,878 | |
| Shift4 Payments, Inc. (a) | 109,055 | 9,347,104 | |
| SolarWinds, Inc. | 396,362 | 6,765,899 | |
| The Western Union Co. | 154,700 | 3,347,708 | |
| Ttec Holdings, Inc. | 39,000 | 4,112,940 | |
| Unisys Corp. (a) | 1,211,401 | 29,328,018 | |
| WEX, Inc. (a) | 101,401 | 18,614,182 | |
| Wix.com Ltd. (a) | 62,735 | 13,932,189 | |
| WNS Holdings Ltd. sponsored ADR (a) | 143,072 | 11,866,392 | |
| 283,727,044 | |||
| Semiconductors & Semiconductor Equipment - 2.4% | |||
| Amkor Technology, Inc. | 391,000 | 10,740,770 | |
| Brooks Automation, Inc. | 23,626 | 2,007,265 | |
| Cirrus Logic, Inc. (a) | 18,981 | 1,588,140 | |
| CMC Materials, Inc. | 78,489 | 10,409,211 | |
| CyberOptics Corp. (a) | 99,618 | 4,188,937 | |
| Diodes, Inc. (a) | 31,800 | 3,079,194 | |
| Enphase Energy, Inc. (a) | 21,040 | 3,655,279 | |
| Entegris, Inc. | 89,372 | 10,737,152 | |
| Himax Technologies, Inc. sponsored ADR (c) | 368,330 | 4,335,244 | |
| Impinj, Inc. (a) | 12,278 | 715,685 | |
| Kulicke & Soffa Industries, Inc. | 121,894 | 8,555,740 | |
| Lattice Semiconductor Corp. (a) | 182,346 | 11,327,334 | |
| MACOM Technology Solutions Holdings, Inc. (a) | 151,810 | 9,216,385 | |
| MaxLinear, Inc. Class A (a) | 170,184 | 8,888,710 | |
| MKS Instruments, Inc. | 26,560 | 3,909,101 | |
| Monolithic Power Systems, Inc. | 51,028 | 25,255,288 | |
| NVE Corp. | 1,586 | 111,353 | |
| ON Semiconductor Corp. (a) | 1,616,008 | 71,686,115 | |
| Power Integrations, Inc. | 19,815 | 2,152,702 | |
| Semtech Corp. (a) | 192,669 | 13,471,416 | |
| SiTime Corp. (a) | 22,210 | 4,727,176 | |
| SolarEdge Technologies, Inc. (a) | 2,500 | 724,450 | |
| Synaptics, Inc. (a) | 41,745 | 7,922,366 | |
| Ultra Clean Holdings, Inc. (a) | 113,592 | 5,252,494 | |
| Universal Display Corp. | 39,539 | 8,247,440 | |
| 232,904,947 | |||
| Software - 6.2% | |||
| 8x8, Inc. (a) | 399,394 | 9,645,365 | |
| ACI Worldwide, Inc. (a) | 463,557 | 14,940,442 | |
| American Software, Inc. Class A | 10,146 | 257,404 | |
| Anaplan, Inc. (a) | 16,800 | 1,007,664 | |
| Aspen Technology, Inc. (a) | 98,137 | 12,708,742 | |
| Avalara, Inc. (a) | 47,723 | 8,575,823 | |
| Avaya Holdings Corp. (a) | 535,277 | 10,796,537 | |
| Black Knight, Inc. (a) | 181,210 | 13,712,161 | |
| Blackbaud, Inc. (a) | 10,700 | 745,683 | |
| CDK Global, Inc. | 354,502 | 14,747,283 | |
| Ceridian HCM Holding, Inc. (a) | 14,000 | 1,572,900 | |
| ChannelAdvisor Corp. (a) | 177,700 | 4,552,674 | |
| CommVault Systems, Inc. (a) | 73,830 | 5,978,015 | |
| Cornerstone OnDemand, Inc. (a) | 62,969 | 3,608,124 | |
| Couchbase, Inc. | 2,633 | 132,256 | |
| Coupa Software, Inc. (a) | 8,820 | 2,159,224 | |
| Dolby Laboratories, Inc. Class A | 51,020 | 5,056,592 | |
| Domo, Inc. Class B (a) | 168,932 | 15,119,414 | |
| Dynatrace, Inc. (a) | 243,670 | 16,747,439 | |
| Elastic NV (a) | 6,300 | 1,005,165 | |
| Enghouse Systems Ltd. | 179,651 | 8,690,287 | |
| Fair Isaac Corp. (a) | 8,070 | 3,710,102 | |
| FireEye, Inc. (a) | 339,549 | 6,176,396 | |
| Five9, Inc. (a) | 28,400 | 4,493,732 | |
| GTY Technology Holdings, Inc. (a) | 640,265 | 4,725,156 | |
| Guidewire Software, Inc. (a) | 100,198 | 11,869,455 | |
| HubSpot, Inc. (a) | 10,017 | 6,856,336 | |
| InterDigital, Inc. | 81,579 | 5,882,662 | |
| j2 Global, Inc. (a) | 693,725 | 95,525,933 | |
| Kaleyra, Inc. (a) | 477,132 | 5,863,952 | |
| LivePerson, Inc. (a) | 92,360 | 5,920,276 | |
| Manhattan Associates, Inc. (a) | 72,743 | 11,856,382 | |
| Microsoft Corp. | 17,230 | 5,201,392 | |
| Mimecast Ltd. (a) | 397,961 | 27,781,657 | |
| Momentive Global, Inc. (a) | 545,440 | 10,696,078 | |
| Monday.com Ltd. (c) | 10,237 | 3,883,508 | |
| N-able, Inc. (a) | 598,872 | 8,102,738 | |
| nCino, Inc. (a) | 95,370 | 5,913,894 | |
| New Relic, Inc. (a) | 161,722 | 12,932,908 | |
| NortonLifeLock, Inc. | 32,300 | 857,888 | |
| Nuance Communications, Inc. (a) | 237,434 | 13,070,742 | |
| Paylocity Holding Corp. (a) | 12,378 | 3,332,158 | |
| Proofpoint, Inc. (a) | 158,075 | 27,821,200 | |
| PTC, Inc. (a) | 184,893 | 24,343,012 | |
| Q2 Holdings, Inc. (a) | 183,181 | 16,136,414 | |
| Qualys, Inc. (a) | 45,718 | 5,366,379 | |
| Rimini Street, Inc. (a) | 411,411 | 3,928,975 | |
| RingCentral, Inc. (a) | 33,020 | 8,329,625 | |
| Smartsheet, Inc. (a) | 203,723 | 16,210,239 | |
| SS&C Technologies Holdings, Inc. | 227,929 | 17,245,108 | |
| Sumo Logic, Inc. | 289,824 | 6,042,830 | |
| Synchronoss Technologies, Inc. (a) | 484,954 | 1,285,128 | |
| Tenable Holdings, Inc. (a) | 162,041 | 7,189,759 | |
| The Trade Desk, Inc. (a) | 39,601 | 3,170,060 | |
| Tyler Technologies, Inc. (a) | 26,080 | 12,667,056 | |
| Varonis Systems, Inc. (a) | 197,210 | 13,609,462 | |
| Vonage Holdings Corp. (a) | 285,901 | 4,031,204 | |
| Workiva, Inc. (a) | 4,800 | 673,296 | |
| Zendesk, Inc. (a) | 75,110 | 9,283,596 | |
| 583,745,882 | |||
| Technology Hardware, Storage & Peripherals - 0.7% | |||
| Avid Technology, Inc. (a) | 245,640 | 6,339,968 | |
| Diebold Nixdorf, Inc. (a) | 1,568,110 | 17,061,037 | |
| NCR Corp. (a) | 605,608 | 25,726,228 | |
| NetApp, Inc. | 45,738 | 4,067,480 | |
| Seagate Technology Holdings PLC | 93,300 | 8,172,147 | |
| Western Digital Corp. (a) | 56,184 | 3,550,829 | |
| Xerox Holdings Corp. | 164,201 | 3,696,165 | |
| 68,613,854 | |||
| TOTAL INFORMATION TECHNOLOGY | 1,420,269,005 | ||
| MATERIALS - 3.9% | |||
| Chemicals - 1.3% | |||
| Axalta Coating Systems Ltd. (a) | 652,014 | 19,912,508 | |
| Balchem Corp. | 10,692 | 1,501,371 | |
| Cabot Corp. | 95,800 | 5,115,720 | |
| Chase Corp. | 2,427 | 277,892 | |
| Eastman Chemical Co. | 25,900 | 2,930,844 | |
| Ecovyst, Inc. | 166,407 | 2,164,955 | |
| Element Solutions, Inc. | 33,700 | 766,001 | |
| FMC Corp. | 27,911 | 2,613,307 | |
| GCP Applied Technologies, Inc. (a) | 248,547 | 5,925,360 | |
| Huntsman Corp. | 338,798 | 8,954,431 | |
| Ingevity Corp. (a) | 152,854 | 12,287,933 | |
| Innospec, Inc. | 67,994 | 6,364,238 | |
| Minerals Technologies, Inc. | 37,719 | 2,966,222 | |
| NewMarket Corp. | 2,413 | 843,898 | |
| Olin Corp. | 30,414 | 1,515,834 | |
| Orion Engineered Carbons SA (a) | 308,636 | 5,453,598 | |
| RPM International, Inc. | 42,920 | 3,531,887 | |
| Sensient Technologies Corp. | 13,979 | 1,214,076 | |
| The Chemours Co. LLC | 183,400 | 6,145,734 | |
| The Mosaic Co. | 138,300 | 4,450,494 | |
| Tredegar Corp. | 8,447 | 112,176 | |
| Trinseo SA | 183,731 | 9,541,151 | |
| Tronox Holdings PLC | 287,546 | 6,075,847 | |
| Valvoline, Inc. | 418,258 | 12,614,661 | |
| 123,280,138 | |||
| Construction Materials - 0.0% | |||
| Eagle Materials, Inc. | 13,837 | 2,170,195 | |
| Summit Materials, Inc. (a) | 36,900 | 1,242,423 | |
| 3,412,618 | |||
| Containers & Packaging - 1.9% | |||
| Aptargroup, Inc. | 145,507 | 19,614,344 | |
| Berry Global Group, Inc. (a) | 676,501 | 45,440,572 | |
| CCL Industries, Inc. Class B | 303,755 | 17,339,544 | |
| Crown Holdings, Inc. | 118,945 | 13,058,972 | |
| Graphic Packaging Holding Co. | 1,006,305 | 20,649,379 | |
| Greif, Inc. Class A | 139,208 | 8,814,651 | |
| O-I Glass, Inc. (a) | 222,299 | 3,363,384 | |
| Pactiv Evergreen, Inc. | 395,862 | 5,443,103 | |
| Ranpak Holdings Corp. (A Shares) (a) | 388,378 | 11,923,205 | |
| Sealed Air Corp. | 193,609 | 11,815,957 | |
| Silgan Holdings, Inc. | 174,000 | 7,382,820 | |
| Sonoco Products Co. | 33,142 | 2,164,173 | |
| WestRock Co. | 211,381 | 11,000,267 | |
| 178,010,371 | |||
| Metals & Mining - 0.5% | |||
| Arconic Corp. (a) | 36,530 | 1,259,920 | |
| Carpenter Technology Corp. | 263,065 | 8,773,218 | |
| Commercial Metals Co. | 263,520 | 8,596,022 | |
| Ferroglobe Representation & Warranty Insurance (a)(d) | 495,885 | 5 | |
| Reliance Steel & Aluminum Co. | 146,553 | 21,988,812 | |
| Royal Gold, Inc. | 21,645 | 2,409,738 | |
| Steel Dynamics, Inc. | 99,900 | 6,742,251 | |
| Worthington Industries, Inc. | 11,364 | 658,544 | |
| 50,428,510 | |||
| Paper & Forest Products - 0.2% | |||
| Domtar Corp. (a) | 37,868 | 2,076,302 | |
| Louisiana-Pacific Corp. | 10,400 | 659,776 | |
| Neenah, Inc. | 5,565 | 280,420 | |
| Resolute Forest Products | 210,100 | 2,573,725 | |
| Schweitzer-Mauduit International, Inc. | 142,263 | 5,444,405 | |
| West Fraser Timber Co. Ltd. | 90,472 | 6,979,010 | |
| 18,013,638 | |||
| TOTAL MATERIALS | 373,145,275 | ||
| REAL ESTATE - 3.0% | |||
| Equity Real Estate Investment Trusts (REITs) - 2.8% | |||
| American Campus Communities, Inc. | 313,636 | 15,948,391 | |
| Americold Realty Trust | 50,995 | 1,873,556 | |
| Brandywine Realty Trust (SBI) | 338,200 | 4,694,216 | |
| Brixmor Property Group, Inc. | 313,300 | 7,346,885 | |
| Broadstone Net Lease, Inc. | 278,320 | 7,625,968 | |
| Camden Property Trust (SBI) | 81,413 | 12,215,207 | |
| City Office REIT, Inc. | 286,467 | 4,574,878 | |
| CorEnergy Infrastructure Trust, Inc. | 84,100 | 405,362 | |
| CoreSite Realty Corp. | 21,811 | 3,236,098 | |
| Cousins Properties, Inc. | 419,576 | 16,178,851 | |
| CubeSmart | 489,581 | 26,192,584 | |
| CyrusOne, Inc. | 14,200 | 1,093,116 | |
| DiamondRock Hospitality Co. (a) | 394,700 | 3,568,088 | |
| Diversified Healthcare Trust (SBI) | 104,200 | 390,750 | |
| EastGroup Properties, Inc. | 76,531 | 13,795,478 | |
| Franklin Street Properties Corp. | 275,093 | 1,320,446 | |
| Gaming & Leisure Properties | 54,800 | 2,701,640 | |
| Global Net Lease, Inc. | 190,184 | 3,233,128 | |
| Industrial Logistics Properties Trust | 136,179 | 3,735,390 | |
| Lexington Corporate Properties Trust | 81,500 | 1,102,695 | |
| MGM Growth Properties LLC | 268,790 | 11,144,033 | |
| Mid-America Apartment Communities, Inc. | 71,357 | 13,726,946 | |
| National Retail Properties, Inc. | 271,019 | 12,903,215 | |
| Office Properties Income Trust | 132,285 | 3,509,521 | |
| Omega Healthcare Investors, Inc. | 192,800 | 6,464,584 | |
| Outfront Media, Inc. | 492,533 | 12,195,117 | |
| Physicians Realty Trust | 630,119 | 11,663,503 | |
| Piedmont Office Realty Trust, Inc. Class A | 383,800 | 6,839,316 | |
| Plymouth Industrial REIT, Inc. | 37,700 | 888,212 | |
| Preferred Apartment Communities, Inc. Class A | 193,740 | 2,417,875 | |
| Retail Value, Inc. | 40,565 | 1,014,125 | |
| RLJ Lodging Trust | 538,176 | 7,765,880 | |
| Sabra Health Care REIT, Inc. | 317,800 | 5,084,800 | |
| Safehold, Inc. | 51,696 | 4,632,479 | |
| Service Properties Trust | 254,722 | 2,911,472 | |
| Spirit Realty Capital, Inc. | 55,289 | 2,862,312 | |
| Stag Industrial, Inc. | 288,295 | 12,180,464 | |
| Summit Hotel Properties, Inc. (a) | 198,800 | 1,852,816 | |
| Tanger Factory Outlet Centers, Inc. (c) | 158,900 | 2,656,808 | |
| Uniti Group, Inc. | 288,500 | 3,770,695 | |
| Urstadt Biddle Properties, Inc. Class A | 106,749 | 2,036,771 | |
| 259,753,671 | |||
| Real Estate Management & Development - 0.2% | |||
| Cushman & Wakefield PLC (a) | 564,163 | 10,233,917 | |
| Howard Hughes Corp. (a) | 9,300 | 841,929 | |
| Jones Lang LaSalle, Inc. (a) | 9,901 | 2,400,299 | |
| Newmark Group, Inc. | 203,111 | 2,766,372 | |
| Opendoor Technologies, Inc. (a)(c) | 20,600 | 365,238 | |
| Rafael Holdings, Inc. (a) | 46,526 | 1,947,113 | |
| Realogy Holdings Corp. (a) | 138,227 | 2,425,884 | |
| 20,980,752 | |||
| TOTAL REAL ESTATE | 280,734,423 | ||
| UTILITIES - 1.0% | |||
| Electric Utilities - 0.4% | |||
| IDACORP, Inc. | 132,361 | 13,944,231 | |
| NRG Energy, Inc. | 220,200 | 10,056,534 | |
| OGE Energy Corp. | 68,390 | 2,421,690 | |
| Pinnacle West Capital Corp. | 71,899 | 5,529,033 | |
| 31,951,488 | |||
| Gas Utilities - 0.3% | |||
| Atmos Energy Corp. | 125,930 | 12,279,434 | |
| National Fuel Gas Co. | 107,300 | 5,559,213 | |
| South Jersey Industries, Inc. | 22,100 | 548,301 | |
| Southwest Gas Corp. | 106,892 | 7,515,577 | |
| UGI Corp. | 123,200 | 5,705,392 | |
| 31,607,917 | |||
| Independent Power and Renewable Electricity Producers - 0.2% | |||
| Brookfield Renewable Corp. | 11,500 | 503,815 | |
| Sunnova Energy International, Inc. (a) | 12,900 | 466,980 | |
| The AES Corp. | 142,388 | 3,398,802 | |
| Vistra Corp. | 770,263 | 14,704,321 | |
| 19,073,918 | |||
| Multi-Utilities - 0.1% | |||
| CenterPoint Energy, Inc. | 108,671 | 2,726,555 | |
| MDU Resources Group, Inc. | 281,100 | 9,042,987 | |
| 11,769,542 | |||
| TOTAL UTILITIES | 94,402,865 | ||
| TOTAL COMMON STOCKS | |||
| (Cost $5,068,339,142) | 7,763,147,102 | ||
| Equity Funds - 15.7% | |||
| Mid-Cap Blend Funds - 1.2% | |||
| Fidelity SAI Small-Mid Cap 500 Index Fund (e) | 6,722,332 | 113,204,066 | |
| Sector Funds - 1.1% | |||
| Fidelity SAI Real Estate Index Fund (e) | 7,253,200 | 97,483,008 | |
| Small Blend Funds - 9.2% | |||
| Fidelity Small Cap Discovery Fund (e) | 2,202,074 | 66,590,722 | |
| Fidelity Small Cap Index Fund (e) | 23,209,374 | 669,822,518 | |
| PIMCO StocksPLUS Small Fund Institutional Class | 5,722,963 | 67,359,273 | |
| Vulcan Value Partners Small Cap Fund | 2,642,673 | 70,506,512 | |
| TOTAL SMALL BLEND FUNDS | 874,279,025 | ||
| Small Growth Funds - 4.2% | |||
| Fidelity Advisor Small Cap Growth Fund - Class Z (e) | 4,389,109 | 173,764,825 | |
| T. Rowe Price Institutional Small-Cap Stock Fund | 6,303,055 | 223,254,207 | |
| TOTAL SMALL GROWTH FUNDS | 397,019,032 | ||
| TOTAL EQUITY FUNDS | |||
| (Cost $1,080,241,830) | 1,481,985,131 | ||
| Money Market Funds - 3.1% | |||
| Fidelity Cash Central Fund 0.06% (f) | 2,764,932 | 2,765,485 | |
| Fidelity Securities Lending Cash Central Fund 0.06% (f)(g) | 72,961,423 | 72,968,719 | |
| State Street Institutional U.S. Government Money Market Fund Premier Class 0.03% (h) | 216,850,530 | 216,850,530 | |
| TOTAL MONEY MARKET FUNDS | |||
| (Cost $292,584,733) | 292,584,734 | ||
| TOTAL INVESTMENT IN SECURITIES - 100.7% | |||
| (Cost $6,441,165,705) | 9,537,716,967 | ||
| NET OTHER ASSETS (LIABILITIES) - (0.7)% | (63,440,090) | ||
| NET ASSETS - 100% | $9,474,276,877 |
| Futures Contracts | |||||
| Number of contracts | Expiration Date | Notional Amount | Value | Unrealized Appreciation/(Depreciation) | |
| Purchased | |||||
| Equity Index Contracts | |||||
| CME E-mini Russell 2000 Index Contracts (United States) | 3 | Sept. 2021 | $340,680 | $7,928 | $7,928 |
| CME E-mini S&P MidCap 400 Index Contracts (United States) | 3 | Sept. 2021 | 825,600 | 12,232 | 12,232 |
| TOTAL FUTURES CONTRACTS | $20,160 |
The notional amount of futures purchased as a percentage of Net Assets is 0.0%
Legend
(a) Non-income producing
(b) Security exempt from registration under Rule 144A of the Securities Act of 1933. These securities may be resold in transactions exempt from registration, normally to qualified institutional buyers. At the end of the period, the value of these securities amounted to $10,890,699 or 0.1% of net assets.
(c) Security or a portion of the security is on loan at period end.
(d) Level 3 security
(e) Affiliated Fund
(f) Affiliated fund that is generally available only to investment companies and other accounts managed by Fidelity Investments. The rate quoted is the annualized seven-day yield of the fund at period end. A complete unaudited listing of the fund's holdings as of its most recent quarter end is available upon request. In addition, each Fidelity Central Fund's financial statements are available on the SEC's website or upon request.
(g) Investment made with cash collateral received from securities on loan.
(h) The rate quoted is the annualized seven-day yield of the fund at period end.
Affiliated Central Funds
Fiscal year to date information regarding the Fund's investments in Fidelity Central Funds, including the ownership percentage, is presented below.
| Fund | Value, beginning of period | Purchases | Sales Proceeds | Dividend Income | Realized Gain/Loss | Change in Unrealized appreciation (depreciation) | Value, end of period | % ownership, end of period |
| Fidelity Cash Central Fund 0.06% | $2,282,550 | $52,920,253 | $52,437,319 | $610 | $-- | $1 | $2,765,485 | 0.0% |
| Fidelity Securities Lending Cash Central Fund 0.06% | 94,022,136 | 411,760,138 | 432,813,555 | 695,990 | -- | -- | 72,968,719 | 0.2% |
| Total | $96,304,686 | $464,680,391 | $485,250,874 | $696,600 | $-- | $1 | $75,734,204 |
Amounts in the income column in the above table include any capital gain distributions from underlying funds, which are presented in the corresponding line-item in the Statement of Operations, if applicable. Amount for Fidelity Securities Lending Cash Central Fund represents the income earned on investing cash collateral, less rebates paid to borrowers and any lending agent fees associated with the loan, plus any premium payments received for lending certain types of securities.
Affiliated Underlying Funds
Fiscal year to date information regarding the Fund's investments in affiliated Underlying Funds is presented below. Exchanges between classes of the same affiliated Underlying Funds may occur. If an underlying Fund changes its name, the name presented below is the name in effect at period end.
| Affiliate | Value, beginning of period | Purchases | Sales Proceeds | Dividend Income | Realized Gain (loss) | Change in Unrealized appreciation (depreciation) | Value, end of period |
| Fidelity Advisor Small Cap Growth Fund - Class Z | $-- | $-- | $-- | $-- | $-- | $21,820,209 | $173,764,825 |
| Fidelity SAI Real Estate Index Fund | 78,038,248 | 7,253 | -- | 7,253 | -- | 19,437,507 | 97,483,008 |
| Fidelity SAI Small-Mid Cap 500 Index Fund | 20,199,891 | 88,311,697 | -- | -- | -- | 4,692,478 | 113,204,066 |
| Fidelity Small Cap Discovery Fund | 57,016,149 | 1,906,237 | -- | 1,906,237 | -- | 7,668,336 | 66,590,722 |
| Fidelity Small Cap Growth Fund | 92,619,147 | 69,221,471 | -- | -- | -- | (9,896,002) | -- |
| Fidelity Small Cap Index Fund | 519,600,894 | 445,945,776 | 316,416,058 | 1,450,142 | (1,164,810) | 21,856,716 | 669,822,518 |
| Total | $767,474,329 | $605,392,434 | $316,416,058 | $3,363,632 | $(1,164,810) | $65,579,244 | $1,120,865,139 |
Investment Valuation
The following is a summary of the inputs used, as of August 31, 2021, involving the Fund's assets and liabilities carried at fair value. The inputs or methodology used for valuing securities may not be an indication of the risk associated with investing in those securities. For more information on valuation inputs, and their aggregation into the levels used below, please refer to the Investment Valuation section in the accompanying Notes to Financial Statements.
| Valuation Inputs at Reporting Date: | ||||
| Description | Total | Level 1 | Level 2 | Level 3 |
| Investments in Securities: | ||||
| Equities: | ||||
| Communication Services | $156,443,945 | $156,443,945 | $-- | $-- |
| Consumer Discretionary | 1,246,541,105 | 1,246,541,105 | -- | -- |
| Consumer Staples | 309,501,077 | 309,370,635 | 130,442 | -- |
| Energy | 187,077,589 | 187,077,589 | -- | -- |
| Financials | 1,147,752,376 | 1,147,752,376 | -- | -- |
| Health Care | 1,012,568,532 | 1,012,568,532 | -- | -- |
| Industrials | 1,534,710,910 | 1,534,710,910 | -- | -- |
| Information Technology | 1,420,269,005 | 1,420,269,005 | -- | -- |
| Materials | 373,145,275 | 373,145,270 | -- | 5 |
| Real Estate | 280,734,423 | 280,734,423 | -- | -- |
| Utilities | 94,402,865 | 94,402,865 | -- | -- |
| Equity Funds | 1,481,985,131 | 1,481,985,131 | -- | -- |
| Money Market Funds | 292,584,734 | 292,584,734 | -- | -- |
| Total Investments in Securities: | $9,537,716,967 | $9,537,586,520 | $130,442 | $5 |
| Derivative Instruments: | ||||
| Assets | ||||
| Futures Contracts | $20,160 | $20,160 | $-- | $-- |
| Total Assets | $20,160 | $20,160 | $-- | $-- |
| Total Derivative Instruments: | $20,160 | $20,160 | $-- | $-- |
Value of Derivative Instruments
The following table is a summary of the Fund's value of derivative instruments by primary risk exposure as of August 31, 2021. For additional information on derivative instruments, please refer to the Derivative Instruments section in the accompanying Notes to Financial Statements.
| Primary Risk Exposure / Derivative Type | Value | |
| Asset | Liability | |
| Equity Risk | ||
| Futures Contracts(a) | $20,160 | $0 |
| Total Equity Risk | 20,160 | 0 |
| Total Value of Derivatives | $20,160 | $0 |
(a) Reflects gross cumulative appreciation (depreciation) on futures contracts as presented in the Schedule of Investments. In the Statement of Assets and Liabilities, the period end daily variation margin is included in receivable or payable for daily variation margin on futures contracts, and the net cumulative appreciation (depreciation) is included in Total accumulated earnings (loss).
See accompanying notes which are an integral part of the financial statements.
Financial Statements
Statement of Assets and Liabilities
| August 31, 2021 (Unaudited) | ||
| Assets | ||
| Investment in securities, at value (including securities loaned of $70,451,482) — See accompanying schedule: Unaffiliated issuers (cost $5,522,233,253) | $8,341,117,624 | |
| Fidelity Central Funds (cost $75,734,203) | 75,734,204 | |
| Other affiliated issuers (cost $843,198,249) | 1,120,865,139 | |
| Total Investment in Securities (cost $6,441,165,705) | $9,537,716,967 | |
| Segregated cash with brokers for derivative instruments | 60,000 | |
| Cash | 1,724,504 | |
| Foreign currency held at value (cost $71,766) | 71,343 | |
| Receivable for investments sold | 16,681,493 | |
| Receivable for fund shares sold | 3,958,596 | |
| Dividends receivable | 5,006,265 | |
| Interest receivable | 3,905 | |
| Distributions receivable from Fidelity Central Funds | 75,931 | |
| Prepaid expenses | 16,027 | |
| Other receivables | 127,796 | |
| Total assets | 9,565,442,827 | |
| Liabilities | ||
| Payable for investments purchased | $12,328,140 | |
| Payable for fund shares redeemed | 2,974,783 | |
| Accrued management fee | 2,687,694 | |
| Payable for daily variation margin on futures contracts | 1,410 | |
| Other payables and accrued expenses | 212,637 | |
| Collateral on securities loaned | 72,961,286 | |
| Total liabilities | 91,165,950 | |
| Net Assets | $9,474,276,877 | |
| Net Assets consist of: | ||
| Paid in capital | $5,691,940,006 | |
| Total accumulated earnings (loss) | 3,782,336,871 | |
| Net Assets | $9,474,276,877 | |
| Net Asset Value, offering price and redemption price per share ($9,474,276,877 ÷ 509,511,215 shares) | $18.59 |
See accompanying notes which are an integral part of the financial statements.
Statement of Operations
| Six months ended August 31, 2021 (Unaudited) | ||
| Investment Income | ||
| Dividends: | ||
| Unaffiliated issuers | $64,833,462 | |
| Affiliated issuers | 1,308,116 | |
| Interest | 18,827 | |
| Income from Fidelity Central Funds (including $695,990 from security lending) | 696,600 | |
| Total income | 66,857,005 | |
| Expenses | ||
| Management fee | $28,181,849 | |
| Custodian fees and expenses | 81,201 | |
| Independent trustees' fees and expenses | 35,849 | |
| Registration fees | 82,059 | |
| Audit | 57,034 | |
| Legal | 17,585 | |
| Interest | 3,331 | |
| Miscellaneous | 26,718 | |
| Total expenses before reductions | 28,485,626 | |
| Expense reductions | (11,793,993) | |
| Total expenses after reductions | 16,691,633 | |
| Net investment income (loss) | 50,165,372 | |
| Realized and Unrealized Gain (Loss) | ||
| Net realized gain (loss) on: | ||
| Investment securities: | ||
| Unaffiliated issuers | 690,960,783 | |
| Affiliated issuers | (1,164,810) | |
| Foreign currency transactions | (59,429) | |
| Futures contracts | 83,653 | |
| Capital gain distributions from underlying funds: | ||
| Affiliated issuers | 2,055,516 | |
| Total net realized gain (loss) | 691,875,713 | |
| Change in net unrealized appreciation (depreciation) on: | ||
| Investment securities: | ||
| Unaffiliated issuers | 101,884,915 | |
| Fidelity Central Funds | 1 | |
| Other affiliated issuers | 65,579,244 | |
| Assets and liabilities in foreign currencies | (932) | |
| Futures contracts | (26,622) | |
| Total change in net unrealized appreciation (depreciation) | 167,436,606 | |
| Net gain (loss) | 859,312,319 | |
| Net increase (decrease) in net assets resulting from operations | $909,477,691 |
See accompanying notes which are an integral part of the financial statements.
Statement of Changes in Net Assets
| Six months ended August 31, 2021 (Unaudited) | Year ended February 28, 2021 | |
| Increase (Decrease) in Net Assets | ||
| Operations | ||
| Net investment income (loss) | $50,165,372 | $78,405,728 |
| Net realized gain (loss) | 691,875,713 | 771,988,328 |
| Change in net unrealized appreciation (depreciation) | 167,436,606 | 2,404,171,930 |
| Net increase (decrease) in net assets resulting from operations | 909,477,691 | 3,254,565,986 |
| Distributions to shareholders | (636,463,343) | (310,122,671) |
| Share transactions | ||
| Proceeds from sales of shares | 596,228,990 | 2,503,074,522 |
| Reinvestment of distributions | 626,546,281 | 305,086,757 |
| Cost of shares redeemed | (1,047,763,054) | (3,701,700,613) |
| Net increase (decrease) in net assets resulting from share transactions | 175,012,217 | (893,539,334) |
| Total increase (decrease) in net assets | 448,026,565 | 2,050,903,981 |
| Net Assets | ||
| Beginning of period | 9,026,250,312 | 6,975,346,331 |
| End of period | $9,474,276,877 | $9,026,250,312 |
| Other Information | ||
| Shares | ||
| Sold | 32,646,996 | 204,122,349 |
| Issued in reinvestment of distributions | 35,258,654 | 22,955,068 |
| Redeemed | (57,689,054) | (269,628,288) |
| Net increase (decrease) | 10,216,596 | (42,550,871) |
See accompanying notes which are an integral part of the financial statements.
Financial Highlights
Strategic Advisers Small-Mid Cap Fund
| Six months ended (Unaudited) August 31, | Years endedFebruary 28, | |||||
| 2021 | 2021 | 2020 A | 2019 | 2018 | 2017 | |
| Selected Per–Share Data | ||||||
| Net asset value, beginning of period | $18.08 | $12.87 | $13.62 | $14.86 | $14.19 | $11.12 |
| Income from Investment Operations | ||||||
| Net investment income (loss)B | .10 | .14 | .13 | .11 | .08 | .05 |
| Net realized and unrealized gain (loss) | 1.68 | 5.63 | (.41) | .11 | 1.88 | 3.29 |
| Total from investment operations | 1.78 | 5.77 | (.28) | .22 | 1.96 | 3.34 |
| Distributions from net investment income | (.01) | (.16) | (.13) | (.11) | (.07) | (.04) |
| Distributions from net realized gain | (1.26) | (.40) | (.34) | (1.35) | (1.22) | (.22) |
| Total distributions | (1.27) | (.56) | (.47) | (1.46) | (1.29) | (.27)C |
| Net asset value, end of period | $18.59 | $18.08 | $12.87 | $13.62 | $14.86 | $14.19 |
| Total ReturnD,E | 10.18% | 46.31% | (2.40)% | 2.64% | 14.04% | 30.11% |
| Ratios to Average Net AssetsF,G | ||||||
| Expenses before reductions | .60%H | .62% | .65% | .73% | .85% | .87% |
| Expenses net of fee waivers, if any | .35%H | .37% | .40% | .48% | .60% | .62% |
| Expenses net of all reductions | .35%H | .37% | .40% | .48% | .60% | .62% |
| Net investment income (loss) | 1.06%H | 1.02% | .96% | .77% | .53% | .37% |
| Supplemental Data | ||||||
| Net assets, end of period (000 omitted) | $9,474,277 | $9,026,250 | $6,975,346 | $8,081,562 | $7,503,132 | $7,048,707 |
| Portfolio turnover rateI | 53%H | 104% | 67% | 82% | 75% | 82% |
A For the year ended February 29.
B Calculated based on average shares outstanding during the period.
C Total distributions per share do not sum due to rounding.
D Total returns for periods of less than one year are not annualized.
E Total returns would have been lower if certain expenses had not been reduced during the applicable periods shown.
F Fees and expenses of any underlying mutual funds or exchange-traded funds (ETFs) are not included in the Fund's expense ratio. The Fund indirectly bears its proportionate share of these expenses. For additional expense information related to investments in Fidelity Central Funds, please refer to the "Investments in Fidelity Central Funds" note found in the Notes to Financial Statements section of the most recent Annual or Semi-Annual report.
G Expense ratios reflect operating expenses of the class. Expenses before reductions do not reflect amounts reimbursed, waived, or reduced through arrangements with the investment advisor, brokerage services, or other offset arrangements, if applicable, and do not represent the amount paid by the class during periods when reimbursements, waivers or reductions occur.
H Annualized
I Amount does not include the portfolio activity of any underlying mutual funds or exchange-traded funds (ETFs).
See accompanying notes which are an integral part of the financial statements.
Notes to Financial Statements (Unaudited)
For the period ended August 31, 2021
1. Organization.
Strategic Advisers Small-Mid Cap Fund (the Fund) is a fund of Fidelity Rutland Square Trust II (the Trust), and is authorized to issue an unlimited number of shares. The Trust is registered under the Investment Company Act of 1940, as amended (the 1940 Act), as an open-end management investment company organized as a Delaware statutory trust. The Fund is offered exclusively to certain managed account clients of Strategic Advisers LLC (Strategic Advisers), an affiliate of Fidelity Management & Research Company LLC (FMR).
2. Significant Accounting Policies.
The Fund is an investment company and applies the accounting and reporting guidance of the Financial Accounting Standards Board (FASB) Accounting Standards Codification Topic 946 Financial Services - Investment Companies. The financial statements have been prepared in conformity with accounting principles generally accepted in the United States of America (GAAP), which require management to make certain estimates and assumptions at the date of the financial statements. Actual results could differ from those estimates. Subsequent events, if any, through the date that the financial statements were issued have been evaluated in the preparation of the financial statements. The Fund's Schedule of Investments lists any underlying mutual funds or exchange-traded funds (ETFs) but does not include the underlying holdings of these funds. The following summarizes the significant accounting policies of the Fund:
Investment Valuation. Investments are valued as of 4:00 p.m. Eastern time on the last calendar day of the period. The Board of Trustees (the Board) has delegated the day to day responsibility for the valuation of the Fund's investments to the Fair Value Committee (the Committee) established by the Fund's investment adviser. In accordance with valuation policies and procedures approved by the Board, the Fund attempts to obtain prices from one or more third party pricing vendors or brokers to value its investments. When current market prices, quotations or currency exchange rates are not readily available or reliable, investments will be fair valued in good faith by the Committee, in accordance with procedures adopted by the Board. Factors used in determining fair value vary by investment type and may include market or investment specific events. The frequency with which these procedures are used cannot be predicted and they may be utilized to a significant extent. The Committee oversees the Fund's valuation policies and procedures and reports to the Board on the Committee's activities and fair value determinations. The Board monitors the appropriateness of the procedures used in valuing the Fund's investments and ratifies the fair value determinations of the Committee.
The Fund categorizes the inputs to valuation techniques used to value its investments into a disclosure hierarchy consisting of three levels as shown below:
- Level 1 – quoted prices in active markets for identical investments
- Level 2 – other significant observable inputs (including quoted prices for similar investments, interest rates, prepayment speeds, etc.)
- Level 3 – unobservable inputs (including the Fund's own assumptions based on the best information available)
Valuation techniques used to value the Fund's investments by major category are as follows:
Equity securities, including restricted securities, for which market quotations are readily available, are valued at the last reported sale price or official closing price as reported by a third party pricing vendor on the primary market or exchange on which they are traded and are categorized as Level 1 in the hierarchy. In the event there were no sales during the day or closing prices are not available, securities are valued at the last quoted bid price or may be valued using the last available price and are generally categorized as Level 2 in the hierarchy. For foreign equity securities, when market or security specific events arise, comparisons to the valuation of American Depositary Receipts (ADRs), futures contracts, Exchange-Traded Funds (ETFs) and certain indexes as well as quoted prices for similar securities may be used and would be categorized as Level 2 in the hierarchy. For equity securities, including restricted securities, where observable inputs are limited, assumptions about market activity and risk are used and these securities may be categorized as Level 3 in the hierarchy.
Futures contracts are valued at the settlement price established each day by the board of trade or exchange on which they are traded and are categorized as Level 1 in the hierarchy. Investments in open-end mutual funds, including the Fidelity Central Funds, are valued at their closing net asset value (NAV) each business day and are categorized as Level 1 in the hierarchy. If an unaffiliated open-end mutual fund's NAV is unavailable, shares of that fund may be valued by another method that the Board believes reflects fair value in accordance with the Board's fair value pricing policies and is categorized as Level 2 in the hierarchy.
Changes in valuation techniques may result in transfers in or out of an assigned level within the disclosure hierarchy. The aggregate value of investments by input level as of August 31, 2021 is included at the end of the Fund's Schedule of Investments.
Foreign Currency. Certain Funds may use foreign currency contracts to facilitate transactions in foreign-denominated securities. Gains and losses from these transactions may arise from changes in the value of the foreign currency or if the counterparties do not perform under the contracts' terms.
Foreign-denominated assets, including investment securities, and liabilities are translated into U.S. dollars at the exchange rates at period end. Purchases and sales of investment securities, income and dividends received, and expenses denominated in foreign currencies are translated into U.S. dollars at the exchange rate in effect on the transaction date.
The effects of exchange rate fluctuations on investments are included with the net realized and unrealized gain (loss) on investment securities. Other foreign currency transactions resulting in realized and unrealized gain (loss) are disclosed separately.
Investment Transactions and Income. For financial reporting purposes, the Fund's investment holdings and NAV include trades executed through the end of the last business day of the period. The NAV per share for processing shareholder transactions is calculated as of the close of business of the New York Stock Exchange (NYSE), normally 4:00 p.m. Eastern time and includes trades executed through the end of the prior business day. Gains and losses on securities sold are determined on the basis of identified cost and include proceeds received from litigation. Dividend income is recorded on the ex-dividend date, except for certain dividends from foreign securities where the ex-dividend date may have passed, which are recorded as soon as the Fund is informed of the ex-dividend date. Non-cash dividends included in dividend income, if any, are recorded at the fair market value of the securities received. Income and capital gain distributions from Fidelity Central Funds, if any, are recorded on the ex-dividend date. Income and capital gain distributions from any underlying mutual funds or exchange-traded funds (ETFs) are recorded on the ex-dividend date. Certain distributions received by the Fund represent a return of capital or capital gain. The Fund determines the components of these distributions subsequent to the ex-dividend date, based upon receipt of tax filings or other correspondence relating to the underlying investment. These distributions are recorded as a reduction of cost of investments and/or as a realized gain. Interest income is accrued as earned and includes coupon interest and amortization of premium and accretion of discount on debt securities as applicable. Investment income is recorded net of foreign taxes withheld where recovery of such taxes is uncertain.
Expenses. Expenses directly attributable to a fund are charged to that fund. Expenses attributable to more than one fund are allocated among the respective funds on the basis of relative net assets or other appropriate methods. Expenses included in the accompanying financial statements reflect the expenses of that fund and do not include any expenses associated with any underlying mutual funds or exchange-traded funds. Although not included in a fund's expenses, a fund indirectly bears its proportionate share of these expenses through the net asset value of each underlying mutual fund or exchange-traded fund. Expense estimates are accrued in the period to which they relate and adjustments are made when actual amounts are known.
Deferred Trustee Compensation. Under a Deferred Compensation Plan (the Plan) for certain Funds, certain independent Trustees have elected to defer receipt of a portion of their annual compensation. Deferred amounts are invested in affiliated mutual funds, are marked-to-market and remain in a fund until distributed in accordance with the Plan. The investment of deferred amounts and the offsetting payable to the Trustees presented below are included in the accompanying Statement of Assets and Liabilities in other receivables and other payables and accrued expenses, as applicable.
| Strategic Advisers Small-Mid Cap Fund | $120,530 |
Income Tax Information and Distributions to Shareholders. Each year, the Fund intends to qualify as a regulated investment company under Subchapter M of the Internal Revenue Code, including distributing substantially all of its taxable income and realized gains. As a result, no provision for U.S. Federal income taxes is required. The Fund files a U.S. federal tax return, in addition to state and local tax returns as required. The Fund's federal income tax returns are subject to examination by the Internal Revenue Service (IRS) for a period of three fiscal years after they are filed. State and local tax returns may be subject to examination for an additional fiscal year depending on the jurisdiction. Foreign taxes are provided for based on the Fund's understanding of the tax rules and rates that exist in the foreign markets in which it invests.
Distributions are declared and recorded on the ex-dividend date. Income and capital gain distributions are determined in accordance with income tax regulations, which may differ from GAAP.
Capital accounts within the financial statements are adjusted for permanent book-tax differences. These adjustments have no impact on net assets or the results of operations. Capital accounts are not adjusted for temporary book-tax differences which will reverse in a subsequent period.
Book-tax differences are primarily due to the short-term gain distributions from the underlying mutual funds or exchange-traded funds (ETFs), futures contracts, foreign currency transactions, passive foreign investment companies (PFIC), market discount, partnerships, deferred Trustees compensation and losses deferred due to wash sales.
As of period end, the cost and unrealized appreciation (depreciation) in securities, and derivatives if applicable, for federal income tax purposes were as follows:
| Gross unrealized appreciation | $3,234,184,115 |
| Gross unrealized depreciation | (177,013,273) |
| Net unrealized appreciation (depreciation) | $3,057,170,842 |
| Tax cost | $6,480,566,285 |
Restricted Securities (including Private Placements). Funds may invest in securities that are subject to legal or contractual restrictions on resale. These securities generally may be resold in transactions exempt from registration or to the public if the securities are registered. Disposal of these securities may involve time-consuming negotiations and expense, and prompt sale at an acceptable price may be difficult. Information regarding restricted securities held at period end is included at the end of the Schedule of Investments, if applicable.
3. Derivative Instruments.
Risk Exposures and the Use of Derivative Instruments. The Fund's investment objective allows the Fund to enter into various types of derivative contracts, including futures contracts. Derivatives are investments whose value is primarily derived from underlying assets, indices or reference rates and may be transacted on an exchange or over-the-counter (OTC). Derivatives may involve a future commitment to buy or sell a specified asset based on specified terms, to exchange future cash flows at periodic intervals based on a notional principal amount, or for one party to make one or more payments upon the occurrence of specified events in exchange for periodic payments from the other party.
The Fund used derivatives to increase returns and to manage exposure to certain risks as defined below. The success of any strategy involving derivatives depends on analysis of numerous economic factors, and if the strategies for investment do not work as intended, the Fund may not achieve its objectives.
The Fund's use of derivatives increased or decreased its exposure to the following risk:
| Equity Risk | Equity risk relates to the fluctuations in the value of financial instruments as a result of changes in market prices (other than those arising from interest rate risk or foreign exchange risk), whether caused by factors specific to an individual investment, its issuer, or all factors affecting all instruments traded in a market or market segment. |
The Fund is also exposed to additional risks from investing in derivatives, such as liquidity risk and counterparty credit risk. Liquidity risk is the risk that the Fund will be unable to close out the derivative in the open market in a timely manner. Counterparty credit risk is the risk that the counterparty will not be able to fulfill its obligation to the Fund. Counterparty credit risk related to exchange-traded futures contracts may be mitigated by the protection provided by the exchange on which they trade.
Investing in derivatives may involve greater risks than investing in the underlying assets directly and, to varying degrees, may involve risk of loss in excess of any initial investment and collateral received and amounts recognized in the Statement of Assets and Liabilities. In addition, there may be the risk that the change in value of the derivative contract does not correspond to the change in value of the underlying instrument.
Futures Contracts. A futures contract is an agreement between two parties to buy or sell a specified underlying instrument for a fixed price at a specified future date. The Fund used futures contracts to manage its exposure to the stock market.
Upon entering into a futures contract, a fund is required to deposit either cash or securities (initial margin) with a clearing broker in an amount equal to a certain percentage of the face value of the contract. Futures contracts are marked-to-market daily and subsequent daily payments (variation margin) are made or received by a fund depending on the daily fluctuations in the value of the futures contracts and are recorded as unrealized appreciation or (depreciation). This receivable and/or payable, if any, is included in daily variation margin on futures contracts in the Statement of Assets and Liabilities. Realized gain or (loss) is recorded upon the expiration or closing of a futures contract. The net realized gain (loss) and change in net unrealized appreciation (depreciation) on futures contracts during the period is presented in the Statement of Operations.
Any open futures contracts at period end are presented in the Schedule of Investments under the caption "Futures Contracts". The notional amount at value reflects each contract's exposure to the underlying instrument or index at period end and is representative of volume of activity during the period. Cash deposited to meet initial margin requirements is presented as segregated cash with brokers for derivative instruments in the Statement of Assets and Liabilities.
4. Purchases and Sales of Investments.
Purchases and sales of securities, other than short-term securities and in-kind transactions, as applicable, are noted in the table below.
| Purchases ($) | Sales ($) | |
| Strategic Advisers Small-Mid Cap Fund | 2,438,923,268 | 2,871,207,774 |
5. Fees and Other Transactions with Affiliates.
Management Fee. Strategic Advisers (the investment adviser) provides the Fund with investment management related services. For these services, the Fund pays a monthly management fee to the investment adviser. The management fee is calculated by adding the annual management fee rate of .25% of the Fund's average net assets throughout the month to the aggregate of the fee rates, payable monthly by the investment adviser, to the Fund's sub-advisers. The Fund's maximum aggregate management fee will not exceed 1.10% of the Fund's average net assets. For the reporting period, the total annualized management fee rate was .60% of the Fund's average net assets.
During the period, the investment adviser waived a portion of its management fee as described in the Expense Reductions note.
Sub-Advisers. AllianceBernstein, L.P. (AB), ArrowMark Colorado Holdings, LLC (d/b/a ArrowMark Partners), Boston Partners Global Investors, Inc., FIAM LLC (an affiliate of the investment adviser), Geode Capital Management, LLC, J.P. Morgan Investment Management, Inc., LSV Asset Management, Portolan Capital Management, LLC, Rice Hall James & Associates, LLC, River Road Asset Management LLC and Victory Capital Management, Inc. each served as a sub-adviser for the Fund during the period. Sub-advisers provide discretionary investment advisory services for their allocated portion of the Fund's assets and are paid as described in the Management Fee note.
FIL Investment Advisors (FIL) has been retained to serve as a sub-adviser for the Fund. As of the date of this report, however, FIL has not been allocated any portion of the Fund's assets. FIL in the future may provide discretionary investment advisory services for an allocated portion of the Fund's assets and will be paid by the investment adviser for providing these services.
Brokerage Commissions. A portion of portfolio transactions were placed with brokerage firms which are affiliates of the investment adviser. Brokerage commissions are included in net realized gain (loss) and change in net unrealized appreciation (depreciation) in the Statement of Operations. The commissions paid to these affiliated firms were as follows:
| Amount | |
| Strategic Advisers Small-Mid Cap Fund | $683 |
Interfund Trades. Funds may purchase from or sell securities to other funds affiliated with each sub-adviser under procedures adopted by the Board. The procedures have been designed to ensure these interfund trades are executed in accordance with Rule 17a-7 of the 1940 Act. Any interfund trades are included within the respective purchases and sales amounts shown in the Purchases and Sales of Investments note and are noted in the table below.
| Purchases ($) | Sales ($) | |
| Strategic Advisers Small-Mid Cap Fund | 2,374,117 | 1,627,836 |
6. Investments in Fidelity Central Funds.
Funds may invest in Fidelity Central Funds, which are open-end investment companies generally available only to other investment companies and accounts managed by the investment adviser and its affiliates. The Schedule of Investments lists any Fidelity Central Funds held as an investment as of period end, but does not include the underlying holdings of each Fidelity Central Fund. An investing fund indirectly bears its proportionate share of the expenses of the underlying Fidelity Central Funds.
Based on its investment objective, each Fidelity Central Fund may invest or participate in various investment vehicles or strategies that are similar to those of the investing fund. These strategies are consistent with the investment objectives of the investing fund and may involve certain economic risks which may cause a decline in value of each of the Fidelity Central Funds and thus a decline in the value of the investing fund.
| Fidelity Central Fund | Investment Manager | Investment Objective | Investment Practices | Expense Ratio(a) |
| Fidelity Money Market Central Funds | Fidelity Management & Research Company LLC (FMR) | Each fund seeks to obtain a high level of current income consistent with the preservation of capital and liquidity. | Short-term Investments | Less than .005% to .01% |
(a) Expenses expressed as a percentage of average net assets and are as of each underlying Central Fund's most recent annual or semi-annual shareholder report.
A complete unaudited list of holdings for each Fidelity Central Fund is available upon request or at the Securities and Exchange Commission website at www.sec.gov. In addition, the financial statements of the Fidelity Central Funds, which are not covered by the Report of Independent Registered Public Accounting Firm, are available on the Securities and Exchange Commission website or upon request.
7. Committed Line of Credit.
Certain Funds participate with other funds managed by the investment adviser or an affiliate in a $4.25 billion credit facility (the "line of credit") to be utilized for temporary or emergency purposes to fund shareholder redemptions or for other short-term liquidity purposes. The participating funds have agreed to pay commitment fees on their pro-rata portion of the line of credit, which are reflected in Miscellaneous expenses on the Statement of Operations, and are listed below. During the period, there were no borrowings on this line of credit.
| Amount | |
| Strategic Advisers Small-Mid Cap Fund | $8,440 |
8. Security Lending.
Funds lend portfolio securities through a lending agent from time to time in order to earn additional income. On the settlement date of the loan, a fund receives collateral (in the form of U.S. Treasury obligations, letters of credit and/or cash) against the loaned securities and maintains collateral in an amount not less than 100% of the market value of the loaned securities during the period of the loan. The market value of the loaned securities is determined at the close of business of a fund and any additional required collateral is delivered to a fund on the next business day. A fund or borrower may terminate the loan at any time, and if the borrower defaults on its obligation to return the securities loaned because of insolvency or other reasons, a fund may apply collateral received from the borrower against the obligation. A fund may experience delays and costs in recovering the securities loaned. Any cash collateral received is invested in the Fidelity Securities Lending Cash Central Fund. Any loaned securities are identified as such in the Schedule of Investments, and the value of loaned securities and cash collateral at period end, as applicable, are presented in the Statement of Assets and Liabilities. Security lending income represents the income earned on investing cash collateral, less rebates paid to borrowers and any lending agent fees associated with the loan, plus any premium payments received for lending certain types of securities. Security lending income is presented in the Statement of Operations as a component of income from Fidelity Central Funds.
9. Bank Borrowings.
The Fund is permitted to have bank borrowings for temporary or emergency purposes to fund shareholder redemptions or for other short-term liquidity requirements. The Fund has established borrowing arrangements with certain banks. The interest rate on the borrowings is the bank's base rate, as revised from time to time. Any open loans, including accrued interest, at period end are presented under the caption "Notes payable" in the Statement of Assets and Liabilities, if applicable. Activity in this program during the period for which loans were outstanding was as follows:
| Average Loan Balance | Weighted Average Interest Rate | Interest Expense | |
| Strategic Advisers Small-Mid Cap Fund | $52,590,750 | .57% | $3,331 |
10. Expense Reductions.
The investment adviser has contractually agreed to waive the Fund's management fee in an amount equal to .25% of the Fund's average net assets until September 30, 2024. During the period, this waiver reduced the Fund's management fee by $11,784,534.
Commissions paid to certain brokers with whom the investment adviser, or its affiliates, places trades on behalf of the Fund include an amount in addition to trade execution, which may be rebated back to the Fund to offset expenses. This amount totaled $9,459 for the period.
11. Other.
Fund's organizational documents provide former and current trustees and officers with a limited indemnification against liabilities arising in connection with the performance of their duties to the fund. In the normal course of business, the fund may also enter into contracts that provide general indemnifications. The fund's maximum exposure under these arrangements is unknown as this would be dependent on future claims that may be made against the fund. The risk of material loss from such claims is considered remote.
Funds do not invest in underlying mutual funds for the purpose of exercising management or control; however, investments by funds within their principal investment strategies may represent a significant portion of the underlying mutual fund's net assets. At the end of the period, certain Funds were the owners of record of 10% or more of the total outstanding shares of the following underlying mutual funds as shown below.
| Fund | Strategic Advisers Small-Mid Cap Fund |
| Fidelity SAI Real Estate Index Fund | 13% |
12. Coronavirus (COVID-19) Pandemic.
An outbreak of COVID-19 first detected in China during December 2019 has since spread globally and was declared a pandemic by the World Health Organization during March 2020. Developments that disrupt global economies and financial markets, such as the COVID-19 pandemic, may magnify factors that affect the Fund's performance.
Shareholder Expense Example
As a shareholder, you incur two types of costs: (1) transaction costs, which may include sales charges (loads) on purchase payments or redemption proceeds, as applicable and (2) ongoing costs, which generally include management fees, distribution and/or service (12b-1) fees and other Fund expenses. This Example is intended to help you understand your ongoing costs (in dollars) of investing in a fund and to compare these costs with the ongoing costs of investing in other mutual funds.
The Example is based on an investment of $1,000 invested at the beginning of the period and held for the entire period (March 1, 2021 to August 31, 2021).
Actual Expenses
The first line of the accompanying table provides information about actual account values and actual expenses. You may use the information in this line, together with the amount you invested, to estimate the expenses that you paid over the period. Simply divide your account value by $1,000.00 (for example, an $8,600 account value divided by $1,000.00 = 8.6), then multiply the result by the number in the first line for a class/Fund under the heading entitled "Expenses Paid During Period" to estimate the expenses you paid on your account during this period. If any fund is a shareholder of any underlying mutual funds or exchange-traded funds (ETFs) (the Underlying Funds), such fund indirectly bears its proportional share of the expenses of the Underlying Funds in addition to the direct expenses incurred presented in the table. These fees and expenses are not included in the annualized expense ratio used to calculate the expense estimate in the table below.
Hypothetical Example for Comparison Purposes
The second line of the accompanying table provides information about hypothetical account values and hypothetical expenses based on the actual expense ratio and an assumed rate of return of 5% per year before expenses, which is not the actual return. The hypothetical account values and expenses may not be used to estimate the actual ending account balance or expenses you paid for the period. You may use this information to compare the ongoing costs of investing in the Fund and other funds. To do so, compare this 5% hypothetical example with the 5% hypothetical examples that appear in the shareholder reports of the other funds. If any fund is a shareholder of any Underlying Funds, such fund indirectly bears its proportional share of the expenses of the Underlying Funds in addition to the direct expenses as presented in the table. These fees and expenses are not included in the annualized expense ratio used to calculate the expense estimate in the table below.
Please note that the expenses shown in the table are meant to highlight your ongoing costs only and do not reflect any transaction costs. Therefore, the second line of the table is useful in comparing ongoing costs only, and will not help you determine the relative total costs of owning different funds.
| Annualized Expense Ratio-A | Beginning Account Value March 1, 2021 | Ending Account Value August 31, 2021 | Expenses Paid During Period-B March 1, 2021 to August 31, 2021 |
|
| Strategic Advisers Small-Mid Cap Fund | .35% | |||
| Actual | $1,000.00 | $1,101.80 | $1.85 | |
| Hypothetical-C | $1,000.00 | $1,023.44 | $1.79 |
A Annualized expense ratio reflects expenses net of applicable fee waivers.
B Expenses are equal to the annualized expense ratio, multiplied by the average account value over the period, multiplied by 184/ 365 (to reflect the one-half year period). The fees and expenses of any Underlying Funds are not included in each annualized expense ratio.
C 5% return per year before expenses
Board Approval of Amended Sub-Advisory Agreement
Strategic Advisers Small-Mid Cap Fund
In June 2021, the Board of Trustees, including the Independent Trustees (together, the Board) voted to approve an amendment to the fee schedule for the investment mandate in the existing sub-advisory agreement among Strategic Advisers LLC (Strategic Advisers), LSV Asset Management (Sub-Adviser), and Fidelity Rutland Square Trust II (Trust) on behalf of the fund (Amended Sub-Advisory Agreement). The Board noted that the updated fee schedule in the Amended Sub-Advisory Agreement will result in the same or lower fees at all asset levels. The Board also noted that no other material contract terms are impacted by the Amended Sub-Advisory Agreement. The Board, assisted by the advice of fund counsel and Independent Trustees' counsel, considered a broad range of information.In considering whether to approve the Amended Sub-Advisory Agreement, the Board reached a determination, with the assistance of fund counsel and Independent Trustees' counsel and through the exercise of its business judgment, that the approval of the Amended Sub-Advisory Agreement is in the best interests of the fund and its shareholders and that the approval of such agreement does not involve a conflict of interest from which Strategic Advisers or its affiliates derive an inappropriate advantage. Also, the Board found that the fees to be charged under the Amended Sub-Advisory Agreement bear a reasonable relationship to the services to be rendered and will be based on services provided that will be in addition to, rather than duplicative of services provided under the advisory contract of any underlying fund in which the fund may invest. The Board's decision to approve the Amended Sub-Advisory Agreement was not based on any single factor, but rather was based on a comprehensive consideration of all the information provided to the Board. In addition, individual Trustees did not necessarily attribute the same weight or importance to each factor. Nature, Extent, and Quality of Services Provided. The Board considered the backgrounds of the investment personnel that will provide services to the fund, and also considered the fund's investment objective, strategies and related investment philosophy and current sub-adviser line-up, as well as the structures of the investment personnel compensation programs and whether such structures provide appropriate incentives to act in the best interests of the fund, at its September 2020 meeting. The Board considered the detailed information provided by Strategic Advisers and the Sub-Adviser in the June 2021 annual contract renewal materials.The Board noted that it had approved the existing sub-advisory agreement with the Sub-Adviser at its September 2020 meeting and that the Amended Sub-Advisory Agreement will not result in any changes to: (i) the nature, extent and quality of the sub-advisory services provided; (ii) the investment process or strategies employed in the management of the fund's assets; or (iii) the day-to-day management of the fund or the persons primarily responsible for such management. Investment Performance. The Board did not consider performance to be a material factor in its decision to approve the Amended Sub-Advisory Agreement because the approval of the Amended Sub-Advisory Agreement will not result in any changes (i) to the fund's investment processes or strategies; or (ii) in the persons primarily responsible for the day-to-day management of the fund.Based on its review, the Board concluded that the nature, extent, and quality of services that will be provided to the fund under the Amended Sub-Advisory Agreement will continue to benefit the fund's shareholders.Competitiveness of Management Fee and Total Fund Expenses.
The Board noted that the Amended Sub-Advisory Agreement will not result in changes to the maximum aggregate annual management fee payable by the fund or Strategic Advisers' portion of the management fee. The Board considered Strategic Advisers' contractual agreement to waive its portion of the fund's management fee. The Board considered that the Amended Sub-Advisory Agreement will or has the potential to result in a decrease in the total management fees of the fund. Based on its review, the Board concluded that the fund's management fee structure and any changes to projected total expenses bear a reasonable relationship to the services that the fund and its shareholders will receive and the other factors considered.Because the Amended Sub-Advisory Agreement was negotiated at arm's length and will have no impact on the maximum management fees payable by the fund, the Board did not consider the costs of services and profitability of the relationship with the fund to Strategic Advisers to be significant factors in its decision to approve the Amended Sub-Advisory Agreement. Potential Fall-Out Benefits. The Board considered that it reviews information regarding the potential of direct and indirect benefits to Strategic Advisers and its affiliates from their relationships with the fund, including non-advisory fee compensation paid to affiliates of Strategic Advisers, if any, as well as information regarding potential fall-out benefits accruing to the Sub-Adviser, if any, as a result of its relationship with the fund, during its annual renewal of the fund's management contract, sub-advisory agreements, and sub-subadvisory agreements. The Board considered Strategic Advisers' representation that it does not anticipate that the approval of the Amended Sub-Advisory Agreement will have a significant impact on the profitability of, or potential fall-out benefits to, Strategic Advisers or its affiliates. Possible Economies of Scale. The Board considered that it reviews whether there have been economies of scale in connection with the management of the fund during its annual renewal of the fund's management contract, sub-advisory agreements, and sub-subadvisory agreements. The Board noted that the Amended Sub-Advisory Agreement will continue to provide for breakpoints that have the potential to reduce sub-advisory fees paid to the Sub-Adviser as assets allocated to the Sub-Adviser grow. The Board also noted that it did not consider the possible realization of economies of scale to be a significant factor in its decision to approve the Amended Sub-Advisory Agreement because the fund will not bear any additional management fees or expenses under the Amended Sub-Advisory Agreement. Conclusion. Based on its evaluation of all of the conclusions noted above, and after considering all factors it believed relevant, the Board concluded that the Amended Sub-Advisory Agreement's fee structure bears a reasonable relationship to the services to be rendered and that the Amended Sub-Advisory Agreement is in the best interests of the fund and its shareholders and should be approved. The Board also concluded that the sub-advisory fees to be charged under the Amended Sub-Advisory Agreement will be based on services provided that will be in addition to, rather than duplicative of, services provided under the advisory contract of any underlying fund in which the fund may invest. In addition, the Board concluded that the approval of the Amended Sub-Advisory Agreement does not involve a conflict of interest from which Strategic Advisers or its affiliates derive an inappropriate advantage.
![]()
SMC-SANN-1021
1.912859.111
Item 2.
Code of Ethics
Not applicable.
Item 3.
Audit Committee Financial Expert
Not applicable.
Item 4.
Principal Accountant Fees and Services
Not applicable.
Item 5.
Audit Committee of Listed Registrants
Not applicable.
Item 6.
Investments
(a)
Not applicable.
(b)
Not applicable
Item 7.
Disclosure of Proxy Voting Policies and Procedures for Closed-End Management Investment Companies
Not applicable.
Item 8.
Portfolio Managers of Closed-End Management Investment Companies
Not applicable.
Item 9.
Purchase of Equity Securities by Closed-End Management Investment Company and Affiliated Purchasers
Not applicable.
Item 10.
Submission of Matters to a Vote of Security Holders
There were no material changes to the procedures by which shareholders may recommend nominees to the Fidelity Rutland Square Trust II’s Board of Trustees.
Item 11.
Controls and Procedures
(a)(i) The President and Treasurer and the Chief Financial Officer have concluded that the Fidelity Rutland Square Trust II’s (the “Trust”) disclosure controls and procedures (as defined in Rule 30a-3(c) under the Investment Company Act) provide reasonable assurances that material information relating to the Trust is made known to them by the appropriate persons, based on their evaluation of these controls and procedures as of a date within 90 days of the filing date of this report.
(a)(ii) There was no change in the Trust’s internal control over financial reporting (as defined in Rule 30a-3(d) under the Investment Company Act) that occurred during the period covered by this report that has materially affected, or is reasonably likely to materially affect, the Trust’s internal control over financial reporting.
Item 12.
Disclosure of Securities Lending Activities for Closed-End Management
Investment Companies
Not applicable.
Item 13.
Exhibits
(a) | (1) | Not applicable. |
(a) | (2) | |
(a) | (3) | Not applicable. |
(b) |
SIGNATURES
Pursuant to the requirements of the Securities Exchange Act of 1934 and the Investment Company Act of 1940, the registrant has duly caused this report to be signed on its behalf by the undersigned, thereunto duly authorized.
Fidelity Rutland Square Trust II
By: | /s/Stacie M. Smith |
Stacie M. Smith | |
President and Treasurer | |
Date: | October 21, 2021 |
Pursuant to the requirements of the Securities Exchange Act of 1934 and the Investment Company Act of 1940, this report has been signed below by the following persons on behalf of the registrant and in the capacities and on the dates indicated.
By: | /s/Stacie M. Smith |
Stacie M. Smith | |
President and Treasurer | |
Date: | October 21, 2021 |
By: | /s/John J. Burke III |
John J. Burke III | |
Chief Financial Officer | |
Date: | October 21, 2021 |