Table of Contents
As filed with the Securities and Exchange Commission on August 4, 2020
Registration No. 33-
(Investment Company Act Registration No. 811-21991)
SECURITIES AND EXCHANGE COMMISSION
Washington, D.C. 20549
FORM N-14
REGISTRATION STATEMENT
UNDER
| THE SECURITIES ACT OF 1933 | ||||
| Pre-Effective Amendment No. | ☐ | |||
| Post-Effective Amendment No. | ☐ |
Fidelity Rutland Square Trust II
(Exact Name of Registrant as Specified in Charter)
Registrant’s Telephone Number (617) 563-7000
245 Summer St., Boston, MA 02210
(Address Of Principal Executive Offices)
With copies to:
| Christina H. Lee Secretary and Chief Legal Officer 245 Summer Street Boston, Massachusetts 02210 (Name and Address of Agent for Service) |
John V. O’Hanlon Dechert LLP One International Place, 40th Floor 100 Oliver Street Boston, MA 02116-5021 |
Approximate Date of Proposed Public Offering: As soon as practicable after the Registration Statement becomes effective under the Securities Act of 1933.
The Registrant has registered an indefinite amount of securities under the Securities Act of 1933 pursuant to Section 24(f) under the Investment Company Act of 1940; accordingly, no fee is payable herewith because of reliance upon Section 24(f).
It is proposed that this filing will become effective on September 3, 2020, pursuant to Rule 488.
Table of Contents
STRATEGIC ADVISERS® CORE FUND
STRATEGIC ADVISERS® GROWTH FUND
STRATEGIC ADVISERS® VALUE FUND
SERIES OF
FIDELITY RUTLAND SQUARE TRUST II
245 SUMMER STREET, BOSTON, MASSACHUSETTS 02210
1-800-544-3455
NOTICE OF SPECIAL MEETING OF SHAREHOLDERS
To the Shareholders of the above funds:
NOTICE IS HEREBY GIVEN that a Special Meeting of Shareholders (the Meeting) of Strategic Advisers® Core Fund, Strategic Advisers® Growth Fund, and Strategic Advisers® Value Fund will be held at an office of Fidelity Rutland Square Trust II (the trust), 245 Summer Street, Boston, Massachusetts 02210 (at the corner of Summer Street and Dorchester Avenue, next to Boston’s South Station) on November 2, 2020 at 8:00 a.m. Eastern Time (ET). The purpose of the Meeting is to consider and act upon the following proposals, and to transact such other business as may properly come before the Meeting or any adjournments thereof.
| (1) | To approve an Agreement and Plan of Reorganization providing for the transfer of all of the assets of Strategic Advisers® Core Fund to Strategic Advisers® Large Cap Fund in exchange solely for shares of beneficial interest of Strategic Advisers® Large Cap Fund and the assumption by Strategic Advisers® Large Cap Fund of Strategic Advisers® Core Fund’s liabilities, in complete liquidation of Strategic Advisers® Core Fund. |
| (2) | To approve an Agreement and Plan of Reorganization providing for the transfer of all of the assets of Strategic Advisers® Growth Fund to Strategic Advisers® Large Cap Fund in exchange solely for shares of beneficial interest of Strategic Advisers® Large Cap Fund and the assumption by Strategic Advisers® Large Cap Fund of Strategic Advisers® Growth Fund’s liabilities, in complete liquidation of Strategic Advisers® Growth Fund. |
| (3) | To approve an Agreement and Plan of Reorganization providing for the transfer of all of the assets of Strategic Advisers® Value Fund to Strategic Advisers® Large Cap Fund in exchange solely for shares of beneficial interest of Strategic Advisers® Large Cap |
Table of Contents
| Fund and the assumption by Strategic Advisers® Large Cap Fund of Strategic Advisers® Value Fund’s liabilities, in complete liquidation of Strategic Advisers® Value Fund. |
The Board of Trustees has fixed the close of business on September 8, 2020 as the record date for the determination of the shareholders of Strategic Advisers® Core Fund, Strategic Advisers® Growth Fund, and Strategic Advisers® Value Fund entitled to notice of, and to vote at, such Meeting and any adjournments thereof.
By order of the Board of Trustees,
Christina H. Lee, Secretary
September 8, 2020
Table of Contents
Your vote is important – please vote your shares promptly.
Shareholders are invited to attend the Meeting in person. Admission to the Meeting will be on a first-come, first-served basis and will require picture identification. Shareholders arriving after the start of the Meeting may be denied entry. Cameras, cell phones, recording equipment and other electronic devices will not be permitted. Fidelity reserves the right to inspect any persons or items prior to admission to the Meeting.
Any shareholder who does not expect to attend the Meeting is urged to vote using the touch-tone telephone or internet voting instructions on the following page or by indicating voting instructions on the enclosed proxy card, dating and signing it, and returning it in the envelope provided, which needs no postage if mailed in the United States. In order to avoid unnecessary expense, we ask your cooperation in responding promptly, no matter how large or small your holdings may be. If you wish to wait until the Meeting to vote your shares, you will need to request a paper ballot at the Meeting in order to do so.
Table of Contents
INSTRUCTIONS FOR EXECUTING PROXY CARD
The following general rules for executing proxy cards may be of assistance to you and help avoid the time and expense involved in validating your vote if you fail to execute your proxy card properly.
| 1. | Individual Accounts: Your name should be signed exactly as it appears in the registration on the proxy card. |
| 2. | Joint Accounts: Either party may sign, but the name of the party signing should conform exactly to a name shown in the registration. |
| 3. | All other accounts should show the capacity of the individual signing. This can be shown either in the form of the account registration itself or by the individual executing the proxy card. For example: |
| REGISTRATION |
VALID SIGNATURE | |||||
| A. 1) | ABC Corp. | John Smith, Treasurer | ||||
| 2) | ABC Corp. | John Smith, Treasurer | ||||
| c/o John Smith, Treasurer | ||||||
| B. 1) | ABC Corp. Profit Sharing Plan | Ann B. Collins, Trustee | ||||
| 2) | ABC Trust | Ann B. Collins, Trustee | ||||
| 3) | Ann B. Collins, Trustee | Ann B. Collins, Trustee | ||||
| u/t/d 12/28/78 | ||||||
| C. 1) | Anthony B. Craft, Cust. | Anthony B. Craft | ||||
| f/b/o Anthony B. Craft, Jr. | ||||||
| UGMA | ||||||
INSTRUCTIONS FOR VOTING BY TOUCH-TONE TELEPHONE OR THROUGH THE INTERNET
| 1. | Read the proxy statement, and have your proxy card handy. |
| 2. | Call the toll-free number or visit the web site indicated on your proxy card. |
| 3. | Enter the number found in the box on the front of your proxy card. |
| 4. | Follow the recorded or on-line instructions to cast your vote. |
Table of Contents
| STRATEGIC ADVISERS® CORE FUND | STRATEGIC ADVISERS® LARGE CAP FUND | |
| STRATEGIC ADVISERS® GROWTH FUND | ||
| STRATEGIC ADVISERS® VALUE FUND |
SERIES OF
FIDELITY RUTLAND SQUARE TRUST II
245 SUMMER STREET, BOSTON, MASSACHUSETTS 02210
1-800-544-3455
PROXY STATEMENT AND PROSPECTUS
SEPTEMBER 8, 2020
This combined Proxy Statement and Prospectus (Proxy Statement) is furnished to shareholders of Strategic Advisers® Core Fund (Core Fund), Strategic Advisers® Growth Fund (Growth Fund), and Strategic Advisers® Value Fund (Value Fund) (collectively, the Target Funds), each a series of Fidelity Rutland Square Trust II (the trust), in connection with a solicitation of proxies made by, and on behalf of, the trust’s Board of Trustees to be used at the Special Meeting of Shareholders of the Target Funds and at any adjournments thereof (the Meeting), to be held on November 2, 2020 at 8:00 a.m. Eastern Time (ET) at 245 Summer Street, Boston, Massachusetts 02210, an office of the trust and Strategic Advisers LLC (Strategic Advisers), the funds’ investment adviser. This Proxy Statement and the accompanying proxy card are first being mailed on or about September 8, 2020.
Shareholders of certain funds of the trust will also participate in the Meeting and have been mailed a separate notice and proxy statement relating to proposals to be voted upon by the trust and/or by the shareholders of those funds at the Meeting. Shareholders of Core Fund, Growth Fund and Value Fund are also asked to vote on certain other proposals that are included in a notice and proxy statement mailed separately to such shareholders.
1
Table of Contents
As more fully described in the Proxy Statement:
| Proposal Number |
Proposal Description |
Applicable Fund |
Page | |||
| 1 |
To approve an Agreement and Plan of Reorganization (the Agreement) relating to the proposed acquisition of Core Fund by Strategic Advisers® Large Cap Fund (Large Cap Fund or Acquiring Fund), a newly created series of the trust. | Core Fund | 39 | |||
| 2 |
To approve the Agreement relating to the proposed acquisition of Growth Fund by Large Cap Fund. | Growth Fund | 47 | |||
| 3 |
To approve the Agreement relating to the proposed acquisition of Value Fund by Large Cap Fund. | Value Fund | 55 | |||
The transactions contemplated by the Agreement are each referred to as a Reorganization and, together, the Reorganizations. Approval of each Reorganization will be determined solely by approval of the shareholders of the individual fund affected. Because each Target Fund is used in Fidelity® Wealth Services (FWS) managed account program to provide exposure to large cap equity securities in individual client accounts, substantially all managed account clients who own shares of one of the Target Funds own shares of all three Target Funds. As a result, each Reorganization is conditional on the approval of shareholders of all three Target Funds. In the event shareholders of one Target Fund fail to approve the Agreement, Fidelity expects to continue to manage all three Target Funds separately to continue to provide large cap equities exposure to accounts in the managed account program.
If the Agreement is approved by each Target Fund’s shareholders and the Reorganizations occur, you will become a shareholder of Large Cap Fund. Your fund will transfer all of its assets to Large Cap Fund in exchange solely for shares of beneficial interest of Large Cap Fund and the assumption by Large Cap Fund of your fund’s liabilities in complete liquidation of each Target Fund. The total value of your fund holdings will not change as a result of the Reorganizations. The Reorganizations are currently scheduled to take place as of the close of business of the New York Stock Exchange (the NYSE) on November 13, 2020, or such other time and date as the parties to the Agreement may agree (the Closing Date).
Large Cap Fund (together with Core Fund, Growth Fund, and Value Fund, the funds) is a diversified series of Fidelity Rutland Square Trust II, an open-end management investment company registered with the
2
Table of Contents
Securities and Exchange Commission (the SEC). Large Cap Fund seeks capital appreciation. Large Cap Fund seeks to achieve its investment objective by normally investing at least 80% of its assets in securities and shares of funds with large market capitalizations (which, for purposes of this fund, are those companies with market capitalizations similar to companies in the Russell 1000® Index or the S&P 500® Index).
THESE SECURITIES HAVE NOT BEEN APPROVED OR DISAPPROVED BY THE SEC, NOR HAS THE SEC PASSED UPON THE ACCURACY OR ADEQUACY OF THIS PROXY STATEMENT AND PROSPECTUS. ANY REPRESENTATION TO THE CONTRARY IS A CRIMINAL OFFENSE.
The Proxy Statement sets forth concisely the information about each Reorganization and Large Cap Fund that shareholders should know before voting on the proposed Reorganizations. Please read it carefully and keep it for future reference.
The following documents have been filed with the SEC and are incorporated into this Proxy Statement by reference, which means they are part of this Proxy statement for legal purposes:
(i) the Statement of Additional Information dated September 8, 2020, relating to this Proxy Statement;
(ii) the Prospectus for Large Cap Fund dated July 29, 2020, a copy of which accompanies this Proxy Statement;
(iii) the Statement of Additional Information for Large Cap Fund dated July 29, 2020;
(iv) the Prospectus for Core Fund dated July 30, 2020;
(v) the Statement of Additional Information for Core Fund dated July 30, 2020;
(vi) the Prospectus for Growth Fund dated July 30, 2020;
(vii) the Statement of Additional Information for Growth Fund dated July 30, 2020;
(viii) the Prospectus for Value Fund dated July 30, 2020; and
(ix) the Statement of Additional Information for Value Fund dated July 30, 2020.
You can obtain copies of the funds’ current Prospectuses, Statements of Additional Information, or annual or semiannual reports without charge by contacting the Trust at Fidelity Distributors Company LLC (FDC), 900 Salem Street, Smithfield, Rhode Island 02917, by calling 1-800-544-3455, or by logging on to www.fidelity.com.
The trust is subject to the informational requirements of the Securities and Exchange Act of 1934, as amended. Accordingly, it must file proxy material, reports, and other information with the SEC. You can review and copy such information at the public reference facilities maintained by the
3
Table of Contents
SEC at 100 F Street, N.E., Washington D.C. 20549, the SEC’s Northeast Regional Office, 200 Vesey Street, Suite 400, New York, NY 10281-1022, and the SEC’s Midwest Regional Office, 175 W. Jackson Blvd., Suite 1450, Chicago, IL 60604. Such information is also available from the EDGAR database on the SEC’s web site at http://www.sec.gov. You can also obtain copies of such information, after paying a duplicating fee, by sending a request by e-mail to publicinfo@sec.gov or by writing the SEC’s Public Reference Room, Office of Consumer Affairs and Information Services, Washington, DC 20549. You may obtain information on the operation of the SEC’s Public Reference Room by calling the SEC at 1-202-551-8090.
An investment in the funds is not a deposit of a bank and is not insured or guaranteed by the Federal Deposit Insurance Corporation or any other government agency. You could lose money by investing in the funds.
4
Table of Contents
| 6 | ||||
| 33 | ||||
| 39 | ||||
| 63 | ||||
| 63 | ||||
| 68 | ||||
| 69 | ||||
| 86 | ||||
5
Table of Contents
The following is a summary of certain information contained elsewhere in this Proxy Statement, in the Agreement, and/or in the Prospectuses and Statements of Additional Information of Core Fund, Growth Fund, and Value Fund, as applicable, or the Prospectus and Statement of Additional Information of Large Cap Fund, each of which are incorporated herein by reference. Shareholders should read the entire Proxy Statement and the Prospectus of Large Cap Fund carefully for more complete information.
What proposal am I being asked to vote on?
Shareholders of Core Fund are being asked to vote on Proposal 1. As more fully described in Proposal 1 below, shareholders of Core Fund are being asked to approve the Agreement relating to the proposed acquisition of Core Fund by Large Cap Fund.
Shareholders of Growth Fund are being asked to vote on Proposal 2. As more fully described in Proposal 2 below, shareholders of Growth Fund are being asked to approve the Agreement relating to the proposed acquisition of Growth Fund by Large Cap Fund.
Shareholders of Value Fund are being asked to vote on Proposal 3. As more fully described in Proposal 3 below, shareholders of Value Fund are being asked to approve the Agreement relating to the proposed acquisition of Value Fund by Large Cap Fund.
Approval of each Reorganization will be determined solely by approval of the shareholders of the individual fund affected. Because each Target Fund is used in FWS managed account program to provide exposure to large cap equity securities in individual client accounts, substantially all managed account clients who own shares of one of the Target Funds own shares of all three Target Funds. As a result, each Reorganization is conditional on the approval of shareholders of all three Target Funds. In the event shareholders of one Target Fund fail to approve the Agreement, Fidelity expects to continue to manage all three Target Funds separately to continue to provide large cap equities exposure to accounts in the managed account program.
Shareholders of record as of the close of business on September 8, 2020 will be entitled to vote at the Meeting.
If the Agreement is approved by each Target Fund’s shareholders and the Reorganizations occur, you will become a shareholder of Large Cap Fund instead. Your fund will transfer all of its assets to Large Cap Fund in exchange solely for shares of beneficial interest of Large Cap Fund and the assumption by Large Cap Fund of your fund’s liabilities in complete liquidation of each Target Fund. Each shareholder of Core Fund, Growth
6
Table of Contents
Fund, and Value Fund will receive shares of the Large Cap Fund. Each Reorganization is currently scheduled to take place as of the close of business of the NYSE on the Closing Date.
For more information, shareholders of Core Fund please refer to the section entitled “The Proposed Transactions – Proposal 1 – Agreement and Plan of Reorganization.” For more information, shareholders of Growth Fund please refer to the section entitled “The Proposed Transactions – Proposal 2 – Agreement and Plan of Reorganization.” For more information, shareholders of Value Fund please refer to the section entitled “The Proposed Transactions – Proposal 3 – Agreement and Plan of Reorganization.”
Has the Board of Trustees approved the proposal?
Yes. Each fund’s Board of Trustees has carefully reviewed the proposal and approved the Agreement and the Reorganization. The Board of Trustees unanimously recommends that you vote in favor of your fund’s Reorganization by approving the Agreement.
What are the reasons for the proposals?
The Board of Trustees considered the following factors, among others, in determining to recommend that you vote in favor of your fund’s Reorganization by approving the Agreement:
| • | Each Reorganization would provide opportunities for improved investment outcomes by reducing redundant risk mitigation strategies employed in managing each of the Target Funds separately to their individual benchmarks. |
| • | Each Reorganization would permit each Target Fund’s shareholders to receive exposure to large cap equity securities in a single fund with the same investment objective, reducing the need to trade across funds and potentially realize gains for customers in taxable accounts. |
| • | Based on annualized expense data for the period from June 1, 2019 through April 30, 2020, and assuming all proposals are approved and the merger had been in effect for a full year, for each Target Fund individually, the change in total expenses is expected to range from a decrease of 18 basis points (bp) to an increase of 2 bp. As substantially all managed account clients who own shares of one Target Fund hold shares of all three Target Funds, and in similar proportions, shareholders are expected to benefit from a projected decrease of 6 bp in total expenses when comparing Acquiring Fund total annual |
7
Table of Contents
| operating expenses to the weighted average expense ratio of the three Target Funds. The pro forma expenses and fee information presented below is based on data for the 12 months ended May 31, 2020, the funds’ fiscal year end. |
| • | The contractual maximum management fee proposed for the Acquiring Fund is lower than that of each of the Target Funds. |
| • | Although substantially all shareholders hold all three Target Funds, the mergers will provide clients who hold only one fund with more manager diversification and broadened portfolio management expertise in a single fund. |
For more information, shareholders of Core Fund please refer to the section entitled “The Proposed Transactions – Proposal 1 – Reasons for the Reorganization.” For more information, shareholders of Growth Fund please refer to the section entitled “The Proposed Transactions – Proposal 2 – Reasons for the Reorganization.” For more information, shareholders of Value Fund please refer to the section entitled “The Proposed Transactions – Proposal 3 – Reasons for the Reorganization.”
How will you determine the number of shares of Large Cap Fund that I will receive?
Although the number of shares you own will most likely change, the total value of your holdings will not change as a result of your fund’s Reorganization.
As provided in the Agreement each Target Fund will distribute shares of Large Cap Fund to its shareholders so that each shareholder will receive the number of full and fractional shares of Large Cap Fund equal in value to the net asset value of shares of the respective Target Fund held by such shareholder on the Closing Date.
For more information, shareholders of Core Fund please refer to the section entitled “The Proposed Transactions – Proposal 1 – Agreement and Plan of Reorganization.” For more information, shareholders of Growth Fund please refer to the section entitled “The Proposed Transactions – Proposal 2 – Agreement and Plan of Reorganization.” For more information, shareholders of Value Fund please refer to the section entitled “The Proposed Transactions – Proposal 3 – Agreement and Plan of Reorganization.”
Is a Reorganization considered a taxable event for federal income tax purposes?
No. Each fund will receive an opinion of counsel that its Reorganization will not result in any gain or loss for federal income tax purposes either to Core Fund, Growth Fund, Value Fund, Large Cap Fund or to the shareholders of any fund, except that Core Fund, Growth Fund, and Value
8
Table of Contents
Fund may recognize gain or loss with respect to assets (if any) that are subject to “mark-to-market” tax accounting due to the Target Funds’ tax years closing as of the date of the Reorganization.
For more information, shareholders of Core Fund please refer to the section entitled “The Proposed Transactions – Proposal 1 – Federal Income Tax Considerations.” For more information, shareholders of Growth Fund please refer to the section entitled “The Proposed Transactions – Proposal 2 – Federal Income Tax Considerations.” For more information, shareholders of Value Fund please refer to the section entitled “The Proposed Transactions – Proposal 3 – Federal Income Tax Considerations.”
How do the funds’ investment objectives, strategies, policies, and limitations compare?
The funds have the same investment objective. Each fund seeks capital appreciation. The Target Funds’ investment objective is currently fundamental, that is, subject to change only by shareholder approval. In a separate proxy statement, shareholders of the Target Funds are being asked to approve the conversion of the fundamental investment objective of each Target Fund to be non-fundamental. If shareholders of the Target Funds vote for the proposal, this change will allow the Board of Trustees to change the investment objective of the Target Funds in the future, without the delay and expense of a shareholder vote. The Acquiring Fund’s investment objective is not fundamental, subject to change by the Board of Trustees.
Although the funds have substantially similar principal investment strategies, there are some differences of which you should be aware. The following compares the principal investment strategies of Core Fund, Growth Fund, Value Fund, and Large Cap Fund:
| Core Fund |
Large Cap Fund | |
| The fund normally invests primarily in common stocks. | No corresponding strategy. | |
| The fund normally invests primarily in securities of companies with large market capitalizations. Although a universal definition of large market capitalization companies does not exist, for purposes of this fund, large market capitalization companies generally are defined as those companies with market capitalizations similar to those of | The fund normally invests at least 80% of its assets in securities and shares of funds with large market capitalizations. Although a universal definition of large market capitalization companies does not exist, for purposes of this fund, large market capitalization companies are generally defined as those whose market capitalization is similar to the | |
9
Table of Contents
| companies included in the S&P 500® Index. A company’s market capitalization is based on its current market capitalization or its market capitalization at the time of the fund’s investment. The size of the companies in the index changes with market conditions and the composition of the index. | market capitalization of companies in the Russell 1000® Index or the S&P 500® Index. A company’s market capitalization is based on its current market capitalization or its market capitalization at the time of the fund’s investment. The size of the companies in each index changes with market conditions and the composition of the index. | |
| The fund may invest in securities of foreign issuers in addition to securities of domestic issuers. | Same principal strategy. | |
| The fund is not constrained by any particular investment style. At any given time, the fund may tend to buy “growth” stocks or “value” stocks, or a combination of both types. | The fund is not constrained by any particular investment style. The fund will normally invest in a combination of “growth” and “value” stocks. | |
| The fund implements its investment strategies by investing directly in securities through one or more sub-advisers or indirectly in securities through one or more underlying funds, which in turn invest directly in securities. | Same principal strategy. | |
| The Adviser may allocate the fund’s assets among any number of underlying funds or sub-advisers at any time. The Adviser may adjust allocations among underlying funds or sub-advisers from time to time, including making no allocation at all to one or more sub-advisers. | Same principal strategy. | |
| The Adviser pursues a disciplined, benchmark-driven approach to portfolio construction, and monitors and adjusts allocations to underlying funds and sub-advisers as necessary to favor those underlying funds and sub-advisers that the Adviser believes will provide the most favorable outlook for achieving the fund’s investment objective. | Same principal strategy. | |
10
Table of Contents
| When determining how to allocate the fund’s assets among sub-advisers and underlying funds, the Adviser uses proprietary fundamental and quantitative research, considering factors including, but not limited to, performance in different market environments, manager experience and investment style, management company infrastructure, costs, asset size, and portfolio turnover. | Same principal strategy. | |
| The fund may invest in affiliated equity funds (i.e., Fidelity® funds, including mutual funds and ETFs), non-affiliated equity funds that participate in Fidelity’s FundsNetwork® and in non-affiliated ETFs. Underlying funds include both funds managed by Fidelity Management & Research Company LLC (FMR) (an affiliated company that, together with the Adviser, is part of Fidelity Investments) or an affiliate and funds managed by investment advisers other than Fidelity. Fidelity may receive service fees that typically are at an annual rate of up to 0.40% of a non-affiliated underlying fund’s average daily net assets attributable to purchases through Fidelity’s FundsNetwork®, though such fees may be higher or lower, or may be charged as transaction and/or account fees. In addition, the fund may invest in ETFs in transactions not occurring through Fidelity’s FundsNetwork®. | Same principal strategy. | |
| No corresponding strategy. | The Adviser generally classifies funds by reference to a fund’s name, policies, or classification by a third-party ranking or ratings organization at the time of investment. Investments in funds whose names, | |
11
Table of Contents
| policies or classifications change after purchase continue to be considered subject to the classification at time of investment for purposes of the 80% policy. | ||
| The Adviser may actively adjust the allocation of the fund’s assets at any time. For current information on fund holdings, please call 1-800-544-3455 or visit Fidelity’s web site at www.fidelity.com. For information on the underlying funds, see the underlying funds’ prospectuses. A copy of any underlying Fidelity® fund’s prospectus is available at www.fidelity.com or institutional.fidelity.com. For a copy of any other underlying fund’s prospectus, visit the web site of the company that manages or sponsors that underlying fund. | Same principal strategy. | |
| Common types of investment approaches that a sub-adviser may use in selecting investments for a fund include, but are not limited to, quantitative analysis, fundamental analysis, or a combination of both approaches. Quantitative analysis refers to programmatic models that analyze such factors as growth potential, valuation, liquidity, and investment risk based on data inputs. Fundamental analysis involves a bottom-up assessment of a company’s potential for success in light of factors including its financial condition, earnings outlook, strategy, management, industry position, and economic and market conditions. | Same principal strategy. | |
| It is not possible to predict the extent to which the fund’s assets will be invested by a particular sub-adviser at any given time and one or more sub-advisers may not be managing any assets for the fund at any given time. | Same principal strategy. | |
12
Table of Contents
| Growth Fund |
Large Cap Fund | |
| The fund normally invests primarily in common stocks. | No corresponding strategy. | |
| The fund invests in companies that are believed to have above-average growth potential. Growth may be measured by factors such as earnings or revenue. | No corresponding strategy. | |
| Companies with high growth potential tend to be companies with higher than average price/earnings (P/E) or price/book (P/B) ratios. Companies with strong growth potential often have new products, technologies, distribution channels, or other opportunities, or have a strong industry or market position. The stocks of these companies are often called “growth” stocks. | No corresponding strategy. | |
| The fund normally invests primarily in securities of companies with large market capitalizations. Although a universal definition of large market capitalization companies does not exist, for purposes of this fund, large market capitalization companies generally are defined as those companies with market capitalizations similar to those of companies included in the Russell 1000® Growth Index. A company’s market capitalization is based on its current market capitalization or its market capitalization at the time of the fund’s investment. The size of the companies in the index changes with market conditions and the composition of the index. | The fund normally invests at least 80% of its assets in securities and shares of funds with large market capitalizations. Although a universal definition of large market capitalization companies does not exist, for purposes of this fund, large market capitalization companies are generally defined as those whose market capitalization is similar to the market capitalization of companies in the Russell 1000® Index or the S&P 500® Index. A company’s market capitalization is based on its current market capitalization or its market capitalization at the time of the fund’s investment. The size of the companies in each index changes with market conditions and the composition of the index. | |
13
Table of Contents
| The fund may invest in securities of foreign issuers in addition to securities of domestic issuers. | Same principal strategy. | |
| No corresponding strategy. | The fund is not constrained by any particular investment style. The fund will normally invest in a combination of “growth” and “value” stocks. | |
| The fund implements its investment strategies by investing directly in securities through one or more sub-advisers or indirectly in securities through one or more underlying funds, which in turn invest directly in securities. | Same principal strategy. | |
| The Adviser may allocate the fund’s assets among any number of underlying funds or sub-advisers at any time. The Adviser may adjust allocations among underlying funds or sub-advisers from time to time, including making no allocation at all to one or more sub-advisers. | Same principal strategy. | |
| The Adviser pursues a disciplined, benchmark-driven approach to portfolio construction, and monitors and adjusts allocations to underlying funds and sub-advisers as necessary to favor those underlying funds and sub-advisers that the Adviser believes will provide the most favorable outlook for achieving the fund’s investment objective. | Same principal strategy. | |
| When determining how to allocate the fund’s assets among sub-advisers and underlying funds, the Adviser uses proprietary fundamental and quantitative research, considering factors including, but not limited to, performance in different market environments, manager experience and investment style, management company infrastructure, costs, asset size, and portfolio turnover. | Same principal strategy. | |
14
Table of Contents
| The fund may invest in affiliated funds (i.e., Fidelity® funds, including mutual funds and ETFs), non-affiliated funds that participate in Fidelity’s FundsNetwork® and in non-affiliated ETFs. Underlying funds include both funds managed by FMR (an affiliated company that, together with the Adviser, is part of Fidelity Investments) or an affiliate and funds managed by investment advisers other than Fidelity. Fidelity may receive service fees that typically are at an annual rate of up to 0.40% of a non-affiliated underlying fund’s average daily net assets attributable to purchases through Fidelity’s FundsNetwork®, though such fees may be higher or lower, or may be charged as transaction and/or account fees. In addition, the fund may invest in ETFs in transactions not occurring through Fidelity’s FundsNetwork®. | The fund may invest in affiliated equity funds (i.e., Fidelity® funds, including mutual funds and ETFs), non-affiliated equity funds that participate in Fidelity’s FundsNetwork® and in non-affiliated ETFs. Underlying funds include both funds managed by FMR (an affiliated company that, together with the Adviser, is part of Fidelity Investments) or an affiliate and funds managed by investment advisers other than Fidelity. Fidelity may receive service fees that typically are at an annual rate of up to 0.40% of a non-affiliated underlying fund’s average daily net assets attributable to purchases through Fidelity’s FundsNetwork®, though such fees may be higher or lower, or may be charged as transaction and/or account fees. In addition, the fund may invest in ETFs in transactions not occurring through Fidelity’s FundsNetwork®. | |
| No corresponding strategy. | The Adviser generally classifies funds by reference to a fund’s name, policies, or classification by a third-party ranking or ratings organization at the time of investment. Investments in funds whose names, policies or classifications change after purchase continue to be considered subject to the classification at time of investment for purposes of the 80% policy. | |
| The Adviser may actively adjust the allocation of the fund’s assets at any time. For current information on fund holdings, please call 1-800-544-3455 or visit Fidelity’s web site at www.fidelity.com. For information on | Same principal strategy. | |
15
Table of Contents
| the underlying funds, see the underlying funds’ prospectuses. A copy of any underlying Fidelity® fund’s prospectus is available at www.fidelity.com or institutional.fidelity.com. For a copy of any other underlying fund’s prospectus, visit the web site of the company that manages or sponsors that underlying fund. | ||
| Common types of investment approaches that a sub-adviser may use in selecting investments for a fund include, but are not limited to, quantitative analysis, fundamental analysis, or a combination of both approaches. Quantitative analysis refers to programmatic models that analyze such factors as growth potential, valuation, liquidity, and investment risk based on data inputs. Fundamental analysis involves a bottom-up assessment of a company’s potential for success in light of factors including its financial condition, earnings outlook, strategy, management, industry position, and economic and market conditions. | Same principal strategy. | |
| It is not possible to predict the extent to which the fund’s assets will be invested by a particular sub-adviser at any given time and one or more sub-advisers may not be managing any assets for the fund at any given time. | Same principal strategy. | |
| Value Fund |
Large Cap Fund | |
| The fund normally invests primarily in common stocks. | No corresponding strategy. | |
| The fund invests in companies that are believed to be undervalued in the marketplace in relation to factors such as the company’s assets, sales, | No corresponding strategy. | |
16
Table of Contents
| earnings, growth potential, or cash flow, or in relation to securities of other companies in the same industry. Companies with these characteristics tend to have lower than average P/B, price/sales (P/S), or P/E ratios. The stocks of these companies are often called “value” stocks. | ||
| The fund normally invests primarily in securities of companies with large market capitalizations. Although a universal definition of large market capitalization companies does not exist, for purposes of this fund, large market capitalization companies generally are defined as those companies with market capitalizations similar to those of companies included in the Russell 1000® Value Index. A company’s market capitalization is based on its current market capitalization or its market capitalization at the time of the fund’s investment. The size of the companies in the index changes with market conditions and the composition of the index. | The fund normally invests at least 80% of its assets in securities and shares of funds with large market capitalizations. Although a universal definition of large market capitalization companies does not exist, for purposes of this fund, large market capitalization companies are generally defined as those whose market capitalization is similar to the market capitalization of companies in the Russell 1000® Index or the S&P 500® Index. A company’s market capitalization is based on its current market capitalization or its market capitalization at the time of the fund’s investment. The size of the companies in each index changes with market conditions and the composition of the index. | |
| The fund may invest in securities of foreign issuers in addition to securities of domestic issuers. | Same principal strategy. | |
| No corresponding strategy. | The fund is not constrained by any particular investment style. The fund will normally invest in a combination of “growth” and “value” stocks. | |
| The fund implements its investment strategies by investing directly in securities through one or more sub-advisers or indirectly in securities through one or more underlying funds, which in turn invest directly in securities. | Same principal strategy. | |
17
Table of Contents
| The Adviser may allocate the fund’s assets among any number of underlying funds or sub-advisers at any time. The Adviser may adjust allocations among underlying funds or sub-advisers from time to time, including making no allocation at all to one or more sub-advisers. | Same principal strategy. | |
| The Adviser pursues a disciplined, benchmark-driven approach to portfolio construction, and monitors and adjusts allocations to underlying funds and sub-advisers as necessary to favor those underlying funds and sub-advisers that the Adviser believes will provide the most favorable outlook for achieving the fund’s investment objective. | Same principal strategy. | |
| When determining how to allocate the fund’s assets among sub-advisers and underlying funds, the Adviser uses proprietary fundamental and quantitative research, considering factors including, but not limited to, performance in different market environments, manager experience and investment style, management company infrastructure, costs, asset size, and portfolio turnover. | Same principal strategy. | |
| The fund may invest in affiliated funds (i.e., Fidelity® funds, including mutual funds and ETFs), non-affiliated funds that participate in Fidelity’s FundsNetwork® and in non-affiliated ETFs. Underlying funds include both funds managed by FMR (an affiliated company that, together with the Adviser, is part of Fidelity Investments) or an affiliate and funds managed by investment advisers other than Fidelity. Fidelity may receive service fees that typically are at an annual rate of up to 0.40% of a | The fund may invest in affiliated equity funds (i.e., Fidelity® funds, including mutual funds and ETFs), non-affiliated equity funds that participate in Fidelity’s FundsNetwork® and in non-affiliated ETFs. Underlying funds include both funds managed by FMR (an affiliated company that, together with the Adviser, is part of Fidelity Investments) or an affiliate and funds managed by investment advisers other than Fidelity. Fidelity may receive service fees that typically are | |
18
Table of Contents
| non-affiliated underlying fund’s average daily net assets attributable to purchases through Fidelity’s FundsNetwork®, though such fees may be higher or lower, or may be charged as transaction and/or account fees. In addition, the fund may invest in ETFs in transactions not occurring through Fidelity’s FundsNetwork®. | at an annual rate of up to 0.40% of a non-affiliated underlying fund’s average daily net assets attributable to purchases through Fidelity’s FundsNetwork®, though such fees may be higher or lower, or may be charged as transaction and/or account fees. In addition, the fund may invest in ETFs in transactions not occurring through Fidelity’s FundsNetwork®. | |
| No corresponding strategy. | The Adviser generally classifies funds by reference to a fund’s name, policies, or classification by a third-party ranking or ratings organization at the time of investment. Investments in funds whose names, policies or classifications change after purchase continue to be considered subject to the classification at time of investment for purposes of the 80% policy. | |
| The Adviser may actively adjust the allocation of the fund’s assets at any time. For current information on fund holdings, please call 1-800-544-3455 or visit Fidelity’s web site at www.fidelity.com. For information on the underlying funds, see the underlying funds’ prospectuses. A copy of any underlying Fidelity® fund’s prospectus is available at www.fidelity.com or institutional.fidelity.com. For a copy of any other underlying fund’s prospectus, visit the web site of the company that manages or sponsors that underlying fund. | Same principal strategy. | |
| Common types of investment approaches that a sub-adviser may use in selecting investments for a fund include, but are not limited to, quantitative analysis, fundamental analysis, or a combination of both | Same principal strategy. | |
19
Table of Contents
| approaches. Quantitative analysis refers to programmatic models that analyze such factors as growth potential, valuation, liquidity, and investment risk based on data inputs. Fundamental analysis involves a bottom-up assessment of a company’s potential for success in light of factors including its financial condition, earnings outlook, strategy, management, industry position, and economic and market conditions. | ||
| It is not possible to predict the extent to which the fund’s assets will be invested by a particular sub-adviser at any given time and one or more sub-advisers may not be managing any assets for the fund at any given time. | Same principal strategy. | |
For a comparison of the principal risks associated with the funds’ principal investment strategies, please refer to the section entitled “Comparison of Principal Risk Factors.”
Although the funds have substantially similar fundamental and non-fundamental investment policies and limitations, there are some differences of which you should be aware. The following summarizes the investment policy and limitation differences between Core Fund, Growth Fund, Value Fund, and Large Cap Fund:
| Core Fund |
Large Cap Fund | |
| Fundamental policies and limitations (subject to change only by shareholder vote) | Fundamental policies and limitations (subject to change only by shareholder vote) | |
| Senior Securities. The fund may not issue senior securities, except in connection with the insurance program established by the fund pursuant to an exemptive order issued by the Securities and Exchange Commission or as otherwise permitted under the Investment Company Act of 1940. | Senior Securities. The fund may not issue senior securities, except as permitted under the Investment Company Act of 1940. | |
20
Table of Contents
| Concentration. The fund may not purchase the securities of any issuer (other than securities issued or guaranteed by the U.S. Government or any of its agencies or instrumentalities) if, as a result, more than 25% of the fund’s total assets would be invested in the securities of companies whose principal business activities are in the same industry. | Concentration. The fund may not purchase the securities of any issuer (other than securities issued or guaranteed by the U.S. Government or any of its agencies or instrumentalities) if, as a result, more than 25% of the fund’s total assets would be invested in the securities of companies whose principal business activities are in the same industry (provided that investments in other investment companies shall not be considered an investment in any particular industry for purposes of this investment limitation). | |
| Non-Fundamental Policies and Limitations | Non-Fundamental Policies and Limitations | |
| No corresponding policy or limitation. | Short Sales. The fund does not currently intend to sell securities short, unless it owns or has the right to obtain securities equivalent in kind and amount to the securities sold short, and provided that transactions in futures contracts, options, and swaps are not deemed to constitute selling securities short. | |
| Growth Fund |
Large Cap Fund | |
| Fundamental policies and limitations (subject to change only by shareholder vote) | Fundamental policies and limitations (subject to change only by shareholder vote) | |
| Senior Securities. The fund may not issue senior securities, except in connection with the insurance program established by the fund pursuant to an exemptive order | Senior Securities. The fund may not issue senior securities, except as permitted under the Investment Company Act of 1940. | |
21
Table of Contents
| issued by the Securities and Exchange Commission or as otherwise permitted under the Investment Company Act of 1940. | ||
| Concentration. The fund may not purchase the securities of any issuer (other than securities issued or guaranteed by the U.S. Government or any of its agencies or instrumentalities) if, as a result, more than 25% of the fund’s total assets would be invested in the securities of companies whose principal business activities are in the same industry. | Concentration. The fund may not purchase the securities of any issuer (other than securities issued or guaranteed by the U.S. Government or any of its agencies or instrumentalities) if, as a result, more than 25% of the fund’s total assets would be invested in the securities of companies whose principal business activities are in the same industry (provided that investments in other investment companies shall not be considered an investment in any particular industry for purposes of this investment limitation). | |
| Non-Fundamental Policies and Limitations | Non-Fundamental Policies and Limitations | |
| Short Sales. The fund does not currently intend to sell securities short, unless it owns or has the right to obtain securities equivalent in kind and amount to the securities sold short, and provided that transactions in futures contracts and options are not deemed to constitute selling securities short. | Short Sales. The fund does not currently intend to sell securities short, unless it owns or has the right to obtain securities equivalent in kind and amount to the securities sold short, and provided that transactions in futures contracts, options, and swaps are not deemed to constitute selling securities short. | |
| Value Fund |
Large Cap Fund | |
| Fundamental policies and limitations (subject to change only by shareholder vote) | Fundamental policies and limitations (subject to change only by shareholder vote) | |
| Senior Securities. The fund may not issue senior securities, except in connection with the insurance | Senior Securities. The fund may not issue senior securities, except as permitted under the Investment Company Act of 1940. | |
22
Table of Contents
| program established by the fund pursuant to an exemptive order issued by the Securities and Exchange Commission or as otherwise permitted under the Investment Company Act of 1940. | ||
| Concentration. The fund may not purchase the securities of any issuer (other than securities issued or guaranteed by the U.S. Government or any of its agencies or instrumentalities) if, as a result, more than 25% of the fund’s total assets would be invested in the securities of companies whose principal business activities are in the same industry. | Concentration. The fund may not purchase the securities of any issuer (other than securities issued or guaranteed by the U.S. Government or any of its agencies or instrumentalities) if, as a result, more than 25% of the fund’s total assets would be invested in the securities of companies whose principal business activities are in the same industry (provided that investments in other investment companies shall not be considered an investment in any particular industry for purposes of this investment limitation). | |
| Non-Fundamental Policies and Limitations | Non-Fundamental Policies and Limitations | |
| Short Sales. The fund does not currently intend to sell securities short, unless it owns or has the right to obtain securities equivalent in kind and amount to the securities sold short, and provided that transactions in futures contracts and options are not deemed to constitute selling securities short. | Short Sales. The fund does not currently intend to sell securities short, unless it owns or has the right to obtain securities equivalent in kind and amount to the securities sold short, and provided that transactions in futures contracts, options, and swaps are not deemed to constitute selling securities short. | |
Except as noted above, the funds have the same fundamental and non-fundamental investment policies and limitations.
For more information about the funds’ investment objectives, strategies, policies, and limitations, please refer to the “Investment Details” section of the funds’ Prospectuses, and to the “Investment Policies and Limitations“ section of the funds’ Statements of Additional Information, each of which are incorporated herein by reference.
23
Table of Contents
Following the Reorganization, the combined fund will be managed in accordance with the investment objective, strategies, policies, and limitations of Large Cap Fund.
How do the funds’ management and distribution arrangements compare?
The following summarizes the management and distribution arrangements of Core Fund, Growth Fund, Value Fund, and Large Cap Fund:
Management of the Funds
The principal business address of Strategic Advisers, each fund’s investment adviser, is 245 Summer Street, Boston, Massachusetts 02210.
As the manager, Strategic Advisers has overall responsibility for directing the funds’ investments and handling their business affairs. As of December 31, 2019, the Adviser had approximately $436.6 billion in discretionary assets under management, and approximately $3.2 trillion when combined with all of its affiliates’ assets under management.
Each fund employs a multi-manager and a fund of funds investment structure. Strategic Advisers may allocate each fund’s assets among any number of sub-advisers or underlying funds. Strategic Advisers may adjust allocations among underlying funds or sub-advisers from time to time, including making no allocation to, or terminating the sub-advisory contract with, a sub-adviser. The table below lists the sub-advisory agreements in effect for each fund.
|
Sub-Adviser* |
Fund(s) |
As of Date of Assets under Management |
Assets Under Management | |||
| AllianceBernstein L.P. | Core Fund Large Cap Fund |
May 31, 2020 | $596 billion (discretionary) | |||
| Aristotle Capital Management, LLC | Core Fund Value Fund Large Cap Fund |
May 31, 2020 | $30.0 billion (discretionary) | |||
| Boston Partners Global Investors, Inc. | Core Fund Value Fund |
May 31, 2020 | $66.3 billion | |||
| Brandywine Global Investment Management, LLC | Core Fund Value Fund Large Cap Fund |
May 31, 2020 | 65.0 billion (discretionary) | |||
24
Table of Contents
| ClariVest Asset Management LLC | Core Fund Growth Fund Large Cap Fund |
May 31, 2020 | 5.1 billion (discretionary) | |||
| ClearBridge Investments, LLC | Core Fund Growth Fund Large Cap Fund |
March 31, 2020 | $120.5 billion | |||
| FIAM LLC | Core Fund Growth Fund Value Fund Large Cap Fund |
December 31, 2019 | $102.9 billion (discretionary) | |||
| Geode Capital Management, LLC | Core Fund Growth Fund Value Fund Large Cap Fund |
December 31, 2019 | $554 billion (discretionary) | |||
| Invesco Advisers, Inc. | Core Fund Large Cap Fund |
March 31, 2020 | $1,053.4 billion (discretionary) | |||
| J.P. Morgan Investment Management Inc. | Core Fund Value Fund Large Cap Fund |
March 31, 2020 | $1.89 trillion | |||
| Loomis, Sayles & Company, L.P. | Core Fund Growth Fund Large Cap Fund |
May 31, 2020 | $301 billion | |||
| LSV Asset Management | Core Fund Value Fund Large Cap Fund |
May 31, 2020 | $90 billion (discretionary) | |||
| Massachusetts Financial Services Company | Core Fund Growth Fund |
May 31, 2020 | $494 billion | |||
| PineBridge Investments LLC | Core Fund Large Cap Fund |
May 31, 2020 | $103.37 billion | |||
| Principal Global Investors, LLC | Core Fund Growth Fund Large Cap Fund |
March 31, 2020 | $437.08 billion | |||
| T. Rowe Price Associates, Inc. | Core Fund Large Cap Fund |
March 31, 2020 | $1.01 trillion | |||
| * | Not all sub-advisers are allocated assets to manage under each sub-advisory agreement. |
25
Table of Contents
FIAM has retained FMR Investment Management (UK) Limited, Fidelity Management & Research (Hong Kong) Limited, and Fidelity Management & Research (Japan) Limited to serve as sub-subadviser for Large Cap Fund. As of December 31, 2019, FMR UK had approximately $23.9 billion in discretionary assets under management. As of December 31, 2019, FMR H.K. had approximately $16.5 billion in discretionary assets under management.
John A. Stone is lead portfolio manager of each fund. Mr. Stone joined Fidelity Investments in 1993 as a customer service team leader and also worked as a financial analyst and investment strategist. In 2006, Mr. Stone left Fidelity Investments and joined Mercer Global Investments as a portfolio manager and Principal. Since returning to Fidelity Investments in 2008, Mr. Stone has worked as a portfolio manager. Mr. Stone is expected to continue to be responsible for portfolio management of the combined fund after each Reorganization.
Gopalakrishnan Anantanatarajan is co-manager of Value Fund and Large Cap Fund. Since joining Fidelity Investments in 2006, Mr. Anantanatarajan has worked as a senior research analyst, research analyst, research associate, a senior research associate, and portfolio manager. Mr. Anantanatarajan is expected to continue to be responsible for portfolio management of the combined fund after each Reorganization.
Niall Devitt is co-manager of Core Fund, Growth Fund, and Large Cap Fund. Mr. Devitt joined Fidelity Investments in 2001 and has been a part of Strategic Advisers since 2006 where he has worked as a research associate, analyst, and portfolio manager. Mr. Devitt is expected to continue to be responsible for portfolio management of the combined fund after each Reorganization.
For information about the compensation of, any other accounts managed by, and any fund shares held by a fund’s portfolio manager(s), please refer to the “Management Contract” section of each fund’s Statement of Additional Information, which are incorporated herein by reference.
Each fund has entered into a management contract with Strategic Advisers, pursuant to which Strategic Advisers furnishes investment advisory and other services.
Under Core Fund’s all-inclusive management contract, Strategic Advisers is responsible for paying certain of the fund’s operating expenses such as, for example, typesetting, printing, and mailing proxy materials to shareholders, legal expenses, fees of the custodian, auditor, and Interested Trustees, the fund’s proportionate share of insurance premiums
26
Table of Contents
and the costs of registering shares under federal securities laws and making necessary filings under state securities laws. Core Fund is responsible for paying fees and expenses of the Independent Trustees, interest on borrowings, taxes, shareholder charges (if any) associated with investing in the underlying funds, prime brokerage fees and expenses, and such non-recurring expenses as may arise, including costs of any litigation to which the fund may be a party, and any obligation it may have to indemnify its officers and Trustees with respect to litigation.
In contrast, under Growth Fund’s, Value Fund’s, and Large Cap Fund’s management contract, Strategic Advisers is not required to pay such operating expenses.
Each fund pays a management fee to the Adviser. The management fee is calculated and paid to the Adviser every month. Each fund’s management fee is calculated by adding the annual rate of 0.25% of the fund’s average daily net assets throughout the month plus the total fees payable monthly to the fund’s sub-advisers, if any, based upon each sub-adviser’s respective allocated portion of the fund’s assets. Because the fund’s management fee rate may fluctuate, the fund’s management fee may be higher or lower in the future. However, each fund’s maximum aggregate annual management fee, as a percentage of its average daily net assets, will not exceed the following rates:
| Name of Fund |
Maximum Management Fee Rate |
|||
| Core Fund |
1.00 | % | ||
| Growth Fund |
0.95 | % | ||
| Value Fund |
0.70 | % | ||
| Large Cap Fund |
0.65 | % | ||
The basis for the Board of Trustees approving the management contract and sub-advisory agreements for Core Fund, Growth Fund, and Value Fund is available in each fund’s semi-annual report for the fiscal period ended November 30, 2019 and in Core Fund’s and Growth Fund’s annual report for the fiscal period ended May 31, 2020.
The basis for the Board of Trustees approving the management contract, sub-advisory agreements, and sub-subadvisory agreements for Large Cap Fund will be included in the fund’s semi-annual report for the fiscal period ending November 30, 2020, when available.
If the Reorganizations are approved, the combined fund will retain Large Cap Fund’s management fee structure, requiring payment of a management fee and all fund operating expenses separately.
For more information about fund management, please refer to the “Fund Management” section of the funds’ Prospectuses, and to the “Control of
27
Table of Contents
Investment Advisers” and “Management Contract” sections of the funds’ Statements of Additional Information, each of which are incorporated herein by reference.
Expense Arrangements
Strategic Advisers has contractually agreed to waive a portion of Core Fund’s, Growth Fund’s, Value Fund’s, and Large Cap Fund’s management fee in an amount equal to 0.25% of the fund’s average daily net assets through [September 30, 2023].
For more information about the funds’ fees and operating expenses, please refer to the funds’ Prospectuses, which are incorporated herein by reference, and to “Annual Fund Operating Expenses” below.
If the proposed Reorganizations are not approved, the funds will maintain current expense structures.
Distribution of Fund Shares
The principal business address of FDC, each fund’s principal underwriter and distribution agent, is 900 Salem Street, Smithfield, Rhode Island 02917.
Each fund has adopted a Distribution and Service Plan pursuant to Rule 12b-1 under the Investment Company Act of 1940 (1940 Act) that recognizes that Strategic Advisers may use its management fee revenues, as well as its past profits or its resources from any other source, to pay FDC for expenses incurred in connection with providing services intended to result in the sale of fund shares and/or shareholder support services. A fund’s Distribution and Service Plan does not authorize payments by the fund other than those that are to be made to Strategic Advisers under the fund’s management contract.
If the Reorganizations are approved, the Distribution and Service Plan for the combined fund will remain unchanged.
For more information about fund distribution, please refer to the “Fund Distribution” section of the funds’ Prospectuses, and to the “Distribution Services” section of the funds’ Statements of Additional Information, each of which are incorporated herein by reference.
How do the funds’ fees and operating expenses compare, and what are the combined fund’s fees and operating expenses estimated to be following the Reorganizations?
The following tables allow you to compare the fees and expenses of each fund and to analyze the pro forma estimated fees and expenses of the combined fund.
28
Table of Contents
Annual Fund Operating Expenses
The following tables show the fees and expenses of Core Fund, Growth Fund, Value Fund, and the weighted average expenses for Core Fund, Growth Fund, and Value Fund combined (under “Combined Weighted Average Expenses”) for the 12 months ended May 31, 2020, adjusted to reflect current contractual arrangements for each fund, and the pro forma estimated fees and expenses of the combined fund based on the same time period after giving effect to the Reorganizations. The Large Cap Fund Pro Forma Combined fee table presented below is identical to the fee table included in the registration statement for the Large Cap Fund, as the fund will commence operations only if the Proposals are approved. Annual fund operating expenses are paid by each fund. Because substantially all shareholders of each Target Fund hold all three Target Funds, and in similar proportions, the Weighted Average Expenses of Core Fund, Growth Fund and Value Fund provide an appropriate comparison, reflecting the managed account client experience.
The combined pro forma expenses for Large Cap Fund shown below assume that all three Reorganizations occur.
As shown below, the Reorganization is expected to result in lower total operating expenses for Core Fund and Growth Fund. As substantially all shareholders who own one Target Fund also own shares of all three Target Funds, and in similar proportions, the Reorganization is expected to result in lower total operating expenses for shareholders when comparing the combined weighted average expense of all three Target Funds to the total operating expenses of the combined Large Cap Fund.
Shareholder Fees (paid directly from your investment)
| Core Fund |
Growth Fund |
Value Fund |
Combined Weighted Average Expense |
Large Cap Fund Pro Forma Combined(a) |
||||||||||||||||
| Maximum sales charge (load) on purchases (as a % of offering price) |
None | None | None | None | None | |||||||||||||||
| Maximum contingent deferred sales charge (as a % of the lesser of original purchase price or redemption proceeds) |
None | None | None | None | None | |||||||||||||||
| (a) | The expenses for Large Cap Fund Pro Forma Combined are based on expenses calculated for and included in the registration statement for Large Cap Fund, which is expected to commence operations in November 2020. |
29
Table of Contents
Annual Operating Expenses
(expenses that you pay each year as a % of the value of your investment)
| Core Fund |
Growth Fund |
Value Fund |
Combined Weighted Average Expense |
Large Cap Fund Pro Forma Combined |
||||||||||||||||
| Management fee (fluctuates based on the fund’s allocation among underlying funds and sub-advisers)(b) |
0.45 | %(a) | 0.36 | %(a) | 0.44 | %(a) | 0.43 | % | 0.42 | %(d)(e) | ||||||||||
| Distribution and/or Service (12b-1) fees |
None | None | None | None | None | |||||||||||||||
| Other expenses |
0.00 | % | 0.00 | % | 0.00 | % | 0.00 | % | 0.00 | %(d) | ||||||||||
| Acquired fund fees and expenses |
0.10 | % | 0.32 | %(a) | 0.04 | %(a) | 0.13 | % | 0.08 | %(d) | ||||||||||
|
|
|
|
|
|
|
|
|
|
|
|||||||||||
| Total annual operating expenses(a)(c) |
0.55 | % | 0.68 | % | 0.48 | % | 0.56 | % | 0.50 | % | ||||||||||
| Fee waiver and/or expense reimbursement(b) |
0.25 | % | 0.25 | % | 0.25 | % | 0.25 | % | 0.25 | % | ||||||||||
|
|
|
|
|
|
|
|
|
|
|
|||||||||||
| Total annual operating expenses after fee waiver and/or expense reimbursement(a)(c) |
0.30 | % | 0.43 | % | 0.23 | % | 0.31 | % | 0.25 | % | ||||||||||
| (a) | Based on historical expenses, adjusted to reflect current fees. |
| (b) | Strategic Advisers has contractually agreed that the funds’ maximum aggregate annual management fee will not exceed 1.00%, 0.95%, 0.70%, and 0.65% for Core Fund, Growth Fund, Value Fund, and Large Cap Fund, respectively, of their average daily net assets. In addition, Strategic Advisers has contractually agreed to waive a portion of the funds’ management fee in an amount equal to 0.25% of each fund’s average daily net assets. This arrangement will remain in effect through [September 30, 2023], and neither Strategic Advisers nor any of its affiliates retain the ability to be repaid with respect to this arrangement. Strategic Advisers may not terminate this arrangement without the approval of the Board of Trustees. |
30
Table of Contents
| (c) | Differs from the ratios of expenses to average net assets in the Financial Highlights section of the prospectus, in part, because of acquired fund fees and expenses. |
| (d) | Based on estimated amounts for the current fiscal year. |
| (e) | The expenses for Large Cap Fund Pro Forma Combined are based on expenses calculated for and included in the registration statement for Large Cap Fund, which is expected to commence operations in November 2020. |
Examples of Effect of Fund Expenses
The following tables illustrate the expenses on a hypothetical $10,000 investment in each fund under the current and pro forma (combined Large Cap Fund) expenses calculated at the rates stated above, assuming a 5% annual return after giving effect to the Reorganizations. The tables illustrate how much a shareholder would pay in total expenses if the shareholder sells all of his or her shares at the end of each time period indicated.
| Core Fund |
Growth Fund |
Value Fund |
Combined Weighted Average Expense |
Large Cap Fund Pro Forma Combined(a) |
||||||||||||||||
| 1 year |
$ | 31 | $ | 44 | $ | 24 | $ | 32 | $ | 26 | ||||||||||
| 3 years |
$ | 97 | $ | 138 | $ | 74 | $ | 100 | $ | 80 | ||||||||||
| 5 years |
$ | 219 | $ | 291 | $ | 180 | $ | 224 | $ | 191 | ||||||||||
| 10 years |
$ | 604 | $ | 762 | $ | 518 | $ | 616 | $ | 542 | ||||||||||
| (a) | The expenses for Large Cap Fund Pro Forma Combined are based on expenses calculated for and included in the registration statement for Large Cap Fund, which is expected to commence operations in November 2020. |
These examples assume that all dividends and other distributions are reinvested and that the percentage amounts listed under Annual Operating Expenses remain the same in the years shown. These examples illustrate the effect of expenses, but are not meant to suggest actual or expected expenses, which may vary. The assumed return of 5% is not a prediction of, and does not represent, actual or expected performance of any fund.
The combined fund pro forma expenses shown above assume that all of the Reorganizations occur.
31
Table of Contents
Do the procedures for purchasing and redeeming shares of the funds differ?
No. The procedures for purchasing and redeeming shares of the funds are the same. If all Reorganizations are approved, the procedures for purchasing and redeeming shares of the combined fund will remain unchanged.
For information about the procedures for purchasing and redeeming the funds’ shares, please refer to the “Additional Information about the Purchase and Sale of Shares” section of the funds’ Prospectuses, and to the “Buying and Selling Information” section of the funds’ Statements of Additional Information, each of which are incorporated herein by reference.
Do the funds’ exchange privileges differ?
No. The exchange privileges currently offered by the funds are the same. If all Reorganizations are approved, the exchange privilege offered by the combined fund will remain unchanged.
For more information about the funds’ exchange privileges, please refer to the “Exchanging Shares” section of the funds’ Prospectuses, and to the “Buying and Selling Information” section of the funds’ Statements of Additional Information, each of which are incorporated herein by reference.
Do the funds’ dividend and distribution policies differ?
No. The funds’ dividend and distribution policies are the same. If all Reorganizations are approved, the dividend and distribution policies of the combined fund will remain unchanged.
On or before the Closing Date, Core Fund, Growth Fund, and Value Fund may declare additional dividends or other distributions in order to distribute substantially all of its investment company taxable income and net realized capital gain.
Whether or not the Reorganizations are approved, each of Core Fund, Growth Fund, and Value Fund is required to recognize gain or loss on both October 31st in connection with the end of its calendar year and on the last day of its taxable year (currently May 31st) on any assets subject to “mark-to-market” tax accounting held by the fund. If the Reorganizations are approved, gains or losses on such assets held on the Closing Date by Core Fund, Growth Fund, and Value Fund may be required to be recognized on the Closing Date.
32
Table of Contents
For more information about the funds’ dividend and distribution policies, please refer to the “Dividends and Capital Gain Distributions” section of the funds’ Prospectuses, and to the “Distributions and Taxes” section of the funds’ Statements of Additional Information, each of which are incorporated herein by reference.
Who bears the expenses associated with the Reorganizations?
For Core Fund, pursuant to its all-inclusive management contract, Strategic Advisers will bear the cost of the Reorganization.
For Growth Fund and Value Fund, each respective fund will bear the cost of the Reorganization.
Any expenses associated with the Reorganization that are incurred after the completion of the merger transactions will be borne by the Large Cap Fund.
For more information, please refer to the section entitled “Voting Information – Solicitation of Proxies; Expenses.”
COMPARISON OF PRINCIPAL RISK FACTORS
Many factors affect each fund’s performance. Developments that disrupt global economies and financial markets, such as pandemics and epidemics, may magnify factors that affect a fund’s performance. Each fund’s share price changes daily based on the performance of the underlying funds and securities in which it invests and on changes in market conditions and interest rates and in response to other economic, political, or financial developments. A fund’s reaction to these developments will be affected by the types of underlying funds and securities in which each fund invests, the financial condition, industry and economic sector, and geographic location of an issuer, and each fund’s level of investment in the securities of that underlying fund or issuer. If the Adviser’s or a sub-adviser’s allocation strategies do not work as intended, a fund may not achieve its objective. A portfolio manager’s evaluations and assumptions in selecting underlying funds or individual securities may be incorrect in view of actual market conditions. When your shares are sold they may be worth more or less than what you paid for them, which means that you could lose money by investing in a fund.
The following is a summary of the principal risks associated with an investment in the funds. Because the funds have identical investment objectives and substantially similar strategies as described above, the funds are subject to substantially similar investment risks. Because the funds have some different principal investment strategies as described above, the funds are also subject to some different investment risks, of which you should be aware.
33
Table of Contents
What risks are associated with an investment in all of the funds?
Each fund is subject to the following principal risks:
Multiple Sub-Adviser Risk. Separate investment decisions and the resulting purchase and sale activities of the fund’s sub-advisers might adversely affect the fund’s performance or lead to disadvantageous tax consequences.
Investing in Other Funds. Regulatory restrictions may limit the amount that one fund can invest in another, which means that the fund’s manager may not be able to invest as much as it wants to in some other funds. The fund bears all risks of investment strategies employed by the underlying funds, including the risk that the underlying funds will not meet their investment objectives.
Stock Market Volatility. Stock markets are volatile and can decline significantly in response to adverse issuer, political, regulatory, market, or economic developments. Different parts of the market, including different market sectors, and different types of securities can react differently to these developments.
Foreign Exposure. Foreign markets can be more volatile than the U.S. market due to increased risks of adverse issuer, political, regulatory, market, or economic developments and can perform differently from the U.S. market.
Industry Exposure. Market conditions, interest rates, and economic, regulatory, or financial developments could significantly affect a single industry or group of related industries.
Issuer-Specific Changes. The value of an individual security or particular type of security can be more volatile than, and can perform differently from, the market as a whole.
Investing in ETFs. ETFs may trade in the secondary market at prices below the value of their underlying portfolios and may not be liquid. ETFs that track an index are subject to tracking error and may be unable to sell poorly performing assets that are included in their index or other benchmark.
Quantitative Investing. Securities selected using quantitative analysis can perform differently from the market as a whole as a result of the factors used in the analysis, the weight placed on each factor, and changes in the factors’ historical trends.
34
Table of Contents
What additional risks are associated with an investment in Growth Fund?
Growth Fund is subject to the following principal risks:
“Growth” Investing. “Growth” stocks can perform differently from the market as a whole and other types of stocks and can be more volatile than other types of stocks.
What additional risks are associated with an investment in Value Fund?
Value Fund is subject to the following principal risks:
“Value” Investing. “Value” stocks can perform differently from the market as a whole and other types of stocks and can continue to be undervalued by the market for long periods of time.
What additional risks are associated with an investment in Large Cap Fund?
Large Cap Fund is subject to the following principal risks, which are not principal risks generally associated with an investment in Core Fund, Growth Fund, and Value Fund, as applicable:
“Growth” Investing. “Growth” stocks can perform differently from the market as a whole and other types of stocks and can be more volatile than other types of stocks.
“Value” Investing. “Value” stocks can perform differently from the market as a whole and other types of stocks and can continue to be undervalued by the market for long periods of time.
For more information about the principal risks associated with an investment in the funds, please refer to the “Investment Details” section of the funds’ Prospectuses, and to the “Investment Policies and Limitations“ section of the funds’ Statements of Additional Information, each of which are incorporated herein by reference.
How do the funds compare in terms of their performance?
The following information provides some indication of the risks associated with an investment in the funds. The information illustrates the changes in Core Fund’s, Growth Fund’s, and Value Fund’s performance of each fund’s shares from year to year and compares Core Fund’s, Growth Fund’s, and Value Fund’s performance of each fund’s shares to the performance of a securities market index over various periods of time. The index description appears in the “Additional Index Information” section of the prospectus. Past performance (before and after taxes) is not an indication of future performance. Performance information for Large Cap Fund is not included because Large Cap Fund is a newly created fund that does not have any historical performance. If the proposed Reorganizations are approved, Large Cap Fund will assume the performance record of Core Fund.
35
Table of Contents
Year-by-Year Returns
Core Fund
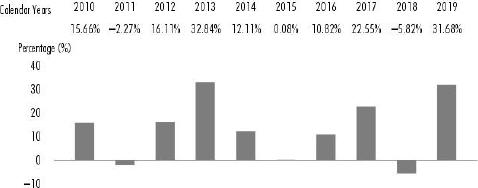
Growth Fund
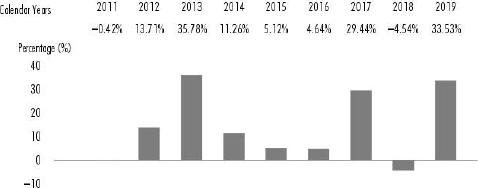
Value Fund
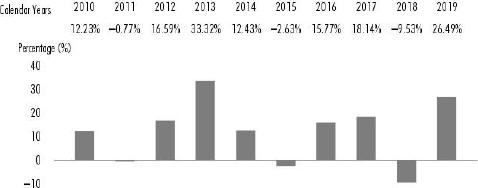
36
Table of Contents
Average Annual Returns
After-tax returns are calculated using the historical highest individual federal marginal income tax rates, but do not reflect the impact of state or local taxes. Actual after-tax returns may differ depending on your individual circumstances. The after-tax returns shown are not relevant if you hold your shares in a retirement account or in another tax-deferred arrangement, such as an employee benefit plan (profit sharing, 401(k), or 403(b) plan). Return After Taxes on Distributions and Sale of Fund Shares may be higher than other returns for the same period due to a tax benefit of realizing a capital loss upon the sale of fund shares.
Core Fund
| For the periods ended December 31, 2019 | Past 1 year |
Past 5 years |
Past 10 years |
|||||||||
| Strategic Advisers® Core Fund |
||||||||||||
| Return Before Taxes |
31.68 | % | 11.01 | % | 12.66 | % | ||||||
| Return After Taxes on Distributions |
29.74 | % | 9.30 | % | 11.20 | % | ||||||
| Return After Taxes on Distributions and Sale of Fund Shares |
19.89 | % | 8.35 | % | 10.13 | % | ||||||
| S&P 500® Index (reflects no deduction for fees, expenses, or taxes) |
31.49 | % | 11.70 | % | 13.56 | % | ||||||
Growth Fund
| For the periods ended December 31, 2019 | Past 1 year |
Past 5 years |
Life of fund(a) |
|||||||||
| Strategic Advisers® Growth Fund |
||||||||||||
| Return Before Taxes |
33.53 | % | 12.66 | % | 14.39 | % | ||||||
| Return After Taxes on Distributions |
30.06 | % | 10.08 | % | 12.51 | % | ||||||
| Return After Taxes on Distributions and Sale of Fund Shares |
22.12 | % | 9.63 | % | 11.62 | % | ||||||
| Russell 1000® Growth Index (reflects no deduction for fees, expenses, or taxes) |
36.39 | % | 14.63 | % | 16.08 | % | ||||||
| (a) | From June 2, 2010 |
37
Table of Contents
Value Fund
| For the periods ended December 31, 2019 | Past 1 year |
Past 5 years |
Past 10 years |
|||||||||
| Strategic Advisers® Value Fund |
||||||||||||
| Return Before Taxes |
26.49 | % | 8.79 | % | 11.49 | % | ||||||
| Return After Taxes on Distributions |
23.77 | % | 6.87 | % | 9.94 | % | ||||||
| Return After Taxes on Distributions and Sale of Fund Shares |
17.43 | % | 6.64 | % | 9.23 | % | ||||||
| Russell 1000® Value Index (reflects no deduction for fees, expenses, or taxes) |
26.54 | % | 8.29 | % | 11.80 | % | ||||||
38
Table of Contents
PROPOSAL 1
TO APPROVE AN AGREEMENT AND PLAN OF REORGANIZATION BETWEEN STRATEGIC ADVISERS® CORE FUND AND STRATEGIC ADVISERS® LARGE CAP FUND.
Agreement and Plan of Reorganization
The terms and conditions under which the proposed transaction may be consummated are set forth in the Agreement. Significant provisions of the Agreement are summarized below in this Proposal 1; however, this summary is qualified in its entirety by reference to the Agreement, a copy of which is attached as Exhibit 1 to this Proxy Statement.
The Agreement contemplates (a) Large Cap Fund acquiring as of the Closing Date all of the assets of Core Fund in exchange solely for shares of Large Cap Fund and the assumption by Large Cap Fund of Core Fund’s liabilities; and (b) the distribution of shares of Large Cap Fund to the shareholders of Core Fund as provided for in the Agreement.
The value of Core Fund’s assets to be acquired by Large Cap Fund and the amount of its liabilities to be assumed by Large Cap Fund will be determined as of the close of business of the NYSE on the Closing Date, using the valuation procedures set forth in Large Cap Fund’s then-current Prospectus and Statement of Additional Information. The net asset value of a share of Large Cap Fund will be determined as of the same time using the valuation procedures set forth in its then-current Prospectus and Statement of Additional Information.
As of the Closing Date, Large Cap Fund will deliver to Core Fund, and Core Fund will distribute to its shareholders of record, shares of Large Cap Fund so that each Core Fund shareholder will receive the number of full and fractional shares of Large Cap Fund equal in value to the aggregate net asset value of shares of Core Fund held by such shareholder on the Closing Date; Core Fund will be liquidated as soon as practicable thereafter. Each Core Fund shareholder’s account shall be credited with the respective pro rata number of full and fractional shares of Large Cap Fund due that shareholder. The net asset value per share of Large Cap Fund will be unchanged by the transaction. Thus, the Reorganization will not result in a dilution of any shareholder’s interest.
Any transfer taxes payable upon issuance of shares of Large Cap Fund in a name other than that of the registered holder of the shares on the books of Core Fund as of that time shall be paid by the person to whom such shares are to be issued as a condition of such transfer. Any reporting responsibility of Core Fund is and will continue to be its responsibility up to and including the Closing Date and such later date on which Core Fund is liquidated.
39
Table of Contents
Core Fund, pursuant to its all-inclusive management contract, Strategic Advisers will bear the cost of the Reorganization, including professional fees, expenses associated with the filing of registration statements, and the cost of soliciting proxies for the Meeting, which will consist principally of printing and mailing prospectuses and the Proxy Statement, together with the cost of any supplementary solicitation.
All of the current investments of Core Fund are permissible investments for Large Cap Fund. Nevertheless, if shareholders approve the Reorganizations, Strategic Advisers may sell certain securities held by the funds and purchase other securities. Any transaction costs associated with portfolio adjustments to Core Fund and Large Cap Fund due to the Reorganization that occur prior to the Closing Date will be borne by Core Fund and Large Cap Fund, respectively. Any transaction costs associated with portfolio adjustments to Core Fund and Large Cap Fund due to the Reorganization that occur after the Closing Date and any additional merger-related costs attributable to Large Cap Fund that occur after the Closing Date will be borne by Large Cap Fund. The funds may recognize a taxable gain or loss on the disposition of securities pursuant to these portfolio adjustments.
The consummation of the Reorganization is subject to a number of conditions set forth in the Agreement, some of which may be waived by a fund. In addition, the Agreement may be amended in any mutually agreeable manner, except that no amendment that may have a materially adverse effect on Core Fund shareholders’ interests may be made subsequent to the Meeting.
Reasons for the Reorganization
In determining whether to approve the Reorganization, each fund’s Board of Trustees (the Board) considered a number of factors, including the following:
(1) the compatibility of the investment objectives, strategies, and policies of the funds;
(2) the historical performance of the funds;
(3) the fees and expenses and the relative expense ratios of the funds;
(4) the potential benefit of the Reorganization to shareholders of the funds;
(5) the costs to be incurred by each fund as a result of the Reorganization;
(6) the tax consequences of the Reorganization;
(7) the relative size of the funds;
(8) the elimination of duplicative funds; and
(9) the potential benefit of the Reorganization to Strategic Advisers and its affiliates.
40
Table of Contents
Strategic Advisers proposed the Reorganization to each fund’s Board at a meeting of the Board held on June 3, 2020. In proposing the Reorganization, Strategic Advisers advised the Board that it permits Core Fund shareholders to receive exposure to large cap equity securities in a single fund with the same investment objective, providing opportunities for improved investment outcomes from reducing redundant risk mitigation strategies and reducing the need to trade across funds and potentially realize gains for customers in taxable accounts. The Board also considered any potential benefits to Fidelity as a result of the merger, such as reducing the number of funds managed and any cost benefits as a result of discontinuing Core Fund’s all-inclusive management fee. Large Cap Fund is expected to have a total expense ratio that is 5 bp lower than Core Fund. In addition, because substantially all shareholders who own one Target Fund also own shares of all three Target Funds, and in similar proportions, the Board also considered that shareholders are expected to benefit from a projected decrease of 6 bp in total expenses when comparing the projected total annual operating expenses of Large Cap Fund to the weighted average expense ratio of all three Target Funds. Each merger will qualify as a tax-free exchange for federal income tax purposes.
Each fund’s Board carefully reviewed the proposal and determined that the Reorganization is in the best interests of the shareholders of each fund and that the Reorganization will not result in a dilution of the interests of the shareholders of either fund.
Description of the Securities to be Issued
Large Cap Fund is a series of Fidelity Rutland Square Trust II (the trust). The Trustees of the trust are authorized to issue an unlimited number of shares of beneficial interest of separate series. Each share of Large Cap Fund represents an equal proportionate interest with each other share of the fund, and each such share of Large Cap Fund is entitled to equal voting, dividend, liquidation, and redemption rights. Each shareholder of Large Cap Fund is entitled to one vote for each dollar of net asset value of the fund that shareholder owns, with fractional dollar amounts entitled to a proportionate fractional vote. Shares of Large Cap Fund have no preemptive or conversion rights. Shares are fully paid and nonassessable, except as set forth in the “Description of the Trust – Shareholder Liability” section of the fund’s Statement of Additional Information, which is incorporated herein by reference.
The trust does not hold annual meetings of shareholders. There will normally be no meetings of shareholders for the purpose of electing
41
Table of Contents
Trustees unless less than a majority of the Trustees holding office have been elected by shareholders, at which time the Trustees then in office will call a shareholder meeting for the election of Trustees. Under the 1940 Act, shareholders of record of at least two-thirds of the outstanding shares of an investment company may remove a Trustee by votes cast in person or by proxy at a meeting called for that purpose. The Trustees are required to call a meeting of shareholders for the purpose of voting upon the question of removal of any Trustee when requested in writing to do so by the shareholders of record holding at least 10% of the trust’s outstanding shares.
For more information about voting rights and dividend rights, please refer to the “Description of the Trust – Voting Rights” and the “Distributions and Taxes” sections, respectively, of Large Cap Fund’s Statement of Additional Information, which is incorporated herein by reference. For more information about redemption rights, please refer to the “Additional Information about the Purchase and Sale of Shares” section, of Large Cap Fund’s Prospectus, which is incorporated herein by reference.
Federal Income Tax Considerations
The exchange of Core Fund’s assets for Large Cap Fund’s shares and the assumption of the liabilities of Core Fund by Large Cap Fund is intended to qualify for federal income tax purposes as a tax-free reorganization under the Internal Revenue Code (the Code). With respect to the Reorganization, the participating funds will receive an opinion from Dechert LLP, counsel to Core Fund and Large Cap Fund, substantially to the effect that:
(i) The acquisition by Large Cap Fund of substantially all of the assets of Core Fund in exchange solely for Large Cap Fund shares and the assumption by Large Cap Fund of all liabilities of Core Fund followed by the distribution of Large Cap Fund shares to the Core Fund shareholders in exchange for their Core Fund shares in complete liquidation and termination of Core Fund will constitute a tax-free reorganization under Section 368(a) of the Code;
(ii) Core Fund will recognize no gain or loss upon the transfer of substantially all of its assets to Large Cap Fund in exchange solely for Large Cap Fund shares and the assumption by Large Cap Fund of all liabilities of Core Fund, except that Core Fund may be required to recognize gain or loss with respect to contracts described in Section 1256(b) of the Code or stock in a passive foreign investment company, as defined in Section 1297(a) of the Code;
(iii) Core Fund will recognize no gain or loss upon the distribution to its shareholders of the Large Cap Fund shares received by Core Fund in the Reorganization;
42
Table of Contents
(iv) Large Cap Fund will recognize no gain or loss upon the receipt of the assets of Core Fund in exchange solely for Large Cap Fund shares and the assumption of all liabilities of Core Fund;
(v) The adjusted basis to Large Cap Fund of the assets of Core Fund received by Large Cap Fund in the Reorganization will be the same as the adjusted basis of those assets in the hands of Core Fund immediately before the exchange;
(vi) Large Cap Fund’s holding periods with respect to the assets of Core Fund that Large Cap Fund acquires in the Reorganization will include the respective periods for which those assets were held by Core Fund (except where investment activities of Large Cap Fund have the effect of reducing or eliminating a holding period with respect to an asset);
(vii) The Core Fund shareholders will recognize no gain or loss upon receiving Large Cap Fund shares in exchange solely for Core Fund shares;
(viii) The aggregate basis of the Large Cap Fund shares received by a Core Fund shareholder in the Reorganization will be the same as the aggregate basis of the Core Fund shares surrendered by the Core Fund shareholder in exchange therefor; and
(ix) A Core Fund shareholder’s holding period for the Large Cap Fund shares received by the shareholder in the Reorganization will include the holding period during which the Core Fund shareholder held Core Fund shares surrendered in exchange therefor, provided that the Core Fund shareholder held such shares as a capital asset on the date of the Reorganization.
The table below shows each Target Fund’s approximate net assets, capital loss carryforwards, net realized gains/losses and net unrealized gains/losses as of May 31, 2020. Each Target Fund’s unrealized gains/losses will generally carryover to Large Cap Fund in the Reorganization and, based on the data shown below, Large Cap Fund could end up with larger net unrealized gains (as a percentage of assets) than Core Fund currently has. As a result, Core Fund shareholders could end up receiving larger capital gain distributions following the merger than they would if Core Fund continued as a standalone fund. This tax consideration should not have a significant impact on Core Fund shareholders in tax-advantaged accounts or on Core Fund shareholders who already hold all three funds (and substantially all managed account clients who own shares of one of the Target Funds own shares of all three Target Funds).
43
Table of Contents
Tax Position as of May 31, 2020 ($M)
| Fund Name |
Fiscal Year End |
Net Assets | Capital Loss Carryforwards |
Net Realized Gains/ (Losses) |
Net Unrealized Gains/ (Losses) |
|||||||||||||||
| Core Fund |
May 31 | $ | 27,026.1 | $ | 0 | $ | 0 | (a) | $ | 7,487.3 | (b) | |||||||||
| Growth Fund |
May 31 | $ | 8,905.5 | $ | 0 | $ | 0 | (a) | $ | 4,138.7 | ||||||||||
| Value Fund |
May 31 | $ | 8,666.2 | $ | 0 | $ | 0 | (a) | $ | 1,392.4 | ||||||||||
| (a) | Each Target Fund had net realized gains as of May 31, 2020 but those gains will be distributed prior to the Reorganization and thus are shown as $0 in the above table. |
| (b) | Includes $77.6 million of capital losses recognized during the period November 1, 2019 to May 31, 2020 that the fund intends to elect to defer to the subsequent fiscal year. |
Shareholders of Core Fund should consult their tax advisers regarding the effect, if any, of the proposed Reorganization in light of their individual circumstances. Because the foregoing discussion relates only to the federal income tax consequences of the Reorganization, those shareholders also should consult their tax advisers as to state and local tax consequences, if any, of the Reorganization.
Forms of Organization
Core Fund and Large Cap Fund are diversified series of Fidelity Rutland Square Trust II, an open-end management investment company organized as a Delaware business trust on March 8, 2006. The trust is authorized to issue an unlimited number of shares of beneficial interest. Because the funds are series of the same Delaware business trust, governed by the same Trust Instrument, the rights of the security holders of Core Fund under state law and the governing documents are expected to remain unchanged after the Reorganization.
For more information regarding shareholder rights, please refer to the “Description of the Trust” section of the funds’ Statements of Additional Information, which are incorporated herein by reference.
Operations of Large Cap Fund Following the Reorganization
Strategic Advisers does not expect Large Cap Fund to revise its investment policies as a result of the Reorganization. In addition, Strategic Advisers does not anticipate significant changes to Large Cap Fund’s management or to entities that provide the fund with services. Specifically, the Trustees and officers, the investment adviser, distributor, and other entities will continue to serve Large Cap Fund in their current capacities. John A. Stone (lead portfolio manager) and Niall Devitt (co-manager), who are currently the portfolio managers of Large Cap Fund and Core Fund, are expected to continue to be responsible for portfolio management of the combined fund after the Reorganization.
Capitalization
The following table shows the capitalization of Core Fund and Large Cap Fund as of May 31, 2020, and on a pro forma combined basis (unaudited) as of that date giving effect to all of the Reorganizations. As of May 31, 2020, the net assets of Core Fund was $27,026,081,269, or 60.6% of Large Cap Fund.
44
Table of Contents
| Net Assets | Net Asset Value Per Share |
Shares Outstanding |
||||||||||
| Core Fundc |
$ | 27,026,081,269 | $ | 18.29 | 1,477,889,462 | |||||||
| Large Cap Fundd |
N/A | N/A | N/A | |||||||||
| Large Cap Fund Pro Forma Combined Fund |
$ | 44,597,753,631 | $ | 10.00 | b | 4,459,775,363 | a | |||||
| a | To comply with Rule 3-18 of Regulation S-X, the pro-forma financial statements will be based on the most recent audited annual report of the Acquiring Fund. If these are more than 245 days old as of the effective date of the N-14 filing, interim financial statements covering a 12 month period will be used. In addition, per Regulation S-X Section 210.11 - 02 (a)(7) shares have been adjusted to reflect what will be issued post-merger. |
| b | Large Cap Fund expected to launch at $10.00 net asset value per share. |
| c | Core Fund’s estimated one time proxy costs related to the proposals in this proxy statement is $77,376. Strategic Advisers will bear the fund’s one time proxy cost pursuant to its all-inclusive management contract. |
| d | Large Cap Fund is expected to commence operations in November 2020. |
The combined fund pro forma capitalization shown above assumes that all of the Reorganizations occur.
The table above assumes that the Reorganizations described in Proposals 1 through 3 occurred on May 31, 2020. The table is for information purposes only. No assurance can be given as to how many Large Cap Fund shares will be received by shareholders of Core Fund on the date that the Reorganization takes place, and the foregoing should not be relied upon to reflect the number of shares of Large Cap Fund that actually will be received on or after that date.
Conclusion
The Agreement and the Reorganization were approved by the Board of Trustees of the trust at a meeting held on June 3, 2020. The Board of Trustees determined that the proposed Reorganization is in the best interests of shareholders of Core Fund and Large Cap Fund and that the interests of existing shareholders of Core Fund and Large Cap Fund would not be diluted as a result of the Reorganization. In the event that the Reorganization does not occur, Core Fund will continue to engage in business as a fund of a registered investment company and the Board of Trustees of Fidelity Rutland Square Trust II may consider other proposals for the reorganization or liquidation of the fund.
45
Table of Contents
The Board of Trustees of Core Fund unanimously recommends that shareholders vote in favor of the Reorganization by approving the Agreement.
46
Table of Contents
THE PROPOSED TRANSACTIONS
PROPOSAL 2
TO APPROVE AN AGREEMENT AND PLAN OF REORGANIZATION BETWEEN STRATEGIC ADVISERS® GROWTH FUND AND STRATEGIC ADVISERS® LARGE CAP FUND.
Agreement and Plan of Reorganization
The terms and conditions under which the proposed transaction may be consummated are set forth in the Agreement. Significant provisions of the Agreement are summarized below in this Proposal 2; however, this summary is qualified in its entirety by reference to the Agreement, a copy of which is attached as Exhibit 1 to this Proxy Statement.
The Agreement contemplates (a) Large Cap Fund acquiring as of the Closing Date all of the assets of Growth Fund in exchange solely for shares of Large Cap Fund and the assumption by Large Cap Fund of Growth Fund’s liabilities; and (b) the distribution of shares of Large Cap Fund to the shareholders of Growth Fund as provided for in the Agreement.
The value of Growth Fund’s assets to be acquired by Large Cap Fund and the amount of its liabilities to be assumed by Large Cap Fund will be determined as of the close of business of the NYSE on the Closing Date, using the valuation procedures set forth in Large Cap Fund’s then-current Prospectus and Statement of Additional Information. The net asset value of a share of Large Cap Fund will be determined as of the same time using the valuation procedures set forth in its then-current Prospectus and Statement of Additional Information.
As of the Closing Date, Large Cap Fund will deliver to Growth Fund, and Growth Fund will distribute to its shareholders of record, shares of Large Cap Fund so that each Growth Fund shareholder will receive the number of full and fractional shares of Large Cap Fund equal in value to the aggregate net asset value of shares of Growth Fund held by such shareholder on the Closing Date; Growth Fund will be liquidated as soon as practicable thereafter. Each Growth Fund shareholder’s account shall be credited with the respective pro rata number of full and fractional shares of Large Cap Fund due that shareholder. The net asset value per share of Large Cap Fund will be unchanged by the transaction. Thus, the Reorganization will not result in a dilution of any shareholder’s interest.
Any transfer taxes payable upon issuance of shares of Large Cap Fund in a name other than that of the registered holder of the shares on the books of Growth Fund as of that time shall be paid by the person to whom such shares are to be issued as a condition of such transfer. Any reporting responsibility of Growth Fund is and will continue to be its responsibility up to and including the Closing Date and such later date on which Growth Fund is liquidated.
47
Table of Contents
Growth Fund will bear the cost of the Reorganization, including professional fees, expenses associated with the filing of registration statements, and the cost of soliciting proxies for the Meeting, which will consist principally of printing and mailing prospectuses and the Proxy Statement, together with the cost of any supplementary solicitation.
All of the current investments of Growth Fund are permissible investments for Large Cap Fund. Nevertheless, if shareholders approve the Reorganizations, Strategic Advisers may sell certain securities held by the funds and purchase other securities. Any transaction costs associated with portfolio adjustments to Growth Fund and Large Cap Fund due to the Reorganization that occur prior to the Closing Date will be borne by Growth Fund and Large Cap Fund, respectively. Any transaction costs associated with portfolio adjustments to Growth Fund and Large Cap Fund due to the Reorganization that occur after the Closing Date and any additional merger-related costs attributable to Large Cap Fund that occur after the Closing Date will be borne by Large Cap Fund. The funds may recognize a taxable gain or loss on the disposition of securities pursuant to these portfolio adjustments.
The consummation of the Reorganization is subject to a number of conditions set forth in the Agreement, some of which may be waived by a fund. In addition, the Agreement may be amended in any mutually agreeable manner, except that no amendment that may have a materially adverse effect on Growth Fund shareholders’ interests may be made subsequent to the Meeting.
Reasons for the Reorganization
In determining whether to approve the Reorganization, each fund’s Board of Trustees (the Board) considered a number of factors, including the following:
(1) the compatibility of the investment objectives, strategies, and policies of the funds;
(2) the historical performance of the funds;
(3) the fees and expenses and the relative expense ratios of the funds;
(4) the potential benefit of the Reorganization to shareholders of the funds;
(5) the costs to be incurred by each fund as a result of the Reorganization;
(6) the tax consequences of the Reorganization;
(7) the relative size of the funds;
(8) the elimination of duplicative funds; and
(9) the potential benefit of the Reorganization to Strategic Advisers and its affiliates.
48
Table of Contents
Strategic Advisers proposed the Reorganization to each fund’s Board at a meeting of the Board held on June 3, 2020. In proposing the Reorganization, Strategic Advisers advised the Board that it permits Growth Fund shareholders to receive exposure to large cap equity securities in a single fund with the same investment objective, providing opportunities for improved investment outcomes from reducing redundant risk mitigation strategies and reducing the need to trade across funds and potentially realize gains for customers in taxable accounts. The Board also considered any potential benefits to Fidelity as a result of the merger, such as reducing the number of funds managed. Large Cap Fund is expected to have a total expense ratio that is 18 bp lower than Growth Fund. In addition, because substantially all shareholders who own one Target Fund also own shares of all three Target Funds, and in similar proportions, the Board also considered that shareholders are expected to benefit from a projected decrease of 6 bp in total expenses when comparing the projected total annual operating expenses of Large Cap Fund to the weighted average expense ratio of all three Target Funds. Each merger will qualify as a tax-free exchange for federal income tax purposes.
Each fund’s Board carefully reviewed the proposal and determined that the Reorganization is in the best interests of the shareholders of each fund and that the Reorganization will not result in a dilution of the interests of the shareholders of either fund.
Description of the Securities to be Issued
Large Cap Fund is a series of Fidelity Rutland Square Trust II (the trust). The Trustees of the trust are authorized to issue an unlimited number of shares of beneficial interest of separate series. Each share of Large Cap Fund represents an equal proportionate interest with each other share of the fund, and each such share of Large Cap Fund is entitled to equal voting, dividend, liquidation, and redemption rights. Each shareholder of Large Cap Fund is entitled to one vote for each dollar of net asset value of the fund that shareholder owns, with fractional dollar amounts entitled to a proportionate fractional vote. Shares of Large Cap Fund have no preemptive or conversion rights. Shares are fully paid and nonassessable, except as set forth in the “Description of the Trust – Shareholder Liability” section of the fund’s Statement of Additional Information, which is incorporated herein by reference.
The trust does not hold annual meetings of shareholders. There will normally be no meetings of shareholders for the purpose of electing Trustees unless less than a majority of the Trustees holding office have
49
Table of Contents
been elected by shareholders, at which time the Trustees then in office will call a shareholder meeting for the election of Trustees. Under the 1940 Act, shareholders of record of at least two-thirds of the outstanding shares of an investment company may remove a Trustee by votes cast in person or by proxy at a meeting called for that purpose. The Trustees are required to call a meeting of shareholders for the purpose of voting upon the question of removal of any Trustee when requested in writing to do so by the shareholders of record holding at least 10% of the trust’s outstanding shares.
For more information about voting rights and dividend rights, please refer to the “Description of the Trust – Voting Rights” and the “Distributions and Taxes” sections, respectively, of Large Cap Fund’s Statement of Additional Information, which is incorporated herein by reference. For more information about redemption rights, please refer to the “Additional Information about the Purchase and Sale of Shares” section, of Large Cap Fund’s Prospectus, which is incorporated herein by reference.
Federal Income Tax Considerations
The exchange of Growth Fund’s assets for Large Cap Fund’s shares and the assumption of the liabilities of Growth Fund by Large Cap Fund is intended to qualify for federal income tax purposes as a tax-free reorganization under the Internal Revenue Code (the Code). With respect to the Reorganization, the participating funds will receive an opinion from Dechert LLP, counsel to Growth Fund and Large Cap Fund, substantially to the effect that:
(i) The acquisition by Large Cap Fund of substantially all of the assets of Growth Fund in exchange solely for Large Cap Fund shares and the assumption by Large Cap Fund of all liabilities of Growth Fund followed by the distribution of Large Cap Fund shares to the Growth Fund shareholders in exchange for their Growth Fund shares in complete liquidation and termination of Growth Fund will constitute a tax-free reorganization under Section 368(a) of the Code;
(ii) Growth Fund will recognize no gain or loss upon the transfer of substantially all of its assets to Large Cap Fund in exchange solely for Large Cap Fund shares and the assumption by Large Cap Fund of all liabilities of Growth Fund, except that Growth Fund may be required to recognize gain or loss with respect to contracts described in Section 1256(b) of the Code or stock in a passive foreign investment company, as defined in Section 1297(a) of the Code;
(iii) Growth Fund will recognize no gain or loss upon the distribution to its shareholders of the Large Cap Fund shares received by Growth Fund in the Reorganization;
50
Table of Contents
(iv) Large Cap Fund will recognize no gain or loss upon the receipt of the assets of Growth Fund in exchange solely for Large Cap Fund shares and the assumption of all liabilities of Growth Fund;
(v) The adjusted basis to Large Cap Fund of the assets of Growth Fund received by Large Cap Fund in the Reorganization will be the same as the adjusted basis of those assets in the hands of Growth Fund immediately before the exchange;
(vi) Large Cap Fund’s holding periods with respect to the assets of Growth Fund that Large Cap Fund acquires in the Reorganization will include the respective periods for which those assets were held by Growth Fund (except where investment activities of Large Cap Fund have the effect of reducing or eliminating a holding period with respect to an asset);
(vii) The Growth Fund shareholders will recognize no gain or loss upon receiving Large Cap Fund shares in exchange solely for Growth Fund shares;
(viii) The aggregate basis of the Large Cap Fund shares received by a Growth Fund shareholder in the Reorganization will be the same as the aggregate basis of the Growth Fund shares surrendered by the Growth Fund shareholder in exchange therefor; and
(ix) A Growth Fund shareholder’s holding period for the Large Cap Fund shares received by the shareholder in the Reorganization will include the holding period during which the Growth Fund shareholder held Growth Fund shares surrendered in exchange therefor, provided that the Growth Fund shareholder held such shares as a capital asset on the date of the Reorganization.
The table below shows each Target Fund’s approximate net assets, capital loss carryforwards, net realized gains/losses and net unrealized gains/losses as of May 31, 2020. Each Target Fund’s unrealized gains/losses will generally carryover to Large Cap Fund in the Reorganization and, based on the data shown below, Large Cap Fund could end up with smaller net unrealized gains (as a percentage of assets) than Growth Fund currently has. As a result, Growth Fund shareholders could end up receiving smaller capital gain distributions following the merger than they would if Growth Fund continued as a standalone fund. This tax consideration should not have a significant impact on Growth Fund shareholders in tax-advantaged accounts or on Growth Fund shareholders who already hold all three funds (and substantially all managed account clients who own shares of one of the Target Funds own shares of all three Target Funds).
51
Table of Contents
Tax Position as of May 31, 2020 ($M)
| Fund Name |
Fiscal Year End |
Net Assets | Capital Loss Carryforwards |
Net Realized Gains/ (Losses) |
Net Unrealized Gains/ (Losses) |
|||||||||||||||
| Core Fund |
May 31 | $ | 27,026.1 | $ | 0 | $ | 0 | (a) | $ | 7,487.3 | ||||||||||
| Growth Fund |
May 31 | $ | 8,905.5 | $ | 0 | $ | 0 | (a) | $ | 4,138.7 | ||||||||||
| Value Fund |
May 31 | $ | 8,666.2 | $ | 0 | $ | 0 | (a) | $ | 1,392.4 | ||||||||||
| (a) | Each Target Fund had net realized gains as of May 31, 2020 but those gains will be distributed prior to the Reorganization and thus are shown as $0 in the above table. |
Shareholders of Growth Fund should consult their tax advisers regarding the effect, if any, of the proposed Reorganization in light of their individual circumstances. Because the foregoing discussion relates only to the federal income tax consequences of the Reorganization, those shareholders also should consult their tax advisers as to state and local tax consequences, if any, of the Reorganization.
Forms of Organization
Growth Fund and Large Cap Fund are diversified series of Fidelity Rutland Square Trust II, an open-end management investment company organized as a Delaware business trust on March 8, 2006. The trust is authorized to issue an unlimited number of shares of beneficial interest. Because the funds are series of the same Delaware business trust, governed by the same Trust Instrument, the rights of the security holders of Growth Fund under state law and the governing documents are expected to remain unchanged after the Reorganization.
For more information regarding shareholder rights, please refer to the “Description of the Trust” section of the funds’ Statements of Additional Information, which are incorporated herein by reference.
Operations of Large Cap Fund Following the Reorganization
Strategic Advisers does not expect Large Cap Fund to revise its investment policies as a result of the Reorganization. In addition, Strategic Advisers does not anticipate significant changes to Large Cap Fund’s management or to entities that provide the fund with services. Specifically, the Trustees and officers, the investment adviser, distributor, and other entities will continue to serve Large Cap Fund in their current capacities. John A. Stone (lead portfolio manager) and Niall Devitt (co-manager), who are currently the portfolio managers of Large Cap Fund and Growth Fund, are expected to continue to be responsible for portfolio management of the combined fund after the Reorganization.
Capitalization
The following table shows the capitalization of Growth Fund and Large Cap Fund as of May 31, 2020, and on a pro forma combined basis (unaudited) as of that date giving effect to all of the Reorganizations. As of May 31, 2020, the net assets of Growth Fund was $8,905,509,859, or 20.0% of Large Cap Fund.
52
Table of Contents
| Net Assets | Net Asset Value Per Share |
Shares Outstanding |
||||||||||
| Growth Fundc |
$ | 8,905,509,859 | $ | 19.66 | 452,953,854 | |||||||
| Large Cap Fundd |
N/A | N/A | N/A | |||||||||
| Large Cap Fund Pro Forma Combined Fund |
$ | 44,597,753,631 | $ | 10.00 | b | 4,459,775,363 | a | |||||
| a | To comply with Rule 3-18 of Regulation S-X, the pro-forma financial statements will be based on the most recent audited annual report of the Acquiring Fund. If these are more than 245 days old as of the effective date of the N-14 filing, interim financial statements covering a 12 month period will be used. In addition, per Regulation S-X Section 210.11 - 02 (a)(7) shares have been adjusted to reflect what will be issued post-merger. |
| b | Large Cap Fund expected to launch at $10.00 net asset value per share. |
| c | Growth Fund’s estimated one time proxy costs related to the proposals in this proxy statement is $77,349. |
| d | Large Cap Fund is expected to commence operations in November 2020. |
The combined fund pro forma capitalization shown above assumes that all of the Reorganizations occur.
The table above assumes that the Reorganizations described in Proposals 1 through 3 occurred on May 31, 2020. The table is for information purposes only. No assurance can be given as to how many Large Cap Fund shares will be received by shareholders of Growth Fund on the date that the Reorganization takes place, and the foregoing should not be relied upon to reflect the number of shares of Large Cap Fund that actually will be received on or after that date.
Conclusion
The Agreement and the Reorganization were approved by the Board of Trustees of the trust at a meeting held on June 3, 2020. The Board of Trustees determined that the proposed Reorganization is in the best interests of shareholders of Growth Fund and Large Cap Fund and that the interests of existing shareholders of Growth Fund and Large Cap Fund would not be diluted as a result of the Reorganization. In the event that the Reorganization does not occur, Growth Fund will continue to engage in business as a fund of a registered investment company and the Board of Trustees of Fidelity Rutland Square Trust II may consider other proposals for the reorganization or liquidation of the fund.
53
Table of Contents
The Board of Trustees of Growth Fund unanimously recommends that shareholders vote in favor of the Reorganization by approving the Agreement.
54
Table of Contents
THE PROPOSED TRANSACTIONS
PROPOSAL 3
TO APPROVE AN AGREEMENT AND PLAN OF REORGANIZATION BETWEEN STRATEGIC ADVISERS® VALUE FUND AND STRATEGIC ADVISERS® LARGE CAP FUND.
Agreement and Plan of Reorganization
The terms and conditions under which the proposed transaction may be consummated are set forth in the Agreement. Significant provisions of the Agreement are summarized below in this Proposal 3; however, this summary is qualified in its entirety by reference to the Agreement, a copy of which is attached as Exhibit 1 to this Proxy Statement.
The Agreement contemplates (a) Large Cap Fund acquiring as of the Closing Date all of the assets of Value Fund in exchange solely for shares of Large Cap Fund and the assumption by Large Cap Fund of Value Fund’s liabilities; and (b) the distribution of shares of Large Cap Fund to the shareholders of Value Fund as provided for in the Agreement.
The value of Value Fund’s assets to be acquired by Large Cap Fund and the amount of its liabilities to be assumed by Large Cap Fund will be determined as of the close of business of the NYSE on the Closing Date, using the valuation procedures set forth in Large Cap Fund’s then-current Prospectus and Statement of Additional Information. The net asset value of a share of Large Cap Fund will be determined as of the same time using the valuation procedures set forth in its then-current Prospectus and Statement of Additional Information.
As of the Closing Date, Large Cap Fund will deliver to Value Fund, and Value Fund will distribute to its shareholders of record, shares of Large Cap Fund so that each Value Fund shareholder will receive the number of full and fractional shares of Large Cap Fund equal in value to the aggregate net asset value of shares of Value Fund held by such shareholder on the Closing Date; Value Fund will be liquidated as soon as practicable thereafter. Each Value Fund shareholder’s account shall be credited with the respective pro rata number of full and fractional shares of Large Cap Fund due that shareholder. The net asset value per share of Large Cap Fund will be unchanged by the transaction. Thus, the Reorganization will not result in a dilution of any shareholder’s interest.
Any transfer taxes payable upon issuance of shares of Large Cap Fund in a name other than that of the registered holder of the shares on the books of Value Fund as of that time shall be paid by the person to whom such shares are to be issued as a condition of such transfer. Any reporting responsibility of Value Fund is and will continue to be its responsibility up to and including the Closing Date and such later date on which Value Fund is liquidated.
55
Table of Contents
Value Fund will bear the cost of the Reorganization, including professional fees, expenses associated with the filing of registration statements, and the cost of soliciting proxies for the Meeting, which will consist principally of printing and mailing prospectuses and the Proxy Statement, together with the cost of any supplementary solicitation.
All of the current investments of Value Fund are permissible investments for Large Cap Fund. Nevertheless, if shareholders approve the Reorganizations, Strategic Advisers may sell certain securities held by the funds and purchase other securities. Any transaction costs associated with portfolio adjustments to Value Fund and Large Cap Fund due to the Reorganization that occur prior to the Closing Date will be borne by Value Fund and Large Cap Fund, respectively. Any transaction costs associated with portfolio adjustments to Value Fund and Large Cap Fund due to the Reorganization that occur after the Closing Date and any additional merger-related costs attributable to Large Cap Fund that occur after the Closing Date will be borne by Large Cap Fund. The funds may recognize a taxable gain or loss on the disposition of securities pursuant to these portfolio adjustments.
The consummation of the Reorganization is subject to a number of conditions set forth in the Agreement, some of which may be waived by a fund. In addition, the Agreement may be amended in any mutually agreeable manner, except that no amendment that may have a materially adverse effect on Value Fund shareholders’ interests may be made subsequent to the Meeting.
Reasons for the Reorganization
In determining whether to approve the Reorganization, each fund’s Board of Trustees (the Board) considered a number of factors, including the following:
(1) the compatibility of the investment objectives, strategies, and policies of the funds;
(2) the historical performance of the funds;
(3) the fees and expenses and the relative expense ratios of the funds;
(4) the potential benefit of the Reorganization to shareholders of the funds;
(5) the costs to be incurred by each fund as a result of the Reorganization;
(6) the tax consequences of the Reorganization;
(7) the relative size of the funds;
(8) the elimination of duplicative funds; and
(9) the potential benefit of the Reorganization to Strategic Advisers and its affiliates.
56
Table of Contents
Strategic Advisers proposed the Reorganization to each fund’s Board at a meeting of the Board held on June 3, 2020. In proposing the Reorganization, Strategic Advisers advised the Board that it permits Value Fund shareholders to receive exposure to large cap equity securities in a single fund with the same investment objective, providing opportunities for improved investment outcomes from reducing redundant risk mitigation strategies and reducing the need to trade across funds and potentially realize gains for customers in taxable accounts. The Board also considered any potential benefits to Fidelity as a result of the merger, such as reducing the number of funds managed. Large Cap Fund is expected to have a total expense ratio that is 2 bp higher than Value Fund. In addition, because substantially all shareholders who own one Target Fund also own shares of all three Target Funds, and in similar proportions, the Board also considered that shareholders are expected to benefit from a projected decrease of 6 bp in total expenses when comparing the projected total annual operating expenses of Large Cap Fund to the weighted average expense ratio of all three Target Funds. Each merger will qualify as a tax-free exchange for federal income tax purposes.
Each fund’s Board carefully reviewed the proposal and determined that the Reorganization is in the best interests of the shareholders of each fund and that the Reorganization will not result in a dilution of the interests of the shareholders of either fund.
Description of the Securities to be Issued
Large Cap Fund is a series of Fidelity Rutland Square Trust II (the trust). The Trustees of the trust are authorized to issue an unlimited number of shares of beneficial interest of separate series. Each share of Large Cap Fund represents an equal proportionate interest with each other share of the fund, and each such share of Large Cap Fund is entitled to equal voting, dividend, liquidation, and redemption rights. Each shareholder of Large Cap Fund is entitled to one vote for each dollar of net asset value of the fund that shareholder owns, with fractional dollar amounts entitled to a proportionate fractional vote. Shares of Large Cap Fund have no preemptive or conversion rights. Shares are fully paid and nonassessable, except as set forth in the “Description of the Trust – Shareholder Liability” section of the fund’s Statement of Additional Information, which is incorporated herein by reference.
The trust does not hold annual meetings of shareholders. There will normally be no meetings of shareholders for the purpose of electing Trustees unless less than a majority of the Trustees holding office have
57
Table of Contents
been elected by shareholders, at which time the Trustees then in office will call a shareholder meeting for the election of Trustees. Under the 1940 Act, shareholders of record of at least two-thirds of the outstanding shares of an investment company may remove a Trustee by votes cast in person or by proxy at a meeting called for that purpose. The Trustees are required to call a meeting of shareholders for the purpose of voting upon the question of removal of any Trustee when requested in writing to do so by the shareholders of record holding at least 10% of the trust’s outstanding shares.
For more information about voting rights and dividend rights, please refer to the “Description of the Trust – Voting Rights” and the “Distributions and Taxes” sections, respectively, of Large Cap Fund’s Statement of Additional Information, which is incorporated herein by reference. For more information about redemption rights, please refer to the “Additional Information about the Purchase and Sale of Shares” section, of Large Cap Fund’s Prospectus, which is incorporated herein by reference.
Federal Income Tax Considerations
The exchange of Value Fund’s assets for Large Cap Fund’s shares and the assumption of the liabilities of Value Fund by Large Cap Fund is intended to qualify for federal income tax purposes as a tax-free reorganization under the Internal Revenue Code (the Code). With respect to the Reorganization, the participating funds will receive an opinion from Dechert LLP, counsel to Value Fund and Large Cap Fund, substantially to the effect that:
(i) The acquisition by Large Cap Fund of substantially all of the assets of Value Fund in exchange solely for Large Cap Fund shares and the assumption by Large Cap Fund of all liabilities of Value Fund followed by the distribution of Large Cap Fund shares to the Value Fund shareholders in exchange for their Value Fund shares in complete liquidation and termination of Value Fund will constitute a tax-free reorganization under Section 368(a) of the Code;
(ii) Value Fund will recognize no gain or loss upon the transfer of substantially all of its assets to Large Cap Fund in exchange solely for Large Cap Fund shares and the assumption by Large Cap Fund of all liabilities of Value Fund, except that Value Fund may be required to recognize gain or loss with respect to contracts described in Section 1256(b) of the Code or stock in a passive foreign investment company, as defined in Section 1297(a) of the Code;
(iii) Value Fund will recognize no gain or loss upon the distribution to its shareholders of the Large Cap Fund shares received by Value Fund in the Reorganization;
58
Table of Contents
(iv) Large Cap Fund will recognize no gain or loss upon the receipt of the assets of Value Fund in exchange solely for Large Cap Fund shares and the assumption of all liabilities of Value Fund;
(v) The adjusted basis to Large Cap Fund of the assets of Value Fund received by Large Cap Fund in the Reorganization will be the same as the adjusted basis of those assets in the hands of Value Fund immediately before the exchange;
(vi) Large Cap Fund’s holding periods with respect to the assets of Value Fund that Large Cap Fund acquires in the Reorganization will include the respective periods for which those assets were held by Value Fund (except where investment activities of Large Cap Fund have the effect of reducing or eliminating a holding period with respect to an asset);
(vii) The Value Fund shareholders will recognize no gain or loss upon receiving Large Cap Fund shares in exchange solely for Value Fund shares;
(viii) The aggregate basis of the Large Cap Fund shares received by a Value Fund shareholder in the Reorganization will be the same as the aggregate basis of the Value Fund shares surrendered by the Value Fund shareholder in exchange therefor; and
(ix) A Value Fund shareholder’s holding period for the Large Cap Fund shares received by the shareholder in the Reorganization will include the holding period during which the Value Fund shareholder held Value Fund shares surrendered in exchange therefor, provided that the Value Fund shareholder held such shares as a capital asset on the date of the Reorganization.
The table below shows each Target Fund’s approximate net assets, capital loss carryforwards, net realized gains/losses and net unrealized gains/losses as of May 31, 2020. Each Target Fund’s unrealized gains/losses will generally carryover to Large Cap Fund in the Reorganization and, based on the data shown below, Large Cap Fund could end up with larger net unrealized gains (as a percentage of assets) than Value Fund currently has. As a result, Value Fund shareholders could end up receiving larger capital gain distributions following the merger than they would if Value Fund continued as a standalone fund. This tax consideration should not have a significant impact on Value Fund shareholders in tax-advantaged accounts or on Value Fund shareholders who already hold all three funds (and substantially all managed account clients who own shares of one of the Target Funds own shares of all three Target Funds).
59
Table of Contents
Tax Position as of May 31, 2020 ($M)
| Fund Name |
Fiscal Year End |
Net Assets | Capital Loss Carryforwards |
Net Realized Gains/ (Losses) |
Net Unrealized Gains/ (Losses) |
|||||||||||||||
| Core Fund |
May 31 | $ | 27,026.1 | $ | 0 | $ | 0 | (a) | $ | 7,487.3 | ||||||||||
| Growth Fund |
May 31 | $ | 8,905.5 | $ | 0 | $ | 0 | (a) | $ | 4,138.7 | ||||||||||
| Value Fund |
May 31 | $ | 8,666.2 | $ | 0 | $ | 0 | (a) | $ | 1,392.4 | ||||||||||
| (a) | Each Target Fund had net realized gains as of May 31, 2020 but those gains will be distributed prior to the Reorganization and thus are shown as $0 in the above table. |
Shareholders of Value Fund should consult their tax advisers regarding the effect, if any, of the proposed Reorganization in light of their individual circumstances. Because the foregoing discussion relates only to the federal income tax consequences of the Reorganization, those shareholders also should consult their tax advisers as to state and local tax consequences, if any, of the Reorganization.
Forms of Organization
Value Fund and Large Cap Fund are diversified series of Fidelity Rutland Square Trust II, an open-end management investment company organized as a Delaware business trust on March 8, 2006. The trust is authorized to issue an unlimited number of shares of beneficial interest. Because the funds are series of the same Delaware business trust, governed by the same Trust Instrument, the rights of the security holders of Value Fund under state law and the governing documents are expected to remain unchanged after the Reorganization.
For more information regarding shareholder rights, please refer to the “Description of the Trust” section of the funds’ Statements of Additional Information, which are incorporated herein by reference.
Operations of Large Cap Fund Following the Reorganization
Strategic Advisers does not expect Large Cap Fund to revise its investment policies as a result of the Reorganization. In addition, Strategic Advisers does not anticipate significant changes to Large Cap Fund’s management or to entities that provide the fund with services. Specifically, the Trustees and officers, the investment adviser, distributor, and other entities will continue to serve Large Cap Fund in their current capacities. John A. Stone (lead portfolio manager) and Gopalakrishnan Anantanatarajan (co-manager), who are currently the portfolio managers of Large Cap Fund and Value Fund, are expected to continue to be responsible for portfolio management of the combined fund after the Reorganization.
Capitalization
The following table shows the capitalization of Value Fund and Large Cap Fund as of May 31, 2020, and on a pro forma combined basis (unaudited) as of that date giving effect to all of the Reorganizations. As of May 31, 2020, the net assets of Value Fund was $8,666,162,503, or 19.4% of Large Cap Fund.
60
Table of Contents
| Net Assets | Net Asset Value Per Share |
Shares Outstanding |
||||||||||
| Value Fundc |
$ | 8,666,162,503 | $ | 16.27 | 532,532,088 | |||||||
| Large Cap Fundd |
N/A | N/A | N/A | |||||||||
| Large Cap Fund Pro Forma Combined Fund |
$ | 44,597,753,631 | $ | 10.00 | b | 4,459,775,363 | a | |||||
| a | To comply with Rule 3-18 of Regulation S-X, the pro-forma financial statements will be based on the most recent audited annual report of the Acquiring Fund. If these are more than 245 days old as of the effective date of the N-14 filing, interim financial statements covering a 12 month period will be used. In addition, per Regulation S-X Section 210.11 - 02 (a)(7) shares have been adjusted to reflect what will be issued post-merger. |
| b | Large Cap Fund expected to launch at $10.00 net asset value per share. |
| c | Value Fund’s estimated one time proxy costs related to the proposals in this proxy statement is $77,275. |
| d | Large Cap Fund is expected to commence operations in November 2020. |
The combined fund pro forma capitalization shown above assumes that all of the Reorganizations occur.
The table above assumes that the Reorganizations described in Proposals 1 through 3 occurred on May 31, 2020. The table is for information purposes only. No assurance can be given as to how many Large Cap Fund shares will be received by shareholders of Value Fund on the date that the Reorganization takes place, and the foregoing should not be relied upon to reflect the number of shares of Large Cap Fund that actually will be received on or after that date.
Conclusion
The Agreement and the Reorganization were approved by the Board of Trustees of the trust at a meeting held on June 3, 2020. The Board of Trustees determined that the proposed Reorganization is in the best interests of shareholders of Value Fund and Large Cap Fund and that the interests of existing shareholders of Value Fund and Large Cap Fund would not be diluted as a result of the Reorganization. In the event that the Reorganization does not occur, Value Fund will continue to engage in business as a fund of a registered investment company and the Board of Trustees of Fidelity Rutland Square Trust II may consider other proposals for the reorganization or liquidation of the fund.
61
Table of Contents
The Board of Trustees of Value Fund unanimously recommends that shareholders vote in favor of the Reorganization by approving the Agreement.
62
Table of Contents
ADDITIONAL INFORMATION ABOUT THE FUNDS
Core Fund’s, Growth Fund’s, and Value Fund’s financial highlights for the fiscal year ended May 31, 2020, which have been audited by PricewaterhouseCoopers LLP, independent registered public accounting firm, whose report thereon is included in the Annual Report to Shareholders, are included in each fund’s prospectus. Large Cap Fund is a newly created fund and does not have any historical financial highlights.
The financial highlights audited by PricewaterhouseCoopers LLP have been incorporated by reference in reliance on their reports given on their authority as experts in auditing and accounting.
Solicitation of Proxies; Expenses
This Proxy Statement is furnished in connection with a solicitation of proxies made by, and on behalf of, the trust’s Board of Trustees to be used at each Meeting. The purpose of each Meeting is set forth in the accompanying Notice.
The solicitation is being made primarily by the mailing of this Proxy Statement and the accompanying proxy card on or about September 8, 2020. Supplementary solicitations may be made by mail, telephone, facsimile or electronic means, or by personal interview by representatives of the trust. In addition, Broadridge Financial Solutions, Inc. (Broadridge) may be paid on a per-call basis to solicit shareholders by telephone on behalf of Core Fund, Growth Fund, and Value Fund. Core Fund, Growth Fund, and Value Fund may also arrange to have votes recorded by telephone. Broadridge may be paid on a per-call basis for vote-by-phone solicitations on behalf of Core Fund, Growth Fund, and Value Fund. The approximate anticipated cost of these services is as follows:
| Fund Name |
Estimated aggregate cost for Broadridge to call and solicit votes |
Estimated aggregate cost for Broadridge to receive votes over the phone |
||||||
| Core Fund |
$ | 2,500 | $ | 750 | ||||
| Growth Fund |
$ | 2,500 | $ | 750 | ||||
| Value Fund |
$ | 2,500 | $ | 750 | ||||
If a fund records votes by telephone or through the internet, it will use procedures designed to authenticate shareholders’ identities, to allow shareholders to authorize the voting of their shares in accordance with their
63
Table of Contents
instructions, and to confirm that their instructions have been properly recorded. Proxies voted by telephone or through the internet may be revoked at any time before they are voted in the same manner that proxies voted by mail may be revoked.
For Growth Fund and Value Fund, the expenses in connection with preparing this Proxy Statement and its enclosures and all solicitations will be paid by the funds.
Each of Growth Fund and Value Fund will reimburse brokerage firms and others for their reasonable expenses in forwarding solicitation material to the beneficial owners of shares. The costs are allocated between the funds based on the number of shareholder accounts in each fund.
For Core Fund, the expenses in connection with preparing this Proxy Statement and its enclosures and all solicitations will be borne by Strategic Advisers under the fund’s management contract, which obligates Strategic Advisers to pay certain fund level expenses. Strategic Advisers will reimburse brokerage firms and others for their reasonable expenses in forwarding solicitation material to the beneficial owners of shares. The costs are allocated between the funds based on the number of shareholder accounts in each fund.
For a free copy of each fund’s annual reports for the fiscal year ended May 31, 2020 call 1-800-544-3455, log-on to www.fidelity.com, or write to FDC at 900 Salem Street, Smithfield, Rhode Island 02917.
Record Date; Quorum; and Method of Tabulation
Shareholders of record as of the close of business on September 8, 2020 will be entitled to vote at the Meeting of the fund in which they hold shares. Each such shareholder will be entitled to one vote for each dollar of net asset value held as of that date, with fractional dollar amounts entitled to a proportional fractional vote.
If the enclosed proxy card is executed and returned, or an internet or telephonic vote is delivered, that vote may nevertheless be revoked at any time prior to its use by written notification received by the trust, by the execution of a later-dated proxy card, by the trust’s receipt of a subsequent valid telephonic or internet vote, or by attending a fund’s Meeting and voting in person.
All proxies solicited by the Board of Trustees that are properly executed and received by the Secretary prior to the Meeting, and that are not revoked, will be voted at the Meeting. Shares represented by such proxies will be voted in accordance with the instructions thereon. If no specification is made on a properly executed proxy card, it will be voted FOR the matters specified on the proxy card. All shares that are voted and votes to ABSTAIN will be counted toward establishing a quorum, as will broker non-votes. (Broker non-votes are shares for which (i) the beneficial owner has not voted and (ii) the broker holding the shares does not have discretionary authority to vote on the particular matter.)
64
Table of Contents
With respect to fund shares held in Fidelity individual retirement accounts (including Traditional, Rollover, SEP, SAR-SEP, Roth and SIMPLE IRAs), the IRA Custodian will vote those shares for which it has received instructions from shareholders only in accordance with such instructions. If Fidelity IRA shareholders do not vote their shares, the IRA Custodian will vote their shares for them, in the same proportion as other Fidelity IRA shareholders have voted.
One-third of each fund’s outstanding voting securities entitled to vote constitutes a quorum for the transaction of business at the applicable Meeting. If a quorum is not present, or if a quorum is present but sufficient votes to approve the proposal are not received, or if other matters arise requiring shareholder attention, the persons named as proxy agents may propose one or more adjournments to permit further solicitation of proxies. Any such adjournment will require the affirmative vote of a majority of those shares present or represented by proxy. When voting on a proposed adjournment, the persons named as proxy agents will vote FOR the proposed adjournment all shares that they are entitled to vote FOR the proposal, unless directed to vote AGAINST the proposal, in which case such shares will be voted AGAINST the proposed adjournment.
Certain shares are registered to Strategic Advisers or a Strategic Advisers affiliate. To the extent that Strategic Advisers or a Strategic Advisers affiliate has discretion to vote, these shares will be voted at the Meeting FOR each proposal. Otherwise, these shares will be voted in accordance with the plan or agreement governing the shares. Although the terms of the plans and agreements vary, generally the shares must be voted either (i) in accordance with instructions received from shareholders or (ii) in accordance with instructions received from shareholders and, for shareholders who do not vote, in the same proportion as certain other shareholders have voted.
Certain shareholders of FWS have elected Strategic Advisers as agent to receive proxy voting materials for non-Fidelity and Fidelity® Funds held in their FWS accounts. For Fidelity® Funds, such shareholders have instructed Strategic Advisers to vote proxies of a Fidelity® Fund in the same proportion as the vote of all other holders of such Fidelity® Fund.
Certain funds and accounts that are managed by Strategic Advisers or its affiliates (including funds of funds) invest in other funds and may at times have substantial investments in one or more funds. Although these funds generally intend to vote their shares of underlying funds using echo voting procedures (that is, in the same proportion as the holders of all other shares of the particular underlying fund), they reserve the right, on a case-by-case basis, to vote in another manner, which may include voting all shares as recommended by the Board.
65
Table of Contents
We intend to hold the Meeting in person as set forth in this Proxy Statement. However, we are actively monitoring the coronavirus (COVID-19); we are sensitive to the public health and travel concerns our shareholders may have and the protocols that federal, state, and local governments may impose. As a result, the date, time, location or means of conducting the Meeting may change. In the event of such a change, the funds will post an announcement online at www.proxyvote.com/proxy and file the announcement on the SEC EDGAR system, among other steps, but may not deliver additional soliciting materials to shareholders or otherwise amend the funds’ proxy materials. Although no decision has been made, the funds may consider imposing additional procedures or limitations on Meeting attendees or conducting the Meeting as a “virtual” shareholder meeting through the internet or other electronic means in lieu of an in-person meeting, subject to any restrictions imposed by applicable law. Please monitor the website at www.proxyvote.com/proxy for updated information. If you are planning to attend the Meeting, please check the website one week prior to the Meeting date. As always, we encourage you to vote your shares prior to the Meeting.
Share Ownership
As of June 30, 2020, shares of each class of each fund issued and outstanding were as follows:
| Number of Shares | ||
| Core Fund | [ ] | |
| Growth Fund | [ ] | |
| Value Fund | [ ] |
[Large Cap Fund is a newly created fund and will not issue shares until after the Closing Date of the Reorganizations.]
[As of June 30, 2020, the Trustees, Members of the Advisory Board (if any), and officers of Core Fund, Growth Fund, and Value Fund owned, in the aggregate, less than 1% of each class’s total outstanding shares, with respect to the fund.]
[As of June 30, 2020, the following owned of record and/or beneficially 5% or more of the outstanding shares:]
| Fund or Class Name | Owner Name | City | State | Ownership % |
66
Table of Contents
[As of June 30, 2020, the following owned of record and/or beneficially 25% or more of the outstanding shares:]
| Fund Name | Owner Name | City | State | Ownership % |
[A shareholder owning of record or beneficially more than 25% of a fund’s outstanding shares may be considered a controlling person. That shareholder’s vote could have a more significant effect on matters presented at a shareholders’ meeting than votes of other shareholders.]
[To the knowledge of the trust and [ ], no [other] shareholder owned of record and/or beneficially 5% or more of the outstanding shares of each fund on that date. [It is not anticipated that any of the above shareholders will own of record and/or beneficially 5% or more of the outstanding shares of the combined fund as a result of the Reorganizations.]/[If the Reorganizations became effective on , [ ] would have owned of record and/or beneficially % of the outstanding shares of the combined fund.]]
Required Vote
Approval of each Reorganization requires the affirmative vote of a “majority of the outstanding voting securities” of the specific fund involved in that Reorganization. Under the 1940 Act, the vote of a “majority of the outstanding voting securities” means the affirmative vote of the lesser of (a) 67% or more of the voting securities present at the Meeting or represented by proxy if the holders of more than 50% of the outstanding voting securities are present or represented by proxy or (b) more than 50% of the outstanding voting securities. Votes to ABSTAIN and broker non-votes will have the same effect as votes cast AGAINST a proposal.
Other Business
The Board knows of no business other than the matters set forth in this Proxy Statement to be brought before each Meeting However, if any other
67
Table of Contents
matters properly come before each Meeting, it is the intention that proxies that do not contain specific instructions to the contrary will be voted on such matters in accordance with the judgment of the persons therein designated.
Legal Matters
Certain legal matters in connection with the issuance of Large Cap Fund shares have been passed upon by Dechert LLP, counsel to the trust.
Experts
The audited financial statements of Core Fund, Growth Fund, and Value Fund are incorporated by reference into the Statement of Additional Information relating to this Proxy Statement and have been audited by PricewaterhouseCoopers LLP, independent registered public accounting firm, whose reports thereon are included in the funds’ Annual Reports to Shareholders for the fiscal year ended May 31, 2020. The financial statements audited by PricewaterhouseCoopers LLP have been incorporated by reference in reliance on their reports given on their authority as experts in auditing and accounting.
Notice to Banks, Broker-Dealers and Voting Trustees and Their Nominees
Please advise Fidelity Rutland Square Trust II, in care of Fidelity Investments Institutional Operations Company LLC, 245 Summer Street, Boston, Massachusetts 02210, whether other persons are beneficial owners of shares for which proxies are being solicited and, if so, the number of copies of the Proxy Statement and Annual Reports you wish to receive in order to supply copies to the beneficial owners of the respective shares.
68
Table of Contents
Form of Agreement and Plan of Reorganization
THIS AGREEMENT AND PLAN OF REORGANIZATION (the Agreement) is made as of September 8, 2020, by and between Fidelity Rutland Square Trust II, a Delaware statutory trust, on behalf of each “Acquired Fund” listed on Schedule A and Strategic Advisers Large Cap Fund (the “Acquiring Fund”), each a series of Fidelity Rutland Square Trust II. Fidelity Rutland Square Trust II may be referred to herein as the “Trust.” The Trust is a duly organized statutory trust under the laws of the State of Delaware with its principal place of business at 245 Summer Street, Boston, Massachusetts 02210. The Acquiring Fund and the Acquired Funds may be referred to herein collectively as the “Funds” or each individually as the “Fund.”
This Agreement is intended to be, and is adopted as, a plan of reorganization within the meaning of Section 368(a) of the Internal Revenue Code of 1986, as amended (the “Code”). For each Acquired Fund the reorganization will comprise: (a) the transfer of all of the assets of the Acquired Fund to the Acquiring Fund solely in exchange for shares of beneficial interest in the Acquiring Fund (the “Acquiring Fund Shares”) and the assumption by the Acquiring Fund of the Acquired Fund’s liabilities; and (b) the constructive distribution of such shares by the Acquired Fund pro rata to its shareholders in complete liquidation and termination of the Acquired Fund, all upon the terms and conditions set forth in this Agreement. The foregoing transactions are referred to herein as the “Reorganization.”
In consideration of the mutual promises and subject to the terms and conditions herein, the parties covenant and agree as follows:
1. REPRESENTATIONS AND WARRANTIES OF EACH ACQUIRED FUND. Each Acquired Fund represents and warrants to and agrees with the Acquiring Fund that:
(a) The Acquired Fund is a series of the Trust, a statutory trust duly organized, validly existing, and in good standing under the laws of the State of Delaware, and has the power to own all of its properties and assets and to carry out its obligations under this Agreement. It has all necessary federal, state, and local authorizations to carry on its business as now being conducted and to carry out this Agreement;
69
Table of Contents
(b) The Trust is an open-end, management investment company duly registered under the Investment Company Act of 1940, as amended (the “1940 Act”), and such registration is in full force and effect;
(c) The Prospectus and Statement of Additional Information of the Acquired Fund dated July 30, 2020, as supplemented, previously furnished to the Acquiring Fund, did not and do not contain any untrue statement of a material fact or omit to state a material fact required to be stated therein or necessary to make the statements therein not misleading;
(d) Except as disclosed in writing to the Acquiring Fund, there are no material legal, administrative, or other proceedings pending or, to the knowledge of the Acquired Fund, threatened against the Acquired Fund which assert liability on the part of the Acquired Fund. The Acquired Fund knows of no facts which might reasonably form the basis for the institution of such proceedings, except as otherwise disclosed to the Acquiring Fund;
(e) The Acquired Fund is not in, and the execution, delivery, and performance of this Agreement will not result in, violation of any provision of its Trust Instrument or By-laws, or, to the knowledge of the Acquired Fund, of any agreement, indenture, instrument, contract, lease, or other undertaking to which the Acquired Fund is a party or by which the Acquired Fund is bound or result in the acceleration of any obligation or the imposition of any penalty under any agreement, judgment or decree to which the Acquired Fund is a party or is bound;
(f) The Statement of Assets and Liabilities, the Statement of Operations, the Statement of Changes in Net Assets, Financial Highlights, and the Schedule of Investments (including market values) of the Acquired Fund at May 31, 2020, have been audited by PricewaterhouseCoopers LLP, independent registered public accounting firm, and have been furnished to the Acquiring Fund. Said Statements of Assets and Liabilities and Schedule of Investments fairly present the Acquired Fund’s financial position as of such date and said Statement of Operations, Statement of Changes in Net Assets, and Financial Highlights fairly reflect the Acquired Fund’s results of operations, changes in financial position, and financial highlights for the periods covered thereby in conformity with generally accepted accounting principles consistently applied;
(g) The Acquired Fund has no known liabilities of a material nature, contingent or otherwise, other than those shown as belonging to it on its statement of assets and liabilities as of May 31, 2020 and those incurred in the ordinary course of the Acquired Fund’s business as an investment company since May 31, 2020;
70
Table of Contents
(h) The registration statement (“Registration Statement”) filed with the Securities and Exchange Commission (“Commission”) by the Trust on Form N-14 relating to the shares of the Acquiring Fund issuable hereunder and the proxy statement of the Acquired Fund included therein (“Proxy Statement”), on the effective date of the Registration Statement and insofar as they relate to the Acquired Fund (i) comply in all material respects with the provisions of the Securities Act of 1933, as amended (the 1933 Act), the Securities Exchange Act of 1934, as amended (the “1934 Act”), and the 1940 Act, and the rules and regulations thereunder, and (ii) do not contain any untrue statement of a material fact or omit to state a material fact required to be stated therein or necessary to make the statements therein not misleading; and at the time of the shareholders’ meeting referred to in Section 7 and on the Closing Date (as defined in Section 6), the prospectus contained in the Registration Statement of which the Proxy Statement is a part (the “Prospectus”), as amended or supplemented, insofar as it relates to the Acquired Fund, will not contain any untrue statement of a material fact or omit to state a material fact required to be stated therein or necessary to make the statements therein not misleading;
(i) No consent, approval, authorization, or order of any court or governmental authority is required for the consummation by the Acquired Fund of the transactions contemplated by this Agreement, except such as have been obtained under the 1933 Act, the 1934 Act, the 1940 Act, and state securities or blue sky laws (which term as used in this Agreement shall include the District of Columbia and Puerto Rico);
(j) The Acquired Fund has filed or will file all federal and state tax returns which, to the knowledge of the Acquired Fund’s officers, are required to be filed by the Acquired Fund and has paid or will pay all federal and state taxes shown to be due on said returns or provision shall have been made for the payment thereof, and, to the best of the Acquired Fund’s knowledge, no such return is currently under audit and no assessment has been asserted with respect to such returns;
(k) The Acquired Fund has met the requirements of Subchapter M of the Code for qualification and treatment as a regulated investment company for all prior taxable years and intends to meet such requirements for its current taxable year ending on the Closing Date;
(l) All of the issued and outstanding shares of the Acquired Fund are, and at the Closing Date will be, duly and validly issued and outstanding and fully paid and nonassessable as a matter of Delaware law (except as disclosed in the Acquired Fund’s Statement of Additional Information), and
71
Table of Contents
have been offered for sale and in conformity with all applicable federal securities laws. All of the issued and outstanding shares of the Acquired Fund will, at the Closing Date, be held by the persons and in the amounts set forth in the list of shareholders submitted to the Acquiring Fund in accordance with this Agreement;
(m) As of both the Valuation Time (as defined in Section 4) and the Closing Date, the Acquired Fund will have the full right, power, and authority to sell, assign, transfer, and deliver its portfolio securities and any other assets of the Acquired Fund to be transferred to the Acquiring Fund pursuant to this Agreement. As of the Closing Date, subject only to the delivery of the Acquired Fund’s portfolio securities and any such other assets as contemplated by this Agreement, the Acquiring Fund will acquire the Acquired Fund’s portfolio securities and any such other assets subject to no encumbrances, liens, or security interests (except for those that may arise in the ordinary course and are disclosed to the Acquiring Fund) and without any restrictions upon the transfer thereof; and
(n) The execution, delivery, and performance of this Agreement will have been duly authorized prior to the Closing Date by all necessary corporate action on the part of the Acquired Fund, and this Agreement constitutes a valid and binding obligation of the Acquired Fund enforceable in accordance with its terms, subject to approval by the shareholders of the Acquired Fund.
2. REPRESENTATIONS AND WARRANTIES OF THE ACQUIRING FUND. The Acquiring Fund represents and warrants to and agrees with each Acquired Fund that:
(a) The Acquiring Fund is a series of the Trust, a statutory trust duly organized, validly existing, and in good standing under the laws of the State of Delaware, and has the power to own all of its properties and assets and to carry out its obligations under this Agreement. It has all necessary federal, state, and local authorizations to carry on its business as now being conducted and to carry out this Agreement;
(b) The Trust is an open-end, management investment company duly registered under the 1940 Act, and such registration is in full force and effect;
(c) The Prospectus and Statement of Additional Information of the Acquiring Fund, dated July 29, 2020, as supplemented, previously furnished to each Acquired Fund, did not and do not contain any untrue statement of a material fact or omit to state a material fact required to be stated therein or necessary to make the statements therein not misleading;
72
Table of Contents
(d) Except as disclosed in writing to each Acquired Fund, there are no material legal, administrative, or other proceedings pending or, to the knowledge of the Acquiring Fund, threatened against the Acquiring Fund which assert liability on the part of the Acquiring Fund. The Acquiring Fund knows of no facts which might reasonably form the basis for the institution of such proceedings, except as otherwise disclosed to each Acquired Fund;
(e) The Acquiring Fund is not in, and the execution, delivery, and performance of this Agreement will not result in, violation of any provision of its Trust Instrument or By-laws, or, to the knowledge of the Acquiring Fund, of any agreement, indenture, instrument, contract, lease, or other undertaking to which the Acquiring Fund is a party or by which the Acquiring Fund is bound or result in the acceleration of any obligation or the imposition of any penalty under any agreement, judgment, or decree to which the Acquiring Fund is a party or is bound;
(f) [Reserved];
(g) [Reserved];
(h) No consent, approval, authorization, or order of any court or governmental authority is required for the consummation by the Acquiring Fund of the transactions contemplated by this Agreement, except such as have been obtained under the 1933 Act, the 1934 Act, the 1940 Act, and state securities or blue sky laws;
(i) [Reserved];
(j) The Acquiring Fund intends to meet the requirements of Subchapter M of the Code for qualification and treatment as a regulated investment company for its current taxable year ending on May 31, 2021;
(k) As of the Closing Date, the shares of beneficial interest of the Acquiring Fund to be issued to each Acquired Fund will have been duly authorized and, when issued and delivered pursuant to this Agreement, will be legally and validly issued and will be fully paid and nonassessable (except as disclosed in the Acquiring Fund’s Statement of Additional Information) by the Acquiring Fund, and no shareholder of the Acquiring Fund will have any preemptive right of subscription or purchase in respect thereof;
73
Table of Contents
(l) The execution, delivery, and performance of this Agreement will have been duly authorized prior to the Closing Date by all necessary corporate action on the part of the Acquiring Fund, and this Agreement constitutes a valid and binding obligation of the Acquiring Fund enforceable in accordance with its terms, subject to approval by the shareholders of each Acquired Fund;
(m) The Registration Statement and the Proxy Statement, on the effective date of the Registration Statement and insofar as they relate to the Acquiring Fund, (i) comply in all material respects with the provisions of the 1933 Act, the 1934 Act, and the 1940 Act, and the rules and regulations thereunder, and (ii) do not contain any untrue statement of a material fact or omit to state a material fact required to be stated therein or necessary to make the statements therein not misleading; and at the time of the shareholders’ meeting referred to in Section 7 and on the Closing Date, the Prospectus, as amended or supplemented, insofar as it relates to the Acquiring Fund, will not contain any untrue statement of a material fact or omit to state a material fact required to be stated therein or necessary to make the statements therein not misleading;
(n) The issuance of the Acquiring Fund Shares pursuant to this Agreement will be in compliance with all applicable federal securities laws; and
(o) All of the issued and outstanding shares of beneficial interest of the Acquiring Fund have been offered for sale and sold in conformity with the federal securities laws.
3. REORGANIZATION.
(a) Subject to the requisite approval of the shareholders of each respective Acquired Fund and to the other terms and conditions contained herein, each Acquired Fund agrees to assign, sell, convey, transfer, and deliver to the Acquiring Fund as of the Closing Date all of the assets of each respective Acquired Fund of every kind and nature existing on the Closing Date. The Acquiring Fund agrees in exchange therefor: (i) to assume all of the liabilities existing on or after the Closing Date for each respective Acquired Fund, whether or not determinable on the Closing Date, and (ii) to issue and deliver to each Acquired Fund the number of full and fractional shares of the Acquiring Fund having an aggregate net asset value equal to the value of the assets of each respective Acquired Fund transferred hereunder, less the value of the liabilities of each Acquired Fund, determined as provided for under Section 4.
74
Table of Contents
(b) The assets of each Acquired Fund to be acquired by the Acquiring Fund shall include, without limitation, all cash, cash equivalents, securities, commodities and futures interests, receivables (including interest or dividends receivables), claims, choses in action, and other property owned by the Acquired Fund, and any deferred or prepaid expenses shown as an asset on the books of the Acquired Fund on the Closing Date. Each Acquired Fund will pay or cause to be paid to the Acquiring Fund any dividend or interest payments received by it on or after the Closing Date with respect to the assets transferred to the Acquiring Fund hereunder, and the Acquiring Fund will retain any dividend or interest payments received by it after the Valuation Time with respect to the assets transferred hereunder without regard to the payment date thereof.
(c) The liabilities of each Acquired Fund to be assumed by the Acquiring Fund shall include (except as otherwise provided for herein) all of the Acquired Fund’s liabilities, debts, obligations, and duties, of whatever kind or nature, whether absolute, accrued, contingent, or otherwise, whether or not arising in the ordinary course of business, whether or not determinable on the Closing Date, and whether or not specifically referred to in this Agreement. Notwithstanding the foregoing, each Acquired Fund agrees to use its best efforts to discharge all of its known liabilities prior to the Closing Date, other than liabilities incurred in the ordinary course of business.
(d) Pursuant to this Agreement, as soon after the Closing Date as is conveniently practicable, each Acquired Fund will constructively distribute pro rata to its respective shareholders of record, determined as of the Valuation Time on the Closing Date, the Acquiring Fund Shares in exchange for such shareholders’ shares of beneficial interest in the Acquired Fund and the Acquired Fund will be liquidated in accordance with the Acquired Fund’s Trust Instrument. Such distribution shall be accomplished by the Funds’ transfer agent opening accounts on the Acquiring Fund’s share transfer books in the names of each respective Acquired Fund shareholders and transferring the Acquiring Fund shares thereto. Each Acquired Fund shareholder’s account shall be credited with the respective pro rata number of full and fractional Acquiring Fund shares due that shareholder. All outstanding Acquired Fund shares, including any represented by certificates, shall simultaneously be canceled on each Acquired Fund’s share transfer records. The Acquiring Fund shall not issue certificates representing the Acquiring Fund Shares in connection with the Reorganization.
75
Table of Contents
(e) Any reporting responsibility of an Acquired Fund is and shall remain its responsibility up to and including the date on which it is terminated.
(f) Any transfer taxes payable upon issuance of the Acquiring Fund shares in a name other than that of the registered holder on each Acquired Fund’s books of the Acquired Fund shares constructively exchanged for the Acquiring Fund Shares shall be paid by the person to whom such Acquiring Fund Shares are to be issued, as a condition of such transfer.
4. VALUATION.
(a) The Valuation Time shall be as of the close of business of the New York Stock Exchange on the Closing Date, or such other date as may be mutually agreed upon in writing by the parties hereto (the “Valuation Time”).
(b) As of the Closing Date, the Acquiring Fund will deliver to each Acquired Fund the number of Acquiring Fund Shares having an aggregate net asset value equal to the value of the assets of each respective Acquired Fund transferred hereunder less the liabilities of each respective Acquired Fund, determined as provided in this Section 4.
(c) The net asset value per share of the Acquiring Fund shares to be delivered to each Acquired Fund, the value of the assets of each Acquired Fund transferred hereunder, and the value of the liabilities of each Acquired Fund to be assumed hereunder shall in each case be determined as of the Valuation Time.
(d) The net asset value per share of the Acquiring Fund shares and the value of the assets and liabilities of each Acquired Fund shall be computed in the manner set forth in the then-current Acquiring Fund Prospectus and Statement of Additional Information.
(e) All computations pursuant to this Section shall be made by or under the direction of Fidelity Service Company, Inc., a wholly-owned subsidiary of FMR LLC, in accordance with its regular practice as pricing agent for the Acquired Fund and each Acquiring Fund.
5. FEES; EXPENSES.
(a) Pursuant to the Strategic Advisers Core Fund’s (“Core Acquired Fund’”) all-inclusive management contract with the Core Acquired Fund’s investment adviser (the “Adviser”), the Adviser will pay all Core Acquired
76
Table of Contents
Fund fees and expenses, including legal, accounting, printing, filing, and proxy solicitation expenses, portfolio transfer taxes (if any), or other similar expenses incurred in connection with the transactions contemplated by this Agreement (but not including costs incurred in connection with the purchase or sale of portfolio securities).
(b) The Strategic Advisers Growth Fund (“Growth Acquired Fund”) shall be responsible for all expenses, fees and other charges in connection with the transactions contemplated by this Agreement incurred by the Growth Acquired Fund.
(c) The Strategic Advisers Value Fund (“Value Acquired Fund”) shall be responsible for all expenses, fees and other charges in connection with the transactions contemplated by this Agreement incurred by the Value Acquired Fund.
(d) Any expenses incurred in connection with the transactions contemplated by this Agreement which may be attributable to the Acquiring Fund will be borne by the Acquiring Fund.
(e) The Acquiring Fund and each Acquired Fund represent that there is no person who has dealt with it who by reason of such dealings is entitled to any broker’s or finder’s or other similar fee or commission arising out of the transactions contemplated by this Agreement.
6. CLOSING DATE.
(a) The Reorganization, together with related acts necessary to consummate the same (the “Closing”), unless otherwise provided herein, shall occur at the principal office of the Trust, 245 Summer Street, Boston, Massachusetts, as of the Valuation Time on November 13, 2020, or at some other time, date, and place agreed to by each Acquired Fund and the Acquiring Fund (the “Closing Date”).
(b) In the event that on the Closing Date: (i) any of the markets for securities held by the Funds is closed to trading, or (ii) trading thereon is restricted, or (iii) trading or the reporting of trading on said market or elsewhere is disrupted, all so that accurate appraisal of the total net asset value of an Acquired Fund and the net asset value per share of the Acquiring Fund is impracticable, the Valuation Time and the Closing Date shall be postponed until the first business day after the day when such trading shall have been fully resumed and such reporting shall have been restored, or such other date as the parties may agree.
77
Table of Contents
7. SHAREHOLDER MEETING AND TERMINATION OF EACH ACQUIRED FUND.
(a) Each Acquired Fund agrees to call a meeting of its shareholders after the effective date of the Registration Statement, to consider transferring its assets to the Acquiring Fund as herein provided, adopting this Agreement, and authorizing the liquidation of the Acquired Fund.
(b) Each Acquired Fund agrees that as soon as reasonably practicable after distribution of the Acquiring Fund Shares, each Acquired Fund shall be terminated as a series of the Trust pursuant to its Trust Instrument, any further actions shall be taken in connection therewith as required by applicable law, and on and after the Closing Date each Acquired Fund shall not conduct any business except in connection with its liquidation and termination.
8. CONDITIONS TO OBLIGATIONS OF THE ACQUIRING FUND.
(a) That, as of the Valuation Time and the Closing Date, all representations and warranties of each Acquired Fund made in this Agreement are true and correct in all material respects and that each Acquired Fund has complied with all the agreements and satisfied all the conditions on its part to be performed or satisfied at or prior to such dates;
(b) That this Agreement and the transactions contemplated herein are approved by the requisite vote of the holders of the outstanding shares of beneficial interest of each respective Acquired Fund;
(c) That, on or prior to the Closing Date, each Acquired Fund will declare one or more dividends or distributions which, together with all previous such dividends or distributions attributable to its current taxable year, shall have the effect of distributing to the shareholders of each respective Acquired Fund substantially all of the respective Acquired Fund’s investment company taxable income and all of its net realized capital gain, if any, as of the Closing Date;
(d) That the Acquiring Fund at the Closing shall have access to a statement of each Acquired Fund’s assets and liabilities, together with a list of its portfolio securities showing each such security’s adjusted tax basis and holding period by lot, with values determined as provided in Section 4 of this Agreement, all as of the Valuation Time;
(e) That each Acquired Fund’s custodian shall deliver to the Acquiring Fund a certificate identifying the assets of the Acquired Fund
78
Table of Contents
held by such custodian as of the Valuation Time on the Closing Date and stating that as of the Valuation Time: (i) the assets held by the custodian will be transferred to the Acquiring Fund; (ii) each Acquired Fund’s assets have been duly endorsed in proper form for transfer in such condition as to constitute good delivery thereof; and (iii) to the best of the custodian’s knowledge, all applicable taxes (including stock transfer taxes, if any) in conjunction with the delivery of the assets, that the custodian has been notified are due, have been paid or provision for payment has been made;
(f) That the Acquiring Fund at the Closing shall have access to the number of shares of each Acquired Fund outstanding as of the Valuation Time and the name and address of each holder of record of any such shares and the number of shares held of record by each such shareholder, as maintained by each Acquired Fund’s transfer agent;
(g) That each Acquired Fund calls a meeting of its respective shareholders to be held after the effective date of the Registration Statement, to consider transferring its assets to the Acquiring Fund as herein provided, adopting this Agreement, and authorizing the liquidation and termination of each respective Acquired Fund;
(h) That there has been no material adverse change in each Acquired Fund’s financial position since May 31, 2020, other than changes in the market value of its portfolio securities, or changes due to net redemptions of its shares, dividends paid, or losses from operations; and
(i) That all of the issued and outstanding shares of beneficial interest of each respective Acquired Fund shall have been offered for sale and sold in conformity with all applicable state securities laws and, to the extent that any audit of the records of each Acquired Fund or its transfer agent by the Acquiring Fund or its agents shall have revealed otherwise, each Acquired Fund shall have taken all actions that in the opinion of the Acquiring Fund are necessary to remedy any prior failure on the part of such Acquired Fund to have offered for sale and sold such shares in conformity with such laws.
9. CONDITIONS TO OBLIGATIONS OF EACH ACQUIRED FUND.
(a) That the Acquiring Fund shall have executed and delivered to each Acquired Fund an Assumption of Liabilities, certified by an authorized officer of the Trust, dated as of the Closing Date pursuant to which the Acquiring Fund will assume all of the liabilities of the Acquired Fund existing at the Valuation Time in connection with the transactions contemplated by this Agreement;
79
Table of Contents
(b) That, as of the Valuation Time and the Closing Date, all representations and warranties of the Acquiring Fund made in this Agreement are true and correct in all material respects, and the Acquiring Fund has complied with all the agreements and satisfied all the conditions on its part to be performed or satisfied at or prior to such dates; and
(c) That each Acquired Fund shall have received an opinion of Dechert LLP, counsel to the Acquired Fund and the Acquiring Fund, to the effect that the Acquiring Fund shares are duly authorized and upon delivery to the Acquired Fund as provided in this Agreement will be validly issued and will be fully paid and nonassessable by the Acquiring Fund (except as disclosed in the Acquiring Fund’s Statement of Additional Information) and no shareholder of the Acquiring Fund has any preemptive right of subscription or purchase in respect thereof.
10. CONDITIONS TO OBLIGATIONS OF THE ACQUIRING FUND AND EACH ACQUIRED FUND.
(a) That this Agreement shall have been adopted and the transactions contemplated herein shall have been approved by the requisite vote of the holders of the outstanding shares of beneficial interest of each respective Acquired Fund;
(b) That all consents of other parties and all other consents, orders, and permits of federal, state, and local regulatory authorities (including those of the Commission and of state blue sky and securities authorities, and including “no action” positions of such federal or state authorities) deemed necessary by the Acquiring Fund or each Acquired Fund to permit consummation, in all material respects, of the transactions contemplated hereby shall have been obtained, except where failure to obtain any such consent, order, or permit would not involve a risk of a material adverse effect on the assets or properties of the Acquiring Fund or each Acquired Fund, provided that either party hereto may for itself waive any of such conditions;
(c) That all proceedings taken by either Fund in connection with the transactions contemplated by this Agreement and all documents incidental thereto shall be satisfactory in form and substance to it and its counsel, Dechert LLP;
(d) That there shall not be any material litigation pending with respect to the matters contemplated by this Agreement;
80
Table of Contents
(e) That the Registration Statement shall have become effective under the 1933 Act, and no stop order suspending such effectiveness shall have been instituted or, to the knowledge of the Acquiring Fund and the Acquired Fund, threatened by the Commission; and
(f) That the Acquiring Fund and each Acquired Fund shall have received an opinion of Dechert LLP satisfactory to the Acquiring Fund and each Acquired Fund substantially to the effect that for federal income tax purposes:
(i) The Reorganization will constitute a tax-free reorganization under Section 368(a) of the Code.
(ii) The Acquired Fund will not recognize gain or loss upon the transfer of substantially all of its assets to the Acquiring Fund in exchange solely for the Acquiring Fund Shares and the assumption of all liabilities of the Acquired Fund, except that the Acquired Fund may be required to recognize gain or loss with respect to contracts described in Section 1256(b) of the Code or stock in a passive foreign investment company, as defined in Section 1297(a) of the Code.
(iii) The Acquired Fund will not recognize gain or loss upon the distribution to its shareholders of the Acquiring Fund Shares received by the Acquired Fund in the Reorganization.
(iv) The Acquiring Fund will recognize no gain or loss upon receiving the properties of the Acquired Fund in exchange solely for the Acquiring Fund Shares and the assumption of all liabilities of the Acquired Fund.
(v) The adjusted basis to the Acquiring Fund of the properties of the Acquired Fund received by the Acquiring Fund in the Reorganization will be the same as the adjusted basis of those properties in the hands of the Acquired Fund immediately before the exchange.
(vi) The Acquiring Fund’s holding periods with respect to the properties of the Acquired Fund that the Acquiring Fund acquires in the Reorganization will include the respective periods for which those properties were held by the Acquired Fund (except where investment activities of the Acquiring Fund have the effect of reducing or eliminating a holding period with respect to an asset).
81
Table of Contents
(vii) The Acquired Fund shareholders will recognize no gain or loss upon receiving the Acquiring Fund Shares solely in exchange for the Acquired Fund shares.
(viii) The aggregate basis of the Acquiring Fund Shares received by an Acquired Fund shareholder in the Reorganization will be the same as the aggregate basis of the Acquired Fund shares surrendered by the Acquired Fund shareholder in exchange therefor.
(ix) An Acquired Fund shareholder’s holding period for the Acquiring Fund Shares received by the Acquired Fund shareholder in the Reorganization will include the holding period during which the Acquired Fund shareholder held the Acquired Fund shares surrendered in exchange therefor, provided that the Acquired Fund shareholder held such shares as a capital asset on the date of the Reorganization.
Notwithstanding anything herein to the contrary, neither the Acquired Fund nor the Acquiring Fund may waive the conditions set forth in this subsection 10(f).
11. COVENANTS OF THE ACQUIRING FUND AND EACH ACQUIRED FUND.
(a) The Acquiring Fund and each Acquired Fund each covenants to operate its respective business in the ordinary course between the date hereof and the Closing Date, it being understood that such ordinary course of business will include the payment of customary dividends and distributions;
(b) Each Acquired Fund covenants that it is not acquiring the Acquiring Fund shares for the purpose of making any distribution other than in accordance with the terms of this Agreement;
(c) Each Acquired Fund covenants that it will assist the Acquiring Fund in obtaining such information as the Acquiring Fund reasonably requests concerning the beneficial ownership of each Acquired Fund’s shares; and
(d) Each Acquired Fund covenants that its liquidation and termination will be effected in the manner provided in its Trust Instrument in accordance with applicable law, and after the Closing Date, the Acquired Fund will not conduct any business except in connection with its liquidation and termination.
82
Table of Contents
12. TERMINATION; WAIVER.
The Acquiring Fund and each Acquired Fund may terminate this Agreement by mutual agreement. In addition, either the Acquiring Fund or each Acquired Fund may at its option terminate this Agreement at or prior to the Closing Date because:
(i) of a material breach by the other of any representation, warranty, or agreement contained herein to be performed at or prior to the Closing Date; or
(ii) a condition herein expressed to be precedent to the obligations of the terminating party has not been met and it reasonably appears that it will not or cannot be met.
In the event of any such termination, there shall be no liability for damages on the part of each Acquired Fund or the Acquiring Fund, or their respective Trustees or officers.
13. SOLE AGREEMENT; AMENDMENTS; WAIVERS; SURVIVAL OF WARRANTIES.
(a) This Agreement supersedes all previous correspondence and oral communications between the parties regarding the subject matter hereof, constitutes the only understanding with respect to such subject matter, may not be changed except by a letter of agreement signed by each party hereto and shall be construed in accordance with and governed by the laws of the State of Delaware.
(b) This Agreement may be amended, modified, or supplemented in such manner as may be mutually agreed upon in writing by the respective President, any Vice President, or Treasurer of the Acquiring Fund or each Acquired Fund ; provided, however, that following the shareholders’ meeting called by each Acquired Fund pursuant to Section 7 of this Agreement, no such amendment may have the effect of changing the provisions for determining the number of the Acquiring Fund Shares to be paid to each Acquired Fund respective shareholders under this Agreement to the detriment of such shareholders without their further approval.
(c) Either Fund may waive any condition to its obligations hereunder, provided that such waiver does not have any material adverse effect on the interests of such Fund’s shareholders.
83
Table of Contents
The representations, warranties, and covenants contained in the Agreement, or in any document delivered pursuant hereto or in connection herewith, shall survive the consummation of the transactions contemplated hereunder.
14. DECLARATIONS OF TRUST.
A copy of each Fund’s Trust Instrument is on file with the Secretary of State of the State of Delaware, and notice is hereby given that this instrument is executed on behalf of the Trustees of each Fund as trustees and not individually and that the obligations of each Fund under this instrument are not binding upon any of such Fund’s Trustees, officers, or shareholders individually but are binding only upon the assets and property of such Fund. Each Fund agrees that its obligations hereunder apply only to such Fund and not to its shareholders individually or to the Trustees of such Fund.
15. ASSIGNMENT.
This Agreement shall bind and inure to the benefit of the parties hereto and their respective successors and assigns, but no assignment or transfer of any rights or obligations hereunder shall be made by any party without the written consent of the other parties. Nothing herein expressed or implied is intended or shall be construed to confer upon or give any person, firm, or corporation other than the parties hereto and their respective successors and assigns any rights or remedies under or by reason of this Agreement.
This Agreement may be executed in any number of counterparts, each of which, when executed and delivered, shall be deemed to be an original.
84
Table of Contents
IN WITNESS WHEREOF, each of the parties hereto has caused this Agreement to be executed by an appropriate officer.
[SIGNATURE LINES OMITTED]
85
Table of Contents
The following table shows the capitalization of Core Fund, Growth Fund, Value Fund, and Large Cap Fund as of May 31, 2020, and on a pro forma combined basis (unaudited) as of that date giving effect to all of the Reorganizations if all are approved.
| Net Assets | Net Asset Value Per Share |
Shares Outstanding |
||||||||||
| Core Fundc |
$ | 27,026,081,269 | $ | 18.29 | 1,477,889,462 | |||||||
| Growth Fundd |
$ | 8,905,509,859 | $ | 19.66 | 452,953,854 | |||||||
| Value Funde |
$ | 8,666,162,503 | $ | 16.27 | 532,532,088 | |||||||
| Large Cap Fundf |
N/A | N/A | N/A | |||||||||
| Large Cap Fund Pro Forma Combined Fund |
$ | 44,597,753,631 | $ | 10.00 | b | 4,459,775,363 | a | |||||
| a | To comply with Rule 3-18 of Regulation S-X, the pro-forma financial statements will be based on the most recent audited annual report of the Acquiring Fund. If these are more than 245 days old as of the effective date of the N-14 filing, interim financial statements covering a 12 month period will be used. In addition, per Regulation S-X Section 210.11 - 02 (a)(7) shares have been adjusted to reflect what will be issued post-merger. |
| b | Large Cap Fund expected to launch at $10.00 net asset value per share. |
| c | Core Fund’s estimated one time proxy costs related to the proposals in this proxy statement is $77,376. Strategic Advisers will bear the fund’s one time proxy cost pursuant to its all-inclusive management contract. |
| d | Growth Fund’s estimated one time proxy costs related to the proposals in this proxy statement is $77,349. |
| e | Value Fund’s estimated one time proxy costs related to the proposals in this proxy statement is $77,275. |
| f | Large Cap Fund is expected to commence operations in November 2020. |
86
Table of Contents
Strategic Advisers, Fidelity Investments & Pyramid Design, Fidelity, and FundsNetwork are registered service marks of FMR LLC.© 2020 FMR LLC. All rights reserved.
Any third-party marks that may appear above are the marks of their respective owners.
| 1.9899679.100 | RSSAI-M-PXS-0920 |
Table of Contents
Fund/Ticker
Strategic Advisers® Large Cap Fund/FALCX
Offered exclusively to certain clients of Strategic Advisers LLC or its affiliates - not available for sale to the general public
Prospectus
July 29, 2020
Beginning on January 1, 2021, as permitted by regulations adopted by the Securities and Exchange Commission, paper copies of a fund’s shareholder reports will no longer be sent by mail, unless you specifically request paper copies of the reports from the fund or from your financial intermediary, such as a financial advisor, broker-dealer or bank. Instead, the reports will be made available on a website, and you will be notified by mail each time a report is posted and provided with a website link to access the report.
If you already elected to receive shareholder reports electronically, you will not be affected by this change and you need not take any action. You may elect to receive shareholder reports and other communications from a fund electronically, by contacting your financial intermediary. For Fidelity customers, visit Fidelity’s web site or call Fidelity using the contact information listed below.
You may elect to receive all future reports in paper free of charge. If you wish to continue receiving paper copies of your shareholder reports, you may contact your financial intermediary or, if you are a Fidelity customer, visit Fidelity’s website, or call Fidelity at the applicable toll-free number listed below. Your election to receive reports in paper will apply to all funds held with the fund complex/your financial intermediary.
| Account Type |
Website |
Phone Number | ||
| Brokerage, Mutual Fund, or Annuity Contracts: | fidelity.com/mailpreferences | 1-800-343-3548 | ||
| Employer Provided Retirement Accounts: | netbenefits.fidelity.com/preferences (choose ‘no’ under Required Disclosures to continue to print) | 1-800-343-0860 | ||
| Advisor Sold Accounts Serviced Through Your Financial Intermediary: | Contact Your Financial Intermediary | Your Financial Intermediary’s phone number | ||
| Advisor Sold Accounts Serviced by Fidelity: | institutional.fidelity.com | 1-877-208-0098 | ||
| Like securities of all mutual funds, these securities have not been approved or disapproved by the Securities and Exchange Commission, and the Securities and Exchange Commission has not determined if this prospectus is accurate or complete. Any representation to the contrary is a criminal offense. |
245 Summer Street, Boston, MA 02210 |

Table of Contents
| Fund Summary | Strategic Advisers® Large Cap Fund | 3 | ||
| Fund Basics | Investment Details | 6 | ||
| Valuing Shares | 10 | |||
| Shareholder Information | Additional Information about the Purchase and Sale of Shares | 11 | ||
| Dividends and Capital Gain Distributions | 13 | |||
| Tax Consequences | 13 | |||
| Fund Services | Fund Management | 13 | ||
| Fund Distribution | 16 | |||
| Appendix | Additional Index Information | 17 | ||
2
Table of Contents
Fund Summary
Fund:
Strategic Advisers® Large Cap Fund
Investment Objective
The fund seeks capital appreciation.
Fee Table
The following table describes the fees and expenses that may be incurred when you buy and hold shares of the fund.
Shareholder fees
| (fees paid directly from your investment) | None |
Annual Operating Expenses
(expenses that you pay each year as a % of the value of your investment)
| Management fee (fluctuates based on the fund’s allocation among underlying funds and sub-advisers)(a),(b) |
0.42 | % | ||
| Distribution and/or Service (12b-1) fees |
None | |||
| Other expenses(b) |
0.00 | % | ||
| Acquired fund fees and expenses(b) |
0.08 | % | ||
|
|
|
|||
| Total annual operating expenses |
0.50 | % | ||
| Fee waiver and/or expense reimbursement(a) |
0.25 | % | ||
|
|
|
|||
| Total annual operating expenses after fee waiver and/or expense reimbursement |
0.25 | % |
(a) Strategic Advisers LLC (Strategic Advisers) has contractually agreed that the fund’s maximum aggregate annual management fee will not exceed 0.65% of the fund’s average daily net assets. In addition, Strategic Advisers has contractually agreed to waive a portion of the fund’s management fee in an amount equal to 0.25% of the fund’s average daily net assets. This arrangement will remain in effect through September 30, 2023, and neither Strategic Advisers nor any of its affiliates retain the ability to be repaid with respect to this arrangement. Strategic Advisers may not terminate this arrangement without the approval of the Board of Trustees.
(b) Based on estimated amounts for the current fiscal year.
This example helps compare the cost of investing in the fund with the cost of investing in other funds.
Let’s say, hypothetically, that the annual return for shares of the fund is 5% and that your shareholder fees and the annual operating expenses for shares of the fund are exactly as described in the fee table. This example illustrates the effect of fees and expenses, but is not meant to suggest actual or expected fees and expenses or returns, all of which may vary. For every $10,000 you invested, here’s how much you would pay in total expenses if you sell all of your shares at the end of each time period indicated:
| 1 year |
$ | 26 | ||
| 3 years |
$ | 80 |
Portfolio Turnover
The fund will not incur transaction costs, such as commissions, when it buys and sells shares of affiliated mutual funds but may incur transaction costs when buying or selling non-affiliated funds and other types of securities (including exchange traded funds (ETFs)) directly (or “turns over” its portfolio). A higher portfolio turnover rate may indicate higher transaction costs and may result in higher taxes when fund shares are held in a taxable account. These costs, which are not reflected in annual operating expenses or in the example, affect the fund’s performance.
Principal Investment Strategies
| • | Normally investing at least 80% of its assets in securities and shares of funds with large market capitalizations (which, for purposes of this fund, are those companies with market capitalizations similar to companies in the Russell 1000® Index or the S&P 500® Index). |
3
Table of Contents
| • | Investing in domestic and foreign issuers. |
| • | Normally investing in a combination of “growth” and “value” stocks. |
| • | Implementing investment strategies by investing directly in securities through one or more managers (sub-advisers) or indirectly in securities through one or more other funds, referred to as underlying funds, which in turn invest directly in securities (as described below). |
| • | Allocating assets among affiliated equity funds (i.e., Fidelity® funds, including mutual funds and ETFs), non-affiliated equity funds that participate in Fidelity’s FundsNetwork®, non-affiliated ETFs (collectively, underlying funds), and sub-advisers. |
| • | Allocating assets among sub-advisers and underlying funds using proprietary fundamental and quantitative research, considering factors including, but not limited to, performance in different market environments, manager experience and investment style, management company infrastructure, costs, asset size, and portfolio turnover. |
Pursuant to an exemptive order granted by the Securities and Exchange Commission (SEC), Strategic Advisers LLC (Strategic Advisers) is permitted, subject to the approval of the Board of Trustees, to enter into new or amended sub-advisory agreements with one or more unaffiliated sub-advisers without obtaining shareholder approval of such agreements. Subject to oversight by the Board of Trustees, Strategic Advisers has the ultimate responsibility to oversee the fund’s sub-advisers and recommend their hiring, termination, and replacement. In the event the Board of Trustees approves a sub-advisory agreement with a new unaffiliated sub-adviser, shareholders will be provided with information about the new sub-adviser and sub-advisory agreement.
Principal Investment Risks
| • | Multiple Sub-Adviser Risk. Separate investment decisions and the resulting purchase and sale activities of the fund’s sub-advisers might adversely affect the fund’s performance or lead to disadvantageous tax consequences. |
| • | Investing in Other Funds. Regulatory restrictions may limit the amount that one fund can invest in another, which means that the fund’s manager may not be able to invest as much as it wants to in some other funds. The fund bears all risks of investment strategies employed by the underlying funds, including the risk that the underlying funds will not meet their investment objectives. |
| • | Stock Market Volatility. Stock markets are volatile and can decline significantly in response to adverse issuer, political, regulatory, market, or economic developments. Different parts of the market, including different market sectors, and different types of securities can react differently to these developments. |
| • | Foreign Exposure. Foreign markets can be more volatile than the U.S. market due to increased risks of adverse issuer, political, regulatory, market, or economic developments and can perform differently from the U.S. market. |
| • | Industry Exposure. Market conditions, interest rates, and economic, regulatory, or financial developments could significantly affect a single industry or group of related industries. |
| • | Issuer-Specific Changes. The value of an individual security or particular type of security can be more volatile than, and can perform differently from, the market as a whole. |
| • | Investing in ETFs. ETFs may trade in the secondary market at prices below the value of their underlying portfolios and may not be liquid. ETFs that track an index are subject to tracking error and may be unable to sell poorly performing assets that are included in their index or other benchmark. |
4
Table of Contents
| • | “Growth” Investing. “Growth” stocks can perform differently from the market as a whole and other types of stocks and can be more volatile than other types of stocks. |
| • | “Value” Investing. “Value” stocks can perform differently from the market as a whole and other types of stocks and can continue to be undervalued by the market for long periods of time. |
| • | Quantitative Investing. Securities selected using quantitative analysis can perform differently from the market as a whole as a result of the factors used in the analysis, the weight placed on each factor, and changes in the factors’ historical trends. |
An investment in the fund is not a deposit of a bank and is not insured or guaranteed by the Federal Deposit Insurance Corporation or any other government agency. You could lose money by investing in the fund.
Performance
Performance history will be available for the fund after the fund has been in operation for one calendar year.
Investment Adviser
Strategic Advisers (the Adviser) is the fund’s manager. AllianceBernstein L.P. (AllianceBernstein), Aristotle Capital Management, LLC (Aristotle Capital), Brandywine Global Investment Management, LLC (Brandywine Global), ClariVest Asset Management LLC (ClariVest), ClearBridge Investments, LLC (ClearBridge), FIAM LLC (FIAM), Geode Capital Management, LLC (Geode), Invesco Advisers, Inc. (Invesco), J.P. Morgan Investment Management Inc. (JPMorgan), Loomis, Sayles & Company, L.P. (Loomis Sayles), LSV Asset Management (LSV), PineBridge Investments LLC (PineBridge), Principal Global Investors, LLC (Principal), and T. Rowe Price Associates, Inc. (T. Rowe Price) have been retained to serve as sub-advisers for the fund. FMR Investment Management (UK) Limited (FMR UK), Fidelity Management & Research (Hong Kong) Limited (FMR H.K.), and Fidelity Management & Research (Japan) Limited (FMR Japan) have been retained to serve as sub-subadvisers for the fund. The Adviser may change a sub-adviser’s asset allocation at any time, including allocating no assets to, or terminating the sub-advisory contract with, a sub-adviser.
Portfolio Manager(s)
John A. Stone (lead portfolio manager) has managed the fund since 2020.
Gopalakrishnan Anantanatarajan (co-manager) has managed the fund since 2020.
Niall Devitt (co-manager) has managed the fund since 2020.
Purchase and Sale of Shares
The fund is not available for sale to the general public.
The price to buy one share is its net asset value per share (NAV). Shares will be bought at the NAV next calculated after an order is received in proper form.
The price to sell one share is its NAV. Shares will be sold at the NAV next calculated after an order is received in proper form.
5
Table of Contents
The fund is open for business each day the New York Stock Exchange (NYSE) is open.
There is no purchase minimum for fund shares.
Tax Information
Distributions you receive from the fund are subject to federal income tax and generally will be taxed as ordinary income or capital gains, and may also be subject to state or local taxes, unless you are investing through a tax-advantaged retirement account (in which case you may be taxed later, upon withdrawal of your investment from such account).
Payments to Broker-Dealers and Other Financial Intermediaries
The fund, the Adviser, Fidelity Distributors Company LLC (FDC), and/or their affiliates may pay intermediaries, which may include banks, broker-dealers, retirement plan sponsors, administrators, or service-providers (who may be affiliated with the Adviser or FDC), for the sale of fund shares and related services. These payments may create a conflict of interest by influencing your intermediary and your investment professional to recommend the fund over another investment. Ask your investment professional or visit your intermediary’s web site for more information.
Fund Basics
Investment Objective
Strategic Advisers® Large Cap Fund seeks capital appreciation.
Principal Investment Strategies
The fund normally invests at least 80% of its assets in securities and shares of funds with large market capitalizations. Although a universal definition of large market capitalization companies does not exist, for purposes of this fund, large market capitalization companies are generally defined as those whose market capitalization is similar to the market capitalization of companies in the Russell 1000® Index or the S&P 500® Index. A company’s market capitalization is based on its current market capitalization or its market capitalization at the time of the fund’s investment. The size of the companies in each index changes with market conditions and the composition of the index.
The fund may invest in securities of foreign issuers in addition to securities of domestic issuers.
The fund is not constrained by any particular investment style. The fund will normally invest in a combination of “growth” and “value” stocks.
The fund implements its investment strategies by investing directly in securities through one or more sub-advisers or indirectly in securities through one or more underlying funds, which in turn invest directly in securities.
The Adviser may allocate the fund’s assets among any number of underlying funds or sub-advisers at any time. The Adviser may adjust allocations among underlying funds or sub-advisers from time to time, including making no allocation at all to one or more sub-advisers.
6
Table of Contents
The Adviser pursues a disciplined, benchmark-driven approach to portfolio construction, and monitors and adjusts allocations to underlying funds and sub-advisers as necessary to favor those underlying funds and sub-advisers that the Adviser believes will provide the most favorable outlook for achieving the fund’s investment objective.
When determining how to allocate the fund’s assets among sub-advisers and underlying funds, the Adviser uses proprietary fundamental and quantitative research, considering factors including, but not limited to, performance in different market environments, manager experience and investment style, management company infrastructure, costs, asset size, and portfolio turnover.
The fund may invest in affiliated equity funds (i.e., Fidelity® funds, including mutual funds and ETFs), non-affiliated equity funds that participate in Fidelity’s FundsNetwork® and in non-affiliated ETFs. Underlying funds include both funds managed by Fidelity Management & Research Company LLC (FMR) (an affiliated company that, together with the Adviser, is part of Fidelity Investments) or an affiliate and funds managed by investment advisers other than Fidelity. Fidelity may receive service fees that typically are at an annual rate of up to 0.40% of a non-affiliated underlying fund’s average daily net assets attributable to purchases through Fidelity’s FundsNetwork®, though such fees may be higher or lower, or may be charged as transaction and/or account fees. In addition, the fund may invest in ETFs in transactions not occurring through Fidelity’s FundsNetwork®.
The Adviser generally classifies funds by reference to a fund’s name, policies, or classification by a third-party ranking or ratings organization at the time of investment. Investments in funds whose names, policies or classifications change after purchase continue to be considered subject to the classification at time of investment for purposes of the 80% policy.
The Adviser may actively adjust the allocation of the fund’s assets at any time. For current information on fund holdings, please call 1-800-544-3455 or visit Fidelity’s web site at www.fidelity.com. For information on the underlying funds, see the underlying funds’ prospectuses. A copy of any underlying Fidelity® fund’s prospectus is available at www.fidelity.com or institutional.fidelity.com. For a copy of any other underlying fund’s prospectus, visit the web site of the company that manages or sponsors that underlying fund.
Common types of investment approaches that a sub-adviser may use in selecting investments for a fund include, but are not limited to, quantitative analysis, fundamental analysis, or a combination of both approaches. Quantitative analysis refers to programmatic models that analyze such factors as growth potential, valuation, liquidity, and investment risk based on data inputs. Fundamental analysis involves a bottom-up assessment of a company’s potential for success in light of factors including its financial condition, earnings outlook, strategy, management, industry position, and economic and market conditions.
It is not possible to predict the extent to which the fund’s assets will be invested by a particular sub-adviser at any given time and one or more sub-advisers may not be managing any assets for the fund at any given time.
The fund’s initial shareholder approved a proposal permitting the Adviser to enter into new or amended sub-advisory agreements with one or more unaffiliated sub-advisers without obtaining shareholder approval of such agreements, subject to conditions of an exemptive order that has been granted by the SEC (Exemptive Order). One of the conditions of the Exemptive Order requires the Board of Trustees to approve any such agreement. Subject to oversight by the Board of Trustees, the Adviser has the ultimate responsibility to oversee the fund’s sub-advisers and recommend their hiring, termination, and replacement. In the event the Board of Trustees approves a sub-advisory agreement with a new unaffiliated sub-adviser, shareholders will be provided with information about the new sub-adviser and sub-advisory agreement within ninety days of appointment.
7
Table of Contents
Description of Principal Security Types
In addition to investing in underlying funds, the fund may invest directly in the following principal security types:
Equity securities represent an ownership interest, or the right to acquire an ownership interest, in an issuer. Different types of equity securities provide different voting and dividend rights and priority in the event of the bankruptcy of the issuer. Equity securities include common stocks, preferred stocks, convertible securities, and warrants.
Principal Investment Risks
Many factors affect the fund’s performance. Developments that disrupt global economies and financial markets, such as pandemics and epidemics, may magnify factors that affect a fund’s performance. The fund’s share price changes daily based on the performance of the underlying funds and securities in which it invests and on changes in market conditions and interest rates and in response to other economic, political, or financial developments. The fund’s reaction to these developments will be affected by the types of underlying funds and securities in which the fund invests, the financial condition, industry and economic sector, and geographic location of an issuer, and the fund’s level of investment in the securities of that underlying fund or issuer.
If the Adviser’s or a sub-adviser’s allocation strategies do not work as intended, the fund may not achieve its objective. A portfolio manager’s evaluations and assumptions in selecting underlying funds or individual securities may be incorrect in view of actual market conditions.
When your shares are sold they may be worth more or less than what you paid for them, which means that you could lose money by investing in the fund.
The following factors can significantly affect the fund’s performance:
Multiple Sub-Adviser Risk. Because each sub-adviser manages its allocated portion, if any, independently from another sub-adviser, it is possible that the sub-advisers’ security selection processes may not complement one another. As a result, the fund’s aggregate exposure to a particular industry or group of industries, or to a single issuer, could unintentionally be larger or smaller than intended. Because each sub-adviser directs the trading for its own portion, if any, of the fund, and does not aggregate its transactions with those of the other sub-advisers, the fund may incur higher brokerage costs than would be the case if a single sub-adviser were managing the entire fund.
Investing in Other Funds. Regulatory restrictions may limit the amount that one fund can invest in another, and in certain cases further limit investments to the extent a fund’s shares are already held by the Adviser or its affiliates. The fund bears all risks of investment strategies employed by the underlying funds. The fund does not control the investments of the underlying funds, which may have different investment objectives and may engage in investment strategies that the fund would not engage in directly. Aggregation of underlying fund holdings may result in indirect concentration of assets in a particular industry or group of industries, or in a single issuer, which may increase volatility.
Stock Market Volatility. The value of equity securities fluctuates in response to issuer, political, market, and economic developments. Fluctuations, especially in foreign markets, can be dramatic over the short as well as long term, and different parts of the market, including different market sectors, and different types of equity securities can react differently to these developments. For example, stocks of companies in one sector can react differently from those in another, large cap stocks can react differently from small cap stocks, “growth” stocks can react differently from “value” stocks, and stocks selected using quantitative or technical analysis can react differently than stocks selected using fundamental analysis. Issuer, political, or economic developments can affect a single issuer, issuers within an industry or economic sector or geographic region, or the market as a whole. Changes in the financial condition of a single issuer can impact the market as a whole. Terrorism and related geo-political risks have led, and may in the future lead, to increased short-term market volatility and may have adverse long-term effects on world economies and markets generally.
Foreign Exposure. Foreign securities, foreign currencies, and securities issued by U.S. entities with substantial foreign operations can involve additional risks relating to political, economic, or regulatory conditions in foreign countries. These risks include fluctuations in foreign exchange rates; withholding or other taxes; trading, settlement, custodial, and other operational risks; and
8
Table of Contents
the less stringent investor protection and disclosure standards of some foreign markets. All of these factors can make foreign investments, especially those in emerging markets, more volatile and potentially less liquid than U.S. investments. In addition, foreign markets can perform differently from the U.S. market.
Global economies and financial markets are becoming increasingly interconnected, which increases the possibilities that conditions in one country or region might adversely impact issuers or providers in, or foreign exchange rates with, a different country or region.
Industry Exposure. Market conditions, interest rates, and economic, regulatory, or financial developments could significantly affect a single industry or a group of related industries, and the securities of companies in that industry or group of industries could react similarly to these or other developments. In addition, from time to time, a small number of companies may represent a large portion of a single industry or a group of related industries as a whole, and these companies can be sensitive to adverse economic, regulatory, or financial developments.
Issuer-Specific Changes. Changes in the financial condition of an issuer or counterparty, changes in specific economic or political conditions that affect a particular type of security or issuer, and changes in general economic or political conditions can increase the risk of default by an issuer or counterparty, which can affect a security’s or instrument’s value. The value of securities of smaller, less well-known issuers can be more volatile than that of larger issuers.
Investing in ETFs. ETFs may trade in the secondary market (e.g., on a stock exchange) at prices below the value of their underlying portfolios and may not be liquid. An ETF that is not actively managed cannot sell poorly performing stocks or other assets as long as they are represented in its index or other benchmark. ETFs that track an index are subject to tracking error risk (the risk of errors in matching the ETF’s underlying assets to its index or other benchmark).
“Growth” Investing. “Growth” stocks can react differently to issuer, political, market, and economic developments than the market as a whole and other types of stocks. “Growth” stocks tend to be more expensive relative to their earnings or assets compared to other types of stocks. As a result, “growth” stocks tend to be sensitive to changes in their earnings and more volatile than other types of stocks.
“Value” Investing. “Value” stocks can react differently to issuer, political, market, and economic developments than the market as a whole and other types of stocks. “Value” stocks tend to be inexpensive relative to their earnings or assets compared to other types of stocks. However, “value” stocks can continue to be inexpensive for long periods of time and may not ever realize their full value.
Quantitative Investing. The value of securities selected using quantitative analysis can react differently to issuer, political, market, and economic developments than the market as a whole or securities selected using only fundamental analysis. The factors used in quantitative analysis and the weight placed on those factors may not be predictive of a security’s value. In addition, factors that affect a security’s value can change over time and these changes may not be reflected in the quantitative model.
In response to market, economic, political, or other conditions, a fund may temporarily use a different investment strategy for defensive purposes. If the fund does so, different factors could affect its performance and the fund may not achieve its investment objective.
Other Investment Strategies
In addition to the principal investment strategies discussed above, the Adviser may lend the fund’s securities to broker-dealers or other institutions to earn income for the fund.
9
Table of Contents
The fund may also use various techniques, such as buying and selling futures contracts, to increase or decrease its exposure to changing security prices or other factors that affect security values. In addition, the fund may have indirect exposure to derivatives through its investments in underlying funds.
Shareholder Notice
The following is subject to change only upon 60 days’ prior notice to shareholders:
Strategic Advisers® Large Cap Fund normally invests at least 80% of its assets in securities and shares of funds with large market capitalizations.
The fund is open for business each day the NYSE is open.
The NAV is the value of a single share. Fidelity normally calculates NAV as of the close of business of the NYSE, normally 4:00 p.m. Eastern time. The fund’s assets normally are valued as of this time for the purpose of computing NAV.
NAV is not calculated and the fund will not process purchase and redemption requests submitted on days when the fund is not open for business. The time at which shares are priced and until which purchase and redemption orders are accepted may be changed as permitted by the SEC.
To the extent that the fund’s assets are traded in other markets on days when the fund is not open for business, the value of the fund’s assets may be affected on those days. In addition, trading in some of the fund’s assets may not occur on days when the fund is open for business.
Shares of underlying funds (other than ETFs) are valued at their respective NAVs. NAV is calculated using the values of the underlying funds in which the fund invests. For an explanation of the circumstances under which the underlying funds will use fair value pricing and the effects of using fair value pricing, see the underlying funds’ prospectuses and statements of additional information (SAIs). Other assets (including securities issued by ETFs) are valued primarily on the basis of market quotations, official closing prices, or information furnished by a pricing service. Certain short-term securities are valued on the basis of amortized cost. If market quotations or official closing prices are not readily available or, in the Adviser’s opinion, are deemed unreliable for a security, then that security will be fair valued in good faith by the Adviser in accordance with applicable fair value pricing policies. For example, if, in the Adviser’s opinion, a security’s value has been materially affected by events occurring before a fund’s pricing time but after the close of the exchange or market on which the security is principally traded, then that security will be fair valued in good faith by the Adviser in accordance with applicable fair value pricing policies.
Arbitrage opportunities may exist when trading in a portfolio security or securities is halted and does not resume before a fund calculates its NAV. These arbitrage opportunities may enable short-term traders to dilute the NAV of long-term investors. Securities trading in overseas markets present time zone arbitrage opportunities when events affecting portfolio security values occur after the close of the overseas markets but prior to the close of the U.S. market. Fair valuation of a fund’s portfolio securities can serve to reduce arbitrage opportunities available to short-term traders, but there is no assurance that fair value pricing policies will prevent dilution of NAV by short-term traders.
Fair value pricing is based on subjective judgments and it is possible that the fair value of a security may differ materially from the value that would be realized if the security were sold.
10
Table of Contents
Shareholder Information
Additional Information about the Purchase and Sale of Shares
NOT AVAILABLE FOR SALE TO THE GENERAL PUBLIC.
As used in this prospectus, the term “shares” generally refers to the shares offered through this prospectus.
Shares can be purchased only through certain discretionary investment programs offered by the Adviser or its affiliates. If you are not currently a client of the Adviser or its affiliates, please call 1-800-544-3455 (9:00 a.m. - 6:00 p.m., Monday through Friday) for more information. Additional fees apply for discretionary investment programs. For more information on these fees, please refer to the “Buying and Selling Information” section of the SAI.
The fund may reject for any reason, or cancel as permitted or required by law, any purchase orders.
Excessive trading of fund shares can harm shareholders in various ways, including reducing the returns to long-term shareholders by increasing costs to the fund (such as brokerage commissions or spreads paid to dealers who sell money market instruments), disrupting portfolio management strategies, and diluting the value of the shares in cases in which fluctuations in markets are not fully priced into the fund’s NAV.
Because investments in the fund can be made only by the Adviser or an affiliate on behalf of its clients, the potential for excessive or short-term disruptive purchases and sales is reduced. Accordingly, the Board of Trustees has not adopted policies and procedures designed to discourage excessive trading of fund shares and the fund accommodates frequent trading.
The fund does not place a limit on purchases or sales of fund shares by the Adviser or its affiliates. The fund reserves the right, but does not have the obligation, to reject any purchase transaction at any time. In addition, the fund reserves the right to impose restrictions on disruptive, excessive, or short-term trading.
There is no minimum balance or purchase minimum for fund shares.
The price to buy one share is its NAV. Shares are sold without a sales charge.
Shares will be bought at the NAV next calculated after an order is received in proper form.
Provided the fund receives an order to buy shares in proper form before the close of business, the fund may place an order to buy shares of an underlying Fidelity® fund after the close of business, pursuant to a pre-determined allocation, and receive that day’s NAV.
Shares are generally available only to investors residing in the United States.
The fund may stop offering shares completely or may offer shares only on a limited basis, for a period of time or permanently.
Under applicable anti-money laundering rules and other regulations, purchase orders may be suspended, restricted, or canceled and the monies may be withheld.
The price to sell one share is its NAV.
Shares will be sold at the NAV next calculated after an order is received in proper form. Normally, redemptions will be processed by the next business day, but it may take up to seven days to pay the redemption proceeds if making immediate payment would adversely affect the fund.
11
Table of Contents
Provided the fund receives an order to sell shares in proper form before the close of business, the fund may place an order to sell shares of an underlying Fidelity® fund after the close of business, pursuant to a pre-determined allocation, and receive that day’s NAV.
See “Policies Concerning the Redemption of Fund Shares” below for additional redemption information.
Redemptions may be suspended or payment dates postponed when the NYSE is closed (other than weekends or holidays), when trading on the NYSE is restricted, or as permitted by the SEC.
Redemption proceeds may be paid in underlying fund shares, securities, or other property rather than in cash if the Adviser determines it is in the best interests of the fund.
When your relationship with the Adviser or one of its affiliates is terminated, your shares may be sold at the NAV next calculated, in which case the redemption proceeds will remain in your account pending your instruction.
Under applicable anti-money laundering rules and other regulations, redemption requests may be suspended, restricted, canceled, or processed and the proceeds may be withheld.
Policies Concerning the Redemption of Fund Shares
If your account is held directly with a fund, the length of time that a fund typically expects to pay redemption proceeds depends on the method you have elected to receive such proceeds. A fund typically expects to make payment of redemption proceeds by wire, automated clearing house (ACH) or by issuing a check by the next business day following receipt of a redemption order in proper form. Proceeds from the periodic and automatic sale of shares of a Fidelity® money market fund that are used to buy shares of another Fidelity® fund are settled simultaneously.
If your account is held through an intermediary, the length of time that a fund typically expects to pay redemption proceeds depends, in part, on the terms of the agreement in place between the intermediary and a fund. For redemption proceeds that are paid either directly to you from a fund or to your intermediary for transmittal to you, a fund typically expects to make payments by wire, by ACH or by issuing a check on the next business day following receipt of a redemption order in proper form from the intermediary by a fund. Redemption orders that are processed through investment professionals that utilize the National Securities Clearing Corporation will generally settle one to three business days following receipt of a redemption order in proper form.
As noted elsewhere, payment of redemption proceeds may take longer than the time a fund typically expects and may take up to seven days from the date of receipt of the redemption order as permitted by applicable law.
Redemption Methods Available. Generally a fund expects to pay redemption proceeds in cash. To do so, a fund typically expects to satisfy redemption requests either by using available cash (or cash equivalents) or by selling portfolio securities. On a less regular basis, a fund may also satisfy redemption requests by utilizing one or more of the following sources, if permitted: borrowing from another Fidelity® fund; drawing on an available line or lines of credit from a bank or banks; or using reverse repurchase agreements. These methods may be used during both normal and stressed market conditions.
In addition to paying redemption proceeds in cash, a fund reserves the right to pay part or all of your redemption proceeds in readily marketable securities instead of cash (redemption in-kind). Redemption in-kind proceeds will typically be made by delivering the selected securities to the redeeming shareholder within seven days after the receipt of the redemption order in proper form by a fund.
12
Table of Contents
Dividends and Capital Gain Distributions
The fund earns dividends, interest, and other income from its investments, and distributes this income (less expenses) to shareholders as dividends. The fund also realizes capital gains from its investments, and distributes these gains (less any losses) to shareholders as capital gain distributions.
The fund normally pays dividends and capital gain distributions in July and December.
Distribution Options
Any dividends and capital gain distributions may be reinvested in additional shares or paid in cash.
As with any investment, your investment in the fund could have tax consequences for you. If you are not investing through a tax-advantaged retirement account, you should consider these tax consequences.
Taxes on Distributions
Distributions you receive from the fund are subject to federal income tax, and may also be subject to state or local taxes.
For federal tax purposes, certain of the fund’s distributions, including dividends and distributions of short-term capital gains, are taxable to you as ordinary income, while certain of the fund’s distributions, including distributions of long-term capital gains, are taxable to you generally as capital gains. A percentage of certain distributions of dividends may qualify for taxation at long-term capital gains rates (provided certain holding period requirements are met).
If the Adviser buys shares on your behalf when a fund has realized but not yet distributed income or capital gains, you will be “buying a dividend” by paying the full price for the shares and then receiving a portion of the price back in the form of a taxable distribution.
Any taxable distributions you receive from the fund will normally be taxable to you when you receive them, regardless of your distribution option.
Taxes on Transactions
Your redemptions may result in a capital gain or loss for federal tax purposes. A capital gain or loss on your investment in the fund generally is the difference between the cost of your shares and the price you receive when you sell them.
Fund Services
The fund is a mutual fund, an investment that pools shareholders’ money and invests it toward a specified goal.
The fund employs a multi-manager and a fund of funds investment structure. The Adviser may allocate the fund’s assets among any number of sub-advisers or underlying funds. The Adviser may adjust allocations among underlying funds or sub-advisers from time to time, including making no allocation to, or terminating the sub-advisory contract with, a sub-adviser.
13
Table of Contents
Adviser
Strategic Advisers LLC. The Adviser is the fund’s manager. The address of the Adviser is 245 Summer Street, Boston, Massachusetts 02210.
As of December 31, 2019, the Adviser had approximately $436.6 billion in discretionary assets under management, and approximately $3.2 trillion when combined with all of its affiliates’ assets under management.
As the manager, the Adviser has overall responsibility for directing the fund’s investments and handling its business affairs.
Sub-Adviser(s)
AllianceBernstein, at 1345 Avenue of the Americas, New York, New York 10105, has been retained to serve as a sub-adviser for the fund. As of May 31, 2020, AllianceBernstein had approximately $596 billion in discretionary assets under management.
Aristotle Capital, at 11100 Santa Monica Boulevard, Suite 1700, Los Angeles, California 90025, has been retained to serve as a sub-adviser for the fund. As of May 31, 2020, Aristotle Capital had approximately $30.0 billion in discretionary assets under management.
Brandywine Global, at 1735 Market Street, Philadelphia, Pennsylvania 19103, has been retained to serve as a sub-adviser for the fund. As of May 31, 2020, Brandywine Global had approximately $65.0 billion in discretionary assets under management.
ClariVest, at 3611 Valley Centre Drive, Suite 100, San Diego, California 92130, has been retained to serve as a sub-adviser for the fund. As of May 31, 2020, ClariVest had approximately $5.1 billion in discretionary assets under management.
ClearBridge, at 620 Eighth Avenue, New York, New York 10018, has been retained to serve as a sub-adviser for the fund. As of March 31, 2020, ClearBridge had approximately $120.5 billion in assets under management.
FIAM, at 900 Salem Street, Smithfield, Rhode Island 02917, has been retained to serve as a sub-adviser for the fund. FIAM is an affiliate of Strategic Advisers. As of December 31, 2019, FIAM had approximately $102.9 billion in discretionary assets under management.
Other investment advisers have been retained to assist FIAM with foreign investments:
•FMR UK, at 1 St. Martin’s Le Grand, London, EC1A 4AS, United Kingdom, has been retained to serve as a sub-subadviser for the fund. As of December 31, 2019, FMR UK had approximately $23.9 billion in discretionary assets under management. FMR UK may provide investment research and advice on issuers based outside the United States and may also provide investment advisory services for the fund. FMR UK is an affiliate of both FIAM and the Adviser.
•FMR H.K., at Floor 19, 41 Connaught Road Central, Hong Kong, has been retained to serve as a sub-subadviser for the fund. As of December 31, 2019, FMR H.K. had approximately $16.5 billion in discretionary assets under management. FMR H.K. may provide investment research and advice on issuers based outside the United States and may also provide investment advisory services for the fund. FMR H.K. is an affiliate of both FIAM and the Adviser.
•FMR Japan, at Kamiyacho Prime Place, 1-17, Toranomon-4-Chome, Minato-ku, Tokyo, Japan, has been retained to serve as a sub-subadviser for the fund. FMR Japan was organized in 2008 to provide investment research and advice on issuers based outside the United States. FMR Japan may provide investment research and advice on issuers based outside the United States and may also provide investment advisory services for the fund. FMR Japan is an affiliate of both FIAM and the Adviser.
14
Table of Contents
Geode, at 100 Summer Street, 12th Floor, Boston, Massachusetts 02110, has been retained to serve as a sub-adviser for the fund. As of December 31, 2019, Geode had approximately $554 billion in discretionary assets under management.
Invesco, at 1555 Peachtree Street, N.E., Atlanta, Georgia 30309, has been retained to serve as a sub-adviser for the fund. As of March 31, 2020, Invesco had approximately $1,053.4 billion in discretionary assets under management.
JPMorgan, at 383 Madison Avenue, New York, New York 10179, has been retained to serve as a sub-adviser for the fund. As of March 31, 2020, JPMorgan had approximately $1.89 trillion in assets under management.
Loomis Sayles, at One Financial Center, Boston, Massachusetts 02111, has been retained to serve as a sub-adviser for the fund. As of May 31, 2020, Loomis Sayles had approximately $301 billion in assets under management.
LSV, at 155 North Wacker Drive, Suite 4600, Chicago, Illinois 60606, has been retained to serve as a sub-adviser for the fund. As of May 31, 2020, LSV had approximately $90 billion in discretionary assets under management.
PineBridge, at Park Avenue Tower, 65 E 55th St, 6th Floor, New York, New York 10022, has been retained to serve as a sub-adviser for the fund. As of May 31, 2020, PineBridge had approximately $103.37 billion in assets under management.
Principal, at 801 Grand Avenue, Des Moines, Iowa 50392, has been retained to serve as a sub-adviser for the fund. As of March 31, 2020, Principal had approximately $437.08 billion in assets under management.
T. Rowe Price, at 100 East Pratt Street, Baltimore, Maryland 21202, has been retained to serve as a sub-adviser for the fund. As of March 31, 2020, T. Rowe Price had approximately $1.01 trillion in assets under management.
Portfolio Manager(s)
John A. Stone is lead portfolio manager of the fund, which he has managed since 2020. He also manages other funds. Mr. Stone joined Fidelity Investments in 1993 as a customer service team leader and also worked as a financial analyst and investment strategist. In 2006, Mr. Stone left Fidelity Investments and joined Mercer Global Investments as a portfolio manager and Principal. Since returning to Fidelity Investments in 2008, Mr. Stone has worked as a portfolio manager.
Gopalakrishnan Anantanatarajan is co-manager of the fund, which he has managed since 2020. He also manages other funds. Since joining Fidelity Investments in 2006, Mr. Anantanatarajan has worked as a senior research analyst, research analyst, research associate, a senior research associate, and portfolio manager.
Niall Devitt is co-manager of the fund, which he has managed since 2020. He also manages other funds. Mr. Devitt joined Fidelity Investments in 2001 and has been a part of Strategic Advisers since 2006 where he has worked as a research associate, analyst, and portfolio manager.
The SAI provides additional information about the compensation of, any other accounts managed by, and any fund shares held by the portfolio manager(s).
From time to time a manager, analyst, or other Fidelity employee may express views regarding a particular company, security, industry, or market sector. The views expressed by any such person are the views of only that individual as of the time expressed and do not necessarily represent the views of Fidelity or any other person in the Fidelity organization. Any such views are subject to change at any time based upon market or other conditions and Fidelity disclaims any responsibility to update such views. These views may not be relied on as investment advice and, because investment decisions for a Fidelity® fund are based on numerous factors, may not be relied on as an indication of trading intent on behalf of any Fidelity® fund.
15
Table of Contents
Advisory Fee(s)
The fund pays a management fee to the Adviser. The management fee is calculated and paid to the Adviser every month.
The fund’s management fee is calculated by adding the annual rate of 0.25% of the fund’s average daily net assets throughout the month plus the total fees payable monthly to the fund’s sub-advisers, if any, based upon each sub-adviser’s respective allocated portion of the fund’s assets. Because the fund’s management fee rate may fluctuate, the fund’s management fee may be higher or lower in the future. The fund’s maximum aggregate annual management fee will not exceed 0.65% of the fund’s average daily net assets.
The Adviser has contractually agreed to waive a portion of the fund’s management fee in an amount equal to 0.25% of the fund’s average daily net assets through September 30, 2023.
In return for the services of the fund’s sub-advisers, the Adviser will pay AllianceBernstein, Aristotle Capital, Brandywine Global, ClariVest, ClearBridge, FIAM, Geode, Invesco, JPMorgan, Loomis Sayles, LSV, PineBridge, Principal, and T. Rowe Price the fee (as described above) payable to that sub-adviser. FIAM, in turn, will pay FMR UK, FMR H.K., and FMR Japan for providing sub-advisory services.
The basis for the Board of Trustees approving the management contract, sub-advisory agreements, and sub-subadvisory agreements for the fund will be included in the fund’s semi-annual report for the fiscal period ending November 30, 2020, when available.
FDC distributes the fund’s shares.
Distribution and Service Plan(s)
The fund has adopted a Distribution and Service Plan pursuant to Rule 12b-1 under the Investment Company Act of 1940 (1940 Act) with respect to its shares that recognizes that the Adviser may use its management fee revenues, as well as its past profits or its resources from any other source, to pay FDC for expenses incurred in connection with providing services intended to result in the sale of shares of the fund and/or shareholder support services. The Adviser, directly or through FDC, may pay significant amounts to intermediaries that provide those services. Currently, the Board of Trustees of the fund has authorized such payments for shares of the fund.
Affiliates of the Adviser may receive service fees or distribution fees or both with respect to underlying funds that participate in Fidelity’s FundsNetwork®.
If payments made by the Adviser to FDC or to intermediaries under the Distribution and Service Plan were considered to be paid out of the fund’s assets on an ongoing basis, they might increase the cost of your investment and might cost you more than paying other types of sales charges.
No dealer, sales representative, or any other person has been authorized to give any information or to make any representations, other than those contained in this prospectus and in the related SAI, in connection with the offer contained in this prospectus. If given or made, such other information or representations must not be relied upon as having been authorized by the fund or FDC. This prospectus and the related SAI do not constitute an offer by the fund or by FDC to sell shares of the fund to or to buy shares of the fund from any person to whom it is unlawful to make such offer.
16
Table of Contents
Appendix
S&P 500® Index is a market capitalization-weighted index of 500 common stocks chosen for market size, liquidity, and industry group representation to represent U.S. equity performance.
Russell 1000® Index is a market capitalization-weighted index designed to measure the performance of the large-cap segment of the U.S. equity market.
IMPORTANT INFORMATION ABOUT OPENING A NEW ACCOUNT
To help the government fight the funding of terrorism and money laundering activities, the Uniting and Strengthening America by Providing Appropriate Tools Required to Intercept and Obstruct Terrorism Act of 2001 (USA PATRIOT ACT), requires all financial institutions to obtain, verify, and record information that identifies each person or entity that opens an account.
For individual investors opening an account: When you open an account, you will be asked for your name, address, date of birth, and other information that will allow Fidelity to identify you. You may also be asked to provide documents that may help to establish your identity, such as your driver’s license.
For investors other than individuals: When you open an account, you will be asked for the name of the entity, its principal place of business and taxpayer identification number (TIN). You will be asked to provide information about the entity’s control person and beneficial owners, and person(s) with authority over the account, including name, address, date of birth and social security number. You may also be asked to provide documents, such as drivers’ licenses, articles of incorporation, trust instruments or partnership agreements and other information that will help Fidelity identify the entity.
You can obtain additional information about the fund. A description of the fund’s policies and procedures for disclosing its holdings is available in its SAI and on Fidelity’s web sites. The SAI also includes more detailed information about the fund and its investments. The SAI is incorporated herein by reference (legally forms a part of the prospectus). A financial report will be available once the fund has completed its first annual or semi-annual period. The fund’s annual and semi-annual reports also include additional information. The fund’s annual report includes a discussion of the fund’s holdings and recent market conditions and the fund’s investment strategies that affected performance.
For a free copy of any of these documents or to request other information or ask questions about the fund, call Fidelity at 1-800-544-3455. In addition, you may visit Fidelity’s web site at www.fidelity.com for a free copy of a prospectus, SAI, or annual or semi-annual report or to request other information.
The SAI, the fund’s annual and semi-annual reports and other related materials are available from the Electronic Data Gathering, Analysis, and Retrieval (EDGAR) Database on the SEC’s web site (http://www.sec.gov). You can obtain copies of this information, after paying a duplicating fee, by sending a request by e-mail to publicinfo@sec.gov or by writing the Public Reference Section of the SEC, Washington, D.C. 20549-1520. You can also review and copy information about the fund, including the fund’s SAI, at the SEC’s Public Reference Room in Washington, D.C. Call 1-202-551-8090 for information on the operation of the SEC’s Public Reference Room.
17
Table of Contents
Investment Company Act of 1940, File Number, 811-21991
FDC is a member of the Securities Investor Protection Corporation (SIPC). You may obtain information about SIPC, including the SIPC brochure, by visiting www.sipc.org or calling SIPC at 202-371-8300.
Strategic Advisers, Fidelity Investments & Pyramid Design, Fidelity, and FundsNetwork are registered service marks of FMR LLC.© 2020 FMR LLC. All rights reserved.
Any third-party marks that may appear above are the marks of their respective owners.
| 1.9899743.100 | LGC-PRO-0720 |
18
Table of Contents
Strategic Advisers Core Fund
Strategic Advisers Growth Fund
Strategic Advisers Value Fund
Strategic Advisers Large Cap Fund
(Series of Fidelity Rutland Square Trust II )
FORM N-14
STATEMENT OF ADDITIONAL INFORMATION
September 8, 2020
This Statement of Additional Information (SAI) relates to the proposed acquisition of Strategic Advisers Core Fund (Core Fund), Strategic Advisers Growth Fund (Growth Fund), and Strategic Advisers Value Fund (Value Fund), series of Fidelity Rutland Square Trust II, by Strategic Advisers Large Cap Fund (Large Cap Fund), a series of Fidelity Rutland Square Trust II. This SAI contains information that may be of interest to shareholders, but which is not included in the Proxy Statement which relates to the Reorganization. As described in the Proxy Statement, Large Cap Fund will acquire all of the assets of Core Fund, Growth Fund, and Value Fund and assume all of Core Fund’s, Growth Fund’s, and Value Fund’s liabilities, in exchange solely for shares of beneficial interest in Large Cap Fund.
This SAI is not a prospectus and should be read in conjunction with the Proxy Statement. The Proxy Statement has been filed with the Securities and Exchange Commission and may be obtained, without charge, from Fidelity Distributors Company LLC, 900 Salem Street, Smithfield, RI 02917.
This SAI consists of this cover page and the following described documents, each of which is incorporated herein by reference:
| 1. | The Prospectus of Large Cap Fund dated July 29, 2020, which was previously filed via EDGAR (Accession No. 0001379491-20-003375). |
| 2. | The Statement of Additional Information of Large Cap Fund dated July 29, 2020, which was previously filed via EDGAR (Accession No. 0001379491-20-003375). |
| 3. | The Prospectus of Core Fund dated July 30, 2020, which was previously filed via EDGAR (Accession No. 0001379491-20-003302). |
| 4. | The Statement of Additional Information of Core Fund dated July 30, 2020, which was previously filed via EDGAR (Accession No. 0001379491-20-003302). |
| 5. | The Prospectus of Growth Fund dated July 30, 2020, which was previously filed via EDGAR (Accession No. 0001379491-20-003302). |
| 6. | The Statement of Additional Information of Growth Fund dated July 30, 2020, which was previously filed via EDGAR (Accession No. 0001379491-20-003302). |
| 7. | The Prospectus of Value Fund dated July 30, 2020, which was previously filed via EDGAR (Accession No. 0001379491-20-003302). |
Table of Contents
| 8. | The Statement of Additional Information of Value Fund dated July 30, 2020, which was previously filed via EDGAR (Accession No. 0001379491-20-003302). |
| 9. | The Financial Statements included in the Annual Report of Core Fund for the fiscal year ended May 31, 2020, which was previously filed via EDGAR (Accession No. 0001379491-20-003224). |
| 10. | The Financial Statements included in the Annual Report of Growth Fund for the fiscal year ended May 31, 2020, which was previously filed via EDGAR (Accession No. 0001379491-20-003224). |
| 11. | The Financial Statements included in the Annual Report of Value Fund for the fiscal year ended May 31, 2020, which was previously filed via EDGAR (Accession No. 0001379491-20-003224). |
PRO FORMA FINANCIAL STATEMENTS
The Pro Forma Financial Statements for the Reorganization are provided on the following pages.
Table of Contents
Fidelity Rutland Square Trust II: Strategic Advisers Large Cap Fund
Fidelity Rutland Square Trust II: Strategic Advisers Core Fund
Fidelity Rutland Square Trust II: Strategic Advisers Growth Fund
Fidelity Rutland Square Trust II: Strategic Advisers Value Fund
Notes to Pro Forma Combined Financial Statements
(Unaudited)
1. Basis of Presentation:
The accompanying unaudited Pro Forma Combined Schedule of Investments and Statement of Assets and Liabilities reflect balances as of May 31, 2020 and the unaudited Pro Forma Combined Statement of Operations reflect results for the twelve months ended May 31, 2020, as if the merger had occurred on the first day of the year presented (June 1, 2019). The unaudited pro forma financial statements are presented to show the effect of the proposed merger of Strategic Advisers Core Fund, Strategic Advisers Growth Fund and Strategic Advisers Value Fund (the “Acquired Funds”) into Strategic Advisers Large Cap Fund, a new series of Fidelity Rutland Square Trust II (the “Acquiring Fund”), the accounting survivor.
The unaudited pro forma financial statements were derived from financial statements prepared for the Acquired Funds in accordance with generally accepted accounting principles. The unaudited pro forma financial statements should be read in conjunction with the historical financial statements which are incorporated by reference in the Statement of Additional Information (“SAI”) to this Proxy Statement and Prospectus for the Acquired Funds. The reorganization is expected to qualify as a tax-free transaction with no gain or loss recognized by the funds or their shareholders.
2. Investment Valuation:
Investments are valued as of 4:00 p.m. Eastern time on the last calendar day of the period. The Board of Trustees (the Board) has delegated the day to day responsibility for the valuation of each Fund’s investments to the Fair Value Committee (the Committee) established by each Fund’s investment adviser. In accordance with valuation policies and procedures approved by the Board, the Acquired Fund and Acquiring Fund attempts to obtain prices from one or more third party pricing vendors or brokers to value its investments. When current market prices, quotations or currency exchange rates are not readily available or reliable, investments will be fair valued in good faith by the Committee, in accordance with procedures adopted by the Board. Factors used in determining fair value vary by investment type and may include market or investment specific events, changes in interest rates and credit quality. The frequency with which these procedures are used cannot be predicted and they may be utilized to a significant extent. The Committee oversees the Fund’s valuation policies and procedures and reports to the Board on the Committee’s activities and fair value determinations. The Board monitors the appropriateness of the procedures used in valuing each Fund’s investments and ratifies the fair value determinations of the Committee.
Table of Contents
The Acquired Funds categorize the inputs to valuation techniques used to value its investments into a disclosure hierarchy consisting of three levels as shown below:
Level 1 – quoted prices in active markets for identical investments
Level 2 – other significant observable inputs (including quoted prices for similar investments, interest rates, prepayment speeds, etc.)
Level 3 – unobservable inputs (including the Fund’s own assumptions based on the best information available)
Valuation techniques used to value each Fund’s investments by major category are as follows:
Equity securities, including restricted securities, for which market quotations are readily available, are valued at the last reported sale price or official closing price as reported by a third party pricing vendor on the primary market or exchange on which they are traded and are categorized as Level 1 in the hierarchy. In the event there were no sales during the day or closing prices are not available, securities are valued at the last quoted bid price or may be valued using the last available price and are generally categorized as Level 2 in the hierarchy. For foreign equity securities, when market or security specific events arise, comparisons to the valuation of American Depositary Receipts (ADRs), futures contracts, Exchange-Traded Funds (ETFs) and certain indexes as well as quoted prices for similar securities may be used and would be categorized as Level 2 in the hierarchy. Utilizing these techniques may result in transfers between Level 1 and Level 2. For equity securities, including restricted securities, where observable inputs are limited, assumptions about market activity and risk are used and these securities are categorized as Level 3 in the hierarchy.
Debt securities, including restricted securities, are valued based on evaluated prices received from third party pricing vendors or from brokers who make markets in such securities. U.S. government and government agency obligations are valued by pricing vendors who utilize matrix pricing which considers yield or price of bonds of comparable quality, coupon, maturity and type or by broker-supplied prices. When independent prices are unavailable or unreliable, debt securities may be valued utilizing pricing methodologies which consider similar factors that would be used by third party pricing vendors. Debt securities are generally categorized as Level 2 in the hierarchy but may be Level 3 depending on the circumstances.
Futures contracts are valued at the settlement price established each day by the board of trade or exchange on which they are traded and are categorized as Level 1 in the hierarchy. Exchange-traded options are valued using the last sale price or, in the absence of a sale, the last offering price and are categorized as Level 1 in the hierarchy. Investments in open-end mutual funds, including the Fidelity Central Funds, are valued at their closing net asset value (NAV) each business day and are categorized as Level 1 in the hierarchy. If an unaffiliated open-end mutual fund’s NAV is unavailable, shares of that fund may be valued by another method that the Board believes reflects fair value in accordance with the Board’s fair value pricing policies and is categorized as Level 2 in the hierarchy.
Table of Contents
Changes in valuation techniques may result in transfers in or out of an assigned level within the disclosure hierarchy. The aggregate value of investments by input level, as of May 31, 2020, is included at the end of the listing within Strategic Advisers Large Cap Fund Combined Pro Forma Portfolio (unaudited).
3. Investment Transactions and Income.
For financial reporting purposes, the Funds’ investment holdings and NAV include trades executed through the end of the last business day of the period. The NAV per share for processing shareholder transactions is calculated as of the close of business of the New York Stock Exchange (NYSE), normally 4:00 p.m. Eastern time and includes trades executed through the end of the prior business day. Gains and losses on securities sold are determined on the basis of identified cost and include proceeds received from litigation. Dividend income is recorded on the ex-dividend date, except for certain dividends from foreign securities where the ex-dividend date may have passed, which are recorded as soon as the Funds are informed of the ex-dividend date. Non-cash dividends included in dividend income, if any, are recorded at the fair market value of the securities received. Income and capital gain distributions from Fidelity Central Funds, if any, are recorded on the ex-dividend date. Income and capital gain distributions from Underlying Funds, if any, are recorded on the ex-dividend date. Certain distributions received by the Funds represent a return of capital or capital gain. The Funds determine the components of these distributions subsequent to the ex-dividend date, based upon receipt of tax filings or other correspondence relating to the underlying investment. These distributions are recorded as a reduction of cost of investments and/or as a realized gain. Interest income is accrued as earned and includes coupon interest and amortization of premium and accretion of discount on debt securities as applicable. Investment income is recorded net of foreign taxes withheld where recovery of such taxes is uncertain.
4. Expenses.
Expenses directly attributable to a fund are charged to that fund. Expenses attributable to more than one fund are allocated among the respective funds on the basis of relative net assets or other appropriate methods. Expense estimates are accrued in the period to which they relate and adjustments are made when actual amounts are known.
5. Merger Costs:
Strategic Advisers Growth Fund and Strategic Advisers Value Fund will bear their respective costs of the Reorganization, including professional fees, expenses associated with the filing of registration statements, and the cost of soliciting proxies for the Meeting, which will consist principally of printing and mailing prospectuses and Proxy Statement, together with the cost of any supplementary solicitation. The estimated one time expenses related to the Reorganization for Strategic Advisers Growth Fund and Strategic Advisers Value Fund is $77,349 and $77,275, respectively. Strategic Advisers will bear Strategic Advisers Core Fund’s one time Reorganization expense of $77,376 pursuant to its all-inclusive management contract.
Table of Contents
6. Capital Shares:
Shareholders of the Acquired Funds would become shareholders of the Acquiring Fund receiving shares of the Acquiring Fund equal to the value of their holdings in each Acquired Fund. The amount of additional shares assumed to be issued was calculated based on the May 31, 2020 net assets of each Acquired Fund and the net asset value per share of the Acquiring Fund as disclosed within the Pro Forma Combined Statement of Assets and Liabilities (unaudited).
7. Use of Estimates:
The financial statements have been prepared in conformity with accounting principles generally accepted in the United States of America which require management to make certain estimates and assumptions at the date of the financial statements. Actual results could differ from those estimates.
8. Federal Income Taxes:
Each year, each of the Funds intends to qualify as a regulated investment company under Subchapter M of the Internal Revenue Code, including distributing substantially all of its taxable income and realized gains. As a result, no provision for income taxes is required.
Table of Contents
Fidelity Rutland Square Trust II: Strategic Advisers Large Cap Fund
Fidelity Rutland Square Trust II: Strategic Advisers Core Fund
Fidelity Rutland Square Trust II: Strategic Advisers Growth Fund
Fidelity Rutland Square Trust II: Strategic Advisers Value Fund
Pro Forma Combined Statement of Assets & Liabilities
As of May 31, 2020 (Unaudited)
| Strategic Advisers | Strategic Advisers | Strategic Advisers | Strategic Advisers | Strategic Advisers | ||||||||||||||||||||||||
| Large Cap Fund(b) (Acquiring Fund) |
Core Fund (Acquired Fund) |
Growth Fund (Acquired Fund) |
Value Fund (Acquired Fund) |
Combined | Pro Forma Adjustments |
Large Cap Fund Pro Forma Combined |
||||||||||||||||||||||
| Assets |
||||||||||||||||||||||||||||
| Investments in securities, at value: |
||||||||||||||||||||||||||||
| Unaffiliated issuers |
$ | — | $ | 23,496,495,844 | $ | 5,497,511,985 | $ | 7,567,600,426 | $ | 36,561,608,255 | $ | — | $ | 36,561,608,255 | ||||||||||||||
| Fidelity Central Funds |
— | 90,811,562 | — | 52,526,246 | 143,337,808 | — | 143,337,808 | |||||||||||||||||||||
| Affiliated issuers |
— | 3,446,713,965 | 3,410,102,579 | 1,073,319,555 | 7,930,136,099 | — | 7,930,136,099 | |||||||||||||||||||||
| Cash |
— | — | 223 | 44 | 267 | (267 | )(a) | — | ||||||||||||||||||||
| Foreign currency held at value |
2,031,709 | — | — | 2,031,709 | — | 2,031,709 | ||||||||||||||||||||||
| Receivable for investments sold |
— | 102,452,628 | 923,242 | 7,413,389 | 110,789,259 | — | 110,789,259 | |||||||||||||||||||||
| Receivable for fund shares sold |
— | 8,793,026 | 2,742,204 | 2,736,120 | 14,271,350 | 14,271,350 | ||||||||||||||||||||||
| Dividends receivable |
— | 35,758,074 | 4,699,596 | 21,345,538 | 61,803,208 | — | 61,803,208 | |||||||||||||||||||||
| Distributions receivable from Fidelity Central Funds |
— | 78,821 | 716 | 19,526 | 99,063 | — | 99,063 | |||||||||||||||||||||
| Interest Receivable |
— | 24,221 | 2,808 | 14,549 | 41,578 | — | 41,578 | |||||||||||||||||||||
| Receivable for daily variation margin on future contracts |
— | 57,525 | — | — | 57,525 | — | 57,525 | |||||||||||||||||||||
| Prepaid expenses |
— | — | 33,645 | 32,777 | 66,422 | — | 66,422 | |||||||||||||||||||||
| Other receivables |
— | 290,653 | 145,791 | 146,873 | 583,317 | — | 583,317 | |||||||||||||||||||||
|
|
|
|
|
|
|
|
|
|
|
|
|
|
|
|||||||||||||||
| Total assets |
— | 27,183,508,028 | 8,916,162,789 | 8,725,155,043 | 44,824,825,860 | (267 | ) | 44,824,825,593 | ||||||||||||||||||||
|
|
|
|
|
|
|
|
|
|
|
|
|
|
|
|||||||||||||||
| Liabilities |
||||||||||||||||||||||||||||
| Payable to custodian Bank |
$ | — | $ | 619,101 | $ | — | $ | — | $ | 619,101 | $ | (267 | )(a) | $ | 618,834 | |||||||||||||
| Payable for investments purchased |
— | 89,290,434 | 5,894,994 | 1,333,785 | 96,519,213 | — | 96,519,213 | |||||||||||||||||||||
| Payable for fund shares redeemed |
— | 11,073,506 | 3,665,446 | 3,596,909 | 18,335,861 | — | 18,335,861 | |||||||||||||||||||||
| Accrued management fee |
— | 4,111,904 | 847,390 | 1,308,763 | 6,268,057 | — | 6,268,057 | |||||||||||||||||||||
| Written options, at value |
— | 341,590 | — | — | 341,590 | — | 341,590 | |||||||||||||||||||||
| Other payables and accrued expenses |
— | 290,506 | (e) | 245,100 | (e) | 224,188 | (e) | 759,794 | — | 759,794 | ||||||||||||||||||
| Collateral on securities loaned, at value |
— | 51,699,718 | — | 52,528,895 | 104,228,613 | — | 104,228,613 | |||||||||||||||||||||
|
|
|
|
|
|
|
|
|
|
|
|
|
|
|
|||||||||||||||
| Total liabilities |
— | 157,426,759 | 10,652,930 | 58,992,540 | 227,072,229 | (267 | ) | 227,071,962 | ||||||||||||||||||||
|
|
|
|
|
|
|
|
|
|
|
|
|
|
|
|||||||||||||||
| Net Assets |
$ | — | $ | 27,026,081,269 | $ | 8,905,509,859 | $ | 8,666,162,503 | $ | 44,597,753,631 | $ | — | $ | 44,597,753,631 | ||||||||||||||
|
|
|
|
|
|
|
|
|
|
|
|
|
|
|
|||||||||||||||
| Net Assets consist of: |
||||||||||||||||||||||||||||
| Paid in capital |
$ | — | $ | 19,007,589,924 | $ | 4,116,614,302 | $ | 6,871,965,970 | $ | 29,996,170,196 | $ | — | $ | 29,996,170,196 | ||||||||||||||
| Total accumulated earnings (loss) |
— | 8,018,491,345 | 4,788,895,557 | 1,794,196,533 | 14,601,583,435 | — | 14,601,583,435 | |||||||||||||||||||||
|
|
|
|
|
|
|
|
|
|
|
|
|
|
|
|||||||||||||||
| Net Assets |
$ | — | $ | 27,026,081,269 | $ | 8,905,509,859 | $ | 8,666,162,503 | $ | 44,597,753,631 | $ | — | $ | 44,597,753,631 | ||||||||||||||
|
|
|
|
|
|
|
|
|
|
|
|
|
|
|
|||||||||||||||
| Book cost of respective Fund: |
$ | — | $ | 18,948,703,354 | $ | 4,748,539,766 | $ | 7,190,892,720 | $ | 30,888,135,840 | $ | — | $ | 30,888,135,840 | ||||||||||||||
|
|
|
|
|
|
|
|
|
|
|
|
|
|
|
|||||||||||||||
Table of Contents
| Strategic Advisers | Strategic Advisers | Strategic Advisers | Strategic Advisers | |||||||||||||||||||||||||
| Large Cap Fund(b) (Acquiring Fund) |
Core Fund (Acquired Fund) |
Growth Fund (Acquired Fund) |
Value Fund (Acquired Fund) |
Combined | Pro Forma Adjustments |
Pro Forma Combined | ||||||||||||||||||||||
| Net Assets |
$ | — | $ | 27,026,081,269 | $ | 8,905,509,859 | $ | 8,666,162,503 | $ | 44,597,753,631 | $ | — | $ | 44,597,753,631 | ||||||||||||||
| Offering price and redemption price per share |
$ | — | $ | 18.29 | $ | 19.66 | $ | 16.27 | $ | $ | 10.00 | (c) | $ | 10.00 | (c) | |||||||||||||
| Shares outstanding |
— | 1,477,889,462 | 452,953,854 | 532,532,088 | 4,459,775,363 | (d) | 4,459,775,363 | |||||||||||||||||||||
| (a) | Adjustment to consolidate cash balances. |
| (b) | Strategic Advisers Large Cap Fund will commence operations in November 2020. |
| (c) | Strategic Advisers Large Cap Fund expected to launch at $10.00 net asset value per share. |
| (d) | Per Regulation S-X Section 210.11 - 02 (a)(7) shares have been adjusted to reflect what will be issued post merger. |
| (e) | Proxy related expenses, representing approximately $77,376 for Strategic Advisers Core Fund, $77,349 Strategic Advisers Growth Fund and $77,275 for Strategic Advisers Value Fund, are excluded from the Pro Forma combined fund analysis. Strategic Advisers will bear the proxy related expense for Strategic Advisers Core Fund pursuant to its all-inclusive management contract. |
Table of Contents
Fidelity Rutland Square Trust II: Strategic Advisers Large Cap Fund
Fidelity Rutland Square Trust II: Strategic Advisers Core Fund
Fidelity Rutland Square Trust II: Strategic Advisers Growth Fund
Fidelity Rutland Square Trust II: Strategic Advisers Value Fund
Pro Forma Combined Statement of Operations
12 months ended May 31, 2020 (Unaudited)
| Strategic Advisers Large Cap Fund (f) |
Strategic Advisers Core Fund |
Strategic Advisers Growth Fund |
Strategic Advisers Value Fund |
Strategic Advisers Large Cap Fund |
||||||||||||||||||||||||
| Pro Forma | ||||||||||||||||||||||||||||
| (Acquiring Fund) | (Acquired Fund) | (Acquiring Fund) | (Acquired Fund) | Combined | Adjustments | Pro Forma Combined | ||||||||||||||||||||||
| Investment Income |
||||||||||||||||||||||||||||
| Dividends Unaffiliated issuers |
$ | — | $ | 453,231,722 | $ | 54,555,552 | $ | 236,031,766 | $ | 743,819,040 | $ | — | $ | 743,819,040 | ||||||||||||||
| Dividends Affiliated issuers |
— | 46,370,495 | 142,109,759 | 9,188,640 | 197,668,894 | — | 197,668,894 | |||||||||||||||||||||
| Interest |
— | 3,599,771 | 776,447 | 1,627,206 | 6,003,424 | — | 6,003,424 | |||||||||||||||||||||
| Income from Fidelity Central Funds |
— | 2,153,118 | 25,868 | 796,564 | 2,975,550 | — | 2,975,550 | |||||||||||||||||||||
|
|
|
|
|
|
|
|
|
|
|
|
|
|
|
|||||||||||||||
| Total Income |
— | 505,355,106 | 197,467,626 | 247,644,176 | 950,466,908 | — | 950,466,908 | |||||||||||||||||||||
| Expenses |
||||||||||||||||||||||||||||
| Management fee |
— | 117,699,434 | 33,269,453 | 40,803,189 | 191,772,076 | (2,946,745 | )(a) | 188,825,331 | ||||||||||||||||||||
| Accounting and security lending fees |
— | — | 106,560 | 106,648 | 213,208 | (213,208 | )(b) | — | ||||||||||||||||||||
| Custodian fees and expenses |
— | — | 54,400 | 87,602 | 142,002 | 267,930 | (c) | 409,932 | ||||||||||||||||||||
| Independent trustees’ fees and expenses |
— | 292,533 | 107,543 | 106,120 | 506,196 | — | 506,196 | |||||||||||||||||||||
| Registration fees |
— | — | 81,113 | 77,522 | 158,635 | — | 158,635 | |||||||||||||||||||||
| Audit |
— | — | 76,618 | 77,210 | 153,828 | (75,828 | )(d) | 78,000 | ||||||||||||||||||||
| Legal |
— | — | 35,856 | 36,549 | 72,405 | 91,830 | (c) | 164,235 | ||||||||||||||||||||
| Miscellaneous |
— | 64,061 | (e) | 85,248 | (e) | 84,050 | (e) | 233,359 | 158,311 | (c) | 391,670 | |||||||||||||||||
|
|
|
|
|
|
|
|
|
|
|
|
|
|
|
|||||||||||||||
| Total expenses before reductions |
— | 118,056,028 | 33,816,791 | 41,378,890 | 193,251,709 | (2,717,710 | ) | 190,533,999 | ||||||||||||||||||||
| Expenses reductions |
— | (66,625,576 | ) | (23,513,811 | ) | (23,135,670 | ) | (113,275,057 | ) | — | (113,275,057 | ) | ||||||||||||||||
|
|
|
|
|
|
|
|
|
|
|
|
|
|
|
|||||||||||||||
| Total expenses |
— | 51,430,452 | 10,302,980 | 18,243,220 | 79,976,652 | (2,717,710 | ) | 77,258,942 | ||||||||||||||||||||
|
|
|
|
|
|
|
|
|
|
|
|
|
|
|
|||||||||||||||
| Net investment income |
— | 453,924,654 | 187,164,646 | 229,400,956 | 870,490,256 | 2,717,710 | 873,207,966 | |||||||||||||||||||||
| Realized and Unrealized Gain (Loss) |
||||||||||||||||||||||||||||
| Net realized gain (loss) on: |
||||||||||||||||||||||||||||
| Investment securities: |
||||||||||||||||||||||||||||
| Unaffiliated issuers |
— | 215,756,405 | 691,141,132 | 511,887,318 | 1,418,784,855 | — | 1,418,784,855 | |||||||||||||||||||||
| Other Affiliated issuers |
— | (32,073,187 | ) | 210,219,417 | (55,347,321 | ) | 122,798,909 | — | 122,798,909 | |||||||||||||||||||
| Fidelity Central Funds |
— | 4,179 | (24 | ) | 2,332 | 6,487 | — | 6,487 | ||||||||||||||||||||
| Foreign currency transactions |
— | (145,815 | ) | — | 840 | (144,975 | ) | — | (144,975 | ) | ||||||||||||||||||
| Futures contracts |
— | 613,157 | — | — | 613,157 | — | 613,157 | |||||||||||||||||||||
| Written options |
— | 505,497 | — | — | 505,497 | — | 505,497 | |||||||||||||||||||||
| Capital gain distributions from underlying funds: Unaffiliated issuers |
— | 310,077,352 | 14,059,313 | 13,976,292 | 338,112,957 | — | 338,112,957 | |||||||||||||||||||||
| Capital gain distributions from underlying funds: Other affiliated issuers |
— | 260,402,406 | 113,647,230 | 9,668,368 | 383,718,004 | — | 383,718,004 | |||||||||||||||||||||
|
|
|
|
|
|
|
|
|
|
|
|
|
|
|
|||||||||||||||
| Total net realized gain (loss) |
— | 755,139,994 | 1,029,067,068 | 480,187,829 | 2,264,394,891 | — | 2,264,394,891 | |||||||||||||||||||||
|
|
|
|
|
|
|
|
|
|
|
|
|
|
|
|||||||||||||||
| Change in net unrealized appreciation (depreciation) on: |
||||||||||||||||||||||||||||
| Investment securities |
||||||||||||||||||||||||||||
| Unaffiliated issuers |
— | 1,631,135,086 | 366,839,946 | (738,591,037 | ) | 1,259,383,995 | — | 1,259,383,995 | ||||||||||||||||||||
| Fidelity Central Funds |
— | — | 1 | — | 1 | — | 1 | |||||||||||||||||||||
| Other affiliated issuers |
— | 184,399,819 | 603,798,285 | 95,324,774 | 883,522,878 | — | 883,522,878 | |||||||||||||||||||||
| Assets and liabilities in foreign currencies |
— | 41,769 | — | — | 41,769 | — | 41,769 | |||||||||||||||||||||
| Futures contracts |
— | 6,433,550 | — | — | 6,433,550 | — | 6,433,550 | |||||||||||||||||||||
| Written options |
— | 868,541 | — | — | 868,541 | — | 868,541 | |||||||||||||||||||||
|
|
|
|
|
|
|
|
|
|
|
|
|
|
|
|||||||||||||||
| Total change in net unrealized appreciation (depreciation) |
— | 1,822,878,765 | 970,638,232 | (643,266,263 | ) | 2,150,250,734 | — | 2,150,250,734 | ||||||||||||||||||||
|
|
|
|
|
|
|
|
|
|
|
|
|
|
|
|||||||||||||||
| Net Gain (Loss) |
— | 2,578,018,759 | 1,999,705,300 | (163,078,434 | ) | 4,414,645,625 | — | 4,414,645,625 | ||||||||||||||||||||
|
|
|
|
|
|
|
|
|
|
|
|
|
|
|
|||||||||||||||
| Net increase (decrease) in net assets resulting from operations |
$ | — | $ | 3,031,943,413 | $ | 2,186,869,946 | $ | 66,322,522 | $ | 5,285,135,881 | $ | 2,717,710 | $ | 5,287,853,591 | ||||||||||||||
|
|
|
|
|
|
|
|
|
|
|
|
|
|
|
|||||||||||||||
Table of Contents
| (a) | Management fee adjustment reflects the Acquiring Fund’s projected management fee rate applied to the Pro Forma Combined fund’s average net assets. |
| (b) | Accounting fees removed per contract change effective July 1, 2019. |
| (c) | Increase in expenses based on conversion of certain Strategic Advisers Core Fund’s expense into Pro Forma Combined fund. |
| (d) | Decrease in expenses based on approved fees and allocations. |
| (e) | Proxy related expenses, representing approximately $77,376 for Strategic Advisers Core Fund, $77,349 Strategic Advisers Growth Fund and $77,275 for Strategic Advisers Value Fund, are excluded from the Pro Forma combined fund analysis. Strategic Advisers will bear the proxy related expense for Strategic Advisers Core Fund pursuant to its all-inclusive management contract. |
| (f) | Strategic Advisers Large Cap Fund will commence operations in November 2020. |
Table of Contents
Capitalization Table
The following tables show the capitalization of the Funds as of May 31, 2020 (unaudited) and on a pro forma combined basis (unaudited) as of that date giving effect to the Reorganization.
| Net Assets | Net Asset Value Per Share |
Shares Outstanding |
||||||||||
| Strategic Advisers Large Cap Fund (f) |
N/A | N/A | N/A | |||||||||
| Strategic Advisers Core Fund (c) |
$ | 27,026,081,269 | $ | 18.29 | 1,477,889,462 | |||||||
| Strategic Advisers Growth Fund (d) |
$ | 8,905,509,859 | $ | 19.66 | 452,953,854 | |||||||
| Strategic Advisers Value Fund (e) |
$ | 8,666,162,503 | $ | 16.27 | 532,532,088 | |||||||
| Pro Forma |
||||||||||||
| Strategic Advisers Large Cap Fund |
$ | 44,597,753,631 | $ | 10.00 | (b) | 4,459,775,363 | (a) | |||||
| (a) | To comply with Rule 3-18 of Regulation S-X, the pro-forma financial statements will be based on the most recent audited annual report of the Acquiring Fund. If these are more than 245 days old as of the effective date of the N-14 filing, interim financial statements covering a 12 month period will be used. In addition, per Regulation S-X Section 210.11 - 02 (a)(7) shares have been adjusted to reflect what will be issued post merger. |
| (b) | Strategic Advisers Large Cap Fund expected to launch at $10.00 net asset value per share. |
| (c) | Strategic Advisers Core Fund’s estimated one time proxy costs is $77,376. Strategic Advisers will bear the funds one time proxy cost pursuant to its all-inclusive management contract. |
| (d) | Strategic Advisers Growth Fund’s estimated one time proxy costs is $77,349. |
| (e) | Strategic Advisers Value Fund’s estimated one time proxy costs is $77,275. |
| (f) | The fund will commence operations in November 2020. |
Table of Contents
Fidelity Rutland Square Trust II: Strategic Advisers Core Fund
Fidelity Rutland Square Trust II: Strategic Advisers Value Fund
Fidelity Rutland Square Trust II: Strategic Advisers Growth Fund
Pro Forma Combined Investments
As of May 31, 2020 (Unaudited)
| Strategic Advisers Core Fund | Strategic Advisers Growth Fund | Strategic Advisers Value Fund | Strategic Advisers Large Cap Fund | |||||||||||||||||||||||||||||
| (Acquired Fund) | (Acquired Fund) | (Acquired Fund) | Pro Forma Combined | |||||||||||||||||||||||||||||
| Investments May 31, 2020 (Unaudited) |
||||||||||||||||||||||||||||||||
| Showing Percentage of Net Assets |
||||||||||||||||||||||||||||||||
| Common Stocks – 76.4% | Shares | Value | Shares | Value | Shares | Value | Shares | Value | ||||||||||||||||||||||||
| COMMUNICATION SERVICES |
||||||||||||||||||||||||||||||||
| Diversified Telecommunication Services |
||||||||||||||||||||||||||||||||
| AT&T, Inc. |
1,720,866 | $ | 53,105,925 | 0 | $ | 0 | 4,629,400 | $ | 142,863,284 | 6,350,266 | $ | 195,969,209 | ||||||||||||||||||||
| CenturyLink, Inc. |
146,756 | 1,442,611 | 0 | 0 | 0 | 0 | 146,756 | 1,442,611 | ||||||||||||||||||||||||
| Verizon Communications, Inc. |
2,187,037 | 125,492,183 | 0 | 0 | 3,295,323 | 189,085,634 | 5,482,360 | 314,577,817 | ||||||||||||||||||||||||
| Vonage Holdings Corp. |
207,800 | 2,001,114 | (a) | 0 | 0 | 0 | 0 | 207,800 | 2,001,114 | (a) | ||||||||||||||||||||||
|
|
|
|
|
|
|
|
|
|||||||||||||||||||||||||
| 182,041,833 | 0 | 331,948,918 | 513,990,751 | |||||||||||||||||||||||||||||
|
|
|
|
|
|
|
|
|
|||||||||||||||||||||||||
| Entertainment |
||||||||||||||||||||||||||||||||
| Activision Blizzard, Inc. |
1,648,801 | 118,680,696 | 280,100 | 20,161,598 | 0 | 0 | 1,928,901 | 138,842,294 | ||||||||||||||||||||||||
| DouYu International Holdings Ltd. ADR |
340,700 | 3,066,300 | (e) | 0 | 0 | 0 | 0 | 340,700 | 3,066,300 | (e) | ||||||||||||||||||||||
| Electronic Arts, Inc. |
319,078 | 39,208,305 | (a) | 0 | 0 | 120,400 | 14,794,752 | (a) | 439,478 | 54,003,057 | (a) | |||||||||||||||||||||
| Live Nation Entertainment, Inc. |
40,772 | 2,004,352 | (a) | 0 | 0 | 0 | 0 | 40,772 | 2,004,352 | (a) | ||||||||||||||||||||||
| Netflix, Inc. |
388,785 | 163,184,728 | (a) | 0 | 0 | 0 | 0 | 388,785 | 163,184,728 | (a) | ||||||||||||||||||||||
| Spotify Technology SA |
9,600 | 1,736,928 | (a) | 0 | 0 | 0 | 0 | 9,600 | 1,736,928 | (a) | ||||||||||||||||||||||
| Take-Two Interactive Software, Inc. |
43,610 | 5,938,374 | (a) | 0 | 0 | 0 | 0 | 43,610 | 5,938,374 | (a) | ||||||||||||||||||||||
| The Walt Disney Co. |
524,569 | 61,531,944 | 429,585 | 50,390,321 | 0 | 0 | 954,154 | 111,922,265 | ||||||||||||||||||||||||
| Vivendi SA |
1,788,416 | 40,892,745 | 0 | 0 | 0 | 0 | 1,788,416 | 40,892,745 | ||||||||||||||||||||||||
|
|
|
|
|
|
|
|
|
|||||||||||||||||||||||||
| 436,244,372 | 70,551,919 | 14,794,752 | 521,591,043 | |||||||||||||||||||||||||||||
|
|
|
|
|
|
|
|
|
|||||||||||||||||||||||||
| Interactive Media & Services |
||||||||||||||||||||||||||||||||
| Alphabet, Inc.: |
||||||||||||||||||||||||||||||||
| Class A |
154,176 | 221,014,380 | (a) | 91,041 | 130,509,094 | (a) | 7,196 | 10,315,610 | (a) | 252,413 | 361,839,084 | (a) | ||||||||||||||||||||
| Class C |
383,018 | 547,302,081 | (a) | 92,124 | 131,637,826 | (a) | 0 | 0 | 475,142 | 678,939,907 | (a) | |||||||||||||||||||||
| ANGI Homeservices, Inc. Class A |
39,600 | 429,660 | (a)(e) | 0 | 0 | 0 | 0 | 39,600 | 429,660 | (a)(e) | ||||||||||||||||||||||
| Facebook, Inc. Class A |
2,040,762 | 459,355,119 | (a) | 926,055 | 208,445,720 | (a) | 0 | 0 | 2,966,817 | 667,800,839 | (a) | |||||||||||||||||||||
| Match Group, Inc. |
32,600 | 2,902,704 | (a)(e) | 0 | 0 | 0 | 0 | 32,600 | 2,902,704 | (a)(e) | ||||||||||||||||||||||
| Twitter, Inc. |
15,628 | 483,999 | (a) | 0 | 0 | 247,000 | 7,649,590 | (a) | 262,628 | 8,133,589 | (a) | |||||||||||||||||||||
| Wise Talent Information Technology Co. Ltd. |
446,200 | 1,057,193 | (a) | 0 | 0 | 0 | 0 | 446,200 | 1,057,193 | (a) | ||||||||||||||||||||||
|
|
|
|
|
|
|
|
|
|||||||||||||||||||||||||
| 1,232,545,136 | 470,592,640 | 17,965,200 | 1,721,102,976 | |||||||||||||||||||||||||||||
|
|
|
|
|
|
|
|
|
|||||||||||||||||||||||||
| Media |
||||||||||||||||||||||||||||||||
| Charter Communications, Inc. Class A |
291,745 | 158,709,280 | 0 | 0 | 22,570 | 12,278,080 | (a) | 314,315 | 170,987,360 | (a) | ||||||||||||||||||||||
| Comcast Corp. Class A |
7,148,021 | 283,061,632 | 20,390,278 | 2,433,477 | 96,365,689 | 9,581,498 | 399,817,599 | |||||||||||||||||||||||||
| Discovery Communications, Inc.: |
||||||||||||||||||||||||||||||||
| Class A |
129,011 | 2,805,989 | (a)(e) | 0 | 0 | 63,100 | 1,372,425 | (a)(e) | 192,111 | 4,178,414 | (a)(e) | |||||||||||||||||||||
| Class C (non-vtg.) |
748,950 | 14,671,931 | (a) | 0 | 0 | 254,978 | 4,995,019 | (a) | 1,003,928 | 19,666,950 | (a) | |||||||||||||||||||||
| DISH Network Corp. Class A |
52,322 | 1,655,991 | (a) | 0 | 0 | 256,410 | 8,115,377 | (a) | 308,732 | 9,771,368 | (a) | |||||||||||||||||||||
| Entercom Communications Corp. Class A |
0 | 0 | 0 | 0 | 625,195 | 1,044,076 | 625,195 | 1,044,076 | ||||||||||||||||||||||||
| Fox Corp.: |
||||||||||||||||||||||||||||||||
| Class A |
36,200 | 1,055,954 | 0 | 0 | 124,600 | 3,634,582 | 160,800 | 4,690,536 | ||||||||||||||||||||||||
| Class B |
26,551 | 764,138 | 0 | 0 | 0 | 0 | 26,551 | 764,138 | ||||||||||||||||||||||||
| Interpublic Group of Companies, Inc. |
246,900 | 4,224,459 | 0 | 0 | 133,770 | 2,288,805 | 380,670 | 6,513,264 | ||||||||||||||||||||||||
| Liberty Broadband Corp. Class C |
343,573 | 46,938,943 | (a) | 0 | 0 | 0 | 0 | 343,573 | 46,938,943 | (a) | ||||||||||||||||||||||
| Liberty Global PLC Class C |
146,100 | 3,014,043 | (a) | 0 | 0 | 0 | 0 | 146,100 | 3,014,043 | (a) | ||||||||||||||||||||||
| Liberty Media Corp. Liberty Formula One Group Series C |
126,900 | 4,397,085 | (a) | 0 | 0 | 0 | 0 | 126,900 | 4,397,085 | (a) | ||||||||||||||||||||||
| Nexstar Broadcasting Group, Inc. Class A |
0 | 0 | 0 | 0 | 91,251 | 7,602,121 | 91,251 | 7,602,121 | ||||||||||||||||||||||||
| Omnicom Group, Inc. |
116,119 | 6,362,160 | 0 | 0 | 89,719 | 4,915,704 | 205,838 | 11,277,864 | ||||||||||||||||||||||||
| Tegna, Inc. |
64,900 | 760,628 | 0 | 0 | 471,200 | 5,522,464 | 536,100 | 6,283,092 | ||||||||||||||||||||||||
| ViacomCBS, Inc. Class B |
137,252 | 2,846,606 | 0 | 0 | 458,687 | 9,513,168 | 595,939 | 12,359,774 | ||||||||||||||||||||||||
|
|
|
|
|
|
|
|
|
|||||||||||||||||||||||||
| 531,268,839 | 20,390,278 | 157,647,510 | 709,306,627 | |||||||||||||||||||||||||||||
|
|
|
|
|
|
|
|
|
|||||||||||||||||||||||||
| Wireless Telecommunication Services |
||||||||||||||||||||||||||||||||
| T-Mobile U.S., Inc. |
491,272 | 49,146,851 | (a) | 0 | 0 | 0 | 0 | 491,272 | 49,146,851 | (a) | ||||||||||||||||||||||
|
|
|
|
|
|
|
|
|
|||||||||||||||||||||||||
| TOTAL COMMUNICATION SERVICES |
2,431,247,031 | 561,534,837 | 522,356,380 | 3,515,138,248 | ||||||||||||||||||||||||||||
|
|
|
|
|
|
|
|
|
|||||||||||||||||||||||||
| CONSUMER DISCRETIONARY |
||||||||||||||||||||||||||||||||
| Auto Components |
||||||||||||||||||||||||||||||||
| Aptiv PLC |
309,730 | 23,338,156 | 115,137 | 8,675,573 | 105,229 | 7,929,005 | 530,096 | 39,942,734 | ||||||||||||||||||||||||
Table of Contents
| BorgWarner, Inc. |
326,996 | 10,512,921 | 0 | 0 | 391,316 | 12,580,809 | 718,312 | 23,093,730 | ||||||||||||||||||||||||
| Cooper Tire & Rubber Co. |
55,800 | 1,435,734 | 0 | 0 | 265,127 | 6,821,718 | 320,927 | 8,257,452 | ||||||||||||||||||||||||
| Gentex Corp. |
28,600 | 756,184 | 0 | 0 | 98,267 | 2,598,179 | 126,867 | 3,354,363 | ||||||||||||||||||||||||
| Lear Corp. |
49,700 | 5,270,685 | 0 | 0 | 176,456 | 18,713,159 | 226,156 | 23,983,844 | ||||||||||||||||||||||||
| Magna International, Inc. Class A |
0 | 0 | 0 | 0 | 18,395 | 775,901 | 18,395 | 775,901 | ||||||||||||||||||||||||
| Magna International, Inc. Class A (sub. vtg.) |
332,600 | 14,025,316 | 0 | 0 | 0 | 0 | 332,600 | 14,025,316 | ||||||||||||||||||||||||
| The Goodyear Tire & Rubber Co. |
186,300 | 1,417,743 | 0 | 0 | 685,300 | 5,215,133 | 871,600 | 6,632,876 | ||||||||||||||||||||||||
|
|
|
|
|
|
|
|
|
|||||||||||||||||||||||||
| 56,756,739 | 8,675,573 | 54,633,904 | 120,066,216 | |||||||||||||||||||||||||||||
|
|
|
|
|
|
|
|
|
|||||||||||||||||||||||||
| Automobiles |
||||||||||||||||||||||||||||||||
| Ferrari NV |
117,000 | 19,739,070 | (e) | 0 | 0 | 0 | 0 | 117,000 | 19,739,070 | (e) | ||||||||||||||||||||||
| Ford Motor Co. |
553,700 | 3,161,627 | 0 | 0 | 2,037,000 | 11,631,270 | 2,590,700 | 14,792,897 | ||||||||||||||||||||||||
| General Motors Co. |
805,442 | 20,844,839 | 0 | 0 | 1,186,424 | 30,704,653 | 1,991,866 | 51,549,492 | ||||||||||||||||||||||||
| Harley-Davidson, Inc. |
100,900 | 2,153,206 | (e) | 0 | 0 | 401,872 | 8,575,948 | (e) | 502,772 | 10,729,154 | (e) | |||||||||||||||||||||
| Tesla, Inc. |
21,605 | 18,040,175 | (a) | 0 | 0 | 0 | 0 | 21,605 | 18,040,175 | (a) | ||||||||||||||||||||||
| Thor Industries, Inc. |
1,210 | 104,302 | 0 | 0 | 124,030 | 10,691,386 | 125,240 | 10,795,688 | ||||||||||||||||||||||||
|
|
|
|
|
|
|
|
|
|||||||||||||||||||||||||
| 64,043,219 | 0 | 61,603,257 | 125,646,476 | |||||||||||||||||||||||||||||
|
|
|
|
|
|
|
|
|
|||||||||||||||||||||||||
| Distributors |
||||||||||||||||||||||||||||||||
| Genuine Parts Co. |
17,400 | 1,451,334 | 0 | 0 | 59,853 | 4,992,339 | 77,253 | 6,443,673 | ||||||||||||||||||||||||
| LKQ Corp. |
193,135 | 5,303,487 | (a) | 0 | 0 | 126,300 | 3,468,198 | (a) | 319,435 | 8,771,685 | (a) | |||||||||||||||||||||
|
|
|
|
|
|
|
|
|
|||||||||||||||||||||||||
| 6,754,821 | 0 | 8,460,537 | 15,215,358 | |||||||||||||||||||||||||||||
|
|
|
|
|
|
|
|
|
|||||||||||||||||||||||||
| Diversified Consumer Services |
||||||||||||||||||||||||||||||||
| Afya Ltd. |
105,134 | 2,065,883 | 0 | 0 | 0 | 0 | 105,134 | 2,065,883 | ||||||||||||||||||||||||
|
|
|
|
|
|
|
|
|
|||||||||||||||||||||||||
| Hotels, Restaurants & Leisure |
||||||||||||||||||||||||||||||||
| Brinker International, Inc. |
44,600 | 1,175,210 | 0 | 342,271 | 9,018,841 | 386,871 | 10,194,051 | |||||||||||||||||||||||||
| Chipotle Mexican Grill, Inc. |
583 | 585,280 | (a) | 0 | 0 | 0 | 583 | 585,280 | (a) | |||||||||||||||||||||||
| Darden Restaurants, Inc. |
56,900 | 4,373,334 | 0 | 0 | 0 | 56,900 | 4,373,334 | |||||||||||||||||||||||||
| Domino’s Pizza, Inc. |
4,750 | 1,832,740 | 35,600 | 13,735,904 | 0 | 0 | 40,350 | 15,568,644 | ||||||||||||||||||||||||
| Hilton Worldwide Holdings, Inc. |
257,904 | 20,454,366 | 0 | 0 | 0 | 0 | 257,904 | 20,454,366 | ||||||||||||||||||||||||
| Hyatt Hotels Corp. Class A |
4,100 | 225,869 | 0 | 0 | 14,179 | 781,121 | 18,279 | 1,006,990 | ||||||||||||||||||||||||
| Las Vegas Sands Corp. |
161,919 | 7,762,397 | 0 | 0 | 0 | 0 | 161,919 | 7,762,397 | ||||||||||||||||||||||||
| Marriott International, Inc. Class A |
204,600 | 18,107,100 | 0 | 0 | 0 | 0 | 204,600 | 18,107,100 | ||||||||||||||||||||||||
| McDonald’s Corp. |
715,317 | 133,277,863 | 0 | 0 | 0 | 0 | 715,317 | 133,277,863 | ||||||||||||||||||||||||
| MGM Mirage, Inc. |
217,700 | 3,740,086 | 0 | 0 | 0 | 0 | 217,700 | 3,740,086 | ||||||||||||||||||||||||
| Royal Caribbean Cruises Ltd. |
24,500 | 1,270,815 | (e) | 0 | 0 | 94,500 | 4,901,715 | (e) | 119,000 | 6,172,530 | (e) | |||||||||||||||||||||
| Starbucks Corp. |
293,791 | 22,912,760 | 371,575 | 28,979,134 | 0 | 0 | 665,366 | 51,891,894 | ||||||||||||||||||||||||
| Wyndham Destinations, Inc. |
61,680 | 1,961,424 | 228,000 | 7,250,400 | 289,680 | 9,211,824 | ||||||||||||||||||||||||||
| Wyndham Hotels & Resorts, Inc. |
0 | 0 | 41,208 | 1,892,683 | 41,208 | 1,892,683 | ||||||||||||||||||||||||||
| Wynn Resorts Ltd. |
135,200 | 11,259,456 | 0 | 0 | 135,200 | 11,259,456 | ||||||||||||||||||||||||||
| Yum China Holdings, Inc. |
0 | 0 | 327,589 | 15,180,474 | 327,589 | 15,180,474 | ||||||||||||||||||||||||||
| Yum! Brands, Inc. |
1,083,186 | 97,194,280 | 240,308 | 21,562,837 | 0 | 0 | 1,323,494 | 118,757,117 | ||||||||||||||||||||||||
|
|
|
|
|
|
|
|
|
|||||||||||||||||||||||||
| 326,132,980 | 79,458,349 | 23,844,760 | 429,436,089 | |||||||||||||||||||||||||||||
|
|
|
|
|
|
|
|
|
|||||||||||||||||||||||||
| Household Durables |
||||||||||||||||||||||||||||||||
| D.R. Horton, Inc. |
221,846 | 12,268,084 | 0 | 151,979 | 8,404,439 | 373,825 | 20,672,523 | |||||||||||||||||||||||||
| Garmin Ltd. |
26,842 | 2,420,343 | 0 | 26,842 | 2,420,343 | |||||||||||||||||||||||||||
| Lennar Corp.: |
||||||||||||||||||||||||||||||||
| Class A |
215,473 | 13,027,498 | 241,600 | 14,607,136 | 361,103 | 21,832,287 | 818,176 | 49,466,921 | ||||||||||||||||||||||||
| Class B |
0 | 0 | 0 | 0 | 6,200 | 278,256 | 6,200 | 278,256 | ||||||||||||||||||||||||
| Mohawk Industries, Inc. |
70,700 | 6,589,240 | (a) | 0 | 0 | 79,003 | 7,363,080 | (a) | 149,703 | 13,952,320 | (a) | |||||||||||||||||||||
| Newell Brands, Inc. |
0 | 0 | 0 | 0 | 358,406 | 4,713,039 | 358,406 | 4,713,039 | ||||||||||||||||||||||||
| PulteGroup, Inc. |
312,824 | 10,626,631 | 388,000 | 13,180,360 | 615,307 | 20,901,979 | 1,316,131 | 44,708,970 | ||||||||||||||||||||||||
| Sony Corp. sponsored ADR |
0 | 0 | 0 | 0 | 179,000 | 11,592,040 | (e) | 179,000 | 11,592,040 | (e) | ||||||||||||||||||||||
| Whirlpool Corp. |
105,723 | 12,879,176 | 0 | 0 | 174,522 | 21,260,270 | 280,245 | 34,139,446 | ||||||||||||||||||||||||
|
|
|
|
|
|
|
|
|
|||||||||||||||||||||||||
| 57,810,972 | 27,787,496 | 96,345,390 | 181,943,858 | |||||||||||||||||||||||||||||
|
|
|
|
|
|
|
|
|
|||||||||||||||||||||||||
| Internet & Direct Marketing Retail |
||||||||||||||||||||||||||||||||
| Alibaba Group Holding Ltd. sponsored ADR |
96,408 | 19,994,055 | (a) | 486,370 | 100,868,274 | (a) | 0 | 0 | 582,778 | 120,862,329 | (a) | |||||||||||||||||||||
| Amazon.com, Inc. |
362,125 | 884,443,236 | (a) | 139,979 | 341,880,510 | (a) | 0 | 0 | 502,104 | 1,226,323,746 | (a) | |||||||||||||||||||||
| eBay, Inc. |
323,594 | 14,736,471 | 0 | 0 | 841,000 | 38,299,140 | 1,164,594 | 53,035,611 | ||||||||||||||||||||||||
| Expedia, Inc. |
11,600 | 921,968 | 0 | 0 | 0 | 0 | 11,600 | 921,968 | ||||||||||||||||||||||||
| Ocado Group PLC |
28,900 | 782,001 | (a) | 0 | 0 | 0 | 0 | 28,900 | 782,001 | (a) | ||||||||||||||||||||||
| The Booking Holdings, Inc. |
76,280 | 125,054,958 | (a) | 8,413 | 13,792,440 | (a) | 5,618 | 9,210,262 | (a) | 90,311 | 148,057,660 | (a) | ||||||||||||||||||||
|
|
|
|
|
|
|
|
|
|||||||||||||||||||||||||
| 1,045,932,689 | 456,541,224 | 47,509,402 | 1,549,983,315 | |||||||||||||||||||||||||||||
|
|
|
|
|
|
|
|
|
|||||||||||||||||||||||||
| Leisure Products |
||||||||||||||||||||||||||||||||
| Hasbro, Inc. |
57,035 | 4,192,643 | 0 | 0 | 0 | 0 | 57,035 | 4,192,643 | ||||||||||||||||||||||||
|
|
|
|
|
|
|
|
|
Table of Contents
| Multiline Retail |
||||||||||||||||||||||||||||||||
| Big Lots, Inc. |
13,500 | 523,125 | 0 | 0 | 160,800 | 6,231,000 | 174,300 | 6,754,125 | ||||||||||||||||||||||||
| Dillard’s, Inc. Class A |
19,700 | 591,197 | (e) | 0 | 0 | 109,300 | 3,280,093 | (e) | 129,000 | 3,871,290 | (e) | |||||||||||||||||||||
| Dollar General Corp. |
150,731 | 28,866,494 | 0 | 0 | 0 | 0 | 150,731 | 28,866,494 | ||||||||||||||||||||||||
| Dollar Tree, Inc. |
272,142 | 26,634,538 | (a) | 0 | 0 | 0 | 0 | 272,142 | 26,634,538 | (a) | ||||||||||||||||||||||
| Kohl’s Corp. |
121,838 | 2,341,726 | 0 | 0 | 524,755 | 10,085,791 | 646,593 | 12,427,517 | ||||||||||||||||||||||||
| Macy’s, Inc. |
103,200 | 656,352 | (e) | 0 | 0 | 348,100 | 2,213,916 | (e) | 451,300 | 2,870,268 | (e) | |||||||||||||||||||||
| Nordstrom, Inc. |
0 | 0 | 0 | 0 | 232,156 | 3,744,676 | (e) | 232,156 | 3,744,676 | (e) | ||||||||||||||||||||||
| Target Corp. |
253,246 | 30,979,583 | 188,080 | 23,007,826 | 230,200 | 28,160,366 | 671,526 | 82,147,775 | ||||||||||||||||||||||||
|
|
|
|
|
|
|
|
|
|||||||||||||||||||||||||
| 90,593,015 | 23,007,826 | 53,715,842 | 167,316,683 | |||||||||||||||||||||||||||||
|
|
|
|
|
|
|
|
|
|||||||||||||||||||||||||
| Specialty Retail |
||||||||||||||||||||||||||||||||
| Advance Auto Parts, Inc. |
20,227 | 2,818,026 | 182,231 | 25,388,423 | 27,500 | 3,831,300 | 229,958 | 32,037,749 | ||||||||||||||||||||||||
| American Eagle Outfitters, Inc. |
110,600 | 1,013,096 | 0 | 0 | 464,400 | 4,253,904 | 575,000 | 5,267,000 | ||||||||||||||||||||||||
| AutoZone, Inc. |
21,052 | 24,164,749 | (a) | 15,200 | 17,447,472 | (a) | 32,895 | 37,758,855 | (a) | 69,147 | 79,371,076 | (a) | ||||||||||||||||||||
| Best Buy Co., Inc. |
325,725 | 25,435,865 | 0 | 0 | 502,105 | 39,209,379 | 827,830 | 64,645,244 | ||||||||||||||||||||||||
| Burlington Stores, Inc. |
91,500 | 19,184,805 | (a) | 0 | 0 | 0 | 0 | 91,500 | 19,184,805 | (a) | ||||||||||||||||||||||
| CarMax, Inc. |
177,900 | 15,664,095 | (a) | 0 | 0 | 67,311 | 5,926,734 | (a) | 245,211 | 21,590,829 | (a) | |||||||||||||||||||||
| Dick’s Sporting Goods, Inc. |
0 | 0 | 0 | 0 | 233,200 | 8,409,192 | 233,200 | 8,409,192 | ||||||||||||||||||||||||
| Foot Locker, Inc. |
0 | 0 | 0 | 0 | 71,661 | 1,985,010 | 71,661 | 1,985,010 | ||||||||||||||||||||||||
| Gap, Inc. |
101,600 | 904,240 | 0 | 0 | 0 | 0 | 101,600 | 904,240 | ||||||||||||||||||||||||
| Lowe’s Companies, Inc. |
807,647 | 105,276,786 | 0 | 0 | 40,818 | 5,320,626 | 848,465 | 110,597,412 | ||||||||||||||||||||||||
| Murphy U.S.A., Inc. |
0 | 0 | 0 | 0 | 52,406 | 6,084,337 | (a) | 52,406 | 6,084,337 | (a) | ||||||||||||||||||||||
| O’Reilly Automotive, Inc. |
212,364 | 88,606,755 | (a) | 0 | 0 | 0 | 0 | 212,364 | 88,606,755 | (a) | ||||||||||||||||||||||
| Office Depot, Inc. |
40,900 | 101,023 | 0 | 0 | 579,800 | 1,432,106 | 620,700 | 1,533,129 | ||||||||||||||||||||||||
| Penske Automotive Group, Inc. |
60,300 | 2,156,328 | 0 | 0 | 177,500 | 6,347,400 | 237,800 | 8,503,728 | ||||||||||||||||||||||||
| Ross Stores, Inc. |
341,829 | 33,143,740 | 0 | 0 | 0 | 0 | 341,829 | 33,143,740 | ||||||||||||||||||||||||
| Sleep Number Corp. |
40,400 | 1,259,268 | (a) | 0 | 0 | 162,100 | 5,052,657 | (a) | 202,500 | 6,311,925 | (a) | |||||||||||||||||||||
| The Home Depot, Inc. |
746,813 | 185,568,094 | 280,470 | 69,691,186 | 33,557 | 8,338,243 | 1,060,840 | 263,597,523 | ||||||||||||||||||||||||
| TJX Companies, Inc. |
1,080,454 | 57,004,753 | 0 | 0 | 99,969 | 5,274,364 | 1,180,423 | 62,279,117 | ||||||||||||||||||||||||
| Ulta Beauty, Inc. |
172,471 | 42,084,649 | (a) | 32,126 | 7,839,065 | (a) | 0 | 0 | 204,597 | 49,923,714 | (a) | |||||||||||||||||||||
| Williams-Sonoma, Inc. |
9,300 | 773,853 | 0 | 0 | 71,848 | 5,978,472 | 81,148 | 6,752,325 | ||||||||||||||||||||||||
|
|
|
|
|
|
|
|
|
|||||||||||||||||||||||||
| 605,160,125 | 120,366,146 | 145,202,579 | 870,728,850 | |||||||||||||||||||||||||||||
|
|
|
|
|
|
|
|
|
|||||||||||||||||||||||||
| Textiles, Apparel & Luxury Goods |
||||||||||||||||||||||||||||||||
| Carter’s, Inc. |
0 | 0 | 0 | 0 | 111,600 | 9,587,556 | 111,600 | 9,587,556 | ||||||||||||||||||||||||
| Columbia Sportswear Co. |
69,400 | 5,070,364 | 0 | 0 | 102,847 | 7,514,002 | 172,247 | 12,584,366 | ||||||||||||||||||||||||
| Hanesbrands, Inc. |
45,523 | 448,857 | 0 | 0 | 0 | 0 | 45,523 | 448,857 | ||||||||||||||||||||||||
| NIKE, Inc. Class B |
721,675 | 71,142,722 | 0 | 0 | 0 | 0 | 721,675 | 71,142,722 | ||||||||||||||||||||||||
| Ralph Lauren Corp. |
33,008 | 2,492,434 | 0 | 0 | 98,129 | 7,409,721 | 131,137 | 9,902,155 | ||||||||||||||||||||||||
| Skechers U.S.A., Inc. Class A (sub. vtg.) |
16,000 | 501,120 | (a) | 0 | 0 | 55,200 | 1,728,864 | (a) | 71,200 | 2,229,984 | (a) | |||||||||||||||||||||
| Tapestry, Inc. |
339,000 | 4,610,400 | 0 | 0 | 137,087 | 1,864,383 | 476,087 | 6,474,783 | ||||||||||||||||||||||||
| VF Corp. |
178,600 | 10,019,460 | 0 | 0 | 0 | 0 | 178,600 | 10,019,460 | ||||||||||||||||||||||||
|
|
|
|
|
|
|
|
|
|||||||||||||||||||||||||
| 94,285,357 | 0 | 28,104,526 | 122,389,883 | |||||||||||||||||||||||||||||
|
|
|
|
|
|
|
|
|
|||||||||||||||||||||||||
| TOTAL CONSUMER DISCRETIONARY |
2,353,728,443 | 715,836,614 | 519,420,197 | 3,588,985,254 | ||||||||||||||||||||||||||||
|
|
|
|
|
|
|
|
|
|||||||||||||||||||||||||
| CONSUMER STAPLES |
||||||||||||||||||||||||||||||||
| Beverages |
||||||||||||||||||||||||||||||||
| Anheuser-Busch InBev SA NV ADR |
33,800 | 1,584,544 | (e) | 193,048 | 9,050,090 | 0 | 0 | 226,848 | 10,634,634 | (e) | ||||||||||||||||||||||
| Coca-Cola European Partners PLC |
0 | 0 | 0 | 0 | 73,126 | 2,756,850 | 73,126 | 2,756,850 | ||||||||||||||||||||||||
| Constellation Brands, Inc. Class A (sub. vtg.) |
314,062 | 54,238,507 | 0 | 0 | 0 | 0 | 314,062 | 54,238,507 | ||||||||||||||||||||||||
| Diageo PLC sponsored ADR |
22,400 | 3,149,664 | 0 | 0 | 0 | 0 | 22,400 | 3,149,664 | ||||||||||||||||||||||||
| Keurig Dr. Pepper, Inc. |
868,030 | 24,235,398 | 347,694 | 9,707,616 | 180,734 | 5,046,093 | 1,396,458 | 38,989,107 | ||||||||||||||||||||||||
| Molson Coors Beverage Co. Class B |
94,200 | 3,575,832 | 0 | 0 | 443,782 | 16,845,965 | 537,982 | 20,421,797 | ||||||||||||||||||||||||
| Monster Beverage Corp. |
661,840 | 47,592,914 | (a) | 999,566 | 71,878,791 | (a) | 0 | 0 | 1,661,406 | 119,471,705 | (a) | |||||||||||||||||||||
| PepsiCo, Inc. |
598,296 | 78,705,839 | 0 | 0 | 0 | 0 | 598,296 | 78,705,839 | ||||||||||||||||||||||||
| The Coca-Cola Co. |
2,129,902 | 99,423,825 | 251,746 | 11,751,503 | 226,000 | 10,549,680 | 2,607,648 | 121,725,008 | ||||||||||||||||||||||||
|
|
|
|
|
|
|
|
|
|||||||||||||||||||||||||
| 312,506,523 | 102,388,000 | 35,198,588 | 450,093,111 | |||||||||||||||||||||||||||||
|
|
|
|
|
|
|
|
|
|||||||||||||||||||||||||
| Food & Staples Retailing |
||||||||||||||||||||||||||||||||
| Costco Wholesale Corp. |
247,519 | 76,352,186 | 185,181 | 57,122,783 | 0 | 0 | 432,700 | 133,474,969 | ||||||||||||||||||||||||
| Kroger Co. |
259,450 | 8,463,259 | 0 | 0 | 1,361,702 | 44,418,719 | 1,621,152 | 52,881,978 | ||||||||||||||||||||||||
| Performance Food Group Co. |
51,400 | 1,369,810 | (a) | 0 | 0 | 0 | 0 | 51,400 | 1,369,810 | (a) | ||||||||||||||||||||||
| Sprouts Farmers Market LLC |
54,280 | 1,364,056 | (a) | 407,600 | 10,242,988 | (a) | 0 | 0 | 461,880 | 11,607,044 | (a) | |||||||||||||||||||||
| Sysco Corp. |
424,273 | 23,402,899 | 0 | 0 | 139,475 | 7,693,441 | 563,748 | 31,096,340 | ||||||||||||||||||||||||
| Walgreens Boots Alliance, Inc. |
287,000 | 12,323,780 | 0 | 0 | 1,446,467 | 62,111,293 | 1,733,467 | 74,435,073 | ||||||||||||||||||||||||
| Walmart, Inc. |
628,360 | 77,954,342 | (i) | 208,574 | 25,875,690 | 0 | 0 | 836,934 | 103,830,032 | (i) | ||||||||||||||||||||||
|
|
|
|
|
|
|
|
|
|||||||||||||||||||||||||
| 201,230,332 | 93,241,461 | 114,223,453 | 408,695,246 | |||||||||||||||||||||||||||||
|
|
|
|
|
|
|
|
|
|||||||||||||||||||||||||
| Food Products |
||||||||||||||||||||||||||||||||
| Archer Daniels Midland Co. |
66,700 | 2,621,977 | 0 | 0 | 229,500 | 9,021,645 | 296,200 | 11,643,622 |
Table of Contents
| Campbell Soup Co. |
45,855 | 2,337,688 | 343,600 | 17,516,728 | 0 | 0 | 389,455 | 19,854,416 | ||||||||||||||||||||||||
| Conagra Brands, Inc. |
1,652,317 | 57,484,108 | 0 | 0 | 719,100 | 25,017,489 | 2,371,417 | 82,501,597 | ||||||||||||||||||||||||
| General Mills, Inc. |
30,927 | 1,949,638 | 0 | 0 | 0 | 0 | 30,927 | 1,949,638 | ||||||||||||||||||||||||
| Ingredion, Inc. |
43,100 | 3,630,313 | 0 | 0 | 201,900 | 17,006,037 | 245,000 | 20,636,350 | ||||||||||||||||||||||||
| Kellogg Co. |
40,800 | 2,664,648 | 0 | 0 | 140,559 | 9,179,908 | 181,359 | 11,844,556 | ||||||||||||||||||||||||
| Mondelez International, Inc. |
1,297,883 | 67,645,662 | 0 | 0 | 0 | 0 | 1,297,883 | 67,645,662 | ||||||||||||||||||||||||
| Pilgrim’s Pride Corp. |
119,600 | 2,472,132 | (a) | 0 | 0 | 270,400 | 5,589,168 | (a) | 390,000 | 8,061,300 | (a) | |||||||||||||||||||||
| Post Holdings, Inc. |
91,900 | 8,000,814 | (a) | 0 | 0 | 101,652 | 8,849,823 | (a) | 193,552 | 16,850,637 | (a) | |||||||||||||||||||||
| The a2 Milk Co. Ltd. |
187,816 | 2,217,093 | 0 | 0 | 0 | 0 | 187,816 | 2,217,093 | ||||||||||||||||||||||||
| The Hershey Co. |
25,867 | 3,509,635 | 0 | 0 | 0 | 0 | 25,867 | 3,509,635 | ||||||||||||||||||||||||
| The J.M. Smucker Co. |
63,570 | 7,242,530 | 0 | 0 | 286,945 | 32,691,644 | 350,515 | 39,934,174 | ||||||||||||||||||||||||
| The Kraft Heinz Co. |
141,300 | 4,305,411 | 0 | 0 | 1,029,600 | 31,371,912 | 1,170,900 | 35,677,323 | ||||||||||||||||||||||||
| Tyson Foods, Inc. Class A |
508,330 | 31,231,795 | 0 | 0 | 519,012 | 31,888,097 | 1,027,342 | 63,119,892 | ||||||||||||||||||||||||
|
|
|
|
|
|
|
|
|
|||||||||||||||||||||||||
| 197,313,444 | 17,516,728 | 170,615,723 | 385,445,895 | |||||||||||||||||||||||||||||
|
|
|
|
|
|
|
|
|
|||||||||||||||||||||||||
| Household Products |
||||||||||||||||||||||||||||||||
| Church & Dwight Co., Inc. |
197,448 | 14,822,421 | 0 | 0 | 0 | 0 | 197,448 | 14,822,421 | ||||||||||||||||||||||||
| Colgate-Palmolive Co. |
110,872 | 8,019,372 | 357,712 | 25,873,309 | 0 | 0 | 468,584 | 33,892,681 | ||||||||||||||||||||||||
| Energizer Holdings, Inc. |
3,100 | 136,028 | 0 | 0 | 199,467 | 8,752,612 | (e) | 202,567 | 8,888,640 | (e) | ||||||||||||||||||||||
| Kimberly-Clark Corp. |
233,025 | 32,959,056 | 0 | 0 | 45,303 | 6,407,656 | 278,328 | 39,366,712 | ||||||||||||||||||||||||
| Procter & Gamble Co. |
3,832,003 | 444,205,788 | 150,160 | 17,406,547 | 140,058 | 16,235,523 | 4,122,221 | 477,847,858 | ||||||||||||||||||||||||
| Reckitt Benckiser Group PLC |
53,326 | 4,776,226 | 0 | 0 | 0 | 0 | 53,326 | 4,776,226 | ||||||||||||||||||||||||
| Spectrum Brands Holdings, Inc. |
13,800 | 653,016 | 0 | 0 | 0 | 0 | 13,800 | 653,016 | ||||||||||||||||||||||||
|
|
|
|
|
|
|
|
|
|||||||||||||||||||||||||
| 505,571,907 | 43,279,856 | 31,395,791 | 580,247,554 | |||||||||||||||||||||||||||||
|
|
|
|
|
|
|
|
|
|||||||||||||||||||||||||
| Personal Products |
||||||||||||||||||||||||||||||||
| Coty, Inc. Class A |
0 | 0 | 0 | 0 | 617,960 | 2,243,195 | 617,960 | 2,243,195 | ||||||||||||||||||||||||
| Estee Lauder Companies, Inc. Class A |
90,092 | 17,790,467 | 0 | 0 | 0 | 0 | 90,092 | 17,790,467 | ||||||||||||||||||||||||
| Unilever NV |
25,800 | 1,333,290 | 0 | 0 | 0 | 0 | 25,800 | 1,333,290 | ||||||||||||||||||||||||
|
|
|
|
|
|
|
|
|
|||||||||||||||||||||||||
| 19,123,757 | 0 | 2,243,195 | 21,366,952 | |||||||||||||||||||||||||||||
|
|
|
|
|
|
|
|
|
|||||||||||||||||||||||||
| Tobacco |
||||||||||||||||||||||||||||||||
| Altria Group, Inc. |
3,185,200 | 124,382,060 | 0 | 0 | 0 | 0 | 3,185,200 | 124,382,060 | ||||||||||||||||||||||||
| British American Tobacco PLC sponsored ADR |
241,800 | 9,691,344 | 0 | 0 | 0 | 0 | 241,800 | 9,691,344 | ||||||||||||||||||||||||
| Philip Morris International, Inc. |
869,405 | 63,779,551 | 0 | 0 | 641,349 | 47,049,363 | 1,510,754 | 110,828,914 | ||||||||||||||||||||||||
|
|
|
|
|
|
|
|
|
|||||||||||||||||||||||||
| 197,852,955 | 0 | 47,049,363 | 244,902,318 | |||||||||||||||||||||||||||||
|
|
|
|
|
|
|
|
|
|||||||||||||||||||||||||
| TOTAL CONSUMER STAPLES |
1,433,598,918 | 256,426,045 | 400,726,113 | 2,090,751,076 | ||||||||||||||||||||||||||||
|
|
|
|
|
|
|
|
|
|||||||||||||||||||||||||
| ENERGY |
||||||||||||||||||||||||||||||||
| Energy Equipment & Services |
||||||||||||||||||||||||||||||||
| Baker Hughes Co. Class A |
221,797 | 3,661,868 | 0 | 0 | 0 | 221,797 | 3,661,868 | |||||||||||||||||||||||||
| Halliburton Co. |
1,445,700 | 16,986,975 | 0 | 0 | 0 | 1,445,700 | 16,986,975 | |||||||||||||||||||||||||
| Helmerich & Payne, Inc. |
39,991 | 805,019 | 0 | 0 | 0 | 39,991 | 805,019 | |||||||||||||||||||||||||
| Oceaneering International, Inc. |
219,767 | 1,410,904 | (a) | 0 | 0 | 0 | 219,767 | 1,410,904 | (a) | |||||||||||||||||||||||
| SBM Offshore NV |
75,400 | 1,028,646 | 0 | 0 | 0 | 75,400 | 1,028,646 | |||||||||||||||||||||||||
| Schlumberger Ltd. |
298,588 | 5,514,920 | 642,014 | 11,857,999 | 0 | 0 | 940,602 | 17,372,919 | ||||||||||||||||||||||||
| Subsea 7 SA |
343,200 | 1,970,070 | 0 | 0 | 0 | 0 | 343,200 | 1,970,070 | ||||||||||||||||||||||||
| TechnipFMC PLC |
231,067 | 1,709,896 | 0 | 0 | 0 | 0 | 231,067 | 1,709,896 | ||||||||||||||||||||||||
|
|
|
|
|
|
|
|
|
|||||||||||||||||||||||||
| 33,088,298 | 11,857,999 | 0 | 0 | 44,946,297 | ||||||||||||||||||||||||||||
|
|
|
|
|
|
|
|
|
|||||||||||||||||||||||||
| Oil, Gas & Consumable Fuels |
||||||||||||||||||||||||||||||||
| Africa Oil Corp. |
527,000 | 405,723 | (a)(e) | 0 | 0 | 0 | 0 | 527,000 | 405,723 | (a)(e) | ||||||||||||||||||||||
| Aker Bp ASA |
34,300 | 550,981 | 0 | 0 | 0 | 0 | 34,300 | 550,981 | ||||||||||||||||||||||||
| Apache Corp. |
257,200 | 2,775,188 | 0 | 0 | 0 | 0 | 257,200 | 2,775,188 | ||||||||||||||||||||||||
| Cabot Oil & Gas Corp. |
77,602 | 1,539,624 | 0 | 0 | 967,479 | 19,194,783 | 1,045,081 | 20,734,407 | ||||||||||||||||||||||||
| Canadian Natural Resources Ltd. |
199,000 | 3,635,000 | 0 | 0 | 0 | 0 | 199,000 | 3,635,000 | ||||||||||||||||||||||||
| Cenovus Energy, Inc. (Canada) |
2,292,800 | 9,991,502 | 0 | 0 | 0 | 0 | 2,292,800 | 9,991,502 | ||||||||||||||||||||||||
| Cheniere Energy, Inc. |
22,700 | 1,006,745 | (a) | 0 | 0 | 0 | 0 | 22,700 | 1,006,745 | (a) | ||||||||||||||||||||||
| Chevron Corp. |
1,570,423 | 144,007,789 | 0 | 0 | 970,346 | 88,980,728 | 2,540,769 | 232,988,517 | ||||||||||||||||||||||||
| Concho Resources, Inc. |
183,800 | 10,020,776 | 0 | 0 | 71,600 | 3,903,632 | 255,400 | 13,924,408 | ||||||||||||||||||||||||
| ConocoPhillips Co. |
2,165,829 | 91,354,667 | 0 | 0 | 1,253,168 | 52,858,626 | 3,418,997 | 144,213,293 | ||||||||||||||||||||||||
| Diamondback Energy, Inc. |
398,396 | 16,963,702 | 0 | 0 | 80,461 | 3,426,029 | 478,857 | 20,389,731 | ||||||||||||||||||||||||
| Enbridge, Inc. |
605,204 | 19,638,870 | 0 | 0 | 0 | 0 | 605,204 | 19,638,870 | ||||||||||||||||||||||||
| EOG Resources, Inc. |
1,361,834 | 69,412,679 | 0 | 0 | 0 | 0 | 1,361,834 | 69,412,679 | ||||||||||||||||||||||||
| EQT Corp. |
0 | 0 | 0 | 0 | 369,163 | 4,924,634 | 369,163 | 4,924,634 | ||||||||||||||||||||||||
| Equinor ASA sponsored ADR |
1,094,700 | 15,971,673 | 0 | 0 | 0 | 0 | 1,094,700 | 15,971,673 | ||||||||||||||||||||||||
| Equitrans Midstream Corp. |
0 | 0 | 0 | 0 | 621,671 | 5,029,318 | (e) | 621,671 | 5,029,318 | (e) | ||||||||||||||||||||||
| Exxon Mobil Corp. |
1,716,208 | 78,035,978 | 0 | 0 | 0 | 0 | 1,716,208 | 78,035,978 | ||||||||||||||||||||||||
| Galp Energia SGPS SA Class B |
160,000 | 1,903,711 | 0 | 0 | 0 | 0 | 160,000 | 1,903,711 | ||||||||||||||||||||||||
| Gibson Energy, Inc. |
26,100 | 403,769 | 0 | 0 | 0 | 0 | 26,100 | 403,769 | ||||||||||||||||||||||||
| Gulfport Energy Corp. |
0 | 0 | 0 | 0 | 1,106,553 | 1,670,895 | (a) | 1,106,553 | 1,670,895 | (a) | ||||||||||||||||||||||
| Hess Corp. |
737,600 | 35,013,872 | 0 | 0 | 0 | 0 | 737,600 | 35,013,872 |
Table of Contents
| HollyFrontier Corp. |
96,612 | 3,038,447 | 0 | 0 | 0 | 0 | 96,612 | 3,038,447 | ||||||||||||||||||||||||
| Kinder Morgan, Inc. |
261,500 | 4,131,700 | 0 | 0 | 1,456,406 | 23,011,215 | 1,717,906 | 27,142,915 | ||||||||||||||||||||||||
| Kosmos Energy Ltd. |
701,900 | 1,277,458 | 0 | 0 | 0 | 0 | 701,900 | 1,277,458 | ||||||||||||||||||||||||
| Magellan Midstream Partners LP |
332,108 | 15,057,777 | 0 | 0 | 0 | 0 | 332,108 | 15,057,777 | ||||||||||||||||||||||||
| Marathon Petroleum Corp. |
398,866 | 14,016,151 | 0 | 0 | 726,489 | 25,528,823 | 1,125,355 | 39,544,974 | ||||||||||||||||||||||||
| MEG Energy Corp. |
512,500 | 1,191,125 | (a) | 0 | 0 | 0 | 0 | 512,500 | 1,191,125 | (a) | ||||||||||||||||||||||
| Noble Energy, Inc. |
33,804 | 295,109 | 0 | 0 | 0 | 0 | 33,804 | 295,109 | ||||||||||||||||||||||||
| Occidental Petroleum Corp. |
28,319 | 366,731 | 0 | 0 | 0 | 0 | 28,319 | 366,731 | ||||||||||||||||||||||||
| PBF Energy, Inc. Class A |
124,900 | 1,326,438 | 0 | 0 | 522,862 | 5,552,794 | 647,762 | 6,879,232 | ||||||||||||||||||||||||
| Phillips 66 Co. |
276,353 | 21,627,386 | 0 | 0 | 789,048 | 61,750,896 | 1,065,401 | 83,378,282 | ||||||||||||||||||||||||
| Pioneer Natural Resources Co. |
315,529 | 28,902,456 | 0 | 0 | 106,000 | 9,709,600 | 421,529 | 38,612,056 | ||||||||||||||||||||||||
| Royal Dutch Shell PLC Class A sponsored ADR |
0 | 0 | 0 | 0 | 85,724 | 2,738,882 | (e) | 85,724 | 2,738,882 | (e) | ||||||||||||||||||||||
| Shell Midstream Partners LP |
45,900 | 619,191 | (e) | 0 | 0 | 0 | 0 | 45,900 | 619,191 | (e) | ||||||||||||||||||||||
| Suncor Energy, Inc. |
710,975 | 12,171,892 | 0 | 0 | 0 | 0 | 710,975 | 12,171,892 | ||||||||||||||||||||||||
| Targa Resources Corp. |
214,300 | 3,833,827 | 0 | 0 | 0 | 0 | 214,300 | 3,833,827 | ||||||||||||||||||||||||
| TC Energy Corp. |
70,250 | 3,161,953 | 0 | 0 | 0 | 0 | 70,250 | 3,161,953 | ||||||||||||||||||||||||
| The Williams Companies, Inc. |
88,764 | 1,813,449 | 0 | 0 | 547,161 | 11,178,499 | 635,925 | 12,991,948 | ||||||||||||||||||||||||
| Total SA sponsored ADR |
1,131,644 | 42,527,182 | 0 | 0 | 79,439 | 2,985,318 | 1,211,083 | 45,512,500 | ||||||||||||||||||||||||
| Tourmaline Oil Corp. |
33,400 | 331,853 | 0 | 0 | 0 | 0 | 33,400 | 331,853 | ||||||||||||||||||||||||
| Valero Energy Corp. |
333,813 | 22,245,298 | 0 | 0 | 725,670 | 48,358,649 | 1,059,483 | 70,603,947 | ||||||||||||||||||||||||
|
|
|
|
|
|
|
|
|
|||||||||||||||||||||||||
| 680,567,672 | 0 | 370,803,321 | 1,051,370,993 | |||||||||||||||||||||||||||||
|
|
|
|
|
|
|
|
|
|||||||||||||||||||||||||
| TOTAL ENERGY |
713,655,970 | 11,857,999 | 370,803,321 | 1,096,317,290 | ||||||||||||||||||||||||||||
|
|
|
|
|
|
|
|
|
|||||||||||||||||||||||||
| FINANCIALS |
||||||||||||||||||||||||||||||||
| Banks |
||||||||||||||||||||||||||||||||
| Bank of America Corp. |
6,534,874 | 157,621,161 | 0 | 0 | 8,757,069 | 211,220,504 | 15,291,943 | 368,841,665 | ||||||||||||||||||||||||
| BOK Financial Corp. |
0 | 0 | 0 | 0 | 69,000 | 3,514,860 | 69,000 | 3,514,860 | ||||||||||||||||||||||||
| CIT Group, Inc. |
74,500 | 1,351,430 | 0 | 0 | 251,200 | 4,556,768 | 325,700 | 5,908,198 | ||||||||||||||||||||||||
| Citigroup, Inc. |
2,574,303 | 123,334,857 | 0 | 0 | 2,294,173 | 109,913,828 | 4,868,476 | 233,248,685 | ||||||||||||||||||||||||
| Citizens Financial Group, Inc. |
232,100 | 5,593,610 | 0 | 0 | 1,075,564 | 25,921,092 | 1,307,664 | 31,514,702 | ||||||||||||||||||||||||
| Comerica, Inc. |
91,400 | 3,322,390 | 0 | 0 | 0 | 0 | 91,400 | 3,322,390 | ||||||||||||||||||||||||
| Commerce Bancshares, Inc. |
13,400 | 853,982 | 0 | 0 | 150,161 | 9,569,761 | 163,561 | 10,423,743 | ||||||||||||||||||||||||
| Cullen/Frost Bankers, Inc. |
6,700 | 508,999 | 0 | 0 | 83,768 | 6,363,855 | 90,468 | 6,872,854 | ||||||||||||||||||||||||
| East West Bancorp, Inc. |
15,000 | 524,250 | 0 | 0 | 187,500 | 6,553,125 | 202,500 | 7,077,375 | ||||||||||||||||||||||||
| EFG Eurobank Ergasias SA |
2,844,900 | 1,200,033 | (a) | 0 | 0 | 0 | 0 | 2,844,900 | 1,200,033 | (a) | ||||||||||||||||||||||
| Fifth Third Bancorp |
2,914,663 | 56,515,316 | 0 | 0 | 1,168,258 | 22,652,523 | 4,082,921 | 79,167,839 | ||||||||||||||||||||||||
| First Horizon National Corp. |
421,100 | 3,937,285 | 0 | 0 | 0 | 0 | 421,100 | 3,937,285 | ||||||||||||||||||||||||
| First Republic Bank |
155,355 | 16,804,750 | 0 | 0 | 44,589 | 4,823,192 | 199,944 | 21,627,942 | ||||||||||||||||||||||||
| Huntington Bancshares, Inc. |
390,200 | 3,468,878 | 0 | 0 | 878,237 | 7,807,527 | 1,268,437 | 11,276,405 | ||||||||||||||||||||||||
| JPMorgan Chase & Co. |
2,863,390 | 278,636,481 | 0 | 0 | 2,267,594 | 220,659,572 | 5,130,984 | 499,296,053 | ||||||||||||||||||||||||
| KeyCorp |
2,187,568 | 25,922,681 | 0 | 0 | 1,651,496 | 19,570,228 | 3,839,064 | 45,492,909 | ||||||||||||||||||||||||
| M&T Bank Corp. |
81,477 | 8,608,860 | 0 | 0 | 164,300 | 17,359,938 | 245,777 | 25,968,798 | ||||||||||||||||||||||||
| Mitsubishi UFJ Financial Group, Inc. sponsored ADR |
0 | 0 | 0 | 0 | 990,000 | 4,128,300 | 990,000 | 4,128,300 | ||||||||||||||||||||||||
| PNC Financial Services Group, Inc. |
1,346,516 | 153,556,685 | 0 | 0 | 477,423 | 54,445,319 | 1,823,939 | 208,002,004 | ||||||||||||||||||||||||
| Regions Financial Corp. |
764,600 | 8,647,626 | 0 | 0 | 2,571,460 | 29,083,213 | 3,336,060 | 37,730,839 | ||||||||||||||||||||||||
| Signature Bank |
25,600 | 2,634,496 | 0 | 0 | 21,465 | 2,208,963 | 47,065 | 4,843,459 | ||||||||||||||||||||||||
| Societe Generale Series A |
44,700 | 661,240 | 0 | 0 | 0 | 0 | 44,700 | 661,240 | ||||||||||||||||||||||||
| SVB Financial Group |
132,037 | 28,354,946 | (a) | 0 | 0 | 21,300 | 4,574,175 | (a) | 153,337 | 32,929,121 | (a) | |||||||||||||||||||||
| Synovus Financial Corp. |
57,300 | 1,099,587 | 0 | 0 | 0 | 0 | 57,300 | 1,099,587 | ||||||||||||||||||||||||
| Truist Financial Corp. |
513,399 | 18,882,815 | 0 | 0 | 801,355 | 29,473,837 | 1,314,754 | 48,356,652 | ||||||||||||||||||||||||
| U.S. Bancorp |
638,310 | 22,698,304 | 0 | 0 | 899,631 | 31,990,878 | 1,537,941 | 54,689,182 | ||||||||||||||||||||||||
| Wells Fargo & Co. |
4,460,844 | 118,078,541 | 0 | 0 | 889,020 | 23,532,359 | 5,349,864 | 141,610,900 | ||||||||||||||||||||||||
| Zions Bancorp NA |
20,400 | 671,262 | 0 | 0 | 70,161 | 2,308,648 | 90,561 | 2,979,910 | ||||||||||||||||||||||||
|
|
|
|
|
|
|
|
|
|||||||||||||||||||||||||
| 1,043,490,465 | 0 | 852,232,465 | 1,895,722,930 | |||||||||||||||||||||||||||||
|
|
|
|
|
|
|
|
|
|||||||||||||||||||||||||
| Capital Markets |
||||||||||||||||||||||||||||||||
| Ameriprise Financial, Inc. |
104,240 | 14,600,897 | 0 | 0 | 422,573 | 59,189,800 | 526,813 | 73,790,697 | ||||||||||||||||||||||||
| Bank of New York Mellon Corp. |
550,230 | 20,452,049 | 168,100 | 6,248,277 | 379,625 | 14,110,661 | 1,097,955 | 40,810,987 | ||||||||||||||||||||||||
| BlackRock, Inc. Class A |
110,897 | 58,624,590 | 0 | 0 | 63,977 | 33,820,801 | 174,874 | 92,445,391 | ||||||||||||||||||||||||
| Cboe Global Markets, Inc. |
96,953 | 10,321,616 | 0 | 0 | 0 | 0 | 96,953 | 10,321,616 | ||||||||||||||||||||||||
| Charles Schwab Corp. |
1,898,340 | 68,169,389 | 288,291 | 10,352,530 | 867,520 | 31,152,643 | 3,054,151 | 109,674,562 | ||||||||||||||||||||||||
| CME Group, Inc. |
161,700 | 29,526,420 | 0 | 0 | 0 | 0 | 161,700 | 29,526,420 | ||||||||||||||||||||||||
| E*TRADE Financial Corp. |
451,104 | 20,543,276 | 0 | 0 | 0 | 0 | 451,104 | 20,543,276 | ||||||||||||||||||||||||
| Eaton Vance Corp. (non-vtg.) |
13,300 | 479,465 | 0 | 0 | 45,900 | 1,654,695 | 59,200 | 2,134,160 | ||||||||||||||||||||||||
| FactSet Research Systems, Inc. |
0 | 0 | 91,298 | 28,075,048 | 91,298 | 28,075,048 | ||||||||||||||||||||||||||
| Goldman Sachs Group, Inc. |
621,159 | 122,051,532 | 41,900 | 8,232,931 | 240,734 | 47,301,824 | 903,793 | 177,586,287 | ||||||||||||||||||||||||
| Intercontinental Exchange, Inc. |
677,062 | 65,844,280 | 0 | 0 | 0 | 0 | 677,062 | 65,844,280 | ||||||||||||||||||||||||
| Invesco Ltd. |
0 | 0 | 0 | 0 | 251,820 | 2,007,005 | 251,820 | 2,007,005 | ||||||||||||||||||||||||
| KKR & Co. LP |
427,500 | 11,863,125 | 0 | 0 | 0 | 0 | 427,500 | 11,863,125 | ||||||||||||||||||||||||
| Legg Mason, Inc. |
4,600 | 229,218 | 0 | 0 | 0 | 0 | 4,600 | 229,218 | ||||||||||||||||||||||||
| LPL Financial |
9,700 | 692,483 | 0 | 0 | 33,335 | 2,379,786 | 43,035 | 3,072,269 | ||||||||||||||||||||||||
| MarketAxess Holdings, Inc. |
13,523 | 6,877,663 | 0 | 0 | 0 | 0 | 13,523 | 6,877,663 |
Table of Contents
| Moody’s Corp. |
11,008 | 2,943,649 | 0 | 0 | 0 | 0 | 11,008 | 2,943,649 | ||||||||||||||||||||||||
| Morgan Stanley |
1,906,104 | 84,249,797 | 0 | 0 | 1,546,056 | 68,335,675 | 3,452,160 | 152,585,472 | ||||||||||||||||||||||||
| MSCI, Inc. |
3,187 | 1,048,045 | 0 | 0 | 0 | 0 | 3,187 | 1,048,045 | ||||||||||||||||||||||||
| Northern Trust Corp. |
199,700 | 15,778,297 | 0 | 0 | 173,848 | 13,735,730 | 373,548 | 29,514,027 | ||||||||||||||||||||||||
| Raymond James Financial, Inc. |
167,400 | 11,597,472 | 0 | 0 | 57,222 | 3,964,340 | 224,622 | 15,561,812 | ||||||||||||||||||||||||
| S&P Global, Inc. |
42,336 | 13,760,047 | 0 | 0 | 0 | 0 | 42,336 | 13,760,047 | ||||||||||||||||||||||||
| SEI Investments Co. |
17,300 | 938,006 | 511,053 | 27,709,294 | 59,652 | 3,234,331 | 588,005 | 31,881,631 | ||||||||||||||||||||||||
| State Street Corp. |
474,547 | 28,928,385 | 0 | 0 | 536,900 | 32,729,424 | 1,011,447 | 61,657,809 | ||||||||||||||||||||||||
| T. Rowe Price Group, Inc. |
100,407 | 12,139,206 | 0 | 0 | 206,875 | 25,011,188 | 307,282 | 37,150,394 | ||||||||||||||||||||||||
| TD Ameritrade Holding Corp. |
511,600 | 19,067,332 | 0 | 0 | 0 | 0 | 511,600 | 19,067,332 | ||||||||||||||||||||||||
| Tradeweb Markets, Inc. Class A |
180,762 | 11,923,062 | 0 | 0 | 0 | 0 | 180,762 | 11,923,062 | ||||||||||||||||||||||||
| Virtu Financial, Inc. Class A |
251,570 | 5,999,945 | 0 | 0 | 0 | 0 | 251,570 | 5,999,945 | ||||||||||||||||||||||||
|
|
|
|
|
|
|
|
|
|||||||||||||||||||||||||
| 638,649,246 | 80,618,080 | 338,627,903 | 1,057,895,229 | |||||||||||||||||||||||||||||
|
|
|
|
|
|
|
|
|
|||||||||||||||||||||||||
| Consumer Finance |
||||||||||||||||||||||||||||||||
| 360 Finance, Inc. ADR |
74,100 | 744,705 | (a) | 0 | 0 | 0 | 0 | 74,100 | 744,705 | (a) | ||||||||||||||||||||||
| Ally Financial, Inc. |
932,600 | 16,264,544 | 0 | 0 | 0 | 0 | 932,600 | 16,264,544 | ||||||||||||||||||||||||
| American Express Co. |
349,021 | 33,181,426 | 164,812 | 15,668,677 | 447,325 | 42,527,188 | 961,158 | 91,377,291 | ||||||||||||||||||||||||
| Capital One Financial Corp. |
1,357,345 | 92,353,754 | 0 | 0 | 841,856 | 57,279,882 | 2,199,201 | 149,633,636 | ||||||||||||||||||||||||
| Credit Acceptance Corp. |
2,300 | 850,586 | (a)(e) | 0 | 0 | 7,787 | 2,879,788 | (a)(e) | 10,087 | 3,730,374 | (a)(e) | |||||||||||||||||||||
| Discover Financial Services |
371,399 | 17,645,166 | 0 | 0 | 340,900 | 16,196,159 | 712,299 | 33,841,325 | ||||||||||||||||||||||||
| Encore Capital Group, Inc. |
2,500 | 79,425 | (a) | 0 | 0 | 0 | 0 | 2,500 | 79,425 | (a) | ||||||||||||||||||||||
| Navient Corp. |
115,400 | 858,576 | 0 | 0 | 619,200 | 4,606,848 | 734,600 | 5,465,424 | ||||||||||||||||||||||||
| OneMain Holdings, Inc. |
344,100 | 8,027,853 | 0 | 0 | 0 | 0 | 344,100 | 8,027,853 | ||||||||||||||||||||||||
| Shriram Transport Finance Co. Ltd. |
167,300 | 1,266,395 | 0 | 0 | 0 | 0 | 167,300 | 1,266,395 | ||||||||||||||||||||||||
| SLM Corp. |
434,992 | 3,297,239 | 0 | 0 | 0 | 0 | 434,992 | 3,297,239 | ||||||||||||||||||||||||
| Synchrony Financial |
50,467 | 1,028,013 | 0 | 0 | 0 | 0 | 50,467 | 1,028,013 | ||||||||||||||||||||||||
|
|
|
|
|
|
|
|
|
|||||||||||||||||||||||||
| 175,597,682 | 15,668,677 | 123,489,865 | 314,756,224 | |||||||||||||||||||||||||||||
|
|
|
|
|
|
|
|
|
|||||||||||||||||||||||||
| Diversified Financial Services |
||||||||||||||||||||||||||||||||
| AXA Equitable Holdings, Inc. |
2,586,699 | 49,431,818 | 0 | 0 | 191,800 | 3,665,298 | 2,778,499 | 53,097,116 | ||||||||||||||||||||||||
| Berkshire Hathaway, Inc.: |
0 | 0 | ||||||||||||||||||||||||||||||
| Class A |
1 | 278,640 | (a) | 0 | 0 | 0 | 0 | 1 | 278,640 | (a) | ||||||||||||||||||||||
| Class B |
1,063,646 | 197,391,425 | (a) | 0 | 0 | 257,510 | 47,788,706 | 1,321,156 | 245,180,131 | (a) | ||||||||||||||||||||||
| Jefferies Financial Group, Inc. |
36,000 | 527,400 | 0 | 0 | 123,918 | 1,815,399 | 159,918 | 2,342,799 | ||||||||||||||||||||||||
| Voya Financial, Inc. |
263,900 | 11,888,695 | 0 | 0 | 61,007 | 2,748,365 | 324,907 | 14,637,060 | ||||||||||||||||||||||||
|
|
|
|
|
|
|
|
|
|||||||||||||||||||||||||
| 259,517,978 | 0 | 0 | 56,017,768 | 315,535,746 | ||||||||||||||||||||||||||||
|
|
|
|
|
|
|
|
|
|||||||||||||||||||||||||
| Insurance |
||||||||||||||||||||||||||||||||
| AFLAC, Inc. |
310,901 | 11,338,559 | 0 | 0 | 689,732 | 25,154,526 | 1,000,633 | 36,493,085 | ||||||||||||||||||||||||
| Alleghany Corp. |
1,700 | 872,270 | 0 | 0 | 13,855 | 7,109,001 | 15,555 | 7,981,271 | ||||||||||||||||||||||||
| Allstate Corp. |
169,359 | 16,565,004 | 0 | 0 | 487,215 | 47,654,499 | 656,574 | 64,219,503 | ||||||||||||||||||||||||
| American Financial Group, Inc. |
32,900 | 1,981,896 | 0 | 0 | 97,800 | 5,891,472 | 130,700 | 7,873,368 | ||||||||||||||||||||||||
| American International Group, Inc. |
2,104,007 | 63,246,450 | 0 | 0 | 488,609 | 14,687,587 | 2,592,616 | 77,934,037 | ||||||||||||||||||||||||
| Aon PLC |
20,336 | 4,005,175 | 0 | 0 | 0 | 0 | 20,336 | 4,005,175 | ||||||||||||||||||||||||
| Arch Capital Group Ltd. |
48,500 | 1,368,670 | (a) | 0 | 0 | 166,800 | 4,707,096 | (a) | 215,300 | 6,075,766 | (a) | |||||||||||||||||||||
| Arthur J. Gallagher & Co. |
26,138 | 2,464,291 | 0 | 0 | 0 | 0 | 26,138 | 2,464,291 | ||||||||||||||||||||||||
| Assurant, Inc. |
24,169 | 2,479,256 | 0 | 0 | 24,700 | 2,533,726 | 48,869 | 5,012,982 | ||||||||||||||||||||||||
| Assured Guaranty Ltd. |
46,100 | 1,195,373 | 0 | 0 | 196,950 | 5,106,914 | 243,050 | 6,302,287 | ||||||||||||||||||||||||
| Axis Capital Holdings Ltd. |
35,700 | 1,340,178 | 0 | 0 | 161,900 | 6,077,726 | 197,600 | 7,417,904 | ||||||||||||||||||||||||
| Chubb Ltd. |
743,062 | 90,608,980 | 0 | 0 | 421,864 | 51,442,096 | 1,164,926 | 142,051,076 | ||||||||||||||||||||||||
| CNA Financial Corp. |
0 | 0 | 0 | 0 | 37,800 | 1,142,694 | 37,800 | 1,142,694 | ||||||||||||||||||||||||
| Everest Re Group Ltd. |
18,600 | 3,690,426 | 0 | 0 | 106,295 | 21,089,991 | 124,895 | 24,780,417 | ||||||||||||||||||||||||
| Fairfax Financial Holdings Ltd. (sub. vtg.) |
4,900 | 1,361,153 | 0 | 0 | 17,863 | 4,970,558 | 22,763 | 6,331,711 | ||||||||||||||||||||||||
| First American Financial Corp. |
11,800 | 595,782 | 0 | 0 | 40,500 | 2,044,845 | 52,300 | 2,640,627 | ||||||||||||||||||||||||
| FNF Group |
32,900 | 1,049,510 | 0 | 0 | 113,337 | 3,615,450 | 146,237 | 4,664,960 | ||||||||||||||||||||||||
| Globe Life, Inc. |
28,300 | 2,179,666 | 0 | 0 | 97,482 | 7,508,064 | 125,782 | 9,687,730 | ||||||||||||||||||||||||
| Hanover Insurance Group, Inc. |
4,100 | 411,435 | 0 | 0 | 14,200 | 1,424,970 | 18,300 | 1,836,405 | ||||||||||||||||||||||||
| Hartford Financial Services Group, Inc. |
348,270 | 13,335,258 | 0 | 0 | 455,977 | 17,459,359 | 804,247 | 30,794,617 | ||||||||||||||||||||||||
| Lincoln National Corp. |
133,900 | 5,078,827 | 0 | 0 | 531,900 | 20,174,967 | 665,800 | 25,253,794 | ||||||||||||||||||||||||
| Loews Corp. |
35,600 | 1,183,344 | 0 | 0 | 677,640 | 22,524,754 | 713,240 | 23,708,098 | ||||||||||||||||||||||||
| Markel Corp. |
1,680 | 1,507,666 | (a) | 0 | 0 | 5,762 | 5,170,934 | (a) | 7,442 | 6,678,600 | (a) | |||||||||||||||||||||
| Marsh & McLennan Companies, Inc. |
264,954 | 28,063,928 | 0 | 0 | 122,411 | 12,965,773 | 387,365 | 41,029,701 | ||||||||||||||||||||||||
| MetLife, Inc. |
1,234,342 | 44,448,655 | 221,700 | 7,983,417 | 897,616 | 32,323,152 | 2,353,658 | 84,755,224 | ||||||||||||||||||||||||
| Old Republic International Corp. |
25,900 | 403,781 | 0 | 0 | 89,000 | 1,387,510 | 114,900 | 1,791,291 | ||||||||||||||||||||||||
| Progressive Corp. |
961,832 | 74,715,110 | 0 | 0 | 369,961 | 28,738,570 | 1,331,793 | 103,453,680 | ||||||||||||||||||||||||
| Prudential Financial, Inc. |
124,100 | 7,565,136 | 0 | 0 | 420,508 | 25,634,168 | 544,608 | 33,199,304 | ||||||||||||||||||||||||
| Reinsurance Group of America, Inc. |
18,700 | 1,697,025 | 0 | 0 | 44,273 | 4,017,775 | 62,973 | 5,714,800 | ||||||||||||||||||||||||
| RenaissanceRe Holdings Ltd. |
4,600 | 772,156 | 0 | 0 | 16,000 | 2,685,760 | 20,600 | 3,457,916 | ||||||||||||||||||||||||
| The Travelers Companies, Inc. |
247,526 | 26,480,331 | 0 | 0 | 380,861 | 40,744,510 | 628,387 | 67,224,841 | ||||||||||||||||||||||||
| Unum Group |
96,100 | 1,455,915 | 0 | 0 | 383,000 | 5,802,450 | 479,100 | 7,258,365 | ||||||||||||||||||||||||
| W.R. Berkley Corp. |
18,400 | 1,066,280 | 0 | 0 | 63,415 | 3,674,899 | 81,815 | 4,741,179 |
Table of Contents
| Willis Group Holdings PLC |
201,371 | 40,858,176 | 0 | 0 | 0 | 0 | 201,371 | 40,858,176 | ||||||||||||||||||||||||
|
|
|
|
|
|
|
|
|
|||||||||||||||||||||||||
| 455,385,662 | 7,983,417 | 435,465,796 | 898,834,875 | |||||||||||||||||||||||||||||
|
|
|
|
|
|
|
|
|
|||||||||||||||||||||||||
| Mortgage Real Estate Investment Trusts |
||||||||||||||||||||||||||||||||
| Annaly Capital Management, Inc. |
427,600 | 2,634,016 | 0 | 0 | 1,012,900 | 6,239,464 | 1,440,500 | 8,873,480 | ||||||||||||||||||||||||
|
|
|
|
|
|
|
|
|
|||||||||||||||||||||||||
| Thrifts & Mortgage Finance |
||||||||||||||||||||||||||||||||
| MGIC Investment Corp. |
1,267,200 | 10,403,712 | 0 | 0 | 0 | 0 | 1,267,200 | 10,403,712 | ||||||||||||||||||||||||
| New York Community Bancorp, Inc. |
55,900 | 561,795 | 0 | 0 | 192,398 | 1,933,600 | 248,298 | 2,495,395 | ||||||||||||||||||||||||
| Radian Group, Inc. |
133,900 | 2,126,332 | 0 | 0 | 448,300 | 7,119,004 | 582,200 | 9,245,336 | ||||||||||||||||||||||||
|
|
|
|
|
|
|
|
|
|||||||||||||||||||||||||
| 13,091,839 | 0 | 9,052,604 | 22,144,443 | |||||||||||||||||||||||||||||
|
|
|
|
|
|
|
|
|
|||||||||||||||||||||||||
| TOTAL FINANCIALS |
2,588,366,888 | 104,270,174 | 1,821,125,865 | 4,513,762,927 | ||||||||||||||||||||||||||||
|
|
|
|
|
|
|
|
|
|||||||||||||||||||||||||
| HEALTH CARE |
||||||||||||||||||||||||||||||||
| Biotechnology |
||||||||||||||||||||||||||||||||
| AbbVie, Inc. |
2,074,408 | 192,235,389 | 302,666 | 28,048,058 | 407,348 | 37,748,939 | 2,784,422 | 258,032,386 | ||||||||||||||||||||||||
| Acceleron Pharma, Inc. |
40,000 | 3,953,200 | (a) | 0 | 0 | 0 | 0 | 40,000 | 3,953,200 | (a) | ||||||||||||||||||||||
| ADC Therapeutics SA |
68,500 | 2,531,075 | (a)(e) | 0 | 0 | 0 | 0 | 68,500 | 2,531,075 | (a)(e) | ||||||||||||||||||||||
| Alexion Pharmaceuticals, Inc. |
427,142 | 51,214,326 | (a) | 142,669 | 17,106,013 | (a) | 293,400 | 35,178,660 | (a) | 863,211 | 103,498,999 | (a) | ||||||||||||||||||||
| Alnylam Pharmaceuticals, Inc. |
40,400 | 5,464,908 | (a) | 0 | 0 | 0 | 0 | 40,400 | 5,464,908 | (a) | ||||||||||||||||||||||
| Amgen, Inc. |
443,037 | 101,765,599 | 236,349 | 54,289,365 | 465,456 | 106,915,243 | 1,144,842 | 262,970,207 | ||||||||||||||||||||||||
| Arcutis Biotherapeutics, Inc. |
50,000 | 1,677,500 | (a)(e) | 0 | 0 | 0 | 0 | 50,000 | 1,677,500 | (a)(e) | ||||||||||||||||||||||
| Argenx SE ADR |
28,000 | 6,140,400 | (a) | 0 | 0 | 0 | 0 | 28,000 | 6,140,400 | (a) | ||||||||||||||||||||||
| Ascendis Pharma A/S sponsored ADR |
44,000 | 6,401,560 | (a) | 0 | 0 | 0 | 0 | 44,000 | 6,401,560 | (a) | ||||||||||||||||||||||
| BELLUS Health, Inc. |
140,000 | 1,468,600 | (a) | 0 | 0 | 0 | 0 | 140,000 | 1,468,600 | (a) | ||||||||||||||||||||||
| Biogen, Inc. |
190,011 | 58,350,478 | (a) | 0 | 0 | 147,600 | 45,326,484 | (a) | 337,611 | 103,676,962 | (a) | |||||||||||||||||||||
| BioMarin Pharmaceutical, Inc. |
0 | 0 | 128,010 | 13,639,466 | (a) | 0 | 0 | 128,010 | 13,639,466 | (a) | ||||||||||||||||||||||
| Crinetics Pharmaceuticals, Inc. |
31,000 | 506,540 | (a)(e) | 0 | 0 | 0 | 0 | 31,000 | 506,540 | (a)(e) | ||||||||||||||||||||||
| Gilead Sciences, Inc. |
384,604 | 29,933,729 | 0 | 0 | 824,868 | 64,199,476 | 1,209,472 | 94,133,205 | ||||||||||||||||||||||||
| Gritstone Oncology, Inc. |
93,400 | 603,364 | (a)(e) | 0 | 0 | 0 | 0 | 93,400 | 603,364 | (a)(e) | ||||||||||||||||||||||
| Heron Therapeutics, Inc. |
13,800 | 251,436 | (a) | 0 | 0 | 0 | 0 | 13,800 | 251,436 | (a) | ||||||||||||||||||||||
| Incyte Corp. |
168,949 | 17,217,593 | (a) | 0 | 0 | 0 | 0 | 168,949 | 17,217,593 | (a) | ||||||||||||||||||||||
| Innovent Biologics, Inc. |
340,000 | 1,867,103 | (a)(g) | 0 | 0 | 0 | 0 | 340,000 | 1,867,103 | (a)(g) | ||||||||||||||||||||||
| Insmed, Inc. |
36,200 | 879,298 | (a) | 0 | 0 | 0 | 0 | 36,200 | 879,298 | (a) | ||||||||||||||||||||||
| Intercept Pharmaceuticals, Inc. |
75,400 | 5,448,404 | (a) | 0 | 0 | 0 | 0 | 75,400 | 5,448,404 | (a) | ||||||||||||||||||||||
| Neurocrine Biosciences, Inc. |
34,000 | 4,241,840 | (a) | 0 | 0 | 0 | 0 | 34,000 | 4,241,840 | (a) | ||||||||||||||||||||||
| ORIC Pharmaceuticals, Inc. |
60,000 | 1,741,200 | (a)(e) | 0 | 0 | 0 | 0 | 60,000 | 1,741,200 | (a)(e) | ||||||||||||||||||||||
| Passage Bio, Inc. |
28,000 | 616,840 | (e) | 0 | 0 | 0 | 0 | 28,000 | 616,840 | (e) | ||||||||||||||||||||||
| Principia Biopharma, Inc. |
45,000 | 2,875,050 | (a) | 0 | 0 | 0 | 0 | 45,000 | 2,875,050 | (a) | ||||||||||||||||||||||
| Regeneron Pharmaceuticals, Inc. |
33,636 | 20,612,477 | (a) | 107,502 | 65,878,301 | (a) | 0 | 0 | 141,138 | 86,490,778 | (a) | |||||||||||||||||||||
| Revolution Medicines, Inc. |
60,000 | 1,843,200 | (e) | 0 | 0 | 0 | 0 | 60,000 | 1,843,200 | (e) | ||||||||||||||||||||||
| Sarepta Therapeutics, Inc. |
40,000 | 6,090,800 | (a) | 0 | 0 | 0 | 0 | 40,000 | 6,090,800 | (a) | ||||||||||||||||||||||
| TG Therapeutics, Inc. |
70,000 | 1,305,500 | (a) | 0 | 0 | 0 | 0 | 70,000 | 1,305,500 | (a) | ||||||||||||||||||||||
| Turning Point Therapeutics, Inc. |
28,000 | 1,939,000 | (a)(e) | 0 | 0 | 0 | 0 | 28,000 | 1,939,000 | (a)(e) | ||||||||||||||||||||||
| Twist Bioscience Corp. |
50,000 | 1,897,500 | (a) | 0 | 0 | 0 | 0 | 50,000 | 1,897,500 | (a) | ||||||||||||||||||||||
| United Therapeutics Corp. |
4,700 | 554,365 | (a) | 0 | 0 | 0 | 0 | 4,700 | 554,365 | (a) | ||||||||||||||||||||||
| Vertex Pharmaceuticals, Inc. |
392,395 | 112,994,064 | (a) | 36,400 | 10,481,744 | (a) | 0 | 0 | 428,795 | 123,475,808 | (a) | |||||||||||||||||||||
| Xencor, Inc. |
50,000 | 1,512,500 | (a) | 0 | 0 | 0 | 0 | 50,000 | 1,512,500 | (a) | ||||||||||||||||||||||
| Zymeworks, Inc. |
55,000 | 2,096,600 | (a) | 0 | 0 | 0 | 0 | 55,000 | 2,096,600 | (a) | ||||||||||||||||||||||
|
|
|
|
|
|
|
|
|
|||||||||||||||||||||||||
| 648,231,438 | 189,442,947 | 289,368,802 | 1,127,043,187 | |||||||||||||||||||||||||||||
|
|
|
|
|
|
|
|
|
|||||||||||||||||||||||||
| Health Care Equipment & Supplies |
||||||||||||||||||||||||||||||||
| Abbott Laboratories |
523,860 | 49,724,791 | 0 | 0 | 0 | 523,860 | 49,724,791 | |||||||||||||||||||||||||
| Alcon, Inc. |
0 | 0 | (a) | 154,006 | 9,785,541 | (a) | 164,000 | 10,420,560 | (a)(e) | 318,006 | 20,206,101 | (a)(e) | ||||||||||||||||||||
| Alcon, Inc. (Switzerland) |
105,393 | 6,780,743 | (a) | 0 | 0 | 0 | 0 | 105,393 | 6,780,743 | (a) | ||||||||||||||||||||||
| Align Technology, Inc. |
10,375 | 2,548,308 | (a) | 0 | 0 | 0 | 0 | 10,375 | 2,548,308 | (a) | ||||||||||||||||||||||
| Baxter International, Inc. |
691,482 | 62,240,295 | 0 | 0 | 0 | 0 | 691,482 | 62,240,295 | ||||||||||||||||||||||||
| Becton, Dickinson & Co. |
379,088 | 93,608,200 | 0 | 0 | 0 | 0 | 379,088 | 93,608,200 | ||||||||||||||||||||||||
| Boston Scientific Corp. |
3,098,565 | 117,714,484 | (a) | 0 | 0 | 0 | 0 | 3,098,565 | 117,714,484 | (a) | ||||||||||||||||||||||
| Danaher Corp. |
260,967 | 43,479,712 | 0 | 0 | 107,000 | 17,827,270 | 367,967 | 61,306,982 | ||||||||||||||||||||||||
| DexCom, Inc. |
1,307 | 494,451 | (a) | 0 | 0 | 0 | 0 | 1,307 | 494,451 | (a) | ||||||||||||||||||||||
| Edwards Lifesciences Corp. |
32,333 | 7,265,872 | (a) | 0 | 0 | 0 | 0 | 32,333 | 7,265,872 | (a) | ||||||||||||||||||||||
| Genmark Diagnostics, Inc. (a) |
360,000 | 3,416,400 | (a) | 0 | 0 | 0 | 0 | 360,000 | 3,416,400 | (a) | ||||||||||||||||||||||
| Hologic, Inc. |
313,895 | 16,636,435 | (a) | 0 | 0 | 0 | 0 | 313,895 | 16,636,435 | (a) | ||||||||||||||||||||||
| Insulet Corp. |
41,500 | 7,825,655 | (a) | 0 | 0 | 0 | 0 | 41,500 | 7,825,655 | (a) | ||||||||||||||||||||||
| Intuitive Surgical, Inc. |
129,900 | 75,345,897 | (a) | 32,717 | 18,976,842 | (a) | 0 | 0 | 162,617 | 94,322,739 | (a) | |||||||||||||||||||||
| Masimo Corp. |
26,000 | 6,244,940 | (a) | 0 | 0 | 0 | 0 | 26,000 | 6,244,940 | (a) | ||||||||||||||||||||||
| Medtronic PLC |
112,532 | 11,093,405 | 0 | 0 | 314,406 | 30,994,143 | 426,938 | 42,087,548 | ||||||||||||||||||||||||
| Nanosonics Ltd. |
300,000 | 1,445,747 | (a) | 0 | 0 | 0 | 0 | 300,000 | 1,445,747 | (a) | ||||||||||||||||||||||
| Nevro Corp. (a) |
14,000 | 1,758,400 | (a) | 0 | 0 | 0 | 0 | 14,000 | 1,758,400 | (a) | ||||||||||||||||||||||
| OraSure Technologies, Inc. |
180,000 | 2,617,200 | (a) | 0 | 0 | 0 | 0 | 180,000 | 2,617,200 | (a) |
Table of Contents
| Penumbra, Inc. (a) |
42,800 | 7,379,576 | (a) | 0 | 0 | 0 | 0 | 42,800 | 7,379,576 | (a) | ||||||||||||||||||||||
| Quidel Corp. |
28,000 | 4,900,000 | (a) | 0 | 0 | 0 | 0 | 28,000 | 4,900,000 | (a) | ||||||||||||||||||||||
| ResMed, Inc. |
19,984 | 3,213,827 | 0 | 0 | 0 | 0 | 19,984 | 3,213,827 | ||||||||||||||||||||||||
| Stryker Corp. |
187,587 | 36,716,404 | 42,000 | 8,220,660 | 0 | 0 | 229,587 | 44,937,064 | ||||||||||||||||||||||||
| Tandem Diabetes Care, Inc. |
22,000 | 1,829,300 | (a) | 0 | 0 | 0 | 0 | 22,000 | 1,829,300 | (a) | ||||||||||||||||||||||
| The Cooper Companies, Inc. |
16,692 | 5,291,030 | 25,298 | 8,018,960 | 0 | 0 | 41,990 | 13,309,990 | ||||||||||||||||||||||||
| Varian Medical Systems, Inc. |
0 | 0 | 91,389 | 11,093,711 | (a) | 91,389 | 11,093,711 | (a) | ||||||||||||||||||||||||
| Zimmer Biomet Holdings, Inc. |
650,587 | 82,195,162 | 96,800 | 12,229,712 | 26,923 | 3,401,452 | 774,310 | 97,826,326 | ||||||||||||||||||||||||
|
|
|
|
|
|
|
|
|
|||||||||||||||||||||||||
| 651,766,234 | 68,325,426 | 62,643,425 | 782,735,085 | |||||||||||||||||||||||||||||
|
|
|
|
|
|
|
|
|
|||||||||||||||||||||||||
| Health Care Providers & Services |
||||||||||||||||||||||||||||||||
| 1Life Healthcare, Inc. |
65,000 | 2,099,500 | (a)(e) | 0 | 0 | 0 | 0 | 65,000 | 2,099,500 | (a)(e) | ||||||||||||||||||||||
| AmerisourceBergen Corp. |
41,700 | 3,975,678 | 0 | 0 | 246,997 | 23,548,694 | 288,697 | 27,524,372 | ||||||||||||||||||||||||
| Anthem, Inc. |
199,435 | 58,655,828 | 0 | 0 | 153,237 | 45,068,534 | 352,672 | 103,724,362 | ||||||||||||||||||||||||
| Cardinal Health, Inc. |
275,397 | 15,061,462 | 0 | 0 | 381,300 | 20,853,297 | 656,697 | 35,914,759 | ||||||||||||||||||||||||
| Centene Corp. |
1,200,598 | 79,539,618 | (a) | 257,674 | 17,070,903 | (a) | 0 | 0 | 1,458,272 | 96,610,521 | (a) | |||||||||||||||||||||
| Cigna Corp. |
1,114,524 | 219,917,876 | 0 | 0 | 227,086 | 44,808,610 | 1,341,610 | 264,726,486 | ||||||||||||||||||||||||
| Covetrus, Inc. |
57,700 | 881,656 | (a) | 0 | 0 | 0 | 0 | 57,700 | 881,656 | (a) | ||||||||||||||||||||||
| CVS Health Corp. |
609,344 | 39,954,686 | 271,900 | 17,828,483 | 529,000 | 34,686,530 | 1,410,244 | 92,469,699 | ||||||||||||||||||||||||
| DaVita HealthCare Partners, Inc. |
43,217 | 3,498,848 | (a) | 0 | 0 | 57,300 | 4,639,008 | (a) | 100,517 | 8,137,856 | (a) | |||||||||||||||||||||
| HCA Holdings, Inc. |
437,611 | 46,780,616 | 0 | 0 | 405,504 | 43,348,378 | 843,115 | 90,128,994 | ||||||||||||||||||||||||
| Henry Schein, Inc. |
83,363 | 5,061,801 | (a) | 0 | 0 | 60,364 | 3,665,302 | (a) | 143,727 | 8,727,103 | (a) | |||||||||||||||||||||
| Humana, Inc. |
209,785 | 86,148,210 | 0 | 0 | 0 | 0 | 209,785 | 86,148,210 | ||||||||||||||||||||||||
| Laboratory Corp. of America Holdings |
51,956 | 9,108,926 | (a) | 54,000 | 9,467,280 | (a) | 39,976 | 7,008,592 | (a) | 145,932 | 25,584,798 | (a) | ||||||||||||||||||||
| McKesson Corp. |
333,570 | 52,927,552 | 101,800 | 16,152,606 | 275,339 | 43,688,039 | 710,709 | 112,768,197 | ||||||||||||||||||||||||
| Molina Healthcare, Inc. |
6,800 | 1,263,576 | (a) | 0 | 0 | 23,500 | 4,366,770 | (a) | 30,300 | 5,630,346 | (a) | |||||||||||||||||||||
| Quest Diagnostics, Inc. |
50,400 | 5,961,312 | 0 | 0 | 199,467 | 23,592,957 | 249,867 | 29,554,269 | ||||||||||||||||||||||||
| UnitedHealth Group, Inc. |
1,043,569 | 318,132,010 | 351,667 | 107,205,685 | 73,433 | 22,386,050 | 1,468,669 | 447,723,745 | ||||||||||||||||||||||||
| Universal Health Services, Inc. Class B |
54,114 | 5,706,321 | 0 | 0 | 159,200 | 16,787,640 | 213,314 | 22,493,961 | ||||||||||||||||||||||||
|
|
|
|
|
|
|
|
|
|||||||||||||||||||||||||
| 954,675,476 | 167,724,957 | 338,448,401 | 1,460,848,834 | |||||||||||||||||||||||||||||
|
|
|
|
|
|
|
|
|
|||||||||||||||||||||||||
| Health Care Technology |
||||||||||||||||||||||||||||||||
| Cerner Corp. |
69,392 | 5,058,677 | 415,725 | 30,306,353 | 0 | 0 | 485,117 | 35,365,030 | ||||||||||||||||||||||||
| Inspire Medical Systems, Inc. |
35,000 | 2,853,900 | (a) | 0 | 0 | 0 | 0 | 35,000 | 2,853,900 | (a) | ||||||||||||||||||||||
| Veeva Systems, Inc. Class A |
20,678 | 4,525,794 | (a) | 74,800 | 16,371,476 | (a) | 0 | 0 | 95,478 | 20,897,270 | (a) | |||||||||||||||||||||
|
|
|
|
|
|
|
|
|
|||||||||||||||||||||||||
| 12,438,371 | 46,677,829 | 0 | 59,116,200 | |||||||||||||||||||||||||||||
|
|
|
|
|
|
|
|
|
|||||||||||||||||||||||||
| Life Sciences Tools & Services |
||||||||||||||||||||||||||||||||
| 10X Genomics, Inc. |
36,000 | 2,806,920 | (a) | 0 | 0 | 0 | 0 | 36,000 | 2,806,920 | (a) | ||||||||||||||||||||||
| Agilent Technologies, Inc. |
307,300 | 27,085,422 | 0 | 0 | 0 | 0 | 307,300 | 27,085,422 | ||||||||||||||||||||||||
| Avantor, Inc. |
213,660 | 4,053,130 | 0 | 0 | 177,418 | 3,365,619 | 391,078 | 7,418,749 | ||||||||||||||||||||||||
| Bio-Rad Laboratories, Inc. Class A |
2,800 | 1,375,696 | 0 | 0 | 9,700 | 4,765,804 | (a) | 12,500 | 6,141,500 | (a) | ||||||||||||||||||||||
| Bruker Corp. |
90,000 | 3,895,200 | 0 | 0 | 0 | 0 | 90,000 | 3,895,200 | ||||||||||||||||||||||||
| Illumina, Inc. |
12,565 | 4,561,723 | (a) | 70,766 | 25,691,596 | (a) | $ | 0 | 0 | 83,331 | 30,253,319 | (a) | ||||||||||||||||||||
| Lonza Group AG |
10,000 | 4,938,207 | 0 | 0 | 0 | 0 | 10,000 | 4,938,207 | ||||||||||||||||||||||||
| Mettler-Toledo International, Inc. |
3,554 | 2,825,430 | (a) | 0 | 0 | 0 | 0 | 3,554 | 2,825,430 | (a) | ||||||||||||||||||||||
| Thermo Fisher Scientific, Inc. |
338,767 | 118,294,049 | 182,779 | 63,824,599 | 0 | 0 | 521,546 | 182,118,648 | ||||||||||||||||||||||||
|
|
|
|
|
|
|
|
|
|||||||||||||||||||||||||
| 169,835,777 | 89,516,195 | 8,131,423 | 267,483,395 | |||||||||||||||||||||||||||||
|
|
|
|
|
|
|
|
|
|||||||||||||||||||||||||
| Pharmaceuticals |
||||||||||||||||||||||||||||||||
| AstraZeneca PLC: |
0 | 0 | ||||||||||||||||||||||||||||||
| (United Kingdom) |
175,000 | 18,847,464 | 0 | 0 | 0 | 0 | 175,000 | 18,847,464 | ||||||||||||||||||||||||
| sponsored ADR |
584,780 | 31,928,988 | 0 | 0 | 0 | 0 | 584,780 | 31,928,988 | ||||||||||||||||||||||||
| Bayer AG |
292,890 | 20,021,842 | 0 | 0 | 0 | 0 | 292,890 | 20,021,842 | ||||||||||||||||||||||||
| Bristol-Myers Squibb Co. |
1,480,032 | 88,387,511 | 499,435 | 29,826,258 | 839,072 | 50,109,380 | 2,818,539 | 168,323,149 | ||||||||||||||||||||||||
| Elanco Animal Health, Inc. |
1,892,433 | 40,516,991 | (a) | 0 | 0 | 344,000 | 7,365,040 | (a) | 2,236,433 | 47,882,031 | (a) | |||||||||||||||||||||
| Eli Lilly & Co. |
724,850 | 110,865,808 | 70,139 | 10,727,760 | 0 | 0 | 794,989 | 121,593,568 | ||||||||||||||||||||||||
| GlaxoSmithKline PLC sponsored ADR |
490,112 | 20,545,495 | 0 | 0 | 143,111 | 5,999,213 | 633,223 | 26,544,708 | ||||||||||||||||||||||||
| Jazz Pharmaceuticals PLC |
27,790 | 3,315,903 | (a) | 0 | 0 | 123,900 | 14,783,748 | (a) | 151,690 | 18,099,651 | (a) | |||||||||||||||||||||
| Johnson & Johnson |
1,545,841 | 229,943,849 | 0 | 0 | 593,521 | 88,286,249 | 2,139,362 | 318,230,098 | ||||||||||||||||||||||||
| Mallinckrodt PLC (a)(e) |
101,900 | 287,358 | 0 | 0 | 0 | 0 | 101,900 | 287,358 | ||||||||||||||||||||||||
| Merck & Co., Inc. |
3,705,889 | 299,139,360 | 362,602 | 29,269,233 | 1,717,493 | 138,636,035 | 5,785,984 | 467,044,628 | ||||||||||||||||||||||||
| MyoKardia, Inc. |
34,000 | 3,477,860 | (a) | 0 | 0 | 0 | 0 | 34,000 | 3,477,860 | (a) | ||||||||||||||||||||||
| Nektar Therapeutics |
80,000 | 1,736,000 | (a) | 0 | 0 | 0 | 0 | 80,000 | 1,736,000 | (a) | ||||||||||||||||||||||
| Novartis AG sponsored ADR |
150,700 | 13,175,701 | 365,200 | 31,929,436 | 204,933 | 17,917,292 | 720,833 | 63,022,429 | ||||||||||||||||||||||||
| Novo Nordisk A/S Series B sponsored ADR |
134,500 | 8,868,930 | 244,238 | 16,105,054 | 0 | 0 | 378,738 | 24,973,984 | ||||||||||||||||||||||||
| Perrigo Co. PLC |
16,300 | 892,751 | 0 | 0 | 56,000 | 3,067,120 | 72,300 | 3,959,871 | ||||||||||||||||||||||||
| Pfizer, Inc. |
3,118,956 | 119,112,930 | 0 | 0 | 4,534,473 | 173,171,524 | 7,653,429 | 292,284,454 | ||||||||||||||||||||||||
| Roche Holding AG (participation certificate) |
74,000 | 25,687,011 | 0 | 0 | 0 | 0 | 74,000 | 25,687,011 | ||||||||||||||||||||||||
| Roche Holding AG sponsored ADR |
0 | 0 | 1,236,646 | 53,608,604 | 1,236,646 | 53,608,604 | ||||||||||||||||||||||||||
| Sanofi SA |
124,000 | 12,129,036 | 0 | 0 | 0 | 0 | 124,000 | 12,129,036 | ||||||||||||||||||||||||
| Sanofi SA sponsored ADR |
555,000 | 27,256,050 | 0 | 0 | 0 | 0 | 555,000 | 27,256,050 |
Table of Contents
| Theravance Biopharma, Inc. |
80,000 | 2,020,000 | (a) | 0 | 0 | 0 | 0 | 80,000 | 2,020,000 | (a) | ||||||||||||||||||||||
| Zoetis, Inc. Class A |
416,834 | 58,102,491 | 208,952 | 29,125,819 | 0 | 0 | 625,786 | 87,228,310 | ||||||||||||||||||||||||
|
|
|
|
|
|
|
|
|
|||||||||||||||||||||||||
| 1,136,259,329 | 200,592,164 | 499,335,601 | 1,836,187,094 | |||||||||||||||||||||||||||||
|
|
|
|
|
|
|
|
|
|||||||||||||||||||||||||
| TOTAL HEALTH CARE |
3,573,206,625 | 762,279,518 | 1,197,927,652 | 5,533,413,795 | ||||||||||||||||||||||||||||
|
|
|
|
|
|
|
|
|
|||||||||||||||||||||||||
| INDUSTRIALS |
||||||||||||||||||||||||||||||||
| Aerospace & Defense |
||||||||||||||||||||||||||||||||
| Airbus Group NV |
12,700 | 811,619 | 0 | 0 | 0 | 0 | 12,700 | 811,619 | ||||||||||||||||||||||||
| Curtiss-Wright Corp. |
4,900 | 491,470 | 0 | 0 | 16,900 | 1,695,070 | 21,800 | 2,186,540 | ||||||||||||||||||||||||
| General Dynamics Corp. |
256,947 | 37,727,528 | 0 | 0 | 211,454 | 31,047,791 | 468,401 | 68,775,319 | ||||||||||||||||||||||||
| Harris Corp. |
124,230 | 24,777,674 | 0 | 0 | 0 | 0 | 124,230 | 24,777,674 | ||||||||||||||||||||||||
| Howmet Aerospace, Inc. |
100,357 | 1,312,670 | 0 | 0 | 0 | 0 | 100,357 | 1,312,670 | ||||||||||||||||||||||||
| Huntington Ingalls Industries, Inc. |
45,588 | 9,112,585 | 0 | 0 | 108,330 | 21,654,084 | 153,918 | 30,766,669 | ||||||||||||||||||||||||
| Lockheed Martin Corp. |
248,257 | 96,432,949 | 0 | 0 | 116,066 | 45,084,677 | 364,323 | 141,517,626 | ||||||||||||||||||||||||
| Moog, Inc. Class A |
27,100 | 1,471,259 | 0 | 0 | 100,300 | 5,445,287 | 127,400 | 6,916,546 | ||||||||||||||||||||||||
| Northrop Grumman Corp. |
348,192 | 116,713,958 | 34,800 | 11,664,960 | 85,703 | 28,727,646 | 468,695 | 157,106,564 | ||||||||||||||||||||||||
| Raytheon Technologies Corp. |
601,903 | 38,834,782 | 367,222 | 23,693,163 | 304,703 | 19,659,438 | 1,273,828 | 82,187,383 | ||||||||||||||||||||||||
| Safran SA |
8,600 | 828,686 | 0 | 0 | 0 | 0 | 8,600 | 828,686 | ||||||||||||||||||||||||
| Spirit AeroSystems Holdings, Inc. Class A |
57,800 | 1,252,526 | 0 | 0 | 166,500 | 3,608,055 | 224,300 | 4,860,581 | ||||||||||||||||||||||||
| Textron, Inc. |
589,100 | 18,244,427 | 0 | 0 | 408,600 | 12,654,342 | 997,700 | 30,898,769 | ||||||||||||||||||||||||
| The Boeing Co. |
298,524 | 43,539,725 | 301,224 | 43,933,520 | 0 | 0 | 599,748 | 87,473,245 | ||||||||||||||||||||||||
| Vectrus, Inc. |
0 | 0 | 0 | 0 | 37,733 | 2,072,296 | (a) | 37,733 | 2,072,296 | (a) | ||||||||||||||||||||||
|
|
|
|
|
|
|
|
|
|||||||||||||||||||||||||
| 391,551,858 | 79,291,643 | 171,648,686 | 642,492,187 | |||||||||||||||||||||||||||||
|
|
|
|
|
|
|
|
|
|||||||||||||||||||||||||
| Air Freight & Logistics |
||||||||||||||||||||||||||||||||
| C.H. Robinson Worldwide, Inc. |
158,207 | 12,835,334 | 135,035 | 10,955,390 | 0 | 0 | 293,242 | 23,790,724 | ||||||||||||||||||||||||
| Expeditors International of Washington, Inc. |
0 | 0 | 492,749 | 37,631,241 | 492,749 | 37,631,241 | ||||||||||||||||||||||||||
| FedEx Corp. |
146,700 | 19,153,152 | 0 | 0 | 59,700 | 7,794,432 | 206,400 | 26,947,584 | ||||||||||||||||||||||||
| United Parcel Service, Inc. Class B |
963,933 | 96,113,759 | 197,437 | 19,686,443 | 288,855 | 28,801,732 | 1,450,225 | 144,601,934 | ||||||||||||||||||||||||
| XPO Logistics, Inc. |
25,700 | 2,025,417 | (a) | 0 | 0 | 200,000 | 15,762,000 | (a) | 225,700 | 17,787,417 | (a) | |||||||||||||||||||||
|
|
|
|
|
|
|
|
|
|||||||||||||||||||||||||
| 130,127,662 | 68,273,074 | 52,358,164 | 250,758,900 | |||||||||||||||||||||||||||||
|
|
|
|
|
|
|
|
|
|||||||||||||||||||||||||
| Airlines |
||||||||||||||||||||||||||||||||
| Alaska Air Group, Inc. |
190,486 | 6,512,716 | 0 | 0 | 0 | 0 | 190,486 | 6,512,716 | ||||||||||||||||||||||||
| American Airlines Group, Inc. |
66,000 | 693,000 | (e) | 0 | 0 | 0 | 0 | 66,000 | 693,000 | (e) | ||||||||||||||||||||||
| Delta Air Lines, Inc. |
185,860 | 4,685,531 | 0 | 0 | 430,000 | 10,840,300 | 615,860 | 15,525,831 | ||||||||||||||||||||||||
| JetBlue Airways Corp. |
149,800 | 1,508,486 | (a) | 0 | 0 | 0 | 0 | 149,800 | 1,508,486 | (a) | ||||||||||||||||||||||
| Ryanair Holdings PLC sponsored ADR |
11,900 | 854,063 | (a) | 0 | 0 | 0 | 0 | 11,900 | 854,063 | (a) | ||||||||||||||||||||||
| Southwest Airlines Co. |
0 | 0 | 0 | 0 | 172,372 | 5,533,141 | 172,372 | 5,533,141 | ||||||||||||||||||||||||
| United Airlines Holdings, Inc. |
349,841 | 9,809,542 | (a)(e) | 0 | 0 | 319,300 | 8,953,172 | (a)(e) | 669,141 | 18,762,714 | (a)(e) | |||||||||||||||||||||
|
|
|
|
|
|
|
|
|
|||||||||||||||||||||||||
| 24,063,338 | 0 | 25,326,613 | 49,389,951 | |||||||||||||||||||||||||||||
|
|
|
|
|
|
|
|
|
|||||||||||||||||||||||||
| Building Products |
||||||||||||||||||||||||||||||||
| Allegion PLC |
20,745 | 2,068,277 | 0 | 0 | 96,000 | 9,571,200 | 116,745 | 11,639,477 | ||||||||||||||||||||||||
| Carrier Global Corp. |
117,688 | 2,409,073 | (a) | 526,579 | 10,779,072 | (a) | 117,001 | 2,395,010 | (a) | 761,268 | 15,583,155 | (a) | ||||||||||||||||||||
| Fortune Brands Home & Security, Inc. |
221,700 | 13,514,832 | 0 | 0 | 56,560 | 3,447,898 | 278,260 | 16,962,730 | ||||||||||||||||||||||||
| Johnson Controls International PLC |
582,238 | 18,288,096 | 0 | 0 | 540,900 | 16,989,669 | 1,123,138 | 35,277,765 | ||||||||||||||||||||||||
| Masco Corp. |
65,219 | 3,042,466 | 0 | 0 | 117,136 | 5,464,394 | 182,355 | 8,506,860 | ||||||||||||||||||||||||
| Owens Corning |
13,000 | 682,500 | 0 | 0 | 160,989 | 8,451,923 | 173,989 | 9,134,423 | ||||||||||||||||||||||||
| Trane Technologies PLC |
497,032 | 44,837,257 | 136,432 | 12,307,531 | 0 | 0 | 633,464 | 57,144,788 | ||||||||||||||||||||||||
|
|
|
|
|
|
|
|
|
|||||||||||||||||||||||||
| 84,842,501 | 23,086,603 | 46,320,094 | 154,249,198 | |||||||||||||||||||||||||||||
|
|
|
|
|
|
|
|
|
|||||||||||||||||||||||||
| Commercial Services & Supplies |
||||||||||||||||||||||||||||||||
| Cintas Corp. |
19,149 | 4,748,186 | 0 | 0 | 0 | 0 | 19,149 | 4,748,186 | ||||||||||||||||||||||||
| Copart, Inc. |
26,279 | 2,349,080 | (a) | 198,200 | 17,717,098 | (a) | 0 | 0 | 224,479 | 20,066,178 | (a) | |||||||||||||||||||||
| Deluxe Corp. |
49,200 | 1,147,836 | 0 | 0 | 166,100 | 3,875,113 | 215,300 | 5,022,949 | ||||||||||||||||||||||||
| Herman Miller, Inc. |
68,300 | 1,572,266 | 0 | 0 | 0 | 0 | 68,300 | 1,572,266 | ||||||||||||||||||||||||
| IAA Spinco, Inc. |
17,000 | 697,000 | (a) | 0 | 0 | 0 | 0 | 17,000 | 697,000 | (a) | ||||||||||||||||||||||
| Waste Connection, Inc. (United States) |
361,496 | 33,995,084 | 0 | 0 | 0 | 0 | 361,496 | 33,995,084 | ||||||||||||||||||||||||
|
|
|
|
|
|
|
|
|
|||||||||||||||||||||||||
| 44,509,452 | 17,717,098 | 3,875,113 | 66,101,663 | |||||||||||||||||||||||||||||
|
|
|
|
|
|
|
|
|
|||||||||||||||||||||||||
| Construction & Engineering |
||||||||||||||||||||||||||||||||
| Jacobs Engineering Group, Inc. |
1,022,534 | 85,913,307 | 0 | 0 | 0 | 0 | 1,022,534 | 85,913,307 | ||||||||||||||||||||||||
| Quanta Services, Inc. |
17,100 | 631,503 | 0 | 0 | 58,702 | 2,167,865 | 75,802 | 2,799,368 | ||||||||||||||||||||||||
|
|
|
|
|
|
|
|
|
|||||||||||||||||||||||||
| 86,544,810 | 0 | 2,167,865 | 88,712,675 | |||||||||||||||||||||||||||||
|
|
|
|
|
|
|
|
|
|||||||||||||||||||||||||
| Electrical Equipment |
||||||||||||||||||||||||||||||||
| Acuity Brands, Inc. |
25,500 | 2,196,825 | 0 | 0 | 0 | 0 | 25,500 | 2,196,825 | ||||||||||||||||||||||||
| AMETEK, Inc. |
273,000 | 25,036,830 | 0 | 0 | 29,635 | 2,717,826 | 302,635 | 27,754,656 | ||||||||||||||||||||||||
| Eaton Corp. PLC |
513,695 | 43,612,706 | 0 | 0 | 402,067 | 34,135,488 | 915,762 | 77,748,194 | ||||||||||||||||||||||||
| Emerson Electric Co. |
266,700 | 16,274,034 | 0 | 0 | 243,400 | 14,852,268 | 510,100 | 31,126,302 | ||||||||||||||||||||||||
| Hubbell, Inc. Class B |
28,400 | 3,476,728 | 0 | 0 | 22,392 | 2,741,229 | 50,792 | 6,217,957 |
Table of Contents
| Sensata Technologies, Inc. PLC |
19,000 | 677,350 | (a) | 0 | 0 | 65,493 | 2,334,825 | (a) | 84,493 | 3,012,175 | (a) | |||||||||||||||||||||
| Sunrun, Inc. |
62,400 | 1,042,080 | (a) | 0 | 0 | 0 | 0 | 62,400 | 1,042,080 | (a) | ||||||||||||||||||||||
| Vertiv Holdings Co. |
67,021 | 853,177 | (a) | 0 | 0 | 0 | 0 | 67,021 | 853,177 | (a) | ||||||||||||||||||||||
| Vertiv Holdings LLC |
450,000 | 5,728,500 | (k) | 0 | 0 | 0 | 0 | 450,000 | 5,728,500 | (k) | ||||||||||||||||||||||
| Vivint Solar, Inc. |
1,094,128 | 8,227,843 | (a)(e) | 0 | 0 | 0 | 0 | 1,094,128 | 8,227,843 | (a)(e) | ||||||||||||||||||||||
|
|
|
|
|
|
|
|
|
|||||||||||||||||||||||||
| 107,126,073 | 0 | 56,781,636 | 163,907,709 | |||||||||||||||||||||||||||||
|
|
|
|
|
|
|
|
|
|||||||||||||||||||||||||
| Industrial Conglomerates |
||||||||||||||||||||||||||||||||
| 3M Co. |
101,108 | 15,817,336 | 0 | 0 | 209,242 | 32,733,818 | 310,350 | 48,551,154 | ||||||||||||||||||||||||
| Carlisle Companies, Inc. |
6,500 | 779,090 | 0 | 0 | 66,366 | 7,954,629 | 72,866 | 8,733,719 | ||||||||||||||||||||||||
| General Electric Co. |
13,747,572 | 90,321,548 | 0 | 0 | 0 | 0 | 13,747,572 | 90,321,548 | ||||||||||||||||||||||||
| Honeywell International, Inc. |
1,943,633 | 283,478,873 | 83,102 | 12,120,427 | 331,023 | 48,279,705 | 2,357,758 | 343,879,005 | ||||||||||||||||||||||||
| Roper Technologies, Inc. |
146,528 | 57,702,726 | 0 | 0 | 0 | 0 | 146,528 | 57,702,726 | ||||||||||||||||||||||||
|
|
|
|
|
|
|
|
|
|||||||||||||||||||||||||
| 448,099,573 | 12,120,427 | 88,968,152 | 549,188,152 | |||||||||||||||||||||||||||||
|
|
|
|
|
|
|
|
|
|||||||||||||||||||||||||
| Machinery |
||||||||||||||||||||||||||||||||
| AGCO Corp. |
72,900 | 4,026,267 | 0 | 0 | 245,838 | 13,577,633 | 318,738 | 17,603,900 | ||||||||||||||||||||||||
| Allison Transmission Holdings, Inc. |
102,200 | 3,854,984 | 0 | 0 | 270,991 | 10,221,781 | 373,191 | 14,076,765 | ||||||||||||||||||||||||
| Caterpillar, Inc. |
134,322 | 16,136,102 | 0 | 0 | 401,902 | 48,280,487 | 536,224 | 64,416,589 | ||||||||||||||||||||||||
| Cummins, Inc. |
272,361 | 46,192,426 | 61,500 | 10,430,400 | 323,086 | 54,795,386 | 656,947 | 111,418,212 | ||||||||||||||||||||||||
| Deere & Co. |
166,655 | 25,351,559 | 286,922 | 43,646,575 | 169,260 | 25,747,831 | 622,837 | 94,745,965 | ||||||||||||||||||||||||
| Dover Corp. |
34,689 | 3,373,505 | 0 | 0 | 234,063 | 22,762,627 | 268,752 | 26,136,132 | ||||||||||||||||||||||||
| Flowserve Corp. |
413,500 | 10,792,350 | 0 | 0 | 0 | 0 | 413,500 | 10,792,350 | ||||||||||||||||||||||||
| Fortive Corp. |
713,037 | 43,480,996 | 0 | 0 | 0 | 0 | 713,037 | 43,480,996 | ||||||||||||||||||||||||
| Gardner Denver Holdings, Inc. |
540,936 | 15,254,395 | (a) | 120,386 | 3,394,885 | (a) | 0 | 0 | 661,322 | 18,649,280 | (a) | |||||||||||||||||||||
| Illinois Tool Works, Inc. |
0 | 0 | 0 | 0 | 42,116 | 7,263,325 | 42,116 | 7,263,325 | ||||||||||||||||||||||||
| ITT, Inc. |
9,800 | 565,460 | 0 | 0 | 104,473 | 6,028,092 | 114,273 | 6,593,552 | ||||||||||||||||||||||||
| Lincoln Electric Holdings, Inc. |
6,400 | 525,888 | 0 | 0 | 22,000 | 1,807,740 | 28,400 | 2,333,628 | ||||||||||||||||||||||||
| Meritor, Inc. |
117,300 | 2,390,574 | (a) | 0 | 0 | 0 | 0 | 117,300 | 2,390,574 | (a) | ||||||||||||||||||||||
| Middleby Corp. |
0 | 0 | 0 | 0 | 67,787 | 4,616,295 | (a) | 67,787 | 4,616,295 | (a) | ||||||||||||||||||||||
| Oshkosh Corp. |
64,300 | 4,618,026 | 0 | 0 | 389,223 | 27,953,996 | 453,523 | 32,572,022 | ||||||||||||||||||||||||
| Otis Worldwide Corp. |
324,353 | 17,077,185 | 49,179 | 2,589,274 | 111,026 | 5,845,519 | 484,558 | 25,511,978 | ||||||||||||||||||||||||
| PACCAR, Inc. |
435,820 | 32,189,665 | 0 | 0 | 142,549 | 10,528,669 | 578,369 | 42,718,334 | ||||||||||||||||||||||||
| Parker Hannifin Corp. |
114,500 | 20,606,565 | 0 | 0 | 107,970 | 19,431,361 | 222,470 | 40,037,926 | ||||||||||||||||||||||||
| Pentair PLC |
19,400 | 759,316 | 0 | 0 | 66,719 | 2,611,382 | 86,119 | 3,370,698 | ||||||||||||||||||||||||
| Snap-On, Inc. |
69,251 | 8,981,162 | 0 | 0 | 22,594 | 2,930,216 | 91,845 | 11,911,378 | ||||||||||||||||||||||||
| Stanley Black & Decker, Inc. |
239,010 | 29,983,805 | 0 | 0 | 0 | 0 | 239,010 | 29,983,805 | ||||||||||||||||||||||||
| Timken Co. |
62,900 | 2,675,766 | 0 | 0 | 197,300 | 8,393,142 | 260,200 | 11,068,908 | ||||||||||||||||||||||||
| Trinity Industries, Inc. |
89,300 | 1,783,321 | 0 | 0 | 447,800 | 8,942,566 | (e) | 537,100 | 10,725,887 | (e) | ||||||||||||||||||||||
| Westinghouse Air Brake Co. |
266,456 | 16,272,468 | 0 | 0 | 0 | 0 | 266,456 | 16,272,468 | ||||||||||||||||||||||||
| Xylem, Inc. |
0 | 0 | 0 | 0 | 129,000 | 8,557,860 | 129,000 | 8,557,860 | ||||||||||||||||||||||||
|
|
|
|
|
|
|
|
|
|||||||||||||||||||||||||
| 306,891,785 | 60,061,134 | 290,295,908 | 657,248,827 | |||||||||||||||||||||||||||||
|
|
|
|
|
|
|
|
|
|||||||||||||||||||||||||
| Professional Services |
||||||||||||||||||||||||||||||||
| CoStar Group, Inc. |
12,400 | 8,144,320 | (a) | 0 | 0 | 0 | 0 | 12,400 | 8,144,320 | (a) | ||||||||||||||||||||||
| Equifax, Inc. |
137,200 | 21,068,432 | 0 | 0 | 0 | 0 | 137,200 | 21,068,432 | ||||||||||||||||||||||||
| IHS Markit Ltd. |
68,811 | 4,779,612 | 254,589 | 17,683,752 | 0 | 0 | 323,400 | 22,463,364 | ||||||||||||||||||||||||
| Manpower, Inc. |
42,800 | 2,959,192 | 0 | 0 | 24,300 | 1,680,102 | 67,100 | 4,639,294 | ||||||||||||||||||||||||
| RELX PLC (London Stock Exchange) |
131,020 | 3,031,505 | 0 | 0 | 0 | 0 | 131,020 | 3,031,505 | ||||||||||||||||||||||||
| Robert Half International, Inc. |
65,247 | 3,310,633 | 0 | 0 | 75,155 | 3,813,365 | 140,402 | 7,123,998 | ||||||||||||||||||||||||
| TransUnion Holding Co., Inc. |
56,724 | 4,894,714 | 0 | 0 | 0 | 0 | 56,724 | 4,894,714 | ||||||||||||||||||||||||
| Verisk Analytics, Inc. |
2,626 | 453,458 | 0 | 0 | 0 | 0 | 2,626 | 453,458 | ||||||||||||||||||||||||
|
|
|
|
|
|
|
|
|
|||||||||||||||||||||||||
| 48,641,866 | 17,683,752 | 5,493,467 | 71,819,085 | |||||||||||||||||||||||||||||
|
|
|
|
|
|
|
|
|
|||||||||||||||||||||||||
| Road & Rail |
||||||||||||||||||||||||||||||||
| AMERCO |
2,400 | 774,000 | 0 | 0 | 8,039 | 2,592,578 | 10,439 | 3,366,578 | ||||||||||||||||||||||||
| CSX Corp. |
525,042 | 37,582,506 | 0 | 0 | 320,500 | 22,941,390 | 845,542 | 60,523,896 | ||||||||||||||||||||||||
| J.B. Hunt Transport Services, Inc. |
210,100 | 25,142,667 | 0 | 0 | 0 | 0 | 210,100 | 25,142,667 | ||||||||||||||||||||||||
| Kansas City Southern |
5,042 | 758,922 | 0 | 0 | 38,091 | 5,733,457 | 43,133 | 6,492,379 | ||||||||||||||||||||||||
| Knight-Swift Transportation Holdings, Inc. Class A |
221,700 | 9,224,937 | 0 | 0 | 70,320 | 2,926,015 | 292,020 | 12,150,952 | ||||||||||||||||||||||||
| Lyft, Inc. |
445,254 | 13,918,640 | (a) | 0 | 0 | 0 | 0 | 445,254 | 13,918,640 | (a) | ||||||||||||||||||||||
| Norfolk Southern Corp. |
511,214 | 91,144,344 | 0 | 0 | 93,141 | 16,606,109 | 604,355 | 107,750,453 | ||||||||||||||||||||||||
| Ryder System, Inc. |
59,100 | 2,024,766 | 0 | 0 | 0 | 0 | 59,100 | 2,024,766 | ||||||||||||||||||||||||
| Uber Technologies, Inc. |
74,200 | 2,694,944 | 468,217 | 17,005,641 | 0 | 0 | 542,417 | 19,700,585 | ||||||||||||||||||||||||
| Union Pacific Corp. |
679,537 | 115,426,155 | 0 | 0 | 36,689 | 6,231,994 | 716,226 | 121,658,149 | ||||||||||||||||||||||||
|
|
|
|
|
|
|
|
|
|||||||||||||||||||||||||
| 298,691,881 | 17,005,641 | 57,031,543 | 372,729,065 | |||||||||||||||||||||||||||||
|
|
|
|
|
|
|
|
|
|||||||||||||||||||||||||
| Trading Companies & Distributors |
||||||||||||||||||||||||||||||||
| Beijer Ref AB (B Shares) |
8,800 | 260,566 | 0 | 0 | 0 | 0 | 8,800 | 260,566 | ||||||||||||||||||||||||
| HD Supply Holdings, Inc. |
77,900 | 2,470,209 | (a) | 0 | 0 | 275,700 | 8,742,447 | (a) | 353,600 | 11,212,656 | (a) | |||||||||||||||||||||
| United Rentals, Inc. |
23,357 | 3,244,054 | (a) | 108,283 | 15,039,426 | (a) | 58,192 | 8,082,287 | (a) | 189,832 | 26,365,767 | (a) | ||||||||||||||||||||
| W.W. Grainger, Inc. |
16,491 | 5,105,943 | 57,340 | 17,753,611 | 22,179 | 6,867,062 | 96,010 | 29,726,616 | ||||||||||||||||||||||||
|
|
|
|
|
|
|
|
|
|||||||||||||||||||||||||
| 11,080,772 | 32,793,037 | 23,691,796 | 67,565,605 | |||||||||||||||||||||||||||||
|
|
|
|
|
|
|
|
|
|||||||||||||||||||||||||
| TOTAL INDUSTRIALS |
1,982,171,571 | 328,032,409 | 823,959,037 | 3,134,163,017 | ||||||||||||||||||||||||||||
|
|
|
|
|
|
|
|
|
Table of Contents
| INFORMATION TECHNOLOGY |
||||||||||||||||||||||||||||||||
| Communications Equipment |
||||||||||||||||||||||||||||||||
| Arista Networks, Inc. |
2,001 | 467,153 | (a) | 0 | 0 | 0 | 0 | 2,001 | 467,153 | (a) | ||||||||||||||||||||||
| Cisco Systems, Inc. |
3,445,789 | 164,777,630 | 1,032,696 | 49,383,523 | 2,671,605 | 127,756,151 | 7,150,090 | 341,917,304 | ||||||||||||||||||||||||
| CommScope Holding Co., Inc. |
0 | 0 | 0 | 0 | 571,506 | 5,892,227 | (a) | 571,506 | 5,892,227 | (a) | ||||||||||||||||||||||
| Ericsson (B Shares) sponsored ADR |
175,700 | 1,605,898 | 0 | 0 | 0 | 0 | 175,700 | 1,605,898 | ||||||||||||||||||||||||
| Juniper Networks, Inc. |
122,000 | 2,959,720 | 0 | 0 | 136,219 | 3,304,673 | 258,219 | 6,264,393 | ||||||||||||||||||||||||
| Lumentum Holdings, Inc. |
2,400 | 175,968 | (a) | 0 | 0 | 0 | 0 | 2,400 | 175,968 | (a) | ||||||||||||||||||||||
| Motorola Solutions, Inc. |
300,776 | 40,704,016 | 0 | 0 | 0 | 0 | 300,776 | 40,704,016 | ||||||||||||||||||||||||
|
|
|
|
|
|
|
|
|
|||||||||||||||||||||||||
| 210,690,385 | 49,383,523 | 136,953,051 | 397,026,959 | |||||||||||||||||||||||||||||
|
|
|
|
|
|
|
|
|
|||||||||||||||||||||||||
| Electronic Equipment & Components |
||||||||||||||||||||||||||||||||
| Amphenol Corp. Class A |
272,900 | 26,351,224 | 0 | 0 | 0 | 0 | 272,900 | 26,351,224 | ||||||||||||||||||||||||
| Arrow Electronics, Inc. |
39,800 | 2,749,384 | (a) | 0 | 0 | 215,478 | 14,885,220 | (a) | 255,278 | 17,634,604 | (a) | |||||||||||||||||||||
| CDW Corp. |
100,340 | 11,128,709 | 0 | 0 | 0 | 0 | 100,340 | 11,128,709 | ||||||||||||||||||||||||
| Corning, Inc. |
133,400 | 3,040,186 | 0 | 0 | 276,100 | 6,292,319 | 409,500 | 9,332,505 | ||||||||||||||||||||||||
| Flextronics International Ltd. |
843,200 | 8,187,472 | (a) | 0 | 0 | 0 | 0 | 843,200 | 8,187,472 | (a) | ||||||||||||||||||||||
| II-VI, Inc. |
198,300 | 9,425,199 | (a) | 0 | 0 | 0 | 0 | 198,300 | 9,425,199 | (a) | ||||||||||||||||||||||
| Insight Enterprises, Inc. |
37,700 | 1,932,502 | (a) | 0 | 0 | 0 | 0 | 37,700 | 1,932,502 | (a) | ||||||||||||||||||||||
| Jabil, Inc. |
796,200 | 23,822,304 | 0 | 0 | 58,700 | 1,756,304 | 854,900 | 25,578,608 | ||||||||||||||||||||||||
| Keysight Technologies, Inc. |
91,001 | 9,839,938 | (a) | 124,834 | 13,498,300 | (a) | 0 | 0 | 215,835 | 23,338,238 | (a) | |||||||||||||||||||||
| Vishay Intertechnology, Inc. |
110,800 | 1,801,608 | 0 | 0 | 507,400 | 8,250,324 | 618,200 | 10,051,932 | ||||||||||||||||||||||||
|
|
|
|
|
|
|
|
|
|||||||||||||||||||||||||
| 98,278,526 | 13,498,300 | 31,184,167 | 142,960,993 | |||||||||||||||||||||||||||||
|
|
|
|
|
|
|
|
|
|||||||||||||||||||||||||
| IT Services |
||||||||||||||||||||||||||||||||
| Accenture PLC Class A |
331,361 | 66,809,005 | 0 | 0 | 0 | 0 | 331,361 | 66,809,005 | ||||||||||||||||||||||||
| Akamai Technologies, Inc. |
40,102 | 4,242,792 | (a) | 216,409 | 22,896,072 | (a) | 0 | 0 | 256,511 | 27,138,864 | (a) | |||||||||||||||||||||
| Amdocs Ltd. |
169,403 | 10,547,031 | 0 | 0 | 0 | 0 | 169,403 | 10,547,031 | ||||||||||||||||||||||||
| Automatic Data Processing, Inc. |
237,587 | 34,804,120 | 82,025 | 12,015,842 | 0 | 0 | 319,612 | 46,819,962 | ||||||||||||||||||||||||
| Booz Allen Hamilton Holding Corp. Class A |
17,812 | 1,420,685 | 134,200 | 10,703,792 | 0 | 0 | 152,012 | 12,124,477 | ||||||||||||||||||||||||
| Cognizant Technology Solutions Corp. Class A |
471,492 | 24,989,076 | 0 | 0 | 215,300 | 11,410,900 | 686,792 | 36,399,976 | ||||||||||||||||||||||||
| CSG Systems International, Inc. |
0 | 0 | 0 | 0 | 185,800 | 8,797,630 | 185,800 | 8,797,630 | ||||||||||||||||||||||||
| DXC Technology Co. |
101,232 | 1,438,507 | 0 | 0 | 162,100 | 2,303,441 | 263,332 | 3,741,948 | ||||||||||||||||||||||||
| Fidelity National Information Services, Inc. |
604,239 | 83,886,500 | 316,893 | 43,994,283 | 0 | 0 | 921,132 | 127,880,783 | ||||||||||||||||||||||||
| Fiserv, Inc. |
555,201 | 59,278,811 | (a) | 265,114 | 28,306,222 | (a) | 0 | 0 | 820,315 | 87,585,033 | (a) | |||||||||||||||||||||
| FleetCor Technologies, Inc. |
255,593 | 62,311,017 | (a) | 39,500 | 9,629,705 | (a) | 0 | 0 | 295,093 | 71,940,722 | (a) | |||||||||||||||||||||
| Gartner, Inc. |
14,700 | 1,788,990 | (a) | 0 | 0 | 0 | 0 | 14,700 | 1,788,990 | (a) | ||||||||||||||||||||||
| Genpact Ltd. |
379,300 | 13,635,835 | 0 | 0 | 0 | 0 | 379,300 | 13,635,835 | ||||||||||||||||||||||||
| Global Payments, Inc. |
329,373 | 59,119,160 | 98,650 | 17,706,689 | 0 | 0 | 428,023 | 76,825,849 | ||||||||||||||||||||||||
| GoDaddy, Inc. |
131,000 | 10,119,750 | (a) | 0 | 0 | 0 | 0 | 131,000 | 10,119,750 | (a) | ||||||||||||||||||||||
| IBM Corp. |
231,644 | 28,932,336 | 0 | 0 | 539,260 | 67,353,574 | 770,904 | 96,285,910 | ||||||||||||||||||||||||
| Leidos Holdings, Inc. |
180,140 | 18,966,941 | 0 | 0 | 0 | 0 | 180,140 | 18,966,941 | ||||||||||||||||||||||||
| MasterCard, Inc. Class A |
712,125 | 214,271,291 | 190,765 | 57,399,281 | 0 | 0 | 902,890 | 271,670,572 | ||||||||||||||||||||||||
| PayPal Holdings, Inc. |
794,214 | 123,111,112 | (a) | 306,411 | 47,496,769 | (a) | 98,419 | 15,255,929 | (a) | 1,199,044 | 185,863,810 | (a) | ||||||||||||||||||||
| Sabre Corp. |
247,100 | 1,722,287 | 0 | 0 | 0 | 0 | 247,100 | 1,722,287 | ||||||||||||||||||||||||
| The Western Union Co. |
156,000 | 3,123,120 | 0 | 0 | 163,446 | 3,272,189 | 319,446 | 6,395,309 | ||||||||||||||||||||||||
| Twilio, Inc. Class A |
69,500 | 13,733,200 | (a) | 0 | 0 | 0 | 0 | 69,500 | 13,733,200 | (a) | ||||||||||||||||||||||
| Unisys Corp. |
184,600 | 2,097,056 | (a) | 0 | 0 | 0 | 0 | 184,600 | 2,097,056 | (a) | ||||||||||||||||||||||
| VeriSign, Inc. |
55,019 | 12,049,711 | (a) | 0 | 0 | 0 | 0 | 55,019 | 12,049,711 | (a) | ||||||||||||||||||||||
| Visa, Inc. Class A |
1,345,583 | 262,711,625 | 1,103,499 | 215,447,145 | 0 | 0 | 2,449,082 | 478,158,770 | ||||||||||||||||||||||||
| Worldline SA |
28,300 | 2,108,536 | (a)(g) | 0 | 0 | 0 | 0 | 28,300 | 2,108,536 | (a)(g) | ||||||||||||||||||||||
|
|
|
|
|
|
|
|
|
|||||||||||||||||||||||||
| 1,117,218,494 | 465,595,800 | 108,393,663 | 1,691,207,957 | |||||||||||||||||||||||||||||
|
|
|
|
|
|
|
|
|
|||||||||||||||||||||||||
| Semiconductors & Semiconductor Equipment |
||||||||||||||||||||||||||||||||
| Advanced Micro Devices, Inc. |
920,219 | 49,507,782 | (a) | 0 | 0 | 0 | 0 | 920,219 | 49,507,782 | (a) | ||||||||||||||||||||||
| Analog Devices, Inc. |
277,704 | 31,366,667 | 0 | 0 | 94,749 | 10,701,900 | 372,453 | 42,068,567 | ||||||||||||||||||||||||
| Applied Materials, Inc. |
1,887,457 | 106,037,334 | 0 | 0 | 823,602 | 46,269,960 | 2,711,059 | 152,307,294 | ||||||||||||||||||||||||
| ASML Holding NV |
141,764 | 46,712,656 | 0 | 0 | 0 | 0 | 141,764 | 46,712,656 | ||||||||||||||||||||||||
| Broadcom, Inc. |
62,365 | 18,165,054 | 34,435 | 10,029,882 | 164,000 | 47,768,280 | 260,800 | 75,963,216 | ||||||||||||||||||||||||
| Cirrus Logic, Inc. |
57,700 | 4,182,096 | (a) | 0 | 0 | 85,700 | 6,211,536 | (a) | 143,400 | 10,393,632 | (a) | |||||||||||||||||||||
| Intel Corp. |
2,660,385 | 167,418,028 | 250,895 | 15,788,822 | 3,074,911 | 193,504,149 | 5,986,191 | 376,710,999 | ||||||||||||||||||||||||
| KLA-Tencor Corp. |
13,435 | 2,364,023 | 101,710 | 17,896,892 | 39,655 | 6,977,694 | 154,800 | 27,238,609 | ||||||||||||||||||||||||
| Lam Research Corp. |
244,228 | 66,837,877 | 47,800 | 13,081,426 | 140,141 | 38,352,387 | 432,169 | 118,271,690 | ||||||||||||||||||||||||
| Marvell Technology Group Ltd. |
558,515 | 18,218,759 | 0 | 0 | 0 | 0 | 558,515 | 18,218,759 | ||||||||||||||||||||||||
| Maxim Integrated Products, Inc. |
10,571 | 609,735 | 0 | 0 | 0 | 0 | 10,571 | 609,735 | ||||||||||||||||||||||||
| MediaTek, Inc. |
123,000 | 1,900,264 | 0 | 0 | 0 | 0 | 123,000 | 1,900,264 | ||||||||||||||||||||||||
| Microchip Technology, Inc. |
14,017 | 1,345,912 | 0 | 0 | 133,000 | 12,770,660 | (e) | 147,017 | 14,116,572 | (e) | ||||||||||||||||||||||
| Micron Technology, Inc. |
1,749,692 | 83,827,744 | (a) | 208,417 | 9,985,258 | (a) | 643,119 | 30,811,831 | (a) | 2,601,228 | 124,624,833 | (a) | ||||||||||||||||||||
| NVIDIA Corp. |
529,612 | 188,022,852 | 359,082 | 127,481,292 | 0 | 0 | 888,694 | 315,504,144 |
Table of Contents
| NXP Semiconductors NV |
543,462 | 52,226,698 | 0 | 0 | 77,757 | 7,472,448 | 621,219 | 59,699,146 | ||||||||||||||||||||||||
| ON Semiconductor Corp. |
318,200 | 5,247,118 | (a) | 0 | 0 | 215,547 | 3,554,370 | (a) | 533,747 | 8,801,488 | (a) | |||||||||||||||||||||
| Qorvo, Inc. |
32,308 | 3,383,940 | (a) | 0 | 0 | 94,024 | 9,848,074 | (a) | 126,332 | 13,232,014 | (a) | |||||||||||||||||||||
| Qualcomm, Inc. |
1,439,131 | 116,396,915 | 792,288 | 64,080,253 | 147,097 | 11,897,205 | 2,378,516 | 192,374,373 | ||||||||||||||||||||||||
| Sanken Electric Co. Ltd. |
33,593 | 776,241 | 0 | 0 | 0 | 0 | 33,593 | 776,241 | ||||||||||||||||||||||||
| Skyworks Solutions, Inc. |
48,500 | 5,749,190 | 0 | 0 | 175,400 | 20,791,916 | 223,900 | 26,541,106 | ||||||||||||||||||||||||
| STMicroelectronics NV (France) |
33,000 | 819,553 | 0 | 0 | 0 | 0 | 33,000 | 819,553 | ||||||||||||||||||||||||
| Taiwan Semiconductor Manufacturing Co. Ltd. Sponsored ADR |
627,426 | 31,578,351 | 0 | 0 | 0 | 0 | 627,426 | 31,578,351 | ||||||||||||||||||||||||
| Teradyne, Inc. |
39,927 | 2,675,908 | 301,200 | 20,186,424 | 0 | 0 | 341,127 | 22,862,332 | ||||||||||||||||||||||||
| Texas Instruments, Inc. |
825,219 | 97,986,504 | 275,134 | 32,669,411 | 101,065 | 12,000,458 | 1,201,418 | 142,656,373 | ||||||||||||||||||||||||
| Xilinx, Inc. |
175,800 | 16,164,810 | 0 | 0 | 0 | 0 | 175,800 | 16,164,810 | ||||||||||||||||||||||||
|
|
|
|
|
|
|
|
|
|||||||||||||||||||||||||
| 1,119,522,011 | 311,199,660 | 458,932,868 | 1,889,654,539 | |||||||||||||||||||||||||||||
|
|
|
|
|
|
|
|
|
|||||||||||||||||||||||||
| Software |
||||||||||||||||||||||||||||||||
| Adobe, Inc. |
177,885 | 68,770,341 | (a) | 187,586 | 72,520,748 | (a) | 54,500 | 21,069,700 | (a) | 419,971 | 162,360,789 | (a) | ||||||||||||||||||||
| ANSYS, Inc. |
0 | 0 | 0 | 0 | 57,000 | 16,131,000 | (a) | 57,000 | 16,131,000 | (a) | ||||||||||||||||||||||
| Autodesk, Inc. |
68,249 | 14,358,225 | (a) | 351,391 | 73,925,639 | (a) | 0 | 0 | 419,640 | 88,283,864 | (a) | |||||||||||||||||||||
| CDK Global, Inc. |
14,000 | 550,340 | 0 | 0 | 48,311 | 1,899,105 | 62,311 | 2,449,445 | ||||||||||||||||||||||||
| Ceridian HCM Holding, Inc. |
86,800 | 5,977,916 | (a) | 0 | 0 | 0 | 0 | 86,800 | 5,977,916 | (a) | ||||||||||||||||||||||
| Citrix Systems, Inc. |
94,000 | 13,923,280 | 0 | 0 | 0 | 0 | 94,000 | 13,923,280 | ||||||||||||||||||||||||
| Cloudflare, Inc. |
133,141 | 3,870,409 | (a) | 0 | 0 | 0 | 0 | 133,141 | 3,870,409 | (a) | ||||||||||||||||||||||
| Dynatrace, Inc. |
30,600 | 1,177,182 | 0 | 0 | 0 | 0 | 30,600 | 1,177,182 | ||||||||||||||||||||||||
| Elastic NV |
103,500 | 8,892,720 | (a) | 0 | 0 | 0 | 0 | 103,500 | 8,892,720 | (a) | ||||||||||||||||||||||
| Envestnet, Inc. |
100 | 7,261 | (a) | 0 | 0 | 0 | 0 | 100 | 7,261 | (a) | ||||||||||||||||||||||
| Fortinet, Inc. |
11,963 | 1,665,250 | (a) | 0 | 0 | 0 | 0 | 11,963 | 1,665,250 | (a) | ||||||||||||||||||||||
| Intuit, Inc. |
148,140 | 43,008,005 | 0 | 0 | 0 | 0 | 148,140 | 43,008,005 | ||||||||||||||||||||||||
| LivePerson, Inc. |
246,444 | 9,229,328 | (a) | 0 | 0 | 0 | 0 | 246,444 | 9,229,328 | (a) | ||||||||||||||||||||||
| Microsoft Corp. |
7,117,302 | 1,304,245,592 | 1,759,907 | 322,502,958 | 198,590 | 36,391,618 | 9,075,799 | 1,663,140,168 | ||||||||||||||||||||||||
| Nortonlifelock, Inc. |
1,978,157 | 45,062,416 | 0 | 0 | 0 | 0 | 1,978,157 | 45,062,416 | ||||||||||||||||||||||||
| Nuance Communications, Inc. |
149,200 | 3,413,696 | (a) | 0 | 0 | 0 | 0 | 149,200 | 3,413,696 | (a) | ||||||||||||||||||||||
| Nutanix, Inc. Class A |
14,300 | 344,058 | (a) | 279,050 | 6,713,943 | (a) | 0 | 0 | 293,350 | 7,058,001 | (a) | |||||||||||||||||||||
| Oracle Corp. |
762,098 | 40,978,009 | 1,209,538 | 65,036,858 | 1,446,449 | 77,775,563 | 3,418,085 | 183,790,430 | ||||||||||||||||||||||||
| Palo Alto Networks, Inc. |
0 | 0 | 63,533 | 14,947,409 | (a) | 63,533 | 14,947,409 | (a) | ||||||||||||||||||||||||
| Parametric Technology Corp. |
33,300 | 2,543,454 | (a) | 0 | 0 | 0 | 0 | 33,300 | 2,543,454 | (a) | ||||||||||||||||||||||
| Paylocity Holding Corp. |
29,900 | 3,887,150 | (a) | 0 | 0 | 0 | 0 | 29,900 | 3,887,150 | (a) | ||||||||||||||||||||||
| RingCentral, Inc. |
3,200 | 877,600 | (a) | 0 | 0 | 0 | 0 | 3,200 | 877,600 | (a) | ||||||||||||||||||||||
| Salesforce.com, Inc. |
1,116,787 | 195,203,200 | (a) | 635,397 | 111,061,042 | 0 | 0 | 1,752,184 | 306,264,242 | (a) | ||||||||||||||||||||||
| SAP SE sponsored ADR |
115,800 | 14,833,980 | 0 | 0 | 0 | 0 | 115,800 | 14,833,980 | ||||||||||||||||||||||||
| ServiceNow, Inc. |
8,250 | 3,200,423 | (a) | 0 | 0 | 0 | 0 | 8,250 | 3,200,423 | (a) | ||||||||||||||||||||||
| Splunk, Inc. |
0 | 0 | 120,760 | 22,442,038 | (a) | 120,760 | 22,442,038 | (a) | ||||||||||||||||||||||||
| SS&C Technologies Holdings, Inc. |
52,137 | 3,018,472 | 180,301 | 10,438,526 | 66,942 | 3,875,607 | 299,380 | 17,332,605 | ||||||||||||||||||||||||
| SurveyMonkey |
75,800 | 1,527,370 | (a) | 0 | 0 | 0 | 0 | 75,800 | 1,527,370 | (a) | ||||||||||||||||||||||
| Synopsys, Inc. |
163,749 | 29,623,832 | (a) | 226,444 | 40,965,984 | (a) | 0 | 0 | 390,193 | 70,589,816 | (a) | |||||||||||||||||||||
| VMware, Inc. Class A |
65,119 | 10,176,146 | (a) | 99,899 | 15,611,217 | (a) | 0 | 0 | 165,018 | 25,787,363 | (a) | |||||||||||||||||||||
| Workday, Inc. Class A |
136,953 | 25,121,289 | (a) | 122,453 | 22,461,554 | (a) | 0 | 0 | 259,406 | 47,582,843 | (a) | |||||||||||||||||||||
| Workiva, Inc. |
17,500 | 779,450 | (a) | 0 | 0 | 0 | 0 | 17,500 | 779,450 | (a) | ||||||||||||||||||||||
| Yext, Inc. |
156,600 | 2,472,714 | (a) | 0 | 0 | 0 | 0 | 156,600 | 2,472,714 | (a) | ||||||||||||||||||||||
| Zendesk, Inc. |
132,000 | 11,319,000 | (a) | 0 | 0 | 0 | 0 | 132,000 | 11,319,000 | (a) | ||||||||||||||||||||||
|
|
|
|
|
|
|
|
|
|||||||||||||||||||||||||
| 1,870,058,108 | 778,627,916 | 157,142,593 | 2,805,828,617 | |||||||||||||||||||||||||||||
|
|
|
|
|
|
|
|
|
|||||||||||||||||||||||||
| Technology Hardware, Storage & Peripherals |
||||||||||||||||||||||||||||||||
| Apple, Inc. |
3,229,093 | 1,026,657,828 | 725,377 | 230,626,363 | 0 | 0 | 3,954,470 | 1,257,284,191 | ||||||||||||||||||||||||
| Hewlett Packard Enterprise Co. |
387,900 | 3,766,509 | 0 | 0 | 1,762,380 | 17,112,710 | 2,150,280 | 20,879,219 | ||||||||||||||||||||||||
| HP, Inc. |
652,149 | 9,873,536 | 0 | 0 | 1,909,200 | 28,905,288 | 2,561,349 | 38,778,824 | ||||||||||||||||||||||||
| NCR Corp. |
76,100 | 1,373,605 | (a) | 0 | 0 | 236,200 | 4,263,410 | (a) | 312,300 | 5,637,015 | (a) | |||||||||||||||||||||
| NetApp, Inc. |
25,600 | 1,140,224 | 0 | 0 | 88,000 | 3,919,520 | 113,600 | 5,059,744 | ||||||||||||||||||||||||
| Seagate Technology LLC |
89,700 | 4,757,688 | 0 | 0 | 343,000 | 18,192,720 | 432,700 | 22,950,408 | ||||||||||||||||||||||||
| Western Digital Corp. |
212,638 | 9,434,748 | 0 | 0 | 104,634 | 4,642,611 | 317,272 | 14,077,359 | ||||||||||||||||||||||||
| Xerox Holdings Corp. |
120,850 | 1,919,098 | 0 | 0 | 282,500 | 4,486,100 | 403,350 | 6,405,198 | ||||||||||||||||||||||||
|
|
|
|
|
|
|
|
|
|||||||||||||||||||||||||
| 1,058,923,236 | 230,626,363 | 81,522,359 | 1,371,071,958 | |||||||||||||||||||||||||||||
|
|
|
|
|
|
|
|
|
|||||||||||||||||||||||||
| TOTAL INFORMATION TECHNOLOGY |
5,474,690,760 | 1,848,931,562 | 974,128,701 | 8,297,751,023 | ||||||||||||||||||||||||||||
|
|
|
|
|
|
|
|
|
|||||||||||||||||||||||||
| MATERIALS |
||||||||||||||||||||||||||||||||
| Chemicals |
||||||||||||||||||||||||||||||||
| AdvanSix, Inc. (a) |
0 | 0 | 0 | 0 | 59,849 | 708,612 | (a) | 59,849 | 708,612 | (a) | ||||||||||||||||||||||
| Albemarle Corp. U.S. |
12,700 | 971,804 | (e) | 0 | 0 | 43,700 | 3,343,924 | 56,400 | 4,315,728 | (e) | ||||||||||||||||||||||
| Amyris, Inc. |
1,018,200 | 3,797,886 | (a)(e) | 0 | 0 | 0 | 0 | 1,018,200 | 3,797,886 | (a)(e) | ||||||||||||||||||||||
| Cabot Corp. |
0 | 0 | 0 | 0 | 215,400 | 7,694,088 | 215,400 | 7,694,088 | ||||||||||||||||||||||||
| Celanese Corp. Class A |
174,509 | 15,690,104 | 0 | 0 | 278,605 | 25,049,376 | 453,114 | 40,739,480 | ||||||||||||||||||||||||
| CF Industries Holdings, Inc. |
271,648 | 7,978,302 | 0 | 0 | 0 | 0 | 271,648 | 7,978,302 | ||||||||||||||||||||||||
| Corteva, Inc. |
98,399 | 2,687,277 | 0 | 0 | 583,165 | 15,926,236 | 681,564 | 18,613,513 | ||||||||||||||||||||||||
| Dow, Inc. |
121,745 | 4,699,357 | 0 | 0 | 0 | 0 | 121,745 | 4,699,357 |
Table of Contents
| DuPont de Nemours, Inc. |
524,562 | 26,611,030 | 0 | 0 | 171,726 | 8,711,660 | 696,288 | 35,322,690 | ||||||||||||||||||||||||
| Eastman Chemical Co. |
447,223 | 30,446,942 | 0 | 0 | 399,867 | 27,222,945 | 847,090 | 57,669,887 | ||||||||||||||||||||||||
| Ecolab, Inc. |
44,092 | 9,373,077 | 88,737 | 18,863,711 | 0 | 0 | 132,829 | 28,236,788 | ||||||||||||||||||||||||
| FMC Corp. |
15,500 | 1,525,355 | 0 | 0 | 82,922 | 8,160,354 | 98,422 | 9,685,709 | ||||||||||||||||||||||||
| Huntsman Corp. |
205,800 | 3,735,270 | 0 | 0 | 826,700 | 15,004,605 | 1,032,500 | 18,739,875 | ||||||||||||||||||||||||
| Linde PLC |
447,786 | 90,605,019 | 0 | 0 | 0 | 0 | 447,786 | 90,605,019 | ||||||||||||||||||||||||
| Livent Corp. (a)(e) |
505,600 | 3,407,744 | 0 | 0 | 0 | 0 | 505,600 | 3,407,744 | ||||||||||||||||||||||||
| LyondellBasell Industries NV Class A |
181,872 | 11,596,159 | 0 | 0 | 539,031 | 34,368,617 | 720,903 | 45,964,776 | ||||||||||||||||||||||||
| Nutrien Ltd. |
59,600 | 2,034,499 | 0 | 0 | 0 | 0 | 59,600 | 2,034,499 | ||||||||||||||||||||||||
| PPG Industries, Inc. |
309,444 | 31,461,171 | 0 | 0 | 120,613 | 12,262,724 | 430,057 | 43,723,895 | ||||||||||||||||||||||||
| RPM International, Inc. |
90,100 | 6,737,678 | 0 | 0 | 136,000 | 10,170,080 | 226,100 | 16,907,758 | ||||||||||||||||||||||||
| Sherwin-Williams Co. |
23,682 | 14,063,556 | 0 | 0 | 0 | 0 | 23,682 | 14,063,556 | ||||||||||||||||||||||||
| The Chemours Co. LLC |
73,300 | 960,963 | 0 | 0 | 279,700 | 3,666,867 | 353,000 | 4,627,830 | ||||||||||||||||||||||||
| Trinseo SA |
47,700 | 981,666 | 0 | 0 | 0 | 0 | 47,700 | 981,666 | ||||||||||||||||||||||||
| Valvoline, Inc. |
306,107 | 5,617,063 | 0 | 0 | 0 | 0 | 306,107 | 5,617,063 | ||||||||||||||||||||||||
| Westlake Chemical Corp. |
217,400 | 10,369,980 | 0 | 0 | 0 | 0 | 217,400 | 10,369,980 | ||||||||||||||||||||||||
|
|
|
|
|
|
|
|
|
|||||||||||||||||||||||||
| 285,351,902 | 18,863,711 | 172,290,088 | 476,505,701 | |||||||||||||||||||||||||||||
|
|
|
|
|
|
|
|
|
|||||||||||||||||||||||||
| Construction Materials |
||||||||||||||||||||||||||||||||
| CRH PLC sponsored ADR |
0 | 0 | 0 | 0 | 159,505 | 5,129,681 | 159,505 | 5,129,681 | ||||||||||||||||||||||||
| Martin Marietta Materials, Inc. |
21,066 | 4,046,568 | 0 | 0 | 102,764 | 19,739,937 | 123,830 | 23,786,505 | ||||||||||||||||||||||||
| Summit Materials, Inc. |
496,800 | 7,546,392 | (a) | 0 | 0 | 0 | 0 | 496,800 | 7,546,392 | (a) | ||||||||||||||||||||||
| Vulcan Materials Co. |
81,927 | 8,874,333 | 0 | 0 | 0 | 0 | 81,927 | 8,874,333 | ||||||||||||||||||||||||
|
|
|
|
|
|
|
|
|
|||||||||||||||||||||||||
| 20,467,293 | 0 | 24,869,618 | 45,336,911 | |||||||||||||||||||||||||||||
|
|
|
|
|
|
|
|
|
|||||||||||||||||||||||||
| Containers & Packaging |
||||||||||||||||||||||||||||||||
| Avery Dennison Corp. |
102,200 | 11,310,474 | 0 | 0 | 30,256 | 3,348,432 | 132,456 | 14,658,906 | ||||||||||||||||||||||||
| Ball Corp. |
0 | 0 | 0 | 0 | 109,418 | 7,797,127 | 109,418 | 7,797,127 | ||||||||||||||||||||||||
| Berry Global Group, Inc. |
848,826 | 38,120,776 | (a) | 0 | 0 | 0 | 0 | 848,826 | 38,120,776 | (a) | ||||||||||||||||||||||
| Crown Holdings, Inc. |
353,289 | 23,115,699 | (a) | 0 | 0 | 55,800 | 3,650,994 | (a) | 409,089 | 26,766,693 | (a) | |||||||||||||||||||||
| Graphic Packaging Holding Co. |
0 | 0 | 0 | 0 | 532,730 | 7,708,603 | 532,730 | 7,708,603 | ||||||||||||||||||||||||
| International Paper Co. |
257,300 | 8,761,065 | 0 | 0 | 396,735 | 13,508,827 | 654,035 | 22,269,892 | ||||||||||||||||||||||||
| O-I Glass, Inc. |
154,700 | 1,185,002 | 0 | 0 | 0 | 0 | 154,700 | 1,185,002 | ||||||||||||||||||||||||
| Packaging Corp. of America |
73,663 | 7,470,165 | 0 | 0 | 131,413 | 13,326,592 | 205,076 | 20,796,757 | ||||||||||||||||||||||||
| Sealed Air Corp. |
156,054 | 5,009,333 | 0 | 0 | 61,900 | 1,986,990 | 217,954 | 6,996,323 | ||||||||||||||||||||||||
| Sonoco Products Co. |
9,500 | 492,195 | 0 | 0 | 32,556 | 1,686,726 | 42,056 | 2,178,921 | ||||||||||||||||||||||||
| WestRock Co. |
49,500 | 1,388,970 | 0 | 0 | 604,402 | 16,959,520 | 653,902 | 18,348,490 | ||||||||||||||||||||||||
|
|
|
|
|
|
|
|
|
|||||||||||||||||||||||||
| 96,853,679 | 0 | 69,973,811 | 166,827,490 | |||||||||||||||||||||||||||||
|
|
|
|
|
|
|
|
|
|||||||||||||||||||||||||
| Metals & Mining |
||||||||||||||||||||||||||||||||
| Barrick Gold Corp. |
0 | 0 | 0 | 0 | 643,422 | 15,442,128 | 643,422 | 15,442,128 | ||||||||||||||||||||||||
| BHP Billiton Ltd. sponsored ADR |
101,700 | 4,790,070 | (e) | 0 | 0 | 0 | 0 | 101,700 | 4,790,070 | (e) | ||||||||||||||||||||||
| First Quantum Minerals Ltd. |
689,500 | 4,041,301 | 0 | 0 | 0 | 0 | 689,500 | 4,041,301 | ||||||||||||||||||||||||
| Freeport-McMoRan, Inc. |
167,900 | 1,522,853 | 0 | 0 | 577,700 | 5,239,739 | 745,600 | 6,762,592 | ||||||||||||||||||||||||
| Lundin Mining Corp. |
1,122,000 | 5,166,489 | 0 | 0 | 0 | 0 | 1,122,000 | 5,166,489 | ||||||||||||||||||||||||
| Newmont Corp. |
364,815 | 21,330,733 | 0 | 0 | 73,907 | 4,321,342 | 438,722 | 25,652,075 | ||||||||||||||||||||||||
| Nucor Corp. |
50,394 | 2,129,650 | 0 | 0 | 124,803 | 5,274,175 | 175,197 | 7,403,825 | ||||||||||||||||||||||||
| Reliance Steel & Aluminum Co. |
8,000 | 776,000 | 0 | 0 | 86,764 | 8,416,108 | 94,764 | 9,192,108 | ||||||||||||||||||||||||
| Steel Dynamics, Inc. |
25,800 | 685,248 | 0 | 0 | 88,800 | 2,358,528 | 114,600 | 3,043,776 | ||||||||||||||||||||||||
| Wheaton Precious Metals Corp. |
69,400 | 2,990,019 | 0 | 0 | 0 | 0 | 69,400 | 2,990,019 | ||||||||||||||||||||||||
| Yamana Gold, Inc. |
0 | 0 | 0 | 0 | 868,534 | 4,699,552 | 868,534 | 4,699,552 | ||||||||||||||||||||||||
|
|
|
|
|
|
|
|
|
|||||||||||||||||||||||||
| 43,432,363 | 0 | 45,751,572 | 89,183,935 | |||||||||||||||||||||||||||||
|
|
|
|
|
|
|
|
|
|||||||||||||||||||||||||
| Paper & Forest Products |
||||||||||||||||||||||||||||||||
| Domtar Corp. |
62,600 | 1,277,040 | 0 | 0 | 211,100 | 4,306,440 | 273,700 | 5,583,480 | ||||||||||||||||||||||||
| Schweitzer-Mauduit International, Inc. |
75,400 | 2,291,406 | 0 | 0 | 165,200 | 5,020,428 | 240,600 | 7,311,834 | ||||||||||||||||||||||||
|
|
|
|
|
|
|
|
|
|||||||||||||||||||||||||
| 3,568,446 | 0 | 9,326,868 | 12,895,314 | |||||||||||||||||||||||||||||
|
|
|
|
|
|
|
|
|
|||||||||||||||||||||||||
| TOTAL MATERIALS |
449,673,683 | 18,863,711 | 322,211,957 | 790,749,351 | ||||||||||||||||||||||||||||
|
|
|
|
|
|
|
|
|
|||||||||||||||||||||||||
| REAL ESTATE |
||||||||||||||||||||||||||||||||
| Equity Real Estate Investment Trusts (REITs) |
||||||||||||||||||||||||||||||||
| Alexandria Real Estate Equities, Inc. |
59,900 | 9,207,828 | 0 | 0 | 0 | 0 | 59,900 | 9,207,828 | ||||||||||||||||||||||||
| American Homes 4 Rent Class A |
61,600 | 1,554,784 | 0 | 0 | 262,545 | 6,626,636 | 324,145 | 8,181,420 | ||||||||||||||||||||||||
| American Tower Corp. |
248,281 | 64,098,706 | 145,400 | 37,537,918 | 0 | 0 | 393,681 | 101,636,624 | ||||||||||||||||||||||||
| Apartment Investment & Management Co. Class A |
19,840 | 731,501 | 0 | 0 | 0 | 0 | 19,840 | 731,501 | ||||||||||||||||||||||||
| AvalonBay Communities, Inc. |
114,226 | 17,820,398 | 0 | 0 | 0 | 0 | 114,226 | 17,820,398 | ||||||||||||||||||||||||
| Boston Properties, Inc. |
42,305 | 3,637,384 | 0 | 0 | 30,780 | 2,646,464 | 73,085 | 6,283,848 | ||||||||||||||||||||||||
| Brandywine Realty Trust (SBI) |
0 | 0 | 0 | 0 | 614,800 | 5,932,820 | 614,800 | 5,932,820 | ||||||||||||||||||||||||
| Brixmor Property Group, Inc. |
0 | 0 | 0 | 0 | 434,789 | 4,852,245 | 434,789 | 4,852,245 | ||||||||||||||||||||||||
| Corporate Office Properties Trust (SBI) |
153,600 | 3,835,392 | 0 | 0 | 0 | 0 | 153,600 | 3,835,392 | ||||||||||||||||||||||||
| Crown Castle International Corp. |
9,372 | 1,613,484 | 0 | 0 | 0 | 0 | 9,372 | 1,613,484 | ||||||||||||||||||||||||
| CubeSmart |
72,700 | 2,069,042 | 0 | 0 | 0 | 0 | 72,700 | 2,069,042 |
Table of Contents
| Digital Realty Trust, Inc. |
44,718 | 6,419,716 | 0 | 0 | 0 | 0 | 44,718 | 6,419,716 | ||||||||||||||||||||||||
| EastGroup Properties, Inc. |
0 | 0 | 0 | 0 | 33,566 | 3,902,048 | 33,566 | 3,902,048 | ||||||||||||||||||||||||
| Equinix, Inc. |
29,450 | 20,545,204 | (i) | 31,222 | 21,781,404 | 0 | 0 | 60,672 | 42,326,608 | (i) | ||||||||||||||||||||||
| Equity Lifestyle Properties, Inc. |
156,388 | 9,742,972 | 0 | 0 | 100,000 | 6,230,000 | 256,388 | 15,972,972 | ||||||||||||||||||||||||
| Equity Residential (SBI) |
246,439 | 14,924,346 | 0 | 0 | 0 | 0 | 246,439 | 14,924,346 | ||||||||||||||||||||||||
| Essex Property Trust, Inc. |
47,790 | 11,601,978 | 0 | 0 | 0 | 0 | 47,790 | 11,601,978 | ||||||||||||||||||||||||
| Extra Space Storage, Inc. |
31,801 | 3,076,747 | 0 | 0 | 0 | 0 | 31,801 | 3,076,747 | ||||||||||||||||||||||||
| Federal Realty Investment Trust (SBI) |
0 | 0 | 0 | 0 | 64,878 | 5,184,401 | 64,878 | 5,184,401 | ||||||||||||||||||||||||
| Hospitality Properties Trust (SBI) |
122,200 | 824,850 | 0 | 0 | 461,800 | 3,117,150 | 584,000 | 3,942,000 | ||||||||||||||||||||||||
| Host Hotels & Resorts, Inc. |
133,600 | 1,595,184 | 0 | 0 | 0 | 0 | 133,600 | 1,595,184 | ||||||||||||||||||||||||
| JBG SMITH Properties |
68,650 | 2,040,965 | 0 | 0 | 0 | 0 | 68,650 | 2,040,965 | ||||||||||||||||||||||||
| Kimco Realty Corp. |
132,311 | 1,469,975 | 0 | 0 | 318,986 | 3,543,934 | 451,297 | 5,013,909 | ||||||||||||||||||||||||
| Lexington Corporate Properties Trust |
31,200 | 303,264 | 0 | 0 | 666,800 | 6,481,296 | 698,000 | 6,784,560 | ||||||||||||||||||||||||
| Medical Properties Trust, Inc. |
63,532 | 1,148,659 | 480,416 | 8,685,921 | 0 | 0 | 543,948 | 9,834,580 | ||||||||||||||||||||||||
| Mid-America Apartment Communities, Inc. |
0 | 0 | 0 | 0 | 77,919 | 9,066,655 | 77,919 | 9,066,655 | ||||||||||||||||||||||||
| Omega Healthcare Investors, Inc. |
83,300 | 2,593,962 | 0 | 0 | 356,200 | 11,092,068 | 439,500 | 13,686,030 | ||||||||||||||||||||||||
| Outfront Media, Inc. |
137,000 | 1,923,480 | 0 | 0 | 244,260 | 3,429,410 | 381,260 | 5,352,890 | ||||||||||||||||||||||||
| Paramount Group, Inc. |
0 | 0 | 0 | 0 | 715,000 | 5,512,650 | 715,000 | 5,512,650 | ||||||||||||||||||||||||
| Park Hotels & Resorts, Inc. |
86,500 | 850,295 | 0 | 0 | 332,200 | 3,265,526 | 418,700 | 4,115,821 | ||||||||||||||||||||||||
| Piedmont Office Realty Trust, Inc. Class A |
128,500 | 2,143,380 | 0 | 0 | 655,900 | 10,940,412 | 784,400 | 13,083,792 | ||||||||||||||||||||||||
| Potlatch Corp. |
56,795 | 1,930,462 | 0 | 0 | 0 | 0 | 56,795 | 1,930,462 | ||||||||||||||||||||||||
| Prologis, Inc. |
1,232,725 | 112,794,338 | 0 | 0 | 0 | 0 | 1,232,725 | 112,794,338 | ||||||||||||||||||||||||
| Public Storage |
14,700 | 2,980,278 | 0 | 0 | 53,978 | 10,943,500 | 68,678 | 13,923,778 | ||||||||||||||||||||||||
| Rayonier, Inc. |
0 | 0 | 0 | 0 | 292,715 | 6,951,981 | 292,715 | 6,951,981 | ||||||||||||||||||||||||
| Realty Income Corp. |
29,538 | 1,633,747 | 0 | 0 | 0 | 0 | 29,538 | 1,633,747 | ||||||||||||||||||||||||
| SBA Communications Corp. Class A |
27,444 | 8,620,984 | 0 | 0 | 0 | 0 | 27,444 | 8,620,984 | ||||||||||||||||||||||||
| Simon Property Group, Inc. |
174,085 | 10,044,705 | 0 | 0 | 0 | 0 | 174,085 | 10,044,705 | ||||||||||||||||||||||||
| SITE Centers Corp. |
166,350 | 943,205 | 0 | 0 | 0 | 0 | 166,350 | 943,205 | ||||||||||||||||||||||||
| SL Green Realty Corp. |
137,937 | 5,809,906 | 0 | 0 | 0 | 0 | 137,937 | 5,809,906 | ||||||||||||||||||||||||
| Sun Communities, Inc. |
0 | 0 | 0 | 0 | 47,000 | 6,447,930 | 47,000 | 6,447,930 | ||||||||||||||||||||||||
| Ventas, Inc. |
518,053 | 18,105,952 | 0 | 0 | 0 | 0 | 518,053 | 18,105,952 | ||||||||||||||||||||||||
| VEREIT, Inc. |
453,100 | 2,482,988 | 0 | 0 | 2,035,200 | 11,152,896 | 2,488,300 | 13,635,884 | ||||||||||||||||||||||||
| VICI Properties, Inc. |
48,600 | 953,532 | 0 | 0 | 0 | 0 | 48,600 | 953,532 | ||||||||||||||||||||||||
| Weyerhaeuser Co. |
616,421 | 12,445,540 | 0 | 0 | 244,921 | 4,944,955 | 861,342 | 17,390,495 | ||||||||||||||||||||||||
|
|
|
|
|
|
|
|
|
|||||||||||||||||||||||||
| 364,519,133 | 68,005,243 | 132,264,977 | 564,789,353 | |||||||||||||||||||||||||||||
|
|
|
|
|
|
|
|
|
|||||||||||||||||||||||||
| Real Estate Management & Development |
||||||||||||||||||||||||||||||||
| CBRE Group, Inc. |
88,676 | 3,899,970 | (a) | 367,037 | 16,142,287 | (a) | 324,057 | 14,252,027 | 779,770 | 34,294,284 | (a) | |||||||||||||||||||||
| Cushman & Wakefield PLC |
252,300 | 2,586,075 | (a) | 0 | 0 | 0 | 0 | 252,300 | 2,586,075 | (a) | ||||||||||||||||||||||
|
|
|
|
|
|
|
|
|
|||||||||||||||||||||||||
| 6,486,045 | 16,142,287 | 14,252,027 | 36,880,359 | |||||||||||||||||||||||||||||
|
|
|
|
|
|
|
|
|
|||||||||||||||||||||||||
| TOTAL REAL ESTATE |
371,005,178 | 84,147,530 | 146,517,004 | 601,669,712 | ||||||||||||||||||||||||||||
|
|
|
|
|
|
|
|
|
|||||||||||||||||||||||||
| UTILITIES |
||||||||||||||||||||||||||||||||
| Electric Utilities |
||||||||||||||||||||||||||||||||
| American Electric Power Co., Inc. |
290,200 | 24,739,550 | 0 | 0 | 435,524 | 37,128,421 | 725,724 | 61,867,971 | ||||||||||||||||||||||||
| Duke Energy Corp. |
264,388 | 22,639,544 | 0 | 0 | 81,863 | 7,009,929 | 346,251 | 29,649,473 | ||||||||||||||||||||||||
| Edison International |
109,500 | 6,363,045 | 0 | 0 | 228,857 | 13,298,880 | 338,357 | 19,661,925 | ||||||||||||||||||||||||
| Entergy Corp. |
278,528 | 28,359,721 | 0 | 0 | 56,844 | 5,787,856 | 335,372 | 34,147,577 | ||||||||||||||||||||||||
| Evergy, Inc. |
255,331 | 15,751,369 | 0 | 0 | 93,800 | 5,786,522 | 349,131 | 21,537,891 | ||||||||||||||||||||||||
| Exelon Corp. |
527,165 | 20,195,691 | 0 | 0 | 657,000 | 25,169,670 | 1,184,165 | 45,365,361 | ||||||||||||||||||||||||
| FirstEnergy Corp. |
54,200 | 2,290,492 | 0 | 0 | 176,700 | 7,467,342 | 230,900 | 9,757,834 | ||||||||||||||||||||||||
| NextEra Energy, Inc. |
986,278 | 252,053,206 | 0 | 0 | 64,612 | 16,512,243 | 1,050,890 | 268,565,449 | ||||||||||||||||||||||||
| NRG Energy, Inc. |
1,747,808 | 63,008,478 | 0 | 0 | 385,500 | 13,897,275 | 2,133,308 | 76,905,753 | ||||||||||||||||||||||||
| OGE Energy Corp. |
23,100 | 723,492 | 0 | 0 | 79,636 | 2,494,200 | 102,736 | 3,217,692 | ||||||||||||||||||||||||
| Pinnacle West Capital Corp. |
51,701 | 4,027,508 | 0 | 0 | 68,575 | 5,341,993 | 120,276 | 9,369,501 | ||||||||||||||||||||||||
| Southern Co. |
846,288 | 48,297,656 | 0 | 0 | 0 | 0 | 846,288 | 48,297,656 | ||||||||||||||||||||||||
| Xcel Energy, Inc. |
498,290 | 32,403,799 | 0 | 0 | 233,601 | 15,191,073 | 731,891 | 47,594,872 | ||||||||||||||||||||||||
|
|
|
|
|
|
|
|
|
|||||||||||||||||||||||||
| 520,853,551 | 0 | 155,085,404 | 675,938,955 | |||||||||||||||||||||||||||||
|
|
|
|
|
|
|
|
|
|||||||||||||||||||||||||
| Gas Utilities |
||||||||||||||||||||||||||||||||
| Atmos Energy Corp. |
127,400 | 13,094,172 | 0 | 0 | 0 | 0 | 127,400 | 13,094,172 | ||||||||||||||||||||||||
| UGI Corp. |
166,897 | 5,314,000 | 0 | 0 | 0 | 0 | 166,897 | 5,314,000 | ||||||||||||||||||||||||
|
|
|
|
|
|
|
|
|
|||||||||||||||||||||||||
| 18,408,172 | 0 | 0 | 18,408,172 | |||||||||||||||||||||||||||||
|
|
|
|
|
|
|
|
|
|||||||||||||||||||||||||
| Independent Power and Renewable Electricity Producers |
||||||||||||||||||||||||||||||||
| NextEra Energy Partners LP |
39,300 | 2,008,623 | 0 | 0 | 0 | 0 | 39,300 | 2,008,623 | ||||||||||||||||||||||||
| The AES Corp. |
502,119 | 6,271,466 | 0 | 0 | 256,269 | 3,200,800 | 758,388 | 9,472,266 | ||||||||||||||||||||||||
| Vistra Energy Corp. |
321,360 | 6,568,598 | 0 | 0 | 1,014,305 | 20,732,394 | 1,335,665 | 27,300,992 | ||||||||||||||||||||||||
|
|
|
|
|
|
|
|
|
|||||||||||||||||||||||||
| 14,848,687 | 0 | 23,933,194 | 38,781,881 | |||||||||||||||||||||||||||||
|
|
|
|
|
|
|
|
|
Table of Contents
| Multi-Utilities |
||||||||||||||||||||||||||||||||
| Ameren Corp. |
399,600 | 29,862,108 | 0 | 0 | 0 | 0 | 399,600 | 29,862,108 | ||||||||||||||||||||||||
| CenterPoint Energy, Inc. |
124,600 | 2,215,388 | 0 | 0 | 100,952 | 1,794,927 | 225,552 | 4,010,315 | ||||||||||||||||||||||||
| CenterPoint Energy, Inc. |
108,819 | 1,741,322 | (k) | 0 | 0 | 0 | 0 | 108,819 | 1,741,322 | (k) | ||||||||||||||||||||||
| Dominion Energy, Inc. |
155,085 | 13,183,776 | 0 | 0 | 0 | 0 | 155,085 | 13,183,776 | ||||||||||||||||||||||||
| DTE Energy Co. |
3,209 | 345,192 | 0 | 0 | 0 | 0 | 3,209 | 345,192 | ||||||||||||||||||||||||
| NiSource, Inc. |
815,055 | 19,422,761 | 0 | 0 | 0 | 0 | 815,055 | 19,422,761 | ||||||||||||||||||||||||
| Public Service Enterprise Group, Inc. |
251,215 | 12,822,014 | 0 | 0 | 560,128 | 28,588,933 | 811,343 | 41,410,947 | ||||||||||||||||||||||||
| Sempra Energy |
451,752 | 57,060,795 | 0 | 0 | 0 | 0 | 451,752 | 57,060,795 | ||||||||||||||||||||||||
|
|
|
|
|
|
|
|
|
|||||||||||||||||||||||||
| 136,653,356 | 0 | 30,383,860 | 167,037,216 | |||||||||||||||||||||||||||||
|
|
|
|
|
|
|
|
|
|||||||||||||||||||||||||
| TOTAL UTILITIES |
690,763,766 | 0 | 209,402,458 | 900,166,224 | ||||||||||||||||||||||||||||
|
|
|
|
|
|
|
|
|
|||||||||||||||||||||||||
| TOTAL COMMON STOCKS |
22,062,108,833 | 4,692,180,399 | 7,308,578,685 | 34,062,867,917 | ||||||||||||||||||||||||||||
|
|
|
|
|
|
|
|
|
|||||||||||||||||||||||||
| Convertible Preferred Stocks – 0.0% |
||||||||||||||||||||||||||||||||
| CONSUMER DISCRETIONARY |
||||||||||||||||||||||||||||||||
| Diversified Consumer Services |
||||||||||||||||||||||||||||||||
| Airbnb, Inc. Series D |
0 | 0 | 98,859 | 6,355,645 | (a)(m)(l) | 0 | 0 | 98,859 | 6,355,645 | (a)(m)(l) | ||||||||||||||||||||||
|
|
|
|
|
|
|
|
|
|||||||||||||||||||||||||
| Internet & Direct Marketing Retail |
||||||||||||||||||||||||||||||||
| The Honest Co., Inc. Series D |
32,084 | 1,468,164 | (a)(k)(l) | 0 | 0 | 0 | 0 | 32,084 | 1,468,164 | (a)(k)(l) | ||||||||||||||||||||||
|
|
|
|
|
|
|
|
|
|||||||||||||||||||||||||
| TOTAL CONVERTIBLE PREFERRED STOCKS |
1,468,164 | 6,355,645 | 0 | 7,823,809 | ||||||||||||||||||||||||||||
|
|
|
|
|
|
|
|
|
|||||||||||||||||||||||||
| Equity Funds – 22.5% |
||||||||||||||||||||||||||||||||
| Large Blend Funds |
||||||||||||||||||||||||||||||||
| Fidelity SAI U.S. Large Cap Index Fund |
64,400,039 | 1,056,804,634 | (f) | 4,953,880 | 81,293,175 | (f) | 32,407,040 | 531,799,524 | (f) | 101,760,959 | 1,669,897,333 | (f) | ||||||||||||||||||||
| Fidelity SAI U.S. Low Volatility Index Fund |
0 | 0 | 0 | 0 | 33,865,138 | 489,689,898 | (f) | 33,865,138 | 489,689,898 | (f) | ||||||||||||||||||||||
| JPMorgan U.S. Large Cap Core Plus Fund Select Class |
28,680,102 | 698,647,292 | (j) | 0 | 0 | 0 | 0 | 28,680,102 | 698,647,292 | (j) | ||||||||||||||||||||||
| PIMCO StocksPLUS Absolute Return Fund Institutional Class |
49,982,553 | 507,322,916 | 0 | 0 | 0 | 0 | 49,982,553 | 507,322,916 | ||||||||||||||||||||||||
|
|
|
|
|
|
|
|
|
|||||||||||||||||||||||||
| 2,262,774,842 | 81,293,175 | 1,021,489,422 | 3,365,557,439 | |||||||||||||||||||||||||||||
|
|
|
|
|
|
|
|
|
|||||||||||||||||||||||||
| Large Growth Funds |
||||||||||||||||||||||||||||||||
| Fidelity Contrafund |
0 | 0 | 10,108,354 | 144,953,803 | (f) | 0 | 0 | 10,108,354 | 144,953,803 | (f) | ||||||||||||||||||||||
| Fidelity Growth Company Fund |
3,266,803 | 80,232,680 | (f) | 120,728,015 | 2,965,080,055 | (f) | 0 | 0 | 123,994,818 | 3,045,312,735 | (f) | |||||||||||||||||||||
| Fidelity SAI U.S. Momentum Index Fund |
1,193,650 | 16,973,699 | (f) | 231,701 | 3,294,795 | (f) | 0 | 0 | 1,425,351 | 20,268,494 | (f) | |||||||||||||||||||||
| Fidelity SAI U.S. Quality Index Fund |
141,991,912 | 2,101,480,276 | (f) | 14,559,510 | 215,480,751 | (f) | 0 | 0 | 156,551,422 | 2,316,961,027 | (f) | |||||||||||||||||||||
| Principal Blue Chip Fund Institutional Class |
0 | 0 | 5,468,630 | 156,293,451 | 0 | 0 | 5,468,630 | 156,293,451 | ||||||||||||||||||||||||
|
|
|
|
|
|
|
|
|
|||||||||||||||||||||||||
| 2,198,686,655 | 3,485,102,855 | 0 | 5,683,789,510 | |||||||||||||||||||||||||||||
|
|
|
|
|
|
|
|
|
|||||||||||||||||||||||||
| Large Value Funds |
||||||||||||||||||||||||||||||||
| Fidelity SAI U.S. Value Index Fund |
0 | 0 | 0 | 0 | 5,950,647 | 51,830,133 | (f) | 5,950,647 | 51,830,133 | (f) | ||||||||||||||||||||||
| Invesco Diversified Dividend Fund Class R6 |
0 | 0 | 0 | 0 | 8,586,887 | 149,755,308 | 8,586,887 | 149,755,308 | ||||||||||||||||||||||||
|
|
|
|
|
|
|
|
|
|||||||||||||||||||||||||
| 0 | 0 | 201,585,441 | 201,585,441 | |||||||||||||||||||||||||||||
|
|
|
|
|
|
|
|
|
|||||||||||||||||||||||||
| Mid-Cap Blend Funds |
||||||||||||||||||||||||||||||||
| Fidelity Mid Cap Index Fund |
8,730,205 | 184,207,331 | (f) | 0 | 0 | 0 | 0 | 8,730,205 | 184,207,331 | (f) | ||||||||||||||||||||||
|
|
|
|
|
|
|
|
|
|||||||||||||||||||||||||
| Mid-Cap Growth Funds |
||||||||||||||||||||||||||||||||
| Janus Henderson Enterprise Fund |
0 | 0 | 4,588,861 | 603,572,898 | 0 | 0 | 4,588,861 | 603,572,898 | ||||||||||||||||||||||||
|
|
|
|
|
|
|
|
|
|||||||||||||||||||||||||
| TOTAL EQUITY FUNDS |
4,645,668,828 | 4,169,968,928 | 1,223,074,863 | 10,038,712,619 | ||||||||||||||||||||||||||||
|
|
|
|
|
|
|
|
|
|||||||||||||||||||||||||
| Other – 0.0% |
||||||||||||||||||||||||||||||||
| Commodity Funds – Broad Basket |
||||||||||||||||||||||||||||||||
| Fidelity SAI Inflation-Focused Fund |
831,202 | 7,015,345 | (f) | 0 | 0 | 0 | 0 | 831,202 | 7,015,345 | (f) | ||||||||||||||||||||||
|
|
|
|
|
|
|
|
|
|||||||||||||||||||||||||
| Principal | Principal | Principal | Principal | |||||||||||||||||||||||||||||
| U.S. Treasury Obligations – 0.0% |
||||||||||||||||||||||||||||||||
| U.S. Treasury Bills, yield at date of purchase 0% to 0.26% 8/20/20 to 2/25/21 |
$ | 5,235,000 | 5,232,492 | (h) | $ | 0 | 0 | $ | 0 | 0 | $ | 5,235,000 | 5,232,492 | (h) | ||||||||||||||||||
|
|
|
|
|
|
|
|
|
|||||||||||||||||||||||||
| Shares | Shares | Shares | Shares | |||||||||||||||||||||||||||||
| Money Market Funds – 1.1% |
||||||||||||||||||||||||||||||||
| Fidelity Cash Central Fund 0.11% |
39,111,541 | 39,119,363 | (b) | 0 | 0 | 0 | 0 | 39,111,541 | 39,119,363 | (b) | ||||||||||||||||||||||
| Fidelity Securities Lending Cash Central Fund 0.10% |
51,687,030 | 51,692,199 | (b)(d) | 0 | 0 | 52,520,993 | 52,526,246 | (b)(d) | 104,208,023 | 104,218,445 | (b)(d) | |||||||||||||||||||||
| Invesco Government & Agency Portfolio Institutional Class .12% |
221,716,147 | 221,716,147 | (c) | 39,109,592 | 39,109,592 | (c) | 0 | 0 | 260,825,739 | 260,825,739 | (c) | |||||||||||||||||||||
| State Street Institutional U.S. Government Money Market Fund Premier Class .12% |
0 | 0 | 0 | 0 | 109,266,433 | 109,266,433 | (c) | 109,266,433 | 109,266,433 | (c) | ||||||||||||||||||||||
|
|
|
|
|
|
|
|
|
|||||||||||||||||||||||||
| TOTAL MONEY MARKET FUNDS |
312,527,709 | 39,109,592 | 161,792,679 | 513,429,980 | ||||||||||||||||||||||||||||
|
|
|
|
|
|
|
|
|
|||||||||||||||||||||||||
| TOTAL INVESTMENT PORTFOLIO – 100.0% |
27,034,021,371 | 8,907,614,564 | 8,693,446,227 | 44,635,082,162 | ||||||||||||||||||||||||||||
| NET OTHER ASSETS (LIABILITIES) – (0.0)% |
(7,940,102 | ) | (2,104,705 | ) | (27,283,724 | ) | (37,328,531 | ) | ||||||||||||||||||||||||
|
|
|
|
|
|
|
|
|
|||||||||||||||||||||||||
| NET ASSETS – 100% |
$ | 27,026,081,269 | $ | 8,905,509,859 | $ | 8,666,162,503 | $ | 44,597,753,631 | ||||||||||||||||||||||||
|
|
|
|
|
|
|
|
|
|||||||||||||||||||||||||
| Cost of Investments |
$ | 18,948,703,354 | $ | 4,748,539,766 | $ | 7,190,892,720 | $ | 30,888,135,840 | ||||||||||||||||||||||||
|
|
|
|
|
|
|
|
|
Table of Contents
Fidelity Rutland Square Trust II: Strategic Advisers Core Fund
Fidelity Rutland Square Trust II: Strategic Advisers Value Fund
Fidelity Rutland Square Trust II: Strategic Advisers Growth Fund
Pro Forma Combined Investments
As of May 31, 2020 (Unaudited)
| Strategic Advisers Core Fund | Strategic Advisers Growth Fund | Strategic Advisers Value Fund | Strategic Advisers Large Cap Value Fund | |||||||||||||||||||||||||||||||||||||||||||||||||||
| (Acquired Fund) |
(Acquired Fund) | (Acquired Fund) | Pro Forma Combined | |||||||||||||||||||||||||||||||||||||||||||||||||||
| Written Options | Written Options | |||||||||||||||||||||||||||||||||||||||||||||||||||||
| Call Options |
Counterparty | Number of Contracts |
Notional Amount |
Exercise Price |
Expiration Date |
Value | Call Options | Counterparty | Number of Contracts |
Notional Amount |
Exercise Price |
Expiration Date |
Value | |||||||||||||||||||||||||||||||||||||||||
| Equinix, Inc |
Chicago Board Options Exchange | 34 | $ | 2,371,942 | $ | 700.00 | 6/19/20 | ($ | 60,180 | ) | Equinix, Inc |
Chicago Board Options Exchange | 34 | $ | 2,371,942 | $ | 700.00 | 6/19/20 | ($ | 60,180 | ) | |||||||||||||||||||||||||||||||||
| Walmart, Inc. |
Chicago Board Options Exchange | 526 | $ | 6,525,556 | $ | 120.00 | 6/19/20 | ($ | 281,410 | ) | Walmart, Inc. |
Chicago Board Options Exchange | 526 | $ | 6,525,556 | $ | 120.00 | 6/19/20 | ($ | 281,410 | ) | |||||||||||||||||||||||||||||||||
|
|
|
|
|
|||||||||||||||||||||||||||||||||||||||||||||||||||
| Total Written Options |
($ | 341,590 | ) | Total Written Options |
($ | 341,590 | ) | |||||||||||||||||||||||||||||||||||||||||||||||
|
|
|
|
|
|||||||||||||||||||||||||||||||||||||||||||||||||||
| Futures Contracts | Futures Contracts | |||||||||||||||||||||||||||||||||||||||||||||||||||||
| Number of contracts |
Expiration Date |
Notional Amount |
Value | Unrealized Appreciation/ (Depreciation) |
Number of contracts |
Expiration Date |
Notional Amount |
Value | Unrealized Appreciation/ (Depreciation) |
|||||||||||||||||||||||||||||||||||||||||||||
| Purchased | Purchased | |||||||||||||||||||||||||||||||||||||||||||||||||||||
| Equity Index Contracts |
Equity Index Contracts |
|||||||||||||||||||||||||||||||||||||||||||||||||||||
| CME E-mini S&P 500 Index Contracts (United States) |
295 | June 2020 | $ | 44,869,500 | $ | 5,979,719 | $ | 5,979,719 | CME E-mini S&P 500 Index Contracts (United States) |
295 | June 2020 | $ | 44,869,500 | $ | 5,979,719 | $ | 5,979,719 | |||||||||||||||||||||||||||||||||||||
|
|
|
|
|
|||||||||||||||||||||||||||||||||||||||||||||||||||
| The notional amount of futures as a percentage of Net Assets is 0.2% |
|
The notional amount of futures as a percentage of Net Assets is 0.1% | ||||||||||||||||||||||||||||||||||||||||||||||||||||
Table of Contents
Fidelity Rutland Square Trust II: Strategic Advisers Core Fund
Fidelity Rutland Square Trust II: Strategic Advisers Value Fund
Fidelity Rutland Square Trust II: Strategic Advisers Growth Fund
Pro Forma Combined Investments
As of May 31, 2020 (Unaudited)
Strategic Advisers Core Fund
(Acquired Fund)
Legend
(a) Non-income producing
(b) Affiliated fund that is generally available only to investment companies and other accounts managed by Fidelity Investments. The rate quoted is the annualized seven-day yield of the fund at period end. A complete unaudited listing of the fund’s holdings as of its most recent quarter end is available upon request. In addition, each Fidelity Central Fund’s financial statements , which are not covered by the Fund’s Report of Independent Registered Public Accounting Firm, are available on the SEC’s website or upon request.
(c) The rate quoted is the annualized seven-day yield of the fund at period end.
(d) Investment made with cash collateral received from securities on loan.
(e) Security or a portion of the security is on loan at period end.
(f) Affiliated Fund
(g) Security exempt from registration under Rule 144A of the Securities Act of 1933. These securities may be resold in transactions exempt from registration, normally to qualified institutional buyers. At the end of the period, the value of these securities amounted to $3,975,639 or 0.0% of net assets.
(h) Security or a portion of the security was pledged to cover margin requirements for futures contracts. At period end, the value of securities pledged amounted to $3,747,719.
(i) Security or a portion of the security is pledged as collateral for call options written. At period end, the value of securities pledged amounted to $8,897,498.
(j) The JPMorgan U.S. Large Cap Core Plus Fund seeks to provide a high total return from a portfolio of selected equity securities which includes both long and short positions.
(k) Restricted securities (including private placements) - Investment in securities not registered under the Securities Act of 1933 (excluding 144A issues). At the end of the period, the value of restricted securities (excluding 144A issues) amounted to $8,937,986 or 0.0% of net assets.
(l) Level 3 security
Additional information on each restricted holding is as follows:
| Security | Acquisition Date | Acquisition Cost | ||||||
| CenterPoint Energy, Inc. |
5/7/20 | $ | 1,749,810 | |||||
| The Honest Co., Inc. Series D |
8/12/15 | $ | 1,468,003 | |||||
| Vertiv Holdings LLC |
2/6/20 | $ | 4,500,000 | |||||
Affiliated Central Funds
Information regarding fiscal year to date income earned by the Fund from investments in Fidelity Central Funds is as follows:
| Fund |
Income earned | |||
| Fidelity Cash Central Fund |
$ | 1,384,260 | ||
| Fidelity Securities Lending Cash Central Fund |
768,858 | |||
|
|
|
|||
| Total |
$ | 2,153,118 | ||
|
|
|
Amounts in the income column in the above table include any capital gain distributions from underlying funds, which are presented in the corresponding line-item in the Statement of Operations, if applicable. Amount for Fidelity Securities Lending Cash Central Fund represents the income earned on investing cash collateral, less rebates paid to borrowers and any lending agent fees associated with the loan, plus any premium payments received for lending certain types of securities.
Affiliated Underlying Funds
Fiscal year to date Information regarding the Fund’s investments in affiliated Underyling Funds, excluding any Money Market Central Funds, is presented below. Exchanged between classes of the same affiliated Underlying Funds may occur.
| Affiliate | Value, beginning of period |
Purchases | Sales Proceeds | Dividend Income |
Realized Gain (loss) |
Change in Unrealized appreciation (depreciation) |
Value, end of period |
|||||||||||||||||||||
| Fidelity Growth Company Fund |
$ | 57,616,055 | $ | 2,583,440 | $ | 0 | $ | 2,583,440 | $ | 0 | $ | 20,033,185 | $ | 80,232,680 | ||||||||||||||
| Fidelity Mid Cap Index Fund |
0 | 165,000,000 | 0 | 0 | 0 | 19,207,331 | 184,207,331.00 | |||||||||||||||||||||
| Fidelity SAI Inflation-Focused Fund |
0 | 6,500,000 | 0 | 0 | 0 | 515,345 | 7,015,345 | |||||||||||||||||||||
| Fidelity SAI U.S. Large Cap Index Fund |
1,207,289,362 | 4,056,342,539 | 4,203,964,199 | 3,800,629 | (84,591,215 | ) | 81,728,147 | 1,056,804,634 | ||||||||||||||||||||
| Fidelity SAI U.S. Momentum Index Fund |
318,762,606 | 5,598,578 | 325,000,000 | 5,598,578 | 57,264,409 | (39,651,894 | ) | 16,973,699 | ||||||||||||||||||||
| Fidelity SAI U.S. Quality Index Fund |
2,148,868,718 | 294,790,234 | 440,000,000 | 294,790,254 | (4,746,381 | ) | 102,567,705 | 2,101,480,276 | ||||||||||||||||||||
|
|
|
|
|
|
|
|
|
|
|
|
|
|
|
|||||||||||||||
| Total |
$ | 3,732,536,741 | $ | 4,530,814,791 | $ | 4,968,964,199 | $ | 306,772,901 | $ | (32,073,187 | ) | $ | 184,399,819 | $ | 3,446,713,965 | |||||||||||||
|
|
|
|
|
|
|
|
|
|
|
|
|
|
|
|||||||||||||||
Amounts in the income column in the above table include any capital gain distributions from underlying funds, which are presented in the corresponding line-item in the Statement of Operations, if applicable.
Investment Valuation
The following is a summary of the inputs used, as of May 31, 2020, involving the Fund’s assets and liabilities carried at fair value. The inputs or methodology used for valuing securities may not be an indication of the risk associated with investing in those securities. For more information on valuation inputs, and their aggregation into the levels used below, please refer to the Investment Valuation section in the accompanying Notes to Financial Statements.
Valuation Inputs at Reporting Date:
| Description | Total | Level 1 | Level 2 | Level 3 | ||||||||||||
| Equities: |
||||||||||||||||
| Communication Services |
$ | 2,431,247,031 | $ | 2,389,297,093 | $ | 41,949,938 | $ | 0 | ||||||||
| Consumer Discretionary |
2,355,196,607 | 2,353,728,443 | 0 | 1,468,164 | ||||||||||||
| Consumer Staples |
1,433,598,918 | 1,427,489,402 | 6,109,516 | 0 | ||||||||||||
| Energy |
713,655,970 | 711,752,259 | 1,903,711 | 0 | ||||||||||||
| Financials |
2,588,366,888 | 2,587,705,648 | 661,240 | 0 | ||||||||||||
| Health Care |
3,573,206,625 | 3,489,715,962 | 83,490,663 | 0 | ||||||||||||
| Industrials |
1,982,171,571 | 1,980,531,266 | 1,640,305 | 0 | ||||||||||||
| Information Technology |
5,474,690,760 | 5,473,871,207 | 819,553 | 0 | ||||||||||||
| Materials |
449,673,683 | 449,673,683 | 0 | 0 | ||||||||||||
| Real Estate |
371,005,178 | 371,005,178 | 0 | 0 | ||||||||||||
| Utilities |
690,763,766 | 689,022,444 | 1,741,322 | 0 | ||||||||||||
| Equity Funds |
4,645,668,828 | 4,645,668,828 | 0 | 0 | ||||||||||||
| Other |
7,015,345 | 7,015,345 | 0 | 0 | ||||||||||||
| Other Short-Term Investments |
5,232,492 | 0 | 5,232,492 | 0 | ||||||||||||
| Money Market Funds |
312,527,709 | 312,527,709 | 0 | 0 | ||||||||||||
|
|
|
|
|
|
|
|
|
|||||||||
| Total Investments in Securities: |
$ | 27,034,021,371 | $ | 26,889,004,467 | $ | 143,548,740 | $ | 1,468,164 | ||||||||
|
|
|
|
|
|
|
|
|
|||||||||
| Derivative Instruments: |
||||||||||||||||
| Assets |
||||||||||||||||
| Futures Contracts |
$ | 5,979,719 | $ | 5,979,719 | $ | 0 | $ | 0 | ||||||||
|
|
|
|
|
|
|
|
|
|||||||||
| Total Assets |
$ | 5,979,719 | $ | 5,979,719 | $ | 0 | $ | 0 | ||||||||
|
|
|
|
|
|
|
|
|
|||||||||
| Liabilities |
||||||||||||||||
| Written Options |
($ | 341,590 | ) | ($ | 341,590 | ) | $ | 0 | $ | 0 | ||||||
|
|
|
|
|
|
|
|
|
|||||||||
| Total Liabilities |
($ | 341,590 | ) | ($ | 341,590 | ) | $ | 0 | $ | 0 | ||||||
|
|
|
|
|
|
|
|
|
|||||||||
| Total Derivative Instruments |
$ | 5,638,129 | $ | 5,638,129 | $ | 0 | $ | 0 | ||||||||
|
|
|
|
|
|
|
|
|
|||||||||
Value of Derivative Instruments
The following table is a summary of the Fund’s value of derivative instruments by primary risk exposure as of May 31, 2020. For additional information on derivative instruments, please refer to the Derivative Instruments section in the accompanying Notes to Financial Statements.
| Risk Exposure / Derivative Type | Asset | Liability | ||||||
| Futures Contracts (a) |
$ | 5,979,719 | $ | 0 | ||||
| Written Options (b) |
0 | (341,590 | ) | |||||
|
|
|
|
|
|||||
| Total Equity Risk |
5,979,719 | (341,590 | ) | |||||
|
|
|
|
|
|||||
| Total Value of Derivatives |
$ | 5,979,719 | ($ | 341,590 | ) | |||
|
|
|
|
|
|||||
(a) Reflects gross cumulative appreciation (depreciation) on futures contracts as presented in the Schedule of Investments. In the Statement of Assets and Liabilities, the period end daily variation margin is included in receivable or payable for daily variation margin on futures contracts, and the net cumulative appreciation (depreciation) is included in Total accumulated earnings (loss).
(b) Gross value is presented in the Statement of Assets and Liabilities in the written options, at value line-item.
Table of Contents
Strategic Advisers Growth Fund
(Acquired Fund)
Legend
(a) Non-income producing
(c) The rate quoted is the annualized seven-day yield of the fund at period end.
(f) Affiliated Fund
(m) Restricted securities (including private placements) - Investment in securities not registered under the Securities Act of 1933 (excluding 144A issues). At the end of the period, the value of restricted securities (excluding 144A issues) amounted to $6,355,645 or 0.1% of net assets.
(l) Level 3 security
Additional information on each restricted holding is as follows:
| Security | Acquisition Date |
Acquisition Cost |
||||||
| Airbnb, Inc. Series D |
4/16/14 | $ | 4,024,850 | |||||
Affiliated Central Funds
Information regarding fiscal year to date income earned by the Fund from investments in Fidelity Central Funds is as follows:
| Fund | Income earned | |||
| Fidelity Securities Lending Cash Central |
$ | 25,868 | ||
|
|
|
|||
| Total |
$ | 25,868 | ||
|
|
|
|||
Amounts in the income column in the above table include any capital gain distributions from underlying funds, which are presented in the corresponding line-item in the Statement of Operations, if applicable. Amount for Fidelity Securities Lending Cash Central Fund represents the income earned on investing cash collateral, less rebates paid to borrowers and any lending agent fees associated with the loan, plus any premium payments received for lending certain types of securities.
Affiliated Underlying Funds
Fiscal year to date Information regarding the Fund’s investments in affiliated Underyling Funds, excluding any Money Market Central Funds, is presented below. Exchanged between classes of the same affiliated Underlying Funds may occur.
| Affiliate | Value, |
Purchases | Sales Proceeds | Dividend Income |
Realized Gain (loss) |
Change in Unrealized appreciation (depreciation) |
Value, end of period |
|||||||||||||||||||||
| Fidelity Contrafund |
$ | 523,366,843 | $ | 20,630,825 | $ | 432,363,022 | $ | 18,950,883 | ($ | 12,384,105 | ) | $ | 45,703,262 | $ | 144,953,803 | |||||||||||||
| Fidelity Growth Company Fund |
2,301,681,826 | 143,204,848 | 250,183,216 | 103,204,849 | 7,780,199 | 762,596,398 | 2,965,080,055 | |||||||||||||||||||||
| Fidelity SAI U.S. Large Cap Index Fund |
25,922,833 | 2,212,341,424 | 2,168,644,669 | 2,574,345 | 7,344,796 | 4,328,791 | 81,293,175 | |||||||||||||||||||||
| Fidelity SAI U.S. Momentum Index Fund |
466,705,072 | 7,992,273 | 470,000,000 | 7,992,273 | 16,791,573 | (18,194,123 | ) | 3,294,795 | ||||||||||||||||||||
| Fidelity SAI U.S. Quality Index Fund |
979,028,121 | 124,012,826 | 887,611,107 | 123,034,639 | 190,686,954 | (190,636,043 | ) | 215,480,751 | ||||||||||||||||||||
|
|
|
|
|
|
|
|
|
|
|
|
|
|
|
|||||||||||||||
| Total |
$ | 4,296,704,695 | $ | 2,508,182,196 | $ | 4,208,802,014 | $ | 255,756,989 | $ | 210,219,417 | $ | 603,798,285 | $ | 3,410,102,579 | ||||||||||||||
|
|
|
|
|
|
|
|
|
|
|
|
|
|
|
|||||||||||||||
Amounts in the income column in the above table include any capital gain distributions from underlying funds, which are presented in the corresponding line-item in the Statement of Operations, if applicable.
The following is a summary of the inputs used, as of May 31, 2020, involving the Fund’s assets and liabilities carried at fair value. The inputs or methodology used for valuing securities may not be an indication of the risk associated with investing in those securities. For more information on valuation inputs, and their aggregation into the levels used below, please refer to the Investment Valuation section in the accompanying Notes to Financial Statements.
Valuation Inputs at Reporting Date:
| Description | Total | Level 1 | Level 2 | Level 3 | ||||||||||||
| Equities: |
||||||||||||||||
| Communication Services |
$ | 561,534,837 | $ | 561,534,837 | $ | 0 | $ | 0 | ||||||||
| Consumer Discretionary |
722,192,259 | 715,836,614 | 0 | 6,355,645 | ||||||||||||
| Consumer Staples |
256,426,045 | 256,426,045 | 0 | 0 | ||||||||||||
| Energy |
11,857,999 | 11,857,999 | 0 | 0 | ||||||||||||
| Financials |
104,270,174 | 104,270,174 | 0 | 0 | ||||||||||||
| Health Care |
762,279,518 | 762,279,518 | 0 | 0 | ||||||||||||
| Industrials |
328,032,409 | 328,032,409 | 0 | 0 | ||||||||||||
| Information Technology |
1,848,931,562 | 1,848,931,562 | 0 | 0 | ||||||||||||
| Materials |
18,863,711 | 18,863,711 | 0 | 0 | ||||||||||||
| Real Estate |
84,147,530 | 84,147,530 | 0 | 0 | ||||||||||||
| Equity Funds |
4,169,968,928 | 4,169,968,928 | 0 | 0 | ||||||||||||
| Money Market Funds |
39,109,592 | 39,109,592 | 0 | 0 | ||||||||||||
|
|
|
|
|
|
|
|
|
|||||||||
| Total Investments in Securities: |
$ | 8,907,614,564 | $ | 8,901,258,919 | $ | 0 | $ | 6,355,645 | ||||||||
|
|
|
|
|
|
|
|
|
|||||||||
Table of Contents
Strategic Advisers Value Fund
(Acquired Fund)
Legend
(a) Non-income producing
(b) Affiliated fund that is generally available only to investment companies and other accounts managed by Fidelity Investments. The rate quoted is the annualized seven-day yield of the fund at period end. A complete unaudited listing of the fund’s holdings as of its most recent quarter end is available upon request. In addition, each Fidelity Central Fund’s financial statements, which are not covered by the Fund’s Report of Independent Registered Public Accounting Firm, are available on the SEC’s website or upon request.
(c) The rate quoted is the annualized seven-day yield of the fund at period end.
(d) Investment made with cash collateral received from securities on loan.
(e) Security or a portion of the security is on loan at period end.
(f) Affiliated Fund
Affiliated Central Funds
Information regarding fiscal year to date income earned by the Fund from investments in Fidelity Central Funds is as follows:
| Fund | Income earned |
|||
| Fidelity Securities Lending Cash Central Fund |
$ | 796,564 | ||
|
|
|
|||
| Total |
$ | 796,564 | ||
|
|
|
|||
Amounts in the income column in the above table include any capital gain distributions from underlying funds, which are presented in the corresponding line-item in the Statement of Operations, if applicable. Amount for Fidelity Securities Lending Cash Central Fund represents the income earned on investing cash collateral, less rebates paid to borrowers and any lending agent fees associated with the loan, plus any premium payments received for lending certain types of securities.
Affiliated Underlying Funds
Fiscal year to date Information regarding the Fund’s investments in affiliated Underyling Funds, excluding any Money Market Central Funds, is presented below. Exchanged between classes of the same affiliated Underlying Funds may occur.
| Affiliate | Value, beginning of period |
Purchases | Sales Proceeds | Dividend Income |
Realized Gain (loss) |
Change in Unrealized appreciation (depreciation) |
Value, end of period |
|||||||||||||||||||||
| Fidelity SAI U.S. Large Cap Index Fund |
$ | 169,787,209 | $ | 2,387,190,365 | $ | 2,014,017,732 | $ | 2,175,464 | ($ | 53,613,653 | ) | $ | 42,453,335 | $ | 531,799,524 | |||||||||||||
| Fidelity SAI U.S. Low Volatility Index Fund |
362,888,020 | 223,673,377 | 145,363,078 | 16,681,544 | 314,467 | 48,177,112 | 489,689,898 | |||||||||||||||||||||
| Fidelity SAI U.S. Value Index Fund |
35,586,584 | 50,000,000 | 36,402,643 | 0 | (2,048,135 | ) | 4,694,327 | 51,830,133 | ||||||||||||||||||||
|
|
|
|
|
|
|
|
|
|
|
|
|
|
|
|||||||||||||||
| Total |
$ | 568,261,813 | $ | 2,660,863,742 | $ | 2,195,783,453 | $ | 18,857,008 | ($ | 55,347,321 | ) | $ | 95,324,774 | $ | 1,073,319,555 | |||||||||||||
|
|
|
|
|
|
|
|
|
|
|
|
|
|
|
|||||||||||||||
Amounts in the income column in the above table include any capital gain distributions from underlying funds, which are presented in the corresponding line-item in the Statement of Operations, if applicable.
Investment Valuation
The following is a summary of the inputs used, as of May 31, 2020, involving the Fund’s assets and liabilities carried at fair value. The inputs or methodology used for valuing securities may not be an indication of the risk associated with investing in those securities. For more information on valuation inputs, and their aggregation into the levels used below, please refer to the Investment Valuation section in the accompanying Notes to Financial Statements.
Valuation Inputs at Reporting Date:
| Description | Total | Level 1 | Level 2 | Level 3 | ||||||||||||
| Equities: |
||||||||||||||||
| Communication Services |
$ | 522,356,380 | $ | 522,356,380 | $ | 0 | $ | 0 | ||||||||
| Consumer Discretionary |
519,420,197 | 519,420,197 | 0 | 0 | ||||||||||||
| Consumer Staples |
400,726,113 | 400,726,113 | 0 | 0 | ||||||||||||
| Energy |
370,803,321 | 370,803,321 | 0 | 0 | ||||||||||||
| Financials |
1,821,125,865 | 1,821,125,865 | 0 | 0 | ||||||||||||
| Health Care |
1,197,927,652 | 1,197,927,652 | 0 | 0 | ||||||||||||
| Industrials |
823,959,037 | 823,959,037 | 0 | 0 | ||||||||||||
| Information Technology |
974,128,701 | 974,128,701 | 0 | 0 | ||||||||||||
| Materials |
322,211,957 | 322,211,957 | 0 | 0 | ||||||||||||
| Real Estate |
146,517,004 | 146,517,004 | 0 | 0 | ||||||||||||
| Utilities |
209,402,458 | 209,402,458 | 0 | 0 | ||||||||||||
| Equity Funds |
1,223,074,863 | 1,223,074,863 | 0 | 0 | ||||||||||||
| Money Market Funds |
161,792,679 | 161,792,679 | 0 | 0 | ||||||||||||
|
|
|
|
|
|
|
|
|
|||||||||
| Total Investments in Securities: |
$ | 8,693,446,227 | $ | 8,693,446,227 | $ | 0 | $ | 0 | ||||||||
|
|
|
|
|
|
|
|
|
|||||||||
Table of Contents
Strategic Advisers Large Cap Fund
Pro Forma Combined
Legend
(a) Non-income producing
(b) Affiliated fund that is generally available only to investment companies and other accounts managed by Fidelity Investments. The rate quoted is the annualized seven-day yield of the fund at period end. A complete unaudited listing of the fund’s holdings as of its most recent quarter end is available upon request. In addition, each Fidelity Central Fund’s financial statements , which are not covered by the Fund’s Report of Independent Registered Public Accounting Firm, are available on the SEC’s website or upon request.
(c) The rate quoted is the annualized seven-day yield of the fund at period end.
(d) Investment made with cash collateral received from securities on loan.
(e) Security or a portion of the security is on loan at period end.
(f) Affiliated Fund
(g) Security exempt from registration under Rule 144A of the Securities Act of 1933. These securities may be resold in transactions exempt from registration, normally to qualified institutional buyers. At the end of the period, the value of these securities amounted to $3,975,639 or 0.0% of net assets.
(h) Security or a portion of the security was pledged to cover margin requirements for futures contracts. At period end, the value of securities pledged amounted to $3,747,719.
(i) Security or a portion of the security is pledged as collateral for call options written. At period end, the value of securities pledged amounted to $8,897,498.
(j) The JPMorgan U.S. Large Cap Core Plus Fund seeks to provide a high total return from a portfolio of selected equity securities which includes both long and short positions.
(k) Restricted securities (including private placements) - Investment in securities not registered under the Securities Act of 1933 (excluding 144A issues). At the end of the period, the value of restricted securities (excluding 144A issues) amounted to $8,937,986 or 0.0% of net assets.
(l) Level 3 security
(m) Restricted securities (including private placements) - Investment in securities not registered under the Securities Act of 1933 (excluding 144A issues). At the end of the period, the value of restricted securities (excluding 144A issues) amounted to $6,355,645 or 0.1% of net assets.
Additional information on each restricted holding is as follows:
| Security | Acquisition Date |
Acquisition Cost |
||||||
| CenterPoint Energy, Inc. |
5/7/20 | $ | 1,749,810 | |||||
| The Honest Co., Inc. Series D |
8/12/15 | $ | 1,468,003 | |||||
| Vertiv Holdings LLC |
2/6/20 | $ | 4,500,000 | |||||
| Airbnb, Inc. Series D |
4/16/14 | $ | 4,024,850 | |||||
Affiliated Central Funds Information regarding fiscal year to date income earned by the Fund from investments in Fidelity Central Funds is as follows:
| Fund | Income earned | |||
| Fidelity Cash Central Fund |
$ | 1,384,260 | ||
| Fidelity Securities Lending Cash Central Fund |
1,591,290 | |||
|
|
|
|||
| Total |
$ | 2,975,550 | ||
|
|
|
|||
Amounts in the income column in the above table include any capital gain distributions from underlying funds, which are presented in the corresponding line-item in the Statement of Operations, if applicable. Amount for Fidelity Securities Lending Cash Central Fund represents the income earned on investing cash collateral, less rebates paid to borrowers and any lending agent fees associated with the loan, plus any premium payments received for lending certain types of securities.
Affiliated Underlying Funds
Fiscal year to date Information regarding the Fund’s investments in affiliated Underyling Funds, excluding any Money Market Central Funds, is presented below. Exchanged between classes of the same affiliated Underlying Funds may occur.
| Affiliate | Value, beginning of period |
Purchases | Sales Proceeds | Dividend Income |
Realized Gain (loss) |
Change in Unrealized appreciation (depreciation) |
Value, end of period |
|||||||||||||||||||||
| Fidelity Contrafund |
$ | 523,366,843 | $ | 20,630,825 | $ | 432,363,022 | $ | 18,950,883 | $ | (12,384,105 | ) | $ | 45,703,262 | $ | 144,953,803 | |||||||||||||
| Fidelity Growth Company Fund |
2,359,297,881 | 145,788,288 | 250,183,216 | 105,788,289 | 7,780,199 | 782,629,583 | 3,045,312,735 | |||||||||||||||||||||
| Fidelity Mid Cap Index Fund |
0 | 165,000,000 | 0 | 0 | 0 | 19,207,331 | 184,207,331 | |||||||||||||||||||||
| Fidelity SAI Inflation-Focused Fund |
0 | 6,500,000 | 0 | 0 | 0 | 515,345 | 7,015,345 | |||||||||||||||||||||
| Fidelity SAI U.S. Large Cap Index Fund |
1,402,999,404 | 8,655,874,328 | 8,386,626,600 | 8,550,438 | (130,860,072 | ) | 128,510,273 | 1,669,897,333 | ||||||||||||||||||||
| Fidelity SAI U.S. Low Volatility Index Fund |
362,888,020 | 223,673,377 | 145,363,078 | 16,681,544 | 314,467 | 48,177,112 | 489,689,898 | |||||||||||||||||||||
| Fidelity SAI U.S. Momentum Index Fund |
785,467,678 | 13,590,851 | 795,000,000 | 13,590,851 | 74,055,982 | (57,846,017 | ) | 20,268,494 | ||||||||||||||||||||
| Fidelity SAI U.S. Quality Index Fund |
3,127,896,839 | 418,803,060 | 1,327,611,107 | 417,824,893 | 185,940,573 | (88,068,338 | ) | 2,316,961,027 | ||||||||||||||||||||
| Fidelity SAI U.S. Value Index Fund |
35,586,584 | 50,000,000 | 36,402,643 | 0 | (2,048,135 | ) | 4,694,327 | 51,830,133 | ||||||||||||||||||||
|
|
|
|
|
|
|
|
|
|
|
|
|
|
|
|||||||||||||||
| Total |
$ | 8,597,503,249 | $ | 9,699,860,729 | $ | 11,373,549,666 | $ | 581,386,898 | $ | 122,798,909 | $ | 883,522,878 | $ | 7,930,136,099 | ||||||||||||||
|
|
|
|
|
|
|
|
|
|
|
|
|
|
|
|||||||||||||||
Amounts in the income column in the above table include any capital gain distributions from underlying funds, which are presented in the corresponding line-item in the Statement of Operations, if applicable.
Investment Valuation
The following is a summary of the inputs used, as of May 31, 2020, involving the Fund’s assets and liabilities carried at fair value. The inputs or methodology used for valuing securities may not be an indication of the risk associated with investing in those securities. For more information on valuation inputs, and their aggregation into the levels used below, please refer to the Investment Valuation section in the accompanying Notes to Financial Statements.
Valuation Inputs at Reporting Date:
| Description | Total | Level 1 | Level 2 | Level 3 | ||||||||||||
| Equities: |
||||||||||||||||
| Communication Services |
$ | 3,515,138,248 | $ | 3,473,188,310 | $ | 41,949,938 | $ | 0 | ||||||||
| Consumer Discretionary |
3,596,809,063 | 3,588,985,254 | 0 | 7,823,809 | ||||||||||||
| Consumer Staples |
2,090,751,076 | 2,084,641,560 | 6,109,516 | 0 | ||||||||||||
| Energy |
1,096,317,290 | 1,094,413,579 | 1,903,711 | 0 | ||||||||||||
| Financials |
4,513,762,927 | 4,513,101,687 | 661,240 | 0 | ||||||||||||
| Health Care |
5,533,413,795 | 5,449,923,132 | 83,490,663 | 0 | ||||||||||||
| Industrials |
3,134,163,017 | 3,132,522,712 | 1,640,305 | 0 | ||||||||||||
| Information Technology |
8,297,751,023 | 8,296,931,470 | 819,553 | 0 | ||||||||||||
| Materials |
790,749,351 | 790,749,351 | 0 | 0 | ||||||||||||
| Real Estate |
601,669,712 | 601,669,712 | 0 | 0 | ||||||||||||
| Utilities |
900,166,224 | 898,424,902 | 1,741,322 | 0 | ||||||||||||
| Equity Funds |
10,038,712,619 | 10,038,712,619 | 0 | 0 | ||||||||||||
| Other |
7,015,345 | 7,015,345 | 0 | 0 | ||||||||||||
| Other Short-Term Investments |
5,232,492 | 0 | 5,232,492 | 0 | ||||||||||||
| Money Market Funds |
513,429,980 | 513,429,980 | 0 | 0 | ||||||||||||
|
|
|
|
|
|
|
|
|
|||||||||
| Total Investments in Securities: |
$ | 44,635,082,162 | $ | 44,483,709,613 | $ | 143,548,740 | $ | 7,823,809 | ||||||||
|
|
|
|
|
|
|
|
|
|||||||||
| Derivative Instruments: |
||||||||||||||||
| Assets |
||||||||||||||||
| Futures Contracts |
$ | 5,979,719 | $ | 5,979,719 | $ | 0 | $ | 0 | ||||||||
|
|
|
|
|
|
|
|
|
|||||||||
| Total Assets |
$ | 5,979,719 | $ | 5,979,719 | $ | 0 | $ | 0 | ||||||||
|
|
|
|
|
|
|
|
|
|||||||||
| Liabilities |
||||||||||||||||
| Written Options |
($ | 341,590 | ) | ($ | 341,590 | ) | $ | 0 | $ | 0 | ||||||
|
|
|
|
|
|
|
|
|
|||||||||
| Total Liabilities |
($ | 341,590 | ) | ($ | 341,590 | ) | $ | 0 | $ | 0 | ||||||
|
|
|
|
|
|
|
|
|
|||||||||
| Total Derivative Instruments |
$ | 5,638,129 | $ | 5,638,129 | $ | 0 | $ | 0 | ||||||||
|
|
|
|
|
|
|
|
|
|||||||||
Value of Derivative Instruments
The following table is a summary of the Fund’s value of derivative instruments by primary risk exposure as of May 31, 2020. For additional information on derivative instruments, please refer to the Derivative Instruments section in the accompanying Notes to Financial Statements.
| Risk Exposure / Derivative Type | Asset | Liability | ||||||
| Futures Contracts (a) |
$ | 5,979,719 | $ | 0 | ||||
| Written Options (b) |
0 | (341,590 | ) | |||||
|
|
|
|
|
|||||
| Total Equity Risk |
5,979,719 | (341,590 | ) | |||||
|
|
|
|
|
|||||
| Total Value of Derivatives |
$ | 5,979,719 | ($ | 341,590 | ) | |||
|
|
|
|
|
|||||
(a) Reflects gross cumulative appreciation (depreciation) on futures contracts as presented in the Schedule of Investments. In the Statement of Assets and Liabilities, the period end daily variation margin is included in receivable or payable for daily variation margin on futures contracts, and the net cumulative appreciation (depreciation) is included in Total accumulated earnings (loss).
(b) Gross value is presented in the Statement of Assets and Liabilities in the written options, at value line-item.
Table of Contents
| PART C. | OTHER INFORMATION |
| Item 15. | Indemnification |
Pursuant to Del. Code Ann. title 12 § 3817, a Delaware statutory trust may provide in its governing instrument for the indemnification of its officers and trustees from and against any and all claims and demands whatsoever. Article X, Section 10.02 of the Trust Instrument sets forth the reasonable and fair means for determining whether indemnification shall be provided to any past or present Trustee or officer. It states that the Trust shall indemnify any present or past trustee or officer to the fullest extent permitted by law against liability, and all expenses reasonably incurred by him or her in connection with any claim, action, suit or proceeding in which he or she is involved by virtue of his or her service as a trustee or officer and against any amount incurred in settlement thereof. Indemnification will not be provided to a person adjudged by a court or other adjudicatory body to be liable to the Trust or its shareholders by reason of willful misfeasance, bad faith, gross negligence or reckless disregard of his or her duties (collectively, “disabling conduct”), or not to have acted in good faith in the reasonable belief that his or her action was in the best interest of the Trust. In the event of a settlement, no indemnification may be provided unless there has been a determination, as specified in the Trust Instrument, that the officer or trustee did not engage in disabling conduct.
Pursuant to Section 11 of the Distribution Agreement, the Trust agrees to indemnify and hold harmless the Distributor and each of its directors and officers and each person, if any, who controls the Distributor within the meaning of Section 15 of the 1933 Act against any loss, liability, claim, damages or expense (including the reasonable cost of investigating or defending any alleged loss, liability, claim, damages, or expense and reasonable counsel fees incurred in connection therewith) arising by reason of any person acquiring any shares, based upon the ground that the registration statement, Prospectus, Statement of Additional Information, shareholder reports or other information filed or made public by the Trust (as from time to time amended) included an untrue statement of a material fact or omitted to state a material fact required to be stated or necessary in order to make the statements not misleading under the 1933 Act, or any other statute or the common law. However, the Trust does not agree to indemnify the Distributor or hold it harmless to the extent that the statement or omission was made in reliance upon, and in conformity with, information furnished to the Trust by or on behalf of the Distributor. In no case is the indemnity of the Trust in favor of the Distributor or any person indemnified to be deemed to protect the Distributor or any person against any liability to the Issuer or its security holders to which the Distributor or such person would otherwise be subject by reason of willful misfeasance, bad faith or gross negligence in the performance of its duties or by reason of its reckless disregard of its obligations and duties under this Agreement.
Pursuant to the agreement by which Fidelity Investments Institutional Operations Company, Inc. (“FIIOC”) is appointed transfer agent, the Registrant agrees to indemnify and hold FIIOC harmless against any losses, claims, damages, liabilities or expenses (including reasonable counsel fees and expenses) resulting from:
(1) any claim, demand, action or suit brought by any person other than the Registrant, including by a shareholder, which names FIIOC and/or the Registrant as a party and is not based on and does not result from FIIOC’s willful misfeasance, bad faith or negligence or reckless disregard of duties, and arises out of or in connection with FIIOC’s performance under the Transfer Agency Agreement; or
(2) any claim, demand, action or suit (except to the extent contributed to by FIIOC’s willful misfeasance, bad faith or negligence or reckless disregard of duties) which results from the negligence of the Registrant, or from FIIOC’s acting upon any instruction(s) reasonably believed by it to have been executed or communicated by any person duly authorized by the Registrant, or as a result of FIIOC’s acting in reliance upon advice reasonably believed by FIIOC to have been given by counsel for the Registrant, or as a result of FIIOC’s acting in reliance upon any instrument or stock certificate reasonably believed by it to have been genuine and signed, countersigned or executed by the proper person.
Table of Contents
Insofar as indemnification for liabilities arising under the Securities Act of 1933 may be permitted to directors, officers or persons controlling the Registrant, the Registrant has been informed that in the opinion of the Securities and Exchange Commission such indemnification is against public policy as expressed in the Act and is therefore unenforceable.
| Item 16. | Exhibits |
| (1) |
| (2) |
| (3) | Not applicable. |
| (4) | Agreement and Plan of Reorganization between Fidelity Rutland Square Trust II: Strategic Advisers Core Fund, Strategic Advisers Growth Fund, and Strategic Advisers Value Fund and Fidelity Rutland Square Trust II: Strategic Advisers Large Cap Fund is filed herein as Exhibit 1 to the Proxy Statement and Prospectus. |
(6)
| (1) |
| (2) |
| (3) |
| (4) |
| (5) |
| (6) |
| (7) |
Table of Contents
| (8) |
| (9) |
| (10) |
| (11) |
| (12) |
| (13) |
| (14) |
| (15) |
| (16) |
| (17) |
| (18) |
| (19) |
| (20) |
Table of Contents
| (21) |
| (22) |
| (23) |
| (24) |
| (25) |
| (26) |
| (27) |
| (28) |
| (29) |
| (30) |
| (31) |
| (32) |
| (33) |
Table of Contents
| (34) |
| (35) |
| (36) |
| (37) |
| (38) |
| (39) |
| (40) |
| (41) |
| (42) |
| (43) |
| (44) |
| (45) |
| (46) |
Table of Contents
| (47) |
| (48) |
| (49) |
| (50) |
| (51) |
| (52) |
| (53) |
| (54) |
| (55) |
| (56) |
| (57) |
| (58) |
| (59) |
Table of Contents
| (60) |
| (61) |
| (62) |
| (63) |
| (64) |
| (65) |
| (66) |
| (67) |
| (68) |
| (69) |
| (70) |
| (71) |
Table of Contents
| (72) |
| (73) |
| (74) |
| (75) |
| (76) |
| (77) |
| (78) |
| (79) |
| (80) |
| (81) |
| (82) |
| (83) |
| (84) |
| (85) |
Table of Contents
| (86) |
| (87) |
| (88) |
| (89) |
| (90) |
| (91) |
| (92) |
| (93) |
| (94) |
| (95) |
| (96) |
Table of Contents
| (97) |
| (98) |
| (99) |
| (100) |
| (101) |
| (102) |
| (103) |
| (104) |
| (105) |
| (106) |
| (107) |
| (108) |
Table of Contents
| (109) |
| (110) |
| (111) |
| (112) |
| (113) |
| (114) |
| (115) |
| (7) |
| (1) |
| (2) |
| (3) |
| (4) |
Table of Contents
| (5) |
| (6) |
| (7) |
| (8) |
| (9) |
| (10) |
| (11) |
| (12) |
| (13) |
| (14) |
| (15) |
| (8) | None. |
Table of Contents
| (9) |
| (1) |
| (2) |
(10)
| (1) |
| (2) |
| (3) |
| (4) |
| (5) |
| (6) |
| (7) |
| (8) |
| (9) |
Table of Contents
| (10) |
| (11) |
| (12) |
| (13) |
| (14) |
| (15) |
| (11) |
| (12) | Opinion and Consent of counsel Dechert LLP, as to tax matters - To be filed by Post-Effective Amendment. |
| (13) |
| (1) |
| (2) |
| (3) |
| (4) |
| (5) |
| (6) |
Table of Contents
| (7) |
| (8) |
| (9) |
| (10) |
| (11) |
| (12) |
| (13) |
| (14) |
| (15) |
| (14) | Consent of PricewaterhouseCoopers LLP, dated July 31, 2020, is filed herein as Exhibit 14. |
| (15) | Not applicable. |
| (16) | Power of Attorney, dated July 1, 2020, is filed herein as Exhibit 16. |
| (17) | Not applicable. |
| Item 17. | Undertakings |
(1) The undersigned Registrant agrees that prior to any public reoffering of the securities registered through the use of the prospectus which is a part of this Registration Statement by any person or party who is deemed to be an underwriter within the meaning of Rule 145(c) of the Securities Act of 1933, the reoffering prospectus will contain the information called for by the applicable registration form for reoffering by persons who may be deemed underwriters, in addition to the information called for by the other items of the applicable form.
Table of Contents
(2) The undersigned Registrant agrees that every prospectus that is filed under paragraph (1) above will be filed as part of an amendment to the Registration Statement and will not be used until the amendment is effective, and that, in determining any liability under the Securities Act of 1933, each Post-Effective Amendment shall be deemed to be a new Registration Statement for the securities offered therein, and the offering of securities at that time shall be deemed to be the initial bona fide offering of them.
(3) The undersigned Registrant undertakes to file a post-effective amendment to this registration statement upon the closing of the Reorganization described in this Registration Statement that contains an opinion of counsel supporting the tax matters discussed in this Registration Statement.
Table of Contents
SIGNATURES
Pursuant to the requirements of the Securities Act of 1933, this Registration Statement has been signed on its behalf by the undersigned, thereunto duly authorized, in the City of Boston, and Commonwealth of Massachusetts, on the 4th day of August 2020.
| Fidelity Rutland Square Trust II | ||
| By | /s/ Stacie M. Smith | |
| Stacie M. Smith, President | ||
Pursuant to the requirements of the Securities Act of 1933, this Registration Statement has been signed below by the following persons in the capacities and on the dates indicated.
| (Signature) |
(Title) |
(Date) | ||
| /s/ Stacie M. Smith |
President and Treasurer | August 4, 2020 | ||
| Stacie M. Smith | (Principal Executive Officer) | |||
| /s/ John J. Burke III |
Chief Financial Officer | August 4, 2020 | ||
| John J. Burke III | (Principal Financial Officer) | |||
| * |
Trustee | August 4, 2020 | ||
| Peter C. Aldrich | ||||
| * |
Trustee | August 4, 2020 | ||
| Charles S. Morrison | ||||
| * |
Trustee | August 4, 2020 | ||
| Mary C. Farrell | ||||
| /s/ Brian B. Hogan |
Trustee | August 4, 2020 | ||
| Brian B. Hogan | ||||
| * |
Trustee | August 4, 2020 | ||
| Karen Kaplan | ||||
| * |
Trustee | August 4, 2020 | ||
| Robert A. Lawrence | ||||
| * |
Trustee | August 4, 2020 | ||
| Heidi L. Steiger | ||||
| * | By: | /s/ Megan C. Johnson | ||
| Megan C. Johnson, pursuant to a power of attorney dated July 1, 2020 and filed herewith. |