Exhibit 99.1

2018 annual report Morphosys Engineering the Medicines of Tomorrow

Product Pipeline MorphoSys’s Product Pipeline (December 31, 2018) MOST ADVANCED DEVELOPMENT STAGE PROGRAM / PARTNER INDICATION DISCOVERY PRECLINIC PHASE 1 PHASE 2 PHASE 3 MARKET Tremfya®* (guselkumab) / Janssen/J&J Psoriasis Gantenerumab / Roche Alzheimer’s disease MOR208 / not partnered Hematological malignancies Anetumab ravtansine (BAY94-9343) / Bayer Solid tumors BAY1093884 / Bayer Hemophilia BHQ880 / Novartis Multiple myeloma Bimagrumab (BYM338) / Novartis Metabolic disease CNTO6785 / Janssen/J&J Inflammation Ianalumab (VAY736) / Novartis Inflammation MOR103 (GSK3196165) / GlaxoSmithKline Inflammation MOR106 / Novatis/Galapagos Inflammation MOR202 / I-Mab Biopharma** Multiple myeloma NOV-12 (MAA868) / Novartis Prevention of thrombosis Setrusumab (BPS804) / Mereo/Novartis Brittle bone syndrome Tesidolumab (LFG316) / Novartis Eye diseases legend : mor program out - licensed mor program partnered discovery program MOST ADVANCED DEVELOPMENT STAGE PROGRAM / PARTNER INDICATION DISCOVERY PRECLINIC PHASE 1 PHASE 2 PHASE 3 MARKET Utomilumab (PF-05082566) / Pfizer Cancer Xentuzumab (BI-836845) / BI Solid tumors BAY2287411 / Bayer Cancer Elgemtumab (LJM716) / Novartis Cancer MOR107*** (LP2-3) / not partnered Not disclosed NOV-7 (CLG561) / Novartis Eye diseases NOV-8 / Novartis Inflammation NOV-9 (LKA651) / Novartis Diabetic eye diseases NOV-10 (PCA062) / Novartis Cancer NOV-11 / Novartis Blood disorders NOV-13 (HKT288) / Novartis Cancer NOV-14 / Novartis Asthma PRV-300 (CNTO3157) / ProventionBio Inflammation Vantictumab (OMP-18R5) / OncoMed Solid tumors * We still consider Tremfya® a phase 3 compound due to ongoing studies in various indications. ** For development in China, Hong Kong, Taiwan, Macao. *** A phase 1 study in healthy volunteers was completed. MOR107 is currently in preclinical investigation with a focus on oncology indications. phase 1 12 Programs phase 2 14 Programs phase 3 3 Programs* In addition, 6 proprietary programs and 56 partnered discovery programs are in discovery stage, 1 proprietary and 24 partnered discovery programs are in preclinic.

MorphoSys at a Glance Figures, data, facts (December 31, 2018) programs in discovery 62 329 employees 34 nations 12 MOR Programs More than 70 active clinical studies with MorphoSys antibodies programs in preclinic 25 programs in phase 1 12 programs in phase 2 14 programs in phase 3 3 r & d expenses (in million €) 27.6 2008 106.4 2018 PRODUCT PIPELINE – MORPHOSYS AT A GLANCE


ENGINEERING THE MEDICINES OF TOMORROW Our mission is to make exceptional, innovative biopharmaceuticals to improve the lives of patients suffering from serious diseases. Our focus is on cancer. Innovative technologies and smart development strategies are central to our approach. Success is created by our employees, who focus on excellence in all they do and collaborate closely across disciplines. GROUP MANAGEMENT REPORT FINANCIAL STATEMENTS CONTENTS

Please find additional information in our online magazine. https://reports.morphosys.com/2018/

Contents the company 06 Roadmap 10 Clinical Development at MorphoSys 12 MorphoSys – A Strong Development Partner 14 Research at MorphoSys 16 Letter to the Shareholders group management report 25 Operations and Business Environment 49 Operating and Financial Review and Prospects 63 Outlook and Forecast 67 Shares and the Capital Market 71 Sustainable Business Development 76 Risk and Opportunity Report 84 Statement on Corporate Governance, Group Statement on Corporate Governance and Corporate Governance Report 113 Subsequent Events financial statements 116 Consolidated Statement of Profit or Loss (IFRS) 117 Consolidated Statement of Comprehensive Income (IFRS) 118 Consolidated Balance Sheet (IFRS) 120 Consolidated Statement of Changes in Stockholders’ Equity (IFRS) 122 Consolidated Statement of Cash Flows (IFRS) 124 Notes 176 Responsibility Statement additional information 177 Independent Auditor’s Report 182 Report of the Supervisory Board 186 Supervisory Board of MorphoSys AG 188 Glossary 191 List of Figures and Tables 192 Imprint GROUP MANAGEMENT REPORT FINANCIAL STATEMENTS

Magazine 4 Roadmap As a fully integrated biopharmaceutical company, we are driven by a desire to develop the medicines of tomorrow. The journey towards this goal has been and continues to be exciting.

Roadmap Magazine 5 GROUP MANAGEMENT REPORT FINANCIAL STATEMENTS

Magazine 6 Roadmap 1992 the beginning: The company was founded in Martinsried near Munich. first ipo: MorphoSys AG goes public on the Frankfurt Stock Exchange in 1999. On September 6, 2004, the Company entered into the TecDAX and in 2018 to the MDAX. Since late 2016 the headquarters is located in Planegg near Munich online report https://www.morphosys.com/company/history#roadmap antibody technology: In 2000, MorphoSys presented its HuCAL antibody library. This was followed by the HuCAL Gold antibody library (2001) and the HuCAL PLATINUM antibody library (2008). Ylanthia, the next generation of antibody technologies, was launched in 2011. Slonomics, which has been part of the MorphoSys technology portfolio since 2010, enables the precise optimization of antibodies from the Ylanthia library.
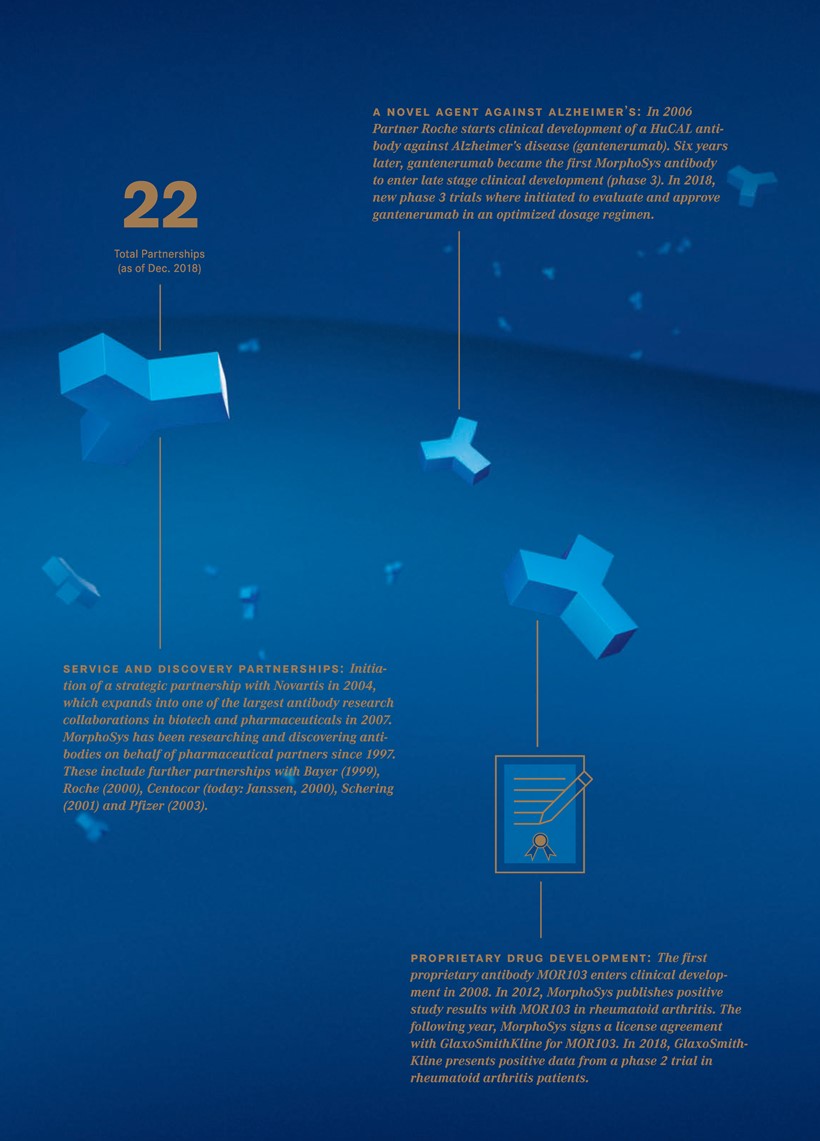
22 Total Partnerships (as of Dec. 2018) a novel agent against alzheimer’s: In 2006 Partner Roche starts clinical development of a HuCAL antibody against Alzheimer’s disease (gantenerumab). Six years later, gantenerumab became the first MorphoSys antibody to enter late stage clinical development (phase 3). In 2018, new phase 3 trials where initiated to evaluate and approve gantenerumab in an optimized dosage regimen. service and discovery partnerships: Initiation of a strategic partnership with Novartis in 2004, which expands into one of the largest antibody research collaborations in biotech and pharmaceuticals in 2007. MorphoSys has been researching and discovering antibodies on behalf of pharmaceutical partners since 1997. These include further partnerships with Bayer (1999), Roche (2000), Centocor (today: Janssen, 2000), Schering (2001) and Pfizer (2003). proprietary drug development : The first proprietary antibody MOR103 enters clinical development in 2008. In 2012, MorphoSys publishes positive study results with MOR103 in rheumatoid arthritis. The following year, MorphoSys signs a license agreement with GlaxoSmithKline for MOR103. In 2018, GlaxoSmith-Kline presents positive data from a phase 2 trial in rheumatoid arthritis patients.

new partnerships for proprietary development: MorphoSys is increasingly entering into development and marketing partnerships with other biotech and pharmaceutical companies in order to advance its proprietary drug candidates. These include partnerships with GSK (2013 for MOR103), Merck (2014 for immunoncology), I-Mab Biopharma (2017 for MOR202 and 2018 for MOR210), Novartis (2018 for MOR106, together with Galapagos). development of mor208: In 2010, MorphoSys signs a license agreement with Xencor Inc. for MOR208. In the same year, MorphoSys starts clinical development of the antibody. The first positive data on MOR208 where presented in 2012. In 2017, the U.S. Food and Drug Administration awarded MOR208 breakthrough therapy designation in the blood cancer indication of diffuse large B cell lymphoma (DLBCL). MorphoSys intends to develop MOR208 toward regulatory approval as soon as possible. first approval: In 2017, MorphoSys’s licensing partner Janssen receives approval for Tremfya® (guselkumab) for the treatment of moderate to severe plaque psoriasis in the United States, Europe and Canada. Approvals in other countries to follow.

Roadmap Magazine 9 Nasdaq Our Goal: Is to develop MorphoSys into a Fully Integrated Biopharmaceutical Company. 2018 nasdaq ipo and establishment of us presence: With the listing and IPO at Nasdaq in 2018, MorphoSys gains numerous new investors and strengthens its capital base (gross proceeds USD 239 million). In addition, the US subsidiary MorphoSys US Inc. is established to prepare the Company’s planned commercialization for MOR208 subject to FDA approval.

Magazine 10 Clinical Development at MorphoSys online report https://reports.morphosys.com/2018/magazine/hitting-the-home-stretch/

Clinical Development at MorphoSys Magazine 11 GROUP MANAGEMENT REPORT FINANCIAL STATEMENTS Clinical Development at MorphoSys: Hitting the home stretch With the development of the antibody MOR208, MorphoSys has reached the most advanced development stage as a biotechpharmaceutical company. Originally, we started out as explorers and service providers. We have identified thousands of antibodies for our pharma partners, the most promising of which are in development (see following pages). Today, MOR208 is the first antibody from our proprietary pipeline that we intend to develop to market approval on our own account. MOR208 is being investigated for the treatment of blood cancer, such as diffuse large cell B cell lymphoma (DLBCL), an aggressive cancer of the lymphatic system. With this, MOR208 gives hope to patients by addressing a high unmet medical need. For those DLBCL patients who do not respond to standard therapies, current treatment options are very limited. We carry out multiple clinical studies and, by now, can see the home stretch. In October 2017, the U.S. Food and Drug Administration (FDA) granted breakthrough therapy designation for MOR208 in combination with lenalidomide. As we intend to apply for FDA approval by the end of 2019, we have already started setting up a commercial organization in the U.S. Prospectively, the development of proprietary drug candidates up to market approval will be a central pillar of MorphoSys’s business model.

Magazine 12 MorphoSys – A Strong Development Partner MorphoSys – A Strong Development Partner Strong partners, joint success MorphoSys is a well-respected development partner for renowned pharmaceutical and biotechnology companies worldwide. This is not limited to the discovery of compounds, where we have excellent expertise and experience. We are also involved in a variety of partnerships that cover the complete development range – from the identification of target molecules to later stages of development and all the way to market approval. The antibody MOR106 is a good example how to advance the development successfully with partners. We discovered and developed MOR106 together with the Belgian company Galapagos N.V. While Galapagos has identified the target molecule, we have identified the antibody. Preclinical studies have shown that MOR106 plays an important role in certain inflammatory skin diseases. MOR106 is currently in clinical development for the treatment of atopic dermatitis. In July 2018, we, together with Galapagos, signed an exclusive global licensing agreement with the pharmaceutical company Novartis. Should MOR106 be approved for such a broad indication as atopic dermatitis, the partner Novartis will bring in the respective necessary commercial and marketing power. The agreement includes an upfront and potential success-based milestone payments. In addition, Novartis will take over all future cost for research and development. In summary, this partnership has created a network resulting in benefits for all stakeholders: First and foremost as we hope for the patients, but also for the companies in terms of joint research and the later commercialization as well as revenue generation. MD Anderson Cancer Center Together with the renowned MD Anderson Cancer Center at the University of Texas, we work on the research and development of therapeutic antibodies against cancer. Based on our Ylanthia platform, we will identify antibody candidates for jointly selected target molecules. GlaxoSmithKline With GlaxoSmithKline we have entered into an agreement for the development and commercialization of MOR103. This antibody is currently in development for the treatment of patients with rheumatoid arthritis. Under the license agreement, we will receive potential payments totaling 445 million euros and double-digit royalties on net sales.

MorphoSys – A Strong Development Partner Magazine 13 GROUP MANAGEMENT REPORT FINANCIAL STATEMENTS Leo Pharma Dermatology: Together with Leo Pharma we have an ongoing collaboration working on antibody-based therapies. In 2018 we extended this partnership to also develop peptide-based therapeutics. Using their broad experience in dermatology, Leo Pharma selects target molecules and we identify suitable drug candidates. In addition, we have the option to develop resulting drug candidates in cancer indications ourselves up to market approval. I-Mab I-Mab and MorphoSys signed a strategic collaboration and regional licensing agreement for the preclinical antibody MOR210 in November 2018. MOR210 has the potential for development in the innovative field of immuno-oncology. I-Mab will have exclusive rights to develop and commercialize MOR210 in China, Hong Kong, Macao, Taiwan and South Korea, while we retain the rights in the rest of the world. Galapagos & Novartis Together with Galapagos, we have entered into a global licensing agreement with Novartis for the development of MOR106 for the treatment of atopic dermatitis. The agreement includes an upfront payment of 95 million euros, potential milestone payments of up to 850 million euros as well as royalties. online report https://reports.morphosys.com/2018/magazine/partners/

Magazine 14 Research at MorphoSys there are currently more than 100 antibody programs in the morphosys pipeline. i hope that many of these will make it to the market and that many patients will benefit from our work. Stefan Schmidt, Chemical-Technical Assistant at MorphoSys online report https://reports.morphosys.com/2018/ magazine/searching-and-finding/

Research at MorphoSys Magazine 15 GROUP MANAGEMENT REPORT FINANCIAL STATEMENTS Research at MorphoSys Searching and Finding the Right Antibody MorphoSys identifies the right antibodies for interesting therapeutic targets in partnerships with biotech and pharmaceutical companies. This business model brought success to MorphoSys, and antibody discovery remains a pillar of the Company until today. Tremfya® has now been approved for the treatment of patients with psoriasis, as the first antibody based on our technology. Stefan Schmidt was involved in the discovery of the antibody in the laboratory in 2003. Mr. Schmidt, can you still remember how you and your colleagues discovered Tremfya®? Stefan Schmidt — We performed several lab experiments to find an antibody for Janssen that is directed against a subunit of the newly discovered IL-23 molecule. IL-23 is an endogenous messenger substance that plays a role in the development of psoriasis. In hindsight, it was pure coincidence that I, of all people, was involved in the experiment that eventually lead to the discovery of Tremfya® - it could have been anyone of our team. Following the discovery, MorphoSys transferred Tremfya® to Janssen for further development. Have you been following this? Stefan Schmidt — As far as possible, I try to follow the development of all antibodies we have discovered for other companies. When the news came out that Tremfya® was approved in the U.S. – and later also in other countries such as the EU and Japan – was just fantastic. Knowing that patients now benefit from what we originally discovered in the laboratory is very rewarding. Is there still a need for antibody discovery efforts today? Stefan Schmidt — In my opinion, the need for specific antibodies is greater than ever, as the medicine of today moves towards so-called personalized treatments tailored for specific disease variants or target molecules. Antibodies are ideal candidates for such targeted therapies due to their specificity and selectivity, thereby avoiding unnecessary treatments and side effects. Besides Tremfya®, are there any other antibodies from MorphoSys’s laboratories that are close to approval? Stefan Schmidt — There are currently more than 100 antibody programs in the MorphoSys pipeline. I hope that many of them will make it to the market, in the U.S., in Europe, worldwide, and that many patients will benefit from our work. That’s why we go to work every day.

The Company 16 Letter to the Shareholders Dear fellow shareholders, ladies and gentlemen, The year 2018 was an outstanding one for MorphoSys. Our achievements in R&D, corporate development and in strengthening the company’s finances combine to take us significantly closer to our objective of making MorphoSys a fully integrated biopharmaceutical company. All stakeholders in MorphoSys as well as many qualified observers were deeply impressed by the progress made with our lead investigational program, MOR208, in 2018. By year-end, this program had emerged as one of the most interesting new cancer drug candidates in the pharmaceutical industry. We also made excellent progress elsewhere in our Proprietary Development segment, with deals on MOR106 and MOR210 and encouraging developmental advances for MOR202 and MOR103. The potential in our Partnered Discovery segment was highlighted by the commercial success of Janssen’s drug Tremfya®, which reached over half a billion U.S. dollars in sales in its first full year on the market. We expect this segment to become an increasingly lucrative source of income, which we will use to grow our business, with a clear focus on our Proprietary Development programs, particularly MOR208. we are committed to creating new treatments for patients suffering from serious diseases – and thereby building value for all of our stakeholders. Dr. Simon Moroney, Chief Executive Officer

Letter to the Shareholders The Company 17 GROUP MANAGEMENT REPORT FINANCIAL STATEMENTS With compelling clinical data, breakthrough therapy designation from the FDA and a clear view of the path to market, we decided to commercialize MOR208 in the U.S. and to build an organization there for this purpose. In April, we completed a highly successful listing of the company’s shares on the Nasdaq stock exchange. We made the decision to list on Nasdaq to ensure we make the most of the enormous opportunity that MOR208 represents for MorphoSys. With maturing clinical data, breakthrough therapy designation from the FDA and a clear view of the path to market, we are planning to commercialize MOR208 in the U.S. and are building an organization there for this purpose. This plan resonated well with investors, leading to an oversubscribed Nasdaq offering with gross proceeds of US$ 239 million. We are establishing our commercial organization in the U.S. and the first senior executives have now been recruited. We are building with a very clear goal in mind: to ensure that the market launch of MOR208, subject of course to regulatory approval, will be a success. If all goes according to plan, this could happen as early as mid-2020. All of us here at MorphoSys are very excited about the potential opportunity to bring MOR208 to market and to help patients suffering from a particularly aggressive form of cancer, diffuse large B-cell lymphoma (DLBCL). We are very encouraged by the most recent clinical data from our ongoing study of MOR208 in combination with lenalidomide (L-MIND) in relapsed or refractory DLBCL. These data, which we presented in December at the American Society of Hematology (ASH) Annual Meeting, were superior to the results that we had published previously in respect of response rates and especially progression-free survival. One third of all patients who participated in the study have experienced complete regression of their tumors, and several are still in remission after two years. If approved, the combination of MOR208 and lenalidomide could provide a new chemotherapy-free regimen to patients who are in urgent need of more therapeutic options. Ultimately, we believe that MOR208-based therapies have the potential to become a treatment alternative for patients with a variety of B-cell malignancies, and our goal is to

The Company 18 Letter to the Shareholders we will work closely with the fda to develop our blood cancer antibody mor208 towards approval as fast as possible. Dr. Malte Peters, Chief Development Officer make these available to as many patients as possible. To that end, we already announced plans to bring MOR208 into front-line development in DLBCL later this year. Over the course of the year, we also made outstanding progress with the other programs in our Proprietary Development segment. In July, we were delighted to announce that, together with our partner Galapagos, we had entered an exclusive global license agreement with Novartis for MOR106. We are developing this antibody as a potential treatment for atopic dermatitis, a debilitating skin disease that affects over 80 million people across the world’s seven largest markets for pharmaceuticals. Bringing medicines to such a large patient population is extremely challenging, which is why it made sense for us to secure the cooperation of a large partner. The deal with Novartis will enable us to advance MOR106 as quickly and broadly as possible while allowing us to allocate more resources elsewhere, in particular, to the development of MOR208. Another important partnership is our exclusive strategic collaboration and regional licensing agreement with I-Mab Biopharma for MOR202. I-Mab is Our partnerships should provide a growing revenue stream in the years ahead, they allow us to enter new territories and they enable us to exploit the full potential of products based on our technology.

Letter to the Shareholders The Company 19 GROUP MANAGEMENT REPORT FINANCIAL STATEMENTS moving forward with the development of MOR202 as planned and expects to initiate pivotal clinical trials in multiple myeloma during 2019. In November 2018, we expanded our agreement with I-Mab to include a pre-clinical program, MOR210. Our relationship with I-Mab takes our product candidates into territories, most importantly China, that it would be difficult for us to target ourselves, while allowing us to retain rights in the rest of the world – a true win-win outcome. We will continue to pursue our own development plans for MOR202 and aim to start a clinical trial in an autoimmune disease later this year. Rounding out the progress in our Proprietary Development segment in 2018 was the confirmation from GSK that they intend to continue developing MOR103 in rheumatoid arthritis. We look forward to the start of a phase 3 clinical trial during 2019. While our intense focus on MOR208 demands the majority of our investment, it is important to acknowledge the solid foundation that our Partnered Discovery segment provides for our business. Partnerships in this segment provide value on several fronts: they should provide a growing revenue stream in the years we have a very solid financial position that allows us to fully explore the value of our proprietary therapeutic candidates. Jens Holstein, Chief Financial Officer

The Company 20 Letter to the Shareholders ahead, they allow us to enter territories that it would be difficult for us to reach on our own and they enable us to exploit the full potential of products discovered using our technology. A great example is Janssen’s Tremfya®, the first therapeutic agent based on MorphoSys’s proprietary technology to gain market approval. Tremfya® was first approved in 2017 in the U.S. for the treatment of plaque psoriasis. Other countries followed shortly thereafter. In 2018, its first full year on the market, total sales were US$ 544 million, meaning that Tremfya® is well on its way to becoming a blockbuster. In its core indication of psoriasis, Janssen reported new clinical data in 2018 demonstrating superiority over competitor Cosentyx® in a head-to-head clinical study, based on a very important clinical metric, the PASI 90 score at week 48. Janssen is conducting 12 late-stage clinical trials of Tremfya® in a variety of settings, illustrating the advantage for us of working with a committed partner. We expect sales of Tremfya® to continue to grow strongly in the years to come, from which MorphoSys will benefit through our royalty participation. To conclude, I would like to mention two critical factors that have contributed to MorphoSys’s success and our ability to grow. First, our technologies, on which our extraordinarily rich product pipeline is based. Second, our dedicated and highly capable people, without whom none of our achievements would in order to further strengthen our pipeline, we bring new innovative product candidates into clinical development. Dr. Markus Enzelberger, Chief Scientific Officer

Letter to the Shareholders The Company 21 GROUP MANAGEMENT REPORT FINANCIAL STATEMENTS MorphoSys is stronger than it has ever been. We look forward to another exciting year ahead as we advance to the next stage in our growth – becoming an integrated commercial biopharmaceutical company. have been possible. On behalf of MorphoSys’s Management Board, I would like to express our deep gratitude to all of them for their ongoing efforts, creativity and commitment to our company’s success. I would also like to thank you, our shareholders, for your continued support and for your belief in the company. Allow me to conclude with a few words on my own behalf. On February 19, 2019, I informed the Supervisory Board of MorphoSys that I will not renew my contract as a member of the company's Management Board. As a result of this decision, I will step down as CEO on expiry of my current contract on June 30, 2020, or when a successor is appointed, whichever comes sooner. I am immensely proud of everything we have achieved over the past 27 years since MorphoSys was founded. MorphoSys today is stronger than it has ever been and I have every confidence in its future. There is only one reason for my decision: after dedicating such a long time to MorphoSys, I am looking forward to having more time for other interests, and to exploring new opportunities. In the meantime, it’s business as usual. We look forward to another exciting year ahead as we advance to the next stage in our growth – becoming an integrated commercial biopharmaceutical company. DR. SIMON MORONEY CHIEF EXECUTIVE OFFICER

Group Management Report 22 Contents Group Management Report

Contents Group Management Report 23 GROUP MANAGEMENT REPORT FINANCIAL STATEMENTS 25 Operations and Business Environment 49 Operating and Financial Review and Prospects 63 Outlook and Forecast 67 Shares and the Capital Market 71 Sustainable Business Development 76 Risk and Opportunity Report 84 Statement on Corporate Governance, Group Statement on Corporate Governance and Corporate Governance Report 113 Subsequent Events

Group Management Report Operations and Business Environment 24 The year 2018 was a successful one for MorphoSys. Our goal is to discover, develop and commercialize outstanding, innovative therapies for critically ill patients. The focus of our business activities is on cancer. Working toward this goal, we made good progress in advancing product candidates at various stages of development during the year under review. In 2018, we announced positive data from two ongoing clinical studies on MOR208, our antibody for the treatment of blood cancer. We have established a wholly-owned subsidiary to build a strong U.S. presence to prepare for the planned commercialization of MOR208 pending FDA approval. Furthermore, we entered into or expanded several important partnerships. We and our partner Galapagos entered into a worldwide, exclusive agreement with Novartis Pharma AG covering the development and commercialization of our joint program MOR106. This collaboration will enable us to accelerate and broaden the development of MOR106 beyond the current focus on atopic dermatitis and to fully exploit the potential of this drug candidate. Building on our existing collaboration with I-Mab Biopharma for MOR202 in Greater China, we entered into an exclusive strategic collaboration and regional licensing agreement for MOR210, a preclinical-stage antibody directed against C5aR, which has potential to be developed as an immuno-oncology agent. We were also pleased to report successes of our partners. Tremfya®, developed by our partner Janssen and the first approved and marketed therapeutic antibody based on MorphoSys’s proprietary technology, was granted marketing authorization in several countries during 2018, including Japan. Janssen continued to explore the use of Tremfya® in additional indications and reported positive long-term data in plaque psoriasis. Royalty payments showed strong year-on-year growth in 2018 which we reinvested in the development of our proprietary drug programs and in building a commercial organization. We aim to become a fully integrated biopharmaceutical company, developing and commercializing our own drugs, and during 2018 we were able to take important steps towards achieving that goal.

Operations and Business Environment Group Management Report 25 FINANCIAL STATEMENTS Operations and Business Environment Strategy and Group Management STRATEGY AND OBJECTIVES MorphoSys intends to discover, develop and commercialize innovative therapies for patients suffering from serious diseases, with a focus on oncology. Having successfully transitioned from a technology provider to a drug development organization over the past years, we now, as the next step of our corporate development path, aim to transform into an integrated commercial biopharmaceutical company. Based on our leading expertise in antibody, protein and peptide technologies, we have created, together with our partners, more than 100 therapeutic product candidates, of which 29 are currently in clinical development. Our main value drivers are our proprietary drug candidates, led by our investigational antibody* MOR208, which is being developed for the treatment of blood cancers. Guselkumab (Tremfya),® marketed by Janssen, is the first commercial product based on MorphoSys’s proprietary technology and is approved in the United States, Canada, Euro-pean Union, Japan and a number of other countries worldwide. This antibody, like the majority of our development programs, is the result of a partnership with a pharmaceutical company. MorphoSys intends to use the revenues generated from these partnerships to advance its proprietary development portfolio which currently comprises 12 programs, one of which is in pivotal development. The Proprietary Development segment focuses on the development of therapeutic agents based on our proprietary technology platforms, candidates in-licensed from other companies and programs co-developed with partners. During clinical development, we determine whether and at which point to pursue a partnership for later development and commercialization. The drug candidate can then be either completely out-licensed or developed further in cooperation with a pharmaceutical or bio-technology company (co-development). Alternatively, individual projects may be developed on a proprietary basis until they reach the market, with MorphoSys commercializing a product in selected regions. In the Partnered Discovery segment, MorphoSys generates antibody candidates for partners in the pharmaceutical and bio-technology industries. We receive contractual payments, which include license fees for technologies and funded research, as well as success-based milestone payments and royalties* on product sales. The funds generated from these partnerships support our long-term business model and help fund our proprietary development activities. Both segments are almost exclusively based on MorphoSys’s innovative technologies, which include HuCAL*, our antibody library* which is the basis for more than 20 product candidates currently in clinical development, and the next-generation antibody platform Ylanthia*. In addition, over recent years we have established two types of stabilized peptides: our lanthipeptide platform, which we gained access to with the acquisition of Lanthio Pharma B.V. in May 2015, and our HTH* peptide platform, which we developed ourselves. We continue to apply our resources and expertise to expand and deepen our technologies. In addition, we added the compounds MOR208 and MOR107 to our portfolio which have been in-licensed and acquired, respectively. *SEE GLOSSARY page 188 Our goal is to maximize the portfolio’s value by investing in the development and, if appropriate, the commercialization of our proprietary drug candidates while maintaining financial discipline and strict cost control. GROUP MANAGEMENT AND PERFORMANCE INDICATORS MorphoSys pays equal attention to financial and non-financial indicators to steer the Group. These indicators help to monitor the success of strategic decisions and give the Company the opportunity to take quick corrective action when necessary. The Company’s management also follows and evaluates selected early indicators so that it can thoroughly assess a project’s progress and act promptly should a problem occur.

Group Management Report Operations and Business Environment 26 FINANCIAL PERFORMANCE INDICATORS Our financial performance indicators are described in detail in the section entitled “Operating and Financial Review and Prospects.” Earnings before interest and taxes (EBIT – defined as earnings before finance income, finance expenses, impairment losses on financial assets and income taxes), revenues, operating expenses, segment results and liquidity (liquidity is presented in the following balance sheet items: as of December 31, 2018 “cash and cash equivalents”, “financial assets at fair value, with changes recognized in profit or loss” as well as “financial assets at amortized cost”; as of December 31, 2017 “cash and cash equivalents”, “available-for-sale financial assets” as well as “financial assets classified as loans and receivables”) are the key financial indicators we use to measure our operating performance. Segment indicators are reviewed monthly, and the budget for the current financial year is revised and updated on a quarterly basis. Each year, the Company prepares a mid-term plan for the subsequent three years. A thorough cost analysis is prepared regularly and used to monitor the Company’s adherence to financial targets and make comparisons to previous periods. MorphoSys’s business performance is influenced by factors such as royalty, milestone and license payments, research and development expenses, other operating cash flows, existing liquidity resources, expected cash inflows and working capital. These indicators are also routinely analyzed and evaluated with special attention given to the Statement of profit or loss, existing and future liquidity and available investment opportunities. The net present value of investments is calculated using discounted cash flow models*. TABLE 01 Development of Financial Performance Indicators1 in million € 2018 2017 2016 2015 2014 MORPHOSYS GROUP Revenues 76.4 66.8 49.7 106.2 64.0 Operating expenses (136.5) (133.8) (109.8) (93.7) (70.1) EBIT2 (59.1) (67.6) (59.9) 17.2 (5.9) Liquidity3 454.7 312.2 359.5 298.4 352.8 PROPRIETARY DEVELOPMENT Segment revenues 53.6 17.6 0.6 59.9 15.0 Segment EBIT (53.3) (81.3) (77.6) 10.7 (18.4) PARTNERED DISCOVERY Segment revenues 22.8 49.2 49.1 46.3 49.0 Segment EBIT 13.3 30.2 31.0 20.4 25.9 1 Differences may occur due to rounding. 2 Contains unallocated expenses (see also Item 3.3 of the Notes): 2018: € 19.2 million, 2017: € 16.5 million, 2016: € 13.4 million, 2015: € 13.9 million, 2014: € 13.4 million). 3 Liquidity presented in the following balance sheet items: as of December 31, 2018 “cash and cash equivalents”, “financial assets at fair value, with changes recognized in profit or loss” as well as “other financial assets at amortized cost”; as of December 31, 2017, 2016, 2015, 2014 “cash and cash equivalents”, “available-for-sale financial assets and bonds” as well as “financial assets classified as loans and receivables”. NON-FINANCIAL PERFORMANCE INDICATORS To secure and expand its position in the therapeutics market, MorphoSys relies on the steady progress of its product pipeline, not only in terms of the number of therapeutic product candidates (115 at the end of the reporting year) but also based on the progress of its development pipeline and prospective market potential. Innovative technologies, when applied appropriately, can be used to generate superior product candidates and therefore a further key performance indicator is the progress of the Company’s technology development. In addition to the quality of our research and development, our professional management of partnerships is also a core element of our success, as demonstrated by new contracts and the ongoing progress made within existing alliances. Details on these performance indicators can be found in the section entitled “Research and Development and Business Performance” (page 31).
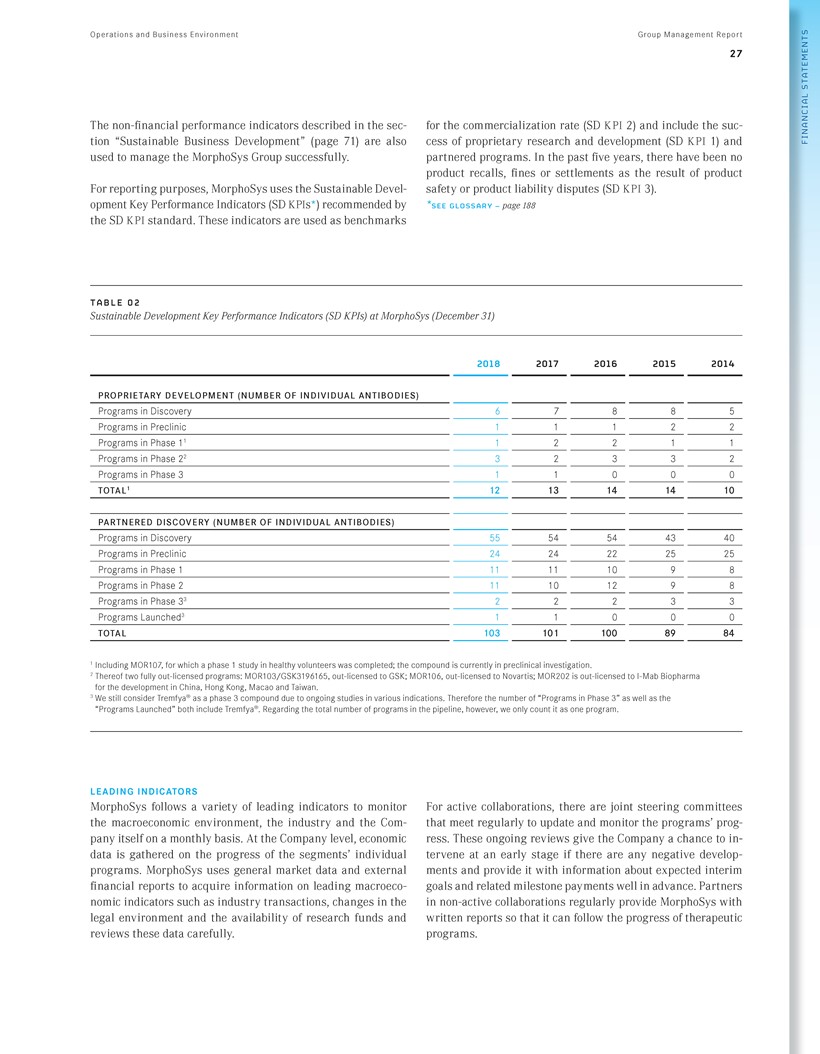
Operations and Business Environment Group Management Report 27 FINANCIAL STATEMENTS The non-financial performance indicators described in the section “Sustainable Business Development” (page 71) are also used to manage the MorphoSys Group successfully. For reporting purposes, MorphoSys uses the Sustainable Development Key Performance Indicators (SD KPIs*) recommended by the SDKPI standard. These indicators are used as benchmarks for the commercialization rate (SDKPI 2) and include the success of proprietary research and development (SDKPI 1) and partnered programs. In the past five years, there have been no product recalls, fines or settlements as the result of product safety or product liability disputes (SDKPI 3). *SEE GLOSSARY - page 188 TABLE 0 2 Sustainable Development Key Performance Indicators (SD KPIs) at MorphoSys (December 31) 2018 2017 2016 2015 2014 PROPRIETARY DEVELOPMENT ( NUMBER OF INDIVIDUAL ANTIBODIES) Programs in Discovery 6 7 8 8 5 Programs in Preclinic 1 1 1 2 2 Programs in Phase 11 1 2 2 1 1 Programs in Phase 22 3 2 3 3 2 Programs in Phase 3 1 1 0 0 0 T O TA L1 12 13 14 14 10 PAR TN ERED DI SC O V ER Y ( NUMBER OF INDIVIDUAL ANTIBODIES) Programs in Discovery 55 54 54 43 40 Programs in Preclinic 24 24 22 25 25 Programs in Phase 1 11 11 10 9 8 Programs in Phase 2 11 10 12 9 8 Programs in Phase 33 2 2 2 3 3 Programs Launched3 1 1 0 0 0 TOTAL 103 101 100 89 84 1 Including MOR107, for which a phase 1 study in healthy volunteers was completed; the compound is currently in preclinical investigation. 2 Thereof two fully out-licensed programs: MOR103/GSK3196165, out-licensed to GSK; MOR106, out-licensed to Novartis; MOR202 is out-licensed to I-Mab Biopharma for the development in China, Hong Kong, Macao and Taiwan. 3 We still consider Tremfya® as a phase 3 compound due to ongoing studies in various indications. Therefore the number of “Programs in Phase 3” as well as the “Programs Launched” both include Tremfya®. Regarding the total number of programs in the pipeline, however, we only count it as one program. LEADING INDICATORS MorphoSys follows a variety of leading indicators to monitor the macroeconomic environment, the industry and the Com-pany itself on a monthly basis. At the Company level, economic data is gathered on the progress of the segments’ individual programs. MorphoSys uses general market data and external financial reports to acquire information on leading macroeco-nomic indicators such as industry transactions, changes in the legal environment and the availability of research funds and reviews these data carefully. For active collaborations, there are joint steering committees that meet regularly to update and monitor the programs’ prog-ress. These ongoing reviews give the Company a chance to in-tervene at an early stage if there are any negative develop-ments and provide it with information about expected interim goals and related milestone payments well in advance. Partners in non-active collaborations regularly provide MorphoSys with written reports so that it can follow the progress of therapeutic programs.

Group Management Report Operations an d Business Environment 28 The business development area uses market analyses to get an early indication of the market’s demand for new technologies. By continuously monitoring the market, MorphoSys can quickly respond to trends and requirements and initiate its own activities or partnerships. Organizational Structure ORGANIZATION OF THE MORPHOSYS GROUP The MorphoSys Group, consisting of MorphoSys AG and its subsidiaries, develops and commercializes antibodies* and peptides for therapeutic applications. The activities of the Group’s two business segments are based on its proprietary technologies. The Proprietary Development segment combines all of the Company’s proprietary research and development of therapeutic compounds. MorphoSys, alone or with partners, develops its proprietary and in-licensed compounds with the option to bring them into partnerships, out-license them or market them in selected regions and therapeutic settings. The development of proprietary technologies is also conducted in this segment. The second business segment, Partnered Discovery, uses MorphoSys’s technologies to make human* antibody- based therapeutics on behalf of partners in the pharmaceutical industry. All business activities within the scope of these collaborations are reflected in this segment. MorphoSys AG is located at its registered office in Planegg near Munich. MorphoSys AG’s subsidiary Lanthio Pharma B.V. and its subsidiary LanthioPep B.V. are located in Groningen, the Netherlands. In order to provide the organizational framework for a potential future commercialization of our lead compound MOR208 in the United States, MorphoSys US Inc. was founded in July 2018. The wholly owned subsidiary of MorphoSys AG was established in Princeton, New Jersey, USA. In the future, it is planned to locate the subsidiary in Boston, Massachusetts, USA. MorphoSys AG’s central corporate functions such as accounting, controlling, human resources, legal, patent, purchasing, corporate communications and investor relations, as well as the two segments Proprietary Development and Partnered Discovery, are all located in Planegg. The subsidiaries MorphoSys US Inc., Lanthio Pharma B.V. and its subsidiary LanthioPep B.V., are largely autonomous and independently managed. These subsidiaries generally have their own management and administration, as well as human resources, accounting and business development departments. The subsidiaries Lanthio Pharma B.V. and LanthioPep B.V. have their own research and development laboratories as well. In June 2018, the subsidiary Sloning BioTechnology GmbH, located in Planegg, Germany, was merged into MorphoSys AG. Additional information about the Group’s structure can be found in the Notes (Item 2.2.1). LEGAL STRUCTURE OF THE MORPHOSYS GROUP : GROUP MANAGEMENT AND SUPERVISION MorphoSys AG, a German stock corporation listed in the Prime Standard segment of the Frankfurt Stock Exchange as well as on the Nasdaq Global Market, is the parent company of the MorphoSys Group. In accordance with the German Stock Corporation Act, the Company has a dual management structure with the Management Board as the governing body with its four members appointed and overseen by the Supervisory Board. The Supervisory Board is elected by the Annual General Meeting and currently consists of six members. Detailed information concerning the Group’s management and control and its corporate governance principles can be found in the Corporate Governance Report. The Senior Management Group supports the Management Board of the Company. At the end of the reporting year, the Senior Management Group consisted of 24 managers from various departments. Business Activities DRUG DEVELOPMENT MorphoSys develops drugs using its own research and development (R&D) and by collaborating with partners from the pharmaceutical and biotechnology industry or with academic institutions. Our core business activity is developing new treatments for patients suffering from serious diseases. We have a very broad pipeline, which comprised a total of 115 therapeutic programs at the end of 2018, 29 of which are in clinical development. The first therapeutic agent based on MorphoSys’s proprietary technology, which was developed by one of our licensees, is approved in the United States, Canada, European Union, Japan and a number of other countries worldwide. Figure 1 shows the revenue development of the MorphoSys Group divided into our two business segments Proprietary Development and Partnered Discovery, which are described in more detail in the Strategy and Group Management and Organizational Structure sections above. Our Proprietary Development programs are critical to our goal of becoming a fully integrated biopharmaceutical company that develops and commercializes its own drugs. We are focusing our development activities on cancer treatments, but also have selected programs in inflammatory diseases. The ability of monoclonal antibodies* to bind to specific antigens* on tumors or activate the immune system against cancer to unleash a therapeutic effect in patients has led to their dominant role in targeted cancer therapies. According to a report from the IQVIA Institute, global spending on cancer medicines rose to approximately US$ 133 billion in 2017. Overall, the global market for oncology medicines is predicted to reach as much as US$ 200 billion by 2022. Chronic inflammatory and

3.Operations and Business Environment Group Management Report 29 01 Revenues of the MorphoSys Group by Segment (in million )‹1 1 Differences due to rounding. 64.0 106.2 49.7 66.8 76.4 59.9 49.0 46.3 49.1 49.2 53.6 15.0 17.6 22.8 0.6 2014 2015 2016 2017 2018 partnered discovery proprietary development autoimmune diseases* affect millions of patients worldwide and impose an enormous social and economic burden. The QuintilesIMS Institute estimates the global market for the treatment of autoimmune diseases will be in the range of US$ 75 billion to US$ 90 billion in the year 2021. MorphoSys’s most advanced Proprietary Development programs are highlighted below in the Research and Development and Business Performance section on page 31. Our clinical stage Partnered Discovery programs are developed entirely under the control of our partners. They comprise not only programs in our core area of oncology, but also in indications where we have not established proprietary expertise. The most advanced Partnered Discovery programs are highlighted below in the Research and Development and Business Performance section on page 31. TECHNOLOGIES MorphoSys has developed a number of technologies that provide direct access to human antibodies for treating diseases, which we utilize for both our Proprietary Development and Partnered Discovery programs. One of the most widely known MorphoSys technologies is HuCA L , which is a collection of billions of fully human antibodies and a system for their optimization. Another fundamental platform is Ylanthia, a large anti body library representing the next generation of antibody technology. Ylanthia is based on an innovative concept for generating highly specific and fully human antibodies. We expect Ylanthia to set a new standard for the pharmaceutical industry’s development of therapeutic antibodies in this decade and beyond. Slonomics* is the Company’s patented, fully automated technology for gene synthesis and modification, which is used to generate highly diverse gene libraries in a controlled process to be used, for example, for the improvement of antibody properties. The lanthipeptide technology developed by Lanthio Pharma B.V., a wholly owned MorphoSys subsidiary, is a valuable addition to our existing library of antibodies and opens up new possibilities for discovering potential drugs based on stabilized peptides. The newest addition to the technology portfolio is our proprietary Helix Turn Helix (HTH) peptide technology. In contrast to the lanthipeptides* that are stabilized by a specific amino acid modification, the HTH peptides are endowed with an inherent stability by their structure. COMMERCIAL In July 2018, we established a wholly owned subsidiary, MorphoSys US Inc. The subsidiary focuses on building a strong U.S. presence to prepare for the planned commercialization of MOR208 subject to FDA* approval. *SEE GLOSSARY page 188 SEE FIGURE 01- Revenues of the MoprhoSys Group by Segment (page 29) >> SEE FIGURE 02- MorphoSys’s Product Pipeline (page 30) SEE FIGURE 03 Active Clinical Studies with MorphoSys Antibodies (page 30)

Group Management Report Operations and Business Environment PROGRAM / PARTNER INDICATION PHASE 1 2 3 M1 Tremfya® (guselkumab) / Janssen/J&J Psoriasis Gantenerumab / Roche Alzheimer’s disease MOR208 / not partnered Hematological malignancies Anetumab ravtansine (BAY94-9343) / Bayer Solid tumors BAY1093884 / Bayer Hemophilia BHQ880 / Novartis Multiple myeloma Bimagrumab (BYM338) / Novartis Metabolic diseases CNTO6785 / Janssen/J&J Infl ammation Ianalumab (VAY736) / Novartis Infl ammation MOR103 (GSK3196165) / GlaxoSmithKline Infl ammation MOR106 / Novartis/Galapagos Infl ammation MOR202 / I-Mab Biopharma2 Multiple myeloma Nov-12 (MAA868) / Novartis Prevention of thrombosis Setrusumab (BPS804) / Mereo/Novartis Brittle bone syndrome Tesidolumab (LFG316) / Novartis Eye diseases PROGRAM / PARTNER INDICATION PHASE 1 2 3 M1 Utomilumab (PF-05082566) / Pfizer Cancer Xentuzumab (BI-836845) / BI Solid tumors BAY2287411 / Bayer Cancer Elgemtumab (LJM716) / Novartis Cancer MOR1073 (LP2-3) / nicht in Partnerschaft Not disclosed NOV-7 (CLG561) / Novartis Eye diseases NOV-8 / Novartis Infl ammation NOV-9 (LKA651) / Novartis Diabetic eye diseases NOV-10 (PCA062) /Novartis Cancer NOV-11 / Novartis Blood disorders NOV-13 (HKT288) / Novartis Cancer NOV-14 / Novartis Asthma PRV-300 (CNTO3157) / ProventionBio Infl ammation Vantictumab (OMP-18R5) / OncoMed Solid tumors legend: mor program out- licensed mor program partnered discovery program MorphoSys’s Product Pipeline (December 31, 2018) 1 Market 2 For development in China, Hongkong, Taiwan, Macao 3 A phase 1 study in healthy volunteers was completed. MOR107 is currently in preclinical investigation with a focus on oncology indications. 02 03 Active Clinical Studies* with MorphoSys Antibodies (December 31) * SEE GLOSSARY: page 188 PHASE 1 2 3 2014 2015 2016 2017 2018 24 27 8 29 19 12 29 25 10 27 31 14 26 32 15 30
31 Operations and Business Environment Group Management Report INFLUENCING FACTORS A political goal of many countries is to provide cost-effective medical care for its citizens as demographic change drives the need for new forms of therapy. Cost-cutting could slow the industry’s development. As part of their austerity measures, governments in Europe, the United States and Asia have tightened their healthcare restrictions and are closely monitoring drug pricing and reimbursement. The regulatory approval processes in the U.S., Europe and elsewhere are lengthy, time-consuming and unpredictable. It typically takes many years from the start of human clinical testing to obtain marketing approval of a drug, which depends upon numerous factors, including the substantial discretion of the regulatory authorities. Approval laws, regulations, policies or the type and amount of information necessary to gain approval may change during the course of a product candidate’s clinical development and may vary among jurisdictions. Generic competition, which is already common in the field of small molecule* drugs, now poses an increasing challenge to the biotechnology industry due to drug patent expiries. The technological barriers for generic biopharmaceuticals, or biosimilars*, are expected to remain high. Nevertheless, many drug manufacturers, particularly those from Europe and Asia, are now entering this market and placing more competitive pressure on established biotechnology companies. In the U.S., the approval of biosimilars as an alternative form of treatment has been very slow; they are, however, gaining more attention because of increasing pressure in the healthcare sector to reduce costs. According to the Allied Market Research information service, the global market for biosimilars will reach US$ 27 billion in 2020. Research and Development and Business Performance 2018 BUSINESS PERFORMANCE MorphoSys’s business is strongly focused on advancing our therapeutic programs in research and development to benefit patients suffering from serious diseases and to increase MorphoSys’s value. The clinical development of proprietary programs with the goal of advancing them toward regulatory approval and commercialization is our focal point. We strive to gain access to novel disease-specific target* molecules, product candidates and innovative technology platforms to advance our Proprietary Development portfolio. MorphoSys also continues to participate in the advancements of our partners’ therapeutic programs through success-based milestone payments and royalties. The first antibody based on MorphoSys’s technology has been on the market in the U.S. since mid-2017. The key measures of success of MorphoSys’s research and development include: the initiation of projects and the progress of individual development programs, collaborations and partnerships with other companies to broaden our technology base and pipeline of compounds and to commercialize our therapeutic programs, clinical and preclinical* research results, regulatory guidance of health authorities to pursue approval of individual therapeutic programs, robust patent protection to secure MorphoSys’s market position. PROPRIETARY DEVELOPMENT On December 31, 2018, the number of Proprietary Development programs totaled 12, three of which were out-licensed, either fully or for certain regions only. Five of these programs are in clinical development, one is in preclinical development, and six are in the discovery stage. Our Proprietary Development activities are currently focused on the five clinical candidates: MOR208-an antibody for the treatment of hematological (blood) cancers for which MorphoSys holds exclusive worldwide commercial rights MOR202-an antibody for the treatment of multiple myeloma* and other cancers as well as certain autoimmune diseases for which we have signed a regional licensing agreement with I-Mab Biopharma for development and commercialization in China, Hong Kong, Taiwan and Macao MOR106-an antibody for the treatment of inflammatory diseases for which MorphoSys and Galapagos entered into an exclusive license agreement with Novartis in July 2018 MOR103/GSK3196165-an antibody that we have fully outlicensed to GlaxoSmithKline (GSK) and which is currently in clinical development at GSK for the treatment of rheumatoid arthritis* MOR107-a lanthipeptide developed by our subsidiary Lanthio Pharma which is currently in preclinical testing in oncology settings. *SEE GLOSSARY page 188 In addition to the programs listed above, we are pursuing several proprietary programs in earlier-stage research and development, including MOR210, a preclinical antibody that was licensed to I-Mab in November 2018 for China and certain other territories in Asia. MOR208 OVERVIEW MOR208 is an investigational monoclonal antibody* directed against the target molecule CD19*. CD19 is broadly expressed on the surface of B cells*, a type of white blood cell. CD19 enhances B cell receptor signaling, an important factor in B cell survival, making CD19 a potential target for the treatment of B cell malignancies, including DLBCL* (diffuse large B cell
Group Management Report Operations and Business Environment 32 lymphoma) and CLL* (chronic lymphocytic leukemia), indications for which MOR208 is being developed. The market research firm Global Data expects the therapeutic market for non-Hodgkin’s lymphoma (NHL*), a type of B cell malignancy that includes DLBCL and CLL, to reach approximately US$ 5.5 billion in 2024. Collectively, lymphomas represent approximately 4 % of all cancers diagnosed in the United States. NHL is the most prevalent of all lymphoproliferative diseases, with the National Cancer Institute estimating that 74,680 new cases occurred in the United States in 2018. Worldwide, 385,741 new cases per year were estimated in 2012. DLBCL is the most frequent type of malignant lymphoma worldwide and accounts for approximately one-third of all NHLs globally. First-line treatment of B cell malignancies, including DLBCL, most commonly consists of a combination chemotherapy regimen plus the antibody rituximab (Rituxan®), also referred to commonly as R-CHOP* (R, rituximab; CHOP, cyclophosphamide, doxorubicin, vincristine and the corticosteroid prednisone). Yet, despite the therapeutic success of first-line R-CHOP in DLBCL, up to 40 % of patients become refractory to or relapse after initial treatment with fast progression of disease. We are developing MOR208 pursuant to a collaboration and license agreement that we entered into in June 2010 with Xencor, Inc. (Xencor), under which Xencor granted us an exclusive worldwide license to MOR208 for all indications. Pursuant to this agreement, except for the phase 1 clinical trial of MOR208 in CLL, which was completed in January 2013, we are responsible for all development and commercialization activities in connection with MOR208. ONGOING CLINICAL TRIALS AND CLINICAL DATA PRESENTED There are currently three clinical trials* ongoing with MOR208 L-MIND* (phase 2 trial in relapsed/refractory DLBCL (r/r* DLBCL)), B-MIND* (phase 2/3 trial in r/r DLBCL) and COSMOS* (phase 2 trial in r/r CLL and small lymphocytic lymphoma (SLL*). The main focus of the current MOR208 development program is on r/r DLBCL. Two of the three ongoing MOR208 clinical studies, namely the L-MIND and B-MIND trials, are being conducted in this indication. Both trials are focusing on r/r DLBCL patients who are not eligible for high-dose chemotherapy (HDCT*) and autologous stem cell transplantation (ASCT*). The available therapy options for this group of patients are currently very limited, thus we see a high unmet medical need for new treatment alternatives. Important new data from two of our three current studies with MOR208 were presented during 2018. L-MIND is a phase 2 open-label, single-arm trial evaluating MOR208 plus lenalidomide (LEN) in patients with r/r DLBCL who are ineligible for HDCT and ASCT. The study enrolled patients after up to three prior lines of therapy, with at least one prior therapy including an anti-CD20* targeting therapy, such as rituximab (Rituxan). Updated interim data from the study were presented in December 2018 at the American Society of Hematology (ASH) Annual Meeting . These interim data (cut-off date June 5, 2018) had a median observation time of 12 months, and efficacy results were based on assessment by the investigators for all 81 patients enrolled in the study. Patients enrolled had a median age of 72 years and had received a median of two prior lines of treatment. The data showed a response in 47 out of 81 patients (overall response rate, or ORR*, 58 %) with complete responses (CR*) in 27 (33 %) and partial responses (PR*) in 20 (25 %) patients. The median progression-free survival (mPFS) was 16.2 months (95 % confidence interval (CI*) 6.3 months - not reached). Responses were durable with a median duration of response (DoR*) not reached (95 % CI: NR - NR), and 70% of responding patients were without progression at 12 months (12-month DoR rate: 70 %, Kaplan-Meier estimate). A significant proportion of patients (37/81; 46 %) were still on study treatment at data cut-off, with 19 treated for over 12 months. Median overall survival (OS*) was not reached (95 % CI: 18.6 months - NR); the 12-month OS rate was 73 % (95 % CI: 63 % - 85 %). Response rates and median PFS* similar to those seen overall were observed in most patient subgroups of interest, including by Ann Arbor stage, or those patients who were primary refractory, refractory to last prior therapy, or refractory to rituximab (Rituxan®). No unexpected toxicities were observed for the treatment combination and no infusion-related reactions (IRRs*) were reported for MOR208. The most frequent treatment-emergent adverse events (TEAEs) with a toxicity* grading of 3 or higher were neutropenia in 35 (43 %), thrombocytopenia in 14 (17 %), and anemia in 7 (9 %) patients. Treatment-related serious adverse events (SAEs*) occurred in 16 (20 %) patients, the majority of which were infections or neutropenic fever. Forty-one (51 %) patients required dose reduction of LEN; 58 patients (72 %) could stay on a daily LEN dose of 20 mg or higher. We are continuing our discussions with the U.S. Food and Drug Administration (FDA) to evaluate possible paths to market, including the possibility of an expedited regulatory submission and potential approval based primarily on the L-MIND study. In October 2017, MOR208, in combination with LEN, was granted

Operations and Business Environment Group Management Report 33 FINANCIAL STATEMENTS U.S. FDA breakthrough therapy designation (BTD*) for the treatment of r/r DLBCL patients ineligible for HDCT or ASCT based on preliminary data from the L-MIND study. BTD is intended to expedite development and review of drug candidates, alone or in combination with other drugs. It is granted if preliminary clinical evidence indicates that the drug candidate may provide substantial improvement over existing therapies in the treatment of a serious or life-threatening disease. A key goal of the Company is to work towards the submission of a regulatory filing for MOR208 in r/r DLBCL to the FDA for the U.S. and possibly to EMA* for submission of a regulatory filing in Europe, primarily based on data from the L-MIND study. In parallel, the process is underway to conduct and complete data collection for the CMC* (chemistry, manufacturing and controls) package required for the regulatory filing and potential market supply thereafter. The purpose of the CMC package is to prove a safe and stable commercial-scale production and manufacturing process of the drug. B-MIND is a phase 2/3 randomized, multi-center trial evaluating MOR208 plus bendamustine compared to rituximab (Rituxan®) plus bendamustine in patients with r/r DLBCL who are ineligible for HDCT and ASCT. This ongoing trial is scheduled to enroll patients in centers across Europe, the Asia/Pacific region and the United States. The study is currently in its phase 3 part. In 2018, recruitment and treatment of patients continued as planned. COSMOS is a phase 2, two-cohort open-label, multi-center study evaluating the preliminary safety and efficacy of MOR208 combined with idelalisib (cohort A) or venetoclax (cohort B) in patients with r/r CLL or SLL previously treated with Bruton’s tyrosine kinase inhibitor (BTKi) ibrutinib. Preliminary safety and efficacy data on all 11 patients enrolled in cohort A (cut-off date: January 29, 2018) were presented at the European Hematological Association (EHA) Annual Congress in June 2018. Patients enrolled had received a median of five prior treatment lines (range: 2 - 9). Nine out of the 11 patients enrolled (82 %) had discontinued prior ibrutinib treatment due to progressive disease and two patients (18 %) due to toxicity. The most common TEAEs of grade 3 or higher were hemato-logic, with neutropenia observed for four patients (36 %) and anemia for three patients (27 %) being the most common reported events. Eleven treatment-emergent SAEs were reported in five patients (45 %), none of them being fatal. All five patients recovered. Six treatment-related SAEs were reported in three patients (27 %). All except one were suspected to be related to idelalisib; the other was assessed as being attributable to both study drugs. According to the preliminary efficacy analysis conducted by the investigators, the ORR was 82 %, including one CR (9 %) confirmed by bone marrow biopsy and eight PRs (73 %). In addition, two patients (18 %) showed stable disease (SD). The median observation time at cut-off was 4.2 months. At the time of data cut-off, six patients were still on treatment. One patient with a very good partial response (VGPR*) according to response criteria was taken off the study to receive stem cell transplantation. Two previously responding patients had to discontinue the study due to progressive disease. Two patients (one PR, one SD) discontinued due to adverse events. At the ASH Annual Meeting in December 2018, preliminary safety and efficacy data on all 13 patients enrolled into cohort B (cut-off date: October 15, 2018) were presented. Patients enrolled had received a median of three prior treatment lines (range: 1 - 4). Nine out of the 13 patients enrolled (69 %) had discontinued prior ibrutinib treatment due to progressive disease, three patients (23 %) due to toxicity and for one patient the reason was unknown (8 %). The most common hematological TEAE was neutropenia, observed for six patients (46 %). Twelve treatment-emergent SAEs were reported in nine patients (69 %), none of them fatal, and all were resolved. According to the preliminary effcacy analysis conducted by the investigators, ten out of 13 patients enrolled showed an objective response (ORR 77 %), including three CRs (23 %) confirmed by bone marrow biopsy and seven PRs (54 %). Three patients discontinued study participation in the first cycle without undergoing a response assessment, two patients thereof due to IRRs and one patient due to withdrawal of informed consent. No patients had progressive disease. Five patients showed minimal residual disease (MRD*) negativity, which means that no tumor cells were detectable in the peripheral blood. The median observation time was 8.3 months. At the time of data cut-off, all ten patients who had initially shown a response continued treatment, and one CR confirmation was pending from bone marrow for one patient. MOR202 OVERVIEW MOR202 is a recombinant human IgG1 HuCAL monoclonal antibody directed against the target molecule CD38*. CD38 is a highly expressed and clinically validated target in multiple myeloma (MM). Scientific research suggests that an anti-CD38 antibody also may have therapeutic activity in solid tumors or autoimmune and other diseases driven by autoantibodies, such as light chain amyloidosis or systemic lupus erythematosus. *SEE GLOSSARY - page 188

Group Management Repor t Operations and Business Environment 34 MM is a hematological (blood) cancer that develops in the mature plasma cells in the bone marrow. MM is the second most common blood cancer worldwide. Development of MOR202 in MM is currently focused on China, where the patient number has gradually increased in recent years due to an aging population. Yet there are no effective biologics approved in China for this indication, and current therapies have been associated with serious side effects and limited treatment efficacy. We are currently conducting a phase 1/2a trial in MM. During 2018, we announced our decision not to continue development of MOR202 in MM beyond completion of the currently ongoing trial. This is in line with previous announcements that we would not continue to develop MOR202 in MM without having a suitable partner. However, we continue to support our partner I-Mab in the development of MOR202 with the aim to gain approval in MM for the greater Chinese market as planned. Also during 2018, we made the decision not to start clinical development of MOR202 in NSCLC as we had originally planned. This was due to Genmab and Janssen discontinuing a clinical study of the anti-CD38 antibody daratumumab in combination with a checkpoint inhibitor for the treatment of NSCLC based on an analysis of interim clinical data and serious safety findings. We are continuing to evaluate the development of MOR202 in other indications outside of cancer, including certain autoimmune diseases. REGIONAL AGREEMENT WITH I -MAB BIOPHARMA We have an exclusive regional licensing agreement for MOR202 with I-Mab Biopharma. Under the terms of the agreement signed in November 2017, I-Mab has the exclusive rights to develop and commercialize MOR202 in China, Taiwan, Hong Kong and Macao. At the signing, MorphoSys received an immediate upfront payment of US$ 20 million. We are also entitled to receive additional success-based clinical and commercial milestone payments from I-Mab of up to US$ 100 million, as well as tiered double-digit royalties on net sales of MOR202 in the agreed regions. In August 2018, we announced that I-Mab had submitted an investigational new drug (IND*) application to the Chinese authorities for MOR202 (called TJ202 by I-Mab) for the treatment of MM. CLINICAL DATA PRESENTED Data from our phase 1/2a study in MM were presented in December 2018 at the ASH Annual Meeting. The data were based on the most recent data cut-off after the primary analysis of the study in r/r MM. The dose escalation trial comprises three arms: MOR202, MOR202 in combination with the immunomodulatory drug (IMiD) lenalidomide (LEN), and MOR202 in combination with the IMiD pomalidomide (POM), in each case with low-dose dexamethasone (DEX). In total, 56 patients were evaluable for safety and efficacy analysis in the clinically relevant dose cohorts of MOR202 (4 mg/ kg, 8 mg/kg, 16 mg/kg) by the time of the data cut-off on October 16, 2018. At data cut-off, 10 patients remained in the study. Of the 56 evaluable patients, 18 received MOR202 plus DEX, 21 received the combination of MOR202 and POM/DEX, and 17 received MOR202 plus LEN/DEX. MOR202 was given as a two-hour infusion up to the highest dose of 16 mg/kg. IRRs occurred in 7 % of patients in the clinically relevant dose cohorts of MOR202 and were limited to grades 1 or 2. Further, the infusion time could be shortened to 30 minutes in the majority of patients still on study treatment at the data cut-off date. The most frequent adverse events of grade 3 or higher were neutropenia, lymphopenia and leukopenia in 52 %, 52 % and 39 % of patients, respectively. No unexpected safety signals were observed. Patients treated with MOR202 in combination with LEN/DEX had a median of two prior treatment lines, 59 % being refractory to at least one prior therapy. Median PFS was not yet reached. With five of the 17 patients in this cohort still on study at data cut-off, the median time on study was 11.8 months. An objective response was observed in 11 out of 17 patients (65 %), with two CRs, two VGPRs and seven PRs. Patients receiving MOR202 with POM/DEX, had a median of three prior treatment lines, and all were refractory to prior LEN therapy. Median PFS was 15.9 months. With five out of 21 patients in this cohort still on study at data cut-off, the median time on study was 13.4 months. An objective response was observed in ten out of 21 patients (48 %), with two patients achieving a CR, six patients with a VGPR and two PRs. Patients treated with MOR202 plus DEX had a median of three prior treatment regimens, with 67 % being refractory to any prior therapy. Median PFS in this cohort was 8.4 months. All patients had discontinued the study before data cut-off; follow- up for this cohort is therefore completed. An objective response was observed in five out of 18 patients (28 %); median time on study was 3.8 months.

Operations and Business Environment Group Management Report 35 MOR106 MOR106 is an investigational fully human IgG1 monoclonal antibody derived from our Ylanthia library and designed to selectively target IL-17C. MOR106 came from the strategic discovery and co-development alliance between Galapagos and MorphoSys, in which both companies contributed their core technologies and expertise. It is the first publicly disclosed monoclonal antibody targeting IL-17C in clinical development worldwide. In preclinical studies, MOR106 has been shown to inhibit the binding of IL-17C to its receptor, thus abolishing its biological activity. Results from rodent inflammatory skin models of atopic dermatitis (AD*) and psoriasis* support clinical development of MOR106 for the treatment of inflammatory diseases. In July 2018, we announced with Galapagos that we had entered into a worldwide exclusive development and commercialization agreement with Novartis Pharma AG (Novartis) for MOR106. AD, the most severe and common type of eczema, is a chronic relapsing inflammatory skin disease that causes severe itch, dry skin and rashes, predominantly on the face, inner side of the elbows and knees, and on hands and feet. Scratching of the affected skin leads to a vicious cycle causing redness, swelling, cracking, scaling of the skin and an increased risk of bacterial infections. Lichenification, thickening of the skin, is characteristic in older children and adults. The National Eczema Association estimates that AD affects over 30 million Americans, and up to 25 % of children and 2-3 % of adults. As many as 50 % of AD patients are diagnosed in the first year of life, and 85 % of patients have a disease onset before age five. Symptoms commonly fade during childhood; however, up to 30 % of the patients will suffer from AD for life. A smaller percentage first develops symptoms as adults. WORLDWIDE EXCLUSIVE DEVELOPMENT AND COMMERCIALIZATION AGREEMENT WITH NOVARTIS Our agreement with Novartis was announced in July 2018, and received U.S. anti-trust clearance in September 2018. Under the terms of the agreement, the parties (Galapagos, MorphoSys, Novartis) will cooperate to execute and broaden the existing development plan for MOR106 in AD. Novartis holds exclusive rights for commercialization of any products resulting from the agreement. All current and future research, development, manufacturing and commercialization costs for MOR106 will be covered by Novartis. This includes the ongoing phase 2 IGUANA trial in AD patients, as well as the phase 1 bridging study to evaluate the safety and efficacy of a subcutaneous formulation of MOR106 in healthy volunteers and AD patients. MorphoSys and Galapagos will conduct additional trials to support development of MOR106 in AD. Under the terms of the agreement, Novartis will also explore the potential of MOR106 in indications beyond AD. In addition to the funding of the current and future MOR106 program by Novartis, MorphoSys and Galapagos jointly received an upfront payment of 95 million. Pending achievement of certain developmental, regulatory, commercial and sales-based milestones, MorphoSys and Galapagos are jointly eligible to receive significant milestone payments, potentially amounting to up to approximately 850 million, in addition to tiered royalties on net commercial sales in the low-teens to low-twenties percent. Under the terms of their agreement from 2008, Galapagos and MorphoSys share all payments equally (50/50). CLINICAL DATA PRESENTED In February 2018, more detailed clinical results from a phase 1 trial with MOR106 in patients with moderate to severe AD were presented at the American Academy of Dermatology (AAD) conference after initial study data were reported in September 2017. MOR106 showed first signs of activity as well as durable responses and was generally well tolerated in patients with AD. This randomized, double-blind, placebo-controlled phase 1 trial evaluated single ascending doses (SAD) of MOR106 in healthy volunteers and multiple ascending doses (MAD) in patients with moderate-to-severe AD. In the MAD part, 25 patients received four infusions once-weekly of either MOR106 (at the doses of 1, 3 and 10 mg/kg body weight) or placebo in a 3:1 ratio. Patients were followed for 10 weeks after the end of the treatment period. In the MAD part of the study, all adverse drug reactions observed were mild to moderate and transient in nature. No SAEs and no IRRs were recorded. MOR106 exhibited a favorable pharmacokinetic (PK) profile with dose-dependent exposure. At the highest dose level of MOR106 (10 mg/kg body weight), in 83 % of patients (5/6) an improvement of at least 50 % in signs and extent of AD, as measured by the Eczema Area and Severity Index (EASI*)-50, was recorded at week 4. The onset of activity occurred within two to four weeks, depending on the dose administered. Pooled data across all dose cohorts showed that patients treated with MOR106 achieved an EASI improvement compared to baseline of 58 %, 62 %, 72 % and 64 % at week 4, 8, 12 and 14, respectively. For patients receiving placebo, the EASI improvement was 32 %, 40 %, 38 % and 50 %, respectively. *SEE GLOSSARY page 188 CLINICAL TRIALS INITIATED IGUANA phase 2 study in AD: In May 2018, we announced with Galapagos that the first patient had been enrolled in IGUANA, a phase 2 study of MOR106 in patients with AD. The placebo-controlled, double-blind study will evaluate the efficacy, safety and PK of MOR106. FINANCIAL STATEMENTS
Group Management Report Operations and Business Environment 36 At least 180 patients with moderate-to-severe AD are planned to be treated over a 12-week period with one of three different doses of intravenously (iv) administered MOR106 (1, 3 or 10 mg/ kg) or placebo using two different dosing regimens in multiple centers across Europe. Dosing at two- or four-week intervals will be evaluated over the 12-week treatment period, followed by a 16-week observation period. The primary objective will be assessed by the percentage change from baseline in EASI score at week 12. Phase 1 bridging study. In September 2018, we announced with Galapagos the initiation of a phase 1 bridging study testing a subcutaneous (sc*) formulation of MOR106. This bridging study is a parallel-design phase 1 clinical trial being conducted in two parts. Part 1 is a single center, randomized, open-label study in healthy volunteers who will be treated with different single-dose levels of MOR106 administered subcutaneously or intravenously. Part 2 is a multiple-center, randomized, placebocontrolled, multiple-dose study in patients with moderate to severe AD who will be treated subcutaneously for 12 weeks. Safety and tolerability, PK and occurrence of anti-drug-antibodies after administration of MOR106 will be assessed as endpoints. In addition, the efficacy of MOR106 will be explored in subjects with moderate-to-severe AD. MOR103/GSK3196165 OVERVIEW MOR103/GSK3196165 is a fully human HuCAL antibody directed against the granulocyte-macrophage colony-stimulating factor (GM-CSF*). Due to its diverse functions in the immune system, GM-CSF can be considered a target for a broad spectrum of anti-inflammatory therapies, such as rheumatoid arthritis* (RA), a chronic inflammatory disorder that affects the lining of joints, causing a painful swelling that can eventually result in bone erosion and joint deformity. The overall market for RA drugs is growing steadily, and GBI Research expects it will reach US$ 19 billion in the year 2020. MorphoSys estimates that MOR103/GSK3196165 has the potential to be the first marketed anti-GM-CSF antibody in RA. We discovered and advanced MOR103/GSK3196165 into clinical development, before out-licensing it to GlaxoSmithKline (GSK) in 2013. GSK is now developing the antibody independently for RA and bears all of the related costs. MorphoSys participates in the program’s development and commercialization through milestone payments up to a total of 423 million and through tiered, double-digit royalties on net sales. In 2013, MorphoSys received an upfront payment of 22.5 million. CLINICAL DATA PRESENTED GSK conducted a phase 2b study in patients with RA and a phase 2a study in patients with inflammatory hand osteoarthritis (OA). The corresponding study data were presented at the 2018 American College of Rheumatology (ACR) Annual Meeting in October 2018. GSK has announced that it does not intend to pursue further development in hand osteoarthritis. Furthermore, results from the phase 2 dose-ranging study of MOR103/GSK3196165 in patients with moderate-to-severe RA who have an inadequate response to methotrexate (MTX) were presented at the ACR Annual Meeting in October 2018. The primary objective of this double-blind, placebo-controlled, dose-ranging study was to assess the efficacy of MOR103/ GSK3196165 in adult patients with active, moderate-to-severe RA. A total of 222 patients were randomized equally to receive placebo or MOR103/GSK3196165 (37 patients per arm) at doses of 22.5 mg, 45 mg, 90 mg, 135 mg or 180 mg, starting with an induction regimen of five weekly subcutaneous injections followed by every other week (EOW) injections until week 50. Study results from the 180 mg dose arm of MOR103/GSK3196165 were as follows: Efficacy was shown in the majority of patients, as measured by a Disease Activity Score taking into account the C-reactive protein*, (DAS28(CRP*)) of less than 2.6 at week 24 (the primary endpoint of the study), although this did not reach statistical significance (week 24: 16 % for MOR103/GSK3196165 180 mg vs 3 % for placebo, p = 0.134). For DAS28(CRP) change from baseline, there was a rapid onset of efficacy, as early as week 1, for all doses of MOR103/ GSK3196165 above 22.5 mg. This improvement continued throughout the weekly dosing phase and was statistically significant at week 12 (-1.27 difference for MOR103/GSK3196165 180 mg from placebo, 95 % CI: -1.91, -0.63; p<0.001). An improvement in efficacy was maintained through the EOW dosing phase and was statistically significant at week 24 (DAS28(CRP): -1.82 difference for MOR103/GSK3196165 180 mg from placebo, 95% CI: -2.05, -0.23; p < 0.001). Major secondary endpoints including a number of traditional measures to assess the efficacy of MOR103/GSK3196165 were also improved in line with the DAS28(CRP) reduction. The magnitude of improvement in patient-based measures (swollen and tender joint counts, pain and clinical disease activity index (CDAI)) was particularly marked.

O p er a ti o ns an d B u s i n e s s E n v i r o nm en t G r o u p M an a g em en t R ep o r t 37 F I NAN C I AL S T A T E ME N T S The safety profile of MOR103/GSK3196165 was similar to that reported in previous studies. All doses of MOR103/GSK3196165 were well tolerated, and adverse events (AEs), including SA Es, were reported similarly across treatment groups. The percent- age of patients experiencing any AE or SA E respectively, was 49 % and 0 % for placebo, 51 % and 5 % for 22.5 mg MOR103/ GSK3196165, 65 % and 3 % for 45 mg MOR103/GSK3196165, 59 % and 5 % for 90 mg MOR103/GSK3196165, 51 % and 3 % for 135 mg MOR103/GSK3196165, and 65 % and 0 % for 180 mg MOR103/GSK3196165. There were no treatment-limiting safety findings including serious infections, injection site reactions, or laboratory abnormalities, all of which were closely monitored throughout the study. No pulmonary toxicity, including pulmo- nary alveolar proteinosis, was observed. In another phase 2a mechanistic 12-week study with 180 mg MOR103/GSK3196165 presented at the same meeting, a similar clinical efficacy profile with, in addition, synovitis reduction, was observed in patients with RA. MOR107 Lanthipeptides are a class of modified peptides that have been engineered for improved stability and selectivity. MOR107 is based on the proprietary technology platform of our Dutch sub- sidiary Lanthio Pharma B.V. This compound has demonstrated angiotensin II type 2 (AT2) receptor-dependent activity in pre- clinical in vivo studies and may have the potential to treat a variety of diseases. After we had successfully completed a first- in-human phase 1 study in healthy volunteers in 2017, we con- tinued our preclinical investigations with MOR107 during 2018, focusing on oncology indications. In the fourth quarter of 2018, updated study data led to the need for further studies, and the existing development plan was adjusted accordingly. This re- sulted in the expectation of a delayed market entry and a delay in the occurrence of future cash flows compared to previous assumptions, which led to an impairment. Further details can be found in the Notes (Item 5.7.5). MOR 210 OV E R V I E W MOR210 is a human antibody directed against C5aR* derived from our HuCA L technology. C5aR, the receptor of the comple- ment factor C5a*, is being investigated as a potential new drug target in the field of immuno-oncology* and autoimmune dis- eases. Tumors have been shown to produce high amounts of C5a which, by recruiting and activating myeloid-derived sup- pressor cells (M DSCs), is assumed to contribute to an immune- suppressive pro-tumorigenic microenvironment. MOR210 is intended to block the interaction between C5a and its receptor, thereby being expected to neutralize the immune-suppressive function of the M DSCs and to enable immune cells to attack the tumor. MOR210 is currently in preclinical development. R E G I O NAL A G R E E M E NT W I TH I - MAB B I O P HAR MA In November 2018 , we announced that we had entered into an exclusive strategic collaboration and regional licensing agree- ment for MOR210 with I-Mab Biopharma. Under the agreement, I-Mab has exclusive rights to develop and commercialize MOR210 in China, Hong Kong, Macao, Taiwan and South Korea, while we retain rights in the rest of the world. The agreement deepens our existing partnership with I-Mab, building upon the ongoing collaboration for MOR202. Under the terms of the agreement, I-Mab will exercise its exclu- sive license rights for development and commercialization of MOR210 in its territories. With our support, I-Mab will perform and fund all global development activities for MOR210, includ- ing clinical trials in China and the U.S., towards clinical proof- of-concept (PoC*) in oncology. We received an upfront payment of US$ 3.5 million from I-Mab and are eligible to receive development and commercial mile- stone payments of up to US$ 101.5 million, as well as tiered, mid-single-digit royalties on net sales of MOR210 in I-Mab’s territories. In return for the execution of a successful clinical PoC study, I-Mab is eligible to receive low-single-digit royalties on net sales generated with MOR210 outside its territories and a tiered percentage of sub-licensing revenue. P A R T N ER ED D I S C O V ER Y At the end of 2018, we had one Partnered Discovery program on the market, 24 in clinical development, 24 partnered product candidates in preclinical development and 55 in discovery. Be- low, we highlight our most advanced programs and a recently expanded strategic alliance. Guselkumab (Tremfya®) – a HuCA L antibody targeting IL-23* that is being developed and commercialized by our partner Janssen in plaque psoriasis and other indications. Guselkumab (Tremfya®) is approved in the United States, Canada, European Union, Japan and a number of other countries worldwide. Gantenerumab – a HuCA L antibody targeting amyloid beta* that is in phase 3 clinical testing by our partner Roche for the treatment of Alzheimer’s disease. *S E E G L O S S A R Y – page 188 Other programs – in addition to the two programs above, we have a large number of programs in various stages of research and development from our partnerships with major pharmaceu- tical companies. L EO Pharma – we have a strategic alliance with L EO Pharma for the discovery and development of therapeutic antibodies for the treatment of skin diseases. This agreement was expanded in 2018 to include peptides.

Group Management Report Operations and Business Environment 38 GUSEL KUMAB ( TREMFYA®) OVERVIEW Guselkumab (Tremfya®) is a human HuCA L antibody targeting IL-23 that is being developed and commercialized by Janssen. It is the first commercial product based on our proprietary technology. It is approved in the United States, Canada, the European Union and several other countries for the treatment of moderate-to-severe plaque psoriasis and in Japan for the treatment of various forms of psoriasis, psoriatic arthritis* and palmoplantar pustulosis*. IL-23 is a pro-inflammatory protein which has been identified as a cytokine in autoimmune diseases and is found in the skin of patients with psoriasis and other inflammatory diseases. It is therefore considered to be a potential treatment target for inflammatory diseases. The anti- body binds to the so-called p19 subunit unique to IL-23. Antibodies that bind to IL-23’s p40 subunit will also neutralize IL-12* and are therefore less specific. Guselkumab (Tremfya®) is the first approved antibody binding the p19 subunit of IL-23. Psoriasis is a chronic, autoimmune inflammatory disorder of the skin characterized by abnormal itching and physically painful skin areas. It is estimated that about 125 million people worldwide have psoriasis, with approximately 25 % suffering from cases that are considered moderate to severe. The independent market experts Transparency Market Research forecast the market for psoriasis to grow from € 7.5 billion in 2014 to € 12 billion in the year 2024. In addition to plaque psoriasis, Janssen is developing guselkumab (Tremfya®) for the treatment of Crohn’s disease*, pediatric psoriasis, psoriatic arthritis, palmar/plantar pustulosis and a few other indications. MorphoSys receives royalties on net sales of guselkumab (Tremfya®) and is eligible to receive milestone payments for selected future development activities. AD D I T I O NAL MAR K E T I NG AP P R O VAL S R E C E I V E D Building on the first approvals for guselkumab (Tremfya®), which occurred in 2017 in the U.S., Europe and Canada, during 2018 Janssen received marketing approvals in several additional countries as follows: Australia: In April 2018, Janssen’s country subsidiary reported that guselkumab (Tremfya®) had been approved for the treatment of adults living with moderate-to-severe plaque psoriasis in Australia. Brazil: In April 2018, Janssen’s country subsidiary reported that guselkumab (Tremfya®) had been approved for the treat- ment of adults living with moderate-to-severe plaque psoriasis in Brazil. Japan: In April 2018, we announced that Janssen had reported that guselkumab (Tremfya®) had received marketing approval in Japan for the treatment of three forms of psoriasis (plaque, pustular and erythrodermic psoriasis) and psoriatic arthritis in patients with moderate-to-severe disease for whom other existing treatments have failed. Additionally, in November 2018, Janssen reported that guselkumab (Tremfya®) had been approved in Japan for the treatment of patients with palmoplantar pustulosis who are not responding to, or are refractory to, existing treatments. Palmoplantar pustulosis is a debilitating, chronic skin disease that causes pustules and inflammation to appear mainly on the palms of the hands and soles of the feet, greatly affecting pa- tients’ quality of life. According to a press release issued by Janssen on November 21, 2018, guselkumab (Tremfya®) was the first and only biologic treatment available for the estimated 130,000 patients living with palmoplantar pustulosis in Japan. South Korea: In April 2018, we announced that an affiliate of Janssen reported that guselkumab (Tremfya®) had been ap- proved for the treatment of moderate-to-severe adult plaque psoriasis requiring phototherapy or systemic therapies in South Korea. N E W C L I NIC AL TR I AL S I NI TI ATE D Crohn’s disease pivotal clinical program: In July 2018, we announced that Janssen had initiated a pivotal phase 2/3 clini- cal program to evaluate the efficacy and safety of guselkumab (Tremfya®) in the treatment of patients with moderate to severely active Crohn’s disease, a type of inflammatory bowel disease affecting any part of the gastrointestinal tract. Expected to enroll approximately 2,000 patients, the program, which is named GA L A X I, consists of three separate studies: a phase 2 study (GA L A X I 1), followed by two phase 3 studies (GA L A X I 2 and GA L A X I 3). In connection with the start of the GA L A X I program, we received two milestone payments from Janssen; the financial details were not disclosed. Phase 3 trial in pediatric plaque psoriasis patients: In September 2018, we announced that Janssen had initiated a phase 3 clinical trial of guselkumab (Tremfya®) in pediatric patients suffering from chronic plaque psoriasis, the most common form of psoriasis. According to clinicaltrials.gov, the trial, PROTOSTAR, is expected to enroll approximately 125 children between 6 and 18 years of age with plaque psoriasis, and will evaluate the safety, efficacy, and pharmacokinetics* of gusel- kumab (Tremfya®) against etanercept and placebo.

Operations and Business Environment Group Management Report 39 FINANCIAL STATEMENTS Phase 2 trial in hidradenitis suppurativa (HS*): In October 2018, we announced that Janssen had initiated a phase 2 clini-cal study of guselkumab (Tremfya®) in patients with moder-ate-to-severe HS, a chronic skin disease also known as acne inversa. According to clinicaltrials.gov, the randomized, dou-ble-blind study, NOVA, is expected to enroll approximately 180 adult patients with moderate-to-severe HS and will evalu-ate the efficacy, safety and tolerability of guselkumab (Tremfya®) against placebo. Phase 2a trial in ulcerative colitis (UC*): In January 2019, we announced that Janssen had initiated a proof-of-concept phase 2a clinical trial in patients with moderately to severely active UC, a chronic inflammatory bowel disease. According to clinicaltrials.gov, this randomized, double-blind study will eval- uate the efficacy and safety of guselkumab (Tremfya®) in com-bination with golimumab compared to guselkumab (Tremfya®) or golimumab monotherapy in approximately 210 patients with moderately to severely active UC. NEW LONG - TERM DATA PRESENTED IN PLAQUE PSORIASIS During 2018, our partner Janssen announced the presentation of new long-term data in patients with plaque psoriasis. In October 2018 , Janssen announced new long-term data from the open-label period of the phase 3 VOYAGE 1 clinical trial that demonstrated stably maintained rates of skin clearance with guselkumab (Tremfya®) treatment at week 52 and week 156 among adult patients with moderate-to-severe plaque psoriasis. According to a press release issued by Janssen, the findings, presented at the 37th Fall Clinical Dermatology Conference in Las Vegas, Nevada/USA, showed that nearly 83 % of patients receiving guselkumab (Tremfya®) in the VOYAGE 1 study maintained at least a 90 % improvement in the Psoriasis Area Severity Index (PASI* 90) response, or near-complete skin clear- ance, and an Investigator’s Global Assessment (IGA) score of cleared (0) or minimal disease (1) at week 156. According to Janssen, 96.4 % of patients treated with guselkumab (Tremfya®) achieved a PASI 75 score at week 156. Furthermore, 53.1 % of patients achieved an IGA score of 0 and 50.8 % of patients achieved a PASI 100 response. This measure represents skin completely cleared of psoriasis plaques (except for residual dis-coloration). *SEE GLOSSARY – page 188 According to Janssen, of the 494 patients in the treatment groups receiving guselkumab (Tremfya®) in the study, the per-centage of patients reporting AEs, SAEs, infections and serious infections through week 156 were 86.2 %, 13.4 %, 67.8 % and 2.2 %, respectively, consistent with data from earlier read-outs from the study. No cases of active tuberculosis, opportunistic infections or serious hypersensitivity reactions were reported among guselkumab (Tremfya®)-treated subjects. In September 2018, Janssen announced new data that showed clinically relevant improvements in long-term patient-reported outcomes (PRO) in patients with plaque psoriasis switched to guselkumab (Tremfya®) after an initial inadequate response to adalimumab (Humira®). These long-term findings from Jans-sen’s phase 3 clinical trial programs – VOYAGE 1 and 2 – in patients with moderate-to-severe plaque psoriasis were part of six abstracts presented at the European Academy of Dermatol-ogy and Venereology (EADV) 2018 Congress. According to Janssen’s press release, study findings showed that a switch to guselkumab (Tremfya®) at week 28, after an inadequate response to adalimumab (Humira®), led to a sus- tained improvement in PROs in both PSSD and DLQ I (Dermatol-ogy Life Quality Index) scores at week 100. The proportions of patients with PSSD symptom and signs scores of 0 (i.e. no pa-tient-reported symptoms or signs of psoriasis) increased from 4.2 % and 1.1 %, respectively, at week 28, to 32.6 % and 18.0 % at week 100. The proportion of patients with a DLQ I score of 0 or 1 (i.e. no impact on patient quality of life) increased from 14.4 % at week 28 to 65.3 % at week 100, showing consistent improve-ment and impact on patient well-being after switching to gusel-kumab (Tremfya®). In February 2018 , Janssen announced the presentation of data from the phase 3 VOYAGE 2 trial at the 2018 American Acad-emy of Dermatology (AAD) Annual Meeting. The data showed that a vast majority of patients with moderate to severe plaque psoriasis receiving guselkumab (Tremfya®) who achieved at least 90 percent improvement in the Psoriasis Area and Sever-ity Index (PASI 90) at week 28, maintained a PASI 90 response with continuous treatment through week 72. Findings from the study also demonstrated that a vast majority of patients origi-nally randomized to guselkumab (Tremfya®), but withdrawn from treatment at week 28, regained a PASI 90 response within six months of initiating guselkumab (Tremfya®) re-treatment. Results from the trial demonstrated that among patients who achieved PASI 90 response at week 28 with guselkumab (Tremfya®), 86 % who continued receiving guselkumab (Tremfya®) maintained a PASI 90 response through week 72, while only 11.5 % of patients who were withdrawn from treatment maintained PASI 90 response. Of 173 patients who lost PASI 90 response after withdrawal from guselkumab (Tremfya®), 87.6 % recaptured PASI 90 response six months fol-lowing re-treatment. No new safety signals were observed with continuous treatment or re-treatment therapy with guselkumab (Tremfya®) through week 100.

G r o u p M an a g em en t R ep o r t O p er a ti o ns an d B u s i n e s s E n v i r o nm en t 40 Guselkumab (Tremfya®) data from eight additional abstracts were also presented at the A AD Annual Meeting, including an oral presentation of a pooled analysis from the phase 3 VOYAGE 1 and 2 trials evaluating consistency of response by weight across subgroups of patients through week 24. The phase 3 VOYAGE 2 trial was a randomized, double-blind, placebo- and active-comparator-controlled study designed to evaluate the safety and efficacy of guselkumab (Tremfya®) com- pared with placebo and adalimumab (Humira®) and of gusel- kumab (Tremfya®) maintenance therapy compared with with- drawal of therapy in adult patients with moderate to severe plaque psoriasis. Patients (n = 992) were randomized to receive subcutaneous (SC) injections of guselkumab (Tremfya®) 100 mg at weeks 0, 4, 12 and 20; placebo at weeks 0, 4 and 12 with crossover to guselkumab (Tremfya®) at weeks 16 and 20 or adalimumab (Humira®) 80 mg at week 0, followed by 40 mg at week 1 and every two weeks through week 23. Patients initially randomized to receive guselkumab (Tremfya®) who achieved a PASI 90 response (n = 375) at week 28 were re-randomized to either continued treatment with guselkumab (Tremfya®) (n = 193) or withdrawal to placebo (n = 182) with re-treatment upon a 50 % or greater loss of PASI improvement at week 28 or week 72 if re-treatment criteria were not met. In December 2018, Janssen announced results from the ECL IPSE study demonstrating that guselkumab (Tremfya®) was superior to secukinumab (Cosentyx®) in treating adults with moderate to severe plaque psoriasis for the primary endpoint assessed at week 48. The data were presented at the 3rd Inflammatory Skin Disease Summit. The phase 3, multicenter, randomized, dou- ble-blind, active comparator trial was designed to evaluate the efficacy and safety of guselkumab (Tremfya®) compared with secukinumab (Cosentyx®) in adult patients with moderate to severe plaque psoriasis. Patients (n = 1,048) were randomized to receive 100 mg of guselkumab (Tremfya®) administered by subcutaneous injection at weeks 0, 4 and 12, followed by eight- week dosing; or 300 mg of secukinumab (Cosentyx®) adminis- tered by two subcutaneous injections of 150 mg at weeks 0, 1, 2, 3 and 4, followed by 4-week dosing. The primary endpoint of the study was the proportion of patients achieving a PASI 90 response at week 48. Secondary endpoints were assessed at weeks 12 and 48, with safety monitoring through week 56. Data from the study demonstrated that 84.5 % of patients treated with guselkumab (Tremfya®) achieved at least 90 % im- provement in their baseline PASI score at week 48, compared with 70.0 % of patients treated with secukinumab (Cosentyx®) (p<0.001). These data, according to Janssen, marked the first- ever results from a head-to-head study comparing an interleu- kin (IL)-23-targeted biologic therapy (guselkumab (Tremfya®)) with an IL-17 inhibitor (secukinumab (Cosentyx®)). ECL IPSE incorporated six major secondary endpoints that used a fixed statistical sequence procedure to control for multiple comparisons and included both shorter and longer-term analy- ses. Guselkumab (Tremfya®) demonstrated non-inferiority to secukinumab (Cosentyx®) in the first major secondary end- point, with 84.6 % of patients on guselkumab (Tremfya®) achiev- ing a PASI 75 response at both weeks 12 and 48 vs. 80.2 % of those on secukinumab (Cosentyx®) (p<0.001). However, it did not demonstrate superiority (p = 0.062). Because superiority was not demonstrated for the first major secondary endpoint, p-values for all the subsequent major secondary endpoints were considered nominal. Three of the remaining major secondary endpoints evaluated efficacy at week 48, including achievement of a PASI 100 re- sponse and Investigator’s Global Assessment (IGA) scores of 0 (cleared), or 0 or 1 (cleared or minimal disease). At week 48, 58.2 % of patients receiving guselkumab (Tremfya®) achieved a PASI 100 response, compared with 48.4 % of patients receiv- ing secukinumab (Cosentyx®); 62.2 % of patients receiving guselkumab (Tremfya®) achieved an IGA score of 0 compared to 50.4 % of patients receiving secukinumab (Cosentyx®); and 85.0 % of patients receiving guselkumab (Tremfya®) achieved an IGA score of 0 or 1 compared to 74.9 % of patients receiv- ing secukinumab (Cosentyx®) (all comparisons with nominal p < 0.001). The remaining major secondary endpoints assessed non- inferiority of guselkumab (Tremfya®) versus secukinumab (Cosentyx®) at week 12. The percentage of patients achieving a PASI 75 response at week 12 was 89.3 % for guselkumab (Tremfya®) and 91.6 % for secukinumab (Cosentyx®) (p < 0.001 for non-inferiority); the percentage of patients achieving a PASI 90 response at week 12 was 69.1 % for guselkumab (Tremfya®) and 76.1 % for secukinumab (Cosentyx®) (p = 0.127 for non- inferiority). Through week 44, 27 patients (5.1 %) randomized to the gusel- kumab (Tremfya®) arm discontinued treatment compared with 48 patients (9.3 %) randomized to the secukinumab (Cosentyx®) arm. The safety profiles observed for guselkumab (Tremfya®) and secukinumab (Cosentyx®) in ECL IPSE were consistent with the known safety profiles seen in the respective registration trials and current prescribing information. Similar percentages of patients receiving guselkumab (Tremfya®) (77.9 %), and secu- kinumab (Cosentyx®) (81.6 %) reported at least one adverse event (AE). Serious AEs were reported in 6.2 % of patients receiving guselkumab (Tremfya®) and 7.2 % of patients receiving secu- kinumab (Cosentyx®). Serious infections occurred in six patients receiving guselkumab (Tremfya®) and five patients receiving secukinumab (Cosentyx®).

Operations and Business Environment Group Management Report 41 FINANCIAL STATEMENTS GANTENERUMAB OVERVIEW Gantenerumab is a HuCAL antibody targeting amyloid beta that is being developed by our partner Roche as a potential treatment for Alzheimer’s disease. Amyloid beta denotes a group of peptides that are centrally involved in Alzheimer’s disease as the main component of the amyloid plaques found in the brains of Alzheimer patients. Gantenerumab binds to the N-terminus and a section in the middle of the amyloid beta pep-tide. On binding, the antibody seems to neutralize and disrupt the formation of amyloid plaque and amyloid oligomers and may also lead to its clearance by recruitment of microglial cells. In phase 1 clinical trials, gantenerumab has been shown to re-duce brain amyloid in mild-to-moderate Alzheimer’s disease patients. Gantenerumab is being investigated in several clini-cal studies to see if there is a positive effect from intervening at an early stage in the disease’s progression. There are currently no drugs available that fundamentally improve the course of Alzheimer’s disease. However, the anti-amyloid beta antibody aducanumab from Biogen Inc., that has been tested in a first-in-human phase 1 study in 2015, showed a substantial clearance of amyloid beta deposition in the brain as determined by Posi-tron Emission Photograpy (PET) and a slowing of the cognitive decline of the patients. Aducanumab is currently in a phase 1 trial, a phase 2 trial and two phase 3 studies to evaluate its effi-cacy in slowing cognitive and functional impairment in pa-tients with prodromal, mild or early Alzheimer’s disease, re-spectively. The market research and consulting firm GlobalData has indicated that the global market for Alzheimer’s disease treatment is expected to grow at double-digit rates each year from US$ 2.9 billion in 2016 to an estimated US$ 14.8 billion by 2026. According to the Alzheimer’s Association, 5.7 million Ameri-cans are living with Alzheimer’s disease, and that figure is projected to increase to nearly 14 million by 2050. Alzheimer’s disease is the sixth leading cause of death in the U.S. NEW CLINICAL DATA PRESENTED In March 2018, data were presented in which gantenerumab was evaluated at considerably higher doses in an open label extension (OLE) study than previously tested. The data were presented at the Alzheimer’s and Parkinson’s disease confer-ence AAT-AD/PDTM Focus Meeting 2018. The data assessed the clinical effects of higher doses of gan-tenerumab measured by amyloid beta reduction in the brain. Eighty-one patients with prodromal to mild Alzheimer’s dis-ease were enrolled in the OLE study parts and received higher doses of up to 1,200 mg of gantenerumab subcutaneously every 4 weeks. The dose increase, from starting levels of 105 mg or 225 mg of gantenerumab to up to 1,200 mg, was administered using different titration schemes with the goal of controlling potential safety findings due to the increased doses. Fifty-one patients had a brain positron emission tomography (PET) scan to determine amyloid plaques at week 52. According to the data presented, patients who received higher doses of gantenerumab showed a greater and consistent amyloid reduction compared to patients who received lower dosing (105 mg or 225 mg). At week 52, approximately one-third of the high-dose patients had amyloid levels below the threshold that classifies a patient as amyloid beta positive. A review of the data in the OLE studies did not reveal any new or unexpected safety findings of the higher doses for this pa-tient population. As reported previously (Klein et al., 2017, CTAD presentation ), increased doses of gantenerumab led to an increase of amyloid-related imaging abnormalities (ARIA), which, however, remained manageable with the implemented dosing titration scheme. In the higher doses of up to 1,200 mg, severity and seriousness of adverse events were comparable to the lower doses (105 mg or 225 mg) applied in the previous studies. NEW PHASE 3 PROGRAM INITIATED IN ALZHEIMER‘S DISEASE In June 2018, we announced that our partner Roche had initi-ated a new phase 3 development program in patients with Alz-heimer’s disease. The program consists of two phase 3 trials – GRADUATE -1 and GRADUATE -2 – which are expected to enroll approximately 1,520 patients in up to 350 study centers in 31 countries worldwide. The two multicenter, randomized, dou-ble-blind, placebo-controlled trials will assess the efficacy and safety of gantenerumab in patients with early (prodromal to mild) Alzheimer’s disease. The primary endpoint for both trials is the assessment of signs and symptoms of dementia, mea-sured as the clinical dementia rating-sum of boxes (CDR-SOB) score, determined as the change of status from baseline to week 104. Patients are to receive a significantly higher dose of gantenerumab than in Roche’s previous trials as a subcutane-ous injection with titration up to the target dose.

Group Management Report Operations and Business Environment 42 OTHER PROGRAMS In June 2018 , our partner Bayer brought a new compound based on MorphoSys’s HuCAL technology into clinical development. BAY2287411 is a thorium-227 radiolabeled antibody conjugate directed against the target molecule mesothelin. In a phase 1 clinical trial, BAY2287411 is being tested for the first time in patients with solid tumors known to express mesothelin in order to evaluate the safety, tolerability, pharmacokinetics and anti-tumor activity of this compound. According to clinicaltrials.gov, in 2018 clinical trials with bimagrumab in patients with sarcopenia or after hip surgery by our partner Novartis reached primary completion. At the end of January 2019, Novartis announced that it would discontinue development in these indications. Other programs developed by our partners continued to make progress during 2018. COLLABORATION WITH LEO PHARMA We have an ongoing strategic alliance with LEO Pharma for the discovery and development of therapeutic antibodies for the treatment of skin diseases. The initial alliance was signed in November 2016 to jointly discover and develop antibody-based therapies in dermatology. Under the terms of this agreement, we are applying our Ylanthia technology platform to generate antibody candidates against targets selected by LEO Pharma and will conduct all development activities up to the start of clinical testing. LEO Pharma is responsible for clinical development and commercialization of resulting drugs in all indications except cancer. COLLABORATION EXPANDED In September 2018, we announced with LEO Pharma an expansion of our existing strategic alliance to include peptide-derived therapeutics. The objective of the expansion is to identify novel, peptide-derived therapeutics for unmet medical needs that will be valuable additions to both companies’ pipelines. Under the terms of the agreement, LEO Pharma will select targets against which we will identify lead molecules using our proprietary HTH peptide technology platform. LEO Pharma will either develop these lead molecules or use them to aid the design of other drug candidates. LEO Pharma will have exclusive, worldwide rights and be responsible for development and commercialization of resulting drugs in the area of dermatology. MorphoSys will have an exclusive option to secure worldwide rights to any drugs arising from the collaboration in the field of oncology. We will receive R&D funding as well as success-based development, regulatory and commercial milestone payments, plus royalties on net sales of peptide drugs commercialized by LEO Pharma. Further financial details were not disclosed. PATENTS During the 2018 financial year, we continued to consolidate and expand our patent protection of our development programs and our growing technology portfolio, which are our most important value drivers. In April 2016, we filed a lawsuit in the United States at the District Court of Delaware against Janssen Biotech and Genmab A/S for patent infringement of U.S. Patent Number 8,263,746. U.S. Patents 9,200,061 and 9,758,590 were added to the case in 2017. In filing the lawsuit, we sought redress for alleged infringement of these patents by Janssen’s and Genmab’s daratu-mumab, a CD38-directed monoclonal antibody indicated for the treatment of certain patients with multiple myeloma. The U.S. District Court of Delaware, based on a hearing held November 27, 2018, has ruled in a Court Order on January 25, 2019, that the asserted claims of the MorphoSys patents are invalid. The Court thus granted a motion for Summary Judgement of invalidity filed by Janssen Biotech and Genmab, A/S against the three patents held by MorphoSys. As a result of this decision, the jury trial scheduled to start February 11, 2019 to consider Janssen’s and Genmab’s alleged infringement and the validity of the MorphoSys patents did not take place. On January 31, 2019 we announced that we have settled the dispute with Janssen Biotech and Genmab A/S. The parties agreed to drop the mutual claims related to the litigation: MorphoSys dismissed claims for alleged patent infringement against Janssen Biotech and Genmab A/S and will not appeal from the court order dated January 25, 2019. Janssen and Genmab dismissed their counterclaims against MorphoSys. At the end of the financial year, we maintained over 60 different proprietary patent families worldwide in addition to the numerous patent families we pursue with our partners. Group Development In April 2018, we successfully closed an initial public offering on the Nasdaq U.S. stock exchange. The transaction produced total gross proceeds of US$ 239.0 million from the sale of 2,075,000 new ordinary shares in the form of 8,300,000 American Depositary Shares (“ADSs”) and from the exercise in full of the underwriters’ option to purchase 311,250 additional new ordinary shares in the form of 1,245,000 additional ADSs, at a price of US$ 25.04 per ADS, respectively. Each ADS represents 1/4 of a MorphoSys ordinary share. At the Annual General Meeting (AGM) of MorphoSys AG on May 17, 2018, our shareholders approved all resolutions of the Company’s management with the required majority of votes. Dr. George Golumbeski and Michael Brosnan were newly elected to the Supervisory Board, replacing Dr. Gerald Möller, who retired from the board, and Klaus Kühn, who resigned for

Operations and Business Environment Group Management Report 43 personal reasons. Dr. Möller’s retirement and Mr. Kühn’s resignation became effective at the conclusion of the 2018 AGM. Dr. Golumbeski most recently served as Executive Vice President and Executive Advisor for Innovation at Celgene Corporation, a position from which he retired in April 2018. Over the last 27 years, he held leadership roles in business and corporate development, partnering and M&A with global pharmaceutical and life science companies, including Celgene, Novartis, Elan Corporation (today: Perrigo) and Schwarz Pharma (today: UCB). Mr. Brosnan has over 40 years of experience in finance, controlling and auditing. Since 2010, he has served as Chief Financial Officer of Fresenius Medical Care Management AG, a company with a dual listing in Germany and the U.S. For over 20 years, he has worked in various leadership and executive positions for Fresenius Medical Care in the U.S. and Germany. Additionally, Dr. Marc Cluzel was re-elected to the Supervisory Board following the expiry of his term of office. Following the AGM, the Supervisory Board in its inaugural meeting elected Dr. Marc Cluzel as its new Chairman and Dr. Frank Morich as Deputy Chairman. On May 24, 2018, MorphoSys AG published a notification to our shareholders in the German Federal Gazette pursuant to Sec. 62 Para. 2 Sent. 1, Para. 3 Sent. 3 (German Transformation Act) indicating its intention to merge Sloning BioTechnology GmbH as the transferring legal entity into MorphoSys AG, as the acquiring legal entity. Upon entry into the commercial register on June 28, 2018 and based on the merger agreement date May 17, 2018, Sloning BioTechnology GmbH, as the transferring legal entity, was merged into MorphoSys AG, as the acquiring legal entity, with the efiective date of January 1, 2018. In July 2018 , we announced the establishment of a U.S. subsidiary, MorphoSys US Inc. We also announced the appointment of Jennifer Herron as President of MorphoSys US Inc. and Executive Vice President, Global Commercial. In November 2018 we reported that Ms. Herron had resigned and James Hussey was appointed Acting President of the U.S. subsidiary. Mr. Hussey joined MorphoSys US Inc. in 2018. He has more than 30 years of experience in leading positions in the biotech and pharmaceutical industries. Over the last 25 years, he served in senior management positions of various pharmaceutical, biotech, and health care companies. He started his career with Bristol Myers Squibb (BMS) in 1984, where he served for 11 years holding positions of increasing responsibility within the US business. The focus of our U.S. subsidiary will be on building a strong presence in the U.S. to prepare for the planned commercialization of MOR208. In July 2018, MorphoSys AG acquired a minority shareholding position of 19.9 % in adivo GmbH, Martinsried, in the context of a seed financing. MorphoSys paid a cash contribution and a contribution in kind. Adivo is dedicated to the research and development of veterinary therapeutics. In addition to the two founding shareholders, who are former employees of MorphoSys, the only other strategic investors in adivo other than MorphoSys are two financial investors. Under a licensing agreement, MorphoSys granted adivo rights to a fully synthetic canine antibody library based on our proven modular combinatorial approach. Effective September 24, 2018, MorphoSys’s shares were included in the MDAX. MorphoSys remains a member of the TecDAX segment, which it has been since 2004. The simultaneous inclusion in both the MDAX and TecDAX indices is based on a revision in rules of the Deutsche Börse for indices, which came into force on September 24, 2018. The TecDAX now includes the 30 largest stocks in terms of market capitalization* and trading volume that are focused on technology. The MDAX now tracks the 60 largest listed companies with the highest trading volume after the DAX index, which continues to contain the 30 largest stocks in Germany. *SEE GLOSSARY page 188 At the beginning of December, the Company held an Investor and Analyst Event in New York City dedicated to MOR208. During this event, the latest L-MIND data, which had been presented at the 60th ASH (American Society of Hematology) conference in San Diego, were discussed and the Company gave an outlook on the planned filing strategy. Moreover, further development plans with MOR208 in first-line DLBCL and also other indolent lymphomas were revealed. To give an overview about the indication and treatment options in DLBCL in more detail, the event also included a discussion of current treatment options. The event was attended by investors and analysts and could also be followed via webcast. GROUP HEADCOUNT DEVELOPMENT On December 31, 2018, the MorphoSys Group had 329 employees (December 31, 2017: 326), 134 of whom hold PhD degrees (December 31, 2017: 132). The MorphoSys Group employed an average of 327 employees in 2018 (2017: 344). Of these 329 active employees, 246 were involved in research and development activities, 62 were involved in general administration and 21 were involved in selling. All of these employees are located in our offices in Munich, Germany, in Groningen, the Netherlands and in Princeton, USA. We have no collective bargaining agreements with our employees and we have not experienced any labor strikes. At the end of the reporting year, we had employees representing 34 different nationalities (2017: 34) employed for an average of 7.2 years (2017: 7.6 years). SEE FIGURE 04 Total Headcount of the MorphoSys Group (page 44) SEE FIGURE 05 Employees by Gender (page 46) SEE FIGURE 06 Seniority (page 46) SEE FIGURE 07 Workforce Turnover Rate (page 46

Group Management Report Operations and Business Environment 44 04 Total Headcount of the MorphoSys Group (December 31) (Number) TOTAL EMPLOYEES 365 345 329 326 329 2014 2015 2016 2017 2018 2017 2018 2017 2018 employees by segment employees by function 161 105 60 209 49 71 59 253 14 62 246 21 PROPRIETARY PARTNERED UNALLOCATED ADMINISTRATION EMPLOYEES EMPLOYEES DEVELOPMENT DISCOVERY IN R&D IN SALES In order to successfully compete for the best employees, MorphoSys conducts an annual comparison of the Company’s compensation with that paid by other companies in the biotech industry and similar sectors and makes adjustments when necessary. The remuneration system at MorphoSys includes fixed compensation and a variable annual bonus that is linked to the achievement of corporate goals. Individual goals promote both the employees’ personal development and the achievement of key corporate goals. In addition, a “spot bonus” (given “on the spot”) is promptly awarded to employees for exceptional accomplishments. We again made significant use of this instrument during the reporting year. A detailed description of our activities to promote successful long-term human resource development can be found in the section “Sustainable Business Development.”

Operations and Business Environment Group Management Repor t 45 CHANGES IN THE BUSINESS ENVIRONMENT According to forecasts by the International Monetary Fund (IMF) in January 2019, global economic growth for 2018 was projected to remain stable at 3.7 %. However, with softer momentum seen in the second half of 2018, the IMF has made downward revisions from earlier forecasts for certain areas including in Germany. Earlier downward revisions reflected surprises that suppressed activity in early 2018 in some major advanced economies, the negative effects of trade measures implemented or approved between April and mid-September, as well as a weaker outlook for some key emerging market and developing economies arising from country-specific factors, tighter financial conditions, geopolitical tensions and higher oil import bills. The 2018 growth forecast for the advanced economies was projected to be 2.3 % (2017: 2.4 %). The emerging and developing economies were expected to experience growth of 4.6 % in 2018 (2017: 4.7 %). The IMF forecast growth in the Euro area of 1.8 % in 2018 (2017: 2.4 %). The 2018 forecast for Germany was 1.5 % (2017: 2.5 %). The United States was projected to grow by 2.9 % in 2018 (2017: 2.2 %). China’s economy was expected to grow 6.6 % (2017: 6.9 %), and the economies of Russia and Brazil were expected to grow by 1.7 % (2017: 1.5 %) and 1.3 % (2017: 1.1 %), respectively. MorphoSys takes into account a wide range of potential macroeconomic risks and opportunities when conducting business activities. Political uncertainty in the global markets did not cause us to refrain from or change any key activities in 2018, nor were our operations affected by fluctuations within individual countries. CURRENCY DEVELOPMENTS At the end of December 2018, the exchange rate of the euro to U.S. dollar was approximately 1.14 1.15. A number of analysts expect the euro to remain saddled by soft economic data (partly a result of the moderation in global trade volumes) and political uncertainty (including Brexit and Italy). The European Central Bank, which is still confronted with slow GDP growth, low inflation and a fragile banking sector, is unlikely to tighten monetary policy soon. But at some point investors will expect the central bank to start the process of policy normalization. That, coupled with other macro-economic and geopolitical factors, could allow the common currency to bounce back in 2019. Most of our business is transacted in euros and US dollars. Therefore, changes in these currencies could have an effect on our future costs and revenues. Any weakness in the euro versus the US dollar would have a direct positive influence on our operating results as our commercial and launch activities are conducted in the United States. Conversely, a strong euro reduces the royalty payments from guselkumab (Tremfya®) sales incurred in US dollars that are converted into euros. We manage this risk as far as possible with appropriate currency hedging tools. REGULATORY ENVIRONMENT The healthcare industry’s regulatory environment is dominated by stringent product quality, safety and efficacy requirements, which place ever-higher demands on the companies involved. Novel drugs are required to demonstrate a benefit over existing therapies in order to be approved, gain market acceptance and be reimbursed. The current trend in the United States is toward faster approvals by the Food and Drug Administration (FDA). The FDA’s actions are partly due to legislation adopted in 2012 and the mechanisms created to reduce review times, such as breakthrough therapy designation and the extension of accelerated approvals. These mechanisms are meant to facilitate a faster review process for drug candidates that demonstrate a substantial improvement for patients in urgent need of safer, more effective treatments, such as cancer patients. Indeed, in 2018, the FDA approved 59 new medicines, surpassing the previous year’s record-breaking 46. Biopharmaceutical companies such as MorphoSys, who are focused on the development of therapies for indications with high unmet medical need, could potentially benefit from the mechanisms described above. We have received FDA breakthrough therapy designation for our drug candidate MOR208. DEVELOPMENT OF THE PHARMACEUTICAL AND BIOTECHNOLOGY SECTORS Worldwide prescription drug sales were projected to be approximately US$ 830 billion, according to a June 2018 report by EvaluatePharma. This number is projected to increase to US$ 1.2 trillion in 2024, a compound average growth rate (CAGR) of 6.4 %. The report indicated that the pharmaceutical sector seemed to have become a more stable place. While the political uncertainty that characterized much of 2017 may not have settled down, the industry appeared less anxious compared to earlier in the year. Much of the expansion of the market is expected to be driven by continuing unmet need in a number of disorders, as demonstrated by sales forecasts for the orphan drug market reaching US$262 billion in 2024, accounting for 20 % of the total prescription drug market. However, the ever-present danger of product failure remains an intrinsic risk of drug development. Companies also remain under pricing pressure from payers, even if the threat of price control from politicians goes away. The demand for real world evidence before insurers and governments will consider reimbursing drugs is expected to continue to intensify, no matter how innovative developers claim their products are.

Group Management Report Operations and Business Environment 46 05 Employees by Gender (December 31) trainees (number) executives (number) 4 4 6 2 23 39 24 33 2017 2018 2017 2018 total employees (in %) 64 2017 36 63 2018 37 06 Seniority years average 2017 2018 7.6 YEARS 7.2 YEARS <5 5-10 10-15 15-20 >20 39 % 30 % 18 % 9 % 4 % 07 Workforce Turnover Rate (in %) 2017 10.6 % 2018 10.0 %

Operations and Business Environment Group Management Report 47 The market for cancer drugs – the primary market for most of MorphoSys’s proprietary compounds – remains one of the most attractive and fastest-growing segments of the pharmaceutical industry. EvaluatePharma stated that worldwide oncology sales were approximately US$ 104 billion in 2017, projected to grow to US$ 233 billion in 2024, at a CAGR of 12 %. In 2024, five of the top ten companies in oncology are expected to maintain their 2017 leadership positions. Outside the top ten, the rest of the industry is expected to have a CAGR of 22 %, bringing their market share in 2024 up to nearly 40 % from nearly 22 % in 2017. Oncology is the leading therapy area in terms of sales and is projected to continue to be the dominant therapy segment in 2024, with sales reaching US$ 233 billion in 2024 (2017: US$ 104 billion) and an expected CAGR of 12.2 % per year. Looking at mergers and acquisitions (M&A) activity, according to BioCentury, the number of biotech takeouts closed in 2018 was 55 compared to 60 in 2017, a decline of 8 %. The total value of those deals, though, was up 8 % to US$ 65.2 billion. Not included in this figure is Takeda’s $ 62 billion acquisition of Shire, which was announced in 2018 but closed in early January 2019. According to BioCentury, the top tier of companies have raised enough capital to weather nearly any storm. The year 2018 saw the biotech sector setting records in the total amount of money raised in venture and IPOs, while the amount raised through follow-ons was second behind 2015. But most of the sector didn’t participate in the cash grab; BioCentury’s analysis of public biotech balance sheets shows that about 40 % of loss making companies have one year of cash or less. For those who did not refinance, the window closed with no IPOs or follow-ons having been completed since the start of the U.S. government shutdown on December 22nd as of January 14th. Information on the development of the stock market environment can be found in the section “Shares and the Capital Market.” DEVELOPMENT OF THE ANTIBODY SECTOR The year 2018 was another highly successful year for the clinical development and marketing approval of therapeutic antibodies. By the end of 2018, marketing approval by the FDA or European Medicines Agency (EMA) had been granted to 13 new antibodies, a new record. According to “Antibodies to Watch in 2019,” published in mAbs Journal, 62 monoclonal antibodies (mAbs) are currently in late-stage clinical studies, representing the largest number to date at this stage of advanced development. Thirty-three of the 62 mAbs are being developed as cancer treatments. Our lead proprietary development product candidate, MOR208, is listed as one of the “antibodies to watch” in this report. We regard the successful development and commercialization of the antibody segment as a generally positive signal and a validation of our development focus on this drug class. However, no conclusions can be drawn regarding the likelihood of clinical or market success of individual drug candidates. FINANCIAL STATEMENTS

Group Management Report 48 Operating and Financial Review and Prospects 08 Revenues by Region (December 31) (in %) 71 41 90 87 75 29 59 10 13 25 2014 2015 2016 2017 2018 europe and asia north america 09 Revenues Proprietary Development and Partnered Discovery (December 31) (in million €)1 1 Differences due to rounding. TOTAL 64.0 106.2 49.7 66.8 76.4 59.9 53.6 43.6 42.3 43.6 41.9 19.3 17.6 15.0 7.3 5.4 4.0 5.6 3.5 0.6 2014 2015 2016 2017 2018 segment partnered discovery funded research and licesing fees segment partnered discovery success-based payments segment proprietary development

Operating and Financial Review and Prospects Group Management Report 49 Operating and Financial Review and Prospects You should read the following discussion and analysis of the financial condition and results of operations of the Company in conjunction with the consolidated financial statements and the related notes thereto included elsewhere in this report. In addition to historical financial information, the following discussion contains forward-looking statements that reflect our plans, estimates and opinions. Our actual results could differ materially from those discussed in these forward-looking statements. Factors that could cause or contribute to these differences or cause our actual results or the timing of selected events to differ materially from those anticipated in these forward-looking statements include those set forth under “Risk Factors,” “Special Note Regarding Forward-Looking Statements” and elsewhere in this report. Our consolidated financial statements comply with both the IFRSs published by the International Accounting Standards Board (IASB) and those adopted by the EU. The consolidated financial statements also take into account the supplementary provisions under commercial law, which must be applied in accordance with Section 315e (1) of the German Commercial Code (Handelsgesetzbuch – HGB). Results of Operations REVENUES Revenues increased by 14 % or € 9.6 million, from € 66.8 million in 2017 to € 76.4 million in 2018. The increase in revenues was primarily a result of a € 47.5 million upfront payment received and fully recognized in 2018 following the signing of an exclusive global license agreement with Novartis Pharma AG for the development and commercialization of MOR106. Had revenues in the 2018 financial year continued to be recognized in accordance with IAS 18, revenues would have been € 1.1 million higher than under the application of IFRS 15, the new accounting standard governing revenue recognition. In 2017, revenues were significantly and positively affected by funded research and license fees from a collaboration agreement with Novartis that concluded at the end of 2017 as well as by the signing of an exclusive regional license agreement with I-Mab Biopharma for the development and commercialization of MOR202 in China, Taiwan, Hong Kong and Macao. On a regional basis, revenues with biotechnology and pharmaceutical companies in the United States and Canada increased by more than 100 %, or € 10.7 million, from € 8.7 million in 2017 to € 19.4 million in 2018 primarily due to higher success-based payments received mainly from Janssen. Revenues with customers in Europe or Asia decreased by 2 %, or € 1.0 million, from € 58.1 million in 2017 to € 57.1 million in 2018. In 2018, 95 % of our revenues were attributable to activities with our partners Novartis, Janssen and I-Mab Biopharma, whereas 90 % of our revenues in 2017 were attributable to activities with the same partners. This change was due to the MOR106 agreement with Novartis in 2018 and receipt of the related upfront payment. In 2017, revenues increased by 34 %, or € 17.1 million, from € 49.7 million in 2016 to € 66.8 million in 2017. The increase in revenues was primarily a result of a $20.0 million (equal to € 16.8 million at the then-prevailing exchange rate) upfront payment received and fully recognized in 2017 following the signing of an exclusive regional license agreement with I-Mab Biopharma for the development and commercialization of MOR202 in China, Taiwan, Hong Kong and Macao. In 2016 and 2017, revenues were significantly and positively affected by funded research and license fees from a collaboration agreement with Novartis that concluded at the end of 2017. On a regional basis, revenues with biotechnology and pharmaceutical companies in the United States and Canada increased by 71 %, or € 3.6 million, from € 5.1 million in 2016 to € 8.7 million in 2017, primarily due to higher success-based payments received mainly from Janssen. Revenues with customers in Europe or Asia increased by 30 %, or € 13.4 million, from € 44.7 million in 2016 to € 58.1 million in 2017 primarily due to the upfront payment received from I-Mab Biopharma, which was partially off-set by lower revenues received from Novartis in 2017. In 2017, 90 % of our revenues were attributable to activities with our partners Novartis, I-Mab Biopharma and Janssen, whereas 95 % of our revenues in 2016 were attributable to activities with our partners Novartis, Pfizer and Janssen. This change is due to entry into the agreement with I-Mab Biopharma in 2017 and receipt of the related upfront payment. ›› SEE FIGURE 08 – Revenues by Region (page 48) ›› SEE FIGURE 09 – Revenues Proprietary Development and Partnered Discovery (page 48) PROPRIETARY DEVELOPMENT In 2018, revenues in our Proprietary Development segment increased by € 36.0 million, from € 17.6 million in 2017 to € 53.6 million in 2018. This increase was due to the revenues recognized from the upfront payment received under our MOR106 agreement with Novartis. FINANCIAL STATEMENTS

Group Management Report 50 Operating and Financial Review and Prospects In 2017, revenues in our Proprietary Development segment increased by € 17.0 million, from € 0.6 million in 2016 to € 17.6 million in 2017. This increase was due to the revenues recognized from the upfront payment received under our 2017 agreement with I-Mab Biopharma. PARTNERED DISCOVERY In 2018, revenues in our Partnered Discovery segment decreased by € 26.4 million, from € 49.2 million in 2017 to € 22.8 million in 2018. These amounts included € 41.9 million in 2017 and € 3.5 million in 2018 in funded research and license fees. The decrease was primarily driven by the terminated collaboration arrangement with Novartis in 2017. The Partnered Discovery segment also included € 7.3 million in 2017 and € 19.3 million in 2018 in success-based payments received primarily from Janssen. Revenues in our Partnered Discovery segment included royalties on net sales of Tremfya® in the amount of € 1.9 million in 2017 and € 15.4 million in 2018. In 2017, revenues in our Partnered Discovery segment increased by € 0.1 million, from € 49.1 million in 2016 to € 49.2 million in 2017. These amounts included € 43.6 million in 2016 and € 41.9 million in 2017 in funded research and license fees, received primarily in connection with the collaboration with Novartis as well as € 5.6 million in 2016 and € 7.3 million in 2017 in success-based payments received primarily from Janssen and Novartis. Revenues in our Partnered Discovery segment included € 1.9 million of royalties on net sales of Tremfya in 2017. As a result of the conclusion of our collaboration arrangement with Novartis, we no longer expect to receive significant recurring research and license fees from Novartis, and further revenues received from Novartis, if any, will consist of milestone payments and royalties from sales of approved products. Operating Expenses In 2018, operating expenses increased by 2 %, or € 2.7 million, from € 133.8 million in 2017 to € 136.5 million in 2018. This increase was driven by higher cost of sales and selling expenses as well as higher administrative expenses. The line item “cost of sales” was presented for the first time in the third quarter of 2018 and consisted of expenses in connection with services being rendered while transferring projects to customers such as I-Mab Biopharma. In 2018, cost of sales amounted to € 1.8 million. The Group started presenting “selling expenses” as a separate line item since January 1, 2018. In 2018, selling expenses amounted to € 6.4 million compared to € 4.8 million. The presentation of selling expenses led to a change in the presentation of research and development expenses and general and administrative expenses for 2017. These items were reduced by € 3.5 million and € 1.3 million, respectively, and the corresponding amounts are now included in “selling expenses.” Research and development expenses decreased by 6 %, or € 6.9 million, from € 113.3 million in 2017 to € 106.4 million in 2018 mainly as a result of decreased expenses for external services related to development activities in our Proprietary Development segment as well as decreased expenses in our Partnered Discovery Segment. General and administrative expenses increased by 39 %, or € 6.2 million, from € 15.7 million in 2017 to € 21.9 million in 2018 mainly due to higher personnel expenses and costs for external services. In 2018, operating expenses in our Proprietary Development segment increased by 8 %, or € 7.9 million, from € 99.1 million in 2017 to € 107.0 million in 2018, primarily due to an increase in research and development expenses and selling expenses. Research and development expenses in our Proprietary Development segment, including technology development, increased by 2 %, or € 2.0 million, from € 96.3 million in 2017 to € 98.3 million in 2018 mainly due to an increase in research and development expenses for MOR208. In 2018, operating expenses in our Partnered Discovery segment decreased by 50 %, or € 9.4 million, from € 18.9 million in 2017 to € 9.5 million in 2018, primarily due to a decrease in research and development expenses. Research and development expenses in our Partnered Discovery segment decreased by 51 %, or € 8.8 million, from € 17.3 million in 2017 to € 8.5 million in 2018. Research and development expenses in our Partnered Discovery segment in 2017 related primarily to the Novartis collaboration, which was concluded in 2017. In 2017, operating expenses increased by 22 %, or € 24.0 million, from € 109.8 million in 2016 to € 133.8 million in 2017. This increase was driven by higher research and development as well as general and administrative expenses. Research and development expenses increased by 21 %, or € 19.3 million, from € 94.0 million in 2016 to € 113.3 million in 2017 mainly as a result of increased expenses for external services related to development in our Proprietary Development segment. General and administrative expenses increased by 17 %, or € 2.3 million, from € 13.4 million in 2016 to € 15.7 million in 2017 mainly due to higher personnel expenses and costs for external services. In 2017, operating expenses in our Proprietary Development segment increased by 26 %, or € 20.6 million, from € 78.5 million in 2016 to € 99.1 million in 2017, primarily due to an increase in research and development expenses. Research and development expenses in our Proprietary Development segment, including technology development, increased by 24 %, or € 18.7 million, from € 77.6 million in 2016 to € 96.3 million in 2017 due to increases mainly in research and development expenses for MOR208, MOR106 and MOR202.
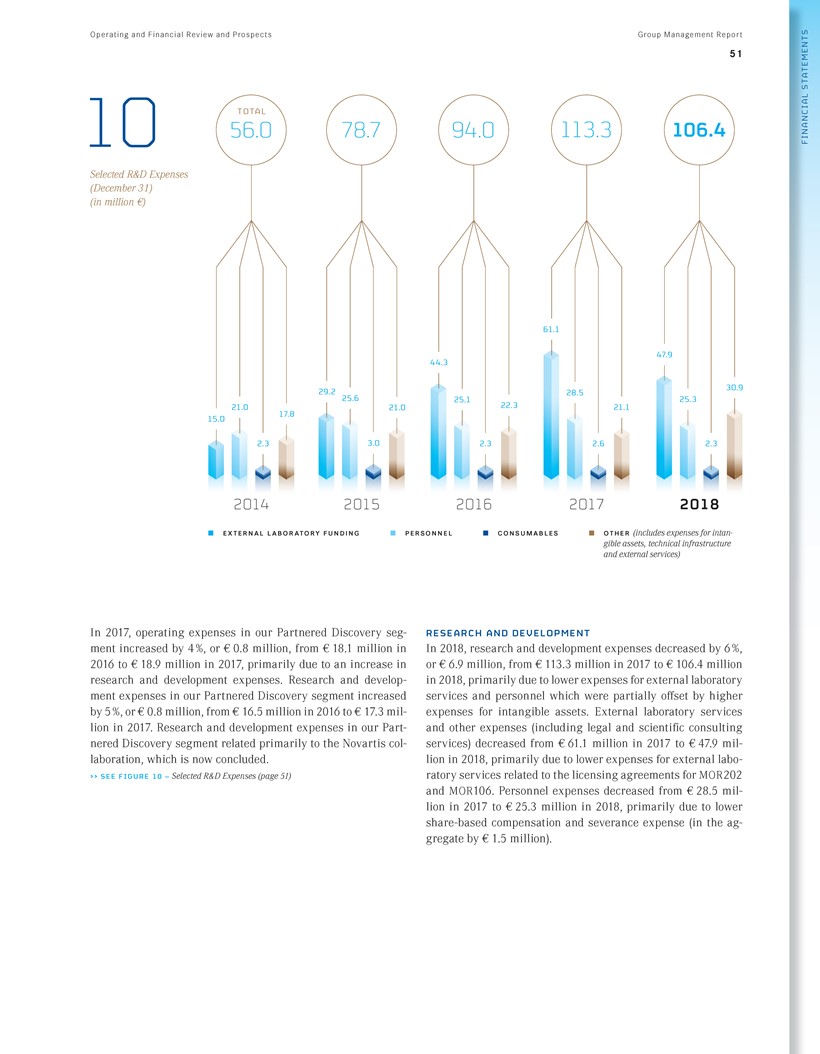
Operating and Financial Review and Prospects Group Management Report 51 10 Selected R&D Expenses (December 31) (in million €) TOTAL 56.0 78.7 94.0 113.3 106.4 61.1 47.9 44.3 30.9 29.2 28.5 25.6 25.1 28.5 25.3 21.0 21.0 22.3 21.1 17.8 15.0 2.3 3.0 2.3 2.6 2.3 2014 2015 2016 2017 2018 external laboratory funding personnel consumables other (includes expenses for intangible assets, technical infrastructure and external services) In 2017, operating expenses in our Partnered Discovery segment increased by 4 %, or € 0.8 million, from € 18.1 million in 2016 to € 18.9 million in 2017, primarily due to an increase in research and development expenses. Research and development expenses in our Partnered Discovery segment increased by 5 %, or € 0.8 million, from € 16.5 million in 2016 to € 17.3 million in 2017. Research and development expenses in our Partnered Discovery segment related primarily to the Novartis collaboration, which is now concluded. ›› SEE FIGURE 10 – Selected R&D Expenses (page 51) RESEARCH AND DEVELOPMENT In 2018, research and development expenses decreased by 6 %, or € 6.9 million, from € 113.3 million in 2017 to € 106.4 million in 2018, primarily due to lower expenses for external laboratory services and personnel which were partially offset by higher expenses for intangible assets. External laboratory services and other expenses (including legal and scientific consulting services) decreased from € 61.1 million in 2017 to € 47.9 million in 2018, primarily due to lower expenses for external laboratory services related to the licensing agreements for MOR202 and MOR106. Personnel expenses decreased from € 28.5 million in 2017 to € 25.3 million in 2018, primarily due to lower share-based compensation and severance expense (in the aggregate by € 1.5 million). FINANCIAL STATEMENTS

Group Management Report Operating and Financial Review and Prospects 52 Expenses for intangible assets increased from € 13.5 million in 2017 to € 22.8 million in 2018. Expenses for intangible assets in 2018 were mainly driven by impairment charges of € 19.2 million primarily related to the impairment of goodwill for MOR107 and € 9.8 million in 2017 related to the termination of the cooperation with Aptevo Therapeutics for the development of MOR209. Depreciation and other costs for infrastructure expenses increased from € 4.9 million in 2017 to € 5.4 million in 2018, primarily due to higher insurance expenses. Other expenses remained unchanged at € 2.8 million in 2017 and 2018. Expenses for consumable supplies decreased from € 2.6 million in 2017 to € 2.3 million in 2018. In 2017, research and development expenses increased by 21 %, or € 19.3 million, from € 94.0 million in 2016 to € 113.3 million in 2017, primarily due to higher expenses for external laboratory services and personnel. External laboratory services and other expenses (including legal and scientific consulting services) increased from € 44.3 million in 2016 to € 61.1 million in 2017, primarily due to increased expenses related to our Proprietary Development segment. Personnel expenses increased from € 25.1 million in 2016 to € 28.5 million in 2017, primarily due to higher share-based compensation and severance expense (in the aggregate by € 2.5 million) in connection with the conclusion of the Novartis collaboration, which were only partially offset by a decrease in the number of employees active in research and development. Expenses for intangible assets remained almost unchanged and decreased slightly from € 13.7 million in 2016 to € 13.5 million in 2017. Expenses for intangible assets mainly represent impairment charges of € 9.8 million in 2017 related to the termination of the cooperation with Aptevo Therapeutics for the development of MOR209 and € 10.1 million in 2016. In 2017, the reason for the impairment was the termination of the cooperation with Aptevo Therapeutics due to the expectation of a delay in the development plan, a delayed market entry and a delay in the occurrence of future cash flows compared to previous assumptions. In 2016, the reason for the partial impairment was the expectation of a lower inflow of benefits and of a delay in the occurrence of future cash flows*. Depreciation and other costs for infrastructure expenses decreased from € 5.9 million in 2016 to € 4.9 million in 2017, primarily due to one-time costs related to our move to a new building in 2016. Other expenses increased from € 2.6 million in 2016 to € 2.8 million in 2017 primarily due to higher maintenance expenses for laboratory equipment. Expenses for consumable supplies increased from € 2.3 million in 2016 to € 2.6 million in 2017 in line with the increase in our research and development operations. SELLING Selling expenses increased by 33 %, or € 1.6 million, from € 4.8 million in 2017 to € 6.4 million in 2018, primarily due to higher personnel expenses and external services. Personnel expenses increased from € 1.8 million in 2017 to € 2.5 million in 2018 due to intensified commercialization efforts for MOR208. Expenses for external services increased from € 2.7 million in 2017 to € 3.0 million in 2018. Selling expenses increased by 100 %, or € 2.4 million, from € 2.4 million in 2016 to € 4.8 million in 2017, primarily due to higher external services. Expenses for external services increased from € 0.3 million in 2016 to € 2.7 million in 2017. GENERAL AND ADMINISTRATIVE In 2018, general and administrative expenses increased by 39 %, or € 6.2 million, from € 15.7 million in 2017 to € 21.9 million in 2018, primarily due to higher personnel expenses and costs for external services. Personnel expenses increased from € 11.8 million in 2017 to € 15.0 million in 2018, primarily due to higher deferred compensation for share-based incentive plans, recruitment expenses and wages. Expenses for external services increased from € 2.2 million in 2017 to € 4.5 million in 2018, primarily due to one-time costs related to our initial public offering on the Nasdaq. Other expenses increased from € 0.7 million in 2017 to € 1.0 million in 2018, primarily due to higher rent expenses. In 2017, general and administrative expenses increased by 17 %, or € 2.3 million, from € 13.4 million in 2016 to € 15.7 million in 2017, primarily due to higher personnel expenses. Personnel expenses increased from € 9.2 million in 2016 to € 11.8 million in 2017, primarily due to higher deferred compensation for share-based incentive plans and bonus payments. Other expenses decreased from € 0.8 million in 2016 to € 0.7 million in 2017, primarily due to one-time costs related to our move in 2016 to a new building. Other Income In 2018, other income increased by 47 %, or € 0.5 million, from € 1.1 million in 2017 to € 1.6 million in 2018 and mainly consisted of currency gains in an amount of € 0.5 million in 2017 and € 0.7 million in 2018, gains from the recognition of previously unrecognized intangible assets of € 0 in 2017 and € 0.4 million (resulting from contribution in kind of the investment in adivo GmbH) in 2018, grant income in an amount of € 0.2 million in 2017 and € 0.2 million in 2018 and miscellaneous income of € 0.4 million in 2017 and € 0.4 million in 2018. *SEE GLOSSARY – page 188

Operating and Financial Review and Prospects Group Management Report 53 In 2017, other income increased by 57 %, or € 0.4 million, from € 0.7 million in 2016 to € 1.1 million in 2017 and mainly consisted of grant income in an amount of € 0.2 million in 2017 and € 0.3 million in 2016, currency gains in an amount of € 0.5 million in 2017 and € 0.2 million in 2016 and miscellaneous income of € 0.5 million in 2017 and € 0.2 million in 2016. Other Expenses In 2018, other expenses decreased by 59 %, or € 1.0 million, from € 1.7 million in 2017 to € 0.7 million in 2018. Other expenses mainly consisted of currency losses in an amount of € 0.8 million in 2017 and € 0.5 million in 2018 and miscellaneous expenses of € 0.9 million in 2017 and € 0.2 million in 2018. In 2017, other expenses increased by € 1.1 million, from € 0.6 million in 2016 to € 1.7 million in 2017. Other expenses mainly consisted of currency losses in an amount of € 0.8 million in 2017 and € 0.4 million in 2016 and miscellaneous expenses of € 0.8 million in 2017 and € 0.2 million in 2016. EBIT EBIT, defined as earnings before finance income, finance expenses, impairment losses on financial assets and income taxes, amounted to € –59.1 million in 2018, compared to an EBIT of to € –67.6 million in 2017. Finance Income Finance income decreased by 43 %, or € 0.3 million, from € 0.7 million in 2017 to € 0.4 million in 2018, reflecting lower returns from investments. Finance income mainly consisted of realized gains from derivatives of € 0.4 million in 2017 and € 0.3 million in 2018 and interest income of € 0.2 million in 2017 and € 0.1 million in 2018 received from investments in term deposits with fixed or variable interest rates. In 2017, finance income decreased by 50 %, or € 0.7 million, from € 1.4 million in 2016 to € 0.7 million in 2017 reflecting lower returns from investments. Finance income mainly consisted of interest income of € 1.0 million in 2016 and € 0.2 million in 2017 received from investments in term deposits with fixed or variable interest rates, € 0.3 million in 2016 and less than € 0.1 million in 2017 in realized gains from the divestment of available-for-sale financial assets and bonds and € 0.1 million in 2016 and € 0.4 million in 2017 in realized gains from derivatives. Finance Expenses In 2018, finance expenses decreased by 5 %, or € 1.1 million, from € 1.9 million in 2017 to € 0.8 million in 2018 and primarily consisted of losses on marketable securities and derivatives of € 1.5 million in 2017 and € 0.4 million in 2018 and interest expenses of € 0.5 million in 2017 and € 0.3 million in 2018. In 2017, finance expenses increased by 46 %, or € 0.6 million, from € 1.3 million in 2016 to € 1.9 million in 2017 and consisted primarily of losses on derivatives of € 1.4 million and interest expenses of € 0.4 million in 2017. In 2016, finance expenses mainly consisted of € 1.2 million in realized losses from the sale of available-for-sale financial assets and bonds. Income Tax Expenses In 2018, income tax benefits amounted to € 4.3 million and in 2017 income tax expenses amounted to € 1.0 million. The income tax benefit is mainly the consequence of derecognition of a deferred tax liability resulting from the impairment of intangible assets. The effective income tax rate changed from negative 1.5 % in 2017 to 7.1 % in 2018. The difference to the expected tax rate of 26.7 % (which would have resulted in an expected income tax benefit of € 16.1 million in 2018 and € 18.3 million in 2017) is primarily the result of the non-recognition of deferred tax assets on current year tax losses of € 14.5 million in 2018 and € 22.0 million in 2017 as well as permanent differences resulting from transaction costs in connection with the US IPO of negative € 3.7 million in 2018 and the non-recognition of deferred tax assets on temporary differences of € 0.3 million in 2018. In 2017, income tax expenses increased by 100 %, or € 0.5 million, from € 0.5 million in 2016 to € 1.0 million in 2017, due in large part to an income tax benefit in 2016 related to certain losses that were carried back to offset 2015 taxable income. In 2017, no such tax loss carry back was possible. The effective income tax rate changed from negative 0.9 % in 2016 to negative 1.5 % in 2017. The difference between the expected tax rate of 26.7 % (which would have resulted in an expected income tax benefit of € 18.3 million in 2017 and € 16.0 million in 2016) is primarily the result of the non-recognition of deferred tax assets on current year tax losses of € 22.0 million in 2017 and € 13.4 million in 2016 and the non-recognition of deferred tax assets on temporary differences of negative € 3.3 million in 2017 and € 3.8 million in 2016. FINANCIAL STATEMENTS

Group Management Report Operating and Financial Review and Prospects 54 Consolidated Net Profit/Loss for the Period In 2018, the net result for the period amounted to € –56.2 million (2017: € –69.8 million). TABLE 03 Multi-Year Overview – Statement of Profit or Loss1 in million € 2018 2017 2016 2015 2014 Revenues 76.4 66.8 49.7 106.2 64.0 Cost of Sales (1.8) 0.0 0.0 0.0 0.0 Research and Development Expenses2 (106.4) (113.3) (94.0) (78.7) (56.0) Selling Expenses2 (6.4) (4.8) (2.4) 0.0 0.0 General and Administrative Expenses2 (21.9) (15.7) (13.4) (15.1) (14.1) Other Income/Expenses 1.0 (0.6 0.2 4.7 0.2 EBIT (59.1) (67.6) (59.9) 17.2 (5.9) Finance Income/Expenses (0.3) (1.2) 0.1 3.4 1.6 Impairment Losses on Financial Assets (1.0) 0.0 1.0 0.0 0.0 Income Tax Benefit/(Expenses) 4.3 (1.0) (0.5) (5.7) 1.3 Consolidated Net Profit/(Loss) (56.2) (69.8) (60.4) 14.9 (3.0) Earnings per Share, basic and diluted (in €)3 (1.79) (2.41) (2.28) (0.12) Earnings per Share, basic (in €) 0.57 Earnings per Share, diluted (in €) 0.57 Shares Used in Computing Earnings per Share (in units), basic and diluted3 31,338,948 28,947,566 26,443,415 25,903,995 Shares Used in Computing Earnings per Share (in units), basic 26,019,855 Shares Used in Computing Earnings per Share (in units), diluted 26,244,292 Dividends Declared per Share 1 Differences due to rounding. 2 In 2018, selling expenses were presented for the first time. In order to provide comparative information for the previous year, the figures for 2017 and 2016 have been adjusted accordingly. The figures for 2015 and 2014 were not adjusted due to materiality reasons. 3 Basic and diluted Earnings per Share are the same in each of the years ended December 31, 2018, 2017, 2016 and 2014, because the assumed exercise of outstanding stock options and convertible bonds would be anti-dilutive due to our consolidated net loss in the respective periods. Liquidity and Capital Resources SOURCES OF FUNDING We have funded our operations primarily through the issuance of ordinary shares and through cash received in the ongoing operations of our business, including upfront fees, milestone payments, license fees, royalties, and support fees from our strategic partners and government grants. Liquidity as of December 31, 2018 is presented in the balance sheet items “cash and cash equivalents”, “financial assets at fair value, with changes recognized in profit or loss” as well as “financial assets at amortized cost”. As of December 31, 2017, liquidity had been presented in the balance sheet items “cash and cash equivalents”, “available-for-sale financial assets” as well as “financial assets classified as loans and receivables”. As of December 31, 2018, we had € 45.5 million in cash and cash equivalents, € 44.6 million in financial assets at fair value, with changes recognized in profit or loss, and € 364.7 million in current and non-current financial assets at amortized cost.

Operating and Financial Review and Prospects Group Management Report 55 As of December 31, 2017, we had € 76.6 million in cash and cash equivalents, € 86.5 million in available-for-sale financial assets and € 149.1 million in current other financial assets categorized as “loans and receivables.” Cash in excess of immediate working capital requirements is invested in accordance with our investment policy, primarily with a view to liquidity and capital preservation. Investments are primarily made in money market funds, corporate bonds and term deposits with fixed or variable interest. We do not have any financial indebtedness, and we are not subject to any operating covenants or capital requirements. USES OF FUNDING Our primary use of cash is to fund research and development costs related to the development of our product candidates. Our primary future funding requirements include the development of our proprietary clinical pipeline (primarily MOR208) and the advancement of our earlier stage wholly-owned or co-developed product candidates. We believe that our existing cash and cash equivalents and other financial instruments (including cash invested in various financial instruments as described above) will be sufficient to fund our anticipated operating expenses for at least the next twelve months. We have based this estimate on assumptions that may prove to be wrong, and we could use our capital resources sooner than we currently expect. Additionally, the process of testing product candidates in clinical trials is costly, and the timing of progress in these trials is uncertain. Because our product candidates are in various stages of development and the outcome of these efforts is uncertain, we cannot estimate the actual amounts necessary to successfully complete the development and commercialization of our product candidates or whether, or when, we may achieve profitability. We will likely require additional capital for the further development of our existing product candidates, regulatory approval processes, the potential buildout of a commercial organization and for our operation as a public company in the U.S. and may also need to raise additional funds sooner to pursue other inlicensing or development activities related to additional product candidates. Until we can generate a sufficient amount of revenue, we expect to finance future cash needs primarily through public or private equity or debt offerings, including convertible bonds. Additional capital may not be available on reasonable terms, if at all. If we are unable to raise additional capital in sufficient amounts or on terms acceptable to us, we may have to significantly delay, scale back or discontinue the development or commercialization of one or more of our product candidates. If we raise additional funds through the issuance of debt or equity securities, it could result in dilution to our existing shareholders, increased fixed payment obligations or the securities may have rights senior to those of our ordinary shares or the ADSs. If we incur indebtedness, we could become subject to covenants that would restrict our operations and potentially impair our competitiveness, such as limitations on our ability to incur additional debt, limitations on our ability to acquire, sell or license intellectual property rights and other operating restrictions that could adversely impact our ability to conduct our business. Cash Flows CASH FLOWS PROVIDED BY / USED IN OPERATING ACTIVITIES In 2018, net cash used in operating activities was € 33.3 million, primarily driven by the consolidated net loss of € 56.2 million, partially offset by non-cash charges of positive € 27.4 million, and changes in operating assets and liabilities and taxes paid of negative € 4.5 million. The consolidated net loss of € 56.2 million was primarily driven by expenses incurred to fund our ongoing operations, in particular research and development expenses, selling expenses and general and administrative expenses. Non-cash charges consisted primarily of impairment expenses for intangibles assets in the amount of € 24.0 million, deferred compensation for share-based payment of € 5.6 million and depreciation and amortization of tangible and intangible assets of € 3.8 million, offset by an income tax benefit of € 4.3 million. Changes in operating assets and liabilities for 2018 consisted primarily of an increase in accounts receivable by € 6.6 million and a decrease in other liabilities by € 2.7 million, offset by contract liabilities in the amount of € 2.4 million incurred during the year as well as an increase in accounts payable and accruals by € 1.9 million. The increase in accounts receivable was mainly due to a comparatively higher level of receivables outstanding at year-end. The decrease in other liabilities was mainly due to the payment of tax liabilities and the repayment of a governmental cost subsidy. The contract liability incurred during the year mainly related to annual license fees. The increase in accounts payable and accruals was mainly due to an increase in external laboratory services that were outstanding at year end. In 2017, net cash used in operating activities was € 38.4 million, primarily driven by the consolidated net loss of € 69.8 million, partially offset by non-cash charges of positive € 0.7 million, and changes in operating assets and liabilities and taxes paid of € 30.6 million. The consolidated net loss of € 69.8 million was primarily driven by expenses incurred to fund our ongoing operations, in particular research and development expenses and general and administrative expenses. Changes in operating assets and liabilities for 2017 consisted primarily of € 18.4 million in deferred revenue received during the year, a € 7.8 million increase in accounts payable and accruals and a € 3.1 million increase in other liabilities. The deferred revenue received during the year mainly related to annual license fees. The increase in FINANCIAL STATEMENTS

Group Management Report Operating and Financial Review and Prospects 56 accounts payable and accruals was mainly due to an increase in external laboratory services primarily related to the MOR208 program that were outstanding at year end. The increase in other liabilities was mainly due to the deferral of the rent-free period for the rental agreement for our headquarters. In 2016, net cash used in operating activities was € 46.6 million, primarily driven by the consolidated net loss of € 60.4 million, after consideration of the net non-cash charges of negative € 0.7 million, and changes in operating assets and liabilities as well as taxes paid of € 14.4 million. Consolidated net loss of € 60.4 million, after consideration of the net non-cash charges of negative € 0.7 million, was primarily driven by expenses incurred to fund our ongoing operations, in particular research and development expenses and general and administrative expenses. Net cash provided by changes in operating assets and liabilities for 2016, consisted primarily of € 17.4 million in deferred revenue prepayments received during the year and a € 13.0 million increase in accounts payable and accruals, partially offset by a € 13.9 million increase in prepaid expenses and other assets. The prepayments for deferred revenue received during the year mainly related to annual license fees. The increase in accounts payable and accruals was mainly due to an increase in external laboratory services. The increase in prepaid expenses and other assets was mainly due to an increase in the purchase of combination compounds and prepaid fees for external laboratory services, in each case primarily related to our MOR208 program. CASH FLOWS PROVIDED BY / USED IN INVESTING ACTIVITIES In 2018, net cash used in investing activities was € 177.3 million, primarily driven by the purchase of financial assets in the amount of € 451.3 million, of which € 366.8 million were classified at amortized cost, partially offset by proceeds from the sale of financial assets in the amount of € 276.4 million, of which € 150.0 million were classified at amortized cost. Cash used in investing activities primarily related to the investment of the proceeds from our initial public offering on the Nasdaq as well as a shift in the composition in our investment portfolio as financial assets matured and were sold and new, similar financial assets were purchased. In 2017, net cash provided by investing activities was € 32.9 million, primarily driven by proceeds from the sale of financial assets in the amount of € 210.2 million, partially offset by the purchase of financial assets in the amount of € 164.4 million, of which € 108 million were classified as loans and receivables. Cash provided by investing activities primarily related to a shift in the composition in our investment portfolio as financial assets matured and were sold and new, similar financial assets were purchased. In 2016, net cash used in investing activities was € 80.8 million, primarily driven by purchase of financial assets of € 423.4 million, partially offset by sales of financial assets and bonds of € 343.5 million. Use of cash in investing activities during the period primarily related to a shift in the composition in our investment portfolio. CASH FLOWS PROVIDED BY / USED IN FINANCING ACTIVITIES In 2018, net cash provided by financing activities was € 179.5 million and mainly related to the gross proceeds from our initial public offering on the Nasdaq of € 193.6 million off-set by the related issuance costs of € 15.0 million. In 2017, net cash provided by financing activities was € 8.2 million and mainly related to exercises of convertible bonds by members of the Management Board and the senior management. In 2016, net cash provided by financing activities was € 110.4 million. Cash provided by financing activities during the period primarily related to our capital increase in November 2016, resulting in gross proceeds of € 115.4 million. Investments In 2018, MorphoSys invested € 1.8 million in property, plant and equipment (2017: € 1.3 million), mainly laboratory equipment (i.e. machinery) and computer hardware. Depreciation of property, plant and equipment in 2018 decreased to € 1.8 million (2017: € 2.0 million). The Company invested € 0.6 million in intangible assets in 2018 (2017: € 11.8 million). Amortization of intangible assets was below the prior year’s level and amounted to € 1.9 million in 2018 (2017: € 2.1 million). In 2018, impairment of € 15.1 million was recognized on the in-process R&D programs, thereof € 13.4 million on the MOR107 program (2017: impairment of € 9.8 million was recognized on the in-process MOR209/ES414 program).

Operating and Financial Review and Prospects Group Management Report 57 TABLE 04 Multi-Year Overview – Financial Situation1 in million € 2018 2017 2016 2015 2014 Net Cash Provided by/Used in Operating Activities2 (33.3) (38.4) (46.6) (23.5) (14.2) Net Cash Provided by/Used in Investing Activities2 (177.3) 32.9 (80.8) 86.3 (21.5) Net Cash Provided by/Used in Financing Activities2 179.5 8.2 110.4 (4.1) (3.9) Cash and Cash Equivalents (as of 31 December) 45.5 76.6 73.9 90.9 32.2 Financial Assets at Fair Value through Profit or Loss3 44.6 0.0 0.0 0.0 0.0 Other Financial Assets at Amortized Cost, Current Portion3 268.9 0.0 0.0 0.0 0.0 Other Financial Assets at Amortized Cost, Net of Current Portion3 95.7 0.0 0.0 0.0 0.0 Available-for-sale Financial Assets3 0.0 86.5 63.4 64.3 106.0 Bonds, Available-for-sale3 0.0 0.0 6.5 33.1 7.5 Financial Assets Categorized as Loans and Receivables, Current Portion3 0.0 149.1 136.1 94.6 157.0 Financial Assets Categorized as Loans and Receivables, Net of Current Portion3 0.0 0.0 79.5 15.5 50.0 1 Differences due to rounding. 2 In 2015, interest paid and interest received were reclassified from operating activities into investing activities and financing activities in the statement of cash flows. In order to provide comparative information for the previous year, the figures for 2014 have been adjusted accordingly. 3 In 2018, due to the first time adoption of IFRS 9 Financial Instruments, the items representing liquidity are presented in different balance sheet than in prior years. Net Assets ASSETS As of December 31, 2018, total assets amounted to € 538.8 million and were € 123.4 million above their level on December 31, 2017 (€ 415.4 million). Current assets increased by € 48.2 million. This change was mainly driven by an overall increase in financial assets and cash and cash equivalents as well as from an increase in accounts receivable and was partly offset by the decline in prepaid expenses and other current assets. As of December 31, 2018, an amount of € 44.6 million (December 31, 2017: € 86.5 million) was invested in various money market funds and reported under “financial assets at fair value through profit or loss.” On December 31, 2017, such investments were reported as “available-for-sale financial assets.” The category “other financial assets at amortized cost” included financial instruments totaling € 268.9 million (December 31, 2017: € 149.1 million). These instruments comprised mainly term deposits with either fixed or variable interest rates as well as three commercial papers. In 2017 such investments were reported in the category “loans and receivables”. Non-current assets increased by € 75.2 million to € 149.9 million compared to their level of € 74.7 million on December 31, 2017. The main reason for this change was an increase in non-current financial assets in the category “other financial assets at amortized cost, net of current portion” which was partially offset by a decline of the line item “In-process R&D Programs”. LIABILITIES Current liabilities decreased from € 47.7 million on December 31, 2017 to € 45.9 million on December 31, 2018. This effect mainly resulted from a decrease in other provisions and contract liabilities. Non-current liabilities (December 31, 2018: € 4.5 million; December 31, 2017: € 9.0 million) decreased mainly due to the decline in deferred tax liabilities. The decrease in deferred tax liabilities is mainly related to the impairment of in-process R&D programs. FINANCIAL STATEMENTS

Group Management Report Operating and Financial Review and Prospects 58 STOCKHOLDERS’ EQUITY As of December 31, 2018, Group equity totaled € 488.4 million compared to € 358.7 million on December 31, 2017. As of December 31, 2018, the Company’s equity ratio amounted to 91 % compared to 86 % on December 31, 2017. The number of shares issued totaled 31,839,572 as of December 31, 2018, of which 31,558,536 shares were outstanding (December 31, 2017: 29,420,785 shares issued and 29,101,107 shares outstanding). Common stock was higher due to the capital increases carried out in April 2018 as a result of the intial public offering on the Nasdaq Global Market. The capital increases were based on American Depositary Shares (“ADS”), with each ADS representing 1/4 of a MorphoSys common share. In the IPO process, 2,075,000 new shares were issued on April 18, 2018 and 311,250 new shares were issued on April 26, 2018 from Authorized Capital 2017-II. Common stock also increased by € 32,537 due to the exercise of 32,537 convertible bonds granted to the Management Board and the Senior Management Group. The weighted-average exercise price of the convertible bonds was € 31.88. On December 31, 2018, the Company held 281,036 shares of treasury stock valued at € 10,398,773, representing a decline of € 1,428,208 compared to December 31, 2017 (319,678 shares, € 11,826,981). The cause of the decline was the transfer of 17,129 shares of treasury stock valued at € 636,414 to the Management Board and Senior Management Group from the performance-based 2014 long-term incentive program (LTI). The vesting periods for this LTI program expired on April 1, 2018. Beneficiaries were given the option to receive a total of 17,219 shares within six months. In May 2018, the Management Board, the Senior Management Group and certain employees of the Company who are not part of the Senior Management Group received a one-time entitlement in a total fixed amount of € 2.1 million. As of December 31, 2018, 20,105 shares in an amount of € 2.1 million have been transferred to beneficiaries as a result of this entitlement. TABLE 05 Multi-Year Overview – Balance Sheet Structure1 in million € 12/31/2018 12/31/2017 12/31/2016 12/31/2015 12/31/2014 Assets Current Assets 388.9 340.7 308.1 300.1 322.4 Non-current Assets 149.9 74.7 155.5 100.0 104.1 Total 538.8 415.4 463.6 400.1 426.5 Equity and Liabilities Current Liabilities 45.9 47.7 38.3 27.5 32.7 Non-current Liabilities 4.5 9.0 9.8 9.9 45.0 Stockholders’ Equity2 488.4 358.7 415.5 362.7 348.8 Total 538.8 415.4 463.6 400.1 426.5 1 Differences due to rounding. 2 Includes Common Stock as of December 31, 2018: € 31,839,572; December 31, 2017: € 29,420,785; December 31, 2016: € 29,159,770; December 31, 2015: € 26,537,682; December 31, 2014: € 26,456,834
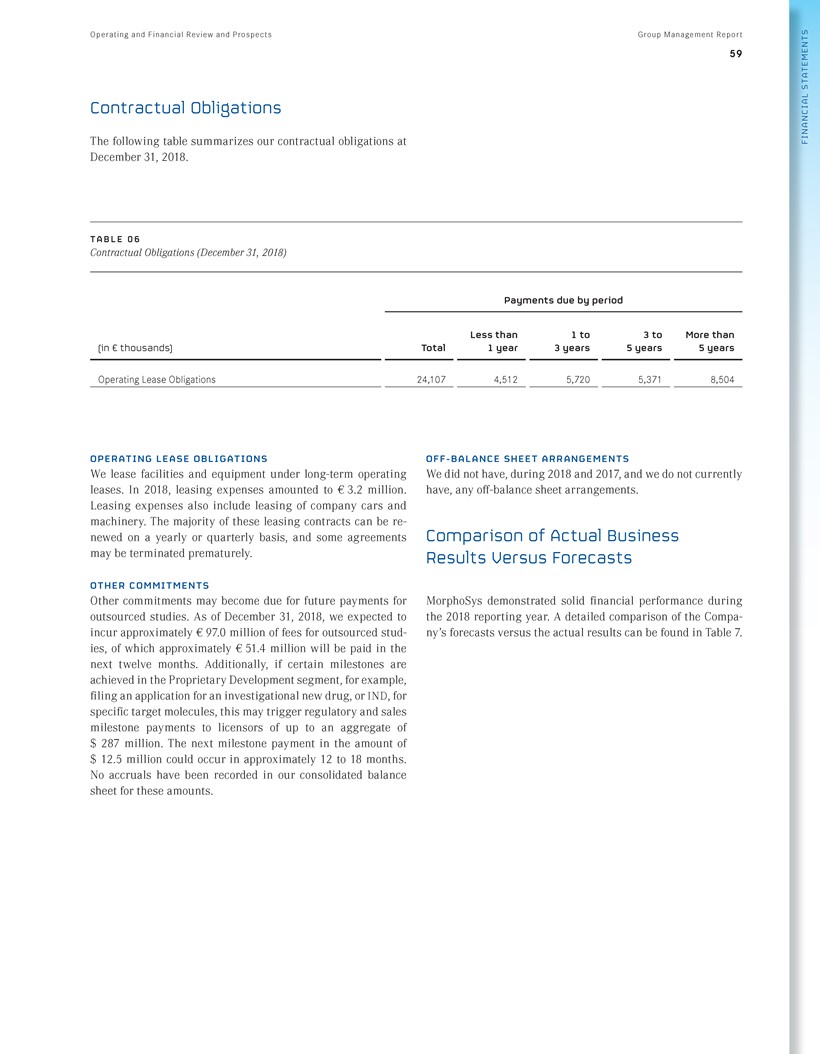
Operating and Financial Review and Prospects Group Management Report 59 Contractual Obligations The following table summarizes our contractual obligations at December 31, 2018. TABLE 06 Contractual Obligations (December 31, 2018) Payments due by period (in € thousands) Total Less than 1 year 1 to 3 years 3 to 5 years More than 5 years Operating Lease Obligations 24,107 4,512 5,720 5,371 8,504 OPERATING LEASE OBLIGATIONS We lease facilities and equipment under long-term operating leases. In 2018, leasing expenses amounted to € 3.2 million. Leasing expenses also include leasing of company cars and machinery. The majority of these leasing contracts can be renewed on a yearly or quarterly basis, and some agreements may be terminated prematurely. OTHER COMMITMENTS Other commitments may become due for future payments for outsourced studies. As of December 31, 2018, we expected to incur approximately € 97.0 million of fees for outsourced studies, of which approximately € 51.4 million will be paid in the next twelve months. Additionally, if certain milestones are achieved in the Proprietary Development segment, for example, filing an application for an investigational new drug, or IND, for specific target molecules, this may trigger regulatory and sales milestone payments to licensors of up to an aggregate of $ 287 million. The next milestone payment in the amount of $ 12.5 million could occur in approximately 12 to 18 months. No accruals have been recorded in our consolidated balance sheet for these amounts. OFF-BALANCE SHEET ARRANGEMENTS We did not have, during 2018 and 2017, and we do not currently have, any off-balance sheet arrangements. Comparison of Actual Business Results Versus Forecasts MorphoSys demonstrated solid financial performance during the 2018 reporting year. A detailed comparison of the Company’s forecasts versus the actual results can be found in Table 7. FINANCIAL STATEMENTS

Group Management Report Operating and Financial Review and Prospects 60 TABLE 07 Comparison of Actual Business Results Versus Forecasts 2018 Targets 2018 Results Financial targets Group revenues between € 67 million and € 72 million (initial forecast € 20–25 million; revised on July 19, 2018 upon announcement of licensing agreement with Novartis for MOR106) Expenses for proprietary product and technology development of € 87 million to € 97 million (initial forecast: € 95–105 million; revised on July 19, 2018 upon announcement of licensing agreement with Novartis for MOR106) EBIT of € (55) million to € (65) million (initial forecast: € (110) million to € (120) million; revised on July 19, 2018 upon announcement of licensing agreement with Novartis for MOR106) Proprietary Development segment: R&D expenses to continue to rise (2017: € 99.1 million) EBIT sharply negative due to planned R&D expenditures on proprietary programs (2017: € (81.3) million) Partnered Discovery segment: R&D expenses lower than in the prior year due to the expiration of the partnership with Novartis (2017: € 17.7 million) EBIT positive (2017: € 30.2 million) Group revenues of € 76.4 million; original guidance exceeded due to signing of licensing agreement for MOR106 with Novartis Expenses for proprietary product and technology development of € 98.3 million; original guidance was not met due to changes in individual project plans and signing of licensing agreement for MOR106 with Novartis EBIT of € (59.1) million Proprietary Development segment: R&D expenses of € 107.0 million EBIT of € (53.2) million Partnered Discovery segment: R&D expenses of € 8.5 million EBIT of € 13.3 million Proprietary Development MOR208 Update on interactions with the FDA based on breakthrough therapy designation status Completion of treatment of 81 patients under the current study protocol of the fully recruited L-MIND trial with MOR208 and lenalidomide in r/r DLBCL and the start of data evaluation Continuation of the pivotal phase 3 study evaluating MOR208 in combination with bendamustine in comparison to rituximab and bendamustine in r/r DLBCL (B-MIND study) Continuation of the phase 2 COSMOS trial with MOR208 in combination with idelalisib or venetoclax in r/r CLL or SLL and presentation of study data at conferences Continue to advance the development towards a potential regulatory approval and begin to set up commercial capabilities in order to commercialize MOR208 in certain geographies MOR202 Evaluation of new potential partnerships for the compound’s optimal development Evaluate the start of an exploratory clinical trial in non-small-cell lung cancer (NSCLC) Presentation of study data after completion of the phase 1/2a dose-escalation trial in multiple myeloma MOR106 Initiation of a phase 2 trial of MOR106 in atopic dermatitis under our co-development program with Galapagos MOR107 Preclinical investigation of MOR107 with a focus on oncology indications based on initial anti-tumor data Initiation and continuation of development programs in the area of antibody discovery and preclinical development MOR208 Regular updates on developments regarding path to market All 81 patients enrolled in the trial, data evaluation ongoing B-MIND study ongoing COSMOS trial ongoing, data presented at conferences: EHA (June) and ASH (December) Preparation for potential regulatory approval ongoing; set-up of commercial capabilities started, foundation of MorphoSys US Inc. to support commercialization of MOR208 in the U.S. MOR202 Termination of active partnering efforts for MOR202 in multiple myeloma outside I-Mab partnership for Greater China Stop of clinical development plans for NSCLC after discontinuation of a clinical study by Genmab and Janssen of anti-CD38 antibody daratumumab in combination with a checkpoint inhibitor in NSCLC due to safety findings Presentation of final phase 1/2a data in MM at ASH (December) MOR106 Start of IGUANA phase 2 trial in atopic dermatitis in May Start of phase 1 bridging study wih Galapagos evaluating a subcutaneous formulation of MOR106 in September Exclusive global license agreement with Novartis signed together with Galapagos for further development of MOR106 in atopic dermatitis and potentially other indications MOR107 Preclinical investigation in oncology indications ongoing Exclusive strategic collaboration and regional licensing agreement for MOR210 with I-Mab Biopharma for development and commercialization in China, Hong Kong, Macao, Taiwan and South Korea Continuation of antibody discovery programs

Operating and Financial Review and Prospects Group Management Report 61 2018 Targets 2018 Results Partnered Discovery Progress of partnered development programs Increasing number of partnered programs (103 programs) as maturity progresses Guselkumab (Tremfya®, partner: Janssen): Further marketing approval for the treatment of moderate to severe plaque psoriasis in Brazil, Australia, South Korea and Japan as well as for psoriatic arthritis in Japan (April) and for the treatment of patients with palmoplantar pustulosis in Japan (November) Start of phase 2/3 program (GALAXI) in Crohn’s disease (July) Start of phase 3 trial (PROTOSTAR) in pediatric psoriasis patients (September) Start of a phase 2 study in patients with moderate to severe hidradenitis suppurativa (HS) (November) Data from phase 3 head-to-head study ECLIPSE demonstrated superiority of guselkumab (Tremfya®) vs. secukinumab (Cosentyx®) in the treatment of plaque psoriasis (December) Partner Roche started two new phase 3 trials of gantenerumab in patients with early Alzheimer’s disease (June) Expansion of existing strategic alliance with LEO Pharma to include peptide-derived therapeutics with the objective of identifying novel, peptide-derived therapeutics for unmet medical needs (September) Partner GSK reported data from phase 2 BAROQUE clinical study of GSK3196165 (formerly MOR103) in rheumatoid arthritis (RA) at ACR conference (October) The Management Board’s General Assessment Of Business Performance The 2018 financial year was marked by both operational highlights as well as positive events among our development programs. The successful Nasdaq listing in April strengthened our financial position and gave us more flexibility to allocate our resources. Moreover, the IPO enhanced our visibility in the U.S., which was further increased by the foundation of our wholly owned subsidiary MorphoSys US Inc. With this, we followed our plan to build a strong U.S. presence as preparation for the planned commercialization of MOR208, our antibody for the treatment of hematological malignancies, which was definitely the key focus during the reporting year. Driven by positive data from our L-MIND trial and encouraged by our ongoing discussions with the FDA we followed our plan to bring the antibody to the U.S. market as fast as possible, pending FDA approval. Revenues in the 2018 financial year increased to € 76.4 million, and EBIT amounted to € –59.1 million. The increase in revenues and the improved operating result compared to the previous year were the result of our exclusive license agreement for MOR106, which we and our partner Galapagos signed with Novartis Pharma AG in July thereby covering the further development and commercialization of our joint program MOR106. This agreement resulted in an upfront payment of € 47.5 million, which prompted us to raise our financial forecast for the 2018 financial year. Moreover, guselkumab (Tremfya®) sales grew rapidly during 2018 resulting in royalty payments with strong year-on-year growth as compared to 2017. The net cash outflow from operating activities amounted to € 33.3 million, which was the result of the planned expenses for proprietary research and development. Our equity ratio of 91 % and liquid funds of € 454.7 million are a confirmation of the strength of the Company’s financial resources. FINANCIAL STATEMENTS

Group Management Report Operating and Financial Review and Prospects 62 Our other Proprietary Development and Partnered Discovery programs made great progress in 2018. For MOR202, we presented final data from our phase 1/2a trial in multiple myeloma at ASH. Our partner I-Mab submitted an investigational new drug application for MOR202 in MM in China in August and we expect them to start pivotal trials soon. We ourselves are not pursuing the further development in MM without a partner, but of course we continue to support I-Mab in their development of MOR202 in Greater China. We made progress evaluating potential options for MOR202 in other indications, such as autoimmune diseases, while we stopped the clinical development plans in NSCLC. For GSK3196165 (formerly MOR103), GSK presented data from their phase 2 trial in rheumatoid arthritis at the ACR conference in October, where they also announced plans to continue clinical development in this indication. Building on our existing collaboration with I-Mab Biopharma for MOR202 for China and certain other Asian territories, we entered into an exclusive strategic collaboration and regional licensing agreement for MOR210, a preclinical-stage antibody directed against C5aR, which has potential to be developed as an immuno-oncology agent. We were also pleased to report successes of our Partnered Programs. Guselkumab (Tremfya®), developed by our partner Janssen and the first approved and marketed therapeutic antibody based on MorphoSys’s proprietary technology, was granted marketing authorization in several additional countries during 2018, including Japan. Janssen continued to develop guselkumab (Tremfya®) in several additional indications and reported positive long-term data in plaque psoriasis. We were very pleased about the data from the ECLIPSE trial reported by Janssen in December showing superiority of guselkumab (Tremfya®) versus secukinumab (Cosentyx®) for the treatment of plaque psoriasis. Our partner Roche initiated two new phase 3 trials with gantenerumab, the antibody against amyloid-beta, which is being developed by Roche for the treatment of Alz-heimer’s disease patients. By the end of the year, our pipeline comprised a total of 115 drug candidates (103 proprietary and 12 partnered programs), 29 of which are in clinical development.
Outlook and Forecast Group Management Report 63 Outlook and Forecast MorphoSys’s business model is focused on developing innovative drug candidates derived from its proprietary technologies, such as the HuCAL and Ylanthia antibody libraries. We develop drug candidates both on a proprietary basis and together with partners with the goal of giving patients access to better treatment alternatives. Our proprietary development activities focus mainly on oncology compounds, which we aim to bring to market and commercialize. We continue to concentrate on further developing our technologies in the fast-growing, innovation-driven areas of the life sciences sector as the foundation of our business model. General Statement on Expected Development MorphoSys’s strategic focus is on the development of innovative drugs to improve the lives of patients suffering from serious diseases. The development of MOR208, our most advanced drug candidate, for the treatment of certain forms of blood cancer, is currently our top priority. Our continued investment in the development of validated and innovative technology platforms is an important basis for our business. In the Partnered Discovery segment, the commercialization of our technologies provides contractually secured cash flows from our partnerships with pharmaceutical companies. The Management Board expects, among others, the following developments in 2019: Complete the L-MIND trial and submit the filing package by end of the year for approval at the FDA Continue to build capabilities in the U.S. in order to prepare for commercialization of MOR208 there pending regulatory approval and explore commercialization options in other geographies. Continue the development of other proprietary drug candidates such as MOR202 and MOR106 and support our partners in the development of these compounds. Continue to participate in the development of our partners’ drug candidates through the receipt of success-based revenues such as milestone payments or royalties on commercialized product sales and continue to invest these funds into the development of our proprietary programs. Evaluate new strategic agreements based on proprietary technologies focused on gaining access to innovative target molecules and compounds. Continue expansion of proprietary development activities through potential in-licensing, company acquisitions, co-development and new proprietary development activities. Invest in the development of proprietary technologies to maintain and expand our position in therapeutic antibodies and related technologies. Strategic Outlook MorphoSys plans to invest a substantial portion of its financial resources in proprietary R&D for the foreseeable future. The Management Board believes this is the best route to increasing the Company’s value for the long term. We plan to advance our portfolio of proprietary development candidates and further strengthen our technology platform. Revenues from R&D funding, royalties, license and milestone payments and a strong liquidity position should allow us to continue expanding our proprietary drug and technology development. In our Proprietary Development segment, we will continue developing therapeutic antibodies and peptides for our own account. We concentrate on oncology, but also explore our drug candidates in other disease areas such as inflammatory or autoimmune disorders if opportunities arise. Decisions to enter into alliances with other companies to co-develop our proprietary candidates or to outlicense them, either globally or for certain geographies, are made on a case-by-case basis. It has become an increasingly integral part of our strategy to retain projects in proprietary development in-house until later states of clinical development or even until commercialization. Our main focus is currently developing MOR208 towards a potential regulatory approval and to preparing commercialization capabilities for MOR208 in selected geographies, in particular the U.S. FINANCIAL STATEMENTS

Group Management Report Outlook and Forecast 64 Our Partnered Discovery segment generates contractually secured cash flows based on various partnerships with pharmaceutical companies. The majority of development candidates in recent years stemmed from our partnership with Novartis. Although this partnership ended in accordance with the contract in November 2017, we expect that drug candidates under this and other partnerships will continue to be developed and may lead to additional milestone payments and royalties in the future. In 2017, Tremfya®, developed and marketed by Janssen, became the first antibody from our partnered discovery business to reach the market. We expect that Tremfya® will continue to provide the bulk of our royalty revenue for the foreseeable future. Based on its breadth, the partnered pipeline is expected to generate further marketable therapeutic antibodies in the future. Should these be successful, the Company’s financial participation in the form of royalties on product sales would increase. Expected Economic Development In its January 2019 report, the International Monetary Fund (IMF) projected global economic growth of 3.5 % in 2019, compared to 3.7 % forecast for 2018. Growth in advanced economies is anticipated to be 2.0 % in 2019, compared to a forecast growth of 2.3 % for 2018. The IMF expects growth in in the euro area to decline to 1.6 % in 2019 compared to the 1.8 % forecast for 2018. Growth rates have been marked down for many economies, including Germany. The IMF expects growth in Germany to be 1.3 % in 2019 (2018E: 1.5 %); this decrease is due to soft private consumption, weak industrial production following the introduction of revised auto emission standards and subdued foreign demand. The IMF is projecting U.S. economic growth in 2019 to be 2.5 % (and soften further to 1.8 % in 2020) compared to expected growth of 2.9 % in 2018 with the unwinding of fiscal stimulus and as the federal funds rate temporarily overshoots the neutral rate of interest. Nevertheless, the projected pace of expansion is above the U.S. economy’s estimated potential growth rate in both years. Strong domestic demand growth will support rising imports and contribute to a widening of the U.S. current account deficit. According to the IMF, growth in emerging and developing countries in 2019 is expected to be 4.5 % (2018E: 4.6 %). Growth in China is projected to reach 6.2 % in 2019 (2018E: 6.6 %) while Russia is expected to grow 1.6 % compared to growth of 1.7 % in 2018. Brazil is also expected to experience positive growth, projected at 2.5 % for 2019 (2018E: 1.3 %). Expected Development of the Life Sciences Sector According to research by BioCentury, two-thirds of biotech companies could be facing a cash crunch in 2019 if the markets remain difficult. While investors do not expect capital availability to be a problem, they think the rising cost of capital might mean employing alternative financing structures to help biotechs extend their runway. Investors and bankers contacted by BioCentury believe that most of the financial market issues facing the biotech sector in 2019 have nothing to do with industry fundamentals but that macro-economic forces have driven a shift toward a risk-off sentiment. The fourth quarter of 2018 was one of the worst quarters for biotech indexes in over 16 years, and investors see little reason to think the sentiment will change in the near-term. One bright spot is the string of M&A events that kicked off 2019 that could draw investors back to the sector. But short of an M&A spending spree, investors expect cost of capital may be one of the most important areas of focus in 2019. Investors are holding a relatively bleak outlook for the sector in 2019, with enough reason to worry from the last three months, which saw biotech enter a bear market. On the positive side, the number of new FDA product approvals reached an all-time high of 59 in 2018. Despite this, investors are wary about companies’ ability to effectively commercialize products once approved, as revenue trajectories, particularly from small and mid-cap companies, have not met projections. Future Research and Development and Expected Business Performance PROPRIETARY DEVELOPMENT The Company’s R&D budget for proprietary drug and technology development in the 2019 financial year is expected to be in the range of € 95 million to € 105 million. The majority of investment will fund the development of our proprietary drug candidates MOR208, MOR202 and our discovery efforts. The lion’s share of that funding will be dedicated to the clinical development of MOR208. Further investment will be made in the areas of target molecule validation as well as antibody and technology development. We will also continue to seek collaborations with partners such as academic institutions to gain access to new target molecules and technologies.
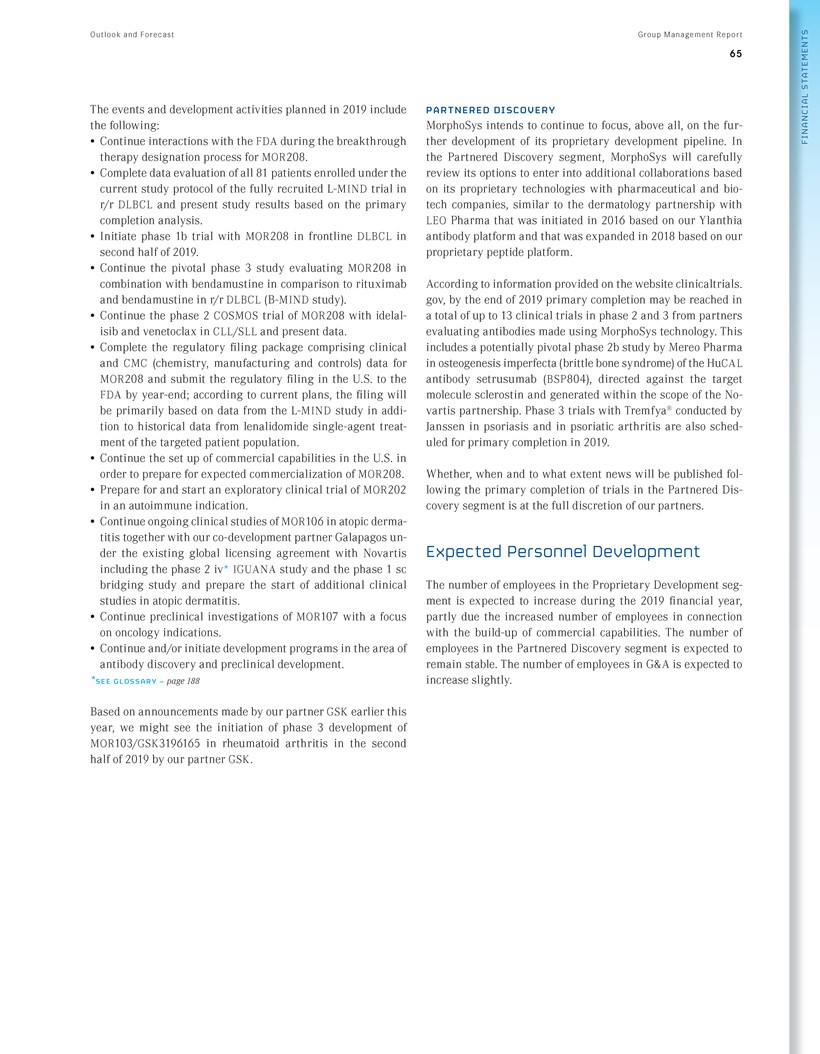
Outlook and Forecast Group Management Report 65 The events and development activities planned in 2019 include the following: • Continue interactions with the FDA during the breakthrough therapy designation process for MOR208. • Complete data evaluation of all 81 patients enrolled under the current study protocol of the fully recruited L-MIND trial in r/r DLBCL and present study results based on the primary completion analysis. Initiate phase 1b trial with MOR208 in frontline DLBCL in second half of 2019. Continue the pivotal phase 3 study evaluating MOR208 in combination with bendamustine in comparison to rituximab and bendamustine in r/r DLBCL (B-MIND study). Continue the phase 2 COSMOS trial of MOR208 with idelal-isib and venetoclax in CLL/SLL and present data. Complete the regulatory filing package comprising clinical and CMC (chemistry, manufacturing and controls) data for MOR208 and submit the regulatory filing in the U.S. to the FDA by year-end; according to current plans, the filing will be primarily based on data from the L-MIND study in addition to historical data from lenalidomide single-agent treatment of the targeted patient population. Continue the set up of commercial capabilities in the U.S. in order to prepare for expected commercialization of MOR208. Prepare for and start an exploratory clinical trial of MOR202 in an autoimmune indication. Continue ongoing clinical studies of MOR106 in atopic dermatitis together with our co-development partner Galapagos under the existing global licensing agreement with Novartis including the phase 2 iv* IGUANA study and the phase 1 sc bridging study and prepare the start of additional clinical studies in atopic dermatitis. Continue preclinical investigations of MOR107 with a focus on oncology indications. Continue and/or initiate development programs in the area of antibody discovery and preclinical development. *SEE GLOSSARY – page 188 Based on announcements made by our partner GSK earlier this year, we might see the initiation of phase 3 development of MOR103/GSK3196165 in rheumatoid arthritis in the second half of 2019 by our partner GSK. PARTNERED DISCOVERY MorphoSys intends to continue to focus, above all, on the further development of its proprietary development pipeline. In the Partnered Discovery segment, MorphoSys will carefully review its options to enter into additional collaborations based on its proprietary technologies with pharmaceutical and bio-tech companies, similar to the dermatology partnership with LEO Pharma that was initiated in 2016 based on our Ylanthia antibody platform and that was expanded in 2018 based on our proprietary peptide platform. According to information provided on the website clinicaltrials. gov, by the end of 2019 primary completion may be reached in a total of up to 13 clinical trials in phase 2 and 3 from partners evaluating antibodies made using MorphoSys technology. This includes a potentially pivotal phase 2b study by Mereo Pharma in osteogenesis imperfecta (brittle bone syndrome) of the HuCAL antibody setrusumab (BSP804), directed against the target molecule sclerostin and generated within the scope of the No-vartis partnership. Phase 3 trials with Tremfya® conducted by Janssen in psoriasis and in psoriatic arthritis are also scheduled for primary completion in 2019. Whether, when and to what extent news will be published following the primary completion of trials in the Partnered Discovery segment is at the full discretion of our partners. Expected Personnel Development The number of employees in the Proprietary Development segment is expected to increase during the 2019 financial year, partly due the increased number of employees in connection with the build-up of commercial capabilities. The number of employees in the Partnered Discovery segment is expected to remain stable. The number of employees in G&A is expected to increase slightly. FINANCIAL STATEMENTS
Group Management Report Outlook and Forecast 66 Expected Development of the Financial Position and Liquidity MorphoSys had financial resources of € 454.7 million at the end of the 2018 financial year. Revenues in the 2019 financial year are expected to be below those achieved in 2018. The main reason for this expected decline is a positive one-time effect in 2018, namely the upfront payment of € 47.5 million received from Novartis in connection with a global licensing deal for MOR106. The Management Board is projecting Group revenues of € 43 million to € 50 million in the 2019 financial year. Revenues are expected to include royalty income from Tremfya® ranging from € 23 million to € 30 million at constant US$ currency. This forecast does not take into account revenues from future collaborations and/or licensing agreements. R&D expenses for proprietary programs and technology development are expected to reach € 95 million to € 105 million in 2019. Most of these expenses in the Proprietary Development segment will arise from the development of MOR208, MOR202 and from our early-stage development programs, with the lion’s share expected to stem from clinical development of MOR208. R&D expenses for the Partnered Discovery segment are expected to be lower than in the prior year. MorphoSys will continue to build commercial structures in the U.S. in preparation for the potential commercialization of MOR208 pending regulatory approval and therefore expects to incur a significant amount of selling expenses in the low to mid double-digit million euro range for 2019. The Company expects EBIT of approximately € –127 million to € –137 million in 2019. This guidance does not include a potential larger milestone for the start of a phase 3 clinical trial for MOR103/GSK3196165 that could occur in the course of 2019. The guidance also does not include revenues from potential future partnership or licensing agreements for MOR208 or any other compound that is in MorphoSys’s proprietary development. Effects from potential in-licensing or co-development deals for new development candidates are also not included in the guidance. The Partnered Discovery segment is expected to generate a positive operating result in 2019 which will exceed the result of the previous year. The Proprietary Development segment is expected to report a substantially more negative EBIT compared to the previous year due to the one-time effect in 2018 from the payment in the amount of € 47.5 million related to the MOR106 license agreement with Novartis Pharma AG and due to the continued high level of R&D expenditures on proprietary programs. In the years ahead, one-time events, such as the in-licensing and out-licensing of development candidates and larger milestone payments and royalties from the market maturity of HuCAL and Ylanthia antibodies could have an impact on the Company’s net assets and financial position. Such events could cause financial targets to change significantly. Similarly, failures in drug development could have negative consequences for the MorphoSys Group. Revenue growth in the near to medium term will depend on the Company’s ability to out-license its proprietary programs and/or enter into new partnerships as well as to secure regulatory approval for, launch and successfully commercialize its first proprietary program MOR208. In addition, revenues should increasingly benefit from royalties based on sales of Tremfya® (guselkumab). At the end of the 2018 financial year, MorphoSys had liquidity of € 454.7 million (December 31, 2017: € 312.2 million). The loss projected for 2019 will cause a decline in liquidity. MorphoSys sees its solid cash position as an advantage that can be used to accelerate its future growth through strategic activities such as the in-licensing of compounds and partnering with promising companies. Available liquidity can also be used to fund research and development expenses for the Company’s proprietary portfolio of therapeutic antibodies. Dividend In the separate financial statements of MorphoSys AG, prepared in accordance with German Generally Accepted Accounting Principles (German Commercial Code), the Company is reporting an accumulated deficit, which prevents it from distributing a dividend for the 2018 financial year. In view of the anticipated losses in 2019, the Company expects to continue to report an accumulated loss for the 2019 financial year. MorphoSys will invest further in the development of proprietary drugs and the set up of commercial capabilities in the U.S. and will potentially pursue additional in-licensing and acquisition transactions to open up new growth opportunities and increase the Company’s value. Based on these plans, the Company does not expect to pay a dividend in the foreseeable future. This outlook takes into account all known factors at the time of preparing this report and is based on the Management Board’s assumptions of events that could influence the Company in 2019 and beyond. Future results may differ from the expectations described in the section entitled “Outlook and Forecast.” The most significant risks are described in the risk report.

Shares and the Capital Market Group Management Report 67 Shares and the Capital Market MorphoSys AG shares opened the reporting year at a share price of € 76.58. After a solid start in the first weeks of 2018, the share price dropped in line with the TecDax due to weak trends observed on Wall Street affecting the European markets and MorphoSys’s share reached its low for the year of € 72.05 mid-February. The shares then trended higher in line with the TecDAX before breaking out in April after the Company announced the initial public offering in the United States and the listing of ADSs on the Nasdaq Global Market. From April 9 on, the share price constantly increased, far outpacing the benchmark index. The dual listing as well as positive news flow, such as approval of Tremfya® for plaque psoriasis in new regions and also for psoriatic arthritis in Japan received by Janssen in June as well as the global licensing agreement with Novartis and Galapagos for MOR106 mid-July, drove MorphoSys shares to a high of €122.20 on July 24. Thereafter, the worldwide stock markets were affected by the U.S. trade war with China and by the jump in returns in the U.S. Moreover, the European Market was marked by insecurities due to the banking crisis in Italy, with all causing a continuous decline for both the TecDAX as well as the MorphoSys shares. This resulted in a low of € 77.75 on October 26. Of note, MorphoSys shares were included into the MDAX as of September 24 while remaining part of the TecDAX segment. The simultaneous inclusion in both indices, MDAX and TecDAX, was based on the reorganization of the index rules of Deutsche Börse, the existing separation into the Tech and Classic segments having been removed. While both the TecDAX and MDAX declined further in the course of the year, MorphoSys’s share price again increased from the beginning of November and closed the financial year at € 88.95, amounting to a share price increase of 16 % and a market capitalization of € 2.8 billion . MorphoSys AG shares therefore clearly outperformed the development of the relevant indices, namely the Nasdaq Biotech-nology Index (–9 %), the MDAX (–18 %) and the TecDAX (–3 %) in 2018 . ›› SEE FIGURE 11 – Performance of the MorphoSys Share in 2018 (page 68) ›› SEE FIGURE 12 – Performance of the MorphoSys Share 2014–2018 (page 68) Stock Market Development 2018 was a difficult year on the stock markets. For the first time since 2011, the leading German index DAX was down significantly at about –18 %. Concerns about a slowdown in the global economy, the trade dispute between the USA and China, and the approaching Brexit in March have had a greater impact on the German stock markets than on the U.S. markets. However, the Dow Jones index also ended the year down roughly 6 %. Bio-tech shares did not manage to escape this negative stock market environment and also had to face falling prices. During the reporting year, MorphoSys continued to increase its investor relations activities both in Europe and with a growing focus also in the United States following the listing on the Nasdaq Global Market. Liquidity and Index Membership The average daily trading volume in MorphoSys shares on all regulated trading platforms increased by about 45 % in 2018, reaching a volume of € 22.5 million (2017: € 15.6 million). The average daily trading volume on the TecDAX, which contains the 30 largest technology stocks on the Frankfurt Stock Exchange, rose 93 %. In addition, in 2018 MorphoSys shares were included for the first time in the German MDAX index, which comprises the 60 largest companies in terms of market capitalization and turnover on the Frankfurt Stock Exchange behind those that make up the DAX. By the end of 2018, MorphoSys ranked 10th in the TecDAX in terms of market capitalization (2017: 10th) and 14th in terms of trading volume (2017: 12th). In the MDAX, MorphoSys shares ranked 59th in terms of market capitalization and 65th in terms of trading volume (the rank refers to DAX (30) and MDAX (60) listed companies). The average daily trading volume in MorphoSys shares on alternative trading platforms (“dark pools”) in 2018 was approximately € 16.2 million, or 173,000 shares (2017: approx. 98,700 shares valued at € 6.3 million), representing a year-on-year increase of 156 %. Market Information Our shares have been trading on the Frankfurt Stock Exchange under the symbol “MOR” since 1999. On April 23, 2018 we announced the closing of our initial public offering (IPO) in the United States through an ADS offering. The ADSs are listed on the Nasdaq Global Market under the symbol “MOR.” The following table sets forth for the periods indicated the reported high and low closing sale prices per ordinary share in Xetra trading in euros on the Frankfurt Stock Exchange as well as per ADS in US dollars traded on Nasdaq. FINANCIAL STATEMENTS
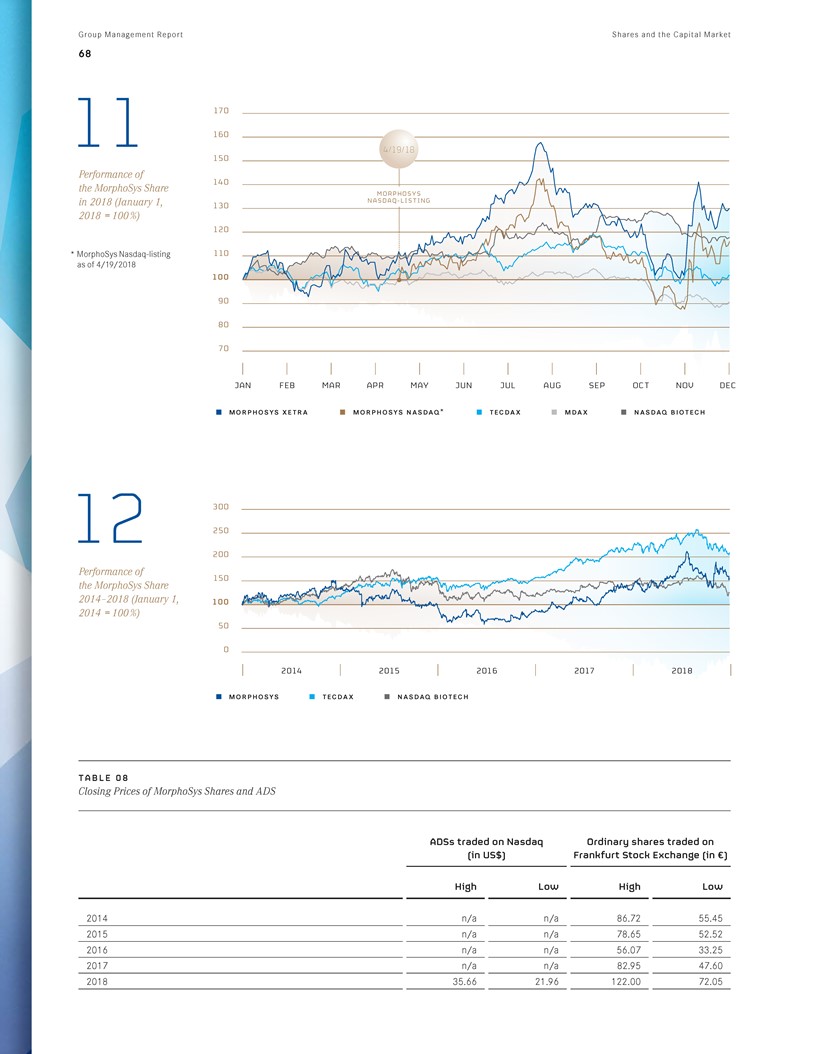
Group Management Report Shares and the Capital Market 68 11 Performance of the MorphoSys Share in 2018 (January 1, 2018 = 100 %) * MorphoSys Nasdaq-listing as of 4/19/2018 170 160 4/19/18 150 140 MORPHOSYS NASDAQ - LISTING 130 120 110 100 90 80 70 JAN FEB MAR APR MAY JUN JUL AUG SEP OCT NOV DEC morphosys xetra morphosys nasdaq* tecdax mdax nasdaq biotech 12 Performance of the MorphoSys Share 2014–2018 (January 1, 2014 = 100 %) 300 250 200 150 100 50 0 2014 2015 2016 2017 2018 morphosys tecdax nasdaq biotech TABLE 08 Closing Prices of MorphoSys Shares and ADS ADSs traded on Nasdaq (in US$) Ordinary shares traded on Frankfurt Stock Exchange (in €) High Low High Low 2014 n/a n/a 86.72 55.45 2015 n/a n/a 78.65 52.52 2016 n/a n/a 56.07 33.25 2017 n/a n/a 82.95 47.60 2018 35.66 21.96 122.00 72.05

Shares and the Capital Market Group Management Report 69 Common Stock The Company’s common stock increased to 31,839,572 shares, or € 31,839,572, in the reporting year mainly due to a capital increase in connection with the initial public offering (IPO) on the Nasdaq Stock Market. In April 2018, MorphoSys successfully completed the IPO on the Nasdaq Stock Market, generating gross proceeds of US$ 239,006,800. The transaction was executed in two consecutive capital increases from Authorized Capital 2017-II, excluding the subscription rights of existing shareholders. Initially, 2,075,000 new ordinary shares were issued as part of a basic offering in the form of 8,300,000 American Depositary Shares (“ADS”). This was followed by the full exercise of an option granted to the underwriters to acquire a further 311,250 new ordinary shares in the form of 1,245,000 ADSs. The price was US$ 25.04 per ADS in both transactions. Each ADS represents 1/4 of a MorphoSys ordinary share. The new ordinary shares underlying the ADSs in the basic offer and the option exercised by the underwriters correspond to approximately 8.1 % of the common stock of MorphoSys prior to the capital increases from Authorized Capital 2017-II. Another reason for the increase in the Company’s common stock was the exercise of convertible bonds granted to the Management Board and the Senior Management Group. A detailed description of the convertible bond program can be found in the Notes (Item 7.2). TABLE 09 Key Data for the MorphoSys Share (December 31) 2018 2017 2016 2015 2014 Total stockholders’ equity (in million €) 488.4 358.7 415.5 362.7 348.8 Number of shares issued (number) 31,839,572 29,420,785 29,159,770 26,537,682 26,456,834 Market capitalization (in million €) 2,832 2,253 1,422 1,530 2,027 Closing price in € (Xetra) 88.95 76.58 48.75 57.65 76.63 Average daily trading volume (in million €) 22.5 15.6 9.7 14.9 11.9 Average daily trading volume (in % of common stock) 0.77 0.83 0.78 0.87 0.65 International Investor Base Various voting right notifications were issued during the reporting year in accordance with Section 26 (1) of the German Securities Trading Act (WpHG). These notifications were published on the MorphoSys website and can be found under Media and Investors – Stock Information – Recent Voting Rights Notifications. According to the definition given by the Deutsche Börse, the free float in MorphoSys AG’s shares was 99.11 % at the end of the reporting year. Annual General Meeting The Management and Supervisory Boards of MorphoSys AG welcomed shareholders to the Company’s 20th Annual General Meeting (AGM) in Munich on May 17, 2018. The shareholders and proxies attending represented more than 60.7 % of the common stock of MorphoSys AG (2017: 54.0 % of the common stock represented). All resolution proposals of the management were approved with the required majority of votes. At the close of the 2018 AGM, the terms of office of Supervisory Board members Dr. Gerald Möller and Dr. Marc Cluzel ended. Klaus Kühn resigned from the Supervisory Board for personal reasons at the end of the 2018 AGM. The Annual General Meeting re-elected Dr. Marc Cluzel and newly elected Dr. George Golumbeski and Michael Brosnan to the Company’s Supervisory Board. In its constitutive meeting following the AGM, the Supervisory Board elected Dr. Marc Cluzel as its new chairman and Dr. Frank Morich as vice chairman. FINANCIAL STATEMENTS
Group Management Report Shares and the Capital Market 70 Dividend Policy We have not paid any dividends on our ordinary shares since our inception, and we currently intend to retain any future earnings to finance the growth and development of our business. Therefore, we do not anticipate that we will declare or pay any cash dividends in the foreseeable future. Except as required by law, any future determination to pay cash dividends will be at the discretion of our Management Board and Supervisory Board and will be dependent upon our financial condition, results of operations, capital requirements, and other factors our Management Board and Supervisory Board deem relevant. Investor Relations Activities At the beginning of December, the Company held an Investor and Analyst Event in New York City dedicated to MOR208, immediately following the 60th ASH conference in San Diego. During this event, the latest L-MIND data were presented and the Company gave an outlook on the planned filing strategy. Following the presentation, participants were given an opportunity to address questions to the management. The event was also webcast, making it accessible to interested parties worldwide. A total of more than 100 investors, analysts and shareholders watched the Management Board’s presentations. MorphoSys also took part in over 20 international investor conferences. Several roadshows were held at various locations in both Europe and the USA. The strongest interest continued to be in the United States where a large number of specialized healthcare investors are located. Following the listing on Nasdaq in April, we estimate that nearly 50 % of MorphoSys AG shares are meanwhile held by U.S. institutional investors. The Management Board also held conference calls in conjunction with the publication of the annual, half-yearly and quarterly results to report past and expected business developments and answer questions from analysts and investors. The development of our lead product candidate MOR208, the general progress of our proprietary portfolio and the partnered pipeline were the topics in investor discussions. A total of 14 analysts covered MorphoSys shares at the end of 2018. TABLE 10 Analyst Recommendations (December 31, 2018) Buy/Overweight/Market Outperform Hold/Neutral Reduce/Underperform 7 5 2 Detailed information on MorphoSys shares, financial ratios, the Company’s strategic direction and the Group’s recent developments can be found on the Company’s website (Media and Investors).
Sustainable Business Development Group Management Report 71 Sustainable Business Development We are aware of our responsibility to present and future generations and see sustainable behavior as a prerequisite for long-term business success. As a biotechnology company conducting both research and drug development, observing the highest ecological, social and ethical standards is a top priority and a key component of our corporate culture. The following section describes our sustainability strategy and the activities carried out during the reporting year that represent non-financial performance indicators. The financial performance indicators are presented in the section “Operating and Financial Review and Prospects.” Information on our management structure and corporate governance practices can be found in the Corporate Governance Report. Sustainable Corporate Management Sustainability is a hallmark of our corporate management and plays a major role in the pursuit of corporate goals and in contributing value to society. This applies to the short- and long-term objectives of all levels of management and is reflected in our core task of developing even more effective and safer drugs. To ensure lasting business success, we incorporate environmental and social responsibility into our daily business and base our business model on sustainable growth that protects the interests of our shareholders, creates long-term value and weighs our actions in terms of their impact on the environment, society, patients and employees. Internally, this business model is reflected in a progressive human resources policy that takes employees’ needs seriously. Our long-term and sustainable business success rests on innovative research and development to meet the major challenge of providing comprehensive healthcare in the future. Due to a growing and aging population, biotechnology-derived drugs represent a growing portion of the overall healthcare system. In the opinion of management, all aspects of our current business model support the sustainable investment interests of our shareholders. A comprehensive risk management system ensures that factors that could threaten sustainable corporate performance are identified early and corrected if necessary. We only accept risk when there is an opportunity to increase our enterprise value. At the same time, great effort is made to systematically identify new opportunities and leverage our business success (more information on risks and opportunities can be found on page 76). Group-wide compliance with the sustainability strategy is monitored by the entire Management Board, with primary responsibility assigned to the Chief Financial Officer. The sustainability strategy is based on the Company’s Credo, which contains the ethical principles forming the foundation of all activities of MorphoSys and its employees. The Credo is developed further by our Code of Conduct. The Compliance Committee consists of six members and is available to employees at all times. The Compliance Officer, who is also a member of the committee, coordinates the elements of MorphoSys’s Compliance Management System. More information on this subject can be found on page 107 of the Corporate Governance Report. Employees can ask for advice on all matters concerning compliance and report any suspected violations. If preferred, this may be done on an anonymous basis. Violations are systematically pursued, and appropriate remedial action is taken. No such violations have been reported to date. Detailed information on the KPIs for sustainable development used by MorphoSys is provided in the section “Strategy and Group Management” (page 25). The following report on the implementation of our corporate strategy and the Company’s sustainable business development is based on the recommendations of the German Sustainability Code originally presented by the Council for Sustainable Development in October 2011 and last updated in 2017. Non-Financial Performance Indicators ETHICAL STANDARDS AND COMMUNICATION WITH STAKEHOLDERS The highest scientific and ethical principles for conducting human clinical trials and animal testing are anchored in our Code of Conduct. Strict compliance with applicable national and international regulations is mandatory for all MorphoSys employees and sub-contractors. As European and international legislation requires animal testing to determine the toxicity, pharmacokinetics and pharmaco-dynamics* of drug candidates, the biotechnology industry cannot forgo this type of testing. Animal testing for our drug candidates is outsourced to contract research organizations (CROs) as we do not have laboratories suitable for this type of research. As part of our product development activities, we award animal experiments in accordance with the 3Rs principles of animal welfare (Replace, Reduce, Refine) as laid down FINANCIAL STATEMENTS
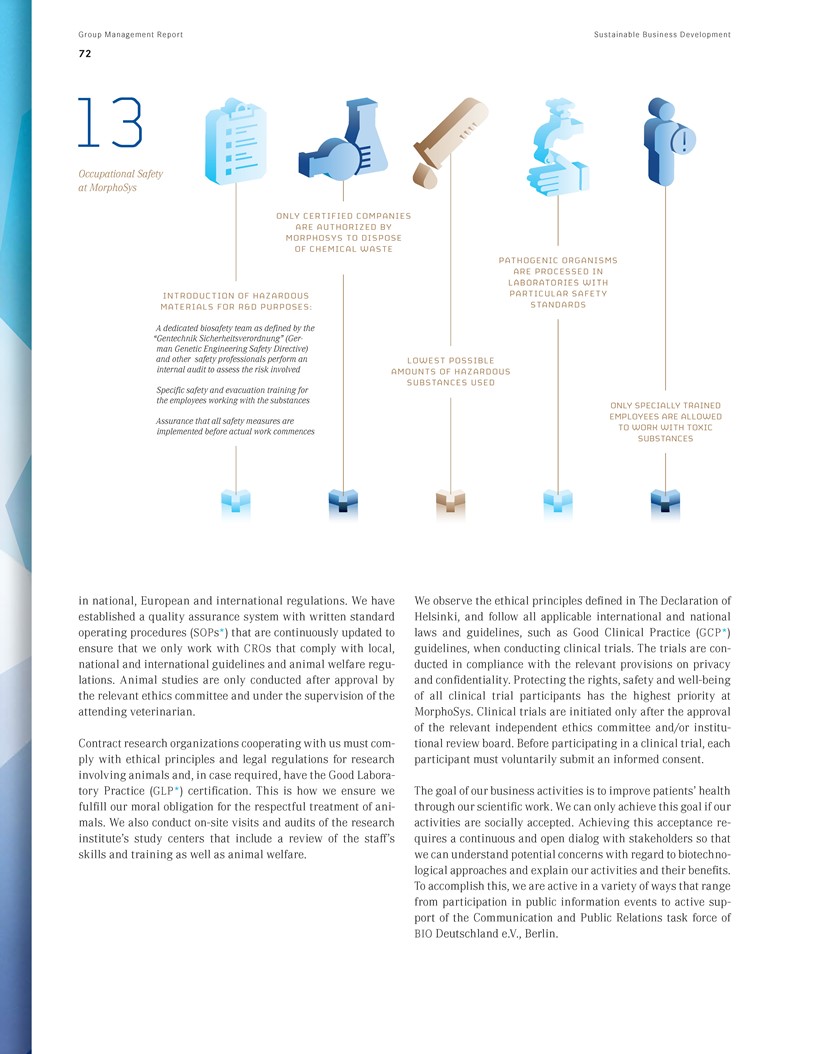
Occupational Safety at MorphoSys Group Management Report 72 Sustainable Business Development ONLY CERTIFIED COMPANIES ARE AUTHORIZED BY MORPHOSYS TO DISPOSE OF CHEMICAL WASTE PATHOGENIC ORGANISMS ARE PROCESSED IN LABORATORIES WITH PARTICULAR SAFETY STANDARDS INTRODUCTION OF HAZARDOUS MATERIALS FOR R&D PURPOSES : A dedicated biosafety team as defined by the “Gentechnik Sicherheitsverordnung” (German Genetic Engineering Safety Directive) and other safety professionals perform an internal audit to assess the risk involved Specific safety and evacuation training for the employees working with the substances Assurance that all safety measures are implemented before actual work commences LOWEST POSSIBLE AMOUNTS OF HAZARDOUS SUBSTANCES USED ONLY SPECIALLY TRAINED EMPLOYEES ARE ALLOWED TO WORK WITH TOXIC SUBSTANCES in national, European and international regulations. We have established a quality assurance system with written standard operating procedures (SOPs*) that are continuously updated to ensure that we only work with CROs that comply with local, national and international guidelines and animal welfare regulations. Animal studies are only conducted after approval by the relevant ethics committee and under the supervision of the attending veterinarian. Contract research organizations cooperating with us must comply with ethical principles and legal regulations for research involving animals and, in case required, have the Good Laboratory Practice (GLP*) certification. This is how we ensure we fulfill our moral obligation for the respectful treatment of animals. We also conduct on-site visits and audits of the research institute’s study centers that include a review of the staff’s skills and training as well as animal welfare. We observe the ethical principles defined in The Declaration of Helsinki, and follow all applicable international and national laws and guidelines, such as Good Clinical Practice (GCP*) guidelines, when conducting clinical trials. The trials are conducted in compliance with the relevant provisions on privacy and confidentiality. Protecting the rights, safety and well-being of all clinical trial participants has the highest priority at MorphoSys. Clinical trials are initiated only after the approval of the relevant independent ethics committee and/or institutional review board. Before participating in a clinical trial, each participant must voluntarily submit an informed consent. The goal of our business activities is to improve patients’ health through our scientific work. We can only achieve this goal if our activities are socially accepted. Achieving this acceptance requires a continuous and open dialog with stakeholders so that we can understand potential concerns with regard to biotechnological approaches and explain our activities and their benefits. To accomplish this, we are active in a variety of ways that range from participation in public information events to active support of the Communication and Public Relations task force of BIO Deutschland e.V., Berlin.

Sustainable Business Development Group Management Report FINANCIAL STATEMENTS 73 PROCUREMENT Our Central Purchasing and Logistics Department is responsible for negotiating and purchasing goods and services. The department is continuing to improve the efficiency of procurement management systems and processes including the introduction of electronic approval processes. Also, during this year, a new ERP system has been developed to address our future needs. For more details, please see section “Information Technology” on page 105. ENVIRONMENTAL PROTECTION AND OCCUPATIONAL SAFETY Because the biotechnology industry is subject to stringent regulatory requirements, environmental protection and occupational safety are important tasks for us. Our Technical Operations Department and its subsections monitor our compliance with all relevant requirements. In addition to strict compliance with all legal requirements, we make a tremendous effort to maintain sustainable environmental management and the effective protection of our employees. We offer employees an extensive range of preventative health-care options. A sample of these options can be found in the section entitled “Human Resources” (page 75). With two reportable occupational accidents in 2018, the number of accidents remained at a very low level, placing our ratio of reportable accidents significantly below the average ratio in the German chemical industry (14.6 reportable occupational accidents as defined by the employers’ liability insurance association BG RCI per 1,000 full-time employees in the latest survey conducted in 2017). We try to minimize the amount of harmful substances used in our laboratories. Only specific employees who are specially trained are allowed to work with toxins. Work involving contagious pathogens can only be carried out in secure laboratories. We only use certified companies to dispose of chemical waste and also refrain from radioactive substances. ›› SEE FIGURE 13 – Occupational Safety at MorphoSys (page 72) QUALITY ASSURANCE Biopharmaceutical companies bear a special responsibility to comply with the highest quality and safety standards. We follow detailed procedures and stringent rules in drug development to minimize safety risks for patients and ensure the quality of the investigational medicinal products, integrity and reliability of the data generated. To control and regulate these processes in our own drug development activities, we implemented an integrated quality management system that complies with the applicable principles of Good Manufacturing Practice (GMP*), Good Clinical Practice (GCP), Good Laboratory Practice (GLP) and Good Distribution Praxis (GDP) to ensure that all development activities follow national and international laws, rules and guidelines. Our independent quality assurance department prepares an annual risk-based audit plan enabling an objective auditing of contract research organizations, investigational sites, suppliers and contract manufacturers selected for clinical studies as well as our own departments involved in drug development activities. The Head of Quality Assurance reports to and coordinates activities with the Chief Executive Officer to meet the stringent quality standards, ensure product quality and data integrity as well as the safety of volunteers and patients in clinical trials. *SEE GLOSSARY – page 188 We hold a manufacturing license for the Qualified Person’s certification of investigational medicinal products, as well as a certificate from the German authorities of Upper Bavaria confirming the Company’s compliance with Good Manufacturing Practice (GMP) standards and guidelines. ›› SEE FIGURE 14 – Quality Management System at MorphoSys (page 74) INTELLECTUAL PROPERTY Proprietary technology and the drug candidates derived there from are our most valuable assets. Therefore, it is critical to our success that these assets are protected by appropriate measures such as patents and patent filings. Only through these means can we ensure that these assets are exclusively utilized. It is also the reason our Intellectual Property (IP) Department seeks out the best strategy to protect our products and technologies. The rights of third parties are also actively monitored and respected. Our core technologies, which include the Ylanthia antibody library and the Slonomics technology amongst others, form our basis for success. Each of these technologies is protected by a number of patent families. Meanwhile, most of these patents have been granted in all of the key regions, including the markets of Europe, the United States and Asia. The same is true for our development programs. In addition to the patents that protect the drug candidates themselves, other patent applications were filed that cover other aspects of the programs. The relevant patents for our development candidates MOR 103/GSK3196165 (out-licensed to GSK) and MOR202 (out-licensed to I-Mab for Greater China) are expected to expire not before 2031 (including the predicted patent term extensions and supplementary protection certificates). The MOR208 program is also protected by various patents. The key patents are scheduled to expire in 2029 (U.S.) and 2027 (Europe), not taking into account the additional protection of up to five years which is available via supplementary protection certificates or patent term extensions. Likewise, the key patent for MOR106 (out-licensed together with Galapagos to Novartis) expires in 2037, not taking into account any potential extensions. For all development programs regulatory exclusivities are available as well.
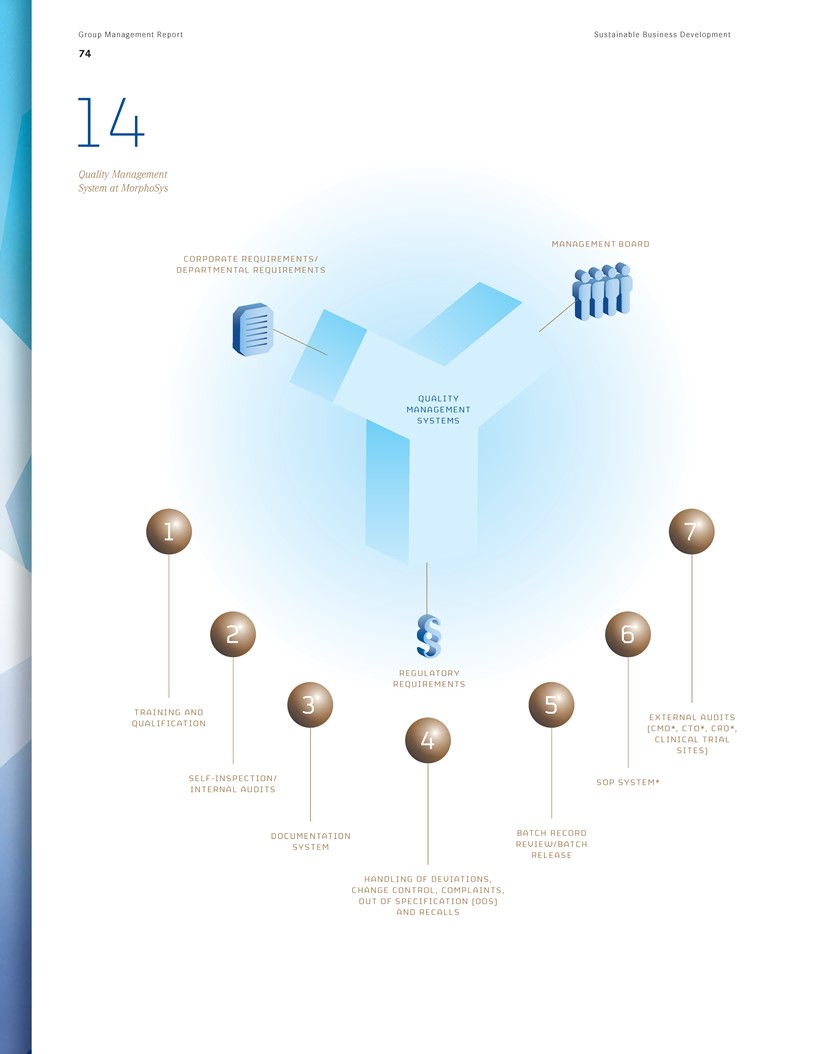
Group Management Report 74 Sustainable Business Development 14 Quality Management System at MorphoSys CORPORATE REQUIREMENTS/ DEPARTMENTAL REQUIREMENTS MANAGEMENT BOARD QUALITY MANAGEMENT SYSTEMS REGULATORY REQUIREMENTS EXTERNAL AUDITS (CMO*, CTO*, CRO*, CLINICAL TRIAL SITES) TRAINING AND QUALIFICATION SELF-INSPECTION/INTERNAL AUDITS DOCUMENTATION SYSTEM SOP SYSTEM* BATCH RECORD REVIEW / BATCH RELEASE HANDLING OF DEVIATIONS, CHANGE CONTROL, COMPLAINTS, OUT OF SPECIFICATION (OOS) AND RECALLS

Sustainable Business Development Group Management Report 75 FINANCIAL STATEMENTS The programs developed in cooperation with or for partners are also fully secured by patent protection. Our patent department works closely with the relevant partners. The patents covering these drug development programs have durations that significantly exceed those of the underlying technology patents. In addition, we monitor the activities of our competitors and initiate any necessary actions. For IP developments in the reporting year please see section “Patents” under “Research and Development and Business Performance.” HUMAN RESOURCES We follow a progressive human resources policy for the long-term retention of professionally and personally suitable employees from a variety of fields. In an industry such as ours, where success largely depends on the creativity and commitment of staff, factors such as employee retention and employee satisfaction are crucial for success. Employees have access to a broad range of in-house and external training programs, advanced education, specialized continuing education and development programs. Employees also can visit or present at industry conferences. We promote not only ongoing professional education but also the personal development of our employees and in some cases even offer support through customized coaching. We encourage all employees with management responsibility to take part in management seminars created exclusively for us. The training is offered in several modules with themes that build upon one another. The goal is not only to provide theoretical knowledge but also to prepare participants for the special demands placed on our executives. We actively promoted the professional career paths of specialists and experts once again during the reporting year. The intended goal of this type of career promotion, which is also available to employees without personnel responsibilities, is to continue to maintain flat hierarchies and place traditional management and professional career paths on an equal footing, also in terms of titles and compensation structures. We offer in-house vocational training to open up promising career prospects, particularly for young people. In awarding apprenticeships, we have been very successful in considering students who are equally suitable but do not have a diploma. On December 31, 2018, we had two trainees in the IT department and six biology laboratory trainees (December 31, 2017: two IT trainees; six biology laboratory trainees). Our corporate values – Innovation, Collaboration, Courage and Urgency – are the basis of our company culture. They determine how we act and interact. As articulated in our credo, transparent communication between employees is one central aspect of our corporate culture. One example is the employees’ use of our intranet to obtain target-group-specific information. We also have a general meeting every three weeks, in which the Management Board presents the latest developments to employees, answers questions and provides an opportunity for employees to present selected projects. Employees’ questions and feedback can be taken directly in the meeting or submitted in advance in writing – anonymously if desired. We maintain a Facebook career page to promote employer branding. The target group is potential applicants who want to learn more about us. The page presents employee profiles and reports on a variety of activities extending beyond the typical workday to give an authentic and modern impression of us. New employees are helped to become familiar with the Group through extensive onboarding activities. Employees can learn about our processes in one-day orientation seminars with presentations from all operating departments and by participating in laboratory tours. New executives are offered an additional seminar concerning their management duties. Free athletic and relaxation options, such as soccer, volleyball and basketball, as well as autogenic training and massage for a fee, all work to promote health and socializing among employees of all departments. Providing feasible concepts for reconciling a professional career with personal life is a strategic success factor for progressive companies. For many years, we have been offering employees a diverse range of options, such as flexible working hours and special part-time employment arrangements. Modern IT equipment also allows employees to work during business trips or from their home office without interruption. We make it easier for employees with families to reenter the work-force and combine work and family life. We cooperate with an external provider offering employees additional services related to care and nursing. We make every effort to protect employees from workplace hazards and maintain their health through preventative measures. The extremely low number of occupational accidents illustrates the success of our strict monitoring of all occupational protection and safety measures. During the reporting year, there were two reportable occupational accidents. We try to maintain the low number of accidents and the highest level of employee safety and well-being through the help of policies and training from the Department of Health and Occupational Safety and by offering routine medical examinations. A detailed overview of the Group’s headcount development can be found in the section “Operations and Business Environment.”

Group Management Report 76 Risk and Opportunity Report Risk and Opportunity Report We operate in an industry characterized by constant change and innovation. The challenges and opportunities in the health-care sector are influenced by a wide variety of factors. Global demographic changes, medical advances and the desire to increase quality of life provide excellent growth opportunities for the pharmaceutical and biotechnology industries; however, companies must also grapple with growing regulatory requirements in the field of drug development as well as cost pressure on healthcare systems. We undertake great efforts to identify new opportunities and to leverage our business success to generate a lasting increase in enterprise value. Entrepreneurial success, however, is not achievable without conscious risk-taking. Through our worldwide operations, we are confronted with a number of risks that could affect our business. Our risk management system identifies these risks, evaluates them and takes suitable action to avert risk and reach our corporate objectives. A periodic strategy review ensures that there is a balance between risk and opportunity. We only assume risk when there is an opportunity to increase our enterprise value. Risk Management System The risk management system is an essential element of our corporate governance and ensures we adhere to good corporate governance principles and comply with regulatory requirements. We have a comprehensive system in place to identify, assess, communicate and deal with our risks. The risk management system identifies risk as early as possible and details possible actions to limit operating losses and avoid risks that could endanger the Company. All actions to minimize risk are assigned to risk officers, who are also members of our Senior Management Group. All of our material risks in the various business segments are assessed using a systematic risk assessment that is carried out twice a year. Risks are assessed by comparing their quantifiable financial impact with their probability of occurrence with and without initiating a risk mitigation process. This method is applied over a 12-month assessment period as well as a period of three years to include our risks related to proprietary development that have longer durations. Additionally, there is long-term strategic risk assessment that spans more than three years (qualitative assessment). An overview of our current risk assessment activities can be found in Tables 11 and 12. Risk managers enter their risks into an IT platform that makes monitoring, analyzing and documenting risks easier. The risk management system distinguishes risk owners from risk managers. For risks relating to clinical development, the risk owner is the responsible business team head for the respective clinical program. For non-clinical risks, the risk owner is the responsible department head. Employees from the respective area of the risk owner can be risk managers as long as the risks included in the risk management system fall under their area of responsibility. Risk owners and risk managers are required to update their risks and assessments at half-yearly intervals. The process for this is coordinated and led from the Corporate Finance & Corporate Development Department, which is also responsible for monitoring the evaluation process and summarizing the key information. The information is regularly presented to the Management Board which, in turn, presents the results to the Supervisory Board twice a year. The entire evaluation process is based on standardized forms for the evaluations. Risk management and monitoring activities are carried out by the relevant managers. The changes in the risk profile resulting from these activities are recorded at regular intervals. It is also possible to report important risks on an ad hoc basis when they occur outside of the regular intervals. A regular audit by external consultants ensures the ongoing development of the risk management system and that any potential changes in our risk areas are promptly incorporated. The risk and opportunity management system combines a bottom-up approach for recognizing both short- and medium-term risks with a top-down approach that systematically identifies long-term global risks and opportunities. As part of the top-down approach, workshops are held twice per year with selected members of the Senior Management Group. These workshops assess and discuss the long-term risks and opportunities in different areas, including those exceeding a period of three years. The evaluation process is solely qualitative. These risks are listed in Table 11 and 12. Principles of Risk and Opportunity Management We continually encounter both risks and opportunities. These could have a potential material impact on our net assets and financial position as well as a direct effect on intangible assets, such as our image in the sector or our trademark. We define risk as an internal or external event that has an immediate impact and includes an assessment of the potential financial impact on our targets. There is a direct relationship between opportunity and risk. Seizing opportunities has a positive influence on our targets, whereas risk emergence has a negative influence.

Risk and Opportunity Report Group Management Report 77 Responsibilities under the Risk and Opportunity Management System Our Management Board is responsible for the risk and opportunity management system and ensures that all risks and opportunities are evaluated, monitored and presented in their entirety. The Corporate Finance & Corporate Development Department coordinates the risk management process and reports regularly to the Management Board. The Supervisory Board has appointed the Audit Committee to monitor the effectiveness of our risk management system. The Audit Committee periodically reports its findings to the entire Supervisory Board, which is also directly informed by the Management Board twice a year. >>SEE FIGURE 15-Risk and Opportunity Management System at MorphoSys (page 78) Accounting-Related Internal Control System We employ extensive internal controls, Group-wide reporting guidelines as well as other measures, such as employee training and ongoing professional education with the goal of maintaining accurate bookkeeping and accounting and ensuring reliable financial reporting in the consolidated financial statements and group management report. This essential component of Group accounting consists of preventative, monitoring and detection measures intended to ensure security and control in accounting and operating functions. Detailed information about the internal control system for financial reporting can be found in the Corporate Governance Report. Risks According to Risk Management System RISK CATEGORIES As part of its risk assessment, we assign risks to the six categories described below. The assessment of the relevance of the risks is not distinguished according to categories but according to impact and probability of occurrence. Therefore, Tables 11 and 12, which list our biggest risks, do not necessarily include risks from all six categories. FINANCIAL RISK Our financial risk management seeks to limit financial risk and reconciles this risk with the requirements of our business. Financial risk can arise in relation to licensing agreements, for example when projects (products or technologies) do not materialize, are delayed or are out-licensed under different terms and conditions than originally planned. Risk also arises when revenues do not reach their projected level or when costs are higher than planned due to greater resource requirements. Detailed project preparations, such as those made through indepth exchanges with internal and external partners and consultants, ensure the optimal starting point early in the process and are important for minimizing risk. Our financial risk related to proprietary programs was reduced in July 2018 when we, together with Galapagos NV, entered into a worldwide, exclusive agreement with Novartis Pharma AG covering the development and commercialization of our joint program MOR106. The financial risk relating to the fully proprietary program MOR208 remains entirely with us. We retain some risk with respect to the clinical development of programs introduced into partnerships; for example MOR210. In 2018 we partnered this program with I-Mab for China, Taiwan, Hong Kong, Macao and South Korea, but retain responsibility for the rest of the world ourselves. The early termination of development partnerships may force us to bear future development costs alone and have a major impact on our statement of profit or loss and financial planning. Through our successful Nasdaq IPO in April 2018, we strengthened our financial position. Continuing economic difficulties in Europe indicate that potential bank insolvencies still pose a financial risk. For this reason, we continue to invest only in funds and bank instruments deemed safe - to the extent this is possible and can be estimated - and that have a high rating and/or are secured by a strong partner. We limit our dependence on individual financial institutions by diversifying and/or investing in lower risk money market funds. However, a strategy that eliminates all risks of bank insolvency would be too costly and impractical. For example, German government bonds are a very secure form of investment but currently trade with negative interest rates. A further risk is the receipt of adequate interest on financial investments, particularly in light of today’s negative interest rates. It is currently very difficult for us to invest within the scope of our policies and still avoid negative interest rates. We invest when possible in instruments that yield positive interest rates. However, there is no guarantee that positive, safe, interest- bearing investments will always be available. In the Partnered Discovery segment, there is a financial risk associated with royalties on TremfyaR product sales. Revenues generated by our partner Janssen from the drug, which was approved in 2017, are difficult to predict and may lead to deviations from the budgeted revenues. We plan to continue to invest a significant portion of our funds in the development of our product candidates. This includes identifying target molecules and drug candidates, conducting preclinical and clinical studies, producing clinical material, supporting partners and co-developing programs. Current financial resources and expected revenues are expected to be sufficient to meet our current and short-term capital needs. This does not guarantee, however, that sufficient funds will be available over the long term at all times.

Group Management Report Risk and Opportunity Report 78 15 Risk and Opportunity Management System at MorphoSys CORPORATE GOVERNANCE SUPERVISORY BOARD MANAGEMENT BOARD COMPLIANCE MANAGEMENT RISK AND OPPORTUNITY MANAGEMENT INTERNAL CONTROL SYSTEM INTERNAL REVISION DEFINE OBJECTIVES ASSESS RISK IMPLEMENT MEASURES MONITOR SYSTEM DISCUSSION FORUM BUSINESS DEVELOPMENT INNOVATION CAPITAL TECHNOLOGY SCOUTING INTERNAL AUDIT

Risk and Opportunity Report Group Management Report 79 OPERATIONAL RISK FINANCIAL STATEMENTS Operational risk includes risks related to the discovery and development of proprietary drug candidates. The termination of a clinical trial prior to out-licensing to partners - which does not necessarily imply the failure of an entire program - can occur when the trial does not produce the expected results, shows unexpected adverse side effects or the data are compiled incorrectly. Clinical trial design and drafts of development plans are always completed with the utmost care. This gives the trials the best opportunity to show relevant data in clinical testing and convince regulatory agencies and potential partners of the drug candidate’s potential. External experts also contribute to our existing internal know-how. Special steering committees and panels are formed to monitor the progress of clinical programs. Any changes with respect to clinical trials such as the trial’s design, the speed at which patients can be recruited or upcoming alternative therapies may lead to a delay in development and, as a result, have a negative impact on the trial’s economic feasibility and potential. There is also a risk associated with proprietary programs if partnerships fail or are delayed. STRATEGIC RISK Access to sufficient financing options also poses a strategic risk for us. Following our decision to develop our proprietary portfolio in-house, the financing of research and development is now a key focus. Risks in this respect can arise from a lack of access to capital. We established an in-depth budget process to mitigate these risks. We also employ various departments and external consultants to ensure the smooth execution of capital market transactions. A further strategic risk is the danger that a development program introduced into a partnership may fail. Partnerships can be terminated prematurely, forcing us to search for new development partners or bear the substantial cost of further development alone. This may result in a delay or even the termination of the development of individual candidates and could lead to additional costs and a potential long-term loss of revenues for us due to delayed market entry. Another strategic risk is that preliminary data from clinical trials may lead to the trial’s termination or a change in the trial’s design. With respect to the development and potential approval of MOR208, we are currently preparing a submission of a regulatory filing with the FDA based on the single-arm L-MIND trial. There may be a strategic risk that the regulatory authorities do not accept a filing and/or grant approval based on single-arm data for MOR208 plus lenalidomide. EXTERNAL RISKS We face external risks with respect to intellectual property, among others. The patent protection of our proprietary technologies and compounds is especially important. To minimize risks in this area, we keep a vigilant eye on published patents and patent applications and analyze the corresponding results. We also develop strategies to ensure that the patents or patent applications of others do not limit our ability to pursue our own activities. Through the years, we have seen increasing success with this strategy and have created ample leeway for our proprietary technology platforms and products for many years to come. Risks can also arise through the enforcement of our intellectual property rights vis-à-vis third parties. The respective proceedings can be costly and mobilize significant resources. There is also the risk that a third party files a counter-claim against us. External risks may also arise as a result of changes in the legal framework. This risk is minimized through continued training of the relevant staff and discussions with external experts. It is also conceivable that competitors might challenge our patents or infringe on our patents or patent families, which in turn could lead us to take legal action against our competitors. Such procedures, particularly when they take place in the U.S., are costly and represent a significant financial risk. As an internationally operating biotechnology company with numerous partnerships and an in-house research and development department for developing drug candidates, we are subject to a number of regulatory and legal risks. These risks include those related to patent, competition, tax and antitrust law, potential liability claims from existing partnerships and environmental protection. The Regulatory Affairs department is also affected by this risk in terms of the feedback it receives from regulators on study design. Future legal proceedings are conceivable and cannot be anticipated. Therefore, we cannot rule out that we may incur expenses for legal or regulatory judgments or settlements that are not or cannot be partially or fully covered by insurance and may have a significant impact on our business and results. ORGANIZATIONAL RISK Organizational risks arise, for example, with respect to setting up commercial structures and the related costs. For us, this means that processes and procedures need to be adapted accordingly. In September 2017, we established a “Global Commercial” department, which works with external consultants to set up commercial structures in the headquarters and supports other functions to get ready for commercialization. In July 2018, we opened a 100 % affiliate in the U.S., MorphoSys US Inc., which will be the first commercial operation. Highly experienced employees are being hired to ensure thorough preparation for launch. Risk also arises from missing or delayed information within the organization on patent issues.

Group Management Report Risk and Opportunity Report 80 COMPLIANCE RISK Compliance risks can arise when quality standards are not met, or business processes are not conducted properly from a legal standpoint. To counter these risks, we are committed to having our business operations meet the highest quality standards as set out in the Sustainability Report. Carrying out a compliance risk analysis is a central tool of the Compliance Management System. Specific risks can arise, for example, when the internal quality management system does not meet the legal requirements or when there is no internal system for detecting quality problems. If the internal controls are not able to detect violations of Good Manufacturing Practice (GMP), Good Clinical Practice (GCP), Good Laboratory Practice (GLP) or Good Distribution Praxis (GDP) then this also would represent a compliance risk. To minimize risk, the internal quality management system is also regularly audited by external experts and subjected to recurring audits by an internal, independent quality assurance department. Inadequate or late financial communication can lead to fines or even lawsuits. Annual General Meetings conducted incorrectly may lead to legal disputes with shareholders resulting in signifi-cant costs from attempts to prevent either a challenge to or repeat of the Annual General Meeting. Pending decisions for corporate actions, such as capital increases, could also be compromised. To minimize these risks, the preparation and execution of the Annual General Meeting and all related documents and processes are carefully reviewed and monitored by the relevant internal departments, as well as by external lawyers and auditors when it comes to the annual financial statements. None of the Top 10 Risks listed in Tables 11 and 12 belonged to this risk category in the reporting period. THE MANAGEMENT BOARD’S EVALUATION OF THE OVERALL RISK SITUATION IN OUR GROUP Our Management Board considers the overall risk to be manageable and trusts in the effectiveness of the risk management system in relation to changes in the environment and the needs of the ongoing business. It is the Management Board’s view that our continued existence is not jeopardized. This assessment applies to us as a whole as well as to each Group company. This conclusion is based on several factors that are summarized below: We have an exceptionally high equity ratio. The Management Board firmly believes that we are well positioned to cope with any adverse events that may occur. We control a comprehensive portfolio of preclinical and clinical programs in partnerships with a number of large pharmaceutical companies and have a strong foundation of technologies for expanding our proprietary portfolio. Despite these factors, it is impossible to rule out, control or in-fluence risk in its entirety. Opportunities Cutting-edge antibody technologies, excellent know-how and a broad portfolio of validated clinical programs have made us one of the world’s leading biotechnology companies in the field of therapeutic antibodies. This therapeutic class is now one of the most successful in the industry, and there is an impressive number of pharmaceutical and biotechnology companies in the field of antibodies that could potentially become customers or partners for our products and technologies. Based on this fact and our extensive, long-term technological and product development expertise, we have identified a number of future growth opportunities. Our technologies for developing and optimizing therapeutic antibody candidates have distinct advantages that can lead to higher success rates and shorter development times in the drug development process. The transfer and application of our core capabilities - even those outside of the field of antibodies - opens up new opportunities for us because many classes of compounds have similar molecular structures. OPPORTUNITY MANAGEMENT SYSTEM The opportunity management system is an important component of our corporate management and is used to identify opportunities as early as possible and generate added value for us. Opportunity management is based on the following pillars: a routine discussion forum involving the Management Board and selected members of the Senior Management Group; our business development activities; a technology scouting team; a compound scouting team; and an in-house suggestion scheme, with appropriate incentive systems, for new scientific ideas. Committees discuss specific opportunities and decide what action should be taken to exploit these opportunities. The meetings and their outcomes are recorded in detail, and any subsequent action is reviewed and monitored. Our Business Development Team takes part in numerous conferences and in the process identifies different opportunities that can enhance our growth. These opportunities are presented and considered by the committee by means of an evaluation process. The technology scouting team searches specifically for innovative technologies that can generate synergies with our existing technology platforms and could be used to source new therapeutic molecules. The compound scouting team searches specifically for compounds that can add to our proprietary pipeline or future sales force. These outcomes are also discussed and evaluated in interdepartmental committees. A proven process for evaluating opportunities gives us a qualitative and replicable evaluation. Our key opportunities are described in Table 13 (qualitative evaluation).

Risk and Opportunity Report Group Management Report 81 GENERAL STATEMENT ON OPPORTUNITIES Increased life expectancy in industrialized countries and rising incomes and living standards in emerging countries are expected to drive the demand for more innovative treatment options and advanced technologies. Scientific and medical progress has led to a better understanding of the biological process of disease and paves the way for new therapeutic approaches. Innovative therapies, such as fully human antibodies, have reached market maturity in recent years and have led to the development of commercially successful medical products. Therapeutic compounds based on proteins-also referred to as “biologics” are less subject to generic competition than chemically produced molecules because the production of biological compounds is far more complex. The sharp rise in both the demand for antibodies and the interest in this class of drug candidates can be seen by the acquisitions and significant licensing agreements made over the past two to three years. MARKET OPPORTUNITIES We believe our antibody platforms HuCAL, Ylanthia, Slonomics, the HTH peptide technology and the in-licensed lanthipeptide technology can all be used to develop products addressing significant unmet medical needs. THERAPEUTIC ANTIBODIES- PROPRIETARY DEVELOPMENT It is reasonable to assume that the pharmaceutical industry will continue or even increase its in-licensing of drugs to refill its pipelines and replace key products and blockbusters that have lost patent protection. Our most advanced compounds MOR103/GSK3196165, MOR106, MOR202 and MOR208 place us in an excellent position to capitalize on the needs of pharmaceutical companies. Our collaborations with GSK (for MOR103/ GSK3196165), with I-Mab (MOR202 and MOR210) and with No-vartis (MOR106) exemplify this point. We are continuously enhancing our proprietary portfolio and will continue to advance it by adding clinical trials with our key drug candidates in new disease areas and by adding additional programs. In this way, we may take advantage of existing and future opportunities for co-development or partnerships. We are also looking for more opportunities to in-license promising drug candidates. The drug candidate MOR208 may provide us with our first opportunity to independently market a drug. THERAPEUTIC ANTIBODIES-PARTNERED DEVELOPMENT By developing drugs with a number of partners, we have been able to spread the risk that is inevitably linked with drug development. With 103 individual therapeutic antibodies currently in partnered development programs, it is becoming more likely that we will have an opportunity to participate financially in marketed drugs. Since the first regulatory approval of Tremfya® by the U.S. FDA in mid-2017, our licensee Janssen reported in October that new Tremfya® (guselkumab) 3-year data show stably maintained rates of skin clearance in patients with moderate to severe plaque psoriasis. In December, Janssen reported that results from the ECLIPSE study demonstrated that Tremfya® was superior to Cosentyx® (secukinumab) in treating adults with moderate to severe plaque psoriasis for the primary endpoint of a PASI 90 response at week 48. Tremfya® has received further regulatory approval in a number of territories worldwide, including Canada, the European Union, Brazil, Japan, Australia and South Korea to treat patients suffering from moderate-to-severe plaque psoriasis and in Japan additionally for the treatment of psoriatic arthritis, pustular psoriasis and erythrodermic psoriasis. Moreover, Tremfya® is being investigated in clinical studies including two phase 3 trials in psoriatic arthritis and a phase 2/3 clinical study program in Crohn’s disease. Janssen also initiated a phase 2 study (NOVA) to evaluate guselkumab in hidradenitis suppurativa. In June 2018, we announced new phase 3 clinical trials by our partner Roche with gantenerumab in early Alzheimer’s disease. TECHNOLOGY DEVELOPMENT We continue to invest in our existing and new technologies to defend our technological leadership. One example is our new antibody platform Ylanthia that enjoys much longer patent protection than its predecessor HuCAL. This type of technological advance can help us to increase not only the speed but also the success rate of our partnered and proprietary drug development programs. New technology modules that enable the production of antibodies against novel classes of target molecules can also provide access to new disease areas in which antibody-based treatments are underrepresented. In September 2018, we announced an expansion of the existing strategic dermatology alliance with LEO Pharma A/S. The objective of the alliance is to identify novel, peptide-derived therapeutics for unmet medical needs. Under the terms of the agreement, LEO Pharma will select targets against which MorphoSys will identify lead molecules using its proprietary peptide technology platform. MorphoSys has an exclusive option to secure worldwide rights to any drugs arising from the collaboration in the field of oncology. Technology development is carried out by a team of scientists whose focus is the further development of our technologies. We not only develop technology internally but also use external resources to enhance our own activities. A good example of this is our acquisition of Lanthio Pharma, a Dutch company developing lanthipeptides.

Group Management Report Risk and Opportunity Report 82 ACQUISITION OPPORTUNITIES In the past, we have proven our ability to acquire compounds and technologies that accelerate our growth. Potential acquisition candidates are also systematically presented, discussed and evaluated during the routine meetings described above between the Management Board and selected members of the Senior Management Group. After these meetings, promising candidates are reviewed in terms of their strategic synergies and evaluated by internal specialist committees. Protocols are completed on all candidates and evaluations are systematically archived for follow-up and monitoring. A proprietary database helps administer this information and keep it available. FINANCIAL OPPORTUNITIES Exchange rate and interest rate developments can positively or negatively affect our financial results. Interest rate and financial market developments are continuously monitored to promptly identify and take advantage of opportunities. TABL E 11 Summary of MorphoSys’s Key Short- and Medium-Term Risks Risk category 3-year assessment Proprietary Development segment Risks related to building a marketing structure Financial Moderate Failure of one or more proprietary clinical programs Financial, strategic, operational Moderate Risks related to regulatory approval process Financial, strategic Moderate Increase in development costs Strategic Moderate Outside of the Proprietary Development segment Failure to reach revenue targets in Partnered Discovery programs Financial Moderate Risk category 1-year assessment Proprietary Development segment Failure of one or more proprietary clinical programs Operational High Risks related to regulatory approval process Strategic Moderate Delay in the development of one or more proprietary clinical programs and/or higher development costs Financial, operational, organizational Moderate Risks related to technology access Strategic Low Patent-related risks External Low Outside of the Proprietary Development segment Failure to reach revenue targets in Partnered Discovery programs Financial Moderate Risks from bank insolvencies Financial Low LEGEND LOW RISK: low probability of occurrence, low impact MODERATE RISK: moderate probability of occurrence, moderate impact HIGH RISK: moderate probability of occurrence, moderate to strong impact CATASTROPHIC RISK: high probability of occurrence, severe impact
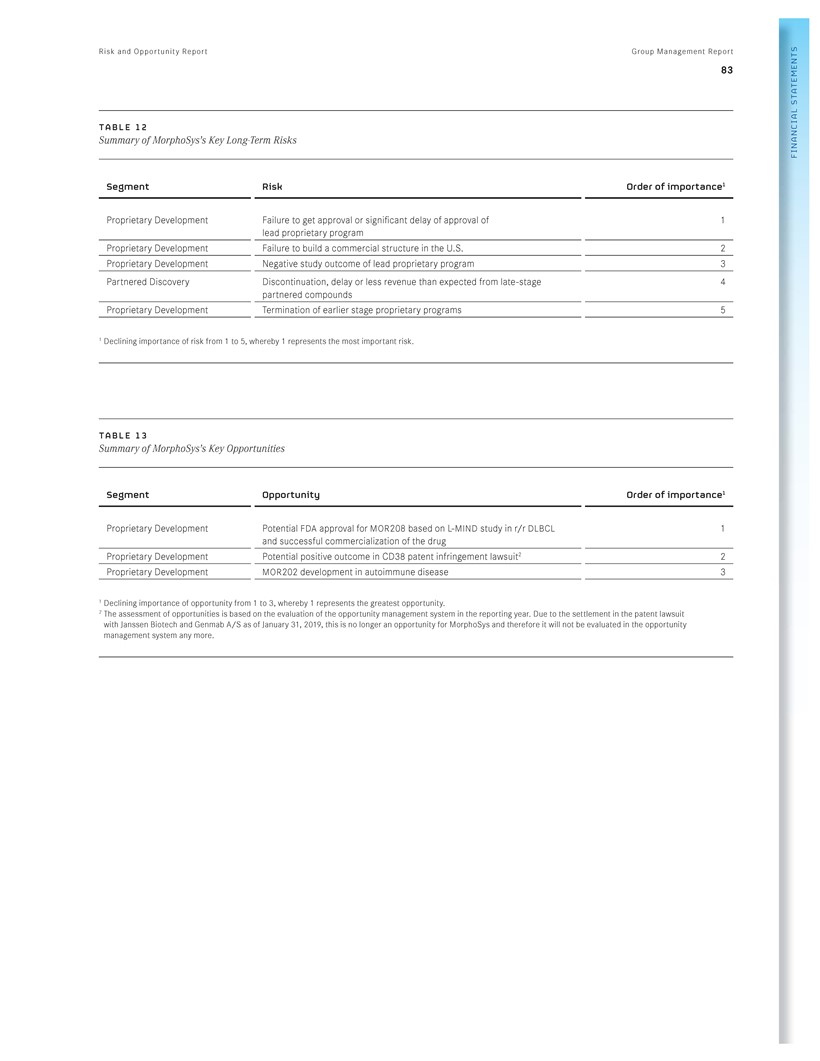
Risk and Opportunity Report Group Management Report 83 TABLE 12 Summary of MorphoSys’s Key Long-Term Risks Segment Risk Order of importance1 Proprietary Development Failure to get approval or significant delay of approval of lead proprietary program 1 Proprietary Development Failure to build a commercial structure in the U.S. 2 Proprietary Development Negative study outcome of lead proprietary program 3 Partnered Discovery Discontinuation, delay or less revenue than expected from late-stage partnered compounds 4 Proprietary Development Termination of earlier stage proprietary programs 5 1 Declining importance of risk from 1 to 5, whereby 1 represents the most important risk. TABLE 13 Summary of MorphoSys’s Key Opportunities Segment Opportunity Order of importance1 Proprietary Development Potential FDA approval for MOR208 based on L-MIND study in r/r DLBCL and successful commercialization of the drug 1 Proprietary Development Potential positive outcome in CD38 patent infringement lawsuit2 2 Proprietary Development MOR202 development in autoimmune disease 3 1 Declining importance of opportunity from 1 to 3, whereby 1 represents the greatest opportunity. 2 The assessment of opportunities is based on the evaluation of the opportunity management system in the reporting year. Due to the settlement in the patent lawsuit with Janssen Biotech and Genmab A/S as of January 31, 2019, this is no longer an opportunity for MorphoSys and therefore it will not be evaluated in the opportunity management system any more. FINANCIAL STATEMENTS

Group Management Report Statement on Corporate Governance, Group Statement on Corporate Governance and Corporate Governance Report 84 Statement on Corporate Governance, Group Statement on Corporate Governance and Corporate Governance Report The Statement on Corporate Governance, the Group Statement on Corporate Governance and the Corporate Governance Report are available on our website under Media and Investors Corporate Governance. Statement on Corporate Governance under Section 289F HGB and Group Statement on Corporate Governance under Section 315d HGB for the 2018 Financial Year In the Statement on Corporate Governance under Section 289f HGB and the Group Statement on Corporate Governance under Section 315d HGB, the Management Board and the Supervisory Board provide information on the main elements of our corporate governance. In addition to the annual Declaration of Conformity in accordance with Section 161 of the Stock Corporation Act (AktG), the Statement on Corporate Governance and the Group Statement on Corporate Governance also include relevant information on corporate governance practices and other aspects of corporate governance, including a description of the working practices of the Management Board and Supervisory Board. DECLARATION OF CONFORMITY WITH THE GERMAN CORPORATE GOVERNANCE CODE (THE “CODE”) OF THE MANAGEMENT BOARD AND SUPERVISORY BOARD OF MORPHOSYS AG The Management Board and Supervisory Board of MorphoSys AG declare the following under Section 161 of the German Stock Corporation Act: 1. Since the last Declaration of Conformity on December 1, 2017, MorphoSys has complied with the recommendations of the “Government Commission on the German Corporate Governance Code” in the version from February 7, 2017 with the following exception: There is no cap on the overall or individual variable remuneration components of Management Board members’ remuneration (see Item 4.2.3 (2) sentence 6 of the Code). Based on the Supervisory Board’s existing limitations for the Management Board’s variable remuneration components and their annual allocation, the Supervisory Board does not believe that an additional cap is required. 2. MorphoSys will continue to comply with the recommendations of the “Government Commission on the German Corporate Governance Code” in the version dated February 7, 2017 with the exception described under Item 1. Planegg, November 30, 2018 MorphoSys AG On behalf of the On behalf of the Management Board: Supervisory Board: Dr. Simon Moroney Dr. Marc Cluzel Chief Executive Officer Chairman of the Supervisory Board

Statement on Corporate Governance, Group Statement on Corporate Governance and Corporate Governance Report Group Management Report 85 RELEVANT INFORMATION ON CORPORATE GOVERNANCE PRACTICES We ensure compliance with laws and rules of conduct through the Group-wide enforcement of the following documents: the Code of Conduct, the Compliance Management Handbook and additional internal policies and guidelines. Our Code of Conduct sets out the fundamental principles and key policies and practices for business behavior. The Code is a valuable tool for employees and executives, particularly in business, legal and ethical conflict situations. It reinforces our principles of transparent and sound management and fosters trust from the public, business partners, employees and financial markets, and the compliance with the Code of Conduct is carefully monitored. The Group-wide application of the Code is overseen by the Compliance Committee, and the Code itself is regularly reviewed and updated. The Code of Conduct is being distributed to each new employee and can be downloaded from our website under Media and Investors - Corporate Governance. The Compliance Handbook describes our Compliance Management System (CMS) and is intended to ensure compliance with all legal regulations as well as high ethical standards that apply to both the management and all employees. The Management Board has overall responsibility for the Compliance Management System and is required to report regularly to the Audit Committee and the Supervisory Board. In carrying out its compliance responsibility, the Management Board has assigned the relevant tasks to various functions at MorphoSys. The Compliance Officer ensures the exchange of information between the internal compliance-relevant functions. The Compliance Officer monitors our existing CMS and upgrades it based on decisions taken by the Management Board and Compliance Committee. The Compliance Officer is the first point of contact for each employee for all compliance-related issues. The Compliance Committee includes representatives from different functions and meets quarterly. The Compliance Committee supports the Compliance Officer in the implementation and monitoring of the CMS. The Compliance Committee is particularly responsible for the identification and discussion of all compliance-relevant issues and thus makes it possible for the Compliance Officer as well as the other members of the Compliance Committee to periodically verify our compliance status and, if necessary, update the CMS. More information on our Compliance Management System can be found in the Corporate Governance Report. COMPOSITION OF THE MANAGEMENT BOARD AND SUPERVISORY BOARD MANAGEMENT BOARD The Management Board of the Company consists of a Chief Executive Officer and three other members. A schedule of responsibilities currently defines the different areas of responsibility as follows: Dr. Simon Moroney, Chief Executive Officer: Strategy and Planning, Compliance & Quality Assurance, Internal Audit, Human Resources, Business Development & Portfolio Management, Legal, Commercial Planning, the coordination of individual areas of the Management Board, representation of the Management Board vis-à-vis the Supervisory Board Jens Holstein, Chief Financial Officer: Accounting & Tax, Controlling, Corporate Finance & Corporate Development, IT, Technical Operations, Central Purchasing & Logistics, Corporate Communications & Investor Relations, Environmental Social Governance (ESG) Dr. Markus Enzelberger, Chief Scientific Officer: Discovery Alliances & Technologies, CMC & Protein Sciences, Alliance Management, Supply Chain, Intellectual Property, Lanthio Pharma Dr. Malte Peters, Chief Development Officer: Preclinical Research, Project Management, Clinical Development, Clinical Operations, Drug Safety & Pharmacovigilance, Regulatory Affairs SUPERVISORY BOARD As of December 31, 2018, our Supervisory Board consisted of six members who oversee and advise the Management Board. The current Supervisory Board consists of professionally qualified members who represent our shareholders. The Chairman of the Supervisory Board (Dr. Gerald Möller until May 17, 2018 and Dr. Marc Cluzel since May 17, 2018), coordinates the Board’s activities, chairs the Supervisory Board meetings and represents the interests of the Supervisory Board externally. All Supervisory Board members are independent, as defined in the German Corporate Governance Code and the Nasdaq Listing Rules, and have many years of experience in the biotechnology and pharmaceutical industries. The Chairman of the Supervisory Board is not a former member of our Management Board. The members of the Supervisory Board and its committees are listed in the table below.FINANCIAL STATEMENTS
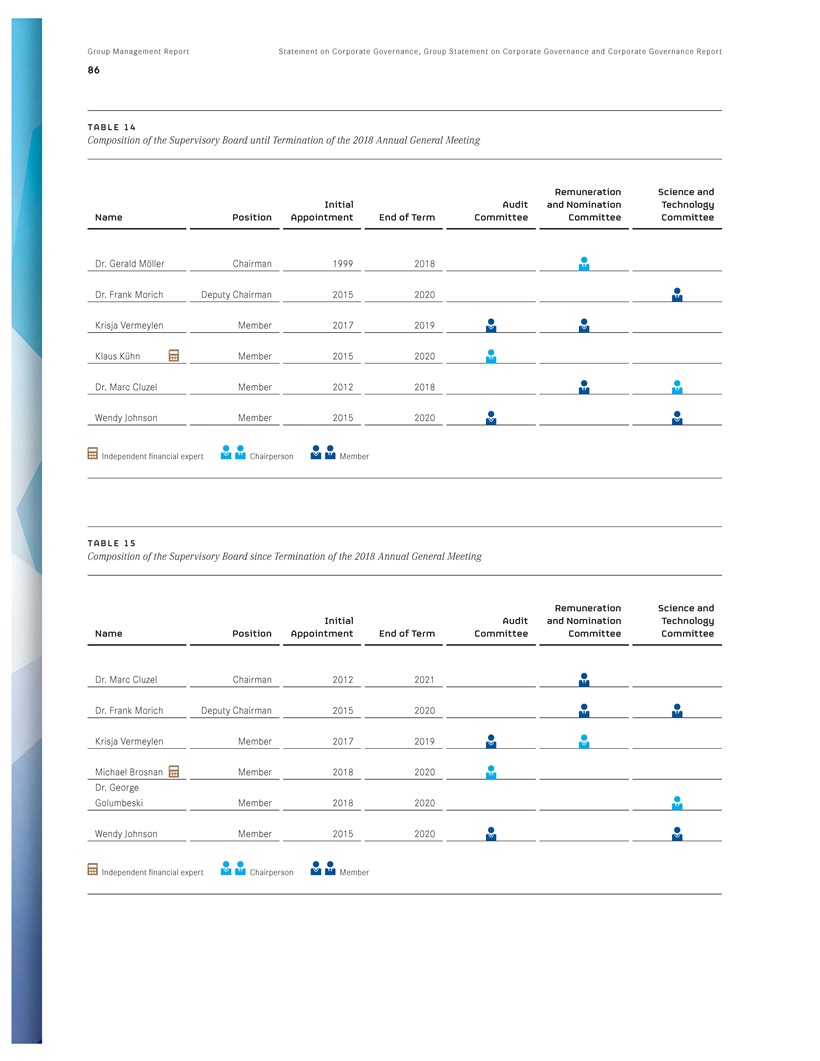
Group Management Report Statement on Corporate Governance, Group Statement on Corporate Governance and Corporate Governance Report 86 TABLE 14 Composition of the Supervisory Board until Termination of the 2018 Annual General Meeting Name Position Initial Appointment End of Term Audit Committee Remuneration and Nomination Committee Science and Technology Committee Dr. Gerald Möller Chairman 1999 2018 Dr. Frank Morich Deputy Chairman 2015 2020 Krisja Vermeylen Member 2017 2019 Klaus Kühn Member 2015 2020 Dr. Marc Cluzel Member 2012 2018 Wendy Johnson Member 2015 2020 Independent financial expert Chairperson Member TABLE 15 Composition of the Supervisory Board since Termination of the 2018 Annual General Meeting Name Position Initial Appointment End of Term Audit Committee Remuneration and Nomination Committee Science and Technology Committee Dr. Marc Cluzel Chairman 2012 2021 Dr. Frank Morich Deputy Chairman 2015 2020 Krisja Vermeylen Member 2017 2019 Michael Brosnan Member 2018 2020 Dr. George Golumbeski Member 2018 2020 Wendy Johnson Member 2015 2020 Independent financial expert Chairperson Member

Statement on Corporate Governance, Group Statement on Corporate Governance and Corporate Governance Report Group Management Report 87 WORKING PRACTICES OF THE MANAGEMENT BOARD AND SUPERVISORY BOARD To ensure good corporate governance, a guiding principle of the cooperation between our Management Board and Supervisory Board is the open, comprehensive and regular communication of information. The dual board system prescribed by the German Stock Corporation Act clearly differentiates between a company’s management and supervision. The responsibility of both boards is clearly stipulated by law and by the boards’ bylaws and Articles of Association. The boards work closely together to make decisions and take actions for our benefit. Their stated objective is to sustainably increase our value. Management Board members each have their own area of responsibility as defined in the schedule of responsibilities. They regularly report to their Management Board colleagues, their cooperation being governed by the bylaws. The Supervisory Board ratifies both the schedule of responsibilities and the bylaws. Management Board meetings are typically held weekly and are chaired by the Chief Executive Officer. During these meetings, resolutions are passed concerning dealings and transactions that, under the bylaws, require the approval of the entire Management Board. At least half of the Management Board’s members must be present to pass a resolution. Management Board resolutions are passed by a simple majority and, in the event of a tied vote, the Chief Executive Officer’s vote decides. For material events, each Management Board or Supervisory Board member can call an extraordinary meeting of the entire Management Board. Management Board resolutions can also be passed outside of meetings by an agreement made orally, by telephone or in writing (also by e-mail). Minutes are taken of each meeting of the full Management Board, are submitted for approval to the full Management Board and for signature by the Chief Executive Officer at the following meeting. In addition to the regularly scheduled meetings, Management Board strategy workshops are also held for developing and prioritizing the Group-wide strategic objectives. The Management Board promptly and comprehensively informs the Supervisory Board in writing and at Supervisory Board meetings about planning, business development, the Group’s position, risk management and other compliance issues. Extraordinary meetings of the Supervisory Board are also called for material events. The Management Board involves the Supervisory Board in the strategy, planning and all fundamental Company issues. In addition to regular Supervisory Board meetings, a strategy meeting takes place between the Management Board and Supervisory Board once annually to discuss our strategic direction. The Management Board’s bylaws specify that material business transactions require the approval of the Supervisory Board. Detailed information on the cooperation of the Management Board and Supervisory Board and important items of discussion during the 2018 financial year can be found in the Report of the Supervisory Board. The Supervisory Board holds a minimum of two meetings per calendar half-year and at least four meetings per full calendar year. The Supervisory Board has supplemented the Articles of Association with bylaws that apply to its duties. In accordance with these bylaws, the Chairperson of the Supervisory Board coordinates the activities of the Supervisory Board, chairs the Supervisory Board meetings and represents the interests of the Supervisory Board externally. The Supervisory Board typically passes its resolutions in meetings, but resolutions may also be passed outside of meetings in writing (also by e-mail), by telephone or video conference. The Supervisory Board has a quorum when at least two-thirds of its members (including either the Chairperson or Deputy Chairperson of the Supervisory Board) take part in the vote. Resolutions of the Supervisory Board are generally passed with a simple majority unless the law prescribes otherwise. In the event of a tied vote, the vote of the Chairperson of the Supervisory Board is decisive. Minutes are completed for Supervisory Board meetings and resolutions passed outside of meetings. A copy of the Supervisory Board’s minutes is made available to all Supervisory Board members. The Supervisory Board conducts an efficiency evaluation regularly in accordance with the recommendation in Item 5.6 of the Code. COMPOSITION AND WORKING PRACTICES OF THE MANAGEMENT BOARD AND SUPERVISORY BOARD COMMITTEES The Management Board has not formed any committees. The Supervisory Board has three committees: the Audit Committee, the Remuneration and Nomination Committee and the Science and Technology Committee. The members of the three committees formed by the Supervisory Board are professionally qualified. FINANCIAL STATEMENTS

Group Management Report Statement on Corporate Governance, Group Statement on Corporate Governance and Corporate Governance Report 88 TABLE 16 Participation of Supervisory Board Members SUPERVISORY BOARD MEETINGS by phone by phone Name 01/16 2018 03/09 2018 05/16 2018 05/17 2018 06/24 2018 07/26 2018 07/27 2018 10/26 2018 12/12 2018 Dr. Gerald Möller1 Dr. Marc Cluzel Wendy Johnson Klaus Kühn1 Dr. Frank Morich Krisja Vermeylen Dr. George Golumbeski2 Michael Brosnan2 1 Supervisory Board member until termination of the 2018 Annual General Meeting. 2 Supervisory Board member since termination of the 2018 Annual General Meeting. MEETINGS OF THE AUDIT COMMIT TEE by phone Name 03/08/2018 04/26/2018 07/25/2018 10/26/2018 12/12/2018 Wendy Johnson Klaus Kühn1 Krisja Vermeylen Michael Brosnan2 1 Supervisory Board member until termination of the 2018 Annual General Meeting. 2 Supervisory Board member since termination of the 2018 Annual General Meeting.

Statement on Corporate Governance, Group Statement on Corporate Governance and Corporate Governance Report Group Management Report 89 FINANCIAL STATEMENTS MEETINGS OF THE REMUNERATION AND NOMINATION COMMITTEE by phone by phone by phone by phone by phone Name 01/16/2018 03/02/2018 05/07/2018 06/08/2018 10/10/2018 Dr. Gerald Möller1 Dr. Marc Cluzel Krisja Vermeylen Dr. Frank Morich 1 Supervisory Board member until termination of the 2018 Annual General Meeting. MEETINGS OF THE SCIENCE AND TECHNOLOGY COMMITTEE Name 03/08/2018 05/16/2018 07/25/2018 10/26/2018 12/12/2018 Dr. Marc Cluzel Wendy Johnson Dr. Frank Morich Dr. George Golumbeski2 2 Supervisory Board member since termination of the 2018 Annual General Meeting. attended in person participated by phone AUDIT COMMITTEE The main task of the Audit Committee is to support the Supervisory Board in fulfilling its supervisory duties with respect to the accuracy of the annual and consolidated financial statements, the activities of the auditor and internal control functions, such as risk management, compliance and internal auditing. The Audit Committee submits a recommendation to the Supervisory Board for the election at the Annual General Meeting of an independent auditor. The members of the Audit Committee until May 17, 2018 were Klaus Kühn (Chairperson), Wendy Johnson and Krisja Vermeylen. The members of the Audit Committee since May 17, 2018 are Michael Brosnan (Chairperson), Wendy Johnson and Krisja Vermeylen. Michael Brosnan currently fulfills the prerequisite of an independent financial expert. REMUNERATION AND NOMINATION COMMITTEE The Remuneration and Nomination Committee is responsible for preparing and reviewing the Management Board’s compensation system annually before its final approval. When necessary, the Committee searches for suitable candidates to appoint to the Management Board and Supervisory Board and submits appointment proposals to the Supervisory Board. The Committee also prepares the contracts made with Management Board members. The members of the Remuneration and Nomination Committee until May 17, 2018 were Dr. Gerald Möller (Chairperson), Dr. Marc Cluzel and Krisja Vermeylen. The members of the Remuneration and Nomination Committee since May 17, 2018 are Krisja Vermeylen (Chairperson), Dr. Marc Cluzel and Frank Morich.
Group Management Report 90 Statement on Corporate Governance, Group Statement on Corporate G overnance and Corporate Governance Report SCIENCE AND TECHNOLOGY COMMITTEE The Science and Technology Committee advises the Supervisory Board on matters concerning proprietary drug and technology development and prepares the relevant Supervisory Board resolutions. The members of the Science and Technology Committee until May 17, 2018 were Dr. Marc Cluzel (Chairperson), Dr. Frank Morich and Wendy Johnson. The members of the Science and Technology Committee since May 17, 2018 are Dr. George Golumbeski (Chairperson), Dr. Frank Morich and Wendy Johnson. In line with Section 5.4.1. para. 5 sentence 2 of the Corporate Governance Code, the Supervisory Board members’ biographies are published on our website under Company Management-Supervisory- Board. Corporate Governance Report At MorphoSys, responsible, sustainable and value-oriented corporate governance is a high priority. Good corporate governance is an essential aspect of our corporate management and forms the framework for the Group’s management and supervision, which includes the Group’s organization, commercial principles and tools for its guidance and control. The German Corporate Governance Code (“the Code”) provides a standard for the transparent monitoring and management of companies that strongly emphasizes shareholder interests. The Code was originally published by the German Federal Ministry of Justice (Bundesministerium der Justiz) in 2002 and was most recently amended on February 7, 2017 and published by the German Federal Gazette (Bundesanzeiger) on April 24, 2017. The Code contains recommendations (Empfehlungen) and suggestions (Anregungen) relating to the management and supervision of German companies that are listed on a stock exchange. It follows internationally and nationally recognized standards for good and responsible corporate governance. The purpose of the Code is to make the German system of corporate governance transparent for investors. The Code includes corporate governance recommendations and suggestions with respect to shareholders and shareholders’ meetings, the management and Supervisory Boards, transparency, accounting policies and auditing. There is no obligation to comply with the recommendations or suggestions of the Code. The German Stock Corporation Act requires only that the Management Board and Supervisory Board of a German listed company issue an annual declaration that either (i) states that the company has complied with the recommendations of the Code or (ii) lists the recommendations that the company has not complied with and explains its reasons for deviating from the recommendations of the Code. In addition, a listed company is also required to state in this annual declaration whether it intends to comply with the recommendations or list the recommendations it does not plan to comply with in the future. These declarations have to be published permanently on the company’s website. If the company changes its policy on certain recommendations between such annual declarations, it must disclose this fact and explain its reasons for deviating from the recommendations. Non-compliance with suggestions contained in the Code need not be disclosed. Many of the corporate governance principles contained in the Code have been practiced at MorphoSys for many years. Our corporate governance is detailed in the Statement on Corporate Governance under Section 289f HGB and 315d HGB. The statement also contains the annual Declaration of Conformity, relevant information on corporate governance practices and a description of the Management Board and Supervisory Board’s working practices. Additional information can be found in this Corporate Governance Report. COMMUNICATION WITH THE CAPITAL MARKETS At MorphoSys, a key principle of corporate communication is to inform institutional investors, private shareholders, financial analysts, employees and all other stakeholders, simultaneously and fully of the Company’s situation through regular, transparent and timely communication. Shareholders have immediate access to the information provided to financial analysts and similar recipients and can obtain this information in both German and English. The Company is firmly committed to following a fair information policy. Regular meetings with analysts and investors in the context of road shows and individual meetings play a central role in investor relations at MorphoSys. Conference calls accompany publication of quarterly results and give analysts and investors an immediate opportunity to ask questions about the Company’s development. Company presentations for on-site events, visual and audio recordings of other important events as well as conference call transcripts are also available on the Company’s website to all interested parties. The Company’s website www.morphosys.com serves as a central platform for current information on the Company and its development. Financial reports, analyst meetings and conference presentations, as well as press releases and ad hoc statements, are also available. The important regularly scheduled publications and events (annual reports, interim reports, annual general meetings and press and analyst conferences) are published in the Company’s financial calendar well in advance. ESTABLISHMENT OF SPECIFIC TARGETS FOR THE COMPOSITION OF THE SUPERVISORY BOARD The Supervisory Board shall determine concrete objectives regarding its composition and prepare a profile of skills and expertise for the Supervisory Board such that (i) the Supervisory Board in its entirety has the necessary knowledge, skills and professional experience to properly perform its duties, (ii) the Company’s international activities and potential conflicts of interest are taken into consideration, (iii) a sufficient number of
Statement on Corporate Governance, Group Statement on Corporate Governance and Corporate Governance Report Group Management Report 91 FINANCIAL STATEMENTS independent Supervisory Board members is ensured, (iv) an age limit and a regular limit on the length of service is specified for members of the Supervisory Board, and (v) the aspect of diversity is taken into account. In view of these factors and in consideration of the Company’s specific circumstances (Section 5.4.1 of the German Corporate Governance Code), the Supervisory Board first set targets for its composition in July 2015 and reviewed and updated these targets on July 26, 2017. The Supervisory Board has taken these targets into account when it submitted its proposal for the election of three new members to the Supervisory Board to the 2018 Annual General Meeting, while at the same time aiming at fulfilling the overall profile of reported skills and expertise of the Supervisory Board. The implementation of these targets is as follows: APPROPRIATE REPRESENTATION OF WOMEN AND DIVERSITY Our Supervisory Board has a total of six members, two of whom are women. The Supervisory Board strongly believes that, at 33.33 %, the current proportion of women is appropriate and intends to maintain this proportion in the future. The Supervisory Board currently fulfills this quota. The Supervisory Board also believes a quota of at least two non-German members or at least two members with extensive international experience represents a fair share of diversity given our international orientation. The Supervisory Board currently meets this quota. INDEPENDENCE The Supervisory Board considers it appropriate that at least four of its members are independent (Section 5.4.2 of the German Corporate Governance Code and the Nasdaq listing rules). Members of the Supervisory Board are considered independent when they have no personal or business relationship with MorphoSys, its management, a controlling shareholder or an affiliate that may give rise to a material and more than temporary conflict of interest. All six current members of the Supervisory Board meet the criteria to be classified as independent. Therefore, the Supervisory Board currently meets the quota of four independent members. Significant and more than temporary conflicts of interest should be avoided, especially when it involves work for major competitors. It should be noted, however, that conflicts of interest in certain cases cannot be excluded. Any potential conflicts of interest must be disclosed to the Chairperson of the Supervisory Board and remedied appropriately. There are currently no conflicts of interest. AGE LIMIT At the time of their appointment by the Annual General Meeting, Supervisory Board members should not be older than 75 years. However, the Supervisory Board may decide to make an exception in specific cases. The age limit of 75 years is currently met by the Supervisory Board members. TERM OF APPOINTMENT At the Annual General Meeting, the Supervisory Board intends to propose an initial two-year period of office for Supervisory Board members. The Supervisory Board intends to allow reappointment twice, each for an additional term of three years, but reserves the right to make exceptions in specific cases and propose to the Annual General Meeting to permit members to be reappointed for a fourth term of three years. Since the time of setting this target, the maximum term of appointment for all elected Supervisory Board members has been respected. The Supervisory Board intends to adhere to the targets set for its composition when making future election proposals to the Annual General Meeting. SKILL AND EXPERIENCE PROFILE FOR THE SUPERVISORY BOARD AS A WHOLE In addition to defining specific targets, the Supervisory Board should develop a profile of skills and experience for the entire Supervisory Board (Section 5.4.1 of the German Corporate Governance Code). On July 26, 2017, the Supervisory Board defined the following profile of skills and experience for the entire Supervisory Board: PROFESSIONAL EXPERTISE AND EXPERIENCE Supervisory Board members should possess the necessary professional expertise and experience to fulfill their duties as members of the Supervisory Board of MorphoSys as an international biotechnology company. All current Supervisory Board members have the relevant experience in management positions in the pharmaceutical and biotechnology industries and, therefore, meet this requirement. In order to promote further cooperation between members of the Supervisory Board, care should be taken in the selection of candidates to ensure that the aspect of diversity in terms of professional background, expertise, experience and personality is sufficiently taken into account. GENER AL KNOWLEDGE All members of the Supervisory Board should have general knowledge of the industry in which we operate in order to make sufficient and substantial contributions to Supervisory Board meetings. All Supervisory Board members have the necessary expertise in the pharmaceutical and biotechnology industries based on their background and, therefore, meet this requirement. PROFESSIONAL EXPERTISE At least two members of the Supervisory Board must have extensive experience in drug development At least one Supervisory Board member must have expertise in the areas of accounting or auditing (Section 100 (5) AktG) At least one member of the Supervisory Board must have experience in human resource issues, particularly with regard to Management Board matters The Company currently meets the above targets.
Group Management Report 92 Statement on Corporate Governance, Group Statement on Corporate Governance and Corporate Governance Report SUFFICIENT AVAILABILITY OF TIME All members of the Supervisory Board must ensure that they have sufficient time available to properly perform their Supervisory Board duties. It must therefore be ensured that the Supervisory Board member is able to personally attend at least four ordinary Supervisory Board meetings per year, as well as the annual strategy meeting, for which a reasonable amount of preparation time is required in each case; the Supervisory Board member is able to attend extraordinary meetings of the Supervisory Board if necessary to deal with specific topics; the Supervisory Board member is able to attend the Annual General Meeting; the Supervisory Board member has sufficient time available to review the annual and consolidated financial statements; the Supervisory Board member sets aside additional time to prepare and participate in committee meetings, depending on his/her possible membership in one or more of the current three committees of the Supervisory Board. The Supervisory Board intends to observe the skills and experience profile for the entire Supervisory Board when making future election proposals to the Annual General Meeting. WOMEN’S QUOTA FOR THE SUPERVISORY BOARD, MANAGEMENT BOARD AND THE TWO MANAGEMENT LEVEL S BELOW THE MANAGEMENT BOARD In July 2015, the Supervisory Board adopted a women’s quota for the Supervisory Board for an initial period of two years. The Supervisory Board reviewed this quota in July 2017 and updated it as follows: “MorphoSys AG’s Supervisory Board has a total of six members. Two of those members are women, which places the current quota of 33.33% for female members on the Company’s Supervisory Board above the 30% target. The Supervisory Board confirms its decision regarding the quota for women on the Supervisory Board, which was passed in July 2015, and intends to maintain this ratio until June 30, 2022.” We continue to meet this target. In July 2015, the Supervisory Board adopted the following quota for women on the Management Board for an initial period of two years, which was reviewed and updated in July 2017 as follows: “The Management Board of MorphoSys AG has a total of five members, including one female member. The current ratio of women’s representation on the Management Board of the company is therefore below 30% and amounts to 20%. With reference to the decision on the quota of women on the Management Board, which was taken in July 2015, the Supervisory Board intends to achieve a ratio of 25% in the future, namely by June 30, 2022.” We do not currently meet this target. The reason this target has not been met was the unplanned departure of Dr. Marlies Sproll as Chief Scientific Officer as of October 31, 2017 for personal reasons and the appointment of Dr. Markus Enzelberger initially as Interim Chief Scientific Officer from April 15, 2017 to October 31, 2017, and then as Dr. Marlies Sproll’s successor as Chief Scientific Officer beginning on November 1, 2017. As a result, since October 31, 2017, the Management Board consists of four male members, and there are currently no women on the Management Board. In July 2015, the Management Board adopted the following quota for women in the first level of management below the Management Board for an initial period of two years and reviewed and updated it in July 2017 as follows: “At the time of the decision, the first management level below the Management Board (the Senior Management Group) consisted of 22 members, nine of whom were women, placing the level of female representation at this management level at 40.9%, which is above the 30% target. The Management Board confirms its July 2015 decision on the quota of women in the first level of management below the Management Board and intends to continue to maintain a minimum ratio of 30% until June 30, 2022.” We continue to meet this target. In July 2015, the Management Board adopted a women’s quota for the second level of management below the Management Board initially for a period of two years and reviewed and updated the quota in July 2017 as follows: “The second management level below the Management Board (i.e. the Company’s managers excluding the Senior Management Group) at the time of the decision consisted of 40 members, 14 of whom were women. This placed the quota of women in the second management level below the Company’s Management Board at 35%, which is above the 30% target at the time of the resolution. The Management Board confirms its July 2012 decision on the quota of women in the second level of management below the Management Board and intends o maintain a quota of at least 30% until June 30, 2022.” We continue to meet this target. DIVERSI T Y PLAN Diversity is firmly anchored in our corporate culture and our affiliates. All dimensions of diversity are of equal importance, be it age, gender, educational background, occupation, origin, religion, sexual orientation or identity. Our Management Board and Supervisory Board see it as their responsibility to further increase and effectively utilize the various aspects of diversity beyond the mere determination of targets for the proportion of women on the Management Board, Supervisory Board and in executive positions.

Statement on Corporate Governance, Group Statement on Corporate Governance and Corporate Governance Report Group Management Report We have not yet developed our own diversity plan with respect to the composition of the Management and Supervisory Boards. Nevertheless, the internal organization and continued development of an open and inclusive corporate culture play an important role in the day-to-day work of the Management and Supervisory Boards. The skills and experience profile for the Supervisory Board as a whole also takes diversity into consideration. The Management and Supervisory Boards intend to develop a diversity plan for their composition in the future that addresses key aspects of diversity, defines specific goals for this purpose and contains guidelines on how these goals should be achieved. Remuneration Report The Remuneration Report presents the principles, structure and amount of Management Board and Supervisory Board remuneration. The report complies with the legal provisions and considers the recommendations of the German Corporate Governance Code. MANAGEMENT BOARD REMUNERATION The Management Board’s remuneration system is intended to provide an incentive for performance-oriented and sustainable corporate management. Therefore, the aggregate remuneration of the Management Board members consists of different components: fixed components, an annual cash bonus based on the achievement of corporate targets (short-term incentive – STI), a variable compensation component with a long-term incentive (long-term incentive – LTI) and other remuneration components. Variable remuneration components with long-term incentive consist of performance share plans from the current and prior years, a convertible bond program from the year 2013, as well as a stock option plan from the current and prior year. Due to the successful U.S. listing the Management Board members received a special one-time bonus in the form of treasury shares held by MorphoSys AG. These shares could be called by the individual Management Board members during the time period from June 1 until end of December 2018 for a pre-defined maximal amount in EUR. The relevant number of shares was determined on the basis of the share price of one MOR share (final auction price in Xetra-trading on the Frankfurt Stock Exchange) on the date the shares were called. Management Board members also receive fringe benefits in the form of non-cash benefits, mainly the use of a company car and the payment of insurance premiums. All remuneration packages are reviewed annually for their scope and appropriateness by the Remuneration and Nomination Committee and are compared to the results of an annual Management Board remuneration analysis. The amount of compensation paid to Management Board members highly depends on their individual areas of responsibility, the Company’s economic situation and success and the Company’s business prospects versus its competition. All decisions concerning adjustments to remuneration packages are made by the entire Supervisory Board. The Management Board’s remuneration and index-linked pension scheme were last adjusted in July 2018. OVERVIEW In the 2018 financial year, total benefits of 6,904,508 (2017: 6,453,649) were granted to the Management Board in accordance with the provisions of the German Corporate Governance Code. Of the total remuneration granted for the year 2018, 3,616,602 was cash compensation and 3,287,906, or 48 %, resulted from personnel expenses for share-based compensation (remuneration with short-term incentive: one-time bonus award in shares due to the successful U.S. listing; remuneration with long-term incentive: performance share plan, stock option plan and convertible bond plan). The total amount of benefits paid to the Management Board in the 2018 financial year amounted to 7,505,917 (2017: 10,593,126). In addition to cash compensation payments of 3,189,972 (2017: 2,963,485), this amount includes primarily the relevant value under German tax law of the transfer of treasury stock from a performance-based share plan (share-based compensation), which amounted to 626,606 (2017: 1,986,671) as well as from the one-time bonus award in shares due to the successful U.S. listing, which amounted to 1,483,804 in 2018. Because convertible bonds were exercised in 2018 and 2017, the total amount for 2018 also included proceeds from the exercise of convertible bonds in the amount of 2,205,535 (2017: 4,743,008). As of April 11, 2018, a total of 6,969 treasury shares from the 2014 performance-based share plan for the Management Board vested because the vesting period for this LTI program had expired. The beneficiaries had the option to call the shares during a six-month period ending on October 10, 2018. All transactions in MorphoSys shares executed by members of the Management Board were reported as required by law and are published in the Corporate Governance Report as well as on the Company’s website. In accordance with the requirements of Section 4.2.5 (3) of the German Corporate Governance Code, the tables that follow provide detailed mandatory information on the remuneration of the individual Management Board members. Please note that the tables that follow are provided in the context of the Corporate Governance Report and differ from the information about Management Board remuneration presented in the Notes of this report (Item 7.4). These differences are due to the differing presentation requirements under the German Corporate Governance Code and IFRS*. *SEE GLOSSARY – page 188 FINANCIAL STATEMENTS 93

Group Management Report Statement on Corporate Governance, Group Statement on Corporate Governance and Corporate Governance Report 94 TABLE 17 Compensation of the Management Board in 2018 and 2017 (Disclosure in Accordance with the German Corporate Governance Code) BENEFITS GRANTED TO THE MANAGEMENT BOARD Dr. Simon Moroney Chief Executive Officer in 2017 2018 2018 (Minimum) 2018 (Maximum) Fixed Compensation 500,876 542,074 542,074 542,074 Fringe Benefits1 35,912 32,654 32,654 32,654 Total Fixed Compensation 536,788 574,728 574,728 574,728 One -Year Variable Compensation2 368,144 455,343 0 474,315 One-Time Bonus in Shares 0 483,616 0 483,616 Multi-Year Variable Compensation: 2013 Convertible Bonds Program3 (Vesting Period 4 Years) 58,224 0 0 0 2017 Long-Term Incentive Program4 (Vesting Period 4 Years) 343,009 0 0 0 2018 Long-Term Incentive Program4 (Vesting Period 4 Years) 0 307,529 0 1,230,116 2017 Stock Option Plan4 (Vesting Period 4 Years) 267,861 0 0 0 2018 Stock Option Plan4 (Vesting Period 4 Years) 0 300,770 0 1,203,080 Total Variable Compensation 1,037,238 1,547,258 0 3,391,127 Service Cost 149,567 158,788 158,788 158,788 Total Compensation 1,723,593 2,280,774 733,516 4,124,643 Dr. Markus Enzelberger5 Chief Scientific Officer Appointment (Interim-CSO): April 15, 2017 Appointment: November 1, 2017 in 2017 2018 2018 (Minimum) 2018 (Maximum) Fixed Compensation 204,698 321,300 321,300 321,300 Fringe Benefits1 417,158 31,211 31,211 31,211 Total Fixed Compensation 621,856 352,511 352,511 352,511 One -Year Variable Compensation2 121,688 269,892 0 281,138 One-Time Bonus in Shares 0 286,650 0 286,650 Multi-Year Variable Compensation: 2013 Convertible Bonds Program3 (Vesting Period 4 Years) 0 0 0 0 2017 Long-Term Incentive Program4 (Vesting Period 4 Years) 144,354 0 0 0 2018 Long-Term Incentive Program4 (Vesting Period 4 Years) 0 201,463 0 805,852 2017 Stock Option Plan4 (Vesting Period 4 Years) 112,745 0 0 0 2018 Stock Option Plan4 (Vesting Period 4 Years) 0 197,065 0 788,260 Total Variable Compensation 378,787 955,070 0 2,161,900 Service Cost 29,186 68,515 68,515 68,515 Total Compensation 1,029,829 1,376,096 421,026 2,582,926 1 In 2017, the fringe benefits of Dr. Malte Peters and Dr. Markus Enzelberger each included a one-time compensation in the form of MorphoSys shares as an incentive to join the Management Board of MorphoSys AG. 2 The one-year compensation granted for the 2018 financial year represents the bonus accrual for 2018 that will be paid in February 2019. The bonus granted for the 2017 financial year was paid in February 2018. 3 Stock-based compensation plans not issued on an annual basis. The fair value was determined pursuant to the regulations of IFRS 2 “Share-based Payment.” For plans that are not issued annually, the pro rata share of personnel expenses resulting from share-based payments is presented for each financial year.

Statement on Corporate Governance, Group Statement on Corporate Governance and Corporate Governance Report Group Management Report 95 Jens Holstein Chief Financial Officer Dr. Malte Peters Chief Development Officer Appointment: March 1, 2017 2017 2018 2018 (Minimum) 2018 (Maximum) 2017 2018 2018 (Minimum) 2018 (Maximum) 372,652 402,235 402,235 402,235 281,500 397,800 397,800 397,800 42,905 46,725 46,725 46,725 568,644 30,613 30,613 30,613 415,557 448,960 448,960 448,960 850,144 428,413 428,413 428,413 273,899 337,877 0 351,955 206,903 334,152 0 348,075 0 358,857 0 358,857 0 354,900 0 354,900 59,641 0 0 0 0 0 0 0 224,747 0 0 0 224,747 0 0 0 0 201,463 0 805,852 0 201,463 0 805,852 175,498 0 0 0 175,498 0 0 0 0 197,065 0 788,260 0 197,065 0 788,260 733,785 1,095,262 0 2,304,924 607,148 1,087,580 0 2,297,087 99,949 111,233 111,233 111,233 60,967 76,190 76,190 76,190 1,249,291 1,655,455 560,193 2,865,117 1,518,259 1,592,183 504,603 2,801,690 Dr. Marlies Sproll6 Chief Scientific Officer Temporary Leave: April 15, 2017 October 31, 2017 Resignation: October 31, 2017 Dr. Arndt Schottelius Chief Development Officer Resignation: February 28, 2017 Total 2017 2018 2018 (Minimum) 2018 (Maximum) 2017 2018 2018 (Minimum) 2018 (Maximum) 2017 2018 2018 (Minimum) 2018 (Maximum) 222,450 0 0 0 103,253 0 0 0 1,685,429 1,663,409 1,663,409 1,663,409 20,427 0 0 0 9,161 0 0 0 1,094,207 141,203 141,203 141,203 242,877 0 0 0 112,414 0 0 0 2,779,636 1,804,612 1,804,612 1,804,612 67,745 0 0 0 23,490 0 0 0 1,061,869 1,397,264 0 1,455,483 0 0 0 0 0 0 0 0 0 1,484,023 0 1,484,023 39,879 0 0 0 39,879 0 0 0 197,623 0 0 0 168,543 0 0 0 0 0 0 0 1,105,400 0 0 0 0 0 0 0 0 0 0 0 0 911,918 0 3,647,672 131,629 0 0 0 0 0 0 0 863,231 0 0 0 0 0 0 0 0 0 0 0 0 891,965 0 3,567,860 407,796 0 0 0 63,369 0 0 0 3,228,123 4,685,170 0 10,155,038 77,976 0 0 0 28,245 0 0 0 445,890 414,726 414,726 414,726 728,649 0 0 0 204,028 0 0 0 6,453,649 6,904,508 2,219,338 12,374,376 4 Stock-based compensation plans issued annually. The fair value was determined pursuant to the regulations of IFRS 2 “Share-based Payment.” For plans issued annually, the personnel expenses resulting from share-based payments are presented for the entire term at the time of issue. 5 In 2017, the figures presented for Dr. Markus Enzelberger do not include any compensation granted for his activities as a member of the Senior Management Group as they do not relate to his appointment as a member of the Management Board. 6 Dr. Marlies Sproll left the Management Board of MorphoSys AG on October 31, 2017. Since November 1, 2017, Dr. Marlies Sproll has taken on a new part-time role at MorphoSys as Special Advisor to the CEO. Therefore, the figures presented for Dr. Marlies Sproll do not include any remuneration granted for these activities. FINANCIAL STATEMENTS

Group Management Report Statement on Corporate Governance, Group Statement on Corporate Governance and Corporate Governance Report 96 PAYMENTS DURING THE FINANCIAL YEAR Dr. Simon Moroney Chief Executive Officer Jens Holstein Chief Financial Officer Dr. Malte Peters Chief Development Officer Appointment: March 1, 2017 in 2017 2018 2017 2018 2017 2018 Fixed Compensation 500,876 542,074 372,652 402,235 281,500 397,800 Fringe Benefits1 35,912 32,654 42,905 46,725 568,644 30,613 Total Fixed Compensation 536,788 574,728 415,557 448,960 850,144 428,413 One-time bonus award in shares 0 483,597 0 358,785 0 354,822 One-Year Variable Compensation2 210,873 368,144 143,054 273,899 0 206,903 Multi-Year Variable Compensation: 2013 Convertible Bonds Program3 (Vesting Period 4 Years) 0 0 658,350 2,205,535 0 0 2013 Long-Term Incentive Program3 (Vesting Period 4 Years) 650,378 0 445,431 0 0 0 2014 Long-Term Incentive Program3 (Vesting Period 4 Years) 0 351,412 0 223,600 0 0 Other4 0 0 0 0 0 0 Total Variable Compensation 861,251 1,203,153 1,246,835 3,061,819 0 561,725 Service Cost 149,567 158,788 99,949 111,233 60,967 76,190 Total Compensation 1,547,606 1,936,669 1,762,341 3,622,012 911,111 1,066,328 1 In 2017, the fringe benefits of Dr. Malte Peters and Dr. Markus Enzelberger each included a one-time compensation in the form of MorphoSys shares as an incentive to join the Management Board of MorphoSys AG. 2 The one-year variable compensation presented here represents the bonus paid in the respective financial year for the previous financial year. 3 The date and value of the payments is the date and value applicable under German tax law. Therefore, this table shows the non-cash benefits arising in the respective financial year from the difference between the exercise or conversion price and the stock market price at the time of exercising the convertible bonds or at the time of transfer of own shares from a performance share plan. 4 No compensation recovery claims against the Management Board existed in 2018 or 2017. FIXED REMUNERATION AND FRINGE BENEFITS The non-performance-related remuneration of the Management Board consists of fixed remuneration and additional benefits, which primarily include the use of company cars, as well as subsidies for health, welfare and disability insurance. The Chief Financial Officer, Mr. Jens Holstein, receives an additional expense allowance for maintaining two households. PENSION EXPENSES The Company also provides payments to Management Board members equal to a maximum of 10 % of the member’s fixed annual salary and partly plus any taxes payable. This compensation is intended for the members’ individual retirement plans. Additionally, all Management Board members participate in a pension plan in the form of a provident fund, which was introduced in cooperation with Allianz Pensions-Management e.V. The pension obligations of the provident fund will be met by Allianz Pensions-Management e.V. These pension obligations are not pension benefit plans.

Statement on Corporate Governance, Group Statement on Corporate Governance and Corporate Governance Report Group Management Report 97 FINANCIAL STATEMENTS Dr. Markus Enzelberger 5 Chief Scientific Officer Appointment (Interim-CSO): April 15, 2017 Appointment: November 1, 2017 Dr. Marlies Sproll 6 Chief Scientific Officer Temporary Leave: April 15, 2017 - October 31, 2017 Resignation: October 31, 2017 Dr. Arndt Schottelius7 Chief Development Officer Resignation: February 28, 2017 Total 2017 2018 2017 2018 2017 2018 2017 2018 204,698 321,300 222,450 0 103,253 0 1,685,429 1,663,409 417,158 31,211 20,427 0 9,161 0 1,094,207 141,203 621,856 352,511 242,877 0 112,414 0 2,779,636 1,804,612 0 286,600 0 0 0 0 0 1,483,804 0 121,688 143,054 0 140,940 0 637,921 970,634 0 0 0 0 2,800,381 0 1,284,277 0 4,743,008 2,205,535 0 0 445,431 0 445,431 0 1,986,671 0 0 51,594 0 0 0 0 0 626,606 0 0 0 0 0 0 0 0 0 459,882 3,388,866 0 1,870,648 0 7,367,600 5,286,579 29,186 68,515 77,976 0 28,245 0 445,890 414,726 651,042 880,908 3,709,719 0 2,011,307 0 10,593,126 7,505,917 5 In 2017, the figures presented for Dr. Markus Enzelberger do not include any payments for his activities as a member of the Senior Management Group as they do not relate to his appointment as a member of the Management Board. 6 Dr. Marlies Sproll left the Management Board of MorphoSys AG on October 31, 2017. Since November 1, 2017, Dr. Marlies Sproll has taken on a new part-time role at MorphoSys as Special Advisor to the CEO. Therefore, the payments presented for Dr.Marlies Sproll do not include any remuneration for these activities. 7 In 2017, the figures presented for Dr. Arndt Schottelius do include remuneration from the exercise of convertible bonds and the transfer of treasury stock from a long-term incentive program after his resignation as Chief Development Officer. These were granted for his activities as a member of the Management Board in previous years. PERFORMANCE - BASED COMPENSATION (SHORT-TERM INCENTIVE - STI) Members of the Management Board each receive performance-based compensation in the form of an annual bonus payment of up to 70 % of the gross base salary when 100 % of the member’s targets have been achieved. These bonus payments are dependent on the achievement of corporate targets specified by the Supervisory Board at the start of each financial year. Targets are typically based on, amongst other objectives, the Company’s performance and the progress of the partnered pipeline and the Company’s proprietary pipeline. At the start of the year, the Supervisory Board assesses the degree to which corporate goals were achieved in the prior year and uses this information to determine the bonus. The bonus may not exceed 125 % of the target amount (corresponding to 87.5 % of the gross base salary). Performance-based compensation can be reduced to zero if goals are not achieved. The bonus for the 2018 financial year will be paid in February 2019.

Group Management Report Statement on Corporate Governance, Group Statement on Corporate Governance and Corporate Governance Report 98 LONG -TERM INCENTIVE COMPENSATION (LONG -TERM INCENTIVE – LTI) In 2011, MorphoSys introduced a long-term incentive compensation plan (Performance Share Plan) for the Management Board and members of the Senior Management Group. The Performance Share Plan is based on the allocation of shares linked to the achievement of predefined performance targets over a four-year period. Each year, the Supervisory Board determines the number of shares to be allocated to the Management Board. On April 1, 2018, the Management Board members were granted a total of 8,804 shares. Each Management Board member received an entitlement benefit for a specific number of shares. For more information, please refer to Item 7.3.5 in the Notes to the Consolidated Financial Statements and the explanation on stock repurchases in the Corporate Governance Report. Long-term performance targets are set by the Supervisory Board at the time the shares are allocated for a specific year. The defined targets for the 2018 Performance Share Plan were the absolute performance of MorphoSys shares, as well as the relative performance of MorphoSys shares relative to a benchmark index comprising of equal parts of the Nasdaq Biotechnology Index and the TecDAX Index. The absolute and relative performance of the share price for each of the four assessment periods (one year each) is determined by comparing the average share price of the last 30 trading days prior to the beginning of the relevant assessment period (April 1) with the average share price of the last 30 trading days prior to the end of the evaluation period. The participants in the Performance Share Plan receive an annual share entitlement, which will be evaluated on the basis of the absolute and relative performance of the share price, that is, a comparison of the performance of MorphoSys shares versus the benchmark index. Depending on the absolute and relative performance of the share price over the course of an evaluation period, certain (absolute and relative) tiered target attainment levels between 10 % and 300 % can be achieved. Exceeding the target attainment level of 300 % does not grant entitlement to additional shares during the relevant assessment period (cap). At the end of the four-year term, a total level of target achievement based on the absolute and relative target attainment levels has to be established. The average absolute and relative attainment levels reached are weighted at 50 %. The overall target achievement is capped at 200 %. The ultimate number of performance shares allocated to the Performance Share Plan participants is determined at the completion of the program, which spans four years. This calculation incorporates the number of shares initially granted (“grants”) multiplied with the total level of target achievement, as well as a “company factor” that is determined at the Supervisory Board’s discretion. This company factor is a number between zero and two that is set by the Supervisory Board based on the Company’s situation. The company factor’s predefined default value is one (1). In 2017, MorphoSys also introduced a stock option plan (SOP*) as another form of long-term incentive compensation based on the resolution of the Annual General Meeting on June 2, 2016 (Agenda Item 9). As of April 1, 2018, a total of 29,312 stock options were granted to the Management Board. Each member of the Management Board received a specific number of stock options that entitle them to purchase up to two MorphoSys shares each. Further details can be found in Item 7.1 in the Notes to the Consolidated Financial Statements and the explanations on stock repurchases in the Corporate Governance Report. *SEE GLOSSARY – page 188 In accordance with the resolution of the Annual General Meeting on June 2, 2016 (Agenda Item 9), the SOP’s performance targets include the absolute price performance of MorphoSys shares and the relative price performance of MorphoSys shares compared to a benchmark index. The benchmark index consists of equal parts of the Nasdaq Biotechnology Index and the TecDAX Index. Each performance target has a 50 % weighting in the achievement of the overall target. To determine the degree of target achievement for each performance target, the four-year vesting period (until the first stock options can be exercised) is subdivided into four equal periods of one year each. An arithmetic mean is calculated based on the degree of target achievement in each of the four years. This, in turn, determines the final percentage of target achievement for each performance target. The final percentage of target achievement for each of the two performance targets are then added together and divided by two, the result being the overall level of target achievement.

Statement on Corporate Governance, Group Statement on Corporate Governance and Corporate Governance Report Group Management Report 99 FINANCIAL STATEMENTS For the performance target of absolute price performance, a comparison is made between the stock market price of MorphoSys shares at the beginning of each year in the four-year period with the price at the end of each respective period. If MorphoSys shares perform well, the degree of target achievement can reach up to 200 % on a straight-line basis for that particular year. Any further positive share price development of MorphoSys shares will not lead to any further increase in the performance target (cap). For the performance target of relative price performance, the development of MorphoSys’s share price is compared with the development of the benchmark index during each annual period and set in relation to each other. In forming the benchmark index, the Nasdaq Biotech Index and the TecDAX Index are each weighted at 50 % in such a way that the percentage price movements of each index are added for the respective annual period and divided by two. If MorphoSys shares outperform the benchmark index, the degree of target achievement for the relevant period can reach up to 200 % on a straight-line basis. Any further positive share price development of MorphoSys shares versus the benchmark index will not lead to any further increase in the performance target (cap). Stock options can only be exercised when the four-year (minimum) vesting period prescribed by law has expired, and the specified minimum value for the degree of target achievement of a performance target has been exceeded. The ultimate number of exercisable stock options is calculated by multiplying the number of initially granted stock options (“grants”) by the total level of target achievement and rounding up to the nearest whole number. The resulting ultimate number of stock options is limited to 200 % of the initially granted number of stock options. The stock options are settled in the form of Company shares, with each stock option entitling the holder to one share for the final number of stock options. When the stock options are exercised, the exercise price must be paid for each underlying share. The exercise price corresponds to the average closing auction price of MorphoSys shares in the 30 trading days prior to the day on which the stock options were issued. The terms of the stock option plan provide further details on the granting and settlement of stock options, the issue of Company shares from the Conditional Capital 2016-III and the administration of the SOP. For more information, please refer to the corresponding resolution of the Annual General Meeting on June 2, 2016 (Agenda Item 9). MISCELLANEOUS None of the Management Board members were granted any loans or similar benefits in the reporting year nor have they received any benefits from third parties that were promised or granted based on their positions as members of the Management Board. PAYMENTS UPON TERMINATION OF MANAGEMENT BOARD EMPLOYMENT CONTRACTS/CHANGE OF CONTROL In case of a premature termination of the service contract with a Management Board member, the compensation, including fringe benefits, is capped at 200 % of the fixed yearly gross salary and the annual bonus (Severance Cap) and no more than the remaining term of the service contract is compensated. If the service contract is terminated for good cause for which the Management Board member is responsible, such member is not entitled to any payments. The Severance Cap is calculated on the basis of the total compensation of the full business year prior to the termination and, if appropriate, the expected total compensation of the business year in which the termination occurs. If a Management Board member’s service contract terminates due to the member’s death, the member’s spouse or life partner is entitled to the fixed monthly salary for the month of death and the 12 months thereafter. In the event of a change of control, Management Board members are entitled to exercise their extraordinary right to terminate their employment contracts and demand the fixed salary and annual bonus still outstanding until the end of the service contract, however at least 200 % of the fixed yearly gross salary and annual bonus. Moreover, in such a case, all stock options and performance shares granted will become vested immediately and can be exercised after the expiration of the statutory vesting periods or blackout periods. A change of control has occurred when (i) MorphoSys transfers

Group Management Report Statement on Corporate Governance, Group Statement on Corporate Governance and Corporate Governance Report 100 assets or a substantial portion of its assets to unaffiliated third parties, (ii) MorphoSys merges with an unaffiliated company, (iii) MorphoSys AG as dominated company becomes party to an agreement pursuant to Section 291 of the German Stock Corporation Act or MorphoSys is integrated in accordance with Section 319 of the German Stock Corporation Act, or (iv) a shareholder or third party holds 30 % or more of MorphoSys’s voting rights. In addition, post-contractual non-compete clauses exist with the members of the Board of Management, providing for compensatory payments to be made by MorphoSys AG until six months after the service contract has terminated. During the duration of the non-compete clause, the compensatory payment amounts to up to 100 % of the fixed salary. CHANGE IN THE COMPOSITION OF THE MANAGEMENT BOARD There was no change in the composition of our Management Board in the 2018 financial year. AGE LIMIT The age limit for Executive Board members at the time of their appointment or re-appointment by the Supervisory Board shall correspond to 67 years. Exceptions thereto may be resolved by the Supervisory Board in the individual case. The age limit of 67 years is currently respected by the Executive Board members. SAY ON PAY Due to the existing legal uncertainty resulting from the forthcoming legal changes to the Shareholders’ Rights Directive and the German Corporate Governance Code, MorphoSys will deliberately refrain from submitting the Management Board compensation system to a vote at its forthcoming 2019 Annual General Meeting. The current remuneration system for the members of the Management Board remains unchanged from the remuneration system approved by the Annual General Meeting on May 19, 2011 with a majority of more than 91 %. A corresponding vote on the remuneration system is planned for the 2020 Annual General Meeting. SUPERVISORY BOARD REMUNERATION The remuneration of Supervisory Board members is governed by our Articles of Association and a corresponding Annual General Meeting resolution on Supervisory Board remuneration. In the 2018 financial year, Supervisory Board members received fixed compensation, attendance fees and expense allowances for their participation in Supervisory Board and committee meetings. Each Supervisory Board member has received annual fixed compensation ( 85,400 for Chairpersons, 51,240 for Deputy Chairpersons and 34,160 for all other members) for their membership of the Supervisory Board. The Chairperson receives 4,000 for each Supervisory Board meeting chaired and the other members receive 2,000 for each Supervisory Board meeting attended. For committee work, the committee Chairperson receives 12,000 and other committee members each receive 6,000. Committee members also receive 1,200 for their participation in a committee meeting. Participation in a Supervisory Board or committee meeting by telephone or video conference results in a 50 % reduction in compensation for meeting participation. Supervisory Board members residing outside of Europe who personally take part in a Supervisory Board or committee meeting are entitled to a fixed expense allowance of 2,000 (plus any sales tax due) for additional travel time in addition to attendance fees and reimbursed expenses. Supervisory Board members are also reimbursed for travel expenses and value-added taxes (VAT) on their compensation. In the 2018 financial year, Supervisory Board members received a total of 525,428 (2017: 523,015) excluding the reimbursement of travel expenses. This amount consists of fixed compensation and attendance fees for participating in Supervisory Board and committee meetings. We did not grant any loans to Supervisory Board members. The table below details the Supervisory Board’s remuneration.

Statement on Corporate Governance, Group Statement on Corporate Governance and Corporate Governance Report Group Management Report 101 FINANCIAL STATEMENTS TABLE 18 Compensation of the Supervisory Board in 2018 and 2017 Fixed Compensation Attendance Fees1 Attendance Fees in 2018 2017 2018 2017 2018 2017 Dr. Marc Cluzel 76,742 52,160 32,400 26,800 109,142 78,960 Dr. Frank Morich 61,004 57,240 23,200 23, 200 84,204 80,440 Krisja Vermeylen 49,916 28,961 24,400 16,000 74,316 44,961 Wendy Johnson 46,160 46, 160 37,400 38,000 83,560 84,160 Dr. George Golumbeski2 28,961 - 25,200 - 54,161 -Michael Brosnan2 28,961 - 18,600 - 47,561 -Dr. Gerald Möller3 36,558 95,156 11,800 36,800 48,358 131,956 Klaus Kühn3 17,326 46,160 6,800 22,000 24,126 68,160 Karin Eastham4 - 19,578 - 14,800 - 34,378 TOTAL 345,628 345,415 179,800 177,600 525,428 523,015 1 The attendance fee contains expense allowances for the attendence at the Supervisory Board and the Committee meetings. 2 Dr. George Golumbeski and Michael Brosnan have joined the Supervisory Board of MorphoSys AG on May 17, 2018. 3 Dr. GeraldMöller and Klaus Kühn have left the Supervisory Board of MorphoSys AG AG on May 17, 2018. 4 Karin Eastham has left the Supervisory Board of MorphoSys AG AG on May 17, 2017. HOLDINGS OF MANAGEMENT BOARD AND SUPERVISORY BOARD MEMBERS The members of the Management Board and the Supervisory Board hold more than 1 % of the shares issued by the Company. All shares, performance shares, stock options and convertible bonds held by each member of the Management Board and the Supervisory Board are listed below.

Group Management Report Statement on Corporate Governance, Group Statement on Corporate Governance and Corporate Governance Report 102 TABLE 19 Directors’ Holdings SHARES 01/01/2018 Additions Sales 12/31/2018 MANAGEMENT BOARD Dr. Simon Moroney 483,709 8,928 8, 928 483,709 Jens Holstein 11,000 36,554 30,537 17,017 Dr. Malte Peters 9,505 3,313 0 12,818 Dr. Markus Enzelberger 7,262 3,248 8,834 1,676 TOTAL 511,476 52,043 48, 299 515, 220 SUPERVISORY BOARD Dr. Marc Cluzel 500 0 0 500 Dr. Frank Morich 1,000 0 0 1,000 Krisja Vermeylen 350 0 0 350 Wendy Johnson 500 0 0 500 Dr. George Golumbeski1 0 0 0 Michael Brosnan1 0 0 0 Dr. Gerald Möller2 11,000 900 0 Klaus Kühn2 0 0 0 TOTAL 13,350 900 0 2,350 STOCK OPTIONS 01/01/2018 Additions Forfeitures3 Exercises 12/31/2018 MANAGEMENT BOARD Dr. Simon Moroney 12,511 9,884 0 0 22,395 Jens Holstein 8,197 6,476 0 0 14,673 Dr. Malte Peters 8,197 6,476 0 0 14,673 Dr. Markus Enzelberger 5,266 6,476 0 0 11,742 TOTAL 34,171 29,312 0 0 63,483

Statement on Corporate Governance, Group Statement on Corporate Governance and Corporate Governance Report Group Management Report 103 FINANCIAL STATEMENTS CONVERTIBLE BONDS 01/01/2018 Additions Forfeitures3 Exercises 12/31/2018 MANAGEMENT BOARD Dr. Simon Moroney 88,386 0 0 0 88,386 Jens Holstein 60,537 0 0 30,537 30,000 Dr. Malte Peters 0 0 0 0 0 Dr. Markus Enzelberger 0 0 0 0 0 TOTAL 148,923 0 0 30,537 118,386 PERFORMANCE SHARES 01/01/2018 Additions Forfeitures3 Allocations4 12/31/2018 MANAGEMENT BOARD Dr. Simon Moroney 30,060 2,969 2,182 3,797 27,050 Jens Holstein 20,086 1,945 1,495 2,600 17,936 Dr. Malte Peters 3,187 1,945 0 0 5,132 Dr. Markus Enzelberger 5,987 1,945 329 572 7,031 TOTAL 59,320 8,804 4,006 6,969 57,149 1 Dr. George Golumbeski and Michael Brosnan have joined the Supervisory Board of MorphoSys AG on May 17, 2018. 2 Dr. Gerald Möller and Klaus Kühn have left the Supervisory Board of MorphoSys AG AG on May 17, 2018. Changes in the number of shares after resignation from the Supervisory Board of MorphoSys AG are not presented in the tables. 3 Forfeited performance Shares are a result of the KPI achievement rate of 63.5 % and a company factor of 1.0 as determined at the end of the performance period of the LTI plan 2014. 4 Allocations are made as soon as performance shares are transferred within the six-month exercise period after the end of the four-year waiting period. The members of our Supervisory Board do not hold stock options, convertible bonds or performance shares. MANAGERS TRANSACTIONS In accordance with the relevant legal provisions of Article 19 para. 1 (a) of the Market Abuse Regulation (MAR), the members of MorphoSys AG’s Management Board and Supervisory Board and persons related to such members are required to disclose any trading in MorphoSys shares. During the reporting year, MorphoSys received the following notifications under Article 19 para 1 (a) MAR listed in the table below.

Group Management Report Statement on Corporate Governance, Group Statement on Corporate Governance and Corporate Governance Report 104 TABLE 20 Managers Transactions in 2018 Party Subject to the Notification Requirement Function Date of Transaction in 2018 Type of Transaction Aggregated Share Price Aggregated Volume Place of Transaction Markus Chief Scientific Enzelberger Officer 09/24/2018 Disposal 91.43 52,296.75 Xetra Simon Chief Executive Moroney Officer 09/20/2018 Disposal 93.63 323,300.40 Xetra Simon Chief Executive Moroney Officer 09/19/2018 Disposal 94.1 515,186.55 Xetra Markus Chief Scientific Enzelberger Officer 08/07/2018 Disposal 107.35 886,946.90 Xetra Purchase of 2,676 shares as part of Markus Chief Scientific his remuneration as member of the Outside a Enzelberger Officer 08/06/2018 Managing Board (issuer’s own shares) not numberable not numberable trading venue Chief Purchase of 3,313 shares as part of Development his remuneration as member of the Outside a Malte Peters Officer 08/06/2018 Managing Board (issuer’s own shares) not numberable not numberable trading venue Chief Financial Jens Holstein Officer 08/06/2018 Disposal 105.58 622,920.00 Xetra Purchase of 3,417 shares as part of Chief Financial his remuneration as member of the Outside a Jens Holstein Officer 08/03/2018 Managing Board (issuer’s own shares) not numberable not numberable trading venue Purchase of shares based on conversion of convertible bonds as part of his remu-Chief Financial neration as member of the Managing Outside a Jens Holstein Officer 08/03/2018 Board (Convertible Bonds Program 2013) 31,875 973,366,875 trading venue Chief Financial Jens Holstein Officer 08/03/2018 Disposal 105.13 259,084.30 Xetra Member of the Dr. Gerald Supervisory Möller Board 05/09/2018 Purchase 88.70 79,830.00 Xetra Allocation of 3,797 shares as part of his remuneration as member of the Dr. Simon Chief Executive Managing Board (Long-Term Incentive Outside a Moroney Officer 04/11/2018 Program 2014) (issuer’s own shares) not numberable not numberable trading venue Allocation of 2,600 shares as part of his remuneration as member of the Chief Financial Managing Board (Long-Term Incentive Outside a Jens Holstein Officer 04/11/2018 Program 2014) (issuer’s own shares) not numberable not numberable trading venue Allocation of 572 shares as part of his remuneration as member of the Markus Chief Scientific Managing Board (Long-Term Incentive Outside a Enzelberger Officer 04/11/2018 Program 2014) (issuer’s own shares) not numberable not numberable trading venue Acceptance of 9,884 stock options to subscribe for up to 2 shares each within Simon Chief Executive the compensation as a Management Board Outside a Moroney Officer 04/10/2018 Member (Stock Option-Program 2018) not numberable not numberable trading venue Acceptance of 6,476 stock options to subscribe for up to 2 shares each within Chief Financial the compensation as a Management Board Outside a Jens Holstein Officer 04/10/2018 Member (Stock Option-Program 2018) not numberable not numberable trading venue Acceptance of 6,476 stock options to subscribe for up to 2 shares each within Markus Chief Scientific the compensation as a Management Board Outside a Enzelberger Officer 04/10/2018 Member (Stock Option-Program 2018) not numberable not numberable trading venue Acceptance of 6,476 stock options to subscribe for up to 2 shares each within Chief Develop- the compensation as a Management Board Outside a Malte Peters ment Officer 04/10/2018 Member (Stock Option-Program 2018) not numberable not numberable trading venue

FINANCIAL STATEMENTS Statement on Corporate Governance, Group Statement on Corporate Governance and Corporate Governance Report Group Management Report 105 AVOIDING CONFLICTS OF INTEREST Management Board and Supervisory Board members are required to refrain from any actions that could lead to a conflict of interest with their duties at MorphoSys AG. Such transactions or the secondary employment of Management Board members must be disclosed immediately to the Supervisory Board and are subject to the Board’s approval. The Supervisory Board, in turn, must inform the Annual General Meeting of any conflicts of interest and their handling. In the 2018 financial year, no conflicts of interest arose in the Supervisory Board. STOCK REPURCHASES By resolution of the Annual General Meeting on May 23, 2014, MorphoSys is authorized in accordance with Section 71 (1) no. 8 AktG to repurchase its own shares in an amount of up to 10 % of the existing common stock. This authorization can be exercised in whole or in part, once or several times by the Company or a third party on the Company’s behalf for the purposes specified in the authorizing resolution. It is at the Management Board’s discretion to decide whether to carry out a repurchase on a stock exchange, via a public offer or through a public invitation to submit a bid. In 2018, MorphoSys did not repurchase any shares based on the authorization from the year 2014. INFORMATION TECHNOLOGY In preparation for our planned transition to a commercial bio-pharmaceutical company, the replacement of our current ERP system with SAP Business By Design was started in April 2018. In parallel, we started the integration of SAP Concur in July 2018 to substitute our legacy systems for absence and business travel management. IT security and compliance continued to be key topics in the area of information technology in 2018. External security experts checked the technical security controls, inter alia, using simulated different hacking attacks to detect potential weaknesses. The IT Security Awareness Campaign (ISAC) simulated deceitful phishing attacks to sensitize employees for their co-responsibility and essential contribution to IT security in our organization. Any security-relevant system notifications or user notifications that occurred were analyzed by the internal CERT (Computer Emergency Response Team) with partial external support. As in the previous year, no serious security incidents occurred. A SIEM (Security Information and Event Management) system was integrated to optimize our cyber defense measures. The previous system for auditing and tracking system changes, configurations and access controls was replaced with a new tool enabling control over changes, configurations and access in our hybrid IT environment. The new tool provides additional intelligence to identify security risks, detect anomalous user behavior and investigate threat patterns in time to prevent damage. INFORMATION ON THE INTERNAL CONTROL AND RISK MANAGEMENT SYSTEM WITH REGARD TO THE ACCOUNTING PROCESS UNDER SECTION 289 (4) AND SECTION 315 (4) HGB In the 2018 financial year, we completed a regular update of the documentation for our existing internal control and risk management system. This update serves to maintain adequate internal control over financial reporting and to ensure the availability of key controls so that financial figures can be reported as precisely and accurately as possible. COSO (Committee of Sponsoring Organizations of the Treadway Commission) defines the corresponding COSO framework (“Internal Control - Integrated Framework”). We use this framework which is the most commonly used for the internal control over financial reporting. System constraints make it impossible to give absolute assurance that internal controls will always prevent or completely detect all misrepresentations made in the context of financial reporting. Internal controls can only provide reasonable assurance that financial reporting is reliable and verify that the financial statements were prepared in accordance with the IFRS standards that were effective on and endorsed by the European Union (EU) for external purposes. The consolidated financial statements are subjected to numerous preparation, review and control processes so that they can be reported promptly to the market and to shareholders. To accomplish this, our executives have a coordinated plan for which all internal and external resources are made available. We also use a strict four-eye principle to ensure the accuracy of the key financial ratios reported and the underlying execution of all accounting processes. Numerous rules and guidelines are also followed to ensure the strict separation of the planning, posting and execution of financial transactions. This functional separation of processes is ensured by all of our operating IT systems through an appropriate assignment of rights. External service providers regularly review the implementation of and compliance with these guidelines as well as the efficiency of the accounting processes

Group Management Report Statement on Corporate Governance, Group Statement on Corporate Governance and Corporate Governance Report 106 16 Compliance Management System (CMS) Credo Code of Conduct reports, if required, to reports to CHIEF EXECUTIVE OFFICER CHAIRPERSON OF THE AUDIT COMMITTEE manages the interfaces between the different compliance streams COMPLIANCE RISK MANAGEMENT COMPLIANCE COMMITTEE SUPERVISION + IMPROVEMENTS TRAININGS WHISTLEBLOWER SYSTEM COMPLIANCE DOCUMENTS COMPLIANCE OFFICER CMS

Statement on Corporate Governance, Group Statement on Corporate Governance and Corporate Governance Report Group Management Report 107 FINANCIAL STATEMENTS Predicting future events is not the job of our internal control and risk management system. Our risk management system does, however, ensure that business risks are detected and assessed early. The risks identified are eliminated or at least brought to an acceptable level using appropriate corrective measures. Special attention is given to risks that could jeopardize us. The Management Board ensures that risks are always dealt with responsibly and keeps the Supervisory Board informed of any risks and their development. Detailed information on our risks and opportunities can be found in the “Risk and Opportunity Report.” ACCOUNTING AND EXTERNAL AUDIT We prepare our financial statements in accordance with the provisions of the German Commercial Code (HGB) and the StockCorporation Act (AktG). The consolidated financial statements are prepared in accordance with International Financial Reporting Standards (“IFRS”) and take into account the recommendations of the International Financial Reporting Standards Interpretations Committee (IFRS IC). We have applied all standards and interpretations that were effective on and endorsed by the European Union (EU) as at December 31, 2018. There were no standards or interpretations as at December 31, 2018, impacting our consolidated financial statements for the years ended December 31, 2018 and 2017, that were effective but not yet endorsed. As a result, our consolidated financial statements comply with both the IFRSs published by the International Accounting Standards Board (IASB) and those adopted by the EU. These consolidated financial statements also take into account the supplementary provisions under commercial law, which must be applied in accordance with Section 315e (1) of the German Commercial Code (Handelsgesetzbuch - HGB). For the election of our auditor, the Audit Committee of the Supervisory Board submits a nomination proposal to the Supervisory Board. At the 2018 Annual General Meeting, PricewaterhouseCoopers GmbH Wirtschaftsprufungsgesellschaft was appointed as auditor for the 2018 financial year. As proof of its independence, the auditor submitted an Independence Declaration to the Supervisory Board. The lead auditor of these consolidated financial statements was Stefano Mulas, who has audited the consolidated financial statements since 2018. PricewaterhouseCoopers GmbH has been our auditor since the 2011 financial year. Information on audit-related fees and all other fees provided by PricewaterhouseCoopers GmbH to us during the 2018 financial year can be found in the Notes under Item 6.1. COMPLIANCE MANAGEMENT SYSTEM Our basic mechanisms of the Compliance Management System (CMS) are presented in the section “Relevant Information on Corporate Governance Practices.” The identification and assessment of compliance risks are an important part of the CMS, and feed the overall CMS strategic development. Our main compliance-relevant risk areas are evaluated using a systematic approach, taking into account our current business strategy and priorities. In the 2018 financial year, we carried out a compliance risk analysis, including anti-bribery and corruption risks. Risk mitigation measures are being identified for the areas requiring action. As part of the CMS, employees are given the opportunity to report suspected breaches of law within the MorphoSys Group in a protected manner. In connection with the General Data Protection Regulation of the EU (Regulation (EU) 2016/679 - “GDPR”) which came into effecton May 25, 2018, we implemented various procedures in 2018 to safeguard compliance with the GDPR. SEE FIGURE 16 - Compliance Management System (CMS) (page 106) INTERNAL AUDIT DEPARTMENT Our Internal Audit Department is an essential element of the Corporate Governance structure. The Internal Audit Department assists us in accomplishing our objectives by bringing a systematic approach to evaluate and improve the effectiveness of our risk management, internal control and other corporate governance processes. The accounting and consulting firm KPMG was mandated for 2018 as a co-sourcing partner for the internal auditing process. The Corporate Internal Audit Department executes on a risk-based audit plan including requirements and recommendations of the Management Board and Supervisory Board’s Audit Committee. Our Internal Audit Department reports regularly to the Management Board. The Head of Internal Audit and the Chief Executive Officer both report to the Supervisory Board’s Audit Committee twice a year or on an ad hoc basis when necessary. Five audits were conducted successfully in the course of 2018. Some areas requiring action were identified and corrective action plans were agreed. The Corporate Internal Audit Department is planning four audits in 2019.

Group Management Report Statement on Corporate Governance, Group Statement on Corporate Governance and Corporate Governance Report 108 Disclosures under Section 289a (1), Section 315a (1) HGB and Explanatory Report of the Management Board under Section 176 (1) Sentence 1 AktG COMPOSITION OF COMMON STOCK As of December 31, 2018, the Company’s statutory common stock amounted to 31,807,035.00 and was divided into 31,807,035 no-par-value bearer shares. Excluding the 281,036 treasury shares held by the Company, the statutory common stock concerns bearer shares with voting rights granting each share one vote at the Annual General Meeting. On January 17, 2019, our Supervisory Board resolved to adjust the share capital to reflect the issuance of new shares in 2018 based on the exercise of 32,537 convertible bonds. This results in an increase of the share capital from 31,807,035 to 31,839,572, which was entered in the commercial register on February 2, 2019. RESTRICTIONS AFFECTING VOTING RIGHTS OR THE TRANSFER OF SHARES Our Management Board is not aware of any restrictions that may affect voting rights, the transfer of shares or those that may emerge from agreements between shareholders. Voting rights restrictions may also arise from the provisions of the German Stock Corporation Act (AktG), such as those under Section 136 AktG, or the provisions for treasury stock under Section 71b AktG. SHAREHOLDINGS IN COMMON S TOCK EXCEEDING 10 % OF VOTING RIGHTS We are not aware of nor have we been notified of any direct or indirect interests in the Company’s common stock that exceed 10 % of the voting rights. SHARES WITH SPECIAL RIGHTS CONFERRING POWERS OF CONTROL Shares with special rights conferring powers of control do not exist. CONTROL OVER VOTING RIGHTS WITH REGARD TO EMPLOYEE OWNERSHIP OF CAPITAL Employees who hold shares in the Company exercise their voting rights directly in accordance with the statutory provisions and the Articles of Association as do other shareholders. APPOINTMENT AND DISMISSAL OF MANAGEMENT BOARD MEMBERS AND AMENDMENTS TO THE ARTICLES OF ASSOCIATION The number of Management Board members, their appointment and dismissal and the nomination of the Chief Executive Officer are determined by the Supervisory Board in accordance with Section 6 of the Articles of Association and Section 84 AktG. Our Management Board currently consists of the Chief Executive Officer and three other members. Management Board members may be appointed for a maximum term of five years. Reappointments or extensions in the term of office are allowed for a maximum term of five years in each case. The Supervisory Board may revoke the appointment of a Management Board member or the nomination of a Chief Executive Officer for good cause within the meaning of Section 84 (3) AktG. If a required member of the Management Board is absent, one will be appointed by the court in cases of urgency under Section 85 AktG. As a rule, the Articles of Association can only be amended by a resolution of the Annual General Meeting in accordance with Section 179 (1) sentence 1 AktG. Under Section 179 (2) sentence 2 AktG in conjunction with Section 20 of the Articles of Association, our Annual General Meeting resolves amendments to the Articles of Association generally through a simple majority of the votes cast and a simple majority of the common stock represented. If the law stipulates a higher mandatory majority of votes or capital, this shall be applied. Amendments to the Articles of Association that only affect their wording can be resolved by the Supervisory Board in accordance with Section 179 (1) sentence 2 AktG in conjunction with Section 12 (3) of the Articles of Association.

Statement on Corporate Governance, Group Statement on Corporate Governance and Corporate Governance Report Group Management Report 109 FINANCIAL STATEMENTS POWER OF THE MANAGEMENT BOARD TO ISSUE SHARES The Management Board’s power to issue shares is granted under Section 5 (5) through (6e) of the Company’s Articles of Association and the statutory provisions: 1. Authorized Capital a. According to Section 5 (5) of the Articles of Association, with the Supervisory Board’s consent, the Management Board is authorized to increase the Company’s common stock on one or more occasions by up to 11,768,314.00 for cash contributions and/or contributions in kind by issuing up to 11,768,314 new, no-par-value bearer shares until and including the date of April 30, 2022 (Authorized Capital 2018-I). Shareholders are principally entitled to subscription rights in the case of a capital increase. One or more credit institutions may also subscribe to the shares with the obligation to offer the shares to shareholders for subscription. With the Supervisory Board’s consent, the Management Board is, however, authorized to exclude shareholder subscription rights: aa) in the case of a capital increase for cash contribution, to the extent necessary to avoid fractional shares; or bb) in the case of a capital increase for contribution in kind; or cc) in the case of a capital increase for cash contribution when the new shares are placed on a domestic and/or foreign stock exchange in the context of a public offering. The total shares to be issued via a capital increase against contribution in cash and/or in kind, excluding preemptive rights and based on the authorizations mentioned above, shall not exceed 20 % of the common stock. The calculation used is based on either the effective date of the authorizations or the exercise of the authorizations, whichever amount is lower. The 20 % limit mentioned above shall take into account (i) treasury shares sold excluding preemptive rights after the effective date of these authorizations (unless they service the entitlements of members of the Management Board and/or employees under employee participation programs), (ii) shares that are issued from other authorized capital existing on the effective date of these authorizations and excluding preemptive rights during the effective period of these authorizations or resolved by the same Annual General Meeting that resolved these authorizations, and (iii) shares to be issued during the effective period of these authorizations to service convertible bonds and/or bonds with warrants whose basis for authorization exists on the effective date of these authorizations provided that the convertible bonds and/or bonds with warrants have been issued with the exclusion of the preemptive rights of shareholders (unless they service the entitlements of members of the Management Board and/or employees under employee participation programs). With the Supervisory Board’s consent, the Management Board is authorized to determine the further details of the capital increase and its implementation. b) Pursuant to Section 5 (6) of the Articles of Association, with the Supervisory Board’s consent, the Management Board is authorized to increase the common stock of the Company against contribution in cash once or several times by a total of up to 2,915,977.00 until and including April 30, 2022 by issuing up to 2,915,977 new no-par-value bearer shares (Authorized Capital 2017-I). Shareholders are principally entitled to subscription rights in the case of a capital increase. One or more credit institutions may also subscribe to the shares with the obligation to offer the shares to shareholders for subscription. With the Supervisory Board’s consent, the Management

Group Management Report Statement on Corporate Governance, Group Statement on Corporate Governance and Corporate Governance Report 110 Board is, however, authorized to exclude shareholder subscription rights: aa) to the extent necessary to avoid fractional shares; or bb) if the issue price of the new shares is not significantly below the market price of shares of the same class already listed and the total number of shares issued against contribution in cash, excluding subscription rights, during the term of this authorization does not exceed 10 % of the common stock on the date this authorization takes effect or at the time it is exercised, in accordance with or in the respective application of Section 186 (3) sentence 4 AktG. The total number of shares to be issued via capital increases against contribution in cash, excluding subscription rights and based on the authorizations mentioned above, shall not exceed 20 % of the common stock when calculated based on the authorizations’ effective date or exercise, whichever amount is lower. This 20 % limit shall take into account (i) treasury shares sold with the exclusion of subscription rights after the effective date of these authorizations (unless they service the entitlements of members of the Management Board and/or employees under employee participation programs); (ii) shares to be issued with the exclusion of subscription rights during the effective period of these authorizations from other authorized capital existing on the effective date of these authorizations or to be resolved by the same Annual General Meeting resolving these authorizations; and (iii) shares to be issued during the effective period of these authorizations to service bonds with conversion or warrant rights, whose authorization basis exists on the effective date of these authorizations, to the extent the bonds with conversion or warrant rights were issued with the exclusion of shareholders’ subscription rights (unless they service the entitlements of members of the Management Board and/or employees under employee participation programs). With the Supervisory Board’s consent, the Management Board is authorized to determine the further details of the capital increase and its implementation. 2. Conditional Capital a. According to Section 5 (6b) of the Articles of Association, the Company’s common stock is conditionally increased by up to 5,307,536.00, divided into a maximum of 5,307,536 no-par-value bearer shares (Conditional Capital 2016-I). The conditional capital increase serves solely as a means to grant new shares to the holders of conversion or warrant rights, which will be issued by the company or companies in which the Company has a direct or indirect majority interest according to the authorizing resolution of the Annual General Meeting on June 2, 2016, under Agenda Item 7 letter a). The shares will be issued at the respective conversion or exercise price to be determined in accordance with the resolution above. The conditional capital increase will only be carried out to the extent that the holders of conversion or warrant rights exercise these rights or fulfill conversion obligations under such bonds. The shares will be entitled to dividends as of the beginning of the previous financial year, provided they were issued before the start of the Company’s Annual General Meeting, or as of the beginning of the financial year in which they were issued. b. According to Section 5 (6e) of the Articles of Association, the Company’s common stock is conditionally increased by up to 188,985.00 through the issue of up to 188,985 new no-par- value bearer shares of the Company (Conditional Capital 2008-III). The conditional capital increase will only be executed to the extent that holders of the convertible bonds exercise their conversion rights for conversion into ordinary shares of the Company. The new shares participate in the Company’s profits from the beginning of the financial year, for which there has been no resolution on the appropriation of accumulated income at the time of issuance. With the Supervisory Board’s consent, the Management Board is authorized to determine the further details of the capital increase and its implementation. On January 17, 2019, our Supervisory Board resolved to adjust the conditional capital to reflect the issuance of new shares in 2018 based on the exercise of 32,537 convertible bonds. This results in a reduction of the conditional capital 2008-III from 188,985 to 156,448, which was entered in the commercial register on February 1, 2019.

Statement on Corporate Governance, Group Statement on Corporate Governance and Corporate Governance Report Group Management Report 111 FINANCIAL STATEMENTS c. According to Section 5 (6g) of the Articles of Association, the Company’s common stock is conditionally increased by up to 995,162.00 through the issue of up to 995,162 new no-par- value bearer shares of the Company (Conditional Capital 2016-III). The conditional capital serves to meet the obligations of subscription rights that have been issued and exercised based on the authorization resolved by the Annual General Meeting of June 2, 2016 under Agenda Item 9 letter a). The conditional capital increase will only be executed to the extent that holders of subscription rights exercise their right to subscribe to shares of the Company. The shares will be issued at the exercise price set in each case as the issue amount in accordance with Agenda Item 9 letter a) subparagraph (8) of the Annual General Meeting’s resolution dated June 2, 2016; Section 9 (1) AktG remains unaffected. The new shares are entitled to dividends for the first time for the financial year for which there has been no resolution by the Annual General Meeting on the appropriation of accumulated income. The Management Board, and the Company’s Supervisory Board where members of the Management Board are concerned, is authorized to determine the additional details of the conditional capital increase and its execution. POWER OF MANAGEMENT BOARD TO REPURCHASE SHARES The Management Board’s power to repurchase the Company’s own shares is granted in Section 71 AktG and by the authorization of the Annual General Meeting of May 23, 2014: Until and including the date of April 30, 2019, the Company is authorized to repurchase its own shares in an amount of up to 10 % of the common stock existing at the time of the resolution (or possibly a lower amount of common stock at the time of exercising this authorization) for any purpose permitted under the statutory limits. The repurchase takes place at the Management Board’s discretion on either the stock exchange, through a public offer or public invitation to submit a bid. The authorization may not be used for the purpose of trading in the Company’s own shares. The intended use of treasury stock acquired under this authorization may be found under Agenda Item 9 of the Annual General Meeting of May 23, 2014. These shares may be used as follows: 1. The shares may be redeemed without the redemption or its execution requiring a further resolution of the Annual General Meeting. 2. The shares may be sold other than on the stock exchange or shareholder offer if the shares are sold for cash at a price that is not significantly below the market price of the Company’s shares of the same class at the time of the sale. 3. The shares may be sold for contribution in kind, particularly in conjunction with company mergers, acquisitions of companies, parts of companies or interests in companies. 4. The shares may be used to fulfill subscription or conversion rights resulting from the exercise of options and/or conversion rights or conversion obligations for Company shares. 5. The shares may be offered or transferred to employees of the Company and those of affiliated companies, members of the Company’s management and those of affiliated companies and/or used to meet commitments or obligations to purchase Company shares that were or will be granted to employees of the Company or those of affiliated companies, members of the Company’s management or managers of affiliated companies. The shares may also be used to fulfill obligations or rights to purchase Company shares that will be agreed with the Company’s employees, members of the senior management and affiliates in the context of employee participation programs. If shares are used for the purposes mentioned above, shareholder subscription rights are excluded, with the exception of share redemptions. MATERIAL AGREEMENTS MADE BY THE COMPANY THAT FALL UNDER THE CONDITION OF A CHANGE OF CONTROL AFTER A TAKEOVER BID The Company has not entered into any material agreements that fall under the condition of a change of control after a take-over bid.

Group Management Report Statement on Corporate Governance, Group Statement on Corporate Governance and Corporate Governance Report 112 COMPENSATION AGREEMENTS CONCLUDED BY THE COMPANY WITH MANAGEMENT BOARD MEMBERS AND EMPLOYEES IN THE EVENT OF A TAKEOVER BID Following a change of control, Management Board members may terminate their service contract and demand the fixed salary and annual bonus still outstanding until the regular end of the service contract, however at least 200 % of the fixed yearly gross salary and the annual bonus. Moreover, in such a case, all stock options, convertible bonds and performance shares granted will become vested immediately and can be exercised after the expiration of the statutory vesting or blackout periods. Following a change of control, some Senior Management Group members may also terminate their employment contract and demand a severance payment equal to one annual gross fixed salary and the full contractual bonus for the calendar year in which the termination is exercised, whereby a target achievement rate of 100 % shall be applied. Moreover, in such a case, all stock options and performance shares granted will become vested immediately and can be exercised after the expiration of the statutory vesting or blackout periods. The following cases constitute a change of control: (i) MorphoSys transfers all or a material portion of the Company’s assets to an unaffiliated entity, (ii) MorphoSys merges with an unaffiliated entity, (iii) MorphoSys AG as dominated company becomes party to an agreement pursuant to Section 291 of the German Stock Corporation Act or MorphoSys is integrated in accordance with Section 319 of the German Stock Corporation Act, or (iv) a shareholder or third party directly or indirectly holds 30 % or more of MorphoSys’s voting rights.

Subsequent Events Group Management Report 113 FINANCIAL STATEMENTS Subsequent Events On January 26, 2019, we announced that in our lawsuit against Janssen Biotech and Genmab A/S, the United States (U.S.) District Court of Delaware, based on a hearing held November 27, 2018, ruled in a Court Order on January 25, 2019, that the asserted claims of three MorphoSys patents with U.S. Patent Numbers 8,263,746, 9,200,061 and 9,758,590 are invalid. The Court thus granted a motion for Summary Judgement of invalidity filed by Janssen Biotech and Genmab, A/S against the three patents held by MorphoSys. As a result of this decision, the jury trial scheduled for February 2019 to consider Janssen’s and Genmab’s alleged infringement and the validity of the MorphoSys patents did not take place. On January 31, 2019 we announced that we had settled the dispute with Janssen Bio-tech and Genmab A/S. The parties agreed to drop the mutual claims related to the litigation: MorphoSys dismissed claims for alleged patent infringement against Janssen Biotech and Genmab A/S and agreed not to appeal from the court order dated January 25, 2019. Janssen and Genmab dismissed their counterclaims against MorphoSys. In early February 2019, we announced the appointment of David Trexler as President and Member of the Board of Directors of MorphoSys US Inc. effective February 6, 2019. Mr. Trexler will lead the further development of MorphoSys’s U.S. subsidiary with a focus on building commercial capabilities. Mr. Trexler joins MorphoSys from EMD Serono, a subsidiary of Merck KGaA, Darmstadt. AT EMD Serono, he was responsible, among other things, for establishing the first commercial organization of Merck KGaA’s oncology division in the U.S. and for the market launch of the cancer drug avelumab for the treatment of metastatic Merkel cell carcinoma. On February 19, 2019, Simon Moroney, CEO and co-founder of MorphoSys AG (informed the Company’s Supervisory Board that he has decided not to renew his contract as a member of the company’s Management Board. As a result of his decision, Dr. Moroney will step down as CEO on expiry of his current contract on June 30, 2020, or when a successor is appointed, whichever comes sooner. At the end of February 2019, our partner Janssen announced that it had received U.S. FDA approval for Tremfya® One-Press, a single-dose, patient-controlled injector for adults with moderate-to-severe plaque psoriasis. This is a device that allows patients to administer the drug subcutaneously by themselves and is thus intended to provide a higher convenience to psori-asis patients with respect to the treatment of their chronic disease. On March 7, 2019 MorphoSys announced that during the first quarter of 2019, the Company in agreement with the FDA implemented an amendment of the B-MIND study by introducing a co-primary endpoint into the trial. The scientific rationale for the amendment is based on published literature as well as MorphoSys’s own pre-clinical data, which indicate that MOR208 might be particularly active in patients who can be characterized by the presence of a certain biomarker. Discussions with the FDA regarding the biomarker assay are currently being planned and are expected to take place in the middle of 2019. The pre-planned, event-driven interim analysis of B-MIND remains projected to take place in the second half of 2019. Depending on the outcome of the interim analysis, an increase from 330 to 450 patients may be required, in which case an event-driven primary analysis of the study is expected in the first half of 2021.

Financial Statements 114 Contents Financial Statements

Contents Financial Statements 115 FINANCIAL STATEMENTS 116 Consolidated Statement of Profit or Loss (IFRS) 117 Consolidated Statement of Comprehensive Income (IFRS) 118 Consolidated Balance Sheet (IFRS) 120 Consolidated Statement of Changes in Stockholders’ Equity (IFRS) 122 Consolidated Statement of Cash Flows (IFRS) notes 124 General Information 124 Summary of Significant Accounting Policies 143 Segment Reporting 146 Notes to Profit or Loss 151 Notes to the Assets of the Balance Sheet 158 Notes to Equity and Liabilities of the Balance Sheet 161 Remuneration System for the Management Board and Employees of the Group 172 Additional Notes

Financial Statements Consolidated Statement of Profit or Loss (IFRS) 116 Consolidated Statement of Profit or Loss (IFRS) in Note 2018 2017 2016 Revenues 2.7.1, 4.1 76,442,505 66,790,840 49,743,515 Operating Expenses 2.1.1, 2.7.2, Cost of Sales 4.2.1 (1,796,629) 0 0 Research and Development 2.7.2, 4.2.2 (106,397,017) (113,313,679) (93,962,975) 2.1.1, 2.7.2, Selling 4.2.3 (6,382,510) (4,816,038) (2,444,224) General and Administrative 2.7.2, 4.2.4 (21,927,731) (15,717,578) (13,431,955) Total Operating Expenses (136,503,887) (133,847,295) (109,839,154) Other Income 2.7.3, 4.3 1,644,632 1,119,598 708,571 Other Expenses 2.7.4, 4.3 (689,343) (1,670,792) (553,925) Earnings before Interest and Taxes (EBIT) (59,106,093) (67,607,649) (59,940,993) Finance Income 2.7.5, 4.3 417,886 712,397 1,385,164 Finance Expenses 2.7.5, 4.3 (753,588) (1,894,852) (1,308,322) Impairment Losses on Financial Assets 2.3.1 (1,035,000) 0 0 Income Tax Benefit/(Expenses) 2.7.6, 4.4 4,304,674 (1,036,365) (518,625) Consolidated Net Loss (56,172,121) (69,826,469) (60,382,776) Earnings per Share, basic and diluted 2.7.7, 4.5 (1.79) (2.41) (2.28) Shares Used in Computing Earnings per Share, basic and diluted 2.7.7, 4.5 31,338,948 28,947,566 26,443,415 The notes are an integral part of these consolidated financial statements.

Consolidated Statement of Comprehensive Income (IFRS) Financial Statements 117 Consolidated Statement of Comprehensive Income (IFRS)1 in 2018 2017 2016 Consolidated Net Loss (56,172,121) (69,826,469) (60,382,776) Change in Fair Value of Equity Instruments through Other Comprehensive Income2 (127,458) 0 0 Foreign Currency Translation Differences from Consolidation3 (83,432) 0 0 Change in Unrealized Gains and Losses on Available-for-sale Financial Assets and Bonds (Thereof 0 for 2018, 86,685 for 2017 and 251,455 for 2016, respectively, Reclassifications of realized Gains and Losses to Profit or Loss) 0 54,170 115,396 Change of Tax Effects presented in Other Comprehensive Income on Available-for-sale Financial Assets and Bonds 0 63,659 (136,550) Change in Unrealized Gains and Losses on Available-for-sale Financial Assets and Bonds, Net of Tax Effects 0 117,829 (21,154) Change in Unrealized Gains and Losses on Cash Flow Hedges (Thereof 0 for 2018, 256,085 for 2017 and 0 for 2016, respectively, Reclassifications of realized Losses to Profit or Loss) 0 (490,164) 490,164 Change of Tax Effects presented in Other Comprehensive Income on Cash Flow Hedges 0 130,751 (130,751) Change in Unrealized Gains and Losses on Cash Flow Hedges, Net of Tax Effects 0 (359,413) 359,413 Other Comprehensive Income (210,890) (241,584) 338,259 Total Comprehensive Income (56,383,011) (70,068,053) (60,044,517) 1 In financial years 2017 and 2016, the statement of comprehensive income only comprised components which will be reclassified in terms of IAS 1.82A(a)(ii) to profit or loss in subsequent periods when specific conditions are met. 2 Item will not be reclassified in terms of IAS 1.82A(a)(i) to profit or loss in subsequent periods. 3 Item will be reclassified in terms of IAS 1.82A(a)(ii) to profit or loss in subsequent periods when specific conditions are met. The notes are an integral part of these consolidated financial statements.

Financial Statements Consolidated Balance Sheet (IFRS) 118 Consolidated Balance Sheet (IFRS) in Note 12/31/2018 12/31/2017 ASSETS Current Assets Cash and Cash Equivalents 2.8.1, 5.1 45,459,836 76,589,129 Available-for-sale Financial Assets 2.8.1, 5.2 0 86,538,195 Financial Assets classified as Loans and Receivables 2.8.1, 5.2 0 149,059,254 Financial Assets at Fair Value through Profit or Loss 2.1.2, 5.2 44,581,264 0 Other Financial Assets at Amortized Cost 2.1.2, 5.2 268,922,724 0 Accounts Receivable 2.8.2, 5.3 17,732,933 11,234,308 Income Tax Receivables 2.8.2, 5.5 161,048 654,511 Other Receivables 2.8.2, 5.4 147,449 84,727 Inventories, Net 2.8.3, 5.5 245,161 300,753 Prepaid Expenses and Other Current Assets 2.8.4, 5.5 11,654,880 16,219,761 Total Current Assets 388,905,295 340,680,638 Non-current Assets Property, Plant and Equipment, Net 2.8.5, 5.6 3,530,709 3,526,351 Patents, Net 2.8.6, 5.7.1 3,938,739 4,669,128 Licenses, Net 2.8.6, 5.7.2 2,526,829 2,999,074 In-process R&D Programs 2.8.6, 5.7.3 37,019,370 52,158,527 Software, Net 2.8.6, 5.7.4 203,807 655,399 Goodwill 2.8.6, 5.7.5 3,676,233 7,364,802 Other Financial Assets at Amortized Cost, Net of Current Portion 2.8.1, 5.2 95,749,059 0 Shares at Fair Value through Other Comprehensive Income 2.8.7, 5.8 232,000 0 Prepaid Expenses and Other Assets, Net of Current Portion 2.8.8, 5.9 2,981,716 3,344,292 Total Non-current Assets 149,858,462 74,717,573 TOTAL ASSETS 538,763,757 415,398,211 The notes are an integral part of these consolidated financial statements.

Consolidated Balance Sheet (IFRS) Financial Statements 119 in Note 12/31/2018 12/31/2017 LIABILITIES AND STOCKHOLDERS’ EQUITY Current Liabilities Accounts Payable and Accruals 2.9.1, 6.1 44,760,615 44,811,718 Tax Provisions 2.9.2, 6.2 208,034 314,944 Other Provisions 2.9.1, 6.2 160,411 1,185,741 Current Portion of Contract Liability (2017: Current Portion of Deferred Revenue) 2.9.3, 6.3 794,230 1,388,638 Total Current Liabilities 45,923,290 47,701,041 Non-current Liabilities Other Provisions, Net of Current Portion 2.9.1, 6.2 23,166 23, 166 Contract Liability, Net of Current Portion (2017: Deferred Revenue, Net of Current Portion) 2.9.4, 6.3 158,024 306,385 Convertible Bonds due to Related Parties 2.9.5 71,517 87,785 Deferred Tax Liability 2.9.6, 4.4 3,507,233 7,811,258 Other Liabilities, Net of Current Portion 2.9.7, 6.4 707,893 797,537 Total Non-current Liabilities 4,467,833 9,026,131 Total Liabilities 50,391,123 56,727,172 Stockholders’ Equity Common Stock 2.9.8, 6.5.1 31,839,572 29,420,785 Ordinary Shares Issued (31,839,572 and 29,420,785 for 2018 and 2017, respectively) Ordinary Shares Outstanding (31,558,536 and 29,101,107 for 2018 and 2017, respectively) Treasury Stock (281,036 and 319,678 shares for 2018 and 2017, respectively), at Cost 2.9.8, 6.5.4 (10,398,773) (11,826,981) Additional Paid-in Capital 2.9.8, 6.5.5 619,908,453 438,557,856 Revaluation Reserve 2.9.8, 6.5.6 0 (105,483) Other Comprehensive Income Reserve 2.9.8, 6.5.7 (210,890) 0 Accumulated Deficit 2.9.8, 6.5.8 (152,765,728) (97,375,138) Total Stockholders’ Equity 488,372,634 358,671,039 TOTAL LIABILITIES AND STOCKHOLDERS’ EQUITY 538,763,757 415,398,211 The notes are an integral part of these consolidated financial statements.

Financial Statements Consolidated Statement of Changes in Stockholders ‘Equity (IFRS) 120 Consolidated Statement of Changes in Stockholders’ Equity (IFRS) Common Stock Note Shares BALANCE AS OF JANUARY 1, 2016 26,537,682 26, 537, 682 Capital Increase, Net of Issuance Cost of 2,778,652 2,622,088 2, 622, 088 Compensation Related to the Grant of Convertible Bonds and Performance Shares 0 0 Repurchase of Treasury Stock, Net of Bank Fees 0 0 Transfer of Treasury Stock for Long-Term Incentive Program 0 0 Reserves: Change in Unrealized Gains and Losses on Available-for-sale Financial Assets and Bonds, Net of Tax Effects 0 0 Change in Unrealized Gains on Cash Flow Hedges, Net of Tax Effects 0 0 Consolidated Net Loss 0 0 Total Comprehensive Income 0 0 BALANCE AS OF DECEMBER 31, 2016 29,159,770 29, 159, 770 BALANCE AS OF JANUARY 1, 2017 29,159,770 29, 159, 770 Compensation Related to the Grant of Stock Options, Convertible Bonds and Performance Shares 7.1, 7.2, 7.3 0 0 Exercise of Convertible Bonds Issued to Related Parties 7.2 261,015 261, 015 Transfer of Treasury Stock for Long-Term Incentive Program 7.3.1 0 0 Transfer of Treasury Stock to Members of the Management Board 7.4 0 0 Reserves: Change in Unrealized Gains and Losses on Available-for-sale Financial Assets and Bonds, Net of Tax Effects 0 0 Change in Unrealized Gains on Cash Flow Hedges, Net of Tax Effects 0 0 Consolidated Net Loss 6.5.8 0 0 Total Comprehensive Income 0 0 BALANCE AS OF DECEMBER 31, 2017 29,420,785 29, 420, 785 Application of IFRS 9 2.1.2, 6.5.6, 6.5.8 0 0 Application of IFRS 15 2.1.2, 6.5.8 0 0 BALANCE AS OF JANUARY 1, 2018 29,420,785 29, 420, 785 Capital Increase, Net of Issuance Cost of 15,038,362 6.5.1, 6.5.5 2,386,250 2, 386, 250 Compensation Related to the Grant of Stock Options and Performance Shares 7.1, 7.3 0 0 Exercise of Convertible Bonds Issued to Related Parties 7.2, 7.4 32,537 32, 537 Transfer of Treasury Stock for Long-Term Incentive Program 7.3.2, 7.4 0 0 Transfer of Treasury Stock to Related Parties 6.5.4, 7.3.7, 7.4 0 0 Reserves: Change in Fair Value of Equity Instruments through Other Comprehensive Income 5.8, 6.5.7 0 0 Foreign Currency Losses from Consolidation 6.5.7 0 0 Consolidated Net Loss 6.5.8 0 0 Total Comprehensive Income 0 0 BALANCE AS OF DECEMBER 31, 2018 31,839,572 31, 839, 572 The notes are an integral part of these consolidated financial statements.

Consolidated Statement of Changes in Stockholders ‘Equity (IFRS) Financial Statements 121 Treasury Stock Shares Additional Paid-in Capital Revaluation Reserve Other Comprehensive Income Reserve Accumulated Deficit € Total Stockholders’ Equity 434,670 (15,827,946) 319,394,322 (202,158) 0 32,834,107 362,736,007 0 0 109,971,132 0 0 0 112,593,220 0 0 2,357,418 0 0 0 2,357,418 52,295 (2,181,963) 0 0 0 0 (2,181,963) (90,955) 3,361,697 (3,361,697) 0 0 0 0 0 0 0 (21,154) 0 0 (21,154) 0 0 0 359,413 0 0 359,413 0 0 0 0 (60,382,776) (60,382,776) 0 0 0 338,259 0 (60,382,776) (60,044,517) 396,010 (14,648, 212) 428,361,175 136,101 0 (27,548,669) 415,460,165 396,010 (14,648, 212) 428,361,175 136,101 0 (27,548,669) 415,460,165 0 0 4,974,599 0 0 0 4,974,599 0 0 8,043,313 0 0 0 8,304,328 (61,871) 2,286,752 (2,286,752) 0 0 0 0 (14,461) 534,479 (534,479) 0 0 0 0 0 0 0 117,829 0 0 117,829 0 0 0 (359,413) 0 0 (359,413) 0 0 0 0 0 (69,826,469) (69,826,469) 0 0 0 (241,584) 0 (69,826,469) (70,068,053) 319,678 (11,826,981) 438,557,856 (105,483) 0 (97,375,138) 358,671,039 0 0 0 105,483 0 (353,483) (248,000) 0 0 0 0 0 1,135,014 1,135,014 319,678 (11,826,981) 438,557,856 0 0 (96,593,607) 359,558,053 0 0 176,189,256 0 0 0 178,575,506 0 0 5,584,969 0 0 0 5,584,969 0 0 1,004,580 0 0 0 1,037,117 (17,219) 636,414 (636,414) 0 0 0 0 (21,423) 791,794 (791,794) 0 0 0 0 0 0 0 0 (127,458) 0 (127,458) 0 0 0 0 (83,432) 0 (83,432) 0 0 0 0 0 (56,172,121) (56,172,121) 0 0 0 0 (210,890) (56,172,121) (56,383,011) 281,036 (10,398, 773) 619,908,453 0 (210,890) (152, 765,728) 488,372,634

Financial Statements Consolidated Statement of Cash Flows (IFRS) 122 Consolidated Statement of Cash Flows (IFRS) in Note 2018 2017 2016 OPERATING ACTIVITIES: Consolidated Net Loss (56,172,121) (69,826,469) (60,382,776) Adjustments to Reconcile Net Loss to Net Cash Provided by/ (Used in) Operating Activities: Impairment of Assets 5.6, 5.7 24,033,479 9,863,582 10,141,187 Depreciation and Amortization of Tangible and Intangible Assets 5.6, 5.7 3,750,259 4,028,948 3,763,813 Net (Gain)/Loss on Sales of Financial Assets at Fair Value through Profit or Loss (2017 and 2016: Available-for-sale Financial Assets) 5.2 1,114,330 84,841 915,201 Proceeds from Derivative Financial Instruments 5.4 (488,201) (589,134) 725,157 Net (Gain)/Loss on Derivative Financial Instruments 5.4 121,717 919,042 (29,879) Net (Gain)/Loss on Sale of Property, Plant and Equipment (24,093) 11,314 (4,037) Proceeds from Recognition of previously unrecognized Intangible Assets 5.8 (350,000) 0 0 Recognition of Contract Liability (2017 and 2016: Recognition of Deferred Revenue) 6.3 (1,993,763) (19,595,746) (19,042,772) Share-based Payment 4.2.5, 7 5,584,969 4,974,599 2,357,418 Income Tax (Benefit)/Expenses 4.4 (4,304,674) 1,036,365 518,625 Changes in Operating Assets and Liabilities: Accounts Receivable 5.3 (6,610,625) 1,362,347 (1,154,597) Prepaid Expenses and Other Assets, Tax Receivables and Other Receivables 5.4, 5.5 545,816 1,807,670 (13,912,263) Accounts Payable and Accruals, Tax Provisions and Other Provisions 6.1, 6.2 1,890,046 7,819,386 13,010,160 Other Liabilities 6.4 (2,718,825) 3,133,558 (421,492) Contract Liability (2017 and 2016: Deferred Revenue) 6.3 2,386,009 18,385,824 17,440,930 Income Taxes Paid (33,837) (1,861,982) (540,383) Net Cash Provided by/(Used in) Operating Activities (33,269,514) (38,445,855) (46,615,708) The notes are an integral part of these consolidated financial statements.

Consolidated Statement of Cash Flows (IFRS) Financial Statements 123 in € Note 2018 2017 2016 INVESTING ACTIVITIES: Purchase of Financial Assets at Fair Value through Profit or Loss (2017 and 2016: Available-for-sale Financial Assets) 5.2 (84,511,324) (56,406,580) (166,923,795) Proceeds from Sales of Financial Assets at Fair Value through Profit or Loss (2017 and 2016: Available-for-sale Financial Assets) 5.2 126,388,925 33,231,500 167,873,152 Proceeds from Sales of Bonds, Available-for-sale 5.2 0 6,500,000 25,770,000 Purchase of Other Financial Assets at Amortized Cost (2017 and 2016: Financial Assets Classified as Loans and Receivables) 5.2 (366,810,000) (108,000,000) (256,499,997) Proceeds from Sales of Other Financial Assets at Amortized Cost (2017 and 2016: Financial Assets Classified as Loans and Receivables) 5.2 149,980,211 170,498,593 149,894,769 Purchase of Property, Plant and Equipment 5.6 (1,820,749) (1,317,058) (2,502,286) Proceeds from Disposals of Property, Plant and Equipment 28,444 84 5,000 Purchase of Intangible Assets 5.7 (644,575) (11,831,789) (411,204) Purchase of Financial Assets at Fair Value through Other Comprehensive Income 5.8 (9,458) 0 0 Interest Received 136,124 257,752 2,008,325 Net Cash Provided by/(Used in) Investing Activities (177,262,402) 32,932,502 (80,786,036) FINANCING ACTIVITIES: Repurchase of Treasury Stock, Net of Bank Fees 0 0 (2,181,963) Proceeds of Share Issuance 6.5 193,613,868 0 115,371,872 Cost of Share Issuance 6.5 (15,038,362) (15,525) (2,778,652) Proceeds in Connection with Convertible Bonds Granted to Related Parties 7.2 1,020,849 8,189,345 0 Outflows in Connection with Convertible Bonds Granted to Related Parties 0 0 (6,707) Interest Paid (134,269) 0 (1,819) Net Cash Provided by/(Used in) Financing Activities 179,462,086 8,173,820 110,402,731 Effect of Exchange Rate Differences on Cash (59,463) 0 0 Increase/(Decrease) in Cash and Cash Equivalents (31,129,293) 2,660,467 (16,999,013) Cash and Cash Equivalents at the Beginning of the Period 76,589,129 73,928,661 90,927,673 Cash and Cash Equivalents at the End of the Period 45,459,836 76,589,129 73,928,661 The notes are an integral part of these consolidated financial statements.

Financial Statements Notes 124 Notes 1 General Information BUSINESS ACTIVITIES AND THE COMPANY MorphoSys AG (“the Company” or “MorphoSys”) develops and applies technologies for generating therapeutic antibodies. The Company has a broad proprietary portfolio of compounds and a broad pipeline of compounds developed with partners from the pharmaceutical and biotechnology industry. MorphoSys was founded as a German limited liability company in July 1992. In June 1998, MorphoSys became a German stock corporation. In March 1999, the Company completed its initial public offering on Germany’s “Neuer Markt”: the segment of the Deutsche Borse at that time designated for high-growth companies. On January 15, 2003, MorphoSys AG was admitted to the Prime Standard segment of the Frankfurt Stock Exchange. On April 18, 2018, MorphoSys completed an IPO on the Nasdaq Global Market through the issue of American Depositary Shares (ADS). MorphoSys AG’s registered office is located in Planegg (district of Munich), and the registered business address is Semmelweisstraße 7, 82152 Planegg, Germany. The Company is registered in the Commercial Register B of the District Court of Munich under the number HRB 121023. 2 Summary of Significant Accounting Policies 2.1 BASIS OF AND CHANGES IN ACCOUNTING STANDARDS 2 .1.1 BASIS OF APPLICATION These consolidated financial statements were prepared in accordance with the International Financial Reporting Standards (“IFRS”), taking into account the recommendations of the International Financial Reporting Standards Interpretations Committee (IFRS IC). We have applied all standards and interpretations that were in force as of December 31, 2018 and adopted by the European Union (EU). As of December 31, 2018, there were no standards or interpretations that affected our consolidated financial statements for the years ended December 31, 2018 and 2017 that were in effect but not yet endorsed into European law. As a result, our consolidated financial statements comply with both the IFRSs published by the International Accounting Standards Board (IASB) and those adopted by the EU. These consolidated financial statements also take into account the supplementary provisions under commercial law, which must be applied in accordance with Section 315e (1) of the German Commercial Code (Handelsgesetzbuch - HGB). These consolidated financial statements as of December 31, 2018 and 2017 and for each of the years in the three years period ended December 31, 2018, comprise MorphoSys AG and its subsidiaries (collectively referred to as the “MorphoSys Group” or the “Group”). In preparing the consolidated financial statements in accordance with IFRS, the Management Board is required to make certain estimates and assumptions, which have an effect on the amounts recognized in the consolidated financial statements and the accompanying Notes. The actual results may differ from these estimates. The estimates and the underlying assumptions are subject to continuous review. Any changes in estimates are recognized in the period in which the changes are made and in all relevant future periods. The annual financial statements of the foreign Group companies are prepared in their respective functional currencies and converted into the euro prior to their consolidation. The consolidated financial statements were prepared in euros. The financial statements are prepared on the basis of historical cost, with the exception of derivative financial instruments and financial assets at fair value, which are recognized at their respective fair value. All figures in this report have been rounded to the nearest euro, thousand euros or million euros. The line item “cost of sales” in profit or loss was first introduced in the third quarter of 2018 and includes the expenses related to the provision of services for the transfer of projects to customers. The rationale for introducing this item is the generally increasing significance of this item in the course of the Group’s planned business development. In 2017 and 2016, there were no material comparable transactions to be reported under this item. Since January 1, 2018, the Group has reported the line item “selling expenses” separately under “operating expenses” in profit or loss. The reason for introducing this new line item and the concomitant changes to the presentation of existing items is the increasing importance of marketing expenses in connection with the preparations planned for the commercialization of MOR208. To ensure comparability of the information, the previous year’s figures have been adjusted accordingly. The disclosure of selling expenses resulted in a change in the recording of research and development and general and administrative expenses in 2017, which reduced these items in 2017 by 3.5 million and 1.3 million and in 2016 by 1.7 million and 0.7 million, respectively. The corresponding amounts are now reported in “selling expenses”. Unless stated otherwise, the accounting policies set out below have been applied consistently to all periods presented in these consolidated financial statements.

Notes Financial Statements 125 2 .1. 2 CHANGES IN ACCOUNTING POLICIES AND DISCLOSURES The accounting principles applied generally correspond to the policies used in the prior year. NEW AND REVISED STANDARDS AND INTERPRE TATIONS APPLIED FOR THE FIRST TIME IN THE FINANCIAL YEAR Standard/Interpretation Mandatory Application for financial years starting on Adopted by the European Union Impact on MorphoSys IFRS 9 Instruments 01/01/2018 yes yes IFRS 15 and IFRS 15 (A) Financial Revenue from Contracts with Customers 01/01/2018 yes yes IFRS 2 (A) Classification and Measurement of Share-based Payment Transactions 01/01/2018 yes yes IFRS 4 (A) Applying IFRS 9 ‘Financial Instruments’ with IFRS 4 ‘Insurance Contracts’ 01/01/2018 yes none IFRS 15 (C) Revenue from Contracts with Customers 01/01/2018 yes yes IAS 40 (A) Transfers of Investment Property 01/01/2018 yes none IFRIC 22 Foreign Currency Transactions and Advance Consideration 01/01/2018 yes none Annual Improvements to IFRS Standards 2014 - 2016 Cycle 01/01/2018 yes none (A) Amendments (C) Clarifications The impact of the amendments to IFRS 2 on the consolidated financial statements is deemed not to be material. IFRS 9 - FINANCIAL INSTRUMENTS As of January 1, 2018, the Group has been applying the new standard for financial instruments, IFRS 9. In this context, the exception granted by IFRS 9 Section 7.2.15 is applied for the transitional provisions for classification and measurement according to which the adjustment of prior year figures is not required. Financial instruments were accounted for in accordance with IAS 39 in fiscal years 2017 and 2016. The Group applied the provisions of IAS 39 on the classification, recognition, measurement and derecognition of financial instruments. As of January 1, 2018, financial instruments, namely money market funds, previously reported in accordance with IAS 39 until December 31, 2017, in the balance sheet item “available-for-sale financial assets” are now classified as “financial assets at fair value, with changes recognized in profit or loss” in accordance with IFRS 9. These items do not meet the IFRS 9 criteria for classification at amortized cost, because their cash flows do not represent solely payments of principal and interest. Financial instruments, namely term deposits with fixed and variable interest rates as well as corporate bonds, previously classified in accordance with IAS 39 as “financial assets classified as loans and receivables” until December 31, 2017, are now presented in the balance sheet item “other financial assets at amortized cost” in accordance with IFRS 9. At the date of initial application the Group’s business model is to hold these financial instruments for collection of contractual cash flows, and the cash flows represent solely payments of principal and interest on the principal amount.

Financial Statements Notes 126 in 000’ Available-for-sale Financial Assets Financial Assets at Fair Value through Profit or Loss Financial Assets classified as loans and Receivables Other Financial Assets at Amortized Cost Balance as of December 31, 2017 86,538 0 149,059 0 Reclassifications of “Available-for-sale Financial Assets” to “Financial Assets at Fair Value through Profit or Loss” (86,538) 86,538 0 0 Reclassifications of “Financial Assets classified as Loans and Receivables” to “Other Financial Assets at Amortized Cost” 0 0 (149,059) 149,059 Impairment 0 0 0 (136) Balance as of January 1, 2018 0 86,538 0 148,923 As of January 1, 2018, there was no difference between the previous carrying amounts of financial instruments in accordance with IAS 39 and the carrying amounts in accordance with IFRS 9. As a result, no change in value has been recognized in accumulated deficit as of January 1, 2018. For financial instruments classified as “at amortized cost”, impairment losses for the expected twelve-month loss were recognized in accumulated deficit as of January 1, 2018. For financial instruments previously classified as “available-for-sale financial assets”, all unrealized gains and losses recognized in the revaluation reserve as of December 31, 2017 were reclassified to accumulated deficit as of January 1, 2018, as these financial instruments are now classified as “financial assets at fair value, with changes recognized in profit or loss”. No reclassification adjustment was required to be made to other financial assets at amortized cost under IFRS 9 compared to the application of IAS 39. in 000’ Revaluation Reserve Accumulated Deficit Balance as of December 31, 2017 (105) 0 Reclassifications of “Available-for-sale Financial Assets” to “Financial Assets at Fair Value through Profit or Loss” 105 (105) Balance as of January 1, 2018 0 (105) The group recognized impairments on financial instruments in accordance with the incurred loss model of IAS 39 until December 31, 2017, by recognizing an allowance once objective evidence of impairment occurred. On January 1, 2018, an expected twelve-month loss for financial instruments, namely for the cash and cash equivalents as well as the term deposits, amounting to 0.1 million, was recognized as strictly required by IFRS 9. All of these debt investments at amortized cost are considered to have a low credit risk, and the risk provision recognized was therefore limited to twelve-month expected losses. For accounts receivable, the simplified impairment model was applied, which requires expected lifetime losses to be recognized. This resulted in a risk provision of 0.1 million as of January 1, 2018.

Notes Financial Statements 127 Impairment IAS 39 Simplified
Impairment Model General Impairment Model Accumument Deficit in 000’ Stage 1 Stage 2 Stage 3 Stage 2 Stage 3 Balance as of December 31, 2017 0 0 0 0 0 0 0 Other Financial Assets at Amortized Cost 0 (136) 0 0 0 0 (136) Accounts Receivable 0 0 0
0 (112) 0 (112) Balance as of January 1, 2018 0 (136) 0 0 (112) 0 (248) MorphoSys did not apply hedge accounting under IAS 39 as of December 31, 2017, nor during the year 2018, therefore the first time application of IFRS 9 has no impact on the
accounting of hedging relationships. IFRS 15 - REVENUE FROM CONTRACTS WITH CUSTOMERS Since January 1, 2018, the Group has been applying IFRS 15, the new accounting standard governing revenue recognition, using the modified retrospective method.
Using this method requires that the cumulative effects of the first adoption of IFRS 15 to be recognized in accumulated deficit as of January 1, 2018 without an adjustment of previous periods. Hence, deferred revenue and accumulated deficit each
decreased by 1.1 million. This effect resulted from license payments which, under IFRS 15, are to be realized at a specific point in time rather than over a period of time, as was the case under IAS 18. Contract Liability,
in 000’ Current Portion of Contract Liability (2017: Current Portion of Deferred Revenue) Current Liability, Net of Current Portion (2017: Deferred Revenue, Net of Current
Portion) Accumulated Deficit Balance as of December 31, 2017 1,389 306 0 Application of IFRS 15 (1,041) (94) 1,135 Balance as of January 1, 2018 348 212 1,135 Had revenues in the 2018 financial year continued to be recognized in accordance with IAS
18, revenues would have been 1.1 million higher. This reflects the aforementioned effect as of January 1, 2018, which would have been fully realized as revenue until December 31, 2018, without the application of the new IFRS 15 standard. For the
revenue realized under IFRS 15 in the 2018 financial year, the accounting under IAS 18 would have resulted in revenue recognition in the same amount and at the same point in time. Accounting principles for accounts receivable assets are presented in
Items 2.4.2*, 2.5.1* and 2.8.2* of these Notes. *CROSS-REFERENCE to page 136 and page 140 As of January 1, 2018, contract liabilities as defined by IFRS 15 rather than deferred revenue were recorded in the consolidated balance sheet. The accounting
policies that apply to contract liabilities are presented in Items 2.9.3* and 2.9.4* of the Notes. *CROSS-REFERENCE to page 142 NEW AND REVISED STANDARDS AND INTERPRETATIONS THAT WERE NOT YET MANDATORY The following new and revised standards and
interpretations that were not yet mandatory for the financial year or were not yet adopted by the European Union were not applied. Standards with the remark “yes” are likely to have an impact on the consolidated financial statements, and
their impact is currently being assessed by the Group. Only those standards having a material impact are described in more detail. The impact on the consolidated financial statements of the amendments to IAS 1 and IAS 8 is not expected to be
material and therefore these are not explained separately. Standards with the remark “none” are unlikely to have a material impact on the consolidated financial statements.

Financial Statements Notes 128 Standard/Interpretation Mandatory Application for financial years starting on Adopted by the European Union Possible Impact on MorphoSys IFRS 3 (A) Business Combinations 01/01/2020 no none IFRS 16 Leases 01/01/2019 yes yes IFRS 17 Insurance Contracts 01/01/2021 no none IFRS 9 (A) Prepayment Features with Negative Compensation 01/01/2019 yes none IAS 1 and IAS 8 (A) Definition of Material 01/01/2020 no yes IAS 19 (A) Plan Amendment, Curtailment or Settlement 01/01/2019 no none IAS 28 (A) Long-term Interests in Associates and Joint Ventures 01/01/2019 yes none IFRIC 23 Uncertainty over Income Tax Treatments 01/01/2019 yes none Amendments to References to the Conceptual Framework in IFRS Standards 01/01/2020 no none Annual Improvements to IFRS Standards 2015 - 2017 Cycle 01/01/2019 no none (A) Amendments I FRS 16 - LEASES As of January 1, 2019, the new IFRS 16 standard for leases, replaces the previous IAS 17 standard for leases, including the related interpretations (IFRIC 4, SIC-15, SIC-27). Currently, all leases are accounted for as operating leases in accordance with IAS 17. The Group reviewed IFRS 16 for its potential impact on existing lease contracts and will apply the standard for the first time as of the date of its mandatory adoption on January 1, 2019, using the modified retrospective method. The Group will not retroactively adjust comparative amounts for the year prior to first-time adoption and will recognize right-of-use assets in the amount of the lease liabilities in accordance with IFRS 9.C8 (b)(ii) on January 1, 2019. The analysis of the first-time application of IFRS 16 showed that IFRS 16 will have a material impact on components of the consolidated financial statements and the presentation of net assets, financial position and results of operations. For lessees, IFRS 16 introduces a uniform approach to the accounting treatment of leases, whereby assets for the right of use and liabilities for the payment obligations must be recognized in the balance sheet for all leases. The right of use is initially measured at the present value of the future lease payments plus the initial direct costs and subsequently amortized over the term of the lease. The lease liability is the present value of the lease payments that are paid during the term of the lease. For subsequent measurement, the carrying amount of the lease liabilities is compounded with the interest rate or the incremental borrowing rate underlying the lease and reduced by lease payments made. For low value lease assets or short-term leases (less than twelve months), the simplified method is applied. Under this method, the lease payments are recognized as expenses over the term of the lease. The analysis of the first-time application of IFRS 16 has shown that, as of January 1, 2019, the conversion is expected to result in the recognition of rights of us right-of-use assets and lease liabilities of around 40.6 million in the balance sheet. In addition, current prepaid expenses of 0.3 million resulting from rent paid in advance and non-current prepaid expenses of 2.1 million are reclassified to the capitalized right-of-use asset as of January 1, 2019. Furthermore, as of January 1, 2019, current other liabilities of 0.1 million and non-current other liabilities of 0.7 million resulting from deferred rent-free periods are offset against the right-of-use asset. The resulting expansion in total liabilities is expected to decrease the equity ratio. The first-time adoption of IFRS 16 is not expected to have an impact on equity as of January 1, 2019. The lease expenses currently recognized in the statement of income will be replaced by depreciation on assets and interest expenses from the compounding of lease liabilities. This means that the related costs will be presented in different line items in the statement of income and may differ in their total amount compared to the application of IAS 17. The first-time application of IFRS 16 is not expected to have a material impact on Group EBIT. Payments for the repayment of lease liabilities and payments relating to the interest portion of the lease liability will be allocated to cash flow from financing activities. 2.2 CONSOLIDATION PRINCIPLES Intercompany balances and transactions and any unrealized gains arising from intercompany transactions are eliminated when preparing consolidated financial statements pursuant to IFRS 10.B86. Unrealized losses are eliminated in the same manner as unrealized gains. Accounting policies have been applied consistently for all subsidiaries. For all contracts and business transactions between Group entities, the arm’s length principle was applied.

Notes Financial Statements 129 2 . 2 .1 CONSOLIDATED COMPANIES AND SCOPE OF CONSOLIDATION MorphoSys AG, as the ultimate parent company, is located in Planegg, near Munich. MorphoSys AG has two wholly owned subsidiaries (collectively referred to as the “MorphoSys Group” or the “Group”): MorphoSys US Inc. (Princeton, New Jersey) and Lanthio Pharma B.V. (Groningen, The Netherlands). Additionally, MorphoSys AG’s investment in Lanthio Pharma B.V. indirectly gives it 100 % ownership in LanthioPep B.V. (Groningen, The Netherlands). On July 2, 2018, MorphoSys AG established the wholly owned subsidiary, MorphoSys US Inc., under Section 102 of the General Corporation Law of the State of Delaware. Since its foundation, the company has been fully included in the MorphoSys AG scope of consolidation. Upon entry into the commercial register on June 28, 2018, and based on the merger agreement dated May 17, 2018, Sloning BioTechnology GmbH, as the transferring legal entity, was merged into MorphoSys AG, as the acquiring legal entity, with retroactive effect from January 1, 2018. The consolidated financial statements for the year ended December 31, 2018, were prepared and approved by the Management Board in its meeting on March 13, 2019, by means of a resolution. The Management Board members are Dr. Simon Moroney (Chief Executive Officer), Jens Holstein (Chief Financial Officer), Dr. Markus Enzelberger (Chief Scientific Officer) and Dr. Malte Peters (Chief Development Officer). On March 13, 2019, the Management Board authorized the consolidated financial statements for issue and passed it through to the Supervisory Board for review and authorization. 2.2.2 CONSOLIDATION METHODS The following Group subsidiaries are included in the scope of consolidation as shown in the table below. Company Purchase of Shares/Establishment Included in Basis of Consolidation since Lanthio Pharma B.V. May 2015 05/07/2015 LanthioPep B.V. May 2015 05/07/2015 MorphoSys US Inc. July 2018 07/02/2018 These subsidiaries are fully consolidated because they are either directly or indirectly wholly owned. MorphoSys controls these subsidiaries because it possesses full power over the investees. Additionally, MorphoSys is subject to risk exposure and has rights to variable returns from its involvement with the investees. MorphoSys also has unlimited capacity to exert power over the investees to influence their returns. The Group does not have any entities consolidated as joint ventures using the equity method as defined by IFRS 11 “Joint Arrangements”, nor does it exercise a controlling influence as defined by IAS 28 “Investments in Associates and Joint Ventures”. Assets and liabilities of fully consolidated domestic and international entities are recognized using Group-wide uniform accounting and valuation methods. The consolidation methods applied have not changed from the previous year. Receivables, liabilities, expenses and income among consolidated entities are eliminated in the consolidated financial statements. 2.2.3 BASIS OF FOREIGN CURRENCY TRANSLATION IAS 21 “The Effects of Changes in Foreign Exchange Rates” governs the accounting for transactions and balances denominated in foreign currencies. Transactions denominated in foreign currencies are translated at the exchange rates prevailing on the date of the transaction. Any resulting translation differences are recognized in profit or loss. On the reporting date, assets and liabilities are translated at the closing rate for the financial year. Any foreign exchange rate differences derived from these translations are recognized in profit or loss. Any other foreign exchange rate differences at the group level are recognized in the “Other Comprehensive Income Reserve” (stockholders’ equity). 2.3 FINANCIAL INSTRUMENTS AND FINANCIAL RISK MANAGEMENT 2 . 3.1 CREDIT RISK AND LIQUIDITY RISK Financial instruments in which the Group may have a concentration of credit and liquidity risk are mainly cash and cash equivalents, financial assets at fair value, with changes recognized in profit or loss, other financial assets at amortized cost, derivative financial instruments and receivables. The Group’s cash and cash equivalents are mainly denominated in euros. Financial assets at fair value, with changes recognized in profit or loss and other financial assets at amortized cost are high-quality assets. Cash, cash equivalents, financial assets at fair value, with changes recognized in profit or loss and other financial assets at amortized cost are generally held at numerous reputable financial institutions. With respect to its investments, the Group continuously monitors the financial institutions that are its counterparties to the financial instruments, as well as their creditworthiness, and does not anticipate any risk of non-performance. The changes in impairment losses for credit risks required to be recognized under IFRS 9 on the financial year’s profit or loss in the line item “impairment losses on financial assets” (see Item 2.4* of the Notes) were as follows. Negative values represent additions and positive values represent reversals of this risk provision. No utilization of impairments was recognized in 2018. The increase of this risk provision resulted from a higher volume of financial assets at amortized cost due to the cash raised in connection with the IPO on the Nasdaq and higher premiums on counterparties’ credit default swaps compared with January 1, 2018. *CROSS-REFERENCE to page 136

Financial Statements Notes 130 General Impairment Model Simplified Impairment Model Total in 000’ Stage 1 Stage 2 Stage 3 Stage 2 Stage 3 Balance as of January 1, 2018 (136) 0 0 (112) 0 (248) Unused Amounts Reversed 0 0 0 112 0 112 Increase in Impairment Losses for Credit Risks recognized in Profit or Loss during the Year (570) (465) 0 (90) 0 (1,125) Change between Impairment Stages 41 (41) 0 0 0 0 Amounts written of during the Year as uncollectible 0 0 0 0 0 0 Balance as of December 31, 2018 (665) (506) 0 (90) 0 (1,261) The Group recognizes impairment losses for credit risks on financial assets as of December 31, 2018 as follows. Basis for Recognition of Ex- Gross Carrying Carrying Internal Credit pected Credit Amount Impairment Amount Average ImBalance Sheet Item Rating Loss Provision (in 000’ ) (in 000’ ) (in 000’ ) pairment Rate Expected Twelve-Month Cash and Cash Equivalents low Loss 43,165 (16) 43,149 0.0 % Other Financial Assets at Expected Amortized Cost Twelve-Month low Loss 275,805 (649) 275,156 0.2 % Lifetime Expected medium Credit Losses 93,102 (506) 92,596 0.5 % Lifetime Expected Accounts Receivable low Credit Losses 17,823 (90) 17,733 0.5 % The Group is also exposed to credit risk from debt instruments that are measured at fair value in profit or loss. As of December 31, 2018, the maximum credit risk corresponded to the carrying amounts of these investments amounting to 44.6 million. One of the Group’s policies requires that all customers who wish to transact business on credit undergo a credit assessment based on external ratings. Nevertheless, the Group’s revenue and accounts receivable are still subject to credit risk from customer concentration. The Group’s most significant single customer accounted for 5.9 million of accounts receivables as of December 31, 2018 (December 31, 2017: 5.1 million) or 33 % of the Group’s total accounts receivable at the end of 2018. The Group’s top three single customers accounted for of 65 %, 25 % and 5 % of the total revenue in 2018. On December 31, 2017, one customer had accounted for 45 % of the Group’s accounts receivable, and the top three customers had individually accounted for 55 %, 25 % and 10 % of the Group’s revenue in 2017. In 2016, the top three customers had individually accounted for 85 %, 5 % and 5 % of the Group’s revenue. The carrying amounts of financial assets represented the maximum credit risk. The table below shows accounts receivables by region as of the reporting date. in 12/31/2018 12/31/2017 Europe and Asia 13,176,523 8,838,884 USA and Canada 4,646,410 2,395,424 Other 0 0 Impairment (90,000) 0 TOTAL 17,732,933 11,234,308 The following table shows the aging of accounts receivable as of the reporting date. The loss rate for accounts receivable is valued at 0.5 % as of December 31, 2018.

Notes Financial Statements 131 12/31/2018 12/31/2018 0 - 30 days 12/31/2018 30 - 60 days 12/31/2018 60+ days in ; due since Total Accounts Receivable 17,822,933 0 0 17,822,933 Impairment (90,000) 0 0 (90,000) Accounts Receivable, Net of Allowance for Impairment 17,732,933 0 0 17,732,933 12/31/2017 0 - 30 days 12/31/2017 30 - 60 days 12/31/2017 60+ days 12/31/2017 Total in ; due since Accounts Receivable 11,234,308 0 0 11,234,308 Write-of 0 0 0 0 Accounts Receivable, Net of Allowance for Impairment 11,234,308 0 0 11,234,308 On December 31, 2018 and December 31, 2017, the Group’s exposure to credit risk from derivative financial instruments was assessed as low. The maximum credit risk (is equal to carrying amount) for rent deposits on the reporting date amounted to 0.7 million (December 31, 2017: 1.1 million). The following table shows the maturities of accounts payable as of the reporting date. 12/31/2018 Between One 12/31/2018 and Twelve More than 12/31/2018 in ; due in Months 12 Months Total Trade Accounts Payable 7,215,127 0 7,215,127 Convertible Bonds due to Related Parties 71,517 0 71,517 12/31/2017 Between One 12/31/2017 and Twelve More than 12/31/2017 in ; due in Months 12 Months Total Trade Accounts Payable 4,621,918 0 4,621,918 Convertible Bonds due to Related Parties 87,785 0 87,785 Financial assets and financial liabilities were not netted as of December 31, 2018. There is no current legal right to offset amounts recognized against each other, to settle on a net basis or to settle an associated liability simultaneously with the realisation of an asset. There were no financial instruments pledged as collateral as of December 31, 2018. Under existing framework netting agreements, there was no netting potential as of December 31, 2018. 2 . 3. 2 MARKET RISK Market risk represents the risk that changes in market prices, such as foreign exchange rates, interest rates or equity prices, will affect the Group’s results of operations or the value of the financial instruments held. The Group is exposed to both currency and interest rate risks. CURRENCY RISK The consolidated financial statements are prepared in euros. Whereas MorphoSys’s expenses are predominantly incurred in euros, a portion of the revenue is dependent on the prevailing exchange rate of the US dollar. Throughout the year, the Group monitors the need to hedge foreign exchange rates to minimize currency risk and addresses this risk by using derivative financial instruments. Under the Group’s hedging policy, highly probable cash flows and definite foreign currency receivables collectible within a twelve-month period are tested to determine if they should be hedged. MorphoSys had begun using foreign currency options and forwards to hedge its foreign exchange risk against US dollar receivables in 2003. For derivatives with a positive fair value, unrealized gains are reported in other receivables and for derivatives with a negative fair value, unrealized losses are reported in other liabilities.

Financial Statements Notes 132 As of December 31, 2018, there were nine unsettled forward rate agreements with terms ranging from one month to nine months (December 31, 2017: twelve unsettled forward rate agreements; December 31, 2016: ten unsettled forward rate agreements). The unrealized gross gains from these agreements amounted to 0.1 million as of December 31, 2018, and were reported in the finance result (December 31, 2017: 0.3 million unrealized gross loss; December 31, 2016: less than 0.1 million unrealized gross gain). The table below shows the Group’s exposure to foreign currency risk based on the items’ carrying amounts. as of December 31, 2018; in EUR US$ Other Impairment Total Cash and Cash Equivalents 38,732,565 6,743,271 0 (16,000) 45,459,836 Financial Assets at Fair Value through Profit or Loss 34,971,116 9,610,148 0 0 44,581,264 Other Financial Assets at Amortized Cost 365,823,783 0 0 (1,152,000) 364,671,783 Accounts Receivable 17,570,035 252,898 0 (90,000) 17,732,933 Restricted Cash (included in Other Current Assets) 772,425 12,901 0 (3,000) 782,326 Accounts Payable and Accruals (43,638,268) (1,122,347) 0 0 (44,760,615) TOTAL 414,231,656 15,496,871 0 (1,261,000) 428,467,527 as of December 31, 2017; in EUR US$ Other Impairment Total Cash and Cash Equivalents 74,289,250 2,299,879 0 0 76,589,129 Available-for-sale Financial Assets 86,538,195 0 0 0 86,538,195 Financial Assets classified as Loans and Receivables 149,059,254 0 0 0 149,059,254 Accounts Receivable 11,199,652 34,656 0 0 11,234,308 Restricted Cash (included in Other Current Assets) 1,132,782 0 0 0 1,132,782 Accounts Payable and Accruals (44,655,328) (156,390) 0 0 (44,811,718) TOTAL 277,563,805 2,178,145 0 0 279,741,950 Various foreign exchange rates and their impact on assets and liabilities were simulated in an in-depth sensitivity analysis to determine the effects on profit or loss. A 10 % increase in the euro versus the US dollar as of December 31, 2018, would have reduced the Group’s income by 1.4 million. A 10 % decline in the euro versus the US dollar would have increased the Group’s income by 1.7 million. A 10 % increase in the euro versus the US dollar as of December 31, 2017, would have reduced the Group’s income by 0.2 million. A 10 % decline in the euro versus the US dollar would have increased the Group’s income by 0.2 million. A 10 % increase in the euro versus the US dollar as of December 31, 2016, would have reduced the Group’s income by less than 0.1 million. A 10 % decline in the euro versus the US dollar would have increased the Group’s income by less than 0.1 million. INTEREST RATE RISK The Group’s risk exposure to changes in interest rates mainly relates to fixed term deposits and corporate bonds. Changes in the general level of interest rates may lead to an increase or decrease in the fair value of these securities. The Group’s investment focus places the safety of an investment ahead of its return. Interest rate risks are limited because all securities can be liquidated within a maximum of two years and due to the partially fixed interest commitment during the term. Different interest rates and their effects on existing investments with variable interest rates were simulated in a detailed sensitivity analysis in order to determine the effects on profit or loss. An increase of the variable interest rate by 0.5 % would have increased the Group’s result by 0.4 million as of December 31, 2018 (December 31, 2017: 0.6 million; December 31, 2016: 0.3 million). A decrease of the variable

Notes Financial Statements 133 interest rate by 0.5 % would have reduced the Group’s result by 0.1 million as of December 31, 2018 (December 31, 2017: 0.4 million; December 31, 2016: 0.5 million). Changes in the interest rate had no material impact on equity as of December 31, 2017 or December 31, 2016. The Group is not subject to significant interest rate risks from the liabilities currently reported in the balance sheet. 2 . 3. 3 FAIR VALUE HIERARCHY AND MEASUREMENT PROCEDURES The IFRS 13 “Fair Value Measurement” guidelines must always be applied when measurement at fair value is required or permitted or disclosures regarding measurement at fair value are required based on another IAS/IFRS guideline. The fair value is the price that would be achieved for the sale of an asset in an arm’s length transaction between independent market participants or the price to be paid for the transfer of a liability (disposal or exit price). Accordingly, the fair value of a liability reflects the default risk (i.e., own credit risk). Measurement at fair value requires that the sale of the asset or the transfer of the liability takes place on the principal market or, if no such principal market is available, on the most advantageous market. The principal market is the market a company has access to that has the highest volume and level of activity. Fair value is measured by using the same assumptions and taking into account the same characteristics of the asset or liability as would an independent market participant. Fair value is a market-based, not an entity-specific measurement. The fair value of non-financial assets is based on the best use of the asset by a market participant. For financial instruments, the use of bid prices for assets and ask prices for liabilities is permitted but not required if those prices best reflect the fair value in the respective circumstances. For simplification, mean rates are also permitted. Thus, IFRS 13 not only applies to financial assets, but all assets and liabilities. MorphoSys applies the following hierarchy in determining and disclosing the fair value of financial instruments: Level 1: Quoted (unadjusted) prices in active markets for identical assets or liabilities to which the Company has access. Level 2: Inputs other than quoted prices included within Level 1 that are observable for assets or liabilities, either directly (i.e., as prices) or indirectly (i.e., derived from prices). Level 3: Inputs for asset or liability that are not based on observable market data (that is, unobservable inputs). The carrying amounts of financial assets and liabilities, such as other financial assets at amortized cost, as well as accounts receivable and accounts payable, approximate their fair value because of their short-term maturities. HIERARCHY LEVEL 1 The fair value of financial instruments traded in active markets is based on the quoted market prices on the reporting date. A market is considered active if quoted prices are available from an exchange, dealer, broker, industry group, pricing service or regulatory body that is easily and regularly accessible and prices reflect current and regularly occurring market transactions at arm’s length conditions. For assets held by the Group, the appropriate quoted market price is the buyer’s bid price. These instruments fall under Hierarchy Level 1 (see Item 5.2* of the Notes). *CROSS- REFERENCE to page 152 HIERARCHY LEVEL 2 AND 3 The fair value of financial instruments not traded in active markets can be determined using valuation methods. In this case, fair value is estimated using the results of a valuation method that makes maximum use of market data and relies as little as possible on entity-specific inputs. If all significant inputs required for measuring fair value by using valuation methods are observable, the instrument is allocated to Hierarchy Level 2. If significant inputs are not based on observable market data, the instrument is allocated to Hierarchy Level 3. Hierarchy Level 2 contains forward exchange contracts to hedge exchange rate fluctuations, term deposits and restricted cash. Future cash flows for these forward exchange contracts are determined based on forward exchange rate curves. The fair value of these instruments corresponds to their discounted cash flows. The fair value of the term deposits and restricted cash is determined by discounting the expected cash flows at market interest rates. Financial assets belonging to Hierarchy Level 3 are shown in Item 5.7* of the Notes to the Consolidated Financial Statements. No financial liabilities were assigned to Hierarchy Level 3, and there were no Hierarchy Level 3 balance sheet items measured at fair value in 2017. *CROSS- REFERENCE to page 155 There were no transfers from one fair value hierarchy level to another in 2018 or 2017. The table below shows the fair values of financial assets and liabilities and the carrying amounts presented in the consolidated balance sheet.

Financial Statements Notes 134 December 31, 2018 (in 000’ Note Hierarchy Level Not classified into a Measurement Category Financial Assets at Amortized Cost Cash and Cash Equivalents 5.1 * 45,460 Financial Assets at Fair Value through Profit or Loss 5.2 1 0 Other Financial Assets at Amortized Cost 5.2 * 268,923 Accounts Receivable 5.3 * 17,733 Other Receivables thereof Financial Assets * 81 thereof Forward Exchange Contracts used for Hedging 5.4 2 0 Current Assets 332,197 Other Financial Assets at Amortized Cost, Net of Current Portion 5.2 2 95,749 Shares at Fair Value through Other Comprehensive Income 5.8 3 0 Prepaid Expenses and Other Assets, Net of Current Portion 5.9 thereof Non-Financial Assets n/a 2,271 thereof Restricted Cash 2 711 Non-current Assets 2,271 96,460 TOTAL 2,271 428,657 Accounts Payable and Accruals 6.1 * 0 Current Liabilities 0 Convertible Bonds - Liability Component 2 0 Non-current Liabilities 0 TOTAL 0 * Declaration waived in accordance with IFRS 7.29 (a). For these instruments the carrying amount is a reasonable approximation of fair value. December 31, 2017 (in 000’ ) Note Hierarchy Level Not classified into a Measurement Category Loans and Receivables Cash and Cash Equivalents 5.1 * 76,589 Available-for-sale Financial Assets 5.2 1 0 Financial Assets classified as Loans and Receivables 5.2 * 149,059 Accounts Receivable 5.3 * 11,234 Other Receivables 5.4 * 85 Prepaid Expenses and Other Current Assets thereof Non-Financial Assets n/a 15,788 thereof Restricted Cash 5.5 * 432 Current Assets 15,788 237,399 Prepaid Expenses and Other Assets, Net of Current Portion 5.9 thereof Non-Financial Assets n/a 2,643 thereof Restricted Cash 2 701 Non-current Assets 2,643 701 TOTAL 18,431 238,100 Accounts Payable and Accruals 6.1 * 0 Other Provisions thereof Non-Financial Liabilities n/a (886) thereof Forward Exchange Contracts used for Hedging 2 0 Current Liabilities (886) 0 Convertible Bonds - Liability Component 2 0 Non-current Liabilities 0 TOTAL (886) 0 * Declaration waived in line with IFRS 7.29 (a). For these instruments carrying amount is a reasonable approximation of fair value.

Notes Financial Statements 135
Financial Assets at Fair Value (Through Profit or Loss)
Financial Assets at Fair Value
(Through other Comprehensive Income)
Financial Liabilities at Amortized Cost
Financial Liabilities at Fair Value Total carrying amount
Fair Value
0 0 0 0 45,460 * 44,581 0 0 0 44,581 44,581 0 0 0 0 268,923 * 0 0 0 0 17,733 * 147 81 * 66 0 0 0 66 66 44,647 0 0 0 376,844 0 0 0 0 95,749 95,749 0 232 0 0 232 0
2,982 2,271 n/a 0 0 0 0 711 701 0 232 0 0 98,963 44,647 232 0 0 475,807 0 0 (44,761) 0 (44,761) * 0 0 (44,761) 0 (44,761) 0 0 (72) 0 (72) (72) 0 0 (72) 0 (72) 0 0 (44,833) 0 (44,833) Available- for sale Other Financial Liabilities Totsl csrrying
Amount Fair value 0 0 76,589 * 86,538 0 86,538 86,538 0 0 149,059 * 0 0 11,234 * 0 0 85 * 16,220 15,788 n/a 0 0 432 * 86,538 0 339,725 3,344 2,643 n/a 0 0 701 701 0 0 3,344 86,538 0 343,069 0 (44,812) (44,812) * (1,186) (886) n/a 0 (300) (300) (300)
0 (45,112) (45,998) 0 (88) (88) (88) 0 (88) (88) 0 (45,200) (46,086)

Financial Statements Notes 136 2.4 IMPAIRMENTS 2 . 4.1 FINANCIAL INSTRUMENTS As of January 1, 2018, the Group assesses on a forward-looking basis the expected credit losses associated with its debt instruments carried at amortized cost, namely term deposits with fixed and variable interest rates as well as corporate bonds. The impairment method applied depends on whether there has been a significant increase in credit risk. If, at the reporting date, the credit risk of a financial instrument has not increased significantly since initial recognition, the Group measures the loss allowance for that financial instrument at an amount equal to twelve-month expected credit losses (Level 1). In case the credit risk of a financial instrument has increased significantly since initial recognition, the Group measures the loss allowance for that financial instrument at an amount equal to the lifetime expected credit losses. The Group currently classifies an increase in credit risk on debt instruments as significant if the premium on a counterparty credit default swap exceeds 100 basis points at the reporting date (Level 2). If there is an objective indication of impairment, the interest received must also be adjusted so that as of that date the interest is accrued on the basis of the net carrying amount (carrying amount less risk provisions) of the financial instrument (Level 3). Objective evidence of a financial instrument’s impairment may arise from material financial difficulties of the issuer or the borrower, a breach of contract such as a default or delay in interest or principal payments, an increased likelihood of insolvency or other remediation process, or from the disappearance of an active market for a financial asset due to financial difficulties. Financial instruments are derecognized when it can be reasonably expected that they will not be recovered and when one of the objective evidences occurs. Impairment of financial instruments is reported under impairment losses on financial assets. 2 . 4. 2 RECEIVABLES In the case of accounts receivable, the Group applies the simplified approach permitted by IFRS 9, which requires expected lifetime losses to be recognized from the initial recognition of the receivables (level 2). In the case of insufficient reason to expect recovery, the expected loss shall be calculated as the difference between the gross carrying amount and the present value of the expected cash flows discounted at the original effective interest rate (Level 3). An indicator that there is insufficient reason to expect recovery includes a situation, among others, when internal or external information indicates that the Group will not fully receive the contractual amounts outstanding. All accounts receivable were aggregated to measure the expected credit losses as they all share the same credit risk characteristics. All accounts receivable are currently due from customers in the same industry and are therefore exposed to the same credit risks. The impairment is determined on the basis of the premium for an industry credit default swap. In the event that accounts receivable cannot be grouped together, they are measured individually. Accounts receivable are derecognized when it can be reasonably expected that they will not be recovered. Impairment of accounts receivable is reported under other expenses. If in subsequent periods amounts are received that were previously impaired, these amounts are recognized in other income. 2 . 4.3 NON - FINANCIAL ASSETS The carrying amounts of the Group’s non-financial assets and inventories are reviewed at each reporting date for any indication of impairment. The non-financial asset’s recoverable amount and inventories’ net realizable value is estimated if such indication exists. For goodwill and intangible assets that have indefinite useful lives or are not yet available for use, the recoverable amount is estimated at the same time each year, or on an interim basis, if required. Impairment is recognized if the carrying amount of an asset or the cash-generating unit (CGU) exceeds its estimated recoverable amount. The recoverable amount of an asset or CGU is the greater of its value-in-use or its fair value less costs of disposal. In assessing value-in-use, the estimated future pre-tax cash flows are discounted to their present value using a pre-tax discount rate that reflects current market assessments of the time value of money and the risks specific to the asset or CGU. For the purposes of impairment testing, assets that cannot be tested individually are grouped into the smallest group of assets that generates cash flows from ongoing use that are largely independent of the cash flows of other assets or CGUs. A ceiling test for the operating segment must be carried out for goodwill impairment testing. CGUs that have been allocated goodwill are aggregated so that the level at which impairment testing is performed reflects the lowest level at which goodwill is monitored for internal reporting purposes. Goodwill acquired in a business combination may be allocated to groups of CGUs that are expected to benefit from the combination’s synergies. The Group’s corporate assets do not generate separate cash flows and are utilized by more than one CGU. Corporate assets are allocated to CGUs on a reasonable and consistent basis and are tested for impairment as part of the impairment testing of the CGU that was allocated the corporate asset. Impairment losses are recognized in profit or loss. Goodwill impairment cannot be reversed. For all other assets, impairment recognized in prior periods is assessed on each reporting date for any indications that the losses decreased or no longer exist. Impairment is reversed when there has been a change in the estimates used to determine the recoverable amount. Impairment losses can only be reversed to the extent that the asset’s carrying amount does not exceed the carrying amount net of depreciation or amortization that would have been determined if an impairment had not been recognized. 2.5 ADDITIONAL INFORMATION 2 .5.1 KEY ESTIMATES AND ASSUMPTIONS Estimates and judgments are continually evaluated and based on historical experience and other factors that include expectations of future events that are believed to be realistic under the prevailing circumstances. The Group makes estimates and assumptions concerning the future. The resulting accounting-related estimates will, by definition, seldom correspond to the actual results. The estimates and assumptions that carry a significant risk of causing material adjustments to the carrying amounts of assets and liabilities in the next financial year are addressed below

Notes Financial Statements 137 REVENUE Revenues from milestones, royalties and contracts with multiple performance obligations are subject to assumptions regarding probabilities of occurrence and individual selling prices within the scope of the accounting and measurement principles explained in Note 2.7.1*. *CROSS- REFERENCE to page 137 FINANCIAL ASSETS Impairment losses on financial assets in the form of debt instruments and accounts receivable are based on assumptions about credit risk. The Group exercises discretion in making these assumptions and in selecting the inputs to calculate the impairment based on past experience, current market conditions and forward-looking estimates at the end of each reporting period. IN - PROCESS R&D PROGRAMS AND GOODWILL The Group performs an annual review to determine whether in-process R&D programs or goodwill is subject to impairment in accordance with the accounting policies discussed in Item 2.4.3*. The recoverable amounts from in-process R&D programs and cash-generating units have been determined using value-in-use calculations and are subjected to a sensitivity analysis. These calculations require the use of estimates (see Items 5.7.3* and 5.7.5* in the Notes). *CROSS-REFERENCE to page 136 and page 156 INCOME TAXES The Group is subject to income taxes in a number of tax jurisdictions. Due to the increasing complexity of tax laws and the corresponding uncertainty regarding the legal interpretation by the fiscal authorities, tax calculations are generally subject to an elevated amount of uncertainty. To the extent necessary, possible tax risks are taken into account in the form of provisions. Deferred tax assets on tax loss carryforwards are recognized based on the expected business performance of the relevant Group entity. For details on tax loss carryforwards and any recognized deferred tax assets, please refer to Item 4.4* in the Notes. *CROSS- REFERENCE to page 148 2 .5. 2 CAPITAL MANAGEMENT The Management Board’s policy for capital management is to preserve a strong and sustainable capital base in order to maintain the confidence of investors, business partners, and the capital market and to support future business development. As of December 31, 2018, the equity ratio was 90.6 % (December 31, 2017: 86.3 %; see also the following overview). The Group does not currently have any financial liabilities. Under the respective incentive plans resolved by the Annual General Meeting, the Management Board and employees may participate in the Group’s performance through long-term performance-related remuneration consisting of convertible bonds issued in 2013 and stock option plans (SOP) set up in 2017 and 2018. MorphoSys also established Long-Term Incentive plans (LTI plan) in 2014, 2015, 2016, 2017 and 2018. These programs are based on the performance-related issue of shares, or “performance shares”, which are granted when certain pre-defined success criteria have been achieved and the vesting period has expired (for more information, please refer to Item 7.3* in the Notes). There were no changes in the Group’s approach to capital management during the year. *CROSS-REFERENCE to page 163 in 000’ 12/31/2018 12/31/2017 Stockholders’ Equity 488,373 358,671 In % of Total Capital 90.6 % 86.3 % Total Liabilities 50,391 56,727 In % of Total Capital 9.4 % 13.7 % TOTAL CAPITAL 538,764 415,398 2.6 USE OF INTEREST RATES FOR MEASUREMENT The Group uses interest rates to measure fair value. When calculating share-based payment, MorphoSys uses the interest rate on four-year German government bonds on the date the share-based payment was granted. 2.7 ACCOUNTING POLICIES APPLIED TO LINE ITEMS OF PROFIT OR LOSS 2 .7.1 REVENUES AND REVENUE RECOGNITION As of January 1, 2018, the Group has adopted IFRS 15, the new accounting standard governing revenue recognition, using the modified retrospective method. The application of IFRS 15 requires a five-stage approach: Identification of the contract Identification of performance obligations Determination of the transaction price Allocation of the transaction price Revenue recognition The Group’s revenues typically include license fees, milestone payments,service fees, and royalties. LICENSE FEES AND MILESTONE PAYMENTS The Group recognizes revenues from license fees for intellectual property (IP) both at a point in time and over a period of time. An assessment needs to be made as to whether such a license represents a right to use (at a point in time) or a right to access (over time). Revenue for a right to use a license is recognized by the Group when the customer can use the IP and benefit from it as well as when the license term begins, e.g. for outlicensing of a drug candidate or technology without any further obligations for the Group. A license is treated as a right to access if the Group will undertake activities that significantly affect the IP during the license term, and the customer is directly exposed to any positive or negative effects of these activities, and these activities do not result in the transfer of a good or service to the customer. Revenues from right to access licenses are recognized linear over the license term. Milestone payments for research and development are contingent upon occurrence of a future event and represent variable consideration. The Group determines that at contract inception the most likely amount for milestone payments is zero. The most likely amount method of estimation is considered to be the most predictive for the outcome, since the outcome is binary, such as achieving a certain success in clinical development (or not). The Group will recognize milestone payments as revenue when it is highly unlikely that there will be a material reversal of cumulative revenue in future periods. Sales-based milestone payments included in contracts for licenses of IP are considered by the Group to be sales-based license fees because they are solely determined by sales of an approved drug. Accordingly, such milestones are recognized as revenue once sales of such drug occur or later if the performance obligation has not been fulfilled

Financial Statements Notes 138 SERVICE FEES Service fees for the assignment of personnel in research and development collaborations are recognized as revenues in the period the services are provided. In case a Group company acts as agent, revenues are recognized on a net basis. ROYALTIES With regard to royalties (income based on a percentage of sales of a marketed product), the same revenue recognition principles apply as for sales-based milestones as described above. AGREEMENTS WITH MULTIPLE PERFORMANCE OBLIGATIONS A Group company may enter into agreements with multiple performance obligations that include both licenses and services. In such cases, it has to be assessed as to whether the license is distinct from services (or other performance obligations) provided under the same agreement. The transaction price is allocated to separate performance obligations based on the relative stand-alone selling price of the performance obligations in the agreement. The Group company estimates stand-alone selling prices for non-individually sold goods and services on the basis of comparable transactions with other customers. A residual approach is used as a method to estimate the stand-alone selling price when the selling price for a good or service is highly variable or uncertain. PRINCIPLE-AGENT RELATIONSHIPS In agreements involving two or more independent parties that contribute to the provision of a specific good or service to a customer, a Group company assesses as to whether it has promised to provide the specific good or service itself (the company acting as a principal) or to arrange for this specific good or service to be provided by another party (the company acting as an agent). Depending on the result of this assessment, the Group company records revenues on a gross (principal) or net (agent) basis. A Group company is an agent and recognizes revenue on a net basis if its obligation is to arrange for another party to provide goods or services, i.e., the Group company does not control the specified good or service before it is transferred to the customer. Indicators to assist a company in determining whether it does not control the good or service before it is provided to a customer, and is therefore an agent, include, but are not limited to, the following criteria: Another party is primarily responsible for fulfilling the contract. The company does not have inventory risk. The company does not have discretion in establishing the price. No single indicator is determinative or weighted more heavily than other indicators. However, some indicators may provide stronger evidence than others, depending on the individual facts and circumstances. A Group company’s control needs to be substantive, so obtaining legal title of a good or service only momentarily before it is transferred to the customer does not necessarily indicate that a Group company is a principal. In general, the assessment whether a Group company is acting as a principal or as an agent in a transaction requires significant judgement. Based on the relevant facts and circumstances, the assessment of an agreement may lead to the conclusion that the counterparty is a cooperation partner or partner rather than a customer, meaning the agreement does not fall in the scope of IFRS 15 because the parties equally share the risks of co-developing a drug and the future profits from the marketing of the approved drug. REVENUE RECOGNITION THROUGH DECEMBER 31, 2017 The group applied the revenue recognition principles of IAS 18 Revenue through December 31, 2017. The Group’s revenue included license fees, milestone payments and service fees in 2017 and 2016. Under IAS 18.9, revenues were measured at fair value of the consideration received or receivable. In accordance with IAS 18.20b, revenues were recognized only to the extent that it was sufficiently probable that the Company will have received the economic benefits associated with the transaction. LICENSE FEES AND MILESTONE PAYMENTS Revenues related to non-refundable fees for providing access to technologies, fees for the use of technologies and license fees were recognized immediately and in full, if all IAS 18.14 criteria were met. Specifically, when significant risks and rewards of a license ownership have transferred to the customer and a Group company does not retain any continuing managerial involvement or effective control. In case these criteria were not met, revenues were recognized on a straight-line basis over the period of the agreement unless a more appropriate method of revenue recognition was available. The period of the agreement usually corresponded to the contractually agreed term of the research project or, in the case of contracts without an agreed project term, the expected term of the collaboration. Revenues from milestone payments were recognized upon achievement of certain contractual criteria. SERVICE FEES Service fees from research and development collaborations were recognized in the period the services were provided. Discounts that were likely to be granted and whose amount could be reliably determined were recognized as a reduction in revenue at the time of revenue recognition. The timing of the transfer of risks and rewards varied depending on the terms of the sales contract. In accordance with IAS 18.21 and 18.25, revenue from multiple-component contracts was recognized by allocating the total consideration to the separately identifiable components based on their respective fair values and by applying IAS 18.20. The applicable revenue recognition criteria were assessed separately for each component. 2.7.2 OPERATING EXPENSES COST OF SALES Cost of sales is recognized as an expense in the period in which the associated revenue accrues. This line item currently includes personnel expenses only. RESEARCH AND DEVELOPMENT Research costs are expensed in the period in which they occur. Development costs are generally expensed as incurred in accordance with IAS 38.5 and IAS 38.11 to 38.23. Development costs are recognized as an intangible asset when the criteria of IAS 38.21 (probability of expected future economic benefits, reliability of cost measurement) are met and if the Group can provide proof under IAS 38.57. This line item contains personnel expenses, consumables supplies, other operating expenses, impairment charges, amortization and other costs of intangible assets (additional information can be found under Item 5.7* in the Notes), costs for external services and depreciation and other costs for infrastructure. *CROSS-REFERENCE to page 155

Notes Financial Statements 139 SELLING The item includes personnel expenses, consumables, operating costs, amortization of intangible assets (software; further details in Item 5.7* of the Notes), costs for external services, infrastructure costs and depreciation. *CROSS-REFERENCE to page 155 GENERAL AND ADMINISTRATIVE This line item contains personnel expenses, consumable supplies, other operating expenses, amortization of intangible assets (software; additional information can be found under Item 5.7* in the Notes), expenses for external services and depreciation and other costs for infrastructure. *CROSS-REFERENCE to page 155 PERSONNEL EXPENSES RESULTING FROM STOCK OPTIONS The Group applies the provisions of IFRS 2 “Share-based Payment”, which require the Group to spread compensation expenses from the estimated fair values of share-based payments on the reporting date over the period in which the beneficiaries provide the services which triggered the granting of the share-based payments. IFRS 2 “Share-based Payment” requires the consideration of the effects of share-based payments if the Group acquires goods or services in exchange for shares or stock options (“settlement in equity instruments”) or other assets that represent the value of a specific number of shares or stock options (“cash settlement”). The key impact of IFRS 2 on the Group is the personnel expense resulting from the use of an option pricing model in relation to share-based incentives for the Management Board and employees. Additional information can be found under Items 7.1*, 7.2*, 7.3* and 7.4* in the Notes. *CROSS-REFERENCE to page 161-167 OPERATING LEASE PAYMENTS Payments made under operating leases are recognized in profit or loss on a straight-line basis over the term of the lease. According to SIC-15, all incentive agreements in the context of operating leases are recognized as an integral part of the net consideration agreed for the use of the leased asset. The total amount of income from incentives is recognized as a reduction in lease expenses on a straight-line basis over the term of the lease. All of the Group’s lease agreements are classified exclusively as operating leases. The Group did not engage in any finance lease arrangements. 2.7.3 OTHER INCOME In addition to government grants, other income primarily included currency gains from operating activities and income related to the Company’s canteen. GOVERNMENT GRANTS Grants, not repayable, received from government agencies to fund specific research and development projects are recognized in profit or loss in the separate line item “other income” to the extent that the related expenses have already occurred. Under the terms of the grants, government agencies generally have the right to audit the use of the funds granted to the Group. Basically, government grants are cost subsidies, and their recognition through profit or loss is limited to the corresponding costs. When the repayment of cost subsidies depends on the success of the development project, these cost subsidies are recognized as other liabilities until success has been achieved. If the condition for repayment is not met, then the grant is recognized under “other income”. No payments were granted in the 2018, 2017 and 2016 financial year that are required to be classified as investment subsidies. 2.7.4 OTHER EXPENSES The line item “other expenses” consisted mainly of currency losses from the operating business. 2.7.5 FINANCE INCOME AND FINANCE EXPENSES Gains and losses arising from changes in fair value, as well as interest effects from the application of the effective interest method to financial assets are recognized in profit or loss when incurred. 2.7.6 INCOME TAX EXPENSES/BENEFIT Income taxes consist of current and deferred taxes and are recognized in profit or loss unless they relate to items recognized directly in equity. Current taxes are the taxes expected to be payable on the year’s taxable income based on prevailing tax rates on the reporting date and any adjustments to taxes payable in previous years. The calculation of deferred taxes is based on the balance sheet liability method that refers to the temporary differences between the carrying amounts of assets and liabilities and the amounts used for taxation purposes. The method of calculating deferred taxes depends on how the assets’ carrying amount is expected to be realized and how the liabilities will be repaid. The calculation is based on the prevailing tax rates or those adopted on the reporting date. Deferred tax assets are offset against deferred tax liabilities if the taxes are levied by the same taxation authority and the entity has a legally enforceable right to set off current tax assets against current tax liabilities. Deferred tax assets are recognized only to the extent that it is likely that there will be future taxable income to offset. Deferred tax assets are reduced by the amount that the related tax benefit is no longer expected to be realized. 2.7.7 EARNINGS PER SHARE The Group reports basic and diluted earnings per share under consideration of IAS 33.41. Basic earnings per share is computed by dividing the net profit or loss attributable to parent company shareholders by the weighted-average number of ordinary shares outstanding during the reporting period. Diluted earnings per share is calculated in the same manner with the exception that the net profit or loss attributable to parent company shareholders and the weighted-average number of ordinary shares outstanding are adjusted for any dilutive effects resulting from stock options and convertible bonds granted to the Management Board and employees. In 2018, 2017 and 2016, diluted earnings per share equaled basic earnings per share. The effect of 120,214 potentially dilutive shares in 2018 (2017: 87,904 dilutive shares; 2016: 99,764 dilutive shares) resulting from stock options and convertible bonds granted to the Management Board, the Senior Management Group and employees of the Company who are not members of the Senior Management Group, has been excluded from the diluted earnings per share because it would result in a decrease in the loss per share and should therefore not be treated as dilutive

Financial Statements Notes 140 The 52,930 stock options not yet vested as of December 31, 2018 are not included in the calculation of potentially dilutive shares, as they are anti-dilutive for the 2018 fiscal year. These shares could possibly have a dilutive effect in the future. 2.8 ACCOUNTING POLICIES APPLIED TO THE ASSETS OF THE BALANCE SHEET 2.8.1 LIQUIDITY CLASSIFICATION As of January 1, 2018, the Group classifies its financial assets (debt instruments) in the following measurement categories: those that are subsequently measured at fair value (either through other comprehensive income or profit or loss) and those that are measured at amortized cost. The classification depends on the Company’s business model with respect to the management of the financial assets and the contractual cash flows. For assets measured at fair value, gains and losses are recognized either within other comprehensive income or profit or loss. The Group only reclassifies debt instruments when the business model for managing such assets changes. The Group regards all cash at banks and on hand and all short-term deposits with a maturity of three months or less as cash and cash equivalents. The Group invests most of its cash and cash equivalents at several major financial institutions: Commerzbank, UniCredit, BayernLB, LBBW, BNP Paribas, Deutsche Bank, Sparkasse, Rabobank and Bank of America Merrill Lynch. Guarantees granted for rent deposits and obligations from convertible bonds issued to employees are recorded under other assets as restricted cash since they are not available for use in the Group’s operations. RECOGNITION AND DERECOGNITION A purchase or sale of financial assets in a manner that is customary for the market is recognized as of the trade date, which is the date on which the Group commits to buying or selling the asset. Financial assets are derecognized when the claims to receive cash flows from the financial assets expire or have been transferred, and the Group has transferred substantially all the risks and rewards of ownership. MEASUREMENT Upon initial recognition, the Group measures a financial asset at fair value plus transaction costs directly attributable to the acquisition of that asset when a financial asset is not subsequently measured at fair value in profit or loss. Transaction costs of financial assets measured at fair value through profit or loss are recognized as expenses in profit or loss. The subsequent measurement of debt instruments depends on the Group’s business model for managing the asset and the asset’s cash flow characteristics. The Group classifies its debt instruments in one of the following measurement categories. Assets that are held in order to collect the contractual cash flows and for which these cash flows represent only interest and principal payments are measured at amortized cost. Interest income from these financial assets is recognized in finance income using the effective interest method. Gains or losses on derecognition are recognized directly in profit or loss and recorded in the finance result. Impairment losses are recognized as a separate line item in profit or loss. Assets that are held to collect the contractual cash flows and to sell the financial assets and where the cash flows represent solely principle and interest payments are measured at fair value through other comprehensive income. Changes in the carrying amount are recognized in other comprehensive income, with the exception of impairment losses and income from the reversal of impairment, interest income, and foreign currency gains and losses, which are recognized in profit or loss. Upon derecognition of the financial asset, the cumulative gain or loss previously recognized in other comprehensive income is reclassified from equity to profit or loss and is recorded in the finance result. Interest income from these financial assets is reported in finance income using the effective interest method. Foreign exchange gains and losses are shown under other income/expenses, and impairment losses are included in a separate line item in profit or loss. Assets that do not meet the criteria of the categories at amortized cost or at fair value through other comprehensive income are allocated to the category at fair value through profit or loss. Gains or losses on a debt instrument that is subsequently measured at fair value through profit or loss, are recognized on a net basis in the finance result in the period in which they occur. DERIVATIVES The Group uses derivatives to hedge its foreign exchange risk and cash flows. The use of derivatives is subject to a Group policy approved by the Management Board, which sets out a written guideline on the use of derivatives. According to the Group’s hedging policy, only highly probable future cash flows and clearly identifiable receivables that can be collected within a twelve-month period are hedged. Derivatives are initially recognized at fair value at the time of the conclusion of a derivative transaction and subsequently remeasured at fair value at the end of each reporting period. Changes in the fair value of a derivative instrument that are not accounted for as a hedging relationship are recognized directly in the finance result in profit or loss. MorphoSys did not apply hedge accounting under IAS 39 as at December 31, 2017, nor during the year 2018, therefore IFRS 9 has no impact on the recognition of hedging relationships. 2.8.2 ACCOUNTS RECEIVABLE, INCOME TAX RECEIVABLES AND OTHER RECEIVABLES Accounts receivable are measured at amortized cost less any impairment using the simplified impairment model (see Items 2.3.1*, 2.4.2* and 5.3* in the Notes). *CROSS-REFERENCE to page 129, page 136 and page 153 Income tax receivables mainly include receivables due from tax authorities in the context of capital gain taxes withheld. Other non-derivative financial instruments are measured at amortized cost using the effective interest method. 2.8.3 INVENTORIES Inventories are measured at the lower value of production or acquisition cost and net realizable value under the first-in first-out method. Acquisition costs comprise all costs of purchase and those incurred in bringing the inventories into operating condition while taking into account purchase price reductions, such as bonuses and discounts. Net realizable value is the estimated selling price less the estimated expenses necessary for completion and sale. Inventories are divided into the categories of raw materials and supplies.

Notes Financial Statements 141 2 .8. 4 PREPAID EXPENSES AND OTHER CURRENT ASSETS Prepaid expenses include expenses resulting from an outflow of liquid assets prior to the reporting date that are only recognized as expenses in the subsequent financial year. Such expenses usually involve maintenance contracts, sublicenses and upfront payments for external laboratory services not yet performed. Other current assets primarily consist of receivables towards tax authorities from input tax surplus resulting from value-added taxes, combination compounds and receivables from upfront payments. This item is recognized at nominal value. 2 .8.5 PROPERTY, PLANT AND EQUIPMENT Property, plant and equipment is recorded at historical cost less accumulated depreciation (see Item 5.6* in the Notes) and any impairment (see Item 2.4.3* in the Notes). Historical cost includes expenditures directly related to the purchase at the time of the acquisition. Replacement purchases, building alterations and improvements are capitalized while repair and maintenance expenses are charged as expenses as they are incurred. Property, plant and equipment is depreciated on a straight-line basis over its estimated useful life (see table below). Leasehold improvements are depreciated on a straight-line basis over the lesser of the asset’s estimated useful life or the remaining term of the lease. *CROSS- REFERENCE to page 154 and page 136 Depreciation Asset Class Useful Life Rates Computer Hardware 3 years 33 % Low-value Laboratory and Office Equipment between 250 and 800 Immediately 100 % Permanent Improvements to Property/Buildings 10 years 10 % Office Equipment 8 years 13 % Laboratory Equipment 4 years 25 % The residual values and useful lives of assets are reviewed at the end of each reporting period and adjusted if appropriate. Borrowing costs that can be directly attributed to the acquisition, construction or production of a qualifying asset are not included in the acquisition or production costs because the Group finances the entire operating business with equity. 2 .8.6 INTANGIBLE ASSETS Purchased intangible assets are capitalized at acquisition cost and exclusively amortized on a straight-line basis over their useful lives. Internally generated intangible assets are recognized to the degree the recognition criteria set out in IAS 38 are met. Development costs are capitalized as intangible assets when the capitalization criteria described in IAS 38 have been met, namely, clear specification of the product or procedure, technical feasibility, intention of completion, use, commercialization, coverage of development costs through future free cash flows, reliable determination of these free cash flows and availability of sufficient resources for completion of development and sale. Amortization of intangible assets is recorded in research and development expenses. Expenses to be classified as research expenses are allocated to research and development expenses as defined by IAS 38. Subsequent expenditures for capitalized intangible assets are capitalized only when they substantially increase the future economic benefits of the specific asset to which they relate. All other expenditures are expensed as incurred. PATENTS Patents obtained by the Group are recorded at acquisition cost less accumulated amortization (see below) and any impairment (see Item 2.4.3* in the Notes). Patent costs are amortized on a straight-line basis over the lower of the estimated useful life of the patent (ten years) or the remaining patent term. Amortization starts when the patent is issued. Technology identified in the purchase price allocation for the acquisition of Sloning BioTechnology GmbH is recorded at the fair value at the time of acquisition, less accumulated amortization (useful life of ten years). *CROSS- REFERENCE to page 136 LICENSE RIGHTS The Group has acquired license rights from third parties by making upfront license payments, paying annual fees to maintain the license and paying fees for sublicenses. The Group amortizes upfront license payments on a straight-line basis over the estimated useful life of the acquired license (eight to ten years). The amortization period and method are reviewed at the end of each financial year in accordance with IAS 38.104. Annual fees to maintain a license are amortized over the term of each annual agreement. Sublicense fees are amortized on a straight-line basis over the term of the contract or the estimated useful life of the collaboration for contracts without a set duration. IN - PROCESS R &D PROGRAMS This line item contains capitalized upfront payments from the in licensing of compounds for the Proprietary Development segment, as well as milestone payments for these compounds subsequently paid as milestones were achieved. Additionally, this line item also includes compounds or antibody programs resulting from acquisitions. The assets are recorded at acquisition cost and are not yet available for use and therefore not subject to scheduled amortization. The assets are tested for impairment annually or in case of triggering events, as required by IAS 36. SOFTWARE Software is recorded at acquisition cost less accumulated amortization (see below), and any impairment (see Item 2.4.3* in the Notes). Amortization is recognized in profit or loss on a straight-line basis over the estimated useful life of three to five years. Software is amortized from the date the software is operational. *CROSS- REFERENCE to page 136 GOOD WILL Goodwill is recognized for expected synergies from business combinations and the skills of the acquired workforce. Goodwill is tested annually for impairment as required by IAS 36 (see Item 5.7.5* in the Notes). *CROSS- REFERENCE to page 156 Amortization Intangible Asset Class Useful Life Rates Patents10 years 10 % License Rights 8 - 10 years 13 % - 10 % Not yet amortized, Impair- In-process R&D Programs ment Only -Software 3 - 5 years 33 % - 20 % Goodwill Impairment Only -

Financial Statements Notes 142 2 .8.7 INVESTMENTS AT FAIR VALUE , WITH CHANGES RECOGNIZED IN OTHER COMPREHENSIVE INCOME The investment in adivo GmbH is accounted for as an equity instrument at fair value. Changes in fair value are recognized in other comprehensive income. This was irrevocably determined when the investment was first recognized. This investment is a strategic financial investment, and the Group considers this classification to be more meaningful. If the investment is derecognized, no subsequent reclassification of gains or losses to profit or loss will occur. Dividends from this investment are recognized in profit or loss when there is a justified right to receive payment. 2 .8.8 PREPAID EXPENSES AND OTHER ASSETS , NET OF CURRENT PORTION The non-current portion of expenses that occurred prior to the reporting date, but are to be recognized in subsequent financial years is recorded in prepaid expenses. This line item contains maintenance contracts and sublicenses. This line item also includes other non-current assets, which are recognized at fair value. Other non-current assets consist mainly of restricted cash, such as rent deposits. 2.9 ACCOUNTING POLICIES APPLIED TO EQUITY AND LIABILITY ITEMS OF T HE BALANCE SHEE T 2 .9.1 ACCOUNTS PAYABLE , OTHER LIABILITIES AND OTHER PROVISIONS Accounts payable and other liabilities are initially recognized at fair value and subsequently at amortized cost using the effective interest method. Liabilities with a term of more than one year are discounted to their net present value. Liabilities with uncertain timing or amount are recorded as provisions. IAS 37 requires the recognition of provisions for obligations to third parties arising from past events. Furthermore, provisions are only recognized for legal or factual obligations to third parties if the event’s occurrence is more likely than not. Provisions are recognized at the amount required to settle the respective obligation and discounted to the reporting date if the interest effect is material. The amount required to meet the obligation also includes expected price and cost increases. The interest portion of other provisions is recorded in the finance result. The measurement of provisions is based on past experience and considers the circumstances in existence on the reporting date. The Group has entered into various research and development contracts with research institutions and other companies. These agreements are generally cancelable, and related costs are recorded as research and development expenses as incurred. The Group records accruals for estimated ongoing research costs that have been incurred. When evaluating the adequacy of the accruals, the Group analyzes the progress of the studies, including the phase or completion of events, invoices received and contracted costs. Significant judgments and estimates are made in determining the accrued balances at the end of any reporting period. Actual results could differ from the Group’s estimates. The Group’s historical accrual estimates have not been materially different from the actual costs. 2.9. 2 TAX PROVISIONS Tax liabilities are recognized and measured at their nominal value. Tax liabilities contain obligations from current taxes, excluding deferred taxes. Provisions for trade taxes, corporate taxes and similar taxes on income are determined based on the taxable income of the consolidated entities less any prepayments made. 2 .9. 3 CURRENT PORTION OF CONTRACT LIABILITIES Upfront payments from customers for services to be rendered by the Group and revenue that must be recognized over a period of time in accordance with IFRS 15.35 are deferred and measured at the nominal amount of cash received. The corresponding rendering of services and revenue recognition is expected to occur within a twelve-month period following the reporting date. Prior to December 31, 2017, this item was recognized as deferred revenue. 2 .9. 4 CONTRACT LIABILITIES , NET OF CURRENT PORTION This line item includes the non-current portion of deferred upfront payments and income from customers that is required to be recognized over a period of time in accordance with IFRS 15.35. These are measured at the nominal amount of cash received. Prior to December 31, 2017, this item was reported as deferred revenue, net of current portion. 2 .9.5 CONVERTIBLE BONDS DUE TO RELATED PARTIES The Group had issued convertible bonds to the Group’s Management Board and employees. In accordance with IAS 32.28, the equity component of a convertible bond must be credited separately in additional paid-in capital. The equity component is determined by deducting the separately determined amount of the liability component from the fair value of the convertible bond. The debit effect of the equity component is recognized in profit or loss in personnel expenses from share-based payments, whereas the effect on profit or loss from the liability component is recognized as interest expense. The Group applies the provisions of IFRS 2 “Share-based Payment” for all convertible bonds granted to the Management Board and the Group’s employees. 2 .9.6 DEFERRED TAXES The recognition and measurement of deferred taxes are based on the provisions of IAS 12. Deferred tax assets and liabilities are calculated using the liability method, which is common practice internationally. Under this method, taxes expected to be paid or recovered in subsequent financial years are based on the applicable tax rate at the time of recognition. Deferred tax assets and liabilities are recorded separately in the balance sheet and take into account the future tax effect resulting from temporary differences between values in the balance sheet for assets, liabilities as well as for tax loss carryforwards. Deferred tax assets are offset against deferred tax liabilities if the taxes are levied by the same taxation authority and the entity has a legally enforceable right to set of current tax assets against current tax liabilities. Pursuant to IAS 12,deferred tax assets and liabilities may not be discounted. 2 .9.7 OTHER LIABILITIES The line item “other liabilities” consists of a deferred amount related to rent-free periods as agreed. The corresponding reduction of these liabilities over the minimum rent period is calculated based on the effective interest method. Other liabilities are discounted due to their long-term maturities at an interest rate equivalent to the rent term.

Notes Financial Statements 143 2 .9.8 STOCK HOLDERS’ EQUITY COMMON STOCK Ordinary shares are classified as stockholders’ equity. Incremental costs directly attributable to the issue of ordinary shares and stock options are recognized as a deduction from stockholders’ equity. TREASURY STOCK Repurchases of the Company’s own shares at prices quoted on an exchange or at market value are recorded in this line item as a deduction from common stock. When common stock that is recorded as stockholders’ equity is repurchased, the amount of consideration paid, including directly attributable costs, is recognized as a deduction from stockholders’ equity net of taxes and is classified as treasury shares. When treasury shares are subsequently sold or reissued, the proceeds are recognized as an increase in stockholders’ equity, and any difference between the proceeds from the transaction and the initial acquisition costs is recognized in additional paid-in capital. The allocation of treasury shares to beneficiaries under Long-Term Incentive plans (in this case: performance shares) is reflected in this line item based on the set number of shares to be allocated after the expiration of the four-year vesting period (quantity structure) multiplied by the weighted-average purchase price of the treasury shares (value structure). The adjustment is carried out directly in equity by reducing the line item treasury stock, which is a deduction from common stock, while simultaneously reducing additional paid-in capital. Further information can be found in Items 7.3.1* and 7.3.2* in the Notes. *CROSS-REFERENCE to page 163 ADDITIONAL PAID-IN CAPITAL Additional paid-in capital mainly consists of personnel expenses resulting from the grant of stock options, convertible bonds and performance shares and the proceeds from newly created shares in excess of their nominal value. REVALUATION RESERVE The revaluation reserve mainly consisted of unrealized gains and losses on available-for-sale financial assets that were measured directly in equity until they were sold. Starting with the application of IFRS 9 as of January 1, 2018, the reporting of this reserve is no longer required. OTHER COMPREHENSIVE INCOME RESERVE The item “other comprehensive income reserve” includes changes in the fair value of equity instruments that are recognized in other comprehensive income and foreign exchange differences that are not recognized in profit or loss. ACCUMULATED INCOME/DEFICIT The “accumulated income/deficit” line item consists of the Group’s accumulated consolidated net profits/losses. A separate measurement of this item is not made. 3 Segment Reporting MorphoSys Group applies IFRS 8 “Operating Segments”. An operating segment is defined as a unit of an entity that engages in business activities from which it can earn revenues and incur expenses and whose operating results are regularly reviewed by the entity’s chief operating decision maker, the Management Board, and for which discrete financial information is available. Segment information is provided for the Group’s operating segments based on the Group’s management and internal reporting structures. The segment results and segment assets include items that can be either directly attributed to the individual segment or allocated to the segments on a reasonable basis. The Management Board evaluates a segment’s economic success using selected key figures so that all relevant income and expenses are included. EBIT, which the Company defines as earnings before finance income, finance expenses, impairment losses on financial assets and income taxes, is the key benchmark for measuring and evaluating the operating results. Refer to the table in Note 3.3* for a reconciliation of EBIT to Net income as well as to the table in Note 4.3* for a breakdown of finance income and expenses. Other key internal reporting figures include revenues, operating expenses, segment results and the liquidity position. The Group consists of the following operating segments. *CROSS- REFERENCE to page 144 and page 148 3.1 PROPRIETARY DEVELOPMENT The segment comprises all activities related to the proprietary development of therapeutic antibodies and peptides. Currently, this segment’s activities comprise a total of twelve antibodies and peptides, with MOR208 representing the Company’s most advanced proprietary clinical program. Also included are the antibody MOR202, which was partially out-licensed to I-Mab Biopharma and MOR106, which had been co-developed with Galapagos and was out-licensed to Novartis during the reporting year. Also included is the Company’s MOR103 program, which was out-licensed to GlaxoSmithKline (GSK) in 2013. The partially or completely out-licensed programs have been part of the Proprietary Development segment since the beginning of their development and will therefore continue to be reported in this segment. MorphoSys is also pursuing other early-stage proprietary development and co-development programs. These include the clinical program MOR107 (formerly LP2), which originated from the acquisition of Lanthio Pharma B.V. This program was evaluated in a phase 1 study in healthy volunteers and is currently undergoing preclinical studies for oncology indications. One other program is in preclinical development and another six programs are in drug discovery. The Proprietary Development segment also manages the development of proprietary technologies. 3.2 PARTNERED DISCOVERY MorphoSys possesses one of the leading technologies for generating therapeutics based on human antibodies. The Group markets this technology commercially through its partnerships with numerous pharmaceutical and biotechnology companies. The Partnered Discovery segment encompasses all operating activities relating to these commercial agreements.

Financial Statements Notes 144 3.3 CROSS-SEGMENT DISCLOSURE The information on segment assets is based on the assets’ respective locations. Proprietary Development Partnered Discovery For the Twelve-month Period Ended December 31 2018 2017 2016 2018 2017 2016 External Revenues 53,610 17,635 621 22,832 49,156 49,123 Operating Expenses (107,019) (99,106) (78,515) (9,516) (18,906) (18,113) SEGMENT RESULT (53,409) (81,471) (77,894) 13,316 30,250 31,010 Other Income 159 157 327 0 0 0 Other Expenses 0 0 0 0 0 0 SEGMENT EBIT (53,250) (81,314) (77,567) 13,316 30,250 31,010 Finance Income Finance Expenses Impairment Losses on Financial Assets EARNINGS BEFORE TAXES Income Tax Benefit/(Expenses) NE T LOSS Current Assets 15,842 8,802 13,157 7,114 18,054 18,415 Non-current Assets 42,041 60,658 59,292 6,288 8,490 10,165 TOTAL SEGMENT ASSETS 57,883 69,460 72,449 13,402 26,544 28,580 Current Liabilities 32,167 33,008 20,948 1,471 4,083 2,512 Non-current Liabilities 3,291 7,072 6,930 158 1,045 2,165 Stockholders’ Equity 0 0 0 0 0 0 TOTAL SEGMENT LIABILITIES AND EQUITY 35,458 40,080 27,878 1,629 5,128 4,677 Capital Expenditure 1,319 12,344 1,358 879 602 1,181 Depreciation and Amortization 1,903 1,555 1,272 1,429 2,075 2,117 The segment result is defined as a segment’s revenue less the segment’s operating expenses. The unallocated other operating expenses of 20.0 million (2017: 15.8 million; 2016: 13.2 million) included primarily expenses for central administrative functions that are not allocated to one of the two segments. Finance income, finance expense and income tax are also not allocated to the segments as they are managed on a Group basis. In the 2018 financial year, impairments totaling 19.2 million were recognized in the Proprietary Development segment (2017: impairments of 9.9 million in the Proprietary Development segment; 2016: impairments of 10.1million in the Proprietary Development segment). The Groups key customers are allocated to either the Proprietary Development or Partnered Discovery segments. As of December 31, 2018, the single most important customer represented accounts receivable with a carrying amount of 5.9 million (December 31, 2017: 5.1 million). The largest customer accounted for revenues in 2018 of 49.5 million, the second largest for 19.0 million and the third largest for 3.9 million. The largest and third largest customers are allocated to the Proprietary Development segment and the second largest customer to the Partnered Discovery segment. In 2017, the largest customer accounted for 36.9 million of the Group’s total revenue, the second largest 16.8 million and the third largest 6.7 million. The largest and third largest customers were allocated to the Partnered Discovery segment, and the second largest customer to the Proprietary Development segment. The top three of the Groups customers that were all allocated to the Partnered Discovery segment accounted for 42.1 million, 2.5 million and 2.5 million, respectively, of the total revenues in 2016. The following overview shows the Groups regional distribution of revenue. in 000’ 2018 2017 2016 Germany 309 851 1,621 Europe and Asia 56,784 57,229 43,046 USA and Canada 19,350 8,711 5,077 TOTAL 76,443 66,791 49,744

Notes Financial Statements 145 Unallocated Group 2018 2017 2016 2018 2017 2016 0 0 0 76,442 66,791 49,744 (19,969) (15,835) (13,212) (136,504) (133,847) (109,840) (19,969) (15,835) (13,212) (60,062) (67,056) (60,096) 1,486 963 382 1,645 1,120 709 (689) (1,671) (554) (689) (1,671) (554) (19,172) (16,543) (13,384) (59,106) (67,607) (59,941) 418 712 1,385 (754) (1,895) (1,308) (1,035) 0 0 (60,477) (68,790) (59,864) 4,305 (1,036) (519) (56,172) (69,826) (60,383) 365,949 313,825 276,484 388,905 340,681 308,056 101,530 5,569 86,087 149,859 74,717 155,544 467,479 319,394 362,571 538,764 415,398 463,600 12,285 10,610 14,842 45,923 47,701 38,302 1,019 909 743 4,468 9,026 9,838 488,373 358,671 415,460 488,373 358,671 415,460 501,677 370,190 431,045 538,764 415,398 463,600 268 204 374 2,466 13,150 2,913 418 400 375 3,750 4,030 3,764 The following overview shows the timing of the satisfaction of performance obligations in 2018. in 000’€ Proprietary Development Partnered Discovery At a Point in Time thereof performance obligations fulfilled in previous periods: 0 in Proprietary Development and 19.0 million in Partnered Discovery 53,610 22,268 Over Time 0 564 TOTAL 53,610 22,832 A total of € 136.1 million (December 31, 2017: € 42.2 million) and € 13.7 million (December 31, 2017: € 32.6 million) of the Group’s non-current assets, excluding deferred tax assets, are located in Germany and the Netherlands, respectively. There are no non-current assets in the USA as of December 31, 2018. The Group’s total investments of € 2.4 million (December 31, 2017: € 13.1 million) were made in Germany, except for € 0.1 million (December 31, 2017: € 0.1 million), which were made in the Netherlands. In accordance with internal definitions, investments only included additions to property, plant and equipment as well as intangible assets which are not related to business combinations.

Financial Statements Notes 146 4 Notes to Profit or Loss 4 .1 REVENUES In 2018, revenues consisted of milestone payments and royalties totaling 19.3 million (2017: 7.3 million; 2016: 5.6 million). In 2018, 2017 and 2016 these were entirely generated by the Partnered Discovery segment. Revenues from license fees (except milestone payments and royalties) amounted to 51.2 million in 2018 (2017: 37.5 million; 2016: 22.8 million) and was attributable to the Proprietary Development segment in the amount of 50.6 million (2017: 16.8 million), and to the Partnered Discovery segment in the amount of 0.6 million (2017: 20.7 million; 2016: 22.8 million). Of the service fee revenues totaling 5.9 million (2017: 22.0 million; 2016: 21.4 million), 3.0 million (2017: 0.8 million; 2016: 0.6 million) was attributable to the Proprietary Development segment, and 2.9 million (2017: 21.2 million; 2016: 20.8 million) to the Partnered Discovery segment. Substantially all service fee revenues relate to revenue on a gross basis (principal). Of the total revenues in 2018, revenues of 19.0 million were recognized from performance obligations that were fulfilled in previous periods and relate to milestone payments and royalties (2017: 7.8 million; 2016: 7.1 million). 4.2 OPERATING EXPENSES 4.2.1 COST OF SALES Cost of sales consists of the items below. in 000’ 2018 2017 2016 Personnel Expenses 1,797 0 0 TOTAL 1,797 0 0 4. 2 . 2 RESEARCH AND DEVELOPMENT EXPENSES Research and development expenses are composed of the items below. in 000’ 2018 2017 2016 Personnel Expenses 25,288 28,482 25,145 Consumable Supplies 2,310 2,588 2,321 Other Operating Expenses 2,761 2,757 2,608 Impairment, Amortization and Other Costs of Intangible Assets 22,760 13,503 13,689 External Services 47,889 61,119 44,311 Depreciation and Other Costs for Infrastructure 5,389 4,865 5,889 TOTAL 106,397 113,314 93,963 4.2.3 SELLING EXPENSES Selling expenses consist of the items below. in 000’ 2018 2017 2016 Personnel Expenses 2,536 1,771 1,661 Consumable Supplies 3 1 1 Other Operating Expenses 538 386 444 Amortization of Intangible Assets 25 0 0 External Services 2,953 2,658 338 Depreciation and Other Costs for Infrastructure 328 0 0 TOTAL 6,383 4,816 2,444

Notes Financial Statements 147 4.2.4 GENERAL AND ADMINISTRATIVE EXPENSES General and administrative expenses included the items below. in 000’ 2018 2017 2016 Personnel Expenses 15,016 11,797 9,208 Consumable Supplies 15 33 97 Other Operating Expenses 1,012 714 847 Amortization of Intangible Assets 97 112 111 External Services 4,475 2,224 2,244 Depreciation and Other Costs for Infrastructure 1,313 838 925 TOTAL 21,928 15,718 13,432 4.2.5 PERSONNEL EXPENSES Personnel expenses included the items below. in 000’ 2018 2017 2016 Wages and Salaries 30,349 28,196 27,146 Social Security Contributions 4,341 4,542 4,570 Share-based Payment Expense 5,585 4,975 2,357 Temporary Staff (External) 1,241 881 1,061 Other 3,121 3,456 880 TOTAL 44,637 42,050 36,014 Personnel expenses from share-based payment in 2018 included a onetime entitlement granted to related parties to receive treasury shares amounting to 2.1 million. Further details can be found in Item 6.5.4* of the Notes. *CROSS- REFERENCE to page 160 In 2018, other personnel expenses mainly included costs for personnel recruitment as well as promotion and development measures. In 2017, this item consisted primarily of costs for severance payments and measures to recruit, promote and develop personnel. In 2016, other personnel expenses comprised mainly of recruitment costs. Due to the increasing importance of selling expenses in connection with the planned preparations for the commercialization of MOR208, the existing functions presented in profit or loss were expanded in 2018 to include the area of “sales”. In order to ensure the comparability of information, the previous year’s figures have been adjusted accordingly. The average number of employees in the 2018 financial year was 327 (2017: 344; 2016: 354). Of the 329 employees on December 31, 2018 (December 31, 2017: 326; December 31, 2016: 345), 246 were active in research and development (December 31, 2017: 253; December 31, 2016: 280), 21 in sales (December 31, 2017: 14; December 31, 2016: 12), and 62 were engaged in general and administrative functions (Decem-ber 31, 2017: 59 employees; December 31, 2016: 53 employees). As of December 31, 2018, there were 209 employees in the Proprietary Development segment and 49 employees in the Partnered Discovery segment while 71 employees were not allocated to a specific segment (December 31, 2017: 161 in the Proprietary Development segment, 105 employees in the Partnered Discovery segment and 60 employees were unallocated; December 31, 2016: 135 in the Proprietary Development segment, 156 employees in the Partnered Discovery segment and 54 employees were unallocated). Costs for defined-contribution plans amounted to 0.7 million in 2018 (2017: 0.6 million; 2016: 0.5 million).

Financial Statements Notes 148 4.3 OTHER INCOME AND EXPENSES, FINANCE INCOME AND FINANCE EXPENSES in 000’ 2018 2017 2016 Grant Income 153 157 327 Gain on Foreign Exchange 677 485 192 Gain from recognition of previously unrecognized intangible assets 350 0 0 Reversal of Impairment for Accounts Receivable Previously Deemed Impaired 0 76 15 Miscellaneous Income 465 402 175 Other Income 1,645 1,120 709 Loss on Foreign Exchange (457) (844) (400) Impairment of Other Receivables 0 0 (7) Miscellaneous Expenses (232) (827) (147) Other Expenses (689) (1,671) (554) Gain on Financial Assets at Fair Value through Profit or Loss (2017 and 2016: Gain on Available-for-sale Financial Assets and Bonds) 5 35 294 Interest Income on Other Financial Assets at Amortized Cost 91 236 1,017 Gain on Derivatives 322 441 74 Finance Income 418 712 1,385 Loss on Financial Assets at Fair Value through Profit or Loss (2017 and 2016: Loss on Available-for-sale Financial Assets and Bonds) (85) (120) (1,209) Interest Expenses for Other Financial Assets at Amortized Cost (53) (374) (20) Interest Expenses for Financial Liabilites at Amortized Cost (126) 0 0 Loss on Derivatives (444) (1,360) (44) Bank Fees (46) (41) (35) Finance Expenses (754) (1,895) (1,308) The following net gains or losses resulted from financial instruments in the fiscal year. in 000’ 2018 2017 2016 Financial Assets at Fair Value through Profit or Loss (202) (919) 30 Other Financial Assets at Amortized Cost (978) 0 0 Shares at Fair Value through Other Comprehensive Income (127) 0 0 Financial Liabilities at Amortized Cost (126) 0 0 Available-for-sale Financial Assets 0 (190) (1,069) Financial Assets classified as Loans and Receivables 0 (164) 918 TOTAL (1,433) (1,273) (121) Net gains or losses mainly comprised gains and losses on derivatives, interest income and expenses as well as valuation effects from changes in fair value. 4.4 INCOME TAX EXPENSES/ BENEFIT MorphoSys AG is subject to corporate taxes, the solidarity surcharge and trade taxes. The Company’s corporate tax rate in 2018 remained unchanged (15.0 %) as did the solidarity surcharge (5.5 %) and the effec-tive trade tax rate (10.85 %). MorphoSys US Inc. is subject to Federal Corporate Income Tax (21 %) and the State Income Tax for Princeton, New Jersey (9 %). The Dutch entities Lanthio Pharma B.V. and LanthioPep B.V. are subject to an income tax rate of 25 % on annual income exceeding 200,000; annual income below 200,000 is subject to a tax rate of 20 %. Depending on certain conditions, a tax rate of previously 5 % and from January 1, 2018, 7 % may be applicable under what is known as the “Innovation Box.”

Notes Financial Statements 149 Income taxes consist of the items listed below. in 000’ 2018 2017 2016 Current Tax Income/(Expense) (Thereof Regarding Prior Years: k 1; 2017: k 171; 2016: k (60)) 1 (534) 45 Deferred Tax Benefit/(Expenses) 4,304 (502) (564) Total Income Tax Benefit/(Expenses) 4,305 (1,036) (519) Total Amount of Current Taxes Resulting from Entries Directly Recognized in Other Comprehensive Income 0 0 (82) Total Amount of Deferred Taxes Resulting from Entries Directly Recognized in Other Comprehensive Income 00 (112) Total Amount of Tax Effects Resulting from Entries Directly Recognized in Equity or Other Comprehensive Income 00 (194) The deferred tax benefit in 2018 mainly resulted from the impairment on intangible assets within the cash-generating unit, the Lanthio Group ( 3.8 million). Further information can be found in Item 5.7.5* in the Notes. *CROSS- REFERENCE to page 156 The following table reconciles the expected income tax expense to the actual income tax expense as presented in the consolidated financial statements. The combined income tax rate of 26.675 % in the 2018 finan-cial year (2017: 26.675 %) was applied to profit before taxes to calculate the statutory income tax expense. This rate consisted of corporate income tax of 15.0 %, a solidarity surcharge of 5.5 % on the corporate tax and an average trade tax of 10.85 % applicable to the Group. in 000’ 2018 2017 2016 Earnings Before Income Taxes (60,477) (68,790) (59,864) Expected Tax Rate 26,675 % 26,675 % 26,675 % Expected Income Tax 16,132 18,350 15,969 Tax Effects Resulting from: Share-based Payment (363) (290) 5 Non-Tax-Deductible Items (126) (134) (135) Differences in Profit or Loss-Neutral Adjustments 3,716 37 812 Non-Recognition of Deferred Tax Assets on Temporary Differences (349) 3,256 (3,766) Non-Recognition of Deferred Tax Assets on Current Year Tax Losses (14,497) (22,007) (13,354) Tax Rate Differences to Local Tax Rates (268) (71) (46) Prior Year Taxes 1 (171) 0 Other Effects 59 (6) (4) Actual Income Tax 4,305 (1,036) (519) The differences in profit or loss-neutral adjustments mainly contained the permanent differences of the issuance costs from the Nasdaq IPO. As of December 31, 2018, neither deferred tax assets on tax loss carry-forwards in the amount of 51.0 million (December 31, 2017: 37.4 million) nor deferred tax assets on temporary differences in the amount of 0.7 million (December 31, 2017: 0.5 million) were recognized by MorphoSys Group due to losses to be incurred as a result of continued substantial investments in proprietary product development and related business development.

Financial Statements Notes 150 Deferred tax assets and deferred tax liabilities are composed as follows. Deferred Tax Asset 2018 Deferred Tax Asset 2017 Deferred Tax Liability 2018 Deferred Tax Liability 2017 in 000’s , as of December 31 Intangible Assets 0 0 4,317 8,297 Receivables and Other Assets 319 0 0 0 Prepaid Expenses and Deferred Charges 0 0 0 3 Other Provisions 278 253 0 0 Other Liabilities 213 236 0 0 TOTAL 810 489 4,317 8,300 Changes in Deferred Taxes in 2018 in 000’s , as of December 31 Recognized in Profit or Loss Income/(Expense) Recognized in Other Comprehensive Income Intangible Assets 3,980 0 Receivables and Other Assets 319 0 Prepaid Expenses and Deferred Charges 3 0 Other Provisions 25 0 Other Liabilities (23) 0 TOTAL 4,304 0 As of December 31, 2018, temporary differences of 1.0 million (De-cember 31, 2017: 0.2 million) existed in connection with investments in subsidiaries (known as outside basis differences) for which no deferred tax assets were recognized (2017: no deferred tax liabilities).

Notes Financial Statements 151 4.5 EARNINGS PER SHARE Earnings per share are computed by dividing the 2018 consolidated net loss of 56,172,121 (2017: consolidated net loss of 69,826,469; 2016: consolidated net loss of 60,382,776) by the weighted-average number of ordinary shares outstanding during the respective year (2018: 31,338,948; 2017: 28,947,566; 2016: 26,443,415). The table below shows the calculation of the weighted-average number of ordinary shares. 2018 2017 SHARES ISSUED ON JANUARY 1 29,420,785 29,159,770 Effect of Treasury Shares Held on January 1 (319,678) (396,010) Effect of Share Issuance 2,208,146 0 Effect of Transfer of Treasury Stock to Members of the Management Board 0 7,759 Effect of Transfer of Treasury Stock/Shares Issued in January 278 0 Effect of Transfer of Treasury Stock/Shares Issued in February 0 0 Effect of Transfer of Treasury Stock/Shares Issued in March 0 0 Effect of Transfer of Treasury Stock/Shares Issued in April 1,863 154,250 Effect of Transfer of Treasury Stock/Shares Issued in May 4,128 3,778 Effect of Transfer of Treasury Stock/Shares Issued in June 756 1,094 Effect of Transfer of Treasury Stock/Shares Issued in July 1,874 2,038 Effect of Transfer of Treasury Stock/Shares Issued in August 17,754 2,669 Effect of Transfer of Treasury Stock/Shares Issued in September 2,818 3,976 Effect of Transfer of Treasury Stock/Shares Issued in October 76 2,566 Effect of Transfer of Treasury Stock/Shares Issued in November 85 5,549 Effect of Transfer of Treasury Stock/Shares Issued in December 63 127 WEIGHTED-AVERAGE NUMBER OF SHARES OF COMMON STOCK 31,338,948 28,947,566 In 2018 and 2017, diluted earnings per share equaled basic earnings per share. The effect of 52,930 potentially dilutive shares in 2018 (2017: 87,904 dilutive shares; 2016: 99,764 dilutive shares) resulting from stock options granted to the Management Board, the Senior Management Group and employees of the Company who are not members of the Senior Management Group, has been excluded from the diluted earnings per share because it would result in a decrease in the loss per share and is therefore not to be treated as dilutive. 5 Notes to the Assets of the Balance Sheet 5.1 CASH AND CASH EQUIVALENTS in 000’ 12/31/2018 12/31/2017 Bank Balances and Cash in Hand 45,476 76,589 Impairment (16) 0 Cash and Cash Equivalents 45,460 76,589 Restricted cash of 0.7 million mainly consisted of rent deposits (2017: 1.1 million). The presentation of the development of the expected twelve-month loss for cash and cash equivalents to be recognized under IFRS 9 can be found in Item 2.3.1* of the Notes. *CROSS-REFERENCE to page 129

Financial Statements Notes 152 5.2 F INANCIAL ASSETS AT FAIR VALUE, WITH CHANGES RECOGNIZED IN PROFIT OR LOSS AND OTHER FINANCIAL INCOME AT AMORTIZED COSTS Gross Unrealized in 000’ Maturity Cost Gains Losses Market Value DECEMBER 31, 2018 Money Market Funds daily 44,718 0 (137) 44,581 TOTAL 44,581 DECEMBER 31, 2017 Money Market Funds daily 86,644 0 (106) 86,538 TOTAL 86,538 As of January 1, 2019, realized and unrealized gains and losses on money market funds held or sold were recognized in the finance result in profit or loss in accordance with IFRS 9. The sale of financial assets in 2018 resulted in net losses of less than 0.1 million. In 2017, in accordance with IAS 39, the Group recognized a net gain of less than 0.1 million in profit or loss resulting from the sale of financial assets previously recognized in equity (2016: net gain of 0.3 million). in 000’ Maturity Cost Unrealized Interest Gain Impairment Carrying amount DECEMBER 31, 2018 Term Deposits, Current Portion 4 12 Months 219,720 2 (744) 218,978 Commercial Papers 4 12 Months 50,000 0 (55) 49,945 More than Term Deposits, Net of Current Portion 12 Months 96,090 12 (353) 95,749 TOTAL 364,672 DECEMBER 31, 2017 Term Deposits, Current Portion 4 12 Months 149,000 59 0 149,059 TOTAL 149,059 In 2018, current and non-current financial assets were categorized as “at amortized cost” in accordance with IFRS 9 “Financial Instruments”, and in 2017 as “loans and receivables” in accordance with IAS 39 “Financial Instruments”. These assets mainly consisted of term deposits with fixed or variable interest rates as well as corporate bonds without interest, in which the nominal value invested is credited at their maturity. The increase in financial assets resulted mainly from the capital increases executed in April 2018 in connection with the IPO on the Nasdaq. Interest income from financial assets “at amortized cost” in 2018 amounted to 0.1 million in 2018 (2017: 0.2 million from financial assets “loans and receivables”; 2016: 0.9 million from financial assets “loans and receivables”) and were recorded in the finance result. The risk associated with these financial instruments primarily resulted from bank credit risks. The presentation of the development of the expected twelve-month loss and the lifetime expected credit loss for term deposits and commercial papers, which must be recognized under IFRS 9 can be found in Item 2.3.1* of the Notes. *CROSS-REFERENCE to page 129 Further information on the accounting for financial assets is provided in Item 2.8.1* in the Notes. *CROSS-REFERENCE to page 140

Notes Financial Statements 153 5.3 ACCOUNTS RECEIVABLE All accounts receivable are non-interest bearing, and generally have payment terms of between 30 and 45 days. As of December 31, 2018 and December 31, 2017, accounts receivable included unbilled receivables amounting to 14.1 million and 5.3 million, respectively. Un-billed receivables increased mainly due to unbilled amounts related to royalties and the provision of services in connection with the transfer of projects to customers. The presentation of the development of the risk provisions to be recognized in accordance with IFRS 9 in the 2018 financial year for accounts receivable using the simplified impairment model can be found in Item 2.3.1* of the Notes. *CROSS- REFERENCE to page 129 Based on the Management Board’s assessment, no net loss for allowances for doubtful receivables was recognized in profit or loss in 2017. 5.4 OTHER RECEIVABLES Other receivables as of December 31, 2018, mainly consisted of receivables from unrealized gross gains on forward rate agreements in the amount of 0.1 million (December 31, 2017: 0.3 million unrealized gross loss, included under provisions for onerous contracts. This can be found in Item 6.2* of the Notes.). The forward rate agreements were classified as financial assets at fair value through profit or loss in accordance with IFRS 9. *CROSS- REFERENCE to page 158 As of December 31, 2018 and December 31, 2017, there were no impairments recognized for other receivables. 5.5 INCOME TAX RECEIVABLES, INVENTORIES, PREPAID EXPENSES AND OTHER CURRENT ASSETS As of December 31, 2018 income tax receivables amounted to 0.2 million (December 31, 2017: 0.7 million) and consisted of receivables from capital gain taxes withheld and income taxes for prior years. Inventories amounting to 0.2 million as of December 31, 2018 (De-cember 31, 2017: 0.3 million) were stored at the Planegg location and consisted of raw materials and supplies. As in the previous year, there were no inventories recognized at fair value less selling costs as of the reporting date. As of December 31, 2018, prepaid expenses and other current assets mainly consisted of combination compounds in the amount of 5.4 million (December 31, 2017: 11.2 million), receivables towards tax authorities from input tax surplus of 2.7 million (December 31, 2017: 2.4 million), upfront fees for external laboratory services of 1.9 million (December 31, 2017: 0.6 million), upfront fees for sublicenses of 0.4 million (December 31, 2017: 0.4 million), restricted cash for rent deposits of 0.0 million (December 31, 2017: 0.4 million) and other prepayments amounting to 1.3 million (December 31, 2017: 1.1 million). An impairment of 4.5 million was recognized on combination compounds in 2018.

Financial Statements Notes 154 5.6 PROPERTY, PLANT AND EQUIPMENT in 000’ Office and Laboratory Equipment Furniture and Fixtures Total Cost JANUARY 1, 2018 17,335 2,501 19,836 Additions 1,780 41 1,821 Disposals (1,457) (1,603) (3,060) DECEMBER 31, 2018 17,658 939 18,597 Accumulated Depreciation and Impairment JANUARY 1, 2018 14,490 1,820 16,310 Depreciation Charge for the Year 1,723 89 1,812 Disposals (1,455) (1,601) (3,056) DECEMBER 31, 2018 14,758 308 15,066 Carrying Amount JANUARY 1, 2018 2,845 681 3,526 DECEMBER 31, 2018 2,900 631 3,531 Cost JANUARY 1, 2017 16,658 2,389 19,047 Additions 1,205 112 1,317 Disposals (528) 0 (528) DECEMBER 31, 2017 17,335 2,501 19,836 Accumulated Depreciation and Impairment JANUARY 1, 2017 13,120 1,738 14,858 Depreciation Charge for the Year 1,887 82 1,969 Impairment 0 0 0 Disposals (517) 0 (517) DECEMBER 31, 2017 14,490 1,820 16,310 Carrying Amount JANUARY 1, 2017 3,538 651 4,189 DECEMBER 31, 2017 2,845 681 3,526 No impairment losses on property, plant and equipment were recognized in the 2018, 2017 and 2016 financial years. No borrowing costs were capitalized during the reporting period, and there were neither restrictions on retention of title nor property, plant and equipment pledged as security for liabilities. There were no material contractual commitments for the purchase of property, plant and equipment as of the reporting date. Depreciation is included in the following line items of profit or loss. in 000’ 2018 2017 2016 Research and Development 1,398 1,672 1,518 Selling 87 0 0 General and Administrative 327 297 268 TOTAL 1,812 1,969 1,786

Notes Financial Statements 155 5.7 INTANGIBLE ASSETS in 000’ Patents License Rights In-process R&D Programs Software Goodwill Total Cost JANUARY 1, 2018 16,995 23,896 52,159 5,853 11,041 109,944 Additions 590 0 0 55 0 645 Disposals 0 0 0 (264) 0 (264) DECEMBER 31, 2018 17,585 23,896 52,159 5,644 11,041 110,325 Accumulated Amortization and Impairment JANUARY 1, 2018 12,326 20,897 0 5,198 3,676 42,097 Amortization Charge for the Year 1,320 112 0 506 0 1,938 Impairment 0 360 15,140 0 3,689 19,189 Disposals 0 0 0 (264) 0 (264) DECEMBER 31, 2018 13,646 21,369 15,140 5,440 7,365 62,960 Carrying Amount JANUARY 1, 2018 4,669 2,999 52,159 655 7,365 67,847 DECEMBER 31, 2018 3,939 2,527 37,019 204 3,676 47,365 Cost JANUARY 1, 2017 16,419 23,896 60,960 5,800 11,041 118,116 Additions 640 0 11,140 53 0 11,833 Disposals (64) 0 (19,941) 0 0 (20,005) DECEMBER 31, 2017 16,995 23,896 52,159 5,853 11,041 109,944 Accumulated Amortization and Impairment JANUARY 1, 2017 11,096 20,749 10,141 4,515 3,676 50,177 Amortization Charge for the Year 1,230 148 0 683 0 2,061 Impairment 64 0 9,800 0 0 9,864 Disposals (64) 0 (19,941) 0 0 (20,005) DECEMBER 31, 2017 12,326 20,897 0 5,198 3,676 42,097 Carrying Amount JANUARY 1, 2017 5,323 3,147 50,819 1,285 7,365 67,939 DECEMBER 31, 2017 4,669 2,999 52,159 655 7,365 67,847 Impairment losses of 0.4 million were recognized on licenses in the 2018 financial year. In the 2017 financial year, 0.1 million of impairment losses were recognized on patents and licenses. No impairment on patents and licenses was recognized in the 2016 financial year. As of December 31, 2018, in-process research and development programs were subject to an impairment test as required by IAS 36. This test indicated a need for impairment. Further details on the impairment of in-process research and development programs and goodwill can be found in Items 5.7.3* and 5.7.5* in the Notes. *CROSS- REFERENCE to page 156 The carrying amount of intangible assets pledged as security amounts to 13.1 million and relates to a government grant in the amount of 1.5 million.

Financial Statements Notes 156 Amortization is included in the following line items of profit or loss. in 000’ 2018 2017 2016 Research and Development 1,822 1,958 1,872 Research and Development (Write-off) 19,189 9,864 10,141 Selling 25 0 0 General and Administrative 91 103 106 TOTAL 21,127 11,925 12,119 5.7.1 PATENTS In the 2018 financial year, the carrying amount of patents declined by 0.8 million from 4.7 million to 3.9 million. This was the result of additions amounting to 0.6 million for patent applications, particularly for proprietary programs and technologies, which were offset by straight-line amortization of 1.3 million. 5.7.2 LICENSES In the 2018 financial year, the carrying amount of licenses declined by 0.5 million from 3.0 million to 2.5 million as a result of scheduled and unscheduled amortization. 5.7.3 IN - PROCESS R&D PROGRAMS The carrying amount of in-process R&D programs decreased in 2018 by 15.1 million to 37.0 million. This was due to impairments in a total amount of 15.1 million. These included 1.7 million in the second quarter of 2018 and 13.4 million in the fourth quarter of 2018 (see section Lanthio Group in Item 5.7.5* of these Notes). *CROSS-REFERENCE to page 156 As of December 31, 2018, this balance sheet item contained capitalized upfront payments from the in-licensing of one compound for the Proprietary Development segment as well as subsequent milestone payments for this compound that were paid at a later point in time. This line item also included one compound resulting from an acquisition (see Item 5.7.5* in the Notes). *CROSS-REFERENCE to page 156 MOR208 As an intangible asset with indefinite useful life (no foreseeable limit to the period over which this compound is expected to generate cash flows) and a carrying amount of 23.9 million, MOR208 was subject to an annual impairment test on September 30, 2018, as required by IAS 36. The recoverable amount of the MOR208 cash-generating unit was determined on the basis of value-in-use calculations, which concluded that the recoverable amount of the cash-generating unit exceeded its carrying amount. The cash flow forecasts took into account expected cash inflows from the potential commercialization of MOR208, the cash outflows for anticipated research and development, and the costs for MOR208’s commercialization. The cash flow forecasts are based on the period of patent protection for MOR208. For this reason, a planning horizon of approximately 20 years is considered appropriate for the value-in-use calculation. The values of the underlying assumptions were determined using both internal (past experience) and external sources of information (market information). Based on the updated cash flow forecast, the value-in-use was determined as follows: A beta factor of 1.2 (2017: 1.2) and WACC before taxes of 10.0% (2017: 9.4%). A detailed sensitivity analysis was performed for the discount rate. A sensitivity analysis for changes in the cash flows was not performed since the cash flows from research and development and the commercialization of the compound have already been probability-adjusted in the value-in-use calculations so as to reflect the probabilities of success in phases of clinical trials. The analysis did not reveal any need for impairment. The values ascribed to the assumptions correspond to the Management Board’s forecasts for future development and are based on internal planning scenarios as well as external sources of information. No indicators of impairment were identified at December 31, 2018. 5.7.4 SOFTWARE In the 2018 financial year, additions to this line item totaled 0.1 million. The carrying amount decreased by 0.5 million from 0.7 million in 2017 to 0.2 million in 2018. Additions were offset by amortization of 0.6 million. 5.7.5 GOODWILL The annual goodwill impairment test was performed on Septem-ber 30, 2018. SLONOMICS TECHNOLOGY As of September 30, 2018, goodwill of 3.7 million from the 2010 acquisition of Sloning BioTechnology GmbH was subject to an impairment test as required by IAS 36. The recoverable amount of the cash-generating unit Slonomics technology, which is part of the Partnered Discovery segment, was determined on the basis of value-in-use calculations. The calculation showed that the recoverable amount was higher than the carrying amount of the cash-generating unit. The cash flow forecasts took into account the payments expected under existing contracts as well as the future free cash flows from the contribution of the Slonomics technology to partnered programs and was offset by expected personnel and administrative expenses. Cash flow forecasts are based on a period of ten years because the Management Board believes that commercialization through licensing agreements, upfront payments, milestone payments, funded development services and royalties is only feasible by means of medium- to long-term contracts. For this reason, a planning horizon of ten years is considered appropriate for the value-in-use calculation. The cash flow forecasts are largely based on the assumption that the Slonomics technology is very beneficial for existing customers. The values of the underlying assumptions were determined using both internal (past experience) and external sources of information (market information). Based on the updated ten-year cash flow forecast, the value-in-use was determined as follows:

Notes Financial Statements 157 A beta factor of 1.2 (2017: 1.2), WACC before taxes of 9.6 % (2017: 10.6 %) and a perpetual growth rate of 1 % (2017: 1 %). A detailed sensitivity analysis was performed for the growth rate and the discount rate for calculating value-in-use. The sensitivity analysis took into account the change in one assumption, with the remaining assumptions remaining unchanged from the original calculation. A sensitivity analysis for changes in the cash flows has not been performed since the cash flows have already been probability-adjusted in the value-in-use calculations so as to reflect the probabilities of success in phases of clinical trials. This analysis did not reveal any need for impairment. The values ascribed to the assumptions correspond to the Management Board’s forecasts for future development and are based on internal planning scenarios as well as external sources of information. LANTHIO GROUP As a result of a regular review of the Company’s proprietary portfolio it was decided in the second quarter of 2018 to discontinue a project in the research stage of the cash-generating unit, the Lanthio Group, in the Proprietary Development operating segment. Accordingly, an impairment of 1.7 million was recorded in research and development expenses as of June 30, 2018. On September 30, 2018, goodwill of 3.7 million and the related intangible asset with indefinite useful life (no foreseeable limit to the period over which MOR208 is expected to generate cash flows) of 26.5 million from the Lanthio Group acquisition were subject to an annual impairment test. This did not result in an impairment loss as of September 30, 2018. In the fourth quarter of 2018, updated study data led to the need for further studies, and the existing development plan was adjusted accordingly. This resulted in the expectation of a delayed market entry and a delay in the occurrence of future cash flows compared to previous assumptions. The cash flow forecasts included planned cash inflows from the potential sale of compounds based on lanthipeptides expected to achieve market approval. These cash inflows were offset by expected operating expenses for compound development and clinical trials as well as sales and administrative expenses. The duration and likelihood of individual stages of the study were taken into consideration. Cash flow forecasts are based on a period of 30 years as the Management Board believes that after the successful approval of compounds, the drugs that follow can generate free cash flows within that period of time. The recoverable amount resulting from this adjusted cash flow forecast of the cash-generating unit Lanthio Group, which is part of the Proprietary Development segment, was determined on the basis of value-in-use calculations and amounted to 13.3 million, i.e., the recoverable amount of the cash-generating unit was lower than its carrying amount. This resulted in an impairment of 17.1 million, consisting of 3.7 million attributed to goodwill and 13.4 million to in-process R&D programs. After impairment, the carrying amount of in-process R&D programs amounted to 13.1 million. The values of the underlying assumptions were determined using both internal (past experience) and external sources of information (market information). On the basis of the updated cash flow forecast, the value-in-use was determined as follows: A beta factor of 1.2 (2017: 1.2) and WACC before taxes of 11.5 % (2017: 12.1 %). A detailed sensitivity analysis was performed with regard to the discount rate. A sensitivity analysis for changes in the cash flows has not been performed since the cash flows had already been probability-adjusted in the value-in-use calculations so as to reflect the probabilities of success in phases of clinical trials. This analysis did not reveal the need for any additional impairment. The values ascribed to the assumptions correspond to the Management Board’s forecasts for future development and are based on internal planning scenarios as well as external sources of information No indicators for additional impairments were identified at December 31, 2018. 5.8 INVESTMENTS AT FAIR VALUE, WITH CHANGES RECOGNIZED IN OTHER COMPREHENSIVE INCOME This line item consisted of an investment in adivo GmbH, Martinsried, amounting to 19.9 %, which was purchased by MorphoSys AG in July 2018 in the context of start-up financing. MorphoSys paid a cash contribution of 9,458 and a contribution in kind of 350,000, which consisted of the adivo brand and a license to a fully synthetic canine-based antibody library.

Financial Statements Notes 158 The change in investments in the 2018 financial year is shown below. in 000’ 01/01/2018 Additions Disposals Through Other Comprehensive Income Through Profit or Loss 12/31/2018 Shareholdings 0 359 0 (127) 0 232 As of December 31, 2018, the fair value of the investment was measured at 0.2 million. The decrease of 0.1 million was recognized directly in equity. The significant unobservable input parameters used in the measurement were corporate planning assumptions, the probability-weighted estimate of cash flows and the discount rate. From the information currently available, a material change in corporate planning is not considered likely and therefore the cash flow forecasts used are considered as a suitable basis for determining the fair value. A change in the pre-tax WACC of +/-1.0 % would cause a 0.1 million lower or 0.1 million higher amount of equity. A sensitivity analysis for changes in cash flows was not performed because the cash flows have already been probability-adjusted in the fair value calculation to reflect the probabilities of success in the various stages of development. There are no significant relationships between the significant unobservable input parameters. 5.9 PREPAID EXPENSES AND OTHER ASSETS, NET OF CURRENT PORTION This line item included the non-current portion of prepaid expenses and other assets and mainly resulted from prepaid rent for the premises in Semmelweisstraße 7 in Planegg. The Group classified certain line items in other assets as “restricted cash” that are not available for use in the Group’s operations (see Items 2.8.1* and 5.1* in the Notes). As of December 31, 2018, the Group held long-term restricted cash in the amount of 0.7 million for issued rent deposits (December 31, 2017: 0.7 million) and of 0.1 million for convertible bonds granted to employees (December 31, 2017: 0.1 million). *CROSS-REFERENCE to page 140 and page 151 The breakdown of this line item is shown in the table below. in 000’ 12/31/2018 12/31/2017 Prepaid Expenses, Net of Current Portion 2,199 2,546 Other Current Assets 783 798 TOTAL 2,982 3,344 6 Notes to Equity and Liabilities of the Balance Sheet 6.1 ACCOUNTS PAYABLE AND ACCRUALS Accounts payable and licenses payable were non-interest-bearing and, under normal circumstances, have payment terms of no more than 30 days. Accounts payable are listed in the table below. in 000’ 12/31/2018 12/31/2017 Trade Accounts Payable 7,215 4,622 Licenses Payable 184 196 Accruals 36,530 36,408 Other Liabilities 832 3,586 TOTAL 44,761 44,812 Accruals consisted mainly of accruals for external laboratory services in the amount of 26.2 million (December 31, 2017: 26.3 million), accrued personnel expenses for payments to employees and management amounting to 5.1 million (December 31, 2017: 5.0 million), provisions for outstanding invoices in the amount of 2.8 million (December 31, 2017: 2.6 million), expenses for legal advice in the amount of 1.5 million (December 31, 2017: 2.1 million), audit fees and other audit-related costs in the amount of 0.5 million (December 31, 2017: 0.2 million) and license payments in the amount of 0.1 million (December 31, 2017: 0.2 million). At the Company’s Annual General Meeting in May 2018, the Price-waterhouseCoopers GmbH Wirtschaftsprufungsgesellschaft (PwC GmbH), Munich, was appointed as the auditor. The Supervisory Board engaged the PwC GmbH to audit the financial statements. In the 2018 financial year, PwC GmbH received a total fee from MorphoSys in the amount of 1,274,165, including audit fees in the amount of 468,803, audit-relatd fees of 516,408, as well as all other fees for other services in the amount of 288,954. PwC GmbH did not provide tax services in 2018. 6.2 TAX PROVISIONS AND OTHER PROVISIONS As of December 31, 2018, the Group recorded tax provisions and other provisions of 0.4 million (2017: 1.5 million). Tax provisions mainly consisted of income tax expenses and other provisions mainly included expenses for personnel recruitment. As of December 31, 2018, tax provisions and other provisions were uncertain in their amount and are expected to be utilized in 2019.

Notes Financial Statements 159 The table below shows the development of tax provisions and current and non-current other provisions in the 2018 financial year. in 000’ 01/01/2018 Additions Utilized Released 12/31/2018 Tax Provisions 315 0 72 35 208 Other Provisions 1,209 773 1,192 606 184 TOTAL 1,524 773 1,264 641 392 6.3 CONTRACT LIABILITIES Contract liabilities related to transaction prices paid by customers, which were allocated to the performance obligations not fulfilled as of December 31, 2018. It is expected that current contract liabilities will be realized in the 2019 financial year and non-current contract liabilities mainly in the 2020 financial year. The changes in this item are set out below. in 000’ 2018 2017 OPENING BALANCE BEFORE APPLICATION OF IFRS 15 1,695 2,905 Application of IFRS 15 (1,135) 0 OPENING BALANCE AFTER APPLICATION OF IFRS 15 560 2,905 Prepayments Received in the Fiscal Year 2,386 18,386 Revenues Recognized in the Reporting Period that was included in the Contract Liability at the Beginning of the Period (306) 0 Revenues Recognized for Received Prepayments and Services Performed in the Fiscal Year (1,688) (19,596) CLOSING BALANCE 952 1,695 thereof short-term 794 1,389 thereof long-term 158 306 6.4 OTHER LIABILITIES Other liabilities exclusively consisted of the deferred amount related to the rent-free period for the building located at Semmelweisstraße 7, Planegg, as agreed in the lease contract. This item is released over the contractually agreed minimum rent period. The current portion amounting to 0.1 million of this liability was included in the item accounts payable and accruals. 6.5 STOCKHOLDERS’ EQUITY 6.5.1 COMMON STOCK As of December 31, 2018, the Company’s common stock including treasury stock amounted to 31,839,572, which represents an increase of 2,418,787 compared to 29,420,785 on December 31, 2017. Each share of common stock grants one vote. The increase in common stock resulted from the capital increases carried out in April 2018 following the IPO on the Nasdaq Global Market. The capital increases were made through American Depositary Shares (“ADS”), with each ADS representing 1/4 of a MorphoSys ordinary share. A total of 2,075,000 new shares were issued from Authorized Capital 2017-II on April 18, 2018 followed by 311,250 new shares on April 26, 2018. Common stock also increased by 32,537 as a result of the exercise of 32,537 convertible bonds that were granted to the Management Board and the Senior Management Group. The weighted-average exercise price of the convertible bonds exercised amounted to 31.88. 6.5.2 AUTHORIZED CAPITAL Compared to December 31, 2017, the number of authorized ordinary shares increased from 14,579,885 to 14,684,291. This overall change comprised a decline in the number of authorized ordinary shares as a result of the two capital increases from Authorized Capital 2017-II totaling 2,386,250 ordinary shares in April 2018 in the context of the IPO in the United States. At the Annual General Meeting on May 17, 2018, Authorized Capital 2018-I in the amount of 11,768,314 was created and the remaining Authorized Capital 2017-II in the amount of 9,277,658 was canceled. Under the terms of Authorized Capital 2018-I, the Management Board, with the Supervisory Board’s consent, was authorized to increase the Company’s share capital once or several times until April 30, 2023, (inclusive) by a total of 11,768,314 by issuing up to 11,768,314 new no-par-value bearer shares. Pursuant to the Company’s articles of association, the shareholders may authorize the Management Board to increase the share capital with the consent of the Supervisory Board within a period of five years by issuing shares for a certain total amount, which are referred to as authorized capital (genehmigtes Kapital) and are a concept under German law that enables the Company to issue shares without going through the process of obtaining another shareholders’ resolution. The aggregate nominal amount of the authorized capital created by the shareholders may not exceed half of the share capital existing at the time of registration of the authorized capital with the commercial register. 6.5.3 CONDITIONAL CAPITAL The number of ordinary shares of conditional capital compared to De-cember 31, 2017 decreased from 6,491,683 to 6,459,146 shares due to the exercise of 32,537 conversion rights in 2018. The reduction in ordinary shares of conditional capital through the exercise of 32,537 conversion rights was entered in the commercial register in February 2019. The shareholders may resolve to amend or create conditional capital (Bedingtes Kapital). However, they may do so only to issue conversion or subscription rights to holders of convertible bonds, in preparation for a merger with another company or to issue subscription rights to employees and members of the Management Board of the Company or of an affiliated company by way of a consent or authorization resolution. According to German law, the aggregate nominal amount of the conditional capital created at the shareholders’ meeting may not exceed half of the share capital existing at the time of the shareholders’ meeting adopting such resolution. The aggregate nominal amount of the conditional capital created for the purpose of granting subscription

Financial Statements Notes 160 rights to employees and members of the management of our Company or of an affiliated company may not exceed 10 % of the share capital existing at the time of the shareholders’ meeting adopting such resolution. 6.5.4 TREASURY STOCK In the years 2018 and 2017, the Group did not repurchase any of its own shares. The composition and development of this line item is listed in the following table. Number of Shares Value As of 12/31/2010 79,896 9,774 Purchase in 2011 84,019 1,747,067 As of 12/31/2011 163,915 1,756,841 Purchase in 2012 91,500 1,837,552 As of 12/31/2012 255,415 3,594,393 Purchase in 2013 84,475 2,823,625 As of 12/31/2013 339,890 6,418,018 Purchase in 2014 111,000 7,833,944 As of 12/31/2014 450,890 14,251,962 Purchase in 2015 88,670 5,392,931 Transfer in 2015 (104,890) (3,816,947) As of 12/31/2015 434,670 15,827,946 Purchase in 2016 52,295 2,181,963 Transfer in 2016 (90,955) (3,361,697) As of 12/31/2016 396,010 14,648,212 Transfer in 2017 (76,332) (2,821,231) As of 12/31/2017 319,678 11,826,981 Transfer in 2018 (38,642) (1,428,208) As of 12/31/2018 281,036 10,398,773 As of December 31, 2018, the Company held 281,036 shares of treasury stock valued at 10,398,773, representing a decline of 1,428,208 compared to December 31, 2017 (319,678 shares; 11,826,981). The reason for this decline was the transfer of 17,219 shares of treasury stock to the Management Board and Senior Management Group from the 2014 Long-Term Incentive plan (LTI plan) in the amount of 636,414. The vesting period for this LTI program expired on April 1, 2018 and all beneficiaries had or have the option within six months to receive a total of 17,219 shares. In May 2018, the Management Board, the Senior Management Group and certain employees of the Company who are not members of the Senior Management Group received a one-time entitlement in a total fixed amount of 2.1 million. This entitlement was settled in treasury shares of the Company when the option was exercised by the benefi-ciaries. Beneficiaries were free to choose the exercise day within a vesting period expiring on December 31, 2018. Upon exercise, the fixed amount of the entitlement was divided by the XETRA closing price on the exercise date and the resulting number of treasury shares was transferred to the beneficiary. As of December 31, 2018, a total of 20,105 shares valued at 2.1 million were transferred as part of this entitlement. In addition, a total of 1,318 treasury shares in the amount of 48,713 were transferred to related parties. As a result, the number of MorphoSys shares owned by the Company as of December 31, 2018, was 281,036 (December 31, 2017: 319,678). The repurchased shares may be used for all purposes named in the authorization of the Annual General Meeting on May 23, 2014 and particularly for any existing or future employee participation schemes and/or to finance acquisitions. The shares may also be redeemed. 6.5.5 ADDITIONAL PAID - IN CAPITAL On December 31, 2018, additional paid-in capital amounted to 619,908,453 (December 31, 2017: 438,557,857). The total increase of 181,350,597 resulted mainly from two capital increases in April 2018 with total proceeds of 176,189,256. The allocation of personnel expenses resulting from share-based payments amounted to 5,584,969, and the exercise of convertible bonds totaled an amount of 1,004,580. There was an offsetting effect from the decline in the reclassification of treasury shares in the context of the allocation of shares under the 2014 performance-based share plan in the amount of 636,414 and the allocation of treasury shares to related persons in the amount of 763,076. 6.5.6 REVALUATION RESERVE On December 31, 2018, the revaluation reserve amounted to 0 (December 31, 2017: -105,483). The change by 105,483 resulted from the adoption of the new IFRS 9 standard for financial instruments. Hence, since January 1, 2018, the reporting of this equity position is no longer required. 6.5.7 OTHER COMPREHENSIVE INCOME RESERVE The other comprehensive income reserve is being reported for the first time as of January 1, 2018. On December 31, 2018, this reserve contained changes in the fair value of equity instruments through other comprehensive income in the amount of 127,458, and currency losses from consolidation of 83,432. The currency losses from consolidation include exchange differences from the revaluation of foreign currency financial statements of Group companies and differences between the exchange rates used in the balance sheet and profit or loss. As of December 31, 2017, the Group consisted solely of companies with financial statements prepared in euros. 6.5.8 ACCUMUL ATED DEFICIT The consolidated net loss for the year of -56,172,121 is reported under accumulated deficit. The first-time adoption of IFRS 9 and IFRS 15 resulted in an adjustment of -248,000 and 1,135,014, respectively. Further details can be found in Item 2.1.2* of the Notes. The accumulated deficit being a result of the effects above therefore increased from -97,375,138 in 2017 to -152,765,728 in 2018. *CROSS-REFERENCE to page 125

Notes Financial Statements 161 7 Remuneration System for the Management Board and Employees of the Group 7.1 STOCK OPTION PLANS 7.1.1 2017 STOCK OPTION PLAN On April 1, 2017, MorphoSys established a stock option plan (SOP) for the Management Board, the Senior Management Group and selected employees of the Company who are not members of the Senior Management Group (beneficiaries). In accordance with IFRS 2, the program is considered an equity-settled share-based payment and is accounted for accordingly. The grant date was April 1, 2017 and the vesting period/performance period is four years. Each stock option grants up to two subscription rights to shares of the Company. The subscription rights vest each year by 25 % within the four-year vesting period, provided that the performance criteria specified for the respective period have been 100 % fulfilled. The number of subscription rights vested per year is calculated based on the key performance criteria of the absolute MorphoSys share price performance and the relative MorphoSys share price performance compared to the Nasdaq Biotechnology Index and the TecDAX Index. The performance criteria can be met annually up to a maximum of 200 %. If the share price development falls short of the program’s performance parameters, the target achievement for that year is 0 %. The exercise price, derived from the average market price of the Company’s shares in the XETR A closing auction on the Frankfurt Stock Exchange from the 30 trading days prior to the issue of the stock options, is 55.52. MorphoSys reserves the right to settle the exercise of stock options through newly created shares from Conditional Capital 2016-III, the issuance of treasury shares or in cash. The exercise period is three years after the end of the four-year vesting period/performance period, which is March 31, 2024. If a member of the Management Board ceases to hold an office at MorphoSys Group through termination (or the Management Board member terminates the employment contract), resignation, death, injury, disability or the attainment of retirement age (receipt of a standard retirement pension, early-retirement pension or disability pension, as long as the requirements for the disability pension entitlement are met) or under other circumstances subject to the Supervisory Board’s discretion, the Management Board member (or the member’s heirs) is entitled to a precise daily pro rata amount of subscription rights. If a member of the Management Board ceases to hold an office at MorphoSys Group for good reason as defined by Section 626 (2) of the German Civil Code (BGB), all unexercised stock options will be forfeited without any entitlement to compensation. If a change of control occurs during the four-year vesting period, the stock options will become fully vested. In this case, however, the right to exercise the stock options arises only at the end of the four-year vesting period. As of April 1, 2017, a total of 81,157 stock options had been granted to the beneficiaries, of which 40,319 had been granted to the Management Board (further details can be found in the “Stock Options” table in Note 7.4* “Related Parties”), 37,660 to the Senior Management Group and 3,178 to selected Company employees who do not belong to the Senior Management Group. The original number of stock options granted was based on 100 % target achievement. Based on the performance criteria that have been met to date, the target achievement is expected to be 125 %. For performance criteria that have not yet been met, 100 % target achievement is assumed. Under this assumption, the total number of subscription rights to be exercised, i.e., the total number of shares to be issued at the end of the four-year holding period/ performance period would currently increase to 90,949 shares. The fair value of the stock options on the grant date (April 1, 2017) was 21.41 per stock option. In the period from the grant date to Decem-ber 31, 2018, seven beneficiaries left MorphoSys, resulting in the forfeiture of 8,398 stock options. For the calculation of personnel expenses resulting from share-based payment under the 2017 Stock Option Plan, the assumption is that two beneficiaries would leave the Company during the four-year period. This assumption was updated in 2018. *CROSS- REFERENCE to page 167 In 2018, personnel expenses from stock options under the Group’s 2017 SOP amounted to 436,154 (2017: 801,330). 7.1.2 2018 STOCK OPTION PLAN On April 1, 2018, MorphoSys established a stock option plan (SOP) for the Management Board, the Senior Management Group and selected Company employees who are not members of the Senior Management Group (beneficiaries). In accordance with IFRS 2; the program is considered an equity-settled share-based payment and is accounted for accordingly. The grant date was April 1, 2018 and the vesting period/ performance period is four years. Each stock option grants up to two subscription rights to shares of the Company. The subscription rights vest each year by 25 % within the four-year vesting period, provided that the performance criteria specified for the respective period have been 100 % fulfilled. The number of subscription rights vested per year is calculated based on the key performance criteria of the absolute MorphoSys share price performance and the relative MorphoSys share price performance compared to the Nasdaq Biotechnology Index and the TecDAX Index. The program’s performance criteria can be met annually up to a maximum of 200 %. If the share price development falls short of the performance parameters, the target achievement for that year is 0 %. The exercise price, derived from the average market price of the Company’s shares in the XETR closing auction on the Frankfurt Stock Exchange from the 30 trading days prior to the issue of the stock options, is 81.04. MorphoSys reserves the right to settle the exercise of stock options through either newly created shares from Conditional Capital 2016-III or, alternatively, through the issuance of treasury shares or in cash should the exercise from Conditional Capital 2016-III not be possible. The exercise period is three years after the end of the four-year vesting period/performance period, which is March 31, 2025. If a member of the Management Board ceases to hold an office at MorphoSys Group prior to the end of the four-year vesting period/ performance period, the Management Board member (or the member’s heirs) is entitled to a precise daily pro rata amount of subscription rights.

Financial Statements Notes 162 If a member of the Management Board ceases to hold an office at MorphoSys Group for good reason as defined by Section 626 (2) of the German Civil Code (BGB), all unexercised stock options will be forfeited without any entitlement to compensation. If a cumulative absence of more than 90 days occurs during the four-year vesting period/performance period, the beneficiary is entitled to a precise daily pro rata amount of subscription rights. Absence is de-fined as either a continued period of lost work time due to illness or inactivity of a beneficiary or employment relationship without continued pay. If a change of control occurs during the four-year vesting period, the stock options will become fully vested. In this case, however, the right to exercise the stock options arises only at the end of the four-year vesting period. As of April 1, 2018, a total of 67,778 stock options had been granted to beneficiaries, of which 29,312 had been granted to the Management Board (further details can be found in the “Stock Options” table in Note 7.4* “Related Parties”), 34,276 to the Senior Management Group and 4,190 to selected Company employees who do not belong to the Senior Management Group. The stated number of stock options granted is based on 100 % target achievement. The fair value of the stock options on the grant date (April 1, 2018) was 30.43 per stock option. In the period from the grant date to December 31, 2018, two beneficiaries left MorphoSys, resulting in the forfeiture of 2,136 stock options. For the calculation of personnel expenses resulting from share-based payment under the 2018 Stock Option Plan, the assumption is that four beneficiaries would leave the Company during the four-year period. *CROSS-REFERENCE to page 167 In 2018, personnel expenses from stock options under the Group’s 2018 SOP amounted to 925,635. The fair value of the stock options from the 2018 and 2017 stock option plans was determined using a Monte Carlo simulation. The expected volatility is based on the development of the share volatility of the last four years. Furthermore, the calculation of fair value equally considered the performance criteria of the absolute and relative performance of MorphoSys shares compared to the development of the Nasdaq Bio-tech Index and the TecDAX Index. The parameters of each program are listed in the table below. April 2017 April 2018 Stock Option Stock Option Plan Plan Share Price on Grant Date in 55.07 81.05 Strike Price in 55.52 81.04 Expected Volatility of the MorphoSys share in % 37.49 35.95 Expected Volatility of the Nasdaq Biotech Index in % 25.07 25.10 Expected Volatility of the TecDAX Index in % 16.94 17.73 Performance Term of Program in Years 4.0 4.0 Dividend Yield in % n/a n/a between between Risk-free Interest Rate in % 0.03 and 0.23 0.02 and 0.15 7.2 CONVERTIBLE BONDS - 2013 PROGRAM On April 1, 2013, MorphoSys AG granted the Management Board and members of the Senior Management Group (beneficiaries) convertible bonds with a total nominal value of 225,000, divided into 449,999 no-par-value bearer bonds with equal rights from “Conditional Capital 2008-III”. The beneficiaries have the right to convert the bonds into Company shares. Each convertible bond can be exchanged for one of the Company’s no-par-value bearer shares equal to the proportional amount of common stock, which currently stands at 1. Exercise of the convertible bonds is subject to several conditions, such as the achievement of performance targets, the expiration of vesting periods, the exercisability of the conversion rights, the existence of an employment or service contract that is not under notice and the commencement of the exercise period. The conversion price amounted to 31.88 and was derived from the Company’s share price in the XETRA closing auction of the Frankfurt Stock Exchange on the trading day preceding the issue of the convertible bonds. The exercise of the conversion rights is admissible since, on at least one trading day during the lifetime of the convertible bonds, the share price of the Company has risen to more than 120 % of the price in the XETRA closing auction of the Frankfurt Stock Exchange on the trading day preceding the issue of the convertible bonds. The following table shows the development of the convertible bond plans for Group employees in the 2018, 2017 and 2016 financial years. Weighted- Convertible average Bonds Price () OUTSTANDING ON JANUARY 1, 2016 449,999 31.88 Granted 0 0.00 Exercised 0 0.00 Forfeited (13,414) 31.88 Expired 0 0.00 OUTSTANDING ON DECEMBER 31, 2016 436,585 31.88 OUTSTANDING ON JANUARY 1, 2017 436,585 31.88 Granted 0 0.00 Exercised (261,015) 31.88 Forfeited 0 0.00 Expired 0 0.00 OUTSTANDING ON DECEMBER 31, 2017 175,570 31.88 OUTSTANDING ON JANUARY 1, 2018 175,570 31.88 Granted 0 0.00 Exercised (32,537) 31.88 Forfeited 0 0.00 Expired 0 0.00 OUTSTANDING ON DECEMBER 31, 2018 143,033 31.88

Notes Financial Statements 163 From the grant date until December 31, 2018, one beneficiary left MorphoSys and, therefore, 13,414 convertible bonds were forfeited. As of December 31, 2018, the number of vested convertible bonds totaled 143,033 shares (December 31, 2017: 175,570 shares; December 31, 2016: 327,439 shares). The following overview includes the weighted-average exercise price as well as information on the contract duration of significant groups of convertible bonds as of December 31, 2018. Remaining Weighted- Weighted- Number Contractual average Exer- Number average Exer- Range of Exercise Prices Outstanding Life (in Years) cise Price () Exercisable cise Price () 25.00 - 40.00 143,033 1.25 31.88 143,033 31.88 143,033 1.25 31.88 143,033 31.88 The Group recognized personnel expenses resulting from convertible bonds on a straight-line basis in accordance with IFRS 2 and IAS 32.28. The equity component of the convertible bonds is presented separately under additional paid-in capital. The corresponding amount was recognized as personnel expenses from convertible bonds. Compensation expenses related to convertible bonds amounted to 0 in 2018, to 287.601 in 2017 and to 40.375 in 2016. 7.3 L ONG-T ERM INCEN T IVE PROGRAMS 7.3.1 2013 LONG -TERM INCENTIVE PL AN On April 1, 2013, MorphoSys established a long-term incentive plan (LTI plan) for the Management Board and the Senior Management Group (beneficiaries). The vesting period of this plan expired on April 1, 2017. According to IFRS 2, this program is considered a share-based payment program with settlement in equity instruments and is accounted for accordingly. The LTI plan is a performance-related share plan and is paid out in ordinary shares (performance shares) of MorphoSys AG if predefined key performance criteria are achieved. The key performance criteria are based on the absolute MorphoSys share price performance and the relative MorphoSys share price performance compared to the Nasdaq Biotechnology Index and the TecDAX Index. These criteria are approved annually by the Supervisory Board. The fulfillment of these criteria was set at 200 % for one year, 54 % for one year and 0 % for two years. The Supervisory Board set the “company factor” at 1.57, meaning the number of performance shares to be allocated was scaled by a factor of 1.57. This factor resulted in an adjustment of previously recognized personnel expenses of 1.0million in the 2017 financial year. Previously, personnel expenses resulting from the 2013 LTI program were recognized based on the assumption of a company factor of 1.0. Based on these terms and the company factor, a total of 61,323 performance shares of MorphoSys AG was transferred to beneficiaries until October 2, 2017 after the expiration of the four-year vesting period. The Management Board received 36,729 performance shares (for further information, please see the tables titled “Shares” and “Performance Shares” in Item 7.4* “Related Parties”), the Senior Management Group received 21,248 performance shares and former members of the Senior Management Group who have since left the Company received 3,346 performance shares. *CROSS- REFERENCE to page 167 On October 1, 2013, MorphoSys established another long-term incentive plan (LTI plan) for Senior Management Group members (beneficia-ries). The vesting period of this plan expired on October 1, 2017. The terms of this plan were identical to the plan granted as of April 1, 2013. The fulfillment of the performance criteria was set at 200 % for one year, 54.8 % for one year and 0 % for two years. The Supervisory Board set the “company factor” at 1.57, meaning the number of performance shares to be allocated was scaled by a factor of 1.57. This factor resulted in an adjustment of previously recognized personnel expenses of 0.02 million in the 2017 financial year. Previously, personnel expenses resulting from the 2013 LTI program were recognized based on the assumption of a company factor of 1.0. Based on these terms and the company factor, a total of 548 performance shares of MorphoSys AG was allocated to beneficiaries after the expiration of the four-year vesting period in December 2017. The Senior Management Group received all of the 548 performance shares. In 2018, personnel expenses from performance shares under the Group’s 2013 LTI plan amounted to 0 (2017: 1,038,639; 2016: -23,571). 7.3.2 2014 LONG -TERM INCENTIVE PLAN On April 1, 2014, MorphoSys established a Long-Term Incentive plan (LTI plan) for the Management Board and the Senior Management Group (beneficiaries). The vesting period of this plan expired on April 1, 2018. According to IFRS 2, this program is considered a share-based payment program with settlement in equity instruments and is accounted for accordingly. The LTI plan is a performance-related share plan and is paid out in ordinary shares (performance shares) of MorphoSys AG if predefined key performance criteria are achieved. The key performance criteria are based on the absolute MorphoSys share price performance and the relative MorphoSys share price performance compared to the Nasdaq Biotechnology Index and the TecDAX Index. These criteria are approved annually by the Supervisory Board. The fulfillment of these criteria was set at 200 % for one year, 54 % for one year and 0 % for two years. The Supervisory Board set the “company factor” at 1.0, meaning the number of performance shares to be allocated was scaled by a factor of 1.0. Based on these terms and the company factor, a total of 17,219 performance shares of MorphoSys AG was transferred to beneficiaries until October 10, 2018 after the expiration of the four-year vesting period. The Management Board received 6,969 performance shares (for further information, please see the tables titled “Shares” and “Performance Shares” in Item 7.4* “Related Parties”), the Senior Management Group received 8,216 performance shares and former members of the Management Board and Senior Management Group, who have since left the Company, received 2,034 performance shares.*CROSS- REFERENCE to page 167

Financial Statements Notes 164 In 2018, personnel expenses resulting from performance shares under the Group’s 2014 LTI plan amounted to 6.388 (2017: 55,759; 2016: 178.518). 7.3.3 2015 LONG-TERM INCENTIVE PLAN On April 1, 2015, MorphoSys established a Long-Term Incentive plan (LTI plan) for the Management Board and the Senior Management Group (beneficiaries). According to IFRS 2, this program is considered a share-based payment program with settlement in equity instruments and is accounted for accordingly. The LTI plan is a performance-related share plan and will be paid out in ordinary shares (performance shares) of MorphoSys AG if predefined key performance criteria are achieved. These criteria are evaluated annually by the Supervisory Board. The grant date was April 1, 2015 and the vesting/performance period is four years. If the predefined key performance criteria for the respective period are fully met, 25 % of the performance shares become vested in each year of the four-year vesting period. The number of performance shares vested per year is calculated based on key performance criteria comprising the absolute MorphoSys share price performance and the relative MorphoSys share price performance compared to the Nasdaq Biotechnology Index and the TecDAX Index. The number of performance shares vested each year will be reduced or increased to the extent that the performance criteria of the respective year have been achieved between only 50 % and 99.9 % (<100 %) or the achievement of the performance criteria has exceeded 100 % (maximum 200 %). If in one year the performance criteria are met by less than 50 %, no performance shares will become vested in that year. In any case, the maximum pay-out at the end of the four-year period is limited by a factor determined by the Group, which generally amounts to 1. However, in justified cases, the Supervisory Board may set this factor freely between 0 and 2, for example, if the level of payment is regarded as unreasonable in view of the general development of the Company. The right to receive a certain allocation of performance shares under the LTI plan, however, occurs only at the end of the four-year vesting period. At the end of the four-year waiting period, there is a six-month exercise period during which the Company can transfer the shares to the bene-ficiaries. Beneficiaries are free to choose the exercise date within this exercise period. If the number of repurchased shares is not sufficient for servicing the LTI plan, MorphoSys reserves the right to pay a certain amount of the LTI plan in cash in the amount of the performance shares at the end of the vesting period, provided the cash amount does not exceed 200 % of the fair value of the performance shares on the grant date. If a member of the Management Board ceases to hold an office at MorphoSys Group because of termination (or if the Management Board member terminates the employment contract), resignation, death, injury, disability, by reaching retirement age (receipt of a normal retirement pension, early-retirement pension or disability pension, as long as the requirements for the disability pension entitlement are met) or under other circumstances subject to the Supervisory Board’s discretion, the Management Board member (or the member’s heirs) is entitled to a precise daily pro rata amount of performance shares. If a member of the Management Board ceases to hold an office at MorphoSys Group for good reason as defined by Section 626 (2) of the German Civil Code (BGB) and/or as defined by Section 84 (3) of the German Stock Corporation Act (AktG), the beneficiary will not be entitled to performance shares. If a change of control occurs during the four-year vesting period, all performance shares will become fully vested. In this case, the right to receive a certain allocation of performance shares under the LTI plan occurs only at the end of the four-year vesting period. A total of 40,425 of these shares were allocated to beneficiaries on April 1, 2015 with 21,948 performance shares allocated to the Management Board (further details may be found in the table titled “Performance Shares” in Item 7.4* “Related parties”) and 18,477 performance shares to the Senior Management Group. The original number of performance shares allocated was based on the full achievement of the performance criteria and a company factor of 1. Based on the performance criteria that have been met to date, the overall achievement of the target is expected to be 123.5 %. For performance criteria that have not yet been met, 100 % target achievement is assumed. Under this assumption, the total number of performance shares to be allocated at the end of the four-year holding period/performance period would currently increase to 44,599 shares. The fair value of the performance shares on the grant date (April 1, 2015) was 61.40 per share. No dividends were included in the determination of the fair value of the performance shares because the Group does not intend to distribute any dividends in the foreseeable future. From the grant date until December 31, 2018, five beneficiaries left MorphoSys, and therefore 3,093 performance shares were forfeited. For the calculation of the personnel expenses from share-based payment under the 2015 LTI plan, it was initially assumed that one beneficiary would leave the Company during the four-year period. This assumption was updated in 2018. *CROSS- REFERENCE to page 167 In 2018, personnel expenses resulting from performance shares under the Group’s 2015 LTI plan amounted to 109,511 (2017: 201,608: 2016: 837.153). 7.3.4 2016 LONG -TERM INCENTIVE PL AN On April 1, 2016, MorphoSys established a Long-Term Incentive plan (LTI plan) for the Management Board and the Senior Management Group (beneficiaries). According to IFRS 2, this program is considered a share-based payment program with settlement in equity instruments and is accounted for accordingly. The LTI plan is a performance-related share plan and will be paid out in ordinary shares (performance shares) of MorphoSys AG if predefined key performance criteria are achieved. These criteria are evaluated annually by the Supervisory Board. The grant date was April 1, 2016 and the vesting/performance period is four years. If the predefined key performance criteria for the respective period are fully met, 25 % of the performance shares become vested in each year of the four-year vesting period. The number of performance shares vested per year is calculated based on key performance criteria comprising the absolute MorphoSys share price performance and the relative MorphoSys share price performance compared to the Nasdaq Biotechnology Index and the TecDAX Index. The number of performance shares vested each year will be reduced or increased to the extent that the performance criteria of the respective year have been achieved between only 50 % and 99.9 % (<100 %) or the achievement of the performance criteria has exceeded 100 % (maximum 200 %).

Notes Financial Statements 165 If in one year the performance criteria are met by less than 50 %, no performance shares will become vested in that year. In any case, the maximum pay-out at the end of the four-year period is limited by a factor determined by the Group, which generally amounts to 1. However, in justified cases, the Supervisory Board may set this factor freely between 0 and 2, for example, if the level of payment is regarded as unreasonable in view of the general development of the Company. The right to receive a certain allocation of performance shares under the LTI plan, however, occurs only at the end of the four-year vesting/ performance period. At the end of the four-year waiting period, there is a six-month exercise period during which the Company can transfer the shares to the bene-ficiaries. Beneficiaries are free to choose the exercise date within this exercise period. If the number of repurchased shares is not sufficient for servicing the LTI plan, MorphoSys reserves the right to pay a certain amount of the LTI plan in cash in the amount of the performance shares at the end of the vesting period, provided the cash amount does not exceed 200 % of the fair value of the performance shares on the grant date. If a member of the Management Board ceases to hold an office at MorphoSys Group because of termination (or if the Management Board member terminates the employment contract), resignation, death, injury, disability, by reaching retirement age (receipt of a normal retirement pension, early-retirement pension or disability pension, as long as the requirements for the disability pension entitlement are met) or under other circumstances subject to the Supervisory Board’s discretion, the Management Board member (or the member’s heirs) is entitled precise daily pro rata amount of performance shares. If a member of the Management Board ceases to hold an office at MorphoSys Group for good reason as defined by Section 626 (2) of the German Civil Code (BGB) and/or as defined by Section 84 (3) of the German Stock Corporation Act (AktG), the beneficiary will not be entitled to performance shares. If a change of control occurs during the four-year vesting period, all performance shares will become fully vested. In this case, the right to receive a certain allocation of performance shares under the LTI plan occurs only at the end of the four-year vesting period. A total of 68,143 of these shares were allocated to beneficiaries on April 1, 2016 with 35,681 performance shares allocated to the Management Board (further details may be found in the table titled “Performance Shares” in Item 7.4* “Related parties”) and 32,462 performance shares to the Senior Management Group. The original number of performance shares allocated was based on the full achievement of the performance criteria and a company factor of 1. Based on the performance criteria that have been met to date, the overall achievement of the target is expected to be 123.5 %. For performance criteria that have not yet been met, 100 % target achievement is assumed. Under this assumption, the total number of performance shares to be allocated at the end of the four-year holding period/performance period would currently increase to 68,595 shares. The fair value of the performance shares on the grant date (April 1, 2016) was 46.86 per share. No dividends were included in the determination of the fair value of the performance shares because the Group does not intend to distribute any dividends in the foreseeable future. From the grant date until December 31, 2018, eight beneficiaries left MorphoSys, and therefore 10,998 performance shares were forfeited. For the calculation of the personnel expenses from share-based payment under the 2016 LTI plan, it was initially assumed that one beneficiary would leave the Company during the four-year period. This assumption was updated in 2018. *CROSS- REFERENCE to page 167 In 2018, personnel expenses resulting from performance shares under the Group’s 2016 LTI plan amounted to 330,727 (2017: 663,624; 2016: 1.483.694). 7.3.5 2017 LONG -TERM INCENTIVE PLAN On April 1, 2017, MorphoSys established another Long-Term Incentive plan (LTI plan) for the Management Board, the Senior Management Group and selected employees of the Company who are not members of the Senior Management Group (beneficiaries). According to IFRS 2, this program is considered a share-based payment program with settlement in equity instruments and is accounted for accordingly. The LTI plan is a performance-related share plan and will be paid out in ordinary shares (performance shares) of MorphoSys AG if predefined key performance criteria are achieved. The grant date was April 1, 2017 and the vesting/performance period is four years. If the pre-defined performance criteria for the respective period are fully met, 25 % of the performance shares become vested in each year of the four-year vesting period. The number of performance shares vested per year is calculated based on key performance criteria comprising the absolute MorphoSys share price performance and the relative MorphoSys share price performance compared to the Nasdaq Biotechnology Index and the TecDAX Index. The performance criteria can be met annually up to a maximum of 300 % and up to 200 % for the entire four-year period. If the specified performance criteria are met by less than 0 % in one year, no shares will be earned for that year (entitlement). In any case, the maximum pay-out at the end of the four-year period is limited by a factor determined by the Group, which generally amounts to 1. However, in justified cases, the Supervisory Board may set this factor freely between 0 and 2, for example, if the level of payment is regarded as unreasonable in view of the general development of the Company. The right to receive a certain allocation of performance shares under the LTI plan, however, occurs only at the end of the four-year vesting/performance period. At the end of the four-year vesting period, there is a six-month exercise period during which the Company can transfer the shares to the bene-ficiaries. Beneficiaries are free to choose the exercise date within this exercise period. If the number of repurchased shares is not sufficient for servicing the LTI plan, MorphoSys reserves the right to pay a certain amount of the LTI plan in cash in the amount of the performance shares at the end of the vesting period, provided the cash amount does not exceed 200 % of the fair value of the performance shares on the grant date. If a member of the Management Board ceases to hold an office at MorphoSys Group because of termination (or if the Management Board member terminates the employment contract), resignation, death, injury, disability, by reaching retirement age (receipt of a normal retirement pension, early-retirement pension or disability pension, as long as the requirements for the disability pension entitlement are met) or under other circumstances subject to the Supervisory Board’s discretion, the Management Board member (or the member’s heirs) is entitled to performance shares determined on a precise daily pro rata basis.

Financial Statements Notes 166 If a member of the Management Board ceases to hold an office at MorphoSys Group for good reason as defined by Section 626 (2) of the German Civil Code (BGB) and/or as defined by Section 84 (3) of the German Stock Corporation Act (AktG), the beneficiary will not be entitled to performance shares. If a change of control occurs during the four-year vesting period, all performance shares will become fully vested. In this case, the right to receive a certain allocation of performance shares under the LTI plan occurs only at the end of the four-year vesting period. A total of 31,549 of these shares were allocated to beneficiaries on April 1, 2017 with 15,675 performance shares allocated to the Management Board (further details may be found in the table titled “Performance Shares” in Item 7.4* “Related parties”), 14,640 performance shares allocated to the Senior Management Group and 1,234 performance shares allocated to selected employees of the Company who are not members of the Senior Management Group. The original number of performance shares allocated was based on the full achievement of the performance criteria and a company factor of 1. Based on the performance criteria that have been met to date, the overall achievement of the target is expected to be 150 %. For performance criteria that have not yet been met, 100 % target achievement is assumed. Under this assumption, the total number of performance shares to be allocated at the end of the four-year holding period/performance period would currently increase to 43,196 shares. The fair value of the performance shares on the grant date (April 1, 2017) was 70.52 per share. From the grant date until December 31, 2018, seven beneficiaries left MorphoSys, and therefore 1,711 performance shares were forfeited. For the calculation of the personnel expenses from share-based payment under the 2017 LTI plan, the assumption is that two beneficiaries would leave the Company during the four-year period. This assumption was updated in 2018. *CROSS- REFERENCE to page 167 In 2018, personnel expenses resulting from performance shares under the Group’s 2017 LTI plan amounted to 558,446 (2017: 1,026,037) 7.3.6 2018 LONG -TERM INCENTIVE PL AN On April 1, 2018, MorphoSys established another Long-Term Incentive plan (LTI plan) for the Management Board, the Senior Management Group and selected employees of the Company who are not members of the Senior Management Group (beneficiaries). According to IFRS 2, this program is considered a share-based payment program with settlement in equity instruments and is accounted for accordingly. The LTI plan is a performance-related share plan and will be paid out in ordinary shares (performance shares) of MorphoSys AG if predefined key performance criteria are achieved. The grant date was April 1, 2018 and the vesting/performance period is four years. If the pre-defined performance criteria for the respective period are fully met, 25 % of the performance shares become vested in each year of the four-year vesting period. The number of performance shares vested per year is calculated based on key performance criteria comprising the absolute MorphoSys share price performance and the relative MorphoSys share price performance compared to the Nasdaq Biotech-nology Index and the TecDAX Index. The performance criteria can be met annually up to a maximum of 300 % and up to 200 % for the entire four-year period. If the specified performance criteria are met by less than 0 % in one year, no shares will be earned for that year (entitle- ment). In any case, the maximum pay-out at the end of the four-year period is limited by a factor determined by the Group, which generally amounts to 1. However, in justified cases, the Supervisory Board may set this factor freely between 0 and 2, for example, if the level of payment is regarded as unreasonable in view of the general development of the Company. The right to receive a certain allocation of performance shares under the LTI plan, however, occurs only at the end of the four-year vesting/performance period. At the end of the four-year vesting period, there is a six-month exercise period during which the Company can transfer the shares to the bene-ficiaries. Beneficiaries are free to choose the exercise date within this exercise period. If the number of repurchased shares is not sufficient for servicing the LTI plan, MorphoSys reserves the right to pay a certain amount of the LTI plan in cash in the amount of the performance shares at the end of the vesting period, provided the cash amount does not exceed 200 % of the fair value of the performance shares on the grant date. If a member of the Management Board ceases to hold an office at MorphoSys Group prior to the end of the four-year vesting period, the Management Board member (or the member’s heirs) is entitled to a precise daily pro rata amount of performance shares. If a member of the Management Board ceases to hold an office at MorphoSys Group for good reason as defined by Section 626 (2) of the German Civil Code (BGB), the beneficiary will not be entitled to performance shares. If a cumulative absence of more than 90 days occurs during the four-year vesting period/performance period, the beneficiary is entitled to a precise daily pro rata amount of performance shares. Absence is de-fined as either a continued period of lost work time due to illness or inactivity of a beneficiary or employment relationship without continued pay. If a change of control occurs during the four-year vesting period, all performance shares will become fully vested. In this case, the right to receive a certain allocation of performance shares under the LTI plan occurs only at the end of the four-year vesting period. A total of 20,357 of these shares were allocated to beneficiaries on April 1, 2018 with 8,804 performance shares allocated to the Management Board, 10,291 performance shares allocated to the Senior Management Group and 1,262 performance shares allocated to selected employees of the Company who are not members of the Senior Management Group. The number of performance shares allocated is based on 100 % achievement of the performance criteria and a company factor of 1. The fair value of the performance shares on the grant date (April 1, 2018) was 103.58 per share. From the grant date until December 31, 2018, two beneficiaries left MorphoSys, and therefore 641 performance shares were forfeited. For the calculation of the personnel expenses from share-based payment under the 2018 LTI plan, the assumption is that four beneficiaries would leave the Company during the four- year period. In 2018, personnel expenses resulting from performance shares under the Group’s 2018 LTI plan amounted to 946,346.

Notes Financial Statements 167 The fair value of the performance shares from the Long-Term Incentive plans 2015 until 2018 has been determined using a Monte Carlo simulation. The expected volatility is based on the development of the share volatility of the last four years. Furthermore, the calculation of fair value equally considered the performance criteria of the absolute and relative performance of MorphoSys shares compared to the development of the Nasdaq Biotech Index and the TecDAX Index. The parameters of each program are listed in the table below. April 2015 Long- April 2016 Long- April 2017 Long- April 2018 Long-Term Incentive Term Incentive Term Incentive Term Incentive Program Program Program Program Share Price on Grant Date in 57.18 43.28 55.07 81.05 Strike Price in n/a n/a n/a n/a Expected Volatility of the MorphoSys share in % 33.09 34.637 37.49 35.95 Expected Volatility of the Nasdaq Biotech Index in % 20.70 23.39 25.07 25.10 Expected Volatility of the TecDAX Index in % 20.10 17.01 16.94 17.73 Performance Term of Program in Years 4.0 4.0 4.0 4.0 Dividend Yield in % n/a n/a n/a n/a between between Risk-free Interest Rate in % 0.07 0.05 0.03 und 0.23 0.02 und 0.15 7.3.7 INITIAL EQUITY GRANT On September 10, 2018, MorphoSys established an initial equity grant for one employee of MorphoSys US Inc. According to IFRS 2, this program is considered a share-based payment program with settlement in equity instruments (treasury shares of MorphoSys AG) and is accounted for accordingly. The grant date was September 25, 2018 and the total vesting/performance period is one year with the shares vesting on a monthly basis, provided that the beneficiary is still with the company as of the respective vesting date. A portion of the shares is transferred to the beneficiary as soon as a monthly vesting period has ended. The total number of shares granted was calculated by dividing the overall grant value of US$ 370,000 by the average closing price of MorphoSys shares as quoted in Xetra on the Frankfurt Stock Exchange on the 30 trading days prior to the start date of the grant ( 102.95). As a result, the grant comprised a maximum of 3,104 shares. The fair value as of the grant date amounted to 91.90 per share. 7.4 RELATED PARTIES Related parties that can be influenced by the Group or can have a significant influence on the Group can be divided into subsidiaries, members of the Supervisory Board, members of management in key positions and other related entities. The Group engages in business relationships with members of the Management Board and Supervisory Board as related parties responsible for the planning, management and monitoring of the Group. In addition to cash compensation, the Group has granted the Management Board convertible bonds and performance shares. The tables below show the shares, stock options, convertible bonds and performance shares held by the members of the Management Board and Supervisory Board, as well as the changes in their ownership during the 2018 financial year.

Financial Statements Notes 168 SHARES 01/01/2018 Additions Sales 12/31/2018 MANAGEMENT BOARD Dr. Simon Moroney 483,709 8,928 8,928 483,709 Jens Holstein 11,000 36,554 30,537 17,017 Dr. Malte Peters 9,505 3,313 0 12,818 Dr. Markus Enzelberger 7,262 3,248 8,834 1,676 TOTAL 511,476 52,043 48,299 515,220 SUPERVISORY BOARD Dr. Marc Cluzel 500 0 0 500 Dr. Frank Morich 1,000 0 0 1,000 Krisja Vermeylen 350 0 0 350 Wendy Johnson 500 0 0 500 Dr. George Golumbeski1 - 0 0 0 Michael Brosnan1 - 0 0 0 Dr. Gerald Möller2 11,000 900 0 -Klaus Kühn2 0 0 0 - TOTAL 13,350 900 0 2,350 S TOCK OPTIONS 01/01/2018 Additions Forfeitures3 Exercises 12/31/2018 MANAGEMENT BOARD Dr. Simon Moroney 12,511 9,884 0 0 22,395 Jens Holstein 8,197 6,476 0 0 14,673 Dr. Malte Peters 8,197 6,476 0 0 14,673 Dr. Markus Enzelberger 5,266 6,476 0 0 11,742 TOTAL 34,171 29,312 0 0 63,483 CONVERTIBLE BONDS 01/01/2018 Additions Forfeitures3 Exercises 12/31/2018 MANAGEMENT BOARD Dr. Simon Moroney 88,386 0 0 0 88,386 Jens Holstein 60,537 0 0 30,537 30,000 Dr. Malte Peters 0 0 0 0 0 Dr. Markus Enzelberger 0 0 0 0 0 TOTAL 148,923 0 0 30,537 118,386 PERFORMANCE SHARES 01/01/2018 Additions Forfeitures3 Allocations4 12/31/2018 MANAGEMENT BOARD Dr. Simon Moroney 30,060 2,969 2,182 3,797 27,050 Jens Holstein 20,086 1,945 1,495 2,600 17,936 Dr. Malte Peters 3,187 1,945 0 0 5,132 Dr. Markus Enzelberger 5,987 1,945 329 572 7,031 TOTAL 59,320 8,804 4,006 6,969 57,149 1 Dr. George Golumbeski and Michael Brosnan have joined the Supervisory Board of MorphoSys AG on May 17, 2018. 2 Dr. Gerald Möller and Klaus Kühn have left the Supervisory Board of MorphoSys AG on May 17, 2018. Changes in the number of shares after resignation from the Supervisory Board of MorphoSys AG are not presented in the tables. 3 Forfeited performance Shares are a result of the KPI achievement rate of 63.5 % and a company factor of 1.0 as determined at the end of the performance period of the LTI plan 2014. 4 Allocations are made as soon as performance shares are transferred within the six-month exercise period after the end of the four-year waiting period.

Notes Financial Statements 169 In May 2018, the Management Board was granted a one-time entitlement to treasury shares of the Company with a fixed total amount of 1.5 million, which could be exercised by December 31, 2018. Further details can be found in Item 6.5.4* of the Notes. Dr. Moroney exercised 5,131 shares with a value of 483,597 from this program, Mr. Holstein exercised 3,417 shares with a value of 358,785, Dr. Peters exercised 3,313 shares with a value of 354,822 and Dr. Enzelberger exercised 2,676 shares valued at 285,600. *CROSS- REFERENCE to page 160 The Supervisory Board of MorphoSys AG does not hold any stock options, convertible bonds or performance shares. The remuneration system for the Management Board is intended to encourage sustainable, results-oriented corporate governance. The Management Board’s total remuneration consists of several components, including fixed compensation, an annual cash bonus that is dependent upon the achievement of corporate targets (short-term incentives - STI), variable compensation components with long-term incentives (LTI) and other remuneration components. Variable remuneration components with long-term incentive consist of Long-Term Incentive plans (LTI plan) from previous years and the current year, a convertible bond program from 2013 and stock option plans from the prior and current years. The members of the Management Board additionally receive fringe benefits in the form of benefits in kind, essentially consisting of a company car and insurance premiums. All total remuneration packages are reviewed annually by the Remuneration and Nomination Committee and compared to an annual Management Board remuneration analysis to check the scope and appropriateness of the remuneration packages. The amount of remuneration paid to members of the Management Board is based largely on the duties of the respective Management Board member, the financial situation and the performance and business outlook for the Company versus its competition. All resolutions on adjustments to the overall remuneration packages are passed by the plenum of the Supervisory Board. The remuneration of the Management Board and the pension contract were last adjusted in July 2018. If a Management Board member’s employment contract terminates due to death, the member’s spouse or life partner is entitled to the fixed monthly salary for the month of death and the 12 months thereafter. In the event of a change of control, Management Board members are entitled to exercise their extraordinary right to terminate their employment contracts and receive any outstanding fixed salary and the annual bonus for the remainder of the agreed contract period, but at least 200 % of the annual gross fixed salary and the annual bonus. Moreover, in such a case, all stock options and performance shares granted will become vested immediately and can be exercised after the expiration of the statutory vesting periods. A change of control has occurred when (i) MorphoSys transfers assets or a substantial portion of its assets to unaffiliated third parties, (ii) MorphoSys merges with an unaf-filiated company, (iii) an agreement pursuant to § 291 AktG is entered into with MorphoSys as a dependent company or MorphoSys is incorporated pursuant to § 319 AktG or (iv) a shareholder or third party holds 30 % or more of MorphoSys’s voting rights. While in the management report the remuneration of the Management Board and Supervisory Boards as members in key management positions is presented in accordance with the provisions of the German Corporate Governance Code, the following tables show the expense- based view in accordance with IAS 24.

Financial Statements Notes 170 MANAGEMENT BOARD REMUNERATION FOR THE YEARS 2018 AND 2017 ( IAS 24): Dr. Malte Peters Dr. Simon Moroney Jens Holstein Chief Development Officer Chief Executive Officer Chief Financial Officer Appointment: March 1, 2017 2017 2018 2017 2018 2017 2018 Fixed Compensation 500,876 542,074 372,652 402,235 281,500 397,800 Fringe Benefits1 35,912 32,654 42,905 46,725 568,644 30,613 One -Year Variable Compensation 368,144 455,343 273,899 337,877 206,903 334,152 Total Short-Term Employee Benefits (IAS 24.17 (a)) 904,932 1,030,071 689,456 786,837 1,057,047 762,565 Service Cost 149,567 158,788 99,949 111,233 60,967 76,190 Total Benefit Expenses - Post- Employment Benefits (IAS 24.17 (b)) 149,567 158,788 99,949 111,233 60,967 76,190 One-Time Bonus in Shares 0 483,616 0 358,857 - 354,900 Multi-Year Variable Compensation2: 2013 Convertible Bonds Program (Vesting Period 4 Years) 58,224 0 59,641 0 0 0 2013 Long-Term Incentive Program (Vesting Period 4 Years) 202,349 0 138,585 0 0 0 2014 Long-Term Incentive Program (Vesting Period 4 Years) 22,460 1,452 15,383 994 0 0 2015 Long-Term Incentive Program (Vesting Period 4 Years) 67,635 26,657 46,324 18,257 0 0 2016 Long-Term Incentive Program (Vesting Period 4 Years) 171,688 86,435 112,481 56,632 0 0 2017 Long-Term Incentive Program (Vesting Period 4 Years) 163,906 104,449 107,395 68,437 107,395 68,437 2018 Long-Term Incentive Program (Vesting Period 4 Years) 0 140,040 0 91,595 0 91,595 2017 Stock Option Plan (Vesting Period 4 Years) 127,997 81,566 83,861 53,441 83,861 53,441 2018 Stock Option Plan (Vesting Period 4 Years) 0 136,980 0 89,593 0 89,593 Total Share-Based Payment (IAS 24.17 (e)) 814,259 1,061,195 563,670 737,806 191,256 657,966 Total Compensation 1,868,758 2,250,054 1,353,075 1,635,876 1,309,270 1,496,721 1 In 2017, the fringe benefits of Dr. Malte Peters und Dr. Markus Enzelberger each included a one-time compensation in the form of MorphoSys shares as an incentive to join the Management Board of MorphoSys AG. 2 The fair value was determined pursuant to the regulations of IFRS 2 “share-based payment”. This table shows the pro-rata share of personnel expenses resulting from share-based payment for the respective financial year. Further details can be found in Sections 7.1*, 7.2*. and 7.3*. 3 The figures presented for 2017 for Dr. Markus Enzelberger do not include any compensation granted for his activities as a member of the Senior Management Group as they do not relate to his appointment as a member of the Management Board. 4 Dr. Marlies Sproll left the Management Board of MorphoSys AG on October 31, 2017. Since November 1, 2017, Dr. Marlies Sproll has taken on a new part-time role at MorphoSys as Special Adviser to the CEO. Therefore, the figures presented for Dr. Marlies Sproll do not include any remuneration granted for these activities. *CROSS- REFERENCE to page 161-163

Notes Financial Statements 171 Dr. Markus Enzelberger3 Dr. Marlies Sproll 4 Chief Scientific Officer Chief Scientific Officer Appointment (Interim-CSO): Temporary Leave: April 15, Dr. Arndt Schottelius April 15, 2017 2017 - October 31, 2017 Chief Development Officer Appointment: November 1, 2017 Resignation: October 31, 2017 Resignation: February 28, 2017 Total 2017 2018 2017 2018 2017 2018 2017 2018 204,698 321,300 222,450 - 103,253 - 1,685,429 1,663,409 417,158 31,211 20,427 - 9,161 - 1,094,207 141,203 121,688 269,892 67,745 - 23,490 - 1,061,869 1,397,264 743,544 622,403 310,622 - 135,904 - 3,841,505 3,201,876 29,186 68,515 77,976 - 28,245 - 445,890 414,726 29,186 68,515 77,976 - 28,245 - 445,890 414,726 - 286,650 0 - 0 - 0 1,484,023 0 0 39,879 - 39,879 - 197,623 0 0 0 138,585 - 138,585 - 618,104 0 0 0 15,383 - (42,038) - 11,188 2,446 0 0 46,324 - (79,105) - 81,178 44,914 0 0 112,481 - (76,828) - 319,822 143,067 68,979 105,222 80,538 - - - 528,213 346,545 0 91,595 0 - - - 0 414,825 53,875 82,185 62,898 - - - 412,492 270,633 0 89,593 0 - - - 405,759 122,854 655,245 496,088 - (19,507) - 2,168,620 3,112,212 895,584 1,346,163 884,686 - 144,642 - 6,456,015 6,728,814

Financial Statements Notes 172 In the years 2018 and 2017, there were no other long-term benefits in accordance with IAS 24.17 (c) or benefits upon termination of employment in accordance with IAS 24.17 (d) accruing to the Management Board or Supervisory Board. In 2018, the total remuneration for the Supervisory Board, excluding reimbursed travel costs, amounted to € 525,428 (2017: € 523,015).SUPERVISORY BOARD REMUNERATION FOR THE YEARS 2018 AND 2017:Fixed Compensation Attendance Fees1 Total Compensation in € 2018 2017 2018 2017 2018 2017 Dr. Marc Cluzel 76,742 52,160 32,400 26,800 109,142 78,960 Dr. Frank Morich 61,004 57,240 23,200 23,200 84,204 80,440 Krisja Vermeylen 49,916 28,961 24,400 16,000 74,316 44,961 Wendy Johnson 46,160 46,160 37,400 38,000 83,560 84,160 Dr. George Golumbeski2 28,961 25,200 54,161 Michael Brosnan2 28,961 18,600 47,561 Dr. Gerald Moller3 36,558 95,156 11,800 36,800 48,358 131,956 Klaus Kuhn3 17,326 46,160 6,800 22,000 24,126 68,160 Karin Eastham4 19,578 14,800 34,378 TOTAL 345,628 345,415 179,800 177,600 525,428 523,015 1 The attendance fee contains expense allowances for the attendence at the Supervisory Board and the Committee meetings. 2 Dr. George Golumbeski and Michael Brosnan have joined the Supervisory Board of MorphoSys AG on May 17, 2018. 3 Dr. Gerald Moller and Klaus Kuhn have left the Supervisory Board of MorphoSys AG AG on May 17, 2018. 4 Karin Eastham has left the Supervisory Board of MorphoSys AG AG on May 17, 2017. No other agreements presently exist with current or former members of the Supervisory Board. As of December 31, 2018, the Senior Management Group held 72,604 stock options (December 31, 2017: 35,978 shares), 11,233 convertible bonds (December 31, 2017: 13,233 convertible bonds) and 83,660 performance shares (December 31, 2017: 67,149 performance shares), which had been granted by the Company. In 2018, a new stock option program and a new performance share program were issued to the Senior Management Group (see paragraphs 7.1.2* and 7.3.6*). In May 2018, the Senior Management Group was granted a one-time entitlement to treasury shares of the Company with a fixed total amount of € 0.5 million, which could be exercised by December 31, 2018. Further details can be found in Item 6.5.4* of the Notes. By December 31, 2018, 4,685 shares under this entitlement worth € 0.5 million had been transferred to the Senior Management Group. On April 1, 2018, the Senior Management Group was granted 9,360 shares under the 2014 LTI program, which had the option to receive these shares within six months. As of December 31, 2018, the option was exercised by the Senior Management Group for 9,360 shares. *CROSS-REFERENCE to page 161, page 166 and page 160 8 Additional Notes 8.1 OBLIGATIONS ARISING FROM OPERATING LEASES, RENTAL AND OTHER CONTRACTS The Group leases facilities and equipment under long-term operating leases. In financial years 2018 and 2017, leasing expenses amounted to € 3.2 million and € 2.6 million. Leasing expenses for the financial years 2018 and 2017 include expenses for company cars and machinery totaling € 0.2 million and € 0.2 million, respectively. The majority of these contracts can be renewed on a yearly or quarterly basis. Some of these agreements may be terminated prematurely. In 2016 a rental agreement was signed for the premises at SemmelweisstraBe 7, Planegg. The contract includes a minimum rental period of ten years. The future minimum payments under non-terminable operating leases, insurance contracts and other services as of December 31, 2018 are shown in the table below. in 000’€ Rent and Leasing Other Total Up to One Year 2,935 1,577 4,512 Between One and Five Years 11,091 0 11,091 More than Five Years 8,504 0 8,504 TOTAL 22,530 1,577 24,107

Notes Financial Statements 173 Additionally, the future payments shown in the table below may become due for outsourced studies after December 31, 2018. These amounts could be shifted or substantially lower due to changes in the study timeline or premature study termination. in million Total 2018 Up to One Year 51.4 Between One and Five Years 45.6 More than Five Years 0.0 TOTAL 97.0 8.2 CONTINGENT ASSETS/CONTINGENT LIABILITIES Contingent liabilities are potential obligations from past events that exist only when the occurrence of one or more uncertain future events - beyond the Company’s control - is confirmed. Current obligations can represent a contingent liability if it is not probable enough that an outflow of resources justifies the recognition of a provision. Moreover, it is not possible to make a sufficiently reliable estimate of the amount of the obligations. The Management Board is unaware of any proceedings that may result in a significant obligation for the Group and may lead to a material adverse effect on theGroup’s net assets, financial position or results of operations. If certain milestones are achieved in the Proprietary Developmentsegment, such as filing an application for an investigational new drug (IND) for specific target molecules, this may trigger milestone payments to licensors of up to an aggregate of US$ 287 million related to regulatory events and achievement of sales targets. The next milestone payment of US$ 12.5 million will presumably be due in approximately 12 to 18 months. If a partner achieves certain milestones in the Partnered Discovery segment, for example, filing an application for an investigational new drug(IND) for specific target molecules or the transfer of technology, this may trigger milestone payments to MorphoSys. However, no further details can be published since the timing, and the achievement of such milestones are uncertain. Obligations may arise from enforcing the Company’s patent rights versus third parties. It is also conceivable that competitors may challenge thepatents of MorphoSys Group or MorphoSys may also come to the conclusion that MorphoSys’s patents or patent families have been infringed upon by competitors. This could prompt MorphoSys to take legal action against competitors or lead competitors to file counterclaims against MorphoSys. Currently, there are no specific indications such obligations have arisen. 8.3 CORPORATE GOVERNANCE The Group has submitted the Declaration of Conformity with the recommendations of the Government Commission on the German Corporate Governance Code for the 2018 financial year under Section 161 of the German Stock Corporation Act (AktG). This declaration was published on the Group’s website (www.morphosys.com) on November 30, 2018 and made permanently available to the public. 8.4 RESEARCH AND DEVELOPMENT AGREEMENTS The Group has entered numerous research and development agreements as part of its proprietary research and development activities and its partnered research strategy. The following information describes the agreements that have a material effect on the Group and the developments under the research and development agreements in the 2018 financial year. 8.4.1 PROPRIETARY DEVELOPMENT SEGMENT In the Proprietary Development segment, partnerships are entered into as part of the Group’s strategy to develop its own drugs in its core areas of oncology and inflammatory diseases. Our partners include (in alphabetical order): Galapagos, GlaxoSmithKline, I-Mab Biopharma, Immatics Biotechnologies, Merck Serono, MD Anderson Cancer Center, Novartis and Xencor. In November 2008, MorphoSys and Galapagos announced a long-term drug discoveryand co-development cooperation aimed at exploring novel mechanisms for the treatment of inflammatory diseases and developing antibody therapies against these diseases. The agreement covers all activities ranging from the probing of target molecules to the completion of clinical trials for novel therapeutic antibodies. After demonstrating clinical efficacy in humans, the programs may be outlicensed to partners for further development, approval, and commercialization. Both companies contributed their core technologies and expertise to the alliance. Along with the use of its adenovirus-based platform for the exploration of new target molecules for the development of antibodies, Galapagos provided access to target molecules already identified that are associated with bone and joint diseases. MorphoSys provided access to its antibody technologies used for generating fully human antibodies directed against these target molecules. Under the terms of the agreement, Galapagos and MorphoSys will share the research and development costs. In July 2014, the collaboration advanced into the preclinical development of MOR106, an antibody from MorphoSys’ nextgeneration library Ylanthia directed against a novel Galapagos target molecule. On July 19, 2018, MorphoSys announced an exclusive global agreement between MorphoSys and Galapagos with Novartis Pharma AG for the development and commercialization of MOR106. Under the agreement, the companies will work together to significantly expand the existing development plan for MOR106. Novartis exclusively holds all rights to the product’s commercialization resulting from the agreement. With the signing of the agreement, all future research, development, manufacturing and marketing costs for MOR106 will be borne byNovartis. Included in this is the ongoing phase 2 trial “IGUANA” in patients with atopic dermatitis, as well as the phase 1 trial also initiated to evaluate the safety and efficacy of the subcutaneous administration of MOR106

Financial Statements Notes 174 in healthy volunteers and patients with atopic dermatitis. MorphoSys and Galapagos also intend to conduct further studies to support the development of MOR106 in atopic dermatitis. As part of this agreement, Novartis will explore the potential of MOR106 in other indications beyond atopic dermatitis. In addition to receiving financing from Novartis’ for the current and future development program for MOR106, MorphoSys and Galapagos also jointly received an upfront payment of 95 million. Of this amount, MorphoSys recognized its 50 % share of 47.5 million as revenue in 2018. MorphoSys and Galapagos will continue to jointly receive significant milestone payments of up to approximately US$ 1 billion (based on the current euro-dollar exchange rate at the time the agreement was signed) when specific development, regulatory, commercial and revenue milestones are met. MorphoSys and Galapagos also stand to jointly receive tiered royalties ranging up to a low 10 % to low 20 % range of net sales. According to their 2008 agreement, MorphoSys and Galapagos will share in all payments equally (50/50). In June 2013, MorphoSys announced it had entered into a global agreement with GlaxoSmithKline (GSK) for the development and commercialization of MOR103. MOR103/GSK3196165 is MorphoSys’s proprietary HuCAL antibody against the GM-CSF target molecule. Under the agreement, GSK assumes responsibility for the compound’s entire development and commercialization. MorphoSys has already received an upfront payment of 22.5 million under this agreement and, next to tiered double-digit royalties on net sales, is still eligible to receive additional payments from GSK in an amount of up to 423 million, depending on the achievement of certain developmental stages and regulatory, commercial and revenue-related milestones. GSK has clinically tested MOR103 in rheumatoid arthritis (RA) and inflammatory hand osteoarthritis in, among others, a phase 2b study in RA and a 2a study in patients with inflammatory hand osteoarthritis. The respective study data was presented in October 2018 at the annual conference of the American College of Rheumatology (ACR). At the same time, GSK also announced that it does not intend to continue to pursue further development in the indication of hand osteoarthritis. In 2017, MorphoSys announced it had signed an exclusive regional licensing agreement with I-Mab Biopharma to develop and commercialize MOR202 in China, Taiwan, Hong Kong and Macao. MOR202 is MorphoSys’s proprietary antibody targeting CD38. MOR202 was evaluated in a phase 1/2a clinical trial in Europe in patients with multiple myeloma. MorphoSys is currently evaluatingthe further development of the antibody in autoimmune diseases. Under the terms of the agreement, I-Mab Biopharma has the exclusive rights for the later development and commercialization of MOR202 in the agreed regions. MorphoSys received an upfront payment of US$ 20.0 million and is also entitled to receive additional success-based clinical and commercial milestone payments from I-Mab of up to roughly US$ 100 million. In addition, MorphoSys will also be entitled to receive double-digit, staggered royalties on net revenue of MOR202 in the agreed regions. I-Mab now plans to launch a pivotal study in early 2019. In the reporting year, MorphoSys announced the completion of an exclusive strategic development collaboration and regionallicensing agreement with I-Mab Biopharma for the MOR210 antibody. MOR210 is a preclinical antibody candidate developed by MorphoSys against C5aR with the potential for development in immuno-oncology. I-Mab has exclusive rights to develop and market MOR210 inChina, Hong Kong, Macao, Taiwan and South Korea, while MorphoSys retains the rights for the rest of the world. Under the terms of the agreement, I-Mab will exercise the exclusive rights to develop and market MOR210 in its contracted territories. With the support of MorphoSys, I-Mab will undertake and fund all global development activities, including clinical trials in China and the United States, to clinical proof of concept in cancer medicine. MorphoSys received an upfront payment of US$ 3.5 million and is further eligible to receive performance-related clinical nd sales-based milestone payments of up to US$ 101.5 million. MorphoSys recognized the upfront payment of US$ 3.5 million ( 3.1 million) as revenue in 2018. In addition, MorphoSys will receive tiered royalties in the mid-single-digit percentage range of net sales on the contracted territory of I-Mab. In return for conducting a successful clinical proof of concept trial, I-Mab is entitled to low-single-digit royalties on net sales of MOR210 outside the I-Mab territory, as well as staggered shares of proceeds from the further out-licensing of MOR210. In August 2015, MorphoSys announced a strategic alliance in the field of immuno-oncology with the German company Immatics Biotechnologies GmbH. The alliance was formed to develop novel antibody-based therapies against a variety of cancer antigens that are recognized by T cells. The alliance agreement gives MorphoSys access to several of Immatics’s proprietary tumor-associated peptides (TUMAPs). In return, Immatics receives the right to develop MorphoSys’s Ylanthia antibodies against several TUMAPs.The companies will pay each other milestone payments and royalties on commercialized products based on the companies’ development progress. In June 2014, MorphoSys and Merck KGaA announced an agreement to identify and develop therapeutic antibodies against target molecules of the class of immune checkpoints. Under this agreement, both MorphoSys and Merck Serono, the biopharmaceutical division of Merck, will co-develop therapies intended to trigger the immune system to attack tumors. MorphoSys will use its proprietary Ylanthia antibody library and other technology platforms to generate antibodies directed against the selected target molecules. Merck Serono is contributing its expertise in the field of immuno-oncology and clinical development and will assume full project responsibility starting with phase 1 of clinical development. In May 2016, MorphoSys and the University of Texas MD Anderson Cancer Center announced a long-term strategic alliance. With MorphoSys applying its Ylanthia technology platform, the partners will work together to identify, validate and develop novel anti-cancer antibodies through to clinical proof of concept by researching targets in a variety of oncology indications. MorphoSys and MD Anderson will conduct early clinical studies of therapeutic antibody candidates after which MorphoSys has the option to continue developing selected antibodies in later stages of clinical development for its own proprietary pipeline.

Notes Financial Statements 175 In June 2010, MorphoSys AG and the US-based biopharmaceutical company Xencor signed an exclusive global licensing and cooperation agreement under which MorphoSys receives exclusive global licensing rights to the XmAb5574/MOR208 antibody for the treatment of cancer and other indications. The companies jointly conducted a phase 1/2a trial in the US in patients with chronic lymphocytic leukemia. MorphoSys is solely responsible for further clinical development after the successful completion of the phase 1 clinical trial. Xencor received an upfront payment of US$ 13.0 million (approx. €10.5 million) from MorphoSys, which was capitalized under in-process R&D programs. Xencor is entitled to development, regulatory and commercially-related milestone payments as well as tiered royalties on product sales. 8.4.2 PARTNERED DISCOVERY SEGMENT Commercial partnerships in the Partnered Discovery segment provide MorphoSys with various types of payments that are spread over the duration of the agreements or recognized in full as revenue when reaching a predefined target or milestone. These payments include upfront payments upon signature, annual license fees in exchange for access to MorphoSys’s technologies and payments for funded research to be performed by MorphoSys on behalf of the partner. In addition, MorphoSys is entitled to development-related milestone payments and royalties on product sales for specific antibody programs. Prior to the 2018 financial year, active collaborations with a number of partners had already ended because the agreements had expired. However, drug development programs initiated in the active phase are designed so that they can be continued by the partner and, therefore, still result in performance-based payments for the achievement of the defined milestones. Partnerships in the Partnered Discovery segment that ended before the beginning of 2018 but where drug development programs were still being pursued, include (in alphabetical order): Astellas, Bayer AG, Boehringer Ingelheim, Daiichi-Sankyo, Fibron Ltd. (continuation of contract with Prochon Biotech Ltd.), Janssen Biotech, Merck & Co., Novartis, OncoMed Pharmaceuticals, Pfizer, Roche and Schering-Plough (a subsidiary of Merck & Co.). Partnerships that were still active in 2018 include (in alphabetical order): GeneFrontier Corporation/Kaneka, Heptares and LEO Pharma. In the year under review, MorphoSys announced that it expanded its existing strategic alliance with LEO Pharma to include peptide-based therapeutics. The goal of the partnership is to discover new, peptide-based drugs for the treatment of diseases with high unmet medical needs and that are a valuable addition to the development pipelines of both companies. The collaboration extends the two companies’ partnership to discover and develop antibody-based therapies for dermatology, which has already been in place since November 2016. Under this agreement, LEO Pharma will select therapeutic target molecules against which MorphoSys will identify target molecules using its proprietary peptide technology platform. LEO Pharma will then either choose to further develop these target molecules or use them to create other drug candidates. LEO Pharma will retain exclusive worldwide rights to the active ingredients and be responsible for the development and commercialization of the dermatology medicines that result. MorphoSys will retain an exclusive option to secure worldwide rights to all oncology medicines stemming from the collaboration. The Group’s alliance with Novartis AG for the research and development of biopharmaceuticals came to an end in November 2017. The companies’ collaboration began in 2004 and led to the creation of several ongoing therapeutic antibody programs against a number of diseases. MorphoSys receives performance-based milestones, contingent upon the successful clinical development and regulatory approval of several products. In addition to these payments, MorphoSys is also entitled to royalties on any future product sales. 8.5 SUBSEQUENT EVENTS On January 26, 2019, we announced that in our lawsuit against Janssen Biotech and Genmab A/S, the United States (U.S.) District Court of Delaware, based on a hearing held November 27, 2018, ruled in a Court Order on January 25, 2019, that the asserted claims of three MorphoSys patents with U.S. Patent Numbers 8,263,746, 9,200,061 and 9,758,590 are invalid. The Court thus granted a motion for Summary Judgement of invalidity filed by Janssen Biotech and Genmab, A/S against the three patents held by MorphoSys. As a result of this decision, the jury trial scheduled for February 2019 to consider Janssen’s and Genmab’s alleged infringement and the validity of the MorphoSys patents did not take place. On January 31, 2019 we announced that we had settled the dispute with Janssen Biotech and Genmab A/S. The parties agreed to drop the mutual claims related to the litigation: MorphoSys dismissed claims for alleged patent infringement against Janssen Biotech and Genmab A/S and agreed not to appeal from the court order dated January 25, 2019. Janssen and Genmab dismissed their counterclaims against MorphoSys. In early February 2019, we announced the appointment of David Trexler as President and Member of the Board of Directors of MorphoSys US Inc. effective February 6, 2019. Mr. Trexler will lead the further development of MorphoSys’s U.S. subsidiary with a focus on building commercial capabilities. Mr. Trexler joins MorphoSys from EMD Serono, a subsidiary of Merck KGaA, Darmstadt. AT EMD Serono, he was responsible, among other things, for establishing the first commercial organization of Merck KGaA’s oncology division in the U.S. and for the market launch of the cancer drug avelumab for the treatment of metastatic Merkel cell carcinoma. On February 19, 2019, Simon Moroney, CEO and co-founder of MorphoSys AG (informed the Company’s Supervisory Board that he has decided not to renew his contract as a member of the company’s Management Board. As a result of his decision, Dr. Moroney will step down as CEO on expiry of his current contract on June 30, 2020, or when a successor is appointed, whichever comes sooner. At the end of February 2019, our partner Janssen announced that it had received U.S. FDA approval for Tremfya® One-Press, a single-dose, patient-controlled injector for adults with moderate-to-severe plaque psoriasis. This is a device that allows patients to administer the drug subcutaneously by themselves and is thus intended to provide a higher convenience to psoriasis patients with respect to the treatment of their chronic disease.

Financial Statements Notes 176 On March 7, 2019 MorphoSys announced that during the first quarter of 2019, the Company in agreement with the FDA implemented an amendment of the B-MIND study by introducing a co-primary endpoint into the trial. The scientific rationale for the amendment is based on published literature as well as MorphoSys’s own pre-clinical data, which indicate that MOR208 might be particularly active in patients who can be characterized by the presence of a certain biomarker. Discussions with the FDA regarding the biomarker assay are currently being planned and are expected to take place in the middle of 2019. The pre-planned, event-driven interim analysis of B-MIND remains projected to take place in the second half of 2019. Depending on the outcome of the interim analysis, an increase from 330 to 450 patients may be required, in which case an event-driven primary analysis of the study is expected in the first half of 2021. 8.6 RESPONSIBILITY STATEMENT To the best of our knowledge, and in accordance with the applicable reporting principles, the consolidated financial statements give a true and fair view of the Group’s net assets, financial position and results of operations, and the group management report provides a fair review of the development and performance of the business and the position of the Group together with a description of the principal opportunities and risks associated with the Group’s expected development. Planegg, March 13, 2019 Dr.Jens Holstein Chief Financial Officer Dr. Simon Moroney Chief Executive Officer Dr. Malte Peters Chief Development Officer Dr. Markus Enzelberger Chief Scientific Officer

Independent Auditor‘s Report Additional Information177 Independent Auditor’s Report To MorphoSys AG, Planegg Report on the Audit of the Consolidated Financial Statements and of the Group Management Report AUDIT OPINIONS We have audited the consolidated financial statements of MorphoSys AG, Planegg, and its subsidiaries (the Group), which comprise the consolidated balance sheet as of December 31, 2018, and the consolidated statement of profit or loss, consolidated statement of comprehensive income, consolidated statement of changes in equity and consolidated cash flow statement for the financial year from January 1, to December 31, 2018, and notes to the consolidated financial statements including a summary of significant accounting policies . In addition, we have audited the group management report of MorphoSys AG for the financial year from January 1, to December 31, 2018. We have not audited the content of those parts of the group management report listed in the “Other Information” section of our auditor’s report in accordance with the German legal requirements. In our opinion, on the basis of the knowledge obtained in the audit, the accompanying consolidated financial statements comply, in all material respects, with the IFRSs as adopted by the EU, and the additional requirements of German commercial law pursuant to § [Article] 315e Abs. [paragraph] 1 HGB [Handelsgesetzbuch: German Commercial Code] and, in compliance with these requirements, give a true and fair view of the assets, liabilities, and financial position of the Group as at December 31, 2018, and of its financial performance for the financial year from January 1, to December 31, 2018, and the accompanying group management report as a whole provides an appropriate view of the Group’s position. In all material respects, this group management report is consistent with the consolidated financial statements, complies with German legal requirements and appropriately presents the opportunities and risks of future development. Our audit opinion on the group management report does not cover the content of those parts of the group management report listed in the “Other Information” section of our auditor’s report. Pursuant to § 322 Abs. 3 Satz [sentence] 1 HGB, we declare that our audit has not led to any reservations relating to the legal compliance of the consolidated financial statements and of the group management report. BASIS FOR THE AUDIT OPINIONS We conducted our audit of the consolidated financial statements and of the group management report in accordance with § 317 HGB and the EU Audit Regulation (No. 537/2014, referred to subsequently as “EU Audit Regulation”) and in compliance with German Generally Accepted Standards for Financial Statement Audits promulgated by the Institut der Wirtschaftsprüfer [Institute of Public Auditors in Germany] (IDW). Our responsibilities under those requirements and principles are further described in the “Auditor’s Responsibilities for the Audit of the Consolidated Financial Statements and of the Group Management Report” section of our auditor’s report. We are independent of the group entities in accordance with the requirements of European law and German commercial and professional law, and we have fulfilled our other German professional responsibilities in accordance with these requirements. In addition, in accordance with Article 10 (2) point (f) of the EU Audit Regulation, we declare that we have not provided non-audit services prohibited under Article 5 (1) of the EU Audit Regulation. We believe that the audit evidence we have obtained is sufficient and appropriate to provide a basis for our audit opinions on the consolidated financial statements and on the group management report. KEY AUDIT MATTERS IN THE AUDIT OF THE CONSOLIDATED FINANCIAL STATEMENTS Key audit matters are those matters that, in our professional judgment, were of most significance in our audit of the consolidated financial statements for the financial year from January 1 to December 31, 2018. These matters were addressed in the context of our audit of the consolidated financial statements as a whole, and in forming our audit opinion thereon; we do not provide a separate audit opinion on these matters. In our view, the matters of most significance in our audit were as follows: 1. Impairment of goodwill and intangible assets with indefinite useful lives 2. Revenue recognition related to the outlicensing of drug programm MOR106 3. Accounting for the capital raise in the financial year 2018 Our presentation of these key audit matters has been structured in each case as follows: 1) Matter and issue 2) Audit approach and findings 3) Reference to further information

Additional Information Independent Auditor s Report‘178 Hereinafter we present the key audit matters: 1. Impairment of goodwill and intangible assets with indefinite useful lives 1) In the consolidated financial statements of the Company, an amount of 3.7 million is reported under the balance sheet item Goodwill. In addition, intangible assets with” an indefinite useful life totaling 37.0 million are reported under the item Research and development programs“ under development. This balance sheet item contains” capitalized prepayments from the in-licensing of active substances and active substances from acquisitions. The assets are not yet available for use and are therefore not yet amortized. Goodwill and intangible assets with an indefinite useful life are tested for impairment by the Company once a year or on an ad hoc basis in order to determine the potential need for depreciation. The impairment test is carried out at the level of the cashgenerating units. As part of the impairment test, the book values of the respective goodwill or intangible assets with an indefinite useful life are compared with the corresponding recoverable amount. This is the higher of the value in use and the fair value less costs of disposal. The basis for measuring goodwill is regularly the present value of future cash inflows and outflows of the respective group of cash-generating units. The bases of valuation of the research and development programs under development are the present values of future cash inflows and outflows of the cash-generating unit. The cash values are determined using discounted cash flow models. The adopted cash flow forecast of the Group is the starting point, which is updated with assumptions about long-term growth rates. This also takes into account expectations about future market developments and assumptions about the development of macroeconomic factors. Discounting is done using the weighted average cost of capital. As a result of the impairment test, an impairment charge of 18.8 million was identified for the cash-generating unit Lanthio Group. The result of this valuation depends to a large extent on the assessment of future cash inflows by the legal representatives as well as the discount rate used and is therefore subject to considerable uncertainty. Against this background and due to the underlying complexity of the applied valuation models, this issue was of particular importance during our audit. 2) During our audit, we reviewed, among other things, the methodology used to carry out the impairment tests and assessed the determination of the weighted capital costs. Among other things, the appropriateness of the future cash inflows used in the valuation is matched with the current budgets from the groups cash flow forecast drawn’ up by the legal representatives and acknowledged by the Supervisory Board, as well as through coordination with general auditors and industry-specific market expectations. With the knowledge that even relatively small changes in the discount rate used can have a material effect on the amount of the recoverable amount determined in this way, we dealt in detail with the parameters used to determine the discount rate used and followed the calculation method. In addition, due to the significant importance of goodwill and capitalized research and development programs, we conducted additional sensitivity analyzes for the cashgenerating units (book value in comparison with the recoverable amount). In order to assess the unscheduled depreciation in the cash-generating unit Lanthio Group, we reviewed the planning documents and assessed the resulting triggering event for the extraordinary depreciation. Furthermore, on the basis of the findings from the planning documents, we have reconstructed the determination of the amount of unscheduled depreciation and its accrual accounting. Overall, the valuation parameters and assumptions used by the legal representatives are in line with our expectations. 3) The information provided by the Company on goodwill and intangible assets with an indefinite useful life is contained in sections 5.7.3 and 5.7.5 of the notes to the consolidated financial statements. 2. Revenue recognition related to the outlicensing of drug programm MOR106 1) The consolidated financial statements of the Company include 47.5 million in revenue from the contractual agreement signed on July 19, 2018 for the development and commercialization of the MOR106 drug program with Novartis Pharma AG. The drug program MOR106 was developed by MorphoSys in collaboration with Galapagos N.V. Novartis Pharma AG now exclusively holds all rights to market the products resulting from the collaboration. All research, development, manufacturing and marketing costs are borne by Novartis Pharma AG in the future. The revenue generated by MorphoSys in 2018 is mainly related to the transfer of rights to the MOR106 drug program. In return for this transfer, MorphoSys received a licence payment from Novartis Pharma AG. Realization of the revenue from the license fee in 2018 was timely, as control of the drug program MOR106 was transferred to Novartis Pharma AG with the transfer of the license. Revenue recognition in connection with the out-licensing of the MOR106 drug program is associated with significant risk in view of the extensive and complex contractual agreement and is also partly based on the judgment of the legal representatives. Considering this background information, this issue was of particular importance for our audit. 2) Among other things, we assessed the appropriateness and effectiveness of the Groups established internal control’ system with regard to the complete and correct recording and realization of the revenues in connection with outlicensing, taking into account the IT systems used. In addition, we have gained an understanding of the underlying contractual agreement and have assessed it with respect to the realization of the revenue in accordance with the provisions of IFRS 15. In order to assess revenue

Independent Auditors Report Additional Information‘179 recognition, we have used and awarded corresponding contract documents. We were able to satisfy ourselves that the systems and processes in place and the controls that were put in place were adequate and that the assessments and assumptions made by the legal representatives were sufficiently documented and justified to ensure the proper recording of revenues in connection with these exemptions. 3) The Companys revenue disclosures are included in sections’ 3.3 and 4.1 of the notes to the consolidated financial statements. 3. Accounting for the capital raise in the financial year 2018 1) In the consolidated financial statements of the Company, the targeted gross proceeds of 194 million ($ 239 million) from the capital increase in the 2018 financial year are reported under the item Equity. This was achieved in” connection with the IPO on the US stock exchange Nasdaq in April 2018. The transaction was made through two successive capital increases from the authorized capital, excluding existing shareholders subscription rights, at a’ price of $ 25.04 per American Depository Share. Each of these shares represents one quarter of a MorphoSys common share. In a first step, a basic offer was issued to issue 2,075,000 new ordinary shares in the form of 8.3 million American Depository Shares. Subsequently, an option was offered by the underwriting banks to acquire a further 311,250 new ordinary shares in the form of 1.2 million American Depository Shares. The net proceeds from the capital increase after deduction of bank commissions and other fees amounted to 178.6 million, of which 2.4 million resulted in an increase in share capital, a further 176.2 million less transaction costs of 15.0 million the capital reserve is discontinued. The capital increase is associated with a significant degree of risk given the complex accounting requirements, in particular to narrow the picture of direct and indirect transaction costs and the assessment of whether transaction costs are incremental, high transaction volumes and legal requirements, and is also partly based on estimates the legal representative. Considering this background information, this issue was of particular importance for our audit. 2) In our audit, we assessed the accounting treatment of the capital increase in accordance with the provisions of IAS 32 in conjunction with IFRS 9. The focus of our assessment was on the presentation of gross proceeds and the assessment of the accounting of direct and indirect costs in connection with the capital increase. First, we assessed whether the transaction costs associated with the capital increase are incremental and directly attributable to them, and whether the discretionary powers of the legal representatives were properly exercised in this allocation. Among other things, we have agreed the costs incurred with invoices and framework agreements with the underwriting banks and have subsequently carried out a recalculation of the costs. In addition, we assessed the consideration of exchange rate effects in accordance with IAS 21 and reviewed the conversion rate using external sources. In addition, we have recorded the entry in the commercial register with regard to the amount and the date of registration of the capital increase and have checked the corresponding incoming payments by means of the bank statements of the participating credit institutions. From our point of view, the disclosure of the capital increase and the associated assessments of the legal representatives are sufficiently documented and justified. 3) The Companys capital raise disclosures are included in’ sections 6.5.1, 6.5.2 and 6.5.5 of the notes to the consolidated financial statements. OTHER INFORMATION The executive directors are responsible for the other information. The other information comprises the following non-audited parts of the group management report, which we obtained prior of the date of our auditors report:’ the group statement on corporate governance pursuant to § 315d HGB included in the group management report the corporate governance report pursuant to No. 3.10 of the German Corporate Governance Code (except for the remuneration report) The annual report is expected to be made available to us after the date of the auditors report.’ Our audit opinions on the consolidated financial statements and on the group management report do not cover the other information, and consequently we do not express an audit opinion or any other form of assurance conclusion thereon. In connection with our audit, our responsibility is to read the other information and, in so doing, to consider whether the other information is materially inconsistent with the consolidated financial statements, with the group management report or our knowledge obtained in the audit, or otherwise appears to be materially misstated. RESPONSIBILITIES OF THE EXECUTIVE DIRECTORS AND THE SUPERVISORY BOARD FOR THE CONSOLIDATED FINANCIAL STATEMENTS AND THE GROUP MANAGEMENT REPORT The executive directors are responsible for the preparation of the consolidated financial statements that comply, in all material respects, with IFRSs as adopted by the EU and the additional requirements of German commercial law pursuant to § 315e Abs. 1 HGB and that the consolidated financial statements, in compliance with these requirements, give a true and fair view of the assets, liabilities, financial position, and financial performance of the Group. In addition, the executive directors are responsible for such internal control as they have determined necessary to enable the preparation of consolidated financial statements that are free from material misstatement, whether due to fraud or error.

Additional Information Independent Auditors Report‘180 In preparing the consolidated financial statements, the executive directors are responsible for assessing the Groups ability to’ continue as a going concern. They also have the responsibility for disclosing, as applicable, matters related to going concern. In addition, they are responsible for financial reporting based on the going concern basis of accounting unless there is an intention to liquidate the Group or to cease operations, or there is no realistic alternative but to do so. Furthermore, the executive directors are responsible for the preparation of the group management report that, as a whole, provides an appropriate view of the Groups position and is, in’ all material respects, consistent with the consolidated financial statements, complies with German legal requirements, and appropriately presents the opportunities and risks of future development. In addition, the executive directors are responsible for such arrangements and measures (systems) as they have considered necessary to enable the preparation of a group management report that is in accordance with the applicable German legal requirements, and to be able to provide sufficient appropriate evidence for the assertions in the group management report. The supervisory board is responsible for overseeing the Groups’ financial reporting process for the preparation of the consolidated financial statements and of the group management report. AUDITORS RESPONSIBILITIES FOR THE AUDIT OF THE’ CONSOLIDATED FINANCIAL STATEMENTS AND OF THE GROUP MANAGEMENT REPORT Our objectives are to obtain reasonable assurance about whether the consolidated financial statements as a whole are free from material misstatement, whether due to fraud or error, and whether the group management report as a whole provides an appropriate view of the Groups position and, in all material’ respects, is consistent with the consolidated financial statements and the knowledge obtained in the audit, complies with the German legal requirements and appropriately presents the opportunities and risks of future development, as well as to issue an auditors report that includes our audit opinions on the’ consolidated financial statements and on the group management report. Reasonable assurance is a high level of assurance, but is not a guarantee that an audit conducted in accordance with 317 HGB and the EU Audit Regulation and in compliance with German Generally Accepted Standards for Financial Statement Audits promulgated by the Institut der Wirtschaftsprüfer (IDW) will always detect a material misstatement. Misstatements can arise from fraud or error and are considered material if, individually or in the aggregate, they could reasonably be expected to influence the economic decisions of users taken on the basis of these consolidated financial statements and this group management report. We exercise professional judgment and maintain professional skepticism throughout the audit. We also: Identify and assess the risks of material misstatement of the consolidated financial statements and of the group management report, whether due to fraud or error, design and perform audit procedures responsive to those risks, and obtain audit evidence that is sufficient and appropriate to provide a basis for our audit opinions. The risk of not detecting a material misstatement resulting from fraud is higher than for one resulting from error, as fraud may involve collusion, forgery, intentional omissions, misrepresentations, or the override of internal control. Obtain an understanding of internal control relevant to the audit of the consolidated financial statements and of arrangements and measures (systems) relevant to the audit of the group management report in order to design audit procedures that are appropriate in the circumstances, but not for the purpose of expressing an audit opinion on the effectiveness of these systems. Evaluate the appropriateness of accounting policies used by the executive directors and the reasonableness of estimates made by the executive directors and related disclosures. Conclude on the appropriateness of the executive directors’ use of the going concern basis of accounting and, based on the audit evidence obtained, whether a material uncertainty exists related to events or conditions that may cast significant doubt on the Groups ability to continue as a going concern. If’ we conclude that a material uncertainty exists, we are required to draw attention in the auditors report to the related’ disclosures in the consolidated financial statements and in the group management report or, if such disclosures are inadequate, to modify our respective audit opinions. Our conclusions are based on the audit evidence obtained up to the date of our auditors report. However, future events or conditions’ may cause the Group to cease to be able to continue as a going concern. Evaluate the overall presentation, structure and content of the consolidated financial statements, including the disclosures, and whether the consolidated financial statements present the underlying transactions and events in a manner that the consolidated financial statements give a true and fair view of the assets, liabilities, financial position and financial performance of the Group in compliance with IFRSs as adopted by the EU and the additional requirements of German commercial law pursuant to 315e Abs. 1 HGB. Obtain sufficient appropriate audit evidence regarding the financial information of the entities or business activities within the Group to express audit opinions on the consolidated financial statements and on the group management report. We are responsible for the direction, supervision and performance of the group audit. We remain solely responsible for our audit opinions.

Independent Auditors Report Additional Information‘ Evaluate the consistency of the group management report with the consolidated financial statements, its conformity with German law, and the view of the Groups position it provides.’ Perform audit procedures on the prospective information presented by the executive directors in the group management report. On the basis of sufficient appropriate audit evidence we evaluate, in particular, the significant assumptions used by the executive directors as a basis for the prospective information, and evaluate the proper derivation of the prospective information from these assumptions. We do not express a separate audit opinion on the prospective information and on the assumptions used as a basis. There is a substantial unavoidable risk that future events will differ materially from the prospective information. We communicate with those charged with governance regarding, among other matters, the planned scope and timing of the audit and significant audit findings, including any significant deficiencies in internal control that we identify during our audit. We also provide those charged with governance with a statement that we have complied with the relevant independence requirements, and communicate with them all relationships and other matters that may reasonably be thought to bear on our independence, and where applicable, the related safeguards. From the matters communicated with those charged with governance, we determine those matters that were of most significance in the audit of the consolidated financial statements of the current period and are therefore the key audit matters. We describe these matters in our auditors report unless law or’ regulation precludes public disclosure about the matter. Other Legal and Regulatory Requirements FURTHER INFORMATION PURSUANT TO ARTICLE 10 OF THE EU AUDIT REGULATION We were elected as group auditor by the annual general meeting on May 17, 2018. We were engaged by the supervisory board on July 4, 2018. We have been the group auditor of the MorphoSys AG, Planegg, without interruption since the financial year 2011. We declare that the audit opinions expressed in this auditors’ report are consistent with the additional report to the audit committee pursuant to Article 11 of the EU Audit Regulation (long-form audit report). German Public Auditor Responsible for the Engagement The German Public Auditor responsible for the engagement is Stefano Mulas. Munich, March 13, 2019 PricewaterhouseCoopers GmbH Wirtschaftsprüfungsgesellschaft (signed Stefano Mulas) (signed Holger Lutz) Wirtschaftsprüfer Wirtschaftsprüfer (German Public Auditor) (German Public Auditor)

Additional Information Report of the Super visory Board182 COOPERATION OF THE MANAGEMENT BOARD AND SUPERVISORY BOARD During the 2018 financial year, the Supervisory Board comprehensively performed the duties assigned to it by law, the Articles of Association, Rules of Procedure and - with one exception - the recommendations of the German Corporate Governance Code (hereinafter referred to as the Code). We regularly advised” and continually oversaw the Management Board in its management of the Company and dealt extensively with the operational and strategic development of the Group. The Management Board fulfilled its duty to inform and furnish us with periodic written and verbal reports containing timely and detailed information on all business transactions and events of significant relevance to the Company. The Management Board prepared these reports in collaboration with the respective departments. In our Committee meetings and plenary sessions, we had the opportunity to discuss the Management Boards’ reports and the proposed resolutions in full. The Management Board answered our questions on strategic topics affecting the Company with a great level of detail and submitted the relevant documents in a timely manner. Any deviations from the business plan were thoroughly explained to us and we were directly involved at an early stage in all decisions relevant to the Company. An appropriate resolution was passed when the Supervisory Boards approval for individual actions was required by law, the’ Articles of Association or the Rules of Procedure. The Supervisory Board members approved all actions by the Management Board requiring Supervisory Board approval based on the documentation provided in advance by the Management Board. When necessary, the Supervisory Board received the support of the relevant committees and, together with the Management Board, discussed any projects requiring decision. All matters requiring approval were submitted for review by the Management Board to the Supervisory Board on a timely basis. Outside of the meetings of the Supervisory Board plenum and the Committees, the chairman of the Supervisory Board regularly exchanged information and ideas with the Management Board and especially the Chief Executive Officer, Dr. Simon Moroney. The Supervisory Board chairman was always kept promptly informed of the current business situation and any significant business transactions. The other Supervisory Board members also had regular contact with the individual Management Board members. SUPERVISORY BOARD MEETINGS IN THE 2018 FINANCIAL YEAR AND KEY ITEMS OF DISCUSSION A total of eight Supervisory Board meetings were held in the 2018 financial year, whereby two meetings were conducted by telephone. With the exception of one meeting, all Supervisory Board members were present at all Supervisory Board meetings. In urgent cases occurring outside of meetings, the Supervisory Board passed resolutions by written procedure. In addition to the above, a one-day strategy meeting took place between the Management Board and the Supervisory Board in July 2018 that primarily addressed the Companys strategic focus; and’ the further development of the Companys product portfolio’ and its impact on the net assets, financial position and results of operations. During the 2018 financial year, the Supervisory Board paid particular attention to the following topics and passed resolutions on these topics after a thorough review and discussion: evaluation of the Companys achievement of the 2017 financial’ year corporate targets, an interim review and minor adjustments to the corporate targets defined by the Supervisory Board at the end of 2017 for the 2018 financial year and defining the corporate targets for the 2019 financial year; commencing and executing an initial public offering in the United States of up to 8,300,000 American Depositary Shares (ADSs) pursuant to a Registration Statement on Form F-1” (Initial Public Offering) and granting the underwriters a” 30-day option to purchase up to 1,245,000 additional ADSs following the offering (Greenshoe);” increasing the share capital of the Company by issuing 2,075,000 new ordinary shares (each ADS representing 1/4 of a MorphoSys ordinary share, i.e. in total 8,300,000 ADSs) from the authorized capital 2017-II, excluding pre-emptive rights of existing shareholders, to implement the Initial Public Offering, and further increasing the share capital of the Company by issuing 311,250 additional new ordinary shares (each ADS representing 1/4 of a MorphoSys ordinary share, i.e. in total 1,245,000 ADSs) from the authorized capital 2017-II, excluding pre-emptive rights of existing shareholders, to implement the Greenshoe;

Report of the Supervisory Board Additional Information183 modification of the rules of procedure of the Supervisory Board as well as the charter of the Audit Committee and the charter of Remuneration and Nomination Committee to reflect changes required by Nasdaq and US securities law; a genda and proposed resolutions for the 2018 Annual General Meeting, particularly the nominations of Dr. George Golumbeski, Michael Brosnan and Dr. Marc Cluzel as Supervisory Board candidates for election and re-election at the 2018 Annual General Meeting; election of the chair and re-election of the deputy chair of the Supervisory Board and establishment and staffing of the Committees in the Boards constituent meeting following the’ 2018 Annual General Meeting; a ward of the audit contract to the auditor for the 2018 financial year; founding of the subsidiary MorphoSys US Inc., which focuses on establishing the Companys commercial capabilities’ in the US; conclusion of a worldwide exclusive agreement between MorphoSys and Galapagos NV as licensors and Novartis Pharma AG as licensee covering the development and commercialization of our joint program MOR106; expansion of our strategic alliance to develop peptide-derived therapeutics with LEO Pharma; conclusion of a strategic partnering agreement with I-Mab granting exclusive rights to develop and commercialize our novel immuno-oncologyagent MOR210 in China, Hong Kong, Macao, Taiwan and South Korea; budget for the 2019 financial year. We also passed a resolution in the Supervisory Board plenum on the remuneration of Management Board members for the period July 1, 2018 to June 30, 2019 taking external benchmarking into consideration. We evaluated the achievement of the 2017 corporate targets that were agreed with the Management Board and discussed the corporate targets for 2019. We commissioned an independent remuneration consultant to confirm the appropriateness of the Management Boards compensation’ and its comparison to the remuneration of various levels of employees. We discussed and adopted the key performance indicators for the long-term incentive plans for both the Management Board and the Senior Management Group. Furthermore, we approved the financial statements for the 2017 financial year and dealt with the Corporate Governance Report and the Statement on Corporate Governance. Our regular discussions in the Supervisory Boards plenary’ meetings were focused on MorphoSyss revenue and earnings’ development, the financial reports, the progress of the two business segments Partnered Discovery and Proprietary Development, the results and progress of the clinical programs for the development of proprietary drugs, the future development strategy and the development of new technologies. Furthermore, we discussed the financial outlook for the 2020/2021 financial years and MorphoSyss associated future potential financing’ needs. In addition, we carried out an efficiency review of the Supervisory Boards work. And lastly, we kept ourselves regularly’ informed with respect to the Companys cash investment’ policy, risk management, internal audit results, internal control system and compliance management system. CONFLICTS OF INTEREST WITHIN THE SUPERVISORY BOARD No conflicts of interest arose within the Supervisory Board in the 2018 financial year. ACTIVITIES AND MEETINGS OF SUPERVISORY BOARD COMMITTEES To ensure that its duties are performed efficiently, the Supervisory Board has established three committees the Audit Committee, the Remuneration and Nomination Committee and the Science and Technology Committee to prepare the issues that fall within the Supervisory Boards respective areas of responsibility’ for the Supervisory Board plenum. In each Supervisory Board meeting, the chairs of the Committees report to the Supervisory Board on the Committees work. The minutes’ of the Committee meetings are made available to all Supervisory Board members. The composition of these committees can be found in the Statement on Corporate Governance, which is” available on the Companys website under the heading Media &“ Investors Corporate Governance Statement on Corporate Governance, and in the Annual Report on pages 85 to 90.” The Audit Committee met on five occasions in the 2018 financial year, one of those meetings was held by telephone. All Committee members were present at all Audit Committee meetings. The Committee dealt mainly with accounting issues, quarterly reports, financial statements and consolidated financial statements. The Committee discussed these topics with the Management Board and recommended the approval of the financial statements to the Supervisory Board. The auditor took part in four Audit Committee meetings and informed its members of the audit results. Against the background of the Auditors Reform Act and the requirements for the external and internal rotation of the auditor, in 2017 the Audit Committee carried out a public tender for the 2018 annual audit on a voluntary basis. As a result, the Audit Committee made a recommendation to the Supervisory Board with respect to the Supervisory Boards’ proposal at the Annual General Meeting for the election of the independent auditor for the 2018 financial year. In addition, the

Additional Information Report of the Super visor y Board184 Audit Committee dealt with the annual update of a list of permitted and pre-approved non-audit services of the auditor. The Committee also discussed the risk management system, the compliance management system and the results of the internal audit conducted in the 2018 financial year, as well as specific accounting issues under International Accounting Standards (IFRS) relevant to the Company. In addition, the Committee regularly discussed the Companys asset management policy and’ the investment recommendations made by the Management Board. The Committee also discussed in depth the 2019 budget and the financial outlook for the 2020/2021 financial years, as well as options for the commercialization strategy for the Companys’ most advanced proprietary drug candidate MOR208. In addition, the Audit Committee discussed in depth IT security measures undertaken in 2018 and the companys plan to change’ the ERP landscape from Mircosoft Dynamics AX to SAP Business by Design. As in previous years, the Audit Committee discussed the proposed impairment tests in preparation for the annual audit. To increase efficiency, there is a joint Remuneration and Nomination Committee, which deliberates on matters relating to remuneration and nomination. The Committee met on five occasions in the 2018 financial year, each time by telephone. All Committee members participated at all Committee meetings. In its function as a remuneration committee, the Committee mainly dealt with the Management Boards remuneration system’ and level of compensation. In this context, the Committee also commissioned an independent remuneration expert with the task of preparing a Management Board remuneration report to verify the appropriateness of the Management Boards’ remuneration. Based on this report, the Committee prepared a recommendation on the future structure of the Management Boards compensation and submitted this to the Supervisory’ Board for approval. The Committee also dealt with the ratio of compensation between the Management Board and the Senior Management Group and the staff overall and had this ratio reviewed by the commissioned remuneration expert. This expert confirmed the appropriateness of these vertical compensation” ratios. In addition, the Committee gave careful consideration to the corporate targets as a basis for the Management Boards’ short-term variable remuneration and offered appropriate recommendations to the Supervisory Board for resolution. The Committee discussed the key performance indicators of the long-term incentive plans for the Management Board, Senior Management Group and other employees in key positions. In its function as the Nomination Committee, the Committee recommended the re-appointment of Dr. Malte Peters as Chief Development Officer for the duration of three years, effective July 1, 2019 until June 30, 2022. In addition, this Committee dealt with succession planning within the company. The Science and Technology Committee met on five occasions during the 2018 financial year. All Committee members participated in all Committee meetings. The Committee dealt mainly with the Companys discovery activities as well as overall strategy’ to expand the proprietary drug pipeline, the development of new technologies, the Companys drug development plans’ and future development strategy, progress in the clinical trials as well as required budget resources. One major focus was the approval strategy for MOR208 and the interactions with the FDA. The Committee also addressed the production of clinical trial and commercial materials for the Companys proprietary’ drug candidates including readiness for commercial supply and the competitive and patent situations of the Companys proprietary’ drug candidates. Finally, the Committee discussed the development and partnering of MOR106 as well as the further development of MOR202 in autoimmune diseases. CORPORATE GOVERNANCE The Supervisory Board devoted its attention to the further development of MorphoSyss corporate governance, taking into’ consideration the Codes amendments made by the Regierungskommission’ Deutscher Corporate Governance Kodex (Government Commission for the German Corporate Governance Code) in February 2017. The detailed Corporate Governance Report, including the Corporate Governance Statement according to Section 289f HGB and the Group Statement on Corporate Governance according to Section 315d HGB (German Commercial Code), can be found on the Companys website under the heading’ Media & Investors > Corporate Governance > Corporate“ Governance Report and in the Annual Report on pages 84” to 112. We also discussed with the Management Board the Companys’ compliance with the Codes recommendations and in one justified’ case approved an exception to the Codes recommendations.’ Based on this consultation, the Management Board and the Supervisory Board submitted the annual Declaration of Conformity on November 30, 2018. The current version of the Declaration of Conformity can be found in this Annual Report and is permanently available to MorphoSyss shareholders on’ the Companys website under the heading Media & Investors >“ Corporate Governance > Declaration of Conformity.”

Report of the Super visory Board Additional Information185 CHANGES IN THE COMPOSITION OF THE MANAGEMENT BOARD AND SUPERVISORY BOARD There were no changes in the composition of the Management Board during the reporting period. However, the Chief Executive Officer, Dr. Simon Moroney, informed the Supervisory Board on February 19, 2019 that he has decided not to renew his contract as a member of the companys’ Management Board. As a result of his decision, Dr. Moroney will step down as CEO on expiry of his current contract on June 30, 2020, or when a successor is appointed, whichever comes sooner. The following changes in the composition of the Supervisory Board took place during the reporting period. Klaus Kühn resigned from his office as a member of the Supervisory Board for personal reasons as of the conclusion of the 2018 Annual General Meeting. Dr. Marc Cluzel was re-elected and Dr. George Golumbeski and Michael Brosnan were newly elected to the Supervisory Board by the 2018 Annual General Meeting. AUDIT OF THE ANNUAL FINANCIAL STATEMENTS AND CONSOLIDATED FINANCIAL STATEMENTS For the 2018 financial year, the Company commissioned PricewaterhouseCoopers GmbH Wirtschaftsprüfungsgesellschaft, Munich (PwC) as its auditor. The audit contract was awarded” by the Supervisory Board in accordance with the resolution of the Annual General Meeting on May 17, 2018. In accordance with Item 7.2.1 of the Code, the Supervisory Board obtained a declaration of independence from the auditor in advance. The annual financial statements and the consolidated financial statements of MorphoSys AG, as well as the Management Report and Group Management Report for the 2018 financial year, were properly audited by PwC and issued with an unqualified Auditors’ Report. The key topics of the audit for the consolidated and annual financial statements for the 2018 financial year were the revenue accounting for complex out-licensing arrangements and the completeness of revenue recognition in general, the measurement of the carrying amounts of goodwill and intangible assets that have indefinite useful lives, the recognition and measurement of the 2018 share-based payment programs, the accounting for accruals for outstanding invoices for external laboratory funding and external services, the presentation and measurement of financial assets, the effectiveness of internal controls, as well as the capital increase in connection with the US Initial Public Offering on the Nasdaq (dual listing). In addition, the auditor confirmed that the Management Board had established an appropriate reporting and monitoring system that is suitable in its design and administration for the early detection of developments that could threaten the Companys’ existence. The audit reports and documents relating to the annual financial statements and consolidated financial statements were provided on a timely basis to all Supervisory Board members for review. The audit report, the consolidated financial statements, the Group Management Report of the MorphoSys Group and the audit report, the annual financial statements and the Management Report of MorphoSys AG were discussed in detail at the Audit Committee meeting on March 12, 2019, and the meeting of the Supervisory Board on March 13, 2019. The auditor attended all meetings concerning the financial statements and quarterly statements and reported on the key results of his audit. The auditor also explained the scope and focus of the audit and was available to the Audit Committee and the Supervisory Board to answer questions and provide further information. The Audit Committee discussed the audit results in detail and recommended to the Supervisory Board that it approve the financial statements prepared by the Management Board. The Supervisory Board also took note of the audit results and, in turn, reviewed the financial statements and management reports in accordance with the statutory provisions. Following its own examination, the Supervisory Board also determined that it sees no cause for objection. The annual financial statements and consolidated financial statements prepared by the Management Board and reviewed by the auditor, as well as the Management Report and Group Management Report, were subsequently approved by the Supervisory Board. Thus, the annual financial statements were adopted. RECOGNITION FOR DEDICATED SERVICE On behalf of the entire Supervisory Board, I would like to thank the members of the Management Board and the employees of MorphoSys for their achievements, their dedicated service and the inspirational work environment witnessed during this past financial year. Through their efforts, MorphoSyss portfolio has’ continued to mature and expand and important milestones have been achieved. Planegg, March 13, 2019 Dr. Marc Cluzel Chairman of the Supervisory Board

Additional Information Supervisory Board of MorphoSys AG 186 Supervisory Board of MorphoSys AG DR. MARC CLUZEL Chairman, Montpellier, France member of the supervisory board of: Griffon Pharmaceuticals Inc., Canada (Member of the Board of Directors) Moleac Pte. Ltd., Singapore (Member of the Board of Directors) DR. FRANK MORICH Deputy Chairman, Berlin, Germany member of the supervisory board of: Cue Biopharma Inc., Cambridge, MA, USA (Member of the Board of Directors) MICHAEL BROSNAN Board Member, Westford, MA, USA member of the supervisory board of: Fresenius Medical Care Holdings, Inc., USA (Member of the Board of Directors) Vifor Fresenius Medical Care Renal Pharma Ltd., Switzerland (Member of the Board of Administration) The CVs of our Supervisory Board Members can be found on the Companys website under the heading Company > Management > Supervisory Board.”

Supervisory Board of MorphoSys AG Additional Information 187 KRISJA VERMEYLEN Board Member, Hellerup, Denmark no other supervisory board memberships WENDY JOHNSON Board Member, San Diego, CA, USA member of the supervisory board of: AmpliPhi Biosciences Corp., USA (Member of the Board of Directors) DR. GEORGE GOLUMBESKI Board Member, Far Hills, NJ, USA member of the supervisory board of: Carrick Therapeutics Ltd., Ireland (Chairman of the Board of Directors) Enanta Pharmaceuticals, Inc., USA (Member of the Board of Directors) Grail Inc., USA (Member of the Board of Directors) KSQ Therapeutics, Inc., USA (Member of the Board of Directors) Sage Therapeutics, USA (Member of the Board of Directors) Shattuck Labs, Inc., USA (Member of the Board of Directors)

Additional Information Glossary 188 Glossary A AD Atopic dermatitis; Chronic autoimmune disease of the skin; formerly also called neurodermatitis ADC Antibody drug conjugate; a tumor growth inhibiting substance (cytostatic) that is coupled to an antibody to attack tumors in an even more targeted manner ADCC Antibody-dependent cell-mediated cytotoxicity; a mechanism of cell-mediated immunity whereby an effector cell of the immune system actively destroys a target cell that has been bound by specific antibodies ADCP Antibody-dependent cellular phagocytosis ALL Acute lymphoblastic leukemia; a form of cancer of the white blood cells characterized by excess lymphoblasts Amyloid beta Protein produced by the body that can be deposited in the brain and is associated with the development of Alzheimer’s disease Antibody Proteins of the immune system that recognize antigens, thereby triggering an immune response Antibody library A collection of genes that encode corresponding human antibodies Antigen Foreign substance stimulating antibody production; binding partner of antibody ASCT Autologous stem cell transplantation; Treatment with stem cells from a patients own body for the treatment of lymphomas Autoimmune disease Disease caused by an im mune response by the body against one of its own tissues, cells or molecules B B cells White blood cells, part of the immune system, capable of generation antibodies BMIND Study to evaluate Bendamustine-MOR208 IN DLBCL Biosimilars Term used to describe officially approved new versions of innovator biopharmaceutical products, following patent expiration Bispecific Antibody consisting of parts from two different antibodies, thereby being able to bind two different antigens BTD Breakthrough Therapy Designation; Status granted by the U.S. Food and Drug Administration FDA given to a drug candidate for the treatment of a serious or life-threatening disease if there is initial clinical evidence that the drug could represent a significant improvement over available therapies BTK inhibitor Bruton’s tyrosine kinase, a key kinase of the B cell receptor signaling pathway that plays a significant role in the proliferation, differentiation and survival of B cells C C5a Part of the immune system; involved in growth of certain cancers C5aR Receptor for C5a CAR-T technology New therapeutic approach in which immune cells are reprogrammed Cash flow Key performance indicator in the cash flow statement used to assess the financial and earning capacity CD19 Therapeutic target for the treatment of B cell lymphomas and leukemias CD20 Therapeutic target for the treatment of B cell lymphomas and leukemias CD38 Therapeutic target for the treatment of multiple myeloma, certain leukemias and solid tumors CI Conficence interval; statistical quantity indicating the range which, with a certain probability (the confidence level), includes the true position of the parameter when a random experiment is repeated indefinitely Clinical trial Clinical trials allow safety and efficacy data to be collected for new drugs or devices; depending on the type of product and the stage of its development, investigators enroll healthy volunteers and/or patients into small pilot studies initially, followed by larger-scale studies in patients CLL Chronic lymphocytic leukemia; most common type of cancer of the blood and bone marrow, affecting the B cells CMC Chemistry, manufacturing and controls CMO Contract manufacturing organization COSMOS CLL patients assessed for ORR / Safety in MOR208 Study CR Complete response CRO Contract research organization Crohn’s Disease Chronic inflammatory bowel disease CRP C-reactive protein; Inflammatory marker that can be measured in the blood in various diseases, including RA CTO Contract testing organization D Discounted cash flow model Method of valuing assets, especially for due diligence DLBCL Diffuse large B cell lymphoma, a subform of NHL DoR duration of response

Glossary Additional Information 189 E EASI Exczema area and severity Index; Value for measuring the severity of atopic dermatitis EGFR Epidermal growth factor receptor; cellsurface receptor for members of the epidermal growth factor family (EGF-family) of extracellular protein ligands; the epidermal growth factor receptor is a receptor tyrosine kinase EMA European Medicines Agency F Fab format The antigen binding fragment of the antibody Fc part Constant part of an antibody known as the Fc (fragment, crystallizable) region FDA Food and Drug Administration; US federal agency for the supervision of food and drugs G GCP Good clinical practice; an inter national ethical and scientific quality standard for designing, conducting, recording and reporting trials that involve the par ticipation of human subjects GLP Good laboratory practice; a formal framework for the implementation of safety tests on chemical products GM-CSF Granulocyte-macrophage colony-stimulating factor; underlying target molecule of MOR103 program GMP Good manufacturing practice; term for the control and management of manufacturing and quality control testing of pharmaceutical products and medical devices H HDCT High-Dose Chemotherapy; High-dose chemotherapy used in conjunction with ASCT to treat DLBCL HS Hidradenitis Suppurativa; a skin disease that causes inflammation of the hair follicles; also known as acne inversion HTH Helix-Turn-Helix; specific structure and folding of a peptide which confer stability HuCAL Human Combinatorial Antibody Library; pro prietary antibody library enabling rapid generation of specific human antibodies for all applications Human Of h,uman origin I IFRS International Financial Reporting Standards; accounting standards issued by the IASB and adopted by the EU IL-12 Cytokine involved in inflammatory processes IL23 Cytokine involved in inflammatory processes; target of guselkumab Immuno-oncology New class of compounds that stimulate the immune system to attack tumors IND Investigational New Drug; application for permission to test a new drug candidate on humans, i.e. in clinical studies IRR Infusion-related reactions; Response of the immune system to intravenous administration of a drug iv Intravenous infusion L Lanthipeptides Novel class of therapeutics with high target selectivity and improved drug-like properties L-MIND Study to evaluate Lanalidomide-MOR208 IN DLBCL M Market capitalization Value of a com pany’s outstanding shares, as measured by shares times current price Mesothelioma Diffusely growing tissue tumor affecting for example the pleura Monoclonal antibody Homogeneous antibody origin ating from a single clone, produced by a hybrid oma cell MRD Minimal Residual Disease; minimal amount of residual tumor cells Multiple myeloma Type of cancer that develops in a subset of white blood cells called plasma cells formed in the bone marrow; abbreviation: MM N NHL Non-Hodgkin’s lymphoma; diverse group of blood cancers that include any kind of lymphoma except Hodgkin’s lymphoma O ORR Overall response rate OS Overall survival

Additional Information Glossary 190 Glossary P Palmoplantar pustulosis Psoriasis on hands and feet PASI Psoriasis area and severity Index; value for determining the extent and severity of the psoriasis disease PFS Progression-free survival Pharmacodynamics Study of the effects of drugs on the body Pharmacokinetics Determination of the fate of substances administered externally to a living organism PoC Proof-of-Concept; clinical evidence that its active substance leads to an improvement of a disease PR Partial response Preclinic Preclinical stage of drug development; tests in animal models as well as in laboratory essays Protein Polymer consisting of amino acids, e. g. antibodies and enzymes Psoriasis A chronic, non-contagious autoimmune disease which affects the skin and joints Psoriatic arthritis (PsA) Chronic joint inflammation that occures in connection with psoriasis R r/r relapsed/refractory R-CHOP Rituximab, Cyclophosphamid, Doxorubicin, Vincristin and Prednison; Combination treatment with rituximab and combination chemotherapy as standard first-line treatment of DLBCL Rheumatoid arthritis Inflammatory disease of the joints; abbreviation: RA Royalties Percentage share of ownership of the rev enue generated by drug products S SAEs Severe adverse events sc subkutan; administration via an injection under the skin SD Stable disease; stable state of the cancer disease SD KPI Sustainable Development Key Performance Indicators; sustainability indicators in corporate management SLL Small lymphocytic lymphoma Slonomics DNA engineering and protein library gene ration platform acquired by MorphoSys in 2010 Small molecules Low molecular compounds SOP system SOP = standard operating procedure T Target Target molecule for therapeutic intervention, e.g. on the surface of diseased cells T cells An abbreviation for T-lymphocytes; a sub type of white blood cells that together with B-lympho cytes are responsible for the body’s immune defense TTP Time to progression Toxicity Poisonousness U UC Ulcerative Colitis; chronic inflammatory bowel disease; Crohn’s disease V VGPR Very good partial response Y Ylanthia The novel next-generation antibody platform of MorphoSys

List of Figures and Tables Additional Information 191 List of Figures and Tables Figures 01 Revenues of the MorphoSys Group by Segment 29 02 MorphoSys’s Product Pipeline 30 03 Active Clinical Studies with MorphoSys Antibodies 30 04 Total Headcount of the MorphoSys Group 44 05 Employees by Gender 46 06 Seniority 46 07 Workforce Turnover Rate 46 08 Revenues by Region 48 09 Revenues Proprietary Development and Partnered Discovery 48 10 Selected R&D Expenses 51 11 Performance of the MorphoSys Share in 2018 68 12 Performance of the MorphoSys Share 2014 2018 68 13 Occupational Safety at MorphoSys 72 14 Quality Management System at MorphoSys 74 15 Risk and Opportunity Management System at MorphoSys 78 16 Compliance Management System (CMS) 106 Tables 01 Development of Financial Performance Indicators 26 02 Sustainable Development Key Performance Indicators (SD KPIs) at MorphoSys 27 03 Multi-Year Overview Statement of Profit or Loss 54 04 Multi-Year Overview Financial Situation 57 05 Multi-Year Overview Balance Sheet Structure 58 06 Contractual Obligations 59 07 Comparison of Actual Business Results Versus Forecasts 60 08 Closing Prices of MorphoSys Shares and ADS 68 09 Key Data for the MorphoSys Share 69 10 Analyst Recommendations 70 11 Summary of MorphoSys’s Key Short- and Medium-Term Risks 82 12 Summary of MorphoSys’s Key Long-Term Risks 83 13 Summary of MorphoSys’s Key Opportunities 83 14 Composition of the Supervisory Board until Termination of the 2018 Annual General Meeting 86 15 Composition of the Supervisory Board since Termination of the 2018 Annual General Meeting 86 16 Participation of Supervisory Board Members 88 17 Compensation of the Management Board in 2018 and 2017 94 18 Compensation of the Supervisory Board in 2018 and 2017 101 19 Directors’ Holdings 102 20 Managers Transactions in 2018 104

Additional Information Imprint 192 Imprint MorphoSys AG Semmelweisstrasse 7 82152 Planegg Germany Phone: +49-89-89927-0 Fax: +49-89-89927-222 Email: info@morphosys.com www.morphosys.com Corporate Communications and Investor Relations Phone: +49-89-89927-404 Fax: +49-89-89927-5404 Email: investors@morphosys.com Concept and Design 3st kommunikation GmbH, Mainz Photography/Picture Credits Andreas Pohlmann, Munich Matthias Haslauer, Hamburg Getty Images Translation Klusmann Communications, Niedernhausen Lennon.de Language Services, Münster Editorial Office Götz Translations and Proofreading GmbH, Hamburg Typesetting and Lithography Knecht GmbH, Ockenheim Printer Woeste Druck + Verlag GmbH & Co. KG, Essen-Kettwig Copy Deadline March 12, 2019 (except financial statements) This financial report is also published in German and is available for download on our website. For better readability, the masculine form has been used in this report equally to all genders. HuCAL®, HuCAL GOLD®, HuCAL PLATINUM®, CysDisplay®, RapMAT®, arYla®, Ylanthia®, 100 billion high potentials®, Slonomics®, Lanthio Pharma® and LanthioPep® are registered trademarks of the MorphoSys Group. Tremfya® is a registered trademark of Janssen Biotech, Inc. Rituxan® is a registered trademark of Biogen MA Inc. MabThera® is a registered trademark of F. Hoffmann-La Roche AG. Gazyva® is a registered trademark of F. Hoffmann-La Roche AG and Genentech, Inc. Blincyto® is a registered trademark of Amgen Inc. Darzalex® is a registered trademark of Johnson & Johnson. Cosentyx® is a registered trademark of Novartis AG.

Key Figures (IFRS) MorphoSys Group (in million , if not stated
otherwise) 12/31/18 12/31/17 12/31/16 12/31/15 12/31/14 12/31/13 12/31/12 12/31/11 12/31/10 12/31/09 RESULT S1 Revenues 76.4 66.8 49.7 106.2 64.0 78.0 51.9 82.1 87.0 81.0 Cost of Sales 1.8 0.0 0.0 0.0 0.0 0.0 0.0 0.0 7.3 6.7 R&D Expenses 106.4
113.3 94.0 78.7 56.0 49.2 37.7 55.9 46.9 39.0 Selling Expenses2 6.4 4.8 2.4 0 0 0 0 0 0 0 G&A Expenses 21.9 15.7 13.4 15.1 14.1 18.8 12.1 14.9 23.2 23.9 Personnel Expenses (Excluding Stock-Based Compensation) 39.2 37.1 33.7 32.4 26.7 27.4 24.1
27.7 29.6 26.1 Capital Expenditure 2.5 13.1 2.9 8.8 20.5 5.6 1.8 2.9 13.8 3.8 Depreciation of Tangible Assets 1.8 2.0 1.8 1.5 1.4 1.5 1.7 1.7 2.1 1.6 Amortization of Intangible Assets 1.9 2.1 2.0 1.9 2.7 3.3 3.5 3.8 4.0 3.8 EBIT (59.1) (67.6) (59.9)
17.2 (5.9) 9.9 2.5 9.8 13.1 12.8 Net Profit/(Loss) (56.2) (69.8) (60.4) 14.9 (3.0) 13.3 1.9 8.2 9.2 9.0 Net Profit/(Loss) from Discontinued Operations - - - - - 6.0 (0.4) 0.0 - - BALANCE SHEET Total Assets 538.8 415.4 463.6 400.1 426.5 447.7 224.3
228.4 209.8 206.1 Cash and Financial Assets 454.7 312.2 359.5 298.4 352.8 390.7 135.7 134.4 108.4 135.1 Intangible Assets 47.4 67.8 67.9 79.6 46.0 35.1 35.0 66.0 69.2 17.4 Total Liabilities 50.4 56.7 48.1 37.3 77.7 95.5 22.3 31.3 23.9 32.2
Stockholders’ Equity 488.4 359.0 415.5 362.7 348.8 352.1 202.0 197.1 185.9 173.9 Equity Ratio (in %) 91 % 86 % 90 % 91 % 82 % 79 % 90 % 86 % 89 % 84 % MORPHOSYS S H A R E Number of Shares Issued 31,839,572 29,420,785 29,159,770 26,537,682
26,456,834 26,220,882 23,358,228 23,112,167 22,890,252 22,660,557 Group Earnings/(Loss) per Share, Basic and Diluted (in ) (1.79) (2.41) (2.28) 0.57 (0.12) 0.54 0.08 0.36 0.40 0.40 Dividend (in ) - - - - - - - - - -Share Price (in ) 88.95 76.58
48.75 57.65 76.63 55.85 29.30 17.53 18.53 17.04 PERSONNEL DATA Total Group Employees (Number3) 329 326 345 365 329 299 421 446 464 404 1 Due to the agreement between Bio-Rad and MorphoSys, signed in December 2012, to acquire substantially all of the
AbD Serotec segment, for the years 2013, 2012 and 2011, revenues, income and expenses in connection with the transaction are shown in the line item “Net Profit/(Loss) from Discontinued Operations.” All other line items consist of amounts
from continuing operations.
2 In 2018, selling expenses were presented for the first time. In order to provide comparative information for the previous year, the
figures for 2017 and 2016 have been adjusted accordingly. 3 2009 to 2012 including employees from the discontinued operations of AbD Serotec.

Financial Calendar 2019 March 13 publication of 2018 year end results May 7 publication of first quarter interim statement 2019 May 22 2019 annual general meeting in munich August 6 publication of 2019 half-year report October 29 publication of third quarter interim statement 2019 MorphoSys AG Semmelweisstrasse 7 82152 Planegg Germany Phone: +49-89-89927-0 Fax: +49-89-89927-222 www.morphosys.com