
UNITED STATES
SECURITIES AND EXCHANGE COMMISSION
Washington, D.C. 20549
FORM
| | ANNUAL REPORT PURSUANT TO SECTION 13 OR 15(d) OF THE SECURITIES EXCHANGE ACT OF 1934 |
For the fiscal year ended
| | TRANSITION REPORT PURSUANT TO SECTION 13 OR 15(d) OF THE SECURITIES EXCHANGE ACT OF 1934 |
| For the transition period from ________________ to ________________ |
Commission file number:
URANIUM ENERGY CORP.
(Exact name of registrant as specified in its charter)
| | | |
| (State or other jurisdiction of incorporation of organization) | (I.R.S. Employer Identification No.) |
| | | |||
| (U.S. corporate headquarters) | (Zip Code) | |||
| 1830 – 1188 West Georgia Street | V6E 4A2 | |
| (Canadian corporate headquarters) | (Zip Code) |
(Address of principal executive offices)
| ( | ||
| (Registrant’s telephone number, including area code) |
Securities registered pursuant to Section 12(b) of the Act:
| Title of each class: | Trading Symbol(s) | Name of each exchange on which registered: |
| | | |
Securities registered pursuant to Section 12(g) of the Act:
N/A
(Title of class)
Indicate by check mark if the registrant is a well-known seasoned issuer, as defined in Rule 405 of the Securities Act.
Indicate by check mark if the registrant is not required to file reports pursuant to Section 13 or Section 15(d) of the Act.
Yes ☐
Indicate by check mark whether the registrant (1) has filed all reports required to be filed by Section 13 or 15(d) of the Securities Exchange Act of 1934 during the preceding 12 months (or for such shorter period that the registrant was required to file such reports), and (2) has been subject to such filing requirements for the past 90 days.
Indicate by check mark whether the registrant has submitted electronically every Interactive Data File required to be submitted pursuant to Rule 405 of Regulation S-T (§232.405 of this chapter) during the preceding 12 months (or for such shorter period that the registrant was required to submit such files).
Indicate by checkmark whether the registrant is a large accelerated filer, an accelerated filer, a non-accelerated filer, a smaller reporting company, or an emerging growth company. See the definitions of “large accelerated filer”, “accelerated filer”, “smaller reporting company” and “emerging growth company” in Rule 12b-2 of the Exchange Act.
| ☒ | ☐ Accelerated filer |
| ☐ Non-accelerated filer | |
If an emerging growth company, indicate by check mark if the registrant has elected not to use the extended transition period for complying with any new or revised financial accounting standards provided pursuant to Section 13(a) of the Exchange Act. ☐
Indicate by check mark whether the registrant has filed a report on and attestation to its management’s assessment of the effectiveness of its internal control over financial reporting under Section 404(b) of the Sarbanes-Oxley Act (15 U.S.C. 7262(b)) by the registered public accounting firm that prepared or issued its audit report.
If securities are registered pursuant to Section 12(b) of the Act, indicate by check mark whether the financial statements of the registrant included in the filing reflect the correction of an error to previously issued financial statements.
Indicate by check mark whether any of those error corrections are restatements that required a recovery analysis of incentive-based compensation received by any of the registrant’s executive officers during the relevant recovery period pursuant to §240.10D-1(b). ☐
Indicate by checkmark whether the registrant is a shell company (as defined in Rule 12b-2 of the Exchange Act).
Yes
The aggregate market value of the voting and non-voting common equity held by non-affiliates computed by reference to the price at which the common equity was last sold, or the average bid and asked price of such common equity, as of the last business day of the registrant’s most recently completed second fiscal quarter ($4.03 on January 31, 2023) was approximately $
The registrant had
CAUTIONARY NOTE REGARDING FORWARD-LOOKING STATEMENTS
This Form 10-K Annual Report and any documents incorporated herein by reference (collectively, the “Annual Report”) include statements and information about our strategy, objectives, plans and expectations for the future that are not statements or information of historical fact. These statements and information are considered to be forward-looking statements, or forward-looking information, within the meaning of and under the protection provided by the safe harbor provisions for forward-looking statements as contained in the Private Securities Litigation Reform Act of 1995 and similar Canadian securities laws.
Forward-looking statements, and any estimates and assumptions upon which they are based, are made in good faith and reflect our views and expectations for the future as of the date of this Annual Report, which can change significantly. Furthermore, forward-looking statements are subject to known and unknown risks and uncertainties which may cause actual results, performance, achievements or events to be materially different from any future results, performance, achievements or events implied, suggested or expressed by such forward-looking statements. Accordingly, forward-looking statements in this Annual Report should not be unduly relied upon.
Forward-looking statements may be based on a number of material estimates and assumptions, of which any one or more may prove to be incorrect. Forward-looking statements may be identifiable by terminology concerning the future, such as “anticipate”, “believe”, “continue”, “could”, “estimate”, “expect”, “forecast”, “intend”, “goal”, “likely”, “may”, “might”, “outlook”, “plan”, “predict”, “potential”, “project”, “should”, “schedule”, “strategy”, “target”, “will” or “would”, and similar expressions or variations thereof including the negative use of such terminology. Examples in this Annual Report include, but are not limited to, such forward-looking statements reflecting or pertaining to:
| ● |
our overall strategy, objectives, plans and expectations for the fiscal year ended July 31, 2023 (“Fiscal 2023”) and beyond; |
| ● |
our expectations for worldwide nuclear power generation and future uranium supply and demand, including long-term market prices for uranium oxide (“U3O8”); |
| ● |
our belief and expectations of in-situ recovery mining for our uranium projects, where applicable; |
| ● |
our estimation of mineralized materials, which are based on certain estimates and assumptions, and the economics of future extraction for our uranium projects including our Palangana Mine and Christensen Ranch Mine (collectively, the “ISR Mines”); |
| ● |
our plans and expectations including anticipated expenditures relating to exploration, pre-extraction, extraction and reclamation activities for our uranium projects including our ISR Mines; |
| ● |
our ability to obtain, maintain and amend, within a reasonable period of time, required rights, permits and licenses from landowners, governments and regulatory authorities; |
| ● |
our ability to obtain adequate additional financing including access to the equity and credit markets; |
| ● |
our ability to remain in compliance with the terms of our indebtedness; and |
| ● |
our belief and expectations including the possible impact of any legal proceedings or regulatory actions against the Company. |
Forward-looking statements, and any estimates and assumptions upon which they are based, are made as of the date of this Annual Report, and we do not intend or undertake to revise, update or supplement any forward-looking statements to reflect actual results, future events or changes in estimates and assumptions or other factors affecting such forward-looking statements, except as required by applicable securities laws. Should one or more forward-looking statements be revised, updated or supplemented, no inference should be made that we will revise, update or supplement any other forward-looking statements.
Forward-looking statements are subject to known and unknown risks and uncertainties. As discussed in more detail under Item 1A. Risk Factors herein, we have identified a number of material risks and uncertainties which reflect our outlook and conditions known to us as of the date of this Annual Report, including but not limited to the following:
| ● |
our limited financial and operating history; |
| ● |
our need for additional financing; |
| ● |
our ability to service our indebtedness; |
| ● |
our limited uranium extraction and sales history; |
| ● |
our operations are inherently subject to numerous significant risks and uncertainties, of which many are beyond our control; |
| ● |
our exploration activities on our mineral properties may not result in commercially recoverable quantities of uranium; |
| ● |
limits to our insurance coverage; |
| ● |
the level of government regulation, including environmental regulation; |
| ● |
changes in governmental regulation and administrative practices; |
| ● |
nuclear incidents; |
| ● |
the marketability of uranium concentrates; |
| ● |
the competitive environment in which we operate; |
| ● |
our dependence on key personnel; and |
| ● |
conflicts of interest of our directors and officers.3 |
Any one of the foregoing material risks and uncertainties has the potential to cause actual results, performance, achievements or events to be materially different from any future results, performance, achievements or events implied, suggested or expressed by any forward-looking statements made by us or by persons acting on our behalf. Furthermore, there is no assurance that we will be successful in preventing the material adverse effects that any one or more of these material risks and uncertainties may cause on our business, prospects, financial condition and operating results, or that the foregoing list represents a complete list of the material risks and uncertainties facing us. There may be additional risks and uncertainties of a material nature that, as of the date of this Annual Report, we are unaware of or that we consider immaterial that may become material in the future, any one or more of which may result in a material adverse effect on us.
Forward-looking statements made by us or by persons acting on our behalf are expressly qualified in their entirety by the foregoing cautionary information.
CAUTIONARY NOTE TO U.S. RESIDENTS CONCERNING DISCLOSURE OF MINERAL RESOURCES
The Company is a U.S. Domestic Issuer for United States Securities and Exchange Commission (“SEC”) purposes, most of its shareholders are U.S. residents, the Company is required to report its financial results under U.S. Generally Accepted Accounting Principles (“U.S. GAAP”) and its only trading market is the NYSE American. However, because the Company is a reporting issuer in Canada, certain prior regulatory filings required of the Company in Canada contain or incorporate by reference therein certain disclosure that satisfies the additional requirements of Canadian securities laws, which differ from the requirements of United States’ securities laws. Unless otherwise indicated, all Company resource estimates included in those Canadian filings, and in the documents incorporated by reference therein, had been prepared in accordance with Canadian National Instrument 43-101 - Standards of Disclosure for Mineral Projects (“NI 43-101”) and the Canadian Institute of Mining, Metallurgy and Petroleum classification system. NI 43-101 is a rule developed by the Canadian Securities Administrators which establishes standards for all public disclosure an issuer makes of scientific and technical information concerning mineral projects.
On October 31, 2018, the SEC adopted the Modernization of Property Disclosures for Mining Registrants (the “New Rule”), introducing significant changes to the existing mining disclosure framework to better align it with international industry and regulatory practice, including NI 43-101. The New Rule was codified as 17 CFR Subpart 220.1300 and 229.601(b)(96) (collectively, “S-K 1300”) and replaced SEC Industry Guide 7. The New Rule became effective as of February 25, 2019, and issuers are required to comply with the New Rule as of the annual report for their first fiscal year beginning on or after January 1, 2021, and earlier in certain circumstances. The Company has been complying with the New Rule since the filing of its Annual Report for the fiscal year ended July 31, 2022 and its related filings.
All mineral estimates constituting mining operations that are material to our business or financial condition included in this Annual Report for Fiscal 2023, and in the documents incorporated by reference herein, have been prepared in accordance with S-K 1300 and are supported by initial assessments prepared in accordance with the requirements of S-K 1300. S-K 1300 provides for the disclosure of: (i) “Inferred Mineral Resources,” which investors should understand have the lowest level of geological confidence of all mineral resources and thus may not be considered when assessing the economic viability of a mining project and may not be converted to a Mineral Reserve; (ii) “Indicated Mineral Resources,” which investors should understand have a lower level of confidence than that of a “Measured Mineral Resource” and thus may be converted only to a “Probable Mineral Reserve”; and (iii) “Measured Mineral Resources,” which investors should understand have sufficient geological certainty to be converted to a “Proven Mineral Reserve” or to a “Probable Mineral Reserve.” Investors are cautioned not to assume that all or any part of Measured or Indicated Mineral Resources will ever be converted into Mineral Reserves as defined by S-K 1300. Investors are cautioned not to assume that all or any part of an Inferred Mineral Resource exists or is economically or legally mineable, or that an Inferred Mineral Resource will ever be upgraded to a higher category.
REFERENCES
As used in this Annual Report: (i) the terms “we”, “us”, “our”, “Uranium Energy”, “UEC” and the “Company” mean Uranium Energy Corp., including our wholly-owned subsidiaries and a controlled partnership; (ii) “SEC” refers to the United States Securities and Exchange Commission; (iii) “Securities Act” refers to the United States Securities Act of 1933, as amended; (iv) “Exchange Act” refers to the United States Securities Exchange Act of 1934, as amended; and (v) all dollar amounts refer to United States dollars unless otherwise indicated.
Uranium Energy Corp. is a fast growing, uranium mining company listed on the NYSE American. UEC is working towards fueling the global demand for carbon-free nuclear energy, a key solution to climate change, and energy source for the low-carbon future.
UEC is a pure-play uranium company and is advancing its next generation of low-cost, environmentally friendly, in-situ recovery (“ISR”) mining uranium projects. The Company has two extraction ready ISR hub and spoke platforms in South Texas and Wyoming, anchored by fully licensed and operational processing capacity at its Hobson and Irigaray plants.
UEC also has seven U.S. ISR uranium projects with all of their major permits in place, with additional diversified holdings of uranium assets across the U.S., Canada and Paraguay.
We believe nuclear energy will continue to be an important part of the energy transition and the energy mix of a future low carbon economy. As such, we are focused on scaling our business to meet the future energy needs for nuclear in the U.S. and globally.
Corporate Organization
Uranium Energy Corp. was incorporated under the laws of the State of Nevada on May 16, 2003 under the name Carlin Gold Inc. During 2004 we changed our business operations and focus from precious metals exploration to uranium exploration in the United States. On January 24, 2005, we completed a reverse stock split of our common stock on the basis of one share for each two outstanding shares and amended our Articles of Incorporation to change our name to Uranium Energy Corp. Effective February 28, 2006, we completed a forward stock split of our common stock on the basis of 1.5 shares for each outstanding share and amended our Articles of Incorporation to increase our authorized capital from 75,000,000 shares of common stock, with a par value of $0.001 per share, to 750,000,000 shares of common stock, with a par value of $0.001 per share. In June 2007 we changed our fiscal year end from December 31st to July 31st (in each instance our “Fiscal” year now).
On December 31, 2007, we incorporated a wholly-owned subsidiary, UEC Resources Ltd., under the laws of the Province of British Columbia, Canada. On December 18, 2009, we acquired a 100% interest in the South Texas Mining Venture, L.L.P. (“STMV”), a Texas limited liability partnership, from each of URN Resources Inc., a subsidiary of Uranium One Inc., and Everest Exploration, Inc. On September 3, 2010, we incorporated a wholly-owned subsidiary, UEC Paraguay Corp., under the laws of the State of Nevada. On May 24, 2011, we acquired a 100% interest in Piedra Rica Mining S.A., a private company incorporated in Paraguay. On September 9, 2011, we acquired a 100% interest in Concentric Energy Corp. (“Concentric”), a private company incorporated in the State of Nevada. On March 30, 2012, we acquired a 100% interest in Cue Resources Ltd. (“Cue”), a formerly publicly-traded company incorporated in the Province of British Columbia, Canada. On March 4, 2016, we acquired a 100% interest in JDL Resources Inc., a private company incorporated in the Cayman Islands. On July 7, 2017, we acquired a 100% interest in CIC Resources (Paraguay) Inc., a private company incorporated in the Cayman Islands. On August 9, 2017, we acquired a 100% interest in AUC Holdings (US), Inc. (“AUC”). On January 31, 2018, we incorporated a wholly-owned subsidiary, UEC Resources (SK) Corp. (“UEC SK”), under the laws of the Province of Saskatchewan, Canada. On December 17, 2021, we acquired a 100% interest in Uranium One Americas, Inc. (“U1A”) (now UEC Wyoming Corp.). On August 19, 2022, we, through UEC 2022 Acquisition Co. (“UEC Acquisition Co.”) (now UEX Corporation), acquired all of the issued and outstanding common shares of UEX Corporation (“UEX”), which we did not already own, by way of a statutory plan of arrangement (the “Arrangement”) under the Canada Business Corporations Act. As part of the final steps of the Arrangement, UEC Acquisition Co. and UEX amalgamated to continue as one corporation under the name UEX Corporation. UEX Corporation holds a development stage uranium property portfolio in Saskatchewan, Canada, and Nunavut, Canada. On October 14, 2022, we acquired, through UEC SK, Roughrider Mineral Holdings Inc., a Saskatchewan corporation and wholly-owned subsidiary of Rio Tinto Fer Et Titane Inc., which, in turn, owns all of the issued and outstanding shares of Roughrider Mineral Assets Inc., also a Saskatchewan corporation, that holds certain mineral leases totaling approximately 598 hectares in northern Saskatchewan that is commonly referred to as the “Roughrider Project” located in the Athabasca Basin in Saskatchewan, Canada.
Our principal executive office (U.S. corporate headquarters) is located at 500 North Shoreline, Ste. 800, Corpus Christi, Texas, 78401, and our administrative office (Canadian corporate headquarters) is located at 1188 West Georgia Street, Suite 1830, Vancouver, British Columbia, Canada, V6E 4A2.
General Business
UEC’s goal is to provide the much needed fuel for the global energy transition. The International Energy Outlook projects that worldwide electricity generation will grow by 1.8% per year, through to 2050. As the global community calls on all governments and industries to curb their carbon emissions to stop the effects of climate change, there is growing need to combine intermittent renewable energy sources, such as wind and solar, with one or more “firm” zero-carbon sources, such as nuclear energy, to ensure the affordability and accessibility of the net-zero electricity grid.
We are predominantly engaged in uranium mining and related activities, including exploration, pre-extraction, extraction and processing, on uranium projects located in the United States, Canada and the Republic of Paraguay. We utilize ISR mining where possible which we believe, when compared to conventional open pit or underground mining, requires lower capital and operating expenditures with a shorter lead time to extraction and a reduced impact on the environment. We do not expect, however, to utilize ISR mining for all of our uranium projects in which case we would expect to rely on conventional open pit and/or underground mining techniques. We have one uranium mine located in the State of Texas, our Palangana Mine, which utilizes ISR mining and commenced extraction of U3O8, or yellowcake, in November 2010. We have one uranium processing facility located in the State of Texas, our Hobson Processing Facility, which processes material from our ISR Mines into drums of U3O8, our only sales product and source of revenue, for shipping to a third-party storage and sales facility. Since commencement of uranium extraction from our ISR Mines in November 2010 to July 31, 2023, our Hobson Processing Facility has processed 578,000 pounds of U3O8. As at July 31, 2023, we had no uranium supply or “off-take” agreements in place. Future sales of U3O8 are therefore expected to generally occur through the uranium spot market, with any fluctuations in the market price continuing to have a direct impact on our revenues and cash flows.
Our fully-licensed and 100%-owned Hobson Processing Facility forms the basis for our regional operating strategy in the State of Texas, specifically in the South Texas Uranium Belt, where we utilize ISR mining. We utilize a “hub-and-spoke” strategy whereby the Hobson Processing Facility acts as the central processing site (the “hub”) for our Palangana Mine and future satellite uranium mining activities, such as our Burke Hollow and Goliad Projects, located within the South Texas Uranium Belt (the “spokes”). The Hobson Processing Facility has a physical capacity to process uranium-loaded resins up to a total of two million pounds of U3O8 annually and is licensed to process up to four million pounds of U3O8 annually.
With the acquisition of U1A in Fiscal 2022, the Irigaray Processing Facility forms the focus of our regional operating strategy in the Powder River and Great Divide uranium districts in the state of Wyoming. The Irigaray plant has a licensed capacity of 2.5 million pounds of U3O8 per year, with the potential to process uranium from eleven satellite ISR projects in the state, including four fully permitted projects.
Recently, we acquired a substantial portfolio of projects in Canada, with the purchase of UEX and the Roughrider Project from a subsidiary of Rio Tinto plc (“Rio Tinto”). The UEX portfolio consists of a mix of uranium deposits, primarily focused on the Athabasca Basin uranium district in Saskatchewan, Canada. This includes interests in the Shea Creek, Christie Lake, Horseshoe Raven, Millennium and Wheeler River projects. In addition to advancing its uranium development projects through its ownership interest in JCU (Canada) Exploration Company, Limited, UEX was advancing several other uranium deposits in the Athabasca Basin which include the Paul Bay, Ken Pen and Ōrora deposits at the Christie Lake Project, the Kianna, Anne, Colette and 58B deposits at its currently 49.1%-owned Shea Creek Project, and the Horseshoe and Raven deposits located on its 100%-owned Horseshoe-Raven Project. The Roughrider Project is an exploration stage asset, having been advanced by Rio Tinto over a decade of work. The acquisition brought in an exploration stage, high-grade, conventional asset into UEC’s portfolio that, along with the UEX acquisition, begins to develop a critical mass of 100% owned resources in the Athabasca Basin to accelerate extraction and/or production plans. The two transactions provide a portfolio of medium to long term, high-grade, conventional projects that complement our nearer term, U.S. ISR assets.
In August 2023, we acquired a portfolio of exploration-stage projects in the Athabasca Basin, Saskatchewan, Canada, for CAD$1.5 million from Rio Tinto Exploration Canada Inc., a subsidiary of Rio Tinto, whereby we acquired a 60% equity stake in the Henday Lake joint venture, 100% of the Milliken project and a 50% equity stake in the Carswell joint venture project. With this transaction, we added an additional 44,444 acres of prospective ground in the Athabasca Basin to our existing portfolio.
As at July 31, 2023, we hold certain mineral rights in various stages in the States of Arizona, Colorado, New Mexico, Texas and Wyoming, in Canada and in the Republic of Paraguay, many of which are located in historically successful mining areas and have been the subject of past exploration and pre-extraction activities by other mining companies. We do not expect, however, to utilize ISR mining for all of our uranium projects in which case we would expect to rely on conventional open pit and/or underground mining techniques.
Our operating and strategic framework is based on expanding our uranium extraction activities, which includes advancing certain uranium projects with established mineralized materials towards uranium extraction, and establishing additional mineralized materials on our existing uranium projects or through acquisition of additional uranium projects.
Physical Uranium Program
The Company is investing in building the next generation of low-cost and environmentally friendly uranium projects that will be competitive on a global basis. Despite our focus on low cost ISR mining with its low capital requirements, we saw a unique opportunity to purchase drummed uranium at prevailing spot prices which are below most global industry mining costs. Hence, we established a physical uranium portfolio (the “Physical Uranium Program”) and, as of July 31, 2023, we had entered into agreements to purchase 1,695,000 pounds of U.S. warehoused uranium from Fiscal 2024 to Fiscal 2026 at the ConverDyn conversion facility located in Metropolis, Illinois, at a volume weighted average price of approximately $42.78 per pound.
During Fiscal 2023, we generated revenue of $164.0 million from sales of 3,150,000 pounds of uranium, which included $17.85 million from sales of 300,000 pounds of U.S. origin uranium concentrates to the U.S. Department of Energy.
Our Physical Uranium Program will support three objectives for our Company: (i) to bolster our balance sheet as uranium prices appreciate; (ii) to provide strategic inventory to support future marketing efforts with utilities that could compliment production and accelerate cash flows; and (iii) to increase the availability of our Texas and Wyoming production capacity for emerging U.S. origin specific opportunities which may command premium pricing due to the scarcity of domestic uranium. One such U.S. origin specific opportunity is the Company’s plan to participate in supplying the Uranium Reserve, as outlined in the Nuclear Fuel Working Group report published by the U.S. Department of Energy.
During Fiscal 2023, we made significant advancements in various aspects of our operations, including:
| ● |
we completed and filed TRS reports in accordance with S-K 1300 disclosing mineral resources for each of our Texas ISR Hub and Spoke, updated Wyoming ISR Hub and Spoke, Shea Creek, Horseshoe-Raven, Workman Creek and Roughrider Projects on August 11, 2022, September 14, 2022, January 13, 2023, January 24, 2023, March 16, 2023 and May 2, 2023, respectively; |
| ● |
we completed the acquisition of UEX on August 19, 2022, making us one of the largest diversified North American focused uranium companies; |
| ● |
we completed the acquisition of the Roughrider Project on October 14, 2022. The acquisition of the Roughrider Project represented an opportunity to scale-up in the high-grade Eastern Athabasca Basin of Saskatchewan, Canada; |
| ● |
we generated revenue of $164.0 million from sales of 3,150,000 pounds of uranium, which included $17.85 million from sales of 300,000 pounds of U.S. origin uranium concentrates to the U.S. Department of Energy; |
| ● |
we published our inaugural sustainability report; |
| ● |
we expanded licensed capacity to four million pounds of U3O8 annually at our Hobson Processing Facility, distinguishing the plant as having the largest licensed capacity in Texas and the second largest in the United States; and |
| ● |
we commenced a drilling campaign at our 82.77% owned Christie Lake Project and drilled 19,778.9 meters. |
Uranium Market Developments
Over the past few years, global uranium market fundamentals have been improving as the market transitions from an inventory driven market to a production driven market. The spot market bottomed in November 2016 at about $17.75 per pound U3O8 and stood at $56.25 per pound on July 31, 2023 (UxC U3O8 Daily Spot Price). Production dropped to a multi-year low in 2020 at about 122 million pounds but began to recover in 2021 and totalled about 129 million pounds in 2022, still well below reactor requirements. Global supply and demand projections show a structural deficit between production and utility requirements averaging over 44 million pounds a year over the next 10 years and increasing thereafter (UxC 2023 Q2 Uranium Market Outlook). The current gap is being filled with secondary market sources, including finite inventory that is projected to decline in coming years. As secondary supplies diminish, and as existing mines deplete their resources, new production will be needed to meet utility demand. This will require higher prices to stimulate new mining investment but market prices are still below the incentive prices for many producers.
Uranium supply has become more complicated due to Russia’s invasion of Ukraine as Russia is a significant supplier of nuclear fuel around the globe. Economic sanctions, transportation restrictions, pending legislation and buyer avoidance of Russian fuel is causing a fundamental change to the nuclear fuel markets. We believe this is resulting in a bifurcation of the uranium market, increasing an already notable supply gap for western utilities. More recently, the coup in Niger has raised questions about uranium supply from that country that provided about 25% of European supply this past year. Secondary supply is also likely to be further reduced with western enrichers reversing operations from underfeeding to overfeeding that requires more uranium to increase the production of enrichment services. While these situations are still unfolding, new trends appear to be pointing towards U.S. and European utilities beginning to shift more focus to security of supply with production from areas of low geopolitical risk.
On the demand side of the equation, the global nuclear energy industry continues robust growth, with 69 new reactors connected to the grid since 2013 and another 59 reactors under construction as of August 2023 (PRIS and WNA August 2023 data). In October 2022, World Nuclear News reported that: “The International Energy Agency projects more than a doubling of nuclear generation by 2050 with at least 30 countries increasing their use of nuclear power, in the Net Zero Emissions by 2050 scenario of its latest World Energy Outlook”. Additional upside market pressure is also emerging as utilities return to a longer-term contracting cycle to replace expiring contracts; something the market has not experienced for several years. Increasing demand has also occurred with financial entities and various producers, including our Company, purchasing significant quantities of drummed uranium inventory, further removing excess near term supplies.
Titanium (TiO2) Industry Updates
During Fiscal 2023, the market fundamentals for titanium dioxide remained positive although some softening is expected during the latter part of 2023. There is no economical substitute or environmentally safe alternative to titanium dioxide. Titanium dioxide is used in many “quality of life” products for which demand historically has been linked to global gross domestic product (“GDP”), ongoing urbanization trends and discretionary spending. 90% of all the mined titanium feedstocks are used to manufacture pure titanium dioxide – a pigment that enhances brightness and opacity in paints, inks, paper, plastics, food products and cosmetics. The remaining 10% of supply is used in the production of titanium metal and steel fabrication.
Demand for titanium feedstocks, such as ilmenite, is closely tied to titanium dioxide pigment demand. The global titanium pigment demand fundamentals are underpinned by urbanization and rising living standards and as such the long-term demand fundamentals remain robust. Demand for titanium pigment is expected to soften during the latter half of 2023 mainly due to slower growth in China. During 2023, China has seen increasing competition for pigment sales in both the domestic and export markets which has led to reduced pigment production from some operations and in turn has impacted the demand for ilmenite during the first part of the year.
Longer-term, China, the world’s largest feedstock market, is becoming increasingly more reliant on higher quality imported feedstocks. Chinese domestic ilmenite is mainly unsuitable for processing under the stricter environmental regulations and, as such, the long-term global shift towards chloride pigment production will continue to drive overall high-quality feedstock demand and prices.
In our view, what appear to be longer-term supply and demand fundamentals and, more specifically, the long-term global shift towards higher grade feedstocks, have the potential to keep upward pressure on high-quality feedstock prices and hence the potential product from the Alto Parana Project.
In-Situ Recovery (ISR) Mining
We utilize in-situ recovery or ISR uranium mining for our South Texas projects as well as our Reno Creek Project in Wyoming, and will continue to utilize ISR mining whenever such an alternative is available to conventional mining. When compared to conventional mining, ISR mining requires lower capital expenditures, has a reduced impact on the environment and results in a shorter lead time to uranium recovery.
ISR mining is considered considerably more environmentally friendly compared to alternative, traditional mining approaches, as the ISR process does not require blasting or waste rock movement, resulting in less damage to the environment, minimal dust, and no resulting tailings or tailings facilities. Further, ISR mining is more discrete and, therefore, land access does not typically have to be restricted, and the area may be restored to its pre-mining usage faster than when applying traditional mining approaches.
ISR mining involves circulating oxidized water through an underground uranium deposit, dissolving the uranium and then pumping the uranium-rich solution to the surface for processing. Oxidizing solution enters the formation through a series of injection wells and is drawn to a series of communicating extraction wells. To create a localized hydrologic cone of depression in each wellfield, more groundwater will be produced than injected. Under this gradient, the natural groundwater movement from the surrounding area is toward the wellfield, providing control of the injection fluid. Over-extraction is adjusted as necessary to maintain a cone of depression which ensures that the injection fluid does not move outside the permitted area.
The uranium-rich solution is pumped from an ore zone to the surface and circulated through a series of ion exchange columns located at the mine site. The solution flows through resin beds inside an ion exchange column where the uranium bonds to small resin beads. As the solution exits the ion exchange column, it is mostly void of uranium and is re-circulated back to the wellfield and through the ore zone. Once the resin beads are fully-loaded with uranium, they are transported by truck to our Hobson Processing Facility and transferred to a tank for flushing with a brine solution, or elution, which strips the uranium from the resin beads. The stripped resin beads are then transported back to the mine and reused in the ion exchange columns. The uranium solution, now free from the resin, is precipitated out and concentrated into a slurry mixture and fed to a filter press to remove unwanted solids and contaminants. The slurry is then dried in a zero-emissions rotary vacuum dryer, packed in metal drums and shipped out as uranium concentrates, or yellowcake, to a conversion facility for storage and sales.
Each project is divided into a mining unit, known as a Production Area Authorization (“PAA”), which lies inside an approved Mine Permit Boundary. Each PAA will be developed, extracted and restored as one unit and will have its own set of monitor wells. It is common to have multiple PAAs in extraction at any one time with additional units in various states of exploration, pre-extraction and/or restoration.
After mining is complete in a PAA, aquifer restoration will begin as soon as practicable and will continue until the groundwater is restored to pre-mining conditions. Once restoration is complete, a stability period of no less than one year is scheduled with quarterly baseline and monitor well sampling. Wellfield reclamation will follow after aquifer restoration is complete and the stability period has passed.
Hobson Processing Facility
Our Hobson Processing Facility is located in Karnes County, Texas, about 100 miles northwest of Corpus Christi. It was originally licensed and constructed in 1978, serving as the hub for several satellite mining projects until 1996, and completely refurbished in 2008. On December 18, 2009, we acquired the Hobson Processing Facility as part of our acquisition of STMV.
With a physical capacity to process uranium-loaded resins up to a total of two million pounds of U3O8 annually and licensed to process up to four million pounds of U3O8 annually, our fully-licensed and 100%-owned Hobson Processing Facility forms the basis for our “hub-and-spoke” strategy in the State of Texas, specifically in the South Texas Uranium Belt, where we utilize ISR mining.
Palangana Mine
We hold various mining lease and surface use agreements generally having an initial five-year term with extension provisions, granting us the exclusive right to explore, develop and mine for uranium at our Palangana Mine, a 6,969-acre property located in Duval County, Texas, approximately 100 miles south of the Hobson Processing Facility. These agreements are subject to certain royalty and overriding royalty interests indexed to the sales price of uranium.
On December 18, 2009, we acquired the Palangana Mine as part of our acquisition of STMV. In November 2010, the Palangana Mine commenced uranium extraction utilizing ISR mining and in January 2011 the Hobson Processing Facility began processing resins received from the Palangana Mine.
Material Relationships Including Long-Term Delivery Contracts
As at July 31, 2023, we had no uranium supply or “off-take” agreements in place.
Given that there are up to approximately 60 different companies as potential buyers in the uranium market, we are not substantially dependent upon any single customer to purchase uranium extracted by us.
Seasonality
The timing of our uranium concentrate sales is dependent upon factors such as extraction results from our mining activities, cash requirements, contractual requirements and perception of the uranium market. As a result, our sales are neither tied to nor dependent upon any particular season. In addition, our ability to extract and process uranium does not change on a seasonal basis. Over the past ten years uranium prices have tended to decline during the calendar third quarter before rebounding during the fourth quarter, but there does not appear to be a strong correlation.
Mineral Rights
In Texas our mineral rights are held exclusively through private leases from the owners of the land/mineral/surface rights with varying terms. In general, these leases provide for uranium and certain other specified mineral rights only including surface access rights for an initial term of five years and renewal for a second five-year term. We have amended the majority of the leases to extend the time period for an additional five years past the original five-year renewal periods. Our Burke Hollow and some of our Goliad Project leases have a fixed royalty amount based on net proceeds from sales of uranium, and our other projects have production royalties calculated on a sliding-scale basis tied to the gross sales price of uranium. Remediation of a property is required in accordance with regulatory standards, which may include the posting of reclamation bonds.
In Arizona, Colorado, New Mexico and Wyoming our mineral rights are held either exclusively or through a combination of federal mining claims and state and private mineral leases. Remediation of a property is required in accordance with regulatory standards, which may include the posting of reclamation bonds. Our federal mining claims consist of both unpatented lode and placer mining claims registered with the U.S. Bureau of Land Management (“BLM”) and the appropriate counties. These claims provide for all mineral rights including surface access rights for an indefinite period. Annual maintenance requirements include BLM claim fees of $165 per claim due yearly on September 1st. Our state mineral leases are registered with their respective states. These leases provide for all mineral rights, including surface access rights, to be subject to a production royalty of 4% in Wyoming and 5% to 6% in Arizona, ranging from a five-year term in Arizona to a ten-year term in Wyoming. Annual maintenance requirements include lease fees of between $1 and $3 per acre and minimum exploration expenditure requirements of between $10 and $20 per acre in Arizona. Our private mineral leases are negotiated directly with the owners of the land/mineral/surface rights with varying terms. These leases provide for uranium and certain other specified mineral rights only, including surface access rights, subject to production royalties, ranging from an initial term of five to seven years and renewal for a second five-year to seven-year term, and some of which have an initial term of 20 years.
Under the mining laws of Saskatchewan, Canada, title to mineral rights for our projects in Saskatchewan is held through The Crown Minerals Act of the Province of Saskatchewan. In addition, The Mineral Resources Act, 1985 and The Mineral Tenure Registry Regulations affect the rights and administration of mineral tenure in Saskatchewan. Our lands of Saskatchewan projects are currently claimed as “Crown dispositions” or “mineral dispositions”. Subject to section 19 of The Crown Minerals Act, a claim grants to the holder the exclusive right to explore for any Crown minerals that are subject to these regulations within the claim lands. Claims are renewed annually and the claim holder is required to satisfy work expenditure requirements. Expenditure requirements are $Nil for the first year, $15 per hectare for the second year to the tenth year of assessment work periods and $25 per hectare for the eleventh year and subsequent assessment work periods. For registering exploration expenditures, mineral dispositions may be grouped at the time of submission if the total mineral disposition area is not greater than 18,000 hectares. The holder may also submit a cash payment or cash deposit in lieu of a work assessment submission for not more than three consecutive work periods. A claim may be converted to a mineral lease upon application and payment of a registration fee.
Under the mining laws of the Republic of Paraguay, title to mineral rights for our Yuty Project is held through a “Mineral Concession Contract” approved by the National Congress and signed between the Government of the Republic of Paraguay and the Company, and titles to mineral rights for our Oviedo Project and our Alto Paraná Titanium Project are held through “Exploration Mining Permits” granted by the Ministry of Public Works and Communications (“MOPC”), the mining regulator in Paraguay. These mineral rights provide for the exploration of metallic and non-metallic minerals and precious and semi-precious gems within the territory of Paraguay for up to a six-year period, and for the exploitation of minerals for a minimum period of 20 years from the beginning of the production phase, extendable for an additional ten years.
Environmental, Social and Governance Overview
UEC is dedicated to preserving the environment in which we operate, and to being a responsible neighbor to our local communities. We believe in mining in a responsible manner, such as through the deployment of ISR technology when possible, adhering to all applicable environmental regulations and managing and reducing our carbon emissions. UEC believes that uranium and nuclear energy will be an important part of the energy transition as it can provide reliable and consistent power to the grid. Ensuring responsible mining practices better positions nuclear to be an energy source of choice to governments, and enables us to be a better partner and corporate citizen to our local communities.
Environmental Management
Environmental Governance
UEC approved an Environmental, Health and Safety Policy in Fiscal 2022 which sets out objectives and provides overarching guidelines for the management of the environment. This enterprise-wide policy can be found at https://www.uraniumenergy.com/about/corporate-governance/. Topics covered in this policy include the management of hazardous waste, water, biodiversity and land use, air quality and pollutants, green-house gas (“GHG”) emissions and energy management. Adherence to and performance against this policy will be reviewed by our Board of Directors’ (the “Board of Directors” or “Board”) Sustainability Committee annually.
U.S. Environmental Regulations
We believe that we comply with all federal, state and local applicable laws and regulations which govern environmental quality and pollution control. Our operations are subject to stringent environmental regulation by state and federal authorities including the Railroad Commission of Texas (“RCT”), the Texas Commission on Environmental Quality (“TCEQ”), the Wyoming Department of Environmental Quality (“WDEQ”) Land, Water and Air Quality Divisions, the United States BLM(Wyoming) and the United States Environmental Protection Agency (“EPA”).
Texas
In Texas, where the Company’s hub-and-spoke operations are anchored by the fully-licensed Hobson Processing Facility, surface extraction and exploration for uranium is regulated by the RCT, while ISR uranium extraction is regulated by the TCEQ. An exploration permit is the initial permit granted by the RCT that authorizes exploration drilling activities inside an approved area. This permit authorizes specific drilling and plugging activities requiring documentation for each borehole drilled. All documentation is submitted to the RCT on a monthly basis and each borehole drilled under the exploration permit is inspected by an RCT inspector to ensure compliance. As at July 31, 2023, we held one exploration permit in each of Bee, Duval and Goliad Counties in Texas.
As an example of the regulation that guides our industry, before ISR uranium extraction can begin in Texas, a number of permits must be granted by the TCEQ.
A Mine Area Permit (“MAP”) application is required for submission to the TCEQ to establish a specific permit area boundary, aquifer exemption boundary and the mineral zones of interests or production zones. The application also includes a financial surety plan to ensure funding for all plugging and abandonment requirements. Funding for surety is in the form of cash or bonds, including an excess of 15% for contingencies and 10% for overhead, adjusted annually for inflation. As at July 31, 2023, we held MAPs for our Palangana Mine and our Goliad and Burke Hollow Projects.
A Radioactive Material License (“RML”) application is also required for submission to the TCEQ for authorization to operate a uranium recovery facility. The application includes baseline environmental data for soil, vegetation, surface water and groundwater along with operational sampling frequencies and locations. A Radiation Safety Manual is a key component of the application which defines the environmental health and safety programs and procedures to protect employees and the environment. Another important component of the application is a financial surety mechanism to ensure plant and wellfield decommissioning is properly funded and maintained. Surety funding is in the form of cash or bonds, and includes an excess of 15% for contingencies and 10% for overhead, adjusted annually for inflation. As at July 31, 2023, we held RMLs for our Palangana Mine, Burke Hollow and Goliad Projects and Hobson Processing Facility.
PAA applications are also required for submission to the TCEQ to establish specific extraction areas inside the MAP boundary. These are typically 30 to 100-acre units that have been delineated and contain extractible quantities of uranium. The PAA application includes baseline water quality data that is characteristic of that individual unit, proposes upper control limits for monitor well analysis and establishes restoration values. The application will also include a financial security plan for wellfield restoration and reclamation which must be funded and in place prior to commencing uranium extraction. As at July 31, 2023, we held four PAA permits for our Palangana Mine and one for our Goliad Project. An application for PAA-1 at Burke Hollow was submitted in February 2023.
A Class I disposal well permit application is also required for submission to the TCEQ for authorization for deep underground wastewater injection. It is the primary method for disposing of excess fluid from the extraction areas and for reverse osmosis concentrate during the restoration phase. This permit authorizes injection into a specific injection zone within a designated injection interval. The permit requires continuous monitoring of numerous parameters including injection flow rate, injection pressure, annulus pressure and injection/annulus differential pressure. Mechanical integrity testing is required initially and annually to ensure the well is mechanically sound. Surety funding for plugging and abandonment of each well is in the form of cash or bonds, including 15% for contingencies and 10% for overhead, adjusted annually for inflation. As at July 31, 2023, we held two Class I disposal well permits for each of our Hobson Processing Facility, Palangana Satellite Facility and Burke Hollow and Goliad Projects.
The federal Safe Drinking Water Act (“SDWA”) creates a regulatory program to protect groundwater and is administered by the EPA. The SDWA allows states to issue underground injection control (“UIC”) permits under two conditions: the state’s program must have been granted primacy; and the EPA must have granted an aquifer exemption upon the state’s request (an “Aquifer Exemption”). Texas, being a primacy state, is therefore authorized to grant UIC permits and makes the official requests for an Aquifer Exemption to the EPA. The Aquifer Exemption request is submitted by the Company to the TCEQ and, once approved, is then submitted by the TCEQ to the EPA for concurrence and final issuance. As at July 31, 2023, we held an Aquifer Exemption for each of our Palangana Mine and our Goliad and Burke Hollow Projects.
Wyoming
In Wyoming ISR mining activities are regulated by the Wyoming Department of Environmental Quality (“WDEQ”), Land Quality Division (“LQD”), under Wyoming Administrative Code §35-11-401 through §35-11-437. Before ISR uranium mining is allowed to proceed in Wyoming, certain permits and licenses must be granted by WDEQ, which are subject to financial assurance plans to ensure anticipated future costs for decontamination, decommissioning, reclamation, groundwater restoration, disposal, or any other reclamation requirements are adequately funded. Bonding regulations for ISR facilities are discussed in §35-11-417 of the Wyoming Administrative Code and further in WDEQ/LQD regulations contained in Non-Coal Chapters 1 through 13.
There are two major permits/licenses required for ISR uranium mining in Wyoming. The first is the Permit to Mine, issued by the WDEQ/LQD. The second is the RML, previously issued by the U.S. Nuclear Regulatory Commission (“NRC”), now issued by the WDEQ/LQD Uranium Recovery Program (“URP”). In 2018 the State of Wyoming became an NRC agreement state for the licensing of uranium recovery operations. RMLs are now issued and regulated by the WDEQ/LQD/URP. Annual financial surety updates are required on the Mine Permit anniversary date and are reviewed by both the WDEQ/LQD and WDEQ/LQD/URP as part of the approval process. As at July 31, 2023, UEC held Permits to Mine and RMLs for each of its Christensen Ranch, Irigaray, Ludeman, Moore Ranch and Reno Creek Projects.
In Wyoming, a Class I disposal well permit is required for deep underground wastewater injection (same process as in Texas). It is the primary method for disposing of excess fluid from the extraction areas and for reverse osmosis concentrate during the restoration phase. Permits for Class I Injection wells are authorized by the WDEQ Water Quality Division who has primacy for this program under EPA. In Wyoming, as at July 31, 2023, UEC holds Class I Injection well permits for four disposal wells at the Christensen Ranch Project, two disposal wells at the Irigaray Project, four disposal wells at the Moore Ranch Project and four disposal wells at its Reno Creek Project.
Exploration drilling outside of areas within a Permit to Mine is regulated by the WDEQ LQD. To conduct exploration drilling, an application must be filed with LQD that provides location details of the areas to be explored, the number of drill holes anticipated, the methods of drill hole abandonment to be used; location of access roads to be used or constructed, and an estimate of the cost to reclaim all drill holes and surfaces impacted by the drilling program. If approved, LQD will approve the reclamation cost estimate and the company will post a bond or other financial assurance instrument acceptable to LQD. After the financial assurance instrument is approved by LQD, they will issue a Drilling Notification permit to the company to conduct the exploration drilling. After reclamation is completed, LQD will inspect the drill hole sites and either approve the reclamation and release the bond, or make recommendations for further corrective action. As at July 31, 2023, UEC holds three Drilling Notification Permits, two for various exploration projects in the Powder River Basin and one for exploration in the Great Divide Basin of Wyoming.
Under the WDEQ the Bonding Provisions (§35-11-417) and regulations for Financial Assurance Requirements for Closure, Post Closure, and Corrective Action outlines financial assurance for in-situ uranium sites to include costs relating to: decommissioning, decontamination, demolition and waste disposal for buildings, structures, foundations, equipment and utilities; well plugging and abandonment; surface reclamation of operating areas, roads, wellfields and surface impoundments; groundwater restoration in mining areas; and radiological surveying for final release of the lands. Funding for the financial assurance is in the form of cash, reclamation bonds, letters of credit, and other mechanisms approved by the WDEQ. The financial assurance calculations include an excess of 15% for contingencies and 10% for overhead, adjusted annually for inflation. As at July 31, 2023, UEC held reclamation bonds for all of the Permits to Mine and RMLs Licenses plus three Drilling Notifications (exploration by drilling permits).
As in Texas, the State of Wyoming is allowed to issue UIC permits under two conditions: the state’s program must have been granted primacy; and the EPA must have granted an aquifer exemption upon the state’s request (an Aquifer Exemption). Wyoming issues UIC Class I permits (disposal wells) and UIC Class III permits for ISR wells. Wyoming requests the official aquifer exemption from the EPA for these permits. As at July 31, 2023, UEC held Aquifer Exemptions for each of its Christensen Ranch, Irigaray, Ludeman, Moore Ranch and Reno Creek Projects, as well as the Christensen Ranch Class I disposal wells.
Canada Environmental Regulations
Uranium mining and milling projects in Canada are among the most heavily regulated types of projects in the country with full regulatory oversight from both the federal and provincial levels of government. That full regulatory oversight includes a strong, independent federal nuclear regulator, the Canadian Nuclear Safety Commission (“CNSC”), which is charged with regulating all aspects of nuclear activities in Canada. Modern uranium mines, despite their strong safety and environmental protection record, operate in this heavily regulated environment effectively using integrated management systems maintain compliance and extensive reporting to demonstrate ongoing compliance. Monitoring includes community groups (e.g., North Environmental Quality Committee), First Nations, periodic state of the environment reporting and occasional independent third-party monitoring funded by the CNSC.
For mining in Saskatchewan, a surface lease is required prior to work commencing on site. The surface lease will generally cover all areas that are predicted to be disturbed and accrues annual fees per hectare. Surface leases are coordinated through the Ministry of Government Relations, Northern Engagement Branch, and the Ministry of Environment (“MOE”), Lands Branch, and includes input from other government agencies where appropriate. While negotiations can start early, and in parallel with a provincial Environmental Impact Assessment (“EIA”) process, a precondition of the issuance of a surface lease is the successful outcome of the EIA process. In Saskatchewan, the EIA and licensing process are sequential, as the EIA process must be completed prior to the issuance of specific leases, licenses and permits.
To require an EIA, a project must be deemed a Development per section 2(d) of the Saskatchewan Environmental Assessment Act (“EAA”) and a formal Ministerial Determination to that effect. The work required for an EIA includes any delegated Duty to Consult engagement and consultation along with environmental baseline work.
Once an EIA is submitted and the provincial internal reviews are finished, the EASB compiles the comments and produces the technical review comments (“TRC”) document. If there are deficiencies in the EIA, the proponent will be required to address them before the TRC document and the final EIS are placed into public review. Public review is generally 30 or 60 days. When the public comments period is complete, EASB will produce an EIA decision document for the Minister of Environment. While there are three outcomes possible, the likely outcome for a project that gets to this stage is approval of the EIA with conditions. With approval of the EIA, licensing and permitting can be completed.
While the EIA is in progress, the proponent can develop the surface lease application, and other provincial licensing packages for review by the government, although approval of these cannot occur until the EIA process is completed and a positive outcome obtained. Provincially, the licensing is through the MOE Environmental Protection Branch, which largely provides a one window approach for mining project licensing on behalf of other branches and ministries. There will be other ministries and permitting required related to health and safety, labour, employment, and royalties. Overall, a number of permissions, of one form or another, are required to complete the project, but when compared to the EIA process, they are rarely material to the schedule or budget if organized properly. Most ministries will indicate their interest and the need for any permits at the Technical Proposal and EIA review stages and those comments will come forward in the TRC.
The federal Impact Assessment Act, 2019 (“IAA”) and the need to produce an Impact Assessment (“IA”) can be triggered in two ways. The first is by triggering one of the activity thresholds in the Physical Activities Regulations, 2019, and the second is that the project can be designated by the federal Minister of Environment and Climate Change (the “Minister”) in response to a request to designate the project and a supporting recommendation from the Canadian Impact Assessment Agency (“CIAA”). Currently, the proposed project does not trigger any thresholds in the Physical Activities Regulations.
The CNSC and Saskatchewan MOE have historically worked closely together and the CNSC will have the ability to review the provincial EIA. The regulators have demonstrated recently that they can cooperate in their review of projects despite the expiration of their cooperation agreement. The CNSC can review and provide comments on any submission to EASB. In addition, the CNSC will act as a technical advisor and is a participant in the EIA process; however, the provincial EIA decision is independent of the federal government.
The main federal licensing agency for the Project, the CNSC, will need to be satisfied that the environment, writ large, is protected. The CNSC will conduct an environmental protection review (“EPR”) for the license application in accordance with their mandate under the NSCA to ensure the protection of the environment and the health of persons. The CNSC follows the federal mandates with respect to Indigenous peoples and other initiatives such as Climate Change.
The CNSC and Saskatchewan MOE have historically worked closely together and the CNSC will have the ability to review the provincial EIA. The regulators have demonstrated recently that they can cooperate in their review of projects despite the expiration of their cooperation agreement. The CNSC can review and provide comments on any submission to EASB. In addition, the CNSC will act as a technical advisor and is a participant in the EIA process; however, the provincial EIA decision is independent of the federal government.
Per the NSCA, a project needs to initiate the licensing process in order to have meaningful discussions with the CNSC and early discussions with the CNSC on the licensing process, engagement and consultation expectations, and the scope of the Project’s licensing are meaningful to help advance a project. While the option of sequentially doing the provincial EIA and the CNSC licensing is available to the proponent, the CNSC suggests doing these two distinct processes in parallel to save time. Effectively, while the EIA process is proceeding, the development and submission of the provincial and CNSC licensing packages can proceed in parallel. It is assumed that a successful outcome for the provincial EIA would be an important part of the CNSC’s EPR, which would be presented to the Commission Tribunal as part of the licensing reviews. As for Saskatchewan, a positive environmental decision is required prior to the Commission approving any licensing packages. The CNSC’s licensing and oversight processes are done on a cost recovery basis through the Cost Recovery Fees Regulations.
In support of licensing, proponents are required to develop management systems complete with policies, systems/programs, procedures, and monitoring commensurate with the proposed scope of activities. To protect human health and the environment, the CNSC focusses on their regulated areas of safety and control in their assessment of projects, including areas of higher risk such as quality management, occupational health and safety, environmental protection, radiation protection, tailings management, and safeguards and non-proliferation, to name a few.
There may be a need to engage with Fisheries and Oceans Canada (under the Fisheries Act) regarding treated effluent discharge or pump stations for fresh water. Transport Canada authorization may be required if there are any in-water works with a potential to impact navigation (under the Canadian Navigable Waters Act or under the Canadian Aviation Regulations). Water quality and the monitoring of biological effects will be governed by the Metal and Diamond Mining Effluent Regulations to the Fisheries Act, in addition to any provincial requirements. Other federal legislation of importance to a project will be compliance with the Species at Risk Act (e.g. the need for a woodland caribou management plan) and the Migratory Birds Convention Act. It is not clear whether the proposed federal Policy on Biodiversity will have an impact on the project, but if enacted, it could mean more bio-physical offsets will be required for disturbed ground.
As part of the environmental assessment process, projects are required to develop conceptual decommissioning plans for inclusion in the EIA, which detail the steps to be taken to decommission project facilities and reclaim the land at the end of project life. As part of licensing, the conceptual plan is expanded into a more detailed Preliminary Decommissioning Plan (“PDP”) and a cost estimate for implementation is prepared from that: The Preliminary Decommissioning Cost (“PDC”). The Company will then be required to provide some form of surety or bond to cover the cost of carrying out the PDP. The surety is designed to cover the unlikely situation whereby the proponent is unable to complete the decommissioning and reclamation and the government must step in to complete the work in a ‘decommission tomorrow’ scenario. While salvage of some materials is likely, these cannot be considered in the PDC. The plan and costs are periodically reviewed and updated and can be scaled to reflect the current state of a project. As operations progress, progressive decommissioning is encouraged as it lowers close-out liabilities, which, in turn, can reduce the amount of a surety bond, and often reduces the cost of disturbed-land lease fees.
For a uranium mining and milling project, once operations have stopped, the first step is to conduct systematic surveys to determine the extent of contamination, if any. Contamination may be chemical or radiological. Areas that can be decontaminated will be cleaned and re-surveyed to ensure that the clean-up criteria are met. Material that cannot be decontaminated to release standards would be disposed of on site or at an approved off-site disposal facility. The remainder of the site will be decommissioned as the facilities are no longer required with the material salvaged for reuse, recycling, or disposal.
In Saskatchewan, reclaimed land can be returned to the Crown under The Reclaimed Industrial Sites Act and The Reclaimed Industrial Sites Regulations, which establish an Institutional Control Program. This program is implemented once a decommissioned site has been deemed to be reclaimed in a stable, self-sustaining and non-polluting manner. The property can then be transferred back to the province for monitoring and maintenance. For this to happen, the proponent pays a calculated sum into the Institutional Control Monitoring and Maintenance Fund, and the Institutional Control Unforeseen Events Fund for long term monitoring of the property and maintenance, if required. In the unlikely event that the site does not behave as predicted, the government can seek redress from the proponent if the costs exceed the funds available.
Indigenous Engagement in Saskatchewan
For both the federal and provincial EIA and permitting/licensing processes, engagement and consultation are required with Indigenous groups. Engagement in Saskatchewan consists of the Crown’s Duty to Consult, a legal requirement, and interest-based engagement, which is essential to a Project’s social license. Both levels of government (‘the Crown’) have a Duty to Consult First Nations and Métis groups on any decision within their purview with the potential to affect Aboriginal or Treaty Rights. As the project progresses through the regulatory process, several provincial and federal decisions will be made that must be informed by engagement and consultation. Implementation of the Duty to Consult is guided by a combination of provincial and federal regulatory requirements and guidance documents (e.g. Section 35, The Constitution Act, 1982).
Although the Duty to Consult lies with the federal and provincial governments, the procedural aspects of the Duty to Consult are frequently delegated to the proponent to undertake. This often results in the proponent entering into engagement agreements with some First Nations and Metis governments to do studies to identify any potential impacts to rights. Companies are expected to meet with each potentially affected community to discuss engagement plans and an appropriate budget for the communities to complete the necessary meetings and studies, although the level of effort is generally commensurate with proximity to the site. The engagement plan should include opportunities to inform communities of the nature of the proposed activities, the potential impacts of a project, and proposed mitigation strategies. The purpose is to receive feedback or information on current traditional land uses and potential impacts to Treaty and Aboriginal rights. Companies are expected to work with the communities to determine the impacts of the projects and mitigation strategies.
Waste Disposal
The Resource Conservation and Recovery Act (“RCRA”) and comparable state statutes affect mineral exploration and production activities by imposing regulations on the generation, transportation, treatment, storage, disposal and cleanup of “hazardous wastes” and on the disposal of non-hazardous wastes. Under the auspices of the EPA, the individual states administer some or all of the provisions of RCRA, sometimes in conjunction with their own, more stringent requirements.
Comprehensive Environmental Response, Compensation and Liability Act
The federal Comprehensive Environmental Response, Compensation and Liability Act (“CERCLA”) imposes joint and several liability for costs of investigation and remediation and for natural resource damages, without regard to fault or the legality of the original conduct, on certain classes of persons with respect to the release into the environment of substances designated under CERCLA as hazardous substances (collectively, “Hazardous Substances”). These classes of persons or potentially responsible parties include the current and certain past owners and operators of a facility or property where there is or has been a release or threat of release of a Hazardous Substance and persons who disposed of or arranged for the disposal of the Hazardous Substances found at such a facility. CERCLA also authorizes the EPA and, in some cases, third parties, to take actions in response to threats to the public health or the environment and to seek to recover the costs of such action. We may also in the future become an owner of facilities on which Hazardous Substances have been released by previous owners or operators. We may in the future be responsible under CERCLA for all or part of the costs to clean up facilities or properties at which such substances have been released and for natural resource damages.
Air Emissions
Our operations are subject to local, state and federal regulations for the control of emissions of air pollution. Major sources of air pollutants are subject to more stringent, federally imposed permitting requirements. Administrative enforcement actions for failure to comply strictly with air pollution regulations or permits are generally resolved by payment of monetary fines and correction of any identified deficiencies. Alternatively, regulatory agencies could require us to forego construction, modification or operation of certain air emission sources. In Texas the TCEQ issues an exemption for those processes that meet the criteria for low to zero emission by issuing a permit by rule. Presently our Palangana Mine, our Hobson Processing Facility and our Goliad Project all have permits by rule covering air emissions.
Water Management
UEC commits its management team, employees and contractors to be good stewards of the water it utilizes in all parts of its operations. From exploration to restoration, water is the critical factor for ISR mining and responsibly managing that water is crucial to our business.
At all UEC’s ISR projects the ore hosted groundwater does not meet either primary or secondary drinking water standards and should only be used for industrial or agricultural use without proper treatment.
Water consumption at UEC’s ISR mining projects is primarily natural groundwater. During the recovery process, water is pumped from the ore hosted aquifer and piped to the satellite facility. The groundwater is filtered for solids, stripped of uranium, allowed to settle and then approximately 95% is reinjected or recirculated back into the same aquifer it was recovered from. This recycling process is an overwhelming advantage of ISR mining compared to other methods such as conventional or open pit.
In order to ensure appropriate water management, and to ensure our team can continuously make decisions to reduce our water usage, UEC closely monitors our water consumption. UEC is identifying ways to reduce water consumption on an ongoing basis.
Compliance with the Clean Water Act
The Clean Water Act (“CWA”) imposes restrictions and strict controls regarding the discharge of wastes, including mineral processing wastes, into waters of the U.S., a term broadly defined. Permits must be obtained to discharge pollutants into federal waters. The CWA provides for civil, criminal and administrative penalties for unauthorized discharges of hazardous substances and other pollutants. It imposes substantial potential liability for the costs of removal or remediation associated with discharges of oil or hazardous substances. State laws governing discharges to water also provide varying civil, criminal and administrative penalties and impose liabilities in the case of a discharge of petroleum or its derivatives, or other hazardous substances, into state waters. In addition, the EPA has promulgated regulations that may require us to obtain permits to discharge storm water runoff. Management believes that we are in substantial compliance with current applicable environmental laws and regulations.
GHG Emissions Management
Mining is an essential industry to enable the global transition to net-zero. Uranium mining, at the heart of UEC’s business, fuels nuclear energy, which is an essential carbon-free energy source. Beyond this, we understand that our operational activities do contribute to climate change through the release of emissions. Therefore, over the next several years, we will begin a process to understand our emissions profile, as well as identify and implement opportunities to reduce emissions, where and when possible.
In 2022, we have created an emissions inventory of all sources (mobile and stationary) for each Texas project, including tracking fuel consumption by individual source at each project. In Fiscal 2023, we expanded our emissions measurement approach to cover all sites, including Wyoming, Saskatchewan and Paraguay. Scope 1 emissions covers direct emissions from owned or controlled sources. Scope 2 emissions covers indirect emissions from the generation of purchased electricity, steam, heating and cooling consumed by the Company.
Through developing this inventory, we have been able to identify, assess and conduct a cost benefit analysis for emission reduction opportunities at UEC’s Texas projects. Such opportunities include exploring ways to upgrade our Hobson plant into a zero-emissions processing plant.
Aligned to responsibly managing our emissions in the short-term, we will look to purchase carbon offset credits for our Scope 1 and 2 emissions for our corporate sites.
Health and Safety
Health and safety is one of our top priorities. We pride ourselves on employing safe practices in all aspects of its work.
In Fiscal 2022, UEC’s Board approved an Environmental, Health and Safety Policy that provides overall objectives and guidance for our health and safety management. Supporting this Policy, at each site, UEC has a number of operational policies and practices covering radiation safety and procedures, spills and leakage reporting, equipment training and emergency response procedures. There is also a company-wide Injury and Incident Policy covered in the employee handbook that all employees are familiar with and are required to comply against.
Training for employees on health and safety protocols are essential to ensuring we employ best safety practices at all times. Although exact training hours have not been recorded for this fiscal year, UEC has provided training to staff on a variety of safety topics, including, but not limited to, the following topics:
| ● |
Annual radiation safety training for all plant and wellfield employees; |
| ● |
Bi-Annual Radiation Safety Officer training; |
| ● |
Radiation Safety Technician training; |
| ● |
Logging training; |
| ● |
First Aid/CPR training every two years; |
| ● |
Rig Safety/Inspections training; and |
| ● |
Annual DOT Training/HazMat training. |
UEC’s health and safety practices are developed to ensure that all regulatory requirements are met. Across all of our sites, our employees are required to report all injuries to their supervisor. On an annual basis, all reports are analyzed and tracked as required by the Occupational Health and Safety Association (“OSHA”). Given the nature of UEC’s specialized industry, there are site-specific emergency procedures in place that identify the steps employees should take in the event of a health and safety emergency.
Competition
The uranium industry is highly competitive, and our competition includes larger, more established companies with longer operating histories that not only explore for and produce uranium but also market uranium and other products on a regional, national or worldwide basis. Due to their greater financial and technical resources, we may not be able to acquire additional uranium projects in a competitive bidding process involving such companies. Additionally, these larger companies have greater resources to continue with their operations during periods of depressed market conditions.
The global titanium market is highly competitive, with the top six producers accounting for approximately 60% of the world’s production capacity according to TZ Minerals International Pty. Ltd. Competition is based on a number of factors, such as price, product quality and service. Among our competitors are companies that are vertically-integrated (those that have their own raw material resources).
Research and Development Activities
No research and development expenditures have been incurred, either on our account or sponsored by customers, for our three most recently completed fiscal years.
Employees
Amir Adnani is our President and Chief Executive Officer and, effective October 29, 2015, Pat Obara was appointed our Chief Financial Officer. These individuals are primarily responsible for all our day-to-day operations. Effective September 8, 2014, Scott Melbye was appointed our Executive Vice President. Other services are provided by outsourcing and consulting and special purpose contracts. As of July 31, 2023, we had 83 persons employed on a full-time basis and 9 individuals providing services on a contractual basis.
Human Capital
As of July 31, 2023, our employee population consisted of 83 individuals working for us and our consolidated subsidiaries, 43 of whom were located in the United States, 25 in Canada and 15 in Paraguay. Our Company is committed to attracting and retaining talented and experienced individuals to manage and support our operations. We engage in a variety of learning and development opportunities with our employees, including ongoing training, continuing education courses, workshops and seminars and membership in professional organizations relating to employees’ projects areas of expertise. We strive to fill employment openings through internal promotions or transfers of qualified employees, as appropriate.
Available Information
The Company’s website address is www.uraniumenergy.com and our annual reports on Form 10-K and quarterly reports on Form 10-Q, and amendments to such reports, are available free of charge on our website as soon as reasonably practicable after such materials are filed or furnished electronically with the SEC. These same reports, as well as our current reports on Form 8-K, and amendments to those reports, filed or furnished electronically with the SEC are available for review at the SEC’s website at www.sec.gov. Printed copies of the foregoing materials are available free of charge upon written request by email at info@uraniumenergy.com. Additional information about the Company can be found on our website, however, such information is neither incorporated by reference nor included as part of this or any other report or information filed with or furnished to the SEC.
In addition to the information contained in this Form 10-K Annual Report, we have identified the following material risks and uncertainties which reflect our outlook and conditions known to us as of the date of this Annual Report. These material risks and uncertainties should be carefully reviewed by our stockholders and any potential investors in evaluating the Company, our business and the market value of our common stock. Furthermore, any one of these material risks and uncertainties has the potential to cause actual results, performance, achievements or events to be materially different from any future results, performance, achievements or events implied, suggested or expressed by any forward-looking statements made by us or by persons acting on our behalf. Refer to “Cautionary Note Regarding Forward-looking Statements”.
There is no assurance that we will be successful in preventing the material adverse effects that any one or more of the following material risks and uncertainties may cause on our business, prospects, financial condition and operating results, which may result in a significant decrease in the market price of our common stock. Furthermore, there is no assurance that these material risks and uncertainties represent a complete list of the material risks and uncertainties facing us. There may be additional risks and uncertainties of a material nature that, as of the date of this Annual Report, we are unaware of or that we consider immaterial that may become material in the future, any one or more of which may result in a material adverse effect on us. You could lose all or a significant portion of your investment due to any one of these material risks and uncertainties.
Risks Related to Our Company and Business
Evaluating our future performance may be difficult since we have a limited financial and operating history, with significant negative operating cash flow and an accumulated deficit to date. Our long-term success will depend ultimately on our ability to achieve and maintain profitability and to develop positive cash flow from our mining activities.
As more fully described under Item 1. Business herein, Uranium Energy Corp. was incorporated under the laws of the State of Nevada on May 16, 2003 and, since 2004, we have been engaged in uranium mining and related activities, including exploration, pre-extraction, extraction and processing, on projects located in the United States, Canada and the Republic of Paraguay. In November 2010, we commenced uranium extraction for the first time at our Palangana Mine utilizing ISR methods and processed those materials at our Hobson Processing Facility into drums of U3O8. We also hold uranium projects in various stages of exploration and pre-extraction in the States of Arizona, Colorado, New Mexico, Texas and Wyoming, in Canada and the Republic of Paraguay. Since we completed the acquisition of our Alto Paraná Project located in the Republic of Paraguay in July 2017, we are also involved in mining and related activities, including exploration, pre-extraction, extraction and processing, of titanium minerals.
As more fully described under “Liquidity and Capital Resources” of Item 7. Management’s Discussion and Analysis of Financial Condition and Results of Operations herein, we have a history of significant negative cash flow and net losses, with an accumulated deficit balance of $289.7 million as at July 31, 2023. Historically, we have been reliant primarily on equity financings from the sale of our common stock and on debt financing in order to fund our operations. Although we generated revenues from sales of U3O8 we extracted during Fiscal 2015, Fiscal 2013 and Fiscal 2012 of $3.1 million, $9.0 million and $13.8 million, respectively, and generated revenues from sales of purchased uranium inventory and toll processing services totaling $164.4 million during Fiscal 2023, we have yet to achieve consistent profitability or develop consistent positive cash flow from our operations, and we do not expect to achieve consistent profitability or develop consistent positive cash flow from operations in the near term. As a result of our limited financial and operating history, including our significant negative cash flow from operations and net losses to date, it may be difficult to evaluate our future performance.
As at July 31, 2023, we had a working capital (current assets less current liabilities) of $43,011 including cash and cash equivalents of $ 45,614 million and uranium inventory holdings of $6,207. Subsequent to July 31, 2023, we received additional cash proceeds of $36.2 million under our at-the-market offering. We believe that our existing cash resources and, if necessary, cash generated from the sale of the Company’s liquid assets, will provide sufficient funds to carry out our planned operations for 12 months from the date of this Annual Report. Our continuation as a going concern for a period beyond those 12 months will be dependent upon our ability to obtain adequate additional financing, as our operations are capital intensive and future capital expenditures are expected to be substantial. Our continued operations, including the recoverability of the carrying values of our assets, are dependent ultimately on our ability to achieve and maintain profitability and positive cash flow from our operations.
Our reliance on equity and debt financings is expected to continue for the foreseeable future, and their availability whenever such additional financing is required will be dependent on many factors beyond our control including, but not limited to, the market price of uranium, the continuing public support of nuclear power as a viable source of electrical generation, the volatility in the global financial markets affecting our stock price and the status of the worldwide economy, any one of which may cause significant challenges in our ability to access additional financing, including access to the equity and credit markets. We may also be required to seek other forms of financing, such as asset divestitures or joint venture arrangements, to continue advancing our projects which would depend entirely on finding a suitable third party willing to enter into such an arrangement, typically involving an assignment of a percentage interest in the mineral project.
Our long-term success, including the recoverability of the carrying values of our assets and our ability to acquire additional uranium projects and continue with exploration and pre-extraction activities and mining activities on our existing uranium projects, will depend ultimately on our ability to achieve and maintain profitability and positive cash flow from our operations by establishing ore bodies that contain commercially recoverable uranium and to develop these into profitable mining activities. The economic viability of our mining activities, including the expected duration and profitability of our ISR Mines and of any future satellite ISR mines, such as our Burke Hollow and Goliad Projects located within the South Texas Uranium Belt, our Christensen Ranch Mine and Reno Creek Project located in the Powder River Basin, Wyoming, and our projects in Canada and in the Republic of Paraguay, have many risks and uncertainties. These include, but are not limited to: (i) a significant, prolonged decrease in the market price of uranium and titanium minerals; (ii) difficulty in marketing and/or selling uranium concentrates; (iii) significantly higher than expected capital costs to construct a mine and/or processing plant; (iv) significantly higher than expected extraction costs; (v) significantly lower than expected mineral extraction; (vi) significant delays, reductions or stoppages of uranium extraction activities; and (vii) the introduction of significantly more stringent regulatory laws and regulations. Our mining activities may change as a result of any one or more of these risks and uncertainties and there is no assurance that any ore body that we extract mineralized materials from will result in achieving and maintaining profitability and developing positive cash flow.
Our operations are capital intensive, and we will require significant additional financing to acquire additional mineral projects and continue with our exploration and pre-extraction activities on our existing projects.
Our operations are capital intensive and future capital expenditures are expected to be substantial. We will require significant additional financing to fund our operations, including acquiring additional mineral projects and continuing with our exploration and pre-extraction activities which include assaying, drilling, geological and geochemical analysis and mine construction costs. In the absence of such additional financing we would not be able to fund our operations or continue with our exploration and pre-extraction activities, which may result in delays, curtailment or abandonment of any one or all of our projects.
Our uranium extraction and sales history is limited. Our ability to generate revenue is subject to a number of factors, any one or more of which may adversely affect our financial condition and operating results.
We have a limited history of uranium extraction and generating revenue. In November 2010, we commenced uranium extraction at our Palangana Mine, which has been our sole source of revenues from the sales of produced U3O8 during Fiscal 2015, Fiscal 2013 and Fiscal 2012, with no revenues from sales of produced U3O8 during other fiscal years.
During Fiscal 2023, we continued to operate our ISR Mines at a reduced pace. This strategy has included the deferral of major pre-extraction expenditures and remaining in a state of operational readiness in anticipation of a recovery in uranium prices. Our ability to generate revenue from our Palangana and recently acquired Christensen Ranch Mines is subject to a number of factors which include, but are not limited to: (i) a significant, prolonged decrease in the market price of uranium; (ii) difficulty in marketing and/or selling uranium concentrates; (iii) significantly higher than expected extraction costs; (iv) significantly lower than expected uranium extraction; (v) significant delays, reductions or stoppages of uranium extraction activities; and (vi) the introduction of significantly more stringent regulatory laws and regulations. Furthermore, continued mining activities at our ISR Mines will eventually deplete the mines or cause such activities to become uneconomical, and if we are unable to directly acquire or develop existing uranium projects, such as our Moore Ranch, Reno Creek, Burke Hollow and Goliad Projects, into additional uranium mines from which we can commence uranium extraction, it will negatively impact our ability to generate revenues. Any one or more of these occurrences may adversely affect our financial condition and operating results.
Exploration and pre-extraction programs and mining activities are inherently subject to numerous significant risks and uncertainties, and actual results may differ significantly from expectations or anticipated amounts. Furthermore, exploration programs conducted on our projects may not result in the establishment of ore bodies that contain commercially recoverable uranium.
Exploration and pre-extraction programs and mining activities are inherently subject to numerous significant risks and uncertainties, with many beyond our control and including, but not limited to: (i) unanticipated ground and water conditions and adverse claims to water rights; (ii) unusual or unexpected geological formations; (iii) metallurgical and other processing problems; (iv) the occurrence of unusual weather or operating conditions and other force majeure events; (v) lower than expected ore grades; (vi) industrial accidents; (vii) delays in the receipt of or failure to receive necessary government permits; (viii) delays in transportation; (ix) availability of contractors and labor; (x) government permit restrictions and regulation restrictions; (xi) unavailability of materials and equipment; and (xii) the failure of equipment or processes to operate in accordance with specifications or expectations. These risks and uncertainties could result in: (i) delays, reductions or stoppages in our mining activities; (ii) increased capital and/or extraction costs; (iii) damage to, or destruction of, our mineral projects, extraction facilities or other properties; (iv) personal injuries; (v) environmental damage; (vi) monetary losses; and (vii) legal claims.
Success in mineral exploration is dependent on many factors including, without limitation, the experience and capabilities of a company’s management, the availability of geological expertise and the availability of sufficient funds to conduct the exploration program. Even if an exploration program is successful and commercially recoverable material is established, it may take a number of years from the initial phases of drilling and identification of the mineralization until extraction is possible, during which time the economic feasibility of extraction may change such that the material ceases to be economically recoverable. Exploration is frequently non-productive due, for example, to poor exploration results or the inability to establish ore bodies that contain commercially recoverable material, in which case the project may be abandoned and written-off. Furthermore, we will not be able to benefit from our exploration efforts and recover the expenditures that we incur on our exploration programs if we do not establish ore bodies that contain commercially recoverable material and develop these projects into profitable mining activities, and there is no assurance that we will be successful in doing so for any of our projects.
Whether an ore body contains commercially recoverable material depends on many factors including, without limitation: (i) the particular attributes, including material changes to those attributes, of the ore body such as size, grade, recovery rates and proximity to infrastructure; (ii) the market price of uranium, which may be volatile; and (iii) government regulations and regulatory requirements including, without limitation, those relating to environmental protection, permitting and land use, taxes, land tenure and transportation.
We have not established proven or probable reserves through the completion of a “final” or “bankable” feasibility study for any of our projects, including our ISR Mines. Furthermore, we have no plans to establish proven or probable reserves for any of our uranium projects for which we plan on utilizing ISR mining, such as our ISR Mines. Since we commenced extraction of mineralized materials from our ISR Mines without having established proven or probable reserves, it may result in our mining activities at our ISR Mines, and at any future projects for which proven or probable reserves are not established, being inherently riskier than other mining activities for which proven or probable reserves have been established.
We have established the existence of mineralized materials for certain of our projects, including our ISR Mines. We have not established proven or probable reserves, as defined by the SEC, through the completion of a “final” or “bankable” feasibility study for any of our projects, including our ISR Mines. Furthermore, we have no plans to establish proven or probable reserves for any of our projects for which we plan on utilizing ISR mining. Since we commenced the extraction of mineralized materials at our ISR Mines without having established proven or probable reserves, there may be greater inherent uncertainty as to whether or not any mineralized material can be economically extracted as originally planned and anticipated. Any mineralized materials established or extracted from our ISR Mines should not in any way be associated with having established or produced from proven or probable reserves.
On October 31, 2018, the SEC adopted the Modernization of Property Disclosures for Mining Registrants (again, the New Rule), introducing significant changes to the existing mining disclosure framework to better align it with international industry and regulatory practice, including NI 43-101. The New Rule became effective as of February 25, 2019, and issuers are required to comply with the New Rule as of the annual report for their first fiscal year beginning on or after January 1, 2021, and earlier in certain circumstances. The Company believes that it is presently in compliance with the New Rule.
Since we are in the Exploration Stage, pre-production expenditures including those related to pre-extraction activities are expensed as incurred, the effects of which may result in our consolidated financial statements not being directly comparable to the financial statements of companies in the Production Stage.
Despite the fact that we commenced uranium extraction at our ISR Mines, we remain in the Exploration Stage (as defined by the SEC) and will continue to remain in the Exploration Stage until such time as proven or probable reserves have been established, which may never occur. We prepare our consolidated financial statements in accordance with United States generally accepted accounting principles (“U.S. GAAP”) under which acquisition costs of mineral rights are initially capitalized as incurred while pre-production expenditures are expensed as incurred until such time as we exit the Exploration Stage. Expenditures relating to exploration activities are expensed as incurred and expenditures relating to pre-extraction activities are expensed as incurred until such time as proven or probable reserves are established for that uranium project, after which subsequent expenditures relating to mine development activities for that particular project are capitalized as incurred.
We have neither established nor have any plans to establish proven or probable reserves for our uranium projects for which we plan on utilizing ISR mining. Companies in the Production Stage, (as defined by the SEC), having established proven and probable reserves and exited the Exploration Stage, typically capitalize expenditures relating to ongoing development activities, with corresponding depletion calculated over proven and probable reserves using the units-of-production method and allocated to inventory and, as that inventory is sold, to cost of goods sold. As we are in the Exploration Stage, it has resulted in us reporting larger losses than if we had been in the Production Stage due to the expensing, instead of capitalization, of expenditures relating to ongoing processing facility and mine pre-extraction activities. Additionally, there would be no corresponding amortization allocated to our future reporting periods since those costs would have been expensed previously, resulting in both lower inventory costs and cost of goods sold and results of operations with higher gross profits and lower losses than if we had been in the Production Stage. Any capitalized costs, such as acquisition costs of mineral rights, are depleted over the estimated extraction life using the straight-line method. As a result, our consolidated financial statements may not be directly comparable to the financial statements of companies in the Production Stage.
Estimated costs of future reclamation obligations may be significantly exceeded by actual costs incurred in the future. Furthermore, only a portion of the financial assurance required for the future reclamation obligations has been funded.
We are responsible for certain remediation and decommissioning activities in the future, primarily for our Hobson and Irigaray Processing Facilities, our ISR Mines and our recently acquired Roughrider Project, and have recorded a liability of $18.7 million on our balance sheet at July 31, 2023, to recognize the present value of the estimated costs of such reclamation obligations. Should the actual costs to fulfill these future reclamation obligations materially exceed these estimated costs, it may have an adverse effect on our financial condition and operating results, including not having the financial resources required to fulfill such obligations when required to do so.
During Fiscal 2015, we secured $5.6 million of surety bonds as an alternate source of financial assurance for the estimated costs of the reclamation obligations of our Hobson Processing Facility and Palangana Mine, of which we have $1.7 million funded and held as restricted cash for collateral purposes as required by the surety. In connection with the U1A acquisition (the “U1A Acquisition”), we assumed $13.7 million of restricted cash as surety bond collateral for total estimated reclamation costs of $18.6 million for the Christensen Ranch Mine and Irigaray Processing Facility. During Fiscal 2022, $8.6 million of surety bond collateral related to the Christensen Ranch Mine and Irigaray Processing Facility was released. We may be required at any time to fund the remaining $17.4 million or any portion thereof for a number of reasons including, but not limited to, the following: (i) the terms of the surety bonds are amended, such as an increase in collateral requirements; (ii) we are in default with the terms of the surety bonds; (iii) the surety bonds are no longer acceptable as an alternate source of financial assurance by the regulatory authorities; or (iv) the surety encounters financial difficulties. Should any one or more of these events occur in the future, we may not have the financial resources to fund the remaining amount or any portion thereof when required to do so.
We cannot provide any assurance that our Physical Uranium Program involving the strategic acquisition of physical uranium will be successful, which may have an adverse effect on our results of operations.
We have used or allocated a large portion of our cash on hand in order to fund the acquisition of drummed uranium. This strategy will be subject to a number of risks and there is no assurance that the strategy will be successful. Future deliveries are subject to performance by other parties and there is a possibility of default by those parties, thus depriving us of potential benefits.
Due to the fluctuation of uranium prices, the price of uranium will fluctuate and we will be subject to losses should we ultimately determine to sell the uranium at prices lower than the acquisition cost. The primary risks associated with physical uranium will be the normal risks associated with supply and demand fundamentals affecting price movements.
We may be required to sell a portion or all of the physical uranium accumulated to fund our operations should other forms of financing not be available to meet our capital requirements.
Since there is no public market for uranium, selling the uranium may take extended periods of time and suitable purchasers may be difficult to find, which could have a material adverse effect on our financial condition and may have a material adverse effect on our securities.
There is no public market for the sale of uranium, although there are several trading and brokerage houses that serve the industry with bid and ask data as well as locations and quantities. The uranium futures market on the New York Mercantile Exchange does not provide for physical delivery of uranium, only cash on settlement, and that trading forum does not offer a formal market but rather facilitates the introduction of buyers to sellers.
The pool of potential purchasers and sellers is limited, and each transaction may require the negotiation of specific provisions. Accordingly, a sale may take several weeks or months to complete. If we determine to sell any physical uranium that we have acquired, we may likewise experience difficulties in finding purchasers that are able to accept a material quantity of physical uranium at a price and at a location that is compatible with our interests. The inability to sell on a timely basis in sufficient quantities and at a desired price and location could have a material adverse effect on our securities.
As part of our Physical Uranium Program, we have entered into commitments to purchase U3O8 and may purchase additional quantities. There is no certainty that any future purchases contemplated by us will be completed.
Storage arrangements, including the extension of storage arrangements, along with credit and operational risks of uranium storage facilities, may result in the loss or damage of our physical uranium which may not be covered by insurance or indemnity provisions and could have a material adverse effect on our financial condition.
Currently, the uranium we purchased will be stored at the licensed uranium conversion facility of ConverDyn owned by Honeywell. There can be no assurance that storage arrangements that have been negotiated will be extended indefinitely, forcing actions or costs not currently contemplated. Failure to negotiate commercially reasonable storage terms for a subsequent storage period with ConverDyn may have a material adverse effect on our financial condition.
By holding our uranium inventory at the ConverDyn conversion facility we are exposed to the credit and operational risks of the facility. There is no guarantee that we can fully recover all of our investment in uranium held with the facility in the event of a disruptive event. Failure to recover all uranium holdings could have a material adverse effect on our financial condition. Any loss or damage of the uranium may not be fully covered or absolved by contractual arrangements with ConverDyn or our insurance arrangements, and we may be financially and legally responsible for losses and/or damages not covered by indemnity provisions or insurance. Such responsibility could have a material adverse effect on our financial condition.
The uranium industry is subject to influential political and regulatory factors which could have a material adverse effect on our business and financial condition.
The international uranium industry, including the supply of uranium concentrates, is relatively small, competitive and heavily regulated. Worldwide demand for uranium is directly tied to the demand for electricity produced by the nuclear power industry, which is also subject to extensive government regulation and policies. In addition, the international marketing and trade of uranium is subject to political changes in governmental policies, regulatory requirements and international trade restrictions (including trade agreements, customs, duties and/or taxes). International agreements, governmental policies and trade restrictions are beyond our control. Changes in regulatory requirements, customs, duties or taxes may affect the availability of uranium, which could have a material adverse effect on our business and financial condition.
We do not insure against all of the risks we face in our operations.
In general, where coverage is available and not prohibitively expensive relative to the perceived risk, we will maintain insurance against such risk, subject to exclusions and limitations. We currently maintain insurance against certain risks, including securities and general commercial liability claims and certain physical assets used in our operations, subject to exclusions and limitations, however, we do not maintain insurance to cover all of the potential risks and hazards associated with our operations. We may be subject to liability for environmental, pollution or other hazards associated with our exploration, pre-extraction and extraction activities, which we may not be insured against, which may exceed the limits of our insurance coverage or which we may elect not to insure against because of high premiums or other reasons. Furthermore, we cannot provide assurance that any insurance coverage we currently have will continue to be available at reasonable premiums or that such insurance will adequately cover any resulting liability.
Acquisitions that we may make from time to time could have an adverse impact on us.
From time to time we examine opportunities to acquire additional mining assets and businesses. Any acquisition that we may choose to complete may be of a significant size, may change the scale of our business and operations and may expose us to new geographic, political, operating, financial and geological risks. Our success in our acquisition activities depends on our ability to identify suitable acquisition candidates, negotiate acceptable terms for any such acquisition and integrate the acquired operations successfully with those of our Company. Any acquisitions would be accompanied by risks which could have a material adverse effect on our business. For example: (i) there may be a significant change in commodity prices after we have committed to complete the transaction and established the purchase price or exchange ratio; (ii) a material ore body may prove to be below expectations; (iii) we may have difficulty integrating and assimilating the operations and personnel of any acquired companies, realizing anticipated synergies and maximizing the financial and strategic position of the combined enterprise and maintaining uniform standards, policies and controls across the organization; (iv) the integration of the acquired business or assets may disrupt our ongoing business and our relationships with employees, customers, suppliers and contractors; and (v) the acquired business or assets may have unknown liabilities which may be significant. In the event that we choose to raise debt capital to finance any such acquisition, our leverage will be increased. If we choose to use equity as consideration for such acquisition, existing shareholders may suffer dilution. Alternatively, we may choose to finance any such acquisition with our existing resources. There can be no assurance that we would be successful in overcoming these risks or any other problems encountered in connection with such acquisitions.
The uranium and titanium industries are subject to numerous stringent laws, regulations and standards, including environmental protection laws and regulations. If any changes occur that would make these laws, regulations and standards more stringent, it may require capital outlays in excess of those anticipated or cause substantial delays, which would have a material adverse effect on our operations.
Uranium and titanium exploration and pre-extraction programs and mining activities are subject to numerous stringent laws, regulations and standards at the federal, state and local levels governing permitting, pre-extraction, extraction, exports, taxes, labor standards, occupational health, waste disposal, protection and reclamation of the environment, protection of endangered and protected species, mine safety, hazardous substances and other matters. Our compliance with these requirements requires significant financial and personnel resources.
The laws, regulations, policies or current administrative practices of any government body, organization or regulatory agency in the United States, or any other applicable jurisdiction, may change or be applied or interpreted in a manner which may also have a material adverse effect on our operations. The actions, policies or regulations, or changes thereto, of any government body or regulatory agency or special interest group may also have a material adverse effect on our operations.
Uranium and titanium exploration and pre-extraction programs and mining activities are subject to stringent environmental protection laws and regulations at the federal, state and local levels. These laws and regulations include permitting and reclamation requirements, regulate emissions, water storage and discharges and disposal of hazardous wastes. Uranium mining activities are also subject to laws and regulations which seek to maintain health and safety standards by regulating the design and use of mining methods. Various permits from governmental and regulatory bodies are required for mining to commence or continue, and no assurance can be provided that required permits will be received in a timely manner.
Our compliance costs, including the posting of surety bonds associated with environmental protection laws and regulations and health and safety standards, have been significant to date, and are expected to increase in scale and scope as we expand our operations in the future. Furthermore, environmental protection laws and regulations may become more stringent in the future, and compliance with such changes may require capital outlays in excess of those anticipated or cause substantial delays, which would have a material adverse effect on our operations.
While the very heart of our business – uranium extraction, which is the fuel for carbon-free, emission-free baseload nuclear power – and our recycling programs, help address global climate change and reduce air pollution, the world’s focus on addressing climate change will require the Company to continue to conduct all of its operations in a manner that minimizes the use of resources, including enhancing energy efficiency and reducing our reliance on fossil fuels, in order to continue to minimize air emissions at our facilities, which can also increase mine and facility, construction, development and operating costs. Regulatory and environmental standards may also change over time to address global climate change, which could further increase these costs.
To the best of our knowledge, our operations are in compliance, in all material respects, with all applicable laws, regulations and standards. If we become subject to liability for any violations, we may not be able or may elect not to insure against such risk due to high insurance premiums or other reasons. Where coverage is available and not prohibitively expensive relative to the perceived risk, we will maintain insurance against such risk, subject to exclusions and limitations. However, we cannot provide any assurance that such insurance will continue to be available at reasonable premiums or that such insurance will be adequate to cover any resulting liability.
We may not be able to obtain, maintain or amend rights, authorizations, licenses, permits or consents required for our operations.
Our exploration and mining activities are dependent upon the grant of appropriate rights, authorizations, licences, permits and consents, as well as continuation and amendment of these rights, authorizations, licences, permits and consents already granted, which may be granted for a defined period of time, or may not be granted or may be withdrawn or made subject to limitations. There can be no assurance that all necessary rights, authorizations, licences, permits and consents will be granted to us, or that authorizations, licences, permits and consents already granted will not be withdrawn or made subject to limitations.
Major nuclear and global market incidents may have adverse effects on the nuclear and uranium industries.
The nuclear incident that occurred in Japan in March 2011 had significant and adverse effects on both the nuclear and uranium industries. If another nuclear incident were to occur, it may have further adverse effects for both industries. Public opinion of nuclear power as a source of electrical generation may be adversely affected, which may cause governments of certain countries to further increase regulation for the nuclear industry, reduce or abandon current reliance on nuclear power or reduce or abandon existing plans for nuclear power expansion. Any one of these occurrences has the potential to reduce current and/or future demand for nuclear power, resulting in lower demand for uranium and lower market prices for uranium, adversely affecting the operations and prospects of our Company. Furthermore, the growth of the nuclear and uranium industries is dependent on continuing and growing public support of nuclear power as a viable source of electrical generation.
In March 2020 the COVID-19 pandemic resulted in a black swan event impacting about 50% of the world’s uranium production and has accelerated the market rebalancing. In 2020 significant production cuts were announced in response to the global COVID-19 pandemic, including uranium facilities in Canada, Kazakhstan and Namibia. In 2023, although most production impacted by COVID-19 has returned to an operating status, some production has continued to be affected. It is unknown at this time exactly how long all the impacts will last or how much uranium production will ultimately be removed from the market as a result of the COVID-19 pandemic. The Company also believes that a large degree of uncertainty exists in the market, primarily due to the size of mobile uranium inventories, transportation issues, premature reactor shutdowns in the U.S. and the length of time of any uranium mine, conversion or enrichment facility shutdowns.
The marketability of uranium concentrates will be affected by numerous factors beyond our control which may result in our inability to receive an adequate return on our invested capital.
The marketability of uranium concentrates extracted by us will be affected by numerous factors beyond our control. These factors include: (i) macroeconomic factors; (ii) fluctuations in the market price of uranium; (iii) governmental regulations; (iv) land tenure and use; (v) regulations concerning the importing and exporting of uranium; and (vi) environmental protection regulations. The future effects of these factors cannot be accurately predicted, but any one or a combination of these factors may result in our inability to receive an adequate return on our invested capital.
The titanium industry is affected by global economic factors, including risks associated with volatile economic conditions, and the market for many titanium products is cyclical and volatile, and we may experience depressed market conditions for such products.
Titanium is used in many “quality of life” products for which demand historically has been linked to global, regional and local GDP and discretionary spending, which can be negatively impacted by regional and world events or economic conditions. Such events are likely to cause a decrease in demand for products and, as a result, may have an adverse effect on our results of operations and financial condition. The timing and extent of any changes to currently prevailing market conditions is uncertain, and supply and demand may be unbalanced at any time. Uncertain economic conditions and market instability make it particularly difficult for us to forecast demand trends. As a consequence, we may not be able to accurately predict future economic conditions or the effect of such conditions on our financial condition or results of operations. We can give no assurances as to the timing, extent or duration of the current or future economic cycles impacting the industries in which we operate.
Historically, the market for large volume titanium applications, including coatings, paper and plastics, has experienced alternating periods of tight supply, causing prices and margins to increase, followed by periods of lower capacity utilization, resulting in declining prices and margins. The volatility this market experiences occurs as a result of significant changes in the demand for products as a consequence of global economic activity and changes in customers’ requirements. The supply-demand balance is also impacted by capacity additions or reductions that result in changes of utilization rates. In addition, titanium margins are impacted by significant changes in major input costs, such as energy and feedstock. Demand for titanium depends in part on the housing and construction industries. These industries are cyclical in nature and have historically been impacted by downturns in the economy. In addition, pricing may affect customer inventory levels as customers may from time to time accelerate purchases of titanium in advance of anticipated price increases or defer purchases of titanium in advance of anticipated price decreases. The cyclicality and volatility of the titanium industry results in significant fluctuations in profits and cash flow from period to period and over the business cycle.
The uranium industry is highly competitive and we may not be successful in acquiring additional projects.
The uranium industry is highly competitive, and our competition includes larger, more established companies with longer operating histories that not only explore for and produce uranium, but also market uranium and other products on a regional, national or worldwide basis. Due to their greater financial and technical resources, we may not be able to acquire additional uranium projects in a competitive bidding process involving such companies. Additionally, these larger companies have greater resources to continue with their operations during periods of depressed market conditions.
The titanium industry is concentrated and highly competitive, and we may not be able to compete effectively with our competitors that have greater financial resources or those that are vertically integrated, which could have a material adverse effect on our business, results of operations and financial condition.
The global titanium market is highly competitive, with the top six producers accounting for approximately 60% of the world’s production capacity. Competition is based on a number of factors, such as price, product quality and service. Among our competitors are companies that are vertically-integrated (those that have their own raw material resources). Changes in the competitive landscape could make it difficult for us to retain our competitive position in various products and markets throughout the world. Our competitors with their own raw material resources may have a competitive advantage during periods of higher raw material prices. In addition, some of the companies with whom we compete may be able to produce products more economically than we can. Furthermore, some of our competitors have greater financial resources, which may enable them to invest significant capital into their businesses, including expenditures for research and development.
We hold mineral rights in foreign jurisdictions which could be subject to additional risks due to political, taxation, economic and cultural factors.
We hold certain mineral rights located in the Republic of Paraguay through Piedra Rica Mining S.A., Transandes Paraguay S.A., Trier S.A. and Metalicos Y No Metalicos Paraguay S.R.L., which are incorporated in Paraguay. Operations in foreign jurisdictions outside of the United States and Canada, especially in developing countries, may be subject to additional risks as they may have different political, regulatory, taxation, economic and cultural environments that may adversely affect the value or continued viability of our rights. These additional risks include, but are not limited to: (i) changes in governments or senior government officials; (ii) changes to existing laws or policies on foreign investments, environmental protection, mining and ownership of mineral interests; (iii) renegotiation, cancellation, expropriation and nationalization of existing permits or contracts; (iv) foreign currency controls and fluctuations; and (v) civil disturbances, terrorism and war.
In the event of a dispute arising at our foreign operations in Paraguay, we may be subject to the exclusive jurisdiction of foreign courts or may not be successful in subjecting foreign persons to the jurisdiction of the courts in the United States or Canada. We may also be hindered or prevented from enforcing our rights with respect to a government entity or instrumentality because of the doctrine of sovereign immunity. Any adverse or arbitrary decision of a foreign court may have a material and adverse impact on our business, prospects, financial condition and results of operations.
The title to our mineral property interests may be challenged.
Although we have taken reasonable measures to ensure proper title to our interests in mineral properties and other assets, there is no guarantee that the title to any of such interests will not be challenged. No assurance can be given that we will be able to secure the grant or the renewal of existing mineral rights and tenures on terms satisfactory to us, or that governments in the jurisdictions in which we operate will not revoke or significantly alter such rights or tenures or that such rights or tenures will not be challenged or impugned by third parties, including local governments, aboriginal peoples or other claimants. The Company has had communications and filings with the MOPC, whereby the MOPC is taking the position that certain concessions forming part of the Company’s Yuty and Alto Paraná Projects are not eligible for extension as to exploration or continuation to exploitation in their current stages. While we remain fully committed to our development path forward in Paraguay, we have filed certain applications and appeals in Paraguay to reverse the MOPC’s position in order to protect the Company’s continuing rights in those concessions. Our mineral properties may be subject to prior unregistered agreements, transfers or claims, and title may be affected by, among other things, undetected defects. A successful challenge to the precise area and location of our claims could result in us being unable to operate on our properties as permitted or being unable to enforce our rights with respect to our properties.
Due to the nature of our business, we may be subject to legal proceedings which may divert management’s time and attention from our business and result in substantial damage awards.
Due to the nature of our business, we may be subject to numerous regulatory investigations, securities claims, civil claims, lawsuits and other proceedings in the ordinary course of our business including those described under Item 3. Legal Proceedings herein. The outcome of these lawsuits is uncertain and subject to inherent uncertainties, and the actual costs to be incurred will depend upon many unknown factors. We may be forced to expend significant resources in the defense of these suits, and we may not prevail. Defending against these and other lawsuits in the future may not only require us to incur significant legal fees and expenses, but may become time-consuming for us and detract from our ability to fully focus our internal resources on our business activities. The results of any legal proceeding cannot be predicted with certainty due to the uncertainty inherent in litigation, the difficulty of predicting decisions of regulators, judges and juries and the possibility that decisions may be reversed on appeal. There can be no assurances that these matters will not have a material adverse effect on our business, financial position or operating results.
We depend on certain key personnel, and our success will depend on our continued ability to retain and attract such qualified personnel.
Our success is dependent on the efforts, abilities and continued service of certain senior officers and key employees and consultants. A number of our key employees and consultants have significant experience in the uranium industry. A loss of service from any one of these individuals may adversely affect our operations, and we may have difficulty or may not be able to locate and hire a suitable replacement.
Certain directors and officers may be subject to conflicts of interest.
The majority of our directors and officers are involved in other business ventures including similar capacities with other private or publicly-traded companies. Such individuals may have significant responsibilities to these other business ventures, including consulting relationships, which may require significant amounts of their available time. Conflicts of interest may include decisions on how much time to devote to our business affairs and what business opportunities should be presented to us. Our Code of Conduct and Ethics provides for guidance on conflicts of interest.
The laws of the State of Nevada and our Articles of Incorporation may protect our directors and officers from certain types of lawsuits.
The laws of the State of Nevada provide that our directors and officers will not be liable to our Company or to our stockholders for monetary damages for all but certain types of conduct as directors and officers. Our Bylaws provide for broad indemnification powers to all persons against all damages incurred in connection with our business to the fullest extent provided or allowed by law. These indemnification provisions may require us to use our limited assets to defend our directors and officers against claims, and may have the effect of preventing stockholders from recovering damages against our directors and officers caused by their negligence, poor judgment or other circumstances.
Several of our directors and officers are residents outside of the United States, and it may be difficult for stockholders to enforce within the United States any judgments obtained against such directors or officers.
Several of our directors and officers are nationals and/or residents of countries other than the United States, and all or a substantial portion of such persons’ assets are located outside of the United States. As a result, it may be difficult for investors to effect service of process on such directors and officers, or enforce within the United States any judgments obtained against such directors and officers, including judgments predicated upon the civil liability provisions of the securities laws of the United States or any state thereof. Consequently, stockholders may be effectively prevented from pursuing remedies against such directors and officers under United States federal securities laws. In addition, stockholders may not be able to commence an action in a Canadian court predicated upon the civil liability provisions under United States federal securities laws. The foregoing risks also apply to those experts identified in this document that are not residents of the United States.
Disclosure controls and procedures and internal control over financial reporting, no matter how well designed and operated, are designed to obtain reasonable, and not absolute, assurance as to its reliability and effectiveness.
Management’s evaluation on the effectiveness of disclosure controls and procedures is designed to ensure that information required for disclosure in our public filings is recorded, processed, summarized and reported on a timely basis to our senior management, as appropriate, to allow timely decisions regarding required disclosure. Management’s report on internal control over financial reporting is designed to provide reasonable assurance that transactions are properly authorized, assets are safeguarded against unauthorized or improper use and transactions are properly recorded and reported. However, any system of controls, no matter how well designed and operated, is based in part upon certain assumptions designed to obtain reasonable, and not absolute, assurance as to its reliability and effectiveness. Any failure to maintain effective disclosure controls and procedures in the future may result in our inability to continue meeting our reporting obligations in a timely manner, qualified audit opinions or restatements of our financial reports, any one of which may affect the market price for our common stock and our ability to access the capital markets.
Proposed and new legislation in the U.S. Congress, including changes in U.S. tax law, may adversely impact the Company and the value of shares of our common stock.
Changes to U.S. tax laws (which changes may have retroactive application) could adversely affect the Company or holders of shares of our common stock. In recent years, many changes to U.S. federal income tax laws have been proposed and made, and additional changes to U.S. federal income tax laws are likely to continue to occur in the future.
The U.S. Congress has recently passed and is currently considering numerous items of legislation which may be enacted prospectively or with retroactive effect, and which legislation could adversely impact the Company’s financial performance and the value of shares of our common stock. In particular, we understand that new legislation known as the “Build Back Better Act” has been passed by both houses of the U.S. Congress. The legislation includes, without limitation, new corporate minimum income taxes. We understand that the proposals would be effective for 2022 or later years.
In addition, the Inflation Reduction Act of 2022 was recently signed into law and includes provisions that will impact the U.S. federal income taxation of corporations. Among other items, this legislation includes provisions that will impose a minimum tax on the book income of certain large corporations and an excise tax on certain corporate stock repurchases that would be imposed on the corporation repurchasing such stock. It is unclear how this legislation will be implemented by the U.S. Department of the Treasury and the Company cannot predict how this legislation or any future changes in tax laws might affect the Company or purchasers of our common stock.
Risks Related to Our Common Stock
Historically, the market price of our common stock has been and may continue to fluctuate significantly.
On September 28, 2007, our common stock commenced trading on the NYSE American (formerly known as the American Stock Exchange, the NYSE Amex Equities Exchange and the NYSE MKT) and prior to that, traded on the OTC Bulletin Board.
The global markets have experienced significant and increased volatility in the past, and have been impacted by the effects of mass sub-prime mortgage defaults and liquidity problems of the asset-backed commercial paper market, resulting in a number of large financial institutions requiring government bailouts or filing for bankruptcy. The effects of these past events and any similar events in the future may continue to or further affect the global markets, which may directly affect the market price of our common stock and our accessibility for additional financing. Although this volatility may be unrelated to specific company performance, it can have an adverse effect on the market price of our shares which, historically, has fluctuated significantly and may continue to do so in the future.
In addition to the volatility associated with general economic trends and market conditions, the market price of our common stock could decline significantly due to the impact of any one or more events including, but not limited to, the following: (i) volatility in the uranium market; (ii) occurrence of a major nuclear incident such as the events in Japan in March 2011; (iii) changes in the outlook for the nuclear power and uranium industries; (iv) failure to meet market expectations on our exploration, pre-extraction or extraction activities, including abandonment of key uranium projects; (v) sales of a large number of our shares held by certain stockholders including institutions and insiders; (vi) downward revisions to previous estimates on us by analysts; (vii) removal from market indices; (viii) legal claims brought forth against us; and (ix) introduction of technological innovations by competitors or in competing technologies.
A prolonged decline in the market price of our common stock could affect our ability to obtain additional financing which would adversely affect our operations.
Historically, we have relied on equity financing and, more recently, on debt financing, as primary sources of financing. A prolonged decline in the market price of our common stock or a reduction in our accessibility to the global markets may result in our inability to secure additional financing which would have an adverse effect on our operations.
Additional issuances of our common stock may result in significant dilution to our existing shareholders and reduce the market value of their investment.
We are authorized to issue 750,000,000 shares of common stock of which 378,452,864 shares were issued and outstanding as of July 31, 2023. Future issuances for financings, mergers and acquisitions, exercise of stock options and share purchase warrants and for other reasons may result in significant dilution to and be issued at prices substantially below the price paid for our shares held by our existing stockholders. Significant dilution would reduce the proportionate ownership and voting power held by our existing stockholders and may result in a decrease in the market price of our shares.
We are subject to the Continued Listing Criteria of the NYSE American and our failure to satisfy these criteria may result in delisting of our common stock.
Our common stock is currently listed on the NYSE American. In order to maintain this listing, we must maintain certain share prices, financial and share distribution targets, including maintaining a minimum amount of shareholders’ equity and a minimum number of public shareholders. In addition to these objective standards, the NYSE American may delist the securities of any issuer: (i) if in its opinion, the issuer’s financial condition and/or operating results appear unsatisfactory; (ii) if it appears that the extent of public distribution or the aggregate market value of the security has become so reduced as to make continued listing on the NYSE American inadvisable; (iii) if the issuer sells or disposes of principal operating assets or ceases to be an operating company; (iv) if an issuer fails to comply with the NYSE American’s listing requirements; (v) if an issuer’s common stock sells at what the NYSE American considers a “low selling price” and the issuer fails to correct this via a reverse split of shares after notification by the NYSE American; or (vi) if any other event occurs or any condition exists which makes continued listing on the NYSE American, in its opinion, inadvisable.
If the NYSE American delists our common stock, investors may face material adverse consequences including, but not limited to, a lack of trading market for our securities, reduced liquidity, decreased analyst coverage of our securities, and an inability for us to obtain additional financing to fund our operations.
Item 1B. Unresolved Staff Comments
Not applicable
Item 2. Description of Properties
Figure 2.1 – Portfolio Overview of Significant Properties
Overview
The Company is engaged in conventional and in situ recovery (ISR) uranium extraction and recovery, along with the exploration, permitting and evaluation of uranium properties in the United States, the Republic of Paraguay, and Canada.
Summary Disclosure
Table 2.1 - Location, Ownership Interest, Operator, Stage, Mining Method, and Mineralization Style Summary
| Country |
State/Province |
Project |
Location (Latitude) |
Location (Longitude) |
Equity Interest |
Operator |
Stage |
Mining Method |
Mineralization Style |
| Uranium Projects |
|||||||||
| United States |
Wyoming |
Allemand-Ross |
43.3101 |
-105.7787 |
100% |
UEC |
Exploration Stage |
ISR |
Roll-Front |
| Antelope |
42.2263 |
-107.9095 |
100% |
UEC |
Exploration Stage |
ISR |
Roll-Front |
||
| Barge |
43.2729 |
-105.5905 |
100% |
UEC |
Exploration Stage |
ISR |
Roll-Front |
||
| Black Hills |
44.7764 |
-104.8831 |
100% |
UEC |
Exploration Stage |
ISR |
Roll-Front |
||
| Brown Ranch |
43.7377 |
-105.9684 |
100% |
UEC |
Exploration Stage |
ISR |
Roll-Front |
||
| Bull Springs |
42.1584 |
-107.6305 |
100% |
UEC |
Exploration Stage |
ISR |
Roll-Front |
||
| Central Shirley Basin |
42.3378 |
-106.4100 |
100% |
UEC |
Exploration Stage |
ISR |
Roll-Front |
||
| Charlie |
43.8274 |
-106.0594 |
100% |
UEC |
Exploration Stage |
ISR |
Roll-Front |
||
| Christensen Ranch |
43.7982 |
-106.0235 |
100% |
UEC |
Exploration Stage |
ISR |
Roll-Front |
||
| Clarkson Hills |
42.6593 |
-106.7006 |
100% |
UEC |
Exploration Stage |
ISR |
Roll-Front |
||
| Crooks Creek |
42.2867 |
-107.7660 |
100% |
UEC |
Exploration Stage |
ISR |
Roll-Front |
||
| Crook's Mountain |
42.3840 |
-107.9060 |
100% |
UEC |
Exploration Stage |
ISR |
Roll-Front |
||
| Crossroads |
43.0040 |
-105.6364 |
100% |
UEC |
Exploration Stage |
ISR |
Roll-Front |
||
| Cyclone Rim |
42.2943 |
-108.3332 |
100% |
UEC |
Exploration Stage |
ISR |
Roll-Front |
||
| East Shirley Basin |
42.3192 |
-106.1616 |
100% |
UEC |
Exploration Stage |
ISR |
Roll-Front |
||
| Gas Hills |
42.7094 |
-107.6521 |
100% |
UEC |
Exploration Stage |
ISR |
Roll-Front |
||
| Horse Creek |
42.5957 |
-106.9867 |
100% |
UEC |
Exploration Stage |
ISR |
Roll-Front |
||
| Irigaray |
43.8683 |
-106.1186 |
100% |
UEC |
Exploration Stage |
ISR |
Roll-Front |
||
| Jab/West Jab |
42.2209/42.2611 |
-108.0439/-108.1225 |
100% |
UEC |
Exploration Stage |
ISR |
Roll-Front |
||
| Ludeman |
42.9119 |
-105.6277 |
100% |
UEC |
Exploration Stage |
ISR |
Roll-Front |
||
| Moore Ranch |
43.5652 |
-105.8480 |
100% |
UEC |
Exploration Stage |
ISR |
Roll-Front |
||
| Mule Creek |
42.2118 |
-105.8143 |
100% |
UEC |
Exploration Stage |
ISR |
Roll-Front |
||
| Niles Ranch |
43.8024 |
-105.7961 |
100% |
UEC |
Exploration Stage |
ISR |
Roll-Front |
||
| Nine Mile Lake |
42.9807 |
-106.3278 |
100% |
UEC |
Exploration Stage |
ISR |
Roll-Front |
||
| Pine Ridge |
43.4591 |
-106.0725 |
100% |
UEC |
Exploration Stage |
ISR |
Roll-Front |
||
| Pine Tree U1 |
43.6173 |
-105.7860 |
100% |
UEC |
Exploration Stage |
ISR |
Roll-Front |
||
| Pumpkin Creek |
43.8163 |
-105.8955 |
100% |
UEC |
Exploration Stage |
ISR |
Roll-Front |
||
| Red Rim |
41.6502 |
-107.5755 |
100% |
UEC |
Exploration Stage |
ISR |
Roll-Front |
||
| Reno Creek |
43.6796 |
-105.7226 |
100% |
UEC |
Exploration Stage |
ISR |
Roll-Front |
||
| Ross Flats |
43.5224 |
-105.8861 |
100% |
UEC |
Exploration Stage |
ISR |
Roll-Front |
||
| Sand Creek |
42.7007 |
-105.2645 |
100% |
UEC |
Exploration Stage |
ISR |
Roll-Front |
||
| South Pine Ridge |
43.1204 |
-105.9251 |
100% |
UEC |
Exploration Stage |
ISR |
Roll-Front |
||
| South Reno Creek |
43.6440 |
-105.6199 |
100% |
UEC |
Exploration Stage |
ISR |
Roll-Front |
||
| Country |
State/Province |
Project |
Location (Latitude) |
Location (Longitude) |
Equity Interest |
Operator |
Stage |
Mining Method |
Mineralization Style |
| Uranium Projects | |||||||||
| South Sweetwater |
41.9694 |
-107.9820 |
100% |
UEC |
Exploration Stage |
ISR |
Roll-Front |
||
| Stewart Creek |
43.3124 |
-105.7342 |
100% |
UEC |
Exploration Stage |
ISR |
Roll-Front |
||
| Taylor Ranch |
43.5578 |
-106.0098 |
100% |
UEC |
Exploration Stage |
ISR |
Roll-Front |
||
| Twin Buttes |
42.2316 |
-107.7205 |
100% |
UEC |
Exploration Stage |
ISR |
Roll-Front |
||
| West Beaver Rim |
42.5967 |
-108.1568 |
100% |
UEC |
Exploration Stage |
ISR |
Roll-Front |
||
| West Crook's Creek |
42.2984 |
-107.8603 |
100% |
UEC |
Exploration Stage |
ISR |
Roll-Front |
||
| West Sweetwater |
42.1318 |
-108.0931 |
100% |
UEC |
Exploration Stage |
ISR |
Roll-Front |
||
| Texas |
Burke Hollow |
27.6756 |
-97.5176 |
100% |
UEC |
Exploration Stage |
ISR |
Roll-Front |
|
| Goliad |
28.8686 |
-97.3433 |
100% |
UEC |
Exploration Stage |
ISR |
Roll-Front |
||
| La Palangana |
28.2638 |
-98.3959 |
100% |
UEC |
Exploration Stage |
ISR |
Roll-Front |
||
| Salvo |
28.2632 |
-97.7889 |
100% |
UEC |
Exploration Stage |
ISR |
Roll-Front |
||
| Longhorn |
28.1700 |
-98.1200 |
100% |
UEC |
Exploration Stage |
ISR |
Roll-Front |
||
| Arizona |
Anderson |
34.1829 |
-113.1632 |
100% |
UEC |
Exploration Stage |
Conventional |
Tabular |
|
| Los Cuatros |
33.548 |
-112.322 |
100% |
UEC |
Exploration Stage |
Conventional |
Tabular |
||
| Workman Creek |
33.50 |
-110.57 |
100% |
UEC |
Exploration Stage |
Conventional |
Tabular |
||
| New Mexico |
C de Baca |
34.18 |
-107.15 |
100% |
UEC |
Exploration Stage |
Conventional |
Tabular |
|
| Dalton Pass |
35.40 |
-108.14 |
100% |
UEC |
Exploration Stage |
Conventional |
Tabular |
||
| Canada |
Saskatchewan |
Alexandra |
58.023 |
-109.789 |
21.05% |
Orano Canada Inc. |
Exploration Stage |
Conventional |
Unconformity Related |
| Axis Lake |
59.304 |
-106.136 |
100.00% |
UEC |
Exploration Stage |
Conventional |
Unconformity Related |
||
| Beatty River |
57.897 |
-109.542 |
32.76% |
Orano Canada Inc. |
Exploration Stage |
Conventional |
Unconformity Related |
||
| Black Lake |
59.1167 |
-105.905 |
51.43% |
UEC |
Exploration Stage |
Conventional |
Unconformity Related |
||
| Brander Lake |
58.2895 |
-109.888 |
49.10% |
Orano Canada Inc. |
Exploration Stage |
Conventional |
Unconformity Related |
||
| Candle Lake |
57.9969 |
-104.93 |
12.50% |
Denison Mines Corp. |
Exploration Stage |
Conventional |
Unconformity Related |
||
| Christie Lake |
57.8128 |
-104.86 |
82.77% |
UEC |
Exploration Stage |
Conventional |
Unconformity Related |
||
| Close Lake |
57.9729 |
-105.082 |
5.16% |
Orano Canada Inc. |
Exploration Stage |
Conventional |
Unconformity Related |
||
| Cree Extension |
57.5881 |
-105.551 |
15.05% |
Cameco Corporation |
Exploration Stage |
Conventional |
Unconformity Related |
||
| Diabase Peninsula |
57.4294 |
-106.913 |
100.00% |
UEC |
Exploration Stage |
Conventional |
Unconformity Related |
||
| Erica |
58.1465 |
-109.731 |
49.10% |
Orano Canada Inc. |
Exploration Stage |
Conventional |
Unconformity Related |
||
| Hidden Bay |
58.157 |
-103.88 |
100.00% |
UEC |
Exploration Stage |
Conventional |
Unconformity Related |
||
| Horseshoe-Raven |
58.1331 |
-103.76 |
100.00% |
UEC |
Exploration Stage |
Conventional |
Unconformity Related |
||
| Key West |
57.2731 |
-106.217 |
100.00% |
UEC |
Exploration Stage |
Conventional |
Unconformity Related |
||
| Laurie |
57.6579 |
-108.721 |
32.99% |
Orano Canada Inc. |
Exploration Stage |
Conventional |
Unconformity Related |
||
| Millennium |
57.5138 |
-105.639 |
15.05% |
Cameco Corporation |
Exploration Stage |
Conventional |
Unconformity Related |
||
| Mirror River |
57.6078 |
-108.423 |
32.34% |
Orano Canada Inc. |
Exploration Stage |
Conventional |
Unconformity Related |
||
| Moon Lake |
57.4669 |
-105.634 |
10.07% |
Orano Canada Inc. |
Exploration Stage |
Conventional |
Unconformity Related |
||
| Moore Tomblin |
57.4512 |
-105.135 |
6.80% |
Orano Canada Inc. |
Exploration Stage |
Conventional |
Unconformity Related |
||
| Nikita |
58.0107 |
-109.574 |
12.72% |
Orano Canada Inc. |
Exploration Stage |
Conventional |
Unconformity Related |
||
| Country |
State/Province |
Project |
Location (Latitude) |
Location (Longitude) |
Equity Interest |
Operator |
Stage |
Mining Method |
Mineralization Style |
| Uranium Projects | |||||||||
| Riou Lake |
59.0491 |
-106.156 |
100.00% |
UEC |
Exploration Stage |
Conventional |
Unconformity Related |
||
| Roughrider |
58.3374 |
-104.021 |
100.00% |
UEC |
Exploration Stage |
Conventional |
Unconformity Related |
||
| Shea Creek |
58.1804 |
-109.49 |
49.10% |
Orano Canada Inc. |
Exploration Stage |
Conventional |
Unconformity Related |
||
| Uchrich |
57.7196 |
-108.483 |
30.48% |
Orano Canada Inc. |
Exploration Stage |
Conventional |
Unconformity Related |
||
| Waterfound River |
58.4588 |
-104.548 |
12.90% |
Orano Canada Inc. |
Exploration Stage |
Conventional |
Unconformity Related |
||
| West Bear |
57.8744 |
-103.975 |
100.00% |
UEC |
Exploration Stage |
Conventional |
Unconformity Related |
||
| Wheeler River |
57.5000 |
-105.421 |
5.00% |
Denison Mines Corp. |
Development |
Conventional |
Unconformity Related |
||
| Wolly |
58.3927 |
-103.799 |
6.38% |
Orano Canada Inc. |
Exploration Stage |
Conventional |
Unconformity Related |
||
| Nunavut |
Kiggavik |
64.3752 |
-97.7685 |
16.91% |
Orano Canada Inc. |
Exploration Stage |
Conventional |
Unconformity Related |
|
| Paraguay |
Yuty |
25.2702 |
56.3125 |
100.00% |
UEC |
Exploration Stage |
ISR |
Roll-Front |
|
| Oviedo |
25.2702 |
56.2828 |
100.00% |
UEC |
Exploration Stage |
ISR |
Roll-Front |
||
| Titanium Projects |
|||||||||
| Paraguay |
Alto Parana |
24.8147 |
54.9083 |
100.00% |
UEC |
Exploration Stage |
Conventional |
Surficial |
|
Table 2.2 – Titles, Mineral Rights, Leases, and Acreage Summaries
| Acres |
Hectares |
State Leases |
Fee Mineral Leases |
Federal Lode Mining Claims |
Provincial Mineral Dispositions |
Provincial Mining Leases |
|||||||||||||
| Country |
State/Province |
Project |
Total |
Total |
Number |
Acres |
Expiration Date |
Number |
Acres |
Expiration Date |
Number |
Acres |
Expiration Date |
Number |
Hectares |
Expiration Date |
Number |
Hectares |
Expiration Date |
| Uranium Projects |
|||||||||||||||||||
| United States |
Wyoming |
Allemand-Ross |
13,331.72 |
5,395.16 |
3 |
958 |
Annual |
7 |
3,333.72 |
July 2025 through Feb. 2029 (variable) |
452 |
9,040 |
Annual |
||||||
| Antelope |
13,220 |
5,349.94 |
1 |
640 |
Annual |
629 |
12,580 |
Annual |
|||||||||||
| Barge |
7,480 |
3,027.05 |
1 |
640 |
Annual |
342 |
6,840 |
Annual |
|||||||||||
| Black Hills |
1,280 |
518.00 |
1 |
640 |
Annual |
32 |
640 |
Annual |
|||||||||||
| Brown Ranch |
3,640 |
1,473.06 |
1 |
640 |
Annual |
150 |
3,000 |
Annual |
|||||||||||
| Bull Springs |
5,702.8 |
2,307.84 |
2 |
1,922.8 |
Annual |
189 |
3,780 |
Annual |
|||||||||||
| Central Shirley Basin |
2,380 |
963.15 |
2 |
760 |
Annual |
81 |
1,620 |
Annual |
|||||||||||
| Charlie |
820 |
331.84 |
1 |
720 |
Annual |
5 |
100 |
Annual |
|||||||||||
| Christensen Ranch |
11,140 |
4,508.20 |
1 |
1,280 |
Annual |
1 |
720 |
Annual |
358 |
9,140 |
Annual |
||||||||
| Clarkson Hills |
400 |
161.87 |
20 |
400 |
Annual |
||||||||||||||
| Crooks Creek |
6,979.25 |
2,824.40 |
6 |
2,599.25 |
Annual |
219 |
4,380 |
Annual |
|||||||||||
| Crook's Mountain |
2,480 |
1,003.62 |
2 |
1,280 |
Annual |
60 |
1,200 |
Annual |
|||||||||||
| Crossroads |
5,680 |
2,298.61 |
2 |
1,280 |
Annual |
220 |
4,400 |
Annual |
|||||||||||
| Cyclone Rim |
4,280 |
1,732.06 |
0 |
0 |
214 |
4,280 |
Annual |
||||||||||||
| East Shirley Basin |
4,599.90 |
1,861.51 |
4 |
2,099.9 |
Annual |
125 |
2,500 |
Annual |
|||||||||||
| Gas Hills |
6,114.76 |
2,474.56 |
5 |
3,394.76 |
Annual |
136 |
2,720 |
Annual |
|||||||||||
| Acres |
Hectares |
State Leases |
Fee Mineral Leases |
Federal Lode Mining Claims |
Provincial Mineral Dispositions |
Provincial Mining Leases |
|||||||||||||
| Country |
State/Province |
Project |
Total |
Total |
Number |
Acres |
Expiration Date |
Number |
Acres |
Expiration Date |
Number |
Acres |
Expiration Date |
Number |
Hectares |
Expiration Date |
Number |
Hectares |
Expiration Date |
| Horse Creek |
540 |
218.53 |
27 |
540 |
Annual |
||||||||||||||
| Irigaray |
2,320 |
938.87 |
2 |
480 |
Annual |
92 |
1,840 |
Annual |
|||||||||||
| Jab/West Jab |
5,300 |
2,144.83 |
3 |
960 |
Annual |
217 |
4,340 |
Annual |
|||||||||||
| Ludeman |
18,101.89 |
7,325.57 |
4 |
1,440 |
Annual |
2 |
1,741.89 |
Sept. 2026 and Jan. 2029 |
746 |
14,920 |
Annual |
||||||||
| Moore Ranch |
4,180 |
1,691.59 |
3 |
1,280 |
Annual |
4 |
1,180 |
Aug. 2025 through Mar. 2027 (variable) |
86 |
1,720 |
Annual |
||||||||
| Mule Creek |
260 |
105.22 |
13 |
260 |
Annual |
||||||||||||||
| Niles Ranch |
3,560 |
1,440.68 |
6 |
2,560 |
Annual |
50 |
1,000 |
Annual |
|||||||||||
| Nine Mile Lake |
2,620 |
1,060.28 |
3 |
1,280 |
Annual |
67 |
1,340 |
Annual |
|||||||||||
| Pine Ridge |
3,780 |
1,529.71 |
2 |
720 |
Annual |
153 |
3,060 |
Annual |
|||||||||||
| Pine Tree U1 |
1,540 |
623.22 |
1 |
80 |
Annual |
73 |
1,460 |
Annual |
|||||||||||
| Pumpkin Creek |
1,000 |
404.69 |
50 |
1,000 |
Annual |
||||||||||||||
| Red Rim |
680 |
275.19 |
34 |
680 |
Annual |
||||||||||||||
| Reno Creek |
18,763 |
7,593.12 |
4 |
3,200 |
Annual |
36 |
4,583 |
Variable |
549 |
10,980 |
Annual |
||||||||
| Ross Flats |
5,480 |
2,217.68 |
3 |
1,040 |
Annual |
3 |
1,680 |
Mar. 2027 |
138 |
2,760 |
Annual |
||||||||
| Sand Creek |
3,000 |
1,214.06 |
3 |
1,920 |
Annual |
54 |
1,080 |
Annual |
|||||||||||
| South Pine Ridge |
4,020 |
1,626.84 |
5 |
2,360 |
Annual |
83 |
1,660 |
Annual |
|||||||||||
| South Reno Creek |
2,580 |
1,044.09 |
1 |
80 |
Annual |
125 |
2,500 |
Annual |
|||||||||||
| South Sweetwater |
1,120 |
453.25 |
1 |
640 |
Annual |
24 |
480 |
Annual |
|||||||||||
| Stewart Creek |
2,460 |
995.53 |
1 |
640 |
Annual |
91 |
1,820 |
Annual |
|||||||||||
| Taylor Ranch |
3,940 |
1,594.46 |
7 |
2,880 |
Annual |
53 |
1,060 |
Annual |
|||||||||||
| Twin Buttes |
7,740 |
3,132.27 |
3 |
1,600 |
Annual |
307 |
6,140 |
Annual |
|||||||||||
| West Beaver Rim |
1,900 |
768.90 |
1 |
640 |
Annual |
63 |
1,260 |
Annual |
|||||||||||
| West Crook's Creek |
1,520 |
615.12 |
1 |
640 |
Annual |
44 |
880 |
Annual |
|||||||||||
| West Sweetwater |
1,080 |
437.06 |
54 |
1,080 |
Annual |
||||||||||||||
| Texas |
Burke Hollow |
17,511 |
7,086 |
1 |
17,511 |
2032 |
|||||||||||||
| Goliad |
636 |
257 |
7 |
636 |
2024 & 2025 |
||||||||||||||
| Palangana |
6,969 |
2,820 |
12 |
6,969 |
2025 thru 2032 |
||||||||||||||
| Salvo |
800 |
324 |
2 |
800 |
2026 & 2027 |
||||||||||||||
| Longhorn |
594 |
240 |
40 |
594 |
2027 thru 2028 |
||||||||||||||
| Arizona |
Anderson |
8,268 |
3,346 |
1 |
640 |
2024 |
386 |
7,628 |
2024 |
||||||||||
| Los Cuatros |
640 |
259 |
1 |
640 |
2024 |
||||||||||||||
| Acres |
Hectares |
State Leases |
Fee Mineral Leases |
Federal Lode Mining Claims |
Provincial Mineral Dispositions |
Provincial Mining Leases |
|||||||||||||
| Country |
State/Province |
Project |
Total |
Total |
Number |
Acres |
Expiration Date |
Number |
Acres |
Expiration Date |
Number |
Acres |
Expiration Date |
Number |
Hectares |
Expiration Date |
Number |
Hectares |
Expiration Date |
| Workman Creek |
4,036 |
1,374 |
198 |
4,036 |
2024 |
||||||||||||||
| New Mexico |
C de Baca |
600 |
243 |
30 |
600 |
2024 |
|||||||||||||
| Dalton Pass |
1,020 |
413 |
51 |
1,020 |
2024 |
||||||||||||||
| Canada |
Saskatchewan |
Alexandra |
36,485 |
14,765 |
6 |
14,765 |
Oct. 4042 |
||||||||||||
| Axis Lake |
13,045 |
5,279 |
3 |
5,279 |
Aug. 2023 |
||||||||||||||
| Beatty River |
16,526 |
6,688 |
7 |
6,688 |
Sept. 2027 |
||||||||||||||
| Black Lake |
78,335 |
31,701 |
13 |
31,701 |
Nov. 2024 |
||||||||||||||
| Brander Lake |
34,577 |
13,993 |
9 |
13,993 |
Apr. 2035 |
||||||||||||||
| Candle Lake |
6,412 |
2,595 |
1 |
2,595 |
Oct. 2038 |
||||||||||||||
| Christie Lake |
19,575 |
7,922 |
6 |
7,922 |
Mar. 2044 |
||||||||||||||
| Christie West |
813 |
329 |
2 |
329 |
Jun. 2023 |
||||||||||||||
| Close Lake |
95,578 |
38,679 |
21 |
38,679 |
Oct. 2023 |
||||||||||||||
| Cree Extension |
30,115 |
12,187 |
11 |
12,187 |
Aug. 2040 |
||||||||||||||
| Diabase Peninsula |
77,164 |
31,227 |
22 |
31,227 |
|||||||||||||||
| Erica |
91,409 |
36,992 |
20 |
36,992 |
Nov. 2036 |
||||||||||||||
| Hidden Bay |
126,933 |
51,368 |
45 |
51,368 |
Aug. 2037 |
||||||||||||||
| Horseshoe-Raven |
11,085 |
4,486 |
1 |
4,486 |
Feb. 2041 |
||||||||||||||
| Key West |
31,827 |
12,880 |
4 |
12,880 |
Apr. 2024 |
||||||||||||||
| Laurie |
21,691 |
8,778 |
4 |
8,778 |
May 2027 |
||||||||||||||
| Millennium |
1,458 |
590 |
1 |
590 |
Feb. 2039 |
||||||||||||||
| Mirror River |
42,996 |
17,400 |
5 |
17,400 |
Apr. 2024 |
||||||||||||||
| Moon Lake |
9,385 |
3,798 |
5 |
3,798 |
Oct. 2039 |
||||||||||||||
| Moore Tomblin |
3,249 |
1,315 |
2 |
1,315 |
May 2028 |
||||||||||||||
| Nikita |
37,390 |
15,131 |
6 |
15,131 |
Jun. 2043 |
||||||||||||||
| Riou Lake |
27,634 |
11,183 |
14 |
11,183 |
Nov. 2023 |
||||||||||||||
| Roughrider |
1,475 |
597 |
1 |
597 |
Jan. 2028 |
||||||||||||||
| Shea Creek |
81,451 |
32,962 |
18 |
32,962 |
Mar. 2035 |
||||||||||||||
| Uchrich |
5,592 |
2,263 |
1 |
2,263 |
May 2027 |
||||||||||||||
| Waterfound River |
28,837 |
11,670 |
25 |
11,670 |
Jul. 2031 |
||||||||||||||
| West Bear |
27,439 |
11,104 |
26 |
10,807 |
Feb 2043 |
1 |
297 |
June 2035 |
|||||||||||
| Wheeler River |
28,961 |
11,720 |
19 |
11,720 |
Oct. 2041 |
||||||||||||||
| Wolly |
58,564 |
23,700 |
17 |
23,700 |
Nov. 2038 |
||||||||||||||
| Nunavut |
Kiggavik |
45,638 |
18,469 |
37 |
18,469 |
Oct. 2038 |
|||||||||||||
| Paraguay |
Yuty |
289,687 |
117,232 |
||||||||||||||||
| Oviedo |
223,754 |
90,550 |
|||||||||||||||||
| Titanium Projects |
|||||||||||||||||||
| Paraguay |
Alto Parana |
174,204 |
70,498 |
||||||||||||||||
Table 2.3 – Permit Status and Conditions
| Uranium Projects |
||||||||||
| Texas |
||||||||||
| Property |
Fully Permitted to Mine |
Partially Permitted to Mine |
Not Permitted to Mine |
RRC Exploration Permit |
TCEQ Class 1 Well Permits |
TCEQ Injection Control Permit |
TCEQ Area Permit |
TCEQ/EPA Aquifer Exemption |
TCEQ Radioactive Materials License |
Notes |
| Burke Hollow |
X |
Yes |
2 |
Yes |
Yes |
Yes |
Yes |
Has all major permits, waiting on final production authorization |
||
| Goliad |
X |
Yes |
2 |
Yes |
Yes |
Yes |
Yes |
Has all major permits and first production authorization |
||
| La Palangana |
X |
Yes |
2 |
Yes |
Yes |
Yes |
Yes |
Has all major permits and four production authorizations |
||
| Salvo |
X |
No |
0 |
No |
No |
No |
No |
|||
| Longhorn |
X |
No |
0 |
No |
No |
No |
No |
|||
| Wyoming |
||||||||||
| Property |
Fully Permitted to Mine |
Partially Permitted to Mine |
Not Permitted to Mine |
Class III UIC Permit to Mine |
WDEQ Class 1 Well Permits |
Source and Byproduct Materials License |
BLM Plan of Operations |
WDEQ/EPA Aquifer Exemption |
Notes |
|
| Allemand-Ross |
X |
Drilling Notification DN339 |
||||||||
| Antelope |
X |
Yes |
Drilling Notification DN353 |
|||||||
| Barge |
X |
|||||||||
| Black Hills |
X |
|||||||||
| Brown Ranch |
X |
|||||||||
| Bull Springs |
X |
|||||||||
| Central Shirley Basin |
X |
|||||||||
| Charlie |
X |
Permitted as an open pit mine not ISR |
||||||||
| Christensen Ranch |
X |
Yes |
Yes |
Yes |
Yes |
|||||
| Clarkson Hill |
X |
|||||||||
| Crooks Creek |
X |
|||||||||
| Crook's Mountain |
X |
|||||||||
| Crossroads |
X |
|||||||||
| Cyclone Rim |
X |
|||||||||
| East Shirley Basin |
X |
|||||||||
| Gas Hills |
X |
|||||||||
| Horse Creek |
X |
|||||||||
| Irigaray Project |
X |
Yes |
Yes |
Yes |
Yes |
Irigaray mine expansion to north and south will require a permit revision. Drilling Notification DN342 |
||||
| Jab/West Jab |
X |
Drilling Notification DN353 |
||||||||
| Ludeman |
X |
Yes |
Yes |
Yes |
||||||
| Moore Ranch |
X |
Yes |
Yes |
Yes |
Yes |
|||||
| Mule Creek |
X |
|||||||||
| Niles Ranch |
X |
|||||||||
| Nine Mile Lake |
X |
Drilling Notification DN339 |
||||||||
| Pine Ridge |
X |
Drilling Notification DN342 |
||||||||
| Pine Tree U1 |
X |
Drilling Notification DN342 |
||||||||
| Pumpkin Creek |
X |
Drilling Notification DN342 |
||||||||
| Red Rim |
X |
|||||||||
| Reno Creek |
X |
Yes |
Yes |
Yes |
Yes |
North Reno Creek and SW Reno Creek Resource areas are permitted. |
||||
| Ross Flat |
X |
Drilling Notification DN342 |
||||||||
| Sand Creek |
X |
|||||||||
| South Pine Ridge |
X |
|||||||||
| South Reno Creek |
X |
|||||||||
| South Sweetwater |
X |
|||||||||
| Stewart Creek |
X |
|||||||||
| Taylor Ranch |
X |
Drilling Notification DN342 |
||||||||
| Twin Buttes |
X |
|||||||||
| West Beaver Rim |
X |
|||||||||
| West Crook's Creek |
X |
|||||||||
| West Sweetwater |
X |
|||||||||
| Arizona |
||||||||||
| Property |
Fully Permitted to Mine |
Partially Permitted to Mine |
Not Permitted to Mine |
Class III UIC Permit to Mine |
WDEQ Class 1 Well Permits |
Source and Byproduct Materials License |
BLM Plan of Operations |
WDEQ/EPA Aquifer Exemption |
Notes |
|
| Anderson |
X |
|||||||||
| Los Cuatros |
X |
|||||||||
| Workman Creek |
X |
|||||||||
| New Mexico |
||||||||||
| Property |
Fully Permitted to Mine |
Partially Permitted to Mine |
Not Permitted to Mine |
Class III UIC Permit to Mine |
WDEQ Class 1 Well Permits |
Source and Byproduct Materials License |
BLM Plan of Operations |
WDEQ/EPA Aquifer Exemption |
Notes |
|
| C de Baca |
X |
|||||||||
| Dalton Pass |
X |
|||||||||
| Canada |
||||||||||
| Property |
Fully Permitted to Mine |
Partially Permitted to Mine |
Not Permitted to Mine |
Notes |
||||||
| Alexandra |
X |
Exploration-Stage Project with no resources |
||||||||
| Axis Lake |
X |
Exploration-Stage Project with no resources |
||||||||
| Beatty River |
X |
Exploration-Stage Project with no resources |
||||||||
| Black Lake |
X |
Exploration-Stage Project with no resources |
||||||||
| Brander Lake |
X |
Exploration-Stage Project with no resources |
||||||||
| Candle Lake |
X |
Exploration-Stage Project with no resources |
||||||||
| Christie Lake |
X |
Exploration-Stage Project with resources |
||||||||
| Christie West |
X |
Exploration-Stage Project with no resources |
||||||||
| Close Lake |
X |
Exploration-Stage Project with no resources |
||||||||
| Cree Extension |
X |
Exploration-Stage Project with no resources |
||||||||
| Diabase Peninsula |
X |
Exploration-Stage Project with no resources |
||||||||
| Erica |
X |
Exploration-Stage Project with no resources |
||||||||
| Hidden Bay |
X |
Exploration-Stage Project with no resources |
||||||||
| Horseshoe-Raven |
X |
Exploration-Stage Project with resources |
||||||||
| Key West |
X |
Exploration-Stage Project with no resources |
||||||||
| Laurie |
X |
Exploration-Stage Project with no resources |
||||||||
| Millennium |
X |
Exploration-Stage Project with resources |
||||||||
| Mirror River |
X |
Exploration-Stage Project with no resources |
||||||||
| Moon Lake |
X |
Exploration-Stage Project with no resources |
||||||||
| Moore Tomblin |
X |
Exploration-Stage Project with no resources |
||||||||
| Nikita |
X |
Exploration-Stage Project with no resources |
||||||||
| Riou Lake |
X |
Exploration-Stage Project with no resources |
||||||||
| Roughrider |
X |
Exploration-Stage Project with resources |
||||||||
| Shea Creek |
X |
Exploration-Stage Project with resources |
||||||||
| Uchrich |
X |
Exploration-Stage Project with no resources |
||||||||
| Waterfound River |
X |
Exploration-Stage Project with no resources |
||||||||
| West Bear |
X |
Exploration-Stage Project with no resources |
||||||||
| Wheeler River |
X |
Feasibility Field Test mining completed |
||||||||
| Wolly |
X |
Exploration-Stage Project with no resources |
||||||||
| Kiggavik |
X |
Development-Stage, not permitted to mine |
||||||||
| Paraguay |
||||||||||
| Property |
Fully Permitted to Mine |
Partially Permitted to Mine |
Not Permitted to Mine |
Notes |
||||||
| Yuty |
X |
Exploration-Stage Project with resources |
||||||||
| Oviedo |
X |
Exploration-Stage Project with no resources |
||||||||
| Titanium Projects |
||||||||||
| Paraguay |
||||||||||
| Property |
Fully Permitted to Mine |
Partially Permitted to Mine |
Not Permitted to Mine |
Notes |
||||||
| Alto Parana |
X |
Exploration-Stage Project with no resources |
||||||||
Table 2.4 – Processing Plants and other Facilities
| State/Province |
Plant |
Location (Latitude) |
Location (Longitude) |
Equity Interest |
Operator |
Status |
Annual Permitted Production Capacity |
Fully Permitted to Mine |
Partially Permitted to Mine |
Not Permitted to Mine |
WDEQ Class 1 Well Permits |
TCEQ Radioactive Materials License |
| Wyoming |
Irigaray Central Processing Plant |
100% |
UEC |
Production Suspended |
2.5 Mlb/year |
X |
2 |
Yes |
||||
| Christensen Ranch Satellite Production Plant |
100% |
UEC |
Standby |
9,000 gpm |
X |
4 |
Yes |
| State/Province |
Plant |
Location (Latitude) |
Location (Longitude) |
Equity Interest |
Operator |
Status |
Annual Permitted Production Capacity |
Fully Permitted to Mine |
Partially Permitted to Mine |
Not Permitted to Mine |
TCEQ Class 1 Well Permits |
TCEQ Radioactive Materials License |
| Texas |
Hobson Central Processing Plant |
28.945 |
-97.989 |
100% |
UEC |
Production Suspended |
4.0 Mlb/year |
X |
2 |
Yes |
Our Mineral Properties
Below is a table setting out our summary disclosure of current measured, indicated, and inferred mineral resource estimates. Details regarding the mineral resource estimate disclosed herein can be found in Section 11, Mineral Resource Estimates, of each relevant TRS.
Table 2.5 – Mineral Resources
| Uranium Oxide Mineral Resources |
||||||||||||||
| Country |
State/Province |
Project |
Measured |
Indicated |
Inferred |
|||||||||
| Tons ('000's) |
Tonnes |
Grade |
Pounds U3O8 ('000's) |
Tons ('000's) |
Tonnes |
Grade |
Pounds U3O8 ('000's) |
Tons ('000's) |
Tonnes |
Grade |
Pounds U3O8 ('000's) |
|||
| United States |
Wyoming |
Allemand-Ross |
246 |
223 |
0.08% |
417 |
32 |
29 |
0.07% |
42 |
1,275 |
1,157 |
0.10% |
2,496 |
| Barge |
4,301 |
3,902 |
0.05% |
4,361 |
||||||||||
| Charlie |
1,255 |
1,139 |
0.12% |
3,100 |
411 |
373 |
0.12% |
988 |
||||||
| Christensen Ranch |
6,555 |
5,947 |
0.07% |
9,596 |
||||||||||
| Clarkson Hill |
957 |
868 |
0.06% |
1,113 |
||||||||||
| Irigaray |
3,881 |
3,521 |
0.08% |
5,899 |
104 |
94 |
0.07% |
141 |
||||||
| Jab/West Jab |
1,621 |
1,471 |
0.07% |
2,335 |
253 |
230 |
0.08% |
392 |
1,402 |
1,272 |
0.06% |
1,677 |
||
| Ludeman |
2,674 |
2,426 |
0.09% |
5,017 |
2,660 |
2,413 |
0.09% |
4,697 |
866 |
786 |
0.07% |
1,258 |
||
| Moore Ranch |
2,675 |
2,427 |
0.06% |
3,210 |
46 |
42 |
0.05% |
44 |
||||||
| Nine Mile Lake |
3,405 |
3,089 |
0.04% |
4,308 |
||||||||||
| Red Rim |
337 |
306 |
0.17% |
1,142 |
473 |
429 |
0.16% |
1,539 |
||||||
| Reno Creek |
14,990 |
13,599 |
0.04% |
12,920 |
16,980 |
15,404 |
0.04% |
13,070 |
1,920 |
1,742 |
0.04% |
1,490 |
||
| Wyoming Total |
22,206 |
20,145 |
0.05% |
23,899 |
36,254 |
32,889 |
0.06% |
42,299 |
10,859 |
9,851 |
0.07% |
15,054 |
||
| Texas |
Burke Hollow |
70 |
64 |
0.08% |
115 |
1,337 |
1,213 |
0.09% |
2,209 |
2,494 |
2,263 |
0.10% |
4,859 |
|
| Goliad |
1,595 |
1,447 |
0.05% |
2,668 |
1,504 |
1,364 |
0.10% |
3,492 |
1,548 |
1,403 |
0.20% |
1,225 |
||
| Palangana |
232 |
210 |
0.13% |
643 |
302 |
274 |
0.18% |
1,001 |
||||||
| Salvo |
1125 |
1,020 |
0.09% |
2,839 |
||||||||||
| Texas Total |
1,665 |
1,510 |
0.08% |
2,783 |
3,073 |
2,788 |
0.10% |
6,344 |
5,469 |
4,961 |
0.09% |
9,924 |
||
| Arizona |
Anderson |
16,175 |
14,674 |
0.10% |
32,055 |
|||||||||
| Workman Creek |
1,981 |
1,797 |
0.11% |
4,459 |
||||||||||
| Arizona Total |
16,175 |
14,674 |
0.10% |
32,055 |
1,981 |
1,797 |
0.11% |
4,459 |
||||||
| United States Total |
23,871 |
21,655 |
0.06% |
26,682 |
55,502 |
50,351 |
0.07% |
80,698 |
18,309 |
16,610 |
0.08% |
29,437 |
||
| Canada |
Saskatchewan |
Christie Lake |
537 |
488 |
1.57% |
16,836 |
||||||||
| Roughrider |
429 |
389 |
3.25% |
27,842 |
396 |
359 |
4.55% |
36,043 |
||||||
| Horseshoe-Raven |
11,412 |
10,353 |
0.16% |
37,426 |
||||||||||
| Shea Creek |
1,113 |
1,009 |
1.49% |
33,175 |
679 |
616 |
1.02% |
13,775 |
||||||
| Millennium |
239 |
217 |
2.39% |
11,423 |
68 |
62 |
3.19% |
4,364 |
||||||
| Canada Total |
13,192 |
11,968 |
0.42% |
109,867 |
1,681 |
1,525 |
2.11% |
71,019 |
||||||
| Paraguay |
Yuty |
9,074 |
8,232 |
0.05% |
8,962 |
2,733 |
2,479 |
0.04% |
2,203 |
|||||
| Total Resources |
23,871 |
21,655 |
0.06% |
26,682 |
77,768 |
70,550 |
0.13% |
199,527 |
22,797 |
20,681 |
0.23% |
102,658 |
||
Notes:
| 1. |
The Mineral Resource estimates in this table meet S-K 1300 definitions. |
|
| 2. |
Mineral Resources are not Mineral Reserves and do not have demonstrated economic viability. |
|
| 3. |
The point of reference for mineral resources is in-situ at the Project. |
|
| 4. |
Mineral Resources are estimated using a long-term uranium price of $40 per pound for ISR projects and $65 per pound for conventional projects. |
|
| 5. |
Mineral Resources are 100% attributable to the Company. |
|
| 6. |
Numbers may not add due to rounding. |
Table 2.6 – Year over Year Changes in Mineral Resources
UEC has recently completed updated mineral resource and reserve updates on the company’s material properties and presently does not have projects in production. As such, there were no changes to stated resources between fiscal year 2022 and 2023.
| Uranium Oxide Resources |
|||||||||||
| FY 2022 |
FY 2023 |
YOY Change |
|||||||||
| Country |
State/Province |
Project |
Measured Pounds U3O8 ('000's) |
Indicated Pounds U3O8 ('000's) |
Inferred Pounds U3O8 ('000's) |
Measured Pounds U3O8 ('000's) |
Indicated Pounds U3O8 ('000's) |
Inferred Pounds U3O8 ('000's) |
% Change in Measured Pounds |
% Change in Indicated Pounds |
% Change in Inferred Pounds |
| United States |
Wyoming |
Allemand-Ross |
417 |
42 |
2,496 |
417 |
42 |
2,496 |
0% |
0% |
0% |
| Barge |
4,361 |
4,361 |
0% |
||||||||
| Charlie |
3,100 |
988 |
3,100 |
988 |
0% |
0% |
|||||
| Christensen Ranch |
9,596 |
9,596 |
0% |
||||||||
| Clarkson Hill |
1,113 |
1,113 |
0% |
||||||||
| Irigaray |
5,899 |
141 |
5,899 |
141 |
0% |
0% |
|||||
| Jab/West Jab |
2,335 |
392 |
1,677 |
2,335 |
392 |
1,677 |
0% |
0% |
0% |
||
| Ludeman |
5,017 |
4,697 |
1,258 |
5,017 |
4,697 |
1,258 |
0% |
0% |
0% |
||
| Moore Ranch |
3,210 |
44 |
3,210 |
44 |
0% |
0% |
|||||
| Nine Mile Lake |
4,308 |
4,308 |
0% |
||||||||
| Red Rim |
1,142 |
1,539 |
1,142 |
1,539 |
0% |
0% |
|||||
| Reno Creek |
12,920 |
13,070 |
1,490 |
12,920 |
13,070 |
1,490 |
0% |
0% |
0% |
||
| Wyoming Total |
23,899 |
42,299 |
15,054 |
23,899 |
42,299 |
15,054 |
0% |
0% |
0% |
||
| Texas |
Burke Hollow |
115 |
2,209 |
4,859 |
115 |
2,209 |
4,859 |
0% |
0% |
0% |
|
| Goliad |
2,668 |
3,492 |
1,225 |
2,668 |
3,492 |
1,225 |
0% |
0% |
0% |
||
| Palangana |
643 |
1,001 |
643 |
1,001 |
0% |
0% |
|||||
| Salvo |
2,839 |
2,839 |
0% |
||||||||
| Texas Total |
2,783 |
6,344 |
9,924 |
2,783 |
6,344 |
9,924 |
0% |
0% |
0% |
||
| Arizona |
Anderson |
32,055 |
32,055 |
0% |
|||||||
| Workman Creek |
4,459 |
4,459 |
0% |
||||||||
| Arizona Total |
32,055 |
4,459 |
32,055 |
4,459 |
0% |
0% |
|||||
| United States Total |
26,682 |
80,698 |
29,437 |
26,682 |
80,698 |
29,437 |
0% |
0% |
0% |
||
| Canada |
Saskatchewan |
Christie Lake |
16,836 |
16,836 |
0% |
||||||
| Roughrider |
27,842 |
36,043 |
27,842 |
36,043 |
0% |
0% |
|||||
| Horseshoe-Raven |
37,426 |
37,426 |
0% |
||||||||
| Shea Creek |
33,175 |
13,775 |
33,175 |
13,775 |
0% |
0% |
|||||
| Millennium |
11,423 |
4,364 |
11,423 |
4,364 |
0% |
0% |
|||||
| Canada Total |
109,867 |
71,019 |
109,867 |
71,019 |
0% |
0% |
|||||
| Paraguay |
Yuty |
8,962 |
2,203 |
8,962 |
2,203 |
0% |
0% |
||||
| Total Resources |
26,682 |
199,527 |
102,658 |
26,682 |
199,527 |
102,658 |
0% |
0% |
0% |
||
Notes:
| 1. |
The Mineral Resource estimates in this table meet S-K 1300 definitions. |
|
| 2. |
Mineral Resources are not Mineral Reserves and do not have demonstrated economic viability. |
|
| 3. |
The point of reference for mineral resources is in-situ at the Project. |
|
| 4. |
Mineral Resources are estimated using a long-term uranium price of $40 per pound for ISR projects and $65 per pound for conventional projects. |
|
| 5. |
Mineral Resources are 100% attributable to the Company. |
|
| 6. |
Numbers may not add due to rounding. |
Internal Controls Over Uranium Resource Estimation Efforts
For Canadian and U.S. exploration programs, Quality Control and Quality Assurance (“QA/QC”) programs for geologic data collection and resource estimation are defined in each TRS along with protocols and procedures for data collection. To summarize, the QA/QC programs for exploration data are in place that cover four broad categories: geologic data collection; data verification; radiometric equivalent data; and geochemical data. The controls in each of these broad categories serve to help the Company and its QPs have confidence in the data and geologic interpretations that are being used in resource estimation.
Geochemical data for Canadian exploration programs is supplied by the Geoanalytical Laboratory at the Saskatchewan Research Council (“SRC”). The quality management system at SRC, Geoanalytical Laboratories, operates in accordance with ISO/IEC 17025, General Requirements for the Competence of Testing and Calibration Laboratories, and is also compliant to ASB, Requirements and Guidance for Mineral Analysis Testing Laboratories. The management system and selected methods are accredited by the Standards Council of Canada. As part of the SRC’s commitment to continually assess the effectiveness of the services, all processes are subject to internal, second party and third-party audits. In addition to the lab controls on QA/QC, the Company submits duplicate samples and blank samples to the lab at a rate of approximately one in 20 samples each along with standard and a round robin pulp that are inserted at the lab, so that in a 20-sample batch there are 16 geochemistry samples for analysis. Failures of lab standards, blanks or duplicates are investigated and can result in re-assay of the samples to replace the original data in the database if necessary. Samples of mineralization at a rate of about 5% of the population are checked externally with a different accredited lab to help assure accuracy.
For U.S. exploration programs the preponderance of data utilized for resource and reserve estimates is generated from radiometric equivalent measurements made utilizing downhole geophysical logging techniques such as gamma-ray and prompt fission neutron (“PFN”) techniques. This technology has been employed in the exploration and development of sandstone uranium deposits in the U.S. since the 1950s. QA/QC of gamma-ray and PFN probes from each logging truck are required to maintain calibration by regular cross-checking the probes at a U.S. Department of Energy test pits located in George West, Texas, or Casper, Wyoming. The pit is set up for logging units to calibrate the probes with a known radioactive source. Each test run generates calibration files for the operator to review and make necessary tool adjustments. Calibration runs typically are made on a one- or two-month interval, and files with the test pit run results are maintained by the operator. The available data indicate that the logging provided by the Company and contract probe trucks at the various U.S. projects have maintained industry standard calibration procedures for their probes.
For resource estimation the internal controls are more common to the U.S. and Canadian operations. Company staff will perform database verification on the geologic database which is then reviewed by the QP. If the QP was not involved in the primary data collection field program the QP will spot check a subset of drill collar locations and, if available, also compare collar elevations against a digital elevation model to evaluate and cross check the drill hole collar elevations. For resource estimation the block model is evaluated visually against geologic cross sections to ensure block grades match drill hole grades. The QP will evaluate probability plots and perform statistical analysis of the sample population to determine the need for an appropriate grade cap to limit the influence of high-grade samples to the appropriate area. The preparation of Swath Plots is another internal control which can inform the QP if high-grade samples have had an exaggerated influence on the resource model.
The resource estimates have inherent risks due to data accuracy, uncertainty from geological interpretation, mine plan assumptions, uncontrolled rights for mineral and surface properties, environmental challenges, uncertainty for future market supply and demand and changes in laws and regulations. Company management and QPs are aware of those risks that might directly impact the assessment of mineral reserves and resources. The current mineral resources are estimated based on the best information available and are subject to reassessment when conditions change.
ISR Uranium Activities
The Company conducts its ISR activities through two district scale hubs located in Wyoming and Texas. The Irigaray Central Processing Plant (“CPP”) is located in northeastern Wyoming, was acquired in December 2021 through the acquisition of U1A. The Hobson CPP is located in south Texas, which it acquired in 2009 from Uranium One.
The Wyoming hub is comprised of the following material ISR projects that are intended to feed resources into the Irigaray CPP: Christensen Ranch, Charlie, Reno Creek, Moore Ranch, Ludeman, Allemand-Ross, Barge, Jab/West Jab, the Nine Mile Lake, Red Rim and Clarkson Hill. Please refer to Summary Disclosure Tables 1, 2, 3 and 4 for detailed information on each project. Production from existing wellfields at Christensen Ranch ceased in 2018 and the project was put in care and maintenance mode. Processing of toll resins from other projects continues at the Irigaray CPP. In order for Christensen Ranch to engage in future uranium extraction, the Company will need to incur capital expenditures to restart idled wellfields.
United States Properties
Wyoming Properties
Below is a map showing our Wyoming projects:
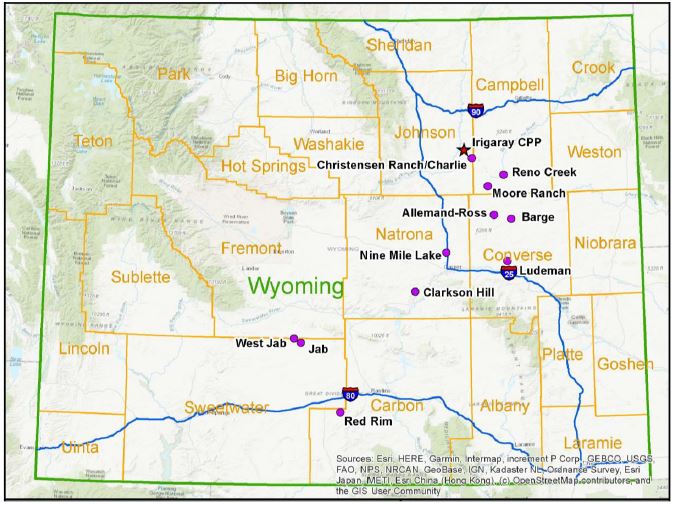
Figure 2.2 – Locations of our Projects in Wyoming
Permitting Requirements in Wyoming
The Irigaray CPP is fully permitted. The Christensen Ranch, Ludeman and Moore Ranch project areas are fully permitted for ISR operations through both the Wyoming Department of Environmental Quality/Land Quality Division (WDEQ/LQD) and the BLM as appropriate. Portions of the Irigaray and Reno Creek project areas are also permitted for ISR operations.
The Allemand-Ross, Barge, Charlie, Clarkson Hill, Jab/West Jab, Nine Mile and Red Rim project areas are not permitted. Portions of the Reno Creek project area and the majority of the Irigaray project area are also not permitted for ISR operations.
Geology and Mineralization in Wyoming
The Allemand-Ross, Barge, Charlie, Christensen Ranch, Irigaray, Ludeman, Moore Ranch, Nine Mile and Reno Creek project areas reside in the Powder River Basin (“PRB”). The PRB is a structural basin that extends over much of northeastern Wyoming and southeastern Montana and consists of a large north-northwest trending asymmetric syncline. The basin is bounded by the Big Horn Mountains on the west and Casper Arch to the southwest, the Black Hills to the east and the Hartville Uplift and Laramie Mountains to the south. The PRB is filled with marine, non-marine and continental sediments ranging in age from early Paleozoic through Cenozoic.
The Jab/West Jab and Red Rim project areas are located within the northeastern portion of the Greater Green River Basin (“GGRB”). The GGRB is a structural basin that extends over southwestern Wyoming and northwestern Colorado and is divided by the Rock Springs Uplift, a north-south trending anticline. The basin is bounded by the Wyoming thrust belt to the west, the Rawlins Uplift and the Sierra Madre Mountains to the east, the Wind River Mountains to the north and the Uinta Mountains to the south. The GGRB contains up to 25,000 feet of Cretaceous to recent sedimentary rocks.
The Clarkson Hill project area is located in the eastern portion of the Wind River Basin (“WRB”). The WRB is a structural basin in west-central Wyoming. The basin is bounded by the Wind River Range to the west, the Casper Arch to the east, the Owl Creek Mountains to the north and the Granite Mountains to the south. The WRB is filled with marine, lacustrine and fluvial sediments ranging in age from Paleozoic to Cenozoic.
Uranium mineralization at the project is typical of Wyoming roll-front sandstone deposits. The formation of roll-front deposits is largely a groundwater process that occurs when uranium rich, oxygenated groundwater interacts with a reducing environment in the subsurface and precipitates uranium. The most favorable host rocks for roll-fronts are permeable sandstones with large aquifer systems. Interbedded mudstone, claystone and siltstone are often present and aid in the formation process by focusing groundwater flow.
Geology of the Powder River Basin
The PRB extends over much of northeastern Wyoming and southeastern Montana and consists of a large north-northwest trending asymmetric syncline, with the basin axis located to the west of the projects. The PRB is bounded by the Big Horn Mountains and Casper Arch to the west, the Black Hills to the east and the Hartville Uplift and Laramie Mountains to the south. The PRB is filled with marine, non-marine and continental sediments ranging in age from early Paleozoic through Cenozoic.
Within the PRB, the Paleocene Fort Union Formation conformably overlies the Lance Formation and is a fluvial-sedimentary stratigraphic unit that consists of fine- to coarse-grained arkosic sandstone, which is interbedded with siltstone, mudstone and carbonaceous materials. In some areas of the PRB, the Fort Union Formation is divided into two members, identified as the Upper and Lower members of the Fort Union Formation. However, Flores divides the Fort Union into three members: the Tullock; Lebo; and Tongue River members (listed from oldest to youngest); as follows:
| ● |
The Tullock member consists of sandstone, siltstone and sparse coal and carbonaceous shale; |
| ● |
The Lebo member consists of abundant drab gray mudstone, minor siltstone and sandstone and sparse coal and carbonaceous shale beds; and |
| ● |
The Tongue River member consists of interbedded sandstone, conglomerate, siltstone, mudstone, limestone, anomalously thick coal beds and carbonaceous shale beds. This member has been mined extensively for its coal beds, which can be hundreds of feet thick. |
Uranium mineralization occurs in zones that are located in channel sands of the Fort Union Formation. These channel sands are typical fining upward sand sequences consisting of fine-grained sandstones. The zones of mineralization are formed as typical roll-front deposits in these sandstones.
The early Eocene Wasatch Formation unconformably overlies the Fort Union Formation around the margins of the PRB. However, the two formations are conformable and gradational towards the basin center. The relative amount of coarse, permeable clastics increases near the top of Fort Union, and the overlying Wasatch Formation contains numerous beds of sandstone that can sometimes be correlated over wide areas. The Wasatch-Fort Union contact is separated by Paleocene and Eocene rocks and is generally placed above the Roland coal. However, other authors have placed the Wasatch-Fort Union contact above the School, Badger and Anderson Coals in other parts of the PRB.
The Wasatch Formation occurs at the surface in the central PRB, but has been mostly removed by erosion with only small, scattered outcrops still present in the southern PRB. The Wasatch Formation is also a fluvial sedimentary unit that consists of a series of silt to very coarse-grained gradational intervals in arkosic sandstone. The sandstone horizons in the Wasatch Formation are the host rocks for several uranium deposits in the central PRB. Within this area, mineralization is found in a 50- to 100-ft thick sandstone lens. On a regional scale, mineralization is localized and controlled by facies changes within this sandstone, including thinning of the sandstone unit, decrease in grain size and increase in clay and organic material content. The Wasatch Formation reaches a maximum thickness of about 1,600 feet and dips northwestward from one degree to two-and-a-half degrees in the southern and central parts of the PRB.
The Oligocene White River Formation overlies the Wasatch Formation and has been removed from most of the basin by erosion. Remnants of this unit crop out on the Pumpkin Buttes, and at the extreme southern edge of the PRB. The White River Formation consists of clayey sandstone, claystone, a boulder conglomerate and tuffaceous sediments, which may be the primary source rock for uranium in the southern part of the PRB as a whole. The youngest sediments consist of Quaternary alluvial sands and gravels locally present in larger valleys. Quaternary eolian sands can also be found locally.
Geology of the Great Divide and Greater Green River Basins
The Jab/West Jab and Red Rim project areas are located within the northeastern portion of the Great Divide Basin.
The Great Divide Basin (“GDB”) and the Washakie Basin (“WB”) in the southwest together comprise the Greater Green River Basin (“GGRB”). The GGRB is a structural basin that extends over southwestern Wyoming and northwestern Colorado and is divided by the Rock Springs Uplift, a north-south trending anticline. The basin is bounded by the Wyoming thrust belt to the west, the Rawlins Uplift and the Sierra Madre Mountains to the east, the Wind River Mountains to the north and the Uinta Mountains to the south. The GGRB contains up to 25,000 feet of Cretaceous to recent sedimentary rocks.
During the end of the Cretaceous Period, the Laramide Orogeny divided the Wyoming Basin Province into a series of down warped basins. As these basins were created, uplift created the Granite and Seminoe Mountains, and older formations were altered during the same time. In the northern regions of the GDB, swamps, alluvial plains and fluvial fans were present at the margins of the uplifted Granite Mountains. To the southwest, the GDB is occupied by the lacustrine Eocene Green River Formation and by the lower energy Wasatch Formation. These two facies interfinger with the high-energy fluvial facies of the Battle Spring Formation at the central and eastern areas in the GDB.
Uranium deposits occur principally in the Battle Spring Formation which consists of alluvial-fluvial fan deposits of west- to southwest-flowing paleodrainage. The common rock type is arkosic sandstone with interbedded claystone. These types of rock are typical of alluvial-fan facies. Much of this material is sourced from the Granite Mountains, by blockages in normal drainages due to differential subsidence rates. The Wasatch Formation, due to its fluvial nature, contains interbedded siltstones, coal, carbonaceous shale, fine-grained sandstone, sandy limestone and medium-grained fluvial sandstones.
The Battle Spring Formation consists of alluvial-fluvial fan deposits of west to southwest-flowing paleodrainage. The common rock type is arkosic sandstone with interbedded claystone. These types of rock are typical of alluvial-fan facies. Much of this material is sourced from the Granite Mountains by blockages in normal drainages due to differential subsidence rates. The Wasatch Formation, due to its fluvial nature, contains interbedded siltstones, coal, carbonaceous shale, fine-grained sandstone, sandy limestone and medium-grained fluvial sandstones. The permeable medium- to very coarse-grained sandstones and arkoses are a favorable host for sandstone-type uranium deposits. Fluvial channels incised into less permeable underlying siltstones and sandstones in the Battle Spring during early Eocene time. The channels were backfilled by the massive, poorly-sorted, coalescing alluvial fan deposits, known as the Battle Spring Formation. The Battle Spring Formation includes impermeable carbonaceous shales that created an impermeable boundary for uranium deposits.
The Fort Union Formation surfaces around the boundary of the GDB. The Fort Union Formation is described as an interbedded sequence of white, gray, tan, buff and brown sandstone, gray to black shale, carbonaceous shale, siltstone, local conglomerate beds and (usually) thin coal beds. It may truncate and unconformably overlie older units near basin margins. The Fort Union is unconformably underlain by the Cretaceous Lance Formation and regionally overlain by either the Eocene Wasatch or Battle Spring Formation.
The Lance Formation is described as a gray to buff fine-grained to very fine-grained silty sandstone interbedded with drab to light-green to gray locally carbonaceous siltstone and thin conglomeratic lenses locally. The Lance Formation contains the upper Red Rim Member and the lower (unnamed) member. The Red Rim Member is a prominent sandstone package named for its color as it crops out south of Interstate 80 on the eastern rim of the WB.
Overbank and floodplain deposits in the Battle Spring Formation also were likely to restrict groundwater flow. These boundaries focused uranium-rich waters into confined permeable units. Faulting also created structural and permeability control.
Geology of the Wind River Basin
The Clarkson Hill project area is located in the eastern portion of the Wind River Basin (“WRB”). The WRB is a structural basin in west-central Wyoming. The basin is bounded by the Wind River Range to the west, the Casper Arch to the east, the Owl Creek Mountains to the north and the Granite Mountains to the south. The WRB is filled with marine, lacustrine and fluvial sediments ranging in age from Paleozoic to Cenozoic.
Both the Wind River and Fort Union Formations are Cenozoic fluvial sedimentary deposits containing sandstone with economic quantities of uranium. The primary source of sediments for the Wind River and Fort Union Formations in the eastern WRB was the ancestral Granite Mountains along the southern boundary of the basin. The Granite Mountains were formed during the Laramide Orogeny, a period of extensive mountain building, which began at the end of the Mesozoic Era and continued into the early Cenozoic Era. Subsequent erosion of the Granite Mountain highlands coupled with the down-warping of adjacent basins, such as the Wind River and Powder River Basins, combined to accumulate thousands of feet of sedimentary deposits.
The Paleocene Fort Union is the oldest Tertiary formation and consists of sandstone, siltstone, shale, coal and local conglomerates. The Fort Union is overlain, often unconformably, by the Eocene Wind River Formation, which consists of sandstones, conglomerates, siltstones and shale. Overlying the Wind River Formation is the Oligocene White River Formation. The White River Formation also consists of sandstones, siltstone and shale, however, along with fluvial deposition of the sands and clays, substantial volumes of windblown volcanic ash (tuffs) were also deposited. This volcanic ash is regarded by many as the source of uranium for many Wyoming sandstone uranium deposits. Economic uranium deposits in the WRB typically occur as roll-front deposits in porous sandstones within the Wind River and Fort Union Formations.
Material Project Descriptions in Wyoming
Irigaray CPP
The following technical and scientific description for the Irigaray CPP Project area (the “Irigaray Project Area”) is based in part on the TRS titled “S-K 1300 Mineral Resource Report Wyoming Assets ISR Hub and Spoke Project, WY USA”, dated March 31, 2022, prepared by Western Water Consultants d/b/a WWC Engineering (“WWC”), a qualified firm (the “QP” herein). The Irigaray Project Area does not have mineral reserves and is therefore considered an Exploration Stage property under S-K 1300 definitions, despite a history of commercial production.
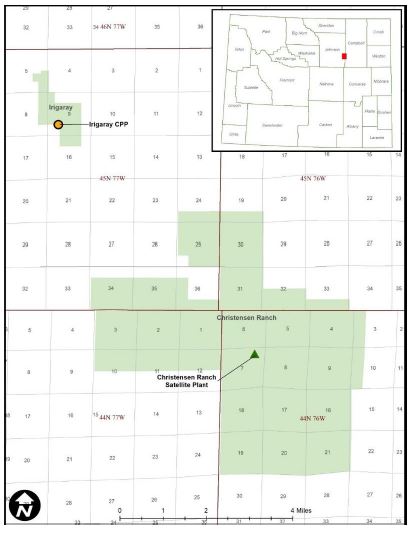
Figure 2.3 – Location of the Irigaray Project
Property Description
The Irigaray Project Area is located in Johnson County, Wyoming, northwest of Pumpkin Buttes and near Willow Creek, within the PRB, at latitude 43.8683 and longitude 106.1186 in decimal degrees. The Irigaray Project Area covers 2,320 acres, including all (or portions of) 12 sections of the PRB.
The Irigaray Project Area is approximately 70 air miles north-northeast of Casper, Wyoming, 48 air miles southeast of Buffalo, Wyoming, and 40 air miles southwest of Gillette. The Irigaray Project Area can be accessed from Casper, Wyoming, by traveling north on I-25, exit onto State Highway 259 at Midwest turn onto State Highway 387, turn left onto State Highway 192 toward Lynch, travel approximately six miles past Lynch, then turn right onto Streeter Road County Road 135 and follow signs to Irigaray and/or Christensen site. From Buffalo travel south on I-25 exit onto Trabing Road County Road 13, travel for approximately 14 miles then exit left onto Irigaray Road and follow signs to the Irigaray site. For access from Gillette, take State Highway 50 south approximately 25 miles exit right onto Black and Yellow Road, travel for approximately 20 miles and follow signs to Irigaray. The Irigaray Project Area is primarily located on private surface land, federal BLM land and a portion located on one section of state-managed land.
The site is accessible year-round on county and private roads which are shared by oil and gas operators and ranchers. Limited services are available from several smaller towns proximal to the site. Primarily, services and personnel are available from Buffalo, Gillette, and Casper. Casper and Gillette provide flight services with daily service to Denver, Billings and Salt Lake City. Water is sourced locally at the mine while electrical service is provided by a regional power company.
UEC’s mineral holdings in the Irigaray Project Area include two State of Wyoming uranium leases (480 acres) and 92 unpatented lode claims on federally administered minerals (1,840 acres). These mineral holdings comprise 2,320 acres. All payments for all leases and claims are up to date.
History
Uranium was first discovered in the southern PRB during the early 1950s. By the mid- to late 1950s, small open pit mine operations were established in the PRB. Early prospecting and exploration included geologic mapping and gamma surveys, which led to discoveries of uranium in the Wasatch and Fort Union Formations. Extensive drill hole exploration has been utilized to locate deeper uranium mineralization since the 1960s to progress geologic models.
The table below describes the historic ownership and operations at the Irigaray Project Area.
Table 2.7: Historic Ownership and Operations at the Irigaray Project Area
| Year |
Company |
Operations/Activity |
Amount (No. of Drill holes) |
Results of Work |
| 1969 |
Homestake Mining (“Homestake”) |
Original controller of the Irigaray Project Area. |
Approximately 1,340 |
Right to mine secured. Preliminary delineation of mineralized areas. |
| 1975 |
Westinghouse Electric Corporation (“Westinghouse”) |
Acquired property from Homestake. The project was licensed for ISR production in 1978 and was operated by Wyoming Mineral Corporation, a subsidiary of Westinghouse. Operations ceased in 1982 due to market trends. |
Approximately 470 |
Delineation of mineralized areas. Began ISR production. |
| 1987 |
Malapai Resources Company (“Malapai”) |
Acquired property from Westinghouse. |
None |
Ownership transition. |
| 1990 |
Total Minerals Corporation (“TOMIN”) and Électricité de France (“EDF”) |
Acquired property from Malapai. TOMIN acted as project operator. |
None |
Ownership transition. |
| 1993 |
COGEMA Resources, Inc. (“COGEMA”) (now Orano S.A.)/Areva |
Replaced TOMIN as project operator in partnership with EDF. COGEMA acquired interests from TOMIN. |
Approximately 20 |
0.74 million lb. of U3O8 produced from 1978 through 2000. |
| 2010 |
Uranium One |
Dried many millions of pounds from Christensen Ranch and through toll milling. |
N/A |
Decommissioned Irigaray wellfields. |
| 2021 |
UEC |
Irigaray Project Area acquired by UEC from Uranium One. |
N/A |
Ownership transition. |
Property Condition and Proposed Development
The condition of the property is very good, and meets all standards and requirements of Federal, State and local regulations. Future development of the property includes a proposed expansion of the permit boundary to include future Mine Units 15 through 19 and further delineation of known roll front type deposits through exploration and delineation drilling. Seventeen (17) exploration and delineation holes were drilled in 2023 in sections 28 and 33, T45N R77W, in the future Mine Unit 15 area.
Facilities, Infrastructure and Underground Development
The Irigaray CPP was first constructed in 1977-1978. Mining occurred at the time in Wellfields 1 through 9. These wellfields have gone through groundwater restoration, decommissioning and final reclamation, which has been approved by the Wyoming DEQ. Currently, the only facilities at the Irigaray Project are the CPP and associated infrastructure including evaporation ponds, access roads, power lines and chemical and fuel storage tanks. The CPP was upgraded in 2009 by removing the original equipment and adding replacement elution systems, additional precipitation tanks, new concrete foundations and upgrades to the filter press and other equipment. The CPP now contains two complete resin elution systems, multiple precipitation areas, filter press, yellowcake thickeners, and a calciner for drying yellowcake product. A vacuum dryer is in storage at the CPP for future installation when needed. The plant is capable of accepting third party resins for stripping, precipitation and drying of yellowcake product, as well as our own resins from Christensen Ranch and other properties. Although the building is older, it has been maintained in good condition. The entire CPP roof was replaced in 2021.
Permit Status and Encumbrances
The Irigaray Project is permitted under Wyoming Department of Environmental Quality (“WDEQ”), Land Quality Division (“LQD”) Permit to Mine No. 478. The project is also licensed under WDEQ/LQD Uranium Recovery Program Radioactive Materials License WYSUA-1341, formerly a U.S. NRC license. Wyoming became an Agreement State for NRC regulation in 2018. Permit to Mine No. 478 and Radioactive Materials License WYSUA-1341 are in good standing, with no violations of permit or license conditions. Mining permit requirements can be found in Wyoming Statutes §35-11-400 through 437, with specific laws for ISR mining in sections 426 – 436. Conditions of the Radioactive Materials License applicable to ISR mining are generally standard for all licensees. Requirements of Radioactive Materials Licenses are found in WDEQ, LQD/Uranium Recovery Program Chapter 4 Rules and Regulations for Licensing of Source and Byproduct Material. There are no materially significant encumbrances on the Irigaray Project. Standard encumbrances include reclamation bonding, mining and surface lease royalties.
Geologic setting, Mineralization and Deposit
The Irigaray Project Area resides in the Powder River Basin and targets mineralization in the Eocene-aged Wasatch Formation. For additional information, refer to the discussion on the Powder River Basin geology previously outlined.
Mineralization in the Irigaray Project Area occurs in fluvial sandstones of the lower parts of the Wasatch Formation. Most of the upper Wasatch Formation has been eroded away. The sandstones are arkosic, fine- to coarse-grained with local calcareous lenses. The sandstones contain minor amounts of organic carbon that occurs as dispersed bits or as stringers. Unaltered sandstones are generally gray, while altered sandstones are tan or pink due to hematite or show yellowish coloring due to limonite.
Pyrite occurs in several forms within the host sandstones. In unaltered sandstones, pyrite occurs as small to large single euhedral crystals associated with magnetite, ilmenite and other dark detrital minerals. In altered sandstone, pyrite is typically absent, but locally occurs as tarnished, very fine-grained euhedral crystals. In areas of intense or heavy mineralization, pyrite locally occurs as massive, tarnished crystal aggregates (Utah International, 1971).
The Irigaray Project Area contains portions of four alteration systems, all within fluvial sands of the Wasatch Formation. These fluvial host systems are labelled K1, K2, K3 and K4 sands and are in descending order. These sands vary in thickness from 0 feet to 100 feet within the Irigaray Project Area. They coalesce within portions of the Irigaray Project Area and form massive sand sequences of roughly 250 feet (80 m) in thickness. These sands in turn host the K1, K2, K3 and K4 uranium roll-front systems, each of which is composed of multiple stacked individual roll-front deposits.
Table 2.8 – Mineral Resources for the Irigaray Project as at the date of this Annual Report
| Classification |
Tons Ore (000’s) |
Tonnes Ore (1000’s) |
Average Grade (% eU3O8) |
Pounds eU3O8 (000’s) |
| Measured |
- |
- |
- |
- |
| Indicated |
3,881 |
3,521 |
0.076 |
5,899.0 |
| Total M&I |
3,881 |
3,521 |
0.076 |
5,899.0 |
| Inferred |
104 |
94 |
0.068 |
141.0 |
| Total Resources |
3,985 |
3,615 |
0.076 |
6,040.0 |
Notes:
| 1. |
The sum of resource tons and lbs. may not add up to the reported total due to rounding. |
|
| 2. |
Measured, indicated and inferred mineral resources as defined in 17 CFR § 229.1300. |
|
| 3. |
GT Cutoff = 0.25 m% eU3O8 |
|
| 4. |
All reported resources occur below the static water table. |
|
| 5. |
The point of reference for mineral resources is in-situ at the Project. |
|
| 6. |
Mineral resources that are not mineral reserves do not have demonstrated economic viability. |
Christensen Ranch ISR Project
The following technical and scientific description for the Christensen Ranch Project area (the “Christensen Ranch Project Area”) is based in part on the TRS titled “S-K 1300 Mineral Resource Report Wyoming Assets ISR Hub and Spoke Project, WY USA”, dated March 31, 2022, prepared by WWC, a qualified firm (the “QP” herein). The Christensen Ranch Project Area does not have mineral reserves and is therefore considered an Exploration Stage property under S-K 1300 definitions, despite a history of commercial production.

Figure 2.4 – Location of the Christensen Ranch Project
Property Description
The Christensen Ranch Project Area is located in Johnson and Campbell Counties, Wyoming, west of Pumpkin Buttes within the PRB, at latitude 43.7982 and longitude -106.0235 in decimal degrees. The Christensen Ranch Project Area covers 11,140 acres, including all (or portions of) 30 sections of the PRB.
The Christensen Ranch Project Area is approximately 70 air miles north-northeast of Casper, Wyoming, 48 air miles southeast of Buffalo, Wyoming and 40 air miles southwest of Gillette. The Christensen Ranch Project Area can be accessed from Casper, Wyoming, by traveling north on I-25, exit onto State Highway 259 at Midwest turn onto State Highway 387, turn left onto State Highway 192 toward Lynch, travel approximately six miles past Lynch, turn right onto Streeter Road County Road 135, and then follow the signs to the Christensen site. From Buffalo travel south on I-25 exit onto Trabing Road County Road 13, travel for approximately 14 miles, then exit left onto Irigaray Road and follow signs to the Christensen site. For access from Gillette, take State Highway 50 south approximately 25 miles exit right onto Black and Yellow Road, travel for approximately 20 miles, then follow signs to Christensen. The Christensen Ranch Project is located 13 miles to the southeast of the Irigaray Central Processing Plant and is accessed by travelling west on Black and Yellow Road to Irigaray Road. The Christensen Ranch Project Area is primarily located on private surface land, with two portions located on federal BLM-managed land.
The site is accessible year-round on county and private roads which are shared by oil and gas operators and ranchers. Limited services are available from several smaller towns proximal to the site. Primarily, services and personnel are available from Buffalo, Gillette and Casper. Casper and Gillette provide flight services with daily service to Denver, Billings and Salt Lake City. Water is sourced locally at the mine while electrical service is provided by a regional power company.
UEC’s mineral holdings in the Christensen Ranch Project Area include one State of Wyoming uranium lease (1,280 acres), 358 unpatented lode claims on federally administered minerals (9,140 acres) and one fee (private) mineral lease (720 acres). These mineral holdings comprise 11,140 acres. All payments for all leases and claims are up to date.
History
Uranium was first discovered in the southern PRB during the early 1950s. By the mid- to late 1950s, small open pit mine operations were established in the PRB. Early prospecting and exploration included geologic mapping and gamma surveys, which led to discoveries of uranium in the Wasatch and Fort Union Formations. Extensive drill hole exploration has been utilized to locate deeper uranium mineralization since the 1960s to progress geologic models.
The table below describes the historic ownership and operations at the Christensen Ranch Project Area.
Table 2.9: Historic Ownership and Operations at the Christensen Ranch Project Area
| Year |
Company |
Operations/Activity |
Amount (No. of Drill holes) |
Results of Work |
| 1967 |
Independent Operators |
Assembled as a large land package by independent operators. |
Approximately 4,860 |
Right to mine secured. Preliminary delineation of mineralized areas. |
| 1979 |
Arizona Public Services (“APS”), parent company of Malapai |
APS became a 50% partner in 1979. |
Approximately 2,220 |
Delineation of mineralized areas. |
| 1981 |
Malapai |
Malapai assumed sole ownership of the Christensen Ranch Project Area by acquiring the interests of Wold Energy (“Wold”) and Western Nuclear Corporation (“WNC”). Malapai purchased the Irigaray Project Area from Westinghouse in 1987, and the Christensen Ranch Project Area was licensed for operations under the Irigaray U.S. NRC and Wyoming Department of Environmental Quality (“WDEQ”) license/permit in 1988. Uranium production by ISR was started by Malapai in 1989 and was placed on standby in 1990. | Approximately 1,460 |
Delineation of mineralized areas. Began ISR production. |
| 1990 |
TOMIN and EDF |
EDF acquired the Irigaray and Christensen Ranch Project Areas from Malapai in 1990. TOMIN acted as project operator for EDF under a joint participation agreement. TOMIN restarted ISR operations in 1991. |
Approximately 2,270 |
Delineation of mineralized areas. Restarted ISR production. |
| 1993 |
COGEMA and EDF |
In 1993, COGEMA acquired the assets of TOMIN and changed the name of the operating entity to COGEMA Mining, Inc. EDF (now Malapai) was still owner of 29%, COGEMA, as operator, owned 71% through the joint participation agreement. |
Approximately 3,690 |
3.70 million lbs of U3O8 produced from 1989 through 2000. |
| 2000 |
COGEMA and Malapai |
Groundwater restoration of Mine Units 2 through 6 was completed. The Christensen Ranch Project Area was placed on standby from 2006 through 2010, at which time COGEMA and Malapai sold the project to Uranium One and Uranium One USA, Inc. (collectively, “Uranium One”). |
N/A |
188,000 lbs of U3O8 produced during restoration. |
| 2010 |
Uranium One |
Mine Units 7, 8 and 10 were installed and operated. A ramp up occurred in 2011, and a ramp down occurred in 2013 (all wellfield development ceased). Low production mode occurred in 2014 through 2018, and production ended in 2018, at which time the Christensen Ranch Project Area was placed on care and maintenance. |
N/A |
2.6 million lbs of U3O8 produced. |
| 2021 |
UEC |
The Christensen Ranch Project Area acquired by UEC from Uranium One. |
N/A |
Ownership transition. |
Property Condition and Proposed Development
The condition of the property is very good while meeting all standards and requirements of Federal, State and local regulations. Development activity to advance the property includes the installation and completion of production and injection wells in Mine Unit 10. Additionally, exploration and delineation holes are planned in an area adjacent to Mine Unit 5.
Facilities, Infrastructure and Underground Development
The Christensen Ranch Project facilities include the ion exchange satellite plant, four evaporation ponds, one permeate storage pond, two EPA Class I injection disposal wells, several miles of buried production and injection trunklines connecting Mine Units to the satellite plant, access roads, office building, maintenance shop, powerlines, and eight installed wellfields (Mine Units 2, 3, 4, 5, 6, 7, 8 and 10). Mine Units 2, 3, 4 and 6 have gone through groundwater restoration, which has been approved by Wyoming DEQ. These wellfields are undergoing decommissioning. Mine Units 7, 8 and 10 have been partially mined and will be the focus of resuming operations. Operations in portions of Mine Unit 5 may also be resumed in the future. All facilities are in very good condition.
Permit Status and Encumbrances
The Christensen Ranch Project is permitted under WDEQ Permit to Mine No. 478. The project is also licensed under WDEQ Radioactive Materials License WYSUA-1341, formerly a U.S. NRC license. Wyoming became an Agreement State for NRC regulation in 2018. Permit to Mine No. 478 and Radioactive Materials License WYSUA-1341 are in good standing, with no violations of permit or license conditions. Mining permit requirements can be found in Wyoming Statutes §35-11-400 through 437, with specific laws for ISR mining in sections 426 – 436. Conditions of the Radioactive Materials License applicable to ISR mining are generally standard for all licensees. Requirements of Radioactive Materials Licenses are found in WDEQ, LQD/Uranium Recovery Program Chapter 4 Rules and Regulations for Licensing of Source and Byproduct Material. There are no materially significant encumbrances on the Christensen Ranch Project. Standard encumbrances include reclamation bonding, mining and surface lease royalties.
Geologic Setting, Mineralization and Deposit
The Christensen Ranch Project Area targets mineralization in the Eocene-aged Wasatch Formation of the Powder River Basin.
Mineralization in the Christensen Ranch Project Area occurs in fluvial sandstones of the lower parts of the Wasatch Formation. Most of the upper Wasatch Formation has been eroded away. The sandstones are arkosic, fine- to coarse-grained with local calcareous lenses. The sandstones contain minor amounts of organic carbon that occurs as dispersed bits or as stringers. Unaltered sandstones are generally gray, while altered sandstones are tan or pink due to hematite, or show yellowish coloring due to limonite.
Pyrite occurs in several forms within the host sandstones. In unaltered sandstones, pyrite occurs as small to large single euhedral crystals associated with magnetite, ilmenite and other dark detrital minerals. In altered sandstone, pyrite is typically absent, but locally occurs as tarnished, very fine-grained euhedral crystals. In areas of intense or heavy mineralization, pyrite locally occurs as massive, tarnished crystal aggregates.
The Christensen Ranch Project Area contains portions of four alteration systems, all within fluvial sands of the Wasatch Formation. These fluvial host systems are identified as K1, K2, K3 and K4 sands and are in descending order. These sands vary in thickness from 0 feet to 100 feet within the Christensen Ranch Project Area. They coalesce within portions of the Christensen Ranch Project Area and form massive sand sequences of roughly 250 feet (80 m) in thickness. These sands in turn host the K1, K2, K3 and K4 uranium roll-front systems, each of which is composed of multiple stacked individual roll-front deposits.
Uranium mineralization at the Christensen Ranch Project Area is typical of Wyoming roll-front sandstone deposits. The formation of roll-front deposits is largely a groundwater process that occurs when uranium-rich, oxygenated groundwater interacts with a reducing environment in the subsurface and precipitates uranium. The most favorable host rocks for roll-fronts are permeable sandstones with large aquifer systems. Interbedded mudstone, claystone and siltstone are often present and aid in the formation process by focusing groundwater flux. The geometry of mineralization is dominated by the classic roll-front “C” shape or crescent configuration at the redox interface. The highest-grade portion of the front occurs in a zone termed the “nose” within reduced ground just ahead of the alteration front. Ahead of the nose, at the leading edge of the solution front, mineral quality gradually diminishes to barren within the “seepage” zone. Trailing behind the nose, in oxidized (altered) ground, are weak remnants of mineralization referred to as “tails” which have resisted re-mobilization to the nose due to association with shale, carbonaceous material or other lithologies of lower permeability. Tails are generally not amenable to ISR because the uranium is typically found within strongly reduced or impermeable strata, therefore making it difficult to leach.
Table 2.10 – Mineral Resources for the Christensen Ranch Project as at the date of this Annual Report
| Classification |
Tons Ore (000’s) |
Tonnes Ore (1000’s) |
Average Grade (% eU3O8) |
Pounds eU3O8 (000’s) |
| Measured |
- |
- |
- |
- |
| Indicated |
6,555 |
5,947 |
0.073 |
9,596 |
| Total M&I |
6,555 |
5,947 |
0.073 |
9,596 |
| Inferred |
- |
- |
- |
- |
| Total Resources |
6,555 |
5,947 |
0.073 |
9,596 |
Notes:
| 1. |
The sum of resource tons and lbs. may not add up to the reported total due to rounding. |
|
| 2. |
Measured, indicated, and inferred mineral resources as defined in 17 CFR § 229.1300. |
|
| 3. |
GT Cutoff = 0.25 m% eU3O8 |
|
| 4. |
All reported resources occur below the static water table. |
|
| 5. |
The point of reference for mineral resources is in-situ at the Project. |
|
| 6. |
Mineral resources that are not mineral reserves do not have demonstrated economic viability |
Moore Ranch ISR Project
The following technical and scientific description for the Moore Ranch Project area (the “Moore Ranch Project Area”) is based in part on the TRS titled “S-K 1300 Mineral Resource Report Wyoming Assets ISR Hub and Spoke Project, WY USA”, dated March 31, 2022, prepared by WWC, a qualified firm (the “QP” herein). The Moore Ranch Project Area does not have mineral reserves and is therefore considered an Exploration Stage property under S-K 1300 definitions, despite a history of commercial production.

Figure 2.5 – Location of the Moore Ranch Project
Property Description
The Moore Ranch Project Area is located in Campbell County, Wyoming, the southern portion of the Pumpkin Buttes within the PRB, at latitude 43.5652 and longitude ‑105.8480 in decimal degrees. The Moore Ranch Project area covers 4,180 acres, including all (or portions of) 16 sections of the PRB.
The Moore Ranch Project Area is 54 air miles northeast of Casper, Wyoming, and 24 miles southwest of Wright, Wyoming, along State Highway 387. The Moore Ranch Project Area is primarily located on private surface land with some areas of state-managed land.
The site is accessible year-round via state, county and private roads which are shared by oil and gas operators and ranchers. Services and personnel are available from Gillette or Casper. Flight service is offered from Gillette or Casper with daily service to Denver, Billings and Salt Lake City. Water will be sourced locally while electrical service will be provided by a regional power company.
UEC’s mineral holdings within the Moore Ranch Project Area include three State of Wyoming uranium leases (1,280 acres), 86 unpatented lode claims on federally administered minerals (1,720 acres) and four fee (private) mineral leases (1,180 acres). These mineral holdings comprise 4,180 acres. All payments for all leases and claims are up to date.
History
Uranium was first discovered in the southern PRB during the early 1950s. By the mid- to late 1950s, small open pit mine operations were established in the PRB. Early prospecting and exploration included geologic mapping and gamma surveys, which led to discoveries of uranium in the Wasatch and Fort Union Formations. Extensive drill hole exploration has been utilized to locate deeper uranium mineralization since the 1960s to progress geologic models.
The table below describes the historic ownership and operations at the Moore Ranch Project Area.
Table 2.11: Historic Ownership and Operations at the Moore Ranch Project Area
| Year |
Company |
Operations/Activity |
Amount (No. of Drill holes) |
Results of Work |
| 1971 |
Conoco Minerals (“Conoco”) and Kerr-McGee Corporation (“Kerr-McGee”) |
Conoco and Kerr-McGee operated as a joint venture. Of the joint venture, Conoco controlled 50% of the Moore Ranch Project Area and served as the operator. |
Approximately 2,700 rotary drill holes Approximately 130 core holes |
Discovery and delineation of mineralized areas. Permitting and licensing of a proposed uranium processing facility known as Sand Rock Mill was completed through the WDEQ/LQD and the NRC. |
| 1983 |
Wold and Kerr-McGee |
Conoco sold its interests to Wold in 1983. Kerr-McGee retained the rights with Wold. Assessment drilling was conducted. |
None |
Retained mining claims. Mining claim assessment drilling. |
| 1989 |
Rio Algom Mining Corp. |
Rio Algom acquired the project in 1989. Rio Algom conducted mining claim assessment drilling to retain mining claims through 1992, which was the last year to allow mining claim assessment drilling. |
None |
Retained mining claims. Mining claim assessment drilling. |
| 1992 |
Rio Algom |
Claim maintenance paid directly to the BLM. No further drilling conducted. |
None |
Mining claims retained through payment. |
| 2002 |
Power Resources, Inc. (“PRI”) |
Rio Algom acquired by PRI. |
None |
Ownership transition. |
| 2004 |
Energy Metals Corporation (“EMC”) |
EMC acquired most of the mining claims and state leases. |
N/A |
Secured right to mine. |
| 2007 |
Uranium One |
Uranium One acquired EMC and all rights to the Moore Ranch Project Area. Uranium One completed verification and resource enhancement drilling, coring, baseline monitor wells, and pump test wells. The Moore Ranch Project Area is fully permitted by WDEQ/LQD in 2011 and the NRC in 2013. |
Approximately 800 |
Exploration efforts focused on developing and upgrading mineral resources. |
| 2021 |
UEC |
Moore Ranch Project Area acquired by UEC from Uranium One. |
N/A |
Ownership transition. |
Property Condition and Proposed Development
The condition of the property is good while meeting all standards and requirements of Federal, State and local regulations. Development is in the planning stage with no immediate plans for exploration or delineation drilling.
Facilities, Infrastructure and Underground Development
Facilities or wellfields have not been constructed to date. Power lines are constructed and accessible in the area.
Permit Status and Encumbrances
The Moore Ranch Project is permitted under WDEQ Permit to Mine No. 777. The project is also licensed under WDEQ Radioactive Materials License WYSUA-1596, formerly a U.S. NRC license. Wyoming became an Agreement State for NRC regulation in 2018. Permit to Mine No. 777 and Radioactive Materials License WYSUA-1596 are in good standing, with no violations of permit or license conditions. Mining permit requirements can be found in Wyoming Statutes §35-11-400 through 437, with specific laws for ISR mining in sections 426 – 436. Conditions of the Radioactive Materials License applicable to ISR mining are generally standard for all licensees. Requirements of Radioactive Materials Licenses are found in WDEQ, LQD/Uranium Recovery Program Chapter 4 Rules and Regulations for Licensing of Source and Byproduct Material. There are no materially significant encumbrances on the Moore Ranch Project. Standard encumbrances include reclamation bonding, mining and surface lease royalties.
Geologic Setting, Mineralization and Deposit
The Moore Ranch Project Area targets mineralization in the Eocene-aged Wasatch Formation.
Mineralization in the Moore Ranch Project Area occurs in fluvial sandstones of the lower parts of the Wasatch Formation. Most of the upper Wasatch Formation has been eroded away. The sandstones are arkosic, fine- to coarse-grained with local calcareous lenses. The sandstones contain minor amounts of organic carbon that occurs as dispersed bits or as stringers. Unaltered sandstones are generally gray, while altered sandstones are tan or pink due to hematite, or show yellowish coloring due to limonite.
Pyrite occurs in several forms within the host sandstones. In unaltered sandstones, pyrite occurs as small to large single euhedral crystals associated with magnetite, ilmenite and other dark detrital minerals. In altered sandstone, pyrite is typically absent, but locally occurs as tarnished, very fine-grained euhedral crystals. In areas of intense or heavy mineralization, pyrite locally occurs as massive, tarnished crystal aggregates.
Geology at the Moore Ranch Project Area is similar to the geology at the North and Southwest Reno Creek resource areas and includes the Felix and Badger coals. The mineralized host sand lies 5 to 30 feet below this coal bed and at a depth of 200–350 feet below the surface. The host sandstone is 80-150 feet thick.
Uranium mineralization at the Moore Ranch Project Area is typical of Wyoming roll-front sandstone deposits. The formation of roll-front deposits is largely a groundwater process that occurs when uranium-rich, oxygenated groundwater interacts with a reducing environment in the subsurface and precipitates uranium. The most favorable host rocks for roll-fronts are permeable sandstones with large aquifer systems. Interbedded mudstone, claystone and siltstone are often present and aid in the formation process by focusing groundwater flux. The geometry of mineralization is dominated by the classic roll-front “C” shape or crescent configuration at the redox interface. The highest-grade portion of the front occurs in a zone termed the “nose” within reduced ground just ahead of the alteration front. Ahead of the nose, at the leading edge of the solution front, mineral quality gradually diminishes to barren within the “seepage” zone. Trailing behind the nose, in oxidized (altered) ground, are weak remnants of mineralization referred to as “tails” which have resisted re-mobilization to the nose due to association with shale, carbonaceous material or other lithologies of lower permeability. Tails are generally not amenable to ISR because the uranium is typically found within strongly reduced or impermeable strata, therefore making it difficult to leach.
Table 2.12 – Mineral Resources for the Moore Ranch Project as at the date of this Annual Report
| Classification |
Tons Ore (000’s) |
Tonnes Ore (1000’s) |
Average Grade (% eU3O8) |
Pounds eU3O8 (000’s) |
| Measured |
2,675 |
2,427 |
0.06 |
3,210.0 |
| Indicated |
- |
- |
- |
- |
| Total M&I |
2,675 |
2,427 |
0.06 |
3,210.0 |
| Inferred |
46 |
42 |
0.047 |
43.7 |
| Total Resources |
2,721 |
2,469 |
0.06 |
3,253.7 |
Notes:
| 1. |
The sum of resource tons and lbs. may not add up to the reported total due to rounding. |
|
| 2. |
Measured, indicated, and inferred mineral resources as defined in 17 CFR § 229.1300. |
|
| 3. |
GT Cutoff = 0.3 m% eU3O8 |
|
| 4. |
All reported resources occur below the static water table. |
|
| 5. |
The point of reference for mineral resources is in-situ at the Project. |
|
| 6. |
Mineral resources that are not mineral reserves do not have demonstrated economic viability. |
Reno Creek ISR Project
The following technical and scientific description for the Reno Creek Project area (the “Reno Creek Project Area”) is based in part on the TRS titled “S-K 1300 Mineral Resource Report Wyoming Assets ISR Hub and Spoke Project, WY USA”, dated March 31, 2022, prepared by WWC, a qualified firm (the “QP” herein). The Reno Creek Project Area does not have mineral reserves and is therefore considered an Exploration Stage property under S-K 1300 definitions.
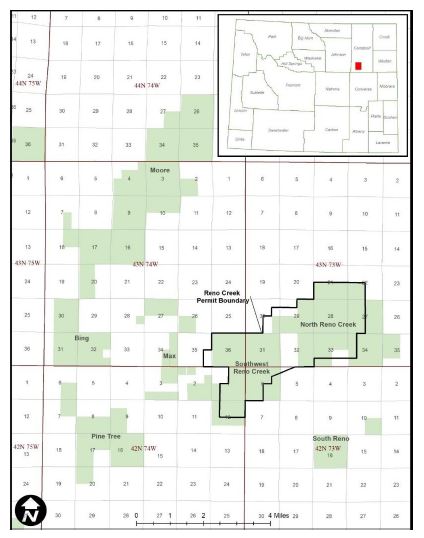
Figure 2.6 - Location of the Reno Creek Project
Property Description
The Reno Creek Project Area is in Campbell County, Wyoming, within the PRB, at latitude 43.6796 and longitude ‑105.7226 in decimal degrees. The Reno Creek Project Area covers 18,763 acres, including all (or portions of) 46 sections of the PRB.
The Reno Creek Project Area is approximately five miles to the northwest of the North and Southwest Reno Creek Resource Areas. The Pine Tree resource area lies approximately five miles to the southwest of the permitted resource areas, immediately southeast of the intersection of U.S. Highway 387 and Wyoming Highway 50, also known as Pine Tree Junction. The Bing resource area lies approximately five miles west of the permitted resource areas adjacent to Wyoming Highway 50, three miles north of Pine Tree Junction.
The site is accessible year-round via state, county and private roads which are shared by oil and gas operators and ranchers. Services and personnel are available from Gillette or Casper. Flight service is offered from Gillette or Casper with daily service to Denver, Billings, and Salt Lake City. Water will be sourced locally while electrical service will be provided by a regional power company.
UEC’s mineral holdings in the Reno Creek Project Area include four State of Wyoming uranium leases (3,200 acres), 549 unpatented lode claims on federally administered minerals (10,980 acres) and 36 fee (private) mineral leases (4,583 acres). The mineral holdings comprise 18,763 acres. All payments for all leases and claims are up to date.
History
Uranium was first discovered in the southern PRB during the early 1950s. By the mid- to late- 1950s, small open pit mine operations were established in the PRB. Early prospecting and exploration included geologic mapping and gamma surveys, which led to discoveries of uranium in the Wasatch and Fort Union Formations. Extensive drill hole exploration has been utilized to locate deeper uranium mineralization since the 1960s to progress geologic models.
The table below describes the historic ownership and operations at the Reno Creek Project Area.
Table 2.13: Historic Ownership and Operations at the Reno Creek Project Area
| Year |
Company |
Operations/Activity |
Amount (No. of Drill holes) |
Results of Work |
| Reno Creek – North Reno Creek |
||||
| Late 1960s |
Rocky Mountain Energy Company (“RME”) |
Drilled exploration holes at and around North Reno Creek resource area. |
Approximately 5,800 |
Delineated Approximately 10 miles of roll-front deposits. |
| Mid 1970s |
RME, Mono Power Company (“Mono”) and Halliburton Services |
Partnership formed to develop North Reno Creek Resource Area using ISR methods. |
N/A |
Acquisition of the Reno Creek Project Area. |
| 1992 |
Energy Fuels Nuclear Inc./International Uranium Corporation |
Energy Fuels Nuclear Inc. acquired RME’s North Reno Creek Resource Area and later became International Uranium Corporation. |
N/A |
Acquisition of the Reno Creek Project Area. |
| 2001 |
Rio Algom |
Rio Algom acquired International Uranium Corporation’s property. |
N/A |
Acquisition of the Reno Creek Project Area. |
| 2001 |
PRI |
PRI acquired North Reno Creek Area and dropped claims in 2003. |
N/A |
Acquisition of the Reno Creek Project Area and mining claims dropped. |
| 2004 |
Strathmore Minerals Corporation and American Uranium Corporation (“AUCA”) |
Re-staked and filed new mining claims on approximately 16,000 acres. |
N/A |
Refiled mining claims and secured right to mine. |
| 2007 |
AUCA |
Advanced project through acquisition of most major permits and required authorizations. |
N/A |
Acquisition of the Reno Creek Project Area and secured permits and authorizations. |
| 2017 |
UEC |
Consolidated ownership of multiple resource areas and oversaw technical reporting and auditing of Project resources. |
N/A |
Consolidation of ownership. Auditing of project resources. |
| Reno Creek – Southwest Reno Creek |
||||
| Pre-2007 |
AUCA and Tennessee Valley Authority JV |
Controlled Southwest Reno Creek and drilled exploration holes. |
Approximately 700 |
Delineation of mineralized areas. |
| 2007 |
AUCA |
Advanced project through acquisition of most major permits and required authorizations. |
N/A |
Secured permits and required authorizations. |
| 2017 |
UEC |
Consolidated ownership of multiple Resource Areas and oversaw technical reporting and auditing of Project resources. |
N/A |
Consolidation of ownership. Auditing of the Reno Creek Project Area resources. |
| Reno Creek – Moore, Pine Tree, and Bing |
||||
| 1960s |
Utah International Mining Company |
Exploration on Moore and Pine Tree Resource Areas. |
N/A |
Delineation of mineralized areas. |
| Late 1970s |
Pathfinder Mines, Inc. |
Utah International Mining Company becomes Pathfinder Mines, Inc. and continues exploration on Moore and Pine Tree Resource Areas. |
>1,560 |
Delineation of mineralized areas. |
| 1980s |
RME |
Obtained ownership of Moore Area, continued exploration drilling until the 1990s. |
>400 |
Acquired the Reno Creek Project Area. Delineation of mineralized areas. |
| 1960s |
Cleveland-Cliffs Iron Company |
Exploration of Bing Area, drilled several hundred exploration holes and conducted limited hydrologic testing in the 1970s. |
177 |
Delineation of mineralized areas through drilling and conducted hydrologic testing. |
| 2007 |
AUCA |
Consolidated the Resource Areas under one owner. |
N/A |
Consolidated ownership. |
| 2017 |
UEC |
Oversaw technical reporting and auditing of project resources. |
N/A |
Auditing of the Reno Creek Project Area resources. |
Property Condition and Proposed Development
The condition of the property is good while meeting all standards and requirements of Federal, State and local regulations. Development is in the planning stage with no immediate plans for exploration or delineation drilling.
Facilities, Infrastructure and Underground Development
Facilities or wellfields have not been constructed.
Permit Status and Encumbrances
The Reno Project is permitted under WDEQ Permit to Mine No. 824. The project is also licensed under WDEQ Radioactive Materials License WYSUA-1602, formerly a U.S. NRC license. Wyoming became an Agreement State for NRC regulation in 2018. Permit to Mine No. 824 and Radioactive Materials License WYSUA-1602 are in good standing, with no violations of permit or license conditions. Mining permit requirements can be found in Wyoming Statutes §35-11-400 through 437, with specific laws for ISR mining in sections 426 – 436. Conditions of the Radioactive Materials License applicable to ISR mining are generally standard for all licensees. Requirements of Radioactive Materials Licenses are found in WDEQ, LQD/Uranium Recovery Program Chapter 4 Rules and Regulations for Licensing of Source and Byproduct Material. There are no materially significant encumbrances on the Reno Creek Project. Standard encumbrances include reclamation bonding, mining and surface lease royalties.
Geologic Setting, Mineralization and Deposit
The Reno Creek Project Area targets mineralization in the Eocene-aged Wasatch Formation.
Mineralization in the Reno Creek Project Area occurs in fluvial sandstones of the lower parts of the Wasatch Formation. Most of the upper Wasatch Formation has been eroded away. The sandstones are arkosic, fine- to coarse-grained with local calcareous lenses. The sandstones contain minor amounts of organic carbon that occurs as dispersed bits or as stringers. Unaltered sandstones are generally gray, while altered sandstones are tan or pink due to hematite or show yellowish coloring due to limonite.
Pyrite occurs in several forms within the host sandstones. In unaltered sandstones, pyrite occurs as small to large single euhedral crystals associated with magnetite, ilmenite and other dark detrital minerals. In altered sandstone, pyrite is typically absent, but locally occurs as tarnished, very fine-grained euhedral crystals. In areas of intense or heavy mineralization, pyrite locally occurs as massive, tarnished crystal aggregates.
At the Reno Creek Project Area, the Felix Coal seams are laterally continuous in the North and Southwest Reno Creek resource areas and extend northward into the Moore and Bing resource areas. The Felix Coal seams, and the underlying Badger Coal seam, provide important correlation points across the Reno Creek Project Area. Sandstone horizons that host uranium mineralization within the production zone aquifer are typically cross-bedded, graded sequences fining upward from very coarse-grained at the base to fine-grained at the top, representing sedimentary cycles from 5-20 feet thick. Stacking of depositional cycles resulted in sandstone body accumulations over 200 feet thick.
Uranium mineralization at the Reno Creek Project Area is typical of Wyoming roll-front sandstone deposits. The formation of roll-front deposits is largely a groundwater process that occurs when uranium-rich, oxygenated groundwater interacts with a reducing environment in the subsurface and precipitates uranium. The most favorable host rocks for roll-fronts are permeable sandstones with large aquifer systems. Interbedded mudstone, claystone and siltstone are often present and aid in the formation process by focusing groundwater flux. The geometry of mineralization is dominated by the classic roll-front “C” shape or crescent configuration at the redox interface. The highest-grade portion of the front occurs in a zone termed the “nose” within reduced ground just ahead of the alteration front. Ahead of the nose, at the leading edge of the solution front, mineral quality gradually diminishes to barren within the “seepage” zone. Trailing behind the nose, in oxidized (altered) ground, are weak remnants of mineralization referred to as “tails” which have resisted re-mobilization to the nose due to association with shale, carbonaceous material or other lithologies of lower permeability. Tails are generally not amenable to ISR because the uranium is typically found within strongly reduced or impermeable strata, therefore making it difficult to leach.
Table 2.14 – Mineral Resources for the Reno Creek Project as at the date of this Annual Report
| Classification |
Tons Ore (000’s) |
Tonnes Ore (1000’s) |
Average Grade (% eU3O8) |
Pounds eU3O8 (000’s) |
| Measured |
14,990 |
13,599 |
0.043 |
12,920.0 |
| Indicated |
16,980 |
15,404 |
0.039 |
13,070.0 |
| Total M&I |
31,970 |
29,003 |
0.041 |
25,990.0 |
| Inferred |
1,920 |
1,742 |
0.039 |
1,490.0 |
| Total Resources |
33,890 |
30,745 |
0.041 |
27,480.0 |
Notes:
| 1. |
The sum of resources tons and lbs. may not add up to the reported total due to rounding. |
|
| 2. |
Measured, indicated, and inferred mineral resources as defined in 17 CFR § 229.1300. |
|
| 3. |
GT Cutoff = 0.20 m% eU3O8 |
|
| 4. |
All reported resources occur below the static water table. |
|
| 5. |
The point of reference for mineral resources is in-situ at the Project. |
|
| 6. |
Mineral resources that are not mineral reserves do not have demonstrated economic viability. |
Ludeman ISR Project
The following technical and scientific description for the Ludeman Project area (the “Ludeman Project Area”) is based in part on the TRS titled “S-K 1300 Mineral Resource Report Wyoming Assets ISR Hub and Spoke Project, WY USA”, dated March 31, 2022, prepared by WWC, a qualified firm (the “QP” herein). The Ludeman Project Area does not have mineral reserves and is therefore considered an Exploration Stage property under S-K 1300 definitions, despite a history of successful in situ research and development testing.
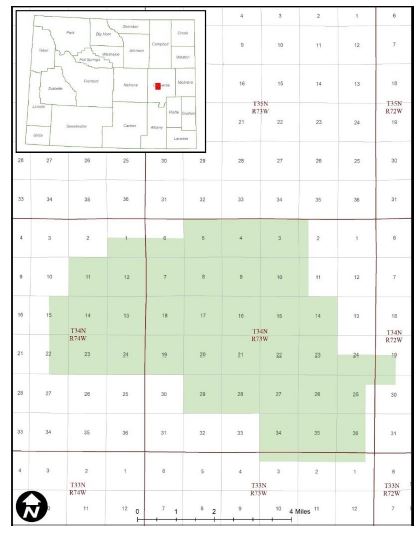
Figure 2.7 – Location of the Ludeman Project
Property Description
The Ludeman Project Area is located in Converse County, Wyoming, in the southern portion of the PRB, at latitude 42.9119 and longitude ‑105.6277 in decimal degrees. The Ludeman Project Area covers 18,101.89 acres including all (or portions of) 31 sections of the PRB.
The Ludeman Project Area is located approximately 12 miles northeast of Glenrock and 30 miles east-northeast of Casper, Wyoming. State Highway 95 provides access to the Ludeman Project Area from the Towns of Glenrock and Rolling Hills to the west and State Highway 93 provides access from Douglas to the southeast. Interstate 25 provides access to both of these state highways from the south of the Ludeman Project Area. The Ludeman Project Area is primarily located on private surface land with some areas of Federal or state lands.
The site is accessible year-round on state and county roads. Services and personnel are available from Glenrock, Douglas or from Casper, which has full services and the nearest airport with daily service to Denver and Salt Lake City. Water will be sourced locally at the site while electrical service will be provided by a regional power company.
UEC’s mineral holdings in the Ludeman Project Area include four State of Wyoming uranium leases (1,440 acres), 746 unpatented lode claims on federally administered minerals (14,920 acres) and two fee (private) mineral leases (1,741.89 acres). These mineral holdings comprise 18,101.89 acres. All payments for all leases and claims are up to date.
History
Uranium was first discovered in the southern PRB during the early 1950s. By the mid- to late 1950s, small open pit mine operations were established in the PRB. Early prospecting and exploration included geologic mapping and gamma surveys, which led to discoveries of uranium in the Wasatch and Fort Union Formations. Extensive drill hole exploration has been utilized to locate deeper uranium mineralization since the 1960s to progress geologic models.
The table below describes the historic ownership and operations at the Ludeman Project Area.
Table 2.15: Historic Ownership and operations at the Ludeman Project Area
| Year |
Company |
Operations/Activity |
Amount (No. of Drill holes) |
Results of Work |
| 1960s-1970s |
Cordero Mining |
Numerous exploration companies including Teton Exploration (“Teton”), PRI, Uranium Resources, Inc. (“URI”) and Malapai (a subsidiary of APS) collectively explored in the Ludeman Project Area. |
Approximately 5,420 |
Explored for uranium roll-front mineralization and delineated deposits in the Ludeman Project Area. |
| 1980 |
United Nuclear Corp. (“UNC”) and partner Teton |
Constructed and operated the Leuenberger ISR pilot test facility for 12 months. Groundwater restoration was completed following production and a commercial permit to mine was granted. Due to a decline in the market, the permitted mine was not placed into commercial operation and the permit expired. |
N/A |
Produced 12,800 lbs of U3O8 from the pilot facility. |
| 1981 |
URI |
Constructed and operated the North Platte ISR project on a portion of the Ludeman Project Area. The pilot test facility produced for five months during 1982. |
N/A |
Produced 1,515 lbs of U3O8 from the pilot facility. |
| 1980s |
Malapai |
Permitted the Peterson Project for pilot operations but was never operated. |
N/A |
Facility was never operated. |
| 1985-Early 1990s |
Central Electrical Generating Board of England (known as PRI) |
Nedco and Union Pacific properties were consolidated into the Teton Leuenberger Project. PRI purchased the property and added to the acreage through the purchase of adjacent claim blocks owned by Kerr-McGee. |
N/A |
Ownership transition and growth in acreage through acquisitions. |
| Late 1990s |
PRI |
Leuenberger properties were released due to declining market trends. Some claims reverted to previous owners. |
N/A |
Decrease in claims and generally the Ludeman Project Area. |
| Early to Mid- 2000s |
High Plains Uranium (“HPU”) and EMC |
HPU held most claims and leases in the Ludeman Project Area. Energy Metals held the remaining claims in the Ludeman Project Area. |
N/A |
Claims and leases increased in the Ludeman Project Area. |
| 2007 |
EMC |
EMC acquired HPU. |
N/A |
Consolidation through acquisition. |
| 2007 |
Uranium One |
Uranium One acquired Energy Metals in late 2007 and continued exploration of the Ludeman Project Area from 2007 through 2012. The primary goals of drilling included exploration to establish continuity of regional ore trends, development drilling to determine the lateral extents of the ore body, stratigraphic investigation, confirmation of the location and nature of mineralization, and collection of cores for leach testing and analysis of uranium, mineralogy, trace metals, disequilibrium, permeability, porosity and density. Acquired the WDEQ/LQD mine permit and NRC license. |
Approximately 2,180 |
Continued exploration of the Ludeman Project Area. Additional holes included boreholes, core holes, and monitor wells. |
| 2021 |
UEC |
The Ludeman Project Area acquired by UEC from Uranium One. |
N/A |
Ownership transition. |
Property Condition and Proposed Development
The condition of the property is very good while meeting all standards and requirements of Federal, State and local regulations. There are no immediate plans for exploration or delineation drilling.
Facilities, Infrastructure and Underground Development
The Ludeman property is fully permitted and licensed for commercial ISR production. The engineering and design work has been completed for the satellite plant, evaporation ponds, infrastructure, and the first Mine Unit. Construction of these facilities has not occurred to date.
Permit Status and Encumbrances
The Ludeman Project is permitted under WDEQ Permit to Mine No. 844. The project is also licensed under WDEQ Radioactive Materials License WYSUA-1341, formerly a U.S. NRC license. Wyoming became an Agreement State for NRC regulation in 2018. Permit to Mine No. 844 and Radioactive Materials License WYSUA-1341 are in good standing, with no violations of permit or license conditions. Mining permit requirements can be found in Wyoming Statutes §35-11-400 through 437, with specific laws for ISR mining in sections 426 – 436. Conditions of the Radioactive Materials License applicable to ISR mining are generally standard for all licensees. Requirements of Radioactive Materials Licenses are found in WDEQ, LQD/Uranium Recovery Program Chapter 4 Rules and Regulations for Licensing of Source and Byproduct Material. There are no materially significant encumbrances on the Ludeman Project. Standard encumbrances include reclamation bonding, mining and surface lease royalties.
Geologic Setting, Mineralization, and Deposit
The Ludeman Project Area targets mineralization in the Fort Union Formation, which underlies the Wasatch Formation. The host rocks for the uranium ore deposits in the project areas are the arkosic sandstones of the Fort Union Formation. These channel deposits are confined by mudstones that serve as aquitards to the water saturated aquifers.
Uranium mineralization at the Ludeman Project Area is typical of Wyoming roll-front sandstone deposits. The formation of roll-front deposits is largely a groundwater process that occurs when uranium-rich, oxygenated groundwater interacts with a reducing environment in the subsurface and precipitates uranium. The most favorable host rocks for roll-fronts are permeable sandstones with large aquifer systems. Interbedded mudstone, claystone and siltstone are often present and aid in the formation process by focusing groundwater flux. The geometry of mineralization is dominated by the classic roll-front “C” shape or crescent configuration at the redox interface. The highest-grade portion of the front occurs in a zone termed the “nose” within reduced ground just ahead of the alteration front. Ahead of the nose, at the leading edge of the solution front, mineral quality gradually diminishes to barren within the “seepage” zone. Trailing behind the nose, in oxidized (altered) ground, are weak remnants of mineralization referred to as “tails” which have resisted re-mobilization to the nose due to association with shale, carbonaceous material or other lithologies of lower permeability. Tails are generally not amenable to ISR because the uranium is typically found within strongly reduced or impermeable strata, therefore making it difficult to leach.
Table 2.16 – Mineral Resources for the Ludeman Project as at the date of this Annual Report
| Classification |
Tons Ore (000’s) |
Tonnes Ore (1000’s) |
Average Grade (% eU3O8) |
Pounds eU3O8 (000’s) |
| Measured |
2,674 |
2426 |
0.094 |
5,016.9 |
| Indicated |
2,660 |
2660 |
0.088 |
4,696.9 |
| Total M&I |
5,334 |
5,086 |
0.091 |
9,713.8 |
| Inferred |
866 |
786 |
0.073 |
1,258.0 |
| Total Resources |
6,200 |
5,872 |
0.088 |
10,971.8 |
Notes:
| 1. |
The sum of measured and indicated tons and lbs. may not add up to the reported total due to rounding. |
|
| 2. |
Measured and indicated mineral resources as defined in 17 CFR § 229.1300. |
|
| 3. |
GT Cutoff = 0.25 m% eU3O8 |
|
| 4. |
All reported resources occur below the static water table. |
|
| 5. |
The point of reference for mineral resources is in-situ at the Project. |
|
| 6. |
Mineral resources that are not mineral reserves do not have demonstrated economic viability. |
Allemand-Ross ISR Project
The following technical and scientific description for the Allemand-Ross Project area (the “Allemand-Ross Project Area”) is based in part on the TRS titled “S-K 1300 Mineral Resource Report Wyoming Assets ISR Hub and Spoke Project, WY USA”, dated March 31, 2022, prepared by WWC, a qualified firm (the “QP” herein). The Allemand-Ross Project Area does not have mineral reserves and is therefore considered an Exploration Stage property under S-K 1300 definitions.

Figure 2.8 – Location of the Allemand-Ross Project
Property Description
The Allemand-Ross Project Area is located in Converse County, Wyoming, in the southern PRB Uranium District of Wyoming, at latitude 43.3101 and longitude -105.7787 in decimal degrees. The Allemand-Ross Project Area covers 13,331.72 acres, including all (or portions of) 21 sections within three townships of the PRB.
The Allemand-Ross Project Area is located approximately 42 air miles northeast of Casper, Wyoming., The Allemand-Ross Project Area is primarily located on private surface land with some areas of federal or state-managed land. The Allemand-Ross Project Area was previously divided into North and South areas, with North Allemand-Ross historically called the Sand Draw Property and South Allemand-Ross called the North Bear Creek Property., This designation is not utilized by UEC, as both areas are now within the Allemand-Ross Project Area. The land ownership is a combination of private, state of Wyoming and federally owned land administered by the BLM.
The site is accessible year-round on state and county roads. Services and personnel are available from Glenrock, Douglas or from Casper, which has full services and the nearest airport with daily service to Denver and Salt Lake City. Water will be sourced locally at the site while electrical service will be provided by a regional power company.
UEC’s mineral holdings in the Allemand-Ross project area include three State of Wyoming uranium leases (958 acres), 452 unpatented lode claims on federally administered minerals (9,040 acres) and seven fee (private) mineral leases (3,333.72 acres). These mineral holdings comprise 13,331.72 acres. All payments for all leases and claims are up to date.
History
Uranium was first discovered in the southern PRB during the early 1950s. By the mid- to late 1950s, small open pit mine operations were established in the PRB. Early prospecting and exploration included geologic mapping and gamma surveys, which led to discoveries of uranium in the Wasatch and Fort Union Formations. Extensive drill hole exploration has been utilized to locate deeper uranium mineralization since the 1960s to progress geologic models.
The table below describes the historic ownership and operation at the Allemand-Ross Project Area.
Table 2.17: Historic Ownership and Operations at the Allemand-Ross Project Area
| Year |
Company |
Operations/Activity |
Amount (No. of Drill holes) |
Results of Work |
| 1967 |
Kerr-McGee, Homestake, Teton |
Early uranium exploration was completed by the three companies in the Allemand-Ross Project Area. Exploration was typically for shallower mineralization (<1,000 ft). |
Approximately 100 |
Exploration of shallow mineralization (<1,000 ft). |
| 1971 |
Conoco |
Conoco staked lode mining claims in 1969. In 1970, Conoco entered an agreement with National Resources Corporation to earn in on the Allemand-Ranch land holdings. National Resources Corporation’s interests were acquired by Pioneer Nuclear in 1972 and the joint venture partnership was maintained until 1975. In 1979, Conoco continued to operate the drilling program. Conoco closed its mineral department in 1984. |
Approximately 1,180 |
A significant amount of the mineralization within the Allemand-Ross Project Area was delineated. |
| 1984 |
Power Reactor and Nuclear Fuel Development Corporation (“PNC”) |
PNC assumed control of the Allemand-Ross Project Area and continued exploration. |
Approximately 50 |
Additional exploration completed by PNC. |
| Early 1990s |
PNC |
Mineral rights were allowed to lapse due to further declining uranium market conditions. |
N/A |
Lost mineral rights. |
| Early 2000s-2005 |
HPU and EMC |
Claims and leases were acquired during the uranium market upswing. HPU held most claims and leases and EMC holding the remainder of the Allemand-Ross Project Area. |
N/A |
Mineral rights were acquired. |
| 2007 |
EMC |
EMC acquired HPU. The properties were consolidated. |
N/A |
Properties consolidated. |
| 2007 |
Uranium One |
Uranium One acquired EMC. Uranium One proceeded to conduct verification and resource enhancement drilling. Most drilling was completed between 2008 and 2010. |
Approximately 300 |
Additional exploration completed within the Allemand-Ross Project Area with average depths ranging from 1,118 ft to 1,546 ft. |
| 2021 |
UEC |
The Allemand-Ross Project Area acquired by UEC from Uranium One. |
N/A |
Ownership transition. |
Property Condition and Proposed Development
The condition of the property is good while meeting all standards and requirements of Federal, State and local regulations. There are no immediate plans for exploration or delineation drilling.
Facilities, Infrastructure and Underground Development
Facilities or wellfields have not been constructed.
Permit Status and Encumbrances
The Allemand Ross Project has not been permitted or licensed for ISR operations. Exploration and delineation drilling is conducted under a WDEQ LQD Drilling Notification. There are no materially significant encumbrances on the Allemand Ross Project. Standard encumbrances include reclamation bonding, mining and surface lease royalties.
Geologic Setting, Mineralization and Deposit
Union Formation, which underlies the Wasatch Formation and is part of the thick PRB sedimentary series. It consists of mudstones, siltstones and clays with minor cross bedded sandstone channels and occasional thin limestone and lignite beds (Lemmers and Smith, 1981). The Fort Union Formation sandstones were deposited in a fluvial paleo-drainage system, which flowed generally in a north-northeasterly direction. The targeted host rocks for uranium ore deposits in the Allemand-Ross Project area are the arkosic sandstones of the Lebo member of the Fort Union formation. These channel deposits are confined by mudstones that serve as aquitards to the water saturated aquifers.
Pyrite occurs in several forms within the host sandstones. In unaltered sandstones, pyrite occurs as small to large single euhedral crystals associated with magnetite, ilmenite and other dark detrital minerals. In altered sandstone, pyrite is typically absent, but locally occurs as tarnished, very fine-grained euhedral crystals. In areas of intense or heavy mineralization, pyrite locally occurs as massive, tarnished crystal aggregates.
Uranium mineralization at the Allemand-Ross Project Area is typical of Wyoming roll-front sandstone deposits. The formation of roll-front deposits is largely a groundwater process that occurs when uranium-rich, oxygenated groundwater interacts with a reducing environment in the subsurface and precipitates uranium. The most favorable host rocks for roll-fronts are permeable sandstones with large aquifer systems. Interbedded mudstone, claystone and siltstone are often present and aid in the formation process by focusing groundwater flux. The geometry of mineralization is dominated by the classic roll-front “C” shape or crescent configuration at the redox interface. The highest-grade portion of the front occurs in a zone termed the “nose” within reduced ground just ahead of the alteration front. Ahead of the nose, at the leading edge of the solution front, mineral quality gradually diminishes to barren within the “seepage” zone. Trailing behind the nose, in oxidized (altered) ground, are weak remnants of mineralization referred to as “tails”, which have resisted re-mobilization to the nose due to association with shale, carbonaceous material or other lithologies of lower permeability. Tails are generally not amenable to ISR because the uranium is typically found within strongly reduced or impermeable strata, therefore making it difficult to leach.
Table 2.18 – Mineral Resources for the Allemand Ross Project as at the date of this Annual Report
| Classification |
Tons Ore (000’s) |
Tonnes Ore (1000’s) |
Average Grade (% eU3O8) |
Pounds eU3O8 (000’s) |
| Measured |
246 |
223 |
0.085 |
417.0 |
| Indicated |
32 |
29 |
0.066 |
42.4 |
| Total M&I |
278 |
252 |
0.083 |
459.4 |
| Inferred |
1,275 |
1,157 |
0.098 |
2,496.0 |
| Total Resources |
1,553 |
1,409 |
0.095 |
2,955.4 |
Notes:
| 1. |
The sum of resource tons and lbs. may not add up to the reported total due to rounding. |
|
| 2. |
Measured and indicated mineral resources as defined in 17 CFR § 229.1300. |
|
| 3. |
GT Cutoff = 0.25 m% eU3O8 |
|
| 4. |
All reported resources occur below the static water table. |
|
| 5. |
The point of reference for mineral resources is in-situ at the Project. |
|
| 6. |
Mineral resources that are not mineral reserves do not have demonstrated economic viability. |
Barge ISR Project
The following technical and scientific description for the Barge Project area (the “Barge Project Area”) is based in part on the TRS titled “S-K 1300 Mineral Resource Report Wyoming Assets ISR Hub and Spoke Project, WY USA”, dated March 31, 2022, prepared by WWC, a qualified firm (the “QP” herein). The Barge Project Area does not have mineral reserves and is therefore considered an Exploration Stage property under S-K 1300 definitions.

Figure 2.9 – Location of the Barge Project
Property Description
The Barge Project Area is located in Converse County, Wyoming, the southern portion of the PRB Uranium District of Wyoming, at latitude 43.2729 and longitude -105.5905 in decimal degrees. The Barge Project Area covers 7,480 acres, including all (or portions of) 18 sections of the PRB.
The Barge Project Area is located approximately 50 air miles northeast of Casper, Wyoming. The Barge Project Area is primarily located on private surface land with some areas of federal BLM or state-managed land.
The site is accessible year-round on state and county roads. Services and personnel are available from Glenrock, Douglas or from Casper, which has full services and the nearest airport with daily service to Denver and Salt Lake City. Water will be sourced locally at the site while electrical service will be provided by a regional power company.
UEC’s mineral holdings in the Barge project area include one State of Wyoming uranium lease (640 acres) and 342 unpatented lode claims on federally administered minerals (6,840 acres). These mineral holdings comprise 7,480 acres. All payments for the lease and claims are up to date.
History
Uranium was first discovered in the southern PRB during the early 1950s. By the mid- to late 1950s, small open pit mine operations were established in the PRB. Early prospecting and exploration included geologic mapping and gamma surveys, which led to discoveries of uranium in the Wasatch and Fort Union Formations. Extensive drill hole exploration has been utilized to locate deeper uranium mineralization since the 1960s to progress geologic models.
The table below describes the historic ownership and operations at the Barge Project Area.
Table 2.19: Historic Ownership and Operations at the Barge Project Area
| Year |
Company |
Operations/Activity |
Amount (No. of Drill holes) |
Results of Work |
| 1969 |
Mono and RME |
Under a joint venture, Mono and RME conducted the initial exploration program through drilling. Upon successful exploration, the Bear Creek Uranium Company was formed under general partnership between Mono and RME. |
Unspecified and included in the total estimate. |
Successful exploration led to joint venture and mill construction. |
| 1975-1982 |
Bear Creek Uranium Company |
A mill was constructed in 1975. Open pit mining operations began in 1977 until 1982. Mining claims were dropped after 1982. |
Approximately 6,880 |
4.7 million tons of material from open pit mining processed at the Bear Creek mill. |
| 2006 |
EMC |
EMC located the unpatented mining claims and acquired the state mineral leases. |
N/A |
Lapsed mineral leases acquired. |
| 2007 |
Uranium One |
Uranium One acquired EMC and all rights to the Barge Project Area. |
None as of 2019. |
No exploration had been completed. |
| 2021 |
UEC |
Barge Project Area acquired by UEC from Uranium One. |
N/A |
Ownership. |
Property Condition and Proposed Development
The condition of the property is good while meeting all standards and requirements of Federal, State and local regulations. There are no immediate plans for exploration or delineation drilling.
Facilities, Infrastructure and Underground Development
Facilities or wellfields have not been constructed.
Permit Status and Encumbrances
The Barge Project has not been permitted or licensed for ISR operations. Exploration and delineation drilling is conducted under a WDEQ LQD Drilling Notification. There are no materially significant encumbrances on the Barge Project. Standard encumbrances include reclamation bonding, mining and surface lease royalties.
Geologic Setting, Mineralization and Deposit
The Barge Project Area mineralization occurs in both the Wasatch Formation and the Paleocene Fort Union Formation.
Mineralization in the Barge Project Area occurs in fluvial sandstones of the lower parts of the Wasatch Formation. Most of the upper Wasatch Formation has been eroded away. The sandstones are arkosic, fine- to coarse-grained with local calcareous lenses. The sandstones contain minor amounts of organic carbon that occurs as dispersed bits or as stringers. Unaltered sandstones are generally gray while altered sandstones are tan or pink due to hematite, or show yellowish coloring due to limonite.
Pyrite occurs in several forms within the host sandstones. In unaltered sandstones, pyrite occurs as small to large single euhedral crystals associated with magnetite, ilmenite and other dark detrital minerals. In altered sandstone, pyrite is typically absent, but locally occurs as tarnished, very fine-grained euhedral crystals. In areas of intense or heavy mineralization, pyrite locally occurs as massive, tarnished crystal aggregates.
Table 2.20 – Mineral Resources for the Barge Project as at the date of this Annual Report
| Classification |
Tons Ore (000’s) |
Tonnes Ore (1000’s) |
Average Grade (% eU3O8) |
Pounds eU3O8 (000’s) |
| Measured |
- |
- |
- |
- |
| Indicated |
4,301 |
3,902 |
0.051 |
4,361.0 |
| Total M&I |
4,301 |
3,902 |
0.051 |
4,361.0 |
| Inferred |
- |
- |
- |
- |
| Total Resources |
4,301 |
3,902 |
0.051 |
4,361.0 |
Notes:
| 1. |
The sum of measured and indicated tons and lbs. may not add up to the reported total due to rounding. |
|
| 2. |
Measured and indicated mineral resources as defined in 17 CFR § 229.1300. |
|
| 3. |
GT Cutoff = 0.25 m% eU3O8 |
|
| 4. |
All reported resources occur below the static water table. |
|
| 5. |
The point of reference for mineral resources is in-situ at the Project. |
|
| 6. |
Mineral resources that are not mineral reserves do not have demonstrated economic viability. |
Jab/West Jab ISR Project
The following technical and scientific description for the Jab/West Jab Project area (the “Jab/West Jab Project Area”) is based in part on the TRS titled “S-K 1300 Mineral Resource Report Wyoming Assets ISR Hub and Spoke Project, WY USA”, dated March 31, 2022, as prepared by WWC, a qualified firm (the “QP” herein). The Jab/West Jab Project Area does not have mineral reserves and is therefore considered an Exploration Stage property under S-K 1300 definitions.
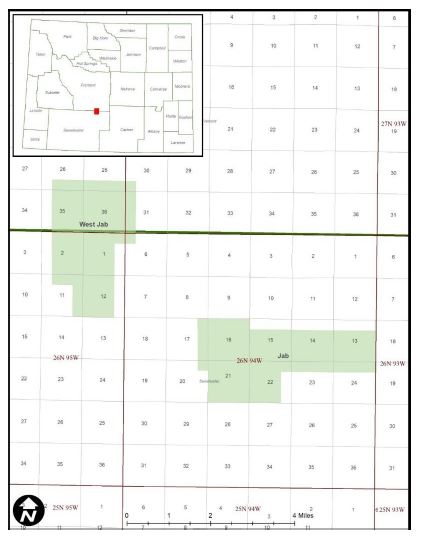
Figure 2.10 – Location of the Jab/West Jab Project
Property Description
The Jab/West Jab Project Area is located in the GDB in Fremont and Sweetwater Counties, Wyoming. The Jab/West Jab Project Area consists of two separate areas of mining claims and state leases separated by less than two miles in the GDB. The Jab/West Jab Project Area is located in both Fremont and Sweetwater Counties in all or portions of 11 sections (5,300 acres), at latitude 42.2611 and longitude -108.1225 in decimal degrees.
The Jab/West Jab Project Area is approximately 100 air miles southwest of Casper, Wyoming, and 20 air miles southwest of Jeffrey City, Wyoming. The Jab/West Jab Project Area is accessed from State Highway 287 and through Bairoil, Wyoming, by traveling west on Bairoil Road (County Road 22). Alternatively, the Jab/West Jab Project Area may be accessed by traveling south from Jeffrey City, Wyoming, following Crooks Gap Road. The Jab/West Jab Project Area is located on federal BLM and state-managed land.
The site is accessible year-round on county roads. Limited services and personnel are available from Rawlins, WY, Primarily, services and personnel will be sourced from Casper. Water will be sourced locally at the site while electrical service will be provided by a regional power company.
UEC’s mineral holdings in the Jab/West Jab Project Area include three State of Wyoming uranium leases (960 acres) and 217 unpatented lode claims on federally administered minerals (4,340 acres). These mineral holdings comprise 5,300 acres. All payments for all leases and claims are up to date.
History
Uranium mineralization was discovered in the GDB at the Lost Creek Schoekingerite deposit in the early 1950s. The Schoekingerite deposits were exposed at the surface along the Lost Creek drainage and were located using radiometric surveys. The USGS used shallow exploration to further evaluate the deposits. Similar to the PRB, drilling for deeper deposits began in the 1960s and exploration has primarily consisted of drilling since that time.
Table 2.21: Historic Ownership and Operations at the Jab/West Jab Project Area
| Year |
Company |
Operations/Activity |
Amount (No. of Drill holes) |
Results of Work |
| Jab |
||||
| Unspecified |
Silverbell Industries |
Originator of the Jab/West Jab Project Area. |
Not specified. |
The Jab/West Jab Project Area initially developed. |
| 1972 |
Union Carbide Corporation (“UCC”) |
Delineated an area of shallow oxidized mineralization and completed feasibility studies for open pit mining. The plan was not executed, and a mining permit was prepared for the WDEQ/LQD. The permit was withdrawn due to the declining uranium market in 1982. |
Approximately 1,830 |
Delineation of shallow oxidized material. |
| 1985-2000 |
Yellowstone Fuels |
Property held until a decline in the uranium market in 2000. No data developed by Yellowstone Fuels were available for evaluation. |
No data available. |
The Jab/West Jab Project Area held but not substantially developed. |
| West Jab |
||||
| Unspecified |
AMAX Petroleum Company |
Originator of the Jab/West Jab Project Area. |
Not specified. |
The Jab/West Jab Project Area initially developed. |
| 1975-1983 |
WNC |
WNC drilled the Jab/West Jab Project Area until 1983 when uranium markets had dropped. WNC terminated claim. AMAX Petroleum Company regained control until the claims were dropped. |
Approximately 1,020 |
Exploration completed by WNC. |
| Jab/West Jab |
||||
| 2006 |
EMC |
Identified the unpatented mining claims and acquired the state mineral leases. |
N/A |
Secured right to mine. |
| 2007 |
Uranium One |
Uranium One acquired EMC and all rights to the Jab/West Jab Project Area. |
None as of 2019 |
No exploration had been completed. Right to mine secured. |
| 2021 |
UEC |
The Jab/West Jab Project Area acquired by UEC from Uranium One. |
N/A |
Ownership transition. |
Property Condition and Proposed Development
The condition of the property is good while meeting all standards and requirements of Federal, State and local regulations. There are no immediate plans for exploration or delineation drilling.
Facilities, Infrastructure and Underground Development
Facilities or wellfields have not been constructed.
Permit Status and Encumbrances
The JAB/West JAB Project has not been permitted or licensed for ISR operations. Exploration and delineation drilling is conducted under a WDEQ LQD Drilling Notification. There are no materially significant encumbrances on the JAB/West JAB Project. Standard encumbrances include reclamation bonding for drilling work. There are no royalties on this project.
Geologic Setting, Mineralization and Deposit
The Jab/West Jab Project Area is located within the north-central part of the Great Divide Basin. Mineralization at the Jab/West Jab project area occurs in the Battle Spring Formation.
The Battle Spring Formation was deposited by a large alluvial fan system and consists of very fine to very coarse-grained arkosic sandstones with interbedded thick shales, mudstones and localized conglomerates. The Battle Spring Formation is relatively flat in the Jab/West Jab project areas.
Within the Jab project area, mineralization occurs as a trend that is approximately 10,000 ft long and 100 to over 1,000 ft wide. Mineralization occurs within a single sandstone unit and ranges in thickness from less than 1 to over 40 ft. The Jab project area contains the Silverbell and RD areas, which are divided by a high-angle normal fault with approximately 80 ft of displacement. The Silverbell portion of the mineralization is on the down-thrown side of the fault, and the RD portion of the mineralization is on the up-thrown side of the fault.
At the West Jab project area, mineralization occurs along a trend that is approximately 7,100 ft long and 50 to over 200 ft wide. Most of the mineralization occurs within a single unit; however, in the northeast portion of the project, there is also mineralization in a lower sand unit (BRS, 2019b). Mineralized thickness at the West Jab project area ranges from less than 1 to over 25 ft.
Table 2.22 – Mineral Resources for the Jab/West Jab Project as at the date of this Annual Report
| Classification |
Tons Ore (000’s) |
Tonnes Ore (1000’s) |
Average Grade (% eU3O8) |
Pounds eU3O8 (000’s) |
| Measured |
1,621 |
1,471 |
0.072 |
2,335.0 |
| Indicated |
253 |
230 |
0.077 |
392.0 |
| Total M&I |
1,874 |
1,701 |
0.073 |
2,727.0 |
| Inferred |
1,402 |
1,272 |
0.06 |
1,677.0 |
| Total Resources |
3,276 |
2,973 |
0.067 |
4,404.0 |
Notes:
| 1. |
The sum of resource tons and lbs. may not add up to the reported total due to rounding. |
|
| 2. |
Measured, indicated, and inferred mineral resources as defined in 17 CFR § 229.1300. |
|
| 3. |
GT Cutoff = 0.25 m% eU3O8 |
|
| 4. |
Measured and indicated resources occur below the static water table. The inferred resources at Jab/West Jab occur above the water table and may not be amenable to ISR. |
|
| 5. |
The point of reference for mineral resources is in-situ at the Project. |
|
| 6. |
Mineral resources that are not mineral reserves do not have demonstrated economic viability. |
Charlie ISR Project
The following technical and scientific description for the Charlie Project area (the “Charlie Project Area”) is based in part on the TRS titled “S-K 1300 Mineral Resource Report Wyoming Assets ISR Hub and Spoke Project, WY USA”, dated March 31, 2022, prepared by WWC, a qualified firm (the “QP” herein). The Charlie Project Area does not have mineral reserves and is therefore considered an Exploration Stage property under S-K 1300 definitions, though it is intended to be mined as part of the Christensen Ranch mine plan.
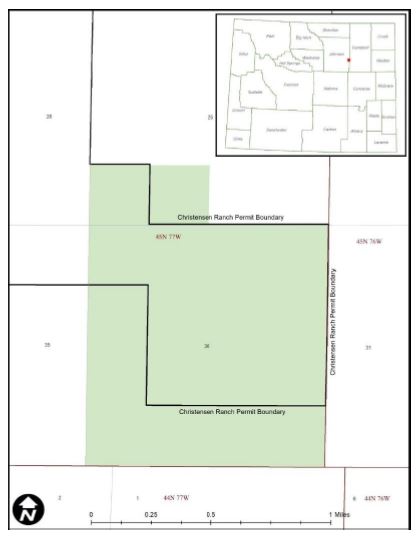
Figure 2.11 – Location of the Charlie Project
Property Description
The Charlie Project Area is in the PRB in Johnson County at latitude 43.8274 and longitude -106.0594 in decimal degrees. It is surrounded by the Christensen Ranch Project Area. The Charlie Project Area covers 820 acres including all (or portions of) two sections of the PRB.
The Charlie Project Area is located approximately 90 air miles north of Casper, Wyoming, and is located on private surface land.
The site is accessible year-round on county and private roads which are shared by oil and gas operators and ranchers. Limited services are available from several smaller towns proximal to the site. Primarily, services and personnel are available from Buffalo, Gillette and Casper. Casper and Gillette provide flight services with daily service to Denver, Billings and Salt Lake City. Water will be sourced locally at the site while electrical service will be provided by a regional power company.
UEC’s mineral holdings in the Charlie project area include one State of Wyoming uranium lease (720 acres) and five unpatented lode claims on federally administered minerals (100 acres). These mineral holdings comprise 820 acres. All payments for the lease are up to date.
History
Uranium was first discovered in the southern PRB during the early 1950s. By the mid to late 1950s, small open pit mine operations were established in the PRB. Early prospecting and exploration included geologic mapping and gamma surveys which led to discoveries of uranium in the Wasatch and Fort Union Formations. Extensive drill hole exploration has been utilized since the 1960s to locate deeper uranium mineralization and progress geologic models.
Table 2.23: Historic Ownership and Operations at the Charlie Project Area
| Year |
Company |
Operations/Activity |
Amount (No. of Drill holes) |
Results of Work |
| 1966 |
Preston Oil Co. (“Preston Oil”) |
Awarded the state lease for 720 acres. |
None. |
Right to mine secured. |
| 1966 |
Inexco Oil Company (“Inexco”) |
Inexco assigned lease from Preston Oil in 1966 and conducted exploration drilling program in 1969 and 1970. |
215 |
Delineation of mineralized areas. |
| 1974 |
Uranerz USA |
Inexco formed a joint venture with Uranerz USA who became the operator. Over the next two years, Uranerz expanded the drilling program, including core drilling. |
715 |
Delineation of mineralized areas. |
| Not specified |
Cotter Corporation (“Cotter”) |
Cotter acquired the property and evaluated both conventional open pit and in situ mining methods. Cotter obtained a surface mining permit in 1979. A 200-foot-deep test pit was excavated in 1981 in a small mineralization area. The pit was subsequently reclaimed, but the state mining permit remains active. |
Not specified |
Falling uranium prices in the 1980’s halted further development. |
| 1994 |
Cotter and PRI |
PRI entered a joint venture agreement with Cotter and completed a feasibility study for development as an ISR mine (PRI, 1995). Completed additional drilling in 1994. |
Not specified |
The feasibility study was positive; however, the Charlie Project Area did not proceed, and the joint venture agreement expired. |
| 2014 |
Cotter |
In 2014 Cotter sought to convert the permit to ISR mining; however, that process has not been completed. |
None |
Unknown. |
| 2018 |
Anfield Energy Inc. (“Anfield”) |
Anfield acquired the Charlie Project Area from Cotter. |
None |
Oversaw technical reporting and auditing of Charlie Project Area resources. |
| 2021 |
UEC |
UEC acquired the Charlie Project Area from Anfield. |
N/A |
Ownership transition. |
Property Condition and Proposed Development
The condition of the property is good while meeting all standards and requirements of Federal, State and local regulations. There are no immediate plans for exploration or delineation drilling. The Charlie Project will eventually be mined as part of the Christensen Ranch Life of Mine.
Facilities, Infrastructure and Underground Development
The Charlie Project is essentially an extension of the Christensen Ranch ore body located in Mine Units 8 and 10. There are currently no facilities located on the Charlie Project other than various monitor wells that have been used for groundwater baseline studies to permit the property.
Permit Status and Encumbrances
The Charlie Project was permitted through Permit to Mine No. 489 years ago for an open pit uranium mine. It is not permitted or licensed for ISR operations. Exploration and delineation drilling is conducted under a WDEQ LQD Drilling Notification or the Permit to Mine. There are no materially significant encumbrances on the Charlie Project. Standard encumbrances include reclamation bonding, mining, and surface lease royalties.
Geologic setting, Mineralization and Deposit
The Charlie Project Area targets mineralization in the Eocene-aged Wasatch Formation.
Mineralization in the Charlie Project Area occurs in fluvial sandstones of the lower parts of the Wasatch Formation. Most of the upper Wasatch Formation has been eroded away. The sandstones are arkosic, fine to coarse-grained with local calcareous lenses. The sandstones contain minor amounts of organic carbon that occurs as dispersed bits or as stringers. Unaltered sandstones are generally gray while altered sandstones are tan or pink due to hematite or show yellowish coloring due to limonite.
Pyrite occurs in several forms within the host sandstones. In unaltered sandstones, pyrite occurs as small to large single euhedral crystals associated with magnetite, ilmenite, and other dark detrital minerals. In altered sandstone, pyrite is typically absent, but locally occurs as tarnished, very fine-grained euhedral crystals. In areas of intense or heavy mineralization, pyrite locally occurs as massive, tarnished crystal aggregates.
At the Charlie Project Area, the Wasatch Formation sand units have been subdivided into eight separate sub-roll-fronts within the overall mineralized horizon. The sands have been designated locally as A through G in descending order. The majority of the currently defined mineral resource falls within the A through D sands, which have a combined thickness of approximately 80 to 100 feet. While mineralization is present in the F and G sands, less than 40 of the over 1,100 drill holes fully penetrated the F and G sands. Similarly, the E sand has only been partially explored.
Uranium mineralization at all of the Charlie Project Area is typical of Wyoming roll-front sandstone deposits. The formation of roll-front deposits is largely a groundwater process that occurs when uranium-rich, oxygenated groundwater interacts with a reducing environment in the subsurface and precipitates uranium. The most favorable host rocks for roll-fronts are permeable sandstones with large aquifer systems. Interbedded mudstone, claystone and siltstone are often present and aid in the formation process by focusing groundwater flux. The geometry of mineralization is dominated by the classic roll-front “C” shape or crescent configuration at the redox interface. The highest-grade portion of the front occurs in a zone termed the “nose” within reduced ground just ahead of the alteration front. Ahead of the nose, at the leading edge of the solution front, mineral quality gradually diminishes to barren within the “seepage” zone. Trailing behind the nose, in oxidized (altered) ground, are weak remnants of mineralization referred to as “tails” which have resisted re-mobilization to the nose due to association with shale, carbonaceous material or other lithologies of lower permeability. Tails are generally not amenable to ISR because the uranium is typically found within strongly reduced or impermeable strata, therefore making it difficult to leach.
Table 2.24 – Mineral Resources for the Charlie Project as at the date of this Annual Report
| Classification |
Tons Ore (000’s) |
Tonnes Ore (1000’s) |
Average Grade (% eU3O8) |
Pounds eU3O8 (000’s) |
| Measured |
- |
- |
- |
- |
| Indicated |
1,255 |
1,139 |
0.123 |
3,100.0 |
| Total M&I |
1,255 |
1,139 |
0.123 |
3,100.0 |
| Inferred |
411 |
373 |
0.120 |
988.0 |
| Total Resources |
1,666 |
1,512 |
0.123 |
4,088.0 |
Notes:
| 1. |
The sum of resource tons and lbs. may not add up to the reported total due to rounding. |
|
| 2. |
Measured, indicated, and inferred mineral resources as defined in 17 CFR § 229.1300. |
|
| 3. |
GT Cutoff = 0.20 m% eU3O8 |
|
| 4. |
All reported resources occur below the static water table. |
|
| 5. |
The point of reference for mineral resources is in-situ at the Project. |
|
| 6. |
Mineral resources that are not mineral reserves do not have demonstrated economic viability. |
Nine Mile Lake ISR Project
The following technical and scientific description for the Nine Mile Lake Project area (the “Nine Mile Lake Project Area”) is based in part on the TRS titled “S-K 1300 Mineral Resource Report Wyoming Assets ISR Hub and Spoke Project, WY USA”, dated March 31, 2022, prepared by WWC, a qualified firm (the “QP” herein). The Nine Mile Lake Project Area does not have mineral reserves and is therefore considered an Exploration Stage property under S-K 1300 definitions, but the area has undergone test mining for ISR mining processes.
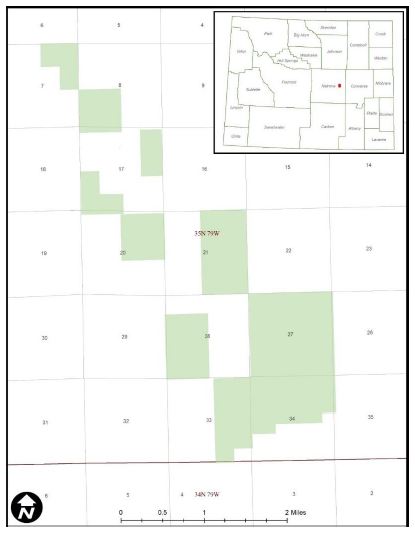
Figure 2.12 – Location of the Nine Mile Lake Project
Property Description
The Nine Mile Lake Project Area is located in Natrona County, Wyoming, in the PRB, at latitude 42.9807 and longitude ‑106.3278 in decimal degrees. The Nine Mile Lake Project Area covers all or portions of approximately 22 sections of the PRB.
The Nine Mile Lake Project Area is located approximately 1.5 miles north of Casper, Wyoming, and is located on private surface land and state managed land. The Nine Mile Lake Project Area is bisected by Interstate 25 and is accessible from the Salt Creek highway which parallels Interstate 25 and from County Road 705. Casper is the major population center with a population of 58,287 and is located 5 miles south of the Nine Mile Lake Project Area. The east-west railway owned by BNSF is located approximately five miles south of the Nine Mile Lake Project Area.
All services and personnel will be available from Casper. Water will be sourced locally at the site or the City of Casper, while electrical service will be provided by a regional power company.
UEC’s mineral holdings in the Nine Mile project area include two State of Wyoming uranium leases (1,280 acres), 67 unpatented lode claims on federally administered minerals (1,340 acres). These mineral holdings comprise 2,620 acres. All payments for all leases and claims are up to date.
History
The initial discovery of mineralization at the Nine Mile Lake Project Area was made in the early 1950s by a Mr. Vickers of Casper, Wyoming, who reportedly discovered surficial mineralization and mined some 100 tons at an average grade of 0.30 % U3O8 which was shipped to the U.S. Atomic Energy Commission (the “AEC”) buying station at Edgemont, South Dakota. Rocky Mountain Energy (“RME”) acquired an interest in the Nine Mile Lake Project Area in 1972 and conducted extensive drilling through 1978. Pilot scale ISR mining was conducted using four seven-spot patterns with a 50-foot radius. The first three patterns used sulfuric acid as the primary lixiviant and the fourth sodium carbonate-bicarbonate as the primary lixiviant. The U.S. Bureau of Mines assisted RME in conducting the pilot testing and documented the results in a publication titled “Case History of a Pilot-Scale Acidic In-Situ Uranium Leaching Experiment”.
RME controlled the Nine Mile Lake Project Area until the late 1980s after which it dropped its mineral interests due to the declining uranium market. In 2005 and 2006, EMC began locating unpatented mining lode claims and securing mineral leases and surface agreements within the former area held by RME. EMC also acquired a variety of geologic data including reports, maps and geophysical logs for the Nine Mile Lake Project Area. EMC was subsequently acquired by Uranium One Inc. in August of 2008. Uranium One sold its interest in 24 uranium projects located in Wyoming, including this project, to Anfield. The transaction closed on September 14, 2016. UEC acquired the Nine Mile Lake Project Area from Anfield in June 2022.
The table below describes the historic ownership and operations at the Nine Mile Lake Project Area.
Table 2.25: Historic Ownership and Operations at the Nine Mile Lake Project Area
| Year |
Company |
Operations/Activity |
Amount (No. of Drill holes) |
Results of Work |
| Early 1950s |
Independent operator |
An internal report from 1969 states a Mr. Vickers reportedly discovered surficial mineralization and mined approximately 100 tons U3O8 at an average grade of 0.30%. Uranium was shipped to the AEC buying station at Edgemont, South Dakota. |
None |
Exploration and production of 100 tons U3O8. |
| 1972 |
RME |
RME acquired interest in the project in 1972 and conducted extensive drilling through 1978. Pilot scale ISR mining was conducted using four seven-spot patterns with a 50-foot radius. The first 3 patterns used sulfuric acid as the primary lixiviant and the fourth sodium carbonate-bicarbonate as the primary lixiviant. The U.S. Bureau of Mines assisted RME in conducting the pilot testing and documented the results in a publication titled “Case History of a Pilot-Scale Acidic In Situ Uranium Leaching Experiment” (Nigbor, N. T., et al, 1982). RME controlled the project until the late 1980s when the mineral interests were dropped due to declining uranium prices. |
Approximately 1,100 |
Exploration and pilot scale ISR mining. |
| 2005 and 2006 |
EMC |
EMC located unpatented mining lode claims and secured mineral leases and surface agreements within the area formerly held by RME. EMC conducted exploratory drilling and compiled previous data and maps for the project. |
Approximately 45 |
Secured right to mine. |
| 2008 |
Uranium One |
EMC was acquired by Uranium One. |
None |
Ownership transition. |
| 2016 |
Anfield |
Anfield purchased Nine Mile Lake Project from Uranium One. |
None |
Oversaw technical reporting and auditing of project resources. |
| 2022 |
UEC |
UEC acquired the Nine Mile Lake Project from Anfield. |
N/A |
Ownership transition. |
Property Condition and Proposed Development
The property is in good condition. There are no plans for near term exploration or delineation drilling.
Facilities, Infrastructure and Underground Development
There are no facilities or wellfields constructed on the project.
Permit Status and Encumbrances
The Nine Mile Lake Project has not been permitted or licensed for ISR operations. Exploration and delineation drilling is conducted under a WDEQ LQD Drilling Notification. Standard encumbrances include reclamation bonding for drill holes, mining, and surface lease royalties. It should be noted that parts of the surface in the Nine Mile Lake vicinity are privately owned with dwellings.
Geologic Setting, Mineralization and Deposit
The Nine Mile Lake Project Area resides in the PRB.
The Nine Mile Lake Project Area is located along the southwestern flank of the PRB which is an asymmetric syncline trending north-northwest. The project is bounded to the west by the Casper Arch, a regional fold sub-parallel to the axis of the basin. In the vicinity of the project no major faults have been identified and the formation dip is less than 6° to the east, north-east.
Uranium deposits at the Nine Mile Lake Project Area are roll-front uranium deposits as defined in the “World Distribution of Uranium Deposits (UDEPO) with Uranium Deposit Classification”. The mineralization at the Nine Mile Lake Project Area is typical of the Wyoming roll-front sandstone deposits.
Table 2.26 – Mineral Resources for the Nine Mile Lake Project as at the date of this Annual Report
| Classification |
Tons Ore (000’s) |
Tonnes Ore (1000’s) |
Average Grade (% eU3O8) |
Pounds eU3O8 (000’s) |
| Measured |
- |
- |
- |
- |
| Indicated |
- |
- |
- |
- |
| Total M&I |
- |
- |
- |
- |
| Inferred |
3,405 |
3,089 |
0.036 |
4,308.0 |
| Total Resources |
3,405 |
3,089 |
0.036 |
4,308.0 |
Notes:
| 1. |
The sum of resource tons and lbs. may not add up to the reported total due to rounding. |
|
| 2. |
Measured, indicated, and inferred mineral resources as defined in 17 CFR § 229.1300. |
|
| 3. |
GT Cutoff = 0.25 m% eU3O8 |
|
| 4. |
All reported resources occur below the static water table. |
|
| 5. |
The point of reference for mineral resources is in-situ at the Project. |
|
| 6. |
Mineral resources that are not mineral reserves do not have demonstrated economic viability. |
Red Rim Project
The following technical and scientific description for the Red Rim Project area (the “Red Rim ISR Project Area”) is based in part on the TRS titled “S-K 1300 Mineral Resource Report Wyoming Assets ISR Hub and Spoke Project, WY USA”, dated March 31, 2022, as prepared by WWC, a qualified firm (the “QP” herein). The Red Rim Project Area does not have mineral reserves and is therefore considered an Exploration Stage property under S-K 1300 definitions.

Figure 2.13 - Location of the Red Rim Project
Property Description
The Red Rim Project Area is in the GGRB in Carbon County at latitude 41.6502 and longitude ‑107.5755 in decimal degrees. The Red Rim Project Area covers 680 acres, including all (or portions of) four sections.
The Red Rim Project Area is located approximately 20 air miles southwest of Rawlins, Wyoming, and is located on federal BLM-managed land. The site is accessible via two-wheel drive via three different routes - the Daley Road which proceeds south from Interstate 80 to the site and the Carbon County Road 605 which proceeds approximately 23 miles southwest from Rawlins along Hogback Ridge. The shortest route to the site is to proceed west from Rawlins on I-80 11 miles to the Daley Road, then travel south for approximately eight miles.
Limited services and personnel are available from Rawlins, WY, Primarily, services and personnel will be sourced from Casper. Water will be sourced locally at the site while electrical service will be provided by a regional power company.
UEC’s mineral holdings in the Red Rim Project Area include 34 unpatented federal mining lode claims (680 acres). All payments for all claims are up to date.
History
Uranium mineralization was discovered in the GGRB at the Lost Creek Schoekingerite deposit in the early 1950s. The Schoekingerite deposits were exposed at the surface along the Lost Creek drainage and were located using radiometric surveys. The USGS used shallow exploration to further evaluate the deposits. As in the PRB, drilling for deeper deposits began in the 1960s and exploration since that time has primarily consisted of drilling.
Table 2.27: Historic Ownership and Operations at the Red Rim Project Area
| Year |
Company |
Operations/Activity |
Amount (No. of Drill holes) |
Results of Work |
| 1970 |
Kerr McGee Corp. and UCC |
Both companies located claims in the vicinity and conducted exploration and drilling programs. The claims were dropped by 1973. |
Not specified. |
Exploration is reported to have encountered alteration and mineralization at depth. |
| 1974 |
Timberline Minerals and Wold |
Both companies located claims in the vicinity. |
None. |
Secured federal mining claims. |
| 1976 |
UCC |
UCC leased the Timberline Minerals property and entered a joint venture agreement with RME, a subsidiary of the Union Pacific Railroad, for the alternate sections of railroad grant lands in the area. UCC relinquished their mineral interests at Red Rim in 1986 and the mining claims reverted to Timberline Minerals, which subsequently dropped the claims. |
138 |
Conducted an exploration and drilling program. Of the 138 drill holes on the current Red Rim Project Area, 42 are barren or contain trace mineralization and the remaining 96 are mineralized. |
| 2004 |
EMC |
Located 49 unpatented mining lode claims that comprise the current Red Rim Project Area. |
None. |
Secured federal mining claims. |
| 2007 |
Uranium One |
Uranium One Inc. acquired EMC. Through subsequent transactions, Uranium One Inc. became Uranium One Americas, Inc. |
None. |
Ownership transition. |
| 2016 |
Anfield |
Anfield purchased Red Rim Project from Uranium One. |
None. |
Oversaw technical reporting and auditing of project resources. |
| 2022 |
UEC |
UEC acquired the Red Rim project from Anfield. |
N/A |
Ownership transition. |
Property Condition and Proposed Development
The property is in good condition. There are no plans for near term exploration or delineation drilling.
Facilities, Infrastructure and Underground Development
There are no facilities or wellfields constructed on the project.
Permit Status and Encumbrances
The Red Rim Project has not been permitted or licensed for ISR operations. Exploration and delineation drilling is conducted under a WDEQ LQD Drilling Notification. There are no materially significant encumbrances on the Red Rim Project. Standard encumbrances include reclamation bonding for drilling, mining and surface lease royalties.
Geologic Setting, Mineralization and Deposit
The Red Rim Project Area is located within the WB portion of the GGRB. Together, the GDB and WB compromise the eastern portion of the GGRB. Mineralization at the Red Rim project area occurs in the Fort Union Formation.
The Fort Union Formation is a medium to coarse-grained arkosic sandstone that generally grades upward. The Fort Union is unconformably underlain by the Cretaceous Lance Formation and regionally overlain by the Eocene Wasatch Formation. North of Separation Creek, the basal portion of the Fort Union Formation is a prominent ridge-forming unit that is composed of dominantly arkosic sandstone that is often altered. South of Separation Creek, the formation becomes less resistant, is composed of sub-arkosic to quartzose, and is generally not altered. The two commonly cited sources of uranium for the Red Rim are the Granite Mountains and leaching of Oligocene and Miocene volcanics.
Uranium deposits at the Red Rim project area occur as roll-fronts in a single sand unit within the lower Fort Union Formation, near the contact with the Lance Formation. The host sandstone unit has been designated the #3 sand, and ranges in thickness from approximately 60 to 120 ft. Mineralized thickness ranges from 1 to 23.5 ft.
Table 2.28 – Mineral Resources for the Red Rim Project as at the date of this Annual Report
| Classification |
Tons Ore (000’s) |
Tonnes Ore (1000’s) |
Average Grade (% eU3O8) |
Pounds eU3O8 (000’s) |
| Measured |
- |
- |
- |
- |
| Indicated |
337 |
306 |
0.170 |
1,142.0 |
| Total M&I |
337 |
306 |
0.170 |
1,142.0 |
| Inferred |
473 |
429 |
0.163 |
1,539.0 |
| Total Resources |
810 |
735 |
0.165 |
2,681.0 |
Notes:
| 1. |
The sum of resource tons and lbs. may not add up to the reported total due to rounding. |
|
| 2. |
Measured, indicated, and inferred mineral resources as defined in 17 CFR § 229.1300. |
|
| 3. |
GT Cutoff = 0.25 m% eU3O8 |
|
| 4. |
All reported resources occur below the static water table. |
|
| 5. |
The point of reference for mineral resources is in-situ at the Project. |
|
| 6. |
Mineral resources that are not mineral reserves do not have demonstrated economic viability. |
Clarkson Hill Project
The following technical and scientific description for the Clarkson Hill Project area (the “Clarkson Hill Project Area”) is based in part on the TRS titled “S-K 1300 Mineral Resource Report Wyoming Assets ISR Hub and Spoke Project, WY USA”, dated March 31, 2022, as prepared by WWC, a qualified firm (the “QP” herein). The Clarkson Hill Project Area does not have mineral reserves and is therefore considered an Exploration Stage property under S-K 1300 definitions.
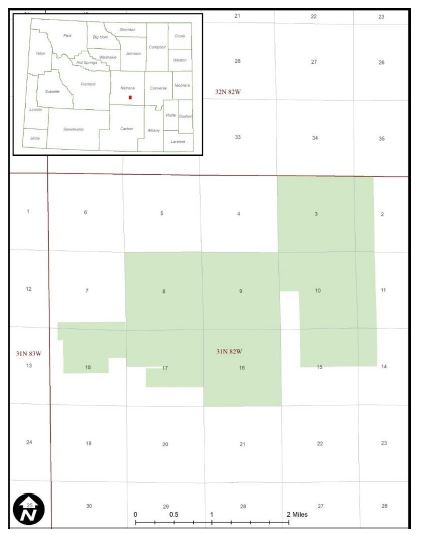
Figure 2.14 – Location of the Clarkson Project
Property Description
The Clarkson Hill Project is located in Natrona County, Wyoming, about 20 air miles southwest of Casper, Wyoming, at latitude 42.6593 and longitude -106.7006 in decimal degrees. The property is located on portions of sections 7, 17, and 18 of T31N R82W. Land ownership consists of federal lands administered by the BLM, state lands and private lands. The Clarkson Hill Project Area is accessible from either Highway 220 or from the Oregon Trail Road, a Natrona County improved gravel road. From Highway 220, the site is approximately four miles northwest of the junction of the highway with Natrona County Road 318. From the Oregon Trail Road, the site is approximately three miles to the southeast. Site access from either route will require an arrangement with intervening private landowners for ingress/egress. The communities of Alcova and Bessemer Bend are located 10 and 13 miles away, respectively, and have limited services. The east-west BNSF railway in Casper is approximately 25 miles northeast of the Clarkson Hill Project Area.
The site is accessible year-round on county and private roads as described above. All services and personnel will be available from Casper. Water will be sourced locally at the site, while electrical service will be provided by a regional power company.
UEC’s mineral holdings in the Clarkson Hill Project Area include 20 unpatented lode claims on federally administered minerals (400 acres). All payments for all claims are up to date.
History
The initial discovery of mineralization at the Clarkson Hill Claims was made in the 1950s and “small amounts of ore were mined and shipped for treatment from the old pit area located in Section 17, T31N, R82W” (Ljung et al, March 1974). However, USGS and the U.S. Bureau of Mines databases list the Clarkson Hill Project Area claims as a surface mine prospect with no reported production. The surface disturbance, based on site observation by the QP of the TRS, is shallow (less than 20 feet in depth) and limited in aerial extent. Surface disturbance is limited and there is no known infrastructure, tailings or mine waste apparent at the site. Drill data utilized in the estimation of mineral resources at the Clarkson Hill Project Area Claims in the TRS reflect a deeper horizon and is not affected by the presence of “old pit”. Surface disturbance from past exploration and/or limited mining activities at the site are readily apparent from current aerial views and on the ground.
Table 2.29: Historic Ownership and Operations at the Clarkson Hill Project Area
| Year |
Company |
Operations/Activity |
Amount (No. of Drill holes) |
Results of Work |
| 1959 |
Utah Construction and Mining |
Conducted uranium exploration drilling. |
Not specified. |
Unknown. |
| 1968 |
Minerals Exploration Company (“MEC”) and Nuclear Reserves Inc. |
MEC performed exploratory drilling between 1968 and 1981. In 1969, MEC and Nuclear Reserves Inc. entered into a joint venture. MEC held the Clarkson Hill Project Area through the mid-1980s, when they dropped the claims due to declining uranium prices. |
250 |
Delineation of mineralized areas. Falling uranium prices in the 1980’s halted further development. |
| Unknown |
EMC |
EMC performed initial staking of 14 claims and compiled relevant data for the Clarkson Hill Project Area. EMC optioned the Clarkson Hill Project Area to Artha Resources, who conducted limited verification drilling during 2008. The Clarkson Hill Project Area reverted from Artha to EMC. |
5 |
Unknown. |
| 2008 |
Uranium One |
EMC was acquired by Uranium One Inc. Through subsequent transactions Uranium One Inc. became Uranium One Americas Inc. |
None. |
Ownership transition. |
| 2016 |
Anfield Resources, Inc. (now Anfield Energy, Inc.) |
Anfield purchased the Clarkson Hill Project Area from Uranium One. |
None. |
Oversaw technical reporting and auditing of the Clarkson Hill Project Area resources. |
| 2022 |
UEC |
UEC acquire the Clarkson Hill Project Area from Anfield. |
N/A |
Ownership transition. |
Property Condition and Proposed Development
The property is in good condition. There are currently no plans for near term exploration or delineation drilling.
Facilities, Infrastructure and Underground Development
There are no facilities or wellfields constructed on the property.
Permit Status and Encumbrances
The Clarkson Hill Project has not been permitted or licensed for ISR operations. Exploration and delineation drilling is conducted under a WDEQ LQD Drilling Notification. There are no materially significant encumbrances on the Clarkson Hill Project. Standard encumbrances may include reclamation bonding for drilling, mining and surface lease royalties.
Geologic Setting, Mineralization and Deposit
The Clarkson Hill Project Area is located near the southern and eastern margin of the WRB, just west of the Casper Arch, which separates the PRB and WRB.
Mineralization at the Clarkson Hill Project Area occurs in the Fort Union Formation. Mineralization has also been reported in the overlying Wind River Formation, but exploration has not characterized this mineralization.
The Paleocene Fort Union Formation is a terrestrial sedimentary deposit consisting of sandstone, siltstone, shale, coal and local conglomerates. The primary source of Fort Union Formation sediments was the ancestral Granite Mountains west and south of the Clarkson Hill Project Area. At the Clarkson Hill Project Area, the Fort Union Formation is approximately 75 to 150 feet thick.
At the Clarkson Hill Project Area, mineralization occurs at multiple depths within the Fort Union Formation. Mineralized thickness ranges from less than five feet to over 20 feet, and the mineralized trend is approximately 5,500 feet long.
Table 2.30 – Mineral Resources for the Clarkson Hill Project as at the date of this Annual Report
| Classification |
Tons Ore (000’s) |
Tonnes Ore (1000’s) |
Average Grade (% eU3O8) |
Pounds eU3O8 (000’s) |
| Measured |
- |
- |
- |
- |
| Indicated |
- |
- |
- |
- |
| Total M&I |
- |
- |
- |
- |
| Inferred |
957 |
868 |
0.058 |
1,113.0 |
| Total Resources |
957 |
868 |
0.058 |
1,113.0 |
Notes:
| 1. |
The sum of resource tons and lbs. may not add up to the reported total due to rounding. |
|
| 2. |
Measured, indicated, and inferred mineral resources as defined in 17 CFR § 229.1300. |
|
| 3. |
GT Cutoff = 0.25 m% eU3O8 |
|
| 4. |
All reported resources occur below the static water table. |
|
| 5. |
The point of reference for mineral resources is in-situ at the Project. |
|
| 6. |
Mineral resources that are not mineral reserves do not have demonstrated economic viability. |
Texas Properties
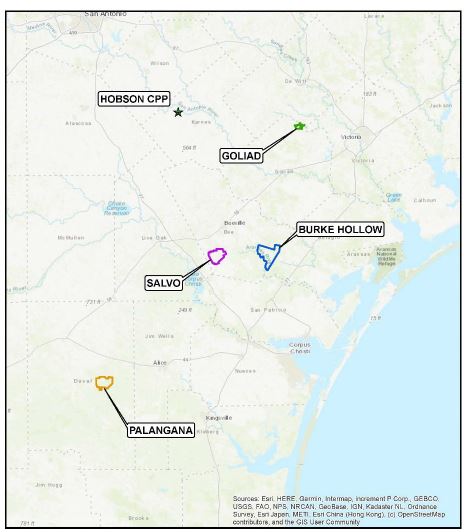
Figure 2.15 – Location of our Projects in Texas
ISR Uranium Activities in Texas
Our ISR operations in Texas consist of the following projects, (i) the Hobson CPP; (ii) the Palangana Project; (iii) the Burke Hollow Project; (iv) the Goliad Project; and (v) the Salvo Project. Production from existing wellfields at the Palangana Project ceased in 2016 and the project was put in care and maintenance mode. In order for Palangana to engage in future uranium production, the Company will need to incur capital expenditures to restart idled wellfields.
Permitting Requirements in Texas
The Hobson CPP is fully permitted. The Burke Hollow, Goliad and Palangana Projects are fully permitted to mine. The Salvo Project still requires all mining permits. Regulatory agencies include the Texas Commission on Environmental Quality (“TCEQ”), the Railroad Commission of Texas (“RRC”) and the Environmental Protection Agency (“EPA”).
Other potential permitting requirements, depending on the status of each project area, may include:
| ● |
the TCEQ will require UEC to apply for and obtain a radioactive material license pursuant to Title 30 Texas Administrative Code Chapters 305 and 336. The application must address a number of matters including, but not limited to, site characteristics (ecology, geology, topography, hydrology, meteorology, historical and cultural landmarks and archaeology), radiological and non-radiological impacts, environmental effects of accidents, decommissioning, decontamination and reclamation; |
| ● |
to produce uranium from subsurface deposits, an operator must obtain an area permit and production area authorization (PAA) pursuant to the Texas Water Code, Chapter 27. Underground injection activities cannot commence until the TCEQ has issued an area permit and PAA to authorize such activities. In addition, all portions of the proposed production zone in groundwater with a total dissolved solids concentration less than 10,000 mg/L, which will be affected by mining solutions, are included within an aquifer exemption approved by TCEQ and the EPA. The PAA application may be developed concurrently with or after the area permit application. As additional production areas are proposed to be activated within the area permit, additional PAA applications must be submitted to the TCEQ for processing and issuance before injecting within the production area; |
| ● |
in 1975, the Texas Legislature gave the RRC jurisdiction to regulate surface mining for coal and uranium. No surface mining for uranium is currently conducted at the Project, but uranium exploration for ISR operations is administered by the Surface Mining and Reclamation Division of the RRC. Active uranium exploration sites are inspected monthly (RRC, 2023). The RRC requires exploration permits for any uranium exploration in the state; |
| ● |
Texas state law does not provide any agency with the authority to regulate the use or production of groundwater unless the location lies within a water conservation district (WCD). Burke Hollow and Salvo are both located in the Bee County WCD, Goliad is located in the Goliad County WCD and Palangana resides in the Duval County WCD. Prior to initiating uranium recovery at the Project, UEC will need to acquire industrial permits to withdraw groundwater from the host sandstones. Please refer to the TRS report for the Texas Hub and Spoke Project for further details.; and |
| ● |
Class I and III injection wells are also regulated by the TCEQ. Therefore, UEC will need to acquire the appropriate permits in order to construct and operate these wells. |
In terms of leases and mineral rights, UEC’s mineral rights in Texas are held through private (fee) mineral leases. Fee mineral leases were obtained through negotiation with individual mineral owners.
Fee minerals have varying royalty rates and calculations, depending on the agreements negotiated with individual mineral owners. In addition, surface use and access agreements may include a production royalty, depending on agreements negotiated with individual surface owners at various levels. UEC’s average combined mineral plus surface production royalty applicable to each project are variable and based upon the selling price of U3O8. Most of the leases have term periods of 5 years with a 5-year renewal option. The primary lease stipulation for ISR mining is the royalty payments as a percentage of production. Royalties vary by lease and are confidential. The various lease fees and royalty conditions are negotiated with individual lessors and conditions may vary from lease to lease. No resources are reported in areas outside of the project area boundaries, which are determined by each project area’s leases.
Surface ownership at each project consists of fee lands predominantly used for agriculture and wind turbine development. On the project areas that are currently permitted, UEC has surface use agreements in place with the private landowners where appropriate. Obtaining surface access rights is a standard process in mine permitting and UEC does not anticipate that maintaining these rights presents a significant risk to UEC’s ability to perform work in Texas.
Geology and Mineralization in Texas
The Texas ISR Projects resides in the Gulf of Mexico Basin (“GMB”). The GMB extends over much of South Texas and includes the Texas coastal plain and South Texas Uranium Province (“STUP”) where the project is located. The coastal plain is bounded by the Rocky Mountain uplift to the west and drains into the Gulf of Mexico. The coastal plain is comprised of marine, non-marine and continental sediments ranging in age from Paleozoic through Cenozoic.
Uranium mineralization at the projects is typical of Texas roll-front sandstone deposits. The formation of roll-front deposits is largely a groundwater process that occurs when uranium-rich, oxygenated groundwater interacts with a reducing environment in the subsurface and precipitates uranium. The most favorable host rocks for roll-fronts are permeable sandstones with large aquifer systems. Interbedded mudstone, claystone and siltstone are often present and aid in the formation process by focusing groundwater flux.
The coastal plains of the GMB were formed by the downfaulting and down warping of Paleozoic Era (252-541 Mya) basement rocks during the breakup of the Paleozoic mega continent, Pangaea and the opening of the North Atlantic Ocean in the Late Triassic Epoch (201-237 Mya). The Rocky Mountain Uplift in the Paleogene Period (43-65 Mya) gave rise to the vast river systems that flowed toward the Gulf of Mexico carrying abundant sediments. Deposits typically thicken down-dip towards the Gulf of Mexico from western-northwestern sources. Stratigraphy in this area can be complex because of the cyclic deposition of sedimentary facies. Shallow inland seas formed broad continental shelves that covered most of Texas and deposited sedimentary units that are dominantly continental clastic with some near shore and shallow marine facies. Volcanic episodes during deposition (more than 20 Mya) are credited as being the source of the uranium deposits through ash-fall and related sediments.
All mineralization at our Texas projects occurs in the Goliad Formation. The Goliad Formation was originally classified as Pliocene in age by most sources, but the formation has been reclassified as early Pliocene to middle Miocene after recent research revealed the presence of indigenous Pliocene-aged mega-fossils occurring in upper Goliad sands, whereas the lower Goliad fluvial sands are correlative with down-dip strata containing benthic foraminifera indicating a Miocene age. The Geology of Texas map published by BEG in 1992 classifies the Goliad as Miocene in age.
The BEG’s geologic map of Texas describes the Goliad Formation as clays, sandstones, marls, caliches, limestones and conglomerates with a thickness of 100 to 500 feet. Above the Goliad Formation lies the Deweyville Formation, Beaumont Clay, Lissie Formation, Montgomery Formation and the Willis Sand, which are composed of sand, gravel, silt and clay.
Three main structural zones are present in the STUP: the Balcones Fault Zone; the San Marcos Arch; and the Rio Grande Embayment. The Balcones Fault Zone is north of the Hobson Project Area and divides the Upper Cretaceous and Eocene strata. The Balcones Fault Zone is comprised of mainly normal faults that displace sediments by up to 1,500 feet, moving downward to the Gulf of Mexico. The San Marcos Arch, northeast of the Hobson Project Area between the Rio Grande Embayment and East Texas Basin, is a broad area of lesser subsidence and a subsurface extension of the Llano Uplift. The arch is crossed by basement-related normal faults that parallel the buried Ouachita Orogenic Belt of Paleozoic age. The Rio Grande Embayment is a small, deformed basin that lies between the El Burro Uplift in northeast Mexico and the basin marginal Balcones Fault Zone to the south. Some data indicate that the embayment was possibly compressed during the Laramide Orogeny in the Late Cretaceous–Paleogene.
The uranium-bearing units in the STUP include most sands and sandstones in Tertiary formations ranging in age from Eocene (oldest) to Lower Pliocene (youngest).
The formation of roll-front deposits is largely a groundwater process that occurs when uranium-rich, oxygenated groundwater interacts with a reducing environment in the subsurface and precipitates uranium. The most favorable host rocks for roll-fronts are permeable sandstones with large aquifer systems. Interbedded mudstone, claystone and siltstone are often present and aid in the formation process by focusing groundwater flux. The geometry of mineralization is dominated by the classic roll-front “C” shape or crescent configuration at the redox interface. The highest-grade portion of the front occurs in a zone termed the “nose” within reduced ground just ahead of the alteration front. Ahead of the nose, at the leading edge of the solution front, mineral quality gradually diminishes to barren within the “seepage” zone. Trailing behind the nose, in oxidized (altered) ground, are weak remnants of mineralization referred to as “tails” which have resisted re-mobilization to the nose due to association with shale, carbonaceous material or other lithologies of lower permeability. Tails are generally not amenable to ISR because the uranium is typically found within strongly reduced or impermeable strata, therefore making it difficult to leach.
Our Material Properties in Texas
Hobson CPP
The independent TRS for the Hobson CPP Project area (the “Hobson Project Area”) has been prepared for UEC, under the supervision of WWC (the “QP” herein”), pursuant to S‑K 1300. This TRS identifies and summarizes the scientific and technical information and conclusions reached from the initial assessment (“IA”) to support disclosure of mineral resources on projects surrounding the Hobson Project Area. There are no resources directly associated with the Hobson Project Area.
Property Description
The Hobson Project Area is located in Karnes County, Texas, northwest of Karnes City, within the GMB, approximately 100 miles northwest of Corpus Christi and 40 miles southeast of San Antonio. This facility represents the ‘hub’ of UEC’s ‘hub-and-spoke’ business model, which comprises a central processing facility supplied with uranium-loaded IX resin from ISR mining at one or more of the project areas. The Hobson CPP was constructed in 1978 when the Hobson Project Area was mined. In 2008, the plant was refurbished. The Hobson CPP has previously processed uranium from UEC’s Palangana Mine satellite facility (i.e., the first UEC ‘spoke’), and UEC plans to also process uranium from its Burke Hollow, Goliad, and Salvo Project satellite facilities.
The Hobson CPP consists of a resin transfer circuit for loading/unloading IX resin from tanker trucks, an elution circuit to strip uranium from the IX resin, a circuit to precipitate uranium oxide solids, a yellowcake thickener (if necessary) and a modern, zero-emission vacuum dryer. Other facilities and equipment include an advanced laboratory with inductively coupled plasma mass spectrometry, office building, yellowcake and byproduct material storage area, chemical storage tanks and one permitted and constructed waste disposal well. Another waste disposal well is permitted but has not been drilled because additional disposal capacity is not needed at the current time. With an average dryer cycle time of 40 hours and a current dryer loading capacity of 8 to 10 drums, the plant appears capable of yielding up to 1.5 million pounds per year without requiring physical modifications. An amendment to the license to increase annual capacity up to 4.0 millons pounds per year was recently approved, so the Hobson CPP is now permitted for production of up to four million pounds per year of uranium concentrates (yellowcake or U3O8). WWC personnel visited the Hobson CPP on November 2, 2021, and found it to be in a well-maintained and apparently fully operational condition, although the plant was inactive (i.e., not processing a batch of uranium-loaded resin) during the site visit.
The Hobson CPP will serve as the ‘hub’ of the Hobson Project Area with the other project areas serving as satellite facilities, or the ‘spokes”. The satellite facilities are considered material to the Hobson CPP. Mineral is mined at the project areas and is then transported to the Hobson CPP for processing.
A surety bond is in place for the Hobson CPP decommissioning requirements and is updated annually.
History
Uranium exploration and mining in South Texas primarily targets sandstone formations throughout the Coastal Plain bordering the Gulf of Mexico. The area has long been known to contain uranium oxide, which was first discovered in Karnes County, Texas, in 1954 using airborne radiometric survey. The uranium deposits discovered were within a belt of strata extending 250 miles from the middle coastal plain southwestward to the Rio Grande. This area includes the Carrizo, Whitsett, Catahoula, Oakville and Goliad geologic formations. Open pit mining began in 1961 and ISR mining was initiated in 1975. The uranium market experienced lower demand and price in the late 1970s, and in 1980 there was a sharp decline in all Texas uranium operations.
During the late 1970s and early 1980s, exploration for uranium in South Texas had evolved towards deeper drilling targets within the known host sandstone formations. Deeper exploration drilling was more costly and excluded many of the smaller uranium mining companies from participating in the down-dip, deeper undrilled trend extensions. Uranium had been mined by several major oil companies in the past in South Texas, including Conoco, Mobil, Humble (later Exxon), Atlantic Richfield (“ARCO”) and others. Mobil had found numerous deposits in South Texas in the past, including the O’Hern, Holiday-El Mesquite and several smaller deposits, mostly in Oligocene-age Catahoula Formation tuffaceous sands. ARCO discovered several Oakville Formation (Miocene-age) uranium-bearing deposits and acquired other deposits located nearby in Live Oak County. They were exploring deeper extensions of Oakville Formation trends when they discovered the Mt. Lucas deposit, located near Lake Corpus Christi in Live Oak County near the Bee County line.
Ownership, control and operation of the Hobson Project Areas has varied greatly since the 1950s. The table below summarizes the operations and activities of various companies, the timeframe during which these activities were completed and the results of the work. The table below also summarizes historic drilling and the number of drill holes completed during each period.
Table 2.31: Historic Ownership and Operations at the Hobson Project Area
| Year |
Company |
Operations/Activity |
Amount |
Results of Work |
| 1979-1988 |
Everest Minerals Corporation (later Everest Exploration, Inc. (EEI)) |
Hobson facility constructed. |
N/A |
N/A |
| 2005 |
Standard Uranium |
N/A |
N/A |
N/A |
| 2006 |
EMC |
Standard Uranium and EMC merger. |
N/A |
N/A |
| 2007 |
Uranium One |
Renovation of the plant. |
N/A |
CPP capable of processing 1.5 million lbs per year. |
| 2009 |
UEC |
Acquires the Hobson Plant through acquisition of South Texas Mining Venture (STMV)/Uranium One. |
N/A |
N/A |
Geologic Setting, Mineralization and Deposit
The Hobson Project Area is located in the STUP which lies along the GMB.
All mineralization at the Hobson Project Area occurs in the Goliad Formation. The Goliad Formation was originally classified as Pliocene in age by most sources, but the formation has been reclassified as early Pliocene to middle Miocene after recent research revealed the presence of indigenous Pliocene-aged mega-fossils occurring in upper Goliad sands, whereas the lower Goliad fluvial sands are correlative with down-dip strata containing benthic foraminifera indicating a Miocene age. The Geology of Texas map published by the Texas Bureau of Economic Geology (“BEG”) in 1992 classifies the Goliad as Miocene in age.
Uranium mineralization occurs in zones that are located in fluvial channel sands of the Goliad Formation. These deposits consist of multiple mineralized sand horizons which are separated vertically by confining beds of silt, mudstone, and clay.
The Hobson project does not have associated current reserves or resources.
Palangana Project
The independent TRS for the Palangana Project area (the “Palangana Project Area”) has been prepared for UEC, under the supervision of WWC (the “QP” herein), pursuant to S-K 1300. This TRS identifies and summarizes the scientific and technical information and conclusions reached from the IA to support disclosure of mineral resources on the Palangana Project Area.
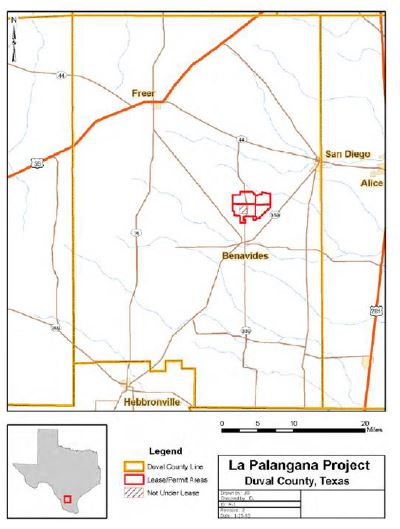
Figure 2.16 – Location of the Palangana Project
Property Description
The Palangana Project Area is 25 miles west of the town of Alice, Texas, and 15 miles to the southeast of Freer, Texas, in Duval County. Corpus Christi is about 65 miles to the east of the Palangana Project Area. The Palangana Project Area has been developed by several operators since the 1950s and has several wellfields that are drilled and ready for operations. In addition, the Palangana Project Area produced 563,600 pounds U3O8 from 2010 to 2016 and currently has the infrastructure to begin mining immediately. No resources are reported in areas outside of the Palangana Project Area boundary. There are no reserves associated with the Palangana Project Area and it is considered a remote ‘satellite’ to the Hobson CPP.
Mineral rights for the Project are private (fee) mineral leases, obtained through negotiation with individual mineral owners. There are 12 fee mineral leases comprised of 6,969 acres at the Palangana project area. No resources are reported in areas outside of the Palangana project area boundary.
The Palangana Project is considered an Exploration Stage property under S-K 1300 as it has no currently defined reserves, but is a past producer and in terms of present conditions has all of the required permits and infrastructure necessary for ISR production. It has been carried in a care and maintenance condition since cessation of uranium recovery in 2016. The Company intends to continue the care and maintenance of the Palangana ISR Project Area, pending restart of uranium recovery operations.
There are no significant encumbrances to the property though routine renewals of permits and authorizations is ongoing. No recent regulatory violations or fines have been levied. A surety bond is in place for the Palangana Project’s restoration, reclamation and decommissioning requirements and is updated annually.
History
Uranium mineralization was discovered during potash exploration drilling of the Palangana Project Area Dome’s gypsum-anhydrite cap rock in 1952 by Columbia Southern Inc. (“CSI”), a subsidiary of Pittsburgh Plate Glass Corp. CSI conducted active uranium exploration drilling on the property starting in March 1956. Records of CSI’s exploration work are unavailable. However, both CSI and the AEC estimated underground mineable uranium resources. The only known details of the estimation method include a 0.15% eU3O8, a minimum mining thickness of 3 feet and widely spaced drilling on a nominal 200-foot exploration grid.
Union Carbide Corporation (“UCC”) acquired the Palangana Project Area property in 1958 and initiated underground mine development. Development work was quickly abandoned due to heavy concentrations of H2S gas, and UCC dropped the property. UCC reacquired the Palangana Project Area in 1967 after recognizing that it would be amenable to exploitation by the emerging ISR mining technologies. During the 1960s and 1970s, UCC drilled over 1,000 exploration and development holes and installed over 3,000 injection-production holes in a 31-acre block.
UCC attempted an ISR operation from 1977 through 1979 using a push/pull injection/recovery system. Ammonia was used as the lixiviate that later caused some environmental issues with groundwater. About 340,000 pounds of U3O8 were produced from portions of a 31-acre wellfield block. The production pounds indicate a 32% to 34% recovery rate. The push/pull injection/recovery system was later proven to be less productive than well configurations or patterns of injection wells around a recovery well. Further, the wellfield was developed without any apparent regard to the geology of the deposit, including disequilibrium. The UCC ISR work was basically conducted at a research level in contrast to the current level of knowledge. The historic production area lies on the western side of the dome and is not part of this resource estimate.
UCC placed the property leases up for sale in 1980. In 1981, Chevron Corporation (“Chevron”) acquired the UCC leases and conducted their own resource evaluation. After the price of uranium dropped to under $10/lb., General Atomics acquired the property and dismantled the process plant in a property-wide restoration effort. Upon formal approval of the clean up by the Texas Natural Resources Conservation Commission and the NRC, the property was returned to the landowners in the late 1990s.
In 2005, EEI acquired the Palangana Project Area property and later joint ventured with Energy Metals through the formation of STMV. An independent consultant estimated that there were 5.7 million pounds of inferred resources in an area now referred to as the Dome trend proximal to the dome on the west side north of the prior UCC leach field. In 2006 and 2007, Energy Metals drilled approximately 200 additional confirmation and delineation holes. The PA-1 and PA-2 areas were found during this drilling program. In 2008, Energy Metals was acquired by Uranium One. During 2008 and 2009, the remainder of the holes on this Palangana Project Area were drilled by Uranium One. During this time, the five exploration trends to the east of the dome were identified and partially delineated. In December 2009, UEC acquired 100% ownership of STMV.
The table below describes the historic ownership and operations at the Palangana Project Area.
Table 2.32: Historic Ownership and Operations at the Palangana Project Area
| Year |
Company |
Operations/Activity |
Amount |
Results of Work |
| 1952 |
CSI |
Original controller of Palangana Project Area. |
Records of CSI’s exploration work was unavailable |
Right to mine secured. Uranium mineralization was discovered during potash exploration drilling of the Palangana Dome in 1952 by CSI. CSI conducted active uranium exploration drilling on the property starting in March 1956. CSI and the AEC estimated underground mineable uranium resources. The estimation method included identifying 0.15% eU3O8, a minimum mining thickness of 3 ft, and exploration was widely spaced drilling on a nominal 200 ft exploration grid. |
| 1958 |
UCC |
UCC acquired the Palangana Project Area in 1958 and ceased operations shortly after until 1967, when operations resumed for over a decade due to new technology. UCC placed the Palangana Project Area up for lease in 1980. |
Over 1,000 exploration and development holes in 1960s and 70s (296 cores) |
Early development work was quickly abandoned because of concentrations of Hydrogen Sulfide (H2S) gas. The property was reacquired in 1967 after emerging ISR mining technologies were available. ISR operation occurred from 1977 through 1979. About 340,000 lbs of U3O8 were produced from portions of a 31-acre wellfield block. The production pounds indicate a 32% to 34% recovery rate. The ISR work was conducted at a research level in contrast to the current level of knowledge. Historic production lies on the western flank of the dome and is not part of this resource estimate. |
| 1981 – Unknown |
Chevron |
Chevron acquired the UCC leases and conducted their own resource evaluation. |
N/A |
Chevron resource evaluation indicated that an estimated 8 million lbs (non-CIM compliant) of eU3O8 existed on the entire site within unclassified material containing 0.125% eU3O8. |
| Unknown to late 1990’s |
General Atomics |
General Atomics acquired the Palangana Project Area for restoration work. |
N/A |
General Atomics acquired the property and dismantled the process plant in a property-wide restoration effort. Upon formal approval of the clean up by the Texas Natural Resources Conservation Commission and the NRC, the property was returned to the landowners in the late 1990s. |
| Late 1990’s to 2005 |
N/A |
The Palangana Project Area returned to surface rights landowners. |
N/A |
N/A |
| 2005 |
EEI and Energy Metals/Uranium One |
EEI acquires Palangana and joint ventured with Energy Metals by forming the STMV. In 2008, Energy Metals was acquired by Uranium One. |
Approximately 236 exploration and confirmation holes. |
Blackstone (2005) estimated 5.7 million lbs of inferred resources in the area referred to as the Dome trend proximal to the dome on the west side, north of the prior UCC leach field. In 2006 and 2007, Energy Metals drilled approximately 200 additional confirmation and delineation holes. The PA-1 and PA-2 areas were delineated during this drilling program. During 2008 and 2009, the remainder of the holes were drilled by Uranium One. During this time, five exploration trends on the east side of the dome were identified and partially delineated. |
| 2009 |
UEC |
Palangana Project Area acquired by UEC from Uranium One. |
N/A |
UEC acquires Palangana. SRK was retained by UEC in 2010 to provide an independent resource and reserve evaluation on PA-1 and PA-2 and adjacent exploration areas. SRK concluded the sandstone, roll-front deposits on the east side of the Palangana Dome contain significant resources of eU3O8. Specifically, PA-1 and PA-2 bodies are adequately delineated for the calculation of Measured and Indicated Resources. SRK developed resource estimates within distinct sand and roll-front zones utilizing detailed computer block modeling of grade and GT modeling. The results of the resource estimation are complex and presented in more detail in this report. In 2010, UEC resumed production at Palangana. Approximately 563,600 pounds were produced from 2010 to 2016 in PA-1, PA-2 and PA-3. |
Geologic Setting, Mineralization, and Deposit
The Palangana Project Area is located in the STUP, which lies along the GMB.
The local geology at the Palangana Project Area is characterized by the occurrence of a Gulf Coast piercement salt dome. This dome is approximately two miles in diameter and is overlain by Pliocene sediments of the Goliad Formation. The Palangana Project Area dome is marked at the surface by a shallow circular basin surrounded by low hills rising above the basin floor. The Palangana Project Area dome has an almost perfectly circular salt core with a remarkably flat top that is approximately 10,000 feet across and occurs from 800 to 850 feet below ground surface (“bgs”). Radial faulting is present in all Goliad Formation sands on the flanks of the dome due to uplift during the intrusion of the dome. Faults and fractures also exist in a random nature in the sands above the caprock due to dissolution of the salt dome from groundwater. Once the salt was solubilized and removed, the overlying sediment collapsed, creating the basin and associated faults.
Uranium mineralization at the Palangana Project Area is typical of Texas roll-front sandstone deposits. Uranium mineralization occurs along oxidation/reduction interfaces in fluvial channel sands of the Goliad Formation. These deposits consist of multiple mineralized sand horizons, which are separated vertically by confining beds of silt, mudstone, and clay.
The Goliad Formation at the Palangana Project Area is composed of fine- to medium-grained, often silty, channel sands interbedded with lenses of mudstone and siltstone. For the most part, the sand is very sparsely cemented although it varies from friable to indurated. There is known to be minor faulting on the north end of the PA-1 deposit. The Palangana Project Area stratigraphy is horizontal to sub-horizontal, with a 2-to-3-degree southeasterly dip at most.
Table 2.33 – Mineral Resources for the Palangana Project as at the date of this Annual Report
| Classification |
Tons Ore (000’s) |
Tonnes Ore (1000’s) |
Average Grade (% eU3O8) |
Pounds eU3O8 (000’s) |
| Measured |
- |
- |
- |
- |
| Indicated |
232 |
210 |
0.134 |
643.1 |
| Total M&I |
232 |
210 |
0.134 |
643.1 |
| Inferred – PA-1 and PA-2 |
96 |
87 |
0.100 |
192.5 |
| Inferred – Dome, NE Garcia, SW Garcia, CC Brine, Jemison Fence, Jemison East |
206 |
187 |
0.110 – 0.300 |
808.8 |
| Total Resources |
534 |
484 |
0.154 |
1,644.4 |
Notes:
| 1. |
Pounds reported with Disequilibrium Factor (DEF) applied. |
|
| 2. |
A range of grades is presented for the Palangana inferred mineral because the resource estimation methods differed between PA-1/PA-2 and the rest of the trends. There was no cutoff for PA-1 and PA-2 block models. See Section 11.1 of the Texas Hub and Spoke TRS for a more detailed explanation. |
|
| 3. |
The sum of resource tons and lbs may not add up to the reported total due to rounding. |
|
| 4. |
Measured, indicated, and inferred mineral resources as defined in 17 CFR § 229.1300. |
|
| 5. |
Delineation drilling conducted at Palangana after 2010 was not incorporated into the resource estimate as in the experience of the QP, this type of drilling does not generally substantially change the resource estimates. |
|
| 6. |
All reported resources occur below the static water table. |
|
| 7. |
The point of reference for mineral resources is in-situ at the Project. |
|
| 8. |
Mineral resources that are not mineral reserves do not have demonstrated economic viability. |
Burke Hollow ISR Project
The independent TRS for the Burke Hollow Project area (the “Burke Hollow Project Area”) has been prepared for UEC, under the supervision of WWC (the “QP” herein), pursuant to S-K 1300. This TRS identifies and summarizes the scientific and technical information and conclusions reached from the IA to support disclosure of mineral resources on the Burke Hollow Project Area. There are no reserves associated with the Burke Hollow Project Area.
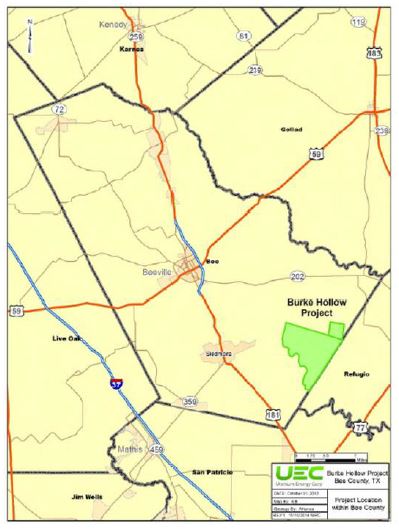
Figure 2.17 – Location of the Burke Hollow Project
Property Description
UEC’s Burke Hollow Project property is located within the extensive STUP. The Burke Hollow Project is about 18 miles southeast of the town of Beeville and is located on the western side of US 77 and northeasterly of US 181, which links with US 59 in Beeville. The approximate center of the Burke Hollow Project lease is located at latitude 28.2638 and longitude -97.5176, in decimal degrees. Site drilling roads are entirely composed of caliche and gravel, allowing access for trucks and cars in most weather conditions. Four-wheel drive vehicles may be needed during high rainfall periods.
The Burke Hollow Project consists of one fee (private) mineral leases comprised of 17,511 acres. This lease area would allow for the mining of uranium by ISR methods while utilizing the land surface (with variable conditions) as needed, for mining wells and above ground surface facilities for fluid processing and uranium production during the mining and groundwater restoration phases of the Burke Hollow Project. All payments for the private lease are up to date. No mineral resources are reported in areas outside of the Burke Hollow Project boundary.
The present condition of the property is considered advanced with monitor well installation completed in the first production area. A caliche pad site with offices and storage containers in addition to some all-weather roads are constructed, and plans are in place for power and other infrastructure needs.
No significant encumbrances exist on the property. The Company intends to complete the permitting of the production area authorization (PAA) and other necessary approvals in the coming years. To date, there have been no violations or fines levied on the property. A surety estimate for Burke Hollow’s project restoration, reclamation and decommissioning costs have been prepared and approved by the Texas Commission on Environmental Quality (TCEQ). A surety bond for the current restoration, reclamation and decommissioning requirements will be in place at least 60 days prior to production.
History
Uranium exploration and mining in South Texas primarily targets sandstone formations throughout the Coastal Plain bordering the Gulf of Mexico. The area has long been known to contain uranium oxide, which was first discovered in Karnes County, Texas, in 1954 using airborne radiometric survey. The uranium deposits discovered were within a belt of strata extending 250 miles from the middle coastal plain southwestward to the Rio Grande. This area includes the Carrizo, Whitsett, Catahoula, Oakville, and Goliad geologic formations. Open pit mining began in 1961 and ISR mining was initiated in 1975. The uranium market experienced lower demand and price in the late 1970s and in 1980, there was a sharp decline in all Texas uranium operations.
During the late 1970s and early 1980s, exploration for uranium in South Texas had evolved towards deeper drilling targets within the known host sandstone formations. Deeper exploration drilling was more costly and excluded many of the smaller uranium mining companies from participating in the down-dip, deeper undrilled trend extensions. Uranium had been mined by several major oil companies in the past in South Texas, including Conoco, Mobil, Humble (later Exxon), ARCO and others. Mobil had found numerous deposits in South Texas in the past, including the O’Hern, Holiday-El Mesquite and several smaller deposits, mostly in Oligocene-age Catahoula Formation tuffaceous sands. ARCO discovered several Oakville Formation (Miocene-age) uranium-bearing deposits and acquired other deposits located nearby in Live Oak County. They were exploring deeper extensions of Oakville Formation trends when they discovered the Mt. Lucas Goliad Formation deposit, located near Lake Corpus Christi in Live Oak County near the Bee County line.
The earliest known uranium exploration in the immediate area of the Burke Hollow Project Area was performed by Nufuels Corporation (“Nufuels”, a Mobil Corporation subsidiary) in 1982. Nufuels drilled a total of 18 exploration holes on or nearby UEC’s 1,825 acre Welder lease. These holes were drilled in conjunction with a larger regional program that was conducted by Nufuels. Each exploration hole was drilled to an average total depth of approximately 1,100 ft in order to test the entire prospective Goliad Formation. UEC acquired copies of the Nufuels logs through its purchase of TOMIN’s database.
Following Nufuels, in 1993, TOMIN conducted a short reconnaissance exploration drilling program on the Thomson-Barrow lease. TOMIN drilled a total of 12 holes on permitted acreage that they negotiated for exploration. 11 of the 12 drill holes intersected anomalous gamma ray log signatures indicative of uranium mineralization.
The historic data package obtained by UEC for portions of the current Burke Hollow Project Area provided the above-described information. Based on the limited number of drill holes, no meaningful resource or reserve determination was made by TOMIN or Nufuels. However, the actual drilling and geophysical logging results have been determined to be properly conducted according to current industry standards.
Table 2.34: Historic Ownership and Operations at the Burke Hollow Project Area
| Year |
Company |
Operations/Activity |
Amount |
Results of Work |
| 1982 |
Nufuels |
Original controller of the Burke Hollow Project Area. |
18 exploration holes on or nearby the Welder Lease |
Nufuels drilled 18 exploration holes on or nearby UEC’s 1,825-acre Welder lease in conjunction with a larger regional program, which was conducted by Nufuels. Exploration holes were drilled to approximately 1,100 ft bgs and tested the entire prospective Goliad Formation. Results showed the presence of a reduction-oxidation interface in sands of the lower Goliad Formation, but there was insufficient data to link economically viable uranium mineralization. |
| 1993 |
TOMIN |
Exploration program. |
12 exploration holes on or near the Thomson-Barrow Lease. |
TOMIN conducted a short reconnaissance exploration drilling program on the Thomson-Barrow lease. TOMIN drilled a total of 12 holes on permitted acreage that they negotiated for exploration. 11 of the 12 drill holes intersected anomalous gamma ray log signatures indicative of uranium mineralization, but there was insufficient data to link economically viable uranium mineralization. |
| 2011 |
UEC |
The Burke Hollow Project Area was acquired by UEC from TOMIN. |
From 2012-2017, 707 uranium exploration drill holes, including 30 monitor wells completed at the Welder lease (Kurrus et al. 2014). |
The historic data package was obtained and reviewed by UEC for portions of the current Burke Hollow Project Area (Kurrus and Yancy, 2017). Based on the limited number of drill holes, no meaningful resource or reserve determination was made using the historic exploration data. However, the actual drilling and geophysical logging results were determined to be properly conducted, per industry standards. UEC completed two drilling campaigns to delineate the opened ended Lower B1 and B2 trends (Carothers et al., 2013). The results of historic and contemporary borehole gamma-ray, SP and resistance logs, as well as PFN logs indicate that uranium mineralization occurs in the upper to lower Goliad Formation sand/sandstone units below the water table at depths from approximately 180 to 1,100 ft bgs. Evidence indicate ISR would likely be the most suitable mining method for this project. In 2017, UEC estimated an Inferred Mineral Resource of 4,064,575 tons grading 0.088% pU3O8 (PFN determination) containing approximately 7.09 million pounds U3O8 in the combined Graben and Eastern Lower B trends. |
| 2019 |
UEC |
Exploration program. |
In 2019, 129 delineation holes were drilled. |
In 2019, UEC completed 129 drill holes, mostly focusing on delineating the Lower B1 and Lower B2 sands in the proposed PA-1. In addition, UEC began installing perimeter monitor wells in proposed PA-1. In total, 57 holes were drilled solely for delineation and exploration purposes and 72 holes were drilled for monitoring purposes. From 2021 to 2022, UEC conducted another drilling program to upgrade a portion of their resources from inferred to measured and indicated, to better define the ore body in proposed PA-1 and to install monitor wells. 168 delineation and exploration holes were drilled as of March 7, 2022. 24 of these holes were also used as monitor wells. This drilling program is ongoing for the purpose of completing more monitor wells. The first production area authorization application has been submitted and 533 exploration and delineation holes have been drilled within PA-2 area as of July 31, 2023.
|
Geologic Setting, Mineralization and Deposit
The Burke Hollow Project Area is located in the STUP, which lies along the GMB.
Uranium mineralization at the Burke Hollow Project Area is typical of Texas roll-front sandstone deposits. All mineralization at the Burke Hollow Project Area occurs in the Goliad Formation. Uranium mineralization occurs along oxidation/reduction interfaces in fluvial channel sands of the Goliad Formation. These deposits consist of multiple mineralized sand horizons which are separated vertically by confining beds of silt, mudstone, and clay.
The uranium-bearing sands of the Goliad Formation at the Burke Hollow Project Area occur beneath a thin layer of Pleistocene-aged Lissie Formation gravels, sands, silts, and clays, which overlie much of the Burke Hollow Project Area. The Goliad Formation uncomfortably underlies the Lissie Formation. Uranium mineralization discovered to date occurs within three of the four sand members of the Goliad, designated as the uppermost Goliad A, Goliad B and the lowermost Goliad D.
The Goliad sand is one of the principal water-bearing formations in South Texas and is capable of yielding moderate to large quantities of water. All of the project areas included in this Burke Hollow Project Area target the Goliad Formation, which is a proven aquifer with characteristics favorable to ISR.
There are two northeast-southwest trending faults at the Burke Hollow Project Area that are likely related to the formation of uranium mineralization. The northwesterly fault is a typical Gulf Coast normal fault, downthrown toward the coast, while the southeastern fault is an antithetic fault downthrown to the northwest, forming a large graben structure. The presence of these faults is likely related to the increased mineralization at the site. The faulting may have served as conduits for reducing waters and natural gas to migrate upward from deeper horizons, as well as altering the groundwater flow system in the uranium-bearing sands.
Table 2.35 – Mineral Resources for the Burke Hollow Project as at the date of this Annual Report
| Classification |
Tons Ore (000’s) |
Tonnes Ore (1000’s) |
Average Grade (% eU3O8) |
Pounds eU3O8 (000’s) |
| Measured |
70 |
64 |
0.082 |
114.7 |
| Indicated |
1,337 |
1,213 |
0.087 |
2,209.0 |
| Total M&I |
1,407 |
1,277 |
0.083 |
2,323.7 |
| Inferred |
2,494 |
2,263 |
0.095 |
4,859.0 |
| Total Resources |
3,901 |
3,540 |
0.092 |
7,182.7 |
Notes:
| 1. |
Pounds reported with Disequilibrium Factor (DEF) applied. |
|
| 2. |
The sum of resource tons and lbs. may not add up to the reported total due to rounding. |
|
| 3. |
Measured, indicated, and inferred mineral resources as defined in 17 CFR § 229.1300. |
|
| 4. |
GT Cutoff = 0.3 m% eU3O8 |
|
| 5. |
All reported resources occur below the static water table. |
|
| 6. |
The point of reference for mineral resources is in-situ at the Project. |
|
| 7. |
Mineral resources that are not mineral reserves do not have demonstrated economic viability. |
Goliad Project
The independent TRS for the Goliad Project area (the “Goliad Project Area”) has been prepared for UEC, under the supervision of WWC (the “QP” herein), pursuant to S-K 1300. This TRS identifies and summarizes the scientific and technical information and conclusions reached from the IA to support disclosure of mineral resources on the Goliad Project Area. There are no reserves associated with the Goliad Project Area.
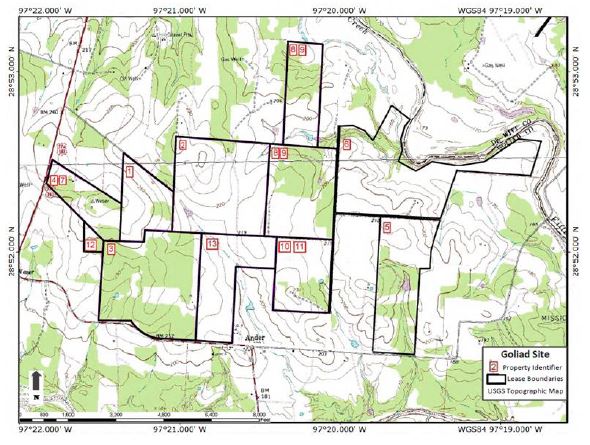
Figure 2.18 – Location of the Goliad Project
Property Description
The Goliad Project Area is located in South Texas near the northeast end of the STUP. The Goliad Project Area consists of multiple contiguous leases that would allow the mining of uranium by ISR methods. The Goliad Project Area is about 14 miles north of the town of Goliad and is located on the east side of US Highway 77A/183, a primary highway that intersects with US Highway 59 in Goliad and I-10 to the north. Site drilling roads are mostly gravel based and allow access for trucks and cars in most weather conditions. Four-wheel drive vehicles may be needed during high rainfall periods.
There are seven fee (private) mineral leases comprised of 636 acres on the Goliad Project Area. Payments for the private leases are up to date. UEC obtained mining leases by assignment from a private entity (Brad A. Moore) in 2006. No resources are reported in areas outside of the Goliad Project Area boundary. UEC has completed all the required permitting in order to mine at the Goliad Project Area.
While the projects current designation under S-K 1300 is Exploration Stage due to lack of reserves, the current condition of the property is moderately advanced. The project lacks only the production area authorization in terms of regulatory authorizations and is otherwise fully permitted with the radioactive materials license in timely renewal. The Company plans to continue to keep the property in a care and maintenance status.
No significant encumbrances are on the property. The Company intends to continue permit renewals and there have been no violations or fines levied on the property. A surety estimate for the Goliad Project’s restoration, reclamation and decommissioning has been prepared and approved by the Texas Commission on Environmental Quality (TCEQ). A surety bond for the current restoration, reclamation and decommissioning requirements will be in place at least 60 days prior to production.
History
Uranium exploration and mining in South Texas primarily targets sandstone formations throughout the Coastal Plain bordering the Gulf of Mexico. The area has long been known to contain uranium oxide, which was first discovered in Karnes County, Texas, in 1954 using airborne radiometric survey. The uranium deposits discovered were within a belt of strata extending 250 miles from the middle coastal plain southwestward to the Rio Grande. This area includes the Carrizo, Whitsett, Catahoula, Oakville and Goliad geologic formations. Open pit mining began in 1961 and ISR mining was initiated in 1975. The uranium market experienced lower demand and price in the late 1970s and in 1980 there was a sharp decline in all Texas uranium operations.
During the late 1970s and early 1980s, exploration for uranium in South Texas had evolved towards deeper drilling targets within the known host sandstone formations. Deeper exploration drilling was more costly and excluded many of the smaller uranium mining companies from participating in the down-dip, deeper undrilled trend extensions. Uranium had been mined by several major oil companies in the past in South Texas, including Conoco, Mobil, Humble (later Exxon), ARCO and others. Mobil had found numerous deposits in South Texas in the past, including the O’Hern, Holiday-El Mesquite and several smaller deposits, mostly in Oligocene-age Catahoula Formation tuffaceous sands. ARCO discovered several Oakville Formation (Miocene-age) uranium-bearing deposits and acquired other deposits located nearby in Live Oak County. They were exploring deeper extensions of Oakville Formation trends when they discovered the Mt. Lucas Goliad Formation deposit, located near Lake Corpus Christi in Live Oak County near the Bee County line.
Table 2.36: Historic Ownership and Operations at the Goliad Project Area
| Year |
Company |
Operations/Activity |
Amount |
Results of Work |
| 1979 |
Coastal Uranium, Inc. (Coastal Uranium) |
Exploration program. |
12 exploration holes. |
Coastal Uranium drilled widely spaced exploration holes in the region as part of the Coastal States wide-spaced drilling exploration effort. Eight of these holes were drilled at or near the Goliad Project Area. Additional information on the exploration is described below. |
| 1980 |
Moore Energy Corporation |
Review of data and leases from Coastal Uranium and exploration program. |
479 exploration and delineation holes. |
Moore Energy Corporation reviewed the Coastal States exploration data and soon after acquired several leases from Coastal Uranium, including several in the Goliad Project Area. From March 1983 through August 1984, Moore Energy Corporation conducted an exploration program at Goliad. All of the boreholes were drilled using truck-mounted drilling rigs contracted with various drilling companies. Samples were taken by the driller for review and logged by a geologist. The holes were logged for gamma ray, self-potential and resistance by contract logging companies. No down-hole deviation tool was available. Historical resource estimates were prepared by Moore Energy Corporation from data gathered in 1983-1985. For each drill hole, a Grade x Thickness (GT) was determined, and the mineral was outlined with a 0.3 GT contour. The average GT of the holes within the contoured outline was used to estimate the resources meeting the specified criteria. Moore Energy Corporation’s historical resource estimated approximately 3,366,000 tons at an average grade of 0.05% (eU3O8 and an average DEF of 1.494 (Moore, 1986). This equates to approximately 5.2 million lbs of uranium. |
| 2006 |
UEC |
Exploration program. |
360 exploration and delineation holes. |
UEC obtained mine leases by assignment from Brad A. Moore for the current Goliad Project Area in 2006. UEC drilled 360 more holes at the property from May 2006 through June 2007. These holes include closer-spaced delineation work on the areas drilled by Moore Energy Corporation. Additionally, several of the UEC holes were drilled to further exploration on contiguous leases to the east of the property. A 2007/2008 report by Thomas Carothers, PG estimated historical mineral resources based on the UEC 2006-2007 confirmation drilling results and the Moore Energy Corporation historical estimate. The author concluded that significant uranium resources from the work in 1983-85 described by Moore Energy Corporation appears to be backed and supported by the more recent UEC exploration data. |
| 2014 |
UEC |
Exploration and water well program. |
33 exploration holes and two water wells drilled. |
In 2014, UEC conducted a drilling program at the Goliad Project Area for exploration and water wells. 35 holes were drilled and logged for exploration and water supply purposes with a majority of the holes being drilled in PA-1 and PA-2. |
Geologic Setting, Mineralization, and Deposit
The Goliad Project Area is located in the STUP, which lies along the GMB.
Uranium mineralization at the Goliad Project Area is typical of Texas roll-front sandstone deposits. All mineralization at the Goliad Project Area occurs in the Goliad Formation. The Goliad Formation occurs at surface on the Goliad Project Area. The mineralized units are sandstones within the Goliad Formation and are designated by UEC as the A through D sands from younger (upper) to older (lower), respectively. The sand units are generally fine to medium-grained sands with silt and varying amounts of secondary calcite. The sand units vary in color depending upon the degree of oxidation-reduction and could be from light brown-tan to gray. The sand units are generally separated from each other by silty clay or clayey silts that serve as confining units between the sand units.
The four sandstone units (A-D) designated as containing uranium mineralization at the site are all considered to be a part of the Gulf Coast Aquifer on a regional basis. At the Goliad Project Area, each unit is a hydrogeologic unit with similar but variable characteristics. Groundwater from sands of the Goliad Formation is used for water supplies over much of the northern portion of Goliad County.
The Goliad structures include two faults that intersect and offset the mineralized units. These faults are normal faults, with one downthrown toward the coast and one downthrown toward the northwest. The fault throws range from about 40 to 80 feet.
The Goliad sand is one of the principal water-bearing formations in South Texas and can yield moderate to large quantities of water. All of the project areas included in this Goliad Project Area target the Goliad Formation, which is a proven aquifer with characteristics favorable to ISR.
Table 2.37 – Mineral Resources for the Goliad Project as at the date of this Annual Report
| Classification |
Tons Ore (000’s) |
Tonnes Ore (1000’s) |
Average Grade (% eU3O8) |
Pounds eU3O8 (000’s) |
| Measured |
1,595 |
1,447 |
0.053 |
2,667.9 |
| Indicated |
1,504 |
1,364 |
0.102 |
3,492.0 |
| Total M&I |
3,099 |
2,811 |
0.099 |
6,159.9 |
| Inferred |
1,548 |
1,403 |
0.195 |
1,224.8 |
| Total Resources |
4,647 |
4,214 |
0.079 |
7,384.7 |
Notes:
| 1. |
Pounds reported with Disequilibrium Factor (DEF) applied. |
|
| 2. |
The sum of resource tons and lbs. may not add up to the reported total due to rounding. |
|
| 3. |
Measured, indicated, and inferred mineral resources as defined in 17 CFR § 229.1300. |
|
| 4. |
GT Cutoff = 0.20 m% eU3O8 |
|
| 5. |
All reported resources occur below the static water table. |
|
| 6. |
The point of reference for mineral resources is in-situ at the Project. |
|
| 7. |
Mineral resources that are not mineral reserves do not have demonstrated economic viability. |
Salvo ISR Project
An independent TRS for the Salvo Project area (the “Salvo Project Area”) has been prepared for UEC, under the supervision of WWC (as “QP” herein), pursuant to S-K 1300. This TRS identifies and summarizes the scientific and technical information and conclusions reached from the IA to support disclosure of mineral resources on the Salvo Project Area. There are no mineral reserves associated with this Salvo Project Area.
Surety estimates for restoration, reclamation or decommissioning will be calculated when the project is permitted.
Figure 2.19 – Location of the Salvo Project
Property Description
The Salvo Project Area is located in South Texas near the northeast end of the STUP. The Salvo Project Area consists of two leases that would allow the mining of uranium by ISR methods. The Salvo Project Area is about 10 miles south of the city of Beeville and approximately five miles west of US Highway 181, a primary highway that intersects with US Highway 59 in Beeville and I-10 to the north. Site drilling roads are mostly caliche-gravel based and allow access for trucks and cars in most weather conditions. Four-wheel drive vehicles may be needed during high rainfall periods. The Salvo Project Area does not have mineral reserves and is therefore considered an Exploration Stage property under S-K 1300 definitions. The Company has maintained the leases though has no near-term work plans for the property.
The Salvo Project Area is also located in an area of Texas that has extensive farming activity. Most of the property is used for farming and has a high level of crop cultivation. There are two mineral leases comprised of 800 acres at the Salvo Project Area. All payments for the private lease are up to date.
No historic uranium mining is known to have occurred on any of the Salvo Project Area leases and only state permitted (RCC) uranium exploration drilling has taken place. Prior to any mining activity at Salvo, UEC will need to acquire all the necessary permits from the RCC, TCEQ and EPA.
No significant encumbrances are on the property. All necessary permits will be required though the Company does not intend to initiate those efforts in the near term. No violations or fines have been levied on the Property.
History
Uranium exploration and mining in South Texas primarily targets sandstone formations throughout the Coastal Plain bordering the Gulf of Mexico. The area has long been known to contain uranium oxide, which was first discovered in Karnes County, Texas, in 1954 using airborne radiometric survey. The uranium deposits discovered were within a belt of strata extending 250 miles from the middle coastal plain southwestward to the Rio Grande. This area includes the Carrizo, Whitsett, Catahoula, Oakville and Goliad geologic formations. Open pit mining began in 1961 and ISR mining was initiated in 1975. The uranium market experienced lower demand and price in the late 1970s, and in 1980 there was a sharp decline in all Texas uranium operations.
During the late 1970s and early 1980s, exploration for uranium in South Texas had evolved towards deeper drilling targets within the known host sandstone formations. Deeper exploration drilling was more costly and excluded many of the smaller uranium mining companies from participating in the down-dip, deeper undrilled trend extensions. Uranium had been mined by several major oil companies in the past in South Texas, including Conoco, Mobil, Humble (later Exxon), ARCO and others. Mobil had found numerous deposits in South Texas in the past, including the O’Hern, Holiday-El Mesquite and several smaller deposits, mostly in Oligocene-age Catahoula Formation tuffaceous sands. ARCO discovered several Oakville Formation (Miocene-age) uranium-bearing deposits and acquired other deposits located nearby in Live Oak County. They were exploring deeper extensions of Oakville Formation trends when they discovered the Mt. Lucas Goliad Formation deposit, located near Lake Corpus Christi in Live Oak County near the Bee County line.
The table below summarizes the historic ownership and operations at the Salvo Project Area.
Table 2.38: Historic Ownership and Operations at the Salvo Project Area
| Year |
Company |
Operations/Activity |
Amount |
Results of Work |
| Unknown to 1983 |
Nufuels |
Original controller of the Salvo Project Area. |
111 exploration holes. |
Nufuels discovered uranium mineralization in La Para sands of the Miocene-aged Goliad Formation in 1982 in Bee County, Texas. Mobil’s reconnaissance drilling located two areas of interest, known as the Salvo and Segar projects. Mobil had drilled a total of 111 exploration holes at Salvo and Seger in 1982. Shortly after conducting their exploration drilling in this area, Mobil elected to discontinue their uranium exploration efforts and sell their uranium production facilities. The early Salvo exploration drilling conducted by Nufuels indicated significant uranium mineralization was present. |
| 1983 |
URI joint venture with Saaberg Interplan Uran Gmbh (“SIPU”) (“URI/SIPU”) |
URI formed a joint venture exploration program with SIPU, a German utility. URI/SIPU acquired Salvo from Mobil, along with the Seger Project, an eastward extension along the same geochemical roll-front system. URI/SIPU leased the property until about 1993 when secondary lease expired. |
295 exploration and delineation holes in 1984. |
URI/SIPU calculated a resource of approximately 1.5 million pounds U3O8 at Salvo using a 0.5 GT cutoff in 1984. Average GT was modeled at 0.989, with a ratio of 0.194, width of 45 ft, length of 140 ft, and tonnage factor of 1.236 lbs/ft2. Due to low uranium prices, URI/SIPU elected not to permit the project at that time (R.B. Smith, unpublished report, 2005). URI utilized a Monte Carlo-based computer simulation to calculate the historic resource (URI, 1984). |
| 2005 |
R.B. Smith & Associates Inc. (“R.B. Smith”) |
Review of past exploration data. |
N/A |
R.B. Smith (2005) completed an evaluation of the Goliad Formation trend project data at the Salvo and Seger projects. Data were on loan from URI/SIPU. Smith did not retain copies of maps or electric logs, and the original data set of logs and maps was returned to URI. URI held the data in storage until 2010. |
| 2010 |
UEC |
The Salvo Project Area was acquired by UEC from URI/SIPU. UEC negotiated a purchase of available data from URI. URI and UEC reached agreement on sales of Salvo and Seger project data in 2010. The adjacent Seger property is no longer included in UEC’s Salvo leases. |
N/A |
Ownership transition. UEC received 425 exploration log files, and several drill hole location maps and land maps. The 425 log files include good quality electric logs from Mobil’s activities at Seger and Salvo in 1982, as well as URI/SIPU’s drill hole logs from exploration activities in 1984. Each log file also contains a detailed lithological report based on drill hole cuttings prepared by Mobil’s and later by URI’s field geologists supervising and monitoring drilling activity. Four core holes were drilled by URI, and core analysis reports were included in the appropriate log files. Eight holes were logged by Princeton Gamma-Tech (PGT, and early form of PFN), a logging company which specialized in uranium chemical assay logging. The PGT logs were utilized and verified as having excellent correlation to actual chemical uranium content by several south Texas ISR mining operations. These results are believed to be pertinent to the understanding of this deposit and indicated a generally positive DEF like other known Goliad Formation sandstones in the region. The historic mineralized intercepts from URI exploration boreholes were presented in the initial NI 43-101 UEC Salvo Project TRS dated July 16, 2010. The estimated historic uranium resource (URI 1984 classification only) of approximately 1.5 million pounds eU3O8 was determined but was not verified independently. However, it was presented in the initial 43-101 TRS. |
Geologic Setting, Mineralization and Deposit
The Salvo Project Area is located in the STUP, which lies along the GMB.
All mineralization at the Salvo Project Area occurs in the Goliad Formation. Uranium mineralization occurs along oxidation/reduction interfaces in fluvial channel sands of the Goliad Formation. These deposits consist of multiple mineralized sand horizons, which are separated vertically by confining beds of silt, mudstone and clay.
The Salvo Project Area is situated in the major northeast-southwest trending Goliad Formation of fluvial origin. The Geologic Map of Texas indicates that a thin layer of Pleistocene-aged Lissie Formation uncomfortably overlies the Miocene Goliad Formation. The Lissie Formation consists of unconsolidated deposits of sand, silt and clay, with minor amounts of gravel.
The uranium-bearing Goliad Formation underlies the Lissie Formation and is present at depths ranging from near-surface to approximately 600 feet in depth on the eastern side of the Salvo Project Area. Uranium Resources Inc. (“URI”) determined that uranium mineralization occurs within six individual sand units in the lower Goliad La Para member at depths generally ranging from 400 to 600 feet.
The entire La Para member can be considered to be a single thick uranium roll-front migration system, which is separated into six definable units designated as the L, M, N, O, P and Q, with the Q member located at the base. Each unit is separated from the other by continuous beds of clay or silts, which serve as confining units between the sand beds.
The Salvo Project Area uranium deposit is similar in many geologic characteristics to other known Goliad sand/sandstone deposits in south Texas. The mineralization occurs within fluvial sands and silts as roll-front deposits that are typically a “C” or cutoff “C” shape. The roll-fronts are generally associated with an extended oxidation–reduction boundary or front.
At the Salvo Project Area there are at least five stacked mineralized sand horizons that are separated vertically by zones of finer sand, silt and clay. Deposition and concentration of uranium in the Goliad Formation likely resulted due to a combination of leaching of uranium from volcanic tuff or ash deposits within the Goliad or erosion of uranium-bearing materials from older Oakville and Catahoula deposits. The natural leaching process occurred near the outcrop area where recharge of oxidizing groundwater increased the solubility of uranium minerals in the interstices and coating sand grains in the sediments. Subsequent downgradient migration of the soluble uranium within the oxygenated groundwater continued until the geochemical conditions became reducing and uranium minerals were deposited in roll-front or tabular bodies due to varying stratigraphic or structural conditions.
There are at least two northeast-southwest trending faults located near the Salvo Project Area that are likely related to the formation of the Salvo Project mineralization. These exist at a depth of approximately 3,000 feet bgs based on petroleum industry maps and are not believed to extend into the Goliad Formation. The northwesterly fault is a typical Gulf Coast normal fault, downthrown toward the coast, while the southeastern fault is an antithetical fault downthrown to the northwest, forming a graben structure. The presence of these faults is likely related to the increased mineralization at the site. The faulting has probably served as a conduit for reducing waters and/or gases to migrate from deeper horizons as well as altering the groundwater flow system in the uranium-bearing sands. The Geologic Atlas of Texas, Beeville-Bay City Sheet does not show any faulting at the surface in the Salvo Project Area.
Table 2.39 – Mineral Resources for the Salvo Project as at the date of this Annual Report
| Classification |
Tons Ore (000’s) |
Tonnes Ore (1000’s) |
Average Grade (% eU3O8) |
Pounds eU3O8 (000’s) |
| Measured |
- |
- |
- |
- |
| Indicated |
- |
- |
- |
- |
| Total M&I |
- |
- |
- |
- |
| Inferred |
1,125 |
1,020 |
0.091 |
2,839.0 |
| Total Resources |
1,125 |
1,020 |
0.091 |
2,839.0 |
Notes:
| 1. |
Pounds reported with Disequilibrium Factor (DEF) applied. |
|
| 2. |
The sum of resource tons and lbs. may not add up to the reported total due to rounding. |
|
| 3. |
Measured, indicated, and inferred mineral resources as defined in 17 CFR § 229.1300. |
|
| 4. |
GT Cutoff = 0.3 m% eU3O8 |
|
| 5. |
All reported resources occur below the static water table. |
|
| 6. |
The point of reference for mineral resources is in-situ at the Project. |
|
| 7. |
Mineral resources that are not mineral reserves do not have demonstrated economic viability. |
Arizona Properties
Arizona Conventional Uranium Activities
Uranium mining and processing work has occurred in Arizona over several historical periods, primarily from small tonnage production underground mines. Initial historical mining in the 1950’s and early 1960’s was primarily out of the Four Corners area of Southwestern Arizona in the Salt Wash member of the Morrison Formation. Mining was typically completed using underground access and targeted both uranium and vanadium. A second important deposit type was the breccia pipes of the Colorado Plateau area. A compilation produced by the U.S. Department of Energy in 1980 estimated that over 18 Mlb. of uranium oxide was produced out of Arizona between 1948 and 1970. (Scarborough, R.B., 1981)
UEC’s projects in Arizona include the material Anderson Project and the non-material Workman Creek Project. The uranium mineralization at both projects is hosted in flat lying sedimentary rocks. Uranium mineralization at the Anderson Project occurs in the Date Creek Basin. The uranium mineralization at Workman Creek occurs in the Sierra Ancha mountain range and hosted in flat-lying quartzite of the Dripping Spring Quartzite. While UEC’s conventional projects in Arizona remain at an Exploration Stage, with sufficient price support they would become economic and would be recovered through open pit and/or underground mining methods, benefitting from the proximity to existing power and road infrastructure, and available labor from the nearby city of Phoenix.
In the Workman Creek area up to 13 mines were in operation within the Sierra Ancha region. Between 1953 and 1960, over 21,000 tons of ore was produced with an average grade of 0.24% U3O8. In 1954, the United States Atomic Energy Commission (“AEC”) conducted a low-level airborne radiometric survey of the Sierra Ancha region. A large prospecting and developing rush followed the release of the results of the airborne survey. By 1957 more than 100 uranium showings were discovered within the Dripping Spring quartzite; of these about 30 had been explored by workings or drillholes. By 1960, all of the small mining operations in the Sierra Ancha region ceased production.
Uranium mining in the Anderson area began in January 1955, when anomalous radioactivity was detected in the vicinity of the Project using an airborne scintillometer. After a ground check revealed uranium oxide in outcrop, numerous claims were staked. The “Anderson Mine,” as the operation was known at the time, was drilled and mined by Mr. Anderson. Between 1955 and 1959 mining activity resulted in 10,758 tons that averaged 0.15% U3O8, and 33,230 pounds U3O8 were shipped to Tuba City, Arizona for custom milling. In 1959, production stopped when the Atomic Energy Commission (AEC) ended the purchasing program.
Permitting Requirements in Arizona
Exploration drilling and associated activities require an exploration permit and a reclamation bond must be posted. Exploration and mining activities on Arizona state land are administrated by the Arizona State Land Office. In order to conduct additional work for BLM administered ground, UEC needs to submit a plan of operations, a minimal impact exploration permit and a special use permit.
The permitting and licensing requirements in Arizona are similar to other states in the US.
| ● |
all exploration and mining activities must comply with the National Environmental Policy Act (NEPA); and |
| ● |
required environmental permits and licenses would include but may not be limited to: |
| ● |
Mine Land Reclamation Plan; Arizona State Mine Inspector; |
| ● |
Exploration Permit; Arizona State Land Department; |
| ● |
Plan of Operations; Bureau of Land Management; |
| ● |
Source Material License; U.S. Nuclear Regulatory Commission; |
| ● |
Water Wells and Appropriations; Arizona Department of Water Resources; |
| ● |
Dams and Impoundments; Arizona Department of Water Resources; |
| ● |
Air Quality Control Permit; Arizona Department of Environmental Quality; |
| ● |
Water and Stormwater Discharge Permits; Arizona Department of Environmental Quality; |
| ● |
Hazardous Waste; Arizona Department of Environmental Quality and EPA; |
| ● |
Solid Waste; Arizona Department of Environmental Quality; |
| ● |
Mine Safety and Health; Arizona State Mine Inspector and MSHA; and |
| ● |
County Zoning and Construction Permits. |
Geology and Mineralization in Arizona
Geology of the Date Creek Basin
The Date Creek Basin is one of hundreds of Paleogene basins throughout western Arizona, southeastern California, Nevada and western Utah. Paleogene lacustrine and fluvial sediments and Quaternary gravels have filled these basins to depths of several thousand meters.
The basin is surrounded by dissected mountain ranges containing Precambrian metamorphic rocks and granites. Surrounding mountain ranges include the Black Mountains, to the north and northeast, and the Rawhide, Buckskin and McCracken Mountains, to the west. To the south and southeast the basin is bordered by a low drainage divide imposed by the Harcuvar and the Black Mountains. The margins of the basin are filled with early Paleogene volcanic flows and volcaniclastic sediments. The basin itself is filled with Oligocene to Miocene lacustrine and deltaic sediments covered by a thick mantle of Quaternary valley fill.
The Date Creek Basin was an area of active volcanism during Paleogene time. A thick series of volcanic flows and associated sediments of volcanic ash and clastics were deposited on the pre-existing surface. During a quiescent period, the Date Creek Basin was covered by a shallow lake or swamp in which a thick sequence of fine-grained sediments was deposited. Interbedded coarse sediments, volcanic basalt flows and conglomerates overlay the lake-bed sediments. This sequence of stratified volcanic and sedimentary rocks is 3,000 to 5,000 feet thick in the central portion of the Date Creek Basin.
The regional stratigraphic sequence was summarized, from oldest to youngest by MinEx, as follows:
| ● |
Precambrian or Jurassic granitic basement complex; |
| ● |
Lacustrine clastic and volcanic members of the Palaeocene-Eocene Artillery Peak Formation; |
| ● |
Arrastra Volcanic Complex, including dacitic intrusions, andesitic flows and volcaniclastic members of Paleogene age; |
| ● |
Chapin Wash Formation, Anderson Mine lacustrine sediments of Miocene age; |
| ● |
Conglomeratic-sandstone unit, possibly equivalent to upper Chapin Wash Formation; |
| ● |
Miocene basalt; |
| ● |
Pliocene-Pleistocene conglomerate; and |
| ● |
Quaternary alluvium. |
The Date Creek Basin has been on the margin of several regional deformations. The basin was located on the northwestern margin of Mazatzal Land and the southeastern margin of the Cordilleran Geosyncline and was subsequently deformed by the Laramide Orogeny. The Date Creek Basin is presently located on the margin of the Basin and Range Province and exhibits structural deformation typical of the province. Basin and Range deformation is the dominant expression evident at the Anderson Project Area today. Structural trends of this deformation comprise a dominant northwest-southeast trend of parallel to sub-parallel hinged block faults and a less dominant west-northwest, east-southeast fault system. Many of these faults exhibit recurrent movements.
Our Material Properties in Arizona
Anderson Uranium Project
A TRS was prepared for UEC on the Anderson Project area (the “Anderson Project Area”) located in Arizona. This TRS was prepared for UEC by BRS Inc. Engineering (“BRS”) under the supervision of Douglas Beahm, PE, PG, and co-authored by Clyde Yancey, PG, then Vice President of Exploration, UEC (collectively, the “QP” herein). The Anderson Project Area does not have mineral reserves and is therefore considered an exploration stage property under S-K 1300 definitions.
Property Description
The Anderson Project Area is located in Yavapai County, west-central Arizona, approximately 75 miles northwest of Phoenix and 43 miles northwest of Wickenburg (latitude 34°18'29" N and longitude 113°16'32" W, datum WGS84). The general area is situated along the northeast margin of the Date Creek Basin. The Anderson Project Area is located on the south side of the Santa Maria River, approximately 13 miles west of State Highway 93 (refer to Project Location Map). The Anderson Project Area occupies part or all of Sections 1 and 3, 9 through 16, 21 through 27, and 34 of Township 11 North, Range 10 West and portions of Sections 18, 19, and 30 of Township 11 North, Range 9 West of the Gila and Salt River Base Meridian.
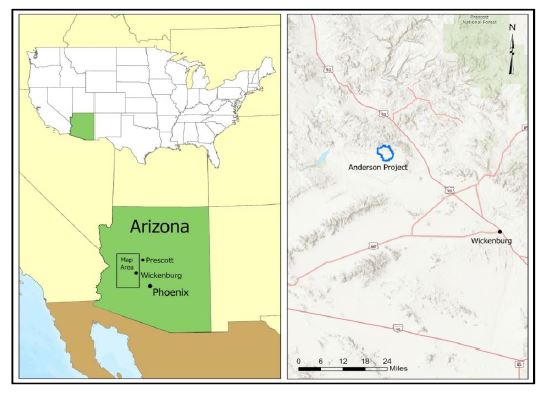
Figure 2.20 – Location of the Anderson Project
The Anderson Project Area covers 8,268 acres (12.9 square miles) and is comprised of 386 contiguous, unpatented lode mining and placer claims totaling 7,628 acres and one Arizona State land section totaling 640 acres. It is located in western Yavapai County, approximately 75 miles northwest of Phoenix. The northern section of the Anderson Project Area holds the open-pit resource, and the adjacent southern section holds the underground resource.
The Anderson Project Area is located along the northeast margin of the Date Creek Basin of the Basin and Range Province of the western United States. Uranium mineralization at the Anderson Project Area is strata bound and occurs exclusively in the sequence of Miocene-age lacustrine lakebed sediments. The lacustrine sediments unconformably overlie the andesitic volcanic unit over most of the Anderson Project Area.
To maintain the mineral tenor, UEC must pay annual claim maintenance fees of $165 per claim, due on September 1 of each year. In addition, Arizona State mineral leases are held with an exploration permit. There is a $500 annual fee for the exploration permit, plus $1 per acre rental for the first five years. For the first two years, there is also a minimal exploration expenditure requirement of $10 per acre per year. For years three through five, there is a $20 per acre minimum. There are no royalties on the BLM unpatented mining claims. Arizona State mineral leases are subject to a 5% production royalty. The state of Arizona has an overriding severance tax of 2.5% on 50% of the net proceeds. No other encumbrances are known.
Infrastructure and Local Resources
The Project area is undeveloped and there are no facilities or equipment on site, except for various access and drill roads and various water wells previously constructed. No utilities exist on or immediately adjacent to the Project area. Various water wells exist on and near the Project that can support large-scale mining operations.
The nearest town is Congress (population 1,700) located 32 road miles to the east. The nearest major housing, supply center and rail terminal is in Wickenburg (population 6,363) located approximately 43 miles from the Project by road. Phoenix (population 1.45 million), approximately 100 miles to the southeast by road, is the nearest major industrial and commercial airline terminal. Kingman (population 24,000) is located approximately 110 miles to the northwest by road.
History
In January 1955, T.R. Anderson, of Sacramento, California, detected anomalous radioactivity in the vicinity of the Anderson Project Area using an airborne scintillometer. After a ground check revealed uranium oxide in outcrop, numerous claims were staked. The Anderson Mine, as the operation was known at the time, was drilled and mined by Mr. Anderson. Work between 1955 and 1959 resulted in 10,758 tons that averaged 0.15% U3O8 and 33,230 pounds U3O8 were shipped to Tuba City, Arizona, for custom milling. In 1959, production stopped when the AEC ended the purchasing program.
During 1967 and 1968, Getty Oil Company (“Getty”) secured an option on claims in the northern portion of the Anderson Project Area. Some drilling and downhole gamma logging was conducted during the option period, but this failed to locate a sizeable uranium deposit. In 1968, Getty dropped their option.
In 1974, the increasing price of uranium created a renewed interest in the vicinity of the Anderson Project Area. Following a field check and an evaluation of the 1968 Getty drill data, MEC optioned the northern portion of the current Anderson Project Area.
In 1975, MinEx purchased the northern portion of the current Anderson Project Area after a 53-hole, 5,800 meter (19,000 foot) drilling program on 250 meter centers confirmed a much greater uranium resource potential than had been interpreted from the 1968 Getty gamma log data. Further exploration work, consisting of a 180-hole, 22,555 meter (74,000 ft) drill and core program on 120 meter centers, was conducted from November 1975 through February 1976 to further delineate the uranium resources. By 1980, MinEx had completed a total of 1,054 holes by rotary and core drilling.
In 1977, the Palmerita Ranch, located 11 kms west of the deposit along the Santa Maria River, was acquired by MinEx to provide a water source for the operations in the event that closer sources proved inadequate. Based on favorable economics, indicated in a Preliminary Feasibility Study completed by Morrison-Knudsen Company, Inc., in December 1977, a detailed Final Feasibility Study was undertaken early in 1978 to evaluate the MinEx holdings on the northern portion of the current project.
In 1973, Urangesellschaft expressed an interest in the former Anderson Property. Urangesellschaft located a claim block, “Date Creek Project”, on the down-dip extension of the mineralization immediately to the south of MinEx’s claims. In 1973 to 1982, subsequent drilling programs delineated mineralization from a total of 352 drill holes with 122,744 meters (402,773 feet) of rotary and core drilling.
Depressed uranium prices stalled exploration activities until 1995 when an individual, Hanson, consolidated portions of the former MinEx and Urangesellschaft claims under single ownership. Hanson dropped the claims by 1998. In 2001, Concentric Energy Corp. (“Concentric”) restaked the claims and controlled ownership until May, 2011. In 2006, Concentric drilled 24 reverse-circulation holes and one core hole on the MinEx portion of the Anderson Project Area to confirm the reproducibility and authenticity of the historical MinEx exploration database. Concentric had planned a similar confirmation drilling campaign on the former Urangesellschaft portion of the Anderson Project Area for the 2007 field season, but the drill program was never done. UEC has not conducted any drilling activity to date.
Permitting and Licensing
Exploration and mining activities for the mining claims of the Anderson Project Area are administrated by the BLM, Kingman Field Office. Exploration drilling and associated activities require an exploration permit and a reclamation bond must be posted. The Anderson Project Area was drilled as recently as 2006, and it is not expected that any of these requirements will have an effect on the ability to conduct exploration activities. UEC has exploration permits on the two state sections. In order to conduct additional work for BLM administered ground UEC needs to submit a plan of operations, a minimal impact exploration permit and a special use permit.
The authors are not aware of significant environmental liabilities on the property. However, it is important to note that 195 acres in the northern part of the project area were classified as “disturbed” by the Bureau of Land Management. The disturbed area is a result of minor production via dozer cuts from surface mining done in the 1950s. No specific social or community related requirements, negotiations, and/or agreements are known to exist with local communities and/or agencies other than those discussed herein. No outstanding environmental liabilities to UEC are known to the authors.
Arizona mine regulations do not require backfill and regrading to approximate original contours and do allow remnant highwalls so long as stability and protection of human health and the environment are adequately addressed. Heap leach recovery will require the isolation of all mill waste material including contaminated buildings and equipment to be disposed of in a lined disposal cell which is isolated from dispersion through all environmental pathways. The heap pads meet this criterion when covered with a radon cap and erosional protection layer. If properly sited, the heap pads can be reclaimed in place along with any contaminated materials for the plant decommissioning. Reclamation of the heap leach and mineral processing facility will be in accordance with USNRC source materials license conditions for the project.
Geologic Setting, Mineralization and Deposit
The Anderson Project Area is located along the northeast margin of the Date Creek Basin of the Basin and Range Province of the western United States.
Three major faults cross the Anderson Project Area: The East Boundary Fault System; Fault 1878; and the West Boundary Fault System. Faults trend predominantly from N30oW to N55oW and dip steeply (approximately 80o) to the southwest.
Another set of faults trending more westerly (N65oW) are present in the south-central portion of the Anderson Project Area. A fault set trending northeast-southwest has been speculated by Urangesellschaft and others but has not been observed in the field. Many of the north-westerly surface water drainage tributaries are developed partially along fault traces. Fault displacements range from a few inches to more than 300 feet. Fault movement is generally of normal displacement resulting in stair-stepped fault blocks. Local faults also tend to hinge.
Nine stratigraphic units were identified on the Anderson Project Area. Listed from oldest to youngest, they are as follows:
| ● |
Crystalline Intrusive Rocks: coarse-grained to pegmatitic Precambrian granite; |
| ● |
Felsic to Intermediate Volcanic: flows, breccias, tuffs and minor intrusive; |
| ● |
Felsic to Intermediate Volcaniclastic: ash flows, tuffaceous beds and arkosic sandstone; |
| ● |
Andesitic Volcanic: porphyritic andesitic flows with a paleosurface and locally reddish-brown paleosols; |
| ● |
Lacustrine Sedimentary rocks: micaceous siltstones and mudstone, calcareous siltstones and silty limestone, thin beds of carbonaceous siltstone and lignitic material and host of uranium mineralization, averaging about 60 to 100 meters thick; |
| ● |
Lower Sandstone Conglomerate: arkosic sandstones and conglomerate, averaging about 60 to 100 meters thick; |
| ● |
Basaltic Flows and Dikes: amygdular basalt, averaging about 20 meters thick; |
| ● |
Upper Conglomerate: cobble and boulder conglomerate, partly indurate and locally calcite cemented, averaging about zero to 60 meters thick; and |
| ● |
Quaternary Alluvium: unconsolidated sand and gravel, caliche formed where calcite cemented. |
Uranium mineralization at the Anderson Project Area occurs exclusively in the sequence of Miocene age lacustrine lakebed sediments. The lacustrine sediments unconformably overlie the andesitic volcanic unit over most of the Anderson Project Area. However, to the east of the Anderson Project Area they overlie the felsic to intermediate volcanic unit. The uranium host rock sequence consists predominantly of a green to gray-green tuffaceous mudstone, which is interbedded with calcareous mudstone, carbonaceous mudstone, limestone, marl, lignite, chert and minor sand lenses. This sequence has been called the Anderson Mine Formation by Sherborne and ranges from 100 meters to more than 500 meters in thickness. This section has been tentatively correlated westward with the Chapin Wash Formation and most probably inter-tongues with the Chapin Wash Formation.
Uranium mineralization in outcrops and the pit floor at the old Anderson Mine was reported by the U.S. Bureau of Mines in Salt Lake City as tyuyamunite (Ca(UO2)2(VO4)2·5-8H2O). Carnotite (K(UO2)2(VO4)2·3H2O) and a rarer silicate mineral, weeksite (K2(UO2)2(Si2O5)3·4H2O), was also reported in outcrop samples. Carnotite mineralization occurs as fine coatings and coarse fibrous fillings along fractures and bedding planes and has been noted in shallow drill holes and surface exposures. The uranium mineralization found at depth on the former Urangesellschaft property was reported by Hazen Research, Inc. (“Hazen Research”) to be poorly crystallized, very fine-grained, amorphous uranium with silica. This could be in the form of either coffinite (U(SiO4)1-x(OH)4x) or uraninite (UO2) in a primary or unoxidized state. Mineralogical studies performed by Hazen Research on Urangesellschaft core found that mineralization was associated, for the most part, with organic-rich fractions of the samples. Specifically, the uraniferous material occurs as stringers, irregular masses and disseminations in carbonaceous veinlets with uranium up to 54% as measured by microprobe analysis. X-ray diffraction identified the mineral as coffinite. It is possible that an amorphous, ill-defined uranium silicate with a variable U:Si ratio is precipitated and, under favorable conditions, develops into an identifiable crystalline form (coffinite).
Urangesellschaft distinguished seven mineralized zones, identified as Horizons A, B, C, D, E, F and G, with the youngest (uppermost) being Horizon A and the oldest (deepest) being Horizon G. The majority of uranium occurs in Horizons A, B and C within the property. A conglomeratic sandstone unit interbeds with these units, but does not contain uranium mineralization; it is referred to as the Barren Sandstone Unit and it lies between Horizon C and Horizon D. Consequently, Horizons A through C have been called the Upper Lakebed Sequence and Horizons D through G have been called the Lower Lakebed Sequence.
Grades of mineralization range from 0.025% U3O8 to normal highs of 0.3 to 0.5% U3O8, with intercepts on occasion of 1.0% to 2.0% U3O8. Secondary enrichment of syngenetic mineralization is observed along faults and at outcrops.
Mineral Resources
Based on the density of drilling, continuity of geology and mineralization, testing, and data verification the mineral resource estimates meet the criteria for indicated mineral resources as summarized herein.
Estimated indicated mineral resources are summarized in the following table at a 0.02% eU3O8 grade cutoff and a 0.1 ft% GT cutoff. Mineral resources were estimated separately for each mineralized zone. The total contained mineralized material was first estimated. Then reasonable prospects for economic extraction were applied resulting in an 18% reduction from the estimate of total mineralized material.
Mineral resources are not mineral reserves and do not have demonstrated economic viability. However, considerations of reasonable prospects for eventual economic extraction were applied to the mineral resource calculations herein.
Table 2.40 – Mineral Resources for the Anderson Project as at the date of this Annual Report
| Classification |
Tons Ore (000’s) |
Tonnes Ore (1000’s) |
Average Sum Thickness (ft) |
Average Grade (% eU3O8) |
Pounds eU3O8 (000’s) |
| Measured |
- |
- |
- |
- |
- |
| Indicated – Zone A |
862 |
782 |
3.8 |
0.111 |
1,907 |
| Indicated – Zone B |
7,347 |
6,665 |
9.5 |
0.108 |
15,816 |
| Indicated – Zone C |
6,211 |
5,634 |
10.4 |
0.094 |
11,730 |
| Indicated – Zone D |
760 |
689 |
3.2 |
0.093 |
1,421 |
| Indicated – Zone E |
911 |
826 |
7.6 |
0.060 |
1,095 |
| Indicated – Zone F |
84 |
76 |
4.6 |
0.051 |
86 |
| Total M&I |
16,175 |
14,673 |
8.2 |
0.099 |
32,055 |
| Inferred |
- |
- |
- |
- |
- |
| Total Resources |
16,175 |
14,673 |
8.2 |
0.099 |
32,055 |
Notes:
| 1. |
The sum of resource tons and lbs. may not add up to the reported total due to rounding. |
| 2. |
Measured, indicated, and inferred mineral resources as defined in 17 CFR § 229.1300. |
| 3. |
GT Cutoff = 0.1 m% eU3O8 and metallurgical Recovery estimated at 90%. |
| 4. |
Economic factors have been applied to the estimates in consideration of reasonable prospects for economic extraction. |
| 5. |
The point of reference for mineral resources is in-situ at the Project. |
| 6. |
Mineral resources that are not mineral reserves do not have demonstrated economic viability. |
Canadian Uranium Projects
Canadian Conventional Projects
The majority of our Canadian projects are currently considered to be potential conventional open pit or underground uranium projects. These projects are in two different geological terrains, the well-known Athabasca Basin in Saskatchewan, and the Thelon Basin in Nunavut. We do not currently have Canadian projects that we operate at a Development stage, all assets operated by UEC are considered to be Exploration Stage projects under S-K 1300 definitions.
Conventional uranium deposits in the Athabasca and Thelon Basins of Saskatchewan and Nunavut respectively are typically unconformity-associated uranium deposits. Wherein uranium mineralization is focused by structures that have promoted the penetration of uranium bearing fluids into trap locations at or near the unconformity between Archean and early-Paleoproterozoic metamorphosed sedimentary and igneous basement rocks and the overlying unmetamorphosed late-Paleoproterozoic sandstone rocks.
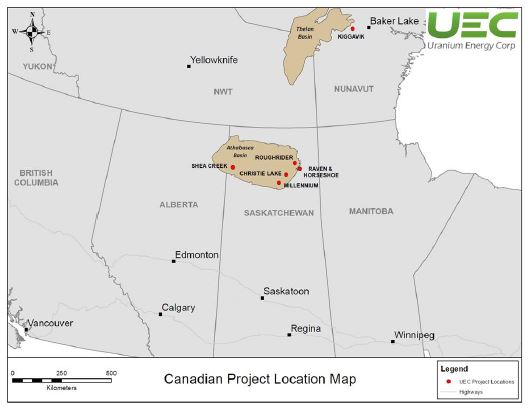
Figure 2.20 – Canadian Uranium Projects
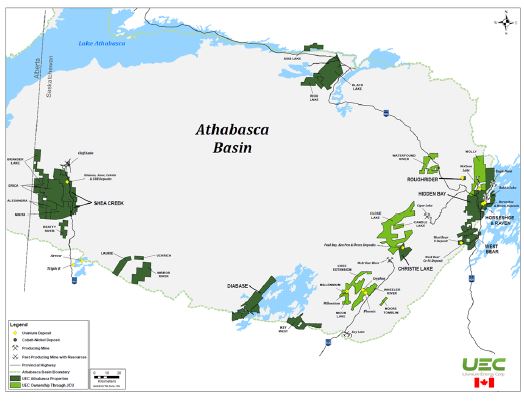
Figure 2.21 – Saskatchewan Uranium Projects
Geology of the Athabasca Basin
The Athabasca Basin is elongated along an east-west axis and straddles the boundary between two subdivisions of the Western Churchill Province. The Rae Subprovince to the west and the Hearne Subprovince to the east. The subprovinces are separated by the northeast trending Snowbird Tectonic Zone, locally known as the Virgin River-Black Lake shear zone in the area of the Athabasca Basin.
The Hearne Craton beneath the eastern Athabasca Basin comprises variably reworked Archean basement, which is dominated by granitic domes and foliated to gneissic granitoid rocks with infolded outliers of Paleoproterozoic metasedimentary rocks. The structural and tectonic regime of the area has been influenced strongly by collisional tectonics between the Hearne and Superior Cratons during the early Proterozoic Trans-Hudson Orogen, which occurred approximately 1.9 billion years ago (“Ga”) to 1.77 Ga. Prior to deposition of the Athabasca Group, rocks of the Rae and Hearne Provinces that would later form the basement of the basin rocks experienced a lengthy period of weathering and non-deposition. Consequently, the basal Athabasca stratigraphy is underlain by a regolith of deeply weathered, hematite-stained basement. In places, the preserved regolith can reach a thickness of up to 50 m, but typically less than 10 m.
Unconformably overlying the basement rocks is the late Mesoproterozoic Athabasca Group consisting mainly of fluvial clastic sedimentary rocks, which are about 1,400 m thick in the central part of the basin (Ramaekers, 2001). The Athabasca Group comprises eight formations, although in the eastern Athabasca Basin, the Manitou Falls Formation is the only formation present. It is subdivided into four units, from bottom to top, designated MFa to MFd. Lithologies are dominated by fine to coarse-grained, partly pebbly or clay-intraclast-bearing quartz arenites. Minor conglomerates, mudstones, and dolostones also occur. Apart from faulting and local folding associated with thrusting, the Athabasca Group strata are undeformed and unmetamorphosed. Age dating of zircons and diagenetic fluorapatite (SGS, 2003) indicate an age of sedimentary deposition around 1.77 Ga, post-dating the Trans-Hudson Orogeny (circa 1.9 Ga to 1.77 Ga).
Our Material Saskatchewan Properties
Roughrider Uranium Project
The independent TRS for the Roughrider Project area (the “Roughrider Project Area”) has been prepared for UEC, under the supervision of SRK Consulting (UK) Limited (the “QP” herein), pursuant to S-K 1300. This TRS identifies and summarizes the scientific and technical information and conclusions reached from the initial assessment to support disclosure of mineral resources on the Roughrider Project Area. There are no mineral reserves associated with the Roughrider Project Area. The Roughrider Project does not have mineral reserves and is therefore considered an Exploration Stage property under S-K 1300 definitions.
Figure 2.22 – Location of the Roughrider Project
Property Description
The Roughrider Project Area is located seven kms north, via gravel road, of Points North Landing, a service centre on Provincial Road 905, in the eastern Athabasca basin of northern Saskatchewan, Canada. The Roughrider Project Area is approximately 440 kms north of La Ronge, and 700 kms north of Saskatoon, at the coordinates 556,545E and 6,466,820N UTM. The Roughrider Project Area is an Exploration Stage property within the 597-hectare mineral lease ML-5547, which is 100% held by UEC. The Roughrider Project Area site comprises core logging, office and storage facilities.
The area around the Roughrider Project Area is a well-developed mining area close to necessary infrastructure and resources. The Roughrider Project Area can be accessed by a seven km gravel road, floatplane or helicopter from Points North Landing. Points North Landing is on Provincial Road 905 which is linked to the nearest sizeable population centre, La Ronge 440 kms south, by Highway 102. There are several daily commercial airline services from Saskatoon to Points North Landing, and regular charter flights for Orano’s McLean Lake operation.
There is one mineral lease on the Roughrider Project Area, which is 100% held by UEC. The lease covers 597 hectares and has been registered with the Saskatchewan Ministry of Energy and Resources.
The project is a mature Exploration Stage project, with significant historical drilling, environmental baseline work, and historical economic assessment work as outlined below. At present, UEC is completing an updated economic assessment of the project, as well as camp infrastructure rehabilitation and upgrades. UEC intends to complete additional resource delineation work in the upcoming 2023/2024 fiscal year to further advance the project. The current exploration camp facilities are over 10 years old but remain in good condition. No mine infrastructure or underground development is present on the project.
History
Between 1969 and 1974, following the discovery of the Rabbit Lake uranium deposit in 1968 by Gulf Minerals Ltd., Numac Oil and Gas (“Numac”) held the large Permit Number Eight over the Midwest Lake (McMahon Lake) and Dawn Lake areas. At the time, Numac, in conjunction with their partners. Esso Minerals and Bow Valley Industries, focused on the Midwest Lake area, located adjacent to the Roughrider Project Area. In 1976, Asamera Oil Corp. (“Asamera”) initiated the Dawn Lake project, located approximately six kms southeast of the current Roughrider Project Area. In 1983, the Saskatchewan Mining and Development Corporation (“SMDC”), predecessor to Cameco Corporation (“Cameco”), became the operator of the Dawn Lake Joint Venture. By 1995, the Dawn Lake Joint Venture consisted of Cameco, Cogema Resources Inc. (now Orano SA), PNC Exploration Canada Ltd. and Kepco Canada Ltd.
Early work by Asamera on the Esso North claim consisted of electromagnetic (“EM”) and aeromagnetic surveys in 1977, followed by airborne very low frequency (“VLF”) EM, magnetic and radiometric surveys in 1978 and 1979 by Kenting and Geoterrex, respectively. From 1978 to 1981, Turam, Vector Pulse EM and VLF-EM surveys confirmed the east-west conductor as well as some weaker northeast trending VLF-EM conductors. During this same period, Asamera drilled 21 holes on the Esso North claim. The first 10 holes were drilled across the projected northeast strike extent of the Roughrider Project Area. The other eleven holes were drilled on the main east-west striking conductor.
In 1984, SMDC carried out Time Domain EM (“TEM”) on the Esso North claim and completed two additional holes. Exploration on the Esso North claim was dormant until 1995, when Cameco resurveyed the area with TEM and located both the east-west conductor and the weak northeast striking conductor. The latter target was tested by one hole, EN-20; it intersected faulted and altered sandstone but no significant radioactivity. In 1996 one drillhole, EN-21, was completed that targeted the east-west conductor. No conductive material was intersected, and the basement lithology was granite.
Under an agreement dated September 10, 2004, between Roughrider Uranium Corp. (“Roughrider”) and Bullion Fund Inc. (“Bullion Fund”), Roughrider earned a 90% interest in claim S-107243 (and six other claims that became part of Roughrider’s Russell South property). On August 10, 2006, Roughrider became a wholly owned subsidiary of Hathor. On April 12, 2007, Terra Ventures Inc. (“Terra”) announced that it had closed a deal with Bullion Fund to acquire an 8% carried working interest in seven claims comprising 56,360 acres in two separate projects located in the Athabasca Basin, Saskatchewan, of which 90% of the remaining 92% working interest was held by Hathor. One of the claims was S-107243. Terra’s interest was to be carried in all respects through to the completion of a feasibility study and the public announcement that the claims will be put into commercial production. On March 24, 2008, Terra announced that it had closed its agreement with Bullion Fund to purchase Bullion Fund’s remaining 2% of Hathor’s carried working interest in the project. This purchase increased Terra’s holding to a 10% carried working interest through to the completion of a feasibility study and the public announcement that the claims will be put into commercial production.
RRW was discovered by Hathor during the winter drilling program of February 2008. RRE was discovered during the summer drilling program in September 2009. A third zone, RRFE, was discovered during the winter drilling program in February 2011.
On April 18, 2011, Hathor and Terra announced that they had executed a binding letter agreement pursuant to which Hathor would acquire, in an all-share transaction, all of the issued and outstanding shares of Terra. On May 9, 2011, Hathor and Terra announced that they had executed a definitive plan of arrangement agreement (the “Arrangement”) to complete the previously announced merger. The result of the Arrangement was consolidation of 100% ownership of the Roughrider Project. On August 5, 2011, Hathor and Terra announced the completion of the Arrangement and Terra became a wholly owned subsidiary of Hathor.
On December 1, 2011, Rio Tinto announced that it was successful in acquiring Hathor, through a wholly-owned Canadian subsidiary, RTCU. On January 11, 2012, RTCU acquired all remaining Hathor common shares making RTCU 100% owners of the Roughrider Project Area. After acquiring the Roughrider Project, RTCU continued to advance the Roughrider Project Area. On October 17, 2022, UEC completed the acquisition of 100% of the Roughrider Project Area from RTCU.
Permitting and Licensing
Should the Roughrider Project Area proceed, either to advanced exploration or to full development, the necessary development and operational approvals will need to be obtained. This includes federal and provincial EIA and permitting/licensing processes and engagement and consultation with Indigenous groups. It is estimated the environmental and social assessment and CSNC licensing for the Roughrider Project Area may require between 48 months and 72 months to complete. A comprehensive list of the potential permits, approvals and authorizations required for the Roughrider Project Area can be found in the Roughrider Project Area TRS as filed. Currently, the project does not require formal environmental bonding or rehabilitation requirements outside of those required as part of early-stage exploration permit requirements.
Geological Setting, Mineralization and Deposit
The Roughrider Project Area, comprising the Roughrider West (“RRW”), Roughrider East (“RRE”) and Roughrider Far East (“RRFE”) deposits, occurs in the Athabasca Basin, which covers over 85,000 km2 in northern Saskatchewan and north-eastern Alberta. The saucer-shaped basin contains a relatively undeformed and unmetamorphosed sequence of Mesoproterozoic clastic rocks known as the Athabasca. These rocks lie unconformably on the basement rocks. The basement rocks consist of Archean orthogneisses, which are overlain by, and structurally intercalated with, the highly deformed supracrustal Palaeoproterozoic Wollaston Group.
The RRW, RRE, and RRFE deposits occur in the basal part of the Wollaston Group of the WMTZ. The basement is structurally complex, comprising steeply dipping Wollaston Group rocks dominated by garnet- and cordierite-bearing pelitic gneisses with subordinate amounts of graphitic pelitic gneisses and psammopelitic to psammitic gneisses, and rare garnetites. The pelitic gneiss varies from equigranular to porphyroblastic in texture. The porphyroblasts vary in size up to centimetre-scale and normally comprise red almandine rich garnets when fresh. The gneisses have been intruded by syn- to post-peak metamorphic felsic pegmatites, granites, and microgranites of Hudsonian age. These rocks locally contain up to 400 ppm of primary uranium.
Proximal to mineralization, graphite in graphitic pelitic gneisses has been consumed by alteration and mineralization; distal to mineralization, the graphite appears to be discontinuous. These two features may help explain the absence of basement-hosted graphitic conductors at the Roughrider Project. Hydrothermal calc-silicate alteration of the orthogneisses is present locally. The alteration is interpreted to be post-peak metamorphism in age and is probably related to the introduction of the Hudsonian felsic rocks. The sandstone and basement rocks have been subjected to several episodes of brittle deformation, including the brittle reactivation of older ductile shear zones.
Uranium deposits in the Athabasca Basin can be broadly subdivided into two styles: unconformity-hosted (occurring at or above the unconformity) and basement-hosted. The Roughrider Project is characterized by basement hosted mineralization, which is typically hosted in faults (often referred to as veins when hosting mineralization) which must have been open to hydrothermal fluid flow at the time of mineralization and thus were likely active at some stage post basin formation. Uranium mineralization at the Project is highly variable in thickness and style in all zones. High grade uranium mineralization occurs primarily as structurally controlled, medium- to coarse-grained, semi-massive to massive pitchblende with what has been termed worm-rock texture, and texturally complex redox controlled mineralization. This high-grade uranium mineralization is intimately associated locally with lesser amounts of red-to-orange coloured oxy-hydroxillized iron oxides. Yellow secondary uranium minerals, probably uranophane, are present locally as veinlets or void-filling masses within the high-grade primary mineralization.
Lower grade mineralization occurs as either disseminated grains of pitchblende, fracture-lining, or veins of pitchblende. Galena occurs in a number of habits and is variably present associated with the uranium mineralization. The lead is presumed to have formed from the radioactive decay of uranium. Veinlets of galena are up to 5 mm thick and either crosscut massive pitchblende, as anhedral masses (less than 1 mm in size) interstitial to the massive pitchblende, or as fine-grained, sub-millimetre-scale disseminated flecks of galena omnipresent throughout mineralized drill core. In all cases, the galena appears to have formed later than the uranium mineralization.
Mineralization is in general terms, mono-metallic (uraninite) in composition. In the RRW deposit, visible, crystalline nickel-cobalt sulph-arsenides are present locally. At the RRE and RRFE deposits, the presence of nickel-cobalt sulph-arsenides is rare. The exact relationship of these elements to uranium is variable and still unclear at this time. However, unlike many unconformity-type uranium deposits in the Athabasca Basin, variable amounts of copper mineralization are present within the Project deposits.
The deposits of the Roughrider Project are interpreted to be Athabasca unconformity-associated uranium deposits, or some variant thereof. Two end-members of the unconformity-associated uranium deposit model have been defined. A sandstone hosted egress-type model (one example is the Midwest A deposit south of the Roughrider Project) involves the mixing of oxidizing sandstone-hosted brine with relatively reduced fluids from the basement in the sandstone. Basement-hosted, ingress-type deposits (one example is the Rabbit Lake deposit) formed by fluid-rock reactions between an oxidizing sandstone brine and the local wall rock of a basement fault zone. Both types of mineralization and associated host-rock alteration occur at sites of basement—sandstone fluid interaction where a spatially stable redox gradient, or front, was present. Although either type of deposit can result in high grade pitchblende mineralization with up to 20% pitchblende, they are not physically large.
Egress-type deposits tend to be polymetallic (uranium-nickel-cobalt-copper-arsenic) and typically follow the trace of the underlying graphitic pelites and associated faults along the unconformity. Ingress-type, tend to be mono-minerallic uranium deposits, and can have more irregular, structurally controlled geometry. The RRW, RRE, and RRFE deposits at the Project are interpreted to be ingress types, although minor sections of the RRW mineralization do extend above the unconformity and the mineralization is polymetallic compared to the RRE and RRFE deposits.
Mineral Resources and Reserves
The current Mineral Resources for the Roughrider project are outlined in the following table:
Table 2.41– Mineral Resources for the Roughrider Project as at the date of this Annual Report
| Mining Scenario |
Deposit |
Classification |
Tons (‘000’s) |
Tonnes (‘000s) |
Grade |
Pounds U3O8 (‘000s) |
| Cut & Fill |
RRW |
Indicated |
44 |
40 |
3.38 |
3,000 |
| Inferred |
12 |
11 |
3.64 |
800 |
||
| Long Hole Open Stope |
RRW |
Indicated |
176 |
160 |
4.62 |
16,200 |
| Inferred |
75 |
68 |
6.06 |
9,100 |
||
| RRE |
Indicated |
- |
- |
- |
- |
|
| Inferred |
256 |
232 |
4.41 |
22,600 |
||
| RRFE |
Indicated |
208 |
189 |
2.07 |
8,600 |
|
| Inferred |
53 |
48 |
3.26 |
3,500 |
||
| Combined RRW, RRE, and RRFE |
||||||
| Total |
Indicated |
429 |
389 |
3.25 |
27,800 |
|
| Inferred |
396 |
359 |
4.55 |
36,000 |
||
Notes:
| 1. |
Mineral Resources are not Mineral Reserves and do not have demonstrated economic viability. |
| 2. |
Mineral Resources are reported exclusive of Mineral Reserves. There are no Mineral Reserves for the Project. |
| 3. |
Mineral Resources are reported on a 100% ownership basis. |
| 4. |
Mineral Resources are reported diluted within the MSO shapes based on a U3O8 price of US$56/1b of U3O8 and metallurgical recovery of 97%. Cut and Fill (“C&F”) and long-hole open stoping (“LHOS”) scenario cut-off grades are 0.52% U3O8 and 0.45% U3O8 respectively. |
| 5. |
The Mineral Resources were estimated by SRK, a third-party QP under the definitions defined by S-K 1300.The tonnage (presented in metric tonnes), grade (%), and contained metal (metric tonnes and imperial pounds) have been rounded to reflect the accuracy of the estimates. |
Horseshoe-Raven Project
An independent TRS for the Horseshoe-Raven Project area (the “Horseshoe-Raven Project Area”) has been prepared for UEC, under the supervision of Nathan Barsi, Chris Hamel and Roger Lemaitre (the “QPs” herein), pursuant to S-K 1300. This TRS identifies and summarizes the scientific and technical information and conclusions reached from the IA to support disclosure of mineral resources on the Horseshoe-Raven Project Area.

Figure 2.23 – Location of the Horseshoe Raven Project
Property Description
The Horseshoe-Raven Project Area is in the Wollaston Lake area of Northern Saskatchewan, approximately 695 kms north of Saskatoon, southwest of Wollaston Lake. The Horseshoe-Raven Project Area measures approximately 4,486 hectares comprising one mineral claim to which UEX Corporation (“UEX”), a wholly-owned subsidiary of UEC, has title. The Horseshoe-Raven Project does not have mineral reserves and is therefore considered an Exploration Stage property under S-K 1300 definitions.
In Saskatchewan, mineral resources are owned by the Crown and managed by the Saskatchewan Ministry of the Economy through the Crown Minerals Act and the Mineral Tenure Registry Regulations, 2012. Staking for mineral dispositions in Saskatchewan is conducted through the online staking system, Mineral Administration Registry Saskatchewan (“MARS”). The mineral disposition for the Horseshoe-Raven Project Areay was staked in 1977. Accordingly, ground staking methods were employed prior to the initiation of staking by the MARS system. These dispositions give the stakeholders the right to explore the lands within the disposition area for economic mineral deposits.
UEX holds a 100% interest in the Horseshoe-Raven Project Area, subject to standard royalties to the Government of Saskatchewan.
Access to the Horseshoe-Raven Project Area is via Highway 905, a well-maintained gravel road accessible year-round that passes through the central portion of the Horseshoe-Raven Project Area and over the west end of the Raven Deposit. Year-round access is possible by truck. The topography of the Horseshoe-Raven Project Area is relatively flat characterized by undulating glacial moraine, outwash and lacustrine plains. There is no permanent infrastructure on the project, a temporary work camp and core logging facility are the only infrastructure on the project area. Access to electricity is by diesel generator, but future mining operations would utilize the Saskatchewan Power grid that is nearby the project. Personnel can be drawn from local communities of Wollaston, Black Lake, Stony Rapids, Fond du Lac, that have supplied personnel for mining operations in the eastern Athabasca Basin for decades. Sources of water near the project area are plentiful and should not be a constraining factor. The nearest airport for public use is at Points North Landing, approximately 40 kilometres (25 miles) by road to the northwest of the project area. There are no rail lines or port facilities near the project area.
The project is an Exploration Stage project, with significant drilling to determine the indicated resources on the property in the Horseshoe and Raven deposits. A program to rehabilitate and upgrade the Raven Camp infrastructure was initiated in fiscal 2023 that is planned to be completed in fiscal year 2024. The camp facilities are approximately 20 years old but with the recent exploration camp remediation work remain in good condition. No mine infrastructure or underground development is present on the project, and the work camp on the site is temporary. The next step for the project to advance will likely be a drill program to collect metallurgy for the Horseshoe and Raven deposits in advance of a future economic study.
History
The Horseshoe-Raven Project Area was initially explored in the late 1960s as part of the greater Rabbit Lake Property after the discovery of the Rabbit Lake Uranium Deposit in 1968.
Early exploration for uranium was conducted by Gulf Minerals Canada Limited (“Gulf”) and Conwest Exploration Company Limited (“Conwest”). Eldorado Nuclear Limited acquired Conwest in 1979, Gulf in 1982 and amalgamated with Saskatchewan Mining and Development Corporation (“SMDC”) to form Cameco in 1988. Cameco transferred title to the Hidden Bay Property to UEX through an agreement reached with Pioneer Metals Corporation (“Pioneer”) in 2001.
The Horseshoe-Raven Project Area deposit was discovered in two stages, four years after the discovery of the Rabbit Lake Mine. In the fall of 1972, drill testing of a ground conductor became the discovery hole for the Raven Deposit. Subsequent drilling through 1973 and 1974 outlined the deposit. During the final year of the Raven Deposit drilling, the discovery hole of the Horseshoe Deposit intersected uranium mineralization to the east of the Raven Deposit while testing a geophysical anomaly similar to the Raven Deposit signature. Subsequent diamond drilling during the period of 1974 to mid-1975 succeeded in outlining the Horseshoe Deposit (Studer, 1984).
Permitting and Licensing
Mineral exploration on land administered by the Saskatchewan Ministry of Environment requires that surface disturbance permits be obtained before any exploration or development work is performed. The Saskatchewan Mineral Exploration and Government Advisory Committee has developed the Mineral Exploration Guidelines for Saskatchewan to mitigate environmental impacts from industry activity and facilitate government approval for such activities (SMEGAC, 2016). Applications to conduct an exploration work program need only to address the relevant topics of those listed in the guidelines. The types of activities are listed under the guide’s best management practices (“BMP”).
There are no environmental encumbrances on the project. The approximate timeline for projects in Saskatchewan for EA baseline work with permitting and licensing following that is 5-10 years once they are at the stage of having indicated resources. There have been no violations or fines associated with the project and the remediation work conducted in 2023 has left the temporary camp facilities in good working order. Future permit requirements will be permitting and licensing with both the federal and provincial governments, the Government of Saskatchewan Ministry of Environment, and the Canadian Nuclear Safety Commission to obtain environmental permits, and construction and operating licenses.
Geologic Setting, Mineralization, and Deposit
The Horseshoe-Raven Project Area is located just east of the eastern margin of the Athabasca Basin. It is underlain by Paleoproterozoic metasedimentary gneiss and Archean granitic gneiss basement rocks of the Hearne Province. The basement rocks of the Horseshoe-Raven Project Area are within the Cree Lake zone of the Early Proterozoic Trans-Hudson orogenic belt. The Cree Lake zone is further subdivided into three transitional lithotectonic domains, of which the Horseshoe-Raven Project Area lies within one of them, the Wollaston Domain. Lithologies and foliation of the Wollaston Domain rocks of the Horseshoe-Raven Project Area trend northeast with predominantly moderate to steep southeast dips, although northwest dips occur as the result of the broad synform that is the host to uranium mineralization at Horseshoe and Raven.
The Wollaston Domain is composed of a mixed sequence of metamorphosed arkosic sandstones and pelitic to semi-pelitic gneisses that make up four successive lithostratigraphic units, of which the upper three are present in the deposit area:
| ● |
a basal pelitic gneiss composed of coarse, mature quarzitic to arkosic metasedimentary rocks; |
| ● |
a meta-pelite, commonly graphitic and interlayered with quartzitic semi-pelite and calc-silicate; |
| ● |
a thick meta-arkose interlayered with minor calc-silicate and pelite; and |
| ● |
upper amphibole-quartzite interlayered with calcareous metasedimentary rocks and graphitic pelite, known as the Hidden Bay assemblage. |
The Horseshoe and Raven Deposits are hosted by the Hidden Bay Assemblage, which occurs within a complex northeast trending D2 synclinorium that sits structurally above and south of the underlying meta-arkose unit of the Daly River subgroup. The synclinorium is cored by quartzite that is succeeded outward concentrically from the core of the folds by other components of the Hidden Bay Assemblage, which include a mixed sequence of calc-arkose, additional quartzite, locally graphitic sillimanite-bearing pelitic schist and amphibolite.
Lithologies in the Horseshoe and Raven areas outline several significant, upright open D2 (F2) folds in the local area. These folds have steep to moderate southeasterly dipping axial planes and horizontal to shallow northeast plunging fold axes.
Mineralization at the Horseshoe Deposit has been defined over a strike length of approximately 800 meters and occurs at depths between 100 and 450 meters below surface. Mineralization occurs in several stacked and shallow plunging shoots that generally follow the fold axis of a gently folded arkose-quartzite package. Uranium mineralization is often best developed along the dilational zones developed between the bedding units.
The Raven Deposit is located 500 meters southwest of the Horseshoe Deposit and has been defined over a strike 1000 meters and ranges between 100 and 300 meters in depth. The bulk of the uranium mineralization occurs in two sub-horizontal tabular zones that are oriented parallel to the axial plane of the folded arkose-quartzite package.
Mineral Resources and Reserves
The current Mineral Resources for the Horseshoe-Raven deposits are outlined in the following table:
Table 2.42 – Mineral Resources for the Horseshoe-Raven Project as at the date of this Annual Report
| Deposit |
Classification |
Tons (‘000s) |
Tonnes (‘000s) |
Grade |
Pounds U3O8 (‘000s) |
| Horseshoe |
Indicated |
5,493 |
4,983 |
0.215 |
23,600 |
| Raven |
Indicated |
5,919 |
5,370 |
0.117 |
13,800 |
Notes:
| 1. |
Mineral resources are not mineral reserves and have not demonstrated economic viability. |
| 2. |
There is no certainty that all or any part of the mineral resource will be converted into mineral reserves. |
| 3. |
All figures are rounded to reflect the relative accuracy of the estimates. |
| 4. |
Resources were estimated using a COG of 0.05% U3O8. |
Shea Creek Project
An independent TRS for the Shea Creek Project area (the “Shea Creek Project Area”) has been prepared for UEC, under the supervision of Chris Hamel, David Alan Rhys, and James Gray (the “QPs” herein), pursuant to S-K 1300. This TRS identifies and summarizes the scientific and technical information and conclusions reached from the IA to support disclosure of mineral resources on the Shea Creek Project Area.
Figure 2.24 – Location of the Shea Creek Project
Property Description
The Shea Creek Project Area comprises 18 mineral dispositions totaling 32,962 hectares (“ha”) (330 km2), which are registered to and administered by ORANO. ORANO acts as project operator.
UEX Corporation (“UEX Corp.”; having amalgamated with UEX, UEC’s wholly-owned subsidiary now) acquired its interest in the Shea Creek Project Area through an option agreement that was signed in March 2004 (the “2004 Agreement”). Under the 2004 Agreement, UEX Corp. was granted an option to acquire a 49% interest in eight uranium projects located in the Western Athabasca Basin that included the Shea Creek Project Area, from COGEMA Resources Inc. (“COGEMA”), the predecessor to AREVA, which subsequently became ORANO. To acquire the initial 49% interest, UEX Corp. was required to fund C$30 million in exploration expenditures over an 11-year period. UEX Corp. fulfilled the option terms of the 2004 Agreement well ahead of the maximum 11-year period by December 31, 2007. Under the terms of the 2004 Agreement, UEX Corp. granted AREVA (now ORANO) a royalty in an amount equal to US$0.212 per pound of future uranium in concentrate produced from the Anne and Colette deposits to a maximum total royalty of $10.0 million.
In April 2013, AREVA granted UEX Corp. an option to increase UEX Corp’s interest in the nine Western Athabasca Projects (the “Projects”), which include the Shea Creek Project Area, to 49.9% through the expenditure by UEX Corp. of an aggregate of C$18.0 million (the "Additional Expenditures") on exploration drilling intended to advance the four known Shea Creek deposits (the “2013 Agreement”). This 2013 Agreement expired on December 31, 2018, with exploration expenditures of C$1,949,275 attributed to the option that earned UEX Corp. the additional equity above the 2004 Agreement to attain a 49.0975% equity interest in the Shea Creek Project Area.
In Saskatchewan, mineral resources are owned by the Crown and managed by the Saskatchewan Ministry of the Economy through the Crown Minerals Act and the Mineral Tenure Registry Regulations, 2012. Staking for mineral dispositions in Saskatchewan is conducted through the online staking system, MARS. Accordingly, ground staking methods were employed prior to the initiation of staking by the MARS system. These dispositions give the stakeholders the right to explore the lands within the disposition area for economic mineral deposits.
Access to the property is by highway 955, approximately 230 km north of the community of La Loche and 5 km south of the formerly producing Cluff Lake mine, the highway passes through the property and within about 2 km of the deposit area. Much of the deposit area is below areas of dry ground, and accessible year-round. There is an unmaintained airstrip at the former Cluff Lake mine. Water is abundant in the area and is not perceived to be a constraint on project development. Personnel to operate future operations could be drawn from the local communities of La Loche, Buffalo Narrows, and several other communities in the area that have people experienced in uranium mining operations. There is currently no grid power supply to the Property. The electrical grid power source is approximately 300 km away at the Key Lake switching station. No buildings or ancillary facilities are currently present at the site of the Property.
History
The western portions of the Athabasca Basin were initially explored in the 1960s as exploration activities expanded outward from the established Beaverlodge uranium district. After airborne radiometric surveys in the late 1960s, ground prospecting followed by drilling led to the discovery of the Cluff Lake deposits. Production from the Cluff Lake deposits commenced in 1980 and operations continued until 2002. Total production from the Cluff Lake mine site amounted to 64.2 million pounds U3O8 at an average grade of 0.92% U3O8, from several deposits.
Despite its proximity to Cluff Lake, systematic exploration on the Shea Creek Project Area did not commence until 1990 when Amok Limited (“Amok”) conducted an airborne GEOTEM EM survey, which identified conductive north-northwest trending zones underlying the Athabasca sandstone sequence. Subsequent follow-up with ground EM surveys further refined the position of the conductors, prompting Amok to reduce their mineral permit area claim to claims that now comprise the Shea Creek Project Area. Amok drilled several of the EM conductors in 1992, intersecting narrow intervals of uranium mineralization in northern parts of the Shea Creek Project Area near the sub-Athabasca unconformity. In 1993, ownership of the Shea Creek Project Area was transferred to COGEMA (now ORANO), who continued exploration by drilling to the north the same conductive basement unit – now known as the Saskatoon Lake Conductor (“SLC”) – and between 1994 and 2000, drilled more than 95,000 meters in 156 drillholes. These resulted in the discovery of the Anne and Colette deposits. Between 2000 and 2003, no drilling was completed, but additional airborne and ground EM surveys were undertaken to further enhance targeting.
In March 2004, COGEMA (subsequently AREVA and now ORANO) and UEX Corp. signed the 2004 Agreement. Drilling re-commenced and was funded by UEX Corp., and between 2004 and December 2012, approximately 141,317 meters of drilling in 307 diamond drillholes was completed under management by AREVA (now ORANO). The drill programs during this period resulted in the discovery and partial delineation of the Kianna Deposit between the Colette and Anne deposits and discovery of new areas of mineralization along the prospective corridor between Anne and Colette (e.g. Colette South mineralization, 58B Deposit and Kianna South). Exploration during this period also included a MEGATEM survey of the Shea Creek Project Area and ground-based geophysical surveys, which included a DC Resistivity survey in 2005 that outlined several significant untested or poorly tested resistivity lows and a Tensor Magnetotelluric survey in 2008. In total, 278,889 meters of drilling in 563 drillholes have been completed on the Shea Creek Project Area since systematic exploration began in 1992, up to December 31, 2021.
Permitting and Licensing
Mineral exploration on land administered by the Saskatchewan Ministry of Environment requires that surface disturbance permits be obtained before any exploration or development work is performed. The Saskatchewan Mineral Exploration and Government Advisory Committee has developed the Mineral Exploration Guidelines for Saskatchewan to mitigate environmental impacts from industry activity and facilitate government approval for such activities (SMEGAC, 2016). Applications to conduct an exploration work program need only to address the relevant topics of those listed in the guidelines. The types of activities are listed under the guide’s BMPs.
There are no environmental encumbrances on the project. The approximate timeline for projects in Saskatchewan for EA baseline work with permitting and licensing following that is 5-10 years once they are at the stage of having indicated resources. There have been no violations or fines associated with the project. Future requirements with respect to permitting and licensing are with both the federal and provincial governments, the Government of Saskatchewan Ministry of Environment, and the Canadian Nuclear Safety Commission to obtain environmental permits, and construction and operating licenses.
Geologic Setting, Mineralization, and Deposit
Local geology at the Shea Creek Project Area comprises 400 to 800 meters of Athabasca Group sandstone, which unconformably overlie Lloyd Domain amphibolite-grade granitic and pelitic gneisses. The latter includes the SLC, a 40- to 80-meter-thick north-northwest trending and west-southwest dipping graphitic pelitic gneiss unit that is spatially associated with mineralization. The gneiss sequence is affected by penetrative syn-metamorphic deformation that occurred in at least two foliation forming phases during the 1950-1900 Ma Taltson orogeny. These peak metamorphic fabrics are overprinted by northeast-trending, right-lateral/oblique, retrograde mylonitic shear zones (D3; probable Hudsonian age) including the regional Beatty River Shear zone and northeast-trending second and third order narrow mylonitic shear zones that offset the SLC. Post-Athabasca faulting remobilizes these mylonites and is also associated with up to 50 meters of reverse displacement of the unconformity along the R3 fault at the base of the SLC. Textural and geometrical relationships suggest that uranium mineralization was coeval with the late faulting, and that the architecture of the older D3 shear zones may have had a fundamental control on the position of mineralization.
To date, four uranium deposits have been discovered over a three km strike length along the SLC in northern parts of the Shea Creek Project Area: Kianna; Anne; Colette; and 58B. Uranium mineralization in these deposits occurs in three stacked styles that encompass the full range of types of unconformity uranium deposits. Most extensive is flat-lying, massive pitchblende-hematite and chlorite-matrix-breccia-hosted mineralization which straddles the unconformity along, and immediately east of, the trace of the SLC. Breccia mineralization occurs both as pitchblende-coffinite fragments and as matrix replacement, suggesting it may have occurred in pulses that temporally spanned brecciation. Continuous unconformity mineralization occurs along the SLC for much of the 2.5 km known strike extent of the Shea Creek Project Area deposits and is thickest and highest grade where basement mineralization lies beneath it. Basement mineralization forms a significant portion of the Shea Creek Project Area’s uranium inventory and is most extensive at the Kianna Deposit. It comprises: a) concordant-reverse-fault-hosted mineralization that often extends from the unconformity downward into granitic gneiss in the immediate footwall of the SLC; and b) discordant fault, vein and replacement pitchblende mineralization that occurs in steep east-west to west-northwest trending zones that may extend for several hundred meters below the unconformity, and which occurs along or beside remobilized mylonitic shear zones. Basement mineralization thickens where concordant and discordant faults intersect, forming west-plunging ore shoots. Lensoidal zones of perched mineralization are locally present up to several tens of meters above the unconformity and are often where reduced, pyritic chlorite alteration extends into the Athabasca sandstone above areas of basement and thicker unconformity mineralization.
Table 2.42 – Mineral Resources for the Horseshoe-Raven Project as at the date of this Annual Report
| Deposit |
Classification |
Tons (000’s) |
Tonnes (‘000s) |
Grade |
Pounds U3O8 (‘000s) |
| Collette |
Indicated |
360 |
327 |
0.787 |
2,786 |
| Inferred |
542 |
492 |
0.717 |
3,814 |
|
| 58B |
Indicated |
156 |
142 |
0.773 |
1,188 |
| Inferred |
89 |
81 |
0.510 |
445 |
|
| Kianna |
Indicated |
1,132 |
1,027 |
1.535 |
17,058 |
| Inferred |
603 |
547 |
1.390 |
8,235 |
|
| Anne |
Indicated |
617 |
560 |
2.002 |
12,144 |
| Inferred |
148 |
134 |
0.883 |
1,282 |
|
| TOTAL |
Indicated |
2,266 |
2,056 |
1.491 |
33,175 |
| Inferred |
1,382 |
1,254 |
1.015 |
13,775 |
Notes:
| 1. |
Mineral resources are not mineral reserves and have not demonstrated economic viability. |
| 2. |
There is no certainty that all or any part of the mineral resource will be converted into mineral reserves. |
| 3. |
Figures are rounded to reflect the relative accuracy of the estimates. |
| 4. |
Resources were estimated using a cut-off grade of 0.30% U3O8. |
| 5. |
UEC's share of mineral resources is calculated based on UEC's 49.0975% equity in the project. |
South American Uranium Properties
Paraguay ISR Properties
Below is a map showing the location for the Company’s uranium projects in Paraguay.
Figure 2.25 – Uranium Project Locations in Paraguay
Our Material Paraguay ISR Properties
Yuty ISR Project
An independent TRS for the Yuty Project area (the “Yuty Project Area”) has been prepared for UEC, under the supervision of BRS Inc. Engineering (“BRS”) (the “QP” herein), pursuant to S-K 1300. This TRS identifies and summarizes the scientific and technical information and conclusions reached from the IA to support disclosure of mineral resources on the Yuty Project Area. There are no mineral reserves associated with this Yuty Project Area. The Yuty Project is an exploration stage phase project.
Figure 2.26 – Location of the Yuty Project
Property Description
The Yuty Project Area is located in Paraguay, South America. UEC operates the Yuty Project Area through its wholly-owned subsidiary, Transandes Paraguay S.A. (“TPSA”), which holds a 100% interest in the Yuty Mining Exploration and Exploitation Concession (the “Yuty Concession”) Contract (the “Contract”). The planned mining method for the Yuty Project Area is by ISR mining.
The Yuty Project Area covers an area of 289,687 acres (117,232 hectares), located in the eastern region of the country in the Department of Caazapá, 167 miles northeast of the capital of Paraguay. The geographic coordinates of the central part of the Yuty Project Area, where the bulk of past exploration has been carried out (San Antonio area in Block 1), are approximately 26°37’S and 56°20’W.
Access to the Yuty Project is via road PY-08, a paved road that borders the town of San Antonio, through the district of the city of Yuty, and through the north portion of the Yuty Deposit area. Very close to the mentioned route, the town of San Antonio has storage of deposit samples containing material from an extensive uranium exploration (2007 to 2014), and hosts logging calibration wells, modest field office facilities, and facilities for staff accommodation. All facilities are kept in good condition through ongoing maintenance work. The Yuty project area is characterized by being primarily a rural area with well-maintained internal dirt roads, electricity, potable water service, hotels, and supplies and public services in the urban area of the city of Yuty.
Title to the Yuty Concession is now held through the Contract with the Republic of Paraguay (the “Republic”), which grants mining rights for a minimum period of 20 years, renewable every five years. The Contract was signed into Law 3575/08 (the “Law”) as an Act of the Paraguayan Congress in August 2008. The Law calls for payment of a 2.5% royalty to the Republic on all production, based on the production at the point of sale.
The Yuty Project Area is located within the Paraná Basin and is underlain by predominantly sedimentary rocks of undivided upper Permo-Carboniferous age. Uranium mineralization is sandstone hosted roll-front type.
The Yuty Project Area was explored extensively by Anschutz Corporation (“Anschutz”) of Denver, Colorado in the late 1970s and early 1980s. Cue Resources Ltd. (“CUE”) controlled the Yuty Project Area prior to acquisition by UEC and conducted exploration and verification drilling projects circa 2007 through 2011. UEC possesses the original drill data, from which a drill hole database has been developed and verified. Samples from Anschutz were not preserved, however, core samples from areas in the possession of UEC and have been reviewed by the TRS QP. Within the Yuty Project Area, drill data from 543 drill holes, including hole location and radiometric equivalent data in 0.1 m downhole increments, were available for the preparation of the TRS.
History
Exploration for uranium in Southeastern Paraguay was started in 1976 by Anschutz, after signing of the Concession Agreement between the Government of Paraguay and Anschutz in December 1975. The agreement allowed Anschutz to explore for “all minerals, excluding oil, gas and construction materials”. Previously intermittent exploration had been carried out by international oil companies, with insignificant results. The region, however, is known for its limited mining activities and production of high-grade iron ore, mineral pigments, clays, limestone, sandstone, sand and gravel by indigenous people.
In early 1976, a number of reports by Anschutz consultants, A.F. Renfro, D.G. Bryant and G.E. Thomas, covered the geology of eastern Paraguay based on reconnaissance field trips made through the southern Precambrian area, the sedimentary section from north to south, and the alkalic intrusions in the north-central part of a large concession. From field examinations of various rock types and airborne radiometric data, Renfro concluded that the Anschutz concession contained areas with good potential for uranium mineralization. The regional correlation of stratigraphic horizons favorable for uranium mineralization is shown in various figures of that report.
The initial uranium exploration by Anschutz in 1976 covered an exclusive exploration exploitation concession covering approximately 162,700 km2, virtually the whole eastern half of Paraguay. This included geological mapping, water sampling, soil sampling and a broad reconnaissance Track Etch program, with stations spaced 10 kms apart. The station spacing for the Track Etch survey was subsequently reduced to five kms in the southern part of the concession. The reconnaissance program outlined large anomalous zones and Anschutz concluded that the concession in Paraguay constituted a new uranium province in an area underlain by granitic rocks and sandstones.
The initial reconnaissance program by Anschutz was followed by a program of airborne radiometric and magnetic surveys, a detailed Track Etch survey with station spacing of 100 to 200 meters and geochemical stream sediment and soil sampling. Flight line spacing for the airborne radiometric survey was five kms with a clearance of 100 meters above the surface. Anschutz carried out exploration on behalf of a joint venture with Korea Electric Power Corporation and Taiwan Power Company.
In 2006, TPSA resumed exploratory activities in San Antonio, a district of the town of Yuty in the Department of Caazapa, Paraguay, by virtue of a prospecting permit granted by the MOPC that enabled the start of the mining exploration phase in May 2007 in four blocks (Blocks I, II, III and IV), encompassing a total of 787,401 acres. In June 2008, with four mining blocks in the exploration phase, the Contract was approved by the Law, and signed between the Government of the Republic and TPSA for the exploration and exploitation of metallic and non-metallic minerals, precious and semiprecious gems.
In March 2012, UEC acquired Cue Resources Inc. (“CUE”). At the time of the acquisition, the Yuty Project Area consisted of four blocks with a total area now reduced to 492,234 acres (199,200 hectares). Data from 323 drill holes totaling 33,491 meters of core and rotary drilling was available and a technical report was completed.
Permitting and Licensing
In summary, all financial and other obligations related to the mineral concession for the Yuty Project Area have been met. All environmental licenses and permits are in good standing. Except for the San Antonio area, the Yuty Project Area is at an early-to intermediate stage of exploration. The Yuty Project does not have mineral reserves and is therefore considered an exploration stage property under S-K 1300 definitions. The San Antonio area is at a more advanced stage since it has received considerable drilling in the past by Anschutz and recently by CUE.
In 2015, the Ministry of Public Works and Communications (MOPC), which is the enforcement authority for mining activities in Paraguay, approved the exploitation phase carried out in the period (2007-2014). However, in 2018, the mining enforcement authority in a previous administration took the position that the Yuty concession was not eligible to continue with the exploitation phase, despite the fact that exploitation phase activities were suspended based on the Company’s subsidiary’s, Transandes Paraguay S.A. (“TPSA”), requests provided for in the concession contract and approved by the MOPC. TPSA initiated legal actions to protect its mining rights and entered into conversations in 2019 with the MOPC and other institutions of the executive branch. TPSA reached an out-of-court agreement in 2022 that suspends the ongoing litigation and begins the re-instatement of the TPSA’s mining rights, however, during the process of finalization, the Administrative Court was not in a position to approve the aforementioned agreement and TPSA has now filed an appeal with the Supreme Court in connection with the same.
Once the re-instatement process of these concession rights regarding the extrajudicial agreement signed with the executive branch is complete, the Yuty project is committed to making annual payments of the mining canon equivalent to $2.5 per hectare, equivalent to a final amount of $293,080 and to make minimum investments equivalent to $690,000 per year during the phase of exploitation. In addition, the Company’s subsidiary must report quarterly to the Enforcement Authority on the progress of the project, as well as once the production stage has begun. TPSA must also pay a 2.5% royalty to the Republic on all production, based on the production at the point of sale according to the Law 3575/2008.
The processing of environmental licenses for the new stages of the exploitation phase will require updating and compliance with management plans approved by the licenses in the future.
Geologic Setting, Mineralization and Deposit
The Yuty Project Area is situated within the Paraná Basin in Southeastern Paraguay. The Yuty Project Area is located on the western end of the Paraná Basin, which also hosts the Figueira uranium deposit in Brazil. The area is underlain by Upper Permian to Carboniferous continental sedimentary rocks, and is known for uranium occurrences, such as the San Pedro, Santa Barbara, Yarati-í and San Antonio occurrences. Significant radiometric anomalies also occur in Precambrian igneous and metamorphic rocks, Cambrian limestone, Silurian sandstone and Cretaceous to Tertiary carbonatites and alkaline intrusive rocks.
The exploration methodology applied during past programs has been to determine the favorable host rocks of the Upper Permian-Carboniferous (“UPC”) sequence and determine favorable areas of the host sandstone.
The stratigraphic sequence of the lithologies in the Yuty Project Area has been divided into the Southern UPC rocks and Lower Permian-Carboniferous (“LPC”) rocks. The Southern UPC contains the sequence of rocks as follows:
| ● |
Cabacua Formation: 200 meters thick; |
| ● |
Tapyata Formation: 125 meters thick; |
| ● |
Tacuary Formation: 280 meters thick; and |
| ● |
San Miguel Formation: 20 to 90 meters thick. |
Local sandstone units in descending stratigraphic order are:
| ● |
Upper Sand Unit: Estimated to be approximately 50 meters thick; |
| ● |
Alternating Sandstone and Shale Unit: Estimated to be approximately 150 meters thick; |
| ● |
Massive Sand Unit: Estimated to be 60 to 100 meters thick; |
| ● |
Fine-grained Sand Unit: Estimated to be up to 15 meters thick; and |
| ● |
Wavy Unit: Estimated to be up to 20 meters thick. |
The Massive Sand Unit, Fine-Grained Unit and the Wavy Unit are collectively referred to as the San Miguel Formation and are host to the uranium mineralization at the Yuty Project Area. At the Yuty Project Area, soils are typically 5 to 15 meters thick. There is a diabase sill between the upper sand unit and the Massive Sand Unit. Within the Massive Sand Unit there is a distinctive marker shale that is typically above the mineralization.
The rocks of the UPC are sub-horizontal (dipping 1° to 5° to the east) and cover the western flank of the Paraná Basin. Data from reconnaissance drilling indicates that “the basin margin is cut by a series of west and northwest trending faults, with displacements ranging from a few metres to several hundred metres”.
Continental sedimentary units of the Independencia Formation (of the UPC) are known to have high potential for uranium exploration in eastern Paraguay. Earlier work also suggests that the basal sandstone, a 20- to 90-meter-thick unit known as the San Miguel Formation (within the Independencia Formation), is the best host for uranium mineralization in the Yuty Project Area. Earlier work further suggests that the San Miguel Formation can be correlated with the Rio Benito Formation in the uranium-bearing Permian rocks near Figueira, in the Paraná Basin in Brazil. The source of the uranium is thought to be the Lower Permian-Carboniferous Coronel Oviedo Formation, which is correlated with the Itataré Formation underlying the Rio Benito Formation in Brazil. Occasional diabase sills and dikes intrude the sedimentary rocks, such as at the San Antonio area near the village of Yuty. Outcrops are rare, mostly along road cuts, and mapping is done by drilling.
The Lower Permian Coronel Oviedo Formation underlies the UPC rocks. This glacial marine sequence of black shales, glacial sands and diamictites is generally characterized by a high radioactive background.
Uranium mineralization within the San Miguel Formation is stratabound and possibly syngenetic or diagenetic in origin. Recent interpretation of exploration data suggests that areas of limonite and hematite alteration within the grey-green, fine-grained sandstones in the San Antonio area have some characteristics similar to the alteration assemblages present at roll-front-type uranium deposits of the Powder River Basin, Wyoming.
Uranium mineralization within the UPC rocks is present in other parts of the Paraná Basin, such as at Figueira, Brazil, as noted above. In a 1982 publication, S. Saad proposed a model of mineralization for Figueira-type mineralization. This model suggests that the uranium mineralization is predominantly of epigenetic type, and consists of five phases covering the source, sedimentation, precipitation, remobilization and enrichment of uranium along the more permeable coarser fluvio-deltaic channel sediments.
Past exploration has identified pitchblende or coffinite (or both) as the uranium minerals that are likely to occur in the Yuty Project Area. Honea (1981) examined three sandstone samples in a polished section under the scanning electron microscope. He reported that “pyrite is confirmed as the sulphide mineral phase present both alone and with clays as partial to complete filling of interstices between clasts… and occurs as relatively well-formed cubic crystals, as anhedral aggregates… grain size varies from less than one micron to almost one millimetre”. Honea further reported that the “uranium-bearing phase(s) could not be isolated even at high magnification but is shown by composition spectra to be present with clay and pyrite in the interstitial fillings. Available data indicate a reduced black opaque mineral (very probably either pitchblende or coffinite – or both) scattered as sub-microscopic particles”.
Uranium mineralization hosted by the basal San Miguel Formation of the UPC is interpreted to represent a variety of the roll-front-type mineralization by the early workers of Anschutz. Sandstone-type deposits are characteristically sedimentary formations of clastic-detrital origin, containing reducing environments. These deposits are usually tabular in shape and may occur in continental sandstones, deltaic or shallow marine environments. Typically, roll-front-type uranium deposits have, in the direction of the flow of mineralizing solutions, a barren (oxidized) interior zone surrounded by a (reduced) mineralized zone. Between the barren zone and the mineralized zone is an altered zone. The overall shape of the roll-front is like a crescent with extended tails at each end, which also outlines the barren interior zone, and uranium is deposited at the interface between the oxidized zone and the reduced zone. Ground water flow direction is usually a good guide in detecting roll-front-type deposits in sandstones.
The style of mineralization within the sandstones at the Yuty Project Area includes some characteristics of the roll-front-type mineralization, as in the Powder River Basin, Wyoming. It is likely that the style of mineralization is a variety of the roll-front-type uranium mineralization.
Table 2.43 – Mineral Resources for the Yuty Project as at the date of this Annual Report
| Category |
Tons Ore (000’s) |
Tonnes Ore (1000’s) |
Weighted Average Grade (% eU3O8) |
Pounds eU3O8 (000’s) |
| Measured |
- |
- |
- |
- |
| Indicated – Massive Sand Unit |
7,233 |
6,562 |
0.048 |
6,969 |
| Indicated – Fine-Grained and Wavy Sand Units |
1,842 |
1,671 |
0.054 |
1,994 |
| Total M&I |
9,074 |
8,232 |
0.049 |
8,962 |
| Inferred – Massive Sand Unit |
1690 |
1533 |
0.045 |
1,528 |
| Inferred – Fine Grained and Wavy Sand Units |
1043 |
946 |
0.032 |
675 |
| Total Resources |
2,733 |
2,479 |
0.040 |
2,203 |
Notes:
| 1. |
The sum of resource tons and lbs. may not add up to the reported total due to rounding. |
| 2. |
Measured, indicated, and inferred mineral resources as defined in 17 CFR § 229.1300. |
| 3. |
Resources estimated using a 0.02% eU3O8 grade cutoff and a 0.1 ft% GT cutoff. |
| 4. |
Mineral Resources are estimated using a long-term uranium price of $65 per pound. |
| 5. |
The point of reference for mineral resources is in-situ at the Project. |
| 6. |
Mineral resources that are not mineral reserves do not have demonstrated economic viability. |
As of the date of this Annual Report, other than as disclosed below, there are no material pending legal proceedings, other than ordinary routine litigation incidental to our business, to which our Company or any of our subsidiaries is a party or of which any of their property is subject, and no director, officer, affiliate or record or beneficial owner of more than 5% of our common stock, or any associate or any such director, officer, affiliate or security holder, is: (i) a party adverse to us or any of our subsidiaries in any legal proceeding; or (ii) has an adverse interest to us or any of our subsidiaries in any legal proceeding. Other than as disclosed below, management is not aware of any other material legal proceedings pending or that have been threatened against us or our properties.
On or about March 9, 2011, the TCEQ granted our Company’s applications for a Class III Injection Well Permit, PAA and AE for our Goliad Project. On or about December 4, 2012, the EPA concurred with the TCEQ issuance of the AE permit. With the receipt of this concurrence, the final authorization required for uranium extraction, our Goliad Project achieved fully-permitted status. On or about May 24, 2011, a group of petitioners, inclusive of Goliad County, appealed the TCEQ action to the 250th District Court in Travis County, Texas. A motion filed by our Company to intervene in this matter was granted. The petitioners’ appeal lay dormant until on or about June 14, 2013, when the petitioners filed their initial brief in support of their position. On or about January 18, 2013, a different group of petitioners, exclusive of Goliad County, filed a petition for review with the Court of Appeals for the Fifth Circuit to appeal the EPA’s decision. On or about March 5, 2013, a motion filed by our Company to intervene in this matter was granted. The parties attempted to resolve both appeals, to facilitate discussions and avoid further legal costs. The parties jointly agreed, through mediation initially conducted through the Fifth Circuit on or about August 8, 2013, to abate the proceedings in the State District Court. On or about August 21, 2013, the State District Court agreed to abate the proceedings. The EPA subsequently filed a motion to remand without vacatur with the Fifth Circuit wherein the EPA’s stated purpose was to elicit additional public input and further explain its rationale for the approval. In requesting the remand without vacatur, which would allow the AE to remain in place during the review period, the EPA denied the existence of legal error and stated that it was unaware of any additional information that would merit reversal of the AE. We and the TCEQ filed a request to the Fifth Circuit for the motion to remand without vacatur, and if granted, to be limited to a 60-day review period. On December 9, 2013, by way of a procedural order from a three-judge panel of the Fifth Circuit, the Court granted the remand without vacatur and initially limited the review period to 60 days. In March of 2014, at the EPA’s request, the Fifth Circuit extended the EPA’s time period for review and additionally, during that same period, our Company conducted a joint groundwater survey of the site, the result of which reaffirmed our previously filed groundwater direction studies. On or about June 17, 2014, the EPA reaffirmed its earlier decision to uphold the granting of our existing AE, with the exception of a northwestern portion containing less than 10% of the uranium resource which was withdrawn, but not denied, from the AE area until additional information is provided in the normal course of mine development. On or about September 9, 2014, the petitioners filed a status report with the State District Court which included a request to remove the stay agreed to in August 2013 and to set a briefing schedule. In that Status Report the petitioners also stated that they had decided not to pursue their appeal at the Fifth Circuit. We continue to believe that the pending appeal is without merit and is continuing as planned towards uranium extraction at its fully-permitted Goliad Project.
A Class I renewal application for the Goliad Project disposal wells was received by the TCEQ on January 23, 2020 and declared administratively complete on April 27, 2020. The application went through technical review and, on September 13, 2022, the executive director of the TCEQ made a decision that the permit application met the requirements of the law. On or around October 4, 2022, petitioners in Goliad County requested a hearing and reconsideration on the renewal permits. The TCEQ considered the requests on December 14, 2022, during its open meeting, and denied the petitioner’s request for reconsideration but granted its request for hearing. The TCEQ referred the application to the State Office of Administrative Hearing (“SOAH”) to discuss three issues: 1) whether the permit application adequately characterizes the geology and identified and assessed faults in the vicinity of the proposed injections wells; 2) whether the draft permit provides for adequate monitoring of migration of injected fluids in the vicinity of the proposed injection wells: and 3) whether the location and design of the injection wells and pre-injection facilities are adequate. At this time, the petitioner’s first set of interrogatories, requests for production and request for admission have been submitted. The hearing and SOAH decision is expected by March 31, 2024.
The Company has had communications and filings with the MOPC, the mining regulator in Paraguay, whereby the MOPC is taking the position that certain concessions forming part of the Company’s Yuty and Alto Paraná Projects are not eligible for extension as to exploration or continuation to exploitation in their current stages. While we remain fully committed to our development path forward in Paraguay, we have filed certain applications and appeals in Paraguay to reverse the MOPC’s position in order to protect the Company’s continuing rights in those concessions.
Item 4. Mine Safety Disclosures
Pursuant to Section 1503(a) of the Dodd-Frank Wall Street Reform and Consumer Protection Act of 2010, issuers that are operators, or that have a subsidiary that is an operator, of a coal or other mine in the United States, and that is subject to regulation by the Federal Mine Safety and Health Administration under the Mine Safety and Health Act of 1977 (the “Mine Safety Act”), are required to disclose in their periodic reports filed with the SEC information regarding specified health and safety violations, orders and citations, related assessments and legal actions, and mining-related fatalities. During the fiscal year ended July 31, 2023, our ISR Mines were not subject to regulation by the Federal Mine Safety and Health Administration under the Mine Safety Act.
Item 5. Market for Registrant’s Common Equity, Related Stockholder Matters and Issuer Purchases of Equity Securities
Shares of our common stock commenced trading on the OTC Bulletin Board under the symbol “URME” on December 5, 2005. On September 28, 2007, shares of our common stock commenced trading on the NYSE American (formerly known as the American Stock Exchange, the NYSE Amex Equities Exchange and the NYSE MKT) under the symbol “UEC”. The market for our common stock is limited and can be volatile. The following table sets forth the high and low trading prices relating to our common stock on the NYSE American on a quarterly basis for the periods indicated:
| NYSE American |
||||||
| Quarter Ended |
High |
Low |
||||
| July 2023 |
$3.65 | $2.30 | ||||
| April 2023 |
$4.29 | $2.36 | ||||
| January 2023 |
$4.41 | $3.02 | ||||
| October 2022 |
$4.65 | $3.18 | ||||
| July 2022 |
$4.25 | $3.97 | ||||
| April 2022 |
$4.69 | $4.23 | ||||
| January 2022 |
$2.63 | $2.46 | ||||
| October 2021 |
$3.87 | $3.53 | ||||
| July 2021 |
$2.34 | $2.14 | ||||
| April 2021 |
$3.05 | $2.85 | ||||
| January 2021 |
$1.76 | $1.59 | ||||
| October 2020 |
$0.88 | $0.83 |
The last reported closing price for our shares on the NYSE American on September 27, 2023 was $5.28 per share. As of September 27, 2023, we had 261 registered shareholders.
Dividend Policy
No dividends have been declared or paid on our common stock. We have incurred recurring losses and do not currently intend to pay any cash dividends in the foreseeable future.
Securities Authorized For Issuance Under Compensation Plans
At July 31, 2023, we had one equity compensation plan, our 2023 Stock Incentive Plan (the “2023 Plan”). Our 2023 Plan was ratified by our shareholders on July 20, 2023 and thereby superseded and replaced our then 2022 Stock Incentive Plan (the “2022 Plan”); having been ratified by our shareholders on July 21, 2022; with all stock-based compensation awards granted in accordance with our 2022 Plan and each of our preceding stock incentive plans being continued under our 2023 Plan (and the 2023 Plan, the 2022 Plan and all preceding stock incentive plans being, collectively, our “Stock Incentive Plan” herein).
The table below sets forth information relating to our equity compensation plan at our fiscal year end July 31, 2023:
| Number of |
Weighted |
Number of |
|||||||
| Securities to be |
Average Exercise |
Securities |
|||||||
| Issued Upon |
Price |
Remaining Available |
|||||||
| Exercise of |
of Outstanding |
for Future Issuance |
|||||||
| Outstanding |
Options, |
Under Equity |
|||||||
| Options, Warrants |
Warrants and |
Compensation Plans |
|||||||
| and Rights (1) |
Rights (2) |
(excluding column |
|||||||
| Plan Category |
(a) |
(b) |
(a)) |
||||||
| Equity Compensation Plans Approved by Security Holders (the 2023 Plan) (3) |
10,592,988 | $1.92 | 16,665,252 | ||||||
| Equity Compensation Plans Not Approved by Security Holders |
Nil |
N/A | Nil |
||||||
| Total |
10,592,988 | $1.92 | 16,665,252 |
Notes:
| (1) |
This figure represents: (i) 8,326,983 outstanding stock options having a weighted average exercise price of $1.92 and a weighted average remaining term of 7.43 years; (ii) 979,500 shares of our common stock underlying restricted stock units (the “RSUs”); and (iii) 1,286,505 shares of our common stock underlying performance based restricted stock units (the “PRSUs”). Shares of our common stock underlying PRSUs are included assuming maximum payout, but may be paid out at lesser amounts, or not at all, depending on the achievement of performance criteria. |
| (2) |
This price applies only to the stock options included in column (a) and is not applicable to the RSUs or PRSUs included in column (a). |
| (3) |
Under our Stock Incentive Plan, stock-based awards are granted from a pool of available shares, with: (i) every share issuable pursuant to the exercise of a stock option or SAR counting as one share of our common stock; and (ii) every share underlying restricted stock, a RSU, a PRSU or other right or benefit under our Stock Incentive Plan counting as two shares of our common stock. |
Securities Authorized For Issuance Under Compensation Plans
2023 Stock Incentive Plan
On May 26, 2023, our Board of Directors authorized and approved the adoption of the Company’s 2023 Plan, under which an aggregate of 30,108,288 of our shares may be issued, subject to adjustment as described in the 2023 Plan, and which, at that time, consisted of: (i) 9,987,917 shares issuable pursuant to awards previously granted that were outstanding under our 2022 Plan; (ii) 10,120,371 shares remaining available for issuance under the 2022 Plan; and (iii) 10,000,000 additional shares that may be issued pursuant to awards that may be granted under the 2023 Plan. On July 20, 2023, our shareholders approved the adoption of our 2023 Plan. The 2023 Plan supersedes and replaces our most recent and prior equity compensation plan, being the 2022 Plan.
The purpose of our Stock Incentive Plan is to enhance our long-term stockholder value by offering opportunities to our directors, officers, employees and eligible consultants to acquire and maintain stock ownership in order to give these persons the opportunity to participate in our growth and success, and to encourage them to remain in our service.
Our Stock Incentive Plan is administered by our Compensation Committee (therein our “Administrator”) which shall determine, among other things: (i) the persons to be granted awards under the Stock Incentive Plan (each an “Award” to an “Eligible Participant”); (ii) the number of shares or amount of other Awards to be granted; and (iii) the terms and conditions of the Awards granted. We may issue shares, options, stock appreciation rights, restricted stock units, performance restricted stock units, deferred stock units and dividend equivalent rights, among others, under our Stock Incentive Plan.
An Award may not be exercised after the termination date of the Award and may be exercised following the termination of an Eligible Participant’s continuous service only to the extent provided by the Administrator under the Stock Incentive Plan. If the Administrator of our Stock Incentive Plan permits an Eligible Participant to exercise an Award following the termination of continuous service for a specified period, the Award terminates to the extent not exercised on the last day of the specified period or the last day of the original term of the Award, whichever occurs first. In the event an Eligible Participant’s service has been terminated for “cause”, he or she shall immediately forfeit all rights to any of the Awards outstanding.
The foregoing summary of our Stock Incentive Plan is not complete and is qualified in its entirety by reference to the Stock Incentive Plan, a copy of which has been filed electronically with the SEC, which is available under the Company’s filings at www.sec.gov.
As of September 27, 2023, there were stock options outstanding under our Stock Incentive Plan exercisable for an aggregate of 7,800,251 shares of our common stock.
Common Stock Purchase Warrants
As of September 27, 2023, there were common stock purchase warrants issued and outstanding exercisable for an aggregate of 3,857,030 shares of our common stock.
Recent Issuances of Unregistered Securities
All of our issuances of unregistered securities during our fiscal year ended July 31, 2023 were previously disclosed in our Quarterly Reports on Form 10-Q for our first, second and third quarters of our fiscal year ended July 31, 2023, and in our Current Reports on Form 8-K as filed periodically with the SEC. During our fourth quarter ended July 31, 2023, we issued the following securities that were not registered under the Securities Act:
| ● |
on May 2, 2023, we issued 12,796 shares of common stock pursuant to the exercise of warrants at a price of CAD$2.33 per share. We relied on the exemption from the registration requirements under the Securities Act provided by Rule 903 of Regulation S with respect to the issuance of these shares; |
| ● | on May 16, 2023, we issued an aggregate of 77,906 shares of common stock pursuant to the exercise of warrants at a price of CAD$2.33 per share. We relied on the exemption from the registration requirements under the Securities Act provided by Rule 903 of Regulation S with respect to the issuance of these shares; | |
| ● | on May 19, 2023, we issued an aggregate of 34,874, 7,500 and 69,704 shares of common stock pursuant to the exercise of warrants at prices of CAD$2.33, CAD$2.00 and CAD$1.44 per share respectively. We relied on the exemption from the registration requirements under the Securities Act provided by Rule 903 of Regulation S with respect to the issuance of these shares. On the same date, we issued an aggregate of 11,250 shares of common stock pursuant to the exercise of warrants at a price of CAD$2.33 per share. We relied on the exemption from the registration requirements under the Securities Act provided by Rule 506(b) of Regulation D and/or Section 4(a)(2) under the Securities Act with respect to the issuance of these shares; | |
| ● | on June 2, 2023, we issued an aggregate of 689,158 shares of common stock pursuant to the exercise of warrants at a price of CAD$2.00 per share. We relied on the exemption from the registration requirements under the Securities Act provided by Rule 903 of Regulation S with respect to the issuance of these shares; and | |
| ● |
on July 26, 2023, we issued an aggregate of 34,566 shares of common stock to a certain vendor pursuant to a Property Purchase Agreement dated July 10, 2023, at a deemed issuance price of $3.2845 per share. We relied on exemptions from registration under the Securities Act provided by Regulation S and/or Section 4(a)(2) with respect to the issuance of these shares. |
Comparative Stock Performance
The graph below compares the cumulative total stockholder return on our common stock assuming an investment of $100 and the reinvestment of all dividends, if any, for the years ended July 31, 2019, through to July 31, 2023, with: (i) the cumulative total return on the shares of common stock of a current peer group index comprised of Centrus Energy Corp., Coeur Mining, Inc., Comstock Resources, Inc., Denison Mines Corp., enCore Energy Corp., Energy Fuels Inc., Filo Mining Corp., Fission Uranium Corp., Gulfport Energy Corporation, K92 Mining Inc., NexGen Energy Ltd., Northern Oil and Gas, Inc., Osisko Mining Inc., Seabridge Gold Inc. and Torex Gold Resources Inc. (collectively, the “Peer Group”); (ii) the cumulative total return on the shares of common stock of a previous peer group index comprised of Centrus Energy Corp., Comstock Resources, Inc., Denison Mines Corp., Energy Fuels Inc., Fission Uranium Corp., Global Atomic Corporation, Gulfport Energy Corporation, IsoEnergy Ltd., NACCO Industries, Inc., NexGen Energy Ltd., Northern Oil and Gas, Inc., PolyMet Mining Corp. and Ur-Energy Inc. (collectively, the “Previous Peer Group”); and (iii) the cumulative return on the Russell 3000 Index. The change in Peer Group was made to address changes in the external market and to better reflect our Company’s business.

Item 6. Selected Financial Data
(Expressed in thousands of U.S. dollars, except per share amounts)
The following tables provide selected financial data for each of the past five fiscal years, and should be read in conjunction with, and are qualified in their entirety by reference to, Item 7. Management’s Discussion and Analysis of Financial Condition and Results of Operations and our consolidated financial statements and related notes for the fiscal year ended July 31, 2023, as presented under Item 8. Financial Statements and Supplementary Data. These historical results are not necessarily indicative of the results to be expected for any future period.
Consolidated Balance Sheets
| July 31, 2023 |
July 31, 2022 |
July 31, 2021 |
July 31, 2020 |
July 31, 2019 |
||||||||||||||||
| Cash and cash equivalents |
$ | 45,614 | $ | 32,536 | $ | 44,313 | $ | 5,149 | $ | 6,058 | ||||||||||
| Term deposits |
- | - | - | - | 11,832 | |||||||||||||||
| Working capital |
43,011 | 93,693 | 61,776 | 4,552 | 16,639 | |||||||||||||||
| Total assets |
737,589 | 354,247 | 169,541 | 91,390 | 101,040 | |||||||||||||||
| Long-term obligations |
- | 18,304 | 4,276 | 24,390 | 23,191 | |||||||||||||||
| Total liabilities |
105,762 | 27,338 | 18,086 | 26,973 | 26,813 | |||||||||||||||
| Stockholders' equity |
631,827 | 326,909 | 151,455 | 64,417 | 74,227 | |||||||||||||||
Consolidated Statements of Operations
| Year Ended July 31, |
||||||||||||||||||||
| 2023 |
2022 |
2021 |
2020 |
2019 |
||||||||||||||||
| Sales and service revenue |
$ | 164,389 | $ | 23,161 | $ | - | $ | - | $ | - | ||||||||||
| Income (loss) from operations |
8,867 | (22,710 | ) | (17,512 | ) | (14,334 | ) | (14,977 | ) | |||||||||||
| Net income (loss) |
(3,307 | ) | 5,252 | (14,813 | ) | (14,610 | ) | (17,153 | ) | |||||||||||
| Basic income (loss) per share |
(0.01 | ) | 0.02 | (0.07 | ) | (0.08 | ) | (0.10 | ) | |||||||||||
| Diluted income (loss) per share |
(0.01 | ) | 0.02 | (0.07 | ) | (0.08 | ) | (0.10 | ) | |||||||||||
Item 7. Management’s Discussion and Analysis of Financial Condition and Results of Operations
(Expressed in thousands of U.S. dollars, except per share amounts)
The following management’s discussion and analysis of the Company’s financial condition and results of operations contain forward-looking statements that involve risks, uncertainties and assumptions including, among others, statements regarding our capital needs, business plans and expectations. In evaluating these statements, you should consider various factors, including the risks, uncertainties and assumptions set forth in reports and other documents we have filed with or furnished to the SEC and, including, without limitation, this Form 10-K filing for the fiscal year ended July 31, 2023, including the consolidated financial statements and related notes contained herein. These factors, or any one of them, may cause our actual results or actions in the future to differ materially from any forward-looking statement made in this document. Refer to “Cautionary Note Regarding Forward-looking Statements” and Item 1A. Risk Factors herein.
Introduction
The following discussion summarizes the results of operations for each of our fiscal years ended July 31, 2023, 2022 and 2021 and our financial condition as at July 31, 2023 and 2022, with a particular emphasis on Fiscal 2023, our most recently completed fiscal year.
Business
We operate in a single reportable segment and, since 2004, as more fully described under “General Business” of Item 1. Business herein, we have been primarily engaged in uranium mining and related activities, including exploration, pre-extraction, extraction and processing, on uranium projects located in the United States, Canada and the Republic of Paraguay.
We utilize ISR mining for our uranium projects where possible which we believe, when compared to conventional open pit or underground mining, requires lower capital and operating expenditures with a shorter lead time to extraction and a reduced impact on the environment. We have two ISR Mines which utilize ISR mining to extract U3O8, or yellowcake. We have two uranium processing facilities located in the vicinity of our IRS Mines, which process material from our ISR Mines into drums of U3O8 for shipping to a third-party storage and sales facility. At July 31, 2023, we had no uranium supply or off-take agreements in place.
In Texas, our fully-licensed and 100% owned Hobson Processing Facility forms the basis for our regional operating strategy in the State of Texas, specifically the South Texas Uranium Belt where we utilize ISR mining. We utilize a “hub-and-spoke” strategy whereby the Hobson Processing Facility, which has a physical capacity to process uranium-loaded resins up to a total of two million pounds of U3O8 annually and is licensed to process up to one million pounds of U3O8 annually, acts as the central processing site (the “hub”) for our Palangana Mine, and future satellite uranium mining activities, such as our Burke Hollow and Goliad Projects, located within the South Texas Uranium Belt (the “spokes”).
We acquired the fully permitted Reno Creek Project in August 2017 and expanded our operations to the strategic Powder River Basin in Wyoming.
On December 17, 2021, we completed the acquisition of all the issued and outstanding shares of Uranium One Americas, Inc. (now UEC Wyoming Corp.; UEC Wyoming) for total cash consideration of $128,495. The UEC Wyoming portfolio primarily consists of 12 projects located in Wyoming, six of which are located in the Powder River Basin with four fully permitted, and six of which are located in the Great Divide Basin (the “UEC Wyoming Portfolio”). The UEC Wyoming Portfolio also consists of dozens of under-explored, mineralized brownfield projects, backed by detailed databases of historic uranium exploration and development programs, thus greatly enhancing the potential for resource expansion. The U1A Acquisition creates a Wyoming hub-and-spoke operation for UEC, anchored by UEC Wyoming’s Irigaray Processing Facility with a licensed capacity of 2.5 million pounds U3O8 per year. Refer to Note 5: Acquisition of Uranium One Americas, Inc. of the Consolidated Financial Statements for Fiscal 2023.
On June 7, 2022, UEC completed a property swap agreement (the “Property Swap”) with Anfield Energy Inc. (“Anfield”), whereby the Company received Anfield’s portfolio of 25 ISR uranium projects in Wyoming (the “Anfield ISR Projects”) in exchange for UEC’s Slick Rock and Long Park projects located in Colorado. The Anfield ISR Projects increased UEC’s Wyoming land holdings by 50%, adding 55,119 acres of federal mining claims and state mineral leases. The Anfield ISR Projects are comprised of the Charlie Project, located immediately adjacent to UEC’s Christensen Ranch property, along with nine projects in the Powder River Basin, seven projects in the Great Divide Basin, four projects in the Wind River Basin, three projects in the Shirley Basin and one project in the Black Hills.
On August 19, 2022, we completed the acquisition of UEX Corporation (UEX) through a plan of arrangement (the UEX Acquisition). UEX is a Canadian uranium and cobalt exploration and development company involved with a portfolio of uranium projects. UEX’s directly-owned portfolio of projects is located in the eastern, western and northern perimeters of the Athabasca Basin, one of the world’s richest uranium regions. In addition to advancing its uranium development projects through its ownership interest in a joint venture entity, UEX is currently advancing several other uranium deposits in the Athabasca Basin which include the Paul Bay, Ken Pen and Ōrora deposits at the Christie Lake Project, the Kianna, Anne, Colette and 58B deposits at its currently 49.1%-owned Shea Creek Project, the Horseshoe and Raven deposits located on its 100%-owned Horseshoe-Raven Project and the West Bear Uranium Deposit located at its 100%-owned West Bear Project.
On October 14, 2022, we acquired, through UEC Resources (SK) Corp., Roughrider Mineral Holdings Inc., a Saskatchewan corporation and wholly-owned subsidiary of Rio Tinto Fer Et Titane Inc., which, in turn, owns all of the issued and outstanding shares of Roughrider Mineral Assets Inc., also a Saskatchewan corporation, that holds certain mineral leases totaling approximately 598 hectares in northern Saskatchewan that is commonly referred to as the “Roughrider Project” located in the Athabasca Basin in Saskatchewan, Canada.
Subsequent to July 31, 2023, we acquired a portfolio of exploration-stage projects in the Athabasca Basin, Saskatchewan, Canada, for CAD$1.5 million from Rio Tinto Exploration Canada Inc., a subsidiary of Rio Tinto Inc., whereby we acquired a 60% equity stake in the Henday Lake joint venture, 100% of the Milliken project and a 50% equity stake in the Carswell joint venture project. With this transaction, we added an additional 44,444 acres of prospective ground in the Athabasca Basin to our existing portfolio.
We also hold certain mineral rights in various stages in the States of Arizona, New Mexico, Texas and Wyoming, and in Canada and in the Republic of Paraguay, many of which are located in historically successful mining areas and have been the subject of past exploration and pre-extraction activities by other mining companies. We do not expect, however, to utilize ISR mining for all of our mineral rights in which case we would expect to rely on conventional open pit and/or underground mining techniques.
Our operating and strategic framework is based on expanding our uranium extraction activities, which includes advancing certain uranium projects with established mineralized materials towards uranium extraction and establishing additional mineralized materials on our existing uranium projects or through acquisition of additional uranium projects.
Key Issues
Since commencing uranium extraction at our Palangana Mine in November 2010, we have been focused primarily on our South Texas uranium mining activities. Since the completion of the U1A Acquisition in December 2021, we expanded our footprints in Wyoming with our Wyoming hub-and-spoke operations. The acquisition of UEX in August 2022 and the acquisition of Roughrider Mineral Holdings Inc. in October 2022 further expanded our footprint in Canada and, in particular, the Athabasca Basin in Saskatchewan. In the meantime, we continue to establish additional uranium mines through exploration and pre-extraction activities and direct acquisitions in both the U.S. and Paraguay, all of which require us to manage numerous challenges, risks and uncertainties inherent in our business and operations as more fully described in Item 1A. Risk Factors herein.
Our operations are capital intensive, and we will require significant additional financing to continue with our exploration and pre-extraction activities and acquire additional uranium projects. Historically, we have been reliant primarily on equity financings from the sale of our common stock and, for Fiscal 2014 and Fiscal 2013, on debt financing, in order to fund our operations. We have also relied on cash flows generated from our mining activities during Fiscal 2015, Fiscal 2013 and Fiscal 2012 and have relied on cash flows generated from the sales of our purchased uranium inventories under our Physical Uranium Program to fund our operations since Fiscal 2022. However, we have yet to achieve consistent profitability or develop consistent positive cash flow from operations. Our reliance on equity and debt financings is expected to continue for the foreseeable future, and their availability whenever such additional financing is required will be dependent on many factors beyond our control including, but not limited to, the market price of uranium, the continuing public support of nuclear power as a viable source of electricity generation, the volatility in the global financial markets affecting our stock price and the status of the worldwide economy, any one of which may cause significant challenges in our ability to access additional financing, including access to the equity and credit markets. We may also be required to seek other forms of financing, such as asset divestitures or additional joint venture arrangements, to continue advancing our uranium projects which would depend entirely on finding a suitable third party willing to enter into such an arrangement, typically involving an assignment of a percentage interest in the mineral project. However, there is no assurance that we will be successful in securing any form of additional financing when required and on terms favorable to us. Our inability to obtain additional financing would have a negative impact on our operations, including delays, curtailment or abandonment of any one or all of our uranium projects.
We have not established proven or probable reserves through the completion of a “final” or “bankable” feasibility study for any of the mineral projects we operate. We have established the existence of mineralized materials for certain uranium projects, including our ISR Mines. Since we commenced uranium extraction at our ISR Mines without having established proven or probable reserves, there may be greater inherent uncertainty as to whether or not any mineralized material can be economically extracted as originally planned and anticipated.
The Palangana Mine was our sole source to generate sales revenues from the sales of U3O8 during Fiscal 2015, Fiscal 2013 and Fiscal 2012. The economic viability of our mining activities, including the expected duration and profitability of our ISR Mines, of any future satellite ISR mines, such as our Burke Hollow and Goliad Projects, Ludeman, Antelope and Charlie Projects, and of our recently acquired traditional uranium mines in Athabasca Basin in Saskatchewan, Canada, has many risks and uncertainties. These include, but are not limited to: (i) a significant, prolonged decrease in the market price of uranium; (ii) difficulty in marketing and/or selling uranium concentrates; (iii) significantly higher than expected capital costs to construct a mine and/or processing plant; (iv) significantly higher than expected extraction costs; (v) significantly lower than expected uranium extraction; (vi) significant delays, reductions or stoppages of uranium extraction activities; and (vii) the introduction of significantly more stringent regulatory laws and regulations. Our mining activities may change as a result of any one or more of these risks and uncertainties and there is no assurance that any ore body that we extract mineralized materials from will result in achieving and maintaining profitability and developing positive cash flow.
As at July 31, 2023, we had no uranium supply or off-take agreements in place. Future sales of U3O8 are therefore expected to generally occur through the uranium spot market, with any fluctuations in the market price continuing to have a direct impact on our revenues and cash flows.
The table below provides the high/low/average/close for the uranium spot price for each of our last five fiscal years as obtained from UxC:
| Fiscal Year Ended |
High |
Low |
Average |
Close |
||||||||||||
| July 31, 2023 |
$ | 57.75 | $ | 47.75 | $ | 51.27 | $ | 56.25 | ||||||||
| July 31, 2022 |
63.75 | 30.50 | 46.56 | 48.50 | ||||||||||||
| July 31, 2021 |
32.75 | 27.31 | 30.38 | 32.40 | ||||||||||||
| July 31, 2020 |
34.19 | 23.88 | 27.66 | 32.35 | ||||||||||||
| July 31, 2019 |
29.28 | 23.94 | 26.95 | 25.41 | ||||||||||||
Historically, the uranium spot price has been difficult to predict and subject to significant volatility and will continue to be affected by numerous factors beyond our control.
Results of Operations
During Fiscal 2023, we recorded sales and service revenue of $164,389 and realized gross profit of $49,670. For Fiscal 2022, we recorded sales and service revenue of $23,161 and realized gross profit of $7,293. No sales and service revenues were recorded during Fiscal 2021.
We recorded a net loss of $3,307 ($0.01 per share) for Fiscal 2023 and net income of $5,252 ($ 0.02 per share) for Fiscal 2022, while we recorded a net loss of $14,813 ($0.07 per share) for Fiscal 2021. Income (loss) from operations during Fiscal 2023, Fiscal 2022 and Fiscal 2021 was $8,867, $ (22,710) and $(17,512), respectively.
During Fiscal 2023, we continued with our strategic plan for reduced operations at our Palangana Mine, and we continued reduced operations at the Christensen Ranch Mine, to capture residual pounds of U3O8 only. Since the acquisition of UEX and Roughrider Mineral Holdings Inc., we have increased our exploration activities in Canada.
While we remain in a state of operational readiness, uranium extraction expenditures incurred at the Palangana Mine and the Christensen Ranch Mine, which are directly related to regulatory/mine permit compliance, lease maintenance obligations and maintaining a necessary labor force, are being charged to our consolidated statement of operations. As a result, no uranium concentrate was extracted at our ISR Mines and processed at the Hobson and the Irigaray Processing Facilities during Fiscal 2023 and Fiscal 2022.
We established our Physical Uranium Program in Fiscal 2021. As of July 31, 2023, we have 1,695,000 pounds of uranium inventory purchase commitments outstanding for a total purchase price of $72,517. Various deliveries are scheduled to occur from Fiscal 2024 into Fiscal 2026 at a weighted average price of $42.78 per pound of uranium.
During Fiscal 2023, as part of our Physical Uranium Program, we purchased 1,521,000 pounds of uranium concentrates with a total cost of $53.7 million. As of July 31, 2023, the carrying value of our uranium inventories was $5,801 (July 31, 2022: $66,160).
Sales and Service Revenue
During Fiscal 2023, we recorded sales of $163,950 from the sale of uranium concentrate inventory, which increased by $141,004 or 614.5% compared to Fiscal 2022. In addition, we recorded revenue from toll processing services of $439 in Fiscal 2023, increased by $224 compared to Fiscal 2022, which was generated from processing uranium resins according to a toll processing agreement resulting from the U1A Acquisition. As a result, we realized gross profit of $49,670, representing a gross profit margin of 30.2% in Fiscal 2023, an increase of $42,377 from Fiscal 2022. No sales and service revenues were recorded during Fiscal 2021.
The table below provides a breakdown of sales and service revenue and cost of sales and services:
| Year Ended July 31, |
||||||||||||
| 2023 |
2022 |
2021 |
||||||||||
| Sales of purchased uranium inventory |
$ | 163,950 | $ | 22,946 | $ | - | ||||||
| Revenue from toll processing services |
439 | 215 | - | |||||||||
| Total sales and service revenue |
$ | 164,389 | $ | 23,161 | $ | - | ||||||
| Cost of purchased uranium inventory |
$ | (114,353 | ) | $ | (15,689 | ) | $ | - | ||||
| Cost of toll processing services |
(366 | ) | (179 | ) | - | |||||||
| Total cost of sales and services |
$ | (114,719 | ) | $ | (15,868 | ) | $ | - | ||||
Operating Costs
Mineral Property Expenditures
Mineral property expenditures consisted of expenditures relating to permitting, property maintenance, exploration and pre-extraction activities and all other non-extraction related activities on our mineral projects.
The following table provides the nature of mineral property expenditures during the past three fiscal years:
| Year Ended July 31, |
||||||||||||
| 2023 |
2022 |
2021 |
||||||||||
| Permitting and compliance |
$ | 396 | $ | 676 | $ | 203 | ||||||
| Property maintenance |
3,608 | 2,635 | 1,493 | |||||||||
| Exploration |
9,308 | 2,582 | 1,751 | |||||||||
| Development |
1,749 | 1,995 | 108 | |||||||||
| Production readiness |
3,559 | 2,266 | 924 | |||||||||
| Total |
$ | 18,620 | $ | 10,154 | $ | 4,479 | ||||||
During Fiscal 2023, the exploration expenditures, such as drilling and preliminary economic assessments, were primarily spent on the following projects:
| ● |
Buke Hollow Project: $3,107 (Fiscal 2022: $1,105, Fiscal 2021: $1,025); |
| ● |
Christie Lake Project: $3,105 (Fiscal 2022: $nil, Fiscal 2021: $nil); and |
| ● |
Roughrider Project: $1,287 (Fiscal 2022: $nil, Fiscal 2021: $nil). |
During Fiscal 2023, the production readiness expenditures were primarily spent on the following projects:
| ● |
Palangana Mine: $905 (Fiscal 2022: $505, Fiscal 2021: $609); and |
| ● |
Christensen Ranch Mine: $1,799 (Fiscal 2022: $225, Fiscal 2021: $nil). |
During Fiscal 2023, the property maintenance expenditures were primarily spent on the following projects:
| ● |
Buke Hollow Project: $703 (Fiscal 2022: $313, Fiscal 2021: $21); |
| ● |
Reno Creek Project: $391 (Fiscal 2022: $409, Fiscal 2021: $91); |
| ● |
Christensen Ranch Mine: $323 (Fiscal 2022: $109, Fiscal 2021: $nil); |
| ● |
Ludeman Project: $328 (Fiscal 2022: $122, Fiscal 2021: $nil); and |
| ● |
Allemand Ross Project: $372 (Fiscal 2022: $139, Fiscal 2021: $nil). |
General and Administrative
During Fiscal 2023, general and administrative (“G&A”) expenses totaled $20,064, compared to $15,026 in Fiscal 2022 and $12,640 in Fiscal 2021. G&A expenses were comprised of the following:
| Year Ended July 31, |
||||||||||||
| 2023 |
2022 |
2021 |
||||||||||
| Salaries and management fees |
$ | 5,168 | $ | 4,281 | $ | 2,417 | ||||||
| Office, IR, communication, insurance and travel |
6,801 | 4,501 | 3,765 | |||||||||
| Foreign exchange loss |
71 | 317 | 95 | |||||||||
| Professional fees |
2,609 | 1,387 | 952 | |||||||||
| Sub-total |
14,649 | 10,486 | 7,229 | |||||||||
| Stock-based compensation |
5,415 | 4,540 | 5,411 | |||||||||
| Total general and administrative expenses |
$ | 20,064 | $ | 15,026 | $ | 12,640 | ||||||
The following summary provides a discussion of the major expense categories, including analyses of factors that caused significant variances from year-to-year:
| ● |
during Fiscal 2023, salaries, wages and management fees totaled $5,168, compared to $4,281 during Fiscal 2022, which was primarily the result of the corporate-wide salary increases to adjust for inflation, payment of short-term incentive cash bonuses for executive officers, employee and consultants as well as additional salary expenses due to the acquisition of U1A in December 2021 and the acquisition of UEX in August 2022. The increase in salaries and managements fee in Fiscal 2022 from Fiscal 2021 was primarily due to the corporate-wide salary increase and the acquisition of U1A. |
| ● |
during Fiscal 2023, office, filing and listing fees, insurance, corporate development, investor relations and travel expenses totaled $6,801, compared to $4,501 during Fiscal 2022, which was primarily the result of increases in expenses for expansion of our Wyoming’s and UEX's operations. During Fiscal 2022, office, filing and listing fees, insurance, corporate development, investor relations and travel expenses totaled $4,501, compared to $3,765 during Fiscal 2021, which was primarily the result of increases in expenses for office, administration and insurance, and expansion of our Wyoming’s operations. |
| ● |
professional fees are comprised primarily of legal services related to transactional activities, regulatory compliance and for audit, accounting and tax compliance services. During Fiscal 2023, professional fees totaled $2,609, compared to $1,387 in Fiscal 2022. During Fiscal 2022, professional fees totaled $1,387, compared to $952 during Fiscal 2021. The overall increasing trend in professional fees is due to the growth in business activities and the expansion of our operations; and |
| ● |
stock-based compensation includes the fair value of stock options granted to optionees and the fair value of shares of the Company issued to directors, officers, employees and consultants of the Company under our Stock Incentive Plan. In recent years, we have utilized equity-based payments to our directors, officers, employees and consultants as part of our continuing efforts to reduce cash outlays. Stock-based compensation expense totaled $5,415, compared to $4,540 during Fiscal 2022. The stock-based compensation varied from year to year primarily as a result of changes in the amount of compensation shares and stock award expenses which were amortized on an accelerating basis, resulting in more expenses being recorded at the beginning of the vesting period than at the end. |
Acquisition-related Costs
During Fiscal 2023, the acquisition-related costs of UEX and Roughrider Project were capitalized in the consolidated balance sheets as both the UEX and Roughrider Project acquisitions were accounted for as assets acquisition under US GAAP. During Fiscal 2022, we incurred acquisition-related costs of $3,444 in the statement of operations in connection with the U1A Acquisition, as it was accounted for as a business combination.
Depreciation, Amortization and Accretion
During Fiscal 2023, depreciation, amortization and accretion totaled $2,007, which increased by $628 compared to $1,379 during Fiscal 2022, primarily due to a full-year depreciation of our plant and equipment acquired from the U1A Acquisition compared to 7 months of depreciation in Fiscal 2022. During Fiscal 2022, depreciation, amortization and accretion totaled $393. Depreciation, amortization and accretion includes depreciation and amortization of long-term assets acquired in the normal course of operations and accretion of asset retirement obligations.
Other Income and Expenses
Interest and Finance Costs
Interest and finance costs were comprised of the following:
| Year Ended July 31, |
||||||||||||
| 2023 |
2022 |
2021 |
||||||||||
| Interest paid on long-term debt |
$ | - | $ | 409 | $ | 1,255 | ||||||
| Amortization of debt discount |
- | 525 | 1,376 | |||||||||
| Surety bond premium |
760 | 539 | 187 | |||||||||
| Other |
45 | 46 | 62 | |||||||||
| Total |
$ | 805 | $ | 1,519 | $ | 2,880 | ||||||
During Fiscal 2023 the decrease in interest on long-term debt and amortization of debt discount resulted from the decrease in the outstanding principal amount of our long-term debt to $Nil as at January 31, 2022, from $10,000 as at July 31, 2021, and from $20,000 as at July 31, 2020 due to the principal repayments we made. The increase in surety bond premiums in Fiscal 2022 resulted from the surety bonds assumed as a result of the U1A Acquisition.
Income from Equity-Accounted Investment
During Fiscal 2023, Fiscal 2022 and Fiscal 2021, income from the equity-accounted investment comprised of the following:
| Year Ended July 31, |
||||||||||||
| 2023 |
2022 |
2021 |
||||||||||
| Share of income (loss) |
$ | (1,648 | ) | $ | 153 | $ | 732 | |||||
| Gain on dilution of ownership interest |
654 | 3,973 | 4,473 | |||||||||
| Total |
$ | (994 | ) | $ | 4,126 | $ | 5,205 | |||||
During Fiscal 2023, Fiscal 2022 and Fiscal 2021, we recorded a gain on dilution of ownership interest in Uranium Royalty Corp. (“URC”) of $654, $3,973 and $4,473, respectively, as a result of URC issuing more shares from its equity financings, which decreased our ownership interest in URC to 14.9% at July 31, 2023, from 15.5% at July 31, 2022 and from 18.1% at July 31, 2021.
During Fiscal 2023, Fiscal 2022 and Fiscal 2021, we recorded a share of URC’s income of $414, $153 and $732, respectively. During Fiscal 2023, we also recorded a share of JCU (Canada) Exploration Company Limited (“JCU”)'s loss of $2,062 since the acquisition of UEX which owns 50% of JCU.
Debt Receivable Recovery and Gain on Settlement of Debt Receivable
In connection with the U1A Acquisition, we acquired certain indebtedness totaling $18,342 due from Anfield, which was owed to U1A prior to the closing of the U1A Acquisition (the “Anfield Debt”). We assigned a value of $Nil to the Anfield Debt net of the expected credit loss on the preliminary purchase price allocation given that the probability of the Anfield Debt being collectable was remote at December 17, 2021.
On April 19, 2022, we entered into a debt settlement agreement (the “Settlement Agreement”) and a property swap agreement (the “Swap Agreement”; and together with the Settlement Agreement, the “Anfield Agreements”) with Anfield to settle the Anfield Debt. Pursuant to the Anfield Agreements, the Anfield Debt was settled by the payment by Anfield to UEC of $9,171 in cash and the issuance by Anfield to UEC in units of Anfield (each, an “Anfield Unit”) with a deemed value of $9,171, with each such Anfield Unit being comprised of one common share in the capital of Anfield (each, an “Anfield Common Share”) and one Anfield Common Share purchase warrant (each whole such warrant being an “Anfield Warrant”). Each Anfield Warrant entitles UEC to acquire one Anfield Common Share at a price of CAD$0.18 until May 12, 2027 (collectively, the “Anfield Debt Settlement”). Completion of the Anfield Agreements was contingent on Anfield raising additional financing.
On June 7, 2022, we closed the Anfield Debt Settlement whereby we received $9,171 in cash and Anfield Units, being comprised of 96,272,918 Anfield Common Shares with a fair value of $7,702 and 96,272,918 Anfield Warrants with a fair value of $3,249.
Consequently, we reversed the entire expected credit loss on the debt receivable and recognized a recovery on debt receivable of $18,342 on our consolidated statements of operations and comprehensive income in Fiscal 2022. The fair value of the cash and the Anfield Common Shares and Anfield Warrants totaled $20,122, which exceeded the amounts of $18,342 previously written off at the date of U1A Acquisition by $1,780, resulting in a gain on settlement of the Anfield Debt receivable on our consolidated statements of operations and comprehensive income.
Gain on Disposition of Assets
Consequently, we reversed the entire expected credit loss on the debt receivable and recognized a recovery on debt receivable of $18,342 on our consolidated statements of operations and comprehensive income in Fiscal 2022. The fair value of the cash and the Anfield Common Shares and Anfield Warrants totaled $20,122, which exceeded the amounts of $18,342 previously written off at the date of U1A Acquisition by $1,780, resulting in a gain on settlement of the Anfield Debt receivable on our consolidated statements of operations and comprehensive income.
Fair value loss on Equity Securities
As at July 31, 2023, our investments in certain equity securities are re-evaluated using the market values at period end, which resulted in fair value loss totaling $13,083 compared to fair value loss of $1,898 in Fiscal 2022. Refer to Note 17: Fair Value Loss on Equity Securities contained herein.
Liquidity and Capital Resources
| July 31, 2023 |
July 31, 2022 |
|||||||
| Cash and cash equivalents |
$ | 45,614 | $ | 32,536 | ||||
| Current assets |
55,205 | 102,191 | ||||||
| Current liabilities |
12,194 | 8,498 | ||||||
| Working capital |
43,011 | 93,693 | ||||||
During Fiscal 2023, we received net proceeds of $66,527 from equity financing, and exercises of stock options and share purchase warrants. As at July 31, 2023, we had a working capital of $43,011.
Subsequent to July 31, 2023, we received additional cash proceeds of $36,217 under our ATM Offering (as described herein).
We have a history of operating losses resulting in an accumulated deficit balance since inception. Although we recorded net income in Fiscal 2022, we recorded net losses in Fiscal 2023 and all prior years, and we had an accumulated deficit balance of $289,680 as at July 31, 2023. During Fiscal 2023, net cash provided by operating activities totaled $72,573, but we recorded negative operating cash flow in prior years. Furthermore, we may not achieve and maintain profitability or develop positive cash flow from our operations in the near term.
Historically, we have been reliant primarily on equity financings from the sale of our common stock and on debt financing in order to fund our operations. We have yet to achieve consistent profitability or develop consistent positive cash flow from operations. Currently, we also rely on cash flows generated from the sales of our purchased uranium concentrates to fund our operations. Our reliance on equity and debt financings is expected to continue for the foreseeable future, and their availability whenever such additional financing is required will be dependent on many factors beyond our control and including, but not limited to, the market price of uranium, the continuing public support of nuclear power as a viable source of electricity generation, the volatility in the global financial markets affecting our stock price and the status of the worldwide economy, any one of which may cause significant challenges in our ability to access additional financing, including access to the equity and credit markets. We may also be required to seek other forms of financing, such as asset divestitures or joint venture arrangements, to continue advancing our uranium projects which would depend entirely on finding a suitable third party willing to enter into such an arrangement, typically involving an assignment of a percentage interest in the mineral project. However, there is no assurance that we will be successful in securing any form of additional financing when required and on terms favorable to us.
Our operations are capital intensive and future capital expenditures are expected to be substantial. We will require significant additional financing to fund our operations, including continuing with our exploration and pre-extraction activities and acquiring additional uranium projects. In the absence of such additional financing, we would not be able to fund our operations, including continuing with our exploration and pre-extraction activities, which may result in delays, curtailment or abandonment of any one or all of our uranium projects.
We hold mineral rights in the States of Arizona, New Mexico, Texas and Wyoming, in Canada and in the Republic of Paraguay, with annual land-related payments totaling $5.8 million to maintain these rights in good standing.
Our anticipated operations, including exploration and pre-extraction activities, however, will be dependent on and may change as a result of our financial position, the market price of uranium and other considerations, and such change may include accelerating the pace or broadening the scope of reducing our operations. Our ability to secure adequate funding for these activities will be impacted by our operating performance, other uses of cash, the market price of uranium, the market price of our common stock and other factors which may be beyond our control. Specific examples of such factors include, but are not limited to:
| ● |
if the market price of uranium weakens; |
| ● |
if the market price of our common stock weakens; and |
| ● |
if a nuclear incident, such as the event that occurred in Japan in March 2011, were to occur, continuing public support of nuclear power as a viable source of electricity generation may be adversely affected, which may result in significant and adverse effects on both the nuclear and uranium industries. |
We believe our existing cash resources and, if necessary, cash generated from the sale of the Company’s liquid assets, will provide sufficient funds to carry out our planned operations for 12 months from the date that this Annual Report is issued. Our continuation as a going concern for a period beyond those 12 months will be dependent upon our ability to generate cash flow from the sales of our uranium inventories under our Physical Uranium Program and to obtain adequate additional financing, as our operations are capital intensive and future capital expenditures are expected to be substantial.
Our long-term success, including the recoverability of the carrying values of our assets and our ability to acquire additional uranium projects and continue with exploration and pre-extraction activities and mining activities on our existing uranium projects, will depend ultimately on our ability to achieve and maintain profitability and positive cash flow from our operations by establishing ore bodies that contain commercially recoverable uranium and to develop these into profitable mining activities.
Equity Financings
On May 17, 2021, we filed a Form S-3 shelf registration statement under the Securities Act which was declared effective by the SEC on June 1, 2021, providing for the public offer and sale of certain securities of the Company from time to time, at our discretion, of up to an aggregate offering amount of $200 million (the “2021 Shelf”), which included an at-the-market offering agreement prospectus (the “May 2021 ATM Offering”) covering the offering, issuance and sale of up to a maximum offering of $100 million as part of the $200 million under the 2021 Shelf.
On May 14, 2021, we entered into an at-the-market offering agreement (the “2021 ATM Offering Agreement”) with H.C. Wainwright & Co., LLC and certain co-managers (collectively, the “2021 ATM Managers”) as set forth in the 2021 ATM Offering Agreement under which we may, from time to time, sell shares of our common stock having an aggregate offering price of up to $100 million through the 2021 ATM Managers selected by us.
On November 26, 2021, we filed a prospectus supplement to our 2021 Shelf with respect to the continuation of the May 2021 ATM Offering Agreement with the 2021 ATM Managers under which we may, if eligible, from time to time, sell shares of our common stock having an aggregate offering price of up to an additional $100 million for a total of $200 million through the 2021 ATM Managers selected by us (the “November 2021 ATM Offering”; and, collectively with the May 2021 ATM Offering, the “2021 ATM Offering”).
On November 16, 2022, we filed a Form S-3 automatic shelf registration statement under the Securities Act, which became effective upon filing, providing for the public offer and sale of certain securities of the Company from time to time, at our discretion, of an undetermined dollar value of common stock, debt securities, warrants to purchase common stock or debt securities, subscription receipts for and units which include common stock, debt securities, warrants or any combination thereof (the “2022 Shelf”), which included an at-the-market offering agreement prospectus (the “2022 ATM Offering”; and, collectively, with the 2021 ATM Offering, the “ATM Offerings”) covering the offering, issuance and sale of up to a maximum offering of $300 million under the 2022 Shelf.
On November 16, 2022, we entered into an at-the-market offering agreement (the “2022 ATM Offering Agreement”) with H.C. Wainwright & Co., LLC and certain co-managers (collectively, the “2022 ATM Managers”) as set forth in the 2022 ATM Offering Agreement under which we may, from time to time, sell shares of our common stock having an aggregate offering price of up to $300 million through the 2022 ATM Managers selected by us.
Credit Facility
On December 5, 2018, we entered into the Third Amended and Restated Credit Agreement to our credit facility (the “Credit Facility”) with our lenders (each, a “Lender”), whereby we and the Lenders agreed to certain further amendments to our Credit Facility, under which initial funding of $10,000 was received by the Company upon closing of the Credit Facility on July 30, 2013, and additional funding of $10,000 was received by the Company upon closing of the amended Credit Facility on March 13, 2014.
The Third Credit Amended and Restated Agreement superseded, in their entirety, the Company’s prior Second Amended and Restated Credit Agreement, dated and effective February 9, 2016, the Amended and Restated Credit Agreement, dated and effective March 13, 2014, and the Credit Agreement dated and effective July 30, 2013, with our Lenders.
Pursuant to the terms of the Third Amended and Restated Credit Agreement, during Fiscal 2022, we issued 161,594 shares with a fair value of $600, and during Fiscal 2021, we issued an aggregate of 1,249,039 shares to our Lender, with a fair value of $1,170, as payment of anniversary fees to our Lender.
During Fiscal 2021, we made voluntary payments totaling $10,000 to certain Lenders, and during Fiscal 2022, we made payment of $10,000 to the remaining Lender, which decreased the principal balance outstanding to $Nil as at July 31, 2022 and 2023 under the Credit Facility.
Operating Activities
During Fiscal 2023, we recorded net cash provided by operating activities totaled $72,573. The positive cash flow was primarily driven by the gross profit of $49,670, decrease in our inventory balance of $60,363, and was partially offset by operating expenditures such as mineral property expenditures and general and administrative expenses. During Fiscal 2022 and Fiscal 2021, net cash used in operating activities totaled $52,987 and $41,470, respectively, of which $37,206 and $28,961, respectively, was for purchases of uranium concentrates.
Financing Activities
During Fiscal 2023, net cash provided from financing activities totaled $65,417, primarily from net cash of $66,527 from our ATM Offerings and the exercises of stock options and share purchase warrants, offset by payments of $1,044 for tax withholding amounts related to the issuance of RSU and PRSU shares.
During Fiscal 2022 net cash provided from financing activities totaled $157,266, primarily from net cash of $163,755 from the 2021 ATM Offerings and $4,259 from the exercises of stock options and share purchase warrants, offset by the payments of $557 for tax withholding amounts related to the issuance of RSU and PRSU shares, the principal payment of $10,000 to our remaining Lender under the Credit Facility and $191 for a promissory note.
During Fiscal 2021, net cash provided by financing activities totaled $84,458, primarily from net cash of $89,932 from various offerings, and $5,504 from the exercises of stock options and share purchase warrants, offset by the payments of $833 for tax withholding amounts related to the issuance of RSU shares, the principal payment of $10,000 to certain Lenders under the Credit Facility and $145 for a promissory note and a government loan.
Investing Activities
During Fiscal 2023, net cash used for investing activities totaled $124,780, comprised of net cash used for the acquisition of Roughrider of $82,117, cash used for investment in equity securities of $42,602, capital contribution to JCU of $1,415, cash used for investment in mineral rights and properties of $101 and cash used for the purchase of property, plant and equipment of $555, offset by cash received as a resulting of the acquisition of UEX of $1,984 and $26 from the disposition of assets.
During Fiscal 2022, net cash used for investing activities totaled $110,843, comprised of net cash used in the U1A Acquisition of $113,588, cash used in investment in equity securities of $15,215, cash used for investment in mineral rights and properties of $590 and cash used for the purchase of property, plant and equipment of $620, offset by cash proceeds of $9,980 from sales of equity securities, $9,171 from recovery of the Anfield Debt receivable and $19 from the disposition of assets.
During Fiscal 2021, net cash used for investing activities totaled $3,625, primarily for cash used in investment in term deposits of $10,000, cash used in the acquisition of URC shares of $3,397, cash used in the investment in mineral rights and properties of $80 and cash used for the purchase of property, plant and equipment of $148, offset by cash received from the redemption of term deposits of $10,000.
Stock Options and Warrants
As at July 31, 2023, the Company had 8,326,983 stock options outstanding at a weighted-average exercise price of $ 1.92 per share, and 3,857,030 share purchase warrants outstanding at a weighted-average exercise price of $3.31 per share. As at July 31, 2023, the Company had 7,150,361 in-the-money stock options outstanding at a weighted-average exercise price of $1.58 per share and 3,675,212 in-the-money share purchase warrants outstanding at a weighted-average exercise price of $3.27 per share. As at July 31, 2023, outstanding in-the-money stock options and share purchase warrants represented a total of 10,825,573 shares issuable for gross proceeds of approximately $23.3 million should the stock options and share purchase warrants exercised in full. The exercise of these stock options and share purchase warrants is at the discretion of the respective holders and, accordingly, there is no assurance that any of these stock options or share purchase warrants will be exercised in the future.
Plan of Operations
For Fiscal 2024, uranium extraction at PAA-1, 2 and 3 of our Palangana Mine and at the Christensen Ranch Mine is expected to continue being operated at a reduced pace, including the deferral of major pre-extraction expenditures, and to remain in a state of operational readiness in anticipation of a sustained recovery of uranium prices. In addition, we will continue the drilling program at our Burke Hollow Project and our recently acquired Roughrider Project, as well as carry out additional exploration activities as required on our remaining portfolio.
Material Commitments
As at July 31, 2023, significant payment obligations of the Company over the next five years and beyond are as follows:
| Payment Due by Period |
||||||||||||||||||||
| Contractual Obligations |
Total |
Less Than 1 Year |
1-3 Years |
3-5 Years |
More Than 5 Years |
|||||||||||||||
| Asset Retirement Obligations |
$ | 29,064 | $ | 1,515 | $ | 3,962 | $ | 4,498 | $ | 19,089 | ||||||||||
| Operating Lease Obligations |
1,407 | $ | 124 | $ | 184 | $ | 195 | $ | 904 | |||||||||||
| Uranium Inventory Purchase Obligations |
72,517 | $ | 45,777 | $ | 26,740 | $ | - | $ | - | |||||||||||
| Total |
$ | 102,988 | $ | 47,416 | $ | 30,886 | $ | 4,693 | $ | 19,993 | ||||||||||
As at July 31, 2023, we were renting or leasing office premises in Texas, Arizona and Wyoming, U.S., Vancouver, British Columbia, Canada, and Paraguay for total monthly payments of $37. Office lease agreements for the U.S. and Canada expire between September 2023 and November 2028.
Commitments for Management Services
As at July 31, 2023, we have committed to pay our key executives a total of $1,065 per year for management services for Fiscal 2024.
Off-Balance Sheet Arrangements
We do not have any off-balance sheet arrangements that have or are reasonably likely to have a current or future material effect on our financial condition, changes in financial condition, revenues or expenses, results of operations, liquidity, capital expenditures or capital resources.
Critical Accounting Policies
For a complete summary of all of our significant accounting policies, refer to Note 2: Summary of Significant Accounting Policies of the Notes to the Consolidated Financial Statements as presented under Item 8. Financial Statements and Supplementary Data herein.
The preparation of financial statements in conformity with U.S. GAAP requires management to make judgements, estimates and assumptions that affect the reported amount of assets and liabilities and disclosure of contingent assets and liabilities at the date of the financial statements and the reported revenues and expenses during the reported periods. Areas requiring significant judgements, estimates and assumptions include the valuation of acquired mineral rights and properties, existence of impairment indicators for the Company’s long-lived assets, valuation and measurement of impairment losses on mineral rights and properties, valuation of recoverability of a credit loss, valuation of stock-based compensation and valuation of asset retirement obligations. Other areas requiring estimates include allocations of expenditures to inventories, depletion and amortization of mineral rights and properties and depreciation of property, plant and equipment. Actual results could differ significantly from those estimates and assumptions. The following summary provides a description of our critical accounting policies.
Mineral Rights and Exploration Stage
Acquisition costs of mineral rights are initially capitalized as incurred while exploration and pre-extraction expenditures are expensed as incurred until such time proven or probable reserves are established for that project.
We have established the existence of mineralized materials for certain uranium projects, including our ISR Mines. However, we have not established proven or probable reserves for any of the uranium projects we operate, including our ISR Mines. Furthermore, we have no plans to establish proven or probable reserves for any of our uranium projects for which we plan on utilizing ISR mining. As a result, and despite the fact that we commenced extraction of mineralized materials at our ISR Mines, we remain in the Exploration Stage and will continue to remain in the Exploration Stage until such time proven or probable reserves have been established.
Companies in the Production Stage that have established proven and probable reserves and exited the Exploration Stage, typically capitalize expenditures relating to ongoing development activities, with corresponding depletion calculated over proven and probable reserves using the units-of-production method and allocated to future reporting periods to inventory and, as that inventory is sold, to cost of goods sold. Since we are in the Exploration Stage, it has resulted in our reporting of lower income or larger losses than if we had been in the Production Stage due to the expensing, instead of capitalization, of expenditures relating to ongoing mine development activities. Additionally, there would be no corresponding amortization allocated to our future reporting periods since those costs would have been expensed previously, resulting in both lower inventory costs and cost of goods sold and results of operations with higher gross profits and lower losses than if we had been in the Production Stage. Any capitalized costs, such as expenditures relating to the acquisition of mineral rights, are depleted over the estimated extraction life using the straight-line method. As a result, our consolidated financial statements may not be directly comparable to the financial statements of companies in the Production Stage.
Business Combination and Asset Acquisition
When an acquisition does not meet the definition of a business combination, as the acquired entity does not have an input and a substantive process that together significantly contribute to the ability to create outputs, we account for the acquisition as an asset acquisition. In an asset acquisition, any direct acquisition-related transaction costs are capitalized as part of the purchase consideration. Deferred taxes are recorded on temporary book/tax differences in an asset acquisition using the simultaneous equations method and adjusted the assigned value of the non-monetary assets acquired to include the deferred tax liability
When an acquisition is accounted for as a business combination, we recognize and measure the assets acquired and liabilities assumed based on their estimated fair values at the acquisition date, while transaction costs related to business combinations are expensed as incurred. An income, market or cost valuation method may be utilized to estimate the fair value of the assets acquired and liabilities assumed, if any, in a business combination. The income valuation method represents the present value of future cash flows over the life of the asset using: (i) discrete financial forecasts, which rely on management’s estimates of resource quantities and exploration potential, costs to produce and develop resources, revenues and operating expenses; (ii) appropriate discount rates; and (iii) expected future capital requirements (the “income valuation method”). The market valuation method uses prices paid for a similar asset by other purchasers in the market, normalized for any differences between the assets (the “market valuation method”). The cost valuation method is based on the replacement cost of a comparable asset at the time of the acquisition adjusted for depreciation and economic and functional obsolescence of the asset (the “cost valuation method”). If the initial accounting for the business combination is incomplete by the end of the reporting period in which the acquisition occurs, an estimate will be recorded. Subsequent to the acquisition date, and not later than one year from the acquisition date, we will record any material adjustments to the initial estimate based on new information obtained that would have existed as of the date of the acquisition. Any adjustment that arises from information obtained that did not exist as of the date of the acquisition will be recorded in the period the adjustments arises.
Equity Investments
Investments in an entity in which our ownership is greater than 20% but less than 50%, a 50/50 joint venture which the Company does not have control, or an entity where other facts and circumstances indicate that we have the ability to exercise significant influence over its operating and financing policies, are accounted for using the equity method in accordance with ASC 323: Investments – Equity Method and Joint Ventures. Equity-accounted investments are recorded initially at cost and adjusted subsequently to recognize our share of the earnings, losses or other changes in capital of the investee entity after the date of acquisition. We periodically evaluate whether declines in fair values of our equity investments below the carrying value are other-than-temporary and, if so, whether an impairment loss is required.
Additionally, we hold certain equity investments in entities that we do not have the ability to exercise significant influence. These equity investments represent our ownership interests in certain entities, and therefore meet the definition of an equity security under ASC 321 Investments – Equity Securities and are measured at fair value at each period end, with unrealized holding gains or losses recorded to earnings.
Impairment of Long-lived Assets
Long-lived assets including mineral rights and property, plant and equipment are reviewed for impairment whenever events or changes in circumstances indicate the carrying amount of an asset or asset group may not be recoverable. Management applies judgment to assess whenever events or changes in circumstances indicate the carrying amount of an asset or asset group may not be recoverable giving rise to the requirement to conduct an impairment test. Circumstances which could trigger an impairment test include, but are not limited to: (i) significant decreases in the market price of the asset; (ii) significant adverse changes in the business climate or legal factors including significant decreases in uranium prices; (iii) significant increase in reclamation costs and accumulation of costs significantly in excess of the amount originally expected for the acquisition or construction of the asset; (iv) current period cash flow or operating losses combined with a history of losses or a forecast of continuing losses associated with the use of the asset; and (v) current expectation that the asset will more likely than not be sold or disposed of significantly before the end of its estimated useful life. Recoverability of these assets is measured by comparing the carrying value to the future undiscounted cash flows expected to be generated by the assets. When the carrying value of an asset exceeds the related undiscounted cash flows, an impairment loss is recorded by writing down the carrying value of the related asset to its estimated fair value, which is determined using discounted future cash flows or other measures of fair value.
Restoration and Remediation Costs (Asset Retirement Obligations)
Various federal and state mining laws and regulations require our Company to reclaim the surface areas and restore underground water quality to the pre-existing quality or class of use after the completion of mining. We recognize the present value of the future restoration and remediation costs as an asset retirement obligation (each, an “ARO”) in the period in which we incur an obligation associated with the retirement of tangible long-lived assets that result from the acquisition, construction, development and/or normal use of the assets.
AROs consist of estimated final well closure, plant and equipment decommissioning and removal and environmental remediation costs to be incurred by our Company in the future. The AROs are estimated based on the current costs escalated at an inflation rate and discounted at a credit adjusted risk-free rate. The AROs are capitalized as part of the costs of the underlying assets and amortized over its remaining useful life. The AROs are accreted to an undiscounted value until they are settled. The accretion expenses are charged to earnings and the actual retirement costs are recorded against the AROs when incurred. Any difference between the recorded AROs and the actual retirement costs incurred will be recorded as a gain or loss in the period of settlement.
Stock-based Compensation
We measure stock-based awards at fair value on the date of the grant and expense the awards in our Consolidated Statements of Operations and Comprehensive Loss over the requisite service period of employees or consultants. The fair value of stock options is determined using the Black-Scholes Valuation Model. The fair value of RSUs is determined using the share price of the Company at the date of grant. The fair value of PRSUs is determined using a Monte Carlo Simulation Model. Stock-based compensation expense related to stock awards is recognized over the requisite service period on a graded vesting basis. Forfeitures are accounted for as they occur.
Subsequent Events
On August 22, 2023, we acquired a portfolio of exploration-stage projects in the Athabasca Basin, Saskatchewan, Canada, which includes 60% equity stake in the Henday Lake joint venture, 100% of the Milliken project and a 50% equity stake in the Carswell joint venture project from Rio Tinto Exploration Canada Inc. for approximately $1.1 million (CAD$1.5 million).
Item 7A. Quantitative and Qualitative Disclosures About Market Risk
Our exposure to market risks includes, but is not limited to, equity price risk, uranium price risk, foreign currency risk, country risk and interest rate risk.
Equity Price Risk
We are subject to market risk related to the market price of our common stock which trades on the NYSE American. Historically, we have relied upon equity financings from the sale of our common stock to fund our operations. Movements in the price of our common stock have been volatile in the past and may continue to be volatile in the future. As a result, there is a risk that we may not be able to complete an equity financing at an acceptable price when required.
Uranium Price Risk
We are subject to market risk related to the market price of uranium. As at July 31, 2023, we had no uranium supply or off-take agreements in place. Since future sales of uranium concentrates are expected to generally occur through the uranium spot market, fluctuations in the market price of uranium would have a direct impact on our revenues, results of operations and cash flows. We do not use derivative financial instruments for speculative trading purposes, nor do we hedge our uranium price exposure to manage our uranium price risk.
Foreign Currency Risk
We are subject to market risk related to foreign currency exchange rate fluctuations. Our functional currency is the United States dollar, however, a portion of our business is transacted in other currencies including the Canadian dollar and the Paraguayan Guarani. To date, these fluctuations have not had a material impact on our results of operations.
We do not use derivative financial instruments for speculative trading purposes, nor do we hedge our foreign currency exposure to manage our foreign currency fluctuation risk.
Country Risk
We are subject to market risk related to our operations in foreign jurisdictions. We hold two significant uranium projects and one significant titanium project in Paraguay. Operations in foreign jurisdictions outside of the U.S. and Canada, especially in developing countries, may be subject to additional risks as they may have different political, regulatory, taxation, economic and cultural environments that may adversely affect the value or continued viability of our rights.
Item 8. Financial Statements and Supplementary Data
Financial Statements
The consolidated financial statements and related information as listed below for the fiscal year ended July 31, 2023, are included in this Annual Report beginning on page F-1:
| ● |
Reports of Independent Registered Public Accounting Firm (PCAOB ID 271); |
| ● |
Consolidated Balance Sheets; |
| ● |
Consolidated Statements of Operations and Comprehensive Income (Loss); |
| ● |
Consolidated Statements of Cash Flows; |
| ● |
Consolidated Statements of Stockholders’ Equity; and |
| ● |
Notes to the Consolidated Financial Statements. |
Supplementary Financial Information
The selected unaudited financial data for each of the quarters for the two most recent fiscal years are presented below:
| For the Quarters Ended |
||||||||||||||||
| July 31, 2023 |
April 30, 2023 |
January 31, 2023 |
October 31, 2022 |
|||||||||||||
| Sales and service revenue |
$ | 38,949 | $ | 20,217 | $ | 47,931 | $ | 57,292 | ||||||||
| Gross profit |
15,023 | 6,219 | 14,570 | 13,858 | ||||||||||||
| Net income (loss) |
517 | (10,960 | ) | 10,892 | (3,756 | ) | ||||||||||
| Total comprehensive income (loss) |
6,835 | (14,549 | ) | 15,509 | (14,524 | ) | ||||||||||
| Basic and diluted income (loss) per share |
0.00 | (0.03 | ) | 0.03 | (0.01 | ) | ||||||||||
| Total assets |
737,589 | 722,148 | 733,315 | 695,487 | ||||||||||||
| For the Quarters Ended |
||||||||||||||||
| July 31, 2022 |
April 30, 2022 |
January 31, 2022 |
October 31, 2021 |
|||||||||||||
| Sales and service revenue |
$ | 78 | $ | 9,892 | $ | 13,191 | $ | - | ||||||||
| Gross profit |
13 | 3,337 | 3,943 | - | ||||||||||||
| Net income (loss) |
5,455 | 7,345 | (5,474 | ) | (2,074 | ) | ||||||||||
| Total comprehensive income (loss) |
5,390 | 7,206 | (6,092 | ) | (1,931 | ) | ||||||||||
| Basic and diluted income (loss) per share |
0.02 | 0.03 | (0.02 | ) | (0.01 | ) | ||||||||||
| Total assets |
354,247 | 330,793 | 302,217 | 232,719 | ||||||||||||
Item 9. Changes in and Disagreements with Accountants on Accounting and Financial Disclosure
None.
Item 9A. Controls and Procedures
Evaluation of Disclosure Controls and Procedures
Our management, with the participation of our Principal Executive Officer and Principal Financial Officer, has evaluated the effectiveness of our disclosure controls and procedures (as such term is defined in Rules 13a-15(e) and 15d-15(e) under the Exchange Act), as of the end of the period covered by this Annual Report. Based on such evaluation, our Principal Executive Officer and Principal Financial Officer have concluded that, as of the end of the period covered by this Annual Report, our disclosure controls and procedures were effective.
It should be noted that any system of controls is based in part upon certain assumptions designed to obtain reasonable (and not absolute) assurance as to its effectiveness, and there can be no assurance that any design will succeed in achieving its stated goals.
Management’s Report on Internal Control Over Financial Reporting
Management of the Company is responsible for establishing and maintaining adequate internal control over financial reporting, as required by Sarbanes-Oxley (SOX) Section 404(a). The Company’s internal control over financial reporting is a process designed under the supervision of the Company’s Principal Executive Officer and Principal Financial Officer and effected by the Company’s Board of Directors, management and other personnel, to provide reasonable assurance regarding the reliability of financial reporting and the preparation of the Company’s consolidated financial statements for external purposes in accordance with United States generally accepted accounting principles. Due to its inherent limitations, internal control over financial reporting may not prevent or detect misstatements on a timely basis. Also, projections of any evaluation of the effectiveness of internal control over financial reporting to future periods are subject to the risk that the controls may become inadequate because of changes in conditions, or that the degree of compliance with the policies or procedures may deteriorate.
As at July 31, 2023, management assessed the effectiveness of the Company’s internal control over financial reporting based on the criteria set forth in Internal Control - Integrated Framework (2013) issued by the Committee of Sponsoring Organizations of the Treadway Commission. Based on that evaluation, the Company’s management concluded that, as of July 31, 2023, the Company’s internal control over financial reporting was effective.
The independent registered public accounting firm that audited the consolidated financial statements included in this Annual Report has issued an attestation report on the Company’s internal control over financial reporting which appears herein.
Changes in Internal Controls
There have been no changes in our internal control over financial reporting (as defined in Rules 13a-15(f) and 15d-15(f) under the Exchange Act) that occurred during the fourth fiscal quarter for the fiscal year ended July 31, 2023, that have materially affected, or are reasonably likely to materially affect, our internal control over financial reporting.
Not applicable.
Item 9C. Disclosure Regarding Foreign Jurisdictions that Prevent Inspections
Not applicable.
Item 10. Directors, Executive Officers and Corporate Governance
Our directors and executive officers and their respective ages as of September 27, 2023 are as follows:
| Name |
Age |
Position with the Company |
| Amir Adnani |
45 |
President, Chief Executive Officer, Principal Executive Officer and a director |
| Spencer Abraham |
71 |
Chairman and a director |
| David Kong |
77 |
Lead independent director |
| Vincent Della Volpe |
81 |
A director |
| Gloria Ballesta |
48 |
A director |
| Trecia Canty |
54 |
A director |
| Pat Obara |
67 |
Secretary, Treasurer, Chief Financial Officer and Principal Accounting Officer |
| Scott Melbye |
61 |
Executive Vice President |
The following describes the business experience of each of our directors, including other directorships held in reporting companies.
Amir Adnani. Amir Adnani is a founder of the Company and has served as our President, Chief Executive Officer and a director since January 2005. Under his leadership, the Company has become one of the fastest growing uranium companies listed on the NYSE American with one of the largest resource bases of fully permitted ISR projects of any U.S.-based producer.
Mr. Adnani has been invited to speak at prominent industry conferences organized by the International Atomic Energy Agency, World Nuclear Fuel Market and the Milken Institute. He is a frequent contributor to the business media, including The Wall Street Journal, Bloomberg, CNBC and Fox Business News.
Fortune magazine distinguished Mr. Adnani on their “40 Under 40, Ones to Watch” list of North American executives. He was selected as one of “Mining’s Future Leaders” by Mining Journal, a UK-based global industry publication. He was a nominee for Ernst & Young’s “Entrepreneur of the Year” distinction.
Mr. Adnani is the founder and Co-Chairman of GoldMining Inc., a publicly-listed gold acquisition and development company, and is the Chairman of Uranium Royalty Corp., a publicly-listed uranium royalty company. Mr. Adnani served as a director of Gold Royalty Corp., a publicly-listed gold royalty company, from November 2020 to March 2023. Mr. Adnani holds a Bachelor of Science degree from the University of British Columbia and was a director of the university’s Alumni Association from 2015 to 2021.
Spencer Abraham. Spencer Abraham has served as Chairman (non-executive) of our Board of Directors since March 2017. Mr. Abraham served as Executive Chairman from October 2015 to March 2017 and as the Chairman of our Advisory Board from December 2012 to October 2015. Mr. Abraham is the Chairman and Chief Executive Officer of The Abraham Group LLC, an international strategic consulting firm based in Washington, D.C. President George W. Bush selected Mr. Abraham as the tenth Secretary of Energy of the United States in 2001. During his tenure at the Energy Department from 2001 to 2005, Mr. Abraham developed policies and regulations to ensure the nation’s energy security, was responsible for the U.S. Strategic Petroleum Reserve, oversaw domestic oil and gas development policy and nuclear energy policy, developed relationships with international governments, including members of the Organization of the Petroleum Exporting Countries, and led the landmark nuclear nonproliferation HEU program between the United States and Russia. Mr. Abraham served as a United States Senator for the State of Michigan from 1995 to 2001. At a time when the Biden Administration and U.S. Congress are considering significant issues pertaining to the U.S. uranium mining sector, Mr. Abraham’s expertise in the public policy arena is especially valuable and he is very actively involved in working with the Company to address these matters.
Mr. Abraham has served as a director of Two Harbors Investment Corp. (NYSE: TWO) since May 2014, as a director of PBF Energy Inc. (NYSE: PBF) since October 2012 and as a director of NRG Energy, Inc. (NYSE: NRG) since December 2012. Mr. Abraham served as a director of GenOn Energy, Inc. from January to December 2012, when it was acquired by NRG Energy, Inc. Previously, Mr. Abraham served as a director of Occidental Petroleum Corporation (NYSE: OXY) from 2005 to May 2020, as the non-executive Chairman of the Board of Directors of AREVA Inc., the North American subsidiary of AREVA, and on the boards of several other public and private companies.
Mr. Abraham holds a Juris Doctor degree from Harvard Law School and is an alumnus of Michigan State University.
David Kong. David Kong has served on our Board of Directors since January 2011 and serves as our lead independent director. Mr. Kong has served as a director of Silvercorp Metals Inc., a public company listed on the Toronto Stock Exchange (the “TSX”) and the NYSE American, since November 2011, as a director of GoldMining Inc., a public company listed on the TSX and the NYSE American, since October 2010, and as a director of New Pacific Metals Corp., a public company listed on the TSX and the NYSE American, from November 2010 to December 2022.
Mr. Kong holds a Bachelor in Business Administration and earned his Chartered Accountant designation (CPA, CA) in British Columbia, Canada, in 1978. Mr. Kong was a partner at Ellis Foster, Chartered Accountants, from 1981 to 2004, before merging with EY (formerly Ernst & Young LLP), Chartered Professional Accountants, in 2005, where he was a partner until 2010. Mr. Kong is a certified director (ICD.D) of the Institute of Corporate Directors.
Vincent Della Volpe. Vincent Della Volpe has served on our Board of Directors since July 2007. Mr. Della Volpe has served as a professional money manager for over 35 years, including as a senior portfolio manager of pension funds for Honeywell Corporation and senior vice president of the YMCA Retirement fund in New York. Throughout his career, Mr. Della Volpe has particularly focused on the management of energy and utility equity portfolios, and he also has experience managing venture capital investments. Mr. Della Volpe holds a Bachelor of Arts in Accounting and an MBA in finance, both from Seton Hall University.
Gloria Ballesta. Gloria Ballesta has served on our Board of Directors since July 2018. Ms. Ballesta has been the Chief Executive Officer of Content Mode SAS, a contact center based in Colombia, since January 2016, and serves as a director of GoldMining Inc., a public company listed on the TSX and the NYSE American, since August 2010. Ms. Ballesta has experience managing administrative and compliance procedures for spin-offs, take-overs and financings of various public companies. Ms. Ballesta holds an LLB (Hons.) from the CEU Cardenal Herrera University in Spain and a Master’s degree in Marketing and Business Management from ESIC School of Business in Spain.
Trecia Canty. Trecia Canty has served on our Board of Directors since March 2023. Ms. Canty has over 25 years of experience in finance, strategic transactions, corporate governance, compliance, enterprise risk and ESG and has extensive energy industry experience, including exploration and production, public utilities, pipelines and related businesses in the United States and Canada. Since 2015, Ms. Canty has served as the Senior Vice President, General Counsel and Corporate Secretary and a member of the Executive Committee of PBF Energy Inc. (NYSE: PBF), a Fortune 200 company that is one of the largest independent petroleum refiners and suppliers of unbranded transportation fuels, heating oil, petrochemical feedstocks, lubricants and other petroleum products in the United States. Ms. Canty is graduate of Dartmouth College and received a Masters degree in Public Affairs from Princeton University’s School of International and Public Affairs and a Juris Doctor from Columbia University’s School of Law.
The following describes the business experience of each of the non-director executive officers of the Company:
Pat Obara. Pat Obara has served as our Secretary, Treasurer and Chief Financial Officer since October 2015, and served as our Chief Financial Officer from August 2006 to January 2011 and as our Vice President Administration from January 2011 to October 2015. Mr. Obara currently serves as the Chief Financial Officer and Secretary of GoldMining Inc., a public company listed on the TSX and the NYSE American, and served as a director of GoldMining Inc. from September 2009 to May 2018. Mr. Obara holds a degree in Building Technology, Land and Construction Economics from the British Columbia Institute of Technology.
Scott Melbye. Scott Melbye has served as our Executive Vice President since September 2014. Mr. Melbye is a 40-year veteran of the nuclear energy industry having held key leadership positions in major global uranium mining companies and various industry organizations. He has passionately promoted the growth and competitiveness of the nuclear fuel cycle in supporting nuclear power as a clean, affordable and reliable source of energy to meet the world’s ever-expanding needs.
As our Executive Vice President, Mr. Melbye is responsible for the uranium marketing and sales function and is a key contributor towards the achievement of the Company’s strategic growth objectives. Mr. Melbye currently serves as the Chief Executive Officer, President and a director of Uranium Royalty Corp., a public company listed on the TSX and the Nasdaq Capital Market. Previously, Mr. Melbye served as the Vice President, Commercial at Uranium Participation Corporation (now Sprott Physical Uranium Trust) from 2014 to 2018, and concurrently served as an advisor, to the Chairman of Kazatomprom, the world’s leading uranium producer in Kazakhstan, guiding their business transformation process as it related to marketing and sales strategy. Through June 2014, Mr. Melbye was Executive Vice President, Marketing for Uranium One, responsible for global sales activities, where he expanded that company’s forward book, particularly in the emerging markets of the United Arab Emirates and China. He also supported the global investor-relations efforts of the CEO during the time that Uranium One was publicly traded on the TSX.
Prior to this, Mr. Melbye spent 22 years with the Cameco Group of companies, both at their Saskatoon head office and with their U.S. subsidiaries. He most recently served as President of Cameco Inc., the subsidiary responsible for managing that company’s world-wide uranium marketing and trading activities (achieving annual sales exceeding 30 million pounds U3O8 through established relationships with most global nuclear utilities). Mr. Melbye’s previous experience includes uranium brokerage and trading at Nukem Inc. in New York, and nuclear fuel procurement at the Palo Verde Nuclear Generating Station in Arizona.
Mr. Melbye is currently the President of the Uranium Producers of America (“UPA”). The UPA is the domestic mining organization that advocates for U.S. Government policies supportive of national energy, and security and interests of a strong and competitive American uranium industry. He is also a past Chair of the Board of Governors of the World Nuclear Fuel Market. Mr. Melbye is a frequent speaker at nuclear industry conferences and has participated in numerous high-level, United States and Canadian trade missions to markets such as Central Europe, China, India, United Arab Emirates and Mexico. Mr. Melbye has provided expert testimony before the U.S. House Oversight Committee on Department of Energy inventory dispositions, and the U.S. Senate Energy and Natural Resources Committee on regaining American nuclear leadership and foreign critical minerals dependency. In addition, he testified before the U.S. International Trade Commission on uranium imports from Kazakhstan following the dissolution of the Soviet Union. Mr. Melbye received a Bachelor of Science in Business Administration with degree specialization in International Business from Arizona State University in 1984.
Director Qualifications and Experience
The following summarizes the relevant experiences, qualifications, attributes and skills that our director nominees bring to the Board of Directors that are important to our business.
| Mining Industry Experience |
Directors who have experience serving on mining company boards, in senior leadership roles at mining companies and/or technical expertise in one or more of the following areas: production; mine operations; mine development; exploration; project development; and mergers and acquisitions; bring an understanding of our business and oversight of strategy. |
| Senior Leadership Experience |
Directors who have experience serving in senior leadership roles at large/complex organizations bring strong abilities to motivate others, to identify and develop leadership qualities in others, to achieve strategic priorities and to create long-term value. |
| Public Company Board Experience |
Directors who have experience serving on other public company boards bring knowledge of the operation of the board and relationships between the board, the chief executive officer and other senior management, insights on key issues, agenda setting, risk oversight, corporate governance, executive compensation, operational and compliance-related matters. |
| International Business Experience |
Directors who have experience serving on other company boards or in senior leadership roles at other companies that have international operations bring knowledge of diverse business, political, cultural and regulatory environments. |
| Capital Markets Experience |
Directors who have experience relating to capital markets bring knowledge of investor expectations and perspectives related to capital raising, capital structure, financing transactions, dispositions, mergers, acquisitions and other strategic transactions. |
| Accounting and Financial Reporting Experience |
Directors who have past professional experience in finance or accounting, requisite professional certification in accounting or experience serving as a chief executive officer, chief financial officer, other senior officer with financial oversight responsibilities or experience serving on other public company audit committees, bring an understanding of financial oversight responsibilities required to oversee the Company’s financial reporting and internal control functions. |
| Corporate Governance, Safety, Health, Environment and Sustainability Experience |
Directors who have experience relating to corporate governance, workplace safety, health, the environment and sustainability bring knowledge of leading practices to oversee strong performance. |
| Government, Regulatory and Public Policy Experience |
Directors who have experience relating to government, regulatory or public policy matters bring knowledge helpful to operate in a complex regulatory environment. |
The following identifies the relevant experiences, qualifications, attributes and skills possessed by our director nominees:
| Skill |
Amir Adnani |
Spencer Abraham |
David Kong |
Vincent Della Volpe |
Gloria Ballesta |
Trecia Canty |
| Mining Industry Experience |
✔ |
✔ |
✔ |
✔ |
✔ |
✔ |
| Senior Leadership Experience |
✔ |
✔ |
✔ |
✔ |
||
| Public Company Board Experience |
✔ |
✔ |
✔ |
✔ |
✔ |
|
| International Business Experience |
✔ |
✔ |
✔ |
✔ |
✔ |
✔ |
| Capital Markets Experience |
✔ |
✔ |
✔ |
✔ |
||
| Accounting and Financial Reporting Experience |
✔ |
✔ |
✔ |
✔ |
✔ |
|
| Corporate Governance, Safety, Health, Environment and Sustainability Experience |
✔ |
✔ |
✔ |
✔ |
✔ |
✔ |
| Government, Regulatory and Public Policy Experience |
✔ |
✔ |
Term of Office
All of our directors hold office until the next annual general meeting of the stockholders or until their successors are elected and qualified. Our officers are appointed by our Board of Directors and hold office until their successors are appointed and qualified.
Significant Employees
There are no significant employees other than our executive officers.
Family Relationships
There is no family relationship between any of our executive officers or directors.
Audit Committee
Our Board of Directors has established an Audit Committee that operates under a written charter approved by the Board of Directors. Our Audit Committee has been structured to comply with Rule 10A-3 under the Exchange Act. Our Audit Committee is comprised of David Kong, Vincent Della Volpe and Gloria Ballesta, all of whom meet the audit committee member independence standards of the NYSE American. Mr. Kong is the Chairperson of the Audit Committee. Our Board of Directors has determined that Mr. Kong satisfies the criteria for an audit committee financial expert under Item 407(d)(5) of Regulation S-K of the rules of the SEC.
Involvement in Certain Legal Proceedings
Except as disclosed in this Annual Report, during the past ten years none of the following events have occurred with respect to any of our directors or executive officers:
| 1. |
a petition under the federal bankruptcy laws or any state insolvency law was filed by or against, or a receiver, fiscal agent or similar officer was appointed by a court for the business or property of such person, or any partnership in which he was a general partner at or within two years before the time of such filing, or any corporation or business association of which he was an executive officer at or within two years before the time of such filing; |
| 2. |
such person was convicted in a criminal proceeding or is a named subject of a pending criminal proceeding (excluding traffic violations and other minor offenses); |
| 3. |
such person was the subject of any order, judgment, or decree, not subsequently reversed, suspended or vacated, of any court of competent jurisdiction, permanently or temporarily enjoining him from, or otherwise limiting, the following activities: |
| i) |
acting as a futures commission merchant, introducing broker, commodity trading advisor, commodity pool operator, floor broker, leverage transaction merchant, any other person regulated by the Commodity Futures Trading Commission, or an associated person of any of the foregoing, or as an investment adviser, underwriter, broker or dealer in securities, or as an affiliated person, director or employee of any investment company, bank, savings and loan association or insurance company, or engaging in or continuing any conduct or practice in connection with such activity; |
| ii) |
engaging in any type of business practice; or |
| iii) |
engaging in any activity in connection with the purchase or sale of any security or commodity or in connection with any violation of federal or state securities laws or federal commodities laws; |
| 4. |
such person was the subject of any order, judgment or decree, not subsequently reversed, suspended or vacated, of any federal or state authority barring, suspending or otherwise limiting for more than 60 days the right of such person to engage in any activity described in paragraph (3)(i) above, or to be associated with persons engaged in any such activity; |
| 5. |
such person was found by a court of competent jurisdiction in a civil action or by the SEC to have violated any federal or state securities law, and the judgment in such civil action or finding by the SEC has not been subsequently reversed, suspended, or vacated; |
| 6. |
such person was found by a court of competent jurisdiction in a civil action or by the Commodity Futures Trading Commission to have violated any federal commodities law, and the judgment in such civil action or finding by the Commodity Futures Trading Commission has not been subsequently reversed, suspended or vacated; |
| 7. |
such person was the subject of, or a party to, any federal or state judicial or administrative order, judgment, decree, or finding, not subsequently reversed, suspended or vacated, relating to an alleged violation of: |
| i) |
any federal or state securities or commodities law or regulation; or |
| ii) |
any law or regulation respecting financial institutions or insurance companies including, but not limited to, a temporary or permanent injunction, order of disgorgement or restitution, civil money penalty or temporary or permanent cease-and-desist order, or removal or prohibition order; or |
| iii) |
any law or regulation prohibiting mail or wire fraud or fraud in connection with any business entity; or |
| 8. |
such person was the subject of, or a party to, any sanction or order, not subsequently reversed, suspended or vacated, of any self-regulatory organization (as defined in Section 3(a)(26) of the Exchange Act), any registered entity (as defined in Section 1(a)(29) of the Commodity Exchange Act), or any equivalent exchange, association, entity or organization that has disciplinary authority over its members or persons associated with a member. |
Code of Conduct and Ethics
We have adopted a Code of Conduct and Ethics (the “Code”) that applies to all directors and officers. The Code describes the legal, ethical and regulatory standards that must be followed by the directors and officers of the Company and sets forth high standards of business conduct applicable to each director and officer. As adopted, the Code sets forth written standards that are designed to deter wrongdoing and to promote, among other things:
| ● |
honest and ethical conduct, including the ethical handling of actual or apparent conflicts of interest between personal and professional relationships; |
| ● |
compliance with applicable governmental laws, rules and regulations; |
| ● |
the prompt internal reporting of violations of the Code to the appropriate person or persons identified in the Code; and |
| ● |
accountability for adherence to the Code. |
A copy of our Code and all material Company corporate governance charters, policies and guidelines can be viewed on our website at: www.uraniumenergy.com.
Corporate Governance and Nominating Committee
Our Board of Directors has established a Corporate Governance and Nominating Committee that operates under a written charter approved by the Board of Directors. The Corporate Governance and Nominating Committee is comprised of Vincent Della Volpe, David Kong and Gloria Ballesta. Mr. Della Volpe is the Chairperson of the Corporate Governance and Nominating Committee. All of the members of the Corporate Governance and Nominating Committee qualify as independent directors under the listing standards of the NYSE American.
The Corporate Governance and Nominating Committee is responsible for developing an appropriate approach to corporate governance issues and compliance with governance rules. The Corporate Governance and Nominating Committee is also mandated to plan for the succession of our Company, including recommending director candidates, review of Board of Director procedures, size and organization and monitoring of senior management with respect to governance issues.
The Corporate Governance and Nominating Committee identifies individuals believed to be qualified to become Board of Director members and recommends individuals to fill vacancies. There are no minimum qualifications for consideration for nomination to be a director of the Company. The Corporate Governance and Nominating Committee assesses all nominees using generally the same criteria. In nominating candidates, the Corporate Governance and Nominating Committee takes into consideration such factors as it deems appropriate, including skills, knowledge, experience and personal character, as well as the needs of the Company.
Director Time Commitments Policy
We have adopted a Director Time Commitments Policy (the “Director Time Commitments Policy”). The Director Time Commitments Policy provides that the Company’s non-executive Chairman and lead independent director shall be limited to serving on four public company boards, including the Company’s Board of Directors (excluding private companies and other non-public companies). The Company’s Corporate Governance and Nominating Committee evaluates on at least an annual basis the outside director time commitments of the Company’s non-executive Chairman and lead independent director. The Company’s non-executive Chairman and lead independent director affirm that they are in compliance with the Director Time Commitments Policy as of the date of this Annual Report. Our Director Time Commitments Policy can be viewed on our website at www.uraniumenergy.com.
Sustainability Committee
Our Sustainability Committee is comprised of David Kong, Gloria Ballesta and Trecia Canty. Our Board of Directors has determined that each member of the Sustainability Committee meets the independence standards of the NYSE American. Mr. Kong is the Chairperson of the Sustainability Committee.
The Sustainability Committee is responsible for oversight of sustainability including environmental, social, health and safety matters. The Sustainability Committee is mandated to oversee the Company’s framework for the development of environmental, social, health and safety policies and programs and performance thereunder. The Sustainability Committee reports regularly to the Board of Directors.
Human Rights Policy
We have adopted a Human Rights Policy (the “Human Rights Policy”) that applies comprehensive standards to our operations across all geographic locations regarding the protection of human rights. Our Human Rights Policy can be viewed on our website at www.uraniumenergy.com.
Diversity Policy
Our Board of Directors has adopted a written Diversity Policy (the “Diversity Policy”) that sets out the Company’s approach to diversity, including gender, on the Board of Directors and among the executive officers of the Company. The Corporate Governance and Nominating Committee and the Board of Directors aim to attract and maintain directors and an executive team that have an appropriate mix of diversity, skill and expertise.
Pursuant to the Diversity Policy, all Board of Directors and executive officer appointments will be based on merit, and the skill and contribution that the candidate is expected to bring to the Board of Directors and the executive team, with due consideration given to the benefits of diversity. Pursuant to the Diversity Policy, when considering the composition of, and individuals to nominate or hire to, the Board of Directors and the executive team, the Corporate Governance and Nominating Committee and the Board of Directors, as applicable, shall consider diversity from a number of aspects and including, but not limited to, gender, age, ethnicity and cultural diversity. In addition, when assessing and identifying potential new members to join the Board of Directors or the executive team, the Corporate Governance and Nominating Committee and the Board of Directors, as applicable, considers the current level of diversity on the Board of Directors and the executive team.
The Corporate Governance and Nominating Committee and the Board of Directors are responsible for developing measurable objectives to implement the Diversity Policy and to measure its effectiveness. The Corporate Governance and Nominating Committee meets annually, or otherwise as applicable, to consider whether to set targets based on diversity for the appointment of individuals to the Board of Directors or the executive team, recognizing that, notwithstanding any targets set in any given year, the selection of diverse candidates will depend on the pool of available candidates with the necessary skills, knowledge and experience. In Fiscal 2023, the Corporate Governance and Nominating Committee and the Board of Directors adopted a target to have 30% female directors by the end of the fiscal year. The target has been achieved and female directors comprise 33% of the Board of Directors as of the date hereof.
As at the date of this Annual Report, the members of our Board of Directors identify as 50% racially diverse, 50% white, 17% asian, 17% hispanic, 17% black, 67% ethnically diverse and 33% female. Our executive officers identify as 67% ethnically diverse and 0% female. The Board of Directors believes that diversity will increase the effectiveness of the Board of Directors and the long-term performance of the Company.
The Corporate Governance and Nominating Committee has performed a review of the experience, qualifications, attributes and skills of our Company’s current directors and believes that our Company’s current directors possess a variety of complementary skills and characteristics, including the following:
| ● |
personal characteristics, including leadership, character, integrity, accountability, sound business judgment and personal reputation; |
| ● |
successful business or professional experience; |
| ● |
various areas of expertise or experience, including financial, strategic and general management; |
| ● |
willingness and ability to commit the necessary time to fully discharge the responsibilities of a director in connection with the affairs of the Company; |
| ● |
a demonstrated commitment to the success of the Company; and |
| ● |
diverse perspectives, qualifications and knowledge. |
The Corporate Governance and Nominating Committee considers nominees recommended by stockholders if such recommendations are made in writing to the Corporate Governance and Nominating Committee and evaluates nominees for election in the same manner whether the nominee has been recommended by a stockholder or otherwise.
Conflicts of Interest
To our knowledge, and other than as disclosed in this Annual Report, there are currently no known existing or potential conflicts of interest among us, our promoters, directors and officers, or other members of management, or any proposed director, officer or other member of management as a result of their outside business interests, except that certain of the directors and officers serve as directors and officers of other companies and, therefore, it is possible that a conflict may arise between their duties to us and their duties as a director or officer of such other companies.
Compliance with Section 16(a) of the Exchange Act
Section 16(a) of the Exchange Act requires our directors and officers, and the persons who beneficially own more than 10% of our common stock, to file reports of ownership and changes in ownership with the SEC. Copies of all filed reports are required to be furnished to us pursuant to Rule 16a-3 promulgated under the Exchange Act. Based solely on the reports received by us and on the representations of the reporting persons, we believe that all such reports were timely filed during Fiscal 2023 within two business days as required by the SEC.
Board Leadership Structure and Role in Risk Oversight
Our leadership structure is comprised of a President and Chief Executive Officer, a Chairman and a lead independent director. The role of our lead independent director includes: (i) to preside at all executive sessions of the independent directors; (ii) to have authority to call meetings of the independent directors; (iii) to serve as the principal liaison and facilitator between the independent directors, the Chairman, the Chief Executive Officer and senior management; (iv) to provide feedback from executive sessions of the independent directors to the Chairman, Chief Executive Officer and senior management; (v) to be available for consultation and communication with major stockholders where appropriate, upon reasonable request; and (vi) to perform such other functions as the Board of Directors may request.
Our Board of Directors takes an active role in risk oversight of the Company. Our executive officers report any significant risks that come to their attention to our Board of Directors. Our Audit Committee reviews significant financial risks and enterprise risks and reports them to our Board of Directors as well.
Item 11. Executive Compensation
Compensation Discussion and Analysis
Oversight of Executive Compensation Program
Our Board of Directors has established a Compensation Committee that operates under a written charter approved by the Board of Directors. The Compensation Committee is comprised of Vincent Della Volpe, David Kong and Gloria Ballesta. Mr. Della Volpe is the Chairperson of the Compensation Committee. All of the members of the Compensation Committee meet the compensation committee independence standards of the NYSE American. The Board of Directors has determined that none of the Compensation Committee members have any material business relationships with the Company. The independence of the Compensation Committee members is re-assessed regularly by the Company.
The Compensation Committee of our Board of Directors is responsible for establishing and administering the Company’s executive and director compensation.
The responsibilities of the Compensation Committee, as stated in its charter, include the following:
| ● |
review and approve the Company’s compensation guidelines and structure; |
| ● |
review and approve on an annual basis the corporate goals and objectives with respect to compensation for the Chief Executive Officer; |
| ● |
review and approve on an annual basis the evaluation process and compensation structure for the Company’s other officers, including base compensation, bonus, incentive and equity compensation; and |
| ● |
periodically review and make recommendations to the Board of Directors regarding the compensation of directors. |
The Compensation Committee is responsible for developing the executive compensation philosophy and reviewing and recommending to the Board of Directors for approval all compensation policies and compensation programs for the executive team.
Since May 2012, consistent with good governance practices, the Compensation Committee retains on an annual basis an independent compensation advisor to provide advice on the structure and levels of compensation for our executive officers and directors and to undertake a comprehensive review of our incentive plans. In Fiscal 2023 the Compensation Committee once again retained Global Governance Advisors (“GGA”) to provide independent compensation advice to the Compensation Committee and to the Board of Directors. GGA is an internationally recognized, independent advisory firm that provides counsel to boards of directors on matters relating to executive compensation and governance. GGA is retained to continually review the compensation levels for the Company’s executive officers and directors and short and long-term incentive plans, and to evaluate and make recommendations on the Company’s overall executive and director compensation philosophy, objectives and approach.
GGA’s services in Fiscal 2023 included:
| ● |
compensation philosophy validation; |
| ● |
peer group review; |
| ● |
executive compensation review and recommendations for our Chief Executive Officer, Chief Financial Officer and Executive Vice President; |
| ● |
review and design of the annual non-equity incentive plan; |
| ● |
director compensation review; and |
| ● |
review of compensation discussion and analysis in the Company’s proxy statement. |
Fees paid for GGA’s services for our last two fiscal years were $43,417 and $70,461 for Fiscal 2022 and Fiscal 2023, respectively.
The Compensation Committee reviews all fees and the terms of consulting services provided by GGA.
Overview of Executive Compensation Program
| What We Do ✓ |
What We Do NOT Do × |
||
| ✓ |
DO align annual incentive pay and performance by linking annual incentive compensation to the achievement of performance goals tied to Company strategic objectives |
× |
NO guaranteed cash incentives, equity compensation or salary increases for executives except in limited scenarios in connection with their hiring |
| ✓ |
DO align long-term incentive pay and performance by linking a portion of long-term compensation to the achievement of relative and absolute TSR goals |
× |
NO full single trigger acceleration of annual equity awards granted to executives |
| ✓ |
DO cap payouts for annual incentive and LTIP awards |
× |
NO acceleration of performance based equity awards without regard to performance goals, with any acceleration upon a qualifying termination of employment subject to proration as well as the attainment of performance goals measured through the date of the acceleration event |
| ✓ |
DO maintain rigorous stock ownership guidelines (3x base compensation for the CEO and 1x base compensation for other executive officers) |
× |
NO executive retirement plans for any of our executives |
| ✓ |
DO maintain a clawback policy with respect to cash and equity incentive compensation |
× |
NO compensation or incentives that encourage unnecessary or excessive risk taking |
| ✓ |
DO conduct annual compensation review and approval of our compensation philosophy and strategy |
× |
NO tax gross ups |
| ✓ |
DO appoint a Compensation Committee comprised solely of independent directors |
× |
NO pledging of any of our securities by directors, executive officers or other employees |
| ✓ |
DO use an independent compensation consultant engaged by our Compensation Committee |
× |
NO hedging or derivative transactions by directors, executive officers or other employees involving our securities |
| ✓ |
DO have a majority of executive compensation at risk based on corporate performance |
× |
NO perquisites for executives |
In Fiscal 2023, with the recommendations put forth by GGA (the “GGA Recommendations”), the Compensation Committee maintained the following general principles in determining its executive and director total compensation plans.
The Company recognizes that people are our primary asset and our principal source of establishing a competitive advantage. In order to recruit, motivate and retain the most qualified individuals as senior executive officers, the Company strives to maintain an executive compensation program that is competitive in the mining industry, which is a competitive, global labor market.
The Compensation Committee’s objective is to establish a compensation program that is designed to align with industry trends and attract and retain the best available talent while efficiently utilizing available resources. These objectives are achieved primarily through base compensation and equity compensation designed to be competitive with comparable companies, and to align management’s compensation with the long-term interests of stockholders. In determining executive management’s compensation, the Compensation Committee also takes into consideration the performance and financial condition of the Company.
In order to accomplish our goals and to ensure that the Company’s executive compensation program is consistent with its direction and business strategy, the compensation program for our senior executive officers is based on the following objectives:
| ● |
to attract, motivate, retain and reward a knowledgeable and driven management team and to encourage them to attain and exceed performance expectations within a calculated risk framework; and |
| ● |
to reward each executive based on individual and corporate performance and to incentivize such executives to drive the organization’s current growth and sustainability objectives. |
The following key principles guide the Company’s overall compensation philosophy:
| ● |
compensation is designed to align executives to the critical business issues facing the Company; |
| ● |
compensation should be fair and reasonable to stockholders and be set with reference to the local market and similar positions of comparable companies; |
| ● |
a substantial portion of total compensation is at risk and linked to individual efforts, as well as divisional and corporate performance. This ensures the link between executive pay and business performance; |
| ● |
an appropriate portion of total compensation should be equity-based, aligning the interests of executives with stockholders; and |
| ● |
compensation should be transparent to the Board of Directors, executives and stockholders. |
Benchmarking Compensation and Peer Groups
In Fiscal 2023, the Compensation Committee commissioned a Peer Group review from GGA as part of a competitive compensation market update review of executive and director compensation in order to stay abreast of changes in the external market and to ensure that the Company continued to benchmark compensation with appropriate market comparators. In addition to external market trends, the Compensation Committee considered the complexity of the Company and the range of size of several of the appropriate comparable companies and, with the GGA Recommendations provided to them, revised the Peer Group from the prior year to address changes in the external market and to better reflect our Company’s business. The Peer remained relatively consistent with the prior year and included publicly traded uranium and precious metals mining and oil and gas companies, headquartered in North America, of similar size and having a market capitalization and/or total assets generally ranging between 0.25 times and four times that of the Company’s. The companies identified below were removed from or added to the Peer Group based on whether they met or continued to meet this selection criteria. The companies removed from the Peer Group were smaller than the Company from a market capitalization perspective and were deemed to be less relevant to the Company. The companies added to the Peer Group aligned better to the Company based on their market capitalization and/or total assets. The Company’s market capitalization was positioned slightly above the median of the Peer Group at the time of the GGA Recommendations. The Peer Group was used by the Compensation Committee to establish the compensation levels for the Company’s executive officers and its Board of Directors.
In Fiscal 2023, with the GGA Recommendations, our compensation philosophy aimed to align both our executive officers’ and Board of Directors’ compensation around the median of the Peer Group. As it relates to executive compensation as a result of the annual compensation review process, executive base compensation and target short-term incentive compensation levels are benchmarked generally below median levels of comparable roles and experience and the long-term incentive award is benchmarked at or above median to provide a stronger link of realizable compensation that is tied to longer-term shareholder value creation. At the time of the Peer Group review, the Company was positioned at the 51st percentile on a market capitalization basis, and at the 52nd percentile on a total assets basis compared with the Peer Group.
In Fiscal 2023, the following companies were removed from or added to the Peer Group:
| Removed from the Peer Group |
Added to the Peer Group |
| Global Atomic Corporation |
Coeur Mining, Inc. |
| IsoEnergy Ltd. |
enCore Energy Corp. |
| NACCO Industries, Inc. |
Filo Mining Corp. |
| PolyMet Mining Corp. |
K92 Mining Inc. |
| Ur-Energy Inc. |
Osisko Mining Inc. |
| Seabridge Gold Inc. |
|
| Torex Gold Resources Inc. |
The adjustments made for the Peer Group were completed to address the Company’s operational and overall year over year total asset growth. When examining peer alternatives, a balanced approach that examined shareholder and other uranium mining company peer groups was used to ensure that the Peer Group aligned within market norms.
In Fiscal 2023, the Peer Group was comprised of the following companies:
| Peer Group |
||
| Centrus Energy Corp. |
Energy Fuels Inc. |
NexGen Energy Ltd. |
| Coeur Mining, Inc. |
Filo Mining Corp. |
Northern Oil and Gas, Inc. |
| Comstock Resources, Inc. |
Fission Uranium Corp. |
Osisko Mining Inc. |
| Denison Mines Corp. |
Gulfport Energy Corporation |
Seabridge Gold Inc. |
| enCore Energy Corp. |
K92 Mining Inc. |
Torex Gold Resources Inc. |
Compensation Elements and Rationale
The Company’s executive compensation program consists of: base compensation; short-term incentive awards; and long-term incentive equity compensation.
Base Compensation
Base compensation is the foundation of the compensation program and is intended to compensate competitively relative to comparable companies within our industry and the marketplace where we compete for talent. Base compensation is a fixed component of the compensation program and is used as the base to determine elements of incentive compensation and benefits.
The following table sets forth the direct and indirect base compensation paid to our executive officers on an annual basis at each quarter end for our Fiscal 2023 and thereafter. Effective on August 1, 2023, the base compensation paid on an annual basis to our executive officers was increased to position pay competitively with the market and to reflect the Company’s growth and performance.
| Fiscal 2023 |
Fiscal 2024 |
|||||
| Name and |
October 31, 2022 |
January 31, 2023 |
April 30, 2023 |
July 31, 2023 |
As of the date hereof |
|
| Amir Adnani President and Chief Executive Officer |
$478,000 |
$478,000 |
$478,000 |
$478,000 |
$575,000 |
|
| Pat Obara Secretary, Treasurer and Chief Financial Officer |
CAD$189,000 |
CAD$189,000 |
CAD$189,000 |
CAD$189,000 |
$200,000 |
|
| Scott Melbye Executive Vice President |
$262,500 |
$262,500 |
$262,500 |
$262,500 |
$290,000 |
|
The base compensation paid to our executive officers is more particularly described below under “Executive Services Agreements” herein.
Short-Term Incentive Awards
The short-term incentive plan (the “STIP”) is a variable component of compensation and has the objective of motivating the executive officers to achieve corporate objectives over a one-year period and to provide a means to reward the achievement of corporate milestones and fulfillment of the annual business plan. The STIP provides an opportunity for an annual cash payout based on performance relative to the achievement of corporate and individual performance goals and metrics. The STIP has a maximum payout opportunity, which is 200% of each executive officer’s target STIP.
The Compensation Committee establishes STIP performance goals, metrics, weightings and targets in the first quarter of each fiscal year. Each of our executive officers has a target STIP set as a percentage of their base compensation (each, a “Target Award”), with payouts based on a performance multiplier dependent on corporate and individual performance. The performance multiplier and payouts achieved can range between 0% and 200% of each Target Award. No payout is awarded if the Compensation Committee deems that the Company failed to achieve performance goals. To determine Target Awards our Compensation Committee considers the breadth, scope and complexity of each executive officer’s role, internal equity and whether the executive officer's incentive compensation is competitive relative to similarly situated executives at companies in our Peer Group.
The following sets forth the formula for payment of STIP awards.

The following sets forth the Target Awards expressed as a percentage of executive officer base compensation along with the corresponding corporate and individual performance weightings for Fiscal 2023. The performance weightings vary by position within the Company, with corporate performance having a higher weighting for more senior executive officers.
| Executive Officer |
Base Compensation |
Fiscal 2023 Target Award |
Performance Weighting |
||
| % of Base Compensation |
Target Award |
Corporate |
Individual |
||
| Amir Adnani President and Chief Executive Officer |
$478,000 |
100% |
$478,000 |
80% |
20% |
| Pat Obara |
CAD$189,000 |
65% |
CAD$122,850 |
60% |
40% |
| Scott Melbye Executive Vice President |
$262,500 |
50% |
$131,250 |
50% |
50% |
Performance Scorecard
The Compensation Committee establishes a performance scorecard in the first quarter of each fiscal year that sets out performance goals and metrics to guide and motivate the executives to execute on our strategy. At the end of each fiscal year, the Compensation Committee evaluates actual performance relative to the performance goals and metrics and recommends to the Board of Directors the payment of STIP awards. The Compensation Committee and the Board of Directors may exercise discretion to pay cash bonuses outside of the STIP and to not pay STIP awards even if performance awards are earned.
In the first quarter of Fiscal 2023, the Compensation Committee selected performance goals and metrics within a performance scorecard. At the end of Fiscal 2023, the Compensation Committee evaluated the performance achieved relative to the performance goals and metrics and assigned each of Messrs. Adnani and Obara an award at breakthrough for corporate and individual performance and assigned Mr. Melbye an award at breakthrough and above threshold for corporate and individual performance, respectively. Messrs. Adnani, Obara and Melbye achieved awards at 200%, 200% and 130% of target, respectively.
The following sets forth the scorecard for Fiscal 2023.
| Weight |
Performance Levels |
|||||||
| Performance Metrics |
Chief Executive Officer |
Chief Financial Officer |
Executive Vice President |
Threshold |
Target (100% of Target Award) |
Breakthrough (200% of |
Result |
Payout |
| S-K 1300 Reporting |
10% |
7.5% |
6% |
Roughrider |
Roughrider plus one TRS report |
Roughrider plus two |
S-K 1300: Six TRS reports filed |
Breakthrough |
| Accretive Acquisitions |
30% |
22.5% |
19% |
Increase resources with accretive acquisitions |
Acquisitions: Completed |
Breakthrough |
||
|
|
|
|
|
Strengthen the balance sheet to support growth initiatives with at least $50 million of liquid assets comprised of cash and the fair value of physical uranium and equity holdings |
Balance Sheet: |
|
||
| Balance Sheet | 10% | 7.5% | 6% | $50 million |
$60 million |
$70 million |
$70 million | Breakthrough |
|
|
|
|
|
Increase licensed capacity to four million pounds of U3O8 annually at our Hobson Processing Facility (“Hobson Capacity”) and project milestones |
|
|
||
| Texas Production Growth | 7.5% | 6% | 5% | Increase Hobson Capacity to four million pounds |
Increase Hobson Capacity plus define Production Area 2 at our Burke Hollow Project |
Increase Hobson Capacity plus |
Texas Production Growth: Completed |
Breakthrough |
|
|
|
|
|
De-risk and complete a plan for resumption of operations at Christensen including start-up plan preparation, wellfield preparation, plant and pump stations preparation, testing and mobilizing human resources to commence delineation and resource growth drilling |
|
|
||
| Wyoming | 7.5% | 6% | 5% | Complete a plan for resumption of operations at Christensen including mobilizing human resources to commence delineation and resource growth drilling |
Complete drilling at Irigaray |
Complete drilling at Irigaray Mine Unit 15 and Christensen Mine Unit 12 south |
Wyoming: Completed |
Breakthrough |
|
|
|
|
|
Goal 1: Conduct a climate risk assessment to prepare for disclosure aligned with recommendations of the Task Force on Climate-related Financial Disclosures Goal 2: Measure GHG emissions at all Texas operations for Fiscal 2023 Goal 3: Measure GHG emissions at all Wyoming operations for Fiscal 2023 Goal 4: Measure GHG emissions at all Saskatchewan operations for Fiscal 2023 |
ESG Program: Four of four |
|
||
| ESG Program | 7.5% | 6% | 5% | Two of four goals |
Three of four goals |
Four of four goals |
goals completed | Breakthrough |
|
|
|
|
|
Promote high performing safe environments with no recordable injuries |
|
|
||
| Total Recordable Injury and Illness Incidence Rate | 7.5% | 6% | 5% | Rate below 4.8 |
Rate below 3.2 |
Rate below 1.6 and no fatalities |
Rate: Zero |
Breakthrough |
|
|
|
|
|
Chief Executive Officer: Exceeded Expectations |
Individual |
|
||
| Individual Performance | 20% | -- | -- | Below Expectations |
Met Expectations |
Exceeded Expectations |
Performance: Exceeded Expectations |
Breakthrough |
|
|
|
|
|
Chief Financial Officer: Exceeded Expectations |
Individual |
|
||
| Individual Performance | -- | 40% | -- | Below Expectations |
Met Expectations |
Exceeded Expectations |
Performance: Exceeded Expectations |
Breakthrough |
|
|
|
|
|
Executive Vice President: Met Expectations |
Individual |
|
||
| Individual Performance | -- | -- | 50% | Below Expectations |
Met Expectations |
Exceeded Expectations |
Performance: Met Expectations |
Above Threshold |
The following sets forth the STIP awards paid to our executive officers for Fiscal 2023.
| Executive Officer |
Base Compensation |
Fiscal 2023 Target Award |
Performance |
Fiscal 2023 STIP Payout |
% of Target |
||
| % of Base Compensation |
Target Award |
Corporate |
Individual |
||||
| Amir Adnani President and Chief Executive Officer |
$478,000 |
100% |
$478,000 |
80% x 200% |
20% x 200% |
$956,000 |
200% |
| Pat Obara(2) |
CAD$189,000 |
65% |
CAD$122,850 |
60% x 200% |
40% x 200% |
$186,462 |
200% |
| Scott Melbye Executive Vice President |
$262,500 |
50% |
$131,250 |
50% x 200% |
50% x 60% |
$170,000 |
130% |
Performance Goals and Metrics
The Compensation Committee selected the following performance goals and metrics within the Company’s performance scorecard on the belief that these performance goals and metrics were aligned with our corporate strategy and could be impacted by our executive officers. In Fiscal 2023, the payout opportunities for threshold, target and breakthrough performance levels were set at 50%, 100% and 200% of each Target Award, respectively, with interpolation between performance levels.
SEC S-K 1300 Reporting: The Compensation Committee selected this metric based on the belief that adopting the reporting requirements of S-K 1300 is important to the Company’s organizational development and is required for compliance with SEC regulations to provide our stockholders with a more comprehensive understanding of our mineral holdings. This metric represented 10%, 7.5% and 6% of the STIP weighting for Messrs. Adnani, Obara and Melbye, respectively. Publication of a TRS report for the Roughrider Project plus one additional TRS report represented the target level of performance, publication of a TRS report for the Roughrider Project represented the threshold level of performance and publication of a TRS report for the Roughrider Project plus two additional TRS reports represented the breakthrough level of performance. The result was breakthrough performance at 200%. As of July 31, 2023, the Company had completed and filed six TRS reports respecting each of our Texas ISR Hub and Spoke, updated Wyoming ISR Hub and Spoke, Shea Creek, Horseshoe-Raven, Workman Creek and Roughrider Projects on August 11, 2022, September 14, 2022, January 13, 2023, January 24, 2023, March 16, 2023 and May 2, 2023, respectively.
Accretive Acquisitions: The Compensation Committee selected this metric based on the belief that the acquisition of additional accretive uranium deposits is aligned to the Company’s growth objectives. This metric represented 30%, 22.5% and 19% of the STIP weighting for Messrs. Adnani, Obara and Melbye, respectively. The acquisitions of UEX and the Roughrider Project represented opportunities to acquire multiple assets located in Canada’s Athabasca Basin, a premier uranium mining jurisdiction. The acquisitions build on our strategic objective to create the leading western supplier of secure and 100% unhedged uranium with near-term, fully permitted and low-cost U.S. ISR production; and a Canadian high-grade conventional pipeline. Completion of the acquisitions represented the breakthrough level of performance. No threshold or target award opportunities were established for this metric. The result was breakthrough performance at 200%. The Company completed its acquisitions of UEX and the Roughrider Project on August 19, 2022 and October 14, 2022, respectively.
Balance Sheet: The Compensation Committee selected this metric based on the belief that strengthening the balance sheet with at least $50 million of liquid assets comprised of cash and the fair value of physical uranium and equity holdings is important to support the Company’s growth initiatives. This metric represented 10%, 7.5% and 6% of the STIP weighting for Messrs. Adnani, Obara and Melbye, respectively. $60 million of liquid assets represented the target level of performance, $50 million of liquid assets represented the threshold level of performance and $70 million of liquid assets represented the breakthrough level of performance. The result was breakthrough performance at 200%. As of July 31, 2023, the Company had liquid assets of $107 million.
Texas Production Growth: The Compensation Committee selected this metric based on the belief that increasing Hobson capacity (“Capacity”) and achieving project milestones will support additional production capacity and create stockholder value through higher production levels and lower production costs. This metric represented 7.5%, 6% and 5% of the STIP weighting for Messrs. Adnani, Obara and Melbye, respectively. Our fully-licensed and 100%-owned Hobson Processing Facility forms the basis for our hub and spoke strategy in the State of Texas. Increasing Hobson Capacity plus defining Production Area 2 at our Burke Hollow Project represented the target level of performance, increasing Hobson Capacity represented the threshold level of performance and increasing Hobson Capacity plus defining Production Area 2 at our Burke Hollow Project and commencing development drilling at our Palangana Mine Production Area 4 represented the breakthrough level of performance. The result was breakthrough performance at 200%. As of July 31, 2023, the Company had increased Hobson Capacity, defined Production Area 2 at our Burke Hollow Project and completed development drilling at our Palangana Mine Production Area 4.
Wyoming: The Compensation Committee selected this metric on the belief that de-risking and completing a plan for the resumption of operations at its Christensen Ranch Mine including start-up plan preparation, wellfield preparation, plant and pump stations preparation, testing and mobilizing human resources to commence delineation and resource growth drilling will advance the Company’s ability to resume uranium production at the central focus of our hub and spoke operations in the State of Wyoming. This metric represented 7.5%, 6% and 5% of the STIP weighting for Messrs. Adnani, Obara and Melbye, respectively. Completing drilling at Irigaray Mine Unit 15 represented the target level of performance, completing a plan for the resumption of operations at Christensen including mobilizing human resources to commence delineation and resource growth drilling represented the threshold level of performance and completing drilling at Irigaray Mine Unit 15 and Christensen Mine Unit 12 south represented the breakthrough level of performance. The result was breakthrough performance at 200%. As of July 31, 2023, the Company had completed a plan for the resumption of operations at its Christensen Ranch Mine and completed drilling at Irigaray Mine Unit 15 and Christensen Mine Unit 12 south.
ESG Program: The Compensation Committee selected this metric to support the Company’s commitment to being a responsible steward of our environment and the communities where we operate. This metric required the Company to: (i) conduct a climate risk assessment to prepare for disclosure aligned with recommendations of the Task Force on Climate-related Financial Disclosures; (ii) measure GHG emissions at all Texas operations for Fiscal 2023; (iii) measure GHG emissions at all Wyoming operations for Fiscal 2023; and (iv) measure GHG emissions at all Saskatchewan operations for Fiscal 2023. This metric represented 7.5%, 6% and 5% of the STIP weighting for Messrs. Adnani, Obara and Melbye, respectively. The target level of performance required the Company to achieve any three of the four goals, the threshold level of performance required the Company to achieve any two of the four goals and the breakthrough level of performance required the Company to achieve all of the four goals. The result was breakthrough performance at 200%. As of July 31, 2023, the Company had achieved all of the four goals.
Total Recordable Injury and Illness Incidence Rate: The Compensation Committee selected this metric based on the belief that the total recordable injury and illness incidence rate (“IIR”) is critical to the Company’s overall approach to promoting high performing safe environments. The Company’s IIR is calculated by multiplying the total number of Occupational Safety and Health Administration (“OSHA”) recordable injuries and illnesses at our operations by 200,000 and dividing that result by the total number of hours worked by all employees at our operations. In this formula, 200,000 represents the number of hours that would be worked by 100 employees working 40 hours per week, 50 weeks per year, and provides the standard base for calculating incidence rates for a year pursuant to OSHA guidance. This metric represented 7.5%, 6% and 5% of the STIP weighting for Messrs. Adnani, Obara and Melbye, respectively. An IIR below 3.2 represented the target level of performance, an IIR below 4.8 represented the threshold level of performance and an IIR below 1.6 and no work-related fatalities represented the breakthrough level of performance. The result was breakthrough performance at 200%. The Company achieved an IIR of zero for Fiscal 2023, having no work-related fatalities, recordable injuries or illnesses among employees at our operations.
Individual Performance: The Compensation Committee made a subjective determination of individual performance for each executive officer to determine whether the executive officer earned an award for performance in Fiscal 2023. For Fiscal 2023, this metric represented 20%, 40% and 50% of the STIP weighting for Messrs. Adnani, Obara and Melbye, respectively. Individual performance goals included maintaining a high performing leadership team, strategic planning and advancing growth objectives. Performance that qualified for an award at the threshold level was expected in normal operating circumstances, performance that qualified for an award at the target level was believed to be achievable only with additional efforts and results and performance that qualified for an award at the breakthrough level was determined to be achievable only with extraordinary efforts and results. The result was performance achieved at 200%, 200% and 60% for Messrs. Adnani, Obara and Melbye, respectively.
Review of Executive Officer Performance
On an annual basis, the Compensation Committee reviews the overall compensation package for our executive officers and evaluates executive officer performance relative to performance goals. The Compensation Committee has the opportunity to meet with the executive officers at various times throughout the year, which assists the Compensation Committee in forming its own assessment of each individual’s performance. The executive officers are not present during voting or deliberations of the Compensation Committee relating to their compensation. The Compensation Committee submits its recommendations regarding executive compensation to the Board of Directors for approval.
In Fiscal 2023 the following milestones were attained by the Company as a result of the success of the executives meeting their performance goals:
| ● |
we completed and filed TRS reports in accordance with S-K 1300 disclosing mineral resources for each of our Texas ISR Hub and Spoke, updated Wyoming ISR Hub and Spoke, Shea Creek, Horseshoe-Raven, Workman Creek and Roughrider Projects on August 11, 2022, September 14, 2022, January 13, 2023, January 24, 2023, March 16, 2023 and May 2, 2023, respectively; |
| ● |
we completed the acquisition of UEX on August 19, 2022, making us one of the largest diversified North American focused uranium companies; |
| ● |
we completed the acquisition of the Roughrider Project on October 14, 2022. The acquisition of the Roughrider Project represented an opportunity to scale-up in the high-grade Eastern Athabasca Basin of Saskatchewan, Canada; |
| ● |
we generated revenue of $164.0 million from sales of 3,150,000 pounds of uranium, which included $17.85 million from sales of 300,000 pounds of U.S. origin uranium concentrates to the U.S. Department of Energy; |
| ● |
we published our inaugural sustainability report; |
| ● |
we expanded licensed capacity to four million pounds of U3O8 annually at our Hobson Processing Facility, distinguishing the plant as having the largest licensed capacity in Texas and the second largest in the United States; |
| ● |
we defined Production Area 2 at our Burke Hollow Project in Texas; |
| ● |
we drilled 30 delineation holes at our Palangana Mine Production Area 4 in Texas; |
| ● |
we completed an initial phase of development and delineation drilling at our Irigaray and Christensen Ranch Projects in Wyoming; and |
| ● |
we commenced a drilling campaign at our 82.77% owned Christie Lake Project in Saskatchewan, Canada, and drilled 19,778.9 meters. |
Subsequent to Fiscal 2023:
| ● |
we completed the acquisition of a portfolio of exploration-stage projects in the high-grade Eastern Athabasca Basin of Saskatchewan, Canada, located within close proximity to our Roughrider Project, on August 4, 2023, including the Milliken, 60% owned Henday and 50% owned Carswell Projects. |
Long-Term Incentive (Equity)
The Company’s long-term incentive program (the “LTIP”) provides for, among other awards, the granting of stock options, performance stock options (“PSOs”), RSUs and PRSUs to executive officers to both motivate executive performance and retention, as well as to align executive officer performance to shareholder value creation. In awarding long-term incentives, the Company compares its long-term incentive program to the Peer Group and evaluates such factors as the number of shares available for awards under the Company’s Stock Incentive Plan and the number of awards outstanding relative to the number of shares outstanding.
Each long-term incentive grant is based on the level of the position held and overall market competitiveness. The Compensation Committee takes into consideration previous grants when it considers new grants of equity awards. The Compensation Committee administers the granting of equity awards in accordance with our Stock Incentive Plan.
In Fiscal 2019 the Compensation Committee considered the advice of GGA and the recommendations issued by leading independent proxy advisors and implemented a performance based long-term incentive award structure to more closely align pay with future performance.
In each of Fiscal 2021, 2022 and 2023 performance based long-term equity incentive plan awards were awarded to the executive officers in the form of PRSUs. The PRSUs are measured based on the Company’s three year total stockholder return relative to the Global X Uranium ETF. The PRSUs cliff vest and settle based on the achievement of the performance criteria at the end of 36 months. The number of PRSUs that may vest at the end of 36 months is contingent on the level of performance achieved and ranges from 0% to 200% of the PRSU target number of units. Regardless of the relative TSR performance of the Company versus the Global X Uranium ETF TSR, if the Company’s absolute share price is negative between the grant date and the 36th month share price, the maximum number of PRSUs that can vest is capped at 100%.
The following table summarizes the vesting schedule for outstanding PRSUs.
| Measurement Period |
Performance Criteria |
Company TSR vs. ETF TSR |
Performance Multiplier if Absolute Company TSR is Positive over the Measurement Period |
Performance Multiplier if Absolute Company TSR is Negative over the Measurement Period |
||||
| Grant date to end |
Three Year Relative Total |
Greater than -2,500 bps |
0% |
0% |
||||
| of 36-month | Stockholder Return against | -2,500 bps |
50% |
50% |
||||
| period | Global X Uranium ETF | 0 bps |
100% |
100% |
||||
| 2,500 bps |
200% |
100% |
In each of Fiscal 2021, 2022 and 2023 long-term equity incentive plan awards were awarded to the executive officers in the form of RSUs, which vest over 36 months.
In Fiscal 2023 performance based long-term equity incentive plan awards were awarded to the executive officers in the form of PSOs. The PSOs vest over 36 months. The PSOs had a premium exercise price at the time of grant set at 20% above the fair market value of the Company’s stock price at the time of grant and have a ten year term to expiry. The PSOs will only have value if the Company’s future stock price is accretive beyond the exercise price of the PSO awards. The PSOs were granted to provide an additional link to a longer-term performance period.
In Fiscal 2023 the Compensation Committee reviewed the market prevalence of long-term equity incentive plans within the Company’s Peer Group and determined that PRSUs, RSUs and PSOs were the most appropriate form of long-term equity incentive to grant in Fiscal 2023 due to market practice. The long-term equity incentive plan awards awarded to our executive officers in Fiscal 2023 are more particularly described below in the “Grants of Plan Based Awards” table.
The following table summarizes the LTIP grant mix for our executive officers for Fiscal 2023:
| Name and Principal Position |
Performance Vesting (% of Granted Units) |
Performance Vesting PRSUs (% of Granted Units) |
Time Vesting RSUs (% of Granted Units) |
| Amir Adnani President and Chief Executive Officer |
16% |
29% |
55% |
| Pat Obara Secretary, Treasurer and Chief Financial Officer |
16% |
29% |
55% |
| Scott Melbye Executive Vice President |
16% |
29% |
55% |
Other Non-Cash Compensation
The Company provides standard health benefits to its executive officers, including medical, dental and disability insurance.
The Company’s other non-cash compensation is intended to provide a similar level of benefits as those provided by comparable companies within our industry.
Executive Compensation
Amir Adnani, President and Chief Executive Officer
During Fiscal 2023, Amir Adnani, through an executive services agreement with Amir Adnani Corp. (“Adnani Corp.”), a private company over which Mr. Adnani exercises control, was retained to provide certain services to the Company, and his direct and indirect compensation as an executive officer of the Company is disclosed below in the “Summary Compensation Table”. The Company’s compensation policy for Mr. Adnani is based on comparisons of other companies’ remunerations made to their Presidents and Chief Executive Officers and the value of Mr. Adnani’s expertise to the Company.
As shown in the “Director Compensation” table below, Mr. Adnani does not receive additional compensation in connection with his service as a director of the Company.
Scott Melbye, Executive Vice President
Scott Melbye is retained according to an executive services agreement with our Company, and his compensation for serving as an executive officer of the Company is disclosed below in the “Summary Compensation Table”. The Company’s compensation policy for Mr. Melbye is based on comparisons of other companies’ remunerations made to their Executive Vice Presidents and the value of Mr. Melbye’s expertise to the Company.
Pat Obara, Secretary, Treasurer and Chief Financial Officer
We appointed Pat Obara as our Secretary, Treasurer and Chief Financial Officer of the Company effective on October 29, 2015. Mr. Obara served as our Chief Financial Officer from August 2006 to January 2011 and as our Vice President Administration from January 2011 to October 2015. Mr. Obara is retained according to an employment agreement with our Company, and his compensation for serving as an executive officer of the Company is disclosed below in the “Summary Compensation Table”. The Company’s compensation policy for Mr. Obara is based on comparisons of other companies’ remunerations made to their Chief Financial Officers and the value of Mr. Obara’s expertise to the Company.
Retirement, Resignation or Termination Plans
Company executive officers with contracts for services have notice requirements which permit pay in lieu of notice.
Each of the Company’s executive services arrangements with Messrs. Melbye and Obara and Adnani Corp. contemplates the case of termination due to various provisions whereby the named executive officers will receive termination payments, as described below under the heading “Executive Services Agreements”.
Compensation and Risk
We do not believe that our compensation policies and practices are reasonably likely to have a material adverse effect on us. We have taken steps to ensure that our executive compensation program does not incentivize risk outside the Company’s risk appetite. Some of the key ways that we currently manage compensation risk are as follows:
| ● |
appointed a Compensation Committee which is composed entirely of independent directors to oversee the executive compensation program; |
| ● |
retained an independent compensation advisor, GGA, to provide advice on the structure and levels of compensation for our executive officers and directors; |
| ● |
our STIP has a cap on the total amount of payment any position may receive; |
| ● |
the use of performance based long-term incentive compensation to encourage a focus on long-term corporate performance; |
| ● |
disclosure of executive compensation to stakeholders; |
| ● |
established a clawback policy applicable to all cash and equity incentive compensation; and |
| ● |
adoption of say-on-pay. |
Clawback Policy
We adopted a Clawback Policy as an additional safeguard to mitigate compensation risks (the “Clawback Policy”). The Clawback Policy applies to all cash and equity incentive compensation and provides that the Board of Directors may seek reimbursement for compensation awarded to an executive in situations where: (i) payment was predicated upon achieving certain financial results that were subsequently the subject of a substantial restatement of the Company’s financial statements filed with any securities regulatory authority; (ii) the executive engaged in gross negligence, intentional misconduct or fraud that caused, or partially caused, the need for a restatement; or (iii) the incentive compensation would have been lower had the financial results been properly reported. Our Clawback Policy is available on the Company’s website at www.uraniumenergy.com.
Anti-Hedging and Anti-Pledging Policy
We adopted an Anti-Hedging and Anti-Pledging Policy (the “Anti-Hedging and Anti-Pledging Policy”). The Anti-Hedging and Anti-Pledging Policy provides that, unless otherwise previously approved by our Corporate Governance and Nominating Committee, no director, officer or employee of the Company or its subsidiaries or, to the extent practicable, any other person (or their associates) in a special relationship (within the meaning of applicable securities laws) with the Company, may, at any time: (i) purchase financial instruments, including prepaid variable forward contracts, instruments for the short sale or purchase or sale of call or put options, equity swaps, collars, or units of exchangeable funds that are based on fluctuations of the Company’s debt or equity instruments and that are designed to or that may reasonably be expected to have the effect of hedging or offsetting a decrease in the market value of any securities of the Company; or (ii) purchase Company securities on a margin or otherwise pledge Company securities as collateral for a loan. Any violation of our Anti-Hedging and Anti-Pledging Policy will be regarded as a serious offence. Our Anti-Hedging and Anti-Pledging Policy is available on the Company’s website at www.uraniumenergy.com.
Stock Ownership Guidelines
We adopted Stock Ownership Guidelines for our executive officers to further align the interests of our executive officers and stockholders (the “Stock Ownership Guidelines”). The Stock Ownership Guidelines provide that each executive officer should attain a specified level of ownership of shares of the Company’s common stock equal to a multiple of their base compensation within five years of the executive officer’s first appointment to their role. The stock ownership requirement is three times (3x) base compensation for our President and Chief Executive Officer and one times (1x) base compensation for our other executive officers. The following table sets forth the total stock ownership and value thereof for each of our executive officers as of September 27, 2023.
| Executive Officer |
Total Stock Ownership |
Total Value of |
Stock Ownership Requirement |
Meets Stock Ownership Requirement |
| Amir Adnani President and Chief Executive Officer |
3,915,861 |
$17,033,995 |
$1,725,000 |
Yes |
| Pat Obara |
737,755 |
$3,209,234 |
$200,000 |
Yes |
| Scott Melbye Executive Vice President |
894,373 |
$3,890,523 |
$290,000 |
Yes |
Note:
(*) The total value of stock owned is based on the $4.35 average closing price of our common stock for the 57 days preceding September 27, 2023.
Consideration of Most Recent Shareholder Advisory Vote on Executive Compensation
As required by Section 14A of the Exchange Act, at our 2023 annual meeting of stockholders our stockholders voted, in an advisory manner, on a proposal to approve our named executive officer compensation. This was our most recent stockholder advisory vote to approve named executive officer compensation. The proposal was approved by our stockholders, receiving approximately 95% of the vote of the stockholders present in person or represented by proxy and voting at the meeting. We considered this vote to be a ratification of our current executive compensation policies and decisions and, therefore, did not make any significant changes to our executive compensation policies and decisions based on the vote.
Compensation Committee Interlocks and Insider Participation
No person who served as a member of our Compensation Committee during Fiscal 2023 was a current or former officer or employee of our Company or engaged in certain transactions with our Company required to be disclosed by regulations of the SEC. Additionally, during Fiscal 2023, there were no Compensation Committee “interlocks”, which generally means that no executive officer of our Company served: (i) as a member of the compensation committee (or other board committee performing equivalent functions or, in the absence of any such committee, the entire board of directors) of another entity which had an executive officer serving as a member of our Company’s Compensation Committee; (ii) as a director of another entity which had an executive officer serving as a member of our Company’s Compensation Committee; or (iii) as a member of the compensation committee (or other board committee performing equivalent functions or, in the absence of any such committee, the entire board of directors) of another entity which had an executive officer serving as a director of our Company.
Compensation Committee Report
The Compensation Committee has reviewed and discussed the foregoing compensation discussion and analysis with Company management. Based on that review and those discussions, the Compensation Committee recommended to the Board of Directors that the compensation discussion and analysis be included in this Annual Report. This report is provided by our independent directors, Vincent Della Volpe, David Kong and Gloria Ballesta, who comprise our Compensation Committee:
Summary Compensation Table
The following table sets forth the compensation paid to our Chief Executive Officer, Chief Financial Officer and those executive officers that earned in excess of $100,000 during the fiscal years ended July 31, 2023, 2022 and 2021 (each a “Named Executive Officer”):
| Name and Principal Position |
Year |
Salary (1) |
Bonus (2) |
Stock |
Option Awards (4) |
Non-Equity Incentive Plan |
Non-Qualified Deferred Compensation Earnings |
All Other Compensation |
Total |
||||||||||||||||||||||||
| Amir Adnani President and Chief Executive Officer |
2023 |
$ | 478,000 | $ | - | $ | 2,026,264 | (6) | $ | 240,516 | $ | 956,000 | $ | - | $ | - | $ | 3,700,780 | |||||||||||||||
| 2022 |
449,167 | 22,000 | 964,705 | (7) | - | 880,000 | - | - | 2,315,872 | ||||||||||||||||||||||||
| 2021 |
440,000 | 300,000 | 895,553 | (8) | - | - | - | - | 1,635,553 | ||||||||||||||||||||||||
| Pat Obara (9) Secretary, Treasurer and Chief Financial Officer |
2023 |
152,023 | - | 280,229 | (6) | 33,262 | 186,462 | - | - | 651,977 | |||||||||||||||||||||||
| 2022 |
156,877 | 7,087 | 201,820 | (7) | - | 150,011 | - | - | 515,795 | ||||||||||||||||||||||||
| 2021 |
141,309 | 50,000 | 255,292 | (8) | - | - | - | - | 446,601 | ||||||||||||||||||||||||
| Scott Melbye Executive Vice President |
2023 |
277,644 | - | 344,894 | (6) | 40,939 | 170,000 | - | - | 833,476 | |||||||||||||||||||||||
| 2022 |
263,862 | 12,500 | 264,893 | (7) | - | 150,000 | - | - | 691,255 | ||||||||||||||||||||||||
| 2021 |
250,000 | 50,000 | 255,292 | (8) | - | - | - | - | 555,292 | ||||||||||||||||||||||||
Notes:
| (1) |
These amounts represent fees paid by us to our Named Executive Officers during the year pursuant to various executive services agreements, between us and the Named Executive Officers, which are more particularly described below. For Fiscal 2021, these amounts include the following restitution payments: to Mr. Adnani: $71,507; to Mr. Obara: CAD$25,112; and to Mr. Melbye: $27,944. |
| (2) |
For Fiscal 2022, these amounts represent discretionary bonuses paid in the fiscal year. |
| (3) |
These amounts represent the aggregate grant date fair value of RSUs and PRSUs. For Fiscal 2023, the grant date fair value of each RSU is $3.32 per share based on the most recent closing price of our common stock as of the grant date of July 31, 2023, and the grant date fair value of each PRSU is $3.347257 per unit, which incorporates the potential to vest, depending on the performance, from 0% to 200% of the number of PRSUs. The fair value of each PRSU was calculated using the Monte Carlo simulation model. The following assumptions were used to value the PRSUs granted on July 31, 2023: expected risk free interest rate: 4.52%; expected volatility: 84.56%; expected dividend yield: 0%; expected life in years: 3.0; and correlation: 81.22%. For Fiscal 2022, the grant date fair value of each RSU is $3.98 per share based on the most recent closing price of our common stock as of the grant date of July 29, 2022, and the grant date fair value of each PRSU is $4.8033 per unit, which incorporates the potential to vest, depending on the performance, from 0% to 200% of the number of PRSUs. The fair value of each PRSU was calculated using the Monte Carlo simulation model. The following assumptions were used to value the PRSUs granted on July 29, 2022: expected risk free interest rate: 2.80%; expected volatility: 90.90%; expected dividend yield: 0%; expected life in years: 3.0; and correlation: 76.89%. For Fiscal 2021, the grant date fair value of each RSU is $2.15 per share based on the most recent closing price of our common stock as of the grant date of July 21, 2021, and the grant date fair value of each PRSU is $2.48 per unit, which incorporates the potential to vest, depending on the performance, from 0% to 200% of the number of PRSUs. The fair value of each PRSU was calculated using the Monte Carlo simulation model. The following assumptions were used to value the PRSUs granted on July 21, 2021: expected risk free interest rate: 0.39%; expected volatility: 78.03%; expected dividend yield: 0%; expected life in years: 3.0; and correlation: 66.02%. |
| (4) |
These amounts represent the aggregate grant date fair value of PSOs which was estimated using the Black-Scholes option pricing model. The following assumptions were used to value the PSOs granted on July 31, 2023: exercise price: $3.98; expected risk free interest rate: 4.137%; expected annual volatility: 79.457%; expected life in years: 5.0; expected annual dividend yield: $Nil; and Black-Scholes value: $2.092991. |
| (5) |
These amounts represent cash awards under our STIP. The payments for Fiscal 2023 and Fiscal 2022 were made after our year-end results were evaluated in August 2023 and August 2022, respectively. |
| (6) |
This amount represents the aggregate grant date fair value of RSUs and PRSUs granted on July 31, 2023. |
| (7) |
This amount represents the aggregate grant date fair value of RSUs and PRSUs granted on July 29, 2022. |
| (8) |
This amount represents the aggregate grant date fair value of RSUs and PRSUs granted on July 21, 2021. |
| (9) |
For each of Fiscal 2023, 2022 and 2021, the Company paid Mr. Obara in Canadian currency. For the purpose of reporting the base compensation paid to Mr. Obara, the compensation was converted from Canadian currency to U.S. currency at the Bank of Canada rate for the years ended July 31st. |
Grants of Plan Based Awards
We granted awards to the Named Executive Officers in Fiscal 2023, as follows:
| Estimated Future Payouts Under |
Estimated Future Payouts Under |
All Other Stock Awards: Number of Shares |
All Other Option Awards: Number of Securities |
Exercise Price of Option |
Grant Date Fair Value of Stock and Option |
||||||||||||||||||||||||||||||||||||||
| Name | Award Type (1) |
Grant Date | Threshold ($) |
Target ($) |
Maximum ($) |
Threshold |
Target |
Maximum |
of Stock or Units |
Underlying Options |
Awards ($) |
Awards ($) |
|||||||||||||||||||||||||||||||
| Amir Adnani President and Chief Executive Officer |
STIP |
August 1, 2022 |
167,300 | 334,600 | 956,000 | - | - | - | - | - | - | - | |||||||||||||||||||||||||||||||
| PSO |
July 31, 2023 |
- | - | - | - | - | - | - | 114,915 | 3.98 | 240,516 | (3) | |||||||||||||||||||||||||||||||
| RSU (6) |
July 31, 2023 |
- | - | - | - | - | - | 397,692 | - | - | 1,320,337 | (4) | |||||||||||||||||||||||||||||||
| PRSU (6) |
July 31, 2023 |
- | - | - | 105,449 | 210,897 | 421,795 | - | - | - | 705,926 | (5) | |||||||||||||||||||||||||||||||
| Pat Obara Secretary, Treasurer and Chief Financial Officer |
STIP |
August 1, 2022 |
36,127 | 72.254 | 186,462 | - | - | - | - | - | - | - | |||||||||||||||||||||||||||||||
| PSO |
July 31, 2023 |
- | - | - | - | - | - | - | 15,892 | 3.98 | 33,262 | (3) | |||||||||||||||||||||||||||||||
| RSU |
July 31, 2023 |
- | - | - | - | - | - | 55,000 | - | - | 182,600 | (4) | |||||||||||||||||||||||||||||||
| PRSU |
July 31, 2023 |
- | - | - | 14,584 | 29,167 | 58,333 | - | - | - | 97,629 | (5) | |||||||||||||||||||||||||||||||
| Scott Melbye Executive Vice President |
STIP |
August 1, 2022 |
53,320 | 106,640 | 262,500 | - | - | - | - | - | - | - | |||||||||||||||||||||||||||||||
| PSO |
July 31, 2023 |
- | - | - | - | - | - | - | 19,560 | 3.98 | 40,939 | (3) | |||||||||||||||||||||||||||||||
| RSU |
July 31, 2023 |
- | - | - | - | - | - | 67,692 | - | - | 224,737 | (4) | |||||||||||||||||||||||||||||||
| PRSU |
July 31, 2023 |
- | - | - | 17,949 | 35,897 | 71,795 | - | - | - | 120,156 | (5) | |||||||||||||||||||||||||||||||
Notes:
| (1) |
STIP – refers to awards under the Short-Term Incentive Plan; PSO – refers to performance stock options granted under our Stock Incentive Plan; RSU – refers to restricted stock units granted under our Stock Incentive Plan; and PRSU – refers to performance based restricted stock units granted under our Stock Incentive Plan. |
| (2) |
These figures represent possible payouts pursuant to the STIP for Fiscal 2023. |
| (3) |
These amounts represent the aggregate grant date fair value of PSOs which was estimated using the Black-Scholes option pricing model. The following assumptions were used to value the PSOs granted on July 31, 2023: exercise price: $3.98; expected risk free interest rate: 4.137%; expected annual volatility: 79.457%; expected life in years: 5.0; expected annual dividend yield: $Nil; and Black-Scholes value: $2.092991. |
| (4) |
The grant date fair value of each RSU is $3.32 per share based on the most recent closing price of our common stock as of the grant date of July 31, 2023. |
| (5) |
The grant date fair value of each PRSU is $3.347257 per unit, which incorporates the potential to vest, depending on the performance, from 0% to 200% of the number of PRSUs. The fair value of each PRSU was calculated using the Monte Carlo simulation model. The following assumptions were used to value the PRSUs granted on July 31, 2023: expected risk free interest rate: 4.52%; expected volatility: 84.56%; expected dividend yield: 0%; expected life in years: 3.0; and correlation: 81.22%. |
| (6) |
Indirectly held by the Named Executive Officer. |
Outstanding Equity Awards
The following table sets forth information as at July 31, 2023, relating to equity awards that have been granted to the Named Executive Officers:
| Option Awards |
Stock Awards | ||||||||||||||||||||||||||||||
| Name |
Award Type (1) |
Grant Date |
Number of Securities Underlying Unexercised Options Exercisable (#) |
Number of Securities Underlying Unexercised Options Unexercisable (#) |
Option Exercise Price ($) |
Option Expiration Date |
Number of Shares or Units of Stock That Have Not Vested (#) (2) |
Market Value of Shares or Units of Stock That Have Not Vested ($) (3) |
Equity Incentive Plan Awards: Number of Unearned Shares or Units of Stock That Have Not Vested (#) (4) |
Equity Incentive Plan Awards: Market or Payout Value of Unearned Shares or Units of Stock That Have Not Vested ($) (5) |
|||||||||||||||||||||
| Amir Adnani |
Option |
July 30, 2019 |
550,000 | - | 0.9421 | July 30, 2029 |
- | - | - | - | |||||||||||||||||||||
| President and Chief Executive Officer | Option |
July 16, 2020 |
150,000 | - | 0.91 | July 16, 2030 |
- | - | - | - | |||||||||||||||||||||
| PSO |
July 16, 2020 |
850,000 | - | 1.10 | July 16, 2030 |
- | - | - | - | ||||||||||||||||||||||
| PSO |
July 31, 2023 |
- | 114,915 | 3.98 | July 31, 2033 |
- | - | - | - | ||||||||||||||||||||||
| RSU |
July 21, 2021 |
- | - | - | 78,489 | 282,560 | - | - | |||||||||||||||||||||||
| RSU |
July 29, 2022 |
- | - | - | 96,081 | 345,892 | - | - | |||||||||||||||||||||||
| RSU (6) |
July 31, 2023 |
- | - | - | 397,692 | 1,431,691 | - | - | |||||||||||||||||||||||
| PRSU |
July 21, 2021 |
- | - | - | - | - | 156,977 | 389,303 | |||||||||||||||||||||||
| PRSU |
July 29, 2022 |
- | - | - | - | - | 81,424 | 391,104 | |||||||||||||||||||||||
| PRSU (6) |
July 31, 2023 |
- | - | - | - | - | 210,897 | 705,926 | |||||||||||||||||||||||
| Pat Obara |
Option |
July 30, 2019 |
200,000 | - | 0.9421 | July 30, 2029 |
- | - | - | - | |||||||||||||||||||||
| Secretary, Treasurer and Chief Financial Officer |
Option |
July 16, 2020 |
125,000 | - | 0.91 | July 16, 2030 |
- | - | - | - | |||||||||||||||||||||
| PSO |
July 16, 2020 |
250,000 | - | 1.10 | July 16, 2030 |
- | - | - | - | ||||||||||||||||||||||
| PSO |
July 31, 2023 |
- | 15,892 | 3.98 | July 31, 2033 |
- | - | - | - | ||||||||||||||||||||||
| RSU |
July 21, 2021 |
- | - | - | 22,375 | 80,550 | - | - | |||||||||||||||||||||||
| RSU |
July 29, 2022 |
- | - | - | 20,101 | 72,364 | - | - | |||||||||||||||||||||||
| RSU |
July 31, 2023 |
- | - | - | 55,000 | 198,000 | - | - | |||||||||||||||||||||||
| PRSU |
July 21, 2021 |
- | - | - | - | - | 44,749 | 110,978 | |||||||||||||||||||||||
| PRSU |
July 29, 2022 |
- | - | - | - | - | 17,034 | 81,819 | |||||||||||||||||||||||
| PRSU |
July 31, 2023 |
- | - | - | - | - | 29,167 | 97,629 | |||||||||||||||||||||||
| Scott Melbye |
Option |
July 30, 2019 |
125,000 | - | 0.9421 | July 30, 2029 |
- | - | - | - | |||||||||||||||||||||
| Executive Vice President |
Option |
July 16, 2020 |
125,000 | - | 0.91 | July 16, 2030 |
- | - | - | - | |||||||||||||||||||||
| PSO |
July 16, 2020 |
225,000 | - | 1.10 | July 16, 2030 |
- | - | - | - | ||||||||||||||||||||||
| PSO |
July 31, 2023 |
- | 19,560 | 3.98 | July 31, 2033 |
- | - | - | - | ||||||||||||||||||||||
| RSU |
July 21, 2021 |
- | - | - | 22,375 | 80,550 | - | - | |||||||||||||||||||||||
| RSU |
July 29, 2022 |
- | - | - | 26,382 | 94,975 | - | - | |||||||||||||||||||||||
| RSU |
July 31, 2023 |
- | - | - | 67,692 | 243,691 | - | - | |||||||||||||||||||||||
| PRSU |
July 21, 2021 |
- | - | - | - | - | 44,749 | 110,978 | |||||||||||||||||||||||
| PRSU |
July 29, 2022 |
- | - | - | - | - | 22,358 | 107,392 | |||||||||||||||||||||||
| PRSU |
July 31, 2023 |
- | - | - | - | - | 35,897 | 120,156 | |||||||||||||||||||||||
Notes:
| (1) |
Option – refers to stock options granted under our Stock Incentive Plan; PSO – refers to performance stock options granted under our Stock Incentive Plan; RSU – refers to restricted stock units granted under our Stock Incentive Plan; and PRSU – refers to performance based restricted stock units granted under our Stock Incentive Plan. |
| (2) |
RSUs granted on July 21, 2021 vest in substantially equal installments on each of July 21, 2022, 2023 and 2024. RSUs granted on July 29, 2022 vest in substantially equal installments on each of July 29, 2023, 2024 and 2025. RSUs granted on July 31, 2023 vest in substantially equal installments on each of July 31, 2024, 2025 and 2026. |
| (3) |
The value shown is based on the closing price of our common stock of $3.60 per share on July 31, 2023. |
| (4) |
Represents unearned shares under target PRSUs granted on July 21, 2021, July 29, 2022 and July 31, 2023. The PRSUs granted on July 21, 2021 cliff vest on July 21, 2024 depending on three-year relative TSR performance. The PRSUs granted on July 29, 2022 cliff vest on July 29, 2025 depending on three-year relative TSR performance. The PRSUs granted on July 31, 2023 cliff vest on July 31, 2026 depending on three-year relative TSR performance. |
| (5) |
The grant date fair value of each PRSU granted on July 21, 2021 is $2.48 per unit, which incorporates the potential to vest, depending on the performance, from 0% to 200% of the number of PRSUs. The fair value of each PRSU was calculated using the Monte Carlo simulation model. The following assumptions were used to value the PRSUs granted on July 21, 2021: expected risk free interest rate: 0.39%; expected volatility: 78.03%; expected dividend yield: 0%; expected life in years: 3.0; and correlation: 66.02%. The grant date fair value of each PRSU granted on July 29, 2022 is $4.8033 per unit, which incorporates the potential to vest, depending on the performance, from 0% to 200% of the number of PRSUs. The fair value of each PRSU was calculated using the Monte Carlo simulation model. The following assumptions were used to value the PRSUs granted on July 29, 2022: expected risk free interest rate: 2.80%; expected volatility: 90.90%; expected dividend yield: 0%; expected life in years: 3.0; and correlation: 76.89%. The grant date fair value of each PRSU granted on July 31, 2023 is $3.347257 per unit, which incorporates the potential to vest, depending on the performance, from 0% to 200% of the number of PRSUs. The fair value of each PRSU was calculated using the Monte Carlo simulation model. The following assumptions were used to value the PRSUs granted on July 31, 2023: expected risk free interest rate: 4.52%; expected volatility: 84.56%; expected dividend yield: 0%; expected life in years: 3.0; and correlation: 81.22%. |
| (6) |
Indirectly held by the Named Executive Officer. |
| (7) |
Stock options granted on July 30, 2019 and July 16, 2020 vest as to one-eighth on each day which is three and six months, respectively, from the date of grant and one-quarter on each day which is 12, 18 and 24 months, respectively, from the date of grant. PSOs granted on July 16, 2020 vest in substantially equal installments on each of July 16, 2021, 2022 and 2023. PSOs granted on July 31, 2023 vest in substantially equal installments on each of July 31, 2024, 2025 and 2026. |
Option Exercises and Stock Vested
The following table sets forth the value realized on stock options exercised and stock awards vested for the Named Executive Officers for Fiscal 2023:
|
|
Option Awards |
Stock Awards |
||||||||||||||
| Name | Number of Shares Acquired on Exercise |
Value Realized |
Number of Shares |
Value Realized on Vesting (2) ($) |
||||||||||||
| Amir Adnani, President and Chief Executive Officer |
236,964 | 1,115,250 | 259,861 | 827,438 | ||||||||||||
| Pat Obara, Secretary, Treasurer and Chief Financial Officer |
77,541 | 366,000 | 71,590 | 227,383 | ||||||||||||
| Scott Melbye, Executive Vice President |
75,000 | 126,000 | 63,898 | 204,014 | ||||||||||||
Notes:
| (1) |
This amount represents the difference between the closing price of our common stock on the date of exercise and the exercise price of the stock option. |
| (2) |
These amounts represent the number of RSUs vested multiplied by the closing price of our common stock on each of the vesting dates and is calculated before payment of any applicable withholding taxes. |
No Pension Benefits
The Company does not maintain any plan that provides for payments or other benefits to its executive officers at, following or in connection with their retirement and including, without limitation, any tax-qualified defined benefit plans or supplemental executive retirement plans.
No Nonqualified Deferred Compensation
The Company does not maintain any defined contribution or other plan that provides for the deferral of compensation on a basis that is not tax-qualified.
Director Compensation
Our non-executive directors receive an annual retainer consisting of cash and equity compensation for their annual service. The value and form of equity awards granted to each director is based on the experience of the director, time spent on Company matters and the compensation paid to directors of other companies in the industry. In Fiscal 2023 RSUs and stock options were awarded to our non-executive directors. The RSUs vest over 36 months. The stock options vest over 24 months.
The following table sets forth information relating to compensation paid to our directors for Fiscal 2023:
| Name (1) |
Fees Earned Or Paid In Cash |
Stock |
Option Awards (3) |
Non-Equity Incentive Plan Compensation |
Non-Qualified Deferred Compensation Earnings |
All |
Total |
|||||||||||||||||||||
| Spencer Abraham |
$ | 157,500 | $ | 127,694 | $ | 127,876 | $ | - | $ | - | $ | - | $ | 413,070 | ||||||||||||||
| David Kong |
23,474 | 51,078 | 51,151 | - | - | - | 125,703 | |||||||||||||||||||||
| Vincent Della Volpe |
31,500 | 51,078 | 51,151 | - | - | - | 133,729 | |||||||||||||||||||||
| Ganpat Mani (4) |
26,250 | - | - | - | - | - | 26,250 | |||||||||||||||||||||
| Gloria Ballesta |
23,474 | 51,078 | 51,151 | - | - | - | 125,703 | |||||||||||||||||||||
| Trecia Canty (5) |
11,768 | 51,078 | 51,151 | - | - | - | 113,997 | |||||||||||||||||||||
Notes:
| (1) |
Information for Mr. Adnani is disclosed above in the “Summary Compensation Table” and is not reported in the “Director Compensation” table of this Annual Report. |
| (2) |
These amounts represent the grant date fair value of RSUs. The grant date fair value of each RSU is $3.32 per share based on the most recent closing price of our common stock as of the grant date of July 31, 2023. RSUs granted on July 31, 2023 vest in substantially equal installments on each of July 31, 2024, 2025 and 2026. |
| (3) |
These amounts represent the grant date fair value of the stock options which was estimated using the Black-Scholes option pricing model. The following assumptions were used to value the stock options granted on July 31, 2023: exercise price: $3.32; expected risk free interest rate: 4.137%; expected annual volatility: 79.457%; expected life in years: 5.0; expected annual dividend yield: $Nil; and Black-Scholes value: $2.20. |
| (4) |
Mr. Mani ceased serving as a director of the Company on July 20, 2023. |
| (5) |
Ms. Canty was appointed as a director of the Company on March 17, 2023. |
As at July 31, 2023, our directors held stock options to acquire an aggregate of 2,559,004 shares of our common stock as follows: Spencer Abraham: 127,967 stock options; Amir Adnani: 1,664,915 stock options including PSOs; David Kong: 213,995 stock options; Vincent Della Volpe: 210,954 stock options; Gloria Ballesta: 217,954 stock options; and Trecia Canty: 123,219 stock options.
Spencer Abraham has served as Chairman (non-executive) of our Board of Directors since March 2, 2017. Mr. Abraham served as Executive Chairman from October 14, 2015 to March 2, 2017, and as Chairman of our Advisory Board from December 2012 to October 2015. Mr. Abraham is retained according to an appointment letter with our Company. In Fiscal 2023, Mr. Abraham was compensated at a rate of $10,500 per month, paid in monthly installments, and $31,500 per year, paid in quarterly installments, for his services as a director of the Company. Effective from August 1, 2023, the monthly fee payable to Mr. Abraham was increased to $14,166.67 and the annual fee payable to Mr. Abraham remains set at $31,500. The compensation paid to Mr. Abraham is more particularly described below under “Director Services Agreement”.
Amir Adnani serves as the Company’s Chief Executive Officer, President and a director. Within his capacity as President and Chief Executive Officer, and through an executive services agreement with a private company, Adnani Corp., controlled by Mr. Adnani, he provides various consulting services to the Company. Mr. Adnani does not receive additional compensation in connection with his service as a director of the Company. Mr. Adnani’s direct and indirect compensation as an executive officer of the Company is disclosed above in the “Summary Compensation Table”.
In Fiscal 2023 David Kong, Vincent Della Volpe, Ganpat Mani, Gloria Ballesta and Trecia Canty served as independent directors of the Company. Mr. Kong serves as the Company’s lead independent director and as Chairperson of each of the Company’s Audit Committee and Sustainability Committee. Mr. Della Volpe serves as Chairperson of each of the Company’s Compensation Committee and Corporate Governance and Nominating Committee.
The Company’s independent directors are retained on a yearly basis for their services and are paid quarterly based on annual retainer fees. In Fiscal 2023 the annual retainer fees paid to our independent directors were as follows: David Kong: CAD$31,500 per year; Vincent Della Volpe: $31,500 per year; Ganpat Mani: $26,250 per year; Gloria Ballesta: CAD$31,500 per year; and Trecia Canty: $31,500 per year. Ms. Canty was appointed as a director of the Company on March 17, 2023. Mr. Mani did not stand for re-election at the Company’s 2023 annual meeting of stockholders.
The amounts listed above were all-inclusive retainer fees and there were no additional Committee and/or Chairperson fees or meeting attendance fees in Fiscal 2023.
In addition to such retainers, our directors may, from time to time, receive equity compensation, which is granted on a discretionary basis. The value and form of equity compensation granted is based on the experience of the director, time spent on Company matters and a comparison of the compensation paid to directors of other companies in the industry.
Standard retainer amounts paid to directors, as well as any equity compensation is determined by the Company’s Compensation Committee and ratified by the Board of Directors.
Effective from August 1, 2023, the annual retainer fees paid to our non-executive directors increased and additional annual retainer fees are paid for serving as Chairperson and/or member of each of the standing committees.
Effective from August 1, 2023, the annual retainer fees paid to our non-executive directors are as follows:
| Board Position |
Retainer |
| Chairperson |
$170,000 |
| Non-Executive Director |
$33,000 |
| Audit Committee Chairperson |
$10,000 |
| Committee Chairperson other than Audit (1) |
$5,000 |
| Committee Members including the Chairperson (2) |
$5,000 |
Notes:
| (1) |
Committee Chairperson retainers applicable to the Compensation Committee, the Corporate Governance and Nominating Committee and the Sustainability Committee. |
| (2) |
Committee Member retainers applicable to the Audit Committee, the Compensation Committee, the Corporate Governance and Nominating Committee and the Sustainability Committee. Each Committee Chairperson also receives the base Committee Member retainer. |
Pay Ratio
As required by the Dodd-Frank Wall Street Reform and Consumer Protection Act, and Item 402(u) of Regulation S-K, we are providing the following information about the relationship of the annual total compensation of our employees and the annual total compensation of Amir Adnani, our President and Chief Executive Officer (“CEO”; and the “CEO Pay Ratio”). For Fiscal 2023, our last completed fiscal year:
| ● |
the median of the annual total compensation of all employees of our Company (other than our CEO) was $81,061; and |
| ● |
the annual total compensation of our CEO, as reported in the Summary Compensation Table above, was $3,700,780. |
Based on this information, for Fiscal 2023 the ratio of the annual total compensation of our CEO to the median of the annual total compensation of all employees was approximately 46 to 1.
We believe our CEO Pay Ratio for Fiscal 2023 demonstrates our pay-for-performance philosophy. Our compensation program consists of both fixed and variable components and is designed to motivate all employees to produce superior short and long-term corporate performance. The ratio of our CEO’s base compensation to the base compensation of our median employee was approximately 46 to 1 because our compensation philosophy aims to position the fixed portion of our CEO’s compensation near the 50th percentile of his position per the review conducted by GGA. Given our CEO’s level of responsibility, experience and potential, the Compensation Committee awards the CEO a mix of compensation with a higher variable component (i.e., annual bonus, PSOs, RSUs and PRSUs) that is based upon individual performance. As a result, a substantial percentage of our CEO’s total compensation is at risk every year, providing our CEO with greater incentive to increase shareholder value and improve corporate performance over the long term.
To identify the median of the annual total compensation of all our employees, we took the following steps:
| ● |
we selected July 31, 2023 as the date upon which we would identify the median employee to allow sufficient time to identify the median employee given the global scope of our operations; |
| ● |
we determined that, as of July 31, 2023, our employee population consisted of approximately 82 individuals working for us and our consolidated subsidiaries, with approximately 52% of these individuals located in the United States, 31% in Canada and 17% in Paraguay. This population consisted of our full-time employees. We do not have part-time, temporary and seasonal employees; |
| ● |
to identify the median employee from our employee population, we examined the annual base compensation and annual bonus target for Fiscal 2023 for all full-time, part-time and temporary employees employed by us and our consolidated subsidiaries at the start of business on July 31, 2023. We believe that these pay elements are appropriate because it was impractical to gather actual data from multiple payroll systems utilized to pay our worldwide workforce, and the actual achievement of the variable portion of compensation can vary widely from year to year; |
| ● |
we annualized compensation for any permanent employees that were only employed for part of Fiscal 2023; |
| ● |
no adjustments were made for cost-of-living differences; |
| ● |
an average exchange rate for the U.S. dollar for Fiscal 2023 was applied to compensation reported in a foreign currency; and |
| ● |
all employees except for our CEO were ranked from lowest to highest with the median determined from this list. |
Once we identified our median employee, we combined all of the elements of such employee’s compensation for Fiscal 2023 in accordance with the requirements of Item 402(c)(2)(x) of Regulation S-K, resulting in annual total compensation of $81,061. With respect to the annual total compensation of our CEO, we used the amount reported in the “Total” column of our “Summary Compensation Table” included above.
The CEO Pay Ratio reported above is a reasonable estimate calculated in a manner consistent with SEC rules, based on our internal records and the methodology described above. The SEC rules for identifying the median compensated employee allow companies to adopt a variety of methodologies, to apply certain exclusions and to make reasonable estimates and assumptions that reflect their employee populations and compensation practices. Accordingly, the pay ratio reported by other companies may not be comparable to the pay ratio reported above, as other companies have different employee populations and compensation practices and may use different methodologies, exclusions, estimates and assumptions in calculating their own pay ratios.
Executive Services Agreements
Adnani Executive Services Agreement
On July 24, 2013, our Board of Directors approved the entering into of an executive services agreement with Adnani Corp. with an initial term commencing retroactively on July 1, 2013 and expiring on July 1, 2016, as amended by a letter agreement dated August 1, 2015 (collectively the “Adnani Agreement”).
The Adnani Agreement is subject to automatic renewal on a three-month to three-month term renewal basis unless either the Company or Adnani Corp. provides written notice not to renew the Adnani Agreement no later than 90 days prior to the end of the then current or renewal term.
Pursuant to the terms and provisions of the Adnani Agreement: (i) through Adnani Corp., Mr. Adnani provides various consulting services to the Company which are in addition to his duties and responsibilities as our President and Chief Executive Officer; and (ii) we shall pay to Adnani Corp. a monthly fee of $34,000. In consultation with the Compensation Committee and Board of Directors, effective on May 1, 2016, the monthly fee payable to Adnani Corp. was reduced on a non-accrued basis, from its original and stated amount to $30,600, of which a portion was paid in shares of common stock in lieu of cash at the discretion of the Compensation Committee to alter from time to time. Effective on April 1, 2020, due to the COVID-19 pandemic, the monthly fee payable to Adnani Corp. was reduced on a non-accrued basis from its original and stated amount to $16,830. Effective on October 1, 2020 and again effective on May 31, 2021, the monthly fee payable to Adnani Corp. was reinstated to the levels in effect prior to April 1, 2020 and May 1, 2016, respectively. Effective on May 31, 2021 and again effective on March 1, 2022, the monthly fee payable to Adnani Corp. was increased to $36,666 and $38,500, respectively. Effective on August 1, 2022 and again effective on August 1, 2023, respectively, the monthly fee payable to Adnani Corp. was increased to $39,833 and $47,916.67, respectively.
If the Company elects to not renew the Adnani Agreement, and provided that Adnani Corp. is in compliance with the relevant terms and conditions of the Adnani Agreement, the Company shall be obligated to provide a termination package to Adnani Corp. as follows: (i) a cash payment equating to an aggregate of four months of the then monthly fee for each full year, and any portion thereof, of the initial term effective from July 23, 2009 and any renewal period during which the Adnani Agreement was in force and effect and during which Adnani Corp. rendered services thereunder, together with a cash payment equating to Adnani Corp.’s average annual bonus during the most recent two years, payable by the Company to Adnani Corp. within 14 calendar days of the effective termination date; (ii) any expense payment reimbursements which would then be due and owing by the Company to Adnani Corp. to the effective termination date, payable within 14 calendar days of the effective termination date (the “Adnani Outstanding Expense Reimbursements”); (iii) subject to applicable provisions of the Adnani Agreement and the Company’s Stock Incentive Plan, all of Mr. Adnani’s then issued and outstanding stock-based equity awards in and to the Company as at the effective termination date shall immediately vest, if not otherwise vested, and shall continue to be exercisable for a period of two years from the effective termination date (the “Adnani Options Extension”); and (iv) confirmation that all of Adnani Corp.’s and Mr. Adnani’s then benefits coverage would be extended to Mr. Adnani for a period ending two years from the effective termination date (the “Adnani Benefits Extension”).
If the Company elects to terminate the Adnani Agreement without just cause (as defined therein), or if Adnani Corp. terminates the Adnani Agreement for just cause, and provided that Adnani Corp. is in compliance with the relevant terms and conditions of the Adnani Agreement, the Company shall be obligated to provide a termination package to Adnani Corp. as follows: (i) a cash payment equating to an aggregate of 24 months of the then monthly fee, together with a cash payment equating to two times the sum of Adnani Corp.’s average annual bonus during the most recent two years, payable by the Company to Adnani Corp. within 14 calendar days of the effective termination date; (ii) all Adnani Outstanding Expense Reimbursements; (iii) subject to applicable provisions of the Adnani Agreement, the Adnani Options Extension; and (iv) the Adnani Benefits Extension.
If Adnani Corp. elects to terminate the Adnani Agreement for good reason (as defined therein) and including, without limitation, a material diminution of Mr. Adnani’s duties, a failure of the Company to deliver a written agreement to be entered into with any successor, assignee or transferee of the Company to assume and agree to perform the Adnani Agreement, a failure of the Company to pay remuneration or any other breach by the Company of a material provision of the Adnani Agreement, and provided that Adnani Corp. is in compliance with the relevant terms and conditions of the Adnani Agreement, the Company shall be obligated to provide a termination package to Adnani Corp. as follows: (i) a cash payment equating to an aggregate of 18 months of the then monthly fee, together with a cash payment equating to one and one-half times the sum of Adnani Corp.’s average annual bonus during the most recent two years, payable by the Company to Adnani Corp. over a period of 12 months from the effective termination date; (ii) all Adnani Outstanding Expense Reimbursements; (iii) subject to applicable provisions of the Adnani Agreement, the Adnani Options Extension; and (iv) the Adnani Benefits Extension.
If Adnani Corp. elects to terminate the Adnani Agreement, except for just cause, or if the Company terminates the Adnani Agreement for just cause, Adnani Corp. is not entitled to a termination package of any kind.
The Adnani Agreement will be deemed terminated on the 30th calendar day following the death or disability of Mr. Adnani, in which case the Company shall be obligated to provide a termination package to Adnani Corp. or Mr. Adnani’s estate as follows, provided that Adnani Corp. is or was in compliance with the relevant terms and conditions of the Adnani Agreement: (i) a cash payment equating to an aggregate of 12 months of the then monthly fee, together with a cash payment equating to Adnani Corp.’s average annual bonus during the most recent two years, payable by the Company to Adnani Corp. or Mr. Adnani’s estate within 14 calendar days of the effective termination date; (ii) all Adnani Outstanding Expense Reimbursements; and (iii) subject to applicable provisions of the Adnani Agreement, the Adnani Options Extension.
Melbye Executive Employment Agreement
On December 15, 2014, our Board of Directors approved the entering into of an executive services agreement with Scott Melbye, as amended by a letter agreement, dated for reference effective as at May 1, 2016, with an initial term commencing retroactively on September 1, 2014 and expiring on February 28, 2017 (collectively, the “Melbye Agreement”).
The Melbye Agreement is subject to automatic renewal on a one-month to one-month term renewal basis unless either the Company or Mr. Melbye provides written notice not to renew the Melbye Agreement no later than 30 calendar days prior to the end of the then current or renewal term.
Pursuant to the terms and provisions of the Melbye Agreement: (i) Mr. Melbye shall provide duties to us commensurate with his position as our Executive Vice President; and (ii) we shall pay to Mr. Melbye a monthly fee of $20,833. In consultation with the Compensation Committee and Board of Directors, effective on May 1, 2016, the monthly fee payable to Mr. Melbye was reduced on a non-accrued basis, from its original and stated amount to $18,750. Effective on June 1, 2016, a portion of monthly fees were paid in shares of common stock in lieu of cash at the discretion of the Company management to alter from time to time. Effective on April 1, 2020, due to the COVID-19 pandemic, the monthly fee payable to Mr. Melbye was reduced on a non-accrued basis from its original and stated amount to $12,187.50. Effective on October 1, 2020 and again effective on May 31, 2021, the monthly fee payable to Mr. Melbye was reinstated to the levels in effect prior to April 1, 2020 and May 1, 2016, respectively. Effective on March 1, 2022, and again effective on August 1, 2023, the monthly fee payable to Mr. Melbye was increased to $21,875 and $24,166.67, respectively.
If the Company elects to not renew the Melbye Agreement, and provided that Mr. Melbye is in compliance with the relevant terms and conditions of the same, the Company shall be obligated to provide a severance package to Mr. Melbye as follows: (i) a cash payment equating to any outstanding fees and bonuses which would then be due and owing by the Company to Mr. Melbye to the effective termination date, payable within 14 calendar days of the effective termination date (the “Melbye Outstanding Fees and Bonuses”); (ii) any expense payment reimbursements which would then be due and owing by the Company to Mr. Melbye to the effective termination date, payable within 14 calendar days of the effective termination date (the “Melbye Outstanding Expense Reimbursements”); (iii) any pro rata and unused vacation pay which would then be due and owing by the Company to Mr. Melbye to the effective termination date, payable within 14 calendar days of the effective termination date (the “Melbye Outstanding Vacation Pay”); (iv) subject to applicable provisions of the Melbye Agreement and the Company’s Stock Incentive Plan, all of Mr. Melbye’s then issued and outstanding stock-based equity awards in and to the Company as at the effective termination date shall immediately vest, if not otherwise vested, and shall continue to be exercisable for a period of 90 calendar days from the effective termination date (the “Melbye Options Extension”); and (v) confirmation that all of Mr. Melbye’s then benefits coverage would be extended to Mr. Melbye for a period ending 90 calendar days from the effective termination date (the “Melbye Benefits Extension”).
If the Company elects to terminate the Melbye Agreement without just cause (as defined therein), or if Mr. Melbye terminates the Melbye Agreement for just cause, and provided that Mr. Melbye is in compliance with the relevant terms and conditions of the same, the Company shall be obligated to provide a severance package to Mr. Melbye as follows: (i) all Melbye Outstanding Fees and Bonuses, together with a cash payment equating to any additional fees which Mr. Melbye would have been entitled to receive until the end of the applicable initial term or renewal period; (ii) all Melbye Outstanding Expense Reimbursements; (iii) all Melbye Outstanding Vacation Pay; (iv) the Melbye Options Extension; and (v) the Melbye Benefits Extension.
If Mr. Melbye elects to terminate the Melbye Agreement, except for just cause, and provided that Mr. Melbye is in compliance with the relevant terms and conditions of the Melbye Agreement, the Company shall be obligated to provide a severance package to Mr. Melbye as follows: (i) all Melbye Outstanding Fees and Bonuses; (ii) all Melbye Outstanding Expense Reimbursements; (iii) all Melbye Outstanding Vacation Pay; and (iv) subject to applicable provisions of the Melbye Agreement, all of Mr. Melbye’s then issued and outstanding stock-based equity awards in and to the Company that have vested as at the effective termination date shall continue to be exercisable for a period of 90 calendar days from the effective termination date.
If the Company elects to terminate the Melbye Agreement for just cause, the Company shall be obligated to provide a severance package to Mr. Melbye as follows: (i) a cash payment equating to any outstanding fees which would then be due and owing by the Company to Mr. Melbye to the effective termination date, payable within 14 calendar days of the effective termination date; (ii) all Melbye Outstanding Expense Reimbursements; and (iii) all Melbye Outstanding Vacation Pay.
The Melbye Agreement will be deemed terminated on the 30th calendar day following the death or disability of Mr. Melbye, in which case the Company shall be obligated to provide a severance package to Mr. Melbye or Mr. Melbye’s estate as follows, provided that Mr. Melbye is or was in compliance with the relevant terms and conditions of the Melbye Agreement: (i) all Melbye Outstanding Fees and Bonuses; (ii) all Melbye Outstanding Expense Reimbursements; (iii) all Melbye Outstanding Vacation Pay; and (iv) subject to applicable provisions of the Melbye Agreement, all of Mr. Melbye’s then issued and outstanding stock-based equity awards in and to the Company that have vested as at the effective termination date shall continue to be exercisable for a period of one year from the effective termination date.
Obara Employment Arrangement
In Fiscal 2016 we effected an employment arrangement with Mr. Obara (the “Obara Employment Arrangement”). The Obara Employment Arrangement is subject to automatic renewal on a three-month to three-month basis unless the Company provides written notice not to renew the Obara Employment Arrangement no later than 90 days prior to the end of the then current or renewal term.
Pursuant to the terms of the Obara Employment Arrangement: (i) Mr. Obara provides various employment services to the Company which are inclusive of his duties and responsibilities as our Secretary, Treasurer and Chief Financial Officer; (ii) we currently pay to Mr. Obara a monthly employment salary of $16,666.67; (iii) Mr. Obara is entitled to participate in the Company’s group benefits plan; and (iv) Mr. Obara is entitled to four weeks’ paid vacation per year of employment.
If the Company elects to not renew the Obara Employment Agreement or any party elects to terminate the Obara Employment Agreement, Mr. Obara’s obligation to provide the services to the Company will continue only until the effective termination date and the Company shall be obligated to provide to Mr. Obara: (i) any fees which would then be due and owing by the Company to Mr. Obara to the effective termination date; (ii) any expense payment reimbursements which would then be due and owing by the Company to Mr. Obara to the effective termination date; (iii) any pro rata and unused vacation pay which would then be due and owing by the Company to Mr. Obara to the effective termination date; (iv) subject to applicable provisions of the Obara Employment Agreement and the Company’s Stock Incentive Plan, the vested portion of all Mr. Obara’s then issued and outstanding stock-based equity awards in and to the Company as at the effective termination date shall continue to be exercisable for a period of 90 calendar days following the effective termination date; and (v) confirmation that all of Mr. Obara’s then benefits coverage would be covered until the effective termination date.
Director Services Agreement
Abraham Agreement
On October 14, 2015, our Board of Directors approved the entering into of an appointment letter with Spencer Abraham dated for reference effective as at October 1, 2015 (the “Abraham Agreement”).
Pursuant to the Abraham Agreement, Mr. Abraham was appointed as non-executive Chairman of our Board of Directors and shall provide duties to us commensurate with his position. In Fiscal 2023, Mr. Abraham was compensated at a rate of $10,500 per month and an annual fee of $31,500 per year for his services as a director of our Company. Effective on August 1, 2023, the monthly fee payable to Mr. Abraham was increased to $14,166.67 and the annual fee payable to Mr. Abraham remains set at $31,500.
Item 12. Security Ownership of Certain Beneficial Owners and Management and Related Stockholder Matters
The following table sets forth information regarding the beneficial ownership of our common stock as of September 27, 2023, by:
| ● |
each person who is known by us to beneficially own more than 5% of our shares of common stock; and |
| ● |
each executive officer, each director and all of our directors and executive officers as a group. |
The number of shares beneficially owned and the related percentages are based on 385,848,443 shares of common stock outstanding as of September 27, 2023.
For the purposes of the information provided below, shares that may be issued upon the exercise or conversion of stock options, warrants and other rights to acquire shares of our common stock that are exercisable or convertible within 60 days following September 27, 2023, are deemed to be outstanding and beneficially owned by the holder for the purpose of computing the number of shares and percentage ownership of that holder, but are not deemed to be outstanding for the purpose of computing the percentage ownership of any other person.
| Name and Address of Beneficial Owner (1) |
Amount and Nature of |
Percentage of |
| Directors and Executive Officers: |
||
| Amir Adnani |
5,468,861 (2) |
1.4% |
| Spencer Abraham |
701,159 (3) |
* |
| David Kong |
330,804 (4) |
* |
| Vincent Della Volpe |
452,000 (5) |
* |
| Trecia Canty |
27,902 (6) |
* |
| Gloria Ballesta |
268,852 (7) |
* |
| Pat Obara |
1,312,755 (8) |
* |
| Scott Melbye 500 North Shoreline Boulevard, Suite 800N Corpus Christi, Texas, U.S.A., 78401 |
1,369,373 (9) |
* |
| All directors and executive officers as a group |
9,931,742 (10) |
2.6% |
| Major Stockholders: |
||
| The Vanguard Group |
21,010,864 (11) |
5.4% |
| BlackRock, Inc. |
24,050,662 (12) |
6.2% |
| MMCAP International Inc. SPC MM Asset Management Inc. c/o Mourant Governance Services (Cayman) Limited 94 Solaris Avenue Camana Bay, P.O. Box 1348 Grand Cayman, KY1-1108, Cayman Islands |
19,720,259 (13) | 5.1% |
Notes:
| * |
Less than one percent. |
| (1) |
Under Rule 13d-3 of the Exchange Act, a beneficial owner of a security includes any person who, directly or indirectly, through any contract, arrangement, understanding, relationship or otherwise, has or shares: (i) voting power, which includes the power to vote, or to direct the voting of such security; and (ii) investment power, which includes the power to dispose or direct the disposition of the security. Certain shares of common stock may be deemed to be beneficially owned by more than one person (if, for example, persons share the power to vote or the power to dispose of the shares). In addition, shares of common stock are deemed to be beneficially owned by a person if the person has the right to acquire the shares (for example, upon exercise of an option) within 60 days of the date as of which the information is provided. In computing the percentage ownership of any person, the amount of shares of common stock outstanding is deemed to include the amount of shares beneficially owned by such person (and only such person) by reason of these acquisition rights. As a result, the percentage of outstanding shares of common stock of any person as shown in this table does not necessarily reflect the person’s actual ownership or voting power with respect to the number of shares of common stock actually outstanding as of the date hereof. As of September 27, 2023, there were 385,848,443 shares of common stock of the Company issued and outstanding. |
| (2) |
This figure represents (i) 3,915,861 shares of our common stock, (ii) 3,000 shares of our common stock held of record by Mr. Adnani’s wife and (iii) stock options to purchase 1,550,000 shares of our common stock, which have vested or will vest within 60 days of the date hereof. |
| (3) |
This figure represents (i) 642,903 shares of our common stock and (ii) stock options to purchase 58,256 shares of our common stock, which have vested or will vest within 60 days of the date hereof. |
| (4) |
This figure represents (i) 147,835 shares of our common stock and (ii) stock options to purchase 183,005 shares of our common stock, which have vested or will vest within 60 days of the date hereof. |
| (5) |
This figure represents (i) 270,095 shares of our common stock and (ii) stock options to purchase 181,905 shares of our common stock, which have vested or will vest within 60 days of the date hereof. |
| (6) |
This figure represents stock options to purchase 27,902 shares of our common stock, which have vested or will vest within 60 days of the date hereof. |
| (7) |
This figure represents (i) 80,917 shares of our common stock and (ii) stock options to purchase 187,935 shares of our common stock, which have vested or will vest within 60 days of the date hereof. |
| (8) |
This figure represents (i) 737,755 shares of our common stock and (ii) stock options to purchase 575,000 shares of our common stock, which have vested or will vest within 60 days of the date hereof. |
| (9) |
This figure represents (i) 894,373 shares of our common stock and (ii) stock options to purchase 475,000 shares of our common stock, which have vested or will vest within 60 days of the date hereof. |
| (10) |
This figure represents (i) 6,692,739 shares of our common stock and (ii) stock options to purchase 3,239,003 shares of our common stock, which have vested or will vest within 60 days of the date hereof. |
| (11) |
This information is based on a Schedule 13G filed with the SEC by The Vanguard Group on February 9, 2023. |
| (12) |
This information is based on a Schedule 13G/A filed with the SEC by BlackRock, Inc. on February 1, 2023. |
| (13) | This figure represents (i) 18,944,369 shares of our common stock and (ii) stock purchase warrants to purchase 775,890 shares of our common stock. This information is based on a Schedule 13G filed with the SEC jointly by MMCAP International Inc. SPC and MM Asset Management Inc. on September 27, 2023, which both have shared voting and dispositive power over such shares. MM Asset Management Inc.’s address is 161 Bay Street, TD Canada Trust Tower Suite 2240, Toronto, Ontario, Canada, M5J 2S1. |
Changes in Control
We have no knowledge of any arrangements, including any pledge by any person of our securities, the operation of which may, at a subsequent date, result in a change in our control.
Item 13. Certain Relationships and Related Transactions, and Director Independence
Related Party Transactions
Except as described in this Annual Report, the Company was not involved in any transactions during Fiscal 2023, and is not involved in any currently proposed transaction, in which the Company was or is to be a participant and the amount involved exceeds $120,000 in which a related person had or will have a direct or indirect material interest.
During Fiscal 2023 and Fiscal 2022, the Company incurred $86,485 and $9,171, respectively, in G&A costs paid to Blender Media Inc. (“Blender”), a company controlled by Arash Adnani, a direct family member of our President and Chief Executive Officer, for various services, including information technology, corporate branding, media, website design, maintenance and hosting, provided to our Company. Our President and Chief Executive Officer does not sit on any of our Board of Directors’ key committees: Audit Committee; Compensation Committee; Corporate Governance and Nominating Committee; or Sustainability Committee. Blender is an award-winning design agency and a leader of investor marketing in North America. Blender works with over 500 private and publicly traded companies on all major stock exchanges, including the NYSE, NASDAQ and TSX.
As of July 31, 2023 the amount owing to Blender totaled $Nil (July 31, 2022: $3,205). The amount was unsecured, non-interest bearing and due on demand.
Our Audit Committee is charged with reviewing and approving all related party transactions and reviewing and making recommendations to the Board of Directors, or approving any contracts or other transactions with any of our current or former executive officers. The Charter of the Audit Committee sets forth the Company’s written policy for the review of related party transactions.
Director Independence
The Board of Directors has determined that David Kong, Vincent Della Volpe, Gloria Ballesta and Trecia Canty each qualify as independent directors under the listing standards of the NYSE American.
Item 14. Principal Accounting Fees and Services
PricewaterhouseCoopers LLP has served as our independent registered public accounting firm and audited our financial statements for the fiscal years ended July 31, 2023 and 2022. Aggregate fees for professional services rendered to us by our auditors for our last two years are set forth below:
| Year Ended July 31, 2023 |
Year Ended July 31, 2022 |
|||||||
| Audit Fees |
$ | 628,720 | $ | 464,943 | ||||
| Audit Related Fees |
- | - | ||||||
| Tax Fees |
121,027 | 138,787 | ||||||
| Total |
$ | 749,747 | $ | 603,730 | ||||
Audit Fees. Audit fees consist of aggregate fees for professional services in connection with the audit of our annual financial statements, quarterly reviews of our financial statements included in our quarterly reports and services in connection with statutory and regulatory filings.
Audit-Related Fees. Audit-related fees consist of aggregate fees for assurance and related services related to the audit or review of our financial statements that are not reported under “Audit Fees” above.
Tax Fees. Tax fees consist of aggregate fees for professional services for tax compliance, tax advice and tax planning, primarily, fees related to tax preparation services.
Pre-Approval of Services by the Independent Auditor
The Audit Committee is responsible for the pre-approval of audit and permitted non-audit services to be performed by the Company’s independent auditor. The Audit Committee will, on an annual basis, consider and, if appropriate, approve the provision of audit and non-audit services by the Company’s independent auditor. Thereafter, the Audit Committee will, as necessary, consider and, if appropriate, approve the provision of additional audit and non-audit services by the Company’s independent auditor which are not encompassed by the Audit Committee’s annual pre-approval and are not prohibited by law. The Audit Committee has delegated to the Chairperson of the Audit Committee the authority to pre-approve, on a case-by-case basis, non-audit services to be performed by the Company’s independent auditor. The Audit Committee has approved all audit and permitted non-audit services performed by its independent auditor, PricewaterhouseCoopers LLP, for Fiscal 2023.
Item 15. Exhibits, Financial Statement Schedules
The following exhibits are filed with this Annual Report on Form 10-K:
| 10.31 |
|
| 10.32 |
|
| 10.33 |
|
| 10.34 |
|
| 10.35 |
|
| 10.36 |
|
| 10.37 |
|
| 10.38 |
Form of Securities Purchase Agreement, dated as of October 17, 2013 (23) |
| 10.39 |
|
| 10.40 |
|
| 10.41 |
|
| 10.42 |
|
| 10.43 |
|
| 10.44 |
|
| 10.45 |
|
| 10.46 |
Amended and Restated Credit Agreement dated March 13, 2014 (29) |
| 10.47 |
|
| 10.48 |
|
| 10.49 |
|
| 10.50 |
|
| 10.51 |
|
| 10.52 |
|
| 10.53 |
|
| 10.54 |
|
| 10.55 |
Appointment Letter dated October 1, 2015 with Spencer Abraham † |
| 10.56 |
Second Amended and Restated Credit Agreement dated February 9, 2016 (36) |
| 10.57 |
|
| 10.58 |
|
| 10.59 |
|
| 10.60 |
|
| 10.61 |
|
| 10.62 |
|
| 10.63 |
|
| 10.64 |
|
| 10.65 |
|
| 10.66 |
|
| 10.67 |
|
| 10.68 |
|
| 10.69 |
|
| 10.70 |
Third Amended and Restated Credit Agreement dated December 5, 2018 (51) |
| 10.71 |
|
| 10.72 |
|
| 10.73 |
|
| 10.74 |
|
| 10.75 |
|
| 10.76 |
|
| 10.77 |
|
| 10.78 |
|
| 10.79 |
Notes:
| * |
Filed herewith. |
| ** | Furnished herewith. |
| † |
Previously filed as an exhibit to our Annual Report on Form 10-K filed with the SEC on September 29, 2022. |
| ‡ | Portions of this exhibit have been omitted. |
| (1) |
Incorporated by reference to our Registration Statement on Form SB-2 filed with the SEC on August 4, 2005. |
| (2) |
Incorporated by reference to our Current Report on Form 8-K filed with the SEC on February 9, 2006. |
| (3) |
Incorporated by reference to our Current Report on Form 8-K filed with the SEC on May 4, 2007. |
| (4) |
Incorporated by reference to our Current Report on Form 8-K filed with the SEC on October 9, 2007. |
| (5) |
Incorporated by reference to our Current Report on Form 8-K filed with the SEC on November 6, 2007. |
| (6) |
Incorporated by reference to our Current Report on Form 8-K filed with the SEC on January 16, 2009. |
| (7) |
Incorporated by reference to our Current Report on Form 8-K filed with the SEC on June 2, 2009. |
| (8) |
Incorporated by reference to our Current Report on Form 8-K filed with the SEC on June 9, 2009. |
| (9) |
Incorporated by reference to our Current Report on Form 8-K filed with the SEC on July 27, 2009. |
| (10) |
Incorporated by reference to our Registration Statement on Form S-8 filed with the SEC on October 1, 2009. |
| (11) |
Incorporated by reference to our Annual Report on Form 10-K/A filed with the SEC on April 21, 2010. |
| (12) |
Incorporated by reference to our Current Report on Form 8-K filed with the SEC on February 23, 2010. |
| (13) |
Incorporated by reference to our Registration Statement on Form S-8 filed with the SEC on February 7, 2011. |
| (14) |
Incorporated by reference to our Current Report on Form 8-K filed with the SEC on January 10, 2011. |
| (15) |
Incorporated by reference to our Current Report on Form 8-K filed with the SEC on May 11, 2011. |
| (16) |
Incorporated by reference to our Current Report on Form 8-K filed with the SEC on May 17, 2011. |
| (17) |
Incorporated by reference to our Current Report on Form 8-K filed with the SEC on July 11, 2011. |
| (18) |
Incorporated by reference to our Current Report on Form 8-K filed with the SEC on October 31, 2011. |
| (19) |
Incorporated by reference to our Current Report on Form 8-K filed with the SEC on November 8, 2011. |
| (20) |
Incorporated by reference to our Current Report on Form 8-K filed with the SEC on March 5, 2012. |
| (21) |
Incorporated by reference to our Current Report on Form 8-K filed with the SEC on August 5, 2013. |
| (22) |
Incorporated by reference to our Current Report on Form 8-K filed with the SEC on October 2, 2013. |
| (23) |
Incorporated by reference to our Current Report on Form 8-K filed with the SEC on October 23, 2013. |
| (24) |
Incorporated by reference to our Registration Statement on Form S-3 filed with the SEC on November 19, 2013. |
| (25) |
Incorporated by reference to our Registration Statement on Form S-8 filed with the SEC on November 21, 2013. |
| (26) |
Incorporated by reference to our Current Report on Form 8-K/A filed with the SEC on December 6, 2013. |
| (27) |
Incorporated by reference to our Registration Statement on Form S-3 filed with the SEC on December 27, 2013. |
| (28) |
Incorporated by reference to our Current Report on Form 8-K filed with the SEC on December 31, 2013. |
| (29) |
Incorporated by reference to our Current Report on Form 8-K filed with the SEC on March 19, 2014. |
| (30) |
Incorporated by reference to our Annual Report on Form 10-K filed with the SEC on October 14, 2014. |
| (31) |
Incorporated by reference to our Registration Statement on Form S-8 filed with the SEC on January 9, 2015. |
| (32) |
Incorporated by reference to our Quarterly Report on Form 10-Q filed with the SEC on March 12, 2015. |
| (33) |
Incorporated by reference to our Schedule 14A Definitive Proxy Statement filed with the SEC on June 19, 2015. |
| (34) |
Incorporated by reference to our Current Report on Form 8-K filed with the SEC on June 25, 2015. |
| (35) |
Incorporated by reference to our Quarterly Report on Form 10-Q filed with the SEC on December 8, 2015. |
| (36) |
Incorporated by reference to our Current Report on Form 8-K filed with the SEC on February 16, 2016 |
| (37) |
Incorporated by reference to our Current Report on Form 8-K filed with the SEC on March 10, 2016. |
| (38) |
Incorporated by reference to our Current Report on Form 8-K filed with the SEC on March 10, 2016. |
| (39) |
Incorporated by reference to our Registration Statement on Form S-8 filed with the SEC on September 2, 2016. |
| (40) |
Incorporated by reference to our Registration Statement on Form S-3 filed with the SEC on January 5, 2017. |
| (41) |
Incorporated by reference to our Current Report on Form 8-K filed with the SEC on January 17, 2017. |
| (42) |
Incorporated by reference to our Current Report on Form 8-K filed with the SEC on March 9, 2017. |
| (43) |
Incorporated by reference to our Quarterly Report on Form 10-Q filed with the SEC on June 9, 2017. |
| (44) |
Incorporated by reference to our Current Report on Form 8-K filed with the SEC on August 11, 2017. |
| (45) |
Incorporated by reference to our Registration Statement on Form S-3 filed with the SEC on September 8, 2017. |
| (46) |
Incorporated by reference to our Annual Report on Form 10-K filed with the SEC on October 16, 2017. |
| (47) |
Incorporated by reference to our Current Report on Form 8-K filed with the SEC on November 6, 2017. |
| (48) |
Incorporated by reference to our Annual Report on Form 10-K filed with the SEC on October 15, 2018. |
| (49) |
Incorporated by reference to our Registration Statement on Form S-8 filed with the SEC on August 27, 2018. |
| (50) |
Incorporated by reference to our Current Report on Form 8-K filed with the SEC on October 1, 2018. |
| (51) |
Incorporated by reference to our Current Report on Form 8-K filed with the SEC on December 7, 2018. |
| (52) |
Incorporated by reference to our Current Report on Form 8-K filed with the SEC on March 18, 2019. |
| (53) |
Incorporated by reference to our Current Report on Form 8-K filed with the SEC on April 9, 2019. |
| (54) |
Incorporated by reference to our Registration Statement on Form S-8 filed with the SEC on September 12, 2019. |
| (55) |
Incorporated by reference to our Current Report on Form 8-K filed with the SEC on March 19, 2020. |
| (56) |
Incorporated by reference to our Current Report on Form 8-K filed with the SEC on September 21, 2020. |
| (57) |
Incorporated by reference to our Current Report on Form 8-K filed with the SEC on March 19, 2021. |
| (58) |
Incorporated by reference to our Current Report on Form 8-K filed with the SEC on April 8, 2021. |
| (59) |
Incorporated by reference to our Registration Statement on Form S-3 filed with the SEC on May 17, 2021. |
| (60) |
Incorporated by reference to our Current Report on Form 8-K filed with the SEC on November 9, 2021. |
| (61) |
Incorporated by reference to our Current Report on Form 8-K filed with the SEC on February 8, 2022. |
| (62) |
Incorporated by reference to our Current Report on Form 8-K filed with the SEC on April 5, 2022. |
| (63) |
Incorporated by reference to our Current Report on Form 8-K filed with the SEC on June 13, 2022. |
| (64) |
Incorporated by reference to our Current Report on Form 8-K filed with the SEC on June 17, 2022. |
| (65) |
Incorporated by reference to our Current Report on Form 8-K filed with the SEC on August 17, 2022. |
| (66) |
Incorporated by reference to our Current Report on Form 8-K filed with the SEC on August 11, 2022. |
| (67) |
Incorporated by reference to our Current Report on Form 8-K filed with the SEC on August 15, 2022. |
| (68) | Incorporated by reference to our Current Report on Form 8-K filed with the SEC on October 13, 2022. |
| (69) | Incorporated by reference to our Current Report on Form 8-K filed with the SEC on January 11, 2023. |
| (70) | Incorporated by reference to our Current Report on Form 8-K filed with the SEC on January 23, 2023. |
| (71) | Incorporated by reference to our Current Report on Form 8-K filed with the SEC on March 13, 2023. |
| (72) | Incorporated by reference to our Current Report on Form 8-K filed with the SEC on March 14, 2023. |
| (73) | Incorporated by reference to our Amendment to our Annual Report on Form 10-K/A filed with the SEC on April 3, 2023. |
| (74) | Incorporated by reference to our Current Report on Form 8-K filed with the SEC on May 1, 2023. |
| (75) | Incorporated by reference to our Current Report on Form 8-K filed with the SEC on May 11, 2023. |
None.
URANIUM ENERGY CORP.
CONSOLIDATED FINANCIAL STATEMENTS
July 31, 2023
Report of Independent Registered Public Accounting Firm
To the Shareholders and Board of Directors of Uranium Energy Corp.
Opinions on the Financial Statements and Internal Control over Financial Reporting
We have audited the accompanying consolidated balance sheets of Uranium Energy Corp. and its subsidiaries (together, the Company) as of July 31, 2023 and 2022, and the related consolidated statements of operations and comprehensive income (loss), stockholders’ equity and cash flows for each of the three years in the period ended July 31, 2023, including the related notes (collectively referred to as the consolidated financial statements). We also have audited the Company’s internal control over financial reporting as of July 31, 2023, based on criteria established in Internal Control – Integrated Framework (2013) issued by the Committee of Sponsoring Organizations of the Treadway Commission (COSO).
In our opinion, the consolidated financial statements referred to above present fairly, in all material respects, the financial position of the Company as of July 31, 2023 and 2022, and the results of its operations and its cash flows for each of the three years in the period ended July 31, 2023 in conformity with accounting principles generally accepted in the United States of America. Also in our opinion, the Company maintained, in all material respects, effective internal control over financial reporting as of July 31, 2023, based on criteria established in Internal Control – Integrated Framework (2013) issued by the COSO.
Basis for Opinions
The Company’s management is responsible for these consolidated financial statements, for maintaining effective internal control over financial reporting, and for its assessment of the effectiveness of internal control over financial reporting, included in the accompanying Management's Report on Internal Control over Financial Reporting appearing in Item 9A. Our responsibility is to express opinions on the Company’s consolidated financial statements and on the Company’s internal control over financial reporting based on our audits. We are a public accounting firm registered with the Public Company Accounting Oversight Board (United States) (PCAOB) and are required to be independent with respect to the Company in accordance with the U.S. federal securities laws and the applicable rules and regulations of the Securities and Exchange Commission and the PCAOB.
We conducted our audits in accordance with the standards of the PCAOB. Those standards require that we plan and perform the audits to obtain reasonable assurance about whether the consolidated financial statements are free of material misstatement, whether due to error or fraud, and whether effective internal control over financial reporting was maintained in all material respects.
Our audits of the consolidated financial statements included performing procedures to assess the risks of material misstatement of the consolidated financial statements, whether due to error or fraud, and performing procedures that respond to those risks. Such procedures included examining, on a test basis, evidence regarding the amounts and disclosures in the consolidated financial statements. Our audits also included evaluating the accounting principles used and significant estimates made by management, as well as evaluating the overall presentation of the consolidated financial statements. Our audit of internal control over financial reporting included obtaining an understanding of internal control over financial reporting, assessing the risk that a material weakness exists, and testing and evaluating the design and operating effectiveness of internal control based on the assessed risk. Our audits also included performing such other procedures as we considered necessary in the circumstances. We believe that our audits provide a reasonable basis for our opinions.
PricewaterhouseCoopers LLP
PricewaterhouseCoopers Place, 250 Howe Street, Suite 1400, Vancouver, British Columbia, Canada V6C 3S7
T: +1 604 806 7000, F: +1 604 806 7806, ca_vancouver_main_fax@pwc.com
“PwC” refers to PricewaterhouseCoopers LLP, an Ontario limited liability partnership.

Definition and Limitations of Internal Control over Financial Reporting
A company’s internal control over financial reporting is a process designed to provide reasonable assurance regarding the reliability of financial reporting and the preparation of financial statements for external purposes in accordance with generally accepted accounting principles. A company’s internal control over financial reporting includes those policies and procedures that (i) pertain to the maintenance of records that, in reasonable detail, accurately and fairly reflect the transactions and dispositions of the assets of the company; (ii) provide reasonable assurance that transactions are recorded as necessary to permit preparation of financial statements in accordance with generally accepted accounting principles, and that receipts and expenditures of the company are being made only in accordance with authorizations of management and directors of the company; and (iii) provide reasonable assurance regarding prevention or timely detection of unauthorized acquisition, use, or disposition of the company’s assets that could have a material effect on the financial statements.
Because of its inherent limitations, internal control over financial reporting may not prevent or detect misstatements. Also, projections of any evaluation of effectiveness to future periods are subject to the risk that controls may become inadequate because of changes in conditions, or that the degree of compliance with the policies or procedures may deteriorate.
Critical Audit Matters
The critical audit matter communicated below is a matter arising from the current period audit of the consolidated financial statements that was communicated or required to be communicated to the audit committee and that (i) relates to accounts or disclosures that are material to the consolidated financial statements and (ii) involved our especially challenging, subjective, or complex judgments. The communication of critical audit matters does not alter in any way our opinion on the consolidated financial statements, taken as a whole, and we are not, by communicating the critical audit matter below, providing a separate opinion on the critical audit matter or on the accounts or disclosures to which it relates.
Valuation of the mineral rights and properties and equity-accounted investment acquired as part of the net assets acquisition of UEX Corporation
As described in Notes 2 and 3 to the consolidated financial statements, the Company acquired all of the issued and outstanding shares of UEX Corporation (UEX) on August 19, 2022. The acquisition was accounted for as an acquisition of assets as UEX does not meet the definition of a business in accordance with relevant accounting standards. Of the net assets acquired, $208,008 thousand related to mineral rights and properties and $24,502 thousand related to an equity-accounted investment. The Company recognized the assets and liabilities acquired in this acquisition by allocating the cost of the acquisition to the assets and liabilities based on their relative fair values. Management applied significant judgment in estimating the fair value of the mineral rights and properties and equity-accounted investment. The fair value of the mineral rights and properties and equity-accounted investment was based on a value per pound of uranium, which was determined using an in situ multiples analysis. Management used data from comparable public companies and precedent transactions in the in situ multiples analysis to estimate a value per pound of uranium and apply that to the property resource estimates, taking into account project‑specific characteristics. The property resource estimates are based on information prepared by qualified persons (management’s specialists).
The principal considerations for our determination that performing procedures relating to the valuation of the mineral rights and properties and equity-accounted investment acquired as part of the net assets acquisition of UEX is a critical audit matter are: (i) the significant judgment by management, including the use of management’s specialists, in determining the fair value of the mineral rights and properties and equity-accounted investment, which in turn led to (ii) a high degree of auditor judgment, subjectivity and effort in performing procedures to evaluate audit evidence relating to the valuation of the mineral rights and properties and equity-accounted investment, including the price per pound of uranium and project resource estimates; and (iii) the audit effort involved the use of professionals with specialized skill and knowledge.
Addressing the matter involved performing procedures and evaluating audit evidence in connection with forming our overall opinion on the consolidated financial statements. These procedures included testing the effectiveness of controls relating to the acquisition accounting, including controls over management’s valuation of the mineral rights and properties and equity-accounted investment acquired. These procedures also included, among others: (i) reading the purchase agreement; (ii) testing management’s process for determining the fair value of the mineral rights and properties and equity-accounted investment. Testing management’s process included testing the completeness and accuracy of the underlying data used by management in the valuation and evaluating the reasonableness of the project‑specific characteristics. Professionals with specialized skill and knowledge were used to assist in evaluating the appropriateness of the in situ multiples analysis and the reasonableness of the data from comparable public companies and precedent transactions used in the in situ multiples analysis to estimate a value per pound of uranium. The work of management’s specialists was used in performing the procedures to evaluate the reasonableness of the property resource estimates. As a basis for using this work, the specialists’ qualifications were understood and the Company’s relationship with the specialists was assessed. The procedures performed also included evaluating the methods and assumptions used by the specialists, testing the completeness and accuracy of the data used by the specialists and evaluating the specialists’ findings.
/s/
Chartered Professional Accountants
September 28, 2023
We have served as the Company’s auditor since 2020.
CONSOLIDATED BALANCE SHEETS
(Expressed in thousands of U.S. dollars)
| Note(s) | July 31, 2023 | July 31, 2022 | |||||||||
| CURRENT ASSETS | |||||||||||
| Cash and cash equivalents | 10 | $ | $ | ||||||||
| Inventories | 7 | ||||||||||
| Prepaid expenses and deposits | |||||||||||
| Other current assets | |||||||||||
| TOTAL CURRENT ASSETS | |||||||||||
| MINERAL RIGHTS AND PROPERTIES | 8 | ||||||||||
| PROPERTY, PLANT AND EQUIPMENT | 9 | ||||||||||
| RESTRICTED CASH | 10 | ||||||||||
| EQUITY-ACCOUNTED INVESTMENT | 11 | ||||||||||
| INVESTMENT IN EQUITY SECURITIES | 12 | ||||||||||
| OTHER NON-CURRENT ASSETS | |||||||||||
| TOTAL ASSETS | $ | $ | |||||||||
| CURRENT LIABILITIES | |||||||||||
| Accounts payable and accrued liabilities | 13 | $ | $ | ||||||||
| Asset retirement obligations - current | 14 | $ | |||||||||
| Other current liabilities | |||||||||||
| TOTAL CURRENT LIABILITIES | |||||||||||
| ASSET RETIREMENT OBLIGATIONS | 14 | ||||||||||
| OTHER NON-CURRENT LIABILITIES | |||||||||||
| DERIVATIVE LIABILITIES | 15 | ||||||||||
| DEFERRED TAX LIABILITIES | 22 | ||||||||||
| TOTAL LIABILITIES | |||||||||||
| STOCKHOLDERS' EQUITY | |||||||||||
| Capital stock | |||||||||||
| Common stock $ par value: shares authorized, shares issued and outstanding (July 31, 2022 - ) | 16 | ||||||||||
| Additional paid-in capital | |||||||||||
| Accumulated deficit | ( | ) | ( | ) | |||||||
| Accumulated other comprehensive income | ( | ) | ( | ) | |||||||
| TOTAL EQUITY | |||||||||||
| TOTAL LIABILITIES AND EQUITY | $ | $ | |||||||||
| COMMITMENTS AND CONTINGENCIES | 7, 14 | ||||||||||
| SUBSEQUENT EVENTS | 24 | ||||||||||
The accompanying notes are an integral part of these consolidated financial statements.
CONSOLIDATED STATEMENTS OF OPERATIONS AND COMPREHENSIVE INCOME (LOSS)
(Expressed in thousands of U.S. dollars, except per share data)
| Year Ended July 31, |
|||||||||||||||
| Note(s) |
2023 |
2022 |
2021 |
||||||||||||
| SALES AND SERVICE REVENUE |
18 | $ | $ | $ | |||||||||||
| COST OF SALES AND SERVICES |
18 | ( |
) | ( |
) | ||||||||||
| GROSS PROFIT |
|||||||||||||||
| OPERATING COSTS |
|||||||||||||||
| Mineral property expenditures |
8 | ||||||||||||||
| General and administrative |
20 | ||||||||||||||
| Acquisition-related costs |
5 | ||||||||||||||
| Depreciation, amortization and accretion |
8,9,14 | ||||||||||||||
| Impairment loss on mineral properties |
8 | ||||||||||||||
| TOTAL OPERATING COSTS |
|||||||||||||||
| INCOME (LOSS) FROM OPERATIONS |
( |
) | ( |
) | |||||||||||
| OTHER INCOME (EXPENSES) |
|||||||||||||||
| Interest expenses and finance costs |
( |
) | ( |
) | ( |
) | |||||||||
| Income (loss) from equity-accounted investment |
11 | ( |
) | ||||||||||||
| Debt receivable recovery |
6 | ||||||||||||||
| Gain on settlement of debt receivable |
6 | ||||||||||||||
| Gain on settlement of liabilities |
|||||||||||||||
| Gain (loss) on disposition of assets |
( |
) | |||||||||||||
| Loss on revaluation of equity securities |
19 | ( |
) | ( |
) | ||||||||||
| Gain on revaluation of derivative liabilities |
15 | ||||||||||||||
| Other income (expenses) |
( |
) | |||||||||||||
| OTHER INCOME (EXPENSES) |
( |
) | |||||||||||||
| INCOME (LOSS) BEFORE INCOME TAXES |
( |
) | ( |
) | |||||||||||
| DEFERRED TAX RECOVERY (EXPENSE) |
22 | ( |
) | ||||||||||||
| NET INCOME (LOSS) FOR THE YEAR |
( |
) | ( |
) | |||||||||||
| OTHER COMPREHENSIVE (LOSS) INCOME |
|||||||||||||||
| Translation (loss) gain |
( |
) | ( |
) | |||||||||||
| TOTAL OTHER COMPREHENSIVE (LOSS) INCOME |
( |
) | ( |
) | |||||||||||
| TOTAL COMPREHENSIVE INCOME (LOSS) FOR THE YEAR |
$ | ( |
) | $ | $ | ( |
) | ||||||||
| NET INCOME (LOSS) PER SHARE |
21 | ||||||||||||||
| Basic |
$ | ( |
) | $ | $ | ( |
) | ||||||||
| Diluted |
$ | ( |
) | $ | $ | ( |
) | ||||||||
| WEIGHTED AVERAGE NUMBER OF SHARES OUTSTANDING, |
|||||||||||||||
| Basic |
|||||||||||||||
| Diluted |
|||||||||||||||
The accompanying notes are an integral part of these consolidated financial statements.
CONSOLIDATED STATEMENTS OF CASH FLOWS
(Expressed in thousands of U.S. dollars)
| Year Ended July 31 |
|||||||||||||||
| Note(s) |
2023 |
2022 |
2021 |
||||||||||||
| NET CASH PROVIDED BY (USED IN): |
|||||||||||||||
| OPERATING ACTIVITIES |
|||||||||||||||
| Net income (loss) for the year |
$ | ( |
) | $ | $ | ( |
) | ||||||||
| Adjustments to reconcile net income (loss) to cash flows in operating activities |
|||||||||||||||
| Stock-based compensation |
17 | ||||||||||||||
| Depreciation, amortization and accretion |
8,9,14 | ||||||||||||||
| Amortization of long-term debt discount |
|||||||||||||||
| Loss (income) from equity-accounted investment |
11 | ( |
) | ( |
) | ||||||||||
| Debt receivable recovery |
6 | ( |
) | ||||||||||||
| Gain on settlement of debt receivable |
6 | ( |
) | ||||||||||||
| (Gain) loss on disposition of assets |
( |
) | ( |
) | |||||||||||
| Impairment loss on mineral properties |
8 | ||||||||||||||
| Loss on revaluation of equity securities |
19 | ||||||||||||||
| Gain on revaluation of derivative liabilities |
15 | ( |
) | ||||||||||||
| Gain on settlement of liabilities |
( |
) | ( |
) | |||||||||||
| Deferred tax recovery |
22 | ( |
) | ( |
) | ||||||||||
| Changes in operating assets and liabilities |
|||||||||||||||
| Inventories |
( |
) | ( |
) | |||||||||||
| Prepaid expenses and deposits |
( |
) | ( |
) | |||||||||||
| Other current assets |
( |
) | |||||||||||||
| Accounts payable and accrued liabilities |
( |
) | |||||||||||||
| Other liabilities |
( |
) | |||||||||||||
| NET CASH PROVIDED BY (USED IN) OPERATING ACTIVITIES |
( |
) | ( |
) | |||||||||||
| FINANCING ACTIVITIES |
|||||||||||||||
| Proceeds from share issuances, net of issuance costs |
16 | ||||||||||||||
| Repayments of long-term debt |
( |
) | ( |
) | |||||||||||
| Repayments of other loans |
( |
) | ( |
) | ( |
) | |||||||||
| Cash paid for withholding amounts on options, RSU and PRSU |
( |
) | ( |
) | ( |
) | |||||||||
| NET CASH PROVIDED BY FINANCING ACTIVITIES |
|||||||||||||||
| INVESTING ACTIVITIES |
|||||||||||||||
| Net cash used in U1A Acquisition |
( |
) | |||||||||||||
| Acquisition of UEX, net of cash acquired |
5 | ||||||||||||||
| Acquisition of Roughrider |
6 | ( |
) | ||||||||||||
| Investment in mineral rights and properties |
( |
) | ( |
) | ( |
) | |||||||||
| Purchase of property, plant and equipment |
( |
) | ( |
) | ( |
) | |||||||||
| Capital contribution to equity-accounted investment |
11 | ( |
) | ||||||||||||
| Purchase of additional interest in equity-accounted investment |
( |
) | |||||||||||||
| Investment in term deposits |
( |
) | |||||||||||||
| Investment in equity securities |
12 | ( |
) | ( |
) | ||||||||||
| Proceeds from redemption of term deposits |
|||||||||||||||
| Proceeds from debt receivable recovery |
6 | ||||||||||||||
| Proceeds from sale of equity security |
12 | ||||||||||||||
| Proceeds from disposition of assets |
|||||||||||||||
| NET CASH USED IN INVESTING ACTIVITIES |
( |
) | ( |
) | ( |
) | |||||||||
| NET CHANGE IN CASH, CASH EQUIVALENTS AND RESTRICTED CASH |
( |
) | |||||||||||||
| FOREIGN EXCHANGE DIFFERENCE ON CASH |
( |
) | |||||||||||||
| CASH, CASH EQUIVALENTS AND RESTRICTED CASH, BEGINNING OF YEAR |
|||||||||||||||
| CASH, CASH EQUIVALENTS AND RESTRICTED CASH, END OF YEAR |
10 | $ | $ | $ | |||||||||||
The accompanying notes are an integral part of these consolidated financial statements.
CONSOLIDATED STATEMENTS OF STOCKHOLDERS’ EQUITY
(Expressed in thousands of U.S. dollars, except share data)
| Common Stock |
Additional Paid- |
Accumulated |
Accumulated Other Comprehensive |
Stockholders' |
||||||||||||||||||||
| Shares |
Amount |
in Capital |
Deficit |
Income (Loss) |
Equity |
|||||||||||||||||||
| Balance, July 31, 2022 |
$ | $ | $ | ( |
) | $ | ( |
) | $ | |||||||||||||||
| Common stock |
||||||||||||||||||||||||
| Issued under ATM offering, net of issuance costs |
||||||||||||||||||||||||
| Issued upon vesting of RSUs and PRSUs |
( |
) | ( |
) | ||||||||||||||||||||
| Issued upon exercise of stock options |
||||||||||||||||||||||||
| Issued upon exercise of warrants |
||||||||||||||||||||||||
| Issued for acquisition of UEX and Roughrider |
||||||||||||||||||||||||
| Stock-based compensation |
||||||||||||||||||||||||
| Common stock issued for consulting services |
||||||||||||||||||||||||
| Common stock issued under Stock Incentive Plan |
||||||||||||||||||||||||
| Amortization of stock-based compensation |
- | |||||||||||||||||||||||
| Net loss for the year |
- | ( |
) | ( |
) | |||||||||||||||||||
| Other comprehensive loss |
- | ( |
) | ( |
) | |||||||||||||||||||
| Balance, July 31, 2023 |
$ | $ | $ | ( |
) | $ | ( |
) | $ | |||||||||||||||
The accompanying notes are an integral part of these consolidated financial statements.
URANIUM ENERGY CORP.
CONSOLIDATED STATEMENTS OF STOCKHOLDERS’ EQUITY
(Expressed in thousands of U.S. dollars, except share data)
| Common Stock |
Additional Paid- |
Share Issuance |
Accumulated |
Accumulated Other Comprehensive |
Stockholders' |
|||||||||||||||||||||||
| Shares |
Amount |
in Capital |
Obligation |
Deficit |
Income (Loss) |
Equity |
||||||||||||||||||||||
| Balance, July 31, 2020 |
$ | $ | $ | $ | ( |
) | $ | ( |
) | $ | ||||||||||||||||||
| Common stock |
||||||||||||||||||||||||||||
| Issued under direct offerings, net of issuance costs |
||||||||||||||||||||||||||||
| Issued under ATM offering, net of issuance costs |
||||||||||||||||||||||||||||
| Issued as anniversary fees for credit facility |
||||||||||||||||||||||||||||
| Issued (accrued) upon vesting of RSUs and PRSUs |
( |
) | ( |
) | ||||||||||||||||||||||||
| Issued upon exercise of stock options |
||||||||||||||||||||||||||||
| Issued upon exercise of warrants |
||||||||||||||||||||||||||||
| Stock-based compensation |
||||||||||||||||||||||||||||
| Common stock issued for consulting services |
||||||||||||||||||||||||||||
| Common stock issued under Stock Incentive Plan |
||||||||||||||||||||||||||||
| Amortization of stock-based compensation |
- | |||||||||||||||||||||||||||
| Warrants |
||||||||||||||||||||||||||||
| Issued in connection with ATM offering |
- | |||||||||||||||||||||||||||
| Issued in connection with a direct offering as issuance costs |
- | |||||||||||||||||||||||||||
| Net loss for the year |
- | ( |
) | ( |
) | |||||||||||||||||||||||
| Other comprehensive income |
- | |||||||||||||||||||||||||||
| Balance, July 31, 2021 |
( |
) | ||||||||||||||||||||||||||
| Common stock |
||||||||||||||||||||||||||||
| Issued as anniversary fees for credit facility |
||||||||||||||||||||||||||||
| Issued under ATM offering, net of issuance costs |
||||||||||||||||||||||||||||
| Issued upon vesting of RSUs and PRSUs |
( |
) | ( |
) | ( |
) | ||||||||||||||||||||||
| Issued upon exercise of stock options |
||||||||||||||||||||||||||||
| Issued upon exercise of warrants |
||||||||||||||||||||||||||||
| Issued for acquisition of mineral properties |
||||||||||||||||||||||||||||
| Stock-based compensation |
||||||||||||||||||||||||||||
| Common stock issued for consulting services |
||||||||||||||||||||||||||||
| Common stock issued under Stock Incentive Plan |
||||||||||||||||||||||||||||
| Amortization of stock-based compensation |
- | |||||||||||||||||||||||||||
| Net income for the year |
- | |||||||||||||||||||||||||||
| Other comprehensive loss |
- | ( |
) | ( |
) | |||||||||||||||||||||||
| Balance, July 31, 2022 |
$ | $ | $ | $ | ( |
) | $ | ( |
) | $ | ||||||||||||||||||
The accompanying notes are an integral part of these consolidated financial statements.
July 31, 2023
| NOTE 1: | NATURE OF OPERATIONS |
Uranium Energy Corp. was incorporated in the State of Nevada on May 16, 2003. Uranium Energy Corp. and its subsidiary companies and a controlled partnership (collectively, the “Company”) are engaged in uranium mining and related activities, including exploration, pre-extraction, extraction and processing of uranium and titanium concentrates, on projects located in the United States, Canada and Paraguay.
As at July 31, 2023, we had working capital (current assets less current liabilities) of $
Historically, we have been reliant primarily on equity financings from the sale of our common stock and on debt financing in order to fund our operations, and this reliance is expected to continue for the foreseeable future. Our continued operations, including the recoverability of the carrying values of our assets, are dependent ultimately on our ability to achieve and maintain profitability and positive cash flow from our operations.
| NOTE 2: | SUMMARY OF SIGNIFICANT ACCOUNTING POLICIES |
Basis of Presentation and Principles of Consolidation
These consolidated financial statements have been prepared in accordance with United States generally accepted accounting principles (“U.S. GAAP”) and are presented in thousands of United States dollars. All inter-company transactions and balances have been eliminated upon consolidation.
Exploration Stage
We have established the existence of mineralized materials for certain uranium projects, including our Palangana Mine, Christensen Ranch Mine (collectively, the “ISR Mines”), Roughrider and Christie Lake Projects. We have not established proven or probable reserves, as defined by the United States Securities and Exchange Commission (“SEC”) subpart 1300 of Regulation S-K (“S-K 1300”), through the completion of a “final” or “bankable” feasibility study for any of the uranium projects we operate, including our ISR Mines. Furthermore, we have no plans to establish proven or probable reserves for any of our uranium projects for which we plan on utilizing in-situ recovery (“ISR”) mining, such as our ISR Mines. As a result, and despite the fact that we commenced extraction of mineralized materials at our ISR Mines, we remain an Exploration Stage issuer, as defined by the SEC, and will continue to remain as an Exploration Stage issuer until such time proven or probable reserves have been established.
Since we commenced extraction of mineralized materials at our ISR Mines without having established proven or probable reserves, any mineralized materials established or extracted from our ISR Mines should not in any way be associated with having established or produced from proven or probable reserves.
In accordance with U.S. GAAP, expenditures relating to the acquisition of mineral rights are initially capitalized as incurred while exploration and pre-extraction expenditures are expensed as incurred until such time as we exit the Exploration Stage by establishing proven or probable reserves. Expenditures relating to exploration activities, such as drill programs to establish mineralized materials, are expensed as incurred. Expenditures relating to pre-extraction activities, such as the construction of mine wellfields, ion exchange facilities and disposal wells, are expensed as incurred until such time proven or probable reserves are established for that project, after which expenditures relating to mine development activities for that particular project are capitalized as incurred.
Companies in the Production Stage, as defined by the SEC, having established proven and probable reserves and exited the Exploration Stage, typically capitalize expenditures relating to ongoing development activities, with corresponding depletion calculated over proven and probable reserves using the units-of-production method and allocated to future reporting periods to inventory and, as that inventory is sold, to cost of goods sold. We are in the Exploration Stage which has resulted in our Company reporting larger losses than if it had been in the Production Stage due to the expensing, instead of capitalization, of expenditures relating to ongoing mine development activities. Additionally, there would be no corresponding depletion allocated to future reporting periods of our Company since those costs would have been expensed previously, resulting in both lower inventory costs and cost of goods sold and results of operations with higher gross profits and lower losses than if we had been in the Production Stage. Any capitalized costs, such as expenditures relating to the acquisition of mineral rights, are depleted over the estimated extraction life using the straight-line method when the underlying property is converted to the Production Stage. As a result, our consolidated financial statements may not be directly comparable to the financial statements of companies in the Production Stage.
July 31, 2023
Business Combination and Asset Acquisition
When an acquisition does not meet the definition of a business combination as the acquired entity does not have an input and a substantive process that together significantly contribute to the ability to create outputs, we account for the acquisition as an asset acquisition. In an asset acquisition, any direct acquisition-related transaction costs are capitalized as part of the purchase consideration. Deferred taxes are recorded on temporary book/tax differences in an asset acquisition using the simultaneous equations method and adjusted the assigned value of the non-monetary assets acquired to include the deferred tax liability
When an acquisition is accounted for as a business combination, we recognize and measure the assets acquired and liabilities assumed based on their estimated fair values at the acquisition date, while transaction costs related to business combinations are expensed as incurred. An income, market or cost valuation method may be utilized to estimate the fair value of the assets acquired and liabilities assumed, if any, in a business combination. The income valuation method represents the present value of future cash flows over the life of the asset using: (i) discrete financial forecasts, which rely on management’s estimates of resource quantities and exploration potential, costs to produce and develop resources, revenues and operating expenses; (ii) appropriate discount rates; and (iii) expected future capital requirements (the “income valuation method”). The market valuation method uses prices paid for a similar asset by other purchasers in the market, normalized for any differences between the assets (the “market valuation method”). The cost valuation method is based on the replacement cost of a comparable asset at the time of the acquisition adjusted for depreciation and economic and functional obsolescence of the asset (the “cost valuation method”). If the initial accounting for the business combination is incomplete by the end of the reporting period in which the acquisition occurs, an estimate will be recorded. Subsequent to the acquisition date, and not later than one year from the acquisition date, we will record any material adjustments to the initial estimate based on new information obtained that would have existed as of the date of the acquisition. Any adjustment that arises from information obtained that did not exist as of the date of the acquisition will be recorded in the period the adjustments arises.
Use of Estimates
The preparation of financial statements in conformity with U.S. GAAP requires management to make judgements, estimates and assumptions that affect the reported amount of assets and liabilities and disclosure of contingent assets and liabilities at the date of the financial statements and the reported revenues and expenses during the reported periods. Areas requiring significant judgements, estimates and assumptions include the valuation of acquired mineral rights and properties and equity-accounted investments, existence of impairment indicators for the Company’s long-lived assets, valuation and measurement of impairment losses on mineral rights and properties, valuation of recoverability of a credit loss, valuation of asset retirement obligations, and valuation of stock options, share purchase warrants and stock-based compensation. Other areas requiring estimates include allocations of expenditures to inventories, depletion and amortization of mineral rights and properties and depreciation of property, plant and equipment. Actual results could differ significantly from those estimates and assumptions.
Foreign Currency Translation
The functional currency of our Company, including its subsidiaries, is the United States dollar, except for UEX Corporation, whose functional currency is the Canadian dollar. Our subsidiaries, UEC Resources Ltd., UEC Resources (SK) Ltd., Roughrider Mineral Holdings Inc. and Cue Resources Ltd., maintain their accounting records in their local currency, the Canadian dollar. Piedra Rica Mining S.A., Transandes Paraguay S.A., Metalicos Y No Metalicos Paraguay S.R.L. and Trier S.A. maintain their accounting records in their local currency, the Paraguayan Guarani. In accordance with ASC 830: Foreign Currency Matters, the financial statements of our subsidiaries are translated into United States dollars using period-end exchange rates as to monetary assets and liabilities and average exchange rates as to revenues and expenses. Non-monetary assets are translated at their historical exchange rates. Net gains and losses resulting from foreign exchange translations and foreign currency exchange gains and losses on transactions occurring in a currency other than our Company’s functional currency are included in the determination of net loss in the period.
Cash and Cash Equivalents
Cash and cash equivalents consist of bank deposits and term deposits with an original maturity of three months or less.
Fair Value Measurement
Fair value accounting establishes a fair value hierarchy that prioritizes the inputs to valuation techniques used to measure fair value. The hierarchy gives the highest priority to unadjusted quoted prices in active markets for identical assets or liabilities (Level 1 measurements) and the lowest priority to unobservable inputs (Level 3 measurements).
The three levels of the fair value hierarchy are described below:
| ● | Level 1 - Unadjusted quoted prices in active markets that are accessible at the measurement date for identical unrestricted assets or liabilities; |
| ● | Level 2 - Quoted prices in markets that are not active, quoted prices for similar assets or liabilities in active markets, quoted prices or inputs that are observable, either directly or indirectly, for substantially the full term of the asset or liability, and model-based valuation techniques for which all significant inputs are observable in the market or can be corroborated by observable market data for substantially the full term of the assets or liabilities; and |
| ● | Level 3 - Prices or valuation techniques that require inputs that are both significant to the fair value measurement and unobservable (supported by little or no market activity). |
The financial instruments, including cash and cash equivalents, accounts and other receivables, restricted cash, accounts payable and accrued liabilities, are carried at cost, which approximate their fair values due to the immediate or short-term maturity. Investment in equity securities (level 1) and derivative liabilities (level 2) are carried at fair value.
July 31, 2023
Inventories
Inventories are comprised of supplies, work-in-progress and uranium concentrates (“U3O8”) from production and purchased uranium concentrates from the market. Expenditures related to the extraction and processing of uranium concentrates and depreciation and depletion charges of extraction and processing plant and equipment are capitalized as work-in-progress and uranium concentrates from production. Costs of purchased uranium concentrates include the purchase price and other direct costs incurred during the purchase process.
Inventories are carried at the lower of cost or net realizable value and are charged to cost of sales using the average costing method.
Equity Investments
Investments in an entity in which our ownership is greater than 20% but less than 50%, a 50/50 joint venture which the Company does not have control, or an entity where other facts and circumstances indicate that we have the ability to exercise significant influence over its operating and financing policies, are accounted for using the equity method in accordance with ASC 323: Investments – Equity Method and Joint Ventures. Equity-accounted investments are recorded initially at cost and adjusted subsequently to recognize our share of the earnings, losses or other changes in capital of the investee entity after the date of acquisition. We periodically evaluate whether declines in fair values of our equity investments below the carrying value are other-than-temporary and, if so, whether an impairment loss is required.
Additionally, we hold certain equity investments in entities that we do not have the ability to exercise significant influence. These equity investments represent our ownership interests in certain entities, and therefore meet the definition of an equity security under ASC 321 Investments – Equity Securities and are measured at fair value at each period end, with unrealized holding gains or losses recorded to earnings.
Other Non-Current Assets
Other non-current assets include future expenditures that we have paid in advance but will not receive benefits within one year. Expenses are recognized over the period the expenditures are used or the benefits from the expenditures are received. Transaction costs incurred in connection with acquisitions of long-term assets are also included in other non-current assets, which will be capitalized as acquisition costs if the transaction succeeds or will be written off if the transaction does not complete. Right-of-use (“ROU”) assets recognized in connection with recognition of lease liabilities are also included in Other Non-Current Assets.
Mineral Rights
Acquisition costs of mineral rights are initially capitalized as incurred while exploration and pre-extraction expenditures are expensed as incurred until such time proven or probable reserves, as defined by the SEC under S-K 1300, are established for that project.
Where proven and probable reserves have been established, the project’s capitalized expenditures are depleted over proven and probable reserves using the units-of-production method upon commencement of production. Where proven and probable reserves have not been established, the project’s capitalized expenditures are depleted over the estimated extraction life using the straight-line method upon commencement of extraction. We have not established proven or probable reserves for any of our projects.
Databases
Expenditures relating to mineral property databases are capitalized upon acquisition while those developed internally are expensed as incurred. Mineral property databases are amortized using the straight-line method over a -year period during which management believes these assets will contribute to our cash flows. Databases are included in Mineral Rights and Properties in our Consolidated Balance Sheets.
Property, Plant and Equipment
Property, plant and equipment are recorded at cost and depreciated to their estimated residual values using the straight-line method over their estimated useful lives, as follows:
| ● | Plant and processing facilities: |
| ● | Mining and logging equipment and vehicles: |
| ● | Computer equipment: |
| ● | Furniture and fixtures: |
| ● | Buildings: |
Impairment of Long-Lived Assets
Long-lived assets including mineral rights and properties and property, plant and equipment are reviewed for impairment whenever events or changes in circumstances indicate the carrying amount of an asset or asset group may not be recoverable. Management applies judgment to assess whenever events or changes in circumstances indicate the carrying amount of an asset or asset group may not be recoverable giving rise to the requirement to conduct an impairment test. Circumstances which could trigger an impairment test include, but are not limited to: significant decreases in the market price of the asset; significant adverse changes in the business climate or legal factors including significant decreases in uranium prices; significant increases in reclamation costs and accumulation of costs significantly in excess of the amount originally expected for the acquisition or construction of the asset; current period cash flow or operating losses combined with a history of losses or a forecast of continuing losses associated with the use of the asset; and current expectation that the asset will more likely than not be sold or disposed of significantly before the end of its estimated useful life. Recoverability of these assets is measured by comparing the carrying value to the future undiscounted cash flows expected to be generated by the assets. When the carrying value of an asset exceeds the related undiscounted cash flows, an impairment loss is recorded by writing down the carrying value of the related asset to its estimated fair value, which is determined using discounted future cash flows or other measures of fair value.
July 31, 2023
Income Taxes
We account for income taxes under the asset and liability method which requires the recognition of deferred tax assets and liabilities for the expected future tax consequences of temporary differences between the carrying amounts and tax bases of assets and liabilities. We provide a valuation allowance on deferred tax assets unless it is more likely than not that such assets will be realized. We review the valuation allowance requirements on an annual basis based on projected future operations.
Restoration and Remediation Costs (Asset Retirement Obligations)
Various federal and state mining laws and regulations require our Company to reclaim the surface areas and restore underground water quality to the pre-existing quality or class of use after the completion of mining. We recognize the present value of the future restoration and remediation costs as an asset retirement obligation in the period in which we incur an obligation associated with the retirement of tangible long-lived assets that result from the acquisition, construction, development and/or normal use of the assets.
Asset retirement obligations consist of estimated final well closure, plant and equipment decommissioning and removal and environmental remediation costs to be incurred by our Company in the future. The asset retirement obligation is estimated based on the current costs escalated at an inflation rate and discounted at a credit adjusted risk-free rate at inception. The asset retirement obligations are capitalized as part of the costs of the underlying assets and amortized over its remaining useful life. The asset retirement obligations are accreted to an undiscounted value until they are settled. The accretion expenses are charged to earnings and the actual retirement costs are recorded against the asset retirement obligations when incurred. Any difference between the recorded asset retirement obligations and the actual retirement costs incurred will be recorded as a gain or loss in the period of settlement.
Long-Term Debt
Long-Term Debt is carried at amortized cost. Debt issuance costs, debt premiums and discounts and annual fees are included in the long-term debt balance and amortized using the effective interest rate over the contractual terms of the Long-Term Debt.
Leases
We determine if a contractual arrangement represents or contains a lease at inception. Operating leases with lease terms greater than 12 months are included in Other Non-Current Assets, Other Current Liabilities and Other Non-Current Liabilities in our Consolidated Balance Sheet. Assets under finance leases are included in Property, Plant and Equipment and the related lease liabilities in Other Current Liabilities and Other Non-Current Liabilities in our Consolidated Balance Sheets.
Operating and finance lease ROU assets and lease liabilities are recognized based on the present value of the future lease payments over the lease term at the commencement date. When the rate implicit to the lease cannot be readily determined, we utilize the incremental borrowing rate in determining the present value of the future lease payments. The incremental borrowing rate is the rate of interest our Company would have to pay to borrow on a collateralized basis over a similar term and the amount equal to the lease payments in a similar economic environment.
The operating lease expenses are recognized on a straight-line basis over the lease term and included in general and administration expenses. Short-term leases, which have an initial term of 12 months or less, are not recorded in our Consolidated Balance Sheets.
We have leases arrangements that include both lease and non-lease components. We account for each separate lease component and its associated non-lease components as a single lease component for all of our asset classes.
Revenue Recognition
Our revenues are primarily derived from the sale of U3O8 that we purchased under our Physical Uranium Program. The sales contracts specify the quantity to be delivered, the price, payment terms and the year of the delivery. Ten days before the scheduled delivery date, the Company notifies the conversion facility with instructions for a title transfer to the customer. Revenue is recognized once a title transfer of the U3O8 is confirmed by the conversion facility.
Stock-Based Compensation
We measure stock-based awards at fair value on the date of the grant and expense the awards over the requisite service period of employees or consultants. The fair value of stock options is determined using the Black-Scholes Valuation Model. The fair value of restricted stock units (“RSU”s) is determined using the share price of the Company at the date of grant. The fair value of performance based restricted stock units (“PRSU”s) is determined using the Monte Carlo Simulation Model. Stock-based compensation expense related to stock option awards is recognized over the requisite service period on a graded vesting basis. Forfeitures are accounted for as they occur.
The Company’s estimates may be impacted by certain variables including, but not limited to, stock price volatility, employee stock option exercise behaviors, additional stock option grants, the Company’s performance and related tax impacts.
July 31, 2023
Earnings (Loss) Per Common Share
Basic earnings or loss per share includes no potential dilution and is computed by dividing the earnings or loss attributable to common stockholders by the weighted-average number of common shares outstanding for the period. Diluted earnings or loss per share reflect the potential dilution of securities that could share in the earnings or loss of our Company. Dilutive securities are excluded from the calculation of our diluted weighted average common shares outstanding if their effect would be anti-dilutive based on the treasury stock method or due to a net loss from continuing operations.
Recently Adopted Accounting Pronouncements and Securities and Exchange Commission Rules
Financial Disclosures of Government Assistance
In November 2021, ASU No. 2021-10 was issued which provides guidance for required annual disclosures about transactions with a government that are accounted for by applying a grant or contribution accounting model by analogy. We adopted this standard as of August 1, 2022. The adoption did not have a material impact on the consolidated financial statements or disclosures.
| NOTE 3: | ACQUISITION OF UEX CORPORATION |
During Fiscal 2022, on June 13, 2022, we entered into a definitive agreement with UEX Corporation (“UEX” and the “UEX Agreement”) pursuant to which we would acquire all of the issued and outstanding common shares of UEX in an all-share transaction (the “UEX Acquisition”). On June 21, 2022, in accordance with the UEX Agreement, we completed a private placement in UEX, whereby we acquired
On August 19, 2022, we acquired all of the issued and outstanding common shares of UEX that we did not already own pursuant to the completion of the UEX Acquisition. Pursuant to the terms of the UEX Acquisition, UEX shareholders received
In connection with the UEX Acquisition, we also issued
The estimated fair value of the Replacement Options in the amount of $
| Exercise Price in U.S. dollars | | ||
| Exercise Price in Canadian dollars | CAD$1.39 to CAD$5.12 | ||
| Expected Risk Free Interest Rate | |||
| Expected Volatility | |||
| Expected Life in Years | |||
| Expected Dividend Yield | % |
The estimated fair value of the Replacement Warrants in the amount of $
| Exercise Price in U.S. dollars | | ||
| Exercise Price in Canadian dollars | CAD$1.44 to CAD$4.44 | ||
| Expected Risk Free Interest Rate | |||
| Expected Volatility | |||
| Expected Life in Years | |||
| Expected Dividend Yield | % |
The UEX Acquisition is accounted for as an acquisition of assets rather than a business as UEX does not meet the definition of a business in accordance with ASC 805 Business Combinations.
July 31, 2023
The following table summarizes the fair value of the consideration paid, and the fair value of the assets acquired and liabilities assumed, on the closing date of the UEX Acquisition:
| Consideration paid | ||||
| UEC shares issued | $ | |||
| Fair value of UEX shares acquired by UEC before acquisition | ||||
| Replacement options issued | ||||
| Replacement warrants issued | ||||
| Acquisition related costs | ||||
| Total consideration | $ | |||
| Assets acquired and liabilities assumed | ||||
| Cash and cash equivalents | $ | |||
| Prepaid expenses and deposits | ||||
| Accounts receivable | ||||
| Mineral rights and properties | ||||
| Equity-accounted investment | ||||
| Investment in equity securities | ||||
| Other non-current assets | ||||
| Total assets | ||||
| Accounts payable and accrued liabilities | ||||
| Other liabilities | ||||
| Asset retirement obligations (Note 14) | ||||
| Deferred tax liabilities | ||||
| Total liabilities | ||||
| Total net assets | $ |
The Company recognized the assets and liabilities acquired in this acquisition by allocating the cost of the acquisition to the assets and liabilities based on their relative fair values. The fair value of the mineral rights and properties and equity-accounted investment was based on a value per pound of uranium which was determined using an in situ multiples analysis. Management used data from comparable public companies and precedent transactions in the in situ multiples analysis to estimate a value per pound of uranium and apply that to the property resource estimates, taking into account project-specific characteristics. The property resource estimates were based on information prepared by qualified persons (management’s specialists).
Cash flow on acquisition:
| Cash acquired with the subsidiary | $ | |||
| Acquisition related costs | ( | ) | ||
| Acquisition of UEX, net of cash acquired | $ |
| NOTE 4: | ACQUISITION OF THE ROUGHRIDER PROJECT |
On October 14, 2022, we completed the acquisition of all of the issued and outstanding shares of Roughrider Mineral Holdings Inc. (“Roughrider”), which owns the Roughrider uranium development project (the “Roughrider Project”) located in the Athabasca Basin, in Saskatchewan, Canada, from a subsidiary of Rio Tinto plc (the “Roughrider Acquisition”). The Roughrider Acquisition is accounted for as an acquisition of assets rather than a business as the Roughrider Project does not meet the definition of a business in accordance with ASC 805 Business Combinations.
The following table summarizes the fair value of the consideration paid, and the fair value of the assets acquired and liabilities assumed, on the closing date of the Roughrider Acquisition:
| Consideration paid | ||||
| Cash | $ | |||
| Fair value of UEC shares issued at $ per share | ||||
| Acquisition related costs | ||||
| Total consideration paid | $ | |||
| Assets acquired and liabilities assumed | ||||
| Mineral rights and properties | $ | |||
| Total assets | ||||
| Asset retirement obligations (Note 14) | ||||
| Deferred tax liabilities | ||||
| Total liabilities | ||||
| Total net assets | $ |
Cash flow on acquisition:
| Cash paid | $ | ( | ) | |
| Acquisition related costs | ( | ) | ||
| Acquisition of Roughrider | $ | ( | ) |
July 31, 2023
| NOTE 5: | ACQUISITION OF URANIUM ONE AMERICAS, INC. |
On December 17, 2021, we completed the acquisition of all the issued and outstanding shares of Uranium One Americas, Inc. (“U1A”), a Nevada corporation, from Uranium One Investments Inc., a subsidiary of Uranium One Inc., for total cash consideration of $
The UEC Wyoming portfolio consists of the Irigaray Processing Facility, the Christensen Ranch Mine and the Ludeman, Antelope, Moore Ranch and Barge Projects located in Wyoming, which creates a Wyoming hub-and-spoke operation for the Company.
The U1A Acquisition was accounted for as a business combination with UEC identified as the acquirer. The Company’s judgement that the U1A Acquisition is a business combination is based on the Company’s assessment that substantially all the fair value of the assets are not concentrated in a single asset or group of similar assets. In accordance with the acquisition method of accounting, the purchase price has been assigned to the assets acquired, and the liabilities assumed, based on their estimated fair values at the acquisition date. In connection with the U1A Acquisition, we incurred acquisition-related costs of $
As of July 31, 2022, we had completed the analysis to assign fair values to all assets acquired and liabilities assumed and, therefore, the purchase price allocation for the U1A Acquisition is final.
The table below sets forth the consideration paid and the fair value of the assets acquired and liabilities assumed for the U1A Acquisition:
| Consideration paid | ||||
| Cash | $ | |||
| Working capital adjustment (1) | ||||
| Total consideration paid | $ | |||
| Assets acquired and liabilities assumed | ||||
| Cash & cash equivalents (1) | ||||
| Prepaid expenses and deposits (1) | ||||
| Other current assets (1) | ||||
| Inventories (1) | ||||
| Mineral rights and properties (2) | ||||
| Property, plant and equipment (3) | ||||
| Restricted cash | ||||
| Debt receivable (4) | ||||
| Other non-current assets (5) | ||||
| Total assets | ||||
| Accounts payable and accrued liabilities (1) | ||||
| Other liabilities (5) | ||||
| Asset retirement obligations (6) | ||||
| Total liabilities | ||||
| Total net assets | $ |
Notes:
| (1) | The working capital adjustment represents the working capital of U1A at the date of the U1A Acquisition, which was comprised of: (i) cash and cash equivalents of (ii) prepaid expenses and deposits of (iii) other current assets of (iv) inventories of and (v) accounts payable and accrued liabilities of $ |
| (2) | The fair value of mineral rights and properties was determined using the discounted cash flow model (being the net present value of expected future cash flows). Expected future cash flows are based on estimates of future uranium prices, production based on current estimates of recoverable mineral resources, future operating costs and capital expenditures and the discount rate. The Company’s estimates of recoverable mineral resources are based on information prepared by qualified persons (management’s specialists). |
| (3) | The fair value of property, plant and equipment was determined using a replacement cost approach. |
| (4) | Other non-current assets included certain material and supply inventories classified as non-current and ROU assets associated with U1A’s operating leases. The fair value of long-term inventory was determined to approximate its carrying value. ROU assets and lease liabilities for operating leases are measured based on the present value of the future lease payments over the remaining lease terms at the acquisition date. |
| (5) | The fair value of asset retirement obligations was measured based on the expected costs and timing for final well closure, plant and equipment decommissioning and removal, and environmental remediation, which are discounted to present value using credit adjusted risk-free rates. |
Since it has been consolidated from December 17, 2021, UEC Wyoming’s net income of $
The following unaudited proforma financial information presents consolidated results assuming the U1A Acquisition occurred on August 1, 2020.
| Year Ended July 31, | ||||||||
| 2022 | 2021 | |||||||
| Sales and service revenue | $ | $ | ||||||
| Net income (loss) for the year | ( | ) | ||||||
July 31, 2023
| NOTE 6: | ANFIELD DEBT SETTLEMENT AND PROPERTY SWAP |
In connection with the U1A Acquisition, we acquired certain indebtedness totaling $
On April 19, 2022, we entered into a debt settlement agreement (the “Settlement Agreement”) and a property swap agreement (the “Swap Agreement”; and together with the Settlement Agreement, the “Anfield Agreements”) with Anfield to settle the Anfield Debt. Pursuant to the Anfield Agreements, the Anfield Debt was settled by the payment by Anfield to UEC of $
On June 7, 2022, we closed the Anfield Debt Settlement whereby we received $
Anfield Common Shares were measured using the Anfield share price of per share at the date of issuance. Anfield Warrants were measured at per share using the Black-Sholes Valuation Model at the date of issuance with the following assumptions.
| Expected Risk Free Interest Rate | % | |||
| Annual Volatility | % | |||
| Life in Years | ||||
| Expected Annual Dividend Yield | % |
Our investment in Anfield Common Shares and Anfield Warrants are accounted for as Investment in Equity Securities with changes in fair value charged to Unrealized Gain or Loss from Equity Securities on our consolidated statements of operations and comprehensive income.
Consequently, we reversed the entire expected credit loss on the debt receivable and recognized a recovery on debt receivable of $
Concurrent with the Anfield Debt Settlement, we completed the Swap Agreement whereby we have received from Anfield 25 ISR uranium projects with a fair value of $
| NOTE 7: | INVENTORIES |
As at July 31, 2023, we held
| July 31, 2023 | July 31, 2022 | |||||||
| Material and supplies | $ | $ | ||||||
| Uranium concentrates from production | ||||||||
| Purchased uranium inventories | ||||||||
| $ | $ | |||||||
As at July 31, 2023, our uranium inventory purchase commitments over the next five fiscal years are as the follows:
| Purchase Commitments in Pounds | Total Purchase Price | |||||||
| Fiscal 2024 | $ | |||||||
| Fiscal 2025 | ||||||||
| Fiscal 2026 | ||||||||
| Total | $ | |||||||
Subsequent to July 31, 2023, we entered into agreements to purchase
July 31, 2023
| NOTE 8: | MINERAL RIGHTS AND PROPERTIES |
Mineral Rights
As at July 31, 2023, we had mineral rights in the States of Arizona, New Mexico, Texas and Wyoming, in Canada and in the Republic of Paraguay. These mineral rights were acquired through staking and purchase, lease or option agreements and are subject to varying royalty interests, some of which are indexed to the sale price of uranium. As at July 31, 2023, annual maintenance payments of approximately $
As at July 31, 2023, the carrying value of these mineral rights and properties was as follows:
| Costs | United States | Canada | Paraguay | Total | ||||||||||||
| Balance at July 31, 2022 | $ | $ | $ | $ | ||||||||||||
| Additions | ||||||||||||||||
| Impact of foreign currency translation | ( | ) | ||||||||||||||
| Balance at July 31, 2023 | ||||||||||||||||
| Accumulated Depletion, Amortization and Impairment | United States | Canada | Paraguay | Total | ||||||||||||
| Balance at July 31, 2022 | ( | ) | ( | ) | ||||||||||||
| Additions | ( | ) | ( | ) | ||||||||||||
| Impairment | ( | ) | ( | ) | ||||||||||||
| Balance at July 31, 2023 | ( | ) | ( | ) | ( | ) | ||||||||||
| Carrying Value | ||||||||||||||||
| Balance at July 31, 2022 | $ | $ | $ | $ | ||||||||||||
| Balance at July 31, 2023 | $ | $ | $ | $ | ||||||||||||
During Fiscal 2018 and Fiscal 2019, we had communications and filings with the Ministry of Public Works and Communications (“MOPC”), the mining regulator in Paraguay, whereby the MOPC took the position that certain concessions forming part of the Company’s Yuty and Alto Parana Projects were not eligible for extension as to exploration or continuation to exploitation in their current stages. While we remain fully committed to our development path forward in Paraguay, we have filed certain applications and appeals in Paraguay to reverse the MOPC’s position in order to protect our continuing rights in those concessions.
We have not established proven or probable reserves, as defined by the SEC under the S-K 1300, for any of our mineral projects. We have established the existence of mineralized materials for certain uranium projects, including our ISR Mines. Since we commenced uranium extraction at our ISR Mines without having established proven or probable reserves, there may be greater inherent uncertainty as to whether or not any mineralized material can be economically extracted as originally planned and anticipated.
The details of mineral property expenditures are as follows:
| Year Ended July 31, | ||||||||||||
| 2023 | 2022 | 2021 | ||||||||||
| Permitting and compliance | $ | $ | $ | |||||||||
| Property maintenance | ||||||||||||
| Exploration | ||||||||||||
| Development | ||||||||||||
| Production readiness | ||||||||||||
| Total | $ | $ | $ | |||||||||
| NOTE 9: | PROPERTY, PLANT AND EQUIPMENT |
Property, plant and equipment consisted of the following:
| July 31, 2023 | July 31, 2022 | |||||||||||||||||||||||
| Accumulated | Net Book | Accumulated | Net Book | |||||||||||||||||||||
| Cost | Depreciation | Value | Cost | Depreciation | Value | |||||||||||||||||||
| Plant and Processing Facilities | $ | $ | ( | ) | $ | $ | $ | ( | ) | $ | ||||||||||||||
| Mining Equipment | ( | ) | ( | ) | ||||||||||||||||||||
| Logging Equipment and Vehicles | ( | ) | ( | ) | ||||||||||||||||||||
| Computer Equipment | ( | ) | ( | ) | ||||||||||||||||||||
| Furniture and Fixtures | ( | ) | ( | ) | ||||||||||||||||||||
| Buildings | ( | ) | ( | ) | ||||||||||||||||||||
| Land | ||||||||||||||||||||||||
| $ | $ | ( | ) | $ | $ | $ | ( | ) | $ | |||||||||||||||
The depreciation expenses for year ended July 31, 2023 was $
July 31, 2023
| NOTE 10: | RESTRICTED CASH |
Restricted cash includes cash and cash equivalents and money market funds as collateral for various bonds posted in favor of applicable state regulatory agencies in Arizona, Texas and Wyoming, and for estimated reclamation costs associated with our plants, processing facilities and various projects. Restricted cash will be released upon completion of reclamation of a mineral property or restructuring of a surety and collateral arrangement.
Restricted cash consisted of the following:
| July 31, 2023 | July 31, 2022 | |||||||
| Balance, beginning of year | $ | $ | ||||||
| Restricted cash received from U1A Acquisition (Note 5) | ||||||||
| (Release) addition of surety bond collateral | ( | ) | ||||||
| Interest received | ||||||||
| Balance, end of year | $ | $ | ||||||
During Fiscal 2022, we received $
Cash, cash equivalents and restricted cash are included in the following accounts:
| July 31, 2023 | July 31, 2022 | July 31, 2021 | ||||||||||
| Cash and cash equivalents | $ | $ | $ | |||||||||
| Restricted cash | ||||||||||||
| Total cash, cash equivalents and restricted cash | $ | $ | $ | |||||||||
Financial instruments that potentially subject the Company to concentrations of credit risk consist of cash and cash equivalents and restricted cash. These assets include Canadian dollar and U.S. dollar denominated certificates of deposit, money market accounts and demand deposits. These instruments are maintained at financial institutions in Canada and the U.S. The maximum credit risk of these assets are the carrying amount less amount covered by the Canada Deposit Insurance Corporation, the Securities Investor Protection Corporation or the U.S. Federal Deposit Insurance Corporation, should the financial institutions with which these amounts are invested be rendered insolvent. The Company does not consider any of its financial assets to be impaired as of July 31, 2023.
| NOTE 11: | EQUITY-ACCOUNTED INVESTMENT |
As at July 31, 2023, we owned
URC is a public company listed on the TSX with the trading symbol URC and on NASDAQ with the trading symbol UROY. As at July 31, 2023, the fair value of our investment in URC was approximately $
As at July 31, 2023, we owned
We incurred $
During Fiscal 2023, Fiscal 2022 and Fiscal 2021, the changes in carrying value of our equity-accounted investment are summarized as follows:
| Balance, July 31, 2020 | $ | |||
| Addition in URC | ||||
| Share of income from URC | ||||
| Gain on dilution of ownership interest in URC | ||||
| Foreign exchange difference | ||||
| Balance, July 31, 2021 | ||||
| Share of income from URC | ||||
| Gain on dilution of ownership interest in URC | ||||
| Foreign exchange difference | ( | ) | ||
| Balance, July 31, 2022 | ||||
| Addition from UEX Acquisition - JCU | ||||
| Capital contribution to JCU | ||||
| Share of losses from URC and JCU | ( | ) | ||
| Gain on dilution of ownership interest in URC | ||||
| Foreign exchange difference | ( | ) | ||
| Balance, July 31, 2023 | $ |
During Fiscal 2023, Fiscal 2022 and Fiscal 2021, we recorded a gain on dilution of ownership interest of $
July 31, 2023
| NOTE 12: | INVESTMENTS IN EQUITY SECURITIES |
On August 19, 2022, we completed the UEX Acquisition (refer to Note 3), and our investment in UEX shares in the amount of $
The changes in our investments in equity securities are summarized as follows:
| Balance, July 31, 2021 | $ | |||
| Anfield Debt Settlement (Note 6) | ||||
| Investment in UEX | ||||
| Unrealized loss on revaluation of equity securities | ( | ) | ||
| Balance, July 31, 2022 | ||||
| Transferred as consideration for UEX Acquisition (Note 3) | ( | ) | ||
| Acquired from UEX Acquisition (Note 3) | ||||
| Investment in public listed companies | ||||
| Sale of investment in public listed companies | ( | ) | ||
| Loss on revaluation of equity securities (Note 19) | ( | ) | ||
| Foreign exchange difference | ( | ) | ||
| Balance, July 31, 2023 | $ |
| NOTE 13: | ACCOUNTS PAYABLE AND ACCRUED LIABILITIES |
As at July 31, 2023, accounts payable and accrued liabilities consisted of the following:
| July 31, 2023 | July 31, 2022 | |||||||
| Trade payables | $ | $ | ||||||
| Accrued purchases | ||||||||
| Accrued payroll liabilities | ||||||||
| Liabilities assumed from prior acquisitions | ||||||||
| $ | $ | |||||||
| NOTE 14: | ASSET RETIREMENT OBLIGATIONS |
Asset retirement obligations (“ARO”s) relate to future remediation and decommissioning activities at our Palangana Mine, Hobson Processing Facility, Reno Creek Project, Alto Paraná Titanium Project, Christensen Ranch Mine and Irigaray Processing Facility pursuant to the U1A Acquisition, as well as the AROs related to the Roughrider Acquisition and the UEX Acquisition.
| July 31, 2023 | July 31, 2022 | |||||||
| Balance, beginning of year | $ | $ | ||||||
| Accretion | ||||||||
| Assumed from Roughrider Acquisition (Note 4) | ||||||||
| Assumed from UEX Acquisition (Note 3) | ||||||||
| Assumed from U1A Acquisition (Note 5) | ||||||||
| Addition | ||||||||
| Liabilities settled in cash | ( | ) | ||||||
| Foreign exchange difference | ( | ) | ||||||
| Balance, end of year | $ | $ | ||||||
The estimated amounts and timing of cash flows and assumptions used for the ARO estimates are as follows:
| July 31, 2023 | July 31, 2022 | |||||||
| Undiscounted amount of estimated cash flows | $ | $ | ||||||
| Payable in years | ||||||||
| Inflation rate | ||||||||
| Discount rate | ||||||||
July 31, 2023
The undiscounted amounts of estimated cash flows for the next five years and beyond are as follows:
| Fiscal 2024 | $ | |||
| Fiscal 2025 | ||||
| Fiscal 2026 | ||||
| Fiscal 2027 | ||||
| Fiscal 2028 | ||||
| Remaining balance | ||||
| $ |
| NOTE 15: | DERIVATIVE LIABILITIES |
On August 19, 2022, the Company issued Replacement Warrants (refer to Note 3) in connection with the closing of the UEX Acquisition. The Replacement Warrants are accounted for as derivative liabilities as the exercise prices of the Replacement Warrants are denominated in Canadian dollars which differs from our functional currency.
As at July 31, 2023, the fair value of the Replacement Warrants was estimated using the Black-Scholes model with the following assumptions, which is level 2 of the fair value measurement hierarchy:
| Exercise Price in U.S. dollars | | ||
| Exercise Price in Canadian dollars | CAD$3.22 to CAD$4.44 | ||
| Expected Risk Free Interest Rate | % | ||
| Expected Volatility | % | ||
| Expected Life in Years | |||
| Expected Dividend Yield | % |
The movement in derivative liabilities during the period is as follows:
| Balance, July 31, 2022 | $ | |||
| Fair value of derivative liabilities assumed from UEX Acquisition (Note 3) | ||||
| Exercise of Replacement Warrants | ( | ) | ||
| Change in fair value | ( | ) | ||
| Balance, July 31, 2023 | $ |
| NOTE 16: | CAPITAL STOCK |
Equity Financing
On May 17, 2021, we filed a Form S-3 shelf registration statement under the United States Securities Act of 1933, as amended (the “Securities Act”), which was declared effective by the SEC on June 1, 2021, providing for the public offer and sale of certain securities of the Company from time to time, at our discretion, of up to an aggregate offering amount of $
On May 14, 2021, we entered into an at-the-market offering agreement (the “2021 ATM Offering Agreement”) with H.C. Wainwright & Co., LLC and certain co-managers (collectively, the “2021 ATM Managers”) as set forth in the 2021 ATM Offering Agreement under which we may, from time to time, sell shares of our common stock having an aggregate offering price of up to $
On November 26, 2021, we filed a prospectus supplement to our 2021 Shelf with respect to the continuation of the May 2021 ATM Offering Agreement with the 2021 ATM Managers under which we may, if eligible, from time to time, sell shares of our common stock having an aggregate offering price of up to an additional $
On November 16, 2022, we filed a Form S-3 automatic shelf registration statement under the Securities Act, which became effective upon filing, providing for the public offer and sale of certain securities of the Company from time to time, at our discretion, of an undetermined dollar value of common stock, debt securities, warrants to purchase common stock or debt securities, subscription receipts for and units which include common stock, debt securities, warrants or any combination thereof (the “2022 Shelf”), which included an at-the-market offering agreement prospectus (the “2022 ATM Offering”; and, collectively, with the 2021 ATM Offering, the “ATM Offerings”) covering the offering, issuance and sale of up to a maximum offering of $
On November 16, 2022, we entered into an at-the-market offering agreement (the “2022 ATM Offering Agreement”) with H.C. Wainwright & Co., LLC and certain co-managers (collectively, the “2022 ATM Managers”) as set forth in the 2022 ATM Offering Agreement under which we may, from time to time, sell shares of our common stock having an aggregate offering price of up to $
During Fiscal 2022, we issued
During Fiscal 2023, we issued
Subsequent to July 31, 2023, we issued a further
July 31, 2023
Share Purchase Warrants
A continuity schedule of outstanding share purchase warrants as at July 31, 2023, and the changes during the periods, is as follows:
| Number of | Weighted Average | |||||||
| Warrants | Exercise Price | |||||||
| Balance, July 31, 2020 | $ | |||||||
| Issued in connection with September 2020 Offering | ||||||||
| Issued in connection with April 2021 Offering | ||||||||
| Exercised | ( | ) | ||||||
| Expired | ( | ) | ||||||
| Balance, July 31, 2021 | ||||||||
| Exercised | ( | ) | ||||||
| Balance, July 31, 2022 | ||||||||
| Issuance of Replacement Warrants (Note 3,15) | ||||||||
| Exercised | ( | ) | ||||||
| Expired | ( | ) | ||||||
| Balance, July 31, 2023 | $ | |||||||
A summary of share purchase warrants outstanding and exercisable as at July 31, 2023 is as follows:
| Weighted Average Exercise Price | Number of Warrants Outstanding | Weighted Average Remaining Contractual Life (Years) | Expiry Date | ||||||||
| $ | September 7, 2024 | ||||||||||
| April 5, 2026 | |||||||||||
| $ | |||||||||||
During Fiscal 2023, Fiscal 2022 and Fiscal 2021, we received cash proceeds totaling $
| NOTE 17: | STOCK-BASED COMPENSATION |
Stock Options
During Fiscal 2023, Fiscal 2022 and Fiscal 2021, we granted stock options under our stock incentive plans to certain of our directors, officers, employees and consultants to purchase an aggregate of
The fair value of these stock options was estimated at the date of grant, using the Black-Scholes Valuation Model, with the following weighted average assumptions:
| Year Ended July 31, | ||||||||||||
| 2023 (1) | 2022 | 2021 | ||||||||||
| Expected Risk Free Interest Rate | % | % | % | |||||||||
| Expected Volatility | % | % | % | |||||||||
| Expected Life in Years | ||||||||||||
| Expected Dividend Yield | % | % | % | |||||||||
| Weighted-Average Grant Date Fair Value | $ | $ | $ | |||||||||
(1) The assumptions used for the fair value measurement of the Replacement Options are excluded in the table below as they have been separately disclosed in Note 3.
July 31, 2023
A continuity schedule of outstanding stock options as at July 31, 2023, and the changes during the fiscal year periods, is as follows:
| Number of Stock Options | Weighted Average Exercise Price | |||||||
| Balance, July 31, 2020 | $ | |||||||
| Granted | ||||||||
| Exercised | ( | ) | ||||||
| Expired | ( | ) | ||||||
| Balance, July 31, 2021 | ||||||||
| Granted | ||||||||
| Exercised | ( | ) | ||||||
| Expired | ( | ) | ||||||
| Balance, July 31, 2022 | ||||||||
| Granted | ||||||||
| Exercised | ( | ) | ||||||
| Forfeited | ( | ) | ||||||
| Expired | ( | ) | ||||||
| Balance, July 31, 2023 | $ | |||||||
The table below sets forth the number of shares issued and cash received upon exercise of stock options:
| Year Ended July 31, | ||||||||||||
| 2023 | 2022 | 2021 | ||||||||||
| Number of Options Exercised on Cash Basis | ||||||||||||
| Number of Options Exercised on Forfeiture Basis | ||||||||||||
| Total Number of Options Exercised | ||||||||||||
| Number of Shares Issued on Cash Exercise | ||||||||||||
| Number of Shares Issued on Forfeiture Basis | ||||||||||||
| Total Number of Shares Issued Upon Exercise of Options | ||||||||||||
| Cash Received from Exercise of Stock Options | $ | $ | $ | |||||||||
| Total Intrinsic Value of Options Exercised | $ | $ | $ | |||||||||
A continuity schedule of outstanding unvested stock options at July 31, 2023, and the changes during the fiscal year periods, is as follows:
| Number of Unvested Stock Options | Weighted Average Grant-Date Fair Value | |||||||
| Balance, July 31, 2020 | $ | |||||||
| Granted | ||||||||
| Vested | ( | ) | ||||||
| Balance, July 31, 2021 | ||||||||
| Granted | ||||||||
| Vested | ( | ) | ||||||
| Balance, July 31, 2022 | ||||||||
| Issuance of Replacement Options (Note 3) | ||||||||
| Granted | ||||||||
| Forfeited | ( | ) | ||||||
| Vested | ( | ) | ||||||
| Balance, July 31, 2023 | $ | |||||||
As at July 31, 2023, the aggregate intrinsic value of all outstanding stock options granted was estimated at $
A summary of stock options outstanding and exercisable as at July 31, 2023 is as follows:
| Options Outstanding | Options Exercisable | |||||||||||||||||||||||
| Range of Exercise | Outstanding at | Weighted Average | Weighted Average Remaining Contractual Term | Exercisable at | Weighted Average | Weighted Average Remaining Contractual Term | ||||||||||||||||||
| Prices | July 31, 2023 | Exercise Price | (Years) | July 31, 2023 | Exercise Price | (Years) | ||||||||||||||||||
| $0.80 to $0.99 | $ | $ | ||||||||||||||||||||||
| $1.00 to $1.99 | ||||||||||||||||||||||||
| $2.00 to $2.99 | ||||||||||||||||||||||||
| $3.00 to $3.99 | ||||||||||||||||||||||||
| $4.00 to $4.23 | ||||||||||||||||||||||||
| $ | $ | |||||||||||||||||||||||
July 31, 2023
Restricted Stock Units
During Fiscal 2023, Fiscal 2022 and Fiscal 2021, the Company granted RSUs to certain directors and officers of the Company under our then stock incentive plans. RSUs granted during Fiscal 2023 and Fiscal 2022 have a vesting period of years from the grant date, whereby -third of the RSUs will vest at the end of the first, second and third year, respectively, from the date of grant. RSUs granted during Fiscal 2021 have a vesting period of years from the grant date, whereby -half of the RSUs will vest at the end of the first year, and -third of the remaining one-half will vest at the end of each of the first, second and third year, respectively, from the date of grant. The fair value of these RSUs were determined using the share prices at the respective grant dates.
A continuity schedule of outstanding RSUs as at July 31, 2023, and the changes during the fiscal year end periods, is as follows:
| Number of Restricted | Weighted Average | |||||||
| Stock Units | Grant Date Fair Value | |||||||
| Balance, July 31, 2020 | $ | |||||||
| Granted | ||||||||
| Vested | ( | ) | ||||||
| Balance, July 31, 2021 | ||||||||
| Granted | ||||||||
| Vested | ( | ) | ||||||
| Balance, July 31, 2022 | ||||||||
| Granted | ||||||||
| Vested | ( | ) | ||||||
| Forfeited | ( | ) | ||||||
| Balance, July 31, 2023 | $ | |||||||
A summary of outstanding unvested RSUs as at July 31, 2023, is as follows:
| Number of Restricted | Grant Date | Remaining Life | Aggregate Intrinsic | |||||||||||||
| Grant Date | Stock Units | Fair Value | (Years) | Value | ||||||||||||
| July 21, 2021 | $ | $ | ||||||||||||||
| May 01, 2022 | ||||||||||||||||
| July 29, 2022 | ||||||||||||||||
| July 31, 2023 | ||||||||||||||||
| $ | $ | |||||||||||||||
During Fiscal 2023, Fiscal 2022 and Fiscal 2021, the number of RSUs vested, the net RSU shares issued and the net RSU shares forfeited as payments of tax withholding amounts are as follows:
| Year Ended July 31, | ||||||||||||
| 2023 | 2022 | 2021 | ||||||||||
| Number of RSUs vested | ||||||||||||
| Number of net RSU shares issued | ||||||||||||
| Number of RSU shares forfeited as payments of withholding amount | ||||||||||||
During Fiscal 2023, Fiscal 2022 and Fiscal 2021, stock-based compensation relating to the RSUs were $
As at July 31, 2023, unrecognized compensation costs related to unvested RSUs totaled $
Performance Based Restricted Stock Units
During Fiscal 2023, Fiscal 2022 and Fiscal 2021, the Company granted
These PRSUs have a market condition considered in the determination of the fair value such that the ultimate number of PRSUs that vest will be determined by the Company’s share performance relative to the Global X Uranium ETF share price from the grant date over the Performance Period. Depending on the TSR performance, the percentage eligible to vest at the end of the respective Measurement Period would range from
The fair values of the Target PRSUs granted were valued using the Monte Carlo Simulation Model at the date of grant with the following principal assumptions.
| Year Ended July 31, | ||||||||||||
| 2023 | 2022 | 2021 | ||||||||||
| Expected Risk Free Interest Rate | % | % | % | |||||||||
| Expected Volatility | % | % | % | |||||||||
| Expected Dividend Yield | % | % | % | |||||||||
| Expected Life in Years | ||||||||||||
| Correlation | % | % | % | |||||||||
| Grant Price | $ | $ | $ | |||||||||
| Grant Date Fair Value | $ | $ | $ | |||||||||
July 31, 2023
A continuity schedule of unvested PRSUs as at July 31, 2023, and the changes during the fiscal year end periods, is as follows:
| Number of Unvested | Weighted Average Grant Date | |||||||
| PRSUs | Fair Value | |||||||
| Balance, July 31, 2020 | $ | |||||||
| Granted | ||||||||
| Balance, July 31, 2021 | ||||||||
| Granted | ||||||||
| Vested | ( | ) | ||||||
| Balance, July 31, 2022 | ||||||||
| Granted | ||||||||
| Balance, July 31, 2023 | $ | |||||||
During Fiscal 2023, Fiscal 2022 and Fiscal 2021, stock-based compensation related to amortization of PRSUs totaled $
Stock-Based Compensation
A summary of stock-based compensation expense for Fiscal 2023, Fiscal 2022 and Fiscal 2021, is as follows:
| Year Ended July 31, | ||||||||||||
| 2023 | 2022 | 2021 | ||||||||||
| Stock-Based Compensation for Consultants | ||||||||||||
| Common stock issued to consultants | $ | $ | $ | |||||||||
| Amortization of stock option expenses | ||||||||||||
| Stock-Based Compensation for Management | ||||||||||||
| Common stock issued to management | ||||||||||||
| Amortization of stock option expenses | ||||||||||||
| Amortization of RSU and PRSU expenses | ||||||||||||
| Stock-Based Compensation for Employees | ||||||||||||
| Common stock issued to employees | ||||||||||||
| Amortization of stock option expenses | ||||||||||||
| Amortization of RSU expenses | ||||||||||||
| $ | $ | $ | ||||||||||
| NOTE 18: | SALES AND SERVICE REVENUE AND COST OF SALES AND SERVICES |
The table below provides a breakdown of sales and service revenue and cost of sales and service revenue:
| Year Ended July 31, | ||||||||||||
| 2023 | 2022 | 2021 | ||||||||||
| Sales of purchased uranium inventory | $ | $ | $ | |||||||||
| Revenue from toll processing services | ||||||||||||
| Total sales and service revenue | $ | $ | $ | |||||||||
| Cost of purchased uranium inventory | $ | ( | ) | $ | ( | ) | $ | |||||
| Cost of toll processing services | ( | ) | ( | ) | ||||||||
| Total cost of sales and services | $ | ( | ) | $ | ( | ) | $ | |||||
July 31, 2023
The table below provides a breakdown of major customers:
| Year Ended July 31, | ||||||||
| 2023 | 2022 | |||||||
| Customer A | % | % | ||||||
| Customer B | % | % | ||||||
| Customer C | % | % | ||||||
| Customer D | % | % | ||||||
| Customer E | % | % | ||||||
| Customer F | % | % | ||||||
| Customer G | % | % | ||||||
| Others | % | % | ||||||
| % | % | |||||||
| NOTE 19: | FAIR VALUE LOSS ON EQUITY SECURITIES |
Fair value loss on equity securities consisted for the following:
| Year Ended July 31, | ||||||||||||
| 2023 | 2022 | 2021 | ||||||||||
| Urealized loss from investment in Anfield shares | $ | ( | ) | $ | ( | ) | $ | |||||
| Urealized loss from investment in Anfield warrants | ( | ) | ( | ) | ||||||||
| Unrealized gain from investment in UEX shares | ||||||||||||
| Unrealized and realized gain (loss) from other public listed companies | ( | ) | ||||||||||
| Realized loss from investment in UEX shares transferred as consideration for UEX Acquisition | ( | ) | ||||||||||
| Total | $ | ( | ) | $ | ( | ) | $ | |||||
Our investments in Anfield shares, Anfield warrants, UEX shares and other public companies’ shares are Level 1 financial instruments, which were re-valued using quoted share prices.
| NOTE 20: | GENERAL AND ADMINISTRATIVE EXPENSES |
The table below provides a breakdown of general and administrative expenses:
| Year Ended July 31, | ||||||||||||
| 2023 | 2022 | 2021 | ||||||||||
| Salaries and management fees | $ | $ | $ | |||||||||
| Office, IR, communication, insurance and travel | ||||||||||||
| Foreign exchange loss | ||||||||||||
| Professional fees | ||||||||||||
| Sub-total | ||||||||||||
| Stock-based compensation | ||||||||||||
| Total general and administrative expenses | $ | $ | $ | |||||||||
| NOTE 21: | NET INCOME (LOSS) PER SHARE |
The following table reconciles the weighted average number of shares used in the computation of basic and diluted income (loss) per share for Fiscal 2023, Fiscal 2022 and Fiscal 2021:
| Year Ended July 31, | ||||||||||||
| Numerator | 2023 | 2022 | 2021 | |||||||||
| Net Income (Loss) for the Year | $ | ( | ) | $ | $ | ( | ) | |||||
| Denominator | ||||||||||||
| Basic Weighted Average Number of Shares | ||||||||||||
| Dilutive Effect of Stock Awards and Warrants | ||||||||||||
| Diluted Weighted Average Number of Shares | ||||||||||||
| Net Income (Loss) Per Share - Basic | $ | ( | ) | $ | $ | ( | ) | |||||
| Net Income (Loss) Per Share - Diluted | $ | ( | ) | $ | $ | ( | ) | |||||
For Fiscal 2021, all outstanding share purchase warrants and stock awards including stock options, RSUs and PRSUs were excluded from the computation of diluted loss per share as their effects would be anti-dilutive.
July 31, 2023
| NOTE 22: | INCOME TAXES |
A reconciliation of income tax computed at the federal and state statutory tax rates including the Company’s effective tax rate is as follows:
| Year Ended July 31, | ||||||||||||
| 2023 | 2022 | 2022 | ||||||||||
| Federal income tax provision rate | % | % | % | |||||||||
| State income tax provision rate, net of federal income tax effect | % | % | % | |||||||||
| Total income tax provision rate | % | % | % | |||||||||
The actual income tax provisions differ from the expected amounts calculated by applying the combined federal and state corporate income tax rates to our loss before income taxes.
The components of these differences are as follows:
| Year Ended July 31, | ||||||||||||
| 2023 | 2022 | 2022 | ||||||||||
| Income (Loss) before income taxes | $ | ( | ) | $ | $ | ( | ) | |||||
| Corporate tax rate | % | % | % | |||||||||
| Expected tax expense (recovery) | ( | ) | ( | ) | ||||||||
| Increase (decrease) resulting from | ||||||||||||
| Foreign tax rate differences | ( | ) | ||||||||||
| Permanent differences | ( | ) | ( | ) | ||||||||
| Prior year true-up | ( | ) | ( | ) | ||||||||
| Change in state tax rate | ( | ) | ( | ) | ( | ) | ||||||
| Foreign exchange rate differences | ( | ) | ( | ) | ||||||||
| Other | ||||||||||||
| Change in valuation allowance | ( | ) | ( | ) | ||||||||
| Deferred tax expense (recovery) | $ | $ | ( | ) | $ | ( | ) | |||||
We have incurred taxable losses for all years since inception and, accordingly, no provision for current income tax has been recorded for the current or any prior fiscal years.
July 31, 2023
As at July 31, 2023, we re-evaluated the realizability of our tax loss carry-forwards and our conclusion that the realization of these tax loss carry-forwards is not likely to occur remains unchanged. As a result, we will continue to record a full valuation allowance for the deferred tax assets relating to the remaining tax loss carry-forwards.
The components of income (loss) from operations before income taxes, by tax jurisdiction, are as follows:
| Year Ended July 31, | ||||||||||||
| 2023 | 2022 | 2022 | ||||||||||
| United States | $ | $ | $ | ( | ) | |||||||
| Canada | ( | ) | ||||||||||
| Paraguay | ( | ) | ( | ) | ( | ) | ||||||
| $ | ( | ) | $ | $ | ( | ) | ||||||
The Company’s deferred tax assets (liabilities) are as follows:
| July 31, 2023 | July 31, 2022 | |||||||
| Deferred tax assets (liabilities) | ||||||||
| Mineral properties | $ | $ | ||||||
| Exploration costs | ||||||||
| Stock option expense | ||||||||
| Depreciable property | ||||||||
| Inventories | ( | ) | ( | ) | ||||
| Asset retirement obligations | ||||||||
| Other | ( | ) | ||||||
| Section 163(j) interest expense carry forwards | ||||||||
| Loss carry forwards | ||||||||
| Valuation allowance | ( | ) | ( | ) | ||||
| Deferred tax assets | ||||||||
| Deferred tax liabilities | ||||||||
| Mineral properties | ( | ) | ( | ) | ||||
| Net deferred tax liabilities | $ | ( | ) | $ | ( | ) | ||
As the criteria for recognizing deferred tax assets have not been met due to the uncertainty of realization, a valuation allowance of
The Company’s U.S. net operating loss carry-forwards expire as follows:
| July 31, 2024 | $ | |||
| July 31, 2025 | ||||
| July 31, 2026 | ||||
| July 31, 2027 | ||||
| July 31, 2028 | ||||
| Between July 31, 2009 and 2037 | ||||
| No expiry | ||||
| $ |
July 31, 2023
For U.S. federal income tax purposes, a change in ownership under IRC Section 382 has occurred as a result of the Company’s acquisitions in prior years. When an ownership change has occurred, the utilization of these losses against future income would be subject to an annual limitation, which would be equal to the value of the acquired company immediately prior to the change in ownership multiplied by the IRC Section 382 rate in effect during the month of the change.
The Company’s Canadian net operating loss carry-forwards in Canadian dollars expire as follows:
| July 31, 2027 | $ | |||
| July 31, 2028 | ||||
| July 31, 2029 | ||||
| July 31, 2030 | ||||
| July 31, 2031 | ||||
| Remaining balance | ||||
| $ |
| NOTE 23: | SEGMENTED INFORMATION |
We currently operate in a single reportable segment and we are focused on uranium mining and related activities, including exploration, pre-extraction, extraction and processing of uranium concentrates.
The table below provides a breakdown of the Company’s long-term assets by geographic area:
| July 31, 2023 | ||||||||||||||||
| Balance Sheet Items | United States | Canada | Paraguay | Total | ||||||||||||
| Mineral Rights and Properties | $ | $ | $ | $ | ||||||||||||
| Property, Plant and Equipment | ||||||||||||||||
| Restricted Cash | ||||||||||||||||
| Equity-Accounted Investment | ||||||||||||||||
| Investment in Equity Securities | ||||||||||||||||
| Other Non-Current Assets | ||||||||||||||||
| Total Long-Term Assets | $ | $ | $ | $ | ||||||||||||
| July 31, 2022 | ||||||||||||||||
| Balance Sheet Items | United States | Canada | Paraguay | Total | ||||||||||||
| Mineral Rights and Properties | $ | $ | $ | $ | ||||||||||||
| Property, Plant and Equipment | ||||||||||||||||
| Restricted Cash | ||||||||||||||||
| Equity-Accounted Investment | ||||||||||||||||
| Investment in Equity Securities | ||||||||||||||||
| Other Non-Current Assets | ||||||||||||||||
| Total Long-Term Assets | $ | $ | $ | $ | ||||||||||||
July 31, 2023
The table below provides a breakdown of our operating results by geographic area. All intercompany transactions have been eliminated.
| Year ended July 31, 2023 | ||||||||||||||||
| Statement of Operations | United States | Canada | Paraguay | Total | ||||||||||||
| Sales and service revenue | $ | $ | $ | $ | ||||||||||||
| Cost of sales and services | ( | ) | ( | ) | ||||||||||||
| Gross profit | ||||||||||||||||
| Operating Costs: | ||||||||||||||||
| Mineral property expenditures | ||||||||||||||||
| General and administrative | ||||||||||||||||
| Acquisition-related costs | ||||||||||||||||
| Depreciation, amortization and accretion | ||||||||||||||||
| Total operating costs | ||||||||||||||||
| Income (loss) from operations | ( | ) | ( | ) | ||||||||||||
| Other income (expenses) | ( | ) | ( | ) | ( | ) | ||||||||||
| Income (loss) before income taxes | $ | $ | ( | ) | $ | ( | ) | $ | ( | ) | ||||||
| Year ended July 31, 2022 | ||||||||||||||||
| Statement of Operations | United States | Canada | Paraguay | Total | ||||||||||||
| Sales and service revenue | $ | $ | $ | $ | ||||||||||||
| Cost of sales and services | ( | ) | ( | ) | ||||||||||||
| Gross profit | ||||||||||||||||
| Operating Costs: | ||||||||||||||||
| Mineral property expenditures | ||||||||||||||||
| General and administrative | ||||||||||||||||
| Acquisition-related costs | ||||||||||||||||
| Depreciation, amortization and accretion | ||||||||||||||||
| Total operating costs | ||||||||||||||||
| Income (loss) from operations | ( | ) | ( | ) | ( | ) | ( | ) | ||||||||
| Other income (expenses) | ||||||||||||||||
| Income (loss) before income taxes | $ | ( | ) | $ | $ | ( | ) | $ | ||||||||
| Year ended July 31, 2021 | ||||||||||||||||
| Statement of Operations | United States | Canada | Paraguay | Total | ||||||||||||
| Operating Costs: | ||||||||||||||||
| Mineral property expenditures | $ | $ | $ | $ | ||||||||||||
| General and administrative | ||||||||||||||||
| Depreciation, amortization and accretion | ||||||||||||||||
| Total operating costs | ||||||||||||||||
| Loss from operations | ( | ) | ( | ) | ( | ) | ( | ) | ||||||||
| Other income (expenses) | ( | ) | ||||||||||||||
| Loss before income taxes | $ | ( | ) | $ | $ | ( | ) | $ | ( | ) | ||||||
| NOTE 24: | SUBSEQUENT EVENT |
On August 22, 2023, we acquired a portfolio of exploration-stage projects in the Athabasca Basin, Saskatchewan, Canada, which includes
SIGNATURES
Pursuant to the requirements of Section 13 or 15(d) of the Securities Exchange Act of 1934, the registrant has duly caused this Annual Report to be signed on its behalf by the undersigned, thereunto duly authorized.
| URANIUM ENERGY CORP. | |||
| By: | /s/ Amir Adnani | ||
| Amir Adnani President, Chief Executive Officer | |||
| (Principal Executive Officer) and Director | |||
| Date: September 28, 2023. | |||
Pursuant to the requirements of the Securities Exchange Act of 1934, this Annual Report has been signed below by the following persons on behalf of the registrant and in the capacities and on the dates indicated.
| By: | /s/ Amir Adnani | ||
| Amir Adnani | |||
| President, Chief Executive Officer (Principal | |||
| Executive Officer) and Director | |||
| Date: September 28, 2023. |
| By: | /s/ Pat Obara | ||
| Pat Obara | |||
| Chief Financial Officer (Principal Financial Officer | |||
| and Principal Accounting Officer) | |||
| Date: September 28, 2023. |
| By: | /s/ Spencer Abraham | ||
| Spencer Abraham | |||
| Chairman and Director | |||
| Date: September 28, 2023. |
| By: | /s/ Vincent Della Volpe | ||
| Vincent Della Volpe | |||
| Director | |||
| Date: September 28, 2023. |
| By: | /s/ David Kong | ||
| David Kong | |||
| Director | |||
| Date: September 28, 2023. |
| By: | /s/ Trecia Canty | ||
| Trecia Canty | |||
| Director | |||
| Date: September 28, 2023. |
| By: | /s/ Gloria Ballesta | ||
| Gloria Ballesta | |||
| Director | |||
| Date: September 28, 2023. |