falseFY20190001334036--12-31——00013340362019-01-012019-12-31iso4217:USD00013340362019-06-28xbrli:shares00013340362020-02-2000013340362018-01-012018-12-3100013340362017-01-012017-12-310001334036us-gaap:RetainedEarningsMember2019-01-012019-12-31iso4217:USDxbrli:shares00013340362019-12-3100013340362018-12-310001334036us-gaap:CommonStockMember2016-12-310001334036us-gaap:TreasuryStockMember2016-12-310001334036us-gaap:AdditionalPaidInCapitalMember2016-12-310001334036us-gaap:RetainedEarningsMember2016-12-310001334036us-gaap:AccumulatedOtherComprehensiveIncomeMember2016-12-3100013340362016-12-310001334036us-gaap:AdditionalPaidInCapitalMember2017-01-012017-12-310001334036us-gaap:CommonStockMember2017-01-012017-12-310001334036us-gaap:TreasuryStockMember2017-01-012017-12-310001334036us-gaap:RetainedEarningsMember2017-01-012017-12-310001334036us-gaap:AccumulatedOtherComprehensiveIncomeMember2017-01-012017-12-310001334036us-gaap:CommonStockMember2017-12-310001334036us-gaap:TreasuryStockMember2017-12-310001334036us-gaap:AdditionalPaidInCapitalMember2017-12-310001334036us-gaap:RetainedEarningsMember2017-12-310001334036us-gaap:AccumulatedOtherComprehensiveIncomeMember2017-12-3100013340362017-12-310001334036us-gaap:AdditionalPaidInCapitalMember2018-01-012018-12-310001334036us-gaap:CommonStockMember2018-01-012018-12-310001334036us-gaap:TreasuryStockMember2018-01-012018-12-310001334036us-gaap:RetainedEarningsMember2018-01-012018-12-310001334036us-gaap:AccumulatedOtherComprehensiveIncomeMember2018-01-012018-12-310001334036us-gaap:CommonStockMember2018-12-310001334036us-gaap:TreasuryStockMember2018-12-310001334036us-gaap:AdditionalPaidInCapitalMember2018-12-310001334036us-gaap:RetainedEarningsMember2018-12-310001334036us-gaap:AccumulatedOtherComprehensiveIncomeMember2018-12-310001334036us-gaap:RetainedEarningsMember2019-01-0100013340362019-01-010001334036us-gaap:AdditionalPaidInCapitalMember2019-01-012019-12-310001334036us-gaap:CommonStockMember2019-01-012019-12-310001334036us-gaap:TreasuryStockMember2019-01-012019-12-310001334036us-gaap:AccumulatedOtherComprehensiveIncomeMember2019-01-012019-12-310001334036us-gaap:CommonStockMember2019-12-310001334036us-gaap:TreasuryStockMember2019-12-310001334036us-gaap:AdditionalPaidInCapitalMember2019-12-310001334036us-gaap:RetainedEarningsMember2019-12-310001334036us-gaap:AccumulatedOtherComprehensiveIncomeMember2019-12-310001334036us-gaap:ConvertiblePreferredStockMember2018-01-012018-12-31crox:affiliate0001334036crox:BlackstoneCapitalPartnersVILPMembersrt:AffiliatedEntityMember2019-11-030001334036crox:BlackstoneCapitalPartnersVILPMembersrt:AffiliatedEntityMember2019-11-042019-11-040001334036crox:GreggSRibattMembersrt:AffiliatedEntityMember2019-11-042019-11-040001334036srt:AffiliatedEntityMembercrox:LegalCostsForBlackstoneAffiliatesPublicOfferingTransactionMember2019-01-012019-12-310001334036srt:AffiliatedEntityMember2019-01-012019-11-040001334036srt:AffiliatedEntityMember2018-01-012018-12-310001334036srt:AffiliatedEntityMember2017-01-012017-12-31xbrli:pure00013340362018-01-010001334036us-gaap:MachineryAndEquipmentMembersrt:MinimumMember2019-01-012019-12-310001334036us-gaap:MachineryAndEquipmentMembersrt:MaximumMember2019-01-012019-12-310001334036srt:MinimumMemberus-gaap:FurnitureAndFixturesMember2019-01-012019-12-310001334036srt:MaximumMemberus-gaap:FurnitureAndFixturesMember2019-01-012019-12-310001334036us-gaap:ComputerSoftwareIntangibleAssetMembersrt:MinimumMember2019-01-012019-12-310001334036us-gaap:ComputerSoftwareIntangibleAssetMembersrt:MaximumMember2019-01-012019-12-310001334036srt:MinimumMemberus-gaap:IntellectualPropertyMember2019-01-012019-12-310001334036srt:MaximumMemberus-gaap:IntellectualPropertyMember2019-01-012019-12-310001334036us-gaap:AccountingStandardsUpdate201602Member2019-01-010001334036us-gaap:CostOfSalesMember2019-01-012019-12-310001334036us-gaap:CostOfSalesMember2018-01-012018-12-310001334036us-gaap:CostOfSalesMember2017-01-012017-12-310001334036us-gaap:SellingGeneralAndAdministrativeExpensesMember2019-01-012019-12-310001334036us-gaap:SellingGeneralAndAdministrativeExpensesMember2018-01-012018-12-310001334036us-gaap:SellingGeneralAndAdministrativeExpensesMember2017-01-012017-12-310001334036crox:UnderperformingRetailStoresMember2018-01-012018-12-310001334036crox:UnderperformingRetailStoresMember2017-01-012017-12-310001334036srt:AmericasMembercrox:UnderperformingRetailStoresMember2018-01-012018-12-31crox:store0001334036srt:AmericasMembercrox:UnderperformingRetailStoresMember2017-01-012017-12-310001334036srt:AsiaPacificMembercrox:UnderperformingRetailStoresMember2018-01-012018-12-310001334036srt:AsiaPacificMembercrox:UnderperformingRetailStoresMember2017-01-012017-12-310001334036us-gaap:EMEAMembercrox:UnderperformingRetailStoresMember2018-01-012018-12-310001334036us-gaap:EMEAMembercrox:UnderperformingRetailStoresMember2017-01-012017-12-310001334036us-gaap:ComputerSoftwareIntangibleAssetMember2019-12-310001334036us-gaap:ComputerSoftwareIntangibleAssetMember2018-12-310001334036crox:PatentsCopyrightsAndTrademarksMember2019-12-310001334036crox:PatentsCopyrightsAndTrademarksMember2018-12-310001334036us-gaap:InProcessResearchAndDevelopmentMember2019-12-310001334036us-gaap:InProcessResearchAndDevelopmentMember2018-12-310001334036us-gaap:TrademarksMember2019-12-310001334036us-gaap:TrademarksMember2018-12-31crox:renewal_option0001334036crox:LeaseArrangementsExistingatBeginningofPeriodMember2019-01-012019-01-010001334036crox:LeaseArrangementsCommencedDuringthePeriodMember2019-01-012019-12-310001334036crox:LeaseArrangementsCorporateHeadquartersandRegionalOfficeinBroomfieldColoradoMember2019-12-31iso4217:EUR0001334036crox:NewDistributionCenterInDordrechtMember2019-12-310001334036crox:LeaseArrangementsNewDistributionCenterinDaytonOhioMember2018-12-310001334036us-gaap:FairValueMeasurementsRecurringMember2019-12-310001334036us-gaap:FairValueMeasurementsRecurringMember2018-12-310001334036us-gaap:CarryingReportedAmountFairValueDisclosureMember2019-12-310001334036us-gaap:EstimateOfFairValueFairValueDisclosureMemberus-gaap:FairValueMeasurementsRecurringMember2019-12-310001334036us-gaap:CarryingReportedAmountFairValueDisclosureMember2018-12-310001334036us-gaap:EstimateOfFairValueFairValueDisclosureMemberus-gaap:FairValueMeasurementsRecurringMember2018-12-310001334036us-gaap:EstimateOfFairValueFairValueDisclosureMemberus-gaap:FairValueInputsLevel3Memberus-gaap:FairValueMeasurementsNonrecurringMember2018-01-012018-12-310001334036us-gaap:EstimateOfFairValueFairValueDisclosureMemberus-gaap:FairValueInputsLevel3Memberus-gaap:FairValueMeasurementsNonrecurringMember2017-01-012017-12-310001334036us-gaap:FairValueInputsLevel2Member2019-12-310001334036us-gaap:FairValueInputsLevel2Member2018-12-310001334036currency:EUR2019-12-310001334036currency:EUR2018-12-310001334036currency:SGD2019-12-310001334036currency:SGD2018-12-310001334036currency:JPY2019-12-310001334036currency:JPY2018-12-310001334036currency:KRW2019-12-310001334036currency:KRW2018-12-310001334036currency:GBP2019-12-310001334036currency:GBP2018-12-310001334036currency:XXX2019-12-310001334036currency:XXX2018-12-310001334036us-gaap:RevolvingCreditFacilityMember2019-12-310001334036us-gaap:RevolvingCreditFacilityMember2018-12-310001334036us-gaap:RevolvingCreditFacilityMembercrox:SeniorRevolvingCreditFacilityMember2019-07-310001334036us-gaap:FederalFundsEffectiveSwapRateMemberus-gaap:RevolvingCreditFacilityMembercrox:SeniorRevolvingCreditFacilityMember2019-01-012019-12-310001334036us-gaap:LondonInterbankOfferedRateLIBORMemberus-gaap:RevolvingCreditFacilityMembercrox:SeniorRevolvingCreditFacilityMember2019-01-012019-12-310001334036srt:MinimumMemberus-gaap:LondonInterbankOfferedRateLIBORMemberus-gaap:RevolvingCreditFacilityMembercrox:SeniorRevolvingCreditFacilityMember2019-01-012019-12-310001334036us-gaap:LondonInterbankOfferedRateLIBORMembersrt:MaximumMemberus-gaap:RevolvingCreditFacilityMembercrox:SeniorRevolvingCreditFacilityMember2019-01-012019-12-310001334036us-gaap:RevolvingCreditFacilityMembercrox:SeniorRevolvingCreditFacilityMembercrox:DebtInstrumentCovenantPeriodOneMember2019-07-310001334036us-gaap:RevolvingCreditFacilityMembercrox:DebtInstrumentCovenantPeriodTwoMembercrox:SeniorRevolvingCreditFacilityMember2019-07-310001334036crox:DebtInstrumentCovenantPeriodThreeMemberus-gaap:RevolvingCreditFacilityMembercrox:SeniorRevolvingCreditFacilityMember2019-07-310001334036crox:DebtInstrumentCovenantPeriodFourMemberus-gaap:RevolvingCreditFacilityMembercrox:SeniorRevolvingCreditFacilityMember2019-07-310001334036us-gaap:RevolvingCreditFacilityMembercrox:SeniorRevolvingCreditFacilityMember2019-12-310001334036us-gaap:LetterOfCreditMembercrox:SeniorRevolvingCreditFacilityMember2019-12-310001334036us-gaap:RevolvingCreditFacilityMembercrox:SeniorRevolvingCreditFacilityMember2018-12-310001334036crox:AsiaPacificRevolvingCreditFacilityMemberus-gaap:RevolvingCreditFacilityMember2018-12-310001334036crox:AsiaPacificRevolvingCreditFacilityMemberus-gaap:RevolvingCreditFacilityMember2019-12-31crox:class_of_stockcrox:vote0001334036us-gaap:CommonStockMember2018-02-200001334036us-gaap:CommonStockMember2019-05-050001334036us-gaap:CommonStockMember2019-01-012019-12-310001334036us-gaap:CommonStockMember2018-01-012018-12-310001334036us-gaap:CommonStockMember2017-01-012017-12-310001334036us-gaap:CommonStockMember2019-12-310001334036us-gaap:SeriesAPreferredStockMember2019-12-310001334036us-gaap:SeriesAPreferredStockMember2018-12-052018-12-050001334036us-gaap:SeriesAPreferredStockMember2018-12-0500013340362018-12-052018-12-050001334036us-gaap:CommonStockMember2018-12-052018-12-0500013340362018-12-052018-12-3100013340362019-01-012019-01-310001334036srt:AmericasMembercrox:SalesChannelThroughIntermediaryWholesaleMember2019-01-012019-12-310001334036srt:AsiaPacificMembercrox:SalesChannelThroughIntermediaryWholesaleMember2019-01-012019-12-310001334036crox:SalesChannelThroughIntermediaryWholesaleMemberus-gaap:EMEAMember2019-01-012019-12-310001334036crox:SalesChannelThroughIntermediaryWholesaleMembercrox:OtherBusinessesMember2019-01-012019-12-310001334036crox:SalesChannelThroughIntermediaryWholesaleMember2019-01-012019-12-310001334036srt:AmericasMembercrox:SalesChannelDirectlytoConsumerRetailMember2019-01-012019-12-310001334036srt:AsiaPacificMembercrox:SalesChannelDirectlytoConsumerRetailMember2019-01-012019-12-310001334036us-gaap:EMEAMembercrox:SalesChannelDirectlytoConsumerRetailMember2019-01-012019-12-310001334036crox:OtherBusinessesMembercrox:SalesChannelDirectlytoConsumerRetailMember2019-01-012019-12-310001334036crox:SalesChannelDirectlytoConsumerRetailMember2019-01-012019-12-310001334036srt:AmericasMembercrox:SalesChannelDirectlytoConsumereCommerceMember2019-01-012019-12-310001334036srt:AsiaPacificMembercrox:SalesChannelDirectlytoConsumereCommerceMember2019-01-012019-12-310001334036us-gaap:EMEAMembercrox:SalesChannelDirectlytoConsumereCommerceMember2019-01-012019-12-310001334036crox:SalesChannelDirectlytoConsumereCommerceMembercrox:OtherBusinessesMember2019-01-012019-12-310001334036crox:SalesChannelDirectlytoConsumereCommerceMember2019-01-012019-12-310001334036srt:AmericasMember2019-01-012019-12-310001334036srt:AsiaPacificMember2019-01-012019-12-310001334036us-gaap:EMEAMember2019-01-012019-12-310001334036crox:OtherBusinessesMember2019-01-012019-12-310001334036srt:AmericasMembercrox:SalesChannelThroughIntermediaryWholesaleMember2018-01-012018-12-310001334036srt:AsiaPacificMembercrox:SalesChannelThroughIntermediaryWholesaleMember2018-01-012018-12-310001334036crox:SalesChannelThroughIntermediaryWholesaleMemberus-gaap:EMEAMember2018-01-012018-12-310001334036crox:SalesChannelThroughIntermediaryWholesaleMembercrox:OtherBusinessesMember2018-01-012018-12-310001334036crox:SalesChannelThroughIntermediaryWholesaleMember2018-01-012018-12-310001334036srt:AmericasMembercrox:SalesChannelDirectlytoConsumerRetailMember2018-01-012018-12-310001334036srt:AsiaPacificMembercrox:SalesChannelDirectlytoConsumerRetailMember2018-01-012018-12-310001334036us-gaap:EMEAMembercrox:SalesChannelDirectlytoConsumerRetailMember2018-01-012018-12-310001334036crox:OtherBusinessesMembercrox:SalesChannelDirectlytoConsumerRetailMember2018-01-012018-12-310001334036crox:SalesChannelDirectlytoConsumerRetailMember2018-01-012018-12-310001334036srt:AmericasMembercrox:SalesChannelDirectlytoConsumereCommerceMember2018-01-012018-12-310001334036srt:AsiaPacificMembercrox:SalesChannelDirectlytoConsumereCommerceMember2018-01-012018-12-310001334036us-gaap:EMEAMembercrox:SalesChannelDirectlytoConsumereCommerceMember2018-01-012018-12-310001334036crox:SalesChannelDirectlytoConsumereCommerceMembercrox:OtherBusinessesMember2018-01-012018-12-310001334036crox:SalesChannelDirectlytoConsumereCommerceMember2018-01-012018-12-310001334036srt:AmericasMember2018-01-012018-12-310001334036srt:AsiaPacificMember2018-01-012018-12-310001334036us-gaap:EMEAMember2018-01-012018-12-310001334036crox:OtherBusinessesMember2018-01-012018-12-310001334036crox:SalesChannelThroughIntermediaryWholesaleMembercrox:ChangeInEstimateOfProductTransfersMember2019-01-012019-12-310001334036crox:ChangeInEstimateOfProductTransfersMembercrox:SalesChannelDirectlytoConsumereCommerceMember2019-01-012019-12-310001334036crox:SalesChannelThroughIntermediaryWholesaleMembercrox:ChangeInEstimateOfProductTransfersMember2018-01-012018-12-310001334036crox:ChangeInEstimateOfProductTransfersMembercrox:SalesChannelDirectlytoConsumereCommerceMember2018-01-012018-12-310001334036crox:ChangeInEstimateOfProductTransfersMembercrox:SalesChannelDirectlytoConsumerRetailMember2019-01-012019-12-310001334036crox:ChangeInEstimateOfProductTransfersMembercrox:SalesChannelDirectlytoConsumerRetailMember2018-01-012018-12-31crox:segmentscrox:distribution_channel0001334036crox:AdvanceCustomerDepositsMember2019-12-310001334036crox:AdvanceCustomerDepositsMember2018-12-310001334036crox:AdvanceCustomerDepositsMember2019-01-012019-12-310001334036crox:RefundLiabilityMember2019-12-310001334036crox:RefundLiabilityMember2018-12-310001334036us-gaap:EmployeeStockOptionMember2017-01-012017-12-310001334036us-gaap:EmployeeStockOptionMember2019-01-012019-12-310001334036us-gaap:EmployeeStockOptionMember2018-01-012018-12-310001334036us-gaap:EmployeeStockOptionMember2019-12-310001334036crox:RemainingYearsMonthlyVestingMemberus-gaap:EmployeeStockOptionMember2019-01-012019-12-310001334036us-gaap:RestrictedStockMember2019-01-012019-12-31crox:vesting_installment0001334036crox:TimeBasedRestrictedStockUnitsMember2019-12-310001334036crox:TimeBasedRestrictedStockUnitsMember2019-01-012019-12-310001334036crox:TimeBasedRestrictedStockUnitsMember2018-01-012018-12-310001334036crox:TimeBasedRestrictedStockUnitsMember2017-01-012017-12-310001334036srt:MinimumMembercrox:PerformanceBasedRestrictedStockUnitsMember2019-12-310001334036srt:MaximumMembercrox:PerformanceBasedRestrictedStockUnitsMember2019-12-310001334036crox:PerformanceBasedRestrictedStockUnitsMember2019-12-310001334036crox:PerformanceBasedRestrictedStockUnitsMember2019-01-012019-12-310001334036crox:PerformanceBasedRestrictedStockUnitsMember2018-01-012018-12-310001334036crox:PerformanceBasedRestrictedStockUnitsMember2017-01-012017-12-310001334036us-gaap:RestrictedStockMember2018-12-310001334036us-gaap:RestrictedStockUnitsRSUMember2018-12-310001334036us-gaap:RestrictedStockUnitsRSUMember2019-01-012019-12-310001334036us-gaap:RestrictedStockMember2019-12-310001334036us-gaap:RestrictedStockUnitsRSUMember2019-12-310001334036us-gaap:RestrictedStockMember2018-01-012018-12-310001334036us-gaap:RestrictedStockMember2017-01-012017-12-310001334036us-gaap:RestrictedStockUnitsRSUMember2018-01-012018-12-310001334036us-gaap:RestrictedStockUnitsRSUMember2017-01-012017-12-310001334036crox:ValuationAllowanceRelatedToIncomeTaxExpenseMember2019-01-012019-12-310001334036crox:ValuationAllowanceImpactofUnrecordedTaxAttributesRelatedtoChangesinCumulativeTranslationAdjustmentsMember2019-01-012019-12-310001334036crox:ValuationAllowanceRelatedToIncomeTaxExpenseMember2018-01-012018-12-310001334036crox:ValuationAllowanceImpactofUnrecordedTaxAttributesRelatedtoChangesinCumulativeTranslationAdjustmentsMember2018-01-012018-12-310001334036us-gaap:DomesticCountryMember2019-12-310001334036us-gaap:DomesticCountryMember2018-12-310001334036us-gaap:StateAndLocalJurisdictionMember2019-12-310001334036us-gaap:StateAndLocalJurisdictionMember2018-12-310001334036us-gaap:ForeignCountryMember2019-12-310001334036us-gaap:ForeignCountryMember2018-12-310001334036us-gaap:PurchaseCommitmentMember2019-12-310001334036us-gaap:PurchaseCommitmentMember2018-12-310001334036srt:AmericasMemberus-gaap:OperatingSegmentsMember2019-01-012019-12-310001334036srt:AmericasMemberus-gaap:OperatingSegmentsMember2018-01-012018-12-310001334036srt:AmericasMemberus-gaap:OperatingSegmentsMember2017-01-012017-12-310001334036srt:AsiaPacificMemberus-gaap:OperatingSegmentsMember2019-01-012019-12-310001334036srt:AsiaPacificMemberus-gaap:OperatingSegmentsMember2018-01-012018-12-310001334036srt:AsiaPacificMemberus-gaap:OperatingSegmentsMember2017-01-012017-12-310001334036us-gaap:EMEAMemberus-gaap:OperatingSegmentsMember2019-01-012019-12-310001334036us-gaap:EMEAMemberus-gaap:OperatingSegmentsMember2018-01-012018-12-310001334036us-gaap:EMEAMemberus-gaap:OperatingSegmentsMember2017-01-012017-12-310001334036us-gaap:OperatingSegmentsMember2019-01-012019-12-310001334036us-gaap:OperatingSegmentsMember2018-01-012018-12-310001334036us-gaap:OperatingSegmentsMember2017-01-012017-12-310001334036us-gaap:OperatingSegmentsMembercrox:OtherBusinessesMember2019-01-012019-12-310001334036us-gaap:OperatingSegmentsMembercrox:OtherBusinessesMember2018-01-012018-12-310001334036us-gaap:OperatingSegmentsMembercrox:OtherBusinessesMember2017-01-012017-12-310001334036us-gaap:MaterialReconcilingItemsMember2019-01-012019-12-310001334036us-gaap:MaterialReconcilingItemsMember2018-01-012018-12-310001334036us-gaap:MaterialReconcilingItemsMember2017-01-012017-12-310001334036country:US2019-01-012019-12-310001334036country:US2018-01-012018-12-310001334036country:US2017-01-012017-12-310001334036us-gaap:NonUsMember2019-01-012019-12-310001334036us-gaap:NonUsMember2018-01-012018-12-310001334036us-gaap:NonUsMember2017-01-012017-12-310001334036country:US2019-12-310001334036country:US2018-12-310001334036us-gaap:NonUsMember2019-12-310001334036us-gaap:NonUsMember2018-12-31iso4217:BRL00013340362015-01-132015-01-130001334036us-gaap:SettledLitigationMembercrox:BrazilianFederalTaxAuthoritiesMember2015-01-132015-01-1300013340362015-02-252015-02-250001334036us-gaap:SettledLitigationMembercrox:BrazilianFederalTaxAuthoritiesMember2015-02-252015-02-250001334036crox:BrazilianFederalTaxAuthoritiesMember2018-03-222018-03-220001334036crox:DefinedContributionBenefitPlanMembercrox:DefinedContributionPlanTranchesOneMemberus-gaap:PensionPlansDefinedBenefitMember2019-01-012019-12-310001334036crox:DefinedContributionBenefitPlanMembercrox:DefinedContributionPlanTranchesTwoMemberus-gaap:PensionPlansDefinedBenefitMember2019-01-012019-12-310001334036crox:DefinedContributionBenefitPlanMemberus-gaap:PensionPlansDefinedBenefitMember2019-01-012019-12-310001334036crox:DefinedContributionBenefitPlanMemberus-gaap:PensionPlansDefinedBenefitMember2018-01-012018-12-310001334036crox:DefinedContributionBenefitPlanMemberus-gaap:PensionPlansDefinedBenefitMember2017-01-012017-12-3100013340362019-01-012019-03-3100013340362019-04-012019-06-3000013340362019-07-012019-09-3000013340362019-10-012019-12-3100013340362018-01-012018-03-3100013340362018-04-012018-06-3000013340362018-07-012018-09-3000013340362018-10-012018-12-310001334036us-gaap:AllowanceForCreditLossMember2018-12-310001334036us-gaap:AllowanceForCreditLossMember2019-01-012019-12-310001334036us-gaap:AllowanceForCreditLossMember2019-12-310001334036crox:ReserveforSalesReturnsandAllowancesMember2018-12-310001334036crox:ReserveforSalesReturnsandAllowancesMember2019-01-012019-12-310001334036crox:ReserveforSalesReturnsandAllowancesMember2019-12-310001334036crox:ReserveForUnappliedRebates1Member2018-12-310001334036crox:ReserveForUnappliedRebates1Member2019-01-012019-12-310001334036crox:ReserveForUnappliedRebates1Member2019-12-310001334036us-gaap:AllowanceForCreditLossMember2017-12-310001334036us-gaap:AllowanceForCreditLossMember2018-01-012018-12-310001334036crox:ReserveforSalesReturnsandAllowancesMember2017-12-310001334036crox:ReserveforSalesReturnsandAllowancesMember2018-01-012018-12-310001334036crox:ReserveForUnappliedRebates1Member2017-12-310001334036crox:ReserveForUnappliedRebates1Member2018-01-012018-12-310001334036us-gaap:AllowanceForCreditLossMember2016-12-310001334036us-gaap:AllowanceForCreditLossMember2017-01-012017-12-310001334036crox:ReserveforSalesReturnsandAllowancesMember2016-12-310001334036crox:ReserveforSalesReturnsandAllowancesMember2017-01-012017-12-310001334036crox:ReserveForUnappliedRebates1Member2016-12-310001334036crox:ReserveForUnappliedRebates1Member2017-01-012017-12-31
UNITED STATES
SECURITIES AND EXCHANGE COMMISSION
Washington, D.C. 20549
________________________________________________________________________________________________________________________________
FORM 10-K
| | | | | |
| ☒ | ANNUAL REPORT PURSUANT TO SECTION 13 OR 15(d) OF THE SECURITIES EXCHANGE ACT OF 1934 |
For the fiscal year ended December 31, 2019
or
| | | | | |
| ☐ | TRANSITION REPORT PURSUANT TO SECTION 13 OR 15(d) OF THE SECURITIES EXCHANGE ACT OF 1934 |
For the transition period from to
Commission File No. 0-51754
________________________________________________________________________________________________________________________________
CROCS, INC.
(Exact name of registrant as specified in its charter)
| | | | | | | | |
| Delaware | | 20-2164234 |
| (State or other jurisdiction of incorporation or organization) | | (I.R.S. Employer Identification No.) |
7477 East Dry Creek Parkway
Niwot, Colorado 80503
(303) 848-7000
(Address, including zip code and telephone number, including area code, of registrant’s principal executive offices)
Securities registered pursuant to Section 12(b) of the Act:
| | | | | | | | | | | | | | |
| Title of each class: | Trading symbol: | Name of each exchange on which registered: | |
| Common Stock, par value $0.001 per share | CROX | The Nasdaq Global Select Market | |
Securities registered pursuant to Section 12(g) of the Act: None
____________________________________________________________________________
Indicate by check mark if the registrant is a well-known seasoned issuer, as defined in Rule 405 of the Securities Act. Yes ☒ No ☐
Indicate by check mark if the registrant is not required to file reports pursuant to Section 13 or Section 15(d) of the Act. Yes ☐ No ☒
Indicate by check mark whether the registrant (1) has filed all reports required to be filed by Section 13 or 15(d) of the Securities Exchange Act of 1934 during the preceding 12 months (or for such shorter period that the registrant was required to file such reports), and (2) has been subject to such filing requirements for the past 90 days. Yes ☒ No ☐
Indicate by check mark whether the registrant has submitted electronically every Interactive Data File required to be submitted pursuant to Rule 405 of Regulation S-T (§232.405 of this chapter) during the preceding 12 months (or for such shorter period that the registrant was required to submit such files). Yes ☒ No ☐
Indicate by check mark whether the registrant is a large accelerated filer, an accelerated filer, a non-accelerated filer, or a smaller reporting company or emerging growth company. See the definitions of “large accelerated filer”, “accelerated filer,” “smaller reporting company,” and “emerging growth company,” in Rule 12b-2 of the Exchange Act.
| | | | | | | | | | | | | | | | | | | | | | | | | | |
| Large accelerated filer | | Accelerated filer | | Non-accelerated filer | | Smaller reporting company | | Emerging growth company |
| ☒ | | ☐ | | ☐ | | ☐ | | ☐ |
If an emerging growth company, indicate by check mark if the registrant has elected not to use the extended transition period for complying with any new or revised financial accounting standards provided pursuant to Section 13(a) of the Exchange Act. ☐
Indicate by check mark whether the registrant is a shell company (as defined in Rule 12b-2 of the Act). Yes ☐ No ☒
The aggregate market value of the voting common stock held by non-affiliates of the registrant as of June 28, 2019 was approximately $879.4 million. For the purpose of the foregoing calculation only, all directors and executive officers of the registrant and owners of more than 10% of the registrant’s common stock are assumed to be affiliates of the registrant. This determination of affiliate status is not necessarily conclusive for any other purpose.
The number of shares of the registrant’s common stock, par value $0.001 per shares, outstanding as of February 20, 2020 was 68,268,347.
DOCUMENTS INCORPORATED BY REFERENCE
Part III incorporates certain information by reference from the registrant’s proxy statement for the 2020 annual meeting of stockholders to be filed no later than 120 days after the end of the registrant’s fiscal year ended December 31, 2019.
Cautionary Note Regarding Forward-Looking Statements
This Annual Report on Form 10-K contains “forward-looking statements” within the meaning of Section 27A of the Securities Act of 1933, as amended, and Section 21E of the Securities Exchange Act of 1934, as amended (the “Exchange Act”). From time to time, we may also provide oral or written forward-looking statements in other materials we release to the public. Such forward-looking statements are subject to the safe harbor created by the Private Securities Litigation Reform Act of 1995.
Statements that refer to industry trends, projections of our future financial performance, anticipated trends in our business and other characterizations of future events or circumstances are forward-looking statements. These statements, which express management’s current views concerning future events or results, use words like “anticipate,” “assume,” “believe,” “continue,” “estimate,” “expect,” “future,” “intend,” “plan,” “project,” “strive,” and future or conditional tense verbs like “could,” “may,” “might,” “should,” “will,” “would,” and similar expressions or variations. Examples of forward-looking statements include, but are not limited to, statements we make regarding:
•our expectations regarding future trends, selling, general and administrative cost savings, expectations, and performance of our business;
•our belief that we have sufficient liquidity to fund our business operations during the next twelve months;
•our expectations about the impact of our strategic plans; and
•our expectations regarding the impact on the business of the coronavirus disease 2019.
Forward-looking statements are subject to risks, uncertainties and other factors, which may cause actual results to differ materially from future results expressed or implied by such forward-looking statements. Important factors that could cause actual results to differ materially from the forward-looking statements include, without limitation, those described in Part I - Item 1A. Risk Factors of this Annual Report on Form 10-K, elsewhere throughout this Annual Report on Form 10-K, and those described from time to time in our past and future reports filed with the Securities and Exchange Commission (the “SEC”). Caution should be taken not to place undue reliance on any such forward-looking statements. Moreover, such forward-looking statements speak only as of the date of this Annual Report on Form 10-K. We undertake no obligation to update any forward-looking statements to reflect events or circumstances after the date of such statements.
Crocs, Inc.
Table of Contents to the Annual Report on Form 10-K
For the Year Ended December 31, 2019
PART I
ITEM 1. Business
The Company
Crocs, Inc. and its consolidated subsidiaries (collectively the “Company,” “Crocs,” “we,” “us,” or “our”) are engaged in the design, development, worldwide marketing, distribution, and sale of casual lifestyle footwear and accessories for men, women, and children. We strive to be the world leader in innovative casual footwear, combining comfort and style with a value that consumers want. The vast majority of shoes within Crocs’ collection contains Croslite™ material, a proprietary, molded footwear technology, delivering extraordinary comfort with each step. Crocs, Inc., a Delaware corporation, is the successor to a Colorado corporation of the same name and was originally organized in 1999 as a limited liability company.
Products
Since we first introduced a single-style clog in six colors in 2002, we have grown to be a world leader of innovative, casual footwear for men, women and children. Recognized globally for our unmistakable iconic clog silhouette, we have taken the successful formula of a simple design aesthetic, paired it with modern comfort, and expanded into a wide variety of casual footwear products including sandals, wedges, flips and slides, that meet the needs of the whole family. In 2019, Crocs reinforced its mission of “everyone comfortable in their own shoes” with the third year of its global Come As You Are™ campaign.
Crocs offers a broad portfolio of all-season products, while remaining true to its core molded footwear heritage. The vast majority of Crocs™ shoes feature Croslite™ material, a proprietary, revolutionary technology that gives each pair of shoes the soft, comfortable, lightweight, non-marking and odor-resistant qualities that Crocs fans know and love. Since sales began in 2002, Crocs has sold more than 700 million pairs of shoes globally.
At the heart of our brand’s DNA are our clogs and sandals. The Classic Clog, our most iconic style for adults and children, embodies our innovation in molding, simplicity of design, and all-day comfort. The unique look and feel of the Classic Clog can be experienced throughout the vast majority of our product line due to the use and design of CrosliteTM. Sandals are a natural extension of our brand, leveraging our signature molding technology to provide casual, comfortable footwear for a variety of wearing occasions.
We are now using CrosliteTM with new technologies in our LiteRideTM collection, as we focus on visible comfort technology. LiteRideTM features comfort focused, proprietary foam insoles which are soft, lightweight and resilient.
We strive to provide our global consumers with comfortable, casual, colorful, and innovative footwear styles, with a focus on molded product. Our collections address many wearing occasions and meet the needs of the entire family. We enjoy licensing partnerships with Disney, Marvel, Nickelodeon, and Warner Bros., among others, which allow us to bring popular global franchises and characters to life on our product in a fun, exciting way.
Environmental, Social, and Governance Initiatives
As one of the world’s largest footwear companies, we can make a positive global impact on the footwear industry and our planet by committing to transparent, socially conscious, and sustainable business practices.
We are in the process of creating a clear and impactful framework of sustainability initiatives throughout our global business, specifically focusing on our supply chain and product lifecycle. This will include, but is not limited to, examining opportunities in waste reduction, energy usage, materials, and packaging.
At Crocs, we also strive to ensure our products are sourced, produced, and delivered to our customers in a manner that upholds international labor and human rights standards. To this end, we have implemented measures to ensure our supply chain complies with these standards, including the conducting of both scheduled and unannounced social compliance audits.
We also monitor chemicals and substances in our supply chain for compliance with legal and regulatory requirements consistent with our Restricted Substances Policy, and we expect our contracted factories and suppliers to take a proactive stance in eliminating any hazardous substances in the manufacturing of Crocs products.
At Crocs, we believe that our vision to make “everyone comfortable in their own shoes” starts with our people. To ensure that we remain an employer of choice for the most talented workforce in the footwear industry, we have implemented initiatives across our business and geographies to develop leadership capabilities, enable meaningful professional experiences, offer a compelling employee value proposition, and create a transparent, collaborative culture that embraces all different kinds. We are also committed to an equitable total rewards philosophy and provide high levels of pay transparency in all regions and are proud of our culture of inclusion, which features diversity at all levels.
Sales and Marketing
We run our business across three geographic regions: the Americas, Asia Pacific, and Europe, Middle East, and Africa (“EMEA”), which are discussed in more detail in “Business Segments and Geographic Information” below. We prioritize five core markets including: (i) the U.S., (ii) Japan, (iii) China, (iv) South Korea, and (v) Germany. These countries represent key geographies where we believe the greatest opportunities for growth exist. We are also concentrating our marketing efforts on these countries, to increase customer awareness of both our brand and our full product range.
Each season we focus on presenting a compelling brand story and experience for our new product introductions as well as our on-going core products. We employ social and digital marketing centered on showcasing our clog and sandal silhouettes. We are growing our clog silhouette with new colors, graphics, licensed images, embellishments, and accessories that allow for personalization. We are expanding our sandal offerings as we pursue a greater share of a large market with no clear global leader. We are continuing to invest in designer, celebrity, and brand collaborations, as well as celebrity brand ambassadors to raise consumer engagement with our brand. See Note 1 — Basis of Presentation and Summary of Significant Accounting Policies in the accompanying notes to the consolidated financial statements included in Part II - Item 8. Financial Statements and Supplementary Data of this Annual Report on Form 10-K for information on total marketing costs for the year.
Distribution Channels
The broad appeal of our footwear has allowed us to market our products in more than 85 countries through three distribution channels: wholesale, retail, and e-commerce. Our wholesale channel includes domestic and international multi-brand retailers, e-tailers, and distributors; our retail channel consists of company-operated stores; and our e-commerce channel includes company-operated e-commerce sites and third-party marketplaces.
Wholesale Channel
During the years ended December 31, 2019, 2018, and 2017, 53.3%, 53.1%, and 52.4% of revenues, respectively, were derived through our wholesale channel. Our wholesale channel includes domestic and international, multi-brand, brick-and-mortar retailers, e-tailers, and distributors, and in certain countries, partner store operators. Brick-and-mortar customers typically include family footwear retailers, national and regional retail chains, sporting goods stores, and independent footwear retailers.
Outside the U.S., we use distributors when we believe such arrangements are economically preferable to direct sales. Distributors purchase products pursuant to a price list and are granted the right to resell those products in a defined territory, usually a country or group of countries. Our typical distribution agreements have terms of one to five years and can be terminated or renegotiated if minimum requirements are not met.
No single wholesale customer accounted for 10% or more of our total revenues for any of the years ended December 31, 2019, 2018, and 2017.
Retail Channel
During the years ended December 31, 2019, 2018, and 2017, 28.2%, 30.1%, and 33.0%, respectively, of our revenues were derived through our retail channel. We operate our retail channel through three platforms: company-operated full-price retail and outlet stores, kiosks, and store-in-store locations. With the worldwide consumer shift toward e-commerce, we are carefully managing our retail fleet, especially full-priced retail stores. As of December 31, 2019, we had 367 company-operated stores. See Part II - Item 7. Management’s Discussion and Analysis of Financial Condition and Results of Operations of this Annual Report on Form 10-K for information on store locations by platform.
Full-Price Retail Stores
Our company-operated full-price retail stores allow us to effectively showcase the full extent of our product range to consumers and provide us with the opportunity to interact with those consumers directly. We believe the optimal location for our retail stores is in high foot-traffic shopping malls or districts.
Outlet Stores
Our company-operated outlet stores allow us to sell discontinued and overstocked merchandise directly to consumers at discounted prices. We also sell full-priced products in certain of our outlet stores as well as built-for-outlet products. Outlet stores are generally located within outlet shopping centers.
Kiosk / Store-in-Store Locations
Our company-operated kiosks and store-in-store locations allow us to market specific product lines, with flexibility to tailor products to consumer preferences in shopping malls and other high foot-traffic areas. With efficient use of retail space, and limited capital investment, we believe kiosks and store-in-store locations can be effective vehicles for marketing our products in certain geographic areas.
Company-Operated Retail Stores
The following table illustrates the net change during 2019 in the number of our company-operated retail stores by reportable operating segment and country:
| | | | | | | | | | | | | | | | | | | | | | | | | | |
| | December 31, 2018 | | Opened | | Closed/Transferred | | December 31, 2019 |
| Americas | | | | | | | | |
| United States | | 155 | | | 1 | | | 3 | | | 153 | |
| Canada | | 9 | | | — | | | — | | | 9 | |
| Puerto Rico | | 4 | | | — | | | 1 | | | 3 | |
| Total Americas | | 168 | | | 1 | | | 4 | | | 165 | |
| Asia Pacific | | | | | | | | |
| Korea | | 86 | | | 3 | | | 4 | | | 85 | |
| China | | 28 | | | 6 | | | 11 | | | 23 | |
| Japan | | 14 | | | — | | | 2 | | | 12 | |
| Singapore | | 14 | | | 3 | | | — | | | 17 | |
| Australia | | 9 | | | — | | | 2 | | | 7 | |
| Hong Kong | | 2 | | | — | | | 1 | | | 1 | |
| Total Asia Pacific | | 153 | | | 12 | | | 20 | | | 145 | |
| EMEA | | | | | | | | |
| Russia | | 31 | | | 1 | | | 2 | | | 30 | |
| Germany | | 14 | | | 1 | | | — | | | 15 | |
| France | | 8 | | | — | | | 2 | | | 6 | |
| Austria | | 6 | | | — | | | 2 | | | 4 | |
| The Netherlands | | 3 | | | — | | | 1 | | | 2 | |
| | | | | | | | |
| | | | | | | | |
| | | | | | | | |
| | | | | | | | |
| Total EMEA | | 62 | | | 2 | | | 7 | | | 57 | |
| Total | | 383 | | | 15 | | | 31 | | | 367 | |
E-commerce Channel
As of December 31, 2019, we offered our products through 13 company-operated e-commerce sites worldwide and also on third-party marketplaces. During the years ended December 31, 2019, 2018, and 2017, 18.5%, 16.8%, and 14.6%, respectively, of our revenues were derived through this channel. Our e-commerce presence facilitates increased access to our consumers and provides us with an opportunity to educate them about our products and brand. We continue to leverage increasingly
sophisticated digital marketing activities to enhance the consumer experience and drive sales, thereby benefiting from the continued migration of consumers to online shopping.
Business Segments and Geographic Information
We have three reportable operating segments based on the geographic nature of our operations: Americas, Asia Pacific, and EMEA. See Part II - Item 7. Management’s Discussion and Analysis of Financial Condition and Results of Operations and Note 16 — Operating Segments and Geographic Information in the accompanying notes to the consolidated financial statements included in Part II - Item 8. Financial Statements and Supplementary Data of this Annual Report on Form 10-K for financial information related to our operating segments.
Raw Materials
CrosliteTM, our proprietary closed-cell resin brand, is the primary material formulation used in the vast majority of our footwear and some of our accessories. CrosliteTM is formulated to create soft, comfortable, lightweight, non-marking, and odor-resistant footwear. We continue to invest in research and development to refine our materials to enhance these properties and develop new properties for specific applications.
CrosliteTM is produced by compounding elastomer resins purchased from major chemical manufacturers, together with certain other production inputs such as color dyes. Multiple suppliers produce the elastomer resins used in CrosliteTM. In the future, we may identify and utilize materials produced by other suppliers as an alternative to, or in addition to, those elastomer resins. All of the other raw materials that we use to produce CrosliteTM products are readily available for purchase from multiple suppliers.
Some of the products we offer are constructed using leather, textile fabrics, or other non-CrosliteTM materials, such as LiteRideTM. These materials are obtained from a number of third-party sources and we believe these materials are also broadly available.
Sourcing
Our strategy is to maintain a flexible, globally-diversified, low-cost third-party manufacturing capability. We source our footwear production from multiple third-party manufacturers, primarily in Vietnam and China. During the years ended December 31, 2019, 2018, and 2017, our largest third-party manufacturer, operating in both Vietnam and China, produced approximately 38%, 45%, and 41%, respectively, and our second largest third-party manufacturer, primarily operating in Vietnam, produced approximately 21%, 21%, and 19%, respectively, of our footwear unit volume. We believe that the manufacturing capabilities required to produce our footwear are broadly available. See the risk factor “We depend solely on third-party manufacturers located outside of the U.S.”, included in Item 1A. Risk Factors for information on risks associated with sourcing.
Distribution and Logistics
We strive to enhance our distribution and logistics network to further streamline our supply chain, increase our speed to market, and lower operating costs. During 2019, we moved our U.S. distribution center from Ontario, California to Dayton, Ohio. As of December 31, 2019, we stored our finished goods inventory in company-operated warehouses and distribution and logistics facilities located in the U.S., the Netherlands, and Japan. We also utilized third-party operated distribution centers located in China, Japan, Hong Kong, Australia, Korea, Singapore, India, Russia, and Brazil. As of December 31, 2019, our company-operated warehouse and distribution facilities provided us with 1.0 million square feet, and our third-party operated distribution facilities provided us with 0.3 million square feet, with additional area available based on inventory levels. We also ship directly to certain of our wholesale customers from our third-party manufacturers.
Intellectual Property and Trademarks
We rely on a combination of trademarks, copyrights, trade secrets, trade dress, and patent protections to establish, protect, and enforce our intellectual property rights in our product designs, brands, materials, and research and development efforts, although no such methods can afford complete protection. We own or license the material trademarks used in connection with the marketing, distribution, and sale of all of our products, both domestically and internationally, in most countries where our products are currently either sold or manufactured. Our major trademarks include the Crocs logo and the Crocs word mark, both of which are registered or pending registration in the U.S., the European Union, Japan, Taiwan, China, and Canada, among other countries. We also have registrations or pending trademark applications for other marks and logos in various countries around the world.
In the U.S., our patents are generally in effect for up to 20 years from the date of filing the patent application. Our trademarks registered within and outside of the U.S. are generally valid as long as they are in use and their registrations are properly maintained and have not been found to have become generic. We believe our trademarks and patents are crucial to the successful marketing and sale of our products. We strategically register, both domestically and internationally, the trademarks and patents covering the product designs and branding that we utilize today. We aggressively police our patents, trademarks, and copyrights and pursue those who infringe upon them, both domestically and internationally, as we deem necessary.
We consider the formulations of the materials used to produce our footwear covered by our trademark CrosliteTM, LiteRideTM, and RevivaTM, among others, valuable trade secrets. The material formulations are manufactured through a process that combines a number of components in various proportions to achieve the properties for which our products are known. We use multiple suppliers to source these components but protect the formulations by using exclusive supply agreements for key components, confidentiality agreements with our third-party processors, and by requiring our employees to execute confidentiality agreements concerning the protection of our confidential information. Other than our third-party processors, we are unaware of any third party using our formulations in the production of footwear. We believe the comfort and utility of our products depend on the properties achieved from the compounding of CrosliteTM and LiteRideTM, which constitutes a key competitive advantage for us, and we intend to continue to vigorously protect this trade secret.
We also actively combat counterfeiting by monitoring of the global marketplace. We use our employees, sales representatives, distributors, and retailers, as well as outside investigators, attorneys and customs agents, to police against infringing products by encouraging them to notify us of any suspect products and to assist law enforcement agencies. Our sales representatives and distributors are also educated on our patents, pending patents, trademarks, and trade dress to assist in preventing potentially infringing products from obtaining retail shelf space. The laws of certain countries do not protect intellectual property rights to the same extent or in the same manner as do the laws of the U.S., and, therefore, we may have difficulty obtaining legal protection for our intellectual property in certain foreign jurisdictions.
Seasonality
Due to the seasonal nature of our footwear, which is more heavily focused on styles suitable for warm weather, revenues generated during our fourth quarter, when the northern hemisphere is experiencing cooler weather, are typically less than revenues generated during our first three quarters. Our quarterly results of operations may also fluctuate significantly as a result of a variety of other factors, including, but not limited to, the timing of new model introductions, general economic conditions, and consumer confidence. Accordingly, results of operations and cash flows for any one quarter are not necessarily indicative of expected results for any other quarter or for any other year.
Backlog
A significant portion of orders from our wholesale customers and distributors remain unfilled as of any given date and, at that point, represent orders scheduled to be shipped at a future date. We refer to these unfilled orders as backlog, which can be canceled by our customers at any time prior to shipment. Backlog only relates to wholesale and distributor orders for the next season and current season fill-in orders and excludes potential sales in our retail and e-commerce channels. Backlog as of a particular date is affected by a number of factors, including seasonality, manufacturing schedules, and the timing of product shipments. Backlog also is affected by the timing of customers’ orders and product availability. Due to these factors and business model differences around the globe, and because backlog is cancelable at any time prior to shipment, we believe backlog is an imprecise indicator of future revenues that may be achieved in a fiscal period and should not be relied upon.
Competition
The global casual, athletic, and fashion footwear markets are highly competitive. Although we do not believe that we compete directly with any single company with respect to the entire spectrum of our products, we believe portions of our wholesale, retail, and e-commerce businesses compete with companies including, but not limited to: NIKE Inc., adidas AG, Under Armour, Inc., Deckers Outdoor Corporation, Skechers USA, Inc., Steven Madden, Ltd., Wolverine World Wide, Inc., and VF Corporation. Our company-operated retail locations and e-commerce sites also compete with footwear retailers such as Genesco, Inc., Macy’s Inc., Dillard’s, Inc., Dick’s Sporting Goods, Inc., The Finish Line Inc., and Foot Locker, Inc.
The principal elements of competition in these markets include brand awareness, product functionality, design, comfort, quality, price, customer service, and marketing and distribution. We believe that our unique footwear designs, our CrosliteTM material, our prices, our product line, and our distribution network position us well in the marketplace. However, a number of companies in the casual footwear industry have greater financial resources, more comprehensive product lines, broader market presence,
longer standing relationships with wholesalers, longer operating histories, greater distribution capabilities, stronger brand recognition, and greater marketing resources than we have.
Employees
As of December 31, 2019, we had 3,803 full-time, part-time, and seasonal employees, of which 2,728 were engaged in retail-related functions.
Available Information
We file with, or furnish to, the SEC reports including our Annual Report on Form 10-K, Quarterly Reports on Form 10-Q, Current Reports on Form 8-K, and amendments to those reports pursuant to Section 13(a) or 15(d) of the Exchange Act. These reports are available free of charge on our corporate website (www.crocs.com) as soon as reasonably practicable after they are electronically filed with or furnished to the SEC. Copies of any materials we file with the SEC can be obtained free of charge at www.sec.gov. The foregoing website addresses are provided as inactive textual references only. The information provided on our website (or any other website referred to in this report) is not part of this report and is not incorporated by reference as part of this Annual Report on Form 10-K.
ITEM 1A. Risk Factors
You should carefully consider the following risk factors and all other information presented within this Annual Report on Form 10-K. The risks set forth below are those that our management believes are applicable to our business and the industry in which we operate. These risks have the potential to have a material adverse effect on our business, results of operations, cash flows, financial condition, liquidity, access to sources of financing, or stock price. The risks included here are not exhaustive and there may be additional risks that are not presently material or known. Because we operate in a very competitive and rapidly changing environment, new risk factors emerge from time to time and it is not possible for us to predict all risk factors, nor can we assess the impact of all such risk factors on our business. Please also refer to the section entitled “Cautionary Note Regarding Forward-Looking Statements” in this Annual Report on Form 10-K.
Risks Specific to Our Company
Our success depends substantially on the value of our brand; failure to strengthen and preserve this value, either through our actions or those of our business partners, could have a negative impact on our financial results.
We believe much of our success has been attributable to the strength of the Crocs global brand. To be successful in the future, particularly outside of the U.S., where the Crocs global brand is less well-known and perceived differently, we believe we must timely and appropriately respond to changing consumer demand and leverage the value of our brand across all sales channels. We may have difficulty managing our brand image across markets and international borders as certain consumers may perceive our brand image to be out of style, outdated, or otherwise undesirable. Maintaining, promoting, and growing our brand will depend on our design and marketing efforts, including product innovation and quality, advertising and consumer campaigns, as well as our ability to adapt to a rapidly changing media environment, including our reliance on social media and digital dissemination of advertising campaigns.
In the past, several footwear companies, including ours, have experienced periods of rapid growth in revenues and earnings followed by periods of declining sales and losses, and our business may be similarly affected in the future. Consumer demand for our products and our brand equity could also diminish significantly if we fail to preserve the quality of our products, are perceived to act in an unethical or socially irresponsible manner, fail to comply with laws and regulations, or fail to deliver a consistently positive consumer experience in each of our markets.
Adverse publicity about regulatory or legal action against us, or by us, could also damage our reputation and brand image, undermine consumer confidence in us and reduce long-term demand for our products, even if the regulatory or legal action is unfounded or not material to our operations. Negative claims or publicity involving us, our products or any of our key employees, endorsers, or business partners could materially damage our reputation and brand image, regardless of whether such claims are accurate. Social media, which accelerates and potentially amplifies the scope of negative publicity, can accelerate, and increase the impact of, negative claims. Further, business incidents that erode consumer trust, such as perceived product safety issues, whether isolated or recurring, in particular incidents that receive considerable publicity or result in litigation, can significantly reduce brand value and have a negative impact on our business and financial results. Additionally, counterfeit reproductions of our products or other infringement of our intellectual property rights, including unauthorized uses of our trademarks by third parties, could harm our brand and adversely impact our business.
We may be unable to successfully execute our long-term growth strategy, maintain or grow our current revenue and profit levels, or accurately forecast geographic demand and supply for our products.
Our ability to maintain our revenue and profit levels or to grow in the future depends on, among other things, the continued success of our efforts to maintain our brand image, our ability to bring compelling and profit enhancing footwear offerings to market, our ability to effectively manage or reduce expenses and our ability to expand within our current distribution channels and increase sales of our products into new locations internationally. We are focusing on our core molded footwear heritage by narrowing our product line with an emphasis on higher margin products, as well as developing innovative new casual lifestyle footwear platforms.
Successfully executing our long-term growth and profitability strategy will depend on many factors, including our ability to:
•Strengthen our brand globally;
•Focus on relevant geographies and markets, product innovation, and profitable growth, while maintaining demand for our current offerings;
•Effectively manage our company-operated retail stores to meet operational and financial targets at the retail store level;
•Accurately forecast the global demand for our products, consolidate our distribution and supply chain network to leverage resources, simplify our fulfillment process, and deliver product around the globe efficiently;
•Use and protect the Crocs brand and our other intellectual property in new and existing markets and territories;
•Achieve and maintain a strong competitive position in new and existing markets;
•Attract and retain qualified wholesalers and distributors;
•Maintain and enhance our social digital marketing capabilities and digital commerce capabilities; and
•Execute multi-channel advertising, marketing, and social media campaigns to effectively communicate our message directly to our consumers and employees.
While these strategies, along with other steps to be taken, are intended to improve and grow our business, there can be no assurance this will be the case or that additional steps or accrual of additional material expenses or accounting charges will not be required. If additional steps are required, there can be no assurance that they will be properly implemented or will be successful.
If our online e-commerce sites, or those of our customers, do not function effectively, our business and financial results could be materially adversely affected.
An increasing amount of our products are sold on our e-commerce sites and third-party e-commerce sites. Any failure on our part or third-parties to provide effective, reliable, user-friendly e-commerce platforms that offer a wide assortment of our products could place us at a competitive disadvantage, result in the loss of sales, and could have a material adverse impact on our business and financial results. Our e-commerce business may be particularly vulnerable to cyber threats including unauthorized access and denial of service attacks. Sales in our e-commerce channel may also divert sales from our retail and wholesale channels.
Our business relies significantly on the use of information technology. A significant disruption to our operational technology or those of our business partners, a privacy law violation, or a data security breach could harm our reputation and/or our ability to effectively operate our business, and our financial results.
We rely heavily on the use of information technology systems and networks across all business functions, as do our business partners. The future success and growth of our business depend on streamlined processes made available through information systems, global communications, internet activity, and other network processes. We rely exclusively on third-party information services providers worldwide for our information technology functions including network, help desk, hardware and software configuration. Additionally, we rely on internal networks and information systems and other technology, including the internet and third-party hosted services, to support a variety of business processes and activities, including procurement and supply chain, manufacturing, distribution, invoicing, and collection of payments. We use information systems for certain human resource activities and to process our employee benefits, as well as to process financial information for internal and external reporting purposes and to comply with various reporting, legal, and tax requirements. We also have outsourced a significant portion of work associated with our finance and accounting, human resources, customer service, and other information technology functions to third-party service providers. Despite our current security and cybersecurity measures, our systems and
those of our third-party service providers may be vulnerable to information security breaches, acts of vandalism, computer viruses, credit card fraud, phishing, and interruption or loss of valuable business data, and we have been subject to, and will continue to be subject to, various third party attacks and phishing scams. Any disruption to these systems or networks could result in product fulfillment delays, key personnel being unable to perform duties or communicate throughout the organization, loss of sales, significant costs for data restoration, the inability to interpret data timely to enhance operations, and other adverse impacts on our business and reputation. Denial of service attacks could also materially adversely affect our business.
We routinely possess sensitive customer and employee information. Hackers and data thieves are increasingly sophisticated and operate large-scale and complex automated attacks on a daily basis. Any breach of our network may result in the loss of valuable business data, misappropriation of our consumers’ or employees’ personal information, including credit card information, or a disruption of our business. Despite our existing cybersecurity procedures and controls, if our network is breached, it could give rise to unwanted media attention, materially damage our customer relationships, or harm our business, our reputation, and our financial results, which could result in fines or lawsuits. The costs we incur to protect against such information security breaches may materially increase, including increased investment in technology, the costs of compliance with consumer protection laws, and costs resulting from consumer fraud. Our business partners in our supply chain and customer base also rely significantly on information technology. Despite their existing cybersecurity procedures and controls, if their information systems become compromised, it could, among other things, cause delays in our product fulfillment or reduce our sales, which could harm our business.
In addition, the European Union’s General Data Protection Regulation, the California Consumer Privacy Act, and other similar privacy laws impose additional obligations on companies regarding the handling of personal data and provide certain individual privacy rights to persons whose data is stored. These regulations may harm or alter the operations of our e-commerce business, add additional compliance costs and obligations, and subject us to significant fines and penalties for non-compliance. Compliance with these and other foreign legal regimes and the associated costs may have a material adverse impact on our business and results of operations.
We face significant competition.
The footwear industry is highly competitive. Our competitors include most major athletic and non-athletic footwear companies and retailers with their own private label footwear products. A number of our competitors have significantly greater financial resources, more comprehensive product lines, a broader market presence, longer standing relationships with wholesalers, a longer operating history, greater distribution capabilities, stronger brand recognition, and spend substantially more on product marketing than we do. Our competitors’ greater financial resources and capabilities in these areas may enable them to better withstand periodic downturns in the footwear industry and general economic conditions, compete more effectively on the basis of price and production, launch more extensive or diverse product lines, and more quickly develop new and popular products. Continued demand in the market for casual footwear and readily available offshore manufacturing capacity has also encouraged the entry of new competitors into the marketplace and has increased competition from established companies. Some of our competitors are offering products that are substantially similar, in design and materials, to our products. If we are unable to compete successfully in the future, our sales and profits may decline, we may lose market share, our business and financial results may deteriorate, and the market price of our common stock would likely fall.
Continuing to rationalize our existing product assortment and introducing new products may be difficult and expensive. If we are unable to do so successfully, our brand may be adversely affected and we may not be able to maintain or grow our current revenue and profit levels.
To successfully continue to refine our footwear product line, we must anticipate, understand, and react to the rapidly changing tastes of consumers and provide appealing merchandise in a timely manner. New footwear models that we introduce may not be successful with consumers or our brand may fall out of favor with consumers. If we are unable to anticipate, identify, or react appropriately to changes in consumer preferences, our revenues may decrease, our brand image may suffer, our operating performance may decline, and we may not be able to execute our growth plans.
In producing new footwear models, we may encounter difficulties that we did not anticipate during the product development stage. If we are not able to efficiently manufacture new products in quantities sufficient to support wholesale, retail, and e-commerce distribution, we may not be able to recover our investment in the development of new styles and product lines and we would continue to be subject to the risks inherent to having a limited product line. Even if we develop and manufacture new footwear products that consumers find appealing, the ultimate success of a new style may depend on our pricing. We may introduce products that are not popular, set the prices of new styles too high for the market to bear, or we may not provide the appropriate level of marketing in order to educate the market and potential consumers about our new products. Achieving market acceptance will require us to exert substantial product development and marketing efforts, which could result in a
material increase in our selling, general and administrative expenses. There can be no assurance that we will have the resources necessary to undertake such efforts effectively or that such efforts will be successful. Failure to gain market acceptance for new products could impede our ability to maintain or grow current revenue levels, reduce profits, adversely affect the image of our brand, erode our competitive position, and result in long-term harm to our business and financial results.
If we do not accurately forecast consumer demand, we may have excess inventory to liquidate or have greater difficulty filling our customers’ orders, either of which could adversely affect our business.
The footwear industry is subject to cyclical variations, consolidation, contraction and closings, as well as fashion trends, rapid changes in consumer preferences, the effects of weather, general economic conditions, and other factors affecting consumer demand. In addition, purchase orders from our wholesale customers are generally subject to rights of cancellation and rescheduling by the wholesaler. These factors make it difficult to forecast consumer demand. If we overestimate demand for our products, we may be forced to liquidate excess inventories at discounted prices resulting in losses or lower gross margins. Conversely, if we underestimate consumer demand, we could have inventory shortages, which can result in lower sales, delays in shipments to customers, expedited shipping costs, and adversely affect our relationships with our customers and diminish brand loyalty. Excess inventory, or any failure on our part to satisfy increased demand for our products, could adversely affect our business and financial results.
Our financial success depends in part on the strength of our relationships with, and the success of, our wholesale and distributor customers.
Our financial success is related to the willingness of our current and prospective wholesale and distributor customers to carry our products. We do not have long-term contracts and sales to our wholesalers and distributors are generally on an order-by-order basis and subject to cancellation and rescheduling. If we cannot fill orders in a timely manner, the sales of our products and our relationships may suffer. Alternatively, if our wholesalers or distributors experience diminished liquidity or other financial issues, we may experience a reduction in product orders, an increase in order cancellations and/or the need to extend payment terms, which could lead to larger outstanding balances, delays in collections of accounts receivable, increased expenses associated with collection efforts, increases in bad debt expenses, and reduced cash flows if our collection efforts are unsuccessful. We have recorded material allowances for doubtful accounts in the past and could do so again in the future. Future problems with customers may have a material adverse effect on our product sales, financial condition, results of operations, and our ability to grow our product line.
Changes in foreign exchange rates, most significantly but not limited to the Euro, Russian Ruble, Japanese Yen, Chinese Yuan, South Korean Won, or other global currencies could have a material adverse effect on our business and financial results.
As a global company, we have significant revenues and costs denominated in currencies other than the U.S. Dollar (“USD”). We are exposed to the risk of losses resulting from changes in exchange rates on monetary assets and liabilities within our international subsidiaries that are denominated in currencies other than the subsidiaries’ functional currencies. Likewise, our U.S. companies are also exposed to the risk of losses resulting from changes in exchange rates on monetary assets and liabilities that are denominated in a currency other than the USD. We have experienced, and will continue to experience, changes in exchange rates, impacting both our statements of operations and the value of our assets and liabilities denominated in foreign currencies.
Further, our ability to sell our products in foreign markets and the USD value of the sales made in foreign currencies can be significantly influenced by changes in exchange rates. A decrease in the value of foreign currencies relative to the USD could result in lower revenues, product price pressures, and increased losses from currency exchange rates. Foreign exchange rate volatility could also disrupt the business of the third-party manufacturers that produce our products by making their purchases of raw materials more expensive and more difficult to finance. We pay the majority of our third-party manufacturers, located primarily in Vietnam and China, in USD. In 2019, we experienced a decrease of approximately $11.0 million in our Asia Pacific segment revenues as a result of decreases in the value of Asian currencies relative to the USD, and a decrease of approximately $13.5 million in our EMEA revenues, primarily as a result of decreases in the Euro relative to the USD. Strengthening of the USD against Asian and European currencies, and various other global currencies, adversely impacts our USD reported results due to the impact on foreign currency translation. While we enter into foreign currency exchange forward contracts to reduce our exposure to changes in exchange rates on monetary assets and liabilities, the volatility of foreign currency exchange rates is dependent on many factors that cannot be forecasted with reliable accuracy and, as a result, our forward contracts may not prove effective in reducing our exposures.
We conduct significant business activity outside the U.S., which exposes us to risks of international commerce.
A significant portion of our revenues is generated from foreign sales. Our ability to maintain the current level of operations in our existing international markets is subject to risks associated with international sales operations. We operate retail stores and sell our products to retailers outside of the U.S. and utilize foreign-based third-party manufacturers. Foreign manufacturing and sales activities are subject to numerous risks including: tariffs, anti-dumping fines, import and export controls, and other non-tariff barriers such as quotas and local content rules; delays associated with the manufacture, transportation and delivery of products; increased transportation costs due to distance, energy prices, or other factors; delays in the transportation and delivery of goods due to increased security concerns; restrictions on the transfer of funds; restrictions and potential penalties due to privacy laws on the handling and transfer of consumer and other personal information; changes in governmental policies and regulations; political unrest, changes in law, terrorism, or war, any of which can interrupt commerce; potential violations of U.S. and foreign anti-corruption and anti-bribery laws by our employees, business partners or agents, despite our policies and procedures relating to compliance with these laws; expropriation and nationalization; difficulties in managing foreign operations effectively and efficiently from the U.S.; difficulties in understanding and complying with local laws, regulations, and customs in foreign jurisdictions; longer accounts receivable payment terms and difficulties in collecting foreign accounts receivables; difficulties in enforcing contractual and intellectual property rights; greater risk that our business partners do not comply with our policies and procedures relating to labor, health and safety; and increased accounting and internal control costs. In addition, we are subject to customs laws and regulations with respect to our export and import activity, which are complex and vary within legal jurisdictions in which we operate. We cannot ensure there will be not be a control failure around customs enforcement despite the precautions we take. We are currently subject to audits by customs authorities. Any failure to comply with customs laws and regulations could be discovered during a U.S. or foreign government customs audit, or customs authorities may disagree with our tariff treatments, and such actions could result in substantial fines and penalties, which could have an adverse effect on our business and financial results. In addition, changes to U.S. trade laws may adversely impact our operations. These changes and any changes to the trade laws of other countries may add additional compliance costs and obligations and subject us to significant fines and penalties for non-compliance. Compliance with these and other foreign legal regimes may have a material adverse impact on our business and results of operations. For more information, please see “We depend solely on third-party manufacturers located outside the U.S.” and “Our business relies significantly on the use of information technology. A significant disruption to our operational technology or data security breach could harm our reputation and/or our ability to effectively operate our business.”
In addition, as a global company, we are subject to foreign and U.S. laws and regulations designed to combat governmental corruption, including the U.S. Foreign Corrupt Practices Act and the U.K. Bribery Act. Violations of these laws and regulations could result in fines and penalties; criminal sanctions against us, our officers, or our employees; prohibitions on the conduct of our business and on our ability to offer our products and services in one or more countries; and a materially negative effect on our brand and our operating results. Although we have implemented policies and procedures designed to ensure compliance with these foreign and U.S. laws and regulations, including the U.S. Foreign Corrupt Practices Act and the U.K. Bribery Act, there can be no assurance that our employees, business partners, or agents will not violate our policies.
Changes in global economic conditions may adversely affect consumer spending and the financial health of our customers and others with whom we do business, which may adversely affect our financial condition, results of operations, and cash resources.
Uncertainty about current and future global economic conditions may cause consumers and retailers to defer purchases or cancel purchase orders for our products in response to tighter credit, decreased cash availability, and weakened consumer confidence. Our financial success is sensitive to changes in general economic conditions, both globally and in specific markets, that may adversely affect the demand for our products including recessionary economic cycles, higher interest rates, higher fuel and other energy costs, inflation, increases in commodity prices, higher levels of unemployment, higher consumer debt levels, higher tax rates and other changes in tax laws, or other economic factors. If global economic and financial market conditions deteriorate, or remain weak, for an extended period of time, the following factors, among others, could have a material adverse effect on our business and financial results:
•Changes in foreign currency exchange rates relative to the USD could have a material impact on our reported financial results;
•Slower consumer spending may result in our inability to maintain or increase our sales to new and existing customers, cause reduced product orders or product order delays or cancellations from wholesale accounts that are directly impacted by fluctuations in the broader economy, difficulties managing inventories, higher discounts, and lower product margins;
•If consumer demand for our products declines, we may not be able to profitably operate existing retail stores, due to higher fixed costs of the retail business;
•A decrease in credit available to our wholesale or distributor customers, product suppliers and other service providers, or financial institutions that are counterparties to our credit facility or derivative instruments may result in credit pressures, other financial difficulties, or insolvency for these parties, with a potential adverse impact on our business, our financial results, or our ability to obtain future financing;
•If our wholesale customers experience diminished liquidity, we may experience a reduction in product orders, an increase in customer order cancellations, and/or the need to extend customer payment terms, which could lead to larger balances and delayed collection of our accounts receivable, reduced cash flows, greater expenses for collection efforts, and increased risk of nonpayment of our accounts receivable; and
•If our manufacturers or other parties in our supply chain experience diminished liquidity, and as a result are unable to fulfill their obligations to us, we may be unable to provide our customers with our products in a timely manner, resulting in lost sales opportunities or a deterioration in our customer relationships.
Our supply chain and retail sales in China may be materially adversely impacted due to the coronavirus disease 2019 (“COVID-19”) outbreak.
In December 2019, COVID-19 began to impact the population of Wuhan, China. We rely upon the facilities of our third-party manufacturers in China to support our business in China, as well as to export our products throughout the world. We opened six company-operated retail stores in China in 2019. The outbreak has resulted in significant governmental measures being implemented to control the spread of the virus, including, among others, restrictions on manufacturing and the movement of employees in many regions of the country. As a result of COVID-19 and the measures designed to contain the spread of the virus, our third-party manufacturers may not have the materials, capacity, or capability to manufacture our products according to our schedule and specifications. If our third-party manufacturers’ operations are curtailed, we may need to seek alternate manufacturing sources, which may be more expensive. Alternate sources may not be available or may result in delays in shipments to us from our supply chain and subsequently to our customers, each of which would affect our results of operations. While the disruptions and restrictions on the ability to travel, quarantines, and temporary closures of the facilities of our third-party manufacturers and suppliers, as well as general limitations on movement in the region are expected to be temporary, the duration of the production and supply chain disruption, and related financial impact, cannot be estimated at this time. Should the production and distribution closures continue for an extended period of time, the impact on our supply chain in China and globally could have a material adverse effect on our results of operations and cash flows. See “We depend solely on third-party manufacturers located outside the U.S.” The COVID-19 outbreak could also delay our release or delivery of new or product offerings or require us to make unexpected changes to such offerings, which may materially adversely affect our business and operating results. Finally, as a result of the governmental restrictions to control the spread of the COVID-19 outbreak, we have experienced, along with wholesale partner stores, store closures and a decrease in consumer traffic in China, which will have a material adverse effect on our results of operations in our Asia Pacific segment. Our operating results could also continue to be adversely affected to the extent that the COVID-19 outbreak harms the Chinese economy in general. In addition, the COVID-19 outbreak could evolve into a worldwide health crisis that could adversely affect the economies and financial markets of many countries, resulting in an economic downturn that could affect demand for our products and materially adversely affect our business, operating results, and financial condition.
Operating company-operated retail stores incurs substantial fixed costs. If we are unable to generate sales, operate our retail stores profitably or otherwise fail to meet expectations, we may be unable to reduce such fixed costs and avoid losses or negative cash flows.
Opening and operating company-operated retail stores requires substantial financial commitments, including fixed costs, and are subject to numerous risks including consumer preferences, location, and other factors that we do not control. Declines in revenue and operating performance of our company-operated retail stores could cause us to record impairment charges and have a material adverse effect on our business and financial results. During 2019, we opened 15 and closed 31 retail stores, and we operated 367 retail stores at December 31, 2019.
Many of our company-operated retail stores are located in shopping malls and outlet malls and our success depends in part on obtaining prominent locations and the overall ability of the malls to successfully generate and maintain customer traffic. We cannot control the success of individual malls or store closures by other retailers, which may lead to mall vacancies and reduced customer foot-traffic. In addition, consumer spending and shopping preferences have shifted, and may continue to further shift, away from brick and mortar retail to e-commerce channels, which may contribute to declining foot-traffic in company-operated retail locations. Continued reduced customer foot-traffic could reduce sales at our company-operated retail stores, including kiosks and store-in-store locations, or hinder our ability to open retail stores in new markets, including kiosks and store-in-store
locations, which could in turn negatively affect our business and financial results. In addition, some of our company-operated retail stores occupy street locations that are heavily dependent on customer traffic generated by tourism. Any substantial decrease in tourism resulting from an economic slowdown, political, terrorism, social, or military events, natural disasters, public health issues, or otherwise, is likely to adversely affect sales in our existing stores.
We may be required to record impairments of long-lived assets or incur other charges relating to our company-operated retail operations.
Impairment testing of our retail stores’ long-lived assets requires us to make estimates about our future performance and cash flows that are inherently uncertain. These estimates can be affected by numerous factors, including changes in economic conditions, our results of operations, and competitive conditions in the industry. Due to the fixed-cost structure associated with our retail operations, negative cash flows or the closure of a store could result in impairment of leasehold improvements, impairment of right-of-use assets, impairment of other long-lived assets, write-downs of inventory, severance costs, significant lease termination costs or the loss of working capital, which could adversely impact our business and financial results. For example, during 2016, we recorded $2.7 million of impairments related to our retail stores. These impairment charges may increase as we continue to evaluate our retail operations. The recording of additional impairments in the future may have a material adverse impact on our business and financial results.
We depend solely on third-party manufacturers located outside of the U.S.
All of our footwear products are manufactured by third-party manufacturers, the majority of which are located in Vietnam and China. We depend on the ability of these manufacturers to finance the production of goods ordered, maintain adequate manufacturing capacity, and meet our quality standards. We compete with other companies for the production capacity of our third-party manufacturers, and we do not exert direct control over the manufacturers’ operations. As such, from time to time we have experienced delays or inabilities to fulfill customer demand and orders. During the years ended December 31, 2019, 2018, and 2017, our largest third-party manufacturer, operating in both Vietnam and China, produced approximately 38%, 45%, and 41%, respectively, and our second largest third-party manufacturer, primarily operating in Vietnam, produced approximately 21%, 21%, and 19%, respectively, of our footwear unit volume. We cannot guarantee that any third-party manufacturer will have sufficient production capacity, meet our production deadlines, or meet our quality standards.
Foreign manufacturing is subject to additional risks, including transportation delays and interruptions, work stoppages, political instability, expropriation, nationalization, foreign currency fluctuations, changing economic conditions, changes in governmental policies and the imposition of tariffs, import and export controls, and other barriers. Because we ceased internal manufacturing in 2018, we can no longer offset any interruption or decrease in supply of our products by increasing production in internal manufacturing facilities, and we may not be able to substitute suitable alternative third-party manufacturers in a timely manner or at acceptable prices. Any disruption in the supply of products from our third-party manufacturers may harm our business and could result in a loss of sales and an increase in production costs, which would adversely affect our results of operations. In addition, manufacturing delays or unexpected demand for our products may require us to use faster, more expensive transportation methods, such as aircraft, which could adversely affect our profit margins. The cost of fuel is a significant component in transportation costs. Increases in the price of petroleum products can increase our transportation costs and adversely affect our product margins.
In addition, because our footwear products are manufactured outside the U.S., the possibility of adverse changes in trade or political relations between the U.S. and other countries, political instability, increases in labor costs, changes in international trade agreements and tariffs, adverse weather conditions, or public health issues could significantly interfere with the production and shipment of our products, which would have a material adverse effect on our operations and financial results. For example, the Trump Administration has instituted trade policies that include the re-negotiation or termination of trade agreements, the imposition of higher tariffs on imports into the U.S., economic sanctions on individuals, corporations, or countries, and other government regulations affecting trade between the U.S. and other countries where we conduct our business. It may be time-consuming and expensive for us to alter our business operations in order to adapt to or comply with any such changes.
Furthermore, as a result of recent policy changes and U.S. government proposals, there may be greater restrictions and economic disincentives on international trade. The tariffs and other changes in U.S. trade policy could trigger retaliatory actions by affected countries, and certain foreign governments have instituted or are considering imposing trade sanctions on certain U.S. goods. For example, in September 2019, the U.S. government placed additional tariffs on certain goods, including footwear, imported from China. Certain products that we sell in the U.S. are manufactured in China. Any further escalation of trade tensions could have a significant, adverse effect on world trade and the world economy. While we are unable to predict whether or how the recently enacted tariffs will impact our business, the imposition of tariffs on items imported by us from
China could require us to increase prices to our customers or, if unable to do so, result in lowering our gross margin on products sold. Tariffs on footwear imported from China could have a material adverse effect on our business and results of operations.
We, similar to many other companies with overseas operations, import and sell products in other countries besides China that could be impacted by changes to the trade policies of the U.S. and foreign countries (including governmental action related to tariffs, international trade agreements, or economic sanctions). Such changes have the potential to adversely impact our industry and the global demand for our products, and as a result, could have a material adverse effect on our business, financial condition, and results of operations.
Our third-party manufacturing operations must comply with labor, trade and other laws. Failure to do so may adversely affect us.
We require our third-party manufacturers to meet our quality control standards and footwear industry standards for working conditions and other matters, including compliance with applicable labor, environmental, and other laws; however, we do not control our third-party manufacturers or their respective labor practices. A failure by any of our third-party manufacturers to adhere to quality standards or labor, environmental, and other laws could cause us to incur additional costs for our products, generate negative publicity, damage our reputation and the value of our brand, and discourage customers from buying our products. We also require our third-party manufacturers to meet certain product safety standards. A failure by any of our third-party manufacturers to adhere to such product safety standards could lead to a product recall, which could result in critical media coverage; harm our business, brand, and reputation; and cause us to incur additional costs.
In addition, if we or our third-party manufacturers violate U.S. or foreign trade laws or regulations, we may be subject to extra duties, significant monetary penalties, the seizure and the forfeiture of the products we are attempting to import, or the loss of our import privileges. Possible violations of U.S. or foreign laws or regulations could include inadequate record keeping of our imported products, misstatements or errors as to the origin, quota category, classification, marketing or valuation of our imported products, and fraudulent visas or labor violations. The effects of these factors could render our conduct of business in a particular country undesirable or impractical and have a negative impact on our operating results. We cannot predict whether additional U.S. or foreign customs quotas, duties, taxes other charges, or restrictions will be imposed upon the importation of foreign produced products in the future or what effect such actions could have on our business or results. For more information, please see “We depend solely on third-party manufacturers located outside the U.S.”
We depend on a limited number of suppliers for key production materials, and any disruption in the supply of such materials could interrupt product manufacturing and increase product costs.
We depend on a limited number of sources for the primary materials used to make our footwear. We source the elastomer resins that constitute the primary raw materials used in compounding our CrosliteTM and LiteRideTM products, which we use to produce our various footwear products, from multiple suppliers. If the suppliers we rely on for elastomer resins were to cease production of these materials, we may not be able to obtain suitable substitute materials in time to avoid interruption of our production schedules. We are also subject to market conditions related to supply and demand for our raw materials. We may have to pay substantially higher prices in the future for the elastomer resins or any substitute materials we use, which would increase our production costs and could have an adverse impact on our product margins. If we are unable to obtain suitable elastomer resins, or if we are unable to procure sufficient quantities of the CrosliteTM and LiteRideTM materials, we may not be able to meet our production requirements in a timely manner or may need to modify our product characteristics, which could result in less favorable market acceptance, lost potential sales, delays in shipments to customers, strained relationships with customers, and diminished brand loyalty.
Failure to adequately protect our trademarks and other intellectual property rights and counterfeiting of our brand could divert sales, damage our brand image and adversely affect our business.
We utilize trademarks, trade names, copyrights, trade secrets, issued and pending patents and trade dress, and designs on nearly all of our products. We believe that having distinctive marks that are readily identifiable trademarks and intellectual property is important to our brand, our success, and our competitive position. The laws of some countries, for example, China, do not protect intellectual property rights to the same extent as do U.S. laws. We frequently discover products that are counterfeit reproductions of our products or that otherwise infringe on our intellectual property rights. If we are unsuccessful in challenging another party’s products on the basis of trademark or design or utility patent infringement, particularly in some foreign countries, or if we are required to change our name or use a different logo, or it is otherwise found that we infringe on others intellectual property rights, continued sales of such competing products by third parties could harm our brand or we may be forced to cease selling certain products, which could adversely impact our business, financial condition, revenues, and results of operations by resulting in the shift of consumer preference away from our products. If our brand is associated with inferior
counterfeit reproductions, the integrity and reputation of our brand could be adversely affected. Furthermore, our efforts to enforce our intellectual property rights are typically met with defenses and counterclaims attacking the validity and enforceability of our intellectual property rights. We may face significant expenses and liability in connection with the protection of our intellectual property, and if we are unable to successfully protect our rights or resolve intellectual property conflicts with others, our business or financial condition could be adversely affected.
We also rely on trade secrets, confidential information, and other unpatented proprietary rights and information related to, among other things, the CrosliteTM material and product development, particularly where we do not believe patent protection is appropriate or obtainable. Using third-party manufacturers and compounding facilities may increase the risk of misappropriation of our trade secrets, confidential information, and other unpatented proprietary information. The agreements we use in an effort to protect our intellectual property, confidential information, and other unpatented proprietary information may be ineffective or insufficient to prevent unauthorized use or disclosure of such trade secrets and information. A party to one of these agreements may breach the agreement and we may not have adequate remedies for such breach. As a result, our trade secrets, confidential information, and other unpatented proprietary rights and information may become known to others, including our competitors. Furthermore, our competitors or others may independently develop or discover such trade secrets and information, which would render them less valuable to us.
Our quarterly revenues and operating results are subject to fluctuation as a result of a variety of factors, including seasonal variations, which could increase the volatility of the price of our common stock.
Sales of our products are subject to seasonal variations and are sensitive to weather conditions. A significant portion of our revenues are attributable to footwear styles that are more suitable for fair weather and are derived from sales in the northern hemisphere. We typically experience our highest sales activity during the first three quarters of the calendar year, compared to the fourth quarter, when there is cooler weather in the northern hemisphere. The effects of favorable or unfavorable weather on sales can be significant enough to affect our quarterly results, which could adversely affect our common stock price. Quarterly results may also fluctuate as a result of other factors, including new style introductions, general economic conditions, or changes in consumer preferences. Results for any one quarter or year are not necessarily indicative of results to be expected for any other quarter or for any year. This could lead to results outside of analyst and investor expectations, which could increase volatility of our stock price.
Our financial results may be adversely affected if substantial investments in businesses and operations fail to produce expected returns.
From time to time, we may invest in business infrastructure, expansion of existing businesses or operations, and acquisitions of new businesses, which require substantial cash investment and management attention. We believe cost effective investments are essential to business growth and profitability; however, significant investments are subject to risks and uncertainties. The failure of any significant investment to provide the returns or profitability we expect, or implementation issues, or the failure to integrate newly acquired businesses could have a material adverse effect on our financial results and divert management attention from more profitable business operations.
Specifically, over the last several years, we have implemented numerous information systems designed to support various areas of our business, including a fully-integrated global accounting, operations, and finance enterprise resource planning system, and warehouse management, order management, and internet point-of-sale systems, as well as various interfaces between these systems and supporting back office systems. We have also moved to a new distribution center in Dayton, Ohio to serve our North American businesses. As our business grows, we may also need to make further investments in business systems and distribution capabilities. Issues in implementing or integrating new business operations and new systems with our current operations, failure of these systems to operate effectively, problems with transitioning to upgraded or replacement systems, issues with transitioning to or operating our new Dayton distribution center, cost overruns, or a breach in security of these systems could cause delays in product fulfillment and reduced efficiency of our operations, require significant additional capital investments to remediate, and may have an adverse effect on our business and financial results.
Failure to continue to obtain or maintain high-quality endorsers of our products could harm our business.
We establish relationships with celebrity endorsers to develop, evaluate, and promote our products, as well as strengthen our brand. In a competitive environment, the costs associated with establishment and retention of these relationships may increase. If we are unable to maintain current associations and/or to establish new associations in the future, this could adversely affect our brand visibility and strength and result in a negative impact to financial results. In addition, actions taken by celebrity endorsers associated with our products that harm the public image and reputations of those endorsers could also seriously harm our brand image with consumers and, as a result, could have an adverse effect on our sales and financial condition.
Our senior revolving credit facility agreement (as amended to date, the “Credit Agreement”) contains financial covenants that require us to maintain certain financial measures and ratios and includes restrictive covenants that limit our ability to take certain actions. A breach of any of those restrictive covenants may cause us to be in default under the Credit Agreement, and our lenders could foreclose on our assets.
Our Credit Agreement requires us to maintain certain financial covenants. A decline in our operating performance could negatively impact our ability to meet these financial covenants. If we breach any of these restrictive covenants, the lenders could either refuse to lend funds to us or accelerate the repayment of any outstanding borrowings under the Credit Agreement. We may not have sufficient funds to repay such indebtedness upon a default or be unable to receive a waiver of the default from the lenders. If we are unable to repay the indebtedness, the lenders could initiate a bankruptcy proceeding or collection proceedings with respect to our assets, all of which secure our indebtedness under the Credit Agreement.
The Credit Agreement also contains certain restrictive covenants that limit, and in some circumstances prohibit, our ability to, among other things: incur additional debt; sell, lease or transfer our assets; pay dividends on our common stock; make capital expenditures and investments; guarantee debt or obligations; create liens; repurchase our common stock; enter into transactions with our affiliates; and enter into certain merger, consolidation, or other reorganizations transactions. These restrictions could limit our ability to obtain future financing, make acquisitions or needed capital expenditures, withstand the current or future downturns in our business, or the economy in general, conduct operations or otherwise take advantage of business opportunities that may arise, any of which could place us at a competitive disadvantage relative to our competitors.
Changes in the method for determining LIBOR and/or the potential replacement of LIBOR could adversely affect our results of operations.
In July 2017, the United Kingdom’s Financial Conduct Authority, which regulates LIBOR, announced that it intends to phase out LIBOR by the end of 2021. It is unclear if at that time LIBOR will cease to exist or if new methods of calculating LIBOR will be established such that it continues to exist after 2021. Our Credit Agreement states that, should LIBOR cease to exist or should another rate become widely recognized as the benchmark rate for USD loans, a rate substantially equivalent to the LIBOR rate in effect prior to its replacement, will be used.
At this time, the Alternative Reference Rates Committee, a steering committee comprised of large U.S. financial institutions convened by the U.S. Federal Reserve, has recommended the Secured Overnight Financing Rate (“SOFR”) as a more robust reference rate alternative to U.S. Dollar LIBOR. SOFR is calculated based on short-term repurchase agreements, backed by Treasury securities. SOFR is observed and backward looking, which stands in contrast with LIBOR under the current methodology, which is an estimated forward-looking rate and relies, to some degree, on the expert judgment of submitting panel members. Given that SOFR is a secured rate backed by government securities, it will be a rate that does not take into account bank credit risk, as is the case with LIBOR. SOFR is therefore likely to be lower than LIBOR and is less likely to correlate with the funding costs of financial institutions. Whether or not SOFR attains market traction as a LIBOR replacement tool remains in question.
In September 2019, the Financial Accounting Standards Board proposed guidance that would help facilitate the market transition from existing reference rates to alternative rates. However, at this time, it is not possible to predict the effect of any such changes, any establishment of alternative reference rates, or any other reforms to LIBOR that may be enacted in the United Kingdom or elsewhere. Uncertainty as to the nature of such potential changes, alternative reference rates, including SOFR, or other reforms may adversely affect the trading market for LIBOR-based securities, including ours. Furthermore, if LIBOR ceases to exist or a replacement rate is used to determine the interest rate on borrowings under our Credit Agreement, our borrowing cost may increase materially. There is currently no definitive information regarding the future utilization of LIBOR or of any particular replacement rate.
As the future of LIBOR at this time is uncertain, the potential effect of any future changes cannot yet be determined, but may have an adverse impact on our interest expense and, thus, our results of operations.
The risks of maintaining significant cash abroad could adversely affect our cash flows in the U.S., our business, and financial results
We have substantial cash requirements in the U.S., but the majority of our cash is generated and held abroad. We generally consider unremitted earnings of subsidiaries operating outside the U.S. to be indefinitely reinvested and it is not our current intent to change this position. Cash held outside of the U.S. is primarily used for the ongoing operations of the business in the locations in which the cash is held. Most of the cash held outside of the U.S. could be repatriated to the U.S., and under the U.S.
Tax Cuts and Jobs Act (the “Tax Act”), could be repatriated without incurring additional U.S. federal income taxes, although some states will continue to subject cash repatriations to income tax. In some countries, repatriation of certain foreign balances is restricted by local laws and could have adverse tax consequences if we were to move the cash to another country. These limitations may affect our ability to fully utilize our cash resources for needs in the U.S. or other countries and may adversely affect our liquidity.
Changes in tax laws and unanticipated tax liabilities and adverse outcomes from tax audits or tax litigation could adversely affect our effective income tax rate and profitability.
We are subject to income taxes in the U.S. and numerous foreign jurisdictions. Our effective income tax rate in the future could be adversely affected by a number of factors, including changes in the mix of earnings in countries with differing statutory tax rates, changes in the valuation of deferred tax assets and liabilities, changes in tax laws, and the outcome of income tax audits or tax litigation in various jurisdictions around the world. We are regularly subject to, and are currently undergoing, audits by tax authorities in the U.S. and foreign jurisdictions for prior tax years. Please refer to Note 15 — Commitments and Contingencies and Note 17 — Legal Proceedings in the accompanying notes to the consolidated financial statements included in Part II - Item 8. Financial Statements and Supplementary Data of this Annual Report on Form 10-K for additional details regarding current tax audits. The final outcome of tax audits and related litigation is inherently uncertain and could be materially different than that reflected in our historical income tax provisions and accruals. Moreover, we could be subject to assessments of substantial additional taxes and/or fines or penalties relating to ongoing or future audits, which could have an adverse effect on our financial position and results of operations. Future changes in domestic or international tax laws and regulations could also adversely affect our effective tax rate or result in higher income tax liabilities. Recent developments, including U.S. tax reform, the European Commission’s investigations of local country tax authority rulings and whether those rulings comply with European Union rules on state aid, as well as the Organization for Economic Co-operation and Development’s project on Base Erosion and Profit Shifting, continue to change long-standing tax principles. These and any other additional changes could adversely affect our effective tax rate or result in higher cash tax liabilities.
We are subject to periodic litigation, which could result in unexpected expenditures of time and resources.
From time to time, we initiate litigation or are called upon to defend ourselves against lawsuits relating to our business. Due to the inherent uncertainties of litigation, we cannot accurately predict the ultimate outcome of any such proceedings. For a detailed discussion of our current material legal proceedings, see Note 17 — Legal Proceedings in the accompanying notes to the consolidated financial statements included in Part II - Item 8. Financial Statements and Supplementary Data of this Annual Report on Form 10-K. An unfavorable outcome in any of these proceedings, or any future legal proceedings, could have an adverse impact on our business and financial results. In addition, any significant litigation in the future, regardless of its merits, could divert management’s attention from our operations and result in substantial legal fees. In the past, securities class action litigation has been brought against us. If our stock price is volatile, we may become involved in this type of litigation in the future. Any litigation could result in substantial costs and a diversion of management’s attention and resources that are needed to successfully run our business.
We rely on technical innovation to compete in the market for our products.
Our success relies on continued innovation in both materials and design of footwear, such as our branded CrosliteTM, LiteRideTM, and RevivaTM. Research and development is a key part of our continued success and growth, and we rely on experts to develop and test our materials and products. CrosliteTM, our branded proprietary closed-cell resin, is the primary raw material used in the vast majority of our footwear and some of our accessories. CrosliteTM is carefully formulated to create soft, durable, extremely lightweight, and water-resistant footwear that conforms to the shape of the foot and increases comfort. We continue to invest in research and development in order to refine our materials to enhance these properties and to develop new properties for specific applications. We strive to produce footwear featuring fun, comfort, color, and functionality. If we fail to introduce technical innovation in our products, consumer demand for our products could decline, and if we experience problems with the quality of our products, we may incur substantial expense to remedy the problems.
We depend on employees across the globe, the loss of whom would harm our business.
We rely on executives and senior management to drive the financial and operational performance of our business. Turnover of executives and senior management can adversely impact our stock price, our results of operations, and our client relationships and may make recruiting for future management positions more difficult or may require us to offer more generous compensation packages to attract top executives. Changes in other key management positions may temporarily affect our financial performance and results of operations as new management becomes familiar with our business. When we experience management turnover, we must successfully integrate any newly hired management personnel within our organization in a timely manner in order to achieve our operating objectives. The key initiatives directed by these executives may take time to implement and yield positive results, and there can be no guarantee they will be successful. If our new executives do not perform up to expectations, we may experience declines in our financial performance and/or delays or failures in achieving our long-term growth strategy.
Further, our business depends on our ability to source and distribute products in a timely, efficient, and cost-effective manner. Labor disputes impacting our suppliers, manufacturers, transportation carriers, or ports pose significant threats to our business, particularly if such disputes result in work slowdowns, lockouts, strikes or other disruptions during our peak importing, or manufacturing and selling seasons. Any such disruption could result in delayed or canceled orders by customers, unplanned inventory accumulation or shortages, and increased transportation and labor costs, negatively impacting our results of operations and financial position.
If our internal controls are ineffective, our operating results and market confidence in our reported financial information could be adversely affected.
Our internal control over financial reporting may not prevent or detect misstatements because of its inherent limitations, including the possibility of human error, the circumvention or overriding of controls, or fraud. Even effective internal controls can provide only reasonable assurance with respect to the preparation and fair presentation of financial statements. If we fail to maintain the adequacy of our internal controls or if we experience difficulties in their implementation, our business and operating results and market confidence in our reported financial information could be harmed, we could incur significant costs to evaluate and remediate weaknesses, and we could fail to meet our financial reporting obligations.
The existence of a material weakness precludes management from concluding that our internal control over financial reporting is effective and precludes our independent auditors from issuing an unqualified opinion that our internal controls are effective. In addition, a material weakness could cause investors to lose confidence in our financial reporting and may negatively affect the price of our common stock. We can make no assurances that we will be able to remediate any future internal control deficiencies timely and in a cost effective manner. Moreover, effective internal controls are necessary to produce reliable financial reports and to prevent fraud. If we are unable to satisfactorily remediate future deficiencies or if we discover other deficiencies in our internal control over financial reporting, such deficiencies may lead to misstatements in our financial statements or otherwise negatively impact our business, financial results and reputation.
Extreme weather conditions, natural disasters, or other events outside of our control could negatively impact our operating results and financial condition.
The effects of climate change or natural disasters such as earthquakes, hurricanes, tsunamis, or other adverse weather and climate conditions, whether occurring in the U.S. or abroad, and the consequences and effects thereof, including damage to our supply chain, manufacturing or distribution centers, retail stores, changes in consumer preferences or spending priorities, energy shortages, and public health issues, could harm or disrupt our operations or the operations of our vendors, other suppliers, or customers, or result in economic instability that may negatively impact our operating results and financial condition. Additionally, certain catastrophes are not covered by our general insurance policies, which could result in significant unrecoverable losses.
Risks Specific to Our Capital Stock
Our restated certificate of incorporation, amended and restated bylaws and Delaware law contain provisions that could discourage a third party from acquiring us and consequently decrease the market value of an investment in our stock.
Our restated certificate of incorporation, amended and restated bylaws, and Delaware corporate law each contain provisions that could delay, defer, or prevent a change in control of us or changes in our management. These provisions could discourage proxy contests and make it more difficult for our stockholders to elect directors and take other corporate actions, which may prevent a change of control or changes in our management that a stockholder might consider favorable. In addition, Section 203 of the Delaware General Corporation Law may discourage, delay, or prevent a change in control of us. Any delay or prevention of a change of control or change in management that stockholders might otherwise consider to be favorable could cause the market price of our common stock to decline.
We may fail to meet analyst and investor expectations, which could cause the price of our stock to decline.
Our common stock is traded publicly and various securities analysts follow our financial results and frequently issue reports on us which include information about our historical financial results as well as their estimates of our future performance. These estimates are based on their own opinions and are often different from management’s estimates or expectations of our business. If our operating results are below the estimates or expectations of public market analysts and expectations of our investors, our stock price could decline.
ITEM 1B. Unresolved Staff Comments
None.
ITEM 2. Properties
Our principal executive and administrative offices are located at 7477 East Dry Creek Parkway, Niwot, Colorado 80503. We lease all of our domestic and international facilities. We currently enter into short-term and long-term leases for office, warehouse, and retail, including kiosk and store-in-store, space. The terms of our leases include fixed monthly rents and/or contingent rents based on percentage of revenues for certain of our retail locations, and expire at various dates through the year 2033. The general location, use, and approximate size of our principal properties, and the reportable operating segment are given below.
| | | | | | | | | | | | | | | | | | | | |
| Location | | Reportable Operating Segment | | Use | | Approximate
Square Feet |
| Dayton, Ohio | | Americas | | Warehouse | | 555,000 | |
Dordrecht, the Netherlands (1) | | EMEA | | Warehouse | | 392,000 | |
Rotterdam, the Netherlands (1) | | EMEA | | Warehouse | | 284,000 | |
| Narita, Japan | | Asia Pacific | | Warehouse | | 156,000 | |
Niwot, Colorado (2) | | Americas | | Corporate headquarters and regional office | | 98,000 | |
Broomfield, Colorado (2) | | Americas | | Corporate headquarters and regional office | | 88,000 | |
| Hoofddorp, the Netherlands | | EMEA | | Regional office | | 29,000 | |
| Singapore | | Asia Pacific | | Regional office | | 17,000 | |
| Westwood, Massachusetts | | Americas | | Global commercial center | | 16,000 | |
(1) In the fourth quarter of 2019, we entered into a lease agreement for a new distribution center in Dordrecht, the Netherlands, which is expected to replace to our existing distribution center in Rotterdam, the Netherlands in 2021.
(2) We plan to relocate our corporate headquarters from Niwot, Colorado to Broomfield, Colorado in early 2020.
Aside from the principal properties listed above, we lease various other offices and distribution centers worldwide to meet our sales and operational needs. We also lease 367 retail locations worldwide. See Item 1. Business of this Annual Report on Form 10-K for further discussion regarding global company-operated stores.
ITEM 3. Legal Proceedings
A discussion of legal matters is found in Note 17 — Legal Proceedings in the accompanying notes to the consolidated financial statements included in Part II - Item 8. Financial Statements and Supplementary Data of this Annual Report on Form 10-K.
ITEM 4. Mine Safety Disclosures
Not applicable.
PART II
ITEM 5. Market for Registrant’s Common Equity, Related Stockholder Matters and Issuer Purchases of Equity Securities
Market Information
Our common stock is listed on the Nasdaq Global Select Market under the stock symbol “CROX.”
Performance Graph
The following performance graph illustrates a five-year comparison of cumulative total return of our common stock, the Nasdaq Composite Index and the Dow Jones U.S. Footwear Index from December 31, 2014 through December 31, 2019. The graph assumes an investment of $100.00 on December 31, 2014 and assumes the reinvestment of all dividends and other distributions.
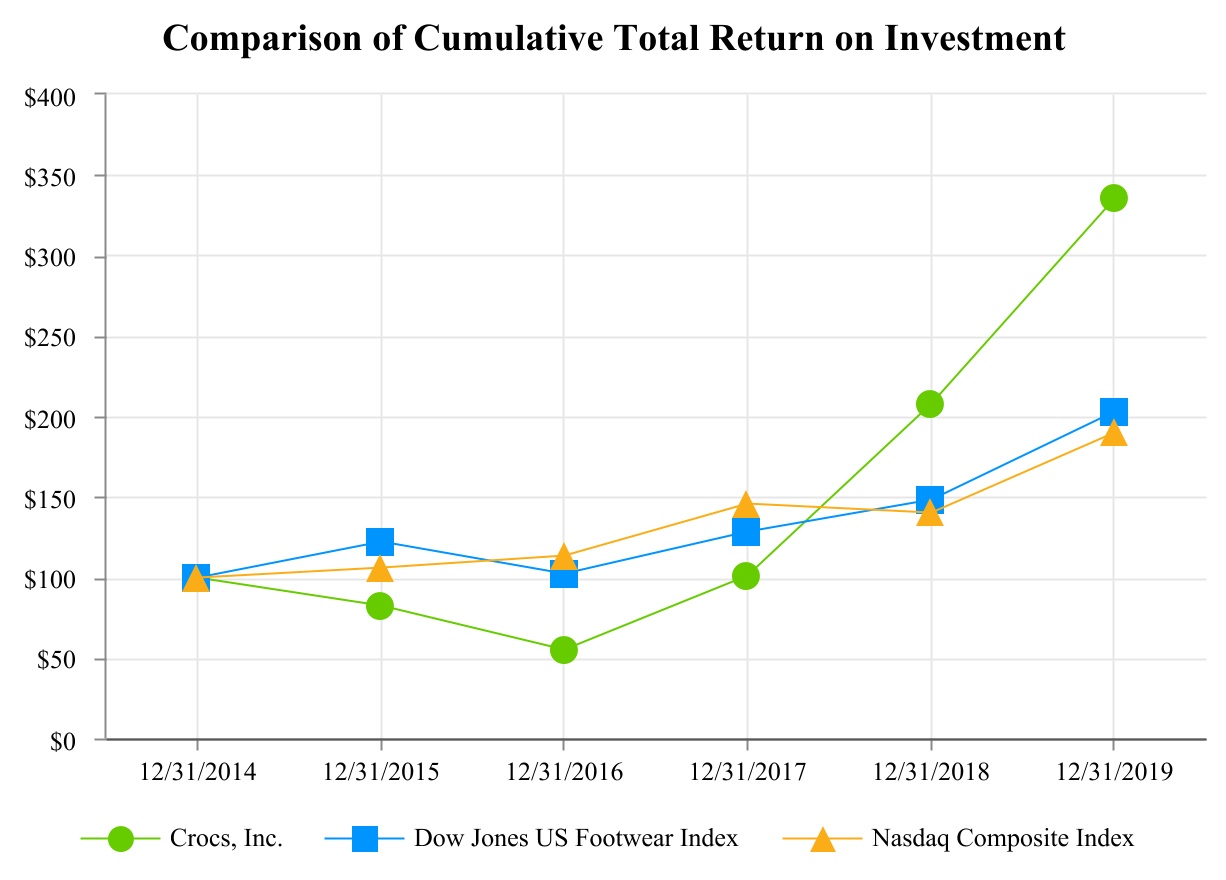
The Dow Jones U.S. Footwear Index is a sector index and includes companies in the major line of business in which we compete. This index does not encompass all of our competitors or all of our product categories and lines of business. The Dow Jones U.S. Footwear Index includes NIKE, Inc., Deckers Outdoor Corporation, Skechers U.S.A., Inc., Steven Madden Ltd., and Wolverine World Wide, Inc. The Nasdaq Composite Index is a market capitalization-weighted index and consists of more than 3,000 common equities, including Crocs, Inc. The stock performance shown on the performance graph above is not necessarily indicative of future performance. We do not make or endorse any predictions as to future stock performance.
Holders
The approximate number of stockholders of record of our common stock was 75 as of February 20, 2020.
Dividends
We have never declared or paid cash dividends on our common stock, and we do not anticipate paying any cash dividends on our common stock in the foreseeable future. Our financing arrangements include restrictions on cash dividends paid on our common stock. Any future determination to declare cash dividends on our common stock will be made at the discretion of our Board, subject to, among other things, our results of operations, financial condition, level of indebtedness, capital requirements, and compliance with covenants under any then-existing financing agreements.
Purchases of Equity Securities by the Issuer
| | | | | | | | | | | | | | | | | | | | | | | | | | |
| Period | | Total Number of Shares Purchased | | Average Price Paid per Share | | Total Number of Shares Purchased as Part of Publicly Announced Plans or Programs (1) | | Maximum Dollar Value of Shares that May Yet be Purchased Under the Plans or Programs (1) |
| October 1-31, 2019 | | — | | | $ | — | | | — | | | $ | 522,333,622 | |
| November 1-30, 2019 | | 394,935 | | | 34.73 | | | 394,935 | | | 508,626,261 | |
| December 1-31, 2019 | | — | | | — | | | — | | | 508,626,261 | |
| Total | | 394,935 | | | $ | 34.73 | | | 394,935 | | | $ | 508,626,261 | |
(1) On February 20, 2018, the Board approved and authorized a program to repurchase up to $500.0 million of our common stock, and on May 5, 2019, the Board approved an increase to the repurchase authorization of an additional $500.0 million of our common stock. As of December 31, 2019, approximately $508.6 million remained available for repurchase under our share repurchase authorization. The number, price, structure and timing of the repurchases, if any, will be at our sole discretion and future repurchases will be evaluated by us depending on market conditions, liquidity needs, restrictions under our revolving credit facility, and other factors. Share repurchases may be made in the open market or in privately negotiated transactions. The repurchase authorization does not have an expiration date and does not oblige us to acquire any particular amount of our common stock. The Board may suspend, modify, or terminate the repurchase program at any time without prior notice.
ITEM 6. Selected Financial Data
The following table presents selected historical financial data for each of our last five years. The information in this table should be read in conjunction with our consolidated financial statements and accompanying notes presented in Part II - Item 8. Financial Statements and Supplementary Data and Part II - Item 7. Management’s Discussion and Analysis of Financial Conditions and Results of Operations of this Annual Report on Form 10-K.
| | | | | | | | | | | | | | | | | | | | | | | | | | | | | |
| | Year Ended December 31, | | | | | | | | |
| | 2019 | | 2018 | | 2017 | | 2016 | | 2015 |
| | (in thousands, except per share data) | | | | | | | | |
| Revenues | $ | 1,230,593 | | | $ | 1,088,205 | | | $ | 1,023,513 | | | $ | 1,036,273 | | | $ | 1,090,630 | |
| Cost of sales | 613,537 | | | 528,051 | | | 506,292 | | | 536,109 | | | 579,825 | |
| Gross profit | 617,056 | | | 560,154 | | | 517,221 | | | 500,164 | | | 510,805 | |
| Gross margin | 50.1 | % | | 51.5 | % | | 50.5 | % | | 48.3 | % | | 46.8 | % |
Selling, general and administrative expenses | 488,407 | | | 495,028 | | | 494,601 | | | 503,174 | | | 559,095 | |
Selling, general and administrative expenses as a % of revenues | 39.7 | % | | 45.5 | % | | 48.3 | % | | 48.6 | % | | 51.3 | % |
Restructuring charges (1) | — | | | — | | | — | | | — | | | 8,728 | |
Asset impairments (2) | — | | | 2,182 | | | 5,284 | | | 3,144 | | | 15,306 | |
| Income (loss) from operations | $ | 128,649 | | | $ | 62,944 | | | $ | 17,336 | | | $ | (6,154) | | | $ | (72,324) | |
| Income (loss) before income taxes | $ | 119,322 | | | $ | 65,157 | | | $ | 18,180 | | | $ | (7,213) | | | $ | (74,744) | |
| Income tax expense (benefit) | (175) | | | 14,720 | | | 7,942 | | | (9,281) | | | (8,452) | |
| Net income (loss) | 119,497 | | | 50,437 | | | 10,238 | | | (16,494) | | | (83,196) | |
Dividends on Series A convertible preferred stock(3) | — | | | (108,224) | | | (12,000) | | | (12,000) | | | (11,833) | |
Dividend equivalents on Series A convertible preferred stock related to redemption value accretion and beneficial conversion feature (3) | — | | | (11,429) | | | (3,532) | | | (3,244) | | | (2,978) | |
Net loss attributable to common stockholders | $ | 119,497 | | | $ | (69,216) | | | $ | (5,294) | | | $ | (31,738) | | | $ | (98,007) | |
| Net income (loss) per common share: | | | | | | | | | | |
| Basic | $ | 1.70 | | | $ | (1.01) | | | $ | (0.07) | | | $ | (0.43) | | | $ | (1.30) | |
| Diluted | $ | 1.66 | | | $ | (1.01) | | | $ | (0.07) | | | $ | (0.43) | | | $ | (1.30) | |
| Weighted average common shares: | | | | | | | | | |
| Basic | 70,357 | | | 68,421 | | | 72,255 | | | 73,371 | | | 75,604 | |
| Diluted | 71,771 | | | 68,421 | | | 72,255 | | | 73,371 | | | 75,604 | |
Cash provided by operating activities | $ | 89,958 | | | $ | 114,162 | | | $ | 98,264 | | | $ | 39,754 | | | $ | 9,698 | |
| Cash used in investing activities | (36,236) | | | (10,110) | | | (11,538) | | | (19,856) | | | (18,488) | |
Cash used in financing activities (4) | (68,638) | | | (148,802) | | | (65,370) | | | (16,443) | | | (101,260) | |
(1) We commenced a restructuring in July 2014 and concluded in December 2015.
(2) Asset impairments consist of impairments of long-lived assets of retail locations in all years, as well as a $1.3 million write-off of supply chain assets in 2018, a $4.8 million write-off of a discontinued project in 2017, and $0.4 million of goodwill impairment in 2016.
(3) On December 5, 2018, all issued and outstanding shares of Series A Convertible Preferred Stock (“Series A Preferred”) were repurchased in exchange for cash or converted to common stock. As a result, amounts reported for the year ended December 31, 2018 include amounts resulting from the repurchase and conversion, in addition to payments made to induce conversion and accretion of dividend equivalents prior to December 5, 2018.
(4) Cash used in financing activities for the year ended December 31, 2018 reflects the impacts of $183.7 million used to repurchase Series A Preferred in 2018 and $120.0 million of borrowings. Cash used in financing activities also includes approximately $147.2 million, $63.1 million, $50.0 million, and $85.9 million, including commissions, used to repurchase shares of our common stock during 2019, 2018, 2017, and 2015, respectively. We did not repurchase shares in 2016.
| | | | | | | | | | | | | | | | | | | | | | | | | | | | | |
| | December 31, | | | | | | | | |
| | 2019 | | 2018 | | 2017 | | 2016 | | 2015 |
| | (in thousands) | | | | | | | | |
| Cash and cash equivalents | $ | 108,253 | | | $ | 123,367 | | | $ | 172,128 | | | $ | 147,565 | | | $ | 143,341 | |
| Inventories | 172,028 | | | 124,491 | | | 130,347 | | | 147,029 | | | 168,192 | |
Working capital (1) | 168,159 | | | 195,807 | | | 268,031 | | | 276,335 | | | 278,852 | |
Total assets (1) | 738,802 | | | 468,901 | | | 543,695 | | | 566,390 | | | 608,020 | |
Long-term liabilities (1) | 349,674 | | | 134,102 | | | 18,379 | | | 17,966 | | | 19,294 | |
| Total stockholders’ equity | 131,905 | | | 150,308 | | | 185,865 | | | 220,383 | | | 245,972 | |
(1) Prior year amounts have not been recast to reflect adoption of revenue recognition guidance as of January 1, 2018, which impacts ‘Total Assets’, or adoption of new lease guidance as of January 1, 2019, which impacts ‘Working capital’, ‘Total assets’, and ‘Long-term liabilities’. See Note 2 — Recent Accounting Pronouncements of the accompanying notes to the consolidated financial statements included in Part II - Item 8. Financial Statements and Supplementary Data of this Annual Report on Form 10-K for more information on our adoption of the new lease standard.
ITEM 7. Management’s Discussion and Analysis of Financial Condition and Results of Operations
Business Overview
Crocs, Inc. and its consolidated subsidiaries (collectively, the “Company,” “Crocs,” “we,” “our,” or “us”) are engaged in the design, development, worldwide marketing, distribution, and sale of casual lifestyle footwear and accessories for men, women, and children. We strive to be the world leader in innovative casual footwear for women, men, and children, combining comfort and style with a value that consumers want. The vast majority of shoes within Crocs’ collection contain CrosliteTM material, a proprietary, molded footwear technology, delivering extraordinary comfort with each step. The broad appeal of our footwear has allowed us to market our products through a wide range of distribution channels. We currently sell our products in more than 85 countries, through three distribution channels: wholesale, retail, and e-commerce. Our wholesale channel includes domestic and international multi-brand brick-and-mortar retailers, e-tailers, and distributors; our retail channel includes company-operated stores; and our e-commerce channel includes company-operated e-commerce sites and third-party-operated marketplace activity.
Known or Anticipated Trends
Based on our recent operating results and our assessment of the current operating environment, we anticipate certain trends will continue to impact our future operating results:
•Consumer spending preferences continue to shift toward e-commerce and away from brick and mortar stores. This has resulted in continued sales growth in our e-commerce channel, as well as with various e-tail partners in the wholesale channel.
•A cautious purchasing environment may negatively affect customer purchasing trends.
•Foreign exchange rate volatility will continue to impact our reported U.S. Dollar results from our foreign operations.
•Following the reductions in ‘Selling, general and administrative expenses’ (“SG&A”) from our 2017 strategic plan, we continue to see leverage in our SG&A spending, while still investing in our future growth.
•We will incur charges affecting gross margin relating to our new distribution center in the Netherlands.
•We currently expect revenues will be negatively impacted as a result of disruptions to our Asia business from COVID-19 in 2020.
Use of Non-GAAP Financial Measures
In addition to financial measures presented on the basis of accounting principles generally accepted in the United States of America (“U.S. GAAP”), we present certain information related to our current period results of operations through “constant currency,” which is a non-GAAP financial measure and should be viewed as a supplement to our results of operations and presentation of reportable segments under U.S. GAAP. Constant currency represents current period results that have been retranslated using prior year average foreign exchange rates for the comparative period to enhance the visibility of the underlying business trends excluding the impact of foreign currency exchange rates on reported amounts.
Management uses constant currency to assist in comparing business trends from period to period on a consistent basis in communications with the Board, stockholders, analysts, and investors concerning our financial performance. We believe constant currency is useful to investors and other users of our consolidated financial statements as an additional tool to evaluate operating performance and trends. Investors should not consider constant currency in isolation from, or as a substitute for, financial information prepared in accordance with U.S. GAAP.
2019 Financial and Operational Highlights
Revenues were $1,230.6 million for the year ended December 31, 2019, a 13.1% increase compared to the year ended December 31, 2018. The increase in 2019 revenues compared to 2018 revenues was due to the net effects of: (i) higher sales volumes, which increased revenues by $103.0 million, or 9.5%, (ii) higher average selling prices as we increased prices on certain products and reduced discounts and promotions, which increased revenues by $67.2 million, or 6.2%; and (iii) unfavorable changes in exchange rates, which decreased revenues by $27.8 million, or 2.6%.
The following were significant developments affecting our businesses and capital structure during the year ended December 31, 2019:
•We sold 67.1 million pairs of shoes worldwide, an increase from 59.8 million pairs in 2018.
•Gross margin was 50.1% compared to 51.5% in 2018, a decline of 140 basis points, partially as a result of transition costs associated with relocation of our distribution center in the U.S. in 2019 and our distribution center in the Netherlands, which is expected to replace our existing facility in 2021. Unfavorable changes in foreign exchange rates decreased gross profit by $13.9 million and offset the improvement of further refined product mix, reduced promotional activities, and increased prices on select products.
•SG&A was $488.4 million, a decrease of $6.6 million, or 1.3%, compared to 2018. As a percent of revenues, SG&A improved 580 basis points to 39.7% of revenues. SG&A expense included $2.9 million of non-recurring charges associated with various cost reduction initiatives compared to $21.1 million of non-recurring charges in 2018 associated with the completion of the closure of our company-operated manufacturing and distribution facilities in Mexico and Italy and our SG&A reduction plan, and some prior year charges related to the relocation of our corporate headquarters, which is planned for early 2020.
•Income from operations was $128.6 million for the year ended December 31, 2019 compared to income from operations of $62.9 million for the year ended December 31, 2018. Our operating margin rose to 10.5% compared to 5.8% in 2018.
•Net income attributable to common stockholders was $119.5 million compared to a loss of $69.2 million in 2018, which included charges incurred related to the repurchase and conversion of our Series A Preferred required by GAAP. Diluted net income per common share was $1.66 for the year ended December 31, 2019, compared to a diluted net loss per common share of $1.01 for the year ended December 31, 2018.
•To continue improving the efficiency and profitability of our retail business we closed or transferred to distributors 31 stores in 2019, 48.4% of which were full-priced locations, for a net reduction of 16 company-operated retail stores. Since we began our store reduction program early in 2017, we have closed a net total of 191 stores and reduced our total company-operated store count to 367 from 558 at the end of 2016. The majority of these store closures occurred upon expiration of the leases. We have also placed greater priority on outlet stores, so that they now represent 52.6% of our store base, up from 41.6% at the end of 2016.
•During 2019, we repurchased 6.1 million shares of common stock at an aggregate cost of $147.2 million.
•In November 2019, Blackstone Capital Partners VI L.P. and certain of its permitted transferees sold its remaining 6,899,027 shares of our common stock in an underwritten public offering.
Results of Operations
Comparison of the Years Ended December 31, 2019 and 2018
A discussion of our year-to-date comparison between 2019 and 2018 is presented below. A discussion of the changes in our results of operations between the years ended December 31, 2018 and December 31, 2017 has been omitted from this Annual Report on Form 10-K, but may be found in Part II - Item 7. Management’s Discussion and Analysis of Financial Condition and Results of Operations of our Annual Report on Form 10-K for the year ended December 31, 2018, filed with the SEC on February 28, 2019, which is available free of charge on the SEC’s website at www.sec.gov and our corporate website (www.crocs.com).
| | | | | | | | | | | | | | | | | | | | | | | | | | | | | |
| Year Ended December 31, | | | | | | $ Change | | | | % Change | | |
| | 2019 | | 2018 | | | | 2019-2018 | | | | 2019-2018 | | |
| (in thousands, except per share data, margin, and average selling price data) | | | | | | | | | | | | | |
| Revenues | $ | 1,230,593 | | | $ | 1,088,205 | | | | | $ | 142,388 | | | | | 13.1 | % | | |
| Cost of sales | 613,537 | | | 528,051 | | | | | (85,486) | | | | | (16.2) | % | | |
| Gross profit | 617,056 | | | 560,154 | | | | | 56,902 | | | | | 10.2 | % | | |
Selling, general and administrative expenses | 488,407 | | | 495,028 | | | | | 6,621 | | | | | 1.3 | % | | |
Asset impairments | — | | | 2,182 | | | | | 2,182 | | | | | 100.0 | % | | |
Income from operations | 128,649 | | | 62,944 | | | | | 65,705 | | | | | 104.4 | % | | |
Foreign currency gains (losses), net | (1,323) | | | 1,318 | | | | | (2,641) | | | | | (200.4) | % | | |
| Interest income | 601 | | | 1,281 | | | | | (680) | | | | | (53.1) | % | | |
| Interest expense | (8,636) | | | (955) | | | | | (7,681) | | | | | (804.3) | % | | |
Other income, net | 31 | | | 569 | | | | | (538) | | | | | (94.6) | % | | |
Income before income taxes | 119,322 | | | 65,157 | | | | | 54,165 | | | | | 83.1 | % | | |
Income tax expense (benefit) | (175) | | | 14,720 | | | | | 14,895 | | | | | 101.2 | % | | |
Net income | 119,497 | | | 50,437 | | | | | 69,060 | | | | | 136.9 | % | | |
Dividends on Series A convertible preferred stock | — | | | (108,224) | | | | | 108,224 | | | | | 100.0 | % | | |
Dividend equivalents on Series A convertible preferred stock related to redemption value accretion and beneficial conversion feature | — | | | (11,429) | | | | | 11,429 | | | | | 100.0 | % | | |
Net income (loss) attributable to common stockholders | $ | 119,497 | | | $ | (69,216) | | | | | $ | 188,713 | | | | | 272.6 | % | | |
Net income (loss) per common share: | | | | | | | | | | | | | | | |
| Basic | $ | 1.70 | | | $ | (1.01) | | | | | $ | 2.71 | | | | | 268.3 | % | | |
| Diluted | $ | 1.66 | | | $ | (1.01) | | | | | $ | 2.67 | | | | | 264.4 | % | | |
Gross margin (1) | 50.1 | % | | 51.5 | % | | | | (140) bp | | | | (2.7) | % | | |
Operating margin (1) | 10.5 | % | | 5.8 | % | | | | 470 bp | | | | 81.0 | % | | |
Selling, general and administrative expenses as a percentage of revenues | 39.7 | % | | 45.5 | % | | | | 580 bp | | | | 12.7 | % | | |
| Footwear unit sales | 67,051 | | | 59,815 | | | | | 7,236 | | | | | 12.1 | % | | |
| Average footwear selling price - nominal basis | $ | 17.81 | | | $ | 17.71 | | | | | $ | 0.10 | | | | | 0.6 | % | | |
| | | | | | | | | | | | | |
(1) Changes for gross margin and operating margin are shown in basis points (“bp”).
Revenues by Channel
| | | | | | | | | | | | | | | | | | | | | | | | | | | | | | | | | | | | | |
| Year Ended December 31, | | | | | | | | | | % Change | | | | | | | | Constant Currency % Change (1) | | |
| 2019 | | 2018 | | | | | | | | 2019-2018 | | | | | | | | 2019-2018 | | |
| (in thousands) | | | | | | | | | | | | | | | | | | | | |
| Wholesale: | | | | | | | | | | | | | | | | | | | | | |
| Americas | $ | 275,284 | | | $ | 216,797 | | | | | | | | | 27.0 | % | | | | | | | | 28.3 | % | | |
| Asia Pacific | 207,405 | | | 203,110 | | | | | | | | | 2.1 | % | | | | | | | | 4.9 | % | | |
| EMEA | 173,480 | | | 154,992 | | | | | | | | | 11.9 | % | | | | | | | | 18.6 | % | | |
| Other businesses | 58 | | | 3,145 | | | | | | | | | (98.2) | % | | | | | | | | (98.2) | % | | |
| Total wholesale | 656,227 | | | 578,044 | | | | | | | | | 13.5 | % | | | | | | | | 16.8 | % | | |
| Retail: | | | | | | | | | | | | | | | | | | | | | |
| Americas | 241,694 | | | 204,806 | | | | | | | | | 18.0 | % | | | | | | | | 18.1 | % | | |
| Asia Pacific | 74,793 | | | 87,264 | | | | | | | | | (14.3) | % | | | | | | | | (10.8) | % | | |
| EMEA | 30,875 | | | 35,358 | | | | | | | | | (12.7) | % | | | | | | | | (8.8) | % | | |
| Total retail | 347,362 | | | 327,428 | | | | | | | | | 6.1 | % | | | | | | | | 7.5 | % | | |
| E-commerce: | | | | | | | | | | | | | | | | | | | | | |
| Americas | 123,537 | | | 98,589 | | | | | | | | | 25.3 | % | | | | | | | | 25.5 | % | | |
| Asia Pacific | 65,874 | | | 54,224 | | | | | | | | | 21.5 | % | | | | | | | | 25.6 | % | | |
| EMEA | 37,593 | | | 29,920 | | | | | | | | | 25.6 | % | | | | | | | | 31.6 | % | | |
| Total e-commerce | 227,004 | | | 182,733 | | | | | | | | | 24.2 | % | | | | | | | | 26.5 | % | | |
| Total revenues | $ | 1,230,593 | | | $ | 1,088,205 | | | | | | | | | 13.1 | % | | | | | | | | 15.6 | % | | |
(1) Reflects year over year change as if the current period results were in constant currency, which is a non-GAAP financial measure. See “Use of Non-GAAP Financial Measures” for more information.
The primary drivers of the changes in revenues were:
| | | | | | | | | | | | | | | | | | | | | | | | | | | | | | | | | | | | | | | | | | | | | | | |
| 2019 vs. 2018 | | | | | | | | | | | | | | |
| Volume | | | | Price (1) | | | | Foreign Exchange | | | | Total | | |
| $ Change | | % Change | | $ Change | | % Change | | $ Change | | % Change | | $ Change | | % Change |
| (in thousands) | | | | | | | | | | | | | | |
| Total revenues | $ | 102,986 | | | | 9.5 | % | | $ | 67,180 | | | | 6.2 | % | | $ | (27,778) | | | | (2.6) | % | | $ | 142,388 | | | | 13.1 | % |
(1) The change due to price is based on the change in average selling price on a constant currency basis (“ASP”).
Revenues. The increase in sales volume was primarily due to increases in the sales volumes of our clog and sandal silhouettes, while the increase in ASP was primarily a result of changes in product mix, reduced promotional activities, and price increases. These changes were partially offset by a decrease due to foreign currency translation, primarily as a result of fluctuations in the Euro, Korean Won, and Chinese Yuan. Increases in e-commerce revenues of 24.2%, as a result of continued focus on digital commerce, and wholesale revenues of 13.5%, as a result of higher sell-through in the Americas and EMEA, were the primary drivers of the overall increase in revenue. Retail revenues increased 6.1%, despite operating a net 16 fewer retail stores compared to the same period last year.
Cost of sales. Cost of sales increased compared to 2018 due to higher sales volume of $65.8 million, or 12.5%, and higher average cost per unit on a constant currency basis (“AUC”), a result of reduced purchasing power related to currency changes, of $33.6 million, or 6.4%. Foreign currency translation resulted in a decrease of $13.9 million, or 2.6%.
Gross profit. Gross margin was 50.1% compared to 51.5% in 2018, driven in part by transition costs associated with the relocation of our distribution centers in the U.S. and the Netherlands and reduced purchasing power related to currency changes, offset in part by better performance from a product mix perspective. Gross profit increased $56.9 million, or 10.2%. Higher unit sales volume drove an increase of approximately $37.2 million, or 6.6%, and ASP, partially offset by higher AUC, led to an increase of $33.6 million, or 6.0%. Foreign currency translation partially offset the gross profit increase by $13.9 million, or 2.5%.
Selling, general and administrative expenses. SG&A decreased $6.6 million, or 1.3%, during the year ended December 31, 2019 compared to 2018. As a percent of sales, SG&A improved by 580 basis points to 39.7%. The net decrease was in part due to non-recurring charges of $2.9 million in 2019, compared to $21.1 million in 2018. The prior year charges were primarily related to the closure of our company-operated manufacturing and distribution facilities and our SG&A reduction plan, which was completed in 2018. There was also a decrease in facilities expense of $9.0 million, primarily due to the reduction of company-operated retail stores. These decreases were partially offset by an additional investment in marketing of $14.5 million, professional services expenses of $5.3 million and other net expenses of $0.8 million to support revenue growth.
Asset impairment charges. During the year ended December 31, 2019, we incurred no impairment charges. During the year ended December 31, 2018, we incurred $0.9 million in retail asset impairment charges related to certain underperforming retail locations that were unlikely to generate sufficient cash flows to fully recover the carrying value of the stores’ assets over their remaining economic lives. In addition, during the year ended December 31, 2018, we incurred charges of $1.3 million associated with the closure of company-operated manufacturing and distribution facilities.
Foreign currency gain (loss), net. Foreign currency gain (loss), net, consists of unrealized and realized foreign currency gains and losses from the remeasurement and settlement of monetary assets and liabilities denominated in non-functional currencies as well as realized and unrealized gains and losses on foreign currency derivative instruments. During the year ended December 31, 2019, we recognized realized and unrealized net foreign currency losses of $1.3 million compared to net gains of $1.3 million during the year ended December 31, 2018.
Income tax expense (benefit). During the year ended December 31, 2019, we recognized an income tax benefit of $0.2 million on pre-tax book income of $119.3 million, representing an effective tax rate of (0.1)%, compared to income tax expense of $14.7 million on pre-tax book income of $65.2 million in 2018, which represented an effective tax rate of 22.6%. During the year ended December 31, 2019, we reduced a portion of the valuation allowance recorded against certain deferred tax assets and recognized excess tax benefits related to share-based compensation, resulting in a lower effective tax rate as compared to 2018. Our effective tax rate has varied dramatically in recent years due to differences in our profitability level and relative operating earnings across multiple jurisdictions and was significantly impacted by the change in the valuation allowance.
Our valuation allowances are primarily the result of uncertainties regarding the future realization of tax attributes recorded in various jurisdictions. The measurement of deferred tax assets is reduced by a valuation allowance if, based upon available evidence, it is more likely than not that the deferred tax assets will not be realized. We have evaluated the realizability of our deferred tax assets in each jurisdiction by assessing the adequacy of expected taxable income, including the reversal of existing temporary differences, historical and projected operating results and the availability of prudent and feasible tax planning strategies. In assessing our valuation allowance, we considered all available evidence, including the magnitude of recent and current operating results, the duration of statutory carryforward periods, our historical experience utilizing tax attributes prior to their expiration dates, the historical volatility of operating results of these jurisdictions and our assessment regarding the sustainability of their profitability. The weight we give to any particular item is, in part, dependent upon the degree to which it can be objectively verified. Certain jurisdictions for which we have historically recorded significant valuation allowances now have a sufficient history of sustained profitability as of December 31, 2019. As a result, valuation allowances recorded against deferred tax assets decreased by $34.2 million for the year ended December 31, 2019.
The 2019 impact of changes in valuation allowances to the effective tax rate was a favorable $33.7 million, equating to a 28.2% impact. There is also a $0.5 million reduction of the valuation allowance related to cumulative translation adjustment. We maintain valuation allowances of approximately $79.0 million as of December 31, 2019, which may be reduced in the future depending upon the achieved profitability of certain jurisdictions as well as the magnitude of the profitability.
In 2017, we began operating under a tax holiday in one of our foreign jurisdictions. This tax holiday is in effect through 2022, and may be extended if certain additional requirements are met. The tax holiday is conditional based upon meeting certain employment and investment thresholds. The impact of the tax holiday in 2019 decreased tax expense in that jurisdiction by approximately $0.2 million and had no impact to our reported earnings per diluted share.
Reportable Operating Segments
The following table sets forth information related to our reportable operating business segments for the years ended December 31, 2019 and 2018.
| | | | | | | | | | | | | | | | | | | | | | | | | | | | | | | | | | | | | |
| Year Ended December 31, | | | | | | | | | | % Change | | | | | | | | Constant Currency % Change (1) | | |
| 2019 | | 2018 | | | | | | | | 2019-2018 | | | | | | | | 2019-2018 | | |
| (in thousands) | | | | | | | | | | | | | | | | | | | | |
| Revenues: | | | | | | | | | | | | | | | | | | | | | |
| Americas | $ | 640,515 | | | $ | 520,192 | | | | | | | | | 23.1 | % | | | | | | | | 23.7 | % | | |
| Asia Pacific | 348,072 | | | 344,598 | | | | | | | | | 1.0 | % | | | | | | | | 4.2 | % | | |
| EMEA | 241,948 | | | 220,270 | | | | | | | | | 9.8 | % | | | | | | | | 16.0 | % | | |
| Segment revenues | 1,230,535 | | | 1,085,060 | | | | | | | | | 13.4 | % | | | | | | | | 16.0 | % | | |
| Other businesses | 58 | | | 3,145 | | | | | | | | | (98.2) | % | | | | | | | | (98.2) | % | | |
Total consolidated revenues | $ | 1,230,593 | | | $ | 1,088,205 | | | | | | | | | 13.1 | % | | | | | | | | 15.6 | % | | |
| | | | | | | | | | | | | | | | | | | | | |
| Income from operations: | | | | | | | | | | | | | | | | | | | | | |
| Americas | $ | 204,868 | | | $ | 138,940 | | | | | | | | | 47.5 | % | | | | | | | | 48.1 | % | | |
| Asia Pacific | 80,645 | | | 82,780 | | | | | | | | | (2.6) | % | | | | | | | | 0.5 | % | | |
| EMEA | 70,326 | | | 59,539 | | | | | | | | | 18.1 | % | | | | | | | | 25.0 | % | | |
Segment income from operations | 355,839 | | | 281,259 | | | | | | | | | 26.5 | % | | | | | | | | 29.2 | % | | |
Reconciliation of segment income from operations to income (loss) before income taxes: | | | | | | | | | | | | | | | | | | | | | |
| Other businesses | (54,936) | | | (55,583) | | | | | | | | | (1.2) | % | | | | | | | | | | |
Unallocated corporate and other (2) | (172,254) | | | (162,732) | | | | | | | | | 5.9 | % | | | | | | | | | | |
Total consolidated income (loss) from operations | 128,649 | | | 62,944 | | | | | | | | | 104.4 | % | | | | | | | | | | |
| Foreign currency transaction gain (loss), net | (1,323) | | | 1,318 | | | | | | | | | (200.4) | % | | | | | | | | | | |
| Interest income | 601 | | | 1,281 | | | | | | | | | (53.1) | % | | | | | | | | | | |
| Interest expense | (8,636) | | | (955) | | | | | | | | | 804.3 | % | | | | | | | | | | |
| Other income | 31 | | | 569 | | | | | | | | | (94.6) | % | | | | | | | | | | |
| Income (loss) before income taxes | $ | 119,322 | | | $ | 65,157 | | | | | | | | | 83.1 | % | | | | | | | | | | |
(1) Reflects year over year change as if the current period results were in constant currency, which is a non-GAAP financial measure. See “Use of Non-GAAP Financial Measures” for more information.
(2) “Unallocated corporate and other” includes corporate support and administrative functions, costs associated with share-based compensation, research and development, brand marketing, legal, and depreciation and amortization of corporate and other assets not allocated to operating segments.
The primary drivers of changes in revenues by operating segment were:
| | | | | | | | | | | | | | | | | | | | | | | | | | | | | | | | | | | | | | | | | | | | | | | |
| 2019 vs. 2018 | | | | | | | | | | | | | | |
| Volume | | | | Price (1) | | | | Foreign Exchange | | | | Total | | |
| $ Change | | % Change | | $ Change | | % Change | | $ Change | | % Change | | $ Change | | % Change |
| (in thousands) | | | | | | | | | | | | | | |
| Segment Revenues: | | | | | | | | | | | | | | | |
| Americas | $ | 56,469 | | | 10.9 | % | | $ | 67,068 | | | 12.9 | % | | $ | (3,214) | | | (0.6) | % | | $ | 120,323 | | | 23.1 | % |
| Asia Pacific | 13,194 | | | 3.8 | % | | 1,305 | | | 0.4 | % | | (11,025) | | | (3.2) | % | | 3,474 | | | 1.0 | % |
| EMEA | 36,410 | | | 16.5 | % | | (1,193) | | | (0.5) | % | | (13,539) | | | (6.1) | % | | 21,678 | | | 9.8 | % |
Total segment revenues | $ | 106,073 | | | 9.8 | % | | $ | 67,180 | | | 6.2 | % | | $ | (27,778) | | | (2.6) | % | | $ | 145,475 | | | 13.4 | % |
(1) The change due to price for revenues is based on ASP, as defined earlier in this section.
Americas
Revenues. The increase in revenues for our Americas segment was primarily due to increased volume, driven by increased demand as consumer affinity for the Crocs brand strengthens, and increased ASP, resulting from positive changes in product mix, reduced promotional activities, and price increases. Overall, wholesale and e-commerce revenues contributed the largest increases of 27.0% and 25.3%, respectively, due to higher sell-through in brick-and-mortar accounts and continued focus on digital commerce. Retail revenues increased 18.0%, despite operating 3 fewer retail stores compared to the same period last year due to increased traffic in our retail locations.
Income from Operations. During the year ended December 31, 2019, income from operations for our Americas segment was $204.9 million, an increase of $65.9 million, or 47.5%. Gross profit for the year ended December 31, 2019 increased $69.9 million, or 24.4%, and gross margin increased 50 basis points to 55.5%, compared to the year ended December 31, 2018. The increase in gross profit was due to the net impact of an increase of $24.4 million, or 8.5%, due to higher unit sales volume and an increase of $47.2 million, or 16.5%, due to increased ASP, partially offset by higher AUC. There was also a decrease of $1.7 million, or 0.6%, from foreign currency translation.
During the year ended December 31, 2019, SG&A for our Americas segment increased by $4.1 million, or 2.8%, compared to 2018. This was primarily due to increases of $3.4 million in compensation expense from hourly wage increases for retail employees and increased commissions to support business growth, $2.7 million in professional services expense from various volume-based services driven primarily by our e-commerce channel, and an additional investment in marketing of $1.7 million to support revenue growth. These increases were partially offset by decreases in facilities expense, primarily related to savings due to the net reduction of 3 stores, and other net expenses of $3.7 million.
Asia Pacific Operating Segment
Revenues. Increases in revenue due to sales volume in the Asia Pacific segment were partially offset by negative foreign currency changes, primarily due to fluctuations in the Korean Won and Chinese Yuan. The increase in revenues for our Asia Pacific segment was primarily due to a 21.5% increase in e-commerce revenues, which were up on a constant currency basis as a result of our focus on digital commerce and opening new marketplaces, partially offset by a 14.3% decrease in retail revenues as a result of 8 fewer company-operated stores.
Income from Operations. During the year ended December 31, 2019, income from operations for our Asia Pacific segment was $80.6 million, a decrease of $2.1 million, or 2.6%. Gross profit for the year ended December 31, 2019 decreased $7.4 million, or 3.8%, and gross margin decreased 270 basis points to 53.4% compared to the year ended December 31, 2018. The decrease in Asia Pacific segment gross profit was due to an increase in our AUC that outpaced the increase in our ASP by $7.7 million, or 4.0%, driven largely by reduced purchasing power related to currency changes, and a decrease of $6.1 million, or 3.1%, from foreign currency translation, partially offset by the net impact of an increase in unit sales volumes of $6.4 million, or 3.3%.
During the year ended December 31, 2019, SG&A for our Asia Pacific segment decreased $4.5 million, or 4.1%, compared to the same period in 2018. This was primarily due to lower facilities expense of $5.5 million from store closures and lower compensation, depreciation, and other expenses of $7.9 million. These were partially offset by an additional investment in marketing of $6.2 million to support revenue growth and increases in other expenses of $2.7 million.
Europe, Middle East, and Africa Operating Segment
Revenues. The increase in revenues for our EMEA segment was primarily due to increased volume driven by increased demand as consumer affinity for the Crocs brand strengthens, partially offset by decreased ASP and decreased foreign currency translation, which resulted from fluctuations in the Euro. E-commerce revenues increased 25.6%, reflecting higher online traffic, and wholesale revenues increased 11.9% as a result of sell-through, which more than offset a decline in retail results of 12.7% as we operated 5 fewer retail stores in the region compared to last year.
Income from Operations. During the year ended December 31, 2019, income from operations for our EMEA segment was $70.3 million, an increase of $10.8 million, or 18.1%. Gross profit for the year ended December 31, 2019 increased $5.4 million, or 4.7%, and gross margin decreased by 250 basis points to 50.2% compared to the year ended December 31, 2018. The increase in our EMEA segment gross profit is from $18.0 million, or 15.5%, of higher volumes, particularly in the wholesale channel, partially offset by a decrease of $5.9 million, or 5.1%, as a result of reduced purchasing power related to currency changes and a decrease of $6.7 million, or 5.8%, from foreign currency translation.
During the year ended December 31, 2019, SG&A for our EMEA segment decreased $5.4 million, or 9.5%, compared to the same period in 2018. Store closures drove a decrease in facilities expense of $2.4 million, compensation expense decreased $2.3 million, and other expenses, including professional services expense and depreciation expense, decreased $2.6 million. These decreases were partially offset by an additional investment in marketing and other expenses of $1.9 million.
Other Businesses and Unallocated Corporate
During the year ended December 31, 2019, total net costs within ‘Other businesses’ and ‘Unallocated corporate’ increased by $8.9 million, or 4.1%, compared to the same period in 2018. The net increase was in part due to higher net supply chain costs of $11.0 million, an additional investment in marketing of $6.1 million, and net increases other costs, including information technology and professional services expenses, of $5.5 million. These increases were partially offset by a decrease in non-recurring charges of $13.7 million, related to the prior year closure of our company-operated manufacturing and distribution facilities.
Store Locations and Comparable Store Sales
The table below illustrates the overall change in the number of our company-operated retail locations by type of store and reportable operating segment:
| | | | | | | | | | | | | | | | | | | | | | | | | | | | | |
| | | | | | | | December 31, 2018 | | Opened | | Closed/Transferred | | December 31, 2019 |
| Type: | | | | | | | | | | | | | |
| Outlet stores | | | | | | | 195 | | | 10 | | | 12 | | | 193 | |
| Retail stores | | | | | | | 120 | | | 4 | | | 15 | | | 109 | |
Kiosk/store-in- store | | | | | | | 68 | | | 1 | | | 4 | | | 65 | |
| Total | | | | | | | 383 | | | 15 | | | 31 | | | 367 | |
| Operating segment: | | | | | | | | | | | | | |
| Americas | | | | | | | 168 | | | 1 | | | 4 | | | 165 | |
| Asia Pacific | | | | | | | 153 | | | 12 | | | 20 | | | 145 | |
| EMEA | | | | | | | 62 | | | 2 | | | 7 | | | 57 | |
| Total | | | | | | | 383 | | | 15 | | | 31 | | | 367 | |
Comparable retail store sales and direct-to-consumer comparable store sales by reportable operating segment are as follows:
| | | | | | | | | | | | | |
| Constant Currency (1) | | | | |
| Year Ended December 31, | | | | |
| 2019 | | 2018 | | |
Comparable retail store sales (2) | | | | | |
| Americas | 18.8 | % | | 14.0 | % | | |
| Asia Pacific | (2.0) | % | | 4.0 | % | | |
| EMEA | 5.0 | % | | 10.1 | % | | |
| Global | 12.4 | % | | 10.8 | % | | |
| | | | | | | | | | | | | |
| Constant Currency (1) | | | | |
| Year Ended December 31, | | | | |
| 2019 | | 2018 | | |
Direct-to-consumer comparable store sales (includes retail and e-commerce) (2) | | | | | |
| Americas | 21.0 | % | | 16.7 | % | | |
| Asia Pacific | 5.6 | % | | 8.8 | % | | |
| EMEA | 13.3 | % | | 15.6 | % | | |
| Global | 16.0 | % | | 14.3 | % | | |
(1) Reflects period over period change on a constant currency basis, which is a non-GAAP financial measure. See the “Use of Non-GAAP Financial Measures” section for additional information.
(2) Comparable store status is determined on a monthly basis. Comparable store sales includes the revenues of stores that have been in operation for more than twelve months. Stores in which selling square footage has changed more than 15% as a result of a remodel, expansion, or reduction are excluded until the thirteenth month in which they have comparable prior year sales. Temporarily closed
stores are excluded from the comparable store sales calculation during the month of closure. Location closures in excess of three months are excluded until the thirteenth month post re-opening. E-commerce revenues are based on same site sales period over period.
Liquidity and Capital Resources
Our liquidity position as of December 31, 2019 was:
| | | | | | | | | | | | | | |
| | December 31, 2019 | | | | | | |
| | (in thousands) | | | | | | |
| Cash and cash equivalents | | $ | 108,253 | | | | | | | |
| | | | | | | | |
| Available borrowings | | 240,400 | | | | | | | |
As of December 31, 2019, we had $108.3 million in cash and cash equivalents and up to $240.4 million in available borrowings under our Facility (as defined below). We believe that our cash flows from operations, our cash and cash equivalents on hand, and available borrowings under our Facility and other financing agreements will be sufficient to meet our ongoing liquidity needs and capital expenditure requirements for at least the next twelve months. Additional future financing may be necessary to fund our operations and there can be no assurance that, if needed, we will be able to secure additional debt or equity financing on terms acceptable to us or at all. Although we believe we have adequate sources of liquidity over the long term, the success of our operations, the global economic outlook, and the pace of sustainable growth in our markets, among other factors, could impact our business and liquidity.
Due to the seasonal nature of our footwear, which is more heavily focused on styles suitable for warm weather, revenues generated during our fourth quarter, when the northern hemisphere is experiencing cooler weather, are typically less than revenues generated during our first three quarters. Accordingly, cash flows from operating activities during our first quarter are typically lower as we collect on the related fourth quarter customer receivables and as customer receivables and inventories rise in preparation for the Spring/Summer season. Cash flows from operating activities generated during our second and third quarters are generally higher, when the northern hemisphere is experiencing warmer weather. Accordingly, results of operations and cash flows for any one quarter are not necessarily indicative of expected results for any other quarter or for any other year.
Repatriation of Cash
As a global business, we have cash balances in various countries and amounts are denominated in various currencies. Fluctuations in foreign currency exchange rates impact our results of operations and cash positions. Future fluctuations in foreign currencies may have a material impact on our cash flows and capital resources. Cash balances held in foreign countries may have additional restrictions and covenants associated with them which could adversely impact our liquidity and our ability to timely access and transfer cash balances between entities.
As a result of the Tax Act, most of the cash held outside of the U.S. could be repatriated to the U.S. without incurring additional U.S. federal income taxes. In some countries, repatriation of certain foreign balances is restricted by local laws and could have adverse tax consequences if we were to move the cash to another country. As of December 31, 2019, we held $78.4 million of our total $108.3 million in cash in international locations. This cash is primarily used for the ongoing operations of the business in the locations in which the cash is held. None of the $78.4 million could potentially be restricted. If the $78.4 million were to be immediately repatriated to the U.S., no additional U.S. federal income tax expense would be incurred.
Senior Revolving Credit Facility
In July 2019, Crocs, Inc. and certain of its subsidiaries (the “Borrowers”) entered into a Second Amended and Restated Credit Agreement (as amended, the “Credit Agreement”), with the lenders named therein and PNC Bank, National Association, as a lender and administrative agent for the lenders, which provides for a revolving credit facility of $450.0 million, which can be increased by an additional $150.0 million subject to certain conditions (the “Facility”). Borrowings under the Credit Agreement bear interest at a variable rate based on a domestic base rate, defined as the highest of (i) the Federal Funds open rate, plus 0.25%, (ii) the Prime Rate, and (iii) the Daily LIBOR rate, plus 1%, or at a LIBOR rate, plus an applicable margin ranging from 1.00% to 1.875% based on our leverage ratio. Borrowings under the Credit Agreement are secured by all of the assets of the Borrowers, and guaranteed by certain other subsidiaries of the Borrowers. As of December 31, 2019, we were in compliance with all financial covenants under the Credit Agreement.
As of December 31, 2019, the total commitments available from the lenders under the Facility were $450.0 million. At December 31, 2019, we had $205.0 million in outstanding borrowings, which are due when the Facility matures in July 2024,
and $4.6 million in outstanding letters of credit under the Facility, which reduces amounts available for borrowing under the Facility. As of December 31, 2019 and 2018, we had $240.4 million and $129.4 million, respectively, of available borrowing capacity under the Facility.
Consolidated Statements of Cash Flows
Our consolidated statements of cash flows are summarized as follows:
| | | | | | | | | | | | | | | | | | | | | |
| Year Ended December 31, | | | | | | $ Change 2019-2018 | | |
| | 2019 | | 2018 | | | | | | |
| | (in thousands) | | | | | | | | |
| Cash provided by operating activities | $ | 89,958 | | | $ | 114,162 | | | | | $ | (24,204) | | | |
| Cash used in investing activities | (36,236) | | | (10,110) | | | | | (26,126) | | | |
| Cash used in financing activities | (68,638) | | | (148,802) | | | | | 80,164 | | | |
Effect of exchange rate changes on cash, cash equivalents, and restricted cash | (569) | | | (4,775) | | | | | 4,206 | | | |
| Net change in cash, cash equivalents, and restricted cash | $ | (15,485) | | | $ | (49,525) | | | | | $ | 34,040 | | | |
Operating Activities. Our primary source of liquidity is cash provided by operating activities, consisting of net income adjusted for non-cash items and changes in working capital. Cash provided by operating activities decreased $24.2 million for the year ended December 31, 2019 compared to the year ended December 31, 2018. This change was in part driven by higher net income adjusted for non-cash items of $99.1 million, offset by changes in operating assets and liabilities of $123.3 million. The change in operating assets and liabilities was primarily a result of higher inventories associated with higher revenues, higher prepaid expenses, in part related to celebrity endorsement agreements and certain information technology expenditures, and changes in income taxes.
Investing Activities. The $26.1 million increase in cash used in investing activities for the year ended December 31, 2019 compared to the year ended December 31, 2018 is primarily due to higher net capital asset expenditures related to the opening of our new distribution center in Dayton, Ohio.
Financing Activities. The $80.2 million decrease in cash used in financing activities for the year ended December 31, 2019 compared to the year ended December 31, 2018 resulted primarily from the net impact of the 2018 repurchase of outstanding Series A Preferred for $183.7 million, the related inducement payment of $12.0 million, and the reduction in cash dividends paid on Series A Preferred of $9.0 million, all of which were partially offset by the $3.0 million final inducement payment made in 2019. These decreases in cash used were partially offset by a $84.1 million increase in repurchases of our common stock, as detailed below, and a $34.3 million reduction in net borrowings against the Facility. There were other uses of cash in financing activities of $3.1 million, primarily due to costs associated with amending the Credit Agreement and other fees.
Stock Repurchases
On February 20, 2018, the Board of Directors approved and authorized a program to repurchase up to $500.0 million of our common stock, and on May 5, 2019, the Board approved an increase to the repurchase authorization of an additional $500.0 million of our common stock. The number, price, structure, and timing of the repurchases are at our sole discretion and may be made depending on market conditions, liquidity needs, restrictions under our revolving credit facility, and other factors. The Board of Directors may suspend, modify, or terminate the program at any time without prior notice. Share repurchases may be made in the open market or in privately negotiated transactions. The repurchase authorization does not have an expiration date and does not obligate us to acquire any amount of our common stock.
We repurchased 6.1 million shares of our common stock at a cost of $147.2 million, including commissions, and 3.6 million shares of our common stock at a cost of $63.1 million, including commissions, during the years ended December 31, 2019 and 2018, respectively. See Note 10 — Equity in the accompanying notes to the consolidated financial statements included in Part II - Item 8. Financial Statements and Supplementary Data of this Annual Report on Form 10-K for more information on our repurchases and repurchase authorizations.
Series A Convertible Preferred Stock Repurchase
On December 5, 2018, pursuant to the terms of a Share Repurchase Agreement among us and holders of the Series A Preferred (i) we repurchased from the holders of the Series A Preferred, 100,000 shares of Series A Preferred with a carrying value of
$100.0 million for an aggregate cash payment of $183.7 million, (ii) the holders of the Series A Preferred converted the remaining 100,000 shares of Series A Preferred that they owned into 6,896,548 shares of common stock, and (iii) we paid to the holders of the Series A Preferred an aggregate cash payment of $15.0 million to induce conversion, of which $12.0 million was paid at closing, with the remaining $3.0 million paid in January 2019.
Off-Balance Sheet Arrangements
We had no material off-balance sheet arrangements as of December 31, 2019, other than certain purchase commitments, which are described in Note 15 — Commitments and Contingencies in the accompanying notes to the consolidated financial statements included in Part II - Item 8. Financial Statements and Supplementary Data of this Annual Report on Form 10-K.
Contractual Obligations
The following table summarizes aggregate information about our significant contractual cash obligations as of December 31, 2019:
| | | | | | | | | | | | | | | | | | | | | | | | | | | | | |
| | Total | | Less than
1 Year | | 1 - 3 Years | | 3 - 5 Years | | More than
5 Years |
| | (in thousands) | | | | | | | | |
Operating lease obligations (1) | $ | 220,346 | | | $ | 52,434 | | | $ | 80,745 | | | $ | 38,171 | | | $ | 48,996 | |
Inventory purchase obligations with third-party manufacturers (2) | 155,513 | | | 155,513 | | | — | | | — | | | — | |
Other contracts (3) | 79,707 | | | 19,714 | | | 22,410 | | | 11,864 | | | 25,719 | |
Minimum licensing royalties (4) | 914 | | | 879 | | | 35 | | | — | | | — | |
Debt obligations (5) | 205,000 | | | — | | | — | | | 205,000 | | | — | |
Interest on debt obligations (6) | 30,851 | | | 6,765 | | | 13,494 | | | 10,592 | | | — | |
| Total | $ | 692,331 | | | $ | 235,305 | | | $ | 116,684 | | | $ | 265,627 | | | $ | 74,715 | |
(1) Our operating lease obligations consist of leases for real estate, which includes retail, warehouse, distribution center, and office spaces, expiring at various dates through 2033. This balance represents the minimum cash commitment under contract to various third parties for operating lease obligations.
(2) Our inventory purchase obligations with third-party manufacturers consist of open purchase orders for footwear products and include an immaterial amount of purchase commitments with certain third-party manufacturers for yet-to-be-received finished product where title passes to us upon receipt. All purchase obligations with third-party manufacturers are expected to be paid within one year.
(3) Other contracts include $20.4 million of future lease commitments and $4.7 million of net other commitments related to our new corporate headquarters in Broomfield, Colorado and $24.6 million of future lease commitments related to our new distribution center in Dordrecht, the Netherlands.
(4) Our minimum licensing royalties consist of usage-based payments for the right to use various licenses, trademarks and copyrights in the production of our footwear and accessories. Royalty obligations are based on minimum guarantees under contract; however, may include additional royalty obligations based on sales volume that are not determinable for future periods.
(5) Our debt obligations consist of long-term borrowings on our Facility, maturing in July 2024.
(6) Future interest payment obligations, which are estimated by assuming the amounts outstanding under our Facility and the interest rates in effect as of December 31, 2019, will remain constant into the future. This is only an estimate, as actual amounts borrowed and rates will vary over time, based on a domestic base rate or LIBOR rate, as described in the “Senior Revolving Credit Facility” section.
Excluded from the table above is a $4.2 million liability for unrecognized tax benefits as of December 31, 2019, as we cannot make a reliable estimate of the period in which the liability will be settled, if ever.
Critical Accounting Policies and Estimates
General
Our discussion and analysis of financial condition and results of operations, outside of discussions regarding constant currency and non-GAAP financial measures, is based on the consolidated financial statements, which have been prepared in accordance with GAAP. The preparation of these financial statements requires us to make estimates and judgments that affect the reported amounts of assets, liabilities, and contingencies as of the date of the financial statements and the reported amounts of revenues and expenses during the reporting periods. We evaluate our assumptions and estimates on an on-going basis.
An accounting policy is considered to be critical if it is important to our results of operations, financial condition, and cash flows, and requires significant judgment and estimates on the part of management in its application. Our estimates are often
based on historical experience, complex judgments, assessments of probability, and assumptions that management believes to be reasonable, but that are inherently uncertain and unpredictable. We believe that the following discussion represents those accounting policies that are the most critical to the reporting of our financial condition and results of operations. For a discussion of our significant accounting policies, see Note 1 — Basis of Presentation and Summary of Significant Accounting Policies in the accompanying notes to the consolidated financial statements included in Part II - Item 8. Financial Statements and Supplementary Data of this Annual Report on Form 10-K.
Reserves for Uncollectible Accounts Receivable, Sales Returns, Allowances, Discounts, and Rebates
We make ongoing estimates related to the collectability of our accounts receivable and maintain a reserve for estimated losses resulting from the inability or unwillingness of our customers to make required payments. Our estimates are based on a variety of factors, including the length of time receivables are past due, economic trends and conditions affecting our customer base, significant non-recurring events, and historical write-off experience. Specific provisions are recorded for individual receivables when we become aware of a customer’s inability or unwillingness to meet its financial obligations. Because we cannot predict future changes in the financial stability of our customers, actual future losses from uncollectible accounts may differ from our estimates and we may experience changes in the amount of reserves we recognize for accounts receivable that we deem uncollectible. If the financial condition of our customers were to deteriorate, resulting in their inability to make payments, a larger reserve might be required. In the event we determine that a smaller or larger reserve is appropriate, we would record a credit or a charge, respectively, to ‘Selling, general and administrative expenses’ in our consolidated statement of operations in the period in which we made such a determination.
Additionally, a significant area of judgment affecting reported revenues and net income involves estimating reserves for sales returns, allowances, discounts, and rebates, which represent the portion of revenues not expected to be realized. Wholesale revenues are reduced by estimates of returns, allowances, discounts, contractual discounts to major customers, and rebates. We also may accept returns from our wholesale customers, on an exception basis, to ensure that our products are merchandised in the proper assortments, and may provide markdown allowances at our sole discretion to key wholesalers and distributors to facilitate sales of slower moving products. Further, we record reductions to revenues for estimated customer credits as a result of price markdowns in certain markets. Revenues in our retail and e-commerce channels are also reduced by an estimate of returns.
Our estimated sales returns and allowances are based on customer return history and actual outstanding returns yet to be received. Changes to our estimates for customer returns, allowances, discounts, and rebates may be caused by many factors, including, but not limited to whether customers accept our new styles, customer inventory levels, shipping delays or errors, known or suspected product defects, the seasonal nature of our products, and macroeconomic factors affecting our customers. Historically, actual amounts of customer returns, allowances, discounts, and rebates have not differed significantly from our estimates. A hypothetical 1% increase in our reserves for returns, allowances, discounts, and rebates as of December 31, 2019 would have decreased our 2019 revenues by approximately $0.1 million.
See Schedule II in Part IV - Item 15. Exhibits, Financial Statement Schedule to the accompanying consolidated financial statements for an analysis of the activity in our reserves for uncollectible accounts receivable, sales returns, allowances, and discounts.
Impairment of Long-Lived Assets
Property and equipment along with other long-lived assets are evaluated for impairment periodically whenever events or changes in circumstances indicate that their carrying values may not be fully recoverable. Testing of long-lived assets for impairment is at the level of an asset group, which is the lowest level for which identifiable cash flows are largely independent of the cash flows of other assets and liabilities. In our retail business, the asset group for impairment testing is each individual retail store. In evaluating long-lived assets for recoverability, we use our best estimate of future cash flows expected to result from the use of the asset and its eventual disposition, where applicable. To the extent that estimated future undiscounted net cash flows attributable to the asset are less than its carrying value, an impairment loss is recognized equal to the difference between the carrying value of such asset and its fair value. Assets to be disposed of and for which there is a committed plan of disposal are reported at the lower of carrying value or fair value, less costs to sell.
In determining future cash flows, we take various factors into account, including the remaining useful life of each asset group, forecasted growth rates, pricing, working capital, capital expenditures, and other cash needs specific to the asset group. Additional considerations when assessing impairment include changes in our strategic operational and financial decisions, global and regional economic conditions, demand for our product and other corporate initiatives which may eliminate or
significantly decrease the realization of future benefits from our long-lived assets. Since the determination of future cash flows is an estimate of future performance, future impairments may arise in the event that future cash flows do not meet expectations.
During 2019, we did not record any impairment charges. During 2018, and 2017, we recorded non-cash impairment of $2.2 million and $5.3 million, respectively, to reduce the net carrying value of certain long-lived assets to their estimated fair values, including $1.3 million to reduce the carrying values of certain supply chain assets related to the closure of our Mexico and Italy manufacturing and distribution facilities in 2018 and $4.8 million write-off for a discontinued project in 2017. During 2018 and 2017, we recorded non-cash impairment of $0.9 million and $0.5 million, respectively, related to underperforming company-operated retail stores. See Note 3 — Property and Equipment, Net in the accompanying notes to the consolidated financial statements included in Part II - Item 8. Financial Statements and Supplementary Data of this Annual Report on Form 10-K for further information related to long-lived asset impairments.
Income Taxes
As a result of the Tax Act, we recorded provisional estimates in accordance with GAAP, during 2017 in relation to the revaluation of our net deferred tax assets at the lower U.S. corporate income tax rate and the additional tax expense associated with the deemed repatriation tax. During the year ended December 31, 2018, we recorded measurement period adjustments related to the provisional estimates. We have not changed our indefinite reinvestment assertion, and we have elected to account for the impact of global intangible low tax income (“GILTI”) based on the period cost method. While we consider our accounting for the Tax Act to be complete, we continue to evaluate new guidance and legislation as it is issued.
We account for income taxes using the asset and liability method, which requires the recognition of deferred tax assets and liabilities for the expected future tax consequences of temporary differences between the carrying amounts and the tax bases of other assets and liabilities. We provide for income taxes at the current and future enacted tax rates and laws applicable in each taxing jurisdiction. We account for the tax effects of GILTI as a component of income tax expense in the period the tax arises, to the extent applicable. We use a two-step approach for recognizing and measuring tax benefits taken or expected to be taken in a tax return and disclosures regarding uncertainties in income tax positions. The impact of an uncertain tax position that is more likely than not to be sustained upon examination by the relevant taxing authority must be recognized at the largest amount that is more likely than not to be sustained. No portion of an uncertain tax position will be recognized if the position has less than a 50% likelihood of being sustained. Interest expense is recognized on the full amount of deferred benefits for uncertain tax positions. While the validity of any tax position is a matter of tax law, the body of statutory, regulatory and interpretive guidance on the application of the law is complex and often ambiguous. We recognize interest and penalties related to unrecognized tax benefits within the ‘Income tax expense (benefit)’ line in the accompanying consolidated statements of operations. Accrued interest and penalties are included within the related tax liability line in the consolidated balance sheets.
We evaluate our ability to realize the tax benefits associated with deferred tax assets by analyzing our forecasted taxable income using both historical and projected future operating results, the reversal of existing temporary differences, taxable income in prior carry back years (if permitted) and the availability of tax planning strategies. A valuation allowance is required unless management determines that it is more likely than not that we will ultimately realize the tax benefit associated with a deferred tax asset. We determine on a regular basis the amount of undistributed earnings that will be indefinitely reinvested in our non-U.S. operations. This assessment is based on the cash flow projections and operational and fiscal objectives of each of our U.S. and foreign subsidiaries. Foreign withholding taxes have not been provided on cumulative undistributed foreign earnings of the non-U.S. subsidiaries as of December 31, 2019, which are considered to be indefinitely reinvested outside of the U.S.
See Note 13 — Income Taxes in the accompanying notes to the consolidated financial statements included in Part II - Item 8. Financial Statements and Supplementary Data of this Annual Report on Form 10-K for further information related to income taxes.
Recent Accounting Pronouncements
See Note 2 — Recent Accounting Pronouncements in the accompanying notes to the consolidated financial statements included in Part II - Item 8. Financial Statements and Supplementary Data of this Annual Report on Form 10-K for a description of recently adopted accounting pronouncements, and issued accounting pronouncements that we believe may have an impact on our consolidated financial statements when adopted.
ITEM 7A. Quantitative and Qualitative Disclosures About Market Risk
Interest Rate Risk
We centrally manage our debt and investment portfolios considering investment opportunities and risks, tax consequences, and overall financing strategies. Our exposure to market risk includes interest rate fluctuations in connection with our Facility and certain financial instruments.
Borrowings under our Facility bear interest at a variable rate based on a domestic base rate or a LIBOR rate, plus an applicable margin, and are therefore subject to risk based upon prevailing market interest rates. Interest rates fluctuate as a result of many factors, including governmental monetary and tax policies, domestic and international economic and political considerations, and other factors that are beyond our control. See the risk factor “Changes in the method for determining LIBOR and/or the potential replacement of LIBOR could adversely affect our results of operations”, included in Part I - Item 1A. Risk Factors for further information on risks related to our interest rate.
As of December 31, 2019, we had $205.0 million in outstanding borrowings and $4.6 million in outstanding letters of credit under our Facility. As of December 31, 2018, we had $120.0 million in outstanding borrowings and $0.6 million in outstanding letters of credit under our Facility.
A hypothetical increase of 1% in the interest rate on these borrowings would have increased interest expense by $2.1 million for the year ended December 31, 2019.
Foreign Currency Exchange Risk
Changes in exchange rates have a direct effect on our reported USD consolidated financial statements because we translate the operating results and financial position of our international subsidiaries to USD using current period exchange rates. Specifically, we translate the statements of operations of our foreign subsidiaries into the USD reporting currency using exchange rates in effect during each reporting period. As a result, comparisons of reported results between reporting periods may be impacted significantly due to differences in the exchange rates in effect at the time such exchange rates are used to translate the operating results of our international subsidiaries.
An increase of 1% of the value of the USD relative to foreign currencies would have decreased our income before taxes during the year ended December 31, 2019 by approximately $0.8 million, excluding the impact on our purchasing power. The volatility of the exchange rates is dependent on many factors that cannot be forecasted with reliable accuracy.
We enter into forward foreign exchange contracts to buy or sell various foreign currencies to selectively protect against volatility in the value of non-functional currency denominated monetary assets and liabilities. Changes in the fair value of these forward contracts are recognized in earnings in the period that the changes occur. As of December 31, 2019, the USD notional value of our outstanding foreign currency forward exchange contracts was approximately $134.3 million. The net fair value of these contracts at December 31, 2019 was an asset of $0.1 million. See Part I - Item 1A. Risk Factors of this Annual Report on Form 10-K for a discussion of risks to our business and financial results associated with foreign currencies.
We perform a sensitivity analysis to determine the effects that market risk exposures may have on the fair values of our foreign currency forward exchange contracts. To perform the sensitivity analysis, we assess the risk of changes in fair values from the effect of hypothetical changes in foreign currency exchange rates. This analysis assumes a like movement by the foreign currencies in our hedge portfolio against the U.S. Dollar. As of December 31, 2019, a 10% appreciation in the value of the USD would result in a net decrease in the fair value of our derivative portfolio of approximately $3.1 million.
See Part II - Item 7. Management’s Discussion and Analysis of Financial Condition and Results of Operations of this Annual Report on Form 10-K for a discussion of the impact of the change in foreign exchange rates on our USD consolidated statement of operations for the years ended December 31, 2019 and 2018.
ITEM 8. Financial Statements and Supplementary Data
The consolidated financial statements and supplementary data are as set forth in the index to consolidated financial statements on page F-1.
ITEM 9. Changes in and Disagreements with Accountants on Accounting and Financial Disclosure
None.
ITEM 9A. Controls and Procedures
Evaluation of Disclosure Controls and Procedures
Under the supervision and with the participation of our management, including our Chief Executive Officer and Chief Financial Officer, we conducted an evaluation (pursuant to Rule 13a-15(b) of the Exchange Act) of our disclosure controls and procedures (as defined under Rule 13a-15(e) under the Exchange Act). Based on this evaluation, our Chief Executive Officer and Chief Financial Officer concluded that our disclosure controls and procedures were effective as of December 31, 2019, to provide reasonable assurance that information required to be disclosed in our reports under the Exchange Act is recorded, processed, summarized and reported within the time periods specified in the SEC rules and forms and that such information is accumulated and communicated to our management, including our Chief Executive Officer and Chief Financial Officer, as appropriate, to allow timely decisions regarding required disclosure. Management necessarily applies its judgment in assessing the costs and benefits of such controls and procedures that, by their nature, can only provide reasonable assurance regarding management’s control objectives.
Management’s Annual Report on Internal Control over Financial Reporting
Our management is responsible for establishing and maintaining effective internal control over financial reporting as such term is defined in Exchange Act Rule 13a-15(f). Our internal control over financial reporting is a process designed to provide reasonable assurance regarding the reliability of financial reporting and the preparation of financial statements for external purposes in accordance with U.S. generally accepted accounting principles. A company’s internal control over financial reporting includes those policies and procedures that (i) pertain to the maintenance of records that, in reasonable detail, accurately and fairly reflect the transactions and dispositions of the assets of the company; (ii) provide reasonable assurance that transactions are recorded as necessary to permit preparation of financial statements in accordance with generally accepted accounting principles, and that receipts and expenditures of the company are being made only in accordance with authorizations of management and directors of the company; and (iii) provide reasonable assurance regarding prevention or timely detection of unauthorized acquisition, use, or disposition of the company’s assets that could have a material effect on the financial statements.
Because of the inherent limitations, internal control over financial reporting may not prevent or detect misstatements. Also, projections of any evaluation of effectiveness to future periods are subject to the risk that controls may become ineffective due to changes in conditions, or that the degree of compliance with the policies or procedures may deteriorate. Our Chief Executive Officer and Chief Financial Officer, with assistance from other members of management, assessed the effectiveness of our internal control over financial reporting as of December 31, 2019, based on the framework and criteria established in Internal Control—Integrated Framework (2013) issued by the Committee of Sponsoring Organizations of the Treadway Commission. Based on its evaluation, management has concluded that our internal control over financial reporting was effective as of December 31, 2019.
Our independent registered public accounting firm has audited the effectiveness of our internal control over financial reporting as of December 31, 2019, as stated in their report, which appears herein.
Changes in Internal Control Over Financial Reporting
There has been no change in our internal control over financial reporting (as such term is defined in Rules 13a through 15(f) and 15(d) through 15(f) under the Exchange Act) that occurred during the three months ended December 31, 2019, that has materially affected, or is reasonably likely to materially affect, our internal control over financial reporting.
REPORT OF INDEPENDENT REGISTERED PUBLIC ACCOUNTING FIRM
To the stockholders and the Board of Directors of Crocs, Inc.
Opinion on Internal Control over Financial Reporting
We have audited the internal control over financial reporting of Crocs, Inc. and subsidiaries (the “Company”) as of December 31, 2019, based on criteria established in Internal Control — Integrated Framework (2013) issued by the Committee of Sponsoring Organizations of the Treadway Commission (COSO). In our opinion, the Company maintained, in all material respects, effective internal control over financial reporting as of December 31, 2019, based on criteria established in Internal Control — Integrated Framework (2013) issued by COSO.
We have also audited, in accordance with the standards of the Public Company Accounting Oversight Board (United States) (PCAOB), the consolidated financial statements as of and for the year ended December 31, 2019, of the Company and our report dated February 27, 2020, expressed an unqualified opinion on those financial statements and included an explanatory paragraph regarding the Company’s adoption of a new accounting standard.
Basis for Opinion
The Company’s management is responsible for maintaining effective internal control over financial reporting and for its assessment of the effectiveness of internal control over financial reporting, included in the accompanying “Management’s Annual Report on Internal Control over Financial Reporting.” Our responsibility is to express an opinion on the Company’s internal control over financial reporting based on our audit. We are a public accounting firm registered with the PCAOB and are required to be independent with respect to the Company in accordance with the U.S. federal securities laws and the applicable rules and regulations of the Securities and Exchange Commission and the PCAOB.
We conducted our audit in accordance with the standards of the PCAOB. Those standards require that we plan and perform the audit to obtain reasonable assurance about whether effective internal control over financial reporting was maintained in all material respects. Our audit included obtaining an understanding of internal control over financial reporting, assessing the risk that a material weakness exists, testing and evaluating the design and operating effectiveness of internal control based on the assessed risk, and performing such other procedures as we considered necessary in the circumstances. We believe that our audit provides a reasonable basis for our opinion.
Definition and Limitations of Internal Control over Financial Reporting
A company’s internal control over financial reporting is a process designed to provide reasonable assurance regarding the reliability of financial reporting and the preparation of financial statements for external purposes in accordance with generally accepted accounting principles. A company’s internal control over financial reporting includes those policies and procedures that (1) pertain to the maintenance of records that, in reasonable detail, accurately and fairly reflect the transactions and dispositions of the assets of the company; (2) provide reasonable assurance that transactions are recorded as necessary to permit preparation of financial statements in accordance with generally accepted accounting principles, and that receipts and expenditures of the company are being made only in accordance with authorizations of management and directors of the company; and (3) provide reasonable assurance regarding prevention or timely detection of unauthorized acquisition, use, or disposition of the company’s assets that could have a material effect on the financial statements.
Because of its inherent limitations, internal control over financial reporting may not prevent or detect misstatements. Also, projections of any evaluation of effectiveness to future periods are subject to the risk that controls may become inadequate because of changes in conditions, or that the degree of compliance with the policies or procedures may deteriorate.
/s/ Deloitte & Touche LLP
Denver, Colorado
February 27, 2020
ITEM 9B. Other Information
None.
PART III
ITEM 10. Directors, Executive Officers and Corporate Governance
The information required by this item is incorporated herein by reference to our definitive proxy statement for the 2020 Annual Meeting of Stockholders to be filed with the SEC within 120 days after December 31, 2019.
Code of Ethics
We have a written code of ethics in place that applies to all our employees, including our principal executive officer and principal financial officer. A copy of our code of ethics is available on our website: www.crocs.com. We are required to disclose certain changes to, or waivers from, that code for our senior financial officers. We intend to use our website as a method of disseminating any change to, or waiver from, our code of ethics as permitted by applicable SEC rules.
ITEM 11. Executive Compensation
The information required by this item is incorporated herein by reference to our definitive proxy statement for the 2020 Annual Meeting of Stockholders to be filed with the SEC within 120 days after December 31, 2019.
ITEM 12. Security Ownership of Certain Beneficial Owners and Management and Related Stockholder Matters
The information required by this item is incorporated herein by reference to our definitive proxy statement for the 2020 Annual Meeting of Stockholders to be filed with the SEC within 120 days after December 31, 2019, with the exception of those items listed below.
Securities Authorized for Issuance under Equity Compensation Plans
As shown in the table below, we reserved 2.0 million shares of common stock for future issuance pursuant to exercise of outstanding awards under equity compensation plans as of December 31, 2019.
| | | | | | | | | | | | | | | | | |
| Plan Category | Number of Securities to be Issued on Exercise of Outstanding Options, Warrants, and Rights (1) | | Weighted Average Exercise Price of Outstanding Options, Warrants, and Rights (2) | | Number of Securities
Remaining Available
for Future
Issuance Under
Plans, Excluding
Securities Available
in First Column |
Equity compensation plans approved by stockholders (3) | 2,003,022 | | | $ | 10.45 | | | 2,359,145 | |
Equity compensation plans not approved by stockholders | — | | | — | | | — | |
| Total | 2,003,022 | | | $ | 10.45 | | | 2,359,145 | |
(1) The number of shares outstanding includes restricted stock awards and restricted stock units that were outstanding on December 31, 2019 and assumes target performance for performance-based equity awards.
(2) The weighted average exercise price of outstanding options pertains to 0.3 million shares issuable on the exercise of outstanding options.
(3) On June 8, 2015, our stockholders approved the Crocs, Inc. 2015 Equity Incentive Plan (the “Plan”). The number of shares available for issuance under the Plan (subject to changes in capitalization) as of its date of adoption consisted of (i) 7.0 million newly available shares; (ii) 1.2 million shares available for issuance under the 2007 Plan as of June 8, 2015; and (iii) 2007 Plan shares associated with outstanding options or awards that are canceled or forfeited after June 8, 2015. The Plan provides for the grant of incentive and non-qualified stock options, stock appreciation rights, restricted stock, restricted stock units, performance units, and other share-based awards. The Plan became effective immediately upon stockholder approval.
ITEM 13. Certain Relationships and Related Transactions and Director Independence
The information required by this item is incorporated herein by reference to our definitive proxy statement for the 2020 Annual Meeting of Stockholders to be filed with the SEC within 120 days after December 31, 2019.
ITEM 14. Principal Accounting Fees and Services
The information required by this item is incorporated herein by reference to our definitive proxy statement for the 2020 Annual Meeting of Stockholders to be filed with the SEC within 120 days after December 31, 2019.
PART IV
ITEM 15. Exhibits, Financial Statement Schedule
(1) Financial Statements
The financial statements filed as part of this report are listed on the index to the consolidated financial statements on page F-1.
(2) Financial Statement Schedule
The following consolidated financial statement schedule of Crocs Inc. and its subsidiaries is filed as a part of this report:
•Schedule II - Valuation and Qualifying Accounts.
Schedules other than the one listed above are omitted either because they are not required or are inapplicable, or because the information is included in the consolidated financial statements or related notes.
(3) Exhibit list
| | | | | | | | |
Exhibit
Number | | Description |
| 3.1 | | | |
| | |
| 3.2 | | | |
| | |
| 3.3 | | | |
| | |
| 3.4 | | | |
| | |
| 4.1 | | | |
| | |
| 4.2 | | † | |
| | |
| 10.1 | | * | |
| | |
| 10.2 | | * | |
| | |
| 10.3 | | * | |
| | |
| 10.4 | | * | |
| | |
| 10.5 | | * | |
| | |
| 10.6 | | * | |
| | |
| 10.7 | | * | |
| | |
| 10.8 | | * | |
| | |
| 10.9 | | * | |
| | |
| 10.10 | | | Second Amended and Restated Credit Agreement, dated July 26, 2019, by and among Crocs, Inc., Crocs Retail, LLC, Jibbitz, LLC, Colorado Footwear C.V., Crocs Europe B.V., the lenders named therein, PNC Capital Markets LLC, as sole bookrunner, cosyndication agent and joint lead arranger, Citibank, N.A., Bank of America, N.A. and KeyBank National Association, each as joint lead arranger and co-syndication agent, and PNC Bank, National Association, as a lender and administrative agent (incorporated herein by reference to Exhibit 10.1 to Crocs, Inc.’s Quarterly Report on Form 10-Q, filed August 1, 2019). |
| | |
| 10.11 | | * | |
| | | | | | | | |
Exhibit
Number | | Description |
| 10.12 | | * | |
| | |
| 10.13 | | * | |
| | |
| 10.14 | | * | |
| | |
| 10.15 | | * | |
| | |
| 21 | | † | |
| | |
| 23.1 | | † | |
| | |
| 31.1 | | † | |
| | |
| 31.2 | | † | |
| | |
| 32 | | + | |
| | |
| 101.INS | | † | XBRL Instance Document - the instance document does not appear in the Interactive Data File because its XBRL tags are embedded within the Inline XBRL document. |
| | |
| 101.SCH | | † | XBRL Taxonomy Extension Schema Document |
| | |
| 101.CAL | | † | XBRL Taxonomy Extension Calculation Linkbase Document |
| | |
| 101.DEF | | † | XBRL Taxonomy Extension Definition Linkbase Document |
| | |
| 101.LAB | | † | XBRL Taxonomy Extension Label Linkbase Document |
| | |
| 101.PRE | | † | XBRL Taxonomy Extension Presentation Linkbase Document |
| | |
| 104 | | Cover Page Interactive Data File (embedded within the Inline XBRL document and contained in Exhibit 101). |
* Compensatory plan or arrangement.
† Filed herewith.
+ Furnished herewith.
Item 16. Form 10–K Summary.
None.
SIGNATURES
Pursuant to the requirements of Section 13 or 15(d) of the Securities Exchange Act of 1934, the registrant has duly caused this report to be signed on its behalf by the undersigned, thereunto duly authorized, as of February 27, 2020.
| | | | | | | | | | | |
| | CROCS, INC.
a Delaware Corporation | | |
| | By: | /s/ ANDREW REES | |
| | | Name: | Andrew Rees |
| | | Title: | President and Chief Executive Officer |
| | | |
Pursuant to the requirements of the Securities Exchange Act of 1934, this report has been signed below by the following persons on behalf of the registrant and in the capacities and on the dates indicated.
| | | | | | | | | | | | | | |
| Signature | | Title | | Date |
| | | | | |
| /s/ ANDREW REES | | President, Chief Executive Officer, and Director (Principal Executive Officer) | | February 27, 2020 |
| Andrew Rees | | | | |
| | | | |
| /s/ ANNE MEHLMAN | | Executive Vice President and Chief Financial Officer (Principal Financial and Accounting Officer) | | February 27, 2020 |
| Anne Mehlman | | | | |
| | | | |
| /s/ THOMAS J. SMACH | | Chairman of the Board | | February 27, 2020 |
| Thomas J. Smach | | | | |
| | | | |
| /s/ IAN M. BICKLEY | | Director | | February 27, 2020 |
| Ian M. Bickley | | | | |
| | | | |
| /s/ RONALD L. FRASCH | | Director | | February 27, 2020 |
| Ronald L. Frasch | | | | |
| | | | |
| /s/ WILLIAM GRAY | | Director | | February 27, 2020 |
| William Gray | | | | |
| | | | |
| /s/ BETH J. KAPLAN | | Director | | February 27, 2020 |
| Beth J. Kaplan | | | | |
| | | | |
| /s/ PRAKASH A. MELWANI | | Director | | February 27, 2020 |
| Prakash A. Melwani | | | | |
| | | | |
| /s/ DOUGLAS J. TREFF | | Director | | February 27, 2020 |
| Douglas J. Treff | | | | |
| | | | |
| /s/ DOREEN A. WRIGHT | | Director | | February 27, 2020 |
| Doreen A. Wright | | | | |
| | | | |
INDEX TO THE CONSOLIDATED FINANCIAL STATEMENTS
| | | | | |
| Financial Statements: | |
| Report of Independent Registered Public Accounting Firm | |
Consolidated Statements of Operations for the Years Ended December 31, 2019, 2018, and 2017 | |
Consolidated Statements of Comprehensive Income for the Years Ended December 31, 2019, 2018, and 2017 | |
Consolidated Balance Sheets as of December 31, 2019 and 2018 | |
Consolidated Statements of Stockholders’ Equity for the Years Ended December 31, 2019, 2018, and 2017 | |
Consolidated Statements of Cash Flows for the Years Ended December 31, 2019, 2018, and 2017 | |
| Notes to Consolidated Financial Statements | |
| Schedule II: Valuation and Qualifying Accounts | |
REPORT OF INDEPENDENT REGISTERED PUBLIC ACCOUNTING FIRM
To the stockholders and the Board of Directors of Crocs, Inc.
Opinion on the Consolidated Financial Statements
We have audited the accompanying consolidated balance sheets of Crocs, Inc. and subsidiaries (the “Company”) as of December 31, 2019 and 2018, the related consolidated statements of operations, comprehensive income, stockholders’ equity, and cash flows, for each of the three years in the period ended December 31, 2019, and the related notes and the schedule listed in the Index at Item 15 (collectively referred to as the “consolidated financial statements”). In our opinion, the consolidated financial statements present fairly, in all material respects, the financial position of the Company as of December 31, 2019 and 2018, and the results of its operations and its cash flows for each of the three years in the period ended December 31, 2019, in conformity with accounting principles generally accepted in the United States of America.
We have also audited, in accordance with the standards of the Public Company Accounting Oversight Board (United States) (PCAOB), the Company’s internal control over financial reporting as of December 31, 2019, based on criteria established in Internal Control - Integrated Framework (2013) issued by the Committee of Sponsoring Organizations of the Treadway Commission and our report dated February 27, 2020, expressed an unqualified opinion on the Company’s internal control over financial reporting.
Change in Accounting Principle
As discussed in Notes 2 and 6 to the consolidated financial statements, effective January 1, 2019, the Company adopted FASB ASC Topic 842, Leases, using the modified retrospective transition approach.
Basis for Opinion
These consolidated financial statements are the responsibility of the Company’s management. Our responsibility is to express an opinion on the Company’s consolidated financial statements based on our audits. We are a public accounting firm registered with the PCAOB and are required to be independent with respect to the Company in accordance with the U.S. federal securities laws and the applicable rules and regulations of the Securities and Exchange Commission and the PCAOB.
We conducted our audits in accordance with the standards of the PCAOB. Those standards require that we plan and perform the audit to obtain reasonable assurance about whether the consolidated financial statements are free of material misstatement, whether due to error or fraud. Our audits included performing procedures to assess the risks of material misstatement of the consolidated financial statements, whether due to error or fraud, and performing procedures that respond to those risks. Such procedures included examining, on a test basis, evidence regarding the amounts and disclosures in the consolidated financial statements. Our audits also included evaluating the accounting principles used and significant estimates made by management, as well as evaluating the overall presentation of the consolidated financial statements. We believe that our audits provide a reasonable basis for our opinion.
Critical Audit Matter
The critical audit matter communicated below is a matter arising from the current-period audit of the consolidated financial statements that was communicated or required to be communicated to the audit committee and that (1) relates to accounts or disclosures that are material to the consolidated financial statements and (2) involved our especially challenging, subjective, or complex judgments. The communication of critical audit matters does not alter in any way our opinion on the consolidated financial statements, taken as a whole, and we are not, by communicating the critical audit matter below, providing a separate opinion on the critical audit matter or on the accounts or disclosures to which it relates.
Income Taxes — Realizability of Deferred Tax Assets — Refer to Note 13 to the consolidated financial statements
Critical Audit Matter Description
The Company recognizes deferred income taxes for tax attributes and for differences between the financial statement and tax basis of assets and liabilities at enacted statutory tax rates in effect for the years in which the deferred tax liability or asset is expected to be settled or realized. A valuation allowance is provided to offset deferred tax assets if, based upon the available evidence, it is more likely than not that some or all of the deferred tax assets will not be realized. Future realization of deferred tax assets depends on the existence of sufficient taxable income of the appropriate character. Sources of taxable income
considered in the evaluation of deferred tax asset realization include future reversals of deferred tax assets and liabilities, expected future taxable income, taxable income in prior carryback years if permitted under the tax law, and tax planning strategies. Management has recorded valuation allowances for those deferred tax assets not expected to be realized. As the Company has achieved a sufficient history of sustained profitability, including taxable income in appropriate jurisdictions, a portion of the valuation allowance was reduced by $34.2 million during the year ended December 31, 2019. The Company maintains valuation allowances of $79.0 million as of December 31, 2019 for deferred tax assets not expected to be realized in the future.
We identified management’s determination that it is more likely than not that sufficient taxable income will be generated in the future to realize deferred tax assets as a critical audit matter because of the significant judgments and estimates management makes related to taxable income across multiple jurisdictions. This required a high degree of auditor judgment and an increased extent of effort, including the need to involve our income tax specialists, when performing audit procedures to evaluate the reasonableness of management’s estimates of taxable income.
How the Critical Audit Matter Was Addressed in the Audit
Our audit procedures related to the determination that it is more likely than not that certain of the Company’s deferred tax assets will be realized included the following, among others:
•We tested the effectiveness of controls over deferred tax assets, including management’s controls over the estimates of taxable income and the determination of whether it is more likely than not that the deferred tax assets will be realized.
•We evaluated the reasonableness of the methods, assumptions, and judgments used by management to determine whether a deferred tax asset would be realized in the future.
•With the assistance of our income tax specialists, we evaluated whether the sources of management’s estimated taxable income were of the appropriate character and sufficient to utilize the deferred tax assets under the relevant tax law.
•We evaluated management’s ability to accurately estimate taxable income by comparing actual results to management’s historical estimates and evaluating whether there have been any changes that would affect management’s ability to continue accurately estimating taxable income.
•We tested the reasonableness of management’s estimates of taxable income by comparing the estimates to:
–Expiration dates or carryforward periods of tax attributes.
–Available and intended tax planning strategies.
–Internal budgets.
–Internal communications to management and the Board of Directors.
–Forecasted information included in Company press releases as well as in analyst and industry reports for the Company and certain of its peer companies.
–Management’s history of carrying out its stated plans and its ability to carry out its plans considering contractual commitments, available financing, or debt covenants.
•We evaluated whether the estimates of future taxable income were consistent with evidence obtained in other areas of the audit.
/s/ Deloitte & Touche LLP
Denver, Colorado
February 27, 2020
We have served as the Company’s auditor since 2005.
CROCS, INC. AND SUBSIDIARIES
CONSOLIDATED STATEMENTS OF OPERATIONS
(in thousands, except per share data)
| | | | | | | | | | | | | | | | | |
| Year Ended December 31, | | | | |
| 2019 | | 2018 | | 2017 |
Revenues | $ | 1,230,593 | | | $ | 1,088,205 | | | $ | 1,023,513 | |
Cost of sales | 613,537 | | | 528,051 | | | 506,292 | |
Gross profit | 617,056 | | | 560,154 | | | 517,221 | |
Selling, general and administrative expenses | 488,407 | | | 495,028 | | | 494,601 | |
Asset impairments | — | | | 2,182 | | | 5,284 | |
Income from operations | 128,649 | | | 62,944 | | | 17,336 | |
Foreign currency gains (losses), net | (1,323) | | | 1,318 | | | 563 | |
Interest income | 601 | | | 1,281 | | | 870 | |
Interest expense | (8,636) | | | (955) | | | (869) | |
Other income, net | 31 | | | 569 | | | 280 | |
Income before income taxes | 119,322 | | | 65,157 | | | 18,180 | |
Income tax expense (benefit) | (175) | | | 14,720 | | | 7,942 | |
Net income | 119,497 | | | 50,437 | | | 10,238 | |
Dividends on Series A convertible preferred stock (1) | — | | | (108,224) | | | (12,000) | |
Dividend equivalents on Series A convertible preferred stock related to redemption value accretion and beneficial conversion feature (1) | — | | | (11,429) | | | (3,532) | |
Net income (loss) attributable to common stockholders | $ | 119,497 | | | $ | (69,216) | | | $ | (5,294) | |
Net income (loss) per common share: | | | | | |
Basic | $ | 1.70 | | | $ | (1.01) | | | $ | (0.07) | |
Diluted | $ | 1.66 | | | $ | (1.01) | | | $ | (0.07) | |
Weighted average common shares outstanding: | | | | | |
Basic | 70,357 | | | 68,421 | | | 72,255 | |
Diluted | 71,771 | | | 68,421 | | | 72,255 | |
(1) On December 5, 2018, all issued and outstanding shares of Series A Convertible Preferred Stock were repurchased in exchange for cash or converted to common stock. As a result, amounts reported for the year ended December 31, 2018, include amounts resulting from the repurchase and conversion, in addition to dividends, payments to induce conversion, and accretion of dividend equivalents prior to December 5, 2018.
The accompanying notes are an integral part of these consolidated financial statements.
CROCS, INC. AND SUBSIDIARIES
CONSOLIDATED STATEMENTS OF COMPREHENSIVE INCOME
(in thousands)
| | | | | | | | | | | | | | | | | |
| | Year Ended December 31, | | | | |
| | 2019 | | 2018 | | 2017 |
Net income | $ | 119,497 | | | $ | 50,437 | | | $ | 10,238 | |
Other comprehensive income: | | | | | |
Foreign currency gains (losses), net | (3,659) | | | (6,846) | | | 12,202 | |
Reclassification of foreign currency translation loss to income (1) | (68) | | | (4,412) | | | — | |
Total comprehensive income | $ | 115,770 | | | $ | 39,179 | | | $ | 22,440 | |
(1) Represents the reclassification of cumulative foreign currency translation adjustment upon liquidation of foreign subsidiaries during the year ended December 31, 2019 and upon closure of manufacturing operations during the year ended December 31, 2018, both of which are presented within ‘Selling, general and administrative expenses’ in the consolidated statements of operations.
The accompanying notes are an integral part of these consolidated financial statements.
CROCS, INC. AND SUBSIDIARIES
CONSOLIDATED BALANCE SHEETS
(in thousands, except share and par value amounts)
| | | | | | | | | | | |
| December 31, | | |
| 2019 | | 2018 |
ASSETS | | | |
Current assets: | | | |
Cash and cash equivalents | $ | 108,253 | | | $ | 123,367 | |
Accounts receivable, net of allowances of $18,797 and $20,477, respectively | 108,199 | | | 97,627 | |
Inventories | 172,028 | | | 124,491 | |
Income taxes receivable | 1,341 | | | 3,041 | |
Other receivables | 8,711 | | | 7,703 | |
Restricted cash — current | 1,500 | | | 1,946 | |
Prepaid expenses and other assets | 25,350 | | | 22,123 | |
Total current assets | 425,382 | | | 380,298 | |
Property and equipment, net | 47,405 | | | 22,211 | |
Intangible assets, net | 47,095 | | | 45,690 | |
Goodwill | 1,578 | | | 1,614 | |
Deferred tax assets, net | 24,747 | | | 8,663 | |
Restricted cash | 2,292 | | | 2,217 | |
Right-of-use assets | 182,228 | | | — | |
Other assets | 8,075 | | | 8,208 | |
Total assets | $ | 738,802 | | | $ | 468,901 | |
| | | |
LIABILITIES AND STOCKHOLDERS’ EQUITY | | | |
Current liabilities: | | | |
Accounts payable | $ | 95,754 | | | $ | 77,231 | |
Accrued expenses and other liabilities | 108,677 | | | 102,171 | |
Income taxes payable | 4,207 | | | 5,089 | |
| | | |
Current operating lease liabilities | 48,585 | | | — | |
Total current liabilities | 257,223 | | | 184,491 | |
Long-term income taxes payable | 4,522 | | | 4,656 | |
Long-term borrowings | 205,000 | | | 120,000 | |
Long-term operating lease liabilities | 140,148 | | | — | |
Other liabilities | 4 | | | 9,446 | |
Total liabilities | 606,897 | | | 318,593 | |
| Commitments and contingencies | | | |
Stockholders’ equity: | | | |
| | | |
Common stock, par value $0.001 per share, 104.0 million and 103.0 million issued, 68.2 million and 73.3 million shares outstanding, respectively | 104 | | | 103 | |
Treasury stock, at cost, 35.8 million and 29.7 million shares, respectively | (546,208) | | | (397,491) | |
Additional paid-in capital | 495,903 | | | 481,133 | |
Retained earnings | 240,485 | | | 121,215 | |
Accumulated other comprehensive loss | (58,379) | | | (54,652) | |
Total stockholders’ equity | 131,905 | | | 150,308 | |
Total liabilities and stockholders’ equity | $ | 738,802 | | | $ | 468,901 | |
The accompanying notes are an integral part of these consolidated financial statements.
CROCS, INC. AND SUBSIDIARIES
CONSOLIDATED STATEMENTS OF STOCKHOLDERS’ EQUITY
(in thousands)
| | | | | | | | | | | | | | | | | | | | | | | | | | | | | | | | | | | | | | | | | | | | | | | |
| | Common Stock | | | | Treasury Stock | | | | Additional
Paid-in
Capital | | Retained
Earnings | | Accumulated Other Comprehensive (Loss) | | Total
Stock-holders'
Equity |
| | Shares | | Amount | | Shares | | Amount | | | | | | | | |
Balance at December 31, 2016 | 73,600 | | | $ | 94 | | | 20,287 | | | $ | (284,237) | | | $ | 364,397 | | | $ | 195,725 | | | $ | (55,596) | | | $ | 220,383 | |
| Share-based compensation | — | | | — | | | — | | | — | | | 11,619 | | | — | | | — | | | 11,619 | |
Exercises of stock options and issuance of restricted stock awards | 850 | | | 1 | | | 41 | | | (75) | | | (2,971) | | | — | | | — | | | (3,045) | |
| Repurchases of common stock | (5,659) | | | — | | | 5,659 | | | (50,000) | | | — | | | — | | | — | | | (50,000) | |
| Series A preferred dividends | — | | | — | | | — | | | — | | | — | | | (12,000) | | | — | | | (12,000) | |
| Series A preferred accretion | — | | | — | | | — | | | — | | | — | | | (3,532) | | | — | | | (3,532) | |
Net income | — | | | — | | | — | | | — | | | — | | | 10,238 | | | — | | | 10,238 | |
Other comprehensive income | — | | | — | | | — | | | — | | | — | | | — | | | 12,202 | | | 12,202 | |
Balance at December 31, 2017 | 68,791 | | | $ | 95 | | | 25,987 | | | $ | (334,312) | | | $ | 373,045 | | | $ | 190,431 | | | $ | (43,394) | | | $ | 185,865 | |
| Share-based compensation | — | | | — | | | — | | | — | | | 13,732 | | | — | | | — | | | 13,732 | |
Exercises of stock options and issuance of restricted stock awards | 1,238 | | | 1 | | | 49 | | | (48) | | | (725) | | | — | | | — | | | (772) | |
| Repurchases of common stock | (3,620) | | | — | | | 3,620 | | | (63,131) | | | — | | | — | | | — | | | (63,131) | |
Series A preferred repurchase (1) | — | | | — | | | — | | | — | | | — | | | (84,224) | | | — | | | (84,224) | |
Series A preferred conversion (2) | 6,897 | | | 7 | | | — | | | — | | | 99,993 | | | — | | | — | | | 100,000 | |
Series A preferred dividends (3) | — | | | — | | | — | | | — | | | — | | | (24,000) | | | — | | | (24,000) | |
Series A preferred accretion, net (4) | — | | | — | | | — | | | — | | | (6,138) | | | (11,429) | | | — | | | (17,567) | |
Net income | — | | | — | | | — | | | — | | | — | | | 50,437 | | | — | | | 50,437 | |
Other comprehensive loss | — | | | — | | | — | | | — | | | — | | | — | | | (11,258) | | | (11,258) | |
| Other | — | | | — | | | — | | | — | | | 1,226 | | | — | | | — | | | 1,226 | |
Balance at December 31, 2018 | 73,306 | | | $ | 103 | | | 29,656 | | | $ | (397,491) | | | $ | 481,133 | | | $ | 121,215 | | | $ | (54,652) | | | $ | 150,308 | |
Adjustments to beginning retained earnings (5) | — | | | — | | | — | | | — | | | — | | | (227) | | | — | | | (227) | |
| Share-based compensation | — | | | — | | | — | | | — | | | 14,412 | | | — | | | — | | | 14,412 | |
Exercises of stock options and issuance of restricted stock awards | 1,008 | | | 1 | | | 58 | | | (1,527) | | | 358 | | | — | | | — | | | (1,168) | |
| Repurchases of common stock | (6,082) | | | — | | | 6,082 | | | (147,190) | | | — | | | — | | | — | | | (147,190) | |
Net income | — | | | — | | | — | | | — | | | — | | | 119,497 | | | — | | | 119,497 | |
Other comprehensive loss | — | | | — | | | — | | | — | | | — | | | — | | | (3,727) | | | (3,727) | |
Balance at December 31, 2019 | 68,232 | | | $ | 104 | | | 35,796 | | | $ | (546,208) | | | $ | 495,903 | | | $ | 240,485 | | | $ | (58,379) | | | $ | 131,905 | |
(1) Represents a repurchase premium, which is the difference between cash paid and the carrying value of 100,000 shares of Series A Convertible Preferred Stock repurchased, including other costs associated with the transaction.
(2) Represents the issuance of common stock upon conversion of 100,000 shares of Series A Convertible Preferred Stock.
(3) Represents Series A Convertible Preferred Stock cash dividends declared and paid of $9.0 million, and $15.0 million of payments paid and payable to induce conversion.
(4) Represents total accretion of $17.6 million, net of $6.1 million acquired value of beneficial conversion feature attributable to repurchased Series A Convertible Preferred Stock.
(5) The decrease to beginning retained earnings is as a result of the adoption of new lease accounting standards as of January 1, 2019, as discussed in Note 2 — Recent Accounting Pronouncements.
The accompanying notes are an integral part of these consolidated financial statements.
CROCS, INC. AND SUBSIDIARIES
CONSOLIDATED STATEMENTS OF CASH FLOWS
(in thousands)
| | | | | | | | | | | | | | | | | |
| Year Ended December 31, | | | | |
| 2019 | | 2018 | | 2017 |
Cash flows from operating activities: | | | | | |
Net income | $ | 119,497 | | | $ | 50,437 | | | $ | 10,238 | |
Adjustments to reconcile net income to net cash provided by operating activities: | | | | | |
Depreciation and amortization | 24,213 | | | 29,250 | | | 33,130 | |
Unrealized foreign currency loss (gain), net | (1,140) | | | (1,455) | | | 1,025 | |
Loss (gain) on disposals of assets | (213) | | | 5,019 | | | (842) | |
Share-based compensation | 14,412 | | | 13,105 | | | 9,773 | |
Asset impairments | — | | | 2,182 | | | 5,284 | |
Operating lease cost | 60,142 | | | | — | | | | — | |
Provision (recovery) for doubtful accounts, net | 1,566 | | | 711 | | | (589) | |
Deferred taxes | (16,259) | | | 959 | | | (3,093) | |
Other non-cash items | (963) | | | 1,994 | | | (1,564) | |
Changes in operating assets and liabilities: | | | | | |
Accounts receivable, net of allowances | (15,015) | | | (24,623) | | | 620 | |
Inventories | (48,156) | | | (1,987) | | | 23,319 | |
Prepaid expenses and other assets | (4,012) | | | 9,703 | | | 18,907 | |
Accounts payable | 6,032 | | | 12,953 | | | (2,714) | |
Accrued expenses and other liabilities | 13,265 | | | 18,065 | | | 5,489 | |
Operating lease liabilities | (64,313) | | | | — | | | | — | |
Income taxes | 902 | | | (2,151) | | | (719) | |
Cash provided by operating activities | 89,958 | | | 114,162 | | | 98,264 | |
Cash flows from investing activities: | | | | | |
Purchases of property, equipment, and software | (36,576) | | | (11,979) | | | (13,117) | |
Proceeds from disposal of property and equipment | 616 | | | 1,856 | | | 1,579 | |
Other | (276) | | | 13 | | | — | |
Cash used in investing activities | (36,236) | | | (10,110) | | | (11,538) | |
Cash flows from financing activities: | | | | | |
Proceeds from borrowings | 315,000 | | | 120,000 | | | 5,500 | |
Repayments of borrowings | (230,000) | | | (662) | | | (8,611) | |
Series A preferred stock repurchase | — | | | (183,724) | | | — | |
Dividends — Series A convertible preferred stock (1) | (2,985) | | | (21,015) | | | (12,000) | |
Repurchases of common stock | (147,190) | | | (63,131) | | | (50,000) | |
Other | (3,463) | | | (270) | | | (259) | |
Cash used in financing activities | (68,638) | | | (148,802) | | | (65,370) | |
Effect of exchange rate changes on cash, cash equivalents, and restricted cash | (569) | | | (4,775) | | | 3,053 | |
Net change in cash, cash equivalents, and restricted cash | (15,485) | | | (49,525) | | | 24,409 | |
| Cash, cash equivalents, and restricted cash — beginning of year | 127,530 | | | 177,055 | | | 152,646 | |
| Cash, cash equivalents, and restricted cash — end of year | $ | 112,045 | | | $ | 127,530 | | | $ | 177,055 | |
| | | | | |
| Cash paid for interest | $ | 7,519 | | | $ | 462 | | | $ | 434 | |
| Cash paid for income taxes | 16,050 | | | 18,633 | | | 13,208 | |
(1) Represents $3.0 million paid to induce conversion of Series A Convertible Preferred Stock to common stock during the year ended December 31, 2019 and Series A Convertible Preferred Stock cash dividends declared and paid of $9.0 million and $12.0 million paid to induce conversion during the year ended December 31, 2018.
The accompanying notes are an integral part of these consolidated financial statements.
CROCS, INC. AND SUBSIDIARIES
NOTES TO CONSOLIDATED FINANCIAL STATEMENTS
1. BASIS OF PRESENTATION AND SUMMARY OF SIGNIFICANT ACCOUNTING POLICIES
Unless otherwise noted in this report, any description of the “Company,” “Crocs,” “we,” “us,” or “our” includes Crocs, Inc. and its consolidated subsidiaries within our reportable operating segments and corporate operations. We are engaged in the design, development, worldwide marketing, distribution, and sale of casual lifestyle footwear and accessories for men, women, and children. We strive to be the global leader in the sale of molded footwear characterized by functionality, comfort, color, and lightweight design. Our reportable operating segments include: the Americas, operating in North and South America; Asia Pacific, operating throughout Asia, Australia, and New Zealand; and Europe, Middle East, and Africa (“EMEA”), operating throughout Europe, Russia, the Middle East, and Africa.
Basis of Presentation and Consolidation
Our consolidated financial statements include our accounts and those of our wholly-owned subsidiaries, and reflect all adjustments which are necessary for a fair statement of financial position, results of operations, and cash flows for the periods presented in accordance with accounting principles generally accepted in the United States of America (“U.S. GAAP”). All intercompany balances and transactions have been eliminated in consolidation.
Use of Estimates
Our consolidated financial statements are prepared in accordance with U.S. GAAP. These accounting principles require us to make certain estimates, judgments, and assumptions. We believe that the estimates, judgments, and assumptions used to determine certain amounts that affect the financial statements are reasonable, based on information available at the time they are made. Management believes that the estimates, judgments, and assumptions made when accounting for items and matters such as, but not limited to, the allowance for doubtful accounts, customer rebates, sales returns, impairment assessments and charges, recoverability of long-lived assets, deferred tax assets, uncertain tax positions, income tax expense, share-based compensation expense, the assessment of lower of cost or net realizable value on inventory, useful lives assigned to long-lived assets, and depreciation and amortization.
Additionally, we are periodically exposed to various contingencies in the ordinary course of conducting our business, including certain litigation, contractual disputes, employee relations matters, various tax or other governmental audits, and trademark and intellectual property matters and disputes. We record a liability for such contingencies to the extent that we conclude their occurrence is probable and the related losses are estimable. If it is reasonably possible that an unfavorable settlement of a contingency could exceed the established liability, we disclose the estimated impact on our liquidity, financial condition, and results of operations, if practicable. As the ultimate resolution of contingencies is inherently unpredictable, these assessments can involve a series of complex judgments about future events including, but not limited to, court rulings, negotiations between affected parties, and governmental actions. As a result, the accounting for loss contingencies relies heavily on management’s judgment in developing the related estimates and assumptions. See Note 17 — Legal Proceedings for additional information regarding our contingencies and legal proceedings.
To the extent there are differences between these estimates and actual results, our consolidated financial statements may be materially affected.
Reclassifications
We have reclassified certain amounts in Note 13 — Income Taxes to conform to current period presentation.
Transactions with Affiliates
During the year ended December 31, 2019, we received services from three affiliates of Blackstone Capital Partners VI L.P. (“Blackstone”). Blackstone and certain of its permitted transferees beneficially owned 6,899,027 shares of our common stock until Blackstone sold 6,864,545 shares of common stock held directly by Blackstone and its affiliates on November 4, 2019 in an underwritten public offering. The other 34,482 shares of common stock were held by Gregg S. Ribatt, our former Chief Executive Officer and former member of our Board of Directors, which Blackstone may have been deemed to beneficially own, and were sold by Mr. Ribatt in October 2019. We incurred expenses to Blackstone’s legal counsel of $0.3 million in relation to this transaction.
Certain Blackstone affiliates provide various services to us, including inventory count services, cybersecurity and consulting, and workforce management services. We incurred expenses for services from these affiliates of $2.2 million through November 4, 2019, and $0.8 million and $0.7 million in the years ended December 31, 2018 and 2017, respectively. Expenses related to these services are reported in ‘Selling, general and administrative expenses’ in the consolidated statements of operations.
Revenue Recognition
See Note 11 — Revenues for a summary of our revenue recognition policy.
Shipping and Handling Costs and Fees
Shipping and handling costs are expensed as incurred and are included in ‘Cost of sales’ in the consolidated statements of operations. Shipping and handling fees billed to customers are included in revenues.
Taxes Assessed by Governmental Authorities
Taxes assessed by governmental authorities that are directly imposed on a revenue transaction, including value added tax, are recorded on a net basis and are therefore excluded from revenues.
Cost of Sales
Our cost of sales includes costs incurred to design, produce, procure, and ship our footwear. These costs include our raw materials, both direct and indirect labor, shipping and handling including freight costs, utilities, maintenance costs, depreciation, packaging, and other manufacturing overhead and costs.
Research, Design, and Development Expenses
We continue to dedicate significant resources to product design and development based on opportunities we identify in the marketplace. We incurred expenses of $11.8 million, $14.1 million, and $13.4 million in research, design, and development activities for the years ended December 31, 2019, 2018, and 2017, respectively, which are expensed as incurred and are reported in ‘Selling, general and administrative expenses’ in the consolidated statements of operations.
Selling, General and Administrative Expenses
Our selling, general and administrative expenses include media advertising (television, radio, print, social, digital), tactical advertising (signs, banners, point-of-sale materials) and promotional costs. Advertising production costs are expensed when the advertising is first run. Advertising communication costs are expensed in the periods that the communications occur. Certain of our promotional expenses result from payments under endorsement contracts. Expenses under endorsement contracts are recognized as performance is received over the term of each endorsement agreement.
Total marketing expenses, inclusive of advertising, production, promotion, and agency expenses, including variable marketing expenses, were $83.2 million, $68.6 million, and $59.1 million for the years ended December 31, 2019, 2018, and 2017, respectively. Prepaid advertising and promotional endorsement expenses of $11.6 million and $7.5 million, were included in ‘Prepaid expenses and other assets’ in the consolidated balance sheets at December 31, 2019 and 2018, respectively.
Selling, general and administrative expenses consist primarily of labor and outside services, rent expense, bad debt expense, legal costs, amortization of intangible assets, as well as certain depreciation costs related to corporate and non-product assets and share-based compensation. Selling, general and administrative expenses also include costs for our marketing and sales organizations, and other functions including finance, legal, human resources, and information technology.
Other Income, Net
Other income, net primarily includes gains and losses associated with activities not directly related to making and selling footwear, as well as certain gains or losses on sales of non-operating assets.
Foreign Currency Gains (Losses), Net
Foreign currency gains (losses), net includes realized and unrealized foreign exchange gains and losses resulting from remeasurement and settlement of foreign-currency transactions denominated in a currency other than the functional currency of
an entity, and realized and unrealized gains and losses on forward foreign currency exchange derivative contracts. Realized foreign exchange gains and losses are reported in the operating segment in which they occur. Foreign exchange gains and losses on intercompany balances and forward foreign exchange derivative contracts are reported within corporate operations.
Other Comprehensive Income
Our foreign subsidiaries use their foreign currency as their functional currency. Functional currency assets and liabilities are translated into U.S. Dollars using exchange rates in effect at the balance sheet date, and revenues and expenses are translated at average exchange rates during the period. Resulting translation gains and losses are reported in other comprehensive income (loss), until the substantial disposition of a subsidiary, at which time accumulated translation gains or losses are reclassified into net income.
Income Taxes
Income taxes are accounted for using the asset and liability method, which requires the recognition of deferred tax assets and liabilities for the expected future tax consequences of temporary differences between the carrying amounts and the tax basis of other assets and liabilities. We provide for income taxes at the current and future enacted tax rates and laws applicable in each taxing jurisdiction. We account for the tax effects of global intangible low-taxed income (“GILTI”) as a component of income tax expense in the period the tax arises, to the extent applicable. We use a two-step approach for recognizing and measuring tax benefits taken or expected to be taken in a tax return and disclosures regarding uncertainties in income tax positions. We recognize interest and penalties related to income tax matters in income tax expense in the consolidated statement of operations. See Note 13 — Income Taxes for further discussion.
Cash and Cash Equivalents
Cash and cash equivalents represent cash and short-term, highly-liquid investments with maturities of three months or less at the date of purchase. We report receivables from credit card companies, if expected to be received within five days, in cash and cash equivalents.
Restricted Cash
Restricted cash primarily consists of funds to secure certain retail store leases, certain customs requirements, and other contractual arrangements.
Accounts Receivable, Net
Accounts receivable are recorded at invoiced amounts, net of reserves and allowances. We reduce the carrying value for estimated uncollectible accounts based on a variety of factors including the length of time receivables are past due, economic trends and conditions affecting our customer base, and historical collection experience. Specific provisions are recorded for individual receivables when we become aware of a customer’s inability to meet its financial obligations. We write off accounts receivable to the reserves when they are deemed uncollectible or, in certain jurisdictions, when legally able to do so. See Schedule II in Part IV - Item 15. Exhibits, Financial Statement Schedule for more information.
Inventories
Inventories are comprised of finished goods and are stated at the lower of cost or net realizable value. Effective January 1, 2018, we completed implementation of a new inventory costing system for approximately 95% of our inventories. In connection with the implementation, we changed our method of inventory costing from a moving average cost method to a first-in-first-out method. We believe this change in accounting principle is preferable because it results in more precision and consistency in global and regional inventory costs, more efficient analysis, and better matching of inventory costs with revenues, it better matches the physical flow of inventories, and it improves comparability with industry peers. The change from our former inventory cost method did not have a material effect on inventory or cost of sales, and, as a result, prior comparative financial statements have not been restated.
We estimate the market value of inventory based on an analysis of historical sales trends of our individual product lines, the impact of market trends and economic conditions, and a forecast of future demand, giving consideration to the value of current orders in-house for future sales of inventory, as well as plans to sell discontinued or end-of-life inventory through our outlet stores, among other off-price channels. Estimates may differ from actual results due to the quantity, quality, and mix of products in inventory, consumer and retailer preferences, and market conditions. If the estimated market value is less than its
carrying value, the carrying value is adjusted to the market value and the difference is recorded in ‘Cost of sales’ in our consolidated statements of operations.
Reserves for the risk of physical loss of inventory are estimated based on historical experience and are adjusted based upon physical inventory counts, and recorded within ‘Cost of sales’ in our consolidated statements of operations.
Property and Equipment, Net
Property, equipment, furniture, and fixtures are stated at original cost, less accumulated depreciation. Depreciation is provided using the straight-line method over the estimated useful asset lives, which are reviewed periodically and have the following ranges: machinery and equipment: 2 to 10 years; furniture, fixtures, and other: 2 to 10 years. Leasehold improvements are stated at cost and amortized on a straight-line basis over their estimated economic useful lives or the lease term, whichever is shorter. Costs of enhancements or modifications that substantially extend the capacity or useful life of an asset are capitalized and depreciated accordingly. Ordinary repairs and maintenance are expensed as incurred. Depreciation of warehouse- and distribution-related assets is included in cost of sales in our consolidated statements of operations. In 2017 and through the third quarter of 2018, when all manufacturing was transferred to third-party manufacturers, cost of sales also included depreciation related to manufacturing assets. Depreciation related to corporate, non-product, and non-manufacturing assets is included in ‘Selling, general and administrative expenses’ in our consolidated statements of operations. When property is retired or otherwise disposed of, the cost and accumulated depreciation are removed from our consolidated balance sheets and the resulting gain or loss, if any, is reflected in ‘Income from operations’ in the consolidated statements of operations.
Goodwill and Other Intangible Assets, Net
We evaluate the carrying value of our goodwill and indefinite-lived intangible assets for impairment at the reporting unit level at least annually or when an interim triggering event has occurred indicating potential impairment. Our annual test is performed as of the last day of our fiscal fourth quarter. We continuously monitor the performance of our definite-lived intangible assets and evaluate for impairment when evidence exists that certain events or changes in circumstances indicate that the carrying amount of these assets may not be recoverable. Significant judgments and assumptions are required in such impairment evaluations. Definite-lived intangible assets are stated at cost, less accumulated amortization. Amortization is recorded using the straight-line method over the estimated lives of the assets.
Direct costs of acquiring or developing internal-use computer software, including costs of employees, are capitalized and classified within intangible assets. Software maintenance and training costs are expensed in the period incurred. Initial costs associated with internally-developed-and-used software are expensed until it is determined that the project has reached the application development stage, after which subsequent additions, modifications, or upgrades are capitalized to the extent that they add functionality. Our capitalized software consists primarily of enterprise resource system software, warehouse management software, and point of sale software. Amortization for software is provided using the straight-line method over the estimated useful asset lives, which are reviewed periodically and range from 2 to 8 years. Amortization of capitalized software used in warehouse- and distribution-related activities is included in ‘Cost of sales’ in the consolidated statements of operations. In 2017 and through the third quarter of 2018, when all manufacturing was transferred to third-party manufacturers, cost of sales also included amortization related to capitalized software used in manufacturing. Amortization related to corporate, non-product, and non-manufacturing assets, such as our global information systems, is included in ‘Selling, general, and administrative expenses’ in the consolidated statements of operations.
Amortization for patents, copyrights, and trademarks is provided using the straight-line method over the estimated useful asset lives, which are reviewed periodically and range from 7 to 25 years.
Impairment of Long-Lived Assets
Long-lived assets to be held and used are evaluated for impairment when events or circumstances indicate the carrying value of a long-lived asset or asset group is less than the undiscounted cash flows from its use and eventual disposition over its remaining economic life. We assess recoverability by comparing the sum of projected undiscounted cash flows from the use and eventual disposition over the remaining economic life of a long-lived asset or asset group to its carrying value, and record a loss from impairment if the carrying value is more than its undiscounted cash flows. For assets involved in Crocs’ retail business, the asset group is at the retail store level. As retail store performance will vary in new and existing markets due to many factors, including maturity of the market and brand recognition, we periodically evaluate the fixed assets, leasehold improvements, and right-of-use assets related to our retail locations for impairment. Assets or asset groups to be abandoned or from which no future benefit is expected are written down to zero in the period it is determined they will no longer be used and
are removed entirely from service. See Note 3 — Property and Equipment, Net for a discussion of impairment losses recorded during the periods presented.
Share-Based Compensation
Stock Options
Stock options are granted with exercise prices equal to the fair market value of our common stock on the date of grant. We use the Black-Scholes option-pricing model to estimate the grant date fair value of stock options, which requires the use of assumptions, including the expected term of the option, expected volatility of our stock price, our expected dividend yield, and the risk-free interest rate, among others. These assumptions reflect our best estimates, however; they involve inherent uncertainties including market conditions and employee behavior that are generally outside of our control. We expense all share-based compensation awarded based on the grant date fair value of the awards using the straight-line method over the requisite service period, adjusted for forfeitures as they occur.
Restricted Stock Awards (“RSAs”) and Restricted Stock Units (“RSUs”)
We grant RSAs, service-condition RSUs, performance-condition RSUs, and market-condition RSUs. The grant date fair values of RSAs, service-condition RSUs, and performance-condition RSUs are based on the closing market price of our common stock on the grant date; the grant date fair value and derived service period of market-condition RSUs is estimated using a Monte Carlo simulation valuation model. Our service-condition RSUs vest based on continued service; our performance-condition RSUs vest based on achievement of multiple weighted performance goals, certification of performance achievement by the Compensation Committee of the Board of Directors, and continued service; our market-condition RSUs vest based on the market price of our stock. Compensation expense, net of forfeitures, is recognized on a straight-line basis over the requisite service period. For performance-condition RSUs, compensation expense is updated for our expected performance level against performance goals at the end of each reporting period, which involves judgment as to achievement of certain performance metrics.
See Note 12 — Share-Based Compensation for additional information related to share-based compensation.
Earnings per Share
Basic and diluted earnings per common share (“EPS”) is presented using the treasury stock method. Diluted EPS reflects the potential dilution to common shareholders from securities that could share in our earnings and is calculated by adjusting weighted average outstanding shares, assuming conversion of all potentially dilutive stock options and awards. Anti-dilutive securities are excluded from diluted EPS. See Note 14 — Earnings per Share for additional information.
Derivative Foreign Currency Contracts
We enter into forward foreign currency exchange contracts to mitigate the potential impact of foreign currency exchange rate risk. By policy, we do not enter into these contracts for trading purposes or speculation. The fair value of these contracts is reported either as an asset or liability in our consolidated balance sheets. Changes in the fair value of these contracts are recorded in ‘Foreign currency gains (losses), net’ in our consolidated statements of operations. We did not designate any derivative instruments for hedge accounting during any of the periods presented. See Note 8 — Derivative Financial Instruments for further information.
Fair Value
U.S. GAAP for fair value establishes a hierarchy that prioritizes fair value measurements based on the types of inputs used for the various valuation techniques (market approach, income approach, and cost approach). We utilize a combination of market and income approaches to value derivative instruments. Our financial assets and liabilities are measured using inputs from the three levels of the fair value hierarchy. The three levels of the hierarchy and the related inputs are as follows:
| | | | | | | | | | | | | | | | | |
| Level | | Inputs | | | |
| 1 | | Unadjusted quoted prices in active markets for identical assets and liabilities. | | | |
| 2 | | Unadjusted quoted prices in active markets for similar assets and liabilities; | | | |
| | Unadjusted quoted prices for identical or similar assets or liabilities in markets that are not active; or | | | |
| | Inputs other than quoted prices that are observable for the asset or liability. | | | |
| 3 | | Unobservable inputs for the asset or liability. | | | |
We categorize fair value measurements within the fair value hierarchy based upon the lowest level of the most significant inputs used to determine fair value.
Our non-financial assets, which primarily consist of property and equipment, goodwill, and other intangible assets, are not required to be carried at fair value on a recurring basis and are reported at carrying value. However, on a periodic basis or whenever events or changes in circumstances indicate that their carrying value may not be fully recoverable (and at least annually for goodwill and indefinite-lived intangible assets), non-financial instruments are assessed for impairment and, if applicable, written down to and recorded at fair value. See Note 7 — Fair Value Measurements for further discussion related to estimated fair value measurements.
Consolidated Statements of Cash Flows - Supplemental Schedule of Non-Cash Investing and Financing Activities
| | | | | | | | | | | | | | | | | |
| Year Ended December 31, | | | | |
| 2019 | | 2018 | | 2017 |
| (in thousands) | | | | | |
| Accrued purchases of property, equipment, and software | $ | 15,206 | | | $ | 1,141 | | | $ | 2,195 | |
| Series A preferred stock conversion | — | | | 100,000 | | | — | |
Series A preferred stock accretion, net (1) | — | | | 17,567 | | | 3,532 | |
| Vendor financed insurance premiums | — | | | — | | | 1,450 | |
(1) Represents total accretion of $17.6 million, net of $6.1 million acquired value of beneficial conversion feature attributable to repurchased Series A Convertible Preferred Stock for the year ended December 31, 2018.
2. RECENT ACCOUNTING PRONOUNCEMENTS
New Accounting Pronouncement Adopted
Reclassification of Certain Tax Effects from Accumulated Other Comprehensive Income
In February 2018, the Financial Accounting Standards Board (“FASB”) issued authoritative guidance that permits reclassification of the income tax effects of the U.S. Tax Cuts and Job Act (“Tax Act”) on accumulated other comprehensive income (“AOCI”) to retained earnings. This guidance may be adopted retrospectively to each period (or periods) in which the income tax effects of the Tax Act related to items remaining in AOCI are recognized, or at the beginning of the period of adoption. The guidance became effective for annual periods beginning after December 15, 2018, including interim periods within those annual periods, with early adoption permitted. This guidance became effective during the first quarter of 2019; however, we did not elect to make the optional reclassification. Our policy is to release stranded tax effects from AOCI using either a specific identification approach or portfolio approach based on the nature of the underlying item.
Leases
In February 2016, the FASB issued authoritative guidance related to accounting for leases. On January 1, 2019, we adopted the guidance using the modified retrospective method applied as of the date of adoption. The comparative information presented in the consolidated financial statements was not restated and is reported under the accounting standards in effect for the periods presented.
We have elected all of the available transition practical expedients, including the ‘package of practical expedients’, which permits us not to reassess under the new standard our prior conclusions about lease identification, lease classification and initial direct costs. We have elected not to apply ‘hindsight’ when adopting the standard for determining the reasonably certain lease term and in assessing impairments. We have elected the short-term lease exemption, which means we have not and will not recognize a right-of-use asset or liability for leases that qualify for the short-term exemption and will recognize those lease expenses on a straight-line basis over the lease term in our consolidated statements of operations. Further, we have elected to combine lease and non-lease components for all of our leases.
Adoption of the new standard resulted in the recognition of right-of-use assets and liabilities of approximately $176.1 million and $187.4 million, respectively, as of January 1, 2019, with additional adjustments to ‘Prepaid expenses and other assets’, ‘Accrued expenses and other liabilities’, and ‘Retained earnings’. As a result of the adoption of new lease accounting standards, we assessed the initial right-of-use assets for impairment and recorded non-cash impairments of $0.2 million within ‘Retained earnings’ in our consolidated balance sheet. The adoption of this guidance did not have a significant impact on the consolidated statements of operations or cash flows.
New Accounting Pronouncements Not Yet Adopted
Measurement of Credit Losses
In June 2016, and through subsequent amendments, the FASB issued guidance that requires the measurement and recognition of expected credit losses for financial assets. This new model replaces the existing “current incurred loss” model with a forward-looking “current expected credit loss” model. This guidance becomes effective for annual reporting periods beginning after December 15, 2019, including interim periods within those periods. At this time, based on the nature of our financial instruments included within the scope of this standard, which are primarily trade and other receivables, and our initial analyses, we do not expect this standard to have a material impact on our consolidated financial statements.
Implementation Costs Incurred in Cloud Computing Arrangements
In August 2018, the FASB issued authoritative guidance related to the treatment of implementation costs incurred in a hosting arrangement that is considered a service contract. This guidance becomes effective for annual reporting periods beginning after December 15, 2019, including interim periods within those periods, with early adoption permitted, and will be applied prospectively to all implementation costs incurred after the date of adoption. Upon adoption, we do not expect this standard to have a material impact on our consolidated financial statements.
Simplifying Accounting for Income Taxes
In December 2019, the FASB issued new guidance to simplify the accounting for income taxes by removing certain exceptions to the general principles and also simplification of areas such as franchise taxes, step-up in tax basis goodwill, separate entity financial statements and interim recognition of enactment of tax laws or rate changes. The standard will be effective for annual reporting periods beginning after December 15, 2020, including interim reporting periods within those periods. We are currently evaluating the impact of adopting this new accounting guidance on our consolidated financial statements.
Other Pronouncements
Other new pronouncements issued but not effective until after December 31, 2019 are not expected to have a material impact on our consolidated financial statements.
3. PROPERTY AND EQUIPMENT, NET
‘Property and equipment, net’ consists of the following:
| | | | | | | | | | | |
| | December 31, | | |
| | 2019 | | 2018 |
| | (in thousands) | | |
| Leasehold improvements | $ | 64,540 | | | $ | 63,702 | |
| Machinery and equipment | 39,011 | | | 20,054 | |
| Furniture, fixtures, and other | 19,761 | | | 16,779 | |
| Construction-in-progress | 3,697 | | | 2,632 | |
| Property and equipment | 127,009 | | | 103,167 | |
| Less: Accumulated depreciation and amortization | (79,604) | | | (80,956) | |
| Property and equipment, net | $ | 47,405 | | | $ | 22,211 | |
Asset Retirement Obligations
We are contractually obligated, under certain of our lease agreements, to restore certain retail and office facilities back to their original condition. At lease inception, the estimated fair value of these liabilities is recorded along with a related asset. Asset retirement obligations were not material to the consolidated balance sheets in the years ended December 31, 2019 or 2018.
Depreciation and Amortization Expense
Depreciation and amortization expense related to property and equipment, reported in ‘Cost of sales’ and ‘Selling, general and administrative expenses’ was:
| | | | | | | | | | | | | | | | | |
| Year Ended December 31, | | | | |
| 2019 | | 2018 | | 2017 |
| (in thousands) | | | | |
| Cost of sales | $ | 1,711 | | | $ | 1,422 | | | $ | 2,278 | |
| Selling, general and administrative expenses | 7,174 | | | 11,180 | | | 12,723 | |
| Total depreciation and amortization expense | $ | 8,885 | | | $ | 12,602 | | | $ | 15,001 | |
Disposals of Property and Equipment and Intangible Assets
We recognized net gains on disposals of property and equipment and intangible assets of $0.2 million and $0.8 million, respectively, for the years ended December 31, 2019 and 2017, and net losses on disposals of property and equipment and intangible assets of $4.8 million for the year ended December 31, 2018, which are included in ‘Selling, general and administrative expenses’ in the consolidated statement of operations.
Asset Impairments
We recorded no asset impairments during the year ended December 31, 2019. During the years ended December 31, 2018 and 2017, we recorded impairments of $0.9 million and $0.5 million, respectively, for underperforming retail stores. Impairments for retail stores by reportable operating segment, were:
| | | | | | | | | | | | | | | | | | | | | | | | | | | |
| | | | | | Year Ended December 31, | | | | | | |
| | | | | | 2018 | | | | 2017 | | |
| | | | | | Asset Impairment | | Number of
Stores | | Asset Impairment | | Number of
Stores |
| | | | | | (in thousands, except store count data) | | | | | | |
| Americas | | | | | $ | 138 | | | 1 | | | $ | 455 | | | 3 | |
| Asia Pacific | | | | | 760 | | | 12 | | | — | | | — | |
| EMEA | | | | | — | | | — | | | 75 | | | 1 | |
| Total | | | | | $ | 898 | | | 13 | | | $ | 530 | | | 4 | |
During the year ended December 31, 2018, we recorded impairment expenses of $1.3 million to reduce the carrying values of certain supply chain assets related to the closure of our Mexico and Italy manufacturing and distribution facilities, included in ‘Other businesses,’ to their estimated fair values.
4. GOODWILL AND INTANGIBLE ASSETS, NET
Goodwill
All of our goodwill is in the EMEA segment. The changes in goodwill for the years ended December 31, 2019 and 2018 were:
| | | | | |
| Goodwill |
| (in thousands) |
Balance at December 31, 2017 | $ | 1,688 | |
| Foreign currency translation | (74) | |
Balance at December 31, 2018 | 1,614 | |
| Foreign currency translation | (36) | |
Balance at December 31, 2019 | $ | 1,578 | |
Accumulated goodwill impairment at December 31, 2019 was $0.8 million.
Intangible Assets, Net
‘Intangible assets, net’ reported in the consolidated balance sheets consist of the following:
| | | | | | | | | | | | | | | | | | | | | | | | | | | | | | | | | | | | | | |
| | December 31, 2019 | | | | | | December 31, 2018 | | | | |
| | Gross | | Accum. Amortiz. | | Net | | Gross | | Accum. Amortiz. | | Net |
| | (in thousands) | | | | | | | | | | |
| Intangible assets subject to amortization: | | | | | | | | | | | | |
| Capitalized software | | $ | 120,620 | | | $ | (78,387) | | | $ | 42,233 | | | $ | 138,857 | | | $ | (97,900) | | | $ | 40,957 | |
| Patents, copyrights, and trademarks | | 4,988 | | | (4,373) | | | 615 | | | 5,338 | | | (4,588) | | | 750 | |
Intangible assets not subject to amortization: | | | | | | | | | | | | |
| In progress | | 4,170 | | | — | | | 4,170 | | | 3,906 | | | — | | | 3,906 | |
| Trademarks and other | | 77 | | | — | | | 77 | | | 77 | | | — | | | 77 | |
| Total | | $ | 129,855 | | | $ | (82,760) | | | $ | 47,095 | | | $ | 148,178 | | | $ | (102,488) | | | $ | 45,690 | |
At December 31, 2019, the weighted average remaining useful life of intangibles subject to amortization was approximately 6.3 years.
Amortization Expense
Amortization expense related to definite-lived intangible assets, reported in ‘Cost of sales’ and ‘Selling, general and administrative expenses’ was:
| | | | | | | | | | | | | | | | | |
| Year Ended December 31, | | | | |
| 2019 | | 2018 | | 2017 |
| (in thousands) | | | | |
| Cost of sales | $ | 3,398 | | | $ | 3,889 | | | $ | 4,550 | |
| Selling, general and administrative expenses | 11,930 | | | 12,759 | | | 13,579 | |
| Total amortization expense | $ | 15,328 | | | $ | 16,648 | | | $ | 18,129 | |
Estimated future annual amortization expense of intangible assets is:
| | | | | |
| As of December 31, 2019 |
| (in thousands) |
| 2020 | $ | 15,284 | |
| 2021 | 14,941 | |
| 2022 | 4,303 | |
| 2023 | 3,658 | |
| 2024 | 2,620 | |
| Thereafter | 2,042 | |
| Total | $ | 42,848 | |
5. ACCRUED EXPENSES AND OTHER LIABILITIES
Amounts reported in ‘Accrued expenses and other liabilities’ in the consolidated balance sheets were:
| | | | | | | | | | | |
| December 31, | | |
| 2019 | | 2018 |
| | (in thousands) | | |
| Accrued compensation and benefits | $ | 42,460 | | | $ | 43,970 | |
| Fulfillment, freight, and duties | 20,110 | | | 12,234 | |
| Professional services | 13,361 | | | 11,124 | |
Accrued rent and occupancy (1) | 4,682 | | | 6,956 | |
| Return liabilities | 7,090 | | | 6,429 | |
| Sales/use and value added taxes payable | 6,843 | | | 5,601 | |
| Royalties payable and deferred revenue | 3,740 | | | 3,356 | |
Other (2) | 10,391 | | | 12,501 | |
| Total accrued expenses and other liabilities | $ | 108,677 | | | $ | 102,171 | |
(1) At December 31, 2019, includes accrued rent and occupancy costs for leases with original terms of one year or less, which are excluded from recognition under the new lease accounting guidance adopted as of January 1, 2019. See Note 2 — Recent Accounting Pronouncements for more information.
(2) At December 31, 2018, includes accrued payments of $3.0 million to induce the conversion of Series A Convertible Preferred Stock into shares of common stock.
6. LEASES
We adopted authoritative guidance related to leases effective January 1, 2019 using the modified retrospective method. The comparative information presented in the consolidated financial statements was not restated and is reported under the accounting standards in effect for the periods presented. See ‘Leases’ in Note 2 — Recent Accounting Pronouncements for a discussion of the significant changes resulting from adoption of the guidance.
Our lease portfolio consists primarily of real estate assets, which includes retail, warehouse, distribution center, and office spaces, under operating leases expiring at various dates through 2033. Leases with an original term of twelve months or less are not reported in the consolidated balance sheet; expense for these short-term leases is recognized on a straight-line basis over the lease term.
Many leases include one or more options to renew, with renewal terms that, if exercised by us, may extend the lease term. The exercise of these renewal options is at our discretion. When assessing the likelihood of a renewal or termination, we consider the significance of leasehold improvements, availability of alternative locations, and the cost of relocation or replacement, among other considerations. The depreciable lives of leasehold improvements are the shorter of the useful lives of the improvements or the expected lease term. We determine the lease term for each lease based on the terms of each contract and factor in renewal and early termination options if such options are reasonably certain to be exercised.
Due to our centralized treasury function, we utilize a portfolio approach to discount our lease obligations. We assess the expected lease term at lease inception, and discount the lease using a fully-secured annual incremental borrowing rate, adjusted for time value corresponding with the expected lease term.
Certain of our retail store leases include rental payments based upon a percentage of retail sales in excess of a minimum fixed rental. In some cases, there is no fixed minimum rental and the entire rental payment is based upon a percentage of sales. Certain of our warehouse leases have rental payments that vary based upon the volume of product placed in storage. In addition, certain leases include rental payments adjusted periodically for changes in price level indexes. We recognize expense for these types of payments as incurred and report them as variable lease expense.
Right-of-Use Assets and Operating Lease Liabilities
Amounts reported in the consolidated balance sheet were:
| | | | | |
| December 31, 2019 |
| (in thousands) |
| Assets: | |
| Right-of-use assets | $ | 182,228 | |
| Liabilities: | |
| Current operating lease liabilities | $ | 48,585 | |
| Long-term operating lease liabilities | 140,148 | |
| Total operating lease liabilities | $ | 188,733 | |
Lease Costs and Other Information
Lease-related costs, reported within ‘Cost of sales’ and ‘Selling, general and administrative expenses’, were:
| | | | | |
| Year Ended December 31, 2019 |
| (in thousands) |
| Operating lease cost | $ | 60,142 | |
| Short-term lease cost | 3,771 | |
| Variable lease cost | 16,936 | |
| Total lease costs | $ | 80,849 | |
Other information related to leases, including supplemental cash flow information, consists of:
| | | | | |
| Year Ended December 31, 2019 |
| (in thousands) |
| Cash paid for operating leases | $ | 63,241 | |
Right-of-use assets obtained in exchange for operating lease liabilities (1) | 233,437 | |
(1) Includes $176.1 million for operating leases existing on January 1, 2019 and a net $57.3 million for operating leases that commenced or were modified in the year ended December 31, 2019.
| | | | | |
| As of December 31, 2019 |
| Weighted average remaining lease term (in years) | 5.9 |
| Weighted average discount rate | 4.8 | % |
Maturities
The maturities of our operating lease liabilities were:
| | | | | |
| As of December 31, 2019 |
| (in thousands) |
| 2020 | $ | 52,434 | |
| 2021 | 47,607 | |
| 2022 | 33,138 | |
| 2023 | 23,943 | |
| 2024 | 14,228 | |
| Thereafter | 48,996 | |
| Total future minimum lease payments | 220,346 | |
| Less: imputed interest | (31,613) | |
| Total operating lease liabilities | $ | 188,733 | |
Leases That Have Not Yet Commenced
As of December 31, 2019, we had significant obligations for leases that have not yet commenced related to our office relocation and new EMEA distribution center projects. In the first quarter of 2019, we entered into a lease for our new corporate headquarters and regional office in Broomfield, Colorado. The contractual commitment related to this lease, with payments beginning in March 2020 and continuing through August 2030, is approximately $20.4 million, with expected net capital investments totaling $7.0 million. In the fourth quarter of 2019, we entered into a lease for a new distribution center in Dordrecht, the Netherlands, which is expected to replace our existing distribution center in Rotterdam by the end of 2021. The contractual commitment related to this lease, with payments expected to begin in January 2021 and continuing through December 2030, is approximately €21.9 million, or $24.6 million, with expected total capital investments of approximately €20.0 million, or $22.4 million.
Comparative Information as Reported Under Previous Accounting Standards
The following comparative information is reported based upon previous accounting standards in effect for the periods presented.
Future minimum lease payments under operating leases were:
| | | | | |
| As of
December 31, 2018 |
| (in thousands) |
| 2019 | $ | 42,455 | |
| 2020 | 36,299 | |
| 2021 | 29,714 | |
| 2022 | 20,721 | |
| 2023 | 15,334 | |
| Thereafter | 54,149 | |
Total minimum lease payments (1) | $ | 198,672 | |
(1) Includes future minimum lease payments of $25.4 million related to the new distribution center in Dayton, Ohio.
Rent expense for operating leases was:
| | | | | | | | | | | |
| Year Ended December 31, | | |
| 2018 | | 2017 |
| (in thousands) | | |
Minimum rentals (1) | $ | 66,049 | | | | $ | 78,779 | |
| Contingent rentals | 14,297 | | | | 14,294 | |
| Total rent expense | $ | 80,346 | | | | $ | 93,073 | |
(1) Minimum rentals include all lease payments as well as fixed and variable common area maintenance, parking, and storage fees, which were approximately $9.3 million and $10.0 million for the years ended December 31, 2018 and 2017, respectively.
7. FAIR VALUE MEASUREMENTS
Recurring Fair Value Measurements
The financial assets and liabilities that are measured and recorded at fair value on a recurring basis consist of our derivative instruments. Our derivative instruments are forward foreign currency exchange contracts. We manage credit risk of our derivative instruments on the basis of our net exposure with our counterparty. All of our derivative instruments are classified as Level 2 of the fair value hierarchy and are reported in the consolidated balance sheets within either ‘Prepaid expenses and other assets’ or ‘Accrued expenses and other liabilities’ at December 31, 2019 and 2018. The fair values of our derivative instruments were an asset of $0.1 million and a liability of $1.3 million at December 31, 2019 and 2018, respectively. See Note 8 — Derivative Financial Instruments for more information.
The carrying amounts of our cash, cash equivalents, and restricted cash, accounts receivable, accounts payable, and current accrued expenses and other liabilities approximate their fair value as recorded due to the short-term maturity of these instruments.
Our borrowing instruments are recorded at their carrying values in the consolidated balance sheets, which may differ from their respective fair values. The fair values of our outstanding borrowings approximate their carrying values at December 31, 2019 and 2018, based on interest rates currently available to us for similar borrowings and were:
| | | | | | | | | | | | | | | | | | | | | | | |
| December 31, 2019 | | | | December 31, 2018 | | |
| Carrying Value | | | Fair
Value | | | Carrying Value | | | Fair
Value | |
| (in thousands) | | | | | | |
| Borrowings | $ | 205,000 | | | $ | 205,000 | | | $ | 120,000 | | | $ | 120,000 | |
Non-Financial Assets and Liabilities
Our non-financial assets, which primarily consist of property and equipment, goodwill, and other intangible assets, are not required to be carried at fair value on a recurring basis and are reported at carrying value.
The fair values of these assets were determined based on Level 3 measurements, including estimates of the amount and timing of future cash flows based upon historical experience, expected market conditions, and management’s plans. We recorded impairments as follows:
| | | | | | | | | | | | | |
| | | Year Ended December 31, | | |
| | | 2018 | | 2017 |
| | | (in thousands) | | |
| Supply chain assets impairment | | | $ | 1,284 | | | $ | — | |
| Retail store assets impairment | | | 898 | | | 530 | |
| Discontinued project | | | — | | | 4,754 | |
| Total asset impairments | | | $ | 2,182 | | | $ | 5,284 | |
8. DERIVATIVE FINANCIAL INSTRUMENTS
We transact business in various foreign countries and are therefore exposed to foreign currency exchange rate risk that impacts the reported U.S. Dollar amounts of revenues, expenses, and certain foreign currency monetary assets and liabilities. In order to manage exposure to fluctuations in foreign currency and to reduce the volatility in earnings caused by fluctuations in foreign exchange rates, we enter into forward contracts to buy and sell foreign currency. By policy, we do not enter into these contracts for trading purposes or speculation.
Counterparty default risk is considered low because the forward contracts we enter into are over-the-counter instruments transacted with highly-rated financial institutions. We were not required to and did not post collateral as of December 31, 2019 or 2018.
Our derivative instruments are recorded at fair value as a derivative asset or liability in the consolidated balance sheets. We report derivative instruments with the same counterparty on a net basis when a master netting arrangement is in place. Changes in fair value are recognized within ‘Foreign currency gains (losses), net’ in the consolidated statements of operations. For the consolidated statements of cash flows, we classify cash flows from derivative instruments at settlement in the same category as the cash flows from the related hedged items within ‘Cash provided by operating activities.’
Results of Derivative Activities
The fair values of derivative assets and liabilities, net, all of which are classified as Level 2, reported within either ‘Prepaid expenses and other assets’ or ‘Accrued expenses and other liabilities’ in the consolidated balance sheets were:
| | | | | | | | | | | | | | | | | | | | | | | |
| December 31, 2019 | | | | December 31, 2018 | | |
| Derivative Assets | | Derivative Liabilities | | Derivative Assets | | Derivative Liabilities |
| (in thousands) | | | | | | |
| Forward foreign currency exchange contracts | $ | 535 | | | $ | (424) | | | $ | 943 | | | $ | (2,256) | |
| Netting of counterparty contracts | (424) | | | 424 | | | (943) | | | 943 | |
| Foreign currency forward contract derivatives | $ | 111 | | | $ | — | | | $ | — | | | $ | (1,313) | |
The notional amounts of outstanding forward foreign currency exchange contracts shown below report the total U.S. Dollar equivalent position and the net contract fair values for each foreign currency position.
| | | | | | | | | | | | | | | | | | | | | | | |
| December 31, 2019 | | | | December 31, 2018 | | |
| Notional | | Fair Value | | Notional | | Fair Value |
| (in thousands) | | | | | | |
| Euro | $ | 46,757 | | | $ | 36 | | | $ | 34,959 | | | $ | (92) | |
| Singapore Dollar | 31,255 | | | 344 | | | 34,584 | | | 254 | |
| Japanese Yen | 11,823 | | | 63 | | | 25,561 | | | (178) | |
| South Korean Won | 10,328 | | | (82) | | | 9,408 | | | 63 | |
| British Pound Sterling | 9,155 | | | (104) | | | 22,185 | | | 183 | |
| Other currencies | 24,969 | | | (146) | | | 67,885 | | | (1,543) | |
| Total | | $ | 134,287 | | | $ | 111 | | | $ | 194,582 | | | $ | (1,313) | |
| | | | | | | |
| Latest maturity date | January 2020 | | | | January 2019 | | |
Amounts reported in ‘Foreign currency gains (losses), net’ in the consolidated statements of operations include both realized and unrealized gains (losses) from foreign currency transactions and derivative contracts and were as follows:
| | | | | | | | | | | | | | | | | |
| Year Ended December 31, | | | | |
| | 2019 | | 2018 | | 2017 |
| | (in thousands) | | | | |
| Foreign currency transaction gains (losses) | $ | (356) | | | $ | 552 | | | $ | 2,284 | |
| Foreign currency forward exchange contracts gains (losses) | (967) | | | 766 | | | (1,721) | |
Foreign currency gains (losses), net | $ | (1,323) | | | $ | 1,318 | | | $ | 563 | |
9. REVOLVING CREDIT FACILITY AND BANK BORROWINGS
Our borrowings were as follows:
| | | | | | | | | | | |
| December 31, | | |
| 2019 | | 2018 |
| (in thousands) | | |
| Revolving credit facilities | | $ | 205,000 | | | $ | 120,000 | |
| Less: Current portion of borrowings | — | | | — | |
| Total long-term borrowings | $ | 205,000 | | | $ | 120,000 | |
The weighted average interest rate on outstanding borrowings as of December 31, 2019 and 2018 was 3.96% and 4.69%, respectively.
Senior Revolving Credit Facility
In July 2019, Crocs, Inc. and certain of its subsidiaries (the “Borrowers”) entered into a Second Amended and Restated Credit Agreement (as amended, the “Credit Agreement”), with the lenders named therein and PNC Bank, National Association, as a lender and administrative agent for the lenders, which provides for a revolving credit facility of $450.0 million, which can be increased by an additional $150.0 million subject to certain conditions (the “Facility”). Borrowings under the Credit Agreement allow for us to borrow at either a variable rate based on a domestic base rate, defined as the highest of (i) the Federal Funds open rate, plus 0.25%, (ii) the Prime Rate, and (iii) the Daily LIBOR rate, plus 1%, or at a LIBOR rate, plus an applicable margin ranging from 1.00% to 1.875% based on our leverage ratio. Borrowings under the Credit Agreement are secured by all of the assets of the Borrowers, and guaranteed by certain other subsidiaries of the Borrowers.
The Credit Agreement requires us to maintain a minimum interest coverage ratio of 4.00 to 1.00, and a maximum leverage ratio of (i) 3.50 to 1.00 from September 30, 2019 to September 30, 2020, and (ii) 3.25 to 1.00 from December 31, 2020 and thereafter (subject to an increase to 4.00 to 1.00 in the event of certain permitted acquisitions or stock repurchases). The Credit Agreement permits (i) stock repurchases so long as after giving effect to such stock repurchases, the maximum leverage ratio does not exceed the applicable maximum leverage ratio, less 0.25; and (ii) certain acquisitions so long as there is borrowing availability under the Credit Agreement of at least $40.0 million. As of December 31, 2019, we were in compliance with all financial covenants under the Credit Agreement.
As of December 31, 2019, the total commitments available from the lenders under the Facility were $450.0 million. At December 31, 2019, we had $205.0 million in outstanding borrowings, which are due when the Facility matures in July 2024, and $4.6 million in outstanding letters of credit under the Facility, which reduces amounts available for borrowing under the Facility. As of December 31, 2019 and 2018, we had $240.4 million and $129.4 million, respectively, of available borrowing capacity under the Facility.
We also have a suspended revolving credit facility in Asia, under which we had no borrowings during the years ended December 31, 2019 and 2018 or outstanding at December 31, 2019 or 2018.
10. EQUITY
Common Stock
We have one class of common stock with a par value of $0.001 per share. There are 250.0 million shares of common stock authorized for issuance. Holders of common stock are entitled to one vote per share on all matters presented to common stockholders.
Common Stock Repurchase Program
On February 20, 2018, the Board of Directors approved and authorized a program to repurchase up to $500.0 million of our common stock, and on May 5, 2019, the Board approved an increase to the repurchase authorization of an additional $500.0 million of our common stock. The number, price, structure, and timing of the repurchases are at our sole discretion and may be made depending on market conditions, liquidity needs, restrictions under our revolving credit facility, and other factors. The Board of Directors may suspend, modify, or terminate the program at any time without prior notice. Share repurchases may be made in the open market or in privately negotiated transactions. The repurchase authorization does not have an expiration date and does not obligate us to acquire any amount of our common stock. Under Delaware state law, these shares are not retired, and the issuer has the right to resell any of the shares repurchased.
We repurchased 6.1 million shares of our common stock at a cost of $147.2 million, including commissions during the year ended December 31, 2019. We repurchased 3.6 million shares of our common stock at a cost of $63.1 million, including commissions, during the year ended December 31, 2018. We repurchased 5.7 million shares of our common stock at a cost of $50.0 million during the year ended December 31, 2017. As of December 31, 2019, we had remaining authorization to repurchase approximately $508.6 million of our common stock, subject to restrictions under our Credit Agreement.
Preferred Stock
We have authorized and available for issuance 5.0 million shares of preferred stock. Of these preferred shares, 1.0 million were authorized as Series A Convertible Preferred Stock with a par value of $0.001 per share and none were issued and outstanding as of December 31, 2019.
2018 Repurchase and Conversion
On December 5, 2018, all of the outstanding Series A Preferred shares were repurchased or converted to common stock. As a result, we recognized the remaining unamortized original issue discount and beneficial conversion feature accretion of $14.7 million, and settled the beneficial conversion feature related to the repurchased Series A Preferred of $6.1 million, resulting in a net increase of $8.6 million in ‘Dividend equivalents on Series A convertible preferred stock related to redemption value accretion and beneficial conversion feature’ in the consolidated statement of operations. We repurchased 100,000 shares of Series A Preferred with a carrying value of $100.0 million in exchange for a cash payment of $183.7 million. The repurchase payment in excess of the carrying value of $83.7 million is reported within ‘Dividends on Series A convertible preferred stock’ in the consolidated statement of operations for the year ended December 31, 2018. The remaining 100,000 shares of Series A Preferred were converted to 6,896,548 shares common stock. In connection with the conversion, we paid $15.0 million in cash to induce conversion, of which $12.0 million was paid at closing, with the remaining $3.0 million paid in January 2019. In addition, we paid other costs associated with this transaction of $0.5 million. The $15.0 million inducement dividend and the $0.5 million of other costs are reported within ‘Dividends on Series A convertible preferred stock’ in the consolidated statement of operations for the year ended December 31, 2018. Subsequently, in November 2019, Blackstone sold all shares of its common stock in an underwritten public offering.
11. REVENUES
We adopted authoritative guidance related to the recognition of revenue from contracts with customers effective January 1, 2018 using the modified retrospective method. The 2017 comparative information presented in the consolidated financial statements was not restated and is reported under the accounting standards in effect for the periods presented.
Revenues by reportable operating segment and by channel were:
| | | | | | | | | | | | | | | | | | | | | | | | | | | | | |
| Year Ended December 31, 2019 | | | | | | | | |
| Americas | | Asia Pacific | | EMEA | | Other Businesses | | Total |
| (in thousands) | | | | | | | | |
| Channel: | | | | | | | | | |
| Wholesale | $ | 275,284 | | | $ | 207,405 | | | $ | 173,480 | | | $ | 58 | | | $ | 656,227 | |
| Retail | 241,694 | | | 74,793 | | | 30,875 | | | — | | | 347,362 | |
| E-commerce | 123,537 | | | 65,874 | | | 37,593 | | | — | | | 227,004 | |
| Total revenues | $ | 640,515 | | | $ | 348,072 | | | $ | 241,948 | | | $ | 58 | | | $ | 1,230,593 | |
| | | | | | | | | | | | | | | | | | | | | | | | | | | | | |
| Year Ended December 31, 2018 | | | | | | | | |
| Americas | | Asia Pacific | | EMEA | | Other Businesses | | Total |
| (in thousands) | | | | | | | | |
| Channel: | | | | | | | | | |
| Wholesale | $ | 216,797 | | | $ | 203,110 | | | $ | 154,992 | | | $ | 3,145 | | | $ | 578,044 | |
| Retail | 204,806 | | | 87,264 | | | 35,358 | | | — | | | 327,428 | |
| E-commerce | 98,589 | | | 54,224 | | | 29,920 | | | — | | | 182,733 | |
| Total revenues | $ | 520,192 | | | $ | 344,598 | | | $ | 220,270 | | | $ | 3,145 | | | $ | 1,088,205 | |
Revenues are recognized in the amount expected to be received in exchange when control of the products transfers to customers, and excludes various forms of promotions, which range from contractually-fixed percentage price reductions to sales returns, discounts, rebates, and other incentives that may vary in amount, must be estimated, and are reported as a reduction in revenues. Variable amounts are estimated based on an analysis of historical experience and adjusted as better estimates become available. During the year ended December 31, 2019, we recognized a net increase of $0.4 million to wholesale revenues and a decrease of $0.1 million to e-commerce revenues due to changes in estimates related to products transferred to customers in prior periods. During the year ended December 31, 2018, we recognized a net increase of $0.8 million to wholesale revenues and no change to e-commerce revenues due to changes in estimates related to products transferred to customers in prior periods. There were no changes to estimates in retail channels during the years ended December 31, 2019 and 2018.
We elected to exclude from revenues taxes assessed by governmental authorities, including value-added and other sales-related taxes, that are imposed on and concurrent with revenue-producing activities, and as a result there is no change in presentation from prior comparative periods.
We also elected to expense incremental costs to obtain customer contracts, consisting primarily of commission incentives, when incurred because the related amortization period is short-term. These costs are reported within ‘Selling, general and administrative expenses’ in our consolidated statement of operations.
The following is a description of our principal revenue-generating activities by distribution channel. We have three reportable operating segments and sell our products using three primary distribution channels. For more detailed information about reportable operating segments, see Note 16 — Operating Segments and Geographic Information.
Wholesale Channel
For the majority of wholesale customers, control transfers and revenues are recognized when the product is shipped or delivered from a manufacturing facility or distribution center to the wholesale customer. In certain cases, control of the product transfers and revenues are recognized when the customer receives the product at the designated delivery point. For certain customers, primarily in the Asia Pacific region, cash payment from customers is required in advance of delivery and revenues are recognized upon the later of cash receipt or delivery of the product. For a small number of customers in the Asia Pacific region, products are sold on consignment and revenues are recognized on a sell-through basis. Wholesale customers are invoiced when products are shipped or delivered.
We have arrangements that grant certain wholesale customers exclusive licenses, concurrent with the terms of the related distribution agreements, to use our intellectual property in exchange for a sales-based royalty. Sales-based royalty revenues are recognized over the terms of the related license agreements as sales are made by the wholesalers.
Retail Channel
We transfer control of products and recognize revenues at Company-operated retail stores at the point of sale, in exchange for cash or other payment, primarily debit or credit card. A portion of the transaction price charged to our customers is variable, primarily due to promotional discounts or allowances, and terms that permit retail customers to exchange or return products for a full refund within a limited period of time. When recognizing revenues, the amount of revenues associated with expected sales returns is estimated based on historical experience, and adjustments to our estimates are made when the most likely amount of consideration we expect to receive changes.
E-commerce Channel
In the e-commerce channel, we transfer control and recognize revenues when the product is shipped from the distribution centers. Payment from customers is primarily through debit and credit card and is made at the time the customer order is shipped.
Similar to the retail channel, a portion of the amount of revenue is variable, primarily due to sales returns, discounts, and other promotional allowances offered to our customers. When recognizing revenues, the amount of revenues associated with expected sales returns is estimated based on historical experience, and adjustments are made when the most likely amount of consideration changes.
Contract Liabilities
Contract liabilities consist of advance cash deposits received from wholesale customers to secure product orders in connection with selling seasons, and payments received in advance of delivery. As products are shipped and control transfers, we recognize the deferred revenue in ‘Revenues’ in the consolidated statements of operations. At December 31, 2019 and 2018, $1.2 million and $1.6 million, respectively, of deferred revenues associated with advance customer deposits were reported in ‘Accrued expenses and other liabilities’ in the consolidated balance sheets. Deferred revenues of $2.0 million, including the balance recorded at December 31, 2018 of $1.6 million, were recognized in revenues during the year ended December 31, 2019. The deferred revenues at December 31, 2019 are expected to be recognized in revenues during the first quarter of 2020 as products are shipped or delivered.
Refund Liabilities
Refund liabilities, primarily associated with product sales returns, retrospective volume rebates, and early payment discounts are estimated based on an analysis of historical experience, and adjustments to revenues made when the most likely amount of consideration expected changes. At December 31, 2019 and 2018, $7.1 million and $6.4 million, respectively, of refund liabilities, primarily associated with product returns, were reported in ‘Accrued expenses and other liabilities’ in the consolidated balance sheets.
12. SHARE-BASED COMPENSATION
Our share-based compensation awards are issued under the 2015 Equity Incentive Plan (“2015 Plan”) and predecessor plan, the 2007 Equity Incentive Plan (“2007 Plan”). Any awards that expire or are forfeited under the 2007 Plan become available for issuance under the 2015 Plan. We account for forfeitures as they occur when calculating share-based compensation expense. The aforementioned plans provide for the issuance of previously unissued common stock in connection with the exercise of stock options and conversion of other share-based awards. As of December 31, 2019, 2.4 million shares of common stock remained available for future issuance under all plans, subject to adjustment for future stock splits, stock dividends, and similar changes in capitalization.
Share-Based Compensation Expense
Pre-tax share-based compensation expense reported in the consolidated statements of operations was:
| | | | | | | | | | | | | | | | | |
| Year Ended December 31, | | | | |
| 2019 | | 2018 | | 2017 |
| (in thousands) | | | | | |
| Cost of sales | $ | 580 | | | $ | 362 | | | $ | 379 | |
| Selling, general and administrative expenses | 13,832 | | | 12,743 | | | 9,394 | |
| Total share-based compensation expense | $ | 14,412 | | | $ | 13,105 | | | $ | 9,773 | |
Stock Option Activity
Stock option activity during the year ended December 31, 2019 was:
| | | | | | | | | | | | | | | | | | | | | | | |
| Number of Options | | Weighted Average Exercise Price | | Weighted Average Contractual Life (Years) | | Aggregate Intrinsic Value |
| (in thousands, except exercise price and years) | | | | | | | |
Outstanding as of December 31, 2018 | 362 | | | $ | 11.05 | | | 5.68 | | $ | 5,407 | |
| Granted | — | | | — | | | | | |
| Exercised | (27) | | | 13.25 | | | | | |
| Forfeited or expired | (20) | | | 17.54 | | | | | |
Outstanding as of December 31, 2019 | 315 | | | $ | 10.45 | | | 5.28 | | $ | 9,904 | |
Exercisable at December 31, 2019 | 248 | | | $ | 11.38 | | | 4.71 | | $ | 7,577 | |
Vested and expected to vest at December 31, 2019 | 315 | | | $ | 10.45 | | | 5.28 | | $ | 9,904 | |
No stock options were granted during 2019 or 2018. During the year ended December 31, 2017, stock options were valued using a Black Scholes option pricing model using the following assumptions.
| | | | | |
| | Year Ended December 31, 2017 |
| Expected volatility | 40.7% | |
| Dividend yield | — | |
| Risk-free interest rate | 1.76% | |
| Expected life (in years) | 4.0 |
The weighted average grant date fair value of stock options granted during the year ended December 31, 2017 was approximately $2.37 per share. The aggregate intrinsic value of stock options exercised during the years ended December 31, 2019, 2018, and 2017 was $0.4 million, $1.7 million, and $0.1 million, respectively. During the years ended December 31, 2019, 2018, and 2017, we received $0.4 million, $1.3 million, and $0.1 million cash in connection with the exercise of stock options.
As of December 31, 2019, we had $0.1 million of total unrecognized share-based compensation expense related to unvested options, which is expected to be amortized over the remaining weighted average period of 0.4 years.
Stock options under the 2015 Plan and 2007 Plan generally vest ratably over four years with the first vesting occurring one year from the date of grant, followed by monthly vesting for the remaining three years, and expire ten years after the date of grant.
Restricted Stock Awards and Restricted Stock Units Activity
From time to time, we grant RSAs and RSUs. RSAs and RSUs generally vest over three years, depending on the terms of the grant. Holders of unvested RSAs have the same rights as those of common stockholders including voting rights and non-forfeitable dividend rights. However, ownership of unvested RSAs cannot be transferred until vested. Holders of unvested RSUs have a contractual right to receive a share of common stock upon vesting. RSUs have dividend equivalent rights, which accrue over the term of the award and are paid if and when the RSUs vest, but RSU holders have no voting rights. We grant service-condition RSUs, performance-condition RSUs, and market-condition RSUs.
Service-condition RSUs are typically granted on an annual basis and vest over time in three equal annual installments, beginning one year after the grant date. During the years ended December 31, 2019, 2018, and 2017, we granted 0.3 million, 0.4 million, and 1.1 million service-condition RSUs, respectively.
Performance-condition RSUs are typically granted on an annual basis and consist of a performance-based and service-based component. The performance targets and vesting conditions for performance-condition RSUs are based on achievement of multiple weighted performance goals. The number of performance-condition RSUs ultimately awarded may be between 0% and 200%, based on performance. These RSUs vest in three equal annual installments beginning one year after the grant date, pending certification of performance achievement by the Compensation Committee and continued service. The fair value of performance-condition awards is based on the closing market price of our common stock on the grant date. Compensation
expense, net of forfeitures, is updated for our expected performance level against performance goals at the end of each reporting period. We also periodically grant market-condition RSUs to certain executives. The grant date fair value and derived service period for market-condition RSUs are estimated using a Monte Carlo simulation valuation model. During the years ended December 31, 2019, 2018, and 2017, we granted 0.5 million, 1.0 million, and 1.3 million performance- and market-condition RSUs, respectively.
RSA and RSU activity during the year ended December 31, 2019 was:
| | | | | | | | | | | | | | | | | | | | | | | |
| Restricted Stock Awards | | | | Restricted Stock Units | | |
| Shares | | Weighted Average Grant Date Fair Value | | Shares | | Weighted Average Grant Date Fair Value |
| (in thousands, except fair value data) | | | | | | | |
Unvested at December 31, 2018 | 6 | | | $ | 18.61 | | | 2,752 | | | $ | 11.58 | |
| Granted | 12 | | | 20.53 | | | 817 | | | 25.37 | |
| Vested | (13) | | | 20.00 | | | (997) | | | 9.92 | |
| Forfeited | — | | | — | | | (645) | | | 11.79 | |
Unvested at December 31, 2019 | 5 | | | $ | 19.39 | | | 1,927 | | | $ | 17.77 | |
The weighted average grant date fair value of RSAs granted during the years ended December 31, 2019, 2018, and 2017 was $20.53, $18.61, and $6.84 per share. RSAs vested during the years ended December 31, 2019, 2018, and 2017 consisted entirely of service-based awards. The total grant date fair value of RSAs vested was $0.2 million in each of the years ended December 31, 2019, 2018, and 2017.
As of December 31, 2019, unrecognized share-based compensation expense for RSAs was $0.1 million, which is expected to amortize over a remaining weighted average period of 0.4 years.
The weighted average grant date fair value of RSUs granted during the years ended December 31, 2019, 2018, and 2017 was $25.37, $14.34, and $6.84 per share. RSUs vested during the year ended December 31, 2019 consisted of 0.6 million service-condition awards and 0.4 million performance- and market-condition awards. RSUs vested during the year ended December 31, 2018 consisted of 0.9 million service-condition awards and 0.2 million performance- and market-condition awards. RSUs vested during the year ended December 31, 2017 consisted of 0.7 million service-condition awards and 0.1 million performance- and market-condition awards. The total grant date fair value of RSUs vested during the years ended December 31, 2019, 2018, and 2017 was $9.9 million, $9.7 million and $8.3 million, respectively.
As of December 31, 2019, unrecognized share-based compensation expenses for service-condition RSUs were $8.5 million and for performance- and market-condition RSUs were $5.0 million, and are expected to amortize over remaining weighted average periods of 1.3 years and 1.6 years, respectively.
13. INCOME TAXES
During the year ended December 31, 2017, as a result of the Tax Act, we recorded provisional estimates related to the revaluation of our net deferred tax assets at the lower U.S. corporate income tax rate and the additional tax expense associated with the deemed repatriation tax. During the year ended December 31, 2018, we recorded measurement period adjustments related to the provisional estimates. While we consider our accounting for the Tax Act to be complete, we continue to evaluate new guidance and legislation as it is issued. We have not changed our indefinite reinvestment assertion, and we have elected to account for the impact of global intangible low tax income based on the period cost method.
The following table sets forth income before taxes and the expense for income taxes:
| | | | | | | | | | | | | | | | | |
| | Year Ended December 31, | | | | |
| | 2019 | | 2018 | | 2017 |
| | (in thousands) | | | | |
| Income (loss) before taxes: | | | | | |
| U.S. | $ | 58,822 | | | $ | 10,088 | | | $ | (34,406) | |
| Foreign | 60,500 | | | 55,069 | | | 52,586 | |
| Total income (loss) before taxes | $ | 119,322 | | | $ | 65,157 | | | $ | 18,180 | |
| Income tax expense (benefit): | | | | | |
| Current income taxes: | | | | | |
| U.S. federal | $ | 1,284 | | | $ | 1,156 | | | $ | 1,383 | |
| U.S. state | 1,427 | | | 246 | | | 127 | |
| Foreign | 13,373 | | | 12,359 | | | 9,525 | |
| Total current income taxes | 16,084 | | | 13,761 | | | 11,035 | |
| Deferred income taxes: | | | | | |
| U.S. federal | (10,249) | | | 276 | | | 1,300 | |
| U.S. state | (3,579) | | | — | | | — | |
| Foreign | (2,431) | | | 683 | | | (4,393) | |
| Total deferred income taxes | (16,259) | | | 959 | | | (3,093) | |
| Total income tax expense (benefit) | $ | (175) | | | $ | 14,720 | | | $ | 7,942 | |
The following table sets forth income reconciliations of the statutory federal income tax rate to actual rates based on income or loss before income taxes:
| | | | | | | | | | | | | | | | | | | | | | | | | | | | | | | | | | | |
| | Year Ended December 31, | | | | | | | | | | |
| | 2019 | | | | 2018 | | | | 2017 | | |
| | (in thousands) | | | | | | | | | | |
| Income tax expense and rate attributable to: | | | | | | | | | | | |
| Federal income tax rate | $ | 25,058 | | | 21.0 | % | | $ | 13,683 | | | 21.0 | % | | $ | 6,363 | | | 35.0 | % |
State income tax rate, net of federal benefit | 5,983 | | | 5.0 | % | | 1,271 | | | 2.0 | % | | 53 | | | 0.3 | % |
| Foreign income tax rate differential | 1,994 | | | 1.7 | % | | 7,630 | | | 11.6 | % | | (11,768) | | | (64.7) | % |
| Enacted changes in tax law | 634 | | | 0.5 | % | | 495 | | | 0.8 | % | | 17,645 | | | 97.1 | % |
| GILTI, net | 7,585 | | | 6.4 | % | | 3,443 | | | 5.3 | % | | — | | | — | % |
| Non-deductible / non-taxable items | 6,727 | | | 5.7 | % | | 3,602 | | | 5.5 | % | | 6,006 | | | 33.0 | % |
| Change in valuation allowance | (33,691) | | | (28.2) | % | | (5,304) | | | (8.1) | % | | 24,400 | | | 134.2 | % |
| U.S. tax on foreign earnings | — | | | — | % | | — | | | — | % | | (32,427) | | | (178.4) | % |
| Foreign tax credits | (12,541) | | | (10.5) | % | | (7,709) | | | (11.9) | % | | (7,980) | | | (43.9) | % |
| Uncertain tax positions | 278 | | | 0.2 | % | | (1,696) | | | (2.6) | % | | 1,054 | | | 5.8 | % |
| Audit settlements | 391 | | | 0.3 | % | | 183 | | | 0.3 | % | | 354 | | | 1.9 | % |
| Share-based compensation | (2,715) | | | (2.3) | % | | 764 | | | 1.2 | % | | 882 | | | 4.9 | % |
| Deferred income tax account adjustments | — | | | — | % | | (25) | | | — | % | | 2,679 | | | 14.7 | % |
| Other | 122 | | | 0.1 | % | | (1,617) | | | (2.5) | % | | 681 | | | 3.8 | % |
| Effective income tax expense and rate | $ | (175) | | | (0.1) | % | | $ | 14,720 | | | 22.6 | % | | $ | 7,942 | | | 43.7 | % |
Deferred income taxes reflect the net effects of temporary differences between the carrying amounts of assets and liabilities for financial reporting purposes and the amounts used for income tax purposes. The following table sets forth deferred income tax assets and liabilities as of the date shown:
| | | | | | | | | | | |
| | December 31, | | |
| | 2019 | | 2018 |
| | (in thousands) | | |
| Non-current deferred tax assets: | | | |
| Share-based compensation expense | $ | 2,218 | | | $ | 2,051 | |
| Accruals, reserves, and other expenses | 13,726 | | | 18,734 | |
| Net operating loss | 29,997 | | | 37,727 | |
| Intangible assets | 990 | | | 1,363 | |
| | | |
| | | |
| Foreign tax credit | 64,355 | | | 66,321 | |
Operating lease liabilities (1) | 36,996 | | | — | |
| Other | 4,467 | | | 3,611 | |
| Valuation allowance | (79,023) | | | (113,237) | |
| Total non-current deferred tax assets | $ | 73,726 | | | $ | 16,570 | |
| Non-current deferred tax liabilities: | | | |
| Unrealized gain on foreign currency | $ | (529) | | | $ | (164) | |
| Property and equipment | (13,713) | | | (7,332) | |
Right-of-use assets (1) | (34,470) | | | — | |
| Other | (267) | | | (411) | |
| Total non-current deferred tax liabilities | $ | (48,979) | | | $ | (7,907) | |
(1) Adoption of new lease accounting guidance as of January 1, 2019, as described in Note 2 — Recent Accounting Pronouncements, resulted in the recognition of a right-of-use asset deferred tax liability and an operating lease liability deferred tax asset. These temporary differences will reverse over the life of the leases.
During 2019, valuation allowances recorded against deferred tax assets decreased by $34.2 million. The change in the valuation allowance includes $33.7 million related to income tax expense and $0.5 million, which does not impact the tax provision because this amount reflects the cumulative impact of unrecorded tax attributes related to changes in cumulative translation adjustment. During 2018, valuation allowances decreased by $6.3 million. The change in the valuation allowance includes $5.3 million related to income tax expense and $1.0 million which does not impact the tax provision because this amount reflects the impact of unrecorded tax attributes related to changes in cumulative translation adjustment.
Our valuation allowances are primarily the result of uncertainties regarding the future realization of tax attributes recorded in various jurisdictions. The measurement of deferred tax assets is reduced by a valuation allowance if, based upon available evidence, it is more likely than not the deferred tax assets will not be realized. We have evaluated the realizability of our deferred tax assets in each jurisdiction by assessing the adequacy of expected taxable income, including the reversal of existing temporary differences, historical and projected operating results and the availability of prudent and feasible tax planning strategies. In assessing our valuation allowance we considered all available evidence, including the magnitude of recent and current operating results, the duration of statutory carryforward periods, our historical experience utilizing tax attributes prior to their expiration dates, the historical volatility of operating results of these jurisdictions and our assessment regarding the sustainability of their profitability. The weight we give to any particular item is, in part, dependent upon the degree to which it can be objectively verified. As of December 31, 2019, certain jurisdictions, for which we have historically recorded significant valuation allowances, have sufficient history of sustained profitability. As a result, valuation allowances recorded against deferred tax assets decreased by $34.2 million.
In certain other jurisdictions, we recorded additional attributes, primarily driven by operational losses recognized based on local tax accounting requirements. These carryforwards were generated in jurisdictions where results indicate it is not more likely than not the deferred tax assets would be realized. We maintain a valuation allowance against the majority of these deferred tax assets.
We have recorded deferred tax assets related to U.S. federal tax carryforwards, including foreign tax credits and other tax credits, which expire at various dates between 2024 and 2039 of $39.7 million and $46.6 million as of December 31, 2019 and 2018, respectively. We recorded deferred tax assets related to U.S. state tax net operating loss carryforwards which expire at
various dates between 2020 and those which do not expire of $6.7 million and $11.1 million at December 31, 2019 and 2018, respectively. We recorded deferred tax assets related to foreign tax carryforwards, including foreign tax credits and net operating losses, which expire starting in 2020 and those which do not expire of $48.0 million and $47.7 million as of December 31, 2019 and 2018, respectively. The valuation allowance maintained against our U.S. deferred tax assets as of December 31, 2019 primarily relates to foreign tax credits and state net operating losses carryforwards that have a limited carryforward period and are not anticipated to be utilized prior to expiration. We also maintain a valuation allowance against a portion of the foreign carryforwards.
The transition tax in the Tax Act imposed a tax on undistributed and previously untaxed foreign earnings at various tax rates. This tax largely eliminated the differences between the financial reporting and income tax basis of foreign undistributed earnings. Furthermore, as of December 31, 2019, foreign withholding taxes have not been provided on unremitted earnings of subsidiaries operating outside of the U.S. as these amounts are considered to be indefinitely reinvested.
The following table sets forth a reconciliation of the beginning and ending amount of unrecognized tax benefits:
| | | | | | | | | | | | | | | | | |
| | Year Ended December 31, | | | | |
| | 2019 | | 2018 | | 2017 |
| | (in thousands) | | | | |
| Unrecognized tax benefit as of January 1 | $ | 4,511 | | | $ | 6,204 | | | $ | 4,750 | |
| Additions in tax positions taken in prior period | 631 | | | 250 | | | 683 | |
| Reductions in tax positions taken in prior period | (1,532) | | | (690) | | | — | |
| Additions in tax positions taken in current period | 1,786 | | | 461 | | | 966 | |
| Settlements | (391) | | | (621) | | | (123) | |
| Lapse of statute of limitations | (368) | | | (1,045) | | | (414) | |
| Cumulative foreign currency translation adjustment | (24) | | | (48) | | | 342 | |
| Unrecognized tax benefit as of December 31 | $ | 4,613 | | | $ | 4,511 | | | $ | 6,204 | |
We recorded a net expense of $0.3 million related to increases in 2019 unrecognized tax benefits combined with amounts effectively settled under audit. Unrecognized tax benefits as of December 31, 2019 relate to tax years that are currently open under the statute of limitation. The primary impact of uncertain tax benefits on the rate reconciliation includes audit settlements, net increases in position changes, and accrued interest expense.
Interest and penalties related to income tax liabilities are included in ‘Income tax expense (benefit)’ in the consolidated statements of operations. For the years ended December 31, 2019, 2018, and 2017, we recorded approximately $0.4 million, $0.2 million, and $0.2 million, respectively, of penalties and interest. During the year ended December 31, 2019, we released $0.2 million of interest from settlements, lapse of statutes, and change in certainty. The cumulative accrued balance of penalties and interest was $0.7 million, $0.6 million, and $0.7 million, as of December 31, 2019, 2018, and 2017, respectively.
Unrecognized tax benefits of $4.0 million, $4.5 million and $6.2 million as of December 31, 2019, 2018, and 2017, respectively, if recognized, would reduce the annual effective tax rate offset by deferred tax assets recorded for uncertain tax positions.
The following table sets forth the tax years subject to examination for the major jurisdictions where we conduct business as of December 31, 2019:
| | | | | |
| The Netherlands | 2005 to 2019 |
| Canada | 2011 to 2019 |
| Japan | 2012 to 2019 |
| China | 2009 to 2019 |
| Singapore | 2014 to 2019 |
| United States | 2010 to 2019 |
We are currently under audit in Japan and Taiwan. U.S. state tax returns are generally subject to examination for a period of three to five years after filing of the respective return. The state impact of any federal changes remains subject to examination by various state jurisdictions for a period up to two years after formal notification to the states. As such, U.S. state income tax returns for us are generally subject to examination for the years 2014 to 2019. Although the timing of income tax audit
resolutions and negotiations with taxing authorities is highly uncertain, we do not anticipate a significant change in the total amount of unrecognized tax benefits within the next twelve months.
14. EARNINGS PER SHARE
Basic and diluted EPS for the years ended December 31, 2019, 2018, and 2017 were as follows:
| | | | | | | | | | | | | | | | | |
| Year Ended December 31, | | | | |
| 2019 | | 2018 | | 2017 |
| (in thousands, except per share data) | | | | |
| Numerator: | | | | | |
Net income (loss) attributable to common stockholders (1) | $ | 119,497 | | | $ | (69,216) | | | $ | (5,294) | |
| | | | | |
| | | | | |
| Denominator: | | | | | |
| Weighted average common shares outstanding - basic | 70,357 | | | 68,421 | | | 72,255 | |
Plus: dilutive effect of stock options and unvested restricted stock units | 1,414 | | | — | | | — | |
Weighted average common shares outstanding - diluted | 71,771 | | | 68,421 | | | 72,255 | |
| | | | | |
Net income (loss) per common share: | | | | | |
| Basic | $ | 1.70 | | | $ | (1.01) | | | $ | (0.07) | |
| Diluted | $ | 1.66 | | | $ | (1.01) | | | $ | (0.07) | |
(1) Net loss attributable to common stockholders for the year ended December 31, 2018 reflects the repurchase and conversion of Series A Convertible Preferred Stock.
For the year ended December 31, 2019, no outstanding shares issued under share-based compensation awards were anti-dilutive and, therefore, excluded from the calculation of diluted EPS. For the years ended December 31, 2018 and 2017, all outstanding shares issued under share-based compensation awards were excluded from the calculation of diluted EPS because the effect was anti-dilutive. Additionally, for the year ended December 31, 2017, all potentially convertible Series A Preferred shares were excluded from the calculation of diluted EPS because the effect was anti-dilutive.
15. COMMITMENTS AND CONTINGENCIES
Purchase Commitments
As of December 31, 2019 and 2018, we had purchase commitments to our third-party manufacturers, primarily for materials and supplies used in the manufacture of our products, for an aggregate of $155.5 million and $165.3 million, respectively. We expect to fulfill our commitments under these agreements in the normal course of business, and as such, no liability has been recorded.
Other
We are regularly subject to, and is currently undergoing, audits by various tax authorities in the U.S. and several foreign jurisdictions, including customs duties, import and other taxes for prior tax years.
During our normal course of business, we may make certain indemnities, commitments, and guarantees under which it may be required to make payments in relation to certain matters. We cannot determine a range of estimated future payments and has not recorded any liability for such payments in the accompanying consolidated balance sheets.
See Note 17 — Legal Proceedings for further details regarding potential loss contingencies related to government tax audits and other current legal proceedings.
16. OPERATING SEGMENTS AND GEOGRAPHIC INFORMATION
We have three reportable operating segments: the Americas, Asia Pacific, and Europe, Middle East, and Africa (“EMEA”). ‘Other businesses’ aggregates insignificant operating segments that do not meet the reportable segment threshold, including corporate operations and, in 2018 and 2017, company-operated manufacturing facilities, which substantially ceased operations in the third quarter of 2018.
Each of the reportable operating segments derives its revenues from the sale of footwear and accessories to external customers. Revenues for ‘Other businesses’ include non-footwear and accessories product sales to external customers that are excluded from the measurement of segment operating revenues and income.
Segment performance is evaluated based on segment results without allocating corporate expenses, or indirect general, administrative, and other expenses. Segment profits or losses include adjustments to eliminate inter-segment sales. Reconciling items between segment income from operations and income from operations consist of other businesses and unallocated corporate expenses, as well as inter-segment eliminations. We do not report asset information by segment because that information is not used to evaluate performance or allocate resources between segments. The following tables set forth information related to reportable operating segments:
| | | | | | | | | | | | | | | | | |
| Year Ended December 31, | | | | |
| 2019 | | 2018 | | 2017 |
| (in thousands) | | | | |
| Revenues: | | | | | |
| Americas | $ | 640,515 | | | $ | 520,192 | | | $ | 480,146 | |
| Asia Pacific | 348,072 | | | 344,598 | | | 336,073 | |
| EMEA | 241,948 | | | 220,270 | | | 206,424 | |
| Segment revenues | 1,230,535 | | | 1,085,060 | | | 1,022,643 | |
| Other businesses | 58 | | | 3,145 | | | 870 | |
| Total consolidated revenues | $ | 1,230,593 | | | $ | 1,088,205 | | | $ | 1,023,513 | |
| Income from operations: | | | | | |
| Americas | $ | 204,868 | | | $ | 138,940 | | | $ | 96,740 | |
| Asia Pacific | 80,645 | | | 82,780 | | | 72,950 | |
| EMEA | 70,326 | | | 59,539 | | | 37,185 | |
| Segment income from operations | 355,839 | | | 281,259 | | | 206,875 | |
Reconciliation of segment income from operations to income before income taxes: | | | | | |
| Other businesses | (54,936) | | | (55,583) | | | (22,861) | |
Unallocated corporate (1) | (172,254) | | | (162,732) | | | (166,678) | |
| Total consolidated income from operations | 128,649 | | | 62,944 | | | 17,336 | |
| Foreign currency gains (losses), net | (1,323) | | | 1,318 | | | 563 | |
| Interest income | 601 | | | 1,281 | | | 870 | |
| Interest expense | (8,636) | | | (955) | | | (869) | |
| Other income | 31 | | | 569 | | | 280 | |
| Income before income taxes | $ | 119,322 | | | $ | 65,157 | | | $ | 18,180 | |
| Depreciation and amortization: | | | | | |
| Americas | $ | 3,593 | | | $ | 4,640 | | | $ | 5,473 | |
| Asia Pacific | 963 | | | 2,049 | | | 3,405 | |
| EMEA | 793 | | | 1,252 | | | 1,937 | |
| Total segment depreciation and amortization | 5,349 | | | 7,941 | | | 10,815 | |
| Other businesses | 5,234 | | | 5,256 | | | 6,748 | |
| Unallocated corporate | 13,630 | | | 16,053 | | | 15,567 | |
| Total consolidated depreciation and amortization | $ | 24,213 | | | $ | 29,250 | | | $ | 33,130 | |
(1) Includes corporate support and administrative functions, costs associated with share-based compensation, research and development, marketing, legal, depreciation and amortization of corporate and other assets not allocated to operating segments, and intersegment eliminations.
There were no customers who represented 10% or more of consolidated revenues during the years ended December 31, 2019, 2018 and 2017. The following table sets forth certain geographical information regarding Crocs’ revenues for the periods as shown:
| | | | | | | | | | | | | | | | | |
| | Year Ended December 31, | | | | |
| | 2019 | | 2018 | | 2017 |
| | (in thousands) | | | | |
| Location: | | | | | |
| United States | $ | 563,473 | | | $ | 442,544 | | | $ | 388,847 | |
| International | 667,120 | | | 645,661 | | | 634,666 | |
| Total revenues | $ | 1,230,593 | | | $ | 1,088,205 | | | $ | 1,023,513 | |
The following table sets forth geographical information regarding property and equipment assets as of the dates shown:
| | | | | | | | | | | |
| | December 31, | | |
| | 2019 | | 2018 |
| | (in thousands) | | |
| Location: | | | |
| United States | $ | 41,745 | | | $ | 17,489 | |
| International | 5,660 | | | 4,722 | |
| Total property and equipment, net | $ | 47,405 | | | $ | 22,211 | |
17. LEGAL PROCEEDINGS
We were subjected to an audit by the Brazilian Federal Tax Authorities related to imports of footwear from China between 2010 and 2014. On January 13, 2015, we were notified about the issuance of assessments totaling 14.4 million Brazilian Real (“BRL”), or approximately $3.6 million, plus interest and penalties, for the period January 2010 through May 2011. We have disputed these assessments and asserted defenses to the claims. On February 25, 2015, we received additional assessments totaling 33.3 million BRL, or approximately $8.3 million, plus interest and penalties, related to the remainder of the audit period. We also disputed these assessments and asserted defenses to these claims in administrative appeals. On August 29, 2017, we received a favorable ruling on our appeal of the first assessment, which dismissed all fines, penalties, and interest. The tax authorities have appealed that decision and we have challenged the appeal on both the merits and procedure. Additionally, the second appeal for the remaining assessments was heard on March 22, 2018. That decision was partially favorable for Crocs and resulted in an approximately 38% reduction in principal, penalties, and interest, leaving approximately $5.1 million, plus interest and penalties, at risk for those assessments. The tax authorities have appealed that decision and Crocs has filed a response to the tax authorities’ appeal as well as a separate appeal against the unfavorable portion of the ruling. Should the Brazilian Tax Authority prevail in this final administrative appeal, we may still challenge the assessments through the court system, which would likely require the posting of a bond. We have not recorded these items within the consolidated financial statements as it is not possible at this time to predict the timing or outcome of this matter or to estimate a potential amount of loss, if any.
For all other claims and disputes, we have accrued estimated losses of $0.2 million within ‘Accrued expenses and other liabilities’ in our consolidated balance sheet as of December 31, 2019. As we are able, we estimate reasonably possible losses or a range of reasonably possible losses for claims and other disputes. As of December 31, 2019, reasonably possible losses could potentially exceed amounts accrued by up to $1.4 million.
Although we are subject to other litigation from time to time in the ordinary course of business, including employment, intellectual property and product liability claims, other than as set forth above, we are not party to any other pending legal proceedings that it believes would reasonably have a material adverse impact on our business, financial results, and cash flows.
18. EMPLOYEE BENEFIT PLAN
Defined Contribution Plan
We sponsor a qualified defined contribution benefit plan (the “Plan”), covering substantially all of our U.S. employees. The Plan includes a savings plan feature under Section 401(k) of the Internal Revenue Code. We make matching contributions to the plans equal to 100% of the first 3%, and up to 50% of the next 2% of salary contributed by an eligible employee. Participants
are vested 100% in our matching contributions when made. Contributions made by us under the Plan were $5.1 million, $5.4 million and $5.5 million for the years ended December 31, 2019, 2018, and 2017, respectively.
19. UNAUDITED QUARTERLY CONSOLIDATED FINANCIAL INFORMATION
| | | | | | | | | | | | | | | | | | | | | | | |
| | For the Quarter Ended | | | | | | |
| | March 31, 2019 | | June 30, 2019 | | September 30, 2019 | | December 31, 2019 |
| | (in thousands, except per share data) | | | | | | |
Revenues (1) | $ | 295,949 | | | $ | 358,899 | | | $ | 312,766 | | | $ | 262,979 | |
| Gross profit | 137,615 | | | 189,379 | | | 163,824 | | | 126,238 | |
Income from operations | 32,578 | | | 47,831 | | | 39,884 | | | 8,356 | |
Net income (2) | 24,710 | | | 39,198 | | | 35,676 | | | 19,913 | |
Net income attributable to common shareholders (2) | 24,710 | | | 39,198 | | | 35,676 | | | 19,913 | |
Basic income per common share (3) | $ | 0.34 | | | $ | 0.55 | | | $ | 0.52 | | | $ | 0.29 | |
Diluted income per common share (3) | $ | 0.33 | | | $ | 0.55 | | | $ | 0.51 | | | $ | 0.29 | |
(1) Due to the seasonal nature of our products, we experience decreased revenues in the fourth quarter of the year relative to the other quarters.
(2) During the three months ended December 31, 2019, we reduced a portion of the valuation allowance recorded against certain deferred tax assets, resulting in a tax benefit. See Note 13 — Income Taxes for more information.
(3) Basic and diluted income per common share are computed independently for each of the quarters presented. Therefore, the sum of the quarters may not equal the annual amounts presented in the consolidated statements of operations.
| | | | | | | | | | | | | | | | | | | | | | | |
| | For the Quarter Ended | | | | | | |
| | March 31, 2018 | | June 30, 2018 | | September 30, 2018 | | December 31, 2018 |
| | (in thousands, except per share data) | | | | | | |
Revenues (1) | $ | 283,148 | | | $ | 328,004 | | | $ | 261,064 | | | $ | 215,989 | |
| Gross profit | 139,873 | | | 181,400 | | | 139,059 | | | 99,822 | |
Income (loss) from operations | 25,922 | | | 37,064 | | | 13,895 | | | (13,937) | |
Net income (loss) | 16,454 | | | 34,377 | | | 10,492 | | | (10,886) | |
Net income (loss) attributable to common shareholders (2) | 12,523 | | | 30,426 | | | 6,520 | | | (118,685) | |
Basic income (loss) per common share | $ | 0.15 | | | $ | 0.37 | | | $ | 0.08 | | | $ | (1.72) | |
Diluted income (loss) per common share | $ | 0.15 | | | $ | 0.35 | | | $ | 0.07 | | | $ | (1.72) | |
(1) Due to the seasonal nature of our products, we experience decreased revenues in the fourth quarter of the year relative to the other quarters.
(2) The balance in ‘Net income (loss) attributable to common shareholders’ for the three months ended December 31, 2018 was impacted by the repurchase and conversion of Series A Convertible Preferred Stock. See Note 10 — Equity and the consolidated statement of operations for more information.
APPENDIX A
SCHEDULE II - VALUATION AND QUALIFYING ACCOUNTS
CROCS, INC. AND SUBSIDIARIES
| | | | | | | | | | | | | | | | | | | | | | | |
| | | | | | | |
| Balance at Beginning of Period | | Charged to Costs and Expenses | | Deductions (1) | | Balance at End of Period |
| (in thousands) | | | | | | |
Year Ended December 31, 2019 | | | | | | | |
| Allowance for doubtful accounts | $ | 10,959 | | | $ | 1,566 | | | $ | (4,249) | | | $ | 8,276 | |
| Reserve for sales returns and allowances | 2,741 | | | 73,027 | | | (70,507) | | | 5,261 | |
| Reserve for unapplied rebates | 6,777 | | | 6,837 | | | (8,354) | | | 5,260 | |
| Total | $ | 20,477 | | | $ | 81,430 | | | $ | (83,110) | | | $ | 18,797 | |
Year Ended December 31, 2018 | | | | | | | |
| Allowance for doubtful accounts | $ | 18,325 | | | $ | 711 | | | $ | (8,077) | | | $ | 10,959 | |
| Reserve for sales returns and allowances | 4,983 | | | 71,865 | | | (74,107) | | | 2,741 | |
| Reserve for unapplied rebates | 8,081 | | | 8,604 | | | (9,908) | | | 6,777 | |
| Total | $ | 31,389 | | | $ | 81,180 | | | $ | (92,092) | | | $ | 20,477 | |
Year Ended December 31, 2017 | | | | | | | |
| Allowance for doubtful accounts | $ | 32,856 | | | $ | 1,235 | | | $ | (15,766) | | | $ | 18,325 | |
| Reserve for sales returns and allowances | 6,121 | | | 65,562 | | | (66,700) | | | 4,983 | |
| Reserve for unapplied rebates | 9,161 | | | 9,318 | | | (10,398) | | | 8,081 | |
| Total | $ | 48,138 | | | $ | 76,115 | | | $ | (92,864) | | | $ | 31,389 | |
(1) Deductions include accounts written off, net of recoveries, and the effects of foreign currency translation.