(State or other jurisdiction of incorporation or organization) |
(I.R.S. Employer Identification No.) |
Title of each class | Trading symbol(s) | Name of each exchange on which registered | ||
N/A | N/A | N/A |
Large accelerated filer _ |
Accelerated filer _ |
Non-accelerated filerX | ||
Smaller reporting company |
Emerging growth company |
PART I
Item 1. Business.
(a) General Development of Business. Ceres Tactical Commodity L.P. (the “Partnership”) is a limited partnership organized on April 20, 2005 under the partnership laws of the State of New York to engage, directly or indirectly, in the speculative trading of commodity interests on United States (“U.S.”) and international futures, options on futures and forward markets. The Partnership may also engage, directly or indirectly, in swap transactions and other derivative transactions with the approval of the General Partner (as defined below). Initially, the Partnership’s investment strategy focused on energy and energy-related investments. While the Partnership is expected to continue to have significant exposure to energy and energy-related markets, such trading will no longer be the Partnership’s primary focus. Therefore, the Partnership’s past trading performance will not necessarily be indicative of future results. The sectors traded include energy, grains, livestock, metals and softs. The commodity interests that are traded by the Partnership, directly or indirectly through its investment in the Funds (as defined below) are volatile and involve a high degree of market risk. The General Partner may also determine to invest up to all of the Partnership’s assets (directly or indirectly through its investment in the Funds) in U.S. Treasury bills and/or money market mutual funds, including money market mutual funds managed by Morgan Stanley or its affiliates. During the initial offering period, the Partnership sold 11,925 redeemable units of limited partnership interest (“Redeemable Units”). The Partnership commenced trading on September 6, 2005. The Partnership privately and continuously offers Redeemable Units to qualified investors. There is no maximum number of Redeemable Units that may be sold by the Partnership.
Subscriptions and redemptions of Redeemable Units and General Partner contributions and redemptions for the years ended December 31, 2024, 2023 and 2022 are reported in the Statements of Changes in Partners’ Capital under “Item 8. Financial Statements and Supplementary Data.”
Ceres Managed Futures LLC, a Delaware limited liability company, acts as the general partner (the “General Partner”) and commodity pool operator of the Partnership and is the trading manager (the “Trading Manager”) of Drakewood Master (as defined below). The General Partner was also the Trading Manager of NL Master (as defined below) and GSL Master (as defined below) prior to NL Master’s and GSL Master’s respective terminations. The General Partner is a wholly-owned subsidiary of Morgan Stanley Capital Management LLC (“MSCM”). MSCM is ultimately owned by Morgan Stanley. Morgan Stanley is a publicly held company whose shares are listed on the New York Stock Exchange. Morgan Stanley is engaged in various financial services and other businesses.
On April 1, 2019, the Partnership allocated a portion of its assets to CMF NL Master Fund LLC (“NL Master”), a limited liability company organized under the limited liability company laws of the State of Delaware. Effective December 31, 2024, the Partnership fully redeemed its investment in NL Master. On November 1, 2020, the Partnership allocated a portion of its assets to CMF GSL Master Fund LLC (“GSL Master”), a limited liability company organized under the limited liability company laws of the State of Delaware. Effective June 30, 2022, the Partnership fully redeemed its investment in GSL Master. On May 1, 2022, the Partnership allocated a portion of its assets to CMF Drakewood Master Fund LLC (“Drakewood Master”), a limited liability company organized under the limited liability company laws of the State of Delaware. Drakewood Master is referred to as the “Fund.” Reference herein to the “Funds” may also include, as relevant, NL Master and GSL Master.
During the years ended December 31, 2024, 2023 and 2022, the Partnership’s/Funds’ commodity broker was Morgan Stanley & Co. LLC (“MS&Co.”), a registered futures commission merchant.
As of December 31, 2024, all trading decisions are made for the Partnership by Millburn Ridgefield Corporation (“Millburn”), Ospraie Management, LLC (“Ospraie”), Drakewood Capital Management Limited (“Drakewood”), and Opus Futures, LLC (“Opus”) (each an “Advisor” and, collectively, the “Advisors”), each of which is, a registered commodity trading advisor, or has otherwise represented that it is exempt from registration as a commodity trading advisor. Effective December 31, 2024, Northlander Commodity Advisors LLP (“Northlander”) and EMC Capital Advisors, LLC (“EMC”) ceased to act as commodity trading advisors to the Partnership. Effective June 30, 2022, Geosol Capital, LLC (“Geosol”) ceased to act as a commodity trading advisor to the Partnership. Effective October 31, 2022, Pan Capital Management L.P. (“Pan”) ceased to act as a commodity trading advisor to the Partnership. References herein to the “Advisors” may also include, as relevant, EMC, Geosol, Northlander and Pan. A description of the trading activities and focus of each Advisor is included under “Item 7. Management’s Discussion and Analysis of Financial Condition and Results of Operations.” Each Advisor is allocated a portion of the Partnership’s assets to manage. The Partnership invests the portion of its assets allocated to each of the Advisors either directly, through individually managed accounts, or indirectly through its investment in the Funds. The Advisors are not affiliated with one another, are not affiliated with the General Partner and MS&Co., and are not responsible for the organization or operation of the Partnership.
3
As of June 13, 2018, the Partnership began offering three classes of limited partnership interests, Class A Redeemable Units, Class D Redeemable Units and Class Z Redeemable Units. All Redeemable Units issued prior to October 31, 2016 were deemed “Class A Redeemable Units.” Class Z Redeemable Units were first issued on January 1, 2017. The rights, liabilities, risks and fees associated with investment in the Class A Redeemable Units were not changed. Class D Redeemable Units were first issued July 1, 2018. The rights, liabilities, risks, and fees associated with investment in the Class A Redeemable Units and Class Z Redeemable Units were not changed. Class A Redeemable Units, Class D Redeemable Units and Class Z Redeemable Units will each be referred to as a “Class” and collectively referred to as the “Classes.” Class A Redeemable Units are and Class D Redeemable Units were available to taxable U.S. individuals and institutions, U.S. tax exempt individuals and institutions and non-U.S. investors. Class Z Redeemable Units are offered to limited partners who receive advisory services from Morgan Stanley Smith Barney LLC (doing business as Morgan Stanley Wealth Management) (“Morgan Stanley Wealth Management”) and may also be offered to certain employees of Morgan Stanley and/or its subsidiaries (and their family members). Class A Redeemable Units, Class D Redeemable Units and Class Z Redeemable Units are identical, except that Class A Redeemable Units and Class D Redeemable Units are subject to a monthly ongoing selling agent fee equal to 1/12 of 0.75% (a 0.75% annual rate) of the adjusted net assets of Class A Redeemable Units and Class D Redeemable Units, respectively, as of the end of each month, whereas Class Z Redeemable Units are not subject to a monthly ongoing selling agent fee. Effective January 1, 2021, the Partnership ceased offering Class D Redeemable Units.
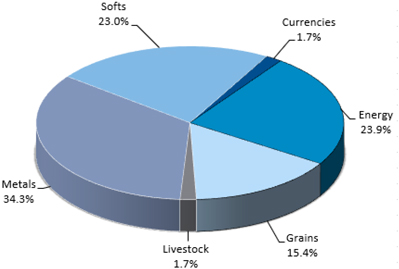
For the period January 1, 2024 through December 31, 2024, the approximate average market sector distribution for the Partnership was as follows:
At December 31, 2024, the Partnership owned approximately 41.3% of Drakewood Master. At December 31, 2023, the Partnership owned approximately 28.3% of NL Master and 35.5% of Drakewood Master. The performance of the Partnership is directly affected by the performance of the Funds.
The Partnership’s/Funds’ trading of futures, forward, swap and option contracts, if applicable, on commodities is done primarily on U.S. commodity exchanges and foreign commodity exchanges. The Partnership/Funds engage in such trading through commodity brokerage accounts maintained with MS&Co.
The General Partner and each limited partner of the Partnership share in the profits and losses of the Partnership in proportion to the amount of Partnership interest owned by each, except that no limited partner is liable for obligations of the Partnership in excess of its capital contribution and profits, if any, net of distributions or redemptions and losses, if any.
The Partnership will be liquidated upon the first of the following to occur: December 31, 2055; the net asset value per Redeemable Unit decreases to less than $400 as of the close of any business day; or under certain circumstances as set forth in the limited partnership agreement of the Partnership, as may be amended or restated from time to time (the “Limited Partnership Agreement.”) In addition, the General Partner may, in its sole discretion, cause the Partnership to dissolve if the Partnership’s aggregate net assets decline to less than $1,000,000.
4
The General Partner administers the business and affairs of the Partnership, including selecting one or more advisors to make trading decisions for the Partnership. The Partnership pays the General Partner a monthly General Partner fee in return for its services to the Partnership equal to 1/12 of 0.75% (0.75% per year) of month-end Net Assets. Month-end Net Assets per Class, for the purpose of calculating the General Partner fee are Net Assets, as defined in the Limited Partnership Agreement, prior to the reduction of the current month’s management fee, incentive fee accrual, the General Partner fee and any redemptions or distributions as of the end of such month. The General Partner fee is allocated proportionately to each Class based on the net asset value of the respective Class. This fee may be increased or decreased at the discretion of the General Partner.
The General Partner, on behalf of the Partnership, entered into management agreements (each, a “Management Agreement”) with the Advisors. The Advisors are not affiliated with one another, are not affiliated with the General Partner or MS&Co. and are not responsible for the organization or operation of the Partnership. The Partnership pays Millburn a monthly management fee equal to 1/12 of 1.0% (1.0% per year) of month-end Net Assets allocated to Millburn. Prior to January 1, 2021, the Partnership paid Millburn a monthly management fee equal to 1/12 of 2.0% (2.0% per year) of month-end Net Assets allocated to Millburn. The Partnership pays Ospraie a monthly management fee equal to 1/12 of 1.5% (1.5% per year) of month-end Net Assets allocated to Ospraie. The Partnership pays Drakewood a monthly management fee equal to 1/12 of 1.5% (1.5% per year) of month-end Net Assets allocated to Drakewood. The Partnership pays Opus a monthly management fee equal to 1/12 of 1.0% (1.0% per year) of month-end Net Assets allocated to Opus. Prior to its termination on December 31, 2024, Northlander was paid a monthly management fee equal to 1/12 of 1.25% (1.25% per year) of month-end Net Assets allocated to Northlander. Prior to its termination on December 31, 2024, EMC was paid a monthly management fee equal to 1/12 of 0.60% (0.60 % per year) of month-end Net Assets allocated to EMC. Prior to its termination on June 30, 2022, Geosol was paid a monthly management fee equal to 1/12 of 1.0% (1.0% per year) of month-end Net Assets allocated to Geosol. Prior to its termination on October 31, 2022, Pan was paid a monthly management fee equal to 1/12 of 1.25% (1.25% per year) of month end Net Assets allocated to Pan. Month-end Net Assets, for the purpose of calculating management fees are Net Assets as defined in the Limited Partnership Agreement, prior to the reduction of the current month’s management fee, incentive fee accrual, the General Partner fee and any redemptions or distributions as of the end of such month. An Advisor’s management fee is allocated proportionately to each Class based on the net asset value of the respective Class.
In addition, the Partnership is obligated to pay each Advisor an incentive fee. The Partnership pays Ospraie, Drakewood, and Opus each an incentive fee, payable annually, equal to 20% of New Trading Profits, as defined in each Management Agreement, earned by the relevant Advisor for the Partnership during each calendar year. The Partnership pays Millburn an incentive fee, payable annually, equal to 27.5% of New Trading Profits, as defined in the Management Agreement, earned by Millburn for the Partnership during the calendar year. Prior to January 1, 2021, Millburn was eligible to receive an incentive fee, payable annually, equal to 20% of New Trading Profits, as defined in the Management Agreement. Prior to its termination on December 31, 2024, Northlander was eligible to receive an incentive fee, payable annually, equal to 20% of New Trading Profits, as defined in the Management Agreement, earned by Northlander for the Partnership each calendar year. Prior to its termination on December 31, 2024, EMC was eligible to receive an incentive fee, payable annually, equal to 20% of New Trading Profits, as defined in the Management Agreement, earned by EMC for the Partnership each calendar year. Prior to its termination on June 30, 2022, Geosol was eligible to receive an incentive fee, payable annually, equal to 20% of New Trading Profits, as defined in the Management Agreement, earned by Geosol for the Partnership each calendar year. Prior to its termination on October 31, 2022, Pan was eligible to receive a quarterly incentive fee equal to 20% of New Trading Profits, as defined in the Management Agreement, earned by Pan for the Partnership each quarter. An Advisor’s incentive fee is allocated proportionally to each Class based on the net asset value of the respective Class. To the extent an Advisor incurs a loss for the Partnership, the Advisor will not be paid an incentive fee until the Advisor recovers the net loss incurred and earns additional new trading profits for the Partnership. Each Management Agreement can be terminated upon notice by either party. In allocating substantially all of the assets of the Partnership among the Advisors, the General Partner considers, among other factors, the Advisors’ past performance, trading style, volatility of markets traded and fee requirements. The General Partner may modify or terminate the allocation of assets among the Advisors and may allocate assets to additional advisors at any time.
The Partnership and the Funds have entered into a customer agreement with MS&Co. (the “Customer Agreement”). Under the Customer Agreement, the Partnership pays trading fees for the clearing and, where applicable, the execution of transactions, as well as exchange, user, give-up, floor brokerage and National Futures Association (“NFA”) fees (collectively, the “clearing fees”) directly and indirectly through its investment in the Funds. Clearing fees are allocated to the Partnership based on its proportionate share of each Fund. Clearing fees are also borne directly by the Partnership for its direct trading. Clearing fees will be paid for the life of the Partnership, although the rate at which such fees are paid may be changed. All of the Partnership’s assets available for trading in commodity interests not held in the Funds’ accounts at MS&Co. are deposited in the Partnership’s accounts at MS&Co. The Partnership’s cash deposited by MS&Co. is held in segregated bank accounts to the extent required by Commodity Futures Trading Commission (“CFTC”) regulations. MS&Co. has agreed to pay the Partnership interest on 100% of the average daily equity maintained in cash in the Partnership’s (or the Partnership’s allocable portion of the Funds’) brokerage account at the rate equal to the monthly average of the 4-week U.S. Treasury bill discount rate.
5
The Partnership has also entered into a selling agreement (the “Selling Agreement”) with Morgan Stanley Wealth Management. Pursuant to the Selling Agreement, the Partnership pays Morgan Stanley Wealth Management a monthly ongoing selling agent fee equal to 0.75% per year of the adjusted month-end net assets of Class A Redeemable Units and Class D Redeemable Units, respectively. Morgan Stanley Wealth Management pays a portion of its ongoing selling agent fees to properly registered or exempted financial advisors who have sold Class A and Class D Redeemable Units in the Partnership. Class Z Redeemable Units are not subject to a monthly ongoing selling agent fee. Month-end net assets, for the purpose of calculating ongoing selling agent fees are net assets, as defined in the Limited Partnership Agreement, prior to the reduction of the current month’s ongoing selling agent fee, management fee, incentive fee accrual, the General Partner fee and other expenses and any redemptions or distributions as of the end of such month.
Generally, a member in the Funds withdraws all or part of its capital contribution and undistributed profits, if any, from the Funds as of the end of any month (the “Redemption Date”) after a request has been made to the General Partner/Trading Manager at least three days in advance of the Redemption Date. Such withdrawals are classified as a liability when the limited partner/member elects to redeem and informs the Funds. However, a limited partner/member may request a withdrawal as of the end of any day if such request is received by the General Partner/Trading Manager at least three days in advance of the proposed withdrawal day.
The General Partner has delegated certain administrative functions to SS&C Technologies, Inc., a Delaware corporation, currently doing business as SS&C GlobeOp (the “Administrator”). Pursuant to a master services agreement, the Administrator furnishes certain administrative, accounting, regulatory reporting, tax and other services as agreed from time to time. In addition, the Administrator maintains certain books and records of the Partnership. The cost of retaining the Administrator is allocated among the pools operated by the General Partner, including the Partnership.
(b) Financial Information about Segments. The Partnership’s business consists of only one segment, speculative trading of commodity interests. The Partnership does not engage in sales of goods or services. The Partnership’s capital as of December 31, 2024 was $123,195,247.
(c) Narrative Description of Business. See Paragraphs (a) and (b) above.
(i) through (xii) — Not applicable.
(xiii) — The Partnership has no employees.
(d) Financial Information About Geographic Areas. The Partnership does not engage in the sale of goods or services or own any long-lived assets, and therefore this item is not applicable.
(e) Available Information. The Partnership does not have an Internet address. The Partnership will provide paper copies of its Annual Report on Form 10-K, Quarterly Reports on Form 10-Q, Current Reports on Form 8-K and any amendments to these reports free of charge upon request.
(f) Reports to Security Holders. Not applicable.
(g) Enforceability of Civil Liabilities Against Foreign Persons. Not applicable.
(h) Smaller Reporting Companies. Not applicable.
6
Item 1A. Risk Factors.
As a result of leverage, small changes in the price of the Partnership’s positions may result in major losses.
The trading of commodity interests is speculative, volatile and involves a high degree of leverage. A small change in the market price of a commodity interest contract can produce major losses for the Partnership. Market prices can be influenced by, among other things, changing supply and demand relationships, governmental, agricultural, commercial and trade programs and policies, national and international political and economic events, weather and climate conditions, insects and plant disease, purchases and sales by foreign countries, changing interest rates, pandemics, epidemics and other public health crises.
An investor may lose all of their investment.
Due to the speculative nature of trading commodity interests, an investor could lose all of their investment in the Partnership.
The Partnership will pay substantial fees and expenses regardless of profitability.
Regardless of its trading performance, the Partnership will incur fees and expenses, including but not limited to trading and transaction fees, ongoing selling agent fees, General Partner fees and management fees. Substantial incentive fees may be paid to one or more of the Advisors even if the Partnership experiences a net loss for the full year.
An investor’s ability to redeem Redeemable Units is limited.
An investor’s ability to redeem Redeemable Units is limited and no market exists for the Redeemable Units.
Conflicts of interest exist.
The Partnership is subject to numerous conflicts of interest including those that arise from the fact that:
1. | The General Partner and the Partnership’s/Funds’ commodity broker are affiliates; |
2. | The Advisors, the Partnership’s/Funds’ commodity broker, the General Partner and their respective principals and affiliates may trade in commodity interests for their own accounts; |
3. | An investor’s financial advisor will receive ongoing compensation for providing services to the investor’s account; and |
4. | The General Partner, on behalf of the Partnership, may purchase shares from money market mutual funds affiliated and/or unaffiliated with the General Partner. |
Investing in Redeemable Units may not provide the desired diversification of an investor’s overall portfolio.
One of the Partnership’s objectives is to add an element of diversification to a traditional stock and bond portfolio, but any benefit of portfolio diversification is dependent upon the Partnership/Funds achieving positive returns and such returns being independent of stock and bond market returns.
Past performance is no assurance of future results.
The Advisors’ trading strategies may not perform as they have performed in the past, and past performance does not necessarily predict future returns. The Advisors have from time to time incurred substantial losses in trading on behalf of clients.
An investor’s tax liability may exceed cash distributions.
Investors are taxed on their share of the Partnership’s income, even though the Partnership does not intend to make any distributions.
7
The General Partner may allocate the Partnership’s assets to undisclosed advisors.
The General Partner at any time may select and allocate the Partnership’s assets to undisclosed advisors. Investors may not be advised of such changes in advance, or at all. Investors must rely on the ability of the General Partner to select commodity trading advisors and allocate assets among them.
Regulatory changes could restrict the Partnership’s operations and increase its operational costs.
Regulatory changes could adversely affect the Partnership by restricting its markets or activities, limiting its trading and/or increasing the costs or taxes to which investors are subject. Pursuant to the mandate of the Dodd-Frank Wall Street Reform and Consumer Protection Act, signed into law on July 21, 2010, the CFTC and the Securities and Exchange Commission (the “SEC”) have promulgated rules to regulate trading in swaps and swap dealers and to mandate additional reporting and disclosure requirements and continue to promulgate rules regarding capital and margin requirements, to require that certain swaps be traded on an exchange or a swap execution facility, and to require that derivatives (such as those traded by the Partnership) be moved into central clearinghouses. The CFTC and the prudential regulators that oversee swap dealers have adopted rules regarding margin requirements for certain derivatives. In addition, the CFTC and such prudential regulators have proposed or adopted, respectively, rules regarding capital requirements for swap dealers. These rules may negatively impact the manner in which swap contracts are traded and/or settled, increase the cost of such trades, and limit trading by speculators (such as the Partnership) in futures and over-the-counter (“OTC”) markets.
Speculative position and trading limits may reduce profitability.
The CFTC and U.S. exchanges have established “speculative position limits” on the maximum net long or net short positions which any person or a group of persons may hold or control in particular futures and options on futures. The Advisors believe that established speculative position and trading limits will not materially adversely affect trading for the Partnership. The trading instructions of an Advisor, however, may have to be modified, and positions held by the Partnership directly and indirectly through its investment in the Funds may have to be liquidated, in order to avoid exceeding these limits. Such modification or liquidation could adversely affect the operations and profitability of the Partnership/Funds by increasing transaction costs to liquidate positions and limiting potential profits on liquidated positions.
In January 2021, the CFTC finalized new rules that impose position limits on certain futures and option contracts and physical commodity swaps that are “economically equivalent” to such contracts. In addition to speculative position limits, most commodity exchanges also limit fluctuations in futures contract prices during a single day by regulations referred to as “daily price fluctuation limits” or “daily limits.” Such regulations could have an adverse effect on an Advisor’s trading for the Partnership.
The General Partner, the Partnership, the Funds and their respective service providers (including the Advisors) and operations are potentially vulnerable to cyber-security attacks or incidents.
Like other business enterprises, the use of the internet and other electronic media and technology exposes the General Partner, the Partnership, the Funds and their respective services providers and operations, to potential risks from cyber-security attacks or incidents (collectively, “cyber events”). Cyber events may include, for example, unauthorized access to systems, networks or devices, infection from computer viruses or other malicious software code, mishandling or misuse of information and attacks which shut down, disable, slow or otherwise disrupt operations, business processes or website access or functionality. In addition to intentional cyber events, unintentional cyber events can occur. Unintentional cyber events may include, for example, the inadvertent release of confidential information, the mishandling or misuse of information and/or technological limitations or hardware failures (in the markets or otherwise) that constrain the Partnership’s and/or the Funds’ ability to gather, process and communicate information efficiently and securely, without interruption.
Any cyber event could adversely affect the Partnership’s and/or the Funds’ business, financial condition or results of operations and cause the Partnership and/or the Funds to incur financial loss and expense, as well as face exposure to regulatory penalties or legal claims, reputational damage and additional costs associated with corrective measures. A cyber-security breach could also jeopardize a limited partner’s personal, confidential, proprietary or other information processed and stored in, and transmitted through, the General Partner’s or a service provider’s computer systems. A cyber event may cause the Partnership, the Funds or their respective service providers to lose proprietary information, suffer data corruption, lose operational capacity (such as, for example, the loss of the ability to process transactions, calculate the Partnership’s net asset value, or allow investors to transact business) and/or fail to comply with applicable privacy and other laws. Among other potentially harmful effects, cyber events also may result in theft, unauthorized monitoring and failures in the physical infrastructure or operating systems that support the Partnership, the Funds or their respective service providers.
8
Item 2. Properties.
The Partnership does not own or lease any properties. The General Partner operates out of facilities provided by Morgan Stanley and/or one of its subsidiaries.
11
Item 3. Legal Proceedings.
This section describes the major pending legal proceedings, other than ordinary routine litigation incidental to the business, to which Morgan Stanley & Co. LLC or its subsidiaries is a party or to which any of their property is subject. There are no material legal proceedings pending against the Partnership or the General Partner.
On June 1, 2011, Morgan Stanley & Co. Incorporated converted from a Delaware corporation to a Delaware limited liability company. As a result of that conversion, Morgan Stanley & Co. Incorporated is now named Morgan Stanley & Co. LLC (“MS&Co.” or “the Company”).
The Company is a wholly-owned, indirect subsidiary of Morgan Stanley, a Delaware holding company. Morgan Stanley files periodic reports with the SEC as required by the Securities Exchange Act of 1934, as amended (the “Exchange Act”) which include current descriptions of material litigation and material proceedings and investigations, if any, by governmental and/or regulatory agencies or self-regulatory organizations concerning Morgan Stanley and its subsidiaries, including the Company. As a consolidated subsidiary of Morgan Stanley, the Company does not file its own periodic reports with the SEC that contain descriptions of material litigation, proceedings and investigations. As a result, we refer you to the “Legal Proceedings” section of Morgan Stanley’s SEC 10-K filings for 2024, 2023, 2022, 2021, and 2020. In addition, the Company annually prepares an Audited, Consolidated Statement of Financial Condition (“Audited Financial Statement”) that is publicly available on Morgan Stanley’s website at www.morganstanley.com. We refer you to the Commitments, Guarantees and Contingencies – Legal section of the Company’s 2023 Audited Financial Statement.
In addition to the matters described in those filings, in the normal course of business, each of Morgan Stanley and the Company has been named, from time to time, as a defendant in various legal actions, including arbitrations, class actions, and other litigation, arising in connection with its activities as a global diversified financial services institution. Certain of the actual or threatened legal actions include claims for substantial compensatory and/or punitive damages or claims for indeterminate amounts of damages. In some cases, the third-party entities that are, or would otherwise be, the primary defendants in such cases are bankrupt, in financial distress, or may not honor applicable indemnification obligations. These actions have included, but are not limited to, antitrust claims, claims under various false claims act statutes, and matters arising from our sales and trading businesses and our activities in the capital markets.
Each of Morgan Stanley and the Company is also involved, from time to time, in other reviews, investigations and proceedings (both formal and informal) by governmental or other regulatory agencies regarding the Company’s business and involving, among other matters, sales, trading, financing, prime brokerage, market-making activities, investment banking advisory services, capital market activities, financial products or offerings sponsored, underwritten, or sold by the Company, wealth and investment management services, and accounting and operational matters, certain of which may result in adverse judgments, settlements, fines, penalties, disgorgement, restitution, forfeiture, injunctions, limitations on our ability to conduct certain business, or other relief.
The Company is a Delaware limited liability company with its main business office located at 1585 Broadway, New York, New York 10036. Among other registrations and memberships, the Company is registered as a futures commission merchant and is a member of the National Futures Association.
During the preceding five years, the following administrative, civil, or criminal actions pending, on appeal or concluded against the Company or any of its principals are material within the meaning of CFTC Rule 4.24(l)(2) or 4.34(k)(2):
Regulatory and Governmental Matters
On January 12, 2024, the U.S. Attorney’s Office for the Southern District of New York (“USAO”) and the SEC announced they had reached settlement agreements with the Company in connection with their investigations into the Company’s blocks business. Specifically, the Company entered into a three-year non-prosecution agreement (“NPA”) with the USAO that included the payment of forfeiture, restitution, and a criminal fine for making false statements in connection with the sale of certain block trades from 2018 through August 2021. The NPA required the Company to admit responsibility for certain acts of its employees and to continue to cooperate with and provide certain information to the USAO for the term of the agreement. Additionally, the SEC charged the Company with violations of Section 10(b) of the Exchange Act and Rule 10b-5(b) thereunder for the disclosure of confidential information about block trades and also violations of Section 15(g) of the Exchange Act for the failure to enforce its policies concerning the misuse of material non-public information related to block trades. As part of the SEC agreement, the Company paid disgorgement and a civil penalty. After the agreed-upon credits were applied, the Company paid a total amount of approximately $249 million under both settlements.
12
On September 30, 2020, the SEC entered into a settlement order with the Company settling an administrative action which relates to the Company’s violations of the order marking requirements of Regulation SHO of the Exchange Act resulting from its improper use of aggregation units in structuring the Company’s equity swaps business. The order found that the Company improperly operated its equity swaps business without netting certain “long” and “short” positions as required by Rule 200(c) of Regulation SHO. The order found that the long exposure to an equity security (the “Long Unit”) and the short exposure to an equity security (the “Short Unit”) were not independent from one another and did not have separate trading strategies or objectives without regard to each other, and that the Long and Short Units were not eligible for the exception in Rule 200(f) of Regulation SHO. The order found that the Company willfully violated Section 200(g) of Regulation SHO. The Company consented, without admitting or denying the findings and without adjudication of any issue of law or fact, to a censure; to cease and desist from committing or causing future violations; to pay a civil penalty of $5 million; and to comply with the undertaking enumerated in the order.
The Firm has reached agreements in principle with two regulatory agencies—the SEC for $125 million and the CFTC for $75 million— to resolve record-keeping related investigations by those agencies relating to business communications on messaging platforms that had not been approved by the Firm. The Company was one of the entities involved in these investigations, and has recognized a provision of $63 million in anticipation of concluding the settlement with the SEC. On September 27, 2022, the Firm’s settlements with the SEC and the CFTC became effective.
Civil Litigation
On May 17, 2013, the plaintiff in IKB International S.A. in Liquidation, et al. v. Morgan Stanley, et al. filed a complaint against the Company and certain affiliates in the Supreme Court of the State of New York, New York County (“Supreme Court of NY”). The complaint alleges that defendants made material misrepresentations and omissions in the sale to the plaintiff of certain mortgage pass-through certificates backed by securitization trusts containing residential mortgage loans. The total amount of certificates allegedly sponsored, underwritten and/or sold by the Company to the plaintiff was approximately $133 million. The complaint alleges causes of action against the Company for common law fraud, fraudulent concealment, aiding and abetting fraud, and negligent misrepresentation, and seeks, inter alia, compensatory and punitive damages. On October 29, 2014, the court granted in part and denied in part the Company’s motion to dismiss. All claims regarding four certificates were dismissed. After these dismissals, the remaining amount of certificates allegedly issued by the Company or sold to the plaintiff by the Company was approximately $116 million. On August 11, 2016, the Appellate Division affirmed the trial court’s order denying in part the Company’s motion to dismiss the complaint. On July 15, 2022, the Company filed a motion for summary judgment on all remaining claims. On March 1, 2023, the court granted in part and denied in part the Company’s motion for summary judgment, narrowing the alleged misrepresentations at issue in the case. On March 26, 2024, the Appellate Division affirmed the trial court’s summary judgment order. On August 27, 2024, the plaintiff notified the court that in light of the court’s rulings to exclude certain evidence at trial, the plaintiff could not prove its claims at trial, and requested that the court dismiss the case, subject to its right to appeal the evidentiary rulings. On August 28, 2024, the court dismissed the case, and judgment was entered in the Company’s favor. The plaintiff has filed notices of appeal.
Beginning in February of 2016, the Company was named as a defendant in multiple purported antitrust class actions now consolidated into a single proceeding in the United States District Court for the Southern District of New York (“SDNY”) styled In Re: Interest Rate Swaps Antitrust Litigation. Plaintiffs allege, inter alia, that the Company, together with a number of other financial institution defendants, violated U.S. and New York state antitrust laws from 2008 through December of 2016 in connection with alleged efforts to prevent the development of electronic exchange-based platforms for interest rate swaps trading. Complaints were filed both on behalf of a purported class of investors who purchased interest rate swaps from defendants, as well as on behalf of three operators of swap execution facilities that allegedly were thwarted by the defendants in their efforts to develop such platforms. The consolidated complaints seek, inter alia, certification of the investor class of plaintiffs and treble damages. On July 28, 2017, the court granted in part and denied in part the defendants’ motion to dismiss the complaints. On December 15, 2023, the court denied the class plaintiffs’ motion for class certification. On December 29, 2023, the class plaintiffs petitioned the United States Court of Appeals for the Second Circuit for leave to appeal that decision. On February 28, 2024, the parties reached an agreement in principle to settle the class claims. On July 11, 2024, the court granted preliminary approval of the settlement.
13
On August 13, 2021, the plaintiff in Camelot Event Driven Fund, a Series of Frank Funds Trust v. Morgan Stanley & Co. LLC, et al. filed in the Supreme Court of NY a purported class action complaint alleging violations of federal securities laws against ViacomCBS (“Viacom”), certain of its officers and directors, and the underwriters, including the Company, of two March 2021 Viacom offerings: a $1,700 million Viacom Class B Common Stock offering and a $1,000 million offering of 5.75% Series A Mandatory Convertible Preferred Stock (collectively, the “Offerings”). The complaint seeks certification of the class of plaintiffs and unspecified compensatory damages and alleges, inter alia, that the Viacom offering documents for both issuances contained material misrepresentations and omissions because they did not disclose that certain of the underwriters, including the Company, had prime brokerage relationships and/or served as counterparties to certain derivative transactions with Archegos Capital Management LP (“Archegos”), a fund with significant exposure to Viacom securities across multiple prime brokers. The complaint also alleges that the offering documents did not adequately disclose the risks associated with Archegos’s concentrated Viacom positions at the various prime brokers, including that the unwind of those positions could have a deleterious impact on the stock price of Viacom. On November 5, 2021, the complaint was amended to add allegations that defendants failed to disclose that certain underwriters, including the Company, had intended to unwind Archegos’s Viacom positions while simultaneously distributing the Offerings. On February 6, 2023, the court issued a decision denying motions to dismiss as to the Company and the other underwriters, but granting the motion to dismiss as to Viacom and the Viacom individual defendants. On February 15, 2023, the underwriters, including the Company, filed their notices of appeal of the denial of their motions to dismiss. On March 10, 2023, the plaintiff appealed the dismissal of Viacom and the individual Viacom defendants. On April 4, 2024, the Appellate Division upheld the lower court’s decision as to the Company and other underwriter defendants that had prime brokerage relationships and/or served as counterparties to certain derivative transactions with Archegos, dismissed the remaining underwriters, and upheld the dismissal of Viacom and its officers and directors. On July 25, 2024, the Appellate Division denied the plaintiff’s and the Company’s respective motions for leave to reargue or appeal the April 4, 2024 decision. On January 4, 2024, the court granted the plaintiff’s motion for class certification, which the defendants have appealed.
The Company is a defendant in three antitrust class action complaints which have been consolidated into one proceeding in the United States District Court for the SDNY under the caption City of Philadelphia, et al. v. Bank of America Corporation, et al. Plaintiffs allege, inter alia, that the Company, together with a number of other financial institution defendants, violated U.S. antitrust laws and relevant state laws in connection with alleged efforts to artificially inflate interest rates for Variable Rate Demand Obligations (“VRDO”). The consolidated complaint seeks, inter alia, certification of the class of plaintiffs and treble damages. The complaint was filed on behalf of a class of municipal issuers of VRDO for which defendants served as remarketing agent. On November 2, 2020, the court granted in part and denied in part the defendants’ motion to dismiss the consolidated complaint, dismissing state law claims, but denying dismissal of the U.S. antitrust claims. On September 21, 2023, the court granted plaintiffs’ motion for class certification. On February 5, 2024, the United States Court of Appeals for the Second Circuit granted leave to appeal that decision.
On February 21, 2025, the U.K. Competition and Markets Authority announced a settlement with an affiliate of the Company, as well as other financial institutions, in connection with its investigation of suspected anti-competitive arrangements in the financial services sector, specifically regarding the affiliate’s activities concerning certain liquid fixed income products between 2009 and 2012. Separately, on June 16, 2023, the affiliate and the Company, together with a number of other financial institutions, were named as defendants in a purported antitrust class action in the United States District Court for the SDNY styled Oklahoma Firefighters Pension and Retirement System v. Deutsche Bank Aktiengesellschaft, et al., alleging, inter alia, that they violated U.S. antitrust laws in connection with their alleged effort to fix prices of gilts traded in the United States between 2009 and 2013. The complaint seeks, inter alia, certification of the class of plaintiffs and treble damages. On September 16, 2024, the court granted defendants’ joint motion to dismiss, and the complaint was dismissed without prejudice. The Firm and other defendants have reached an agreement in principle to settle the U.S. litigation.
Settled Civil Litigation
On August 18, 2009, Relators Roger Hayes and C. Talbot Heppenstall, Jr., filed a qui tam action in New Jersey state court styled State of New Jersey ex. rel. Hayes v. Bank of America Corp., et al. The complaint, filed under seal pursuant to the New Jersey False Claims Act, alleged that the Company and several other underwriters of municipal bonds had defrauded New Jersey issuers by misrepresenting that they would achieve the best price or lowest cost of capital in connection with certain municipal bond issuances. On March 17, 2016, the court entered an order unsealing the complaint. On November 17, 2017, Relators filed an amended complaint to allege the Company mispriced certain bonds issued in twenty-three bond offerings between 2008 and 2017, having a total par amount of $6,900 million. The complaint sought, among other relief, treble damages. On February 22, 2018, the Company moved to dismiss the amended complaint, and on July 17, 2018, the court denied the Company’s motion. On October 13, 2021, following a series of voluntary and involuntary dismissals, Relators limited their claims to certain bonds issued in five offerings the Company underwrote between 2008 and 2011, having a total par amount of $3,900 million. On August 22, 2023, the Company reached an agreement in principle to settle the litigation. The final agreement became effective on January 30, 2024.
14
On July 15, 2010, China Development Industrial Bank (“CDIB”) filed a complaint against the Company, styled China Development Industrial Bank v. Morgan Stanley & Co. Incorporated et al., in the Supreme Court of NY. The complaint related to a $275 million credit default swap (“CDS”) referencing the super senior portion of the STACK 2006-1 CDO. The complaint asserted claims for common law fraud, fraudulent inducement and fraudulent concealment and alleges that the Company misrepresented the risks of the STACK 2006-1 CDO to CDIB, and that the Company knew that the assets backing the CDO were of poor quality when it entered into the CDS with CDIB. On March 22, 2021, the parties entered into a settlement agreement. On April 16, 2021, the court entered a stipulation of voluntary discontinuance, with prejudice.
On October 15, 2010, the Federal Home Loan Bank of Chicago filed a complaint against the Company and other defendants in the Circuit Court of the State of Illinois, styled Federal Home Loan Bank of Chicago v. Bank of America Funding Corporation et al. A corrected amended complaint was filed on April 8, 2011, which alleged that defendants made untrue statements and material omissions in the sale to plaintiff of a number of mortgage pass-through certificates backed by securitization trusts containing residential mortgage loans and asserts claims under Illinois law. The total amount of certificates allegedly sold to plaintiff by the Company at issue in the action was approximately $203 million. The complaint sought, inter alia, to rescind the plaintiff’s purchase of such certificates. On November 4, 2021, the Company entered into an agreement to settle the litigation.
In August of 2017, the Company was named as a defendant in a purported antitrust class action in the United States District Court for the SDNY styled Iowa Public Employees’ Retirement System et al. v. Bank of America Corporation et al. Plaintiffs alleged, inter alia, that the Company, together with a number of other financial institution defendants, violated U.S. antitrust laws and New York state law in connection with their alleged efforts to prevent the development of electronic exchange-based platforms for securities lending. The complaint was filed on behalf of a purported class of borrowers and lenders who entered into stock loan transactions with the defendants. The complaint sought, inter alia, certification of the class of plaintiffs and treble damages. On September 27, 2018, the court denied the defendants’ motion to dismiss the complaint. Plaintiffs’ motion for class certification was referred by the District Court to a magistrate judge who, on June 30, 2022, issued a report and recommendation that the District Court certify a class. The motion for class certification and the parties’ objections to the report and recommendation are pending before the District Court. On May 20, 2023, the Company reached an agreement in principle to settle the litigation. On September 11, 2024, the court granted final approval of the settlement.
Beginning on March 25, 2019, the Company was named as a defendant in a series of putative class action complaints filed in the United States District Court for the SDNY, the first of which is styled Alaska Electrical Pension Fund v. BofA Secs., Inc., et al. Each complaint alleged a conspiracy to fix prices and restrain competition in the market for unsecured bonds issued by the following Government-Sponsored Enterprises: the Federal National Mortgage Association; the Federal Home Loan Mortgage Corporation; the Federal Farm Credit Banks Funding Corporation; and the Federal Home Loan Banks. The purported class period for each suit is from January 1, 2012 to June 1, 2018. Each complaint raised a claim under Section 1 of the Sherman Act and sought, inter alia, injunctive relief and treble compensatory damages. On May 23, 2019, plaintiffs filed a consolidated amended class action complaint styled In re GSE Bonds Antitrust Litigation, with a purported class period from January 1, 2009 to January 1, 2016. On June 13, 2019, the defendants filed a joint motion to dismiss the consolidated amended complaint. On August 29, 2019, the court denied the Company’s motion to dismiss. On December 15, 2019, the Company and certain other defendants entered into a stipulation of settlement to resolve the action as against each of them in its entirety. On June 16, 2020, the court granted final approval of the settlement.
Additional lawsuits containing claims similar to those described above may be filed in the future. In the course of its business, the Company, as a major futures commission merchant, is party to various civil actions, claims and routine regulatory investigations and proceedings that the General Partner believes do not have a material effect on the business of the Company. The Company may establish reserves from time to time in connections with such actions.
15
Item 4. Mine Safety Disclosures. Not Applicable.
16
PART II
Item 5. Market for Registrant’s Common Equity, Related Stockholder Matters and Issuer Purchases of Equity Securities.
(a) | Market Information. The Partnership has issued no stock. There is no public market for the Redeemable Units. |
(b) | Holders. The number of holders of Redeemable Units as of February 28, 2025 was 754 for Class A Redeemable Units, 1 for Class D Redeemable Units and 20 for Class Z Redeemable Units. |
(c) | Dividends. The Partnership did not declare any distributions in 2024 or 2023. The Partnership does not intend to declare distributions in the foreseeable future. |
(d) | Securities Authorized for Issuance Under Equity Compensatory Plans. None. |
(e) | Performance Graph. Not applicable. |
(f) | Recent Sales of Unregistered Securities – Use of Proceeds from Registered Securities. For the year ended December 31, 2024, there were subscriptions of 1,328.6390 Class A Redeemable Units totaling $3,647,500 and 83.3320 Class Z Redeemable Units totaling $189,888. For the year ended December 31, 2023, there were subscriptions of 2,752.1070 Class A Redeemable Units totaling $7,482,119 and 117.6330 Class Z Redeemable Units totaling $262,500. For the year ended December 31, 2022, there were subscriptions of 4,842.6190 Class A Redeemable Units totaling $12,557,500 and 790.3010 Class Z Redeemable Units totaling $1,675,000. |
Redeemable Units are issued in reliance upon applicable exemptions from registration under Section 4(a)(2) of the Securities Act of 1933, as amended (the “Securities Act”), and Section 506 of Regulation D promulgated thereunder. The Redeemable Units are purchased by accredited investors, as described in Regulation D. In determining the applicability of the exemption, the General Partner relies on the fact that the Redeemable Units are purchased by accredited investors in a private offering.
Proceeds from the sale of Redeemable Units are used in the trading of commodity interests including futures, option and forward contracts and any other interests pertaining thereto, including interests in commodity pools.
(g) | Purchases of Equity Securities by the Issuer and Affiliated Purchasers. |
The following chart sets forth the purchases of limited partner Redeemable Units for each Class by the Partnership.
Period | Class A of Redeemable |
Class A (b) Average Price Paid per Redeemable Unit ** |
Class Z (a) Total Number of Redeemable Units Purchased * |
Class Z (b) Average Price Paid per Redeemable Unit ** |
(c) Total Number of Redeemable Units Purchased as Part of Publicly Announced Plans or Programs |
(d) Maximum Number (or Approximate Dollar Value) of Redeemable Units that May Yet be Purchased Under the Plans or Programs |
||||||||||||||||||
October 1, 2024 - October 31, 2024 |
1,717.6600 | $ | 2,672.24 | 22.2640 | $ | 2,222.65 | N/A | N/A | ||||||||||||||||
November 1, 2024 - November 30, 2024 |
707.0280 | $ | 2,677.58 | N/A | N/A | N/A | N/A | |||||||||||||||||
December 1, 2024 - December 31, 2024 |
1,621.9040 | $ | 2,627.20 | 111.0390 | $ | 2,187.95 | N/A | N/A | ||||||||||||||||
4,046.5920 | $ | 2,655.12 | 133.3030 | $ | 2,193.75 |
* | Generally, limited partners are permitted to redeem their Redeemable Units as of the end of each month on three business days’ notice to the General Partner. Under certain circumstances, the General Partner can compel redemption, although to date, the General Partner has not exercised this right. Purchases of Redeemable Units by the Partnership reflected in the chart above were made in the ordinary course of the Partnership’s business in connection with effecting redemptions for limited partners. |
** | Redemptions of Redeemable Units are effected as of the last day of each month at the net asset value per Redeemable Unit as of that day. No fee will be charged for redemptions. |
17
Item 6. Reserved.
Item 7. Management’s Discussion and Analysis of Financial Condition and Results of Operations.
Overview
The Partnership, directly and through its investment in the Funds, seeks to achieve capital appreciation through speculative trading of commodity interests on U.S. and international futures, options on futures and forward markets. The Partnership may also engage, directly or indirectly, in swap transactions and other derivative transactions with the approval of the General Partner. Initially, the Partnership’s investment strategy focused on energy and energy-related investments. While the Partnership is expected to continue to have significant exposure to energy and energy-related markets, such trading will no longer be the Partnership’s primary focus. Therefore, the Partnership’s past trading performance will not necessarily be indicative of future results.
The General Partner/Trading Manager manages all business of the Partnership/Funds. The General Partner delegated its responsibility for the investment of the Partnership’s assets to the Advisors. The General Partner/Trading Manager engages a team of approximately 9 professionals, whose primary emphasis is on attempting to maintain quality control among the advisors to the funds operated or managed by the General Partner/Trading Manager. A full-time staff of due diligence professionals use proprietary technology and on-site evaluations to monitor new and existing futures money managers. The accounting and operations staff provide processing of subscriptions and redemptions and reporting to limited partners and regulatory authorities. The General Partner also engages staff involved in marketing and sales support. In selecting an Advisor for the Partnership, the General Partner considers, among other factors, the Advisor’s past performance, trading style, volatility of markets traded and fee requirements. The General Partner may modify or terminate the allocation of assets to an Advisor and allocate assets to additional advisors at any time.
Responsibilities of the General Partner include:
• | due diligence examinations of the Advisors; |
• | selection, appointment and termination of the Advisors; |
• | negotiation of the Management Agreements; and |
• | monitoring the activity of the Advisors. |
In addition, the General Partner/Trading Manager prepares, or assists the Administrator in preparing, the books and records and provides, or assists the Administrator in providing, the administrative and compliance services that are required by law or regulation, from time to time, in connection with the operation of the Partnership/Funds.
While the Partnership and the Funds have the right to seek lower commission rates from other commodity brokers at any time, the General Partner believes that the customer agreements and other arrangements with the commodity broker are fair, reasonable and competitive.
The programs traded by each Advisor on behalf of the Partnership are: Millburn — Commodity Program, Ospraie — Commodity Program, Drakewood – Drakewood Prospect Fund Strategy, Opus – Opus Advanced Ag Program and prior to Northlander’s termination effective December 31, 2024, Northlander – Commodity Program and prior to EMC’s termination effective December 31, 2024, EMC – Commodity Program and prior to Pan’s termination effective October 31, 2022, Pan – Energy Trading Program and prior to Geosol’s termination effective June 30, 2022, Geosol – U.S. Power and Natural Gas Program. The General Partner may modify or terminate the allocation of assets among the Advisors at any time and may allocate assets to additional Advisors at any time.
18
As of December 31, 2024 and September 30, 2024, the Partnership’s assets were allocated among the Advisors in the following approximate percentages:
Advisor |
December 31, 2024 | December 31, 2024 (percentage of Partners’ Capital) |
September 30, 2024 | September 30, 2024 (percentage of Partners’ Capital) |
||||||||||||
Millburn |
$ | 41,822,109 | 34% | $ | 42,701,892 | 31% | ||||||||||
Ospraie |
24,547,887 | 20% | 26,368,425 | 19% | ||||||||||||
Northlander |
3,807,148 | 3% | 7,800,511 | 6% | ||||||||||||
Drakewood |
17,511,229 | 14% | 21,075,139 | 16% | ||||||||||||
EMC |
- | 0% | 5,022,120 | 4% | ||||||||||||
Opus |
31,625,551 | 26% | 30,122,954 | 22% | ||||||||||||
Unallocated |
3,881,323 | 3% | 2,554,142 | 2% |
Millburn Ridgefield Corporation
Millburn trades the Partnership’s assets in accordance with its Millburn Commodity Program. Millburn is the corporate successor to a futures trading and advisory organization that has been continuously managing assets in the currency and futures markets using quantitative, systematic techniques since 1971. The Millburn Commodity Program trades a diverse group of global commodity futures markets – currently approximately 45 – although it may not trade in all such markets at all times and the number of markets may increase or decrease from time to time. It strives to maintain a diversified portfolio of commodity futures, allocated according to volatility based risk (not face value), subject to constraints, in order to take advantage of global economic cycles and commodity price fluctuations. The portfolio is intended to be as diversified as market liquidity permits, and each market is traded using a diversified set of directional trading systems. Maximum market allocations for each market in the portfolio are determined based on factors including, among others, exchange regulations and depth of market. Millburn seeks to increase the number of commodity futures markets traded in the portfolio over time as new futures contracts become available, but it is also likely that certain futures contracts will be removed from the portfolio due to diminishing liquidity.
Millburn makes its systematically-based investment and trading decisions pursuant to its investment and trading methods, which may include technical trend analysis, certain nontraditional technical systems (i.e., systems falling outside of traditional technical trend analysis) and money management principles, each of which may be revised from time to time. The objective of the investment and trading systems employed by Millburn is to consider multiple data inputs, or “factors,” in order to arrive at relatively near-term return forecasts for each traded instrument, and take appropriate, risk-managed positions. These factors include price data, but also a range of price derivative and non-price data.
Trades generated by quantitative models may be profitable or unprofitable. The Millburn Commodity Program’s objective is to have its profitable trades offset and exceed losses from its unprofitable trades. During periods in which market behavior differs significantly from that analyzed to build models, substantial losses are possible, and even likely. Successful systematic futures trading depends on several elements. Two of the main factors are the development and selection of the trading systems used in each market, and the allocation of portfolio risk among the markets available for trading.
Market environments change over time, and particular systems may perform well in one environment but poorly in another. Likewise, market sectors and individual markets go through periods where systematic trading is very profitable and other periods where no system is able to generate any profits. The goal of Millburn’s research has been to develop and select a mix of systems in each market and to allocate risk across a wide array of markets, so as to contain overall portfolio risk within a targeted range while allowing exposure to profitable opportunities.
Over more than 50 years, Millburn and its predecessor entities have developed hundreds of trading systems. These trading systems generate buy or sell decisions in a particular market based on the analysis of price movements in the market, some non-price information or a combination of both. Of course, systems can be materially different –better in some periods and worse in others. The main distinguishing features are: the time frame over which systems work (intra-day to long term); the granularity of data fed into them (tick data to daily, weekly or monthly frequencies); type (market or economic statistics); source (cash, futures, forward or option markets generated data or government and industry generated statistical information), and the objective of the system (profiting from momentum, mean reversion, trading ranges or volatility). No single approach will work all the time. Therefore, Millburn’s objective is to have several approaches and several data inputs operating in conjunction with one another.
19
When arriving at the portfolio allocation, Millburn generally seeks maximum diversification subject to liquidity and sector concentration constraints and subject to the mandate of the strategy. Each market is traded using a diversified set of trading systems, which may be optimized for groups of markets, sectors or specific markets. The markets traded and allocations are reviewed at least monthly, although changes may occur more or less frequently. The following factors, among others, are considered in constructing a universe of markets to trade for each portfolio: profitability, liquidity of markets, professional judgment, desired diversification, transaction costs, exchange regulations and depth of market. For the Millburn Commodity Program, the current allocation to any market in the portfolio does not exceed 10%. The portfolio weightings will be determined, taking into account statistical data on the returns in each market, liquidity constraints and Millburn’s judgment and experience.
Risk is a function of both price level and price volatility. For example, for any given level of volatility, a 100,000 barrel crude oil position is worth more and is, therefore, probably more risky with oil at $90 per barrel than with oil at $50 per barrel. Similarly, oil would be more risky if prices are moving in a 5% daily range than if prices are moving in a 1% daily range. Millburn sizes the position in each market taking into account its measurement of risk based on price level and volatility in that market. Market exposure is then managed by the position-sizing models which measure the risk in the portfolio’s position in each market. In the event the model determines that the risk has changed beyond an acceptable threshold, it will signal a change in the position — a decrease in position size when risk increases and an increase in position size when risk decreases. Millburn’s position-sizing models maintain overall portfolio risk and distribution of risk across markets within designated ranges. The position-sizing model manages the position traded by each of the (directional) trading systems discussed above.
In addition, Millburn’s risk management processes focus on money management principles applicable to the portfolio as a whole rather than to individual markets. The first principle is portfolio diversification which attempts to improve the quality of profits by reducing volatility. Additional money management principles applicable to the portfolio as a whole include:
(1) limiting the assets committed as margin or collateral, generally within a range of 5% to 35% of an account’s net assets, though the amount may at any time be higher or lower; and
(2) prohibiting pyramiding — that is, using unrealized profits in a particular market as margin for additional positions solely in the same market.
Another important risk management function is the careful control of leverage or total portfolio exposure. Leverage levels are determined by simulating the entire portfolio — all markets, all systems, all risk control models, the exact weightings of the markets in the portfolio and the proposed level of leverage — over the past five or ten years to determine the portfolio’s simulated risk and return characteristics as well as the worst case experienced by the portfolio in the simulation period. The worst case, or peak-to-trough drawdown, is measured from a daily high in portfolio assets to the subsequent daily low whether that occurs days, weeks or months after the daily high. If Millburn considers the drawdown too severe or the portfolio’s simulated volatility too high, it reduces the leverage or total portfolio exposure. There are, however, no restrictions on the amount of leverage Millburn may use at any given time. Decisions whether to trade a particular market require the exercise of judgment. The decision not to trade certain markets for certain periods, or to reduce the size of a position in a particular market, may result at times in missing significant profit opportunities.
In some cases, Millburn employs discretion in the execution of trades where The Millburn Corporation’s trader expertise plays a role in timing of orders and, from time to time, Millburn may adjust the size of a position, long or short, in any given market indicated by its systematic trading strategies. This exercise of discretion (other than in trade execution) generally occurs only in response to unusual market conditions that may not have been factored into the design of the trading systems and is generally intended to reduce risk. Decisions to make such adjustments also require the exercise of judgment and may include consideration of the volatility of the particular market; the pattern of price movements, both inter-day and intra-day; open interest; volume of trading; changes in spread relationships between various forward contracts; and overall portfolio balance and risk exposure. With respect to the execution of trades, Millburn may rely to an extent upon the judgment of others, including dealers and bank traders. No assurance is given that it will be possible to execute trades regularly at or near the desired buy or sell point.
The trading method, systems and money management principles utilized by Millburn are proprietary and confidential. The foregoing description is general and is not intended to be complete. Millburn and its principals may, from time to time, trade futures, forward, and option contracts and securities for their own proprietary accounts. Such trades may or may not be in accordance with the Millburn trading program described above. The trading records of those accounts are not available for inspection.
20
Ospraie Management, LLC
Ospraie trades the Partnership’s assets in accordance with the Commodity Program. The primary investment objective is the appreciation of capital through active, leveraged trading and investment on a global basis primarily in a portfolio of commodities and related derivative instruments. Such commodity trading includes futures, forward, option and swap contracts and physical commodities in energy, industrial metals, precious metals, grains, softs/meats, freight and related markets, among other commodity sectors. The cornerstone of Ospraie’s approach to commodity investing is fundamental research. Ospraie uses a similar analytical methodology for each commodity market in which it elects to invest. This methodology incorporates the multiple variables that determine the end price of a commodity, including, but not limited to, the available supply of the commodity and the cost of production including extracting or harvesting, transporting, processing and distributing such commodity. It also incorporates current and projected demand for the commodity based on relative and absolute price levels and global economic factors. In addition, the relative availability of inventory in respect of a specified commodity to the world markets is factored into Ospraie’s analytical model. This analytical methodology guides Ospraie’s investment decisions with respect to an industry and results in a view as to its likely economic prospects. The investment thesis is then expressed in the global capital markets principally through futures and options instruments. The majority of the portfolio will include long/short directional investments based on Ospraie’s view on the future movements of prices of applicable commodities. Ospraie will also seek to maximize returns by investing in relative value opportunities, including investments based on intra-commodity curve related spreads (i.e., entering into a long and short position in a commodity interest with different delivery months) and inter-commodity price spreads (i.e., entering into a long position in a commodity interest and entering into a short position in a related commodity interest). Ospraie may also invest in foreign exchange, primarily for hedging purposes.
While the portfolio will generally be based upon Ospraie’s long-term views, the investment process will also include a subjective overlay as to the short-term profitability of an investment. Ospraie intends to dynamically size and scale back its trades based on its continued fundamental analysis, current level of conviction, the likely timing of realization, and current market conditions applicable to each investment. The portfolio will be principally comprised of highly liquid investment assets in order to maximize liquidity for investors. The portfolio’s liquidity will be achieved through the use of various instruments to access what Ospraie believes is the most efficient combination of liquidity and risk/reward consideration for each position.
Northlander Commodity Advisors LLP
The portion of the Partnership’s assets that were allocated to Northlander for trading were not invested in commodity interests directly. Northlander’s allocation of the Partnership’s assets were invested in NL Master. Northlander traded the Partnership’s assets allocated to it pursuant to its Northlander Commodity Program. The Northlander Commodity Program was a commodity focused trading program which invested in energy products globally, but with an emphasis on European power, European gas, European emissions, and international coal markets. The program was an absolute return strategy which sought to identify value in mispriced markets through careful fundamental analysis by focusing on market dynamics and market structure and then expressing its thesis through its proprietary portfolio construction and risk management procedures.
Drakewood Capital Management Limited
Drakewood trades the Partnership’s assets allocated to it pursuant to the Drakewood Prospect Fund Strategy. Pursuant to the Drakewood Prospect Fund Strategy, Drakewood invests the Partnership’s assets primarily in a portfolio of risk positions in precious, non-ferrous and ferrous metal futures, forward contracts and related options, and derivative instruments. Other commodities may be traded from time to time, and may also invest in LME warrants, although these instruments are expected to constitute a relatively minor part of the portfolio. Investments made pursuant to the Drakewood Prospect Fund Strategy investments are expected to be concentrated in precious, non-ferrous and ferrous metal strategies and the Program’s investments are not expected to be diversified.
The Drakewood Prospect Fund Strategy is designed to gain exposure to opportunities in the majority of actively traded metals while limiting exposure in any one particular metal. The intent of this strategy is to increase opportunities for gain, while managing risk in order to provide more consistent returns.
21
Based on the fundamentally driven investment approach of the Drakewood Prospect Fund Strategy, Drakewood will often hold generally directional positions – either predominantly long or short depending on price drivers for each individual metal. The Drakewood Prospect Fund Strategy is expected to be neither long nor short biased through the cycle but rather to take a fundamental view over a one, two, five and ten year time frame and take positions accordingly. Long long-term core positions will be augmented by shorter shorter-term trading positions around each core position to manage short short-term price risk. In normal circumstances there may be daily trading activity on the portfolio even though the core fundamental view will persist for a year or more. Due to the nature of commodities futures trading, gross exposures may be much higher than net asset value due to the nature of having numerous offsetting positions, such as calendar spreads.
EMC Capital Advisors, LLC
EMC traded the Partnership’s assets allocated to it pursuant to the EMC Commodity Program. The investment strategy employed in the EMC Commodity Program sought to provide long-term positive returns with low correlation to equity, fixed income and hedge fund portfolios. EMC employed quantitative, systematic trading models across a broad range of liquid global commodity and currency markets. Sectors traded included precious and base metals, energies, agricultural and soft commodities.
Opus Futures, LLC
Opus trades the Partnership’s assets allocated to it directly pursuant to Opus’ Advanced Ag Program (the “Program”). The General Partner and Opus have agreed that Opus will trade the Partnership’s assets allocated to Opus at 1.5 times the amount of the assets allocated. The Program is a fundamental discretionary strategy primarily focused on agricultural commodities, specifically grains, oilseeds, and livestock. Opus takes a medium-to-long term outlook, typically holding trades for several weeks up to several months, depending on the opportunity set.
Opus only trades on liquid North American exchanges, using both futures and options on futures to express ideas using directional positions and, occasionally, using spread trades, such as inter-commodity and calendar spreads. Typically trades focus on ‘old crop vs, new crop’, weather and cyclical seasonality. Fundamental analysis is used in forecasting U.S. and world supply and demand tables, monitoring U.S. and world weather, studying domestic and international freight values, and tracking underlying cash values associated with agriculture futures markets.
The portfolio is intentionally concentrated on a limited number of grains and livestock markets. Position and risk management are at the trader’s discretion, meaning there were no hard-coded portfolio or position stop-outs.
Pan Capital Management L.P.
Pan traded the Partnership’s assets allocated to it directly pursuant to its Energy Trading Program, a proprietary, discretionary trading program. The Energy Trading Program’s primary objective was to produce absolute returns through active trading of the U.S. energy markets, while offering investors an opportunity to diversify their overall portfolios. The Energy Trading Program also strived to minimize the risk of capital loss.
Pan traded listed exchange-traded futures and options on futures in the U.S. natural gas market and, with the consent of the General Partner, other liquid U.S. energy markets, including, but not limited to, electricity and crude oil. With the General Partner’s consent Pan may also trade swaps on behalf of the Partnership. Pan based energy trading on fundamental analysis rather than market timing and seeks to structure trades with asymmetric risk return.
Pan firmly believed solid and thorough fundamental analysis, rigorous risk management and deep understanding of energy markets are required to achieve the Energy Trading Program’s investment objectives.
Geosol Capital, LLC
The portion of the Partnership’s assets that were allocated to Geosol for trading were not invested in commodity interests directly. Geosol’s allocation of the Partnership’s assets were invested in GSL Master. Geosol traded the Partnership’s assets in accordance with its U.S. Power and Natural Gas Program. Geosol used proprietary fundamental valuation analysis combined with their proprietary profit maximizing risk management framework to identify a variety of trade opportunities and execution possibilities in North American energy markets, including electricity and natural gas, using listed commodity futures and options. The Trading Manager and Geosol have agreed that the volatility applied to the assets allocated to Geosol shall initially be 50.0% (one half) of the volatility typically employed for the trading of the program.
22
Upon identifying opportunities through fundamental analysis (i.e., supply, demand, storage and power dispatch stack), Geosol then determined the most appropriate means of capturing the identified value. Geosol allocated risk based on predetermined calculations of maximum acceptable loss exposure associated with each strategy and commodity. Geosol employs several different types of risk models based on the characteristics of each strategy and commodity, and will periodically shift risk allocations between commodities and risk books based on the opportunities observed in the marketplace. Geosol believes that flexible risk allocations tend to produce greater total returns in a multi-commodity book due to higher average capital utilization. The risk process measures profit/loss and position by strategy and commodity on a daily basis.
In managing the trading activity for the Partnership, Geosol strived to trade GSL Master pari passu with Geosol Capital Onshore I, LP subject to the targeted volatility differential as described above and/or directed (in writing) by the General Partner/Trading Manager.
No assurance can be given that the Advisors’ strategies will be successful or that they will generate profits for the Partnership.
Specific Fund level performance information is included in Note 6 to the financial statements included in “Item 8. Financial Statements and Supplementary Data.”
For the period January 1, 2024 through December 31, 2024, the average allocation by commodity market sector for NL Master and Drakewood Master was as follows:
NL Master
Energy |
100 | % |
Drakewood Master
Currencies |
2 | % | ||||
Metals |
98 | % |
(a) | Liquidity. |
The Partnership does not engage in sales of goods or services. Its assets are its (i) investment in the Funds, (ii) redemptions receivable from the Funds, (iii) equity in trading account, consisting of unrestricted and restricted cash, net unrealized appreciation on open futures contracts, net unrealized appreciation on open forward contracts, options purchased at fair value and investment in U.S. Treasury bills at fair value, if applicable, and (iv) interest receivable. Because of the low margin deposits normally required in commodity futures trading, relatively small price movements may result in substantial losses to the Partnership, through its investment in the Funds and its direct investments. While substantial losses could lead to a material decrease in liquidity, no such illiquidity occurred during the year ended December 31, 2024.
To minimize the risk relating to low margin deposits, the Partnership/Funds follow certain trading policies, including:
(i) | The Partnership/Funds invest their assets only in commodity interests that the Advisors believe are traded in sufficient volume to permit ease of taking and liquidating positions. Sufficient volume, in this context, refers to a level of liquidity that the Advisors believe will permit them to enter and exit trades without noticeably moving the market. |
(ii) | An Advisor will not initiate additional positions in any commodity if these positions would result in aggregate positions requiring a margin of more than 66 2/3% of the Partnership’s net assets allocated to such Advisor. |
(iii) | The Partnership/Funds may occasionally accept delivery of a commodity. Unless such delivery is disposed of promptly by retendering the warehouse receipt representing the delivery to the appropriate clearinghouse, the physical commodity position is fully hedged. |
(iv) | The Partnership/Funds do not employ the trading technique commonly known as “pyramiding,” in which the speculator uses unrealized profits on existing positions as margin for the purchases or sale of additional positions in the same or related commodities. |
(v) | The Partnership/Funds do not utilize borrowings other than short-term borrowings if the Partnership/Funds take delivery of any cash commodities. |
23
(vi) | The Advisors may, from time to time, employ trading strategies such as spreads or straddles on behalf of the Partnership/Funds. The terms “spread” and “straddle” describe commodity futures trading strategies involving the simultaneous buying and selling of futures contracts on the same commodity but involving different delivery dates or markets. |
(vii) | The Partnership/Funds will not permit the churning of their commodity trading accounts. The term “churning” refers to the practice of entering and exiting trades with a frequency unwarranted by legitimate efforts to profit from the trades, driven by the desire to generate commission income. |
From January 1, 2024 through December 31, 2024, the Partnership’s average margin to equity ratio (i.e., the percentage of assets on deposit required for margin) was approximately 8.3%. The foregoing margin to equity ratio takes into account cash held in the Partnership’s name, as well as the allocable value of the positions and cash held on behalf of the Partnership in the name of the Funds.
In the normal course of business, the Partnership and the Funds are parties to financial instruments with off-balance-sheet risk, including derivative financial instruments and derivative commodity instruments. These financial instruments may include forwards, futures, options and swaps, whose values are based upon an underlying asset, index, or reference rate, and generally represent future commitments to exchange currencies or cash balances, to purchase or sell other financial instruments at specific terms at specified future dates, or, in the case of derivative commodity instruments, to have a reasonable possibility to be settled in cash, through physical delivery or with another financial instrument. These instruments may be traded on an exchange, a swap execution facility or OTC. Exchange-traded instruments include futures and certain standardized forward, swap and option contracts. Specific market movements of commodities or futures contracts underlying an option cannot accurately be predicted. The purchaser of an option may lose the entire premium paid for the option. The writer or seller of an option has unlimited risk. Certain swap contracts may also be traded on a swap execution facility or OTC. OTC contracts are negotiated between contracting parties and also include certain forward and option contracts. Each of these instruments is subject to various risks similar to those related to the underlying financial instruments, including market and credit risk. In general, the risks associated with OTC contracts are greater than those associated with exchange-traded instruments because of the greater risk of default by the counterparty to an OTC contract. None of the Partnership’s/Funds’ contracts are traded OTC, although contracts may be traded OTC in the future.
As both a buyer and seller of options, the Partnership/Funds pay or receive a premium at the outset and then bear the risk of unfavorable changes in the price of the contract underlying the option. Written options expose the Partnership/Funds to potentially unlimited liability; for purchased options the risk of loss is limited to the premiums paid. Certain written put options permit cash settlement and do not require the option holder to own the reference asset. The Partnership/Funds do not consider these contracts to be guarantees.
The Partnership/Funds do not isolate the portion of the results of operations arising from the effect of changes in foreign exchange rates on investments from fluctuations due to changes in market prices of investments held. Such fluctuations are included in total trading results in the Partnership’s/Funds’ Statements of Income and Expenses.
Market risk is the potential for changes in the value of the financial instruments traded by the Partnership/Funds due to market changes, including interest and foreign exchange rate movements and fluctuations in commodity or security prices. Market risk is directly impacted by the volatility and liquidity in the markets in which the related underlying assets are traded. The Partnership and the Funds are exposed to market risk equal to the value of the futures and forward contracts held and unlimited liability on such contracts sold short.
Credit risk is the possibility that a loss may occur due to the failure of a counterparty to perform according to the terms of a contract. The Partnership’s/Funds’ risk of loss in the event of counterparty default is typically limited to the amounts recognized in the Statements of Financial Condition and is not represented by the contract or notional amounts of the instruments. The Partnership’s/Funds’ risk of loss is reduced through the use of legally enforceable master netting agreements with counterparties that permit the Partnership/Funds to offset unrealized gains and losses and other assets and liabilities with such counterparties upon the occurrence of certain events. The Partnership/Funds have credit risk and concentration risk, as MS&Co. or an MS&Co. affiliate are counterparties or brokers with respect to the Partnership’s/Funds’ assets. Credit risk with respect to exchange-traded instruments is reduced to the extent that, through MS&Co. or an MS&Co. affiliate, the Partnership’s/Funds’ counterparty is an exchange or clearing organization.
The risk to the limited partners that have purchased Redeemable Units is limited to the amount of their share of the Partnership’s net assets and undistributed profits. The limited liability is a result of the organization of the Partnership as a limited partnership under New York law.
24
The General Partner/Trading Manager monitors and attempts to mitigate the Partnership’s/Funds’ risk exposure on a daily basis through financial, credit and risk management monitoring systems, and believes, accordingly, that it has effective procedures for evaluating and limiting the credit and market risks to which the Partnership/Funds may be subject. These monitoring systems generally allow the General Partner/Trading Manager to statistically analyze actual trading results with risk-adjusted performance indicators and correlation statistics. In addition, online monitoring systems provide account analysis of futures, exchange-cleared swap and option contracts by sector, margin requirements, gain and loss transactions and collateral positions. (See also “Item 8. Financial Statements and Supplementary Data.” for further information on financial instrument risk included in the notes to the financial statements.)
The majority of these financial instruments mature within one year of the inception date. However, due to the nature of the Partnership’s/Funds’ business, these instruments may not be held to maturity.
Other than the risks inherent in commodity futures, forwards, options and swaps trading, U.S. Treasury bills and money market mutual fund securities, the General Partner/Trading Manager knows of no trends, demands, commitments, events or uncertainties which will result in or which are reasonably likely to result in the Partnership’s/Funds’ liquidity increasing or decreasing in any material way. The Limited Partnership Agreement provides that the Partnership shall cease trading operations and liquidate all open positions under certain circumstances, including a decrease in net asset value per Redeemable Unit to less than $400 as of the close of business on any business day.
(b) | Capital Resources. |
(i) | The Partnership has made no material commitments for capital expenditures. |
(ii) | The Partnership’s capital consists of the capital contributions of the partners, as increased or decreased by net income or losses on trading and by expenses, interest income, subscriptions and redemptions of Redeemable Units and distributions of profits, if any. Gains or losses on trading cannot be predicted. Market movements in commodities are dependent upon fundamental and technical factors which the Advisors may or may not be able to identify, such as changing supply and demand relationships, pandemics, epidemics and other health crises, weather, government, agricultural, commercial and trade programs and policies, national and international political and economic events and changes in interest rates. Partnership expenses consist of, among other things, clearing fees, ongoing selling agent fees, management fees and General Partner fees. The level of these expenses is dependent upon trading performance and the level of net assets maintained. In addition, the amount of interest income earned by the Partnership is dependent upon (1) the average daily equity maintained in cash in the Partnership’s and/or applicable Funds’ accounts, (2) the amount of U.S. Treasury bills and/or money market mutual fund securities held by the Partnership and/or the Funds and (3) interest rates over which none of the Partnership, the Funds or MS&Co. has control. |
No forecast can be made as to the level of redemptions in any given period. A limited partner may require the Partnership to redeem some or all of its Redeemable Units at their net asset value as of the end of each month on three business days’ notice to the General Partner. There is no fee charged to limited partners in connection with redemptions. Redemptions are generally funded out of the Partnership’s cash holdings and/or redemptions from the Funds.
For the year ended December 31, 2024, 7,250.2020 Class A Redeemable Units were redeemed totaling $19,553,237, 101.5880 Class Z General Partner Redeemable Units were redeemed totaling $225,077 and 148.1850 Class Z Redeemable Units were redeemed totaling $326,072. For the year ended December 31, 2023, 5,858.7060 Class A Redeemable Units were redeemed totaling $15,919,759, 500.0000 Class D Redeemable Units were redeemed totaling $1,089,837, 33.2290 Class Z General Partner Redeemable Units were redeemed totaling $74,997 and 719.2070 Class Z Redeemable Units were redeemed totaling $1,589,919. For the year ended December 31, 2022, 4,280.7070 Class A Redeemable Units were redeemed totaling $11,192,915, 11.1970 Class Z General Partner Redeemable Units were redeemed totaling $25,000 and 119.2400 Class Z Redeemable Units were redeemed totaling $263,645.
For the year ended December 31, 2024, there were subscriptions of 1,328.6390 Class A Redeemable Units totaling $3,647,500 and 83.3320 Class Z Redeemable Units totaling $189,888. For the year ended December 31, 2023, there were subscriptions of 2,752.1070 Class A Redeemable Units totaling $7,482,119 and 117.6330 Class Z Redeemable Units totaling $262,500. For the year ended December 31, 2022, there were subscriptions of 4,842.6190 Class A Redeemable Units totaling $12,557,500 and 790.3010 Class Z Redeemable Units totaling $1,675,000.
25
(c) Results of Operations.
For the year ended December 31, 2024, the net asset value per Class A Redeemable Unit decreased 3.8% from $2,730.63 to $2,627.20. For the year ended December 31, 2024, the net asset value per Class D Redeemable Unit decreased 3.8% from $2,165.30 to $2,083.28. For the year ended December 31, 2024, the net asset value per Class Z Redeemable Unit decreased 3.1% from $2,256.96 to $2,187.95. For the year ended December 31, 2023, the net asset value per Class A Redeemable Unit increased 0.3% from $2,721.77 to $2,730.63. For the year ended December 31, 2023, the net asset value per Class D Redeemable Unit increased 0.3% from $2,158.32 to $2,165.30. For the year ended December 31, 2023, the net asset value per Class Z Redeemable Unit increased 1.1% from $2,232.72 to $2,256.96. For the year ended December 31, 2022, the net asset value per Class A Redeemable Unit increased 18.8% from $2,290.21 to $2,721.77. For the year ended December 31, 2022, the net asset value per Class D Redeemable Unit increased 18.8% from $1,816.10 to $2,158.32. For the year ended December 31, 2022, the net asset value per Class Z Redeemable Unit increased 19.8% from $1,864.35 to $2,232.72.
The Partnership experienced a net trading loss before fees and expenses for the year ended December 31, 2024 of $5,422,206. Losses were primarily attributable to the Partnership’s/Funds’ trading of commodity futures in currencies, energy, livestock, metals and softs and were partially offset by gains in grains. The net trading gain or loss for the Partnership is discussed under “Item 8. Financial Statements and Supplementary Data.”
During the first quarter of 2024, the most notable gains were achieved in the grains sector during January and February from short positions in soybean and corn futures as prices fell to near three-year lows amid reports of growing grain production in the U.S. and South America. In the energies, further first quarter gains were recorded during January from long positions in crude oil and its refined products as heightened tensions in the Middle East boosted oil prices. Long positions in live cattle futures also recorded gains throughout the first quarter as prices advanced on signs of low U.S. cattle inventories. A portion of the Partnership’s gains for the first quarter was offset by losses incurred within the soft commodities sector during March from short positions in coffee and cocoa futures as adverse weather conditions in key growing regions threatened crops, pushing prices higher. In the metals markets, losses were recorded during January and February from long positions in platinum futures as prices reversed lower.
During the second quarter of 2024, the Partnership’s most significant losses were incurred within the energies during April and May from global carbon emission futures as uncertainty over the strength of global industrial output roiled carbon markets. Additional losses were recorded in the soft commodities during April from short positions in cocoa and coffee futures as weather-related threats to crops forced prices higher. In the metals, losses were incurred during June from long positions in copper futures as prices reversed lower following reports of tepid economic growth in China. Additional losses for the second quarter were experienced in the livestock markets during May from short positions in live cattle futures as prices moved higher. A portion of the Partnership’s losses for the second quarter was offset by gains achieved within the grains markets from short positions in soybean and wheat futures as prices fell during June. An increase in exports of grains from South America and favorable growing conditions in the U.S. Midwest contributed to the decline in prices.
During the third quarter of 2024, the Partnership’s most noteworthy losses were incurred within the energy sector from long positions in crude oil futures as prices steadily declined throughout the quarter amid high global inventories and concerns of a potential slowdown in the global economy. Within the soft commodities markets, losses were recorded during August and September from short positions in coffee futures as prices rallied amid drought conditions in key growing regions. Additional losses were incurred during July from currency hedging positions in the Australian dollar and New Zealand dollar. Within the grains, losses were experienced during September from short positions in soybean and corn futures as grain prices surged higher. Elsewhere, short positions in live cattle futures recorded losses during September as prices advanced on increased buying demand. A portion of the Partnership’s losses for the third quarter was offset by gains achieved within the metals sector during September from long positions in gold futures as a falling U.S. dollar boosted demand for precious metals.
During the fourth quarter of 2024, the most notable losses were incurred within the metals markets from long positions in copper futures as prices declined throughout the quarter amid concerns of slowing industrial growth in China. In the energies, losses were recorded during October and December from short positions in natural gas futures as cold weather in the U.S. and Europe boosted gas consumption demand. During October, losses in the livestock markets were recorded due to positions in lean hog and live cattle futures as choppy price action primarily dominated the meats markets. The Partnership’s losses for the fourth quarter were partially offset by gains achieved within the grains markets during October and November from short positions in soybean futures as data showed U.S. farms were producing bumper grain harvests while grain exports from South America were higher-than-expected. In the currencies, gains were experienced during November and December from currency hedging positions in the U.S. Dollar Index. Further gains for the fourth quarter were achieved during December from long positions in cocoa futures as prices rallied amid fears of global supply shortfalls.
26
The Partnership experienced a net trading loss before fees and expenses for the year ended December 31, 2023 of $317,769. Losses were primarily attributable to the Partnership’s/Funds’ trading of commodity futures in currencies, energy and metals and were partially offset by gains in grains, livestock and softs.
During the first quarter of 2023, the most notable losses were recorded in the energy markets from long positions in Brent and West Texas Intermediate (“WTI”) crude oil, gas oil, heating oil, and gasoline as prices for oil and the refined oil products finished the quarter lower amid an outlook for weaker global demand. These losses more than offset gains from short positions in natural gas throughout the quarter. In the grains markets, losses were incurred from positions in the soybean complex as prices moved without consistent direction throughout a majority of the quarter. In the metals markets, losses were recorded during February from long positions in copper and nickel as base metals prices fell amid the potential for an economic slowdown. Small losses were incurred in the currency markets during March from long U.S. dollar hedging positions. A portion of the Partnership’s losses for the first quarter was offset by profits recorded during March in the soft commodities sector from long positions in sugar futures as sugar prices rallied to a multi-year high amid concerns of export constrictions coming out of Brazil. Additional gains were achieved during March in livestock from long positions in cattle futures as prices finished the quarter higher.
During the second quarter of 2023, the Partnership’s most significant gains were recorded in the soft commodities markets from long positions in sugar futures as prices climbed to an 11-year high in April amid adverse weather in key growing regions and supply tightness. In the livestock markets, long positioning in live cattle futures and options was profitable for all three months of the quarter as tight supplies and steady demand pushed prices higher. In the metals, the most notable gains were achieved from short positions in nickel, zinc, and aluminum during May as industrial metals prices trended lower amid a drop in global demand. Further gains were recorded in the grains markets during May from trading in corn futures and options positions. A portion of the Partnership’s overall gains for the quarter was offset by losses incurred from futures and options positions in Brent crude oil and WTI crude oil as oil prices moved in a volatile manner throughout most of June. Small losses were recorded in the currency markets during June from short positions in the Canadian dollar versus the U.S. dollar.
During the third quarter of 2023, the Partnership’s most significant gains were recorded in the energy markets from long futures positions in crude oil and its refined products as prices trended higher throughout the quarter amid supply related concerns strengthened further by announcements in September of supply cuts by Saudi Arabia and Russia. In the soft commodities markets, long positions in sugar futures were profitable as prices continued to advance to multi-year highs several times throughout the quarter on reports of tight supplies. In the grain markets, gains were achieved in August from short positions in corn futures and options as prices trended lower amid improving crop conditions. A portion of the Partnership’s gains for the third quarter was offset by losses incurred in the metals markets from net long positioning in copper during August and September as prices moved lower in response to strength in the U.S. dollar. Smaller losses were recorded in the livestock markets from short positions in live cattle futures as prices moved higher throughout the quarter.
During the fourth quarter of 2023, the most notable losses were incurred within the energy complex during October from long positions in crude oil and its refined products as concerns regarding potential demand reduction outweighed escalating geopolitical tensions in the Middle East. In the metals, losses were experienced throughout the quarter from short positions in gold futures as a weakening dollar boosted precious metals prices. In the livestock sector, losses were recorded during November and December from short positions in live cattle futures as prices advanced amid concerns for the strength of U.S. cattle herds. Further losses were experienced during November and December from short positions in coffee futures as prices rallied on concerns El Niño weather patterns would damage South American crops. Losses were also incurred from currency hedge positions in November and December. The Partnership’s losses for the fourth quarter were partially offset by gains achieved within the grains markets during December from short positions in soybean and corn futures as prices fell amid reports grain plantings in key U.S. and South American growing regions increased in 2023.
The results of operations for the twelve months ended 2022 is discussed under “Item 7. Management’s Discussion and Analysis of Financial Condition and Results of Operations.” in the Partnership’s Annual Report on Form 10-K for the fiscal year ended December 31, 2022.
27
Interest income on 100% of the average daily equity maintained in cash in the Partnership’s (or the Partnership’s allocable portion of the Funds’) brokerage account during each month is earned at a rate equal to the monthly average of the 4-week U.S. Treasury bill discount rate. For the avoidance of doubt, the Partnership/Funds will not receive interest on amounts in the futures brokerage account that are committed to margin. Any interest earned on the Partnership’s and/or the Funds’ account in excess of the amounts described above, if any, will be retained by MS&Co. and/or shared with the General Partner. All interest income earned on U.S. Treasury bills and money market mutual fund securities will be retained by the Partnership and/or the Funds, as applicable. Interest income earned for the three and twelve months ended December 31, 2024 decreased by $452,651 and $276,342, respectively, as compared to the corresponding periods in 2023. The decrease in interest income was primarily due to lower interest rates during the three and twelve months ended December 31, 2024 as compared to the corresponding periods in 2023. Interest earned by the Partnership will increase the net asset value of the Partnership. The amount of interest income earned by the Partnership depends on (1) the average daily equity maintained in cash in the Partnership’s and/or the applicable Funds’ accounts, (2) the amount of U.S. Treasury bills and/or money market mutual fund securities held by the Partnership and/or the Funds and (3) interest rates over which none of the Partnership, the Funds or MS&Co. has control.
Certain clearing fees are based on the number of trades executed by the Advisors for the Partnership/Funds. Accordingly, they must be compared in relation to the number of trades executed during the period. Clearing fees related to direct investments for the three and twelve months ended December 31, 2024 increased by $76,180 and $241,266, respectively, as compared to the corresponding periods in 2023. The increase in these clearing fees was primarily due to an increase in the number of direct trades made by the Partnership during the three and twelve months ended December 31, 2024 as compared to the corresponding periods in 2023.
Ongoing selling agent fees are calculated as a percentage of the Partnership’s adjusted Net Assets of Class A Redeemable Units and Class D Redeemable Units as of the end of each month and are affected by trading performance, subscriptions and redemptions. Accordingly, they must be analyzed in relation to the fluctuations in the monthly net asset values. Ongoing selling agent fees for the three and twelve months ended December 31, 2024 decreased by $35,373 and $83,226, respectively, as compared to the corresponding periods in 2023. The decrease was due to lower average adjusted net assets during the three and twelve months ended December 31, 2024 as compared to the corresponding periods in 2023.
Management fees are calculated as a percentage of the Partnership’s adjusted Net Assets as of the end of each month and are affected by trading performance, subscriptions and redemptions. Accordingly, they must be analyzed in relation to the fluctuations in the monthly net asset values. Management fees for the three and twelve months ended December 31, 2024 decreased by $66,999 and $157,096, respectively, as compared to the corresponding periods in 2023. The decrease was due to lower average net assets during the three and twelve months ended December 31, 2024 as compared to the corresponding periods in 2023.
General Partner fees are calculated as a percentage of the Partnership’s adjusted Net Assets as of the end of each month and are affected by trading performance, subscriptions and redemptions. Accordingly, they must be analyzed in relation to the fluctuations in the monthly net asset values. General Partner fees for the three and twelve months ended December 31, 2024 decreased by $35,679 and $87,963, respectively, as compared to the corresponding periods in 2023. This decrease was due to lower average net assets during the three and twelve months ended December 31, 2024 as compared to the corresponding periods in 2023.
Incentive fees are based on the Net Trading Profits (as defined in the respective management agreements between the Partnership, the General Partner and each Advisor) generated by each Advisor at the end of each quarter, half year or year, as applicable. Trading performance for the three and twelve months ended December 31, 2024 resulted in incentive fees of $291,349 and $663,398, respectively. Trading performance for the three months ended December 31, 2023 resulted in a reversal of incentive fees of $414,312. Trading performance for the twelve months ended December 31, 2023 resulted in incentive fees of $513,461. To the extent an Advisor incurs a loss for the Partnership, the Advisor will not be paid incentive fees until such Advisor recovers any net loss incurred and earns additional new trading profits for the Partnership.
The Partnership pays professional fees, which generally include professional fees made up of legal and accounting expenses, as well as certain offering costs and filing, administrative, reporting and data processing fees. Professional fees for the years ended December 31, 2024 and 2023 were $526,550 and $450,270, respectively.
In the General Partner’s/Trading Manager’s opinion, the Partnership’s Advisors continue to employ trading methods consistent with the objectives of the Partnership/Funds and expectations of the Advisors’ respective programs. The General Partner/Trading Manager monitors the Advisors’ performance on a daily, weekly, monthly and annual basis to assure that these objectives are met.
28
Commodity markets are highly volatile. Broad price fluctuations and rapid inflation increase not only the risks involved in commodity trading, but also the possibility of profit. The profitability of the Partnership/Funds depends on the existence of major price trends and the ability of the Advisors to correctly identify those price trends. Price trends are influenced by, among other factors, changing supply and demand relationships, weather, governmental, agricultural, commercial and trade programs and policies, national and international political and economic events, changes in interest rates, pandemics, epidemics and other public health crises. To the extent that market trends exist and the Advisors are able to identify them, the Partnership/Funds expect to increase capital through operations.
In allocating substantially all of the assets of the Partnership among the Advisors, the General Partner considers, among other factors, each Advisor’s past performance, trading style, volatility of markets traded and fee requirements. The General Partner may modify or terminate the allocation of assets to the Advisors and allocate assets to additional advisors at any time. Each Advisor’s percentage allocation and trading program is described in the “Overview” section of this Item 7.
(d) Off-balance Sheet Arrangements. None.
(e) Contractual Obligations. None.
(f) Operational Risk.
The Partnership, directly or indirectly through its investment in the Funds, is directly exposed to market risk and credit risk, which arise in the normal course of its business activities. Slightly less direct, but of critical importance, are risks pertaining to operational and back office support. This is particularly the case in a rapidly changing and increasingly global environment with increasing transaction volumes and an expansion in the number and complexity of products in the marketplace.
Such risks include:
Operational/Settlement Risk — the risk of financial and opportunity loss and legal liability attributable to operational problems, such as inaccurate pricing of transactions, untimely trade execution, clearance and/or settlement, or the inability to process large volumes of transactions. The Partnership/Funds are subject to increased risks with respect to their trading activities in emerging market instruments, where clearance, settlement, and custodial risks are often greater than in more established markets.
Technological Risk — the risk of loss attributable to technological limitations or hardware failure that constrain the Partnership’s/Funds’ ability to gather, process, and communicate information efficiently and securely, without interruption, to customers, and in the markets where the Partnership and the Funds participate. Additionally, the General Partner’s computer systems may be vulnerable to unauthorized access, mishandling or misuse, computer viruses or malware, cyber attacks and other events that could have a security impact on such systems. If one or more of such events occur, this potentially could jeopardize a limited partner’s personal, confidential, proprietary or other information processed and stored in, and transmitted through, the General Partner’s computer systems, and adversely affect the Partnership’s business, financial condition or results of operations.
Legal/Documentation Risk — the risk of loss attributable to deficiencies in the documentation of transactions (such as trade confirmations) and customer relationships (such as master netting agreements) or errors that result in noncompliance with applicable legal and regulatory requirements.
Financial Control Risk — the risk of loss attributable to limitations in financial systems and controls. Strong financial systems and controls ensure that assets are safeguarded, that transactions are executed in accordance with the General Partner’s authorization, and that financial information utilized by the General Partner and communicated to external parties, including the Partnership’s Redeemable Unit holders, creditors and regulators, is free of material errors.
29
(g) Critical Accounting Policies.
The preparation of financial statements in conformity with accounting principles generally accepted in the United States of America (“GAAP”) requires the General Partner to make estimates and assumptions that affect the reported amounts of assets and liabilities and disclosures of contingent assets and liabilities at the date of the financial statements and the reported amounts of income and expenses during the reporting period. As a result, actual results could differ from these estimates, and those differences could be material. A summary of the Partnership’s significant accounting policies is described in Note 2 to the Partnership’s financial statements included in “Item 8. Financial Statements and Supplementary Data.”
As of December 31, 2024, the Partnership’s most significant accounting policy is the valuation of its investment in the Funds and in futures, option and forward contracts and U.S. Treasury bills, as applicable. The fair value of the investment in the Funds is determined based on the Partnership’s (1) net contribution to the Funds and (2) its allocated share of the undistributed profits and losses, including realized gains (losses) and net change in unrealized gains (losses), of the Funds. The fair value of exchange-traded futures, option and forward contracts is determined by the various exchanges, and reflects the settlement price for each contract as of the close of business on the last business day of the reporting period. The fair value of foreign currency forward contracts is extrapolated on a forward basis from the spot prices quoted as of approximately 3:00 P.M. (E.T.) on the last business day of the reporting period from various exchanges. The fair value of non-exchange-traded foreign currency option contracts is calculated by applying an industry standard model application for options valuation of foreign currency options, using as inputs the spot prices, interest rates, and option implied volatilities quoted as of approximately 3:00 P.M. (E.T.) on the last business day of the reporting period. U.S. Treasury bills are valued at the last available bid price received from independent pricing services as of the close of the last business day of the reporting period.
30
Item 7A. Quantitative and Qualitative Disclosures About Market Risk.
Introduction
The Partnership/Funds are speculative commodity pools. The market sensitive instruments held by the Partnership/Funds are acquired for speculative trading purposes, and all or substantially all of the Partnership’s/Funds’ assets are subject to the risk of trading loss. Unlike an operating company, the risk of market sensitive instruments is integral, not incidental, to the Partnership’s/Funds’ main line of business.
The limited partners will not be liable for losses exceeding the current net asset value of their investment. This limited liability is a result of the organization of the Partnership as a limited partnership under New York law.
Market movements result in frequent changes in the fair value of the Partnership’s/Funds’ open positions and, consequently, in their earnings and cash balances. The Partnership’s/Funds’ market risk is influenced by a wide variety of factors, including the level and volatility of interest rates, exchange rates, equity price levels, the market value of financial instruments and contracts, the diversification effects among the Partnership’s/Funds’ open contracts and the liquidity of the markets in which they trade.
The Partnership/Funds rapidly acquire and liquidate both long and short positions in a wide range of different markets. Consequently, it is not possible to predict how a particular future market scenario will affect performance, and the Partnership’s/Funds’ past performance is not necessarily indicative of their future results.
“Value at Risk” is a measure of the maximum amount which the Partnership/Funds could reasonably be expected to lose in a given market sector. However, the inherent uncertainty of the Partnership’s/Funds’ speculative trading and the recurrence in the markets traded by the Partnership/Funds of market movements far exceeding expectations could result in actual trading or non-trading losses far beyond the indicated Value at Risk or the Partnership’s/Funds’ experience to date (i.e., “risk of ruin”). In light of the foregoing, as well as the risks and uncertainties intrinsic to all future projections, the inclusion of the quantification in this section should not be considered to constitute any assurance or representation that the Partnership’s/Funds’ losses in any market sector will be limited to Value at Risk or by the Partnership’s/Funds’ attempts to manage their market risk.
Materiality as used in this section is based on an assessment of reasonably possible market movements and the potential losses caused by such movements, taking into account the leverage, optionality and multiplier features of the Partnership’s/Funds’ market sensitive instruments.
Quantifying the Partnership’s and the Funds’ Trading Value at Risk
The following quantitative disclosures regarding the Partnership’s/Funds’ market risk exposures contain “forward-looking statements” within the meaning of the safe harbor from civil liability provided for such statements by the Private Securities Litigation Reform Act of 1995 (set forth in Section 27A of the Securities Act and Section 21E of the Securities Exchange Act of 1934, as amended (the “Exchange Act”)). All quantitative disclosures in this section are deemed to be forward-looking statements for purposes of the safe harbor except for statements of historical fact (such as the terms of particular contracts and the number of market risk sensitive instruments held during or at the end of the reporting period).
The Partnership/Funds account for open positions on the basis of fair value accounting principles. Any loss in the market value of the Partnership’s/Funds’ open positions is directly reflected in the Partnership’s/Funds’ earnings and cash flow.
The Partnership’s/Funds’ risk exposure in the market sectors traded by the Advisors is estimated below in terms of Value at Risk. Please note that the Value at Risk model is used to numerically quantify market risk for historic reporting purposes only and is not utilized by either the General Partner or the Advisors in their daily risk management activities.
Exchange margin requirements have been used by the Partnership/Funds as the measure of their Value at Risk. Margin requirements are set by exchanges to equal or exceed the maximum losses reasonably expected to be incurred in the fair value of any given contract in 95%-99% of any one-day interval. The margin levels are established by dealers and exchanges using historical price studies as well as an assessment of current market volatility (including the implied volatility of the options on a given futures contract) and economic fundamentals to provide a probabilistic estimate of the maximum expected near-term one-day price fluctuation.
In the case of market sensitive instruments which are not exchange-traded (almost exclusively currencies in the case of the Partnership/Funds), the margin requirements for the equivalent futures positions have been used as Value at Risk. In those rare cases in which a futures-equivalent margin is not available, dealers’ margins have been used.
31
The fair value of the Partnership’s/Funds’ futures and forward positions does not have any optionality component. However, the Advisors may trade commodity options. The Value at Risk associated with options is reflected in the following table as the margin requirement attributable to the instrument underlying each option. Where this instrument is a futures contract, the futures margin has been used, and where this instrument is a physical commodity, the futures-equivalent margin has been used. This calculation is conservative in that it assumes that the fair value of an option will decline by the same amount as the fair value of the underlying instrument, whereas, in fact, the fair values of the options traded by the Partnership/Funds in almost all cases fluctuate to a lesser extent than those of the underlying instruments.
In quantifying the Partnership’s/Funds’ Value at Risk, 100% positive correlation in the different positions held in each market risk category has been assumed. Consequently, the margin requirements applicable to the open contracts have simply been added to determine each trading category’s aggregate Value at Risk. The diversification effects resulting from the fact that the Partnership’s/Funds’ positions are rarely, if ever, 100% positively correlated have not been reflected.
The Partnership’s and the Funds’ Trading Value at Risk in Different Market Sectors
Value at Risk tables represent a probabilistic assessment of the risk of loss in market sensitive instruments. As of December 31, 2024, Drakewood trades the Partnership’s assets indirectly in master fund managed accounts established in the name of the master funds over which they have been granted limited authority to make trading decisions. Opus, Millburn and Ospraie directly trade managed accounts in the name of the Partnership. The first two trading Value at Risk tables reflect the market sensitive instruments held by the Partnership directly and through its investments in the Funds. The remaining trading Value at Risk tables reflect the market sensitive instruments held by the Partnership directly (i.e in the managed accounts in the Partnership’s name traded by certain Advisors) and indirectly by each Fund separately. There have been no material changes in the trading Value at Risk information previously disclosed in the Partnership’s Annual Report on Form 10-K for the year ended December 31, 2023.
The following table indicates the trading Value at Risk associated with the Partnership’s open positions by market category as of December 31, 2024. As of December 31, 2024, the Partnership’s total capitalization was $123,195,247.
December 31, 2024 | ||||||||
Market Sector |
Value at Risk | % of Total Capitalization | ||||||
Currencies |
$ | 27,735 | 0.02 | % | ||||
Energy |
2,164,987 | 1.76 | ||||||
Grains |
2,106,373 | 1.71 | ||||||
Livestock |
95,370 | 0.08 | ||||||
Metals |
4,491,128 | 3.64 | ||||||
Softs |
1,831,610 | 1.49 | ||||||
|
|
|
|
|
| |||
Total |
$ | 10,717,203 | 8.70 | % | ||||
|
|
|
|
|
|
The following table indicates the trading Value at Risk associated with the Partnership’s open positions by market category as of December 31, 2023. As of December 31, 2023, the Partnership’s total capitalization was $144,572,899.
December 31, 2023 | ||||||||
Market Sector |
Value at Risk | % of Total Capitalization | ||||||
Currencies |
$ | 125,591 | 0.09 | % | ||||
Energy |
4,276,350 | 2.96 | ||||||
Grains |
2,154,822 | 1.49 | ||||||
Livestock |
280,803 | 0.19 | ||||||
Metals |
3,249,408 | 2.25 | ||||||
Softs |
2,330,742 | 1.61 | ||||||
|
|
|
|
|
| |||
Total |
$ | 12,417,716 | 8.59 | % | ||||
|
|
|
|
|
|
32
The following tables indicate the trading Value at Risk associated with the Partnership’s direct investments and indirect investments in the Funds as of December 31, 2024 and 2023, and the highest, lowest and average values during the twelve months ended December 31, 2024 and 2023, as applicable. All open contracts trading risk exposures have been included in calculating the figures set forth below.
As of December 31, 2024 and 2023, the Partnership’s Value at Risk for the portion of its assets that are traded directly was as follows:
December 31, 2024 | ||||||||||||||||||||
Twelve Months Ended December 31, 2024 | ||||||||||||||||||||
Market Sector |
Value at Risk | % of Total Capitalization |
High Value at Risk |
Low Value at Risk |
Average Value at Risk * | |||||||||||||||
Currencies |
$ | 11,880 | 0.01 | % | $ | 271,403 | $ | 10,395 | $ | 148,894 | ||||||||||
Energy |
2,164,987 | 1.76 | 3,895,847 | 454,870 | 1,762,163 | |||||||||||||||
Grains |
2,106,373 | 1.71 | 3,884,134 | 854,112 | 1,764,175 | |||||||||||||||
Livestock |
95,370 | 0.08 | 672,202 | 58,685 | 192,189 | |||||||||||||||
Metals |
1,687,565 | 1.37 | 1,875,738 | 839,593 | 1,317,942 | |||||||||||||||
Softs |
1,831,610 | 1.49 | 5,239,839 | 775,371 | 2,721,491 | |||||||||||||||
|
|
|
|
|
|
|||||||||||||||
Total |
$ | 7,897,785 | 6.42 | % | ||||||||||||||||
|
|
|
|
|
|
* | Annual average of daily Values at Risk. |
December 31, 2023 | ||||||||||||||||||||
Twelve Months Ended December 31, 2023 | ||||||||||||||||||||
Market Sector |
Value at Risk | % of Total Capitalization |
High Value at Risk |
Low Value at Risk |
Average Value at Risk * | |||||||||||||||
Currencies |
$ | 71,390 | 0.05 | % | $ | 811,963 | $ | 71,390 | $ | 340,211 | ||||||||||
Energy |
3,631,942 | 2.51 | 4,668,801 | 1,173,780 | 2,658,518 | |||||||||||||||
Grains |
2,154,822 | 1.49 | 6,213,199 | 634,659 | 2,688,416 | |||||||||||||||
Livestock |
280,803 | 0.19 | 754,930 | 47,059 | 250,322 | |||||||||||||||
Metals |
1,392,560 | 0.96 | 3,078,026 | 1,151,668 | 1,763,373 | |||||||||||||||
Softs |
2,330,742 | 1.61 | 2,869,817 | 454,252 | 1,449,734 | |||||||||||||||
|
|
|
|
|
|
|||||||||||||||
Total |
$ | 9,862,259 | 6.81 | % | ||||||||||||||||
|
|
|
|
|
|
* | Annual average of daily Values at Risk. |
As of December 31, 2024, the Partnership fully redeemed its investment from NL Master.
As of December 31, 2023, NL Master’s total capitalization was $40,737,626, and the Partnership owned approximately 28.3% of NL Master. As of December 31, 2023, NL Master’s Value at Risk for its assets (including the portion of the Partnership’s assets allocated to NL Master for trading) was as follows:
December 31, 2023 | ||||||||||||||||||||
Twelve Months Ended December 31, 2023 | ||||||||||||||||||||
Market Sector |
Value at Risk | % of Total Capitalization |
High Value at Risk |
Low Value at Risk |
Average Value at Risk * | |||||||||||||||
Energy |
$ | 2,277,059 | 5.59 | % | $ | 4,647,914 | $ | 832,520 | $ | 2,281,544 | ||||||||||
|
|
|
|
|
|
|||||||||||||||
Total |
$ | 2,277,059 | 5.59 | % | ||||||||||||||||
|
|
|
|
|
|
* | Annual average of daily Values at Risk. |
33
As of December 31, 2024, Drakewood Master’s total capitalization was $42,341,747, and the Partnership owned approximately 41.3% of Drakewood Master. As of December 31, 2024, Drakewood Master’s Value at Risk for its assets (including the portion of the Partnership’s assets allocated to Drakewood Master for trading) was as follows:
December 31, 2024 | ||||||||||||||||||||
Twelve Months Ended December 31, 2024 | ||||||||||||||||||||
Market Sector |
Value at Risk | % of Total Capitalization |
High Value at Risk |
Low Value at Risk |
Average Value at Risk * | |||||||||||||||
Currencies |
$ | 38,390 | 0.09 | % | $ | 204,050 | $ | - | $ | 106,063 | ||||||||||
Metals |
6,788,289 | 16.03 | 9,052,374 | 3,500,321 | 6,499,735 | |||||||||||||||
|
|
|
|
|
|
|||||||||||||||
Total |
$ | 6,826,679 | 16.12 | % | ||||||||||||||||
|
|
|
|
|
|
* | Annual average of daily Values at Risk. |
As of December 31, 2023, Drakewood Master’s total capitalization was $46,153,273, and the Partnership owned approximately 35.5% of Drakewood Master. As of December 31, 2023, Drakewood Master’s Value at Risk for its assets (including the portion of the Partnership’s assets allocated to Drakewood Master for trading) was as follows:
December 31, 2023 | ||||||||||||||||||||
Twelve Months Ended December 31, 2023 | ||||||||||||||||||||
Market Sector |
Value at Risk | % of Total Capitalization |
High Value at Risk |
Low Value at Risk |
Average Value at Risk * | |||||||||||||||
Currencies |
$ | 152,680 | 0.33 | % | $ | 355,410 | $ | 108,130 | $ | 205,414 | ||||||||||
Metals |
5,230,558 | 11.33 | 7,224,155 | 2,376,417 | 4,343,085 | |||||||||||||||
|
|
|
|
|
|
|||||||||||||||
Total |
$ | 5,383,238 | 11.66 | % | ||||||||||||||||
|
|
|
|
|
|
* | Annual average of daily Values at Risk. |
Material Limitations on Value at Risk as an Assessment of Market Risk
The face value of the market sector instruments held by the Partnership/Funds is typically many times the applicable margin requirement (margin requirements generally range between 1% and 15% of contract face value, although an exchange may increase margin requirements on short notice), as well as many times the capitalization of the Partnership/Funds. The magnitude of the Partnership’s/Funds’ open positions creates a “risk of ruin” not typically found in most other investment vehicles. Because of the size of their positions, certain market conditions — unusual, but historically recurring from time to time — could cause the Partnership/Funds to incur severe losses over a short period of time. The foregoing Value at Risk tables — as well as the past performance of the Partnership/Funds — give no indication of this “risk of ruin.”
Non-Trading Risk
The Partnership/Funds have non-trading market risk on its foreign cash balances not needed for margin. These balances and any market risk they may represent are immaterial.
A decline in short-term interest rates would result in a decline in the Partnership’s/Funds’ cash management income. This cash flow risk is not considered to be material.
Materiality, as used throughout this section, is based on an assessment of reasonably possible market movements and any associated potential losses, taking into account the leverage, optionality and multiplier features of the Partnership’s/Funds’ market-sensitive instruments, in relation to the Partnership’s/Funds’ net assets.
34
Qualitative Disclosures Regarding Primary Trading Risk Exposures
The following qualitative disclosures regarding the Partnership’s/Funds’ market risk exposures — except for (i) those disclosures that are statements of historical fact and (ii) the descriptions of how the Partnership/Funds manage their primary market risk exposures — constitute forward-looking statements within the meaning of Section 27A of the Securities Act and Section 21E of the Exchange Act. The Partnership’s/Funds’ primary market risk exposures as well as the strategies used and to be used by the General Partner and the Advisors for managing such exposures are subject to numerous uncertainties, contingencies and risks, any one of which could cause the actual results of the Partnership’s/Funds’ risk controls to differ materially from the objectives of such strategies. Government interventions, pandemics, epidemics and other public health crises, defaults and expropriations, illiquid markets, the emergence of dominant fundamental factors, political upheavals, changes in historical price relationships, an influx of new market participants, increased regulation and many other factors could result in material losses as well as in material changes to the risk exposures and the management strategies of the Partnership/Funds. There can be no assurance that the Partnership’s/Funds’ current market exposure and/or risk management strategies will not change materially or that any such strategies will be effective in either the short- or long- term. Investors must be prepared to lose all or substantially all of their investment in the Partnership.
The following were the primary trading risk exposures of the Partnership at December 31, 2024, by market sector. It may be anticipated, however, that these market exposures will vary materially over time.
Energy. The Partnership’s primary energy market exposure is to oil and natural gas price movements, often resulting from political developments in the Middle East, weather conditions, and other factors contributing to supply and demand. Further energy market exposure is to prices for carbon emissions allowances, European electric power, and coal, which can be driven by geopolitical events, climate related regulations, local government imposed regulations, weather related factors, availability of substitute power and fuel sources, and other supply/demand related factors. Energy prices can be volatile and substantial profits and losses, which have been experienced in the past, are expected to continue to be experienced in these markets in the future.
Metals. The Partnership’s primary metal market exposure as of December 31, 2024, was to fluctuations in the prices of industrial metals (such copper, nickel, tin, iron, lead, and zinc, and aluminum) and precious metals (such as gold, silver, platinum, and palladium). Price movement in both industrial and precious metals can be driven by fluctuation in the valuations between currency pairs, geopolitical events, economic conditions globally and regionally, trade policies, regulatory restrictions, as well as other supply and demand related factors.
Softs. The Partnership’s trading risk exposure in the soft commodities is to agricultural-related price movements, which are often directly affected by severe or unexpected weather conditions, as well as geopolitical events and other supply/demand related factors. Cocoa, coffee, sugar, and cotton accounted for the majority of the Partnership’s soft commodities exposure as of December 31, 2024.
Grains. The Partnership’s trading risk exposure in the grains is primarily to agricultural price movements, which are often directly affected by severe or unexpected weather conditions. Corn, wheat, and the soybean complex accounted for the majority of the Partnership’s grain exposure as of December 31, 2024.
Livestock. The Partnership’s primary risk exposure in livestock is to fluctuations in U.S. cattle and hog prices.
Currencies. The Partnership’s currency exposure is to exchange rate fluctuations, primarily fluctuations that disrupt the historical pricing relationships between different currencies and currency pairs. These fluctuations are influenced by interest rate changes as well as political and general economic conditions. The Partnership’s primary currency exposure as of December 31, 2024, was to Australian dollar and British pound positions. The General Partner does not anticipate the risk profile of the Partnership’s currency sector to be significant in the future.
35
Qualitative Disclosures Regarding Non-Trading Risk Exposure
The following was the only non-trading risk exposure of the Partnership/Funds as of December 31, 2024.
Foreign Currency Balances. The Partnership/Funds may hold various foreign balances. The Advisors regularly convert foreign currency balances to U.S. dollars in an attempt to manage the Partnership’s/Funds’ non-trading risk.
Qualitative Disclosures Regarding Means of Managing Risk Exposure
The General Partner/Trading Manager monitors and attempts to mitigate the Partnership’s/Funds’ risk exposure on a daily basis through financial, credit and risk management monitoring systems and, accordingly, believes that it has effective procedures for evaluating and limiting the credit and market risks to which the Partnership/Funds may be subject.
The General Partner/Trading Manager monitors the Partnership’s/Funds’ performance and the concentration of open positions, and consults with the Advisors concerning the Partnership’s/Funds’ overall risk profile. If the General Partner/Trading Manager felt it necessary to do so, the General Partner/Trading Manager could require an Advisor to close out positions as well as enter positions traded on behalf of the Partnership/Funds. However, any such intervention would be a highly unusual event. The General Partner/Trading Manager primarily relies on the Advisors’ own risk control policies while maintaining a general supervisory overview of the Partnership’s/Funds’ market risk exposures.
The Advisors apply their own risk management policies to their trading. The Advisors often follow diversification guidelines, margin limits and stop loss points to exit a position. The Advisors’ research of risk management often suggests ongoing modifications to their trading programs.
As part of the General Partner’s risk management, the General Partner periodically meets with the Advisors to discuss their risk management and to look for any material changes to the Advisors’ portfolio balance and trading techniques. The Advisors are required to notify the General Partner of any material changes to their programs.
36
![]() | ||
By: | Patrick T. Egan | |
President and Director Ceres Managed Futures LLC General Partner, Ceres Tactical Commodity L.P. | ||
Ceres Managed Futures LLC 1585 Broadway New York, NY 10036 (855) 672-4468 |
(i) | pertain to the maintenance of records that, in reasonable detail, accurately and fairly reflect the transactions and dispositions of the assets of the Partnership; |
(ii) | provide reasonable assurance that transactions are recorded as necessary to permit preparation of financial statements in accordance with accounting principles generally accepted in the United States of America, and that receipts and expenditures of the Partnership are being made only in accordance with authorizations of management and directors of the Partnership; and |
(iii) | provide reasonable assurance regarding prevention or timely detection and correction of unauthorized acquisition, use or disposition of the Partnership’s assets that could have a material effect on the financial statements. |
![]() |
![]() | |||
Patrick T. Egan | Brooke Lambert | |||
President and Director | Chief Financial Officer | |||
Ceres Managed Futures LLC | Ceres Managed Futures LLC | |||
General Partner, | General Partner, | |||
Ceres Tactical Commodity L.P. | Ceres Tactical Commodity L.P. |
![]() |
Ernst & Young LLP 200 Clarendon Street Boston, MA 02116 |
Tel: +1 617 266 2000 Fax: +1 617 266 5843 www.ey.com |
December 31, 2024 |
December 31, 2023 | |||||||
Assets: |
||||||||
Investment in the Funds (1) , at fair value (Note 6) |
$ | $ | ||||||
Redemptions receivable from the Funds |
||||||||
|
|
|
|
|
| |||
Equity in trading account: |
||||||||
Unrestricted cash (Note 3c) |
||||||||
Restricted cash (Note 3c) |
||||||||
Foreign cash (cost $ |
||||||||
Net unrealized appreciation on open futures contracts |
||||||||
Net unrealized appreciation on open forward contracts |
||||||||
Options purchased, at fair value (premiums paid $ |
||||||||
|
|
|
|
|
| |||
Total equity in trading account |
||||||||
Interest receivable (Note 3c) |
||||||||
|
|
|
|
|
| |||
Total assets |
$ | $ | ||||||
|
|
|
|
|
| |||
Liabilities and Partners’ Capital: |
||||||||
Liabilities: |
||||||||
Net unrealized depreciation on open futures contracts |
$ | $ | ||||||
Net unrealized depreciation on open forward contracts |
||||||||
Options written, at fair value (premiums received $ |
||||||||
Accrued expenses: |
||||||||
Ongoing selling agent fees (Note 3d) |
||||||||
Management fees (Note 3b) |
||||||||
General Partner fees (Note 3a) |
||||||||
Incentive fees (Note 3b) |
||||||||
Professional fees |
||||||||
Redemptions payable to General Partner (Note 7) |
||||||||
Redemptions payable to Limited Partners (Note 7) |
||||||||
|
|
|
|
|
| |||
Total liabilities |
||||||||
|
|
|
|
|
| |||
Partners’ Capital (Notes 1 and 7): |
||||||||
General Partner, Class Z, |
||||||||
Limited Partners, Class A, |
||||||||
Limited Partners, Class D, |
||||||||
Limited Partners, Class Z, |
||||||||
|
|
|
|
|
| |||
Total partners’ capital (net asset value) |
||||||||
|
|
|
|
|
| |||
Total liabilities and partners’ capital |
$ | |
$ | |
||||
|
|
|
|
|
| |||
Net asset value per Redeemable Unit: |
||||||||
Class A |
$ | $ | ||||||
|
|
|
|
|
| |||
Class D |
$ | $ | ||||||
|
|
|
|
|
| |||
Class Z |
$ | $ | ||||||
|
|
|
|
|
|
(1) |
Defined in Note 1. |
Number of Contracts |
Fair Value |
% of Partners Capital | ||||||||||||||
Futures Contracts Purchased |
||||||||||||||||
Currencies |
$ | ( |
) | ( |
) | % | ||||||||||
Energy |
||||||||||||||||
WTI CRUDE FUTURE FEB25 |
||||||||||||||||
Other |
||||||||||||||||
Grains |
||||||||||||||||
Livestock |
* | |||||||||||||||
Metals |
( |
) | ( |
) | ||||||||||||
Softs |
( |
) | ( |
) | ||||||||||||
Total futures contracts purchased |
||||||||||||||||
Futures Contracts Sold |
||||||||||||||||
Energy |
( |
) | ( |
) | ||||||||||||
Grains |
( |
) | ( |
) | ||||||||||||
Livestock |
||||||||||||||||
Metals |
||||||||||||||||
Softs |
||||||||||||||||
Total futures contracts sold |
( |
) | ( |
) | ||||||||||||
Net unrealized depreciation on open futures contracts |
$ | ( |
) | ( |
) | % | ||||||||||
Unrealized Appreciation on Open Forward Contracts |
||||||||||||||||
Metals |
$ | % | ||||||||||||||
Total unrealized appreciation on open forward contracts |
||||||||||||||||
Unrealized Depreciation on Open Forward Contracts |
||||||||||||||||
Metals |
( |
) | ( |
) | ||||||||||||
Total unrealized depreciation on open forward contracts |
( |
) | ( |
) | ||||||||||||
Net unrealized depreciation on open forward contracts |
$ | ( |
) | ( |
) | % | ||||||||||
Options Purchased |
||||||||||||||||
Calls |
||||||||||||||||
Grains |
$ | % | ||||||||||||||
Metals |
||||||||||||||||
Puts |
||||||||||||||||
Energy |
||||||||||||||||
Grains |
||||||||||||||||
SOYBEAN FUT OPTN P @ |
||||||||||||||||
SOYBEAN FUT OPTN P @ |
||||||||||||||||
Other |
||||||||||||||||
Livestock |
||||||||||||||||
Metals |
||||||||||||||||
Softs |
|
|||||||||||||||
Total options purchased (premiums paid $ |
$ | % | ||||||||||||||
Options Written |
||||||||||||||||
Calls |
||||||||||||||||
Grains |
$ | ( |
) | ( |
) | % | ||||||||||
Livestock |
( |
) | ( |
) | ||||||||||||
Softs |
( |
) | ( |
) | ||||||||||||
Puts |
||||||||||||||||
Grains |
( |
) | ( |
) | ||||||||||||
Livestock |
( |
) | ( |
) | ||||||||||||
Metals |
( |
) | ( |
) | ||||||||||||
Softs |
( |
) | ( |
) | ||||||||||||
Total options written (premiums received $ |
$ | ( |
) | ( |
) | % | ||||||||||
Fair Value |
% of Partners Capital |
|||||||||||||||
Investment in the Fund |
||||||||||||||||
CMF Drakewood Master Fund LLC |
$ | |
% | |||||||||||||
Total investment in the Fund |
$ | % | ||||||||||||||
* | Due to rounding. |
Number of Contracts |
Fair Value |
% of Partners Capital | ||||||||||||||
Futures Contracts Purchased |
||||||||||||||||
Currencies |
$ | % | ||||||||||||||
Energy |
||||||||||||||||
BRENT CRUDE FUTR MAR24 |
( |
) | ( |
) | ||||||||||||
Other |
( |
) | ( |
) | ||||||||||||
Grains |
( |
) | ( |
) | ||||||||||||
Livestock |
( |
) | ( |
) | ||||||||||||
Metals |
||||||||||||||||
Softs |
( |
) | ( |
) | ||||||||||||
Total futures contracts purchased |
( |
) | ( |
) | ||||||||||||
Futures Contracts Sold |
||||||||||||||||
Currencies |
( |
) | ( |
) | ||||||||||||
Energy |
||||||||||||||||
Grains |
||||||||||||||||
Livestock |
||||||||||||||||
Metals |
( |
) | ( |
) | ||||||||||||
Softs |
( |
) | ( |
) | ||||||||||||
Total futures contracts sold |
||||||||||||||||
Net unrealized appreciation on open futures contracts |
$ | % | ||||||||||||||
Unrealized Appreciation on Open Forward Contracts |
||||||||||||||||
Metals |
$ | % | ||||||||||||||
Total unrealized appreciation on open forward contracts |
||||||||||||||||
Unrealized Depreciation on Open Forward Contracts |
||||||||||||||||
Metals |
( |
) | ( |
) | ||||||||||||
Total unrealized depreciation on open forward contracts |
( |
) | ( |
) | ||||||||||||
Net unrealized appreciation on open forward contracts |
$ | % | ||||||||||||||
Options Purchased |
||||||||||||||||
Calls |
||||||||||||||||
Energy |
$ | % | ||||||||||||||
Grains |
* | |||||||||||||||
Livestock |
||||||||||||||||
Metals |
* | |||||||||||||||
Puts |
||||||||||||||||
Grains |
||||||||||||||||
Metals |
||||||||||||||||
Softs |
||||||||||||||||
Total options purchased (premiums paid $ |
$ | % | ||||||||||||||
Options Written |
||||||||||||||||
Calls |
||||||||||||||||
Grains |
$ | ( |
) | ( |
) | % | ||||||||||
Livestock |
( |
) | ( |
) | ||||||||||||
Metals |
( |
) | ( |
) | * | |||||||||||
Softs |
( |
) | ( |
) | ||||||||||||
Puts |
||||||||||||||||
Energy |
( |
) | ( |
) | ||||||||||||
Grains |
( |
) | ( |
) | ||||||||||||
Livestock |
( |
) | ( |
) | ||||||||||||
Metals |
( |
) | ( |
) | ||||||||||||
Total options written (premiums received $ |
$ | ( |
) | ( |
) | % | ||||||||||
Fair Value |
% of Partners Capital |
|||||||||||||||
Investment in the Funds |
||||||||||||||||
CMF NL Master Fund LLC |
$ | % | ||||||||||||||
CMF Drakewood Master Fund LLC |
|
|||||||||||||||
Total investment in the Funds |
$ | |
% | |||||||||||||
* | Due to rounding. |
2024 |
2023 |
2022 | ||||||||||
Investment Income: |
||||||||||||
Interest income (Note 3c) |
$ | $ | $ | |||||||||
Interest income allocated from the Funds (Note 3c) |
||||||||||||
Total investment income |
||||||||||||
Expenses: |
||||||||||||
Expenses allocated from the Funds |
||||||||||||
Clearing fees related to direct investments (Note 3c) |
||||||||||||
Ongoing selling agent fees (Note 3d) |
||||||||||||
Management fees (Note 3b) |
||||||||||||
General Partner fees (Note 3a) |
||||||||||||
Incentive fees (Note 3b) |
||||||||||||
Professional fees |
||||||||||||
Total expenses |
||||||||||||
Net investment income (loss) |
( |
) | ||||||||||
Trading Results: |
||||||||||||
Net gains (losses) on trading of commodity interests and investments in the Funds: |
||||||||||||
Net realized gains (losses) on closed contracts |
||||||||||||
Net realized gains (losses) on closed contracts allocated from the Funds |
( |
) | ( |
) | ||||||||
Net change in unrealized gains (losses) on open contracts |
( |
) | ( |
) | ( |
) | ||||||
Net change in unrealized gains (losses) on open contracts allocated from the Funds |
( |
) | ( |
) | ||||||||
Total trading results |
( |
) | ( |
) | ||||||||
Net income (loss) |
$ | ( |
) | $ | $ | |||||||
Net income (loss) per Redeemable Unit (Note 8): * |
||||||||||||
Class A |
$ | ( |
) | $ | $ | |||||||
Class D |
$ | ( |
) | $ | $ | |||||||
Class Z |
$ | ( |
) | $ | $ | |||||||
Weighted average Redeemable Units outstanding: |
||||||||||||
Class A |
|
|
|
|||||||||
Class D |
||||||||||||
Class Z |
||||||||||||
* | Represents the change in net asset value per Redeemable Unit. |
Class A |
Class D |
Class Z |
Total | |||||||||||||||||||||||||||||
Amount |
Redeemable Units |
Amount |
Redeemable Units |
Amount |
Redeemable Units |
Amount |
Redeemable Units | |||||||||||||||||||||||||
Partners’ Capital, December 31, 2021 |
$ | $ | $ | $ | ||||||||||||||||||||||||||||
Subscriptions - Limited Partners |
- | - | ||||||||||||||||||||||||||||||
Redemptions - General Partner |
- | - | - | - | ( |
) | ( |
) | ( |
) | ( |
) | ||||||||||||||||||||
Redemptions - Limited Partners |
( |
) | ( |
) | - | - | ( |
) | ( |
) | ( |
) | ( |
) | ||||||||||||||||||
Net income (loss) |
- | - | - | - | ||||||||||||||||||||||||||||
|
|
|
|
|
|
|
|
|
|
|
|
|
|
|
|
|
|
|
|
|
|
|
| |||||||||
Partners’ Capital, December 31, 2022 |
||||||||||||||||||||||||||||||||
Subscriptions - Limited Partners |
- | - | ||||||||||||||||||||||||||||||
Redemptions - General Partner |
- | - | - | ( |
) | ( |
) | ( |
) | ( |
) | |||||||||||||||||||||
Redemptions - Limited Partners |
( |
) | ( |
) | ( |
) | ( |
) | ( |
) | ( |
) | ( |
) | ( |
) | ||||||||||||||||
Net income (loss) |
- | - | - | - | ||||||||||||||||||||||||||||
|
|
|
|
|
|
|
|
|
|
|
|
|
|
|
|
|
|
|
|
|
|
|
| |||||||||
Partners’ Capital, December 31, 2023 |
||||||||||||||||||||||||||||||||
Subscriptions - Limited Partners |
- | - | ||||||||||||||||||||||||||||||
Redemptions - General Partner |
- | - | - | - | ( |
) | ( |
) | ( |
) | ( |
) | ||||||||||||||||||||
Redemptions - Limited Partners |
( |
) | ( |
) | - | - | ( |
) | ( |
) | ( |
) | ( |
) | ||||||||||||||||||
Net income (loss) |
( |
) | - | ( |
) | - | ( |
) | - | ( |
) | - | ||||||||||||||||||||
|
|
|
|
|
|
|
|
|
|
|
|
|
|
|
|
|
|
|
|
|
|
|
| |||||||||
Partners’ Capital, December 31, 2024 |
$ | |
|
$ | |
|
$ | |
|
$ | |
|
||||||||||||||||||||
|
|
|
|
|
|
|
|
|
|
|
|
|
|
|
|
|
|
|
|
|
|
|
|
Class A | Class D | Class Z | ||||||||||
2022: |
$ | $ | $ | |||||||||
|
|
|
|
|
|
|
|
| ||||
2023: |
$ | $ | $ | |||||||||
|
|
|
|
|
|
|
|
| ||||
2024: |
$ | $ | $ | |||||||||
|
|
|
|
|
|
|
|
|
1. |
Organization: |
2. |
Basis of Presentation and Summary of Significant Accounting Policies: |
a. | Use of Estimates |
b. | Profit Allocation |
c. | Statement of Cash Flows “Statement of Cash Flows.” |
d. | Partnership’s Investment in the Funds |
e. | Partnership’s/Funds’ Derivative Investments first-in, first-out method. Net unrealized gains or losses on open contracts are included as a component of equity in trading account in the Partnership’s/Funds’ Statements of Financial Condition. Net realized gains or losses and net change in unrealized gains or losses are included in the Partnership’s/Funds’ Statements of Income and Expenses. |
f. | Partnership’s Cash |
g. | Income Taxes “Income Taxes,” “more-likely-than-not” of being sustained “when challenged” or “when examined” by the applicable tax authority. Tax positions determined not to meet the more-likely-than-not threshold would be recorded as a tax benefit or liability in the Partnership’s Statements of Financial Condition for the current year. If a tax position does not meet the minimum statutory threshold to avoid the incurring of penalties, an expense for the amount of the statutory penalty and interest, if applicable, shall be recognized in the Partnership’s Statements of Income and Expenses in the years in which the position is claimed or expected to be claimed. The General Partner has concluded that there are |
h. | Investment Company Status 2013-08, “Financial Services — Investment Companies (Topic 946): Amendments to the Scope, Measurement and Disclosure Requirements” |
i. | Net Income (Loss) per Redeemable Unit “Financial Services — Investment Companies.” |
j. | Segment Reporting No. 2023-07, Segment Reporting (Topic 280): Improvements to Reportable Segment Disclosures 2023-07), which requires incremental disclosures related to a public entity’s reportable segments. The Partnership operates as a single reportable segment, as the Chief Operating Decision Maker (CODM) monitors the operating results of the fund as a whole against its investment objective, which is included in Note 1. The Partnership’s President acts as the Partnership’s CODM and is responsible for assessing the performance of the Partnership’s single segment and deciding how to allocate the segment’s resources. To perform this function, the CODM reviews the total trading results as reflected in the accompanying statements of income and expenses and total return as reflected in the financial highlights as included in the notes to the Partnership’s Financial Statements. Additionally, segment assets are presented in the accompanying Statements of Financial Condition and significant segment expenses are reported in the accompanying Statements of Income and Expenses. |
3. |
Agreements: |
a. | Limited Partnership Agreement: |
b. | Management Agreement: |
c. | Customer Agreement: |
d. | Selling Agreement: |
4. |
Trading Activities: |
Gross Amounts Offset in the |
Amounts Presented in the |
Gross Amounts Not Offset in the Statements of Financial Condition |
||||||||||||||||||||||
December 31, 2024 |
Gross Amounts Recognized |
Statements of Financial Condition |
Financial Instruments |
Cash Collateral Received/ Pledged* |
Net Amount |
||||||||||||||||||
Assets |
||||||||||||||||||||||||
Futures |
$ | $ | ( |
) | $ | $ | $ | $ | ||||||||||||||||
Forwards |
( |
) | ||||||||||||||||||||||
Total assets |
$ | |
$ | ( |
) | $ | $ | |
$ | $ | ||||||||||||||
Liabilities |
||||||||||||||||||||||||
Futures |
$ | ( |
) | $ | |
$ | ( |
) | $ | $ | $ | |||||||||||||
Forwards |
( |
) | ( |
) | ||||||||||||||||||||
Total liabilities |
$ | ( |
) | $ | $ | ( |
) | $ | $ | |
$ | |||||||||||||
Net fair value |
$ | * | ||||||||||||||||||||||
Gross Amounts Offset in the |
Amounts Presented in the |
Gross Amounts Not Offset in the Statements of Financial Condition |
||||||||||||||||||||||
December 31, 2023 |
Gross Amounts Recognized |
Statements of Financial Condition |
Financial Instruments |
Cash Collateral Received/ Pledged* |
Net Amount |
||||||||||||||||||
Assets |
||||||||||||||||||||||||
Futures |
$ | $ | ( |
) | $ | $ | $ | $ | ||||||||||||||||
Forwards |
|
( |
) | |
||||||||||||||||||||
Total assets |
$ | $ | ( |
) | $ | |
$ | $ | $ | |||||||||||||||
Liabilities |
||||||||||||||||||||||||
Futures |
$ | ( |
) | $ | |
$ | $ | $ | $ | |||||||||||||||
Forwards |
( |
) | ||||||||||||||||||||||
Total liabilities |
$ | ( |
) | $ | $ | $ | $ | $ | ||||||||||||||||
Net fair value |
$ | |
* | |||||||||||||||||||||
* | In the event of default by the Partnership, MS&Co., the Partnership’s commodity futures broker and the sole counterparty to the Partnership’s non-exchange-traded contracts, as applicable, has the right to offset the Partnership’s obligation with the Partnership’s cash and/or U.S. Treasury bills held by MS&Co., thereby minimizing MS&Co.’s risk of loss. In certain instances, MS&Co. may not post collateral and as such, in the event of default by MS&Co., the Partnership is exposed to the amount shown in the Statements of Financial Condition. In the case of exchange-traded contracts, the Partnership’s exposure to counterparty risk may be reduced since the exchange’s clearinghouse interposes its credit between buyer and seller and the clearinghouse’s guarantee funds may be available in the event of a default. In some instances, the actual collateral received and/or pledged may be more than the amount shown due to overcollateralization. |
December 31, 2024 |
||||
Assets |
||||
Futures Contracts |
||||
Energy |
$ | |||
Grains |
||||
Livestock |
||||
Metals |
||||
Softs |
||||
Total unrealized appreciation on open futures contracts |
||||
Liabilities |
||||
Futures Contracts |
||||
Currencies |
( |
|||
Energy |
( |
|||
Grains |
( |
|||
Livestock |
( |
|||
Metals |
( |
|||
Softs |
( |
|||
Total unrealized depreciation on open futures contracts |
( |
|||
Net unrealized depreciation on open futures contracts |
$ | ( |
* | |
Assets |
||||
Forward Contracts |
||||
Metals |
$ | |||
Total unrealized appreciation on open forward contracts |
||||
Liabilities |
||||
Forward Contracts |
||||
Metals |
( |
|||
Total unrealized depreciation on open forward contracts |
( |
|||
Net unrealized depreciation on open forward contracts |
$ | ( |
** | |
Assets |
||||
Options Purchased |
||||
Energy |
$ | |||
Grains |
||||
Livestock |
||||
Metals |
||||
Softs |
||||
Total options purchased |
$ | |
*** | |
Liabilities |
||||
Options Written |
||||
Grains |
$ | ( |
||
Livestock |
( |
|||
Metals |
( |
|||
Softs |
( |
|||
Total options written |
$ | ( |
**** | |
* | This amount is in “Net unrealized depreciation on open futures contracts” in the Statements of Financial Condition. |
** | This amount is in “Net unrealized depreciation on open forward contracts” in the Statements of Financial Condition. |
*** | This amount is in “Options purchased, at fair value” in the Statements of Financial Condition. |
**** | This amount is in “Options written, at fair value” in the Statements of Financial Condition. |
December 31, 2023 |
||||
Assets |
||||
Futures Contracts |
||||
Currencies |
$ | |||
Energy |
||||
Grains |
||||
Livestock |
||||
Metals |
||||
Softs |
||||
Total unrealized appreciation on open futures contracts |
||||
Liabilities |
||||
Futures Contracts |
||||
Currencies |
( |
|||
Energy |
( |
|||
Grains |
( |
|||
Livestock |
( |
|||
Metals |
( |
|||
Softs |
( |
|||
Total unrealized depreciation on open futures contracts |
( |
|||
Net unrealized appreciation on open futures contracts |
$ | * | ||
Assets |
||||
Forward Contracts |
||||
Metals |
$ | |||
Total unrealized appreciation on open forward contracts |
||||
Liabilities |
||||
Forward Contracts |
||||
Metals |
( |
|||
Total unrealized depreciation on open forward contracts |
( |
|||
Net unrealized appreciation on open forward contracts |
$ | ** | ||
Assets |
||||
Options Purchased |
||||
Energy |
$ | |||
Grains |
||||
Livestock |
||||
Metals |
||||
Softs |
||||
Total options purchased |
$ | |
*** | |
Liabilities |
||||
Options Written |
||||
Energy |
$ | ( |
||
Grains |
( |
|||
Livestock |
( |
|||
Metals |
( |
|||
Softs |
( |
|||
Total options written |
$ | ( |
**** | |
* | This amount is in “Net unrealized appreciation on open futures contracts” in the Statements of Financial Condition. |
** | This amount is in “Net unrealized appreciation on open forward contracts” in the Statements of Financial Condition. |
*** | This amount is in “Options purchased, at fair value” in the Statements of Financial Condition. |
**** | This amount is in “Options written, at fair value” in the Statements of Financial Condition. |
Sector |
2024 |
2023 |
2022 |
|||||||||
Currencies |
$ | ( |
$ | ( |
$ | ( |
||||||
Energy |
( |
|||||||||||
Grains |
|
|
|
|||||||||
Indices |
||||||||||||
Livestock |
( |
|||||||||||
Metals |
( |
( |
( |
|||||||||
Softs |
( |
|||||||||||
Total |
$ | ( |
***** | $ | ***** | $ | ***** | |||||
***** |
This amount is included in “Total trading results” in the Statements of Income and Expenses. |
5. |
Fair Value Measurements: |
December 31, 2024 |
Total |
Level 1 |
Level 2 |
Level 3 | ||||||||||||
Assets |
||||||||||||||||
Futures |
$ | $ | $ | - | $ | - | ||||||||||
Forwards |
- | - | ||||||||||||||
Options purchased |
- | - | ||||||||||||||
Total assets |
$ | $ | $ | $ | - | |||||||||||
Liabilities |
||||||||||||||||
Futures |
$ | $ | $ | - | $ | - | ||||||||||
Forwards |
- | - | ||||||||||||||
Options written |
- | - | ||||||||||||||
Total liabilities |
$ | |
$ | |
$ | |
$ | - | ||||||||
December 31, 2023 |
Total |
Level 1 |
Level 2 |
Level 3 | ||||||||||||
Assets |
||||||||||||||||
Futures |
$ | $ | $ | - | $ | - | ||||||||||
Forwards |
- | - | ||||||||||||||
Options purchased |
- | - | ||||||||||||||
Total assets |
$ | $ | $ | $ | - | |||||||||||
Liabilities |
||||||||||||||||
Futures |
$ | $ | $ | - | $ | - | ||||||||||
Forwards |
- | - | ||||||||||||||
Options written |
- | - | ||||||||||||||
Total liabilities |
$ | $ | $ | $ | - | |||||||||||
6. |
Investment in the Funds: |
December 31, 2024 |
||||||||||||
Total Assets |
Total Liabilities |
Total Capital |
||||||||||
NL Master |
$ | $ | $ | |||||||||
Drakewood Master |
$ | $ | $ |
December 31, 2023 |
||||||||||||
Total Assets |
Total Liabilities |
Total Capital |
||||||||||
NL Master |
$ | $ | |
$ | ||||||||
Drakewood Master |
For the year ended December 31, 2024 |
||||||||||||
Net Investment |
Total Trading |
|||||||||||
Income (Loss) |
Results |
Net Income (Loss) | ||||||||||
NL Master |
$ | $ | ( |
$ | ( |
|||||||
Drakewood Master |
( |
( |
For the year ended December 31, 2023 |
||||||||||||
Net Investment |
Total Trading |
|||||||||||
Income (Loss) |
Results |
Net Income (Loss) | ||||||||||
NL Master |
$ | $ | ( |
$ | ( |
|||||||
Drakewood Master |
( |
( |
For the year ended December 31, 2022 |
||||||||||||
Net Investment |
Total Trading |
|||||||||||
Income (Loss) |
Results |
Net Income (Loss) |
||||||||||
GSL Master |
$ | ( |
$ | $ | ||||||||
NL Master |
||||||||||||
Drakewood Master (a) |
( |
( |
(a) |
From May 1, 2022, commencement of operations for Drakewood Master, through December 31, 2022. |
December 31, 2024 |
For the year ended December 31, 2024 |
|||||||||||||||||||||||||||||||
% of |
Expenses |
Net |
||||||||||||||||||||||||||||||
Partners’ |
Fair |
Income |
Clearing |
Professional |
Income |
Investment |
Redemptions |
|||||||||||||||||||||||||
Funds |
Capital |
Value |
(Loss) |
Fees |
Fees |
(Loss) |
Objective |
Permitted |
||||||||||||||||||||||||
NL Master |
- % | $ | $ | ( |
$ | $ | $ | ( |
|
|||||||||||||||||||||||
Drakewood Master |
( |
( |
|
|||||||||||||||||||||||||||||
$ | |
$ | ( |
$ | |
$ | |
$ | ( |
|||||||||||||||||||||||
December 31, 2023 |
For the year ended December 31, 2023 |
|||||||||||||||||||||||||||||||
% of |
Expenses |
Net |
||||||||||||||||||||||||||||||
Partners’ |
Fair |
Income |
Clearing |
Professional |
Income |
Investment |
Redemptions |
|||||||||||||||||||||||||
Funds |
Capital |
Value |
(Loss) |
Fees |
Fees |
(Loss) |
Objective |
Permitted |
||||||||||||||||||||||||
NL Master |
$ | $ | ( |
$ | $ | $ | ( |
|
||||||||||||||||||||||||
Drakewood Master |
( |
( |
|
|||||||||||||||||||||||||||||
$ | |
$ | ( |
$ | |
$ | |
$ | ( |
|||||||||||||||||||||||
December 31, 2022 |
For the year ended December 31, 2022 |
|||||||||||||||||||||||||||||||
% of Partners’ Capital |
Expenses |
Net Income (Loss) |
||||||||||||||||||||||||||||||
Fair |
Income |
Clearing |
Professional |
Investment |
Redemptions |
|||||||||||||||||||||||||||
Funds |
Value |
(Loss) |
Fees |
Fees |
Objective |
Permitted |
||||||||||||||||||||||||||
GSL Master |
- % | $- | $ | $ | $ | $ | |
|||||||||||||||||||||||||
NL Master |
|
|||||||||||||||||||||||||||||||
Drakewood Master (a) |
( |
) | ( |
) | |
|||||||||||||||||||||||||||
$ | |
$ | |
$ | |
$ | |
$ | |
|||||||||||||||||||||||
(a) |
The Partnership first invested into Drakewood Master on May 1, 2022. |
7. |
Subscriptions, Distributions and Redemptions: |
8. |
Financial Highlights: |
2024 |
2023 |
2022 | ||||||||||||||||||||||||||||||||||
Class A |
Class D |
Class Z |
Class A |
Class D |
Class Z |
Class A |
Class D |
Class Z | ||||||||||||||||||||||||||||
Per Redeemable Unit Performance (for a unit outstanding throughout the year): * |
||||||||||||||||||||||||||||||||||||
Net realized and unrealized gains (losses) |
$ | ( |
) | $ | ( |
) | $ | ( |
) | $ | ( |
) | $ | $ | $ | $ | $ | |||||||||||||||||||
Net investment income (loss) |
( |
) | ( |
) | ( |
) | ( |
) | ||||||||||||||||||||||||||||
Increase (decrease) for the year |
( |
) | ( |
) | ( |
) | ||||||||||||||||||||||||||||||
Net asset value per Redeemable Unit, beginning of year |
||||||||||||||||||||||||||||||||||||
Net asset value per Redeemable Unit, end of year |
$ | |
$ | |
$ | |
$ | |
$ | |
$ | |
$ | |
$ | |
$ | |
||||||||||||||||||
2024 |
2023 |
2022 |
||||||||||||||||||||||||||||||||||
Class A |
Class D |
Class Z |
Class A |
Class D |
Class Z |
Class A |
Class D |
Class Z |
||||||||||||||||||||||||||||
Ratios to Average Limited Partners’ Capital: ** |
||||||||||||||||||||||||||||||||||||
Net investment income (loss) *** |
|
% | |
% | |
% | |
% | |
% | |
% | ( |
% | ( |
% | ( |
% | ||||||||||||||||||
Operating expenses |
% | % | % | % | % | % | % | % | % | |||||||||||||||||||||||||||
Incentive fees |
% | % | % | % | % | % | % | % | % | |||||||||||||||||||||||||||
Total expenses |
% | % | % | % | % | % | % | % | % | |||||||||||||||||||||||||||
Total return: |
||||||||||||||||||||||||||||||||||||
Total return before incentive fees |
( |
% | ( |
% | ( |
% | % | % | % | % | % | % | ||||||||||||||||||||||||
Incentive fees |
( |
% | ( |
% | ( |
% | ( |
% | ( |
% | ( |
% | ( |
% | ( |
% | ( |
% | ||||||||||||||||||
Total return after incentive fees |
( |
% | ( |
% | ( |
% | % | % | % | % | % | % | ||||||||||||||||||||||||
* | Net investment income (loss) per Redeemable Unit is calculated by dividing the interest income less total expenses by the average number of Redeemable Units outstanding during the period/year. The net realized and unrealized gains (losses) per Redeemable Unit is a balancing amount necessary to reconcile the change in net asset value per Redeemable Unit with the other per unit information. |
** | Interest income less total expenses. |
9. |
Financial Instrument Risks: |
10. |
Subsequent Events: |
For the period from October 1, 2024 to December 31, 2024 |
For the period from July 1, 2024 to September 30, 2024 |
For the period from April 1, 2024 to June 30, 2024 |
For the period from January 1, 2024 to March 31, 2024 | |||||||||||||
Total investment income |
$ | $ | $ | $ | ||||||||||||
Total expenses |
( |
) | ( |
) | ( |
) | ( |
) | ||||||||
Total trading results |
( |
) | ( |
) | ( |
) | ||||||||||
Net income (loss) |
$ | ( |
) | $ | ( |
) | $ | ( |
) | $ | ||||||
Increase (decrease) in net asset value per Redeemable Unit: |
||||||||||||||||
Class A |
$ | ( |
) | $ | ( |
) | $ | ( |
) | $ | ||||||
Class D |
$ | ( |
) | $ | ( |
) | $ | ( |
) | $ | ||||||
Class Z |
$ | ( |
) | $ | ( |
) | $ | ( |
) | $ | ||||||
For the period from October 1, 2023 to December 31, 2023 |
For the period from July 1, 2023 to September 30, 2023 |
For the period from April 1, 2023 to June 30, 2023 |
For the period from January 1, 2023 to March 31, 2023 | |||||||||||||
Total investment income |
$ | $ | $ | $ | ||||||||||||
Total expenses |
( |
) | ( |
) | ( |
) | ( |
) | ||||||||
Total trading results |
( |
) | ( |
) | ||||||||||||
Net income (loss) |
$ | ( |
) | $ | $ | $ | ( |
) | ||||||||
Increase (decrease) in net asset value per Redeemable Unit: |
||||||||||||||||
Class A |
$ | ( |
) | $ | $ | $ | ( |
) | ||||||||
Class D |
$ | ( |
) | $ | $ | $ | ( |
) | ||||||||
Class Z |
$ | ( |
$ | $ | $ | ( |
) | |||||||||
(1) Title of Class |
(2) Name of Beneficial Owner |
(3) Amount and Nature of Beneficial Ownership |
(4) Percent of Class | |||
Class Z Redeemable Units |
General Partner | 602.1040 | 58.7% |
PART IV
Item 15. Exhibits and Financial Statement Schedules.
(1) Financial Statements:
Statements of Financial Condition at December 31, 2024 and 2023.
Condensed Schedules of Investments at December 31, 2024 and 2023.
Statements of Income and Expenses for the years ended December 31, 2024, 2023 and 2022.
Statements of Changes in Partners’ Capital for the years ended December 31, 2024, 2023 and 2022.
Notes to Financial Statements.
(2) Exhibits:
3.1(a) |
||||
(b) |
||||
(c) |
||||
(d) |
||||
(e) |
||||
(f) |
||||
(g) |
||||
(h) |
||||
(i) |
||||
3.2(a) |
||||
3.2(b) |
||||
4.1 |
||||
10.1(a) |
||||
(b) |
||||
10.2 (a) |
||||
(b) |
||||
10.3 |
69
10.4(a) |
||||
(b) |
||||
10.5 |
||||
10.6 |
||||
10.7 |
||||
10.8 |
||||
10.9 |
||||
10.10(a) |
||||
(b) |
||||
10.11 |
||||
10.12 |
||||
10.13 |
||||
10.14 |
||||
11.1 |
||||
19.1 |
Investment Management Insider Trading Policy (filed herewith). | |||
99.1 |
||||
99.2 |
||||
The exhibits required to be filed by Item 601 of Regulation S-K are incorporated herein by reference: | ||||
31.1 |
Rule 13a-14(a)/15d-14(a) Certification (Certification of President and Director) (filed herewith). | |||
31.2 |
Rule 13a-14(a)/15d-14(a) Certification (Certification of Chief Financial Officer) (filed herewith). | |||
32.1 |
Section 1350 Certification (Certification of President and Director) (filed herewith). | |||
32.2 |
Section 1350 Certification (Certification of Chief Financial Officer) (filed herewith). |
70
101.INS XBRL Instance Document. |
101.SCH XBRL Taxonomy Extension Schema Document. |
101.CAL XBRL Taxonomy Extension Calculation Linkbase Document. |
101.LAB XBRL Taxonomy Extension Label Linkbase Document. |
101.PRE XBRL Taxonomy Extension Presentation Linkbase Document. |
101.DEF XBRL Taxonomy Extension Definition Linkbase Document. |
104. Cover Page Interactive Data File (formatted as Inline XBRL and contained in Exhibit 101) |
71
SIGNATURES
Pursuant to the requirements of Section 13 or 15(d) of the Securities Exchange Act of 1934, the registrant has duly caused this report to be signed on its behalf by the undersigned, thereunto duly authorized.
CERES TACTICAL COMMODITY L.P. | ||
By: | Ceres Managed Futures LLC | |
(General Partner) | ||
By: | /s/ Patrick T. Egan | |
Patrick T. Egan | ||
President & Director | ||
Date: March 20, 2025 |
Pursuant to the requirements of the Securities Exchange Act of 1934, this report has been signed below by the following persons on behalf of the Registrant and in the capacities and on the date indicated.
/s/ Patrick T. Egan |
/s/ Brooke Lambert |
|||||
Patrick T. Egan | Brooke Lambert | |||||
President and Director | Chief Financial Officer | |||||
Ceres Managed Futures LLC | Ceres Managed Futures LLC | |||||
Date: March 20, 2025 | Date: March 20, 2025 | |||||
/s/ Victoria Eckstein |
/s/ Tatiana Segal |
|||||
Victoria Eckstein | Tatiana Segal | |||||
Director | Director | |||||
Ceres Managed Futures LLC | Ceres Managed Futures LLC | |||||
Date: March 20, 2025 | Date: March 20, 2025 |
Supplemental Information to be Furnished With Reports Filed Pursuant to Section 15(d) of the Exchange Act by Registrants Which Have Not Registered Securities Pursuant to Section 12 of the Exchange Act.
Annual Report to limited partners.
No proxy material has been sent to limited partners.
72