UNITED STATES
SECURITIES AND EXCHANGE COMMISSION
Washington, D.C. 20549
FORM N-CSR
CERTIFIED SHAREHOLDER REPORT OF REGISTERED
MANAGEMENT INVESTMENT COMPANIES
Investment Company Act file number 811-21727
First Trust Mortgage Income Fund
(Exact name of registrant as specified in charter)
120 East Liberty Drive, Suite 400
Wheaton, IL 60187
(Address of principal executive offices) (Zip code)
W. Scott Jardine, Esq.
First Trust Portfolios L.P.
120 East Liberty Drive, Suite 400
Wheaton, IL 60187
(Name and address of agent for service)
registrant’s telephone number, including
area code: 630-765-8000
Date of fiscal year end: October 31
Date of reporting period: April 30, 2021
Form N-CSR is to be used by management investment
companies to file reports with the Commission not later than 10 days after the transmission to stockholders of any report that is required
to be transmitted to stockholders under Rule 30e-1 under the Investment Company Act of 1940 (17 CFR 270.30e-1). The Commission may use
the information provided on Form N-CSR in its regulatory, disclosure review, inspection, and policymaking roles.
A registrant is required to disclose the information
specified by Form N-CSR, and the Commission will make this information public. A registrant is not required to respond to the collection
of information contained in Form N-CSR unless the Form displays a currently valid Office of Management and Budget (“OMB”)
control number. Please direct comments concerning the accuracy of the information collection burden estimate and any suggestions for reducing
the burden to Secretary, Securities and Exchange Commission, 100 F Street, NE, Washington, DC 20549. The OMB has reviewed this collection
of information under the clearance requirements of 44 U.S.C. § 3507.
Item 1. Reports to Stockholders.
| (a) | | The Report to Shareholders is attached herewith. |

First Trust
Mortgage Income
Fund (FMY)
Semi-Annual
Report
For the Six
Months Ended
April 30,
2021
First Trust Mortgage Income Fund
(FMY)
Semi-Annual Report
April 30, 2021
| 1
|
| 2
|
| 3
|
| 5
|
| 12
|
| 13
|
| 14
|
| 15
|
| 16
|
| 23
|
Caution Regarding
Forward-Looking Statements
This report contains
certain forward-looking statements within the meaning of the Securities Act of 1933, as amended, and the Securities Exchange Act of 1934, as amended. Forward-looking statements include statements regarding the goals,
beliefs, plans or current expectations of First Trust Advisors L.P. (“First Trust” or the “Advisor”) and its representatives, taking into account the information currently available to them.
Forward-looking statements include all statements that do not relate solely to current or historical fact. For example, forward-looking statements include the use of words such as “anticipate,”
“estimate,” “intend,” “expect,” “believe,” “plan,” “may,” “should,” “would” or other words that convey uncertainty of
future events or outcomes.
Forward-looking
statements involve known and unknown risks, uncertainties and other factors that may cause the actual results, performance or achievements of First Trust Mortgage Income Fund (the “Fund”) to be materially
different from any future results, performance or achievements expressed or implied by the forward-looking statements. When evaluating the information included in this report, you are cautioned not to place undue
reliance on these forward-looking statements, which reflect the judgment of the Advisor and its representatives only as of the date hereof. We undertake no obligation to publicly revise or update these forward-looking
statements to reflect events and circumstances that arise after the date hereof.
Performance and Risk
Disclosure
There is no assurance
that the Fund will achieve its investment objectives. The Fund is subject to market risk, which is the possibility that the market values of securities owned by the Fund will decline and that the value of the
Fund’s shares may therefore be less than what you paid for them. Accordingly, you can lose money by investing in the Fund. See “Principal Risks” in the Additional Information section of this report
for a discussion of certain other risks of investing in the Fund.
Performance data quoted
represents past performance, which is no guarantee of future results, and current performance may be lower or higher than the figures shown. For the most recent month-end performance figures, please visit www.ftportfolios.com or speak with your financial advisor. Investment returns, net asset value and common share price will fluctuate and Fund shares, when sold,
may be worth more or less than their original cost.
The Advisor may also
periodically provide additional information on Fund performance on the Fund’s web page at www.ftportfolios.com.
How to Read This
Report
This report contains
information that may help you evaluate your investment in the Fund. It includes details about the Fund and presents data and analysis that provide insight into the Fund’s performance and investment approach.
By reading the portfolio
commentary by the portfolio management team of the Fund, you may obtain an understanding of how the market environment affected the Fund’s performance. The statistical information that follows may help you
understand the Fund’s performance compared to that of a relevant market benchmark.
It is important to keep
in mind that the opinions expressed by personnel of the Advisor are just that: informed opinions. They should not be considered to be promises or advice. The opinions, like the statistics, cover the period through the
date on the cover of this report. The material risks of investing in the Fund are spelled out in the prospectus, the statement of additional information, this report and other Fund regulatory filings.
First Trust Mortgage Income Fund
(FMY)
Semi-Annual Letter from the Chairman
and CEO
April 30, 2021
Dear Shareholders,
First Trust is pleased
to provide you with the semi-annual report for the First Trust Mortgage Income Fund (the “Fund”), which contains detailed information about the Fund for the six months ended April 30, 2021.
I would like to begin my
remarks by saying that this is a time for all of us to be thankful. It is astounding to me that our scientists and extended health care community successfully discovered, developed, and distributed multiple effective
vaccines to treat the coronavirus (“COVID-19”) in the span of just 15 months. Suffice it to say that we are witnessing history in the making. We even received some good news recently with respect to
wearing masks in public, a polarizing act for many politicians and Americans. The Centers for Disease Control and Prevention released a new set of guidelines in mid-May for those individuals who have been fully
vaccinated. It essentially says fully vaccinated Americans can quit wearing their masks outdoors (even in crowds), in most indoor settings, and can drop social distancing altogether. This is a big step towards
expediting the reopening of the U.S. economy.
For those who may not
know, we subscribe to the buy-and-hold philosophy of investing here at First Trust Advisors L.P., even though it means enduring lots of tough times. While the notion of being able to time the market is seductive on
its face, very few investors are skilled enough to make it work over time. I can think of no better example than the COVID-19 pandemic. The degree of uncertainty surrounding the onset of the virus alone was enough to
make the average investor want to run for cover. And if that was not enough, the 33.8% plunge in the S&P 500® Index (the “Index”) from February 19, 2020, through March 23, 2020 (23 trading days) was a real gut check
for most of us. But a funny thing happened on the way to another potential collapse of the market − it did not happen. In fact, thanks to the U.S. Federal government stepping up with trillions of dollars of
timely fiscal and monetary support, the stock market roared. From March 23, 2020 through May 14, 2021, the Index posted a total return of 90.14%, according to Bloomberg. What a shame for those investors who may have
moved some, or all, of their capital out of equities. What looked like a great time to de-risk turned out to be just the opposite.
The overall climate for
investing looks bright for a few reasons. First, U.S. real gross domestic product (“GDP”) growth is expected to grow by 6.4% year-over-year in 2021, according to the International Monetary Fund. The last
time the U.S. economy grew that fast was in 1984, when real GDP growth reached 7.2%. Second, corporate earnings are expected to recover from their 2020 slide. Bloomberg’s consensus year-over-year earnings growth
rate estimates for the Index for 2021 and 2022 were 33.17% and 12.87%, respectively, as of May 14, 2021. That is a significant rebound from the 12.44% decline in earnings in 2020. Third, inflation is rising, and that
is exactly what the Federal Reserve has been wanting for some time. Central banks around the world have spent years battling deflationary pressures, so a little bit of inflation is welcome at this stage of the
recovery. Lastly, the U.S. labor market is robust despite the talk about the millions of people who lost their jobs in the COVID-19 pandemic and are living off unemployment benefits. As of March 31, 2021, there were
8.12 million job openings in the U.S., the highest total since record-keeping began in December 2000, according to the Bureau of Labor Statistics. We need to get people back to work.
While it seems
fashionable to sell fear these days, we choose to follow the data. Remember, the Index has never failed to fully recoup the losses sustained in a market correction or bear market. Stay the course!
Thank you for giving
First Trust the opportunity to play a role in your financial future. We value our relationship with you and will report on the Fund again in six months.
Sincerely,
James A. Bowen
Chairman of the Board of Trustees
Chief Executive Officer of First Trust
Advisors L.P.
First Trust Mortgage Income Fund (FMY)
“AT A GLANCE”
As of April 30, 2021
(Unaudited)
| Fund Statistics
|
|
| Symbol on New York Stock Exchange
| FMY
|
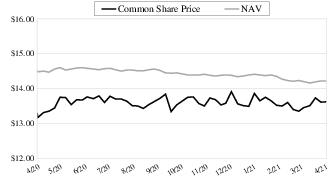
| Common Share Price
| $13.62
|
| Common Share Net Asset Value (“NAV”)
| $14.22
|
| Premium (Discount) to NAV
| (4.22)%
|
| Net Assets Applicable to Common Shares
| $59,897,020
|
| Current Distribution per Common Share(1)
| $0.0600
|
| Current Annualized Distribution per Common Share
| $0.7200
|
| Current Distribution Rate on Common Share Price(2)
| 5.29%
|
| Current Distribution Rate on NAV(2)
| 5.06%
|
Common Share Price & NAV (weekly closing price)
| Performance
|
|
|
|
|
|
|
|
| Average Annual Total Returns |
|
| 6 Months Ended
4/30/21
| 1 Year Ended
4/30/21
| 5 Years Ended
4/30/21
| 10 Years Ended
4/30/21
| Inception
(5/25/05)
to 4/30/21
|
| Fund Performance(3)
|
|
|
|
|
|
| NAV
| 1.03%
| 3.23%
| 3.65%
| 3.53%
| 5.24%
|
| Market Value
| 4.35%
| 8.02%
| 4.25%
| 2.52%
| 4.66%
|
| Index Performance
|
|
|
|
|
|
| Bloomberg Barclays U.S. Mortgage Backed Securities (MBS) Index
| -0.27%
| -0.17%
| 2.50%
| 2.78%
| 3.90%
|
| Portfolio Characteristics
|
|
| Weighted Average Effective Duration
| 3.0 Years
|
| Weighted Average Effective Maturity
| 5.7 Years
|
| Fund Allocation
| % of Net Assets
|
| U.S. Government Agency Mortgage-Backed Securities
| 56.0%
|
| Mortgage-Backed Securities
| 34.9
|
| Asset-Backed Securities
| 3.4
|
| Net Other Assets and Liabilities(4)
| 5.7
|
| Total
| 100.0%
|
| Credit Quality(5)
| % of Total
Fixed-Income
Investments
|
| AAA
| 5.8%
|
| AA+
| 5.3
|
| AA
| 3.1
|
| AA-
| 1.1
|
| A+
| 1.6
|
| A
| 1.1
|
| BBB+
| 0.9
|
| BBB
| 0.9
|
| BB
| 2.3
|
| B
| 0.3
|
| B-
| 1.1
|
| CCC-
| 0.1
|
| CC
| 5.1
|
| Not Rated
| 10.4
|
| Government
| 57.2
|
| Cash & Cash Equivalents
| 3.7
|
| Total
| 100.0%
|
| (1)
| Most recent distribution paid or declared through 4/30/2021. Subject to change in the future.
|
| (2)
| Distribution rates are calculated by annualizing the most recent distribution paid or declared through the report date and then dividing by Common Share Price or NAV, as applicable, as of 4/30/2021.
Subject to change in the future.
|
| (3)
| Total return is based on the combination of reinvested dividend, capital gain, and return of capital distributions, if any, at prices obtained by the Dividend Reinvestment Plan and changes in NAV per
share for NAV returns and changes in Common Share Price for market value returns. Total returns do not reflect sales load and are not annualized for periods of less than one year. Past performance is not indicative of
future results.
|
| (4)
| Includes variation margin on futures.
|
| (5)
| The credit quality and ratings information presented above reflect the ratings assigned by one or more nationally recognized statistical rating organizations (NRSROs), including Standard &
Poor’s Ratings Group, a division of the McGraw Hill Companies, Inc., Moody’s Investors Service, Inc., Fitch Ratings or a comparably rated NRSRO. For situations in which a security is rated by more than one
NRSRO and the ratings are not equivalent, the highest rating is used. Sub-investment grade ratings are those rated BB+/Ba1 or lower. Investment grade ratings are those rated BBB-/Baa3 or higher. The credit ratings
shown relate to the creditworthiness of the issuers of the underlying securities in the Fund, and not to the Fund or its shares. U.S. Treasury, U.S. Agency and U.S. Agency mortgage-backed securities appear under
“Government.” Credit ratings are subject to change.
|
Portfolio Commentary
First Trust Mortgage
Income Fund (FMY)
Semi-Annual Report
April 30, 2021
(Unaudited)
Advisor
First Trust Advisors L.P.
(“First Trust” or the “Advisor”) serves as the investment advisor to the First Trust Mortgage Income Fund (the “Fund” or “FMY”) and offers customized portfolio
management using its structured, quantitative approach to security selection.
Portfolio Management
Team
Jeremiah Charles –
Senior Vice President and Senior Portfolio Manager, First Trust Securitized Products Group
James Snyder – Senior
Vice President and Senior Portfolio Manager, First Trust Securitized Products Group
Commentary
First Trust Mortgage Income
Fund
The Fund’s primary
investment objective is to seek a high level of current income. As a secondary objective, the Fund seeks to preserve capital. The Fund pursues its objectives by investing primarily in mortgage-backed securities
(“MBS”) representing part ownership in a pool of either residential or commercial mortgage loans that, in the opinion of the Fund’s investment advisor, offer an attractive combination of credit
quality, yield and maturity. There can be no assurance the Fund will achieve its investment objectives. The Fund may not be appropriate for all investors.
Market Recap
The 2021 fiscal year
began in earnest as markets reacted to shifting and uncertain results surrounding U.S. elections. Meanwhile, the effects of the coronavirus (“COVID-19”) pandemic continued to ripple through both global and
domestic economies alike. Post-election, on the back of incredibly positive vaccine developments, risk markets staged a very strong and very broad-based rally as market expectations for a faster economic recovery than
earlier anticipated began to be priced into forward data. After another round of Federal stimulus, the calendar year turned over, election results were certified, and immediately the details of yet another round of an
even larger scale stimulus program began to take shape. Market participants took notice, and when considering another massive stimulus bill alongside a blow out in M2 money supply during the pandemic, two factors
weighed heavily on the intermediate and longer dated maturity segment of the U.S. yield curve – inflation and treasury debt issuance. Over the preceding 12 months, treasury issuance had already soared to buoy
government deficit spending. Plans for additional rounds of stimulus only heightened fears of further treasury supply. As a result, the 5-Year Treasury sold off 46 basis points (“bps”), the 10-Year +75 bps
and the 30-year +64 bps, while the 2-Year Treasury, firmly anchored by the Federal Reserve (the “Fed”), was basically unchanged. This drove the yield curve in the 2/10 (the 2-Year and 10-Year Treasury
notes) 75 bps steeper to settle at 146 bps to end the fiscal period. As rates rose, yield hungry investors remained in an aggressive risk-on stance, as economic data showed the recovery was well underway. As such,
Agency MBS spreads tightened dramatically, starting the period at 64 bps Option-Adjusted Spread (“OAS”), and ending the semi-annual period at -12 bps OAS.
Performance Analysis
During the first half of
the 2021 fiscal year, the Fund returned 1.03% on a net asset value (“NAV”) basis, and 4.35% on a market price basis.
During the same period,
the Bloomberg/Barclays US MBS Index (the “Index”) returned -0.27%.
During the same period,
the Fund outperformed the Index by 1.30% net of fees, on a NAV basis and 4.62% on a market price basis. The Fund maintained significant exposures to Non-Agency Residential Mortgage-Backed Securities
(“RMBS”), and Interest Only Agency MBS securities that continued to tighten over the period, which was a strong contributor to the outperformance. Additionally, the Fund maintained a lower, and more stable
overall effective duration than its more negatively convex benchmark, which saw its duration extend as interest rates moved higher. The Fund’s usage of futures positions to help manage interest rate risk and to
structurally position a lower overall effective duration, was mildly beneficial to the Fund’s performance. During the period, the Fund deployed a very minimal amount of leverage for a short period of time, which
very minimally detracted from the Fund’s performance, as interest rates continued their sell off during the first quarter of 2021. The Fund continues to recover from the severe illiquidity that gripped financial
markets in March of 2020. Since the NAV low on March 25, 2020, the Fund has outperformed its Agency MBS benchmark by more than 800 bps.
Fund and Market Outlook
As expected, we saw an
acceleration in overall consumer and economic data to start the fiscal year. We expect strong and robust data over the remainder of the year as well, as the United States continues to fully reopen the economy. With
the massive increase in M2 money supply, and with stimulus dollars in consumers’ hands, we do expect inflationary risks to continue to build. We are ever mindful
Portfolio Commentary (Continued)
First Trust Mortgage
Income Fund (FMY)
Semi-Annual Report
April 30, 2021
(Unaudited)
of the impacts this can
have on term premium pricing along the U.S. yield curve, and believe heightened uncertainty will ultimately drive intermediate to long rates higher, before the Fed will confront how hot it wants the U.S. economy to
run, and what magnitude of ongoing inflation it is comfortable within the economy. At the outset of the pandemic, the Fed deployed emergency rate cuts, large scale quantitative easing and unprecedented lending
programs. Over one year later, it remains highly accommodative. We do anticipate that the Fed will begin to taper its bond purchasing program later this year, and potentially could implement a curve twist type program
with the reinvestment of MBS paydowns back into U.S. treasuries. Overall, we believe that as long as the Fed maintains its view that inflation pressures are ‘transitory’, the front end of the yield curve
will remain fairly anchored in place in the near term, with any rate volatility centralized in the intermediate to longer maturity segments. While we continue to redeploy capital into what we believe are attractively
priced opportunities in the broader securitized mortgage market, we have turned negative on generic Agency MBS spread valuations, the types of securities of which constitute the majority of the Fund’s benchmark,
and believe there is the potential for spread widening.
Given our outlook on the
broader bond markets, we plan to continue to actively manage the Fund versus the Index from a duration standpoint. To the extent the curve sees a large bear steepening, likely due to inflationary pressures, treasury
supply or volatility, we will look to take advantage of higher longer maturity yields and potentially look to increase interest rate hedges on the front end. From an asset allocation perspective, we plan to continue
to reinvest legacy portfolio runoff into both Agency RMBS and Agency Commercial Mortgage-Backed Securities (“CMBS”) interest only securities. The Fund will also look to invest in select opportunities that
the managers find to be attractively priced in Non-Agency CMBS and Non-Agency RMBS, with an emphasis on floating rate instruments. In our view, this approach would provide some yield, income, dividend, and spread
protection for shareholders. As a reminder, as part of the investment team’s Agency MBS strategy, a substantial portion of the agency securities have been, and will continue to be, invested in the interest-only
sectors to increase the income and economic earnings of the portfolio. This strategy can be very effective with proper security selection, particularly when combined with appropriate yield curve management. We plan to
continue to maintain a tradeable portfolio as that is critical to being able to act should opportunities arise.
First Trust Mortgage Income Fund (FMY)
Portfolio of Investments
April 30, 2021
(Unaudited)
Principal
Value
|
| Description
|
| Stated
Coupon
|
| Stated
Maturity
|
| Value
|
| U.S. GOVERNMENT AGENCY MORTGAGE-BACKED SECURITIES – 56.0%
|
|
|
| Collateralized Mortgage Obligations – 33.8%
|
|
|
|
|
|
|
|
|
| Federal Home Loan Mortgage Corp.
|
|
|
|
|
|
|
| $7,373
|
| Series 1394, Class ID, Cost of Funds 11th District of San Fransisco x -4.67 + 44.56%, Capped at 9.57% (a)
|
| 9.57%
|
| 10/15/22
|
| $7,765
|
| 10,386
|
| Series 2303, Class SW, Cost of Funds 11th District of San Fransisco x -15.87 + 121.11%, Capped at 10.00% (a)
|
| 10.00%
|
| 03/01/24
|
| 1,066
|
| 53,708
|
| Series 2334, Class QS, 1 Mo. LIBOR x -3.5 + 28.18% (a)
|
| 27.77%
|
| 07/15/31
|
| 80,295
|
| 203,050
|
| Series 2439, Class XI, IO, if 1 Mo. LIBOR x -1 + 7.74% is less than 7.50%, then 6.50%, otherwise 0.00% (a)
|
| 6.50%
|
| 03/01/32
|
| 34,269
|
| 435,406
|
| Series 2807, Class SB, IO, 1 Mo. LIBOR x -1 + 7.45% (a)
|
| 7.34%
|
| 11/15/33
|
| 78,912
|
| 997,004
|
| Series 2975, Class SJ, IO, 1 Mo. LIBOR x -1 + 6.65% (a)
|
| 6.54%
|
| 05/15/35
|
| 189,957
|
| 234,021
|
| Series 3012, Class GK, 1 Mo. LIBOR x -4.5 + 24.75% (a)
|
| 24.23%
|
| 06/15/35
|
| 406,373
|
| 247,870
|
| Series 3108, Class QZ
|
| 6.00%
|
| 02/01/36
|
| 351,280
|
| 13,874
|
| Series 3195, Class SX, 1 Mo. LIBOR x -6.5 + 46.15% (a)
|
| 45.40%
|
| 07/15/36
|
| 46,902
|
| 110,481
|
| Series 3410, Class HC
|
| 5.50%
|
| 02/01/38
|
| 130,045
|
| 48,293
|
| Series 3451, Class SB, IO, 1 Mo. LIBOR x -1 + 6.03% (a)
|
| 5.92%
|
| 05/15/38
|
| 7,420
|
| 353,986
|
| Series 3471, Class SD, IO, 1 Mo. LIBOR x -1 + 6.08% (a)
|
| 5.97%
|
| 12/15/36
|
| 63,430
|
| 250,000
|
| Series 3797, Class KB
|
| 4.50%
|
| 01/01/41
|
| 296,636
|
| 217,293
|
| Series 3985, Class GI, IO
|
| 3.00%
|
| 10/01/26
|
| 5,107
|
| 30,311
|
| Series 4021, Class IP, IO
|
| 3.00%
|
| 03/01/27
|
| 1,579
|
| 499,490
|
| Series 4057, Class YI, IO
|
| 3.00%
|
| 06/01/27
|
| 29,104
|
| 904,735
|
| Series 4082, Class PI, IO
|
| 3.00%
|
| 06/01/27
|
| 50,927
|
| 4,570,996
|
| Series 4142, Class IO, IO
|
| 3.00%
|
| 12/01/27
|
| 260,677
|
| 537,194
|
| Series 4206, Class IA, IO
|
| 3.00%
|
| 03/01/33
|
| 55,540
|
| 613,822
|
| Series 4258, Class CO
|
| (b)
|
| 06/01/43
|
| 517,103
|
| 3,700,284
|
| Series 4459, Class EI, IO
|
| 6.00%
|
| 06/01/36
|
| 499,422
|
| 368,006
|
| Series 4615, Class GT, 1 Mo. LIBOR x -4 + 16.00%, Capped at 4.00% (a)
|
| 4.00%
|
| 10/15/42
|
| 345,686
|
| 2,696,086
|
| Series 4619, Class IB, IO
|
| 4.00%
|
| 12/01/47
|
| 126,808
|
| 6,455,557
|
| Series 4938, Class IB, IO
|
| 4.00%
|
| 07/01/49
|
| 821,645
|
|
|
| Federal Home Loan Mortgage Corp. Structured Pass-Through
Certificates
|
|
|
|
|
|
|
| 48,509
|
| Series T-56, Class APO
|
| (b)
|
| 05/01/43
|
| 48,180
|
|
|
| Federal Home Loan Mortgage Corp., STRIPS
|
|
|
|
|
|
|
| 54,311
|
| Series 177, IO
|
| 7.00%
|
| 07/01/26
|
| 6,338
|
| 779,718
|
| Series 243, Class 2, IO
|
| 5.00%
|
| 11/01/35
|
| 123,672
|
| 3,179,982
|
| Series 303, Class C17, IO
|
| 3.50%
|
| 01/01/43
|
| 467,547
|
| 1,116,014
|
| Series 324, Class C21, IO
|
| 6.00%
|
| 06/01/39
|
| 268,779
|
|
|
| Federal National Mortgage Association
|
|
|
|
|
|
|
| 51,338
|
| Series 1996-46, Class ZA
|
| 7.50%
|
| 11/01/26
|
| 57,148
|
| 143,760
|
| Series 1997-85, Class M, IO
|
| 6.50%
|
| 12/01/27
|
| 7,916
|
| 34,163
|
| Series 2002-80, Class IO, IO
|
| 6.00%
|
| 09/01/32
|
| 3,286
|
| 71,375
|
| Series 2003-15, Class MS, IO, 1 Mo. LIBOR x -1 + 8.00% (a)
|
| 7.89%
|
| 03/25/33
|
| 14,318
|
| 93,138
|
| Series 2003-44, Class IU, IO
|
| 7.00%
|
| 06/01/33
|
| 18,533
|
| 510,261
|
| Series 2003-62, Class PO
|
| (b)
|
| 07/01/33
|
| 478,490
|
| 420,677
|
| Series 2004-49, Class SN, IO, 1 Mo. LIBOR x -1 + 7.10% (a)
|
| 6.99%
|
| 07/25/34
|
| 72,675
|
| 14,034
|
| Series 2004-74, Class SW, 1 Mo. LIBOR x -2 + 15.50% (a)
|
| 15.27%
|
| 11/25/31
|
| 18,093
|
| 278,388
|
| Series 2004-W10, Class A6
|
| 5.75%
|
| 08/01/34
|
| 305,417
|
| 273,214
|
| Series 2005-122, Class SN, 1 Mo. LIBOR x -4 + 28.60% (a)
|
| 28.18%
|
| 01/25/36
|
| 456,695
|
| 21,639
|
| Series 2005-59 SU, 1 Mo. LIBOR x -5 + 25.50% (a)
|
| 24.97%
|
| 06/25/35
|
| 34,004
|
| 91,583
|
| Series 2005-6, Class SE, IO, 1 Mo. LIBOR x -1 + 6.70% (a)
|
| 6.59%
|
| 02/25/35
|
| 17,125
|
| 446,949
|
| Series 2005-74, Class NZ
|
| 6.00%
|
| 09/01/35
|
| 598,220
|
| 302,481
|
| Series 2006-105, Class ZA
|
| 6.00%
|
| 11/01/36
|
| 402,057
|
| 548,798
|
| Series 2006-5, Class 3A2 (c)
|
| 2.12%
|
| 05/01/35
|
| 562,028
|
| 44,474
|
| Series 2007-100, Class SM, IO, 1 Mo. LIBOR x -1 + 6.45% (a)
|
| 6.34%
|
| 10/25/37
|
| 9,077
|
| 249,003
|
| Series 2007-30, Class ZM
|
| 4.25%
|
| 04/01/37
|
| 289,659
|
See Notes to Financial Statements
Page 5
First Trust Mortgage Income Fund (FMY)
Portfolio of Investments
(Continued)
April 30, 2021
(Unaudited)
Principal
Value
|
| Description
|
| Stated
Coupon
|
| Stated
Maturity
|
| Value
|
| U.S. GOVERNMENT AGENCY MORTGAGE-BACKED SECURITIES (Continued)
|
|
|
| Collateralized Mortgage Obligations (Continued)
|
|
|
|
|
|
|
|
|
| Federal National Mortgage Association (Continued)
|
|
|
|
|
|
|
| $242,000
|
| Series 2007-37, Class SB, IO, 1 Mo. LIBOR x -1 + 6.75% (a)
|
| 6.64%
|
| 05/25/37
|
| $48,407
|
| 294,177
|
| Series 2008-17, Class BE
|
| 5.50%
|
| 10/01/37
|
| 357,949
|
| 682,000
|
| Series 2008-2, Class PH
|
| 5.50%
|
| 02/01/38
|
| 823,967
|
| 494,000
|
| Series 2009-28, Class HX
|
| 5.00%
|
| 05/01/39
|
| 594,609
|
| 199,737
|
| Series 2009-37, Class NZ
|
| 5.71%
|
| 02/01/37
|
| 252,656
|
| 1,056,699
|
| Series 2010-103, Class ID, IO
|
| 5.00%
|
| 09/01/40
|
| 210,656
|
| 527,750
|
| Series 2010-59, Class EI, IO
|
| 6.00%
|
| 06/01/40
|
| 103,013
|
| 64,847
|
| Series 2010-99, Class SG, 1 Mo. LIBOR x -5 + 25.00% (a)
|
| 24.42%
|
| 09/01/40
|
| 106,190
|
| 714,497
|
| Series 2011-52, Class LB
|
| 5.50%
|
| 06/01/41
|
| 824,677
|
| 13,434
|
| Series 2011-66, Class QI, IO
|
| 3.50%
|
| 07/01/21
|
| 1
|
| 1,177,409
|
| Series 2011-81, Class PI, IO
|
| 3.50%
|
| 08/01/26
|
| 63,376
|
| 88,887
|
| Series 2012-111, Class B
|
| 7.00%
|
| 10/01/42
|
| 107,552
|
| 760,846
|
| Series 2012-112, Class BI, IO
|
| 3.00%
|
| 09/01/31
|
| 31,908
|
| 2,244,690
|
| Series 2012-125, Class MI, IO
|
| 3.50%
|
| 11/01/42
|
| 322,337
|
| 16,656
|
| Series 2012-74, Class OA
|
| (b)
|
| 03/01/42
|
| 15,807
|
| 16,656
|
| Series 2012-75, Class AO
|
| (b)
|
| 03/01/42
|
| 15,796
|
| 858,214
|
| Series 2013-130, Class GS, IO, 1 Mo. LIBOR x -1 + 6.25% (a)
|
| 6.14%
|
| 09/25/33
|
| 112,812
|
| 37,857
|
| Series 2013-132, Class SW, 1 Mo. LIBOR x -2.67 + 10.67% (a)
|
| 10.36%
|
| 01/01/44
|
| 45,260
|
| 1,118,194
|
| Series 2013-32, Class IG, IO
|
| 3.50%
|
| 04/01/33
|
| 125,082
|
| 321,462
|
| Series 2013-51, Class PI, IO
|
| 3.00%
|
| 11/01/32
|
| 30,348
|
| 2,464,986
|
| Series 2015-20, Class ES, IO, 1 Mo. LIBOR x -1 + 6.15% (a)
|
| 6.04%
|
| 04/25/45
|
| 445,362
|
| 488,135
|
| Series 2015-76, Class BI, IO
|
| 4.00%
|
| 10/01/39
|
| 31,175
|
| 1,708,328
|
| Series 2015-97, Class AI, IO
|
| 4.00%
|
| 09/01/41
|
| 80,870
|
| 168,142
|
| Series 2016-74, Class LI, IO
|
| 3.50%
|
| 09/01/46
|
| 52,430
|
| 4,805,047
|
| Series 2017-109, Class SJ, IO, 1 Mo. LIBOR x -1+ 6.20% (a)
|
| 6.09%
|
| 01/25/48
|
| 871,092
|
|
|
| Federal National Mortgage Association, STRIPS
|
|
|
|
|
|
|
| 36,513
|
| Series 305, Class 12, IO (d)
|
| 6.50%
|
| 12/01/29
|
| 4,775
|
| 49,602
|
| Series 355, Class 18, IO
|
| 7.50%
|
| 11/01/33
|
| 9,807
|
| 1,676,650
|
| Series 387, Class 10, IO
|
| 6.00%
|
| 04/01/38
|
| 338,482
|
| 774,801
|
| Series 406, Class 6, IO (d)
|
| 4.00%
|
| 01/01/41
|
| 106,263
|
| 659,603
|
| Series 413, Class 173, IO (d)
|
| 4.50%
|
| 07/01/42
|
| 108,980
|
|
|
| Government National Mortgage Association
|
|
|
|
|
|
|
| 330,758
|
| Series 2004-95, Class QZ
|
| 4.50%
|
| 11/01/34
|
| 362,350
|
| 189,656
|
| Series 2005-33, Class AY
|
| 5.50%
|
| 04/01/35
|
| 212,402
|
| 68,642
|
| Series 2005-68, Class DP, 1 Mo. LIBOR x -2.41 + 16.43% (a)
|
| 16.16%
|
| 06/17/35
|
| 86,058
|
| 251,564
|
| Series 2005-68, Class KI, IO, 1 Mo. LIBOR x -1 + 6.30% (a)
|
| 6.18%
|
| 09/20/35
|
| 52,103
|
| 37,303
|
| Series 2006-28, Class VS, 1 Mo. LIBOR x -13 + 87.10% (a)
|
| 85.59%
|
| 06/20/36
|
| 114,603
|
| 396,523
|
| Series 2007-14, Class PB
|
| 5.40%
|
| 03/01/37
|
| 443,330
|
| 62,088
|
| Series 2007-50, Class AI, IO, 1 Mo. LIBOR x -1 + 6.78% (a)
|
| 6.66%
|
| 08/20/37
|
| 2,693
|
| 206,444
|
| Series 2007-68, Class PI, IO, 1 Mo. LIBOR x -1 + 6.65% (a)
|
| 6.53%
|
| 11/20/37
|
| 29,788
|
| 100,000
|
| Series 2008-2, Class HB
|
| 5.50%
|
| 01/01/38
|
| 115,704
|
| 304,000
|
| Series 2008-32, Class JD
|
| 5.50%
|
| 04/01/38
|
| 354,800
|
| 181,586
|
| Series 2008-73, Class SK, IO, 1 Mo. LIBOR x -1 + 6.74% (a)
|
| 6.62%
|
| 08/20/38
|
| 30,977
|
| 113,825
|
| Series 2009-100, Class SL, IO, 1 Mo. LIBOR x -1 + 6.50% (a)
|
| 6.38%
|
| 05/16/39
|
| 1,801
|
| 143,470
|
| Series 2009-12, Class IE, IO
|
| 5.50%
|
| 03/01/39
|
| 20,959
|
| 141,815
|
| Series 2009-79, Class PZ
|
| 6.00%
|
| 09/01/39
|
| 176,557
|
| 341,241
|
| Series 2013-104, Class YS, IO, 1 Mo. LIBOR x -1 + 6.15% (a)
|
| 6.03%
|
| 07/16/43
|
| 59,686
|
| 158,047
|
| Series 2014-41, Class St, 1 Mo. LIBOR x -2.67 + 11.47% (a)
|
| 11.16%
|
| 11/20/42
|
| 163,956
|
| 5,621,251
|
| Series 2015-158, Class KS, IO, 1 Mo. LIBOR x -1 + 6.25% (a)
|
| 6.13%
|
| 11/20/45
|
| 1,068,054
|
| 73,478
|
| Series 2016-139, Class MZ
|
| 1.50%
|
| 07/01/45
|
| 62,589
|
| 149,926
|
| Series 2017-4, Class CZ
|
| 3.00%
|
| 01/01/47
|
| 155,846
|
| 117,854
|
| Series 2017-H18, Class DZ (d)
|
| 4.61%
|
| 09/01/67
|
| 141,028
|
| 17,290,147
|
| Series 2020-13, Class BT, IO, 1 Mo. LIBOR x -1 + 6.20%, Capped at 0.50% (a)
|
| 0.50%
|
| 11/20/45
|
| 363,809
|
Page 6
See Notes to Financial Statements
First Trust Mortgage Income Fund (FMY)
Portfolio of Investments
(Continued)
April 30, 2021
(Unaudited)
Principal
Value
|
| Description
|
| Stated
Coupon
|
| Stated
Maturity
|
| Value
|
| U.S. GOVERNMENT AGENCY MORTGAGE-BACKED SECURITIES (Continued)
|
|
|
| Collateralized Mortgage Obligations (Continued)
|
|
|
|
|
|
|
|
|
| Government National Mortgage Association (Continued)
|
|
|
|
|
|
|
| $4,901,097
|
| Series 2020-146, Class CI, IO
|
| 2.50%
|
| 10/01/50
|
| $591,425
|
| 6,206,821
|
| Series 2021-23, Class BI, IO
|
| 2.00%
|
| 02/01/51
|
| 748,781
|
|
|
|
|
| 20,268,143
|
|
|
| Commercial Mortgage-Backed Securities – 16.7%
|
|
|
|
|
|
|
|
|
| Federal Home Loan Mortgage Corp. Multifamily Structured
Pass-Through Certificates
|
|
|
|
|
|
|
| 4,000,000
|
| Series K110, Class X3, IO (c)
|
| 3.52%
|
| 06/01/48
|
| 1,022,670
|
| 3,330,000
|
| Series K112, Class X3, IO (c)
|
| 3.10%
|
| 07/01/48
|
| 759,496
|
| 4,605,411
|
| Series K115, Class X3, IO (c)
|
| 3.06%
|
| 09/01/48
|
| 1,038,699
|
| 4,326,216
|
| Series K118, Class X3, IO (c)
|
| 2.79%
|
| 10/25/53
|
| 906,930
|
| 1,900,000
|
| Series K122, Class X3, IO (c)
|
| 2.72%
|
| 01/01/49
|
| 394,058
|
| 3,343,856
|
| Series K128, Class X3, IO (c)
|
| 2.79%
|
| 04/01/31
|
| 751,072
|
| 3,250,000
|
| Series K-1517, Class X3, IO (c)
|
| 3.40%
|
| 08/01/38
|
| 1,108,174
|
| 3,000,000
|
| Series K-1520, Class X3, IO (c)
|
| 3.09%
|
| 04/01/39
|
| 999,253
|
| 1,831,144
|
| Series K739, Class X3, IO (c)
|
| 2.95%
|
| 09/25/27
|
| 287,219
|
|
|
| Federal National Mortgage Association, ACES
|
|
|
|
|
|
|
| 13,100,000
|
| Series 2019-M9, Class X4, IO
|
| 0.70%
|
| 03/01/29
|
| 549,724
|
|
|
| Government National Mortgage Association
|
|
|
|
|
|
|
| 218,000
|
| Series 2013-57, Class D (d)
|
| 2.35%
|
| 06/01/46
|
| 220,039
|
| 2,953,380
|
| Series 2016-11, Class IO (d)
|
| 0.86%
|
| 01/01/56
|
| 147,048
|
| 4,661,611
|
| Series 2016-143, Class IO
|
| 0.88%
|
| 10/01/56
|
| 262,658
|
| 7,431,814
|
| Series 2016-166, Class IO (d)
|
| 1.02%
|
| 04/01/58
|
| 447,229
|
| 10,345,022
|
| Series 2017-126, Class IO (c)
|
| 0.77%
|
| 08/01/59
|
| 612,510
|
| 9,742,166
|
| Series 2017-7, Class IO (d)
|
| 0.76%
|
| 12/01/58
|
| 506,324
|
|
|
|
|
| 10,013,103
|
|
|
| Pass-through Security – 5.5%
|
|
|
|
|
|
|
|
|
| Federal Home Loan Mortgage Corp.
|
|
|
|
|
|
|
| 382,497
|
| Pool K36017
|
| 5.00%
|
| 09/01/47
|
| 417,847
|
| 766,944
|
| Pool U99176
|
| 4.00%
|
| 12/01/47
|
| 852,798
|
|
|
| Federal National Mortgage Association
|
|
|
|
|
|
|
| 508,004
|
| Pool 831145
|
| 6.00%
|
| 12/01/35
|
| 604,501
|
| 557,530
|
| Pool 843971
|
| 6.00%
|
| 11/01/35
|
| 652,762
|
| 690,214
|
| Pool AB5688
|
| 3.50%
|
| 07/01/37
|
| 752,216
|
|
|
|
|
| 3,280,124
|
|
|
| Total U.S. Government Agency Mortgage-Backed Securities
|
| 33,561,370
|
|
|
| (Cost $34,215,478)
|
|
|
|
|
|
|
| MORTGAGE-BACKED SECURITIES – 34.9%
|
|
|
| Collateralized Mortgage Obligations – 29.0%
|
|
|
|
|
|
|
|
|
| Accredited Mortgage Loan Trust
|
|
|
|
|
|
|
| 226,046
|
| Series 2003-2, Class A1
|
| 4.98%
|
| 10/01/33
|
| 237,225
|
|
|
| ACE Securities Corp. Home Equity Loan Trust
|
|
|
|
|
|
|
| 762,997
|
| Series 2006-ASAP6, Class A2D, 1 Mo. LIBOR + 0.22% (e)
|
| 0.33%
|
| 12/25/36
|
| 376,354
|
|
|
| Banc of America Mortgage Trust
|
|
|
|
|
|
|
| 47,056
|
| Series 2002-L, Class 1A1 (c)
|
| 3.07%
|
| 12/01/32
|
| 41,218
|
| 104,945
|
| Series 2005-A, Class 2A1 (c)
|
| 2.58%
|
| 02/01/35
|
| 108,821
|
|
|
| Chase Mortgage Finance Trust
|
|
|
|
|
|
|
| 62,273
|
| Series 2007-A1, Class 1A3 (c)
|
| 2.65%
|
| 02/01/37
|
| 63,241
|
|
|
| Citigroup Mortgage Loan Trust
|
|
|
|
|
|
|
| 131,892
|
| Series 2005-6, Class A1, US Treasury Yield Curve Rate T Note Constant Maturity 1 Year + 2.10% (e)
|
| 2.22%
|
| 09/01/35
|
| 137,936
|
See Notes to Financial Statements
Page 7
First Trust Mortgage Income Fund (FMY)
Portfolio of Investments
(Continued)
April 30, 2021
(Unaudited)
Principal
Value
|
| Description
|
| Stated
Coupon
|
| Stated
Maturity
|
| Value
|
| MORTGAGE-BACKED SECURITIES (Continued)
|
|
|
| Collateralized Mortgage Obligations (Continued)
|
|
|
|
|
|
|
|
|
| Citigroup Mortgage Loan Trust (Continued)
|
|
|
|
|
|
|
| $25,001
|
| Series 2009-10, Class 1A1 (c) (f)
|
| 2.76%
|
| 09/01/33
|
| $25,283
|
| 308,284
|
| Series 2012-7, Class 10A2 (c) (f)
|
| 2.91%
|
| 09/01/36
|
| 283,253
|
|
|
| Connecticut Avenue Securities Trust
|
|
|
|
|
|
|
| 1,000,000
|
| Series 2019-RO2, Class 1B1, 1 Mo. LIBOR + 4.15% (e) (f)
|
| 4.26%
|
| 08/25/31
|
| 1,034,290
|
|
|
| Countrywide Home Loan Mortgage Pass-Through Trust
|
|
|
|
|
|
|
| 172,413
|
| Series 2003-46, Class 2A1 (c)
|
| 2.81%
|
| 01/01/34
|
| 175,191
|
| 54,015
|
| Series 2005-HYB3, Class 2A6B (c)
|
| 3.14%
|
| 06/01/35
|
| 56,276
|
| 183,509
|
| Series 2006-21, Class A8
|
| 5.75%
|
| 02/01/37
|
| 133,544
|
| 327,865
|
| Series 2006-HYB5, Class 3A1A (c)
|
| 2.92%
|
| 09/01/36
|
| 312,821
|
|
|
| Credit Suisse Commercial Mortgage Securities Corp. Pass-Through
Certificates
|
|
|
|
|
|
|
| 1,000,000
|
| Series 2020-UNFI, Class A, 1 Mo. LIBOR + 0.50%, 4.25% minimum (e) (f)
|
| 4.25%
|
| 12/06/22
|
| 1,004,993
|
|
|
| Credit Suisse First Boston Mortgage Securities Corp.
|
|
|
|
|
|
|
| 326,263
|
| Series 2004-AR2, Class 1A1 (c)
|
| 2.93%
|
| 03/01/34
|
| 340,054
|
| 188,413
|
| Series 2005-5, Class 3A2, 1 Mo. LIBOR + 0.30% (e)
|
| 0.41%
|
| 07/25/35
|
| 185,057
|
|
|
| Credit Suisse Mortgage Trust
|
|
|
|
|
|
|
| 364,261
|
| Series 2017-FHA1, Class A1 (f)
|
| 3.25%
|
| 04/01/47
|
| 373,421
|
|
|
| Deutsche ALT-A Securities, Inc., Mortgage Loan Trust
|
|
|
|
|
|
|
| 2,734
|
| Series 2003-3, Class 3A1
|
| 5.00%
|
| 10/25/33
|
| 2,731
|
|
|
| DSLA Mortgage Loan Trust
|
|
|
|
|
|
|
| 388,370
|
| Series 2004-AR3, Class 2A2A, 1 Mo. LIBOR + 0.74% (e)
|
| 0.86%
|
| 07/19/44
|
| 375,666
|
| 479,706
|
| Series 2007-AR1, Class 2A1A, 1 Mo. LIBOR + 0.14% (e)
|
| 0.26%
|
| 03/01/37
|
| 457,428
|
|
|
| Federal National Mortgage Association Connecticut Avenue
Securities
|
|
|
|
|
|
|
| 913,843
|
| Series 2018-CO3, Class 1M2, 1 Mo. LIBOR + 2.15% (e)
|
| 2.26%
|
| 10/25/30
|
| 925,092
|
|
|
| Galton Funding Mortgage Trust
|
|
|
|
|
|
|
| 55,677
|
| Series 2018-2, Class A41 (f)
|
| 4.50%
|
| 10/01/58
|
| 56,220
|
|
|
| GSR Mortgage Loan Trust
|
|
|
|
|
|
|
| 5,271
|
| Series 2003-10, Class 1A12 (c)
|
| 2.84%
|
| 10/01/33
|
| 5,276
|
| 150,111
|
| Series 2005-AR1, Class 4A1 (c)
|
| 2.80%
|
| 01/01/35
|
| 148,459
|
|
|
| Harborview Mortgage Loan Trust
|
|
|
|
|
|
|
| 245,751
|
| Series 2004-6, Class 3A1 (c)
|
| 3.24%
|
| 08/01/34
|
| 246,418
|
|
|
| Home Equity Asset Trust
|
|
|
|
|
|
|
| 15,024
|
| Series 2005-3, Class M4, 1 Mo. LIBOR + 0.96% (e)
|
| 1.07%
|
| 08/25/35
|
| 15,049
|
| 329,763
|
| Series 2005-9, Class M1, 1 Mo. LIBOR + 0.62% (e)
|
| 0.72%
|
| 04/25/36
|
| 328,078
|
|
|
| Impac CMB Trust
|
|
|
|
|
|
|
| 102,739
|
| Series 2004-6, Class 1A2, 1 Mo. LIBOR + 0.78% (e)
|
| 0.89%
|
| 10/25/34
|
| 104,336
|
|
|
| IXIS Real Estate Capital Trust
|
|
|
|
|
|
|
| 1,044,554
|
| Series 2007-HE1, Class A3, 1 Mo. LIBOR + 0.16% (e)
|
| 0.27%
|
| 05/25/37
|
| 367,381
|
|
|
| JP Morgan Mortgage Trust
|
|
|
|
|
|
|
| 594,977
|
| Series 2005-ALT1, Class 4A1 (c)
|
| 2.97%
|
| 10/01/35
|
| 538,295
|
| 346,821
|
| Series 2006-A2, Class 4A1 (c)
|
| 3.05%
|
| 08/01/34
|
| 364,709
|
| 85,555
|
| Series 2006-A2, Class 5A3 (c)
|
| 2.54%
|
| 11/01/33
|
| 89,548
|
| 58,033
|
| Series 2014-2, Class 1A1 (f)
|
| 3.00%
|
| 06/01/29
|
| 59,513
|
|
|
| MASTR Adjustable Rate Mortgages Trust
|
|
|
|
|
|
|
| 24,783
|
| Series 2004-13, Class 3A7B, US Treasury Yield Curve Rate T Note Constant Maturity 1 Year + 2.00% (e)
|
| 2.06%
|
| 11/01/34
|
| 25,300
|
|
|
| MASTR Alternative Loan Trust
|
|
|
|
|
|
|
| 3,572,419
|
| Series 2006-2, Class 2A3, 1 Mo. LIBOR + 0.35% (e)
|
| 0.46%
|
| 03/25/36
|
| 206,553
|
|
|
| MASTR Asset Backed Securities Trust
|
|
|
|
|
|
|
| 691,911
|
| Series 2006-HE5, Class A3, 1 Mo. LIBOR + 0.16% (e)
|
| 0.27%
|
| 11/25/36
|
| 513,618
|
| 1,154,102
|
| Series 2006-NC2, Class A3, 1 Mo. LIBOR + 0.22% (e)
|
| 0.33%
|
| 08/25/36
|
| 611,761
|
| 526,792
|
| Series 2006-NC2, Class A5, 1 Mo. LIBOR + 0.48% (e)
|
| 0.59%
|
| 08/25/36
|
| 286,483
|
Page 8
See Notes to Financial Statements
First Trust Mortgage Income Fund (FMY)
Portfolio of Investments
(Continued)
April 30, 2021
(Unaudited)
Principal
Value
|
| Description
|
| Stated
Coupon
|
| Stated
Maturity
|
| Value
|
| MORTGAGE-BACKED SECURITIES (Continued)
|
|
|
| Collateralized Mortgage Obligations (Continued)
|
|
|
|
|
|
|
|
|
| MASTR Asset Securitization Trust
|
|
|
|
|
|
|
| $12,034
|
| Series 2003-11, Class 5A2
|
| 5.25%
|
| 12/01/23
|
| $12,248
|
| 39,860
|
| Series 2003-11, Class 6A16
|
| 5.25%
|
| 12/01/33
|
| 40,717
|
|
|
| Mellon Residential Funding Corp. Mortgage Pass-Through Trust
|
|
|
|
|
|
|
| 164,602
|
| Series 2001-TBC1, Class A1, 1 Mo. LIBOR + 0.70% (e)
|
| 0.81%
|
| 11/15/31
|
| 167,653
|
| 175,619
|
| Series 2002-TBC2, Class A, 1 Mo. LIBOR + 0.86% (e)
|
| 0.97%
|
| 08/15/32
|
| 167,857
|
|
|
| Meritage Mortgage Loan Trust
|
|
|
|
|
|
|
| 2,469
|
| Series 2004-2, Class M3, 1 Mo. LIBOR + 0.98% (e)
|
| 1.08%
|
| 01/25/35
|
| 2,667
|
|
|
| Morgan Stanley Mortgage Loan Trust
|
|
|
|
|
|
|
| 268,379
|
| Series 2004-7AR, Class 2A6 (c)
|
| 2.57%
|
| 09/01/34
|
| 274,183
|
|
|
| MortgageIT Trust
|
|
|
|
|
|
|
| 113,560
|
| Series 2005-2, Class 2A, 1 Mo. LIBOR + 1.65% (e)
|
| 1.77%
|
| 05/01/35
|
| 113,847
|
|
|
| New Residential Mortgage Loan Trust
|
|
|
|
|
|
|
| 316,645
|
| Series 2014-2A, Class A2 (f)
|
| 3.75%
|
| 05/01/54
|
| 337,557
|
| 388,048
|
| Series 2016-1A, Class A1 (f)
|
| 3.75%
|
| 03/01/56
|
| 411,984
|
| 313,242
|
| Series 2016-3A, Class A1 (f)
|
| 3.75%
|
| 09/01/56
|
| 335,847
|
|
|
| Nomura Asset Acceptance Corporation Alternative Loan Trust
|
|
|
|
|
|
|
| 630,973
|
| Series 2004-AR4, Class M1, 1 Mo. LIBOR + 1.10% (e)
|
| 1.21%
|
| 12/25/34
|
| 630,330
|
|
|
| Residential Accredit Loans, Inc.
|
|
|
|
|
|
|
| 102,378
|
| Series 2006-QO1, Class 2A1, 1 Mo. LIBOR + 0.54% (e)
|
| 0.65%
|
| 02/25/46
|
| 74,102
|
| 1,023,327
|
| Series 2006-QS6, Class 1AV, IO (c)
|
| 0.76%
|
| 06/01/36
|
| 23,362
|
|
|
| Residential Asset Securitization Trust
|
|
|
|
|
|
|
| 24,332
|
| Series 2004-A3, Class A7
|
| 5.25%
|
| 06/01/34
|
| 25,181
|
|
|
| Saxon Asset Securities Trust
|
|
|
|
|
|
|
| 721,066
|
| Series 2007-2, Class A2D, 1 Mo. LIBOR + 0.30% (e)
|
| 0.41%
|
| 05/25/47
|
| 623,756
|
|
|
| Sequoia Mortgage Trust
|
|
|
|
|
|
|
| 37,346
|
| Series 2017-CH2, Class A10 (f)
|
| 4.00%
|
| 12/01/47
|
| 37,399
|
| 13,809
|
| Series 2018-CH2, Class A12 (f)
|
| 4.00%
|
| 06/01/48
|
| 13,829
|
|
|
| Structured Adjustable Rate Mortgage Loan Trust
|
|
|
|
|
|
|
| 178,621
|
| Series 2004-2, Class 4A2 (c)
|
| 2.52%
|
| 03/01/34
|
| 176,976
|
|
|
| Structured Asset Securities Corp. Mortgage Pass-Through
Certificates
|
|
|
|
|
|
|
| 25,449
|
| Series 2001-SB1, Class A2
|
| 3.38%
|
| 08/01/31
|
| 24,857
|
|
|
| Thornburg Mortgage Securities Trust
|
|
|
|
|
|
|
| 161,844
|
| Series 2003-4, Class A1, 1 Mo. LIBOR + 0.64% (e)
|
| 0.75%
|
| 09/25/43
|
| 165,039
|
|
|
| Vendee Mortgage Trust
|
|
|
|
|
|
|
| 55,022,733
|
| Series 2010-1, Class DI, IO (c)
|
| 0.29%
|
| 04/01/40
|
| 530,920
|
|
|
| Wachovia Mortgage Loan Trust, LLC
|
|
|
|
|
|
|
| 88,333
|
| Series 2006-A, Class 3A1 (c)
|
| 3.12%
|
| 05/01/36
|
| 85,388
|
|
|
| WaMu Mortgage Pass-Through Certificates
|
|
|
|
|
|
|
| 121,943
|
| Series 2003-AR5, Class A7 (c)
|
| 3.49%
|
| 06/01/33
|
| 124,292
|
| 210,621
|
| Series 2004-AR1, Class A (c)
|
| 2.41%
|
| 03/01/34
|
| 217,269
|
| 239,072
|
| Series 2004-AR10, Class A1B, 1 Mo. LIBOR + 0.84% (e)
|
| 0.95%
|
| 07/25/44
|
| 242,574
|
| 220,439
|
| Series 2004-AR13, Class A1A, 1 Mo. LIBOR + 0.72% (e)
|
| 0.83%
|
| 11/25/34
|
| 216,479
|
| 30,122
|
| Series 2004-AR3, Class A2 (c)
|
| 3.17%
|
| 06/01/34
|
| 31,021
|
| 270,811
|
| Series 2005-AR1, Class A1A, 1 Mo. LIBOR + 0.64% (e)
|
| 0.75%
|
| 01/25/45
|
| 269,427
|
| 389,474
|
| Series 2005-AR6, Class 2A1A, 1 Mo. LIBOR + 0.46% (e)
|
| 0.57%
|
| 04/25/45
|
| 384,464
|
| 135,659
|
| Series 2005-AR9, Class A1A, 1 Mo. LIBOR + 0.64% (e)
|
| 0.75%
|
| 07/25/45
|
| 136,022
|
| 250,320
|
| Series 2006-AR2, Class 1A1 (c)
|
| 2.93%
|
| 03/01/36
|
| 250,475
|
|
|
| Washington Mutual Alternative Mortgage Pass-Through Certificates
|
|
|
|
|
|
|
| 15,301
|
| Series 2007-5, Class A11, 1 Mo. LIBOR x -6 + 39.48% (a)
|
| 38.84%
|
| 06/25/37
|
| 29,651
|
|
|
| Washington Mutual MSC Mortgage Pass-Through Certificates
|
|
|
|
|
|
|
| 221,613
|
| Series 2004-RA1, Class 2A
|
| 7.00%
|
| 03/01/34
|
| 236,299
|
See Notes to Financial Statements
Page 9
First Trust Mortgage Income Fund (FMY)
Portfolio of Investments
(Continued)
April 30, 2021
(Unaudited)
Principal
Value
|
| Description
|
| Stated
Coupon
|
| Stated
Maturity
|
| Value
|
| MORTGAGE-BACKED SECURITIES (Continued)
|
|
|
| Collateralized Mortgage Obligations (Continued)
|
|
|
|
|
|
|
|
|
| WinWater Mortgage Loan Trust
|
|
|
|
|
|
|
| $319,411
|
| Series 2015-3, Class B1 (c) (f)
|
| 3.88%
|
| 03/01/45
|
| $339,389
|
|
|
|
|
| 17,369,953
|
|
|
| Commercial Mortgage-Backed Securities – 5.9%
|
|
|
|
|
|
|
|
|
| BBCMS Trust
|
|
|
|
|
|
|
| 607,936
|
| Series 2013-TYSN, Class A2 (f)
|
| 3.76%
|
| 09/01/32
|
| 608,983
|
|
|
| Citigroup Commercial Mortgage Trust
|
|
|
|
|
|
|
| 4,474,642
|
| Series 2015-GC29, Class XA (c)
|
| 1.17%
|
| 04/01/48
|
| 158,043
|
| 9,890,769
|
| Series 2016-GC37, Class XA (c)
|
| 1.85%
|
| 04/01/49
|
| 675,341
|
| 1,451,843
|
| Series 2016-P4, Class XA (c)
|
| 2.11%
|
| 07/01/49
|
| 104,365
|
|
|
| COMM Mortgage Trust
|
|
|
|
|
|
|
| 537,652
|
| Series 2013-LC13, Class XA (c)
|
| 1.29%
|
| 08/01/46
|
| 10,692
|
| 25,178,907
|
| Series 2013-LC6, Class XA (c)
|
| 1.46%
|
| 01/01/46
|
| 404,071
|
| 122,774,000
|
| Series 2014-UBS6, Class XB (c) (f)
|
| 0.11%
|
| 12/01/47
|
| 277,064
|
| 1,123,000
|
| Series 2015-CCRE26, Class XD (c) (f)
|
| 1.38%
|
| 10/01/48
|
| 54,897
|
|
|
| Hudsons Bay Simon JV Trust
|
|
|
|
|
|
|
| 510,000
|
| Series 2015-HBFL, Class DFL, 1 Mo. LIBOR + 3.90% (e) (f)
|
| 4.01%
|
| 08/05/34
|
| 371,605
|
|
|
| JP Morgan Chase Commercial Mortgage Securities Trust
|
|
|
|
|
|
|
| 3,555,947
|
| Series 2016-JP4, Class XA (c)
|
| 0.81%
|
| 12/01/49
|
| 86,430
|
|
|
| Morgan Stanley Bank of America Merrill Lynch Trust
|
|
|
|
|
|
|
| 2,121,776
|
| Series 2014-C19, Class XA (c)
|
| 1.15%
|
| 12/01/47
|
| 61,155
|
| 5,632,500
|
| Series 2014-C19, Class XE (c) (f)
|
| 1.36%
|
| 12/01/47
|
| 244,020
|
| 506,349
|
| Series 2016-C31, Class XA (c)
|
| 1.48%
|
| 11/01/49
|
| 27,106
|
|
|
| Wells Fargo Commercial Mortgage Trust
|
|
|
|
|
|
|
| 1,431,806
|
| Series 2015-C26, Class XA (c)
|
| 1.35%
|
| 02/01/48
|
| 54,908
|
|
|
| WFRBS Commercial Mortgage Trust
|
|
|
|
|
|
|
| 400,000
|
| Series 2011-C5, Class C (c) (f)
|
| 5.85%
|
| 11/01/44
|
| 403,910
|
|
|
|
|
| 3,542,590
|
|
|
| Total Mortgage-Backed Securities
|
| 20,912,543
|
|
|
| (Cost $22,189,464)
|
|
|
|
|
|
|
| ASSET-BACKED SECURITIES – 3.4%
|
|
|
| Affirm Asset Securitization Trust
|
|
|
|
|
|
|
| 750,000
|
| Series 2021-A, Class C (f)
|
| 1.66%
|
| 08/15/25
|
| 753,975
|
| 750,000
|
| Series 2021-A, Class D (f)
|
| 3.49%
|
| 08/15/25
|
| 755,722
|
|
|
| Green Tree Financial Corp.
|
|
|
|
|
|
|
| 16,353
|
| Series 1998-4, Class A7
|
| 6.87%
|
| 04/01/30
|
| 16,613
|
|
|
| Mid-State Capital Corp. Trust
|
|
|
|
|
|
|
| 205,451
|
| Series 2004-1, Class M1
|
| 6.50%
|
| 08/01/37
|
| 219,014
|
| 258,067
|
| Series 2005-1, Class A
|
| 5.75%
|
| 01/01/40
|
| 277,669
|
|
|
| Total Asset-Backed Securities
|
| 2,022,993
|
|
|
| (Cost $1,981,496)
|
|
|
|
|
|
|
|
| Total Investments – 94.3%
|
| 56,496,906
|
|
| (Cost $58,386,438) (g)
|
|
|
|
| Net Other Assets and Liabilities – 5.7%
|
| 3,400,114
|
|
| Net Assets – 100.0%
|
| $59,897,020
|
Page 10
See Notes to Financial Statements
First Trust Mortgage Income Fund (FMY)
Portfolio of Investments
(Continued)
April 30, 2021
(Unaudited)
Futures Contracts (See Note 2D - Futures Contracts in the Notes to Financial Statements):
| Futures Contracts
|
| Position
|
| Number of
Contracts
|
| Expiration
Date
|
| Notional
Value
|
| Unrealized
Appreciation
(Depreciation)/
Value
|
| U.S. Treasury Long Bond Futures
|
| Long
|
| 1
|
| Jun 2021
|
| $ 157,250
|
| $(687)
|
| Ultra 10-Year U.S. Treasury Note Futures
|
| Long
|
| 10
|
| Jun 2021
|
| 1,455,469
|
| (4,047)
|
| Total Futures Contracts
|
|
|
|
|
|
|
| $1,612,719
|
| $(4,734)
|
|
| (a)
| Inverse floating rate security.
|
| (b)
| Zero coupon security.
|
| (c)
| Collateral Strip Rate security. Coupon is based on the weighted net interest rate of the investment’s underlying collateral. The interest rate resets periodically.
|
| (d)
| Weighted Average Coupon security. Coupon is based on the blended interest rate of the underlying holdings, which may have different coupons. The coupon may change in any period.
|
| (e)
| Floating or variable rate security.
|
| (f)
| This security, sold within the terms of a private placement memorandum, is exempt from registration upon resale under Rule 144A under the Securities Act of 1933, as amended (the
“1933 Act”), and may be resold in transactions exempt from registration, normally to qualified institutional buyers. Pursuant to procedures adopted by the Fund’s Board of Trustees, this security has
been determined to be liquid by First Trust Advisors L.P. (the “Advisor”). Although market instability can result in periods of increased overall market illiquidity, liquidity for each security is
determined based on security specific factors and assumptions, which require subjective judgment. At April 30, 2021, securities noted as such amounted to $7,783,154 or 13.0% of net assets.
|
| (g)
| Aggregate cost for financial reporting purposes approximates the aggregate cost for federal income tax purposes. As of April 30, 2021, the aggregate gross
unrealized appreciation for all investments in which there was an excess of value over tax cost was $2,361,306 and the aggregate gross unrealized depreciation for all investments in which there was an excess of tax
cost over value was $4,255,572. The net unrealized depreciation was $1,894,266. The unrealized amounts presented are inclusive of derivative contracts.
|
| ACES
| Alternative Credit Enhancement Securities
|
| IO
| Interest-Only Security - Principal amount shown represents par value on which interest payments are based.
|
| LIBOR
| London Interbank Offered Rate
|
| STRIPS
| Separate Trading of Registered Interest and Principal of Securities
|
Valuation Inputs
A summary of the inputs
used to value the Fund’s investments as of April 30, 2021 is as follows (see Note 2A - Portfolio Valuation in the Notes to Financial Statements):
| ASSETS TABLE
|
|
| Total
Value at
4/30/2021
| Level 1
Quoted
Prices
| Level 2
Significant
Observable
Inputs
| Level 3
Significant
Unobservable
Inputs
|
U.S. Government Agency Mortgage-Backed Securities
| $ 33,561,370
| $ —
| $ 33,561,370
| $ —
|
Mortgage-Backed Securities
| 20,912,543
| —
| 20,912,543
| —
|
Asset-Backed Securities
| 2,022,993
| —
| 2,022,993
| —
|
Total Investments
| $ 56,496,906
| $—
| $ 56,496,906
| $—
|
LIABILITIES TABLE |
|
| Total
Value at
4/30/2021
| Level 1
Quoted
Prices
| Level 2
Significant
Observable
Inputs
| Level 3
Significant
Unobservable
Inputs
|
Futures Contracts
| $ (4,734)
| $ (4,734)
| $ —
| $ —
|
See Notes to Financial Statements
Page 11
First Trust Mortgage Income Fund (FMY)
Statement of Assets and
Liabilities
April 30, 2021
(Unaudited)
| ASSETS:
|
|
Investments, at value
(Cost $58,386,438)
| $ 56,496,906
|
Cash
| 2,179,881
|
Restricted Cash
| 38,214
|
| Receivables:
|
|
Investment securities sold
| 2,863,036
|
Interest
| 465,000
|
Prepaid expenses
| 19,952
|
Total Assets
| 62,062,989
|
| LIABILITIES:
|
|
| Payables:
|
|
Investment securities purchased
| 2,025,735
|
Audit and tax fees
| 53,297
|
Investment advisory fees
| 41,773
|
Administrative fees
| 13,254
|
Shareholder reporting fees
| 10,114
|
Custodian fees
| 9,307
|
Variation margin
| 4,734
|
Legal fees
| 2,841
|
Transfer agent fees
| 2,680
|
Trustees’ fees and expenses
| 1,400
|
Financial reporting fees
| 771
|
Other liabilities
| 63
|
Total Liabilities
| 2,165,969
|
NET ASSETS
| $59,897,020
|
| NET ASSETS consist of:
|
|
Paid-in capital
| $ 66,237,538
|
Par value
| 42,131
|
Accumulated distributable earnings (loss)
| (6,382,649)
|
NET ASSETS
| $59,897,020
|
NET ASSET VALUE, per Common Share (par value $0.01 per Common Share)
| $14.22
|
Number of Common Shares outstanding (unlimited number of Common Shares has been authorized)
| 4,213,115
|
Page 12
See Notes to Financial Statements
First Trust Mortgage Income Fund (FMY)
Statement of Operations
For the Six Months Ended
April 30, 2021 (Unaudited)
| INVESTMENT INCOME:
|
|
Interest
| $ 751,946
|
Other
| 608,893
|
Total investment income
| 1,360,839
|
| EXPENSES:
|
|
Investment advisory fees
| 254,329
|
Administrative fees
| 33,191
|
Audit and tax fees
| 29,749
|
Transfer agent fees
| 16,899
|
Shareholder reporting fees
| 15,032
|
Listing expense
| 10,100
|
Trustees’ fees and expenses
| 7,630
|
Legal fees
| 4,829
|
Financial reporting fees
| 4,625
|
Custodian fees
| 2,963
|
Other
| 10,018
|
Total expenses
| 389,365
|
NET INVESTMENT INCOME (LOSS)
| 971,474
|
| NET REALIZED AND UNREALIZED GAIN (LOSS):
|
|
| Net realized gain (loss) on:
|
|
Investments
| 119,069
|
Futures contracts
| 102,161
|
Net realized gain (loss)
| 221,230
|
| Net change in unrealized appreciation (depreciation) on:
|
|
Investments
| (649,274)
|
Futures contracts
| (7,359)
|
Net change in unrealized appreciation (depreciation)
| (656,633)
|
NET REALIZED AND UNREALIZED GAIN (LOSS)
| (435,403)
|
NET INCREASE (DECREASE) IN NET ASSETS RESULTING FROM OPERATIONS
| $ 536,071
|
See Notes to Financial Statements
Page 13
First Trust Mortgage Income Fund (FMY)
Statements of Changes in
Net Assets
|
| Six Months
Ended
4/30/2021
(Unaudited)
|
| Year
Ended
10/31/2020
|
| OPERATIONS:
|
|
|
|
Net investment income (loss)
| $ 971,474
|
| $ 1,868,860
|
Net realized gain (loss)
| 221,230
|
| (154,999)
|
Net change in unrealized appreciation (depreciation)
| (656,633)
|
| (634,287)
|
Net increase (decrease) in net assets resulting from operations
| 536,071
|
| 1,079,574
|
| DISTRIBUTIONS TO SHAREHOLDERS FROM:
|
|
|
|
Investment operations
| (1,516,721)
|
| (2,663,075)
|
Return of capital
| —
|
| (370,368)
|
Total distributions to shareholders
| (1,516,721)
|
| (3,033,443)
|
Total increase (decrease) in net assets
| (980,650)
|
| (1,953,869)
|
| NET ASSETS:
|
|
|
|
Beginning of period
| 60,877,670
|
| 62,831,539
|
End of period
| $ 59,897,020
|
| $ 60,877,670
|
| COMMON SHARES:
|
|
|
|
Common Shares at end of period
| 4,213,115
|
| 4,213,115
|
Page 14
See Notes to Financial Statements
First Trust Mortgage Income Fund (FMY)
Financial Highlights
For a Common Share
outstanding throughout each period
|
| Six Months
Ended
4/30/2021
(Unaudited)
|
| Year Ended October 31,
|
|
| 2020
|
| 2019
|
| 2018
|
| 2017 |
|
2016 (a) |
Net asset value, beginning of period
| $ 14.45
|
| $ 14.91
|
| $ 14.96
|
| $ 15.47
|
| $ 15.53
|
| $ 16.05
|
| Income from investment operations:
|
|
|
|
|
|
|
|
|
|
|
|
Net investment income (loss)
| 0.23
|
| 0.44
|
| 0.34
|
| 0.45
|
| 0.18
|
| (0.02)
|
Net realized and unrealized gain (loss)
| (0.10)
|
| (0.18)
|
| 0.33
|
| (0.21)
|
| 0.54
|
| 0.41
|
Total from investment operations
| 0.13
|
| 0.26
|
| 0.67
|
| 0.24
|
| 0.72
|
| 0.39
|
| Distributions paid to shareholders from:
|
|
|
|
|
|
|
|
|
|
|
|
Net investment income
| (0.36)
|
| (0.63)
|
| (0.50)
|
| (0.42)
|
| (0.46)
|
| (0.54)
|
Return of capital
| —
|
| (0.09)
|
| (0.22)
|
| (0.33)
|
| (0.32)
|
| (0.37)
|
Total distributions paid to Common Shareholders
| (0.36)
|
| (0.72)
|
| (0.72)
|
| (0.75)
|
| (0.78)
|
| (0.91)
|
Net asset value, end of period
| $14.22
|
| $14.45
|
| $14.91
|
| $14.96
|
| $15.47
|
| $15.53
|
Market value, end of period
| $13.62
|
| $13.40
|
| $13.99
|
| $13.01
|
| $14.39
|
| $14.00
|
Total return based on net asset value (b)
| 1.03%
|
| 2.12%
|
| 5.08%
|
| 2.13%
|
| 5.25%
|
| 3.05%
|
Total return based on market value (b)
| 4.35%
|
| 0.93%
|
| 13.37%
|
| (4.52)%
|
| 8.60%
|
| 2.26%
|
| Ratios to average net assets/supplemental data:
|
|
|
|
|
|
|
|
|
|
|
|
Net assets, end of period (in 000’s)
| $ 59,897
|
| $ 60,878
|
| $ 62,832
|
| $ 63,047
|
| $ 65,196
|
| $ 65,437
|
Ratio of total expenses to average net assets
| 1.30% (c)
|
| 1.33%
|
| 1.33%
|
| 1.59%
|
| 1.25%
|
| 1.47%
|
Ratio of total expenses to average net assets excluding interest expense
| 1.30% (c)
|
| 1.33%
|
| 1.33%
|
| 1.59%
|
| 1.25%
|
| 1.43%
|
Ratio of net investment income (loss) to average net assets
| 3.25% (c)
|
| 3.03%
|
| 2.29%
|
| 2.95%
|
| 1.12%
|
| (0.11)%
|
Portfolio turnover rate
| 28%
|
| 28%
|
| 69%
|
| 30%
|
| 27%
|
| 49%
|
| (a)
| Effective September 19, 2016, the portfolio management of the Fund transitioned to the First Trust Securitized Products Group, formerly known as First Trust Mortgage Securities Team.
Schroder Investment Management North America Inc. acquired the portfolio management team of Brookfield Investment Management Inc. (“Brookfield”), previously responsible for the portfolio management of the
Fund, resulting in the automatic termination of the investment sub-advisory agreement among Brookfield, First Trust and the Fund. In connection with the change in portfolio management, First Trust agreed to lower the
investment management fee payable by the Fund to a rate of 0.85% of the Fund’s managed assets, a decrease from the Fund’s previous investment management fee of 1.00% of the Fund’s managed assets.
|
| (b)
| Total return is based on the combination of reinvested dividend, capital gain and return of capital distributions, if any, at prices obtained by the Dividend Reinvestment Plan, and
changes in net asset value per share for net asset value returns and changes in Common Share Price for market value returns. Total returns do not reflect sales load and are not annualized for periods of less than one
year. Past performance is not indicative of future results.
|
| (c)
| Annualized.
|
See Notes to Financial Statements
Page 15
Notes to Financial Statements
First Trust Mortgage
Income Fund (FMY)
April 30, 2021
(Unaudited)
1. Organization
First Trust Mortgage
Income Fund (the “Fund”) is a diversified, closed-end management investment company organized as a Massachusetts business trust on February 22, 2005, and is registered with the Securities and Exchange
Commission (“SEC”) under the Investment Company Act of 1940, as amended (the “1940 Act”). The Fund trades under the ticker symbol “FMY” on the New York Stock Exchange
(“NYSE”).
The Fund’s primary
investment objective is to seek a high level of current income. As a secondary objective, the Fund seeks to preserve capital. The Fund pursues its objectives by investing primarily in mortgage-backed securities
(“MBS”) representing part ownership in a pool of either residential or commercial mortgage loans that, in the opinion of First Trust Advisors L.P. (“First Trust” or the “Advisor”),
offer an attractive combination of credit quality, yield and maturity. There can be no assurance the Fund will achieve its investment objectives. The Fund may not be appropriate for all investors.
2. Significant
Accounting Policies
The Fund is considered an
investment company and follows accounting and reporting guidance under Financial Accounting Standards Board Accounting Standards Codification Topic 946, “Financial Services-Investment Companies.” The
following is a summary of significant accounting policies consistently followed by the Fund in the preparation of the financial statements. The preparation of the financial statements in accordance with accounting
principles generally accepted in the United States of America (“U.S. GAAP”) requires management to make estimates and assumptions that affect the reported amounts and disclosures in the financial
statements. Actual results could differ from those estimates.
A. Portfolio
Valuation
The net asset value
(“NAV”) of the Common Shares of the Fund is determined daily as of the close of regular trading on the NYSE, normally 4:00 p.m. Eastern time, on each day the NYSE is open for trading. If the NYSE closes
early on a valuation day, the NAV is determined as of that time. Domestic debt securities and foreign securities are priced using data reflecting the earlier closing of the principal markets for those securities. The
Fund’s NAV per Common Share is calculated by dividing the value of all assets of the Fund (including accrued interest and dividends), less all liabilities (including accrued expenses, dividends declared but
unpaid and any borrowings of the Fund), by the total number of Common Shares outstanding.
The Fund’s
investments are valued daily at market value or, in the absence of market value with respect to any portfolio securities, at fair value. Market value prices represent last sale or official closing prices from a
national or foreign exchange (i.e., a regulated market) and are primarily obtained from third-party pricing services. Fair value prices represent any prices not considered market value prices and are either obtained
from a third-party pricing service or are determined by the Advisor’s Pricing Committee, in accordance with valuation procedures adopted by the Fund’s Board of Trustees, and in accordance with provisions
of the 1940 Act. Investments valued by the Advisor’s Pricing Committee, if any, are footnoted as such in the footnotes to the Portfolio of Investments. The Fund’s investments are valued as follows:
U.S.
government securities, mortgage-backed securities, asset-backed securities and other debt securities are fair valued on the basis of valuations provided by dealers who make markets in such securities or by a
third-party pricing service approved by the Fund’s Board of Trustees, which may use the following valuation inputs when available:
| 1)
| benchmark yields;
|
| 2)
| reported trades;
|
| 3)
| broker/dealer quotes;
|
| 4)
| issuer spreads;
|
| 5)
| benchmark securities;
|
| 6)
| bids and offers; and
|
| 7)
| reference data including market research publications.
|
Exchange-traded futures contracts are valued at the closing price in the market where such contracts are principally traded. If no closing price is available, exchange-traded futures contracts are fair valued at the
mean of their most recent bid and asked price, if available, and otherwise at their closing bid price.
Exchange-traded options contracts are valued at the closing price in the market where such contracts are principally traded. If no closing price is available, exchange-traded options contracts are fair valued at the
mean of their most recent bid and asked price, if available, and otherwise at their closing bid price. Over-the-counter options contracts are fair valued at the mean of their most recent bid and asked price, if
available, and otherwise at their closing bid price.
Notes to Financial Statements (Continued)
First Trust Mortgage
Income Fund (FMY)
April 30, 2021
(Unaudited)
Fixed
income and other debt securities having a remaining maturity of sixty days or less when purchased are fair valued at cost adjusted for amortization of premiums and accretion of discounts (amortized cost), provided the
Advisor’s Pricing Committee has determined that the use of amortized cost is an appropriate reflection of fair value given market and issuer-specific conditions existing at the time of the determination. Factors
that may be considered in determining the appropriateness of the use of amortized cost include, but are not limited to, the following:
| 1)
| the credit conditions in the relevant market and changes thereto;
|
| 2)
| the liquidity conditions in the relevant market and changes thereto;
|
| 3)
| the interest rate conditions in the relevant market and changes thereto (such as significant changes in interest rates);
|
| 4)
| issuer-specific conditions (such as significant credit deterioration); and
|
| 5)
| any other market-based data the Advisor’s Pricing Committee considers relevant. In this regard, the Advisor’s Pricing Committee may use last-obtained market-based data to assist it when
valuing portfolio securities using amortized cost.
|
Certain securities may
not be able to be priced by pre-established pricing methods. Such securities may be valued by the Fund’s Board of Trustees or its delegate, the Advisor’s Pricing Committee, at fair value. These securities
generally include, but are not limited to, restricted securities (securities which may not be publicly sold without registration under the Securities Act of 1933, as amended (the “1933 Act”)) for which a
third-party pricing service is unable to provide a market price; securities whose trading has been formally suspended; a security whose market or fair value price is not available from a pre-established pricing source;
a security with respect to which an event has occurred that is likely to materially affect the value of the security after the market has closed but before the calculation of the Fund’s NAV or make it difficult
or impossible to obtain a reliable market quotation; and a security whose price, as provided by the third-party pricing service, does not reflect the security’s fair value. As a general principle, the current
fair value of a security would appear to be the amount which the owner might reasonably expect to receive for the security upon its current sale. When fair value prices are used, generally they will differ from market
quotations or official closing prices on the applicable exchanges. A variety of factors may be considered in determining the fair value of such securities, including, but not limited to, the following:
| 1)
| the fundamental business data relating to the issuer;
|
| 2)
| an evaluation of the forces which influence the market in which these securities are purchased and sold;
|
| 3)
| the type, size and cost of the security;
|
| 4)
| the financial statements of the issuer;
|
| 5)
| the credit quality and cash flow of the issuer, based on the Advisor’s or external analysis;
|
| 6)
| the information as to any transactions in or offers for the security;
|
| 7)
| the price and extent of public trading in similar securities (or equity securities) of the issuer/borrower, or comparable companies;
|
| 8)
| the coupon payments;
|
| 9)
| the quality, value and salability of collateral, if any, securing the security;
|
| 10)
| the business prospects of the issuer, including any ability to obtain money or resources from a parent or affiliate and an assessment of the issuer’s management;
|
| 11)
| the prospects for the issuer’s industry, and multiples (of earnings and/or cash flows) being paid for similar businesses in that industry; and
|
| 12)
| other relevant factors.
|
The Fund is subject to
fair value accounting standards that define fair value, establish the framework for measuring fair value and provide a three-level hierarchy for fair valuation based upon the inputs to the valuation as of the
measurement date. The three levels of the fair value hierarchy are as follows:
| •
| Level 1 – Level 1 inputs are quoted prices in active markets for identical investments. An active market is a market in which transactions for the investment occur with sufficient frequency and
volume to provide pricing information on an ongoing basis.
|
| •
| Level 2 – Level 2 inputs are observable inputs, either directly or indirectly, and include the following:
|
| o
| Quoted prices for similar investments in active markets.
|
| o
| Quoted prices for identical or similar investments in markets that are non-active. A non-active market is a market where there are few transactions for the investment, the prices are not current, or
price quotations vary substantially either over time or among market makers, or in which little information is released publicly.
|
Notes to Financial Statements (Continued)
First Trust Mortgage
Income Fund (FMY)
April 30, 2021
(Unaudited)
| o
| Inputs other than quoted prices that are observable for the investment (for example, interest rates and yield curves observable at commonly quoted intervals, volatilities, prepayment speeds, loss
severities, credit risks, and default rates).
|
| o
| Inputs that are derived principally from or corroborated by observable market data by correlation or other means.
|
| •
| Level 3 – Level 3 inputs are unobservable inputs. Unobservable inputs may reflect the reporting entity’s own assumptions about the assumptions that market participants would use in pricing
the investment.
|
The inputs or
methodologies used for valuing investments are not necessarily an indication of the risk associated with investing in those investments. A summary of the inputs used to value the Fund’s investments as of April
30, 2021, is included with the Fund’s Portfolio of Investments.
B. Option
Contracts
The Fund may invest in
exchange-listed options on U.S. Treasury securities, exchange-listed options on U.S. Treasury futures contracts and exchange-listed U.S. Treasury futures contracts. The Fund uses derivative instruments primarily to
hedge interest rate risk and actively manage interest rate exposure. The primary risk exposure is interest rate risk.
The Fund may purchase
(buy) or write (sell) put and call options on futures contracts and enter into closing transactions with respect to such options to terminate an existing position. A futures option gives the holder the right, in
return for the premium paid, to assume a long position (call) or short position (put) in a futures contract at a specified exercise price prior to the expiration of the option. Upon exercise of a call option, the
holder acquires a long position in the futures contract and the writer is assigned the opposite short position. In the case of a put option, the opposite is true. Prior to exercise or expiration, a futures option
contract may be closed out by an offsetting purchase or sale of a futures option of the same series. When the Fund writes (sells) an option, an amount equal to the premium received by the Fund is included in
“Options contracts written, at value” on the Statement of Assets and Liabilities. When the Fund purchases (buys) an option, the premium paid represents the cost of the option, which is included in
“Premiums paid on options contracts purchased” on the Statement of Assets and Liabilities. Options are marked-to-market daily and their value is affected by changes in the value of the underlying security,
changes in interest rates, changes in the actual or perceived volatility of the securities markets and the underlying securities, and the remaining time to the option’s expiration. The value of options may also
be adversely affected if the market for the options becomes less liquid or the trading volume diminishes.
The Fund uses options on
futures contracts in connection with hedging strategies. Generally, these strategies are applied under the same market and market sector conditions in which the Fund uses put and call options on securities. The
purchase of put options on futures contracts is analogous to the purchase of puts on securities so as to hedge the Fund’s securities holdings against the risk of declining market prices. The writing of a call
option or the purchasing of a put option on a futures contract constitutes a partial hedge against declining prices of securities which are deliverable upon exercise of the futures contract. If the price at expiration
of a written call option is below the exercise price, the Fund will retain the full amount of the option premium which provides a partial hedge against any decline that may have occurred in the Fund’s holdings
of securities. If the price when the option is exercised is above the exercise price, however, the Fund will incur a loss, which may be offset, in whole or in part, by the increase in the value of the securities held
by the Fund that were being hedged. Writing a put option or purchasing a call option on a futures contract serves as a partial hedge against an increase in the value of the securities the Fund intends to acquire.
Realized gains and losses on written options are included in “Net realized gain (loss) on written options contracts” on the Statement of Operations. Realized gains and losses on purchased options are
included in “Net realized gain (loss) on purchased options contracts” on the Statement of Operations.
The Fund is required to
deposit and maintain margin with respect to put and call options on futures contracts written by it. Such margin deposits will vary depending on the nature of the underlying futures contract (and the related initial
margin requirements), the current market value of the option and other futures positions held by the Fund. The Fund will pledge in a segregated account at the Fund’s custodian, liquid assets, such as cash, U.S.
government securities or other high-grade liquid debt obligations equal in value to the amount due on the underlying obligation. Such segregated assets will be marked-to-market daily, and additional assets will be
pledged in the segregated account whenever the total value of the pledged assets falls below the amount due on the underlying obligation.
The risks associated with
the use of options on future contracts include the risk that the Fund may close out its position as a writer of an option only if a liquid secondary market exists for such options, which cannot be assured. The
Fund’s successful use of options on futures contracts depends on the Advisor’s ability to correctly predict the movement in prices on futures contracts and the underlying instruments, which may prove to be
incorrect. In addition, there may be imperfect correlation between the instruments being hedged and the futures contract subject to option.
Notes to Financial Statements (Continued)
First Trust Mortgage
Income Fund (FMY)
April 30, 2021
(Unaudited)
C. Securities
Transactions and Investment Income
Securities transactions
are recorded as of the trade date. Realized gains and losses from securities transactions are recorded on the identified cost basis. Interest income is recorded daily on the accrual basis. Amortization of premiums and
accretion of discounts are recorded using the effective interest method.
The Fund invests in
interest-only securities. For these securities, if there is a change in the estimated cash flows, based on an evaluation of current information, then the estimated yield is adjusted. Additionally, if the evaluation of
current information indicates a permanent impairment of the security, the cost basis of the security is written down and a loss is recognized. Debt obligations may be placed on non-accrual status and the related
interest income may be reduced by ceasing current accruals and writing off interest receivables when the collection of all or a portion of interest has become doubtful based on consistently applied procedures. A debt
obligation is removed from non-accrual status when the issuer resumes interest payments or when collectability of interest is reasonably assured.
Securities purchased or
sold on a when-issued, delayed-delivery or forward purchase commitment basis may have extended settlement periods. The value of the security so purchased is subject to market fluctuations during this period. The Fund
maintains liquid assets with a current value at least equal to the amount of its when-issued, delayed-delivery or forward purchase commitments until payment is made. At April 30, 2021, the Fund had no when-issued,
delayed-delivery or forward purchase commitments.
The United
Kingdom’s Financial Conduct Authority, which regulates the London Interbank Offered Rates (“LIBOR”), announced on March 5, 2021 that all non-USD LIBOR reference rates and the 1-week and 2-month USD
LIBOR reference rates will cease to be provided or no longer be representative immediately after December 31, 2021 and the remaining USD LIBOR settings will cease to be provided or no longer be representative
immediately after June 30, 2023. The International Swaps and Derivatives Association, Inc. (“ISDA”) confirmed that the March 5, 2021 announcement constituted an index cessation event under the Interbank
Offered Rates (“IBOR”) Fallbacks Supplement and the ISDA 2020 IBOR Fallbacks Protocol for all 35 LIBOR settings and confirmed that the spread adjustment to be used in ISDA fallbacks was fixed as of the
date of the announcement.
In the United States, the
Alternative Reference Rates Committee (the “ARRC”), a group of market participants convened by the Board of Governors of the Federal Reserve System and the Federal Reserve Bank of New York in cooperation
with other federal and state government agencies, has since 2014 undertaken efforts to identify U.S. dollar reference interest rates as alternatives to LIBOR and to facilitate the mitigation of LIBOR-related risks. In
June 2017, the ARRC identified the Secured Overnight Financing Rate (“SOFR”), a broad measure of the cost of cash overnight borrowing collateralized by U.S. Treasury securities, as the preferred
alternative for U.S. dollar LIBOR. The Federal Reserve Bank of New York began daily publishing of SOFR in April 2018.
At this time, it is not
possible to predict the full impact of the elimination of LIBOR and the establishment of an alternative reference rate on the Fund or its investments.
D. Futures
Contracts
The Fund may purchase or
sell (i.e., is long or short) exchange-listed futures contracts to hedge against changes in interest rates (interest rate risk). Futures contracts are agreements between the Fund and a counterparty to buy or sell a
specific quantity of an underlying instrument at a specified price and at a specified date. Depending on the terms of the contract, futures contracts are settled either through physical delivery of the underlying
instrument on the settlement date or by payment of a cash settlement amount on the settlement date. Open futures contracts can also be closed out prior to settlement by entering into an offsetting transaction in a
matching futures contract. If the Fund is not able to enter into an offsetting transaction, the Fund will continue to be required to maintain margin deposits on the futures contract. When the contract is closed or
expires, the Fund records a realized gain or loss equal to the difference between the value of the contract at the time it was opened and the value at the time it was closed or expired. This gain or loss is included
in “Net realized gain (loss) on futures contracts” on the Statement of Operations.
Upon entering into a
futures contract, the Fund must deposit funds, called margin, with its custodian in the name of the clearing broker equal to a specified percentage of the current value of the contract. Open futures contracts are
marked to market daily with the change in value recognized as a component of “Net change in unrealized appreciation (depreciation) on futures contracts” on the Statement of Operations. Pursuant to the
contract, the Fund agrees to receive from or pay to the broker an amount of cash equal to the daily fluctuation in value of the contract. Such receipts or payments are known as variation margin and are included in
“Variation margin” payable or receivable on the Statement of Assets and Liabilities.
If market conditions
change unexpectedly, the Fund may not achieve the anticipated benefits of the futures contract and may realize a loss. The use of futures contracts involves the risk of imperfect correlation in movements in the price
of the futures contracts, interest rates and the underlying instruments.
Notes to Financial Statements (Continued)
First Trust Mortgage
Income Fund (FMY)
April 30, 2021
(Unaudited)
Restricted cash
segregated as collateral for futures contracts in the amount of $38,214 is shown as “Restricted Cash” on the Statement of Assets and Liabilities.
E. Inverse
Floating-Rate Securities
An inverse floating-rate
security is one where the coupon is inversely indexed to a short-term floating interest rate multiplied by a specific factor. As the floating rate rises, the coupon is reduced. Conversely, as the floating rate
declines, the coupon is increased. The price of these securities may be more volatile than the price of a comparable fixed-rate security. These instruments are typically used to enhance the yield of the portfolio and
have the effect of creating leverage. These securities, if any, are identified on the Portfolio of Investments.
F. Stripped
Mortgage-Backed Securities
Stripped Mortgage-Backed
Securities are created by segregating the cash flows from underlying mortgage loans or mortgage securities to create two or more new securities, each with a specified percentage of the underlying security’s
principal or interest payments. Mortgage securities may be partially stripped so that each investor class receives some interest and some principal. When securities are completely stripped, however, all of the
interest is distributed to holders of one type of security known as an interest-only security (“IO Security”) and all of the principal is distributed to holders of another type of security known as a
principal-only security. These securities, if any, are identified on the Portfolio of Investments.
G. Interest-Only
Securities
An IO Security is the
interest-only portion of a mortgage-backed security that receives some or all of the interest portion of the underlying mortgage-backed security and little or no principal. A reference principal value called a
notional value is used to calculate the amount of interest due to the IO Security. IO Securities are sold at a deep discount to their notional principal amount. Generally speaking, when interest rates are falling and
prepayment rates are increasing, the value of an IO Security will fall. Conversely, when interest rates are rising and prepayment rates are decreasing, generally the value of an IO Security will rise. These
securities, if any, are identified on the Portfolio of Investments.
H. Mortgage Dollar
Rolls and TBA Transactions
The Fund may invest,
without limitation, in mortgage dollar rolls. The Fund intends to enter into mortgage dollar rolls only with high quality securities dealers and banks, as determined by the Fund’s investment advisor. In a
mortgage dollar roll, the Fund will sell (or buy) mortgage-backed securities for delivery on a specified date and simultaneously contract to repurchase (or sell) substantially similar (same type, coupon and maturity)
securities on a future date. Mortgage dollar rolls are recorded as separate purchases and sales in the Fund. The Fund may also invest in to-be-announced transactions (“TBA Transactions”). A TBA Transaction
is a method of trading mortgage-backed securities. TBA Transactions generally are conducted in accordance with widely-accepted guidelines which establish commonly observed terms and conditions for execution,
settlement and delivery. In a TBA Transaction, the buyer and the seller agree on general trade parameters such as agency, settlement date, par amount and price.
I. Dividends and
Distributions to Shareholders
The Fund will distribute
to holders of its Common Shares monthly dividends of all or a portion of its net income after the payment of interest and dividends in connection with leverage, if any. Distributions of any net long-term capital gains
earned by the Fund are distributed at least annually. Distributions will automatically be reinvested into additional Common Shares pursuant to the Fund’s Dividend Reinvestment Plan unless cash distributions are
elected by the shareholder.
Distributions from net
investment income and realized capital gains are determined in accordance with federal income tax regulations, which may differ from U.S. GAAP. Certain capital accounts in the financial statements are periodically
adjusted for permanent differences in order to reflect their tax character. These permanent differences are primarily due to the varying treatment of income and gain/loss on portfolio securities held by the Fund and
have no impact on net assets or NAV per share. Temporary differences, which arise from recognizing certain items of income, expense and gain/loss in different periods for financial statement and tax purposes, will
reverse at some point in the future.
The tax character of
distributions paid by the Fund during the fiscal year ended October 31, 2020, was as follows:
| Distributions paid from:
|
|
Ordinary income
| $2,663,075
|
Capital gains
| —
|
Return of capital
| 370,368
|
Notes to Financial Statements (Continued)
First Trust Mortgage
Income Fund (FMY)
April 30, 2021
(Unaudited)
As of October 31, 2020,
the components of distributable earnings and net assets on a tax basis were as follows:
Undistributed ordinary income
| $—
|
Undistributed capital gains
| —
|
Total undistributed earnings
| —
|
Accumulated capital and other losses
| (2,755,463)
|
Net unrealized appreciation (depreciation)
| (2,646,536)
|
Total accumulated earnings (losses)
| (5,401,999)
|
Other
| —
|
Paid-in capital
| 66,279,669
|
Total net assets
| $60,877,670
|
J. Income Taxes
The Fund intends to
continue to qualify as a regulated investment company by complying with the requirements under Subchapter M of the Internal Revenue Code of 1986, as amended, which includes distributing substantially all of its net
investment income and net realized gains to shareholders. Accordingly, no provision has been made for federal and state income taxes. However, due to the timing and amount of distributions, the Fund may be subject to
an excise tax of 4% of the amount by which approximately 98% of the Fund’s taxable income exceeds the distributions from such taxable income for the calendar year.
Under the Regulated
Investment Company Modernization Act of 2010 (the “Act”), net capital losses arising in taxable years after December 22, 2010, may be carried forward indefinitely, and their character is retained as
short-term and/or long-term losses. Previously, net capital losses were carried forward for up to eight years and treated as short-term losses. As a transition rule, the Act requires that post-enactment net capital
losses be used before pre-enactment net capital losses. At October 31, 2020, the Fund had no pre-enactment net capital losses for federal income tax purposes. At October 31, 2020, the Fund had post-enactment net
capital losses for federal income tax purposes of $2,755,463 to be carried forward indefinitely.
The Fund is subject to
certain limitations under the U.S. tax rules on the use of capital loss carryforwards and net unrealized built-in losses. These limitations apply when there has been a 50% change in ownership.
Certain losses realized
during the current fiscal year may be deferred and treated as occurring on the first day of the following fiscal year for federal income tax purposes. For the fiscal year ended October 31, 2020, the Fund did not incur
any net ordinary losses.
The Fund is subject to
accounting standards that establish a minimum threshold for recognizing, and a system for measuring, the benefits of a tax position taken or expected to be taken in a tax return. Taxable years ended 2017, 2018, 2019,
and 2020 remain open to federal and state audit. As of April 30, 2021, management has evaluated the application of these standards to the Fund and has determined that no provision for income tax is required in the
Fund’s financial statements for uncertain tax positions.
K. Expenses
The Fund will pay all
expenses directly related to its operations.
3. Investment
Advisory Fee, Affiliated Transactions and Other Fee Arrangements
First Trust, the
investment advisor to the Fund, is a limited partnership with one limited partner, Grace Partners of DuPage L.P., and one general partner, The Charger Corporation. The Charger Corporation is an Illinois corporation
controlled by James A. Bowen, Chief Executive Officer of First Trust. First Trust is responsible for the selection and ongoing monitoring of the Fund’s investment portfolio, managing the Fund’s business
affairs and providing certain administrative services necessary for the management of the Fund. For these investment management services, First Trust is entitled to a monthly fee calculated at an annual rate of 0.85%
of the Fund’s Managed Assets (the average daily total asset value of the Fund minus the sum of the Fund’s liabilities other than the principal amount of borrowings or reverse repurchase agreements, if
any). First Trust also provides fund reporting services to the Fund for a flat annual fee in the amount of $9,250.
BNY Mellon Investment
Servicing (US) Inc. (“BNYM IS”) serves as the Fund’s transfer agent in accordance with certain fee arrangements. As transfer agent, BNYM IS is responsible for maintaining shareholder records for the
Fund. The Bank of New York Mellon (“BNYM”) serves as the Fund’s administrator, fund accountant, and custodian in accordance with certain fee arrangements. As administrator and fund accountant, BNYM
is responsible for providing certain administrative and accounting services to the Fund, including maintaining the Fund’s books of account, records of the Fund’s securities transactions, and certain other
books and records.
Notes to Financial Statements (Continued)
First Trust Mortgage
Income Fund (FMY)
April 30, 2021
(Unaudited)
As custodian, BNYM is responsible for
custody of the Fund’s assets. BNYM IS and BNYM are subsidiaries of The Bank of New York Mellon Corporation, a financial holding company.
Each Trustee who is not
an officer or employee of First Trust, any sub-advisor or any of their affiliates (“Independent Trustees”) is paid a fixed annual retainer that is allocated equally among each fund in the First Trust Fund
Complex. Each Independent Trustee is also paid an annual per fund fee that varies based on whether the fund is a closed-end or other actively managed fund, a defined-outcome fund or an index fund.
Additionally, the Lead
Independent Trustee and the Chairmen of the Audit Committee, Nominating and Governance Committee and Valuation Committee are paid annual fees to serve in such capacities, with such compensation allocated pro rata
among each fund in the First Trust Fund Complex based on net assets. Independent Trustees are reimbursed for travel and out-of-pocket expenses in connection with all meetings. The Lead Independent Trustee and
Committee Chairmen rotate every three years. The officers and “Interested” Trustee receive no compensation from the Fund for acting in such capacities.
4. Purchases and
Sales of Securities
The cost of purchases of
U.S. Government securities and non-U.S. Government securities, excluding short-term investments, for the six months ended April 30, 2021, were $10,514,563 and $6,061,163, respectively. The proceeds from sales and
paydowns of U.S. Government securities and non-U.S. Government securities, excluding short-term investments, for the six months ended April 30, 2021, were $9,042,899 and $7,425,721, respectively. The cost of purchases
to cover investments sold short and the proceeds of investments sold short were $1,003,516 and $1,003,516, respectively.
5. Derivative
Transactions
The following table
presents the type of derivatives held by the Fund at April 30, 2021, the primary underlying risk exposure and the location of these instruments as presented on the Statement of Assets and Liabilities.
|
|
|
|
| Asset Derivatives
|
| Liability Derivatives
|
Derivative
Instrument
|
| Risk
Exposure
|
| Statement of Assets and
Liabilities Location
|
| Value
|
| Statement of Assets and
Liabilities Location
|
| Value
|
| Futures
|
| Interest Rate Risk
|
| Unrealized appreciation
on futures contracts
|
| $ —
|
| Unrealized depreciation
on futures contracts
|
| $ (4,734)
|
The following table
presents the amount of net realized gain (loss) and change in net unrealized appreciation (depreciation) recognized for the six months ended April 30, 2021, on derivative instruments, as well as the primary underlying
risk exposure associated with each instrument.
| Statement of Operations Location
|
|
| Interest Rate Risk Exposure
|
|
| Net realized gain (loss) on futures contracts
| $102,161
|
| Net change in unrealized appreciation (depreciation) on futures contracts
| (7,359)
|
During the six months
ended April 30, 2021, the notional value of futures contracts opened and closed were $35,091,219 and $32,167,498, respectively.
The Fund does not have
the right to offset financial assets and liabilities related to futures contracts on the Statement of Assets and Liabilities.
6. Indemnification
The Fund has a variety of
indemnification obligations under contracts with its service providers. The Fund’s maximum exposure under these arrangements is unknown. However, the Fund has not had prior claims or losses pursuant to these
contracts and expects the risk of loss to be remote.
7. Subsequent
Events
Management has evaluated
the impact of all subsequent events to the Fund through the date the financial statements were issued, and has determined that there were no subsequent events requiring recognition or disclosure in the financial
statements that have not already been disclosed.
*Includes
cumulative appreciation (depreciation) on futures contracts as reported in the Portfolio of Investments. Only the current day’s variation margin is reported within the Statement of Assets and Liabilities.
Additional Information
First Trust Mortgage
Income Fund (FMY)
April 30, 2021
(Unaudited)
Dividend Reinvestment
Plan
If your Common Shares are
registered directly with the Fund or if you hold your Common Shares with a brokerage firm that participates in the Fund’s Dividend Reinvestment Plan (the “Plan”), unless you elect, by written notice
to the Fund, to receive cash distributions, all dividends, including any capital gain distributions, on your Common Shares will be automatically reinvested by BNY Mellon Investment Servicing (US) Inc. (the “Plan
Agent”), in additional Common Shares under the Plan. If you elect to receive cash distributions, you will receive all distributions in cash paid by check mailed directly to you by the Plan Agent, as the dividend
paying agent.
If you decide to
participate in the Plan, the number of Common Shares you will receive will be determined as follows:
| (1)
| If Common Shares are trading at or above net asset value (“NAV”) at the time of valuation, the Fund will issue new shares at a price equal to the greater of (i) NAV per Common Share on that
date or (ii) 95% of the market price on that date.
|
| (2)
| If Common Shares are trading below NAV at the time of valuation, the Plan Agent will receive the dividend or distribution in cash and will purchase Common Shares in the open market,
on the NYSE or elsewhere, for the participants’ accounts. It is possible that the market price for the Common Shares may increase before the Plan Agent has completed its purchases. Therefore, the average
purchase price per share paid by the Plan Agent may exceed the market price at the time of valuation, resulting in the purchase of fewer shares than if the dividend or distribution had been paid in Common Shares
issued by the Fund. The Plan Agent will use all dividends and distributions received in cash to purchase Common Shares in the open market within 30 days of the valuation date except where temporary curtailment or
suspension of purchases is necessary to comply with federal securities laws. Interest will not be paid on any uninvested cash payments.
|
You may elect to opt-out
of or withdraw from the Plan at any time by giving written notice to the Plan Agent, or by telephone at (866) 340-1104, in accordance with such reasonable requirements as the Plan Agent and the Fund may agree upon. If
you withdraw or the Plan is terminated, you will receive a certificate for each whole share in your account under the Plan, and you will receive a cash payment for any fraction of a share in your account. If you wish,
the Plan Agent will sell your shares and send you the proceeds, minus brokerage commissions.
The Plan Agent maintains
all Common Shareholders’ accounts in the Plan and gives written confirmation of all transactions in the accounts, including information you may need for tax records. Common Shares in your account will be held by
the Plan Agent in non-certificated form. The Plan Agent will forward to each participant any proxy solicitation material and will vote any shares so held only in accordance with proxies returned to the Fund. Any proxy
you receive will include all Common Shares you have received under the Plan.
There is no brokerage
charge for reinvestment of your dividends or distributions in Common Shares. However, all participants will pay a pro rata share of brokerage commissions incurred by the Plan Agent when it makes open market
purchases.
Automatically reinvesting
dividends and distributions does not mean that you do not have to pay income taxes due upon receiving dividends and distributions. Capital gains and income are realized although cash is not received by you. Consult
your financial advisor for more information.
If you hold your Common
Shares with a brokerage firm that does not participate in the Plan, you will not be able to participate in the Plan and any dividend reinvestment may be effected on different terms than those described above.
The Fund reserves the
right to amend or terminate the Plan if in the judgment of the Board of Trustees the change is warranted. There is no direct service charge to participants in the Plan; however, the Fund reserves the right to amend
the Plan to include a service charge payable by the participants. Additional information about the Plan may be obtained by writing BNY Mellon Investment Servicing (US) Inc., 301 Bellevue Parkway, Wilmington, Delaware
19809.
Proxy Voting Policies
and Procedures
A description of the
policies and procedures that the Fund uses to determine how to vote proxies and information on how the Fund voted proxies relating to portfolio investments during the most recent 12-month period ended June 30 is
available (1) without charge, upon request, by calling (800) 988-5891; (2) on the Fund’s website at www.ftportfolios.com; and (3) on the Securities and Exchange Commission’s (“SEC”) website at www.sec.gov.
Portfolio Holdings
The Fund files portfolio
holdings information for each month in a fiscal quarter within 60 days after the end of the relevant fiscal quarter on Form N-PORT. Portfolio holdings information for the third month of each fiscal quarter will be
publicly available on the
Additional Information (Continued)
First Trust Mortgage
Income Fund (FMY)
April 30, 2021
(Unaudited)
SEC’s website at www.sec.gov. The Fund’s complete schedule of portfolio holdings for the second and fourth quarters of each fiscal year is included in the semi-annual and
annual reports to shareholders, respectively, and is filed with the SEC on Form N-CSR. The semi-annual and annual report for the Fund is available to investors within 60 days after the period to which it relates. The
Fund’s Forms N-PORT and Forms N-CSR are available on the SEC’s website listed above.
NYSE Certification
Information
In accordance with
Section 303A-12 of the New York Stock Exchange (“NYSE”) Listed Company Manual, the Fund’s President has certified to the NYSE that, as of April 28, 2021, he was not aware of any violation by the Fund
of NYSE corporate governance listing standards. In addition, the Fund’s reports to the SEC on Form N-CSR contain certifications by the Fund’s principal executive officer and principal financial officer
that relate to the Fund’s public disclosure in such reports and are required by Rule 30a-2 under the 1940 Act.
Submission of Matters to
a Vote of Shareholders
The Fund held its Annual
Meeting of Shareholders (the “Annual Meeting”) on April 26, 2021. At the Annual Meeting, Richard E. Erickson and Thomas R. Kadlec were elected by the Common Shareholders of First Trust Mortgage Income Fund
as the Class II Trustees for a three-year term expiring at the Fund’s annual meeting of shareholders in 2024. The number of votes cast in favor of Mr. Erickson was 2,112,383 and the number of votes withheld was
289,605. The number of votes cast in favor of Mr. Kadlec was 2,110,797 and the number of votes withheld was 291,191. James A. Bowen, Niel B. Nielson, and Robert F. Keith are the other current and continuing
Trustees.
Principal Risks
The Fund is a closed-end
management investment company designed primarily as a long-term investment and not as a trading vehicle. The Fund is not intended to be a complete investment program and, due to the uncertainty inherent in all
investments, there can be no assurance that the Fund will achieve its investment objectives. The following discussion summarizes the principal risks associated with investing in the Fund, which includes the risk that
you could lose some or all of your investment in the Fund. The Fund is subject to the informational requirements of the Securities Exchange Act of 1934 and the Investment Company Act of 1940 and, in accordance
therewith, files reports, proxy statements and other information that is available for review.
Collateralized Mortgage
Obligations Risks. A risk of CMOs is the uncertainty of the timing of cash flows that results from the rate of prepayments on the underlying mortgages serving as collateral and from the structure of the
particular CMO transaction (that is, the priority of the individual tranches). An increase or decrease in prepayment rates (resulting from a decrease or increase in mortgage interest rates) may cause the CMOs to be
retired substantially earlier than their stated maturities or final distribution dates and will affect the yield and price of CMOs. In addition, if the collateral securing CMOs or any third-party guarantees are
insufficient to make payments, the Fund could sustain a loss.
Credit Agency Risk. Credit ratings are determined by credit rating agencies and are only the opinions of such entities. Ratings assigned by a rating agency are not absolute standards of credit quality and do
not evaluate market risk or the liquidity of securities. Any shortcomings or inefficiencies in credit rating agencies’ processes for determining credit ratings may adversely affect the credit ratings of
securities held by the Fund and, as a result, may adversely affect those securities’ perceived or actual credit risk.
Credit and Below-Investment
Grade Securities Risk. Credit risk is the risk that the issuer of one or more securities in the Fund’s portfolio will fail to pay dividends or interest or repay principal when due. Below-investment grade
instruments, including instruments that are not rated but judged to be of comparable quality, are commonly referred to as high-yield securities or “junk” bonds and are considered speculative with respect
to the issuer’s capacity to pay dividends or interest and repay principal and are susceptible to default or decline in market value due to adverse economic and business developments. High-yield securities are
often unsecured and subordinated to other creditors of the issuer. The market values for high-yield securities tend to be very volatile, and these securities are generally less liquid than investment grade securities.
For these reasons, an investment in the Fund is subject to the following specific risks: (i) increased price sensitivity to changing interest rates and to a deteriorating economic environment; (ii) greater risk of
loss due to default or declining credit quality; (iii) adverse company specific events more likely to render the issuer unable to make dividend, interest and/or principal payments; (iv) negative perception of the
high-yield market which may depress the price and liquidity of high-yield securities; (v) volatility; and (vi) liquidity.
Cyber Security Risk. The Fund is susceptible to potential operational risks through breaches in cyber security. A breach in cyber security refers to both intentional and unintentional events that may cause the
Fund to lose proprietary information, suffer data corruption or lose operational capacity. Such events could cause the Fund to incur regulatory penalties, reputational damage, additional compliance costs associated
with corrective measures and/or financial loss. Cyber security breaches may involve
Additional Information (Continued)
First Trust Mortgage
Income Fund (FMY)
April 30, 2021
(Unaudited)
unauthorized access to the Fund’s
digital information systems through “hacking” or malicious software coding, but may also result from outside attacks such as denial-of-service attacks through efforts to make network services unavailable
to intended users. In addition, cyber security breaches of the Fund’s third-party service providers, such as its administrator, transfer agent, custodian, or sub-advisor, as applicable, or issuers in which the
Fund invests, can also subject the Fund to many of the same risks associated with direct cyber security breaches. The Fund has established risk management systems designed to reduce the risks associated with cyber
security. However, there is no guarantee that such efforts will succeed, especially because the Fund does not directly control the cyber security systems of issuers or third party service providers.
Extension Risk. Extension risk is the risk that, when interest rates rise, certain obligations will be paid off by the issuer (or other obligated party) more slowly than anticipated, causing the value of
these debt securities to fall. Rising interest rates tend to extend the duration of debt securities, making their market value more sensitive to changes in interest rates. The value of longer-term debt securities
generally changes more in response to changes in interest rates than shorter-term debt securities. As a result, in a period of rising interest rates, securities may exhibit additional volatility and may lose
value.
Fixed-Income Securities
Risk. An investment in fixed-income securities is subject to certain risks, including:
| •
| Issuer Risk. The value of fixed-income securities may decline for a number of reasons which directly relate to the issuer, such as management performance, leverage and reduced demand for the
issuer’s goods and services. In addition, an issuer of fixed-income securities may default on its obligation to pay interest and repay principal.
|
| •
| Prepayment Risk. During periods of declining interest rates, the issuer of a security may exercise its option to prepay principal earlier than scheduled, forcing the Fund to reinvest the proceeds from such
prepayment in lower yielding securities, which may result in a decline in the Fund’s income and distributions to common shareholders.
|
| •
| Reinvestment Risk. Reinvestment risk is the risk that income from the Fund’s portfolio will decline if the Fund invests the proceeds from matured, traded or called securities or loans at market interest
rates that are below the Fund portfolio’s current earnings rate.
|
Futures Contracts
Risk. The primary risks associated with the use of futures contracts are (a) the imperfect correlation between the change in market value of the instruments or indices underlying the futures
contracts and the price of the futures contracts; (b) possible lack of a liquid secondary market for a futures contract and the resulting inability to close a futures contract when desired; (c) losses caused by
unanticipated market movements, which are potentially unlimited; (d) the investment adviser’s inability to predict correctly the direction of securities prices, interest rates, currency exchange rates and other
economic factors; and (e) the possibility that the counterparty will default in the performance of its obligations.
Illiquid and Restricted
Securities Risk. Investments in restricted securities could have the effect of increasing the amount of the Fund’s assets invested in illiquid securities if qualified institutional buyers are
unwilling to purchase these securities. Illiquid and restricted securities may be difficult to dispose of at a fair price at the times when the Fund believes it is desirable to do so. The market price of illiquid and
restricted securities generally is more volatile than that of more liquid securities, which may adversely affect the price that the Fund pays for or recovers upon the sale of such securities. Illiquid and restricted
securities are also more difficult to value, especially in challenging markets.
Inflation Risk. Inflation risk is the risk that the value of assets or income from investments will be worth less in the future as inflation decreases the value of money.
Interest Rate and Duration
Risk. Interest rate risk is the risk that securities will decline in value because of changes in market interest rates. For fixed income securities, when market interest rates rise, the market
value of such securities generally will fall. During periods of rising interest rates, the average life of certain types of securities may be extended because of slower than expected prepayments. This may lock in a
below-market yield, increase the security’s duration and further reduce the value of the security. Fixed income securities with longer durations tend to be more sensitive to changes in interest rates, usually
making them more volatile than securities with shorter durations. Investments in fixed rate securities with long-term maturities may experience significant price declines if long-term interest rates
increase.
The interest rates
payable on floating rate securities are not fixed and may fluctuate based upon changes in market rates. As short-term interest rates decline, interest payable on floating rate securities typically decreases.
Alternatively, during periods of rising interest rates, interest payable on floating rate securities typically increases. Changes in interest rates on floating rate securities may lag behind changes in market rates or
may have limits on the maximum increases in interest rates. The value of floating rate securities may decline if their interest rates do not rise as much, or as quickly, as interest rates in general.
Many financial
instruments use or may use a floating rate based upon the London Interbank Offered Rate (“LIBOR”). The United Kingdom’s Financial Conduct Authority, which regulates LIBOR, intends to cease making
LIBOR available as a reference rate over a phase-out period that is currently expected to begin after the end of 2021. The unavailability or replacement of LIBOR may affect the
Additional Information (Continued)
First Trust Mortgage
Income Fund (FMY)
April 30, 2021
(Unaudited)
value, liquidity or return on certain
Fund investments and may result in costs incurred in connection with closing out positions and entering into new trades. Any potential effects of the transition away from LIBOR on the Fund or on certain instruments in
which the Fund invests can be difficult to ascertain, and they may vary depending on a variety of factors. Any such effects on the transition away from LIBOR, as well as other unforeseen effects, could result in
losses to the Fund.
In general, income on
inverse floating rate securities will decrease when interest rates increase and increase when interest rates decrease. Inverse floating rate securities generally will underperform the market for fixed rate securities
in a rising interest rate environment. An inverse floating rate security’s price may be more volatile than that of a fixed rate security.
In the case of stripped
mortgage-backed securities, in general, when interest rates are falling and prepayment rates are increasing, the value of a principal only security (“PO Security”) will rise and the value of an interest
only security (“IO Security”) will fall. Conversely, when interest rates are rising and prepayment rates are decreasing, in general, the value of a PO Security will fall and the value of an IO Security
will rise.
Leverage Risk. The use of leverage by the Fund can magnify the effect of any losses. If the income and gains from the securities and investments purchased with leverage proceeds do not cover the cost of
leverage, the return to the common shares will be less than if leverage had not been used. Leverage involves risks and special considerations for common shareholders including: the likelihood of greater volatility of
net asset value and market price of the common shares than a comparable portfolio without leverage; the risk that fluctuations in interest rates on borrowings will reduce the return to the common shareholders or will
result in fluctuations in the dividends paid on the common shares; in a declining market, the use of leverage is likely to cause a greater decline in the net asset value of the common shares than if the Fund were not
leveraged, which may result in a greater decline in the market price of the common shares; and when the Fund uses certain types of leverage, the investment advisory fee payable to the Advisor and by the Advisor to the
Sub-Advisor will be higher than if the Fund did not use leverage.
Management Risk and
Reliance on Key Personnel. The implementation of the Fund’s investment strategy depends upon the continued contributions of certain key employees of the Advisor, some of whom have unique talents and experience
and would be difficult to replace. The loss or interruption of the services of a key member of the portfolio management team could have a negative impact on the Fund.
Market Discount from Net
Asset Value. Shares of closed-end investment companies such as the Fund frequently trade at a discount from their net asset value. The Fund cannot predict whether its common shares will trade at, below
or above net asset value.
Market Risk. Securities held by the Fund, as well as shares of the Fund itself, are subject to market fluctuations caused by factors such as general economic conditions, political events, regulatory or
market developments, changes in interest rates and perceived trends in securities prices. Shares of the Fund could decline in value or underperform other investments as a result of the risk of loss associated with
these market fluctuations. In addition, local, regional or global events such as war, acts of terrorism, spread of infectious diseases or other public health issues, recessions, or other events could have a
significant negative impact on the Fund and its investments. Such events may affect certain geographic regions, countries, sectors and industries more significantly than others. The outbreak of the respiratory disease
designated as COVID-19 in December 2019 has caused significant volatility and declines in global financial markets, which have caused losses for investors. The COVID-19 pandemic may last for an extended period of time
and will continue to impact the economy for the foreseeable future.
Mortgage-Backed Securities
Risk. A mortgage-backed security may be negatively affected by the quality of the mortgages underlying such security and the structure of its issuer. For example, if a mortgage underlying a
particular mortgage-backed security defaults, the value of that security may decrease. Moreover, a downturn in the markets for residential or commercial real estate or a general economic downturn could negatively
affect both the price and liquidity of privately issued mortgage-backed securities. Mortgage-backed securities are subject to prepayment risk, which is the risk that the borrowers under the mortgage loans underlying a
Fund’s mortgage-backed securities might pay off their mortgage loans sooner than expected, which could happen when interest rates fall or for other reasons, which could cause the value of the Fund’s
mortgage-backed securities to fall. Moreover, if the underlying mortgage loans are paid off sooner than expected, the Fund may have to reinvest the proceeds in other securities that have lower yields. Mortgage-backed
securities are also subject to extension risk, which is the risk that rising interest rates could cause mortgages underlying the securities to be prepaid more slowly than expected, resulting in slower prepayments of
the securities. This would, in effect, convert a short or medium-duration mortgage-backed security into a longer-duration security, increasing its sensitivity to interest rate changes and likely causing its price to
decline. Mortgage-backed securities issued by a private issuer, such as commercial mortgage-backed securities, generally entail greater risk than obligations directly or indirectly guaranteed by the U.S. government or
a government-sponsored entity.
A portion of the
Fund’s managed assets may be invested in subordinated classes of mortgage-backed securities. Such subordinated classes are subject to a greater degree of non-payment risk than are senior classes of the same
issuer or agency. In addition, under
Additional Information (Continued)
First Trust Mortgage
Income Fund (FMY)
April 30, 2021
(Unaudited)
certain market conditions, the market
for subordinated classes of mortgage-backed securities may not be as liquid as the market for other fixed income securities.
Given its focus in
mortgage-backed securities, the Fund may be more susceptible to adverse economic, political and regulatory events that affect the value of real estate.
Non-Agency Securities
Risk. Investments in asset-backed or mortgage-backed securities offered by non-governmental issuers, such as commercial banks, savings and loans, private mortgage insurance companies, mortgage
bankers and other secondary market issuers are subject to additional risks. There are no direct or indirect government or agency guarantees of payments in loan pools created by non-government issuers. Securities
issued by private issuers are subject to the credit risks of the issuers. An unexpectedly high rate of defaults on the loan pool may adversely affect the value of a non-agency security and could result in losses to
the Fund. The risk of such defaults is generally higher in the case of pools that include subprime loans. Non-agency securities are typically traded “over-the-counter” rather than on a securities exchange
and there may be a limited market for the securities, especially when there is a perceived weakness in the mortgage and real estate market sectors. Without an active trading market, the non-agency mortgage-related
securities held by the Fund may be particularly difficult to value because of the complexities involved in assessing the value of the underlying loans.
Potential Conflicts of
Interest Risk. First Trust and the portfolio managers have interests which may conflict with the interests of the Fund. In particular, First Trust currently manages and may in the future manage and/or
advise other investment funds or accounts with the same or substantially similar investment objectives and strategies as the Fund. In addition, while the Fund is using leverage, the amount of the fees paid to First
Trust for investment advisory and management services are higher than if the Fund did not use leverage because the fees paid are calculated based on managed assets. Therefore, First Trust has a financial incentive to
leverage the Fund.
Repurchase Agreement
Risk. A repurchase agreement is an agreement to purchase a security from a party at one price and a simultaneous agreement to sell it back to the original party at an agreed-upon price,
typically representing the purchase price plus interest. Repurchase agreements are subject to the risk of failure. If the Fund’s counterparty defaults on its obligations and the Fund is delayed or prevented from
recovering the collateral, or if the value of the collateral is insufficient, the Fund may realize a loss.
Short Selling Risk. If a security sold short increases in price, the Fund may have to cover its short position at a higher price than the short sale price, resulting in a loss. Because losses on short sales
arise from increases in the value of the security sold short, such losses are theoretically unlimited. It is possible that the Fund’s long securities positions will decline in value at the same time that the
value of its short securities positions increase, thereby increasing potential losses to the Fund. In addition, the Fund’s short selling strategies will limit its ability to fully benefit from increases in the
fixed-income markets. The Fund may not be able to borrow a security that it needs to deliver or it may not be able to close out a short position at an acceptable price and may have to sell related long positions
before it had intended to do so. Thus, the Fund may not be able to successfully implement its short sale strategy due to limited availability of desired securities or for other reasons. Also, there is the risk that
the counterparty to a short sale may fail to honor its contractual terms, causing a loss to the Fund.
TBA Transactions
Risk. The Fund may purchase securities via TBA (To Be Announced) Transactions. In such a transaction, the purchase price of the securities is typically fixed at the time of the commitment, but
delivery and payment can take place a month or more after the date of the commitment. At the time of delivery of the securities, the value may be more or less than the purchase or sale price. Purchasing securities in
a TBA Transaction may give rise to investment leverage and may increase the Fund’s volatility. Default by, or bankruptcy of, a counterparty to a TBA Transaction would expose the Fund to possible losses because
of an adverse market action, expenses or delays in connection with the purchase or sale of the pools specified in such transaction.
Valuation Risk. The valuation of mortgage-backed securities may carry more risk than that of common stock. Uncertainties in the conditions of the financial markets, unreliable reference data, lack of
transparency and inconsistency of valuation models and processes may lead to inaccurate asset pricing. The Fund may hold investments in sizes smaller than institutionally‐sized round lot positions (sometimes
referred to as odd lots). However, third‐party pricing services generally provide evaluations on the basis of institutionally‐sized round lots. If the Fund sells certain of its investments in an odd lot
transaction, the sale price may be less than the value at which such securities have been held by the Fund. Odd lots often trade at lower prices than institutional round lots.
This page intentionally left blank
INVESTMENT ADVISOR
First Trust Advisors L.P.
120 East Liberty Drive, Suite
400
Wheaton, IL 60187
ADMINISTRATOR,
FUND ACCOUNTANT,
AND CUSTODIAN
The Bank of New York Mellon
240 Greenwich Street
New York, NY 10286
TRANSFER AGENT
BNY Mellon Investment Servicing
(US) Inc.
301 Bellevue Parkway
Wilmington, DE 19809
INDEPENDENT REGISTERED
PUBLIC ACCOUNTING FIRM
Deloitte & Touche LLP
111 S. Wacker Drive
Chicago, IL 60606
LEGAL COUNSEL
Chapman and Cutler LLP
111 W. Monroe Street
Chicago, IL 60603
Item 2. Code of Ethics.
Not applicable.
Item 3. Audit Committee Financial Expert.
Not applicable.
Item 4. Principal Accountant Fees and Services.
Not applicable.
Item 5. Audit Committee of Listed registrants.
Not applicable.
Item 6. Investments.
| (a) | | Schedule of Investments in securities of unaffiliated issuers
as of the close of the reporting period is included as part of the report to shareholders filed under Item 1 of this form. |
Item 7. Disclosure of Proxy Voting
Policies and Procedures for Closed-End Management Investment Companies.
Not applicable.
Item 8. Portfolio Managers of Closed-End Management Investment
Companies.
| (b) | | There has been no change, as of the date of this filing, in any of the portfolios managers
identified in response to paragraph (a)(1) of this Item in the Registrant’s most recently filed annual report on Form N-CSR. |
Item 9. Purchases of Equity Securities
by Closed-End Management Investment Company and Affiliated Purchasers.
Not applicable.
Item 10. Submission of Matters to a Vote of Security Holders.
There have been no material changes to the
procedures by which the shareholders may recommend nominees to the registrant’s board of directors, where those changes were implemented
after the registrant last provided disclosure in response to the requirements of Item 407(c)(2)(iv) of Regulation S-K (17 CFR 229.407)
(as required by Item 22(b)(15) of Schedule 14A (17 CFR 240.14a-101)), or this Item.
Item 11. Controls and Procedures.
| (a) | | The registrant’s principal executive and principal financial officers, or persons performing
similar functions, have concluded that the registrant’s disclosure controls and procedures (as defined in Rule 30a-3(c) under the
Investment Company Act of 1940, as amended (the “1940 Act”) (17 CFR 270.30a-3(c))) are effective, as of a date within 90
days of the filing date of the report that includes the disclosure required by this paragraph, based on their evaluation of these controls
and procedures required by Rule 30a-3(b) under the 1940 Act (17 CFR 270.30a-3(b)) and Rules 13a-15(b) or 15d-15(b) under the Securities
Exchange Act of 1934, as amended (17 CFR 240.13a-15(b) or 240.15d-15(b)). |
| (b) | | There were no changes in the registrant’s internal control over financial reporting
(as defined in Rule 30a-3(d) under the 1940 Act (17 CFR 270.30a-3(d)) that occurred during the period covered by this report that has
materially affected, or is reasonably likely to materially affect, the registrant’s internal control over financial reporting. |
Item 12. Disclosure of Securities Lending Activities For Closed-End
Management Investment Companies.
Item 13. Exhibits.
| (a)(2) | | Certifications pursuant to Rule 30a-2(a) under the 1940 Act and Section 302 of the Sarbanes-Oxley
Act of 2002 are attached hereto. |
| (b) | | Certifications pursuant to Rule 30a-2(b) under the 1940 Act and Section 906 of the Sarbanes- Oxley
Act of 2002 are attached hereto. |
SIGNATURES
Pursuant to the requirements of the Securities Exchange
Act of 1934 and the Investment Company Act of 1940, the registrant has duly caused this report to be signed on its behalf by the undersigned,
thereunto duly authorized.
| (registrant) |
|
First Trust Mortgage Income Fund |
| By (Signature and Title)* |
|
/s/ James M. Dykas |
| |
|
James M. Dykas, President and Chief Executive Officer
(principal executive
officer)
|
Pursuant
to the requirements of the Securities Exchange Act of 1934 and the Investment Company Act of 1940, this report has been signed
below by the following persons on behalf of the registrant and in the capacities and on the dates indicated.
| By (Signature and Title)* |
|
/s/ James M. Dykas |
| |
|
James M. Dykas, President and Chief Executive Officer
(principal executive
officer)
|
| By (Signature and Title)* |
|
/s/ Donald P. Swade |
| |
|
Donald P. Swade, Treasurer, Chief Financial Officer
and Chief Accounting Officer
(principal financial officer)
|
* Print the name and title of each signing officer under
his or her signature.