| Label |
Element |
Value |
| Risk Return Abstract |
rr_RiskReturnAbstract |
|
|
| Document Type |
dei_DocumentType |
485BPOS
|
|
| Document Period End Date |
dei_DocumentPeriodEndDate |
Apr. 30, 2017
|
|
| Registrant Name |
dei_EntityRegistrantName |
360 Funds
|
|
| Central Index Key |
dei_EntityCentralIndexKey |
0001319067
|
|
| Amendment Flag |
dei_AmendmentFlag |
false
|
|
| Document Creation Date |
dei_DocumentCreationDate |
Oct. 13, 2017
|
|
| Document Effective Date |
dei_DocumentEffectiveDate |
Oct. 13, 2017
|
|
| Prospectus Date |
rr_ProspectusDate |
Oct. 13, 2017
|
|
| EAS Crow Point Alternatives Fund |
|
|
|
| Risk Return Abstract |
rr_RiskReturnAbstract |
|
|
| Risk/Return [Heading] |
rr_RiskReturnHeading |
SUMMARY
|
|
| Objective, Primary [Text Block] |
rr_ObjectivePrimaryTextBlock |
Investment Objective. The investment
objective of the EAS Crow Point Alternatives Fund (the "Fund") is preservation and growth of capital.
|
|
| Expense Narrative [Text Block] |
rr_ExpenseNarrativeTextBlock |
Fees and Expenses of the Fund. This
table describes the fees and expenses that you may pay if you buy and hold shares of the Fund. You may qualify for sales charge
discounts if you and your family invest, or agree to invest in the future, at least $50,000 in the Fund. More information about
these and other discounts is available from your financial professional and in the section captioned "Purchasing Shares"
on page 22 of the Fund's prospectus and the section captioned "Purchases" beginning on page 38 of the Fund's statement
of additional information.
|
|
| Shareholder Fees Caption [Text] |
rr_ShareholderFeesCaption |
Shareholder Fees (fees paid directly from your investment)
|
|
| Operating Expenses Caption [Text] |
rr_OperatingExpensesCaption |
Annual Fund Operating Expenses (expenses
that you pay each year as a percentage of the value of your investment)
|
|
| Fee Waiver or Reimbursement over Assets, Date of Termination |
rr_FeeWaiverOrReimbursementOverAssetsDateOfTermination |
August 31, 2019
|
|
| Portfolio Turnover [Text Block] |
rr_PortfolioTurnoverTextBlock |
Portfolio Turnover. The Fund pays transaction
costs, such as commissions, when it buys and sells securities (or "turns over" its portfolio). A higher portfolio turnover
rate may indicate higher transaction costs and may result in higher taxes when Fund shares are held in a taxable account. These
costs, which are not reflected in annual fund operating expenses or in the example, affect the Fund's performance. For the fiscal
year ended April 30, 2017, the Fund's portfolio turnover rate was 138% of the average value of its portfolio.
|
|
| Portfolio Turnover, Rate |
rr_PortfolioTurnoverRate |
138.00%
|
|
| Expense Breakpoint Discounts [Text] |
rr_ExpenseBreakpointDiscounts |
You may qualify for sales charge discounts if you and your family invest, or agree to invest in the future, at least $50,000 in the Fund.
|
|
| Expense Breakpoint, Minimum Investment Required [Amount] |
rr_ExpenseBreakpointMinimumInvestmentRequiredAmount |
$ 50,000
|
|
| Other Expenses, New Fund, Based on Estimates [Text] |
rr_OtherExpensesNewFundBasedOnEstimates |
Estimated for the Fund’s first fiscal year of operations following the reorganization, as described below.
|
|
| Expenses Restated to Reflect Current [Text] |
rr_ExpensesRestatedToReflectCurrent |
The expenses have been restated based on contractual arrangements with the Fund’s current service providers.
|
|
| Expenses Not Correlated to Ratio Due to Acquired Fund Fees [Text] |
rr_ExpensesNotCorrelatedToRatioDueToAcquiredFundFees |
Total Annual Fund Operating Expenses do not correlate to the ratio of expenses to average net assets provided in the Financial Highlights.
|
|
| Expense Example Narrative [Text Block] |
rr_ExpenseExampleNarrativeTextBlock |
Example. This Example is intended to
help you compare the cost of investing in the Fund with the cost of investing in other mutual funds.
This Example assumes that you invest $10,000
in the Fund for the time periods indicated and then redeem all of your shares at the end of those periods. This Example also assumes
that your investment has a 5% return each year and the Fund's operating expenses remain the same, and the contractual agreement
to limit expenses remains in effect only until August 31, 2019. The Contingent Deferred Sales Charge (the "CDSC") is
not included in these calculations for Class A Shares. If the CDSC were included, your costs would be higher. See "CDSC for
Certain Purchases of Class A Shares" below. Although your actual costs may be higher or lower, based on these assumptions
your cost would be:
|
|
| Strategy Narrative [Text Block] |
rr_StrategyNarrativeTextBlock |
Principal Investment Strategy of the Fund.
The Adviser's investment philosophy centers on the preservation and growth of capital through both good and bad markets. The Adviser
believes that for most shareholders, investment success is about growing capital over time while protecting it at all times, not
about beating a market index which can frequently involve losses while still meeting the objective. Thus, the Adviser follows an
absolute return approach in managing the Fund, as defined below. In executing its strategy, the Adviser attempts to generate consistent,
positive returns regardless of market conditions by allocating the Fund's investments among multiple alternative investment styles.
Alternative investment styles generally exhibit low volatility and relatively low long-term market correlation.
"Low correlation" refers to the extent
to which the performance of an investment moves in synch with the broader equity and bond markets. The goal of the Adviser in managing
the Fund's assets is to construct a portfolio of assets that exhibit low correlation with and downside capture of the stock market.
A correlation measure of 1 demonstrates perfect positive correlation; a correlation measure of 0 demonstrates no correlation and
a correlation measure of -1 demonstrates a perfect negative correlation.
Many mutual funds are managed according to
a "relative return" approach (i.e., – they aim to perform better than their mutual fund category, their mutual
fund peers or the general market as a whole). By contrast, "absolute return" refers to the strategy of seeking positive
investment performance regardless of overall or broader market performance. Absolute return strategies, which the Adviser believes
will be less volatile, differ from relative return because they are concerned with the return of a particular investment and do
not compare it to any other measure or benchmark.
The Fund pursues its absolute return objective
by tactically allocating its capital among multiple potential alternative investment classes, including investments in private
funds. The Fund may, generally, pursue investments among the following alternative investment classes or strategies: Long-Short
Equity, Long-Short Credit, Asset Backed Securities, Arbitrage, Commodities, Convertibles, Floating Rate Debt, Currencies, Emerging
Market Bonds, Emerging Market Equities, High Yield, Managed Futures, and Real Estate (primarily through real estate investment
trusts ("REITs")).
A general overview of the Fund's investment
classes is illustrated below. Allocations among the various investment classes or strategies will vary:
| Long/Short Global Equity |
Long/Short Credit |
|
Cash |
| |
Arbitrage |
| |
Commodities |
| |
Currencies |
| |
Convertibles |
| |
Asset Backed Securities |
| |
Emerging Markets |
| |
Managed Futures |
| |
Real Estate |
The Fund may invest directly or through other
mutual funds, exchange traded funds ("ETFs"), closed-end funds and private funds, including hedge funds ("Underlying
Funds") across these alternative investment classes. Investments in private funds, including hedge funds, will be limited
to no more than 15% of the Fund's net assets. An ETF is an investment company that typically seeks to track the performance of
an index by holding in its portfolio either the contents of the index or a representative sample of the securities in the index.
The Adviser may invest a portion of the Fund's assets in other mutual funds that are also advised by the Adviser. The Adviser will
adjust the asset allocation among each alternative investment class based on its assessment of market conditions and investment
opportunities. Depending on market conditions, the core of the Fund's investments will ordinarily be in long-short equity and long-short
credit strategies managed by the Adviser. The Adviser also expects to utilize other alternative asset classes to round out portfolio
allocations, some of which may also be managed by the Adviser, others may be managed by a Sub-adviser. Whether these asset classes
are managed by the Adviser or not, they will generally show lower correlations to broader market indicies to seek to reduce the
Fund's volatility compared to the markets in general.
To assist in assessing the attractiveness of
each of the alternative asset classes, the Adviser utilizes a proprietary quantitative model that analyzes various technical characteristics
of each class and provides a risk score on the investment prospects of each. Specifically, the quantitative model examines certain
data to forecast which investment securities, asset classes, or strategies are likely to underperform or outperform cash. The Adviser
may allocate to cash or cash equivalents during periods of market duress. The Adviser does not employ market timing, but rather
a disciplined, repeatable process with a focus on low volatility, downside protection and portfolio consistency. The Adviser believes
the application of a disciplined, quantitative approach to portfolio management and asset allocation helps the Adviser's execution
in its goal of generating positive absolute returns over time.
The Fund is designed to exhibit low volatility,
low correlation and low downside capture to the broad markets and to provide an effective absolute return alternative to long-only
equity strategies and traditional fixed-income strategies. "Broad markets" refer generally to the commonly recognized
securities exchanges and the indices that track the performance of those exchanges. Indices commonly used to track these markets
include the Standard & Poor's 500 Index and the Barclays Capital Aggregate Bond Index, respectively. As the Fund pursues a
multi-strategy approach and utilizes a blend of alternative investment styles, the HFRI Fund-of-Funds Conservative Index is the
most relevant index to which the Fund should be benchmarked.
The Fund may invest in securities directly,
or through other investment companies, including alternative (a.k.a. "hedged") mutual funds, ETFs, closed end funds and
private funds. "Hedged mutual funds" are those mutual funds that employ a non-traditional investment style sometimes
found in the hedge fund investment world. For example, they may use a limited amount of leverage, sell securities short, use derivatives
and hold cash positions as they deem appropriate to adjust to market cycles. The Fund may utilize derivatives such as equity and
index options in order to selectively hedge individual stock exposure. Given the broader investment flexibility, hedged mutual
funds can adjust their net long or short equity exposure much more liberally than traditional "long-only" mutual funds.
The Hedged mutual funds may pursue a variety of specific investment styles or "hedge fund-like strategies" that fall
under the aforementioned alternative investment classes.
By combining multiple alternative asset classes
in the Fund, the Adviser pursues a diversified investment program designed with the goal of delivering low market volatility, low
market beta and relatively low market correlation. The Fund aims to isolate and extract the key benefits that may be found, but
not necessarily exclusively, in hedge fund investing (absolute return, low volatility, low – modest beta, relatively low
market correlation, investment flexibility, hedging capability, etc.) by selectively incorporating individual securities or investments,
mutual funds, ETFs, closed-end funds and private funds into a mutual fund investment vehicle.
Investment Process: In its portfolio construction
process, the Adviser utilizes a rules-based, disciplined investment approach that begins with a quantitative evaluation of individual
securities and selected alternative investment classes. Using the same quantitative approach, the Adviser then utilizes its proprietary
quantitative investment tools to construct an expected return forecast for securities and asset classes.
By employing a combined quantitative and qualitative
process, the Adviser applies a tactical, integrated approach in the investment process for the Fund. This covers all stages of
portfolio construction, including forming strategic allocation, identifying new potential investments within the allocation parameters
and determining whether such investments meet the Adviser's standards and requirements set forth in its selection process.
The Fund's market capitalization target range
for global equities is $250 million to $300 billion. The Fund's investments in fixed income securities are not limited by maturity
or credit quality.
The desired result is a disciplined, repeatable
investment process that aims for effective market navigation, portfolio consistency and return stability, as illustrated in the
following chart.
| > |
Monitor Asset Classes and Assess Risk Levels |
> |
Rebalance/Adjust Macro Allocations |
> |
Conduct Rigorous Bottom-Up Analysis and Investment Selection |
> |
|
|
| Risk Narrative [Text Block] |
rr_RiskNarrativeTextBlock |
Principal Risks of Investing in the Fund.
An investment in the Fund is subject to investment risks, including the possible loss of some or all of the principal amount invested.
There can be no assurance that the Fund will be successful in meeting its investment objective.
The following describes the risks the Fund
bears directly or indirectly through investments in Underlying Funds.
| • | Commodity Risk – Investing in the commodities markets may subject the Fund to greater
volatility than investments in traditional securities. Commodity prices may be influenced by unfavorable weather, animal and plant
disease, geologic and environmental factors as well as changes in government regulation such as tariffs, embargoes or burdensome
production rules and restrictions. |
| • | Credit Risk – Issuers of fixed-income securities may default on interest and principal
payments due to Underlying Funds. Generally, securities with lower debt ratings have speculative characteristics and carry greater
risk that the issuer may default on its obligation. Changes in economic conditions or other circumstances are more likely to lead
to a weakened capacity of those issuers to make principal or interest payments, as compared to issuers of more highly rated securities. |
| • | Currencies Risk – Currency trading risks include market risk, credit risk and country
risk. Market risk results from adverse changes in exchange rates in the currencies the Fund is long or short. Credit risk results
because a currency-trade counterparty may default. Country risk arises because a government may interfere with transactions in
its currency. |
| • | Derivatives Risk – Derivatives strategies such as managed futures strategies involve
leverage risk and tracking risk. The Fund may utilize equity and index options to hedge individual stock exposure. Options are
a type of derivative instrument. The value of may rise or fall more rapidly than other investments. For some derivatives, it is
possible to lose more than the amount invested in the derivative. If the Fund uses derivatives to "hedge" the risk of
its portfolio, it is possible that the hedge may not succeed. Over the counter derivatives are also subject to counterparty risk,
which is the risk that the other party to the contract will not fulfill its contractual obligation to complete the transaction
with the Fund. Other risks of investments in derivatives include imperfect correlation between the value of these instruments and
the underlying assets; risks of default by the other party to the derivative transactions; risks that the transactions may result
in losses that offset gains in portfolio positions; and risks that the derivative transactions may not be liquid. Specific risks
that the Fund will seek to manage include the following: interest rate, liquidity, credit and market risks. By investing in options,
the Fund may be subject to the risk of counterparty default, as well as the potential for unlimited loss. Certain types of options
(such as OTC or "over the counter" options") may be considered to be illiquid investments. |
| • | Emerging Markets Risk – Countries with emerging markets have relatively unstable governments,
social and legal systems that do not protect shareholders, economies based on only a few industries, and securities markets that
trade a small number of issues. |
| • | Foreign Investment Risk – Changes in foreign economies and political climates are
more likely to affect the Fund than a mutual fund that invests exclusively in U.S. companies. The value of foreign securities is
also affected by the value of the local currency relative to the U.S. dollar. There may also be less government supervision of
foreign markets, resulting in non-uniform accounting practices and less publicly available information. The values of foreign investments
may be affected by changes in exchange control regulations, application of foreign tax laws (including withholding tax) changes
in governmental administration or economic or monetary policy (in this country or abroad) or changed circumstances in dealings
between nations. |
| • | Interest Rate Risk – In general, the price of a debt security falls when interest
rates rise. Securities with longer maturities tend to be more sensitive to interest rate changes. |
| • | Lower-Rated Securities Risk – The Fund invests in securities rated below investment-grade,
sometimes called "high-yield" or "junk" bonds that generally have more credit risk than higher-rated securities.
Companies issuing high yield fixed-income securities are not as strong financially as those issuing securities with higher credit
ratings. These companies are more likely to encounter financial difficulties and are more vulnerable to changes in the economy,
such as a recession or a sustained period of rising interest rates, which could affect their ability to make interest and principal
payments. These securities may be considered speculative and the value of these securities can be move volatile due to increased
sensitivity to adverse issuer, political, regulatory, market, or economic developments and can be difficult to resell. |
| • | Management Risk – The ability of the Fund to meet its investment objective is directly
related to the Adviser's investment model. The Adviser's assessment of the attractiveness and potential appreciation of particular
investments in which the Fund invests may prove to be incorrect and there is no guarantee that the Adviser's investment strategy
will produce the desired results. |
| • | Market Risk – The net asset value ("NAV") of the Fund will fluctuate based
on changes in the value of the securities in which that Fund invests. The price of equity and fixed income securities may rise
or fall because of economic or political changes. Stock prices in general may decline over short or even extended periods of time,
and tend to be more volatile than other investment choices. |
| • | Merger Arbitrage Risk – Investments in companies that are expected to be, or already
are, the subject of a publicly announced merger, takeover, tender offer, leveraged buyout, spin-off, liquidation or other corporate
reorganization carry the risk that the proposed or expected corporate event may not be completed or may be completed on less favorable
terms than originally expected. |
| • | Portfolio Turnover Risk – Increased portfolio turnover may result in higher brokerage
commissions, dealer mark-ups and other transaction costs, and may result in taxable capital gains. Higher costs associated with
increased portfolio turnover may offset gains in the Fund's performance. |
| • | Private Fund Risk – The Fund may invest in private investment funds, including "hedge
funds," which pursue alternative investment strategies. Certain investment instruments and techniques that a private fund
may use are speculative and involve a high degree of risk. Because of the speculative nature of a private fund's investments and
trading strategies, the Fund may suffer a significant or complete loss of its invested capital in one or more private funds. A
shareholder will also bear fees and expenses charged by the underlying funds in addition to the Fund's direct fees and expenses.
In addition, interests in a private fund may also be illiquid. |
| • | Real Estate Risk – REIT share prices may decline because of adverse developments affecting
the real estate industry and real property values. In general, real estate values can be affected by a variety of factors, including
supply and demand for properties, the economic health of the country or of different regions, and the strength of specific industries
that rent properties. |
| • | Short Position Risk – The Fund will incur a loss as a result of a short position if
the price of the short position instrument increases in value between the date of the short position sale and the date on which
an offsetting position is purchased. Short positions may be considered speculative transactions and involve special risks, including
greater reliance on the advisor's ability to accurately anticipate the future value of a security or instrument. The Fund's losses
are potentially unlimited in a short position transaction. |
| • | Small Company Risk – Investments in smaller capitalization companies may be more vulnerable
than larger, more established organizations to adverse business or economic developments. In particular, smaller capitalization
companies may have limited product lines, markets, and financial resources and may be dependent upon a relatively small management
group. |
| • | Underlying Funds Risk – Mutual Funds, ETFs, closed-end funds and private funds ("Underlying
Funds") shares may trade at a discount or a premium in market price if there is a limited market in such shares. Investments
in Underlying Funds are subject to brokerage and other trading costs, which could result in greater expenses to the Fund. Underlying
Funds and mutual funds also are subject to investment advisory fees and other expenses, which will be indirectly paid by the Fund.
As a result, your cost of investing in the Fund that invests in Underlying Funds will be higher than the cost of investing directly
in Underlying Funds and may be higher than other mutual funds that invest directly in stocks and bonds. |
|
|
| Risk Lose Money [Text] |
rr_RiskLoseMoney |
An investment in the Fund is subject to investment risks, including the possible loss of some or all of the principal amount invested.
|
|
| Performance Narrative [Text Block] |
rr_PerformanceNarrativeTextBlock |
Performance. The Fund was reorganized
on October 13, 2017 from a series of Northern Lights Fund Trust, a Delaware statutory trust (the "Predecessor Fund"),
to a series of 360 Funds, a Delaware statutory trust (the "Reorganization"). While the Fund is substantially similar
to the Predecessor Fund and theoretically would have invested in the same portfolio of securities, the Fund's performance may be
different than the performance of the Predecessor Fund due to, among other things, differences in fees and expenses.
The bar chart and performance table below show
the variability of the Predecessor Fund's returns, which is some indication of the risks of investing in the Fund. The bar chart
shows performance of the Predecessor Fund's Class I shares for each full calendar year since the Predecessor Fund's inception.
The performance table compares the performance of the Predecessor Fund's Class A, Class C and Class I shares over time to the performance
of a broad-based securities market index. You should be aware that the Predecessor Fund's past performance (before and after taxes)
may not be an indication of how the Fund will perform in the future. Updated performance information will be available at no cost
by calling (877) 244-6235.
|
|
| Performance Information Illustrates Variability of Returns [Text] |
rr_PerformanceInformationIllustratesVariabilityOfReturns |
The bar chart and performance table below show the variability of the Predecessor Fund's returns, which is some indication of the risks of investing in the Fund.
|
|
| Performance Availability Phone [Text] |
rr_PerformanceAvailabilityPhone |
(877) 244-6235
|
|
| Performance Past Does Not Indicate Future [Text] |
rr_PerformancePastDoesNotIndicateFuture |
You should be aware that the Predecessor Fund's past performance (before and after taxes) may not be an indication of how the Fund will perform in the future.
|
|
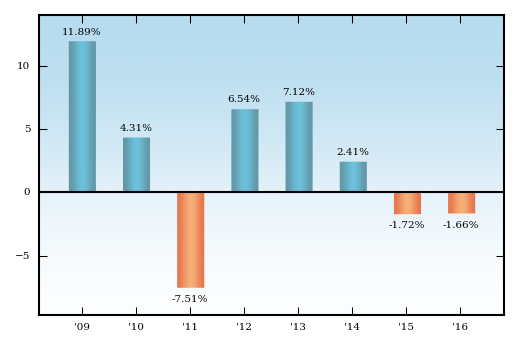
| Bar Chart [Heading] |
rr_BarChartHeading |
Performance Bar Chart For Class I Shares
Calendar Years Ended December 31
|
|
| Bar Chart Closing [Text Block] |
rr_BarChartClosingTextBlock |
| Best Quarter: |
6/30/09 |
5.72% |
| Worst Quarter: |
9/30/11 |
(9.12)% |
The total return for Class I shares for the
quarter ended June 30, 2017 was 3.23%.
|
|
| Performance Table Heading |
rr_PerformanceTableHeading |
Performance Table
Average Annual Total Returns
(For periods ended December 31, 2016)
|
|
| Performance Table Does Reflect Sales Loads |
rr_PerformanceTableDoesReflectSalesLoads |
Class A returns before taxes include maximum possible sale load.
|
|
| Performance Table Market Index Changed |
rr_PerformanceTableMarketIndexChanged |
The Fund's broad based securities market index (benchmark) has been changed to the HFRI Fund-of-Funds Conservative Index from the S&P 500® Index to better reflect the securities and strategies used by the Fund's Adviser.
|
|
| Performance Table Uses Highest Federal Rate |
rr_PerformanceTableUsesHighestFederalRate |
After-tax returns are calculated using the highest historical individual federal marginal income tax rate and do not reflect the impact of state and local taxes.
|
|
| Performance Table Not Relevant to Tax Deferred |
rr_PerformanceTableNotRelevantToTaxDeferred |
Actual after-tax returns depend on a shareholder’s tax situation and may differ from those shown. The after-tax returns are not relevant if you hold your Fund shares in tax-deferred arrangements, such as 401(k) plans or individual retirement accounts ("IRA").
|
|
| Performance Table One Class of after Tax Shown [Text] |
rr_PerformanceTableOneClassOfAfterTaxShown |
After-tax returns for Class A and Class C shares, which are not shown, will vary from those of Class I shares.
|
|
| Performance Table Footnotes |
rr_PerformanceTableFootnotesTextBlock |
* The Fund’s current adviser has managed the Fund since March 1, 2013.
|
|
| Performance Table Closing [Text Block] |
rr_PerformanceTableClosingTextBlock |
After-tax returns are calculated using the
highest historical individual federal marginal income tax rate and do not reflect the impact of state and local taxes. Actual after-tax
returns depend on a shareholder's tax situation and may differ from those shown. The after-tax returns are not relevant if you
hold your Fund shares in tax-deferred arrangements, such as 401(k) plans or individual retirement accounts ("IRA"). Class
A returns before taxes include maximum possible sale load. After-tax returns for Class A and Class C shares, which are not shown,
will vary from those of Class I shares. The Fund's broad based securities market index (benchmark) has been changed to the HFRI
Fund-of-Funds Conservative Index from the S&P 500® Index to better reflect the securities and strategies used
by the Fund's Adviser.
It is important to note that the Predecessor
Fund's name was changed and the strategy of the EAS Crow Point Alternatives Fund was modified, effective March 1, 2013 and the
strategy was updated again, effective August 29, 2016. Under the investment approach prior to March 1, 2013, the EAS Crow Point
Alternatives Fund, formerly known as the "EAS Alternatives Fund" and the "EAS Genesis Fund," had a broader mandate
and the Predecessor Fund was managed by a different investment adviser and portfolio manager. The Fund's current investment adviser,
Crow Point Partners, LLC, began managing the Predecessor Fund in March, 2013. The historical performance information illustrated
above includes that of the Predecessor Fund's former strategy, run by the former portfolio management team.
Current performance of the Fund may be
lower or higher than the performance quoted above. Updated performance information may be obtained by calling (877) 244-6235.
|
|
| EAS Crow Point Alternatives Fund | Class A Shares |
|
|
|
| Risk Return Abstract |
rr_RiskReturnAbstract |
|
|
| Trading Symbol |
dei_TradingSymbol |
EASAX
|
|
| Maximum Sales Charge (Load) Imposed on Purchases (as a percentage of offering price) |
rr_MaximumSalesChargeImposedOnPurchasesOverOfferingPrice |
5.50%
|
|
| Maximum Deferred Sales Charge (Load) (as a percentage of amount redeemed) |
rr_MaximumDeferredSalesChargeOverOfferingPrice |
1.00%
|
[1] |
| Maximum Sales Charge (Load) Imposed on Reinvested Dividends/Distributions |
rr_MaximumSalesChargeOnReinvestedDividendsAndDistributionsOverOther |
none
|
|
| Redemption Fee on Shares Held Less Than 30 Days (as a % of amount redeemed) |
rr_RedemptionFeeOverRedemption |
(2.00%)
|
|
| Management Fees |
rr_ManagementFeesOverAssets |
1.00%
|
|
| Distribution and Service (12b-1) Fees |
rr_DistributionAndService12b1FeesOverAssets |
0.25%
|
|
| Interest and Dividends on Securities Sold Short |
rr_Component1OtherExpensesOverAssets |
0.23%
|
[2] |
| Remainder of Other Expenses |
rr_Component2OtherExpensesOverAssets |
1.03%
|
[2] |
| Total Other Expenses |
rr_OtherExpensesOverAssets |
1.26%
|
[2] |
| Acquired Fund Fees and Expenses |
rr_AcquiredFundFeesAndExpensesOverAssets |
2.56%
|
|
| Total Annual Fund Operating Expenses |
rr_ExpensesOverAssets |
5.07%
|
[3] |
| Fee Waivers and Expense Reimbursements |
rr_FeeWaiverOrReimbursementOverAssets |
(0.33%)
|
[3],[4] |
| Total Annual Fund Operating Expenses After Waivers and/or Expense Reimbursements |
rr_NetExpensesOverAssets |
4.74%
|
[3],[4] |
| One Year |
rr_ExpenseExampleYear01 |
$ 999
|
|
| Three Years |
rr_ExpenseExampleYear03 |
1,959
|
|
| Five Years |
rr_ExpenseExampleYear05 |
2,917
|
|
| Ten Years |
rr_ExpenseExampleYear10 |
$ 5,308
|
|
| 1 Year |
rr_AverageAnnualReturnYear01 |
(7.24%)
|
|
| 5 Years |
rr_AverageAnnualReturnYear05 |
(0.16%)
|
|
| Since Inception |
rr_AverageAnnualReturnSinceInception |
0.07%
|
|
| Inception Date |
rr_AverageAnnualReturnInceptionDate |
Aug. 14, 2008
|
|
| EAS Crow Point Alternatives Fund | Class C Shares |
|
|
|
| Risk Return Abstract |
rr_RiskReturnAbstract |
|
|
| Trading Symbol |
dei_TradingSymbol |
EASYX
|
|
| Maximum Sales Charge (Load) Imposed on Purchases (as a percentage of offering price) |
rr_MaximumSalesChargeImposedOnPurchasesOverOfferingPrice |
none
|
|
| Maximum Deferred Sales Charge (Load) (as a percentage of amount redeemed) |
rr_MaximumDeferredSalesChargeOverOfferingPrice |
1.00%
|
|
| Maximum Sales Charge (Load) Imposed on Reinvested Dividends/Distributions |
rr_MaximumSalesChargeOnReinvestedDividendsAndDistributionsOverOther |
none
|
|
| Redemption Fee on Shares Held Less Than 30 Days (as a % of amount redeemed) |
rr_RedemptionFeeOverRedemption |
(2.00%)
|
|
| Management Fees |
rr_ManagementFeesOverAssets |
1.00%
|
|
| Distribution and Service (12b-1) Fees |
rr_DistributionAndService12b1FeesOverAssets |
1.00%
|
|
| Interest and Dividends on Securities Sold Short |
rr_Component1OtherExpensesOverAssets |
0.24%
|
[2] |
| Remainder of Other Expenses |
rr_Component2OtherExpensesOverAssets |
1.04%
|
[2] |
| Total Other Expenses |
rr_OtherExpensesOverAssets |
1.28%
|
[2] |
| Acquired Fund Fees and Expenses |
rr_AcquiredFundFeesAndExpensesOverAssets |
2.56%
|
|
| Total Annual Fund Operating Expenses |
rr_ExpensesOverAssets |
5.84%
|
[3] |
| Fee Waivers and Expense Reimbursements |
rr_FeeWaiverOrReimbursementOverAssets |
(0.34%)
|
[3],[4] |
| Total Annual Fund Operating Expenses After Waivers and/or Expense Reimbursements |
rr_NetExpensesOverAssets |
5.50%
|
[3],[4] |
| One Year |
rr_ExpenseExampleYear01 |
$ 549
|
|
| Three Years |
rr_ExpenseExampleYear03 |
1,701
|
|
| Five Years |
rr_ExpenseExampleYear05 |
2,834
|
|
| Ten Years |
rr_ExpenseExampleYear10 |
$ 5,585
|
|
| 1 Year |
rr_AverageAnnualReturnYear01 |
(2.60%)
|
|
| 5 Years |
rr_AverageAnnualReturnYear05 |
0.23%
|
|
| Since Inception |
rr_AverageAnnualReturnSinceInception |
0.13%
|
|
| Inception Date |
rr_AverageAnnualReturnInceptionDate |
Aug. 14, 2008
|
|
| EAS Crow Point Alternatives Fund | Class I Shares |
|
|
|
| Risk Return Abstract |
rr_RiskReturnAbstract |
|
|
| Trading Symbol |
dei_TradingSymbol |
EASIX
|
|
| Maximum Sales Charge (Load) Imposed on Purchases (as a percentage of offering price) |
rr_MaximumSalesChargeImposedOnPurchasesOverOfferingPrice |
none
|
|
| Maximum Deferred Sales Charge (Load) (as a percentage of amount redeemed) |
rr_MaximumDeferredSalesChargeOverOfferingPrice |
none
|
|
| Maximum Sales Charge (Load) Imposed on Reinvested Dividends/Distributions |
rr_MaximumSalesChargeOnReinvestedDividendsAndDistributionsOverOther |
none
|
|
| Redemption Fee on Shares Held Less Than 30 Days (as a % of amount redeemed) |
rr_RedemptionFeeOverRedemption |
(2.00%)
|
|
| Management Fees |
rr_ManagementFeesOverAssets |
1.00%
|
|
| Distribution and Service (12b-1) Fees |
rr_DistributionAndService12b1FeesOverAssets |
none
|
|
| Interest and Dividends on Securities Sold Short |
rr_Component1OtherExpensesOverAssets |
0.27%
|
[2] |
| Remainder of Other Expenses |
rr_Component2OtherExpensesOverAssets |
1.02%
|
[2] |
| Total Other Expenses |
rr_OtherExpensesOverAssets |
1.29%
|
[2] |
| Acquired Fund Fees and Expenses |
rr_AcquiredFundFeesAndExpensesOverAssets |
2.56%
|
|
| Total Annual Fund Operating Expenses |
rr_ExpensesOverAssets |
4.85%
|
[3] |
| Fee Waivers and Expense Reimbursements |
rr_FeeWaiverOrReimbursementOverAssets |
(0.32%)
|
[3],[4] |
| Total Annual Fund Operating Expenses After Waivers and/or Expense Reimbursements |
rr_NetExpensesOverAssets |
4.53%
|
[3],[4] |
| One Year |
rr_ExpenseExampleYear01 |
$ 454
|
|
| Three Years |
rr_ExpenseExampleYear03 |
1,430
|
|
| Five Years |
rr_ExpenseExampleYear05 |
2,409
|
|
| Ten Years |
rr_ExpenseExampleYear10 |
$ 4,869
|
|
| 2009 |
rr_AnnualReturn2009 |
11.89%
|
|
| 2010 |
rr_AnnualReturn2010 |
4.31%
|
|
| 2011 |
rr_AnnualReturn2011 |
(7.51%)
|
|
| 2012 |
rr_AnnualReturn2012 |
6.54%
|
|
| 2013 |
rr_AnnualReturn2013 |
7.12%
|
|
| 2014 |
rr_AnnualReturn2014 |
2.41%
|
|
| 2015 |
rr_AnnualReturn2015 |
(1.72%)
|
|
| 2016 |
rr_AnnualReturn2016 |
(1.66%)
|
|
| Year to Date Return, Label |
rr_YearToDateReturnLabel |
total return for Class I
|
|
| Bar Chart, Year to Date Return, Date |
rr_BarChartYearToDateReturnDate |
Jun. 30, 2017
|
|
| Bar Chart, Year to Date Return |
rr_BarChartYearToDateReturn |
3.23%
|
|
| Highest Quarterly Return, Label |
rr_HighestQuarterlyReturnLabel |
Best Quarter
|
|
| Highest Quarterly Return, Date |
rr_BarChartHighestQuarterlyReturnDate |
Jun. 30, 2009
|
|
| Highest Quarterly Return |
rr_BarChartHighestQuarterlyReturn |
5.72%
|
|
| Lowest Quarterly Return, Label |
rr_LowestQuarterlyReturnLabel |
Worst Quarter
|
|
| Lowest Quarterly Return, Date |
rr_BarChartLowestQuarterlyReturnDate |
Sep. 30, 2011
|
|
| Lowest Quarterly Return |
rr_BarChartLowestQuarterlyReturn |
(9.12%)
|
|
| 1 Year |
rr_AverageAnnualReturnYear01 |
(1.72%)
|
|
| 5 Years |
rr_AverageAnnualReturnYear05 |
1.22%
|
|
| Since Inception |
rr_AverageAnnualReturnSinceInception |
1.06%
|
|
| Inception Date |
rr_AverageAnnualReturnInceptionDate |
Aug. 14, 2008
|
|
| EAS Crow Point Alternatives Fund | Return after taxes on distributions | Class I Shares |
|
|
|
| Risk Return Abstract |
rr_RiskReturnAbstract |
|
|
| 1 Year |
rr_AverageAnnualReturnYear01 |
(2.00%)
|
|
| 5 Years |
rr_AverageAnnualReturnYear05 |
0.44%
|
|
| Since Inception |
rr_AverageAnnualReturnSinceInception |
0.48%
|
|
| Inception Date |
rr_AverageAnnualReturnInceptionDate |
Aug. 14, 2008
|
|
| EAS Crow Point Alternatives Fund | Return after taxes on distributions and sale of Fund shares | Class I Shares |
|
|
|
| Risk Return Abstract |
rr_RiskReturnAbstract |
|
|
| 1 Year |
rr_AverageAnnualReturnYear01 |
(0.74%)
|
|
| 5 Years |
rr_AverageAnnualReturnYear05 |
0.95%
|
|
| Since Inception |
rr_AverageAnnualReturnSinceInception |
0.83%
|
|
| Inception Date |
rr_AverageAnnualReturnInceptionDate |
Aug. 14, 2008
|
|
| EAS Crow Point Alternatives Fund | Barclay's U.S. Aggregate Bond Index |
|
|
|
| Risk Return Abstract |
rr_RiskReturnAbstract |
|
|
| 1 Year |
rr_AverageAnnualReturnYear01 |
2.65%
|
|
| 5 Years |
rr_AverageAnnualReturnYear05 |
2.23%
|
|
| Since Inception |
rr_AverageAnnualReturnSinceInception |
4.22%
|
|
| Inception Date |
rr_AverageAnnualReturnInceptionDate |
Aug. 14, 2008
|
|
| EAS Crow Point Alternatives Fund | HFRI Fund-of-Funds Conservative Index |
|
|
|
| Risk Return Abstract |
rr_RiskReturnAbstract |
|
|
| 1 Year |
rr_AverageAnnualReturnYear01 |
1.89%
|
[5] |
| 5 Years |
rr_AverageAnnualReturnYear05 |
3.43%
|
[5] |
| Since Inception |
rr_AverageAnnualReturnSinceInception |
1.00%
|
[5],[6] |
| Inception Date |
rr_AverageAnnualReturnInceptionDate |
Aug. 14, 2008
|
[5] |
|
|