As filed with the Securities and Exchange Commission on November 4, 2022
UNITED STATES
SECURITIES AND EXCHANGE COMMISSION
Washington, D.C. 20549
FORM N-CSR
CERTIFIED SHAREHOLDER REPORT OF
REGISTERED MANAGEMENT INVESTMENT COMPANIES
Investment Company Act file number: 811- 21715
NEUBERGER BERMAN ALTERNATIVE FUNDS
(on behalf of Neuberger Berman Commodity Strategy Fund)
(Exact Name of Registrant as specified in charter)
c/o Neuberger Berman Investment Advisers LLC
1290 Avenue of the Americas
New York, New York 10104-0002
(Address of Principal Executive Offices – Zip Code)
Joseph V. Amato
Chief Executive Officer and President
Neuberger Berman Alternative Funds
c/o Neuberger Berman Investment Advisers LLC
1290 Avenue of the Americas
New York, New York 10104-0002
Lori L. Schneider, Esq.
K&L Gates LLP
1601 K Street, N.W.
Washington, D.C. 20006-1600
(Names and Addresses of agents for service)
Registrant’s telephone number, including area code: (212) 476-8800
Date of fiscal year end: August 31
Date of reporting period: August 31, 2022
Form N-CSR is to be used by management investment companies to file reports with the Commission not later than 10 days after the transmission to stockholders of any report that is required to be transmitted to
stockholders under Rule 30e-1 under the Investment Company Act of 1940, as amended (“Act”) (17 CFR 270.30e-1). The Commission may use the information provided on Form N-CSR in its regulatory, disclosure review, inspection, and policymaking roles.
A registrant is required to disclose the information specified by Form N-CSR, and the Commission will make this information public. A registrant is not required to respond to the collection of information contained in
Form N-CSR unless the Form displays a currently valid Office of Management and Budget (“OMB”) control number. Please direct comments concerning the accuracy of the information collection burden estimate and any suggestions for reducing the burden to
Secretary, Securities and Exchange Commission, 100 F Street, NE, Washington, DC 20549-1090. The OMB has reviewed this collection of information under the clearance requirements of 44 U.S.C. § 3507.
Item 1. Report to Shareholders.
(a) Following is a copy of the annual report for Neuberger Berman Commodity Strategy Fund (the “Fund”) transmitted to
shareholders pursuant to Rule 30e-1 under the Act.

Neuberger Berman
Alternative and Multi-Asset Class Funds
Alternative and Multi-Asset Class Funds
|
Institutional Class Shares
|
|
Class A Shares
|
|
Class C Shares
|
|
Commodity Strategy Fund
|

Annual Report
August 31, 2022

Contents
|
1
|
|
|
2
|
|
|
7
|
|
|
8
|
|
|
9
|
|
|
16
|
|
|
19
|
|
|
32
|
|
|
35
|
|
|
36
|
|
|
37
|
|
|
47
|
|
|
47
|
|
|
47
|
|
|
48
|
The "Neuberger Berman" name and logo and "Neuberger Berman Investment Advisers LLC" name are
registered service marks of Neuberger Berman Group LLC. The individual Fund name in this piece is either a service mark or registered service mark of Neuberger Berman Investment Advisers LLC, an affiliate of Neuberger Berman BD LLC,
distributor, member FINRA. ©2022
Neuberger Berman BD LLC, distributor. All rights reserved.
President’s Letter
Dear Shareholder,
I am pleased to present this annual shareholder report for Neuberger Berman Commodity Strategy Fund for the period from
November 1, 2021 through August 31, 2022 (the reporting period). In June 2022, the Fund’s Board of Trustees approved a change in the Fund’s fiscal year end from October 31st to August 31st.
The commodity asset class was one of the few bright spots amid overall equity market weakness. A number of factors negatively
impacted investor sentiment, including the pandemic’s impacts on supply chains, high inflation, war in Ukraine, and fiscal tightening amidst a slowing global economy.
Tensions began in November, when Covid’s fast-spreading Omicron variant emerged, evading defenses. With vaccinations, improved
treatments and immunity, it proved less deadly. However, it added to supply-chain disruptions, a key factor driving high inflation, especially as China imposed lockdowns under their zero-Covid policy. Beginning in February, the war in
Ukraine worsened sentiment and exacerbated inflation, particularly in Europe, which relies on Ukraine for grain and Russia for energy, which is something to watch as another heating season approaches.
Central banks, whose stimulative policies powered global economies (and by extension, equity markets) through the depths of
the pandemic, reversed course to combat inflation. This is a delicate balancing act that investors watch nervously, as too many rate hikes too quickly could push the global economy into recession.
At their July meeting, the U.S. Federal Reserve Board, hoping to reduce inflation to 2%, raised rates to between 2.25% and
2.5% from near zero in March, and set expectations for future rates increases. The Bank of Canada, Bank of England, and European Central Bank have also raised rates.
The International Monetary Fund forecasts global real Gross Domestic Product growth for 2022 at 3.2%, down from 6.1% in 2021.
For the U.S., their estimate is 2.3%, down from last year’s 40-year high of 5.7%. Still, 2.3% is below the long-term average, and further slowing could be risky.
Although macroeconomic concerns are valid, fundamentals remain positive. Corporate earnings continued to beat estimates
throughout the reporting period. Additionally, reshoring—driven by top-down policy and bottom-up supply-chain necessity—as well as a significant federal commitment to infrastructure, should support American businesses, labor and
logistics. Wage growth slowed as this period ended, which could help temper demand-side inflation; and unemployment increased slightly, a positive as more Americans began seeking work. Still, we believe markets will likely remain volatile
until inflation (and uncertainty) begins to fall meaningfully.
In terms of the commodity asset class, we believe it can continue to be an important component of a well-diversified
portfolio. In addition to the potential for rising commodity prices given supply-demand imbalances, commodities historically have a low correlation to both equities and bonds. They may also provide a hedge in an inflationary environment.
We thank you for your confidence in Neuberger Berman.

Joseph V. Amato
President and CEO
Neuberger Berman Alternative Funds
President and CEO
Neuberger Berman Alternative Funds
1
Commodity Strategy Fund* Commentary (Unaudited)
Neuberger Berman Commodity Strategy Fund Institutional Class generated a total return of 13.67% for the 10-month period1 from November 1, 2021 through August 31, 2022 (the reporting period) and underperformed its
benchmark, the Bloomberg Commodity Index (the Index), which provided a 18.60% total return for the same period. (Performance for all share classes is provided in the table immediately following this letter.)
The commodity market rallied strongly during the reporting period. Energy was the top performer, partially driven by supply
chain issues triggered by the war in Ukraine. In particular, heating oil and natural gas prices rose significantly. The agriculture space also marched higher over the reporting period as soybeans and corn generated the strongest returns.
Elsewhere, precious metals and industrial metals (including copper and silver) generated weak returns, partially due to concerns over moderating global growth.
While the Fund generated a strong absolute return, it lagged the Index on a relative basis.
The Fund seeks to gain exposure to the commodity markets by investing, directly or indirectly, in futures contracts on
individual commodities and other commodity-linked derivative instruments. The Fund’s tactical positioning contributed to performance during the reporting period.
Looking at the commodity sectors in which the Fund invests, energy was the largest detractor from relative performance, driven
primarily by the Fund’s underweight versus the Index in natural gas which rallied an astonishing 69% over the reporting period. Precious metals were also a headwind for relative results, due to the Fund’s overweight in gold and
out-of-Index positions in palladium and platinum. Within softs (commodities that are grown, rather than mined, such as sugar and coffee), the Fund’s underweight to coffee negatively impacted relative performance, but was partially offset
by positive performance from an overweight in cotton. In industrial metals, our lead and copper exposures detracted from relative performance, whereas our nickel exposure was additive. On the upside, the Fund’s agriculture exposure was
the most beneficial for relative returns. This was driven by overweights in corn, Kansas wheat and soybean meal and an underweight in wheat positioning.
A severe supply and demand imbalance has raised commodity prices in recent months. In our view, there appears to be very
little prospect for meaningful additional supply, as neither investors nor governments are incentivized to capitalize it. Tightening financial conditions and a slowing economy could trim some demand, but in our view, it is unlikely to
have a big effect relative to the structural trends of redistribution, decarbonization and deglobalization that command today’s global economy. For those investors that can bear the volatility, we believe commodities will continue to
provide a number of benefits. First, there is the potential for further rising prices as markets try to restore equilibrium. Second, they can provide much needed negative correlation to equities and bonds, and positive correlation with
inflation expectations and inflation surprises. Far from missing the opportunity to build strategic allocations to the asset class, we believe we are still in the early innings of this cycle.
Sincerely,
Hakan Kaya, David Yi Wan and Michael Foster
Portfolio Managers
Portfolio Managers
* Effective
October 21, 2022, the Fund was converted to an exchange-traded fund. For more information, call us at 800-877-9700, or visit www.nb.com/ETF.
1 In June 2022,
the Fund’s Board of Trustees approved a change in the Fund’s fiscal year end from October 31st to August 31st.
Information about principal risks of investing in the Fund is set forth in the prospectus and
statement of additional information.
The portfolio composition, industries and holdings of the Fund are subject to change without notice.
The opinions expressed are those of the Fund’s portfolio managers. The opinions are as of the date of this report
and are subject to change without notice.
2
Commodity Strategy Fund (Unaudited)
|
TICKER SYMBOLS
|
|
|
Institutional Class
|
NRBIX
|
|
Class A
|
NRBAX
|
|
Class C
|
NRBCX
|
|
PORTFOLIO BY INVESTMENT
TYPE
|
|
|
(as a % of Total Net Assets)
|
|
|
Asset-Backed Securities
|
19.7%
|
|
Corporate Bonds
|
56.2
|
|
U.S. Treasury Obligations
|
1.3
|
|
Short-Term Investments
|
13.9
|
|
Other Assets Less Liabilities
|
8.9*
|
|
Total
|
100.0%
|
|
*
|
Includes the impact of the Fund’s open
positions in derivatives (other than options
purchased), if any.
|
|
PORTFOLIO BY TYPE OF
COMMODITY FUTURE
|
|
|
(as a % of Total Notional Value)
Commodity Futures:
|
|
|
Agriculture
|
21.4%
|
|
Energy
|
34.1
|
|
Industrial Metals
|
16.2
|
|
Livestock
|
4.4
|
|
Precious Metals
|
17.5
|
|
Softs
|
6.4
|
|
Total
|
100.0%
|
|
PERFORMANCE HIGHLIGHTS3
|
||||||
|
|
Inception
Date
|
Ten Month
Period Ended
08/31/2022*
|
Average Annual Total Return
Ended 08/31/2022
|
|||
|
|
1 Year
|
5 Years
|
10 Years
|
Life of
Fund
|
||
|
At NAV
|
|
|
|
|
|
|
|
Institutional
Class
|
08/27/2012
|
13.67%
|
21.46%
|
9.49%
|
-0.40%
|
-0.32%
|
|
Class A
|
08/27/2012
|
13.35%
|
20.95%
|
9.12%
|
-0.77%
|
-0.69%
|
|
Class C4
|
03/24/2021
|
12.54%
|
20.11%
|
9.15%
|
-0.56%
|
-0.48%
|
|
With Sales
Charge
|
|
|
|
|
|
|
|
Class A
|
|
6.78%
|
13.94%
|
7.82%
|
-1.35%
|
-1.28%
|
|
Class C4
|
|
11.80%
|
19.32%
|
9.15%
|
-0.56%
|
-0.48%
|
|
Index
|
|
|
|
|
|
|
|
Bloomberg Commodity Index1,2
|
18.60%
|
27.72%
|
8.75%
|
-1.15%
|
-1.10%
|
|
* In June 2022, the Fund’s Board of Trustees approved a change in the Fund’s fiscal year end from October 31st to August 31st.
The performance data quoted represent past performance and do not indicate future results. Current
performance may be lower or higher than the performance data quoted. For current performance data, including current to the most recent month-end, please visit www.nb.com/performance.
The results shown in the table reflect the reinvestment of income dividends and other
distributions, if any. The results do not reflect the effect of taxes a shareholder would pay on Fund distributions or on the redemption of Fund shares.
The investment return and principal value of an investment will fluctuate and shares, when
redeemed, may be worth more or less than their original cost.
Returns would have been lower if Neuberger Berman Investment Advisers LLC (“NBIA”) had not reimbursed certain
expenses and/or waived a portion of the investment management fees during certain of the periods shown. Repayment by a class (of expenses previously reimbursed and/or fees previously waived by NBIA) will decrease the class’s returns.
Please see Note B in the Notes to Financial Statements for specific information regarding expense reimbursement and/or fee waiver arrangements.
As stated in the Fund’s most recent prospectus, the total annual operating expense ratios for the Fund’s former
fiscal year ended October 31, 2021 were 0.99%,1.37% and 2.97% for Institutional Class, Class A and Class C shares, respectively (before expense reimbursements and/or fee waivers, if any). The expense ratios were 0.74%, 1.10% and 1.86% for
Institutional Class, Class A and Class C shares, respectively, after expense reimbursements and/or fee waivers. The expense ratios for the period ended August 31, 2022, can be found in the Financial Highlights section of this report.
Returns shown with a sales charge reflect the deduction of the current maximum initial sales charge of 5.75% for
Class A shares and the contingent deferred sales charge (CDSC) for Class C shares. The CDSC for Class C shares is 1.00%, which is reduced to 0% after 1 year. The performance of the Fund’s share classes will differ primarily due to
different sales charge structures and class expenses. Please see the prospectus for more information about sales charge structures, if any, and class expenses for your share class.
3
Commodity Strategy Fund (Unaudited)
COMPARISON OF A $1,000,000 INVESTMENT
(000's omitted)
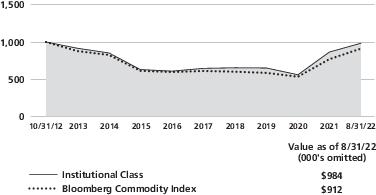
This graph shows the change in value of a hypothetical $1,000,000 investment in the Fund over the past 10 fiscal
years, or since the Fund’s inception if it has not operated for 10 years. The graph is based on the Institutional Class shares only; the performance of the Fund’s share classes will differ primarily due to different sales charge
structures and class expenses (see Performance Highlights chart on previous page). The result is compared with benchmarks, which include a broad-based market index and may include a more narrowly based index. Market indices have not been
reduced to reflect any of the fees and costs of investing. The results shown in the graph reflect the reinvestment of income dividends and other distributions, if any. The results do not reflect the effect of taxes a shareholder would pay
on Fund distributions or on the redemption of Fund shares. Results represent past performance and do not indicate future results.
4
Endnotes (Unaudited)
|
1
|
Please see “Description of Index” on page 6 for a description of the Index. Please note that
individuals
cannot invest directly in any index. The index described in this report does not take into account
any fees,
expenses or tax consequences of investing in the individual securities that they track. Data about
the
performance of an index are prepared or obtained by Neuberger Berman Investment Advisers LLC and
reflect the reinvestment of income dividends and other distributions, if any. The Fund may invest
in
securities not included in a described index and generally does not invest in all securities
included in a
described index.
|
|
2
|
The date used to calculate Life of Fund performance for the index is the inception date of the
oldest share
class.
|
|
3
|
During the period from August 2012 through January 2013, the Fund was relatively small, which
could
have impacted Fund performance. The same techniques used to produce returns in a small fund may
not
work to produce similar returns in a larger fund.
|
|
4
|
The performance information for Class C prior to the class’s inception date is that of the
Institutional Class.
The performance information for the Institutional Class has been adjusted to reflect the
appropriate sales
charges applicable to Class C shares but has not been adjusted to take into account differences in
class
specific operating expenses (such as Rule 12b-1 fees). The Institutional Class has lower expenses
and
typically higher returns than Class C.
|
For more complete information on any of the Neuberger Berman Alternative and Multi-Asset Class Funds, call us at (800) 877-9700,
or visit our website at www.nb.com.
5
Description of Index (Unaudited)
|
Bloomberg Commodity Index:
|
The index is a rolling index composed of exchange-traded futures contracts on
physical commodities. The index relies primarily on liquidity data of futures contracts,
along with U.S. dollar-adjusted production data, in determining the relative quantities
of included commodities. The index is designed to be a highly liquid and diversified
benchmark for commodities investments. The version of the index that is calculated
on a total return basis reflects the returns on a fully collateralized investment in the
underlying commodity futures contracts, combined with the returns on cash collateral
invested in U.S. Treasury Bills.
|
6
Information About Your Fund’s Expenses (Unaudited)
As a Fund shareholder, you incur two types of costs: (1) transaction costs, including sales charges (loads) on purchase payments
or redemption proceeds (if applicable); and (2) ongoing costs, including management fees, distribution and/or service (12b-1) fees (if applicable), and other Fund expenses. This example is intended to help you understand your ongoing
costs (in U.S. dollars) of investing in the Fund and compare these costs with the ongoing costs of investing in other mutual funds.
This table is designed to provide information regarding costs related to your investments. The following examples are based on
an investment of $1,000 made at the beginning of the six month period ended August 31, 2022 and held for the entire period. The table illustrates the Fund’s costs in two ways:
|
Actual Expenses and
Performance:
|
The first section of the table provides information about actual account values and actual
expenses in dollars, based on the Fund’s actual performance during the period indicated.
You may use the information in this line, together with the amount you invested, to
estimate the expenses you paid over the period. Simply divide your account value by
$1,000 (for example, an $8,600 account value divided by $1,000 = 8.6), then multiply
the result by the number in the first section of the table under the heading entitled
“Expenses Paid During the Period” to estimate the expenses you paid over the period.
|
|
Hypothetical Example for
Comparison Purposes:
|
The second section of the table provides information about hypothetical account values
and hypothetical expenses based on the Fund’s actual expense ratio and an assumed rate
of return at 5% per year before expenses. This return is not the Fund’s actual return. The
hypothetical account values and expenses may not be used to estimate the actual ending
account balance or expenses you paid for the period. You may use this information to
compare the ongoing costs of investing in a Fund versus other funds. To do so, compare
the expenses shown in this 5% hypothetical example with the 5% hypothetical examples
that appear in the shareholder reports of other funds.
|
Please note that the expenses in the table are meant to highlight your ongoing costs only and do not include any transaction
costs, such as sales charges (loads) (if applicable). Therefore, the information under the heading “Hypothetical (5% annual return before expenses)” is useful in comparing ongoing costs only, and will not help you determine the relative
total costs of owning different funds. In addition, if these transaction costs were included, your costs would have been higher.
Expense Example (Unaudited)
Neuberger Berman Alternative Funds
|
|
ACTUAL
|
HYPOTHETICAL (5% ANNUAL RETURN BEFORE EXPENSES)
|
||||||
|
|
Beginning
Account
Value
3/1/22
|
Ending
Account
Value
8/31/22
|
Expenses Paid
During the
Period(1)(2)
3/1/22 – 8/31/22
|
Expense
Ratio
|
Beginning
Account
Value
3/1/22
|
Ending
Account
Value
8/31/22
|
Expenses Paid
During the
Period(1)(3)
3/1/22 – 8/31/22
|
Expense
Ratio
|
|
Commodity Strategy Fund
|
||||||||
|
Institutional Class
|
$1,000.00
|
$1,013.90
|
$3.71
|
0.73%
|
$1,000.00
|
$1,021.53
|
$3.72
|
0.73%
|
|
Class A
|
$1,000.00
|
$1,010.70
|
$5.52
|
1.09%
|
$1,000.00
|
$1,019.71
|
$5.55
|
1.09%
|
|
Class C
|
$1,000.00
|
$1,007.10
|
$9.31
|
1.84%
|
$1,000.00
|
$1,015.93
|
$9.35
|
1.84%
|
|
(1)
|
Included the expenses of the Fund's subsidiary (See Note A of the Notes to Consolidated Financial
Statements).
|
|
(2)
|
For each class, expenses are equal to the annualized expense ratio for the class, multiplied by
the average account value over the
period, multiplied by 184/365 (to reflect the one-half year period shown), unless otherwise
indicated.
|
|
(3)
|
Hypothetical expenses are equal to the annualized expense ratios for each class, multiplied by
the average account value over the
period (assuming a 5% annual return), multiplied by 184/365 (to reflect the one-half year period
shown).
|
7
Legend August 31, 2022 (Unaudited)
Neuberger Berman Alternative Funds
|
Benchmarks:
|
|
|
LIBOR
|
= London Interbank Offered Rate
|
|
SOFR
|
= Secured Overnight Financing Rate
|
|
Index Periods/Payment Frequencies:
|
|
|
1M
|
= 1 Month
|
|
3M
|
= 3 Months
|
|
Other Abbreviations:
|
|
|
Management or NBIA
|
= Neuberger Berman Investment Advisers LLC
|
8
Consolidated Schedule of Investments Commodity Strategy Fund^
August 31, 2022
August 31, 2022
|
Principal Amount
|
Value
|
|
|
U.S. Treasury Obligations 1.3%
|
||
|
$ 3,000,000
|
U.S. Cash Management Bill, 1.70%, due 10/4/2022 (Cost $2,995,319)
|
$2,993,561(a)
|
|
Asset-Backed Securities 19.7%
|
||
|
1,961,000
|
Ally Auto Receivables Trust, Ser. 2022-1, Class A2, 2.67%, due 4/15/2025
|
1,946,764
|
|
1,469,657
|
BMW Vehicle Lease Trust, Ser. 2022-1, Class A2, 0.67%, due 5/28/2024
|
1,454,688
|
|
|
Capital One Prime Auto Receivables Trust
|
|
|
884,266
|
Ser. 2021-1, Class A2, 0.32%, due 2/18/2025
|
873,076
|
|
3,601,000
|
Ser. 2022-1, Class A2, 2.71%, due 6/16/2025
|
3,558,854
|
|
590,343
|
CNH Equipment Trust, Ser. 2021-C, Class A2, 0.33%, due 1/15/2025
|
582,718
|
|
464,511
|
DLLMT LLC, Ser. 2021-1A, Class A2, 0.60%, due 3/20/2024
|
457,700(b)
|
|
622,000
|
DLLST LLC, Ser. 2022-1A, Class A2, 2.79%, due 1/22/2024
|
615,323(b)
|
|
1,895,000
|
Ford Credit Auto Lease Trust, Ser. 2022-A, Class A2A, 2.78%, due 10/15/2024
|
1,879,617
|
|
|
Ford Credit Auto Owner Trust
|
|
|
1,563,179
|
Ser. 2022-A, Class A2, 0.73%, due 9/15/2024
|
1,545,240
|
|
2,120,000
|
Ser. 2022-B, Class A2A, 3.44%, due 2/15/2025
|
2,110,696
|
|
1,227,000
|
GM Financial Automobile Leasing Trust, Ser. 2022-2, Class A2, 2.93%, due
10/21/2024
|
1,216,778
|
|
|
GM Financial Consumer Automobile Receivables Trust
|
|
|
1,312,942
|
Ser. 2021-4, Class A2, 0.28%, due 11/18/2024
|
1,296,409
|
|
525,051
|
Ser. 2022-1, Class A2, 0.76%, due 2/18/2025
|
518,434
|
|
877,000
|
Ser. 2022-2, Class A2, 2.52%, due 5/16/2025
|
869,773
|
|
2,138,000
|
Ser. 2022-3, Class A2A, 3.50%, due 9/16/2025
|
2,125,415
|
|
630,000
|
Harley-Davidson Motorcycle Trust, Ser. 2022-A, Class A2A, 2.45%, due 5/15/2025
|
625,036
|
|
1,775,969
|
Honda Auto Receivables Owner Trust, Ser. 2021-4, Class A2, 0.39%, due
5/21/2024
|
1,752,364
|
|
1,290,000
|
HPEFS Equipment Trust, Ser. 2022-1A, Class A2, 1.02%, due 5/21/2029
|
1,266,158(b)
|
|
|
Hyundai Auto Lease Securitization Trust
|
|
|
667,937
|
Ser. 2021-B, Class A2, 0.19%, due 10/16/2023
|
664,545(b)
|
|
413,000
|
Ser. 2022-B, Class A2A, 2.75%, due 10/15/2024
|
408,464(b)
|
|
|
Hyundai Auto Receivables Trust
|
|
|
898,980
|
Ser. 2021-C, Class A2A, 0.36%, due 10/15/2024
|
887,673
|
|
2,119,000
|
Ser. 2022-A, Class A2A, 1.81%, due 2/18/2025
|
2,095,500
|
|
1,296,000
|
Kubota Credit Owner Trust, Ser. 2022-1A, Class A2, 2.34%, due 4/15/2025
|
1,273,965(b)
|
|
|
MMAF Equipment Finance LLC
|
|
|
584,162
|
Ser. 2021-A, Class A2, 0.30%, due 4/15/2024
|
580,471(b)
|
|
1,005,000
|
Ser. 2022-A, Class A2, 2.77%, due 2/13/2025
|
989,454(b)
|
|
|
Navient Student Loan Trust
|
|
|
140,633
|
Ser. 2017-4A, Class A2, (1M USD LIBOR + 0.50%), 2.94%, due 9/27/2066
|
140,390(b)(c)
|
|
140,578
|
Ser. 2019-7A, Class A1, (1M USD LIBOR + 0.50%), 2.94%, due 1/25/2068
|
139,973(b)(c)
|
|
53,245
|
Ser. 2019-4A, Class A1, (1M USD LIBOR + 0.28%), 2.72%, due 7/25/2068
|
53,220(b)(c)
|
|
|
Nissan Auto Lease Trust
|
|
|
712,719
|
Ser. 2021-A, Class A2, 0.30%, due 12/15/2023
|
706,897
|
|
1,018,000
|
Ser. 2022-A, Class A2A, 3.45%, due 8/15/2024
|
1,012,474
|
|
|
Santander Retail Auto Lease Trust
|
|
|
574,472
|
Ser. 2021-A, Class A2, 0.32%, due 2/20/2024
|
570,392(b)
|
|
993,637
|
Ser. 2022-A, Class A2, 0.97%, due 3/20/2025
|
970,405(b)
|
|
1,050,803
|
Ser. 2022-B, Class A2, 2.84%, due 5/20/2025
|
1,040,799(b)
|
|
788,826
|
Tesla Auto Lease Trust, Ser. 2021-A, Class A2, 0.36%, due 3/20/2025
|
777,513(b)
|
|
|
Toyota Auto Receivables Owner Trust
|
|
|
1,432,244
|
Ser. 2022-A, Class A2, 0.74%, due 10/15/2024
|
1,414,504
|
|
800,000
|
Ser. 2022-B, Class A2A, 2.35%, due 1/15/2025
|
792,826
|
See Notes to Consolidated Financial Statements
9
Consolidated Schedule of Investments Commodity Strategy Fund^ (cont’d)
|
Principal Amount
|
Value
|
|
|
Asset-Backed Securities – cont'd
|
||
|
|
Toyota Lease Owner Trust
|
|
|
$ 1,316,119
|
Ser. 2021-B, Class A2, 0.25%, due 3/20/2024
|
$ 1,300,548(b)
|
|
658,000
|
Ser. 2022-A, Class A2, 1.73%, due 7/22/2024
|
646,802(b)
|
|
1,434,000
|
Verizon Owner Trust, Ser. 2020-B, Class A, 0.47%, due 2/20/2025
|
1,414,319
|
|
|
World Omni Auto Receivables Trust
|
|
|
367,434
|
Ser. 2021-B, Class A2, 0.20%, due 7/15/2024
|
365,675
|
|
1,926,134
|
Ser. 2022-A, Class A2, 1.15%, due 4/15/2025
|
1,897,840
|
|
909,000
|
Ser. 2022-B, Class A2A, 2.77%, due 10/15/2025
|
899,559
|
|
|
World Omni Automobile Lease Securitization Trust
|
|
|
223,653
|
Ser. 2021-A, Class A2, 0.21%, due 4/15/2024
|
221,680
|
|
1,548,270
|
Ser. 2022-A, Class A2, 2.63%, due 10/15/2024
|
1,534,371
|
|
Total Asset-Backed Securities (Cost $48,008,539)
|
47,495,302
|
|
|
|
||
|
Corporate Bonds 56.2%
|
||
|
Auto Manufacturers 2.7%
|
||
|
|
Toyota Motor Credit Corp.
|
|
|
2,875,000
|
(SOFR + 0.65%), 2.69%, due 12/29/2023
|
2,879,111(c)
|
|
1,565,000
|
(SOFR + 0.62%), 2.57%, due 3/22/2024
|
1,564,261(c)
|
|
2,000,000
|
Volkswagen Group of America Finance LLC, (SOFR + 0.95%), 2.67%, due 6/7/2024
|
1,991,334(b)(c)
|
|
|
|
6,434,706
|
|
Banks 19.5%
|
||
|
|
Bank of America Corp.
|
|
|
1,775,000
|
(3M USD LIBOR + 0.79%), 2.40%, due 3/5/2024
|
1,770,218(c)
|
|
3,765,000
|
(SOFR + 1.10%), 3.37%, due 4/25/2025
|
3,746,974(c)
|
|
3,048,000
|
Bank of New York Mellon Corp., Ser. J, (SOFR + 0.20%), 2.43%, due 10/25/2024
|
3,011,127(c)
|
|
|
Citigroup, Inc.
|
|
|
1,091,000
|
(3M USD LIBOR + 1.43%), 3.01%, due 9/1/2023
|
1,091,000(c)
|
|
4,138,000
|
(3M USD LIBOR + 1.10%), 4.04%, due 5/17/2024
|
4,142,710(c)
|
|
5,442,000
|
Goldman Sachs Group, Inc., (3M USD LIBOR + 1.60%), 4.64%, due 11/29/2023
|
5,487,356(c)
|
|
6,005,000
|
JPMorgan Chase & Co., (SOFR + 0.58%), 2.56%, due 6/23/2025
|
5,894,288(c)
|
|
1,155,000
|
Lloyds Banking Group PLC, (3M USD LIBOR + 0.81%), 2.91%, due 11/7/2023
|
1,151,567(d)
|
|
|
Morgan Stanley
|
|
|
215,000
|
(SOFR + 0.47%), 0.56%, due 11/10/2023
|
213,406(d)
|
|
5,484,000
|
(SOFR + 0.63%), 2.89%, due 1/24/2025
|
5,403,577(c)
|
|
|
Royal Bank of Canada
|
|
|
270,000
|
(3M USD LIBOR + 0.36%), 3.10%, due 1/17/2023
|
269,816(c)
|
|
1,240,000
|
(SOFR + 0.44%), 2.66%, due 1/21/2025
|
1,215,043(c)
|
|
1,218,000
|
Toronto-Dominion Bank, (SOFR + 0.48%), 2.75%, due 1/27/2023
|
1,217,532(c)
|
|
|
Truist Bank
|
|
|
2,045,000
|
(SOFR + 0.73%), 2.51%, due 3/9/2023
|
2,044,848(c)
|
|
2,460,000
|
(SOFR + 0.20%), 2.38%, due 1/17/2024
|
2,438,195(c)
|
|
530,000
|
Truist Financial Corp., (SOFR + 0.40%), 2.18%, due 6/9/2025
|
519,398(c)
|
|
1,185,000
|
U.S. Bank N.A., (3M USD LIBOR + 0.40%), 2.09%, due 12/9/2022
|
1,184,839(c)
|
|
5,435,000
|
Wells Fargo & Co., (3M USD LIBOR + 1.23%), 4.04%, due 10/31/2023
|
5,440,470(c)
|
|
640,000
|
Westpac Banking Corp., (3M USD LIBOR + 0.39%), 2.85%, due 1/13/2023
|
639,705(c)
|
|
|
|
46,882,069
|
|
Cosmetics - Personal Care 0.7%
|
||
|
1,605,000
|
GSK Consumer Healthcare Capital U.S. LLC, (SOFR + 0.89%), 2.88%, due 3/24/2024
|
1,602,432(b)(c)
|
See Notes to Consolidated Financial Statements
10
Consolidated Schedule of Investments Commodity Strategy Fund^ (cont’d)
|
Principal Amount
|
Value
|
|
|
|
||
|
Diversified Financial Services 2.6%
|
||
|
|
American Express Co.
|
|
|
$ 995,000
|
(SOFR + 0.23%), 2.52%, due 11/3/2023
|
$ 988,958(c)
|
|
3,052,000
|
(SOFR + 0.93%), 2.62%, due 3/4/2025
|
3,050,661(c)
|
|
|
Capital One Financial Corp.
|
|
|
1,175,000
|
(3M USD LIBOR + 0.72%), 3.53%, due 1/30/2023
|
1,172,674(c)
|
|
1,175,000
|
(SOFR + 1.35%), 3.64%, due 5/9/2025
|
1,159,434(c)
|
|
|
|
6,371,727
|
|
Electric 7.7%
|
||
|
1,855,000
|
Duke Energy Corp., (SOFR + 0.25%), 2.05%, due 6/10/2023
|
1,846,360(c)
|
|
2,745,000
|
Florida Power & Light Co., (SOFR + 0.25%), 2.54%, due 5/10/2023
|
2,737,220(c)
|
|
|
National Rural Utilities Cooperative Finance Corp.
|
|
|
1,040,000
|
Ser. D, (SOFR + 0.40%), 2.69%, due 8/7/2023
|
1,039,150(c)
|
|
2,220,000
|
Ser. D, (SOFR + 0.33%), 2.51%, due 10/18/2024
|
2,196,532(c)
|
|
4,500,000
|
NextEra Energy Capital Holdings, Inc., (SOFR + 0.40%), 2.69%, due 11/3/2023
|
4,461,435(c)
|
|
3,767,000
|
PPL Electric Utilities Corp., (SOFR + 0.33%), 2.32%, due 6/24/2024
|
3,723,154(c)
|
|
2,507,000
|
Southern California Edison Co., (SOFR + 0.47%), 2.77%, due 12/2/2022
|
2,504,513(c)
|
|
|
|
18,508,364
|
|
Entertainment 0.8%
|
||
|
2,010,000
|
Magallanes, Inc., (SOFR + 1.78%), 3.66%, due 3/15/2024
|
2,009,289(b)(c)
|
|
Gas 0.7%
|
||
|
565,000
|
Atmos Energy Corp., (3M USD LIBOR + 0.38%), 2.07%, due 3/9/2023
|
564,785(c)
|
|
601,000
|
CenterPoint Energy Resources Corp., (3M USD LIBOR + 0.50%), 3.60%, due
3/2/2023
|
600,024(c)
|
|
585,000
|
Southern California Gas Co., (3M USD LIBOR + 0.35%), 2.09%, due 9/14/2023
|
582,102(c)
|
|
|
|
1,746,911
|
|
Healthcare - Products 2.6%
|
||
|
2,500,000
|
Baxter Int'l, Inc., (SOFR + 0.26%), 2.56%, due 12/1/2023
|
2,481,916(c)
|
|
|
Thermo Fisher Scientific, Inc.
|
|
|
1,995,000
|
(SOFR + 0.35%), 2.53%, due 4/18/2023
|
1,993,859(c)
|
|
1,755,000
|
(SOFR + 0.39%), 2.57%, due 10/18/2023
|
1,747,671(c)
|
|
|
|
6,223,446
|
|
Healthcare - Services 1.2%
|
||
|
2,845,000
|
Roche Holdings, Inc., (SOFR + 0.56%), 2.35%, due 3/10/2025
|
2,837,307(b)(c)
|
|
Insurance 0.6%
|
||
|
1,356,000
|
Protective Life Global Funding, (SOFR + 0.98%), 2.99%, due 3/28/2025
|
1,350,237(b)(c)
|
|
Machinery - Construction & Mining 2.0%
|
||
|
|
Caterpillar Financial Services Corp.
|
|
|
605,000
|
(SOFR + 0.15%), 2.45%, due 11/17/2022
|
604,752(c)
|
|
4,344,000
|
(SOFR + 0.27%), 2.09%, due 9/13/2024
|
4,304,279(c)
|
|
|
|
4,909,031
|
See Notes to Consolidated Financial Statements
11
Consolidated Schedule of Investments Commodity Strategy Fund^ (cont’d)
|
Principal Amount
|
Value
|
|
|
|
||
|
Machinery - Diversified 1.8%
|
||
|
|
John Deere Capital Corp.
|
|
|
$ 955,000
|
(3M USD LIBOR + 0.55%), 2.18%, due 6/7/2023
|
$ 956,771(c)
|
|
2,323,000
|
(SOFR + 0.12%), 2.19%, due 7/10/2023
|
2,316,969(c)
|
|
605,000
|
(SOFR + 0.20%), 2.27%, due 10/11/2024
|
599,331(c)
|
|
398,000
|
(SOFR + 0.56%), 2.22%, due 3/7/2025
|
394,788(c)
|
|
|
|
4,267,859
|
|
Media 1.3%
|
||
|
2,504,000
|
Comcast Cable Communications Holdings, Inc., 9.46%, due 11/15/2022
|
2,533,318
|
|
645,000
|
Comcast Corp., (3M USD LIBOR + 0.63%), 3.14%, due 4/15/2024
|
645,137(c)
|
|
|
|
3,178,455
|
|
Miscellaneous Manufacturer 2.0%
|
||
|
|
General Electric Co.
|
|
|
3,440,000
|
(3M USD LIBOR + 1.00%), 2.83%, due 3/15/2023
|
3,438,890(c)
|
|
580,000
|
(3M USD LIBOR + 1.00%), 3.51%, due 4/15/2023
|
578,459(c)
|
|
730,000
|
Siemens Financieringsmaatschappij NV, (SOFR + 0.43%), 2.24%, due 3/11/2024
|
729,753(b)(c)
|
|
|
|
4,747,102
|
|
Pharmaceuticals 1.9%
|
||
|
4,659,000
|
AbbVie, Inc., (3M USD LIBOR + 0.65%), 3.63%, due 11/21/2022
|
4,662,821(c)
|
|
Pipelines 1.2%
|
||
|
3,040,000
|
Enbridge, Inc., (SOFR + 0.63%), 2.92%, due 2/16/2024
|
3,015,672(c)
|
|
Real Estate Investment Trusts 1.7%
|
||
|
4,090,000
|
Simon Property Group L.P., (SOFR + 0.43%), 2.55%, due 1/11/2024
|
4,052,299(c)
|
|
Retail 1.0%
|
||
|
2,505,000
|
Starbucks Corp., (SOFR + 0.42%), 2.71%, due 2/14/2024
|
2,491,370(c)
|
|
Semiconductors 1.0%
|
||
|
2,462,000
|
Analog Devices, Inc., (SOFR + 0.25%), 2.30%, due 10/1/2024
|
2,427,396(c)
|
|
Telecommunications 3.2%
|
||
|
|
AT&T, Inc.
|
|
|
455,000
|
(3M USD LIBOR + 0.89%), 3.80% NBIA, due 2/15/2023
|
455,329(c)
|
|
4,759,000
|
(SOFR + 0.64%), 2.64%, due 3/25/2024
|
4,729,037(c)
|
|
2,605,000
|
Verizon Communications, Inc., (SOFR + 0.50%), 2.45%, due 3/22/2024
|
2,585,377(c)
|
|
|
|
7,769,743
|
|
Total Corporate Bonds (Cost $136,169,183)
|
135,488,236
|
|
See Notes to Consolidated Financial Statements
12
Consolidated Schedule of Investments Commodity Strategy Fund^ (cont’d)
|
Number of Shares
|
Value
|
|
|
|
||
|
Short-Term Investments 13.9%
|
||
|
Investment Companies 13.9%
|
||
|
33,637,212
|
State Street Institutional U.S. Government Money Market Fund Premier Class,
2.25%(e)
(Cost $33,637,212)
|
$33,637,212
|
|
Total Investments 91.1% (Cost $220,810,253)
|
219,614,311
|
|
|
Other Assets Less Liabilities 8.9%
|
21,370,755(f)
|
|
|
Net Assets 100.0%
|
$240,985,066
|
|
|
(a)
|
Rate shown was the discount rate at the date of purchase.
|
|
(b)
|
Securities were purchased under Rule 144A of the Securities Act of 1933, as amended, or are
otherwise
restricted and, unless registered under the Securities Act of 1933 or exempted from
registration, may only
be sold to qualified institutional investors or may have other restrictions on resale. At August
31, 2022,
these securities amounted to $22,416,474, which represents 9.3% of net assets of the Fund.
|
|
(c)
|
Variable or floating rate security. The interest rate shown was the current rate as of August
31, 2022 and
changes periodically.
|
|
(d)
|
Security issued at a fixed coupon rate, which converts to a variable rate at a future date. Rate
shown is the
rate in effect as of period end.
|
|
(e)
|
Represents 7-day effective yield as of August 31, 2022.
|
|
(f)
|
Includes the impact of the Fund’s open positions in derivatives at August 31, 2022.
|
See Notes to Consolidated Financial Statements
13
Consolidated Schedule of Investments Commodity Strategy Fund^ (cont’d)
Derivative Instruments
Futures contracts ("futures")
At August 31, 2022, open positions in futures for the Fund were as follows:
|
Long Futures:
|
|
Expiration
Date
|
Number of
Contracts
|
Open Contracts
|
Notional
Amount
|
Value and
Unrealized
Appreciation/
(Depreciation)
|
|
9/2022
|
63
|
Nickel
|
$8,065,386
|
$(4,692,408)
|
|
10/2022
|
61
|
Lead
|
2,979,469
|
(217,252)
|
|
10/2022
|
33
|
Nickel
|
4,230,666
|
(1,161,179)
|
|
10/2022
|
65
|
Platinum
|
2,687,750
|
(415,616)
|
|
10/2022
|
129
|
Primary Aluminum
|
7,633,575
|
(1,533,003)
|
|
10/2022
|
134
|
Zinc
|
11,730,025
|
(394,443)
|
|
11/2022
|
62
|
Lead
|
3,024,825
|
(250,599)
|
|
11/2022
|
126
|
New York Harbor ULSD
|
19,098,828
|
2,467,111
|
|
11/2022
|
41
|
Nickel
|
5,264,892
|
(901,538)
|
|
11/2022
|
122
|
Primary Aluminum
|
7,196,475
|
(459,385)
|
|
11/2022
|
107
|
Soybean
|
7,610,375
|
(555,235)
|
|
11/2022
|
155
|
Zinc
|
13,455,937
|
(242,305)
|
|
12/2022
|
94
|
Cocoa
|
2,268,220
|
61,206
|
|
12/2022
|
38
|
Coffee 'C'
|
3,352,313
|
30,260
|
|
12/2022
|
176
|
Copper
|
15,481,400
|
(3,542,991)
|
|
12/2022
|
587
|
Corn
|
19,679,175
|
2,681,993
|
|
12/2022
|
123
|
Cotton No. 2
|
6,962,415
|
(53,250)
|
|
12/2022
|
200
|
Gold 100 Oz.
|
34,524,000
|
(1,206,684)
|
|
12/2022
|
135
|
Hard Red Winter Wheat
|
6,159,375
|
(1,352,455)
|
|
12/2022
|
57
|
Lead
|
2,778,750
|
(46,104)
|
|
12/2022
|
77
|
Natural Gas
|
7,181,020
|
1,105,718
|
|
12/2022
|
45
|
Nickel
|
5,787,990
|
(150,445)
|
|
12/2022
|
7
|
Palladium
|
1,455,230
|
(127,376)
|
|
12/2022
|
131
|
Primary Aluminum
|
7,735,550
|
(126,908)
|
|
12/2022
|
182
|
RBOB Gasoline
|
18,024,552
|
(895,356)
|
|
12/2022
|
78
|
Silver
|
6,973,980
|
(1,125,545)
|
|
12/2022
|
278
|
Soybean Meal
|
11,539,780
|
415,029
|
|
12/2022
|
153
|
Soybean Oil
|
6,194,664
|
(571,715)
|
|
12/2022
|
106
|
Wheat
|
4,406,950
|
(1,177,315)
|
|
12/2022
|
169
|
Zinc
|
14,542,450
|
1,771,393
|
|
1/2023
|
182
|
Brent Crude Oil
|
16,913,260
|
121,049
|
|
1/2023
|
25
|
Cattle Feeder
|
2,314,063
|
(55,250)
|
|
1/2023
|
134
|
Low Sulphur Gasoil
|
13,199,000
|
1,050,027
|
|
1/2023
|
165
|
WTI Crude Oil
|
14,440,800
|
90,086
|
|
2/2023
|
172
|
Lean Hogs
|
6,040,640
|
(279,605)
|
|
2/2023
|
51
|
Live Cattle
|
3,127,830
|
(35,835)
|
|
3/2023
|
206
|
Sugar 11
|
4,099,894
|
(57,226)
|
|
Total Long Positions
|
$328,161,504
|
$(11,833,151)
|
||
See Notes to Consolidated Financial Statements
14
Consolidated Schedule of Investments Commodity Strategy Fund^ (cont’d)
|
Short Futures:
|
|
Expiration
Date
|
Number of
Contracts
|
Open Contracts
|
Notional
Amount
|
Value and
Unrealized
Appreciation/
(Depreciation)
|
|
9/2022
|
63
|
Nickel
|
$(8,065,386)
|
$3,346,141
|
|
10/2022
|
61
|
Lead
|
(2,979,469)
|
251,699
|
|
10/2022
|
33
|
Nickel
|
(4,230,666)
|
835,535
|
|
10/2022
|
129
|
Primary Aluminum
|
(7,633,575)
|
575,535
|
|
10/2022
|
134
|
Zinc
|
(11,730,025)
|
269,445
|
|
11/2022
|
62
|
Lead
|
(3,024,825)
|
14,726
|
|
11/2022
|
41
|
Nickel
|
(5,264,892)
|
118,370
|
|
11/2022
|
122
|
Primary Aluminum
|
(7,196,475)
|
74,725
|
|
11/2022
|
155
|
Zinc
|
(13,455,938)
|
(1,827,062)
|
|
12/2022
|
16
|
Lead
|
(780,000)
|
58,324
|
|
12/2022
|
6
|
Nickel
|
(771,732)
|
18,133
|
|
12/2022
|
20
|
Primary Aluminum
|
(1,181,000)
|
26,075
|
|
12/2022
|
15
|
Zinc
|
(1,290,750)
|
(135,884)
|
|
Total Short Positions
|
$(67,604,733)
|
$3,625,762
|
||
|
Total Futures
|
|
$(8,207,389)
|
||
At August 31, 2022, the Fund had $29,252,332 deposited in a segregated account to cover margin requirements on open futures.
For the period ended August 31, 2022, the average notional value for the months where the Fund had futures outstanding was
$294,088,142 for long positions and $(60,485,602) for short positions.
The following is a summary, categorized by Level (see Note A of the Notes to Consolidated Financial Statements), of inputs
used to value the Fund’s investments as of August 31, 2022:
|
Asset Valuation Inputs
|
Level 1
|
Level 2
|
Level 3
|
Total
|
|
Investments:
|
|
|
|
|
|
U.S. Treasury Obligations
|
$—
|
$2,993,561
|
$—
|
$2,993,561
|
|
Asset-Backed Securities
|
—
|
47,495,302
|
—
|
47,495,302
|
|
Corporate Bonds#
|
—
|
135,488,236
|
—
|
135,488,236
|
|
Short-Term Investments
|
—
|
33,637,212
|
—
|
33,637,212
|
|
Total Investments
|
$—
|
$219,614,311
|
$—
|
$219,614,311
|
|
#
|
The Consolidated Schedule of Investments provides information on the industry or sector
categorization.
|
The following is a summary, categorized by Level (see Note A of the Notes to Consolidated Financial Statements), of inputs used
to value the Fund’s derivatives as of August 31, 2022:
|
Other Financial Instruments
|
Level 1
|
Level 2
|
Level 3
|
Total
|
|
Futures@
|
|
|
|
|
|
Assets
|
$15,382,580
|
$—
|
$—
|
$15,382,580
|
|
Liabilities
|
(23,589,969)
|
—
|
—
|
(23,589,969)
|
|
Total
|
$(8,207,389)
|
$—
|
$—
|
$(8,207,389)
|
|
@
|
Futures are reported at the cumulative unrealized appreciation/(depreciation) of the instrument.
|
^
A balance indicated with a “—”, reflects either a zero balance or an amount that rounds to less
than 1.
See Notes to Consolidated Financial Statements
15
Consolidated Statement of Assets and Liabilities
Neuberger Berman Alternative Funds
|
|
Commodity
Strategy Fund**
|
|
|
August 31, 2022
|
|
Assets
|
|
|
Investments in securities, at value* (Note A)—
see Consolidated Schedule of Investments:
|
|
|
Unaffiliated issuers(a)
|
$219,614,311
|
|
Cash collateral segregated for futures contracts (Note A)
|
29,252,332
|
|
Interest receivable
|
651,480
|
|
Receivable from Management—net (Note B)
|
83,924
|
|
Receivable for Fund shares sold
|
75,202
|
|
Prepaid expenses and other assets
|
49,590
|
|
Total Assets
|
249,726,839
|
|
Liabilities
|
|
|
Payable to investment manager (Note B)
|
118,087
|
|
Payable for Fund shares redeemed
|
236,985
|
|
Payable for accumulated variation margin on futures contracts (Note A)
|
8,207,389
|
|
Payable to trustees
|
7,976
|
|
Other accrued expenses and payables
|
171,336
|
|
Total Liabilities
|
8,741,773
|
|
Net Assets
|
$240,985,066
|
|
Net Assets consist of:
|
|
|
Paid-in capital
|
$321,264,023
|
|
Total distributable earnings/(losses)
|
(80,278,957)
|
|
Net Assets
|
$240,985,066
|
|
Net Assets
|
|
|
Institutional Class
|
$209,469,125
|
|
Class A
|
31,215,166
|
|
Class C
|
300,775
|
|
Shares Outstanding ($.001 par value; unlimited shares authorized)
|
|
|
Institutional Class
|
8,084,443(b)
|
|
Class A
|
5,494,715
|
|
Class C
|
53,314
|
|
Net Asset Value, offering and redemption price per share
|
|
|
Institutional Class
|
$25.91(b)
|
|
Net Asset Value and redemption price per share
|
|
|
Class A
|
$5.68
|
|
Offering Price per share
|
|
|
Class A‡
|
$6.03
|
|
Net Asset Value and offering price per share
|
|
|
Class C^
|
$5.64
|
|
*Cost of Investments:
|
|
|
(a) Unaffiliated issuers
|
$220,810,253
|
|
|
|
|
(b)
|
Updated to reflect the effect of a reverse stock split that occurred after the close of business
on October 14, 2022. See Note J of the
Notes to Consolidated Financial Statements.
|
|
**
|
The Fund has changed its fiscal year end from October 31 to August 31. See Note G of the Notes to
Consolidated Financial
Statements.
|
|
‡
|
On single retail sales of less than $50,000. On sales of $50,000 or more or in certain other
circumstances described in the Fund's
prospectus, offering price is reduced.
|
|
^
|
Redemption price per share is equal to net asset value less any applicable contingent deferred
sales charge.
|
See Notes to Consolidated Financial Statements
16
Consolidated Statements of Operations
Neuberger Berman Alternative Funds
|
|
Commodity
Strategy Fund
|
Commodity
Strategy Fund
|
|
|
For the Period From
November 1, 2021 to
August 31, 2022**
|
For the Fiscal
Year Ended
October 31, 2021
|
|
Investment Income:
|
|
|
|
Income (Note A):
|
|
|
|
Interest and other income—unaffiliated issuers
|
$1,703,216
|
$544,460
|
|
Expenses:
|
|
|
|
Investment management fees (Note B)
|
898,810
|
721,725
|
|
Administration fees (Note B):
|
|
|
|
Institutional Class
|
231,024
|
181,132
|
|
Class A
|
66,643
|
61,274
|
|
Class C
|
360
|
61
|
|
Distribution fees (Note B):
|
|
|
|
Class A
|
64,080
|
58,917
|
|
Class C
|
1,386
|
234
|
|
Shareholder servicing agent fees:
|
|
|
|
Institutional Class
|
2,770
|
1,347
|
|
Class A
|
5,642
|
5,194
|
|
Class C
|
144
|
194
|
|
Audit fees
|
69,384
|
73,496
|
|
Subsidiary Administration Fees
|
41,667
|
50,001
|
|
Custodian and accounting fees
|
92,231
|
97,734
|
|
Insurance
|
3,355
|
4,207
|
|
Legal fees
|
136,479
|
123,061
|
|
Registration and filing fees
|
48,702
|
59,200
|
|
Shareholder reports
|
40,756
|
11,852
|
|
Trustees' fees and expenses
|
38,140
|
43,394
|
|
Interest
|
383
|
6,569
|
|
Miscellaneous and other fees (Note A)
|
14,412
|
14,437
|
|
Total expenses
|
1,756,368
|
1,514,029
|
|
Expenses reimbursed by Management (Note B)
|
(344,424)
|
(363,816)
|
|
Total net expenses
|
1,411,944
|
1,150,213
|
|
Net investment income/(loss)
|
$291,272
|
$(605,753)
|
|
Realized and Unrealized Gain/(Loss) on Investments (Note A):
|
|
|
|
Net realized gain/(loss) on:
|
|
|
|
Transactions in investment securities of unaffiliated issuers
|
(38,036)
|
73,986
|
|
Expiration or closing of futures contracts
|
34,289,508
|
56,462,005
|
|
Change in net unrealized appreciation/(depreciation) in value of:
|
|
|
|
Investment securities of unaffiliated issuers
|
(1,299,180)
|
(113,507)
|
|
Futures contracts
|
(13,254,576)
|
2,437,048
|
|
Net gain/(loss) on investments
|
19,697,716
|
58,859,532
|
|
Net increase/(decrease) in net assets resulting from operations
|
$19,988,988
|
$58,253,779
|
|
|
|
|
**
|
The Fund has changed its fiscal year end from October 31 to August 31. See Note G of the Notes to
Consolidated Financial
Statements.
|
See Notes to Consolidated Financial Statements
17
Consolidated Statements of Changes in Net Assets
Neuberger Berman Alternative Funds
|
|
Commodity
Strategy Fund
|
||
|
|
Period Ended From
|
Year Ended
|
Year Ended
|
|
|
November 1, 2021 to
August 31, 2022**
|
October 31, 2021
|
October 31, 2020
|
|
Increase/(Decrease) in Net Assets:
|
|
|
|
|
From Operations (Note A):
|
|
|
|
|
Net investment income/(loss)
|
$291,272
|
$(605,753)
|
$940,335
|
|
Net realized gain/(loss) on investments
|
34,251,472
|
56,535,991
|
(28,653,917)
|
|
Change in net unrealized appreciation/(depreciation) of
investments
|
(14,553,756)
|
2,323,541
|
1,061,851
|
|
Net increase/(decrease) in net assets resulting from operations
|
19,988,988
|
58,253,779
|
(26,651,731)
|
|
Distributions to Shareholders From (Note A):
|
|
|
|
|
Distributable earnings:
|
|
|
|
|
Institutional Class
|
(46,096,951)
|
(575,526)
|
(2,329,766)
|
|
Class A
|
(9,160,442)
|
(66,009)
|
(263,335)
|
|
Class C
|
(13,555)
|
—(a)
|
(146)
|
|
Total distributions to shareholders
|
(55,270,948)
|
(641,535)
|
(2,593,247)
|
|
From Fund Share Transactions (Note D):
|
|
|
|
|
Proceeds from shares sold:
|
|
|
|
|
Institutional Class
|
135,750,562
|
44,013,444
|
46,842,515
|
|
Class A
|
12,529,181
|
6,431,839
|
8,442,516
|
|
Class C
|
330,177
|
35,000(a)
|
8,250
|
|
Proceeds from reinvestment of dividends and distributions:
|
|
|
|
|
Institutional Class
|
45,825,965
|
569,330
|
2,310,028
|
|
Class A
|
9,129,267
|
66,000
|
261,469
|
|
Class C
|
9,547
|
—(a)
|
146
|
|
Payments for shares redeemed:
|
|
|
|
|
Institutional Class
|
(89,597,836)
|
(34,656,618)
|
(79,271,860)
|
|
Class A
|
(11,773,110)
|
(7,764,625)
|
(9,336,309)
|
|
Class C
|
(45,016)
|
(8,422)(a)
|
(19,204)
|
|
Net increase/(decrease) from Fund share transactions
|
102,158,737
|
8,685,948
|
(30,762,449)
|
|
Net Increase/(Decrease) in Net Assets
|
66,876,777
|
66,298,192
|
(60,007,427)
|
|
Net Assets:
|
|
|
|
|
Beginning of period
|
174,108,289
|
107,810,097
|
167,817,524
|
|
End of period
|
$240,985,066
|
$174,108,289
|
$107,810,097
|
|
|
|
|
**
|
The Fund has changed its fiscal year end from October 31 to August 31. See Note G of the Notes to
Consolidated Financial
Statements.
|
|
(a)
|
Neuberger Berman Commodity Strategy Fund Class C shares were fully redeemed on February 2, 2021.
Operations recommenced on
March 24, 2021. The data includes transactions for the full period ended October 31, 2021.
|
See Notes to Consolidated Financial Statements
18
Notes to Consolidated Financial Statements Commodity Strategy Fund
Note A—Summary of Significant Accounting Policies:
1
General: Neuberger
Berman Alternative Funds (the "Trust") is a Delaware statutory trust organized pursuant to an Amended and Restated Trust Instrument dated March 27, 2014. The Trust is registered as an open-end management investment company under the
Investment Company Act of 1940, as amended (the "1940 Act"), and its shares are registered under the Securities Act of 1933, as amended. Neuberger Berman Commodity Strategy Fund ("the Fund") is a separate operating series of the
Trust. Under the 1940 Act, the status of a fund that was registered as non-diversified may, under certain circumstances, change to that of a diversified fund (the Fund became diversified in August 2015). The Fund offers Institutional
Class shares, Class A shares and Class C shares. The Trust’s Board of Trustees (the "Board") may establish additional series or classes of shares without the approval of shareholders.
A balance indicated with a "—", reflects either a zero balance or a balance that rounds to less than 1.
The assets of the Fund belong only to the Fund, and the liabilities of the Fund are borne solely by the Fund
and no other series of the Trust.
The Fund is an investment company and accordingly follows the investment company accounting and reporting
guidance of the Financial Accounting Standards Board ("FASB") Accounting Standards Codification ("ASC") Topic 946 "Financial Services—Investment Companies."
The preparation of financial statements in accordance with U.S. generally accepted accounting principles
("GAAP") requires Management to make estimates and assumptions at the date of the financial statements. Actual results could differ from those estimates.
The Fund invests in commodity-related instruments through Neuberger Berman Cayman Commodity Fund I Ltd. (the
"CS Subsidiary"), which is organized under the laws of the Cayman Islands. Subscription agreements were entered into between the Fund and the CS Subsidiary with the intent that the Fund will remain the sole shareholder of the CS
Subsidiary. The CS Subsidiary is governed by its own Board of Directors.
As of August 31, 2022, the value of the Fund’s investment in the CS Subsidiary was as follows:
|
|
Investment in
CS Subsidiary
|
Percentage of
Net Assets
|
|
|
$45,685,747
|
19.0%
|
2
Consolidation: The
accompanying financial statements of the Fund present the consolidated accounts of the Fund and the CS Subsidiary. All intercompany accounts and transactions have been eliminated in consolidation.
3
Portfolio valuation:
In accordance with ASC 820 "Fair Value Measurement" ("ASC 820"), all investments held by the Fund are carried at the value that Management believes the Fund would receive upon selling an investment in an orderly transaction to an
independent buyer in the principal or most advantageous market for the investment under current market conditions. Various inputs, including the volume and level of activity for the asset or liability in the market, are considered in
valuing the Fund's investments, some of which are discussed below. Significant Management judgment may be necessary to value investments in accordance with ASC 820.
ASC 820 established a three-tier hierarchy of inputs to create a classification of value measurements for
disclosure purposes. The three-tier hierarchy of inputs is summarized in the three broad Levels listed below.
•
Level 1 – unadjusted quoted prices in active markets for identical investments
19
•
Level 2 – other observable inputs (including quoted prices for similar investments, interest
rates, prepayment speeds, credit risk, amortized cost, etc.)
•
Level 3 – unobservable inputs (including the Fund's own assumptions in determining the fair
value of investments)
The inputs or methodology used for valuing an investment are not necessarily an indication of the risk
associated with investing in those securities.
The value of the Fund’s investments in debt securities is determined by Management primarily by obtaining
valuations from independent pricing services based on readily available bid quotations, or if quotations are not available, by methods which include various considerations based on security type (generally Level 2 inputs). In addition to
the consideration of yields or prices of securities of comparable quality, coupon, maturity and type, indications as to values from dealers, and general market conditions, the following is a description of other Level 2 inputs and related
valuation techniques used by independent pricing services to value certain types of debt securities held by the Fund:
Corporate Bonds. Inputs used to
value corporate debt securities generally include relevant credit information, observed market movements, sector news, U.S. Treasury yield curve or relevant benchmark curve, and other market information, which may include benchmark yield
curves, reported trades, broker-dealer quotes, issuer spreads, comparable securities, and reference data, such as market research publications, when available ("Other Market Information").
U.S. Treasury Obligations. Inputs
used to value U.S. Treasury securities generally include quotes from several inter-dealer brokers and Other Market Information.
Asset-Backed Securities. Inputs
used to value asset-backed securities generally include models that consider a number of factors, which may include the following: prepayment speeds, cash flows, spread adjustments and Other Market Information.
The value of futures contracts is determined by Management by obtaining valuations from independent pricing
services at the settlement price at the market close (Level 1 inputs).
Management has developed a process to periodically review information provided by independent pricing services
for all types of securities.
Investments in non-exchange traded investment companies with a readily determinable fair value are valued using
the respective fund’s daily calculated net asset value ("NAV") per share (Level 2 inputs).
If a valuation is not available from an independent pricing service, or if Management has reason to believe
that the valuation received does not represent the amount the Fund might reasonably expect to receive on a current sale in an orderly transaction, Management seeks to obtain quotations from brokers or dealers (generally considered Level 2
or Level 3 inputs depending on the number of quotes available). If such quotations are not readily available, the security is valued using methods the Board has approved in the good-faith belief that the resulting valuation will reflect
the fair value of the security. Inputs and assumptions considered in determining the fair value of a security based on Level 2 or Level 3 inputs may include, but are not limited to, the type of the security; the initial cost of the
security; the existence of any contractual restrictions on the security’s disposition; the price and extent of public trading in similar securities of the issuer or of comparable companies; quotations or evaluated prices from
broker-dealers and/or pricing services; information obtained from the issuer and/or analysts; an analysis of the company’s or issuer’s financial statements; an evaluation of the inputs that influence the issuer and the market(s) in which
the security is purchased and sold.
In December 2020, the Securities and Exchange Commission ("SEC") adopted Rule 2a-5 under the 1940 Act, which
establishes requirements for determining fair value in good faith for purposes of the 1940 Act, including related oversight and reporting requirements. The rule also defines when market quotations are "readily available" for purposes of
the 1940 Act, which is the threshold for determining whether a fund must fair value a security. The compliance date for Rule 2a-5 was September 8, 2022 (the "Compliance Date"). Effective as of the Compliance Date, the Board approved
changes to the Fund's valuation policy to
20
comply with Rule 2a-5 and designated Management as the Fund's valuation designee (as defined in the rule). The
valuation designee will be responsible for determining fair value in good faith for any and all Fund investments, subject to oversight by the Board.
4
Foreign currency translations: The accounting records of the Fund and the CS Subsidiary are maintained in U.S. dollars. Foreign currency amounts are normally translated into U.S. dollars using the exchange rate as of 4:00 p.m. Eastern Time, on
days the NYSE is open for business, to determine the value of investments, other assets and liabilities. Purchase and sale prices of securities, and income and expenses, are translated into U.S. dollars at the prevailing rate of
exchange on the respective dates of such transactions. Net unrealized foreign currency gain/(loss), if any, arises from changes in the value of assets and liabilities, other than investments in securities, as a result of changes in
exchange rates and is stated separately in the Consolidated Statements of Operations.
5
Securities transactions and investment income: Securities transactions are recorded on trade date for financial reporting purposes. Dividend income is recorded on the ex-dividend date or, for certain foreign dividends, as soon as the Fund becomes
aware of the dividends. Non-cash dividends included in dividend income, if any, are recorded at the fair market value of the securities received. Interest income, including accretion of discount (adjusted for original issue discount,
where applicable) and amortization of premium, where applicable, is recorded on the accrual basis. Realized gains and losses from securities transactions and foreign currency transactions, if any, are recorded on the basis of
identified cost and stated separately in the Consolidated Statement of Operations.
6
Income tax information:The Fund is treated as a separate entity for U.S. federal income tax purposes. It is the policy of the Fund to continue to qualify for treatment as a regulated investment company ("RIC") by complying with the requirements of
the U.S. Internal Revenue Code applicable to RICs and to distribute substantially all of its net investment income and net realized capital gains to its shareholders. To the extent the Fund distributes substantially all of its net
investment income and net realized capital gains to shareholders, no federal income or excise tax provision is required.
ASC 740 "Income Taxes" sets forth a minimum threshold for financial statement recognition of a tax position
taken, or expected to be taken, in a tax return. The Fund recognizes interest and penalties, if any, related to unrecognized tax positions as an income tax expense in the Consolidated Statement of Operations. The Fund is subject to
examination by U.S. federal and state tax authorities for returns filed for the tax years for which the applicable statutes of limitations have not yet expired. As of August 31, 2022, the Fund did not have any unrecognized tax positions.
The CS Subsidiary is a controlled foreign corporation under the U.S. Internal Revenue Code. As a U.S.
shareholder of a controlled foreign corporation, the Fund will include in its taxable income its share of the CS Subsidiary’s current earnings and profits (including net realized gains). Any deficit generated by the CS Subsidiary will be
disregarded for purposes of computing the Fund's taxable income in the current period and also disregarded for all future periods.
For federal income tax purposes, the estimated cost in value of investments held at August 31, 2022 was
$314,687,677. The estimated gross unrealized appreciation was $15,452,157 and estimated gross unrealized depreciation was $118,732,912 resulting in net unrealized depreciation in value of investments of $103,280,755 based on cost for U.S.
federal income tax purposes.
Income distributions and capital gain distributions are determined in accordance with income tax regulations,
which may differ from GAAP. These differences are primarily due to differing treatments of income and gains on various investment securities held by the Fund, timing differences and differing characterization of distributions made by the
Fund. The Fund may also utilize earnings and profits distributed to shareholders on redemption of their shares as a part of the dividends-paid deduction for income tax purposes.
Any permanent differences resulting from different book and tax treatment are reclassified at year-end and have
no impact on net income, NAV or NAV per share of the Fund. For the period ended August 31, 2022, the Fund recorded permanent reclassifications primarily related to one or more of the following: wholly owned subsidiary income and gain
(loss), prior year true up adjustments, and deemed distribution on
21
shareholder redemptions. For the period ended August 31, 2022, the Fund recorded the following permanent
reclassifications:
|
|
Paid-in Capital
|
Total Distributable
Earnings/(Losses)
|
|
|
$36,404,219
|
$(36,404,219)
|
The tax character of distributions paid during the period ended August 31, 2022(a), and during the years ended October 31, 2021, and October 31, 2020, was as follows:
|
Distributions Paid From:
|
|||||||||||
|
Ordinary
Income
|
Long-Term
Capital Gain
|
Return of
Capital
|
Total
|
||||||||
|
2022
|
2021
|
2020
|
2022
|
2021
|
2020
|
2022
|
2021
|
2020
|
2022
|
2021
|
2020
|
|
$55,270,948
|
$641,535
|
$2,593,247
|
$—
|
$—
|
$—
|
$—
|
$—
|
$—
|
$55,270,948
|
$641,535
|
$2,593,247
|
(a)
Period from November 1, 2021 to August 31, 2022.
As of August 31, 2022, the components of distributable earnings (accumulated losses) on a U.S. federal income
tax basis were as follows:
|
|
Undistributed
Ordinary
Income
|
Undistributed
Long-Term
Capital Gain
|
Unrealized
Appreciation/
(Depreciation)
|
Loss
Carryforwards
and Deferrals
|
Other
Temporary
Differences
|
Total
|
|
|
$25,607,556
|
$—
|
$(103,280,755)
|
$(2,605,497)
|
$(261)
|
$(80,278,957)
|
The temporary differences between book basis and tax basis distributable earnings are primarily due to: losses
disallowed and recognized on wash sales, amortization of organizational expenses, amortization of bond premium and wholly owned subsidiary inclusions.
To the extent the Fund’s net realized capital gains, if any, can be offset by capital loss carryforwards, it
is the policy of the Fund not to distribute such gains. Capital loss carryforward rules allow for RICs to carry forward capital losses indefinitely and to retain the character of capital loss carryforwards as short-term or long-term. As
determined at August 31, 2022, the Fund had unused capital loss carryforwards available for federal income tax purposes to offset future net realized capital gains, as follows:
|
|
Capital Loss Carryforwards
|
|
|
|
Long-Term
|
Short-Term
|
|
Commodity Strategy
|
127,718
|
2,477,779
|
7
Foreign taxes:
Foreign taxes withheld, if any, represent amounts withheld by foreign tax authorities, net of refunds recoverable.
8
Distributions to shareholders: The Fund may earn income, net of expenses, daily on its investments. Distributions from net investment income and net realized capital gains, if any, are generally distributed once a year (usually in December) and
are recorded on the ex-date.
Subsequent to August 31, 2022, the Fund made a distribution on September 28, 2022 to shareholders of record on
September 26, 2022 in the amounts of $0.63 per share for Class A, $0.59 per share for Class C and $0.65 per share for Institutional Class. Please see Note J of the Notes to Consolidated Financial Statements for additional information.
9
Expense allocation:
Certain expenses are applicable to multiple funds within the complex of related investment companies. Expenses directly attributable to a fund are charged to that fund. Expenses of the Trust that are not directly attributable to a
particular series of the Trust (e.g., the Fund) are allocated among the series of the Trust, on the basis of relative net assets, except where a more appropriate allocation of expenses to each of the series can otherwise be made
fairly. Expenses borne by the complex of related investment companies, which includes open-end and closed-end investment companies for which NBIA
22
serves as investment manager, that are not directly attributable to a particular investment company in the
complex (e.g., the Trust) or series thereof are allocated among the investment companies in the complex or series thereof on the basis of relative net assets, except where a more appropriate allocation of expenses to each of the
investment companies in the complex or series thereof can otherwise be made fairly. The Fund’s expenses (other than those specific to each class) are allocated proportionally each day among its classes based upon the relative net assets
of each class.
10
Investments in foreign securities: Investing in foreign securities may involve sovereign and other risks, in addition to the credit and market risks normally associated with domestic securities. These additional risks include the possibility of
adverse political and economic developments (including political instability, nationalization, expropriation, or confiscatory taxation) and the potentially adverse effects of unavailability of public information regarding issuers,
less governmental supervision and regulation of financial markets, reduced liquidity of certain financial markets, and the lack of uniform accounting, auditing, and financial reporting standards or the application of standards that
are different or less stringent than those applied in the United States. Foreign securities also may experience greater price volatility, higher rates of inflation, and delays in settlement.
11
When-issued/delayed delivery securities: The Fund may purchase securities with delivery or payment to occur at a later date beyond the normal settlement period. At the time the Fund enters into a commitment to purchase a security, the transaction is
recorded and the value of the security is reflected in the NAV. The price of such security and the date when the security will be delivered and paid for are fixed at the time the transaction is negotiated. The value of the security
may vary with market fluctuations. No interest accrues to the Fund until payment takes place. When-issued and delayed delivery transactions can have a leverage-like effect on the Fund, which can increase fluctuations in the Fund’s
NAV. Certain risks may arise upon entering into when-issued or delayed delivery securities transactions from the potential inability of counterparties to meet the terms of their contracts or if the issuer does not issue the securities
due to political, economic, or other factors. Additionally, losses may arise due to changes in the value of the underlying securities.
The Fund may also enter into a TBA agreement and "roll over" such agreement prior to the settlement date by
selling the obligation to purchase the pools set forth in the agreement and entering into a new TBA agreement for future delivery of pools of mortgage-backed securities. TBA mortgage-backed securities may increase prepayment risks because
the underlying mortgages may be less favorable than anticipated by the Fund.
12
Derivative instruments: The Fund’s use of derivatives during the period ended August 31, 2022, is described below. Please see the Consolidated Schedule of Investments for the Fund's open positions in derivatives at August 31, 2022. The disclosure
requirements of ASC 815 "Derivatives and Hedging" ("ASC 815") distinguish between derivatives that qualify for hedge accounting and those that do not. Because investment companies value their derivatives at fair value and recognize
changes in fair value through the Consolidated Statement of Operations, they do not qualify for hedge accounting. Accordingly, even though the Fund’s investments in derivatives may represent economic hedges, they are considered
non-hedge transactions for purposes of this disclosure.
The SEC adopted Rule 18f-4 under the 1940 Act which, effective August 19, 2022, regulates the use of
derivatives for certain funds registered under the 1940 Act ("Rule 18f-4"). The Fund has adopted a Rule 18f-4 Policy which provides, among other things, that unless the Fund qualifies as a "limited derivatives user" as defined in Rule
18f-4, the Fund is subject to a comprehensive derivatives risk management program, to comply with certain value-at-risk based leverage limits and to provide additional disclosure both publicly and to the SEC regarding its derivatives
positions. If the Fund qualifies as a limited derivatives user, Rule 18f-4 requires the Fund to have policies and procedures to manage its aggregate derivatives risk.
Futures contracts: During the
period ended August 31, 2022, the Fund used commodity futures contracts including bitcoin futures contracts (through investments in the CS Subsidiary) to provide investment exposure to individual commodities, as well as to manage and/or
adjust the risk profile of the Fund.
23
At the time the Fund or CS Subsidiary enters into a futures contract, it is required to deposit with the
futures commission merchant a specified amount of cash or liquid securities, known as "initial margin," which is a percentage of the value of the futures contract being traded that is set by the exchange upon which the futures contract is
traded. Each day, the futures contract is valued at the official settlement price of the board of trade or U.S. commodity exchange on which such futures contract is traded. Subsequent payments, known as "variation margin," to and from the
broker are made on a daily basis, or as needed, as the market price of the futures contract fluctuates. Daily variation margin adjustments, arising from this "mark to market," are recorded by the Fund or CS Subsidiary as unrealized gains
or losses.
Although some futures by their terms call for actual delivery or acquisition of the underlying securities or
currency, in most cases the contracts are closed out prior to delivery by offsetting purchases or sales of matching futures. When the contracts are closed or expire, the Fund or CS Subsidiary recognizes a gain or loss. Risks of entering
into futures contracts include the possibility there may be an illiquid market, possibly at a time of rapidly declining prices, and/or a change in the value of the contract may not correlate with changes in the value of the underlying
securities. Futures executed on regulated futures exchanges have minimal counterparty risk to the Fund or CS Subsidiary because the exchange’s clearinghouse assumes the position of the counterparty in each transaction. Thus, the Fund or
CS Subsidiary is exposed to risk only in connection with the clearinghouse and not in connection with the original counterparty to the transaction. The Fund or CS Subsidiary may invest in cash-settled bitcoin futures that are traded on
commodity exchanges registered with the Commodity Futures Trading Commission.
For U.S. federal income tax purposes, the futures transactions undertaken by the Fund or CS Subsidiary may
cause the Fund or CS Subsidiary to recognize gains or losses from marking contracts to market even though its positions have not been sold or terminated, may affect the character of the gains or losses recognized as long-term or
short-term, and may affect the timing of some capital gains and losses realized by the Fund or CS Subsidiary. Also, the Fund’s or CS Subsidiary's losses on transactions involving futures contracts may be deferred rather than being taken
into account currently in calculating the Fund’s or CS Subsidiary's taxable income.
At August 31, 2022, the Fund had the following derivatives (which did not qualify as hedging instruments under
ASC 815), grouped by primary risk exposure:
|
|
Asset Derivatives
|
Liability Derivatives
|
||
|
Fund
|
Consolidated Statement of
Assets and Liabilities
Location
|
Value
|
Consolidated Statement of
Assets and Liabilities
Location
|
Value
|
|
Commodity Strategy
|
|
|
|
|
|
Futures
|
|
|
|
|
|
Commodity risk
|
Receivable/Payable for
accumulated variation margin on
futures contracts
|
$15,382,580
|
Receivable/Payable for
accumulated variation margin on
futures contracts
|
$(23,589,969)
|
The impact of the use of these derivative instruments on the Consolidated Statements of Operations during the
period ended August 31, 2022, was as follows:
|
Fund
|
Net Realized Gain/
(Loss) on Derivatives(a)
|
|
Change in Net Unrealized
Appreciation/
(Depreciation) on
Derivatives(b)
|
|
Commodity Strategy
|
|
|
|
|
Futures
|
|
|
|
|
Commodity risk
|
$34,289,508
|
|
(13,254,576)
|
24
|
(a)
|
Realized gains/(losses) on derivatives are located in the Consolidated Statements of Operations
each under
the caption, "Net realized gain/(loss) on:"
|
|
Futures
|
Expiration or closing of futures contracts
|
|
(b)
|
Change in unrealized appreciation/(depreciation) is located in the Consolidated Statements of
Operations
each under the caption, "Change in net unrealized appreciation/(depreciation) in value of:"
|
|
Futures
|
Futures contracts
|
13
Securities lending: The
Fund, using State Street as its lending agent, may loan securities to qualified brokers and dealers in exchange for negotiated lender’s fees. These fees, if any, would be disclosed within the Consolidated Statement of Operations under
the caption "Income from securities loaned-net" and are net of expenses retained by State Street as compensation for its services as lending agent.
The initial collateral received by the Fund at the beginning of each transaction shall have a value equal to at
least 102% of the prior day’s market value of the loaned securities (105% in the case of international securities). Collateral in the form of cash and/or securities issued or guaranteed by the U.S. government or its agencies, equivalent
to at least 100% of the market value of securities, is maintained at all times. Thereafter, the value of the collateral is monitored on a daily basis, and collateral is moved daily between a counterparty and the Fund until the close of
the transaction. Cash collateral is generally invested in a money market fund registered under the 1940 Act that is managed by an affiliate of State Street and is included on the Statement of Assets and Liabilities. The total value of
securities received as collateral for securities on loan is included in a footnote following the Schedule of Investments, but is not included within the Statement of Assets and Liabilities because the receiving Fund does not have the
right to sell or repledge the securities received as collateral. The risks associated with lending portfolio securities include, but are not limited to, possible delays in receiving additional collateral or in the recovery of the loaned
securities. Any increase or decrease in the fair value of the securities loaned and any interest earned or dividends paid or owed on those securities during the term of the loan would accrue to the Fund.
As of August 31, 2022, the Fund did not participate in securities lending.
14
Indemnifications:
Like many other companies, the Trust’s organizational documents provide that its officers ("Officers") and trustees ("Trustees") are indemnified against certain liabilities arising out of the performance of their duties to the Trust.
In addition, both in some of its principal service contracts and in the normal course of its business, the Trust enters into contracts that provide indemnifications to other parties for certain types of losses or liabilities. The
Trust’s maximum exposure under these arrangements is unknown as this could involve future claims against the Trust.
15
Investment company securities and exchange-traded funds: The Fund may invest in shares of other registered investment companies, including exchange-traded funds ("ETFs"), within the limitations prescribed by the 1940 Act, in reliance on rules
adopted by the SEC, particularly Rule 12d1-4 under the 1940 Act, which the Fund was required to comply with on January 19, 2022, or any other applicable exemptive relief. Prior to the compliance date of Rule 12d1-4, the Fund was
permitted to invest in both affiliated and unaffiliated investment companies, including ETFs, in excess of the limits in Section 12(d)(1)(A) of the 1940 Act, subject to the terms and conditions of exemptive orders. These exemptive
orders along with Rule 12d1-2 were rescinded upon the compliance date of Rule 12d1-4. Rule 12d1-4 contains elements from the SEC's prior exemptive orders permitting fund of funds arrangements, and includes (i) limits on control and
voting; (ii) required evaluations and findings; (iii) required fund of funds investment agreements; and (iv) limits on complex structures. Some ETFs seek to track the performance of a particular market index. These indices include
both broad-based market indices and more narrowly-based indices, including those relating to particular sectors, markets, regions or industries. However, some ETFs have an actively-managed investment objective. ETF shares are traded
like traditional equity securities on a national securities exchange or NASDAQ. The Fund will indirectly bear its proportionate share of any management fees and other expenses paid by such other investment companies, which will
decrease returns.
16
Other: All net
investment income and realized and unrealized capital gains and losses of the Fund are allocated, on the basis of relative net assets, pro rata among its respective classes.
25
Note B—Investment Management Fees, Administration Fees, Distribution Arrangements, and Other Transactions with
Affiliates:
The Fund retains NBIA as its investment manager under a Management Agreement. For such investment management services, the Fund
and CS Subsidiary pays NBIA an investment management fee as a percentage of average daily net assets(a) according to the following table:
|
|
||||||||
|
|
First
$250
million
|
Next
$250
million
|
Next
$250
million
|
Next
$250
million
|
Next
$500
million
|
Next
$500
million
|
Next
$2
billion
|
Thereafter
|
|
For Commodity Strategy and CS Subsidiary:
|
||||||||
|
|
0.50%
|
0.475%
|
0.45%
|
0.425%
|
0.40%
|
0.375%
|
0.375%
|
0.35%
|
(a) Less the NAV of the CS Subsidiary for Commodity Strategy.
Accordingly, for the period ended August 31, 2022, the investment management fee pursuant to the Management Agreement was
equivalent to an annual effective rate of the Fund's average daily net assets(a),
as follows:
|
|
||
|
|
|
Effective Rate
|
|
Commodity Strategy
|
0.50%
|
|
|
CS Subsidiary
|
0.50%
|
|
(a) Less the NAV of the CS Subsidiary for Commodity Strategy.
The Fund retains NBIA as its administrator under an Administration Agreement. The administration fee is
assessed at the class level and each share class of the Fund, as applicable, pays NBIA an annual administration fee equal to the following: 0.26% for each of Class A and Class C; and 0.15% for Institutional Class, each as a percentage of
its average daily net assets. Additionally, NBIA retains State Street as its sub-administrator under a Sub-Administration Agreement. NBIA pays State Street a fee for all services received under the Sub-Administration Agreement.
NBIA has contractually agreed to waive fees and/or reimburse certain expenses of the Institutional Class, Class
A and Class C of the Fund that offers those classes so that the total annual operating expenses of those classes do not exceed the expense limitations as detailed in the following table. These undertakings exclude interest, taxes,
brokerage commissions, acquired fund fees and expenses, extraordinary expenses, and dividend and interest expenses relating to short sales, if any (commitment fees relating to borrowings are treated as interest for purposes of this
exclusion) ("annual operating expenses"); consequently, net expenses may exceed the contractual expense limitations. The expenses of the CS Subsidiary are included in the total expenses used to calculate the reimbursement, which the Fund
has agreed to share with the CS Subsidiary. For the period ended August 31, 2022, the expenses of the CS Subsidiary amounted to $245,121.
26
At August 31, 2022, contingent liabilities to NBIA under the agreements were as follows:
|
|
|
|
Expenses Reimbursed in
Year Ended August 31,
|
||
|
|
|
|
2020(a)
|
2021(a)
|
2022(b)
|
|
|
|
|
Subject to Repayment until
October 31,
|
||
|
Class
|
Contractual
Expense
Limitation(c)
|
Expiration
|
2023
|
2024
|
2025
|
|
Commodity Strategy Institutional Class
|
0.73%
|
10/31/25
|
$291,571
|
$300,249
|
$290,598
|
|
Commodity Strategy Class A
|
1.09%
|
10/31/25
|
52,155
|
63,318
|
53,415
|
|
Commodity Strategy Class C
|
1.84%
|
10/31/25
|
—
|
237(d)
|
411
|
|
(a)
|
Year ended October 31.
|
|
(b)
|
Period from November 1, 2021 to August 31, 2022.
|
|
(c)
|
Expense limitation per annum of the respective class’s average daily net assets.
|
|
(d)
|
Period from March 24, 2021 (Recommencement of Operations) to October 31, 2021.
|
The Fund has agreed that each of its respective classes will repay NBIA for fees and expenses waived or
reimbursed for that class provided that repayment does not cause that class’s annual operating expenses to exceed its contractual expense limitation in place at the time the fees and expenses were waived or reimbursed, or the expense
limitation in place at the time the Fund repays NBIA, whichever is lower. Any such repayment must be made within three years after the year in which NBIA incurred the expense.
During the period ended August 31, 2022, there was no repayment to NBIA under these agreements.
The Fund also has a distribution agreement with Neuberger Berman BD LLC (the "Distributor") with respect to
each class of shares. The Distributor acts as agent in arranging for the sale of class shares without sales commission or other compensation, except as described below for Class A and Class C shares, and bears the advertising and
promotion expenses.
However, the Distributor receives fees from Class A and Class C under their distribution plans (each a
"Plan", collectively the "Plans") pursuant to Rule 12b-1 under the 1940 Act. The Plans provide that, as compensation for administrative and other services provided to these classes, the Distributor’s activities and expenses related to the
sale and distribution of these classes, and ongoing services provided to investors in these classes, the Distributor receives from each of these classes a fee at the annual rate of 0.25% of Class A’s and 1.00% of Class C’s average daily
net assets. The Distributor receives this amount to provide distribution and shareholder servicing for these classes and pays a portion of it to institutions that provide such services. Those institutions may use the payments for, among
other purposes, compensating employees engaged in sales and/or shareholder servicing. The amount of fees paid by each class during any year may be more or less than the cost of distribution and other services provided to that class. FINRA
rules limit the amount of annual distribution fees that may be paid by a mutual fund and impose a ceiling on the cumulative distribution fees paid. The Trust’s Plans comply with those rules.
Class A shares of the Fund are generally sold with an initial sales charge of up to 5.75%. Class A shares of
each Fund are generally sold with no contingent deferred sales charge ("CDSC"), except that a CDSC of 1.00% applies to certain redemptions made within 18 months following purchases of $1 million or more without an initial sales charge.
Class C shares of each Fund are sold with no initial sales charge and a 1.00% CDSC if shares are sold within one year after purchase.
27
For the period ended August 31, 2022, the Distributor, acting as underwriter and broker-dealer, received net
initial sales charges from the purchase of Class A shares and CDSCs from the redemption of Class A and Class C shares as follows:
|
Commodity Strategy Class A
|
$1,002
|
$—
|
$—
|
$—
|
|
Commodity Strategy Class C
|
—
|
437
|
—
|
—
|
Note C — Securities Transactions:
During the period ended August 31, 2022, there were purchase and sale transactions of long-term securities (excluding futures)
as follows:
|
Purchases of
U.S. Government
and Agency
Obligations
|
Purchases
excluding
U.S. Government
and Agency
Obligations
|
Sales and
Maturities
of
U.S. Government
and Agency
Obligations
|
Sales and
Maturities
excluding
U.S. Government
and Agency
Obligations
|
|
$—
|
$142,440,007
|
$—
|
$76,837,958
|
During the period ended August 31, 2022, no brokerage commissions on securities transactions were paid to
affiliated brokers.
Note D—Fund Share Transactions:
Share activity for the period ended August 31, 2022, and for the years ended October 31, 2021 and October 31, 2020, was as
follows:
|
Commodity Strategy
|
||||||||
|
Institutional Class(a)
|
5,117,728
|
2,084,342
|
(3,382,268)
|
3,819,802
|
1,470,242
|
22,415
|
(1,197,351)
|
295,306
|
|
Class A
|
2,169,512
|
1,890,117
|
(2,057,845)
|
2,001,784
|
956,126
|
11,703
|
(1,163,240)
|
(195,411)
|
|
Class C(b)
|
53,545
|
1,981
|
(7,615)
|
47,911
|
5,403
|
—
|
(1,445)
|
3,958
|
|
|
For the Year Ended October 31, 2020
|
|||
|
|
Shares
Sold
|
Shares
Issued on
Reinvestment
of Dividends
and
Distributions
|
Shares
Redeemed
|
Total
|
|
Commodity Strategy
|
||||
|
Institutional Class(a)
|
2,161,179
|
87,002
|
(3,739,742)
|
(1,491,561)
|
|
Class A
|
1,755,272
|
44,317
|
(1,932,134)
|
(132,545)
|
28
|
|
For the Year Ended October 31, 2020
|
|||
|
|
Shares
Sold
|
Shares
Issued on
Reinvestment
of Dividends
and
Distributions
|
Shares
Redeemed
|
Total
|
|
Class C(b)
|
1,446
|
25
|
(4,359)
|
(2,888)
|
|
(a)
|
After the close of business on October 14, 2022, the Fund's Institutional Class underwent a
reverse stock
split. The capital share activity presented here has been retroactively adjusted to reflect this
split. See Note J
of the Notes to Consolidated Financial Statements.
|
|
(b)
|
Commodity Strategy Class C shares were fully redeemed on February 2, 2021. Operations
recommenced on
March 24, 2021. The data includes share transactions for the full period ended October 31, 2021.
|
Note E—Line of Credit:
At August 31, 2022, the Fund was a participant in a syndicated committed, unsecured $700,000,000 line of credit
(the "Credit Facility"), to be used only for temporary or emergency purposes. Series of other investment companies managed by NBIA also participate in this line of credit on substantially the same terms. Interest is charged on borrowings
under this Credit Facility at the highest of (a) a federal funds effective rate plus 1.00% per annum, (b) a daily SOFR rate plus 1.10% per annum, and (c) an overnight bank funding rate plus 1.00% per annum; provided that should the
Administrative Agent of the Credit Facility determine that the daily simple SOFR rate is unavailable, then the interest rate option described in (b) shall be replaced with a benchmark replacement determined to be applicable by such
Administrative Agent. The Credit Facility has an annual commitment fee of 0.15% per annum of the available line of credit, which is paid quarterly. The Fund has agreed to pay its pro rata share of the annual commitment fee, based on the
ratio of its individual net assets to the net assets of all participants at the time the fee is due, and interest charged on any borrowing made by the Fund and other costs incurred by the Fund. Because several mutual funds participate in
the Credit Facility, there is no assurance that an individual fund will have access to all or any part of the $700,000,000 at any particular time. There were no loans outstanding under the Credit Facility at August 31, 2022. During the
period ended August 31, 2022, the Fund did not utilize the Credit Facility.
Note F—Investments in Affiliates(a):
|
|
Affiliated Person(s)
Percentage
Ownership of
Outstanding Shares
|
|
Commodity Strategy
|
1.82%
|
|
(a)
|
Affiliated persons, as defined in the 1940 Act.
|
Note G — Change in Fiscal Year End:
On June 23, 2022, the Board approved a change in fiscal year end from October 31 to August 31. This change
was effective beginning with this fiscal period, November 1, 2021.
Note H—Recent Accounting Pronouncements:
In January 2021, the FASB issued Accounting Standards Update No. 2021-01 ("ASU 2021-01"), "Reference Rate
Reform (Topic 848)". ASU 2021-01 is an update of Accounting Standards Update No. 2020-04 ("ASU 2020-04"), which is in response to concerns about structural risks of interbank offered rates, and particularly the risk of cessation of LIBOR,
regulators have undertaken reference rate reform initiatives to
29
identify alternative reference rates that are more observable or transaction based and less susceptible to
manipulation. ASU 2020-04 provides optional guidance for a limited period of time to ease the potential burden in accounting for (or recognizing the effects of) reference rate reform on financial reporting. ASU 2020-04 is elective and
applies to all entities, subject to meeting certain criteria, that have contracts, hedging relationships, and other transactions that reference LIBOR or another reference rate expected to be discontinued because of reference rate reform.
The ASU 2021-01 update clarifies that certain optional expedients and exceptions in Topic 848 for contract modifications and hedge accounting apply to derivatives that are affected by the discounting transition. The amendments in this
update are effective immediately through December 31, 2022, for all entities. Management is currently evaluating the implications, if any, of the additional requirements and its impact on the Fund’s consolidated financial statements.
In June 2022, FASB issued Accounting Standards Update No. 2022-03, "Fair Value Measurement of Equity Securities
Subject to Contractual Sale Restrictions" ("ASU 2022-03"). ASU 2022-03 clarifies the guidance in ASC 820, related to the measurement of the fair value of an equity security subject to contractual sale restrictions, where it eliminates the
ability to apply a discount to the fair value of these securities, and introduces disclosure requirements related to such equity securities. The guidance is effective for fiscal years, and interim periods within those fiscal years,
beginning after December 15, 2023, and allows for early adoption. Management is currently evaluating the impact of applying this update.
Note I—Other Matters:
Coronavirus: The outbreak of the
novel coronavirus in many countries has, among other things, disrupted global travel and supply chains, and adversely impacted global commercial activity, the transportation industry and commodity prices in the energy sector. The impact
of this virus has negatively affected and may continue to affect the economies of many nations, individual companies and the global securities and commodities markets, including liquidity and volatility. The development and fluidity of
this situation precludes any prediction as to its ultimate impact, which may have a continued adverse effect on global economic and market conditions. Such conditions (which may be across industries, sectors or geographies) have impacted
and may continue to impact certain issuers of the securities held by the Fund and in turn, may impact the financial performance of the Fund.
Russia's Invasion of Ukraine: Russia’s
invasion of Ukraine, and corresponding events in late February 2022, have had, and could continue to have, severe adverse effects on regional and global economic markets for securities and commodities. Following Russia’s actions, various
governments, including the United States, have issued broad-ranging economic sanctions against Russia. The current events have had, and could continue to have, an adverse effect on global markets performance and liquidity, thereby
negatively affecting the value of the Fund's investments beyond any direct exposure to Russian or Ukrainian issuers. The duration of ongoing hostilities and the vast array of sanctions and related events cannot be predicted. Those events
present material uncertainty and risk with respect to markets globally and the performance of the Fund and its investments or operations could be negatively impacted.
Note J—Subsequent Events:
On June 23, 2022, the Board approved the conversion of the Fund to a newly organized series of the Neuberger
Berman ETF Trust (the "Commodity Strategy ETF"). The conversion occurred on October 21, 2022, and was effected through the reorganization of the Fund into the Commodity Strategy ETF (the "Conversion") and conducted pursuant to an
Agreement and Plan of Reorganization.
The Conversion was structured to be a tax-free reorganization under the U.S. Internal Revenue Code. After the
Conversion, shareholders of the Fund hold shares of the Commodity Strategy ETF instead of the Fund. The Commodity Strategy ETF has the same investment objective, investment strategy, investment restrictions and portfolio managers as the
Fund.
30
Existing shareholders of the Fund received an information statement/prospectus describing in detail both the
Conversion and the Commodity Strategy ETF, and summarizing the Board’s considerations in approving the Conversion.
As described in the information statement/prospectus, the Conversion involved several important steps. First,
after the close of business on October 7, 2022, each class of shares of the Fund was consolidated into the institutional class (without a contingent deferred sales charge or other charge). Accordingly, after that date, all Fund
shareholders owned institutional class shares. Second, after the close of business on October 14, 2022, the Fund conducted a reverse stock split pursuant to a stock split of 1:0.2256 (old to new) was merged (referred to as reverse split)
into one institutional class share. Third, on October 21, 2022, any fractional shares of the Fund held by shareholders were redeemed. The Fund distributed such redemption proceeds to those shareholders.
Finally, all whole Fund shares were converted into shares of the Commodity Strategy ETF in connection with the
Conversion, which closed after the end of trading on Friday, October 21, 2022. The Commodity Strategy ETF opened for trading on NYSE Arca, Inc. on October 24, 2022. In connection with the Conversion, shareholders of the Fund received
shares of the Commodity Strategy ETF equal in value to the number of shares of the Fund they owned, including a cash payment in lieu of fractional shares of the Fund.
Additionally, prior to the Conversion, the Fund made a distribution of net investment income and net realized
capital and foreign currency gains, which would normally be made in December. The distribution was paid on September 28, 2022 to shareholders of record as of September 26, 2022.
The shares outstanding, NAV per share and other per share information for institutional class have been updated
in the accompanying consolidated financial statements and consolidated financial highlights to reflect the effect of the stock split.
31
Consolidated Financial Highlights
The following tables include selected data for a share outstanding throughout each period and other performance information
derived from the Consolidated Financial Statements. Amounts that do not round to $0.01 or $(0.01) per share are presented as $0.00 or $(0.00), respectively. Ratios that do not round to 0.01% or (0.01)% are presented as 0.00% or (0.00)%,
respectively. Net Assets amounts with a zero balance, if any, may reflect actual amounts rounding to less than $0.1 million. A “—” indicates that the line item was not applicable in the corresponding period.
|
|
|
|
|
|
|
|
|
|
|
Net Asset
Value,
Beginning
of Year
|
Net
Investment
Income/
(Loss)a
|
Net Gains
or
(Losses) on
Securities
(both
realized
and
unrealized)
|
Total From
Investment
Operations
|
Dividends
from Net
Investment
Income
|
Distributions
from Net
Realized
Capital
Gains
|
Total
Distributions
|
|
Commodity Strategy Fund
|
|||||||
|
Institutional Class
|
|||||||
|
Period from
11/1/2021d,eto
8/31/2022
|
$34.57
|
$ 0.04
|
$ 2.65
|
$2.69
|
$(11.35)
|
$—
|
$(11.35)
|
|
10/31/2021
|
$22.52
|
$(0.09)
|
$12.27
|
$12.18
|
$(0.13)
|
$—
|
$(0.13)
|
|
10/31/2020
|
$26.60
|
$0.18
|
$(3.82)
|
$(3.64)
|
$(0.44)
|
$—
|
$(0.44)
|
|
10/31/2019
|
$27.44
|
$0.53
|
$(0.71)
|
$(0.18)
|
$(0.66)
|
$(0.00)
|
$(0.66)
|
|
10/31/2018
|
$28.19
|
$0.35
|
$(0.04)
|
$0.31
|
$(1.06)
|
$—
|
$(1.06)
|
|
10/31/2017
|
$26.55
|
$0.09
|
$1.55
|
$1.64
|
$—
|
$—
|
$—
|
|
|
|||||||
|
Class A
|
|||||||
|
Period from
11/1/2021d to
8/31/2022
|
$7.64
|
$(0.01)
|
$0.58
|
$0.57
|
$(2.53)
|
$—
|
$(2.53)
|
|
10/31/2021
|
$4.99
|
$(0.05)
|
$2.72
|
$2.67
|
$(0.02)
|
$—
|
$(0.02)
|
|
10/31/2020
|
$5.89
|
$0.02
|
$(0.85)
|
$(0.83)
|
$(0.07)
|
$—
|
$(0.07)
|
|
10/31/2019
|
$6.07
|
$0.09
|
$(0.14)
|
$(0.05)
|
$(0.13)
|
$(0.00)
|
$(0.13)
|
|
10/31/2018
|
$6.24
|
$0.06
|
$(0.01)
|
$0.05
|
$(0.22)
|
$—
|
$(0.22)
|
|
10/31/2017
|
$5.90
|
$—
|
$0.34
|
$0.34
|
$—
|
$—
|
$—
|
|
|
|||||||
|
Class C
|
|||||||
|
Period from
11/1/2021d to
8/31/2022
|
$7.62
|
$(0.03)
|
$0.56
|
$0.53
|
$(2.51)
|
$—
|
$(2.51)
|
|
Period from
3/24/2021j to
10/31/2021 |
$6.26
|
$(0.07)
|
$1.43
|
$1.36
|
$—
|
$—
|
$—
|
|
10/31/2020
|
$5.66
|
$(0.01)
|
$(0.84)
|
$(0.85)
|
$(0.03)
|
$—
|
$(0.03)
|
|
10/31/2019
|
$5.83
|
$0.05
|
$(0.14)
|
$(0.09)
|
$(0.08)
|
$(0.00)
|
$(0.08)
|
|
10/31/2018
|
$5.95
|
$0.01
|
$—
|
$0.01
|
$(0.13)
|
$—
|
$(0.13)
|
|
10/31/2017
|
$5.71
|
$(0.05)
|
$0.29
|
$0.24
|
$—
|
$—
|
$—
|
|
|
|
|
|
|
|
|
|
See Notes to Consolidated Financial Highlights
32
|
|
|
|
|
|
|
|
|
Net Asset
Value,
End of
Year
|
Total
Returnb
|
Net Assets,
End of
Year
(in millions)
|
Ratio
of Gross
Expenses to
Average Net
Assetsc
|
Ratio
of Net
Expenses to
Average
Net
Assets
|
Ratio
of Net
Investment
Income/
(Loss)
to
Average
Net
Assets
|
Portfolio
Turnover
Rate
|
|
|
|
|
|
|
|
|
|
|
|
|
|
|
|
|
|
$25.91
|
13.67%f
|
$209.5
|
0.92%g
|
0.73%g
|
0.22%g
|
57%f
|
|
$34.57
|
54.44% h
|
$147.4
|
0.99 %
|
0.74%
|
(0.36) %
|
56%
|
|
$22.52
|
(13.98)%
|
$89.4
|
0.99%
|
0.74%
|
0.74%
|
109%
|
|
$26.60
|
(0.41)%
|
$145.3
|
0.96%
|
0.74%
|
1.99%
|
88%
|
|
$27.44
|
1.19%
|
$100.3
|
0.98%
|
0.74%
|
1.31%
|
107%
|
|
$28.19
|
6.18%
|
$83.1
|
1.18%
|
0.85%
|
0.36%
|
105%
|
|
|
||||||
|
|
|
|
|
|
|
|
|
$5.68
|
13.35%f
|
$31.2
|
1.30%g
|
1.09%g
|
(0.19)%g
|
57%f
|
|
$7.64
|
53.60% h
|
$26.7
|
1.37 %
|
1.10%
|
(0.72) %
|
56%
|
|
$4.99
|
(14.29)%
|
$18.4
|
1.36%
|
1.10%
|
0.34%
|
109%
|
|
$5.89
|
(0.64)%
|
$22.5
|
1.37%
|
1.09%
|
1.65%
|
88%
|
|
$6.07
|
0.81%
|
$47.9
|
1.35%
|
1.10%
|
0.95%
|
107%
|
|
$6.24
|
5.76%
|
$42.4
|
1.56%
|
1.21%
|
(0.02)%
|
105%
|
|
|
||||||
|
|
|
|
|
|
|
|
|
$5.64
|
12.54%f
|
$0.3
|
2.14%g
|
1.84 % g
|
(0.58)%g
|
57%f
|
|
$7.62
|
21.73%f,h
|
$0.0
|
2.97%g
|
1.86%g
|
(1.55)%g
|
56%i
|
|
$4.78
|
(15.05)%
|
$0.0
|
2.31%
|
1.86%
|
(0.23)%
|
109%
|
|
$5.66
|
(1.51)%
|
$0.0
|
2.32%
|
1.84%
|
0.88%
|
88%
|
|
$5.83
|
0.15%
|
$0.0
|
2.34%
|
1.85%
|
0.19%
|
107%
|
|
$5.95
|
4.20%
|
$0.0
|
3.20%
|
2.03%
|
(0.92)%
|
105%
|
|
|
|
|
|
|
|
|
|
|
|
|
|
|
|
|
33
Notes to Consolidated Financial Highlights Alternative and Multi-Asset Class Funds
|
a
|
Calculated based on the average number of shares outstanding during each fiscal period.
|
|
b
|
Total return based on per share NAV reflects the effects of changes in NAV on the performance of
the Fund
during each fiscal period. Returns assume income dividends and other distributions, if any, were
reinvested,
but do not reflect the effect of sales charges. Results represent past performance and do not
indicate future
results. Current returns may be lower or higher than the performance data quoted. Investment
returns and
principal will fluctuate and shares, when redeemed, may be worth more or less than original
cost. Total
return would have been lower if Management had not reimbursed and/or waived certain expenses.
Total
return would have been higher if Management had not recouped previously reimbursed and/or waived
expenses.
|
|
c
|
Represents the annualized ratios of net expenses to average daily net assets if Management had
not
reimbursed certain expenses and/or waived a portion of the investment management fee.
|
|
d
|
The Fund has changed its fiscal year end from October 31 to August 31. This period represents
the
ten-month period from November 1, 2021 to August 31, 2022. See Note G of the Notes to
Consolidated
Financial Statements for more information.
|
|
e
|
After the close of business on October 14, 2022, the Fund's Institutional Class underwent a
reverse stock
split. The per share data presented here has been retroactively adjusted to reflect this split.
See Note J of the
Notes to Consolidated Financial Statements.
|
|
f
|
Not annualized.
|
|
g
|
Annualized.
|
|
h
|
The class action proceeds received in 2021 had no impact on the Fund's total returns for the
year ended
October 31, 2021.
|
|
i
|
Portfolio turnover is calculated at the Fund level. Percentage indicated was for the year ended
October 31,
2021.
|
|
j
|
Commodity Strategy Class C shares were fully redeemed on February 2, 2021. Operations
recommenced on
March 24, 2021. The Consolidated Financial highlights presented are only for the period after
commencement of operations.
|
34
Report of Independent Registered Public Accounting Firm
To the Shareholders of Neuberger Berman Commodity Strategy Fund and the Board of Trustees of Neuberger Berman Alternative
Funds
Opinion on the Financial Statements
We have audited the accompanying consolidated statement of assets and liabilities of Neuberger Berman Commodity Strategy Fund
(the "Fund") (one of the series constituting the Neuberger Berman Alternatives Funds) (the "Trust"), including the consolidated schedule of investments, as of August 31, 2022, and the related consolidated statements of operations for the
period from November 1, 2021 to August 31, 2022 and the year ended October 31, 2021, the consolidated statements of changes in net assets for the period from November 1, 2021 to August 31, 2022 and each of the two years in the period
ended October 31, 2021, the consolidated financial highlights for the period from November 1, 2021 to August 31, 2022 and each of the five years in the period ended October 31, 2021 and the related notes (collectively referred to as the
"consolidated financial statements"). In our opinion, the consolidated financial statements present fairly, in all material respects, the consolidated financial position of the Fund (one of the series constituting Neuberger Berman
Alternative Funds) at August 31, 2022, the consolidated results of its operations for the period from November 1, 2021 to August 31, 2022 and the year ended October 31, 2021, the consolidated changes in net assets for the period from
November 1, 2021 to August 31, 2022 and each of the two years in the period ended October 31, 2021 and its consolidated financial highlights for the period from November 1, 2021 to August 31, 2022 and each of the five years in the period
ended October 31, 2021, in conformity with U.S. generally accepted accounting principles.
Basis for Opinion
These consolidated financial statements are the responsibility of the Trust’s management. Our responsibility is to express an
opinion on the Fund’s consolidated financial statements based on our audits. We are a public accounting firm registered with the Public Company Accounting Oversight Board (United States) ("PCAOB") and are required to be independent with
respect to the Trust in accordance with the U.S. federal securities laws and the applicable rules and regulations of the Securities and Exchange Commission and the PCAOB.
We conducted our audits in accordance with the standards of the PCAOB. Those standards require that we plan and perform the
audit to obtain reasonable assurance about whether the financial statements are free of material misstatement, whether due to error or fraud. The Trust is not required to have, nor were we engaged to perform, an audit of the Trust’s
internal control over financial reporting. As part of our audits, we are required to obtain an understanding of internal control over financial reporting, but not for the purpose of expressing an opinion on the effectiveness of the
Trust’s internal control over financial reporting. Accordingly, we express no such opinion.
Our audits included performing procedures to assess the risks of material misstatement of the consolidated financial
statements, whether due to error or fraud, and performing procedures that respond to those risks. Such procedures included examining, on a test basis, evidence regarding the amounts and disclosures in the consolidated financial
statements. Our procedures included confirmation of securities owned as of August 31, 2022, by correspondence with the custodian, brokers and others; when replies were not received from brokers and others, we performed other auditing
procedures. Our audits also included evaluating the accounting principles used and significant estimates made by management, as well as evaluating the overall presentation of the consolidated financial statements. We believe that our
audits provide a reasonable basis for our opinion.

We have served as the auditor of one or more Neuberger Berman investment companies since 1954.
Boston, Massachusetts
October 27, 2022
October 27, 2022
35
Directory
Investment Manager and Administrator
Neuberger Berman Investment Advisers LLC
1290 Avenue of the Americas
New York, NY 10104-0002
Shareholder Services
800.877.9700 or 212.476.8800
Intermediary Client Services 800.366.6264
1290 Avenue of the Americas
New York, NY 10104-0002
Shareholder Services
800.877.9700 or 212.476.8800
Intermediary Client Services 800.366.6264
Distributor
Neuberger Berman BD LLC
1290 Avenue of the Americas
New York, NY 10104-0002
Shareholder Services
800.877.9700 or 212.476.8800
Intermediary Client Services 800.366.6264
1290 Avenue of the Americas
New York, NY 10104-0002
Shareholder Services
800.877.9700 or 212.476.8800
Intermediary Client Services 800.366.6264
Custodian
State Street Bank and Trust Company
One Lincoln Street
Boston, MA 02111
One Lincoln Street
Boston, MA 02111
Shareholder Servicing Agent
DST Asset Manager Solutions Inc.
430 West 7th Street, Suite 219189
Kansas City, MO 64105-1407
430 West 7th Street, Suite 219189
Kansas City, MO 64105-1407
For Institutional Class Shareholders address correspondence to:
Neuberger Berman Funds
PO Box 219189
Kansas City, MO 64121-9189
Intermediary Client Services 800.366.6264
PO Box 219189
Kansas City, MO 64121-9189
Intermediary Client Services 800.366.6264
For Class A and Class C Shareholders:
Please contact your investment provider
Legal Counsel
K&L Gates LLP
1601 K Street, NW
Washington, DC 20006-1600
1601 K Street, NW
Washington, DC 20006-1600
Independent Registered Public Accounting Firm
Ernst & Young LLP
200 Clarendon Street
Boston, MA 02116
200 Clarendon Street
Boston, MA 02116
36
Trustees and Officers
The following tables set forth information concerning the Trustees and Officers of the Fund. All persons named as Trustees
and Officers also serve in similar capacities for other funds administered or managed by NBIA. The Fund's Statement of Additional Information includes additional information about the Trustees as of the time of the Fund's most recent
public offering and is available upon request, without charge, by calling (800) 877-9700.
Information about the Board of Trustees
|
Name, (Year of Birth),
and Address(1)
|
Position(s)
and Length of
Time Served(2)
|
Principal Occupation(s)(3)
|
Number of
Funds in
Fund Complex
Overseen by
Fund Trustee
|
Other Directorships Held
Outside Fund Complex by
Fund Trustee(3)
|
|
Independent Fund Trustees
|
||||
|
Michael J. Cosgrove (1949)
|
Trustee since
2015
|
President, Carragh
Consulting USA, since 2014;
formerly, Executive, General
Electric Company, 1970 to
2014, including President,
Mutual Funds and Global
Investment Programs, GE
Asset Management, 2011 to
2014, President and Chief
Executive Officer, Mutual
Funds and Intermediary
Business, GE Asset
Management, 2007 to
2011, President, Institutional
Sales and Marketing, GE
Asset Management, 1998 to
2007, and Chief Financial
Officer, GE Asset
Management, and Deputy
Treasurer, GE Company,
1988 to 1993.
|
50
|
Director, America Press, Inc.
(not-for-profit Jesuit
publisher), 2015 to 2021;
formerly, Director, Fordham
University, 2001 to 2018;
formerly, Director, The
Gabelli Go Anywhere Trust,
June 2015 to June 2016;
formerly, Director, Skin
Cancer Foundation
(not-for-profit), 2006 to
2015; formerly, Director, GE
Investments Funds, Inc.,
1997 to 2014; formerly,
Trustee, GE Institutional
Funds, 1997 to 2014;
formerly, Director, GE Asset
Management, 1988 to
2014; formerly, Director,
Elfun Trusts, 1988 to 2014;
formerly, Trustee, GE Pension
& Benefit Plans, 1988 to
2014; formerly, Member of
Board of Governors,
Investment Company
Institute.
|
37
|
Name, (Year of Birth),
and Address(1)
|
Position(s)
and Length of
Time Served(2)
|
Principal Occupation(s)(3)
|
Number of
Funds in
Fund Complex
Overseen by
Fund Trustee
|
Other Directorships Held
Outside Fund Complex by
Fund Trustee(3)
|
|
Marc Gary (1952)
|
Trustee since
2015
|
Executive Vice Chancellor
Emeritus, The Jewish
Theological Seminary, since
2020; formerly, Executive
Vice Chancellor and Chief
Operating Officer, Jewish
Theological Seminary, 2012
to 2020; formerly, Executive
Vice President and General
Counsel, Fidelity
Investments, 2007 to
2012;formerly, Executive
Vice President and General
Counsel, BellSouth
Corporation, 2004 to 2007;
formerly, Vice President and
Associate General Counsel,
BellSouth Corporation, 2000
to 2004; formerly, Associate,
Partner, and National
Litigation Practice Co-Chair,
Mayer, Brown LLP, 1981 to
2000; formerly, Associate
Independent Counsel, Office
of Independent Counsel,
1990 to 1992.
|
50
|
Chair and Director, USCJ
Supporting Foundation,
since 2021; Director, UJA
Federation of Greater New
York, since 2019; Trustee,
Jewish Theological Seminary,
since 2015; formerly,
Director, Legility, Inc.
(privately held for-profit
company), 2012 to 2021;
Director, Lawyers Committee
for Civil Rights Under Law
(not-for-profit), since 2005;
formerly, Director, Equal
Justice Works
(not-for-profit), 2005 to
2014; formerly, Director,
Corporate Counsel Institute,
Georgetown University Law
Center, 2007 to 2012;
formerly, Director, Greater
Boston Legal Services
(not-for-profit), 2007 to
2012.
|
38
|
Name, (Year of Birth),
and Address(1)
|
Position(s)
and Length of
Time Served(2)
|
Principal Occupation(s)(3)
|
Number of
Funds in
Fund Complex
Overseen by
Fund Trustee
|
Other Directorships Held
Outside Fund Complex by
Fund Trustee(3)
|
|
Martha Clarke Goss (1949)
|
Trustee since
2007
|
President, Woodhill
Enterprises Inc./Chase
Hollow Associates LLC
(personal investment
vehicle), 2006 to 2020;
formerly, Consultant,
Resources Global
Professionals (temporary
staffing), 2002 to 2006;
formerly, Chief Financial
Officer, Booz-Allen &
Hamilton, Inc., 1995 to
1999; formerly, Enterprise
Risk Officer, Prudential
Insurance, 1994 to1995;
formerly, President,
Prudential Asset
Management Company,
1992 to 1994; formerly,
President, Prudential Power
Funding (investments in
electric and gas utilities and
alternative energy projects),
1989 to 1992; formerly,
Treasurer, Prudential
Insurance Company, 1983 to
1989.
|
50
|
Director, American Water
(water utility), since 2003;
Director, Allianz Life of New
York (insurance), since 2005;
formerly, Director, Berger
Group Holdings, Inc.
(engineering consulting
firm), from 2013 to 2018;
formerly, Director, Financial
Women’s Association of
New York (not-for-profit
association), from 1987 to
1996, 2003 to 2019; ;
Trustee Emerita, Brown
University, since 1998;
Director, Museum of
American Finance
(not-for-profit), since 2013;
formerly, Non-Executive
Chair and Director, Channel
Reinsurance (financial
guaranty reinsurance), 2006
to 2010; formerly, Director,
Ocwen Financial Corporation
(mortgage servicing), 2005
to 2010; formerly, Director,
Claire’s Stores, Inc. (retailer),
2005 to 2007; formerly,
Director, Parsons
Brinckerhoff Inc.
(engineering consulting
firm), 2007 to 2010;
formerly, Director, Bank
Leumi (commercial bank),
2005 to 2007; formerly,
Advisory Board Member,
Attensity (software
developer), 2005 to 2007;
formerly, Director of Foster
Wheeler Manufacturing,
1994 to 2004; formerly
Director Dexter Corp.,
Manufacturer of
Non-Wovens, Plastics, and
Medical Supplies, 1992 to
2001.
|
39
|
Name, (Year of Birth),
and Address(1)
|
Position(s)
and Length of
Time Served(2)
|
Principal Occupation(s)(3)
|
Number of
Funds in
Fund Complex
Overseen by
Fund Trustee
|
Other Directorships Held
Outside Fund Complex by
Fund Trustee(3)
|
|
Michael M. Knetter (1960)
|
Trustee since
2007
|
President and Chief
Executive Officer, University
of Wisconsin Foundation,
since 2010; formerly, Dean,
School of Business,
University of Wisconsin -
Madison; formerly, Professor
of International Economics
and Associate Dean, Amos
Tuck School of Business -
Dartmouth College, 1998 to
2002.
|
50
|
Director, 1 William Street
Credit Income Fund, since
2018; Board Member,
American Family Insurance (a
mutual company, not
publicly traded), since March
2009; formerly, Trustee,
Northwestern Mutual
Series Fund, Inc., 2007 to
2011; formerly, Director,
Wausau Paper, 2005 to
2011; formerly, Director,
Great Wolf Resorts, 2004 to
2009.
|
|
Deborah C. McLean (1954)
|
Trustee since
2015
|
Member, Circle Financial
Group (private wealth
management membership
practice), since 2011;
Managing Director, Golden
Seeds LLC (an angel
investing group), since 2009;
Adjunct Professor (Corporate
Finance), Columbia
University School of
International and Public
Affairs, since 2008; formerly,
Visiting Assistant Professor,
Fairfield University, Dolan
School of Business, Fall
2007; formerly, Adjunct
Associate Professor of
Finance, Richmond, The
American International
University in London, 1999
to 2007.
|
50
|
Board member, The
Maritime Aquarium at
Norwalk, since 2020; Board
member, Norwalk
Community College
Foundation, since 2014;
Dean’s Advisory Council,
Radcliffe Institute for
Advanced Study, since 2014;
formerly, Director and
Treasurer, At Home in Darien
(not-for-profit), 2012 to
2014; formerly, Director,
National Executive Service
Corps (not-for-profit), 2012
to 2013; formerly, Trustee,
Richmond, The American
International University in
London, 1999 to 2013.
|
40
|
Name, (Year of Birth),
and Address(1)
|
Position(s)
and Length of
Time Served(2)
|
Principal Occupation(s)(3)
|
Number of
Funds in
Fund Complex
Overseen by
Fund Trustee
|
Other Directorships Held
Outside Fund Complex by
Fund Trustee(3)
|
|
George W. Morriss (1947)
|
Trustee since
2007
|
Formerly, adjunct Professor,
Columbia University School
of International and Public
Affairs, from 2012 to 2018;
formerly, Executive Vice
President and Chief Financial
Officer, People’s United
Bank, Connecticut (a
financial services company),
1991 to 2001.
|
50
|
Director, 1 WS Credit Income
Fund; Chair, Audit
Committee, since 2018;
Director and Chair, Thrivent
Church Loan and Income
Fund, since 2018; formerly,
Trustee, Steben Alternative
Investment Funds, Steben
Select Multi-Strategy Fund,
and Steben Select
Multi-Strategy Master Fund,
2013 to 2017; formerly,
Treasurer, National
Association of Corporate
Directors, Connecticut
Chapter, 2011 to 2015;
formerly, Manager, Larch
Lane Multi-Strategy Fund
complex (which consisted of
three funds), 2006 to 2011;
formerly, Member, NASDAQ
Issuers’ Affairs Committee,
1995 to 2003.
|
|
Tom D. Seip (1950)
|
Trustee since
2000;
Chairman of
the Board since
2008; formerly
Lead
Independent
Trustee in Fund
Complex from
2006 to 2008
|
Formerly, Managing
Member, Ridgefield
Farm LLC (a private
investment vehicle), 2004 to
2016; formerly, President
and CEO, Westaff, Inc.
(temporary staffing), May
2001 to January 2002;
formerly, Senior Executive,
The Charles Schwab
Corporation, 1983 to 1998,
including Chief Executive
Officer, Charles Schwab
Investment Management,
Inc.; Trustee, Schwab Family
of Funds and Schwab
Investments, 1997 to 1998;
and Executive Vice
President-Retail Brokerage,
Charles Schwab & Co., Inc.,
1994 to 1997.
|
50
|
Trustee, University of
Maryland, Shore Regional
Health System, since 2020;
Formerly, Director, H&R
Block, Inc. (tax services
company), 2001 to 2018;
formerly, Director, Talbot
Hospice Inc., 2013 to 2016;
formerly, Chairman,
Governance and Nominating
Committee, H&R Block, Inc.,
2011 to 2015; formerly,
Chairman, Compensation
Committee, H&R Block, Inc.,
2006 to 2010; formerly,
Director, Forward
Management, Inc. (asset
management company),
1999 to 2006.
|
41
|
Name, (Year of Birth),
and Address(1)
|
Position(s)
and Length of
Time Served(2)
|
Principal Occupation(s)(3)
|
Number of
Funds in
Fund Complex
Overseen by
Fund Trustee
|
Other Directorships Held
Outside Fund Complex by
Fund Trustee(3)
|
|
James G. Stavridis (1955)
|
Trustee since
2015
|
Vice Chairman Global
Affairs, The Carlyle Group,
since 2018; Commentator,
NBC News, since 2015;
formerly, Dean, Fletcher
School of Law and
Diplomacy, Tufts University,
2013 to 2018; formerly,
Admiral, United States Navy,
1976 to 2013, including
Supreme Allied Commander,
NATO and Commander,
European Command, 2009
to 2013, and Commander,
United States Southern
Command, 2006 to 2009.
|
50
|
Director, Fortinet
(cybersecurity), since 2021;
Director, Ankura, since 2020;
Director, Vigor Shipyard,
since 2019; Director,
Rockefeller Foundation,
since 2018; Director,
American Water (water
utility), since 2018; Director,
NFP Corp. (insurance broker
and consultant), since 2017;
Director, Onassis Foundation,
since 2014; Director, Michael
Baker International
(construction) since 2014;
Director, Vertical Knowledge,
LLC, since 2013; formerly,
Director, U.S. Naval Institute,
2014 to 2019; formerly,
Director, Navy Federal Credit
Union, 2000-2002; formerly,
Director, BMC Software
Federal, LLC, 2014-2019.
|
42
|
Name, (Year of Birth),
and Address(1)
|
Position(s)
and Length of
Time Served(2)
|
Principal Occupation(s)(3)
|
Number of
Funds in
Fund Complex
Overseen by
Fund Trustee
|
Other Directorships Held
Outside Fund Complex by
Fund Trustee(3)
|
|
Fund Trustees who are "Interested Persons"
|
||||
|
Joseph V. Amato* (1962)
|
Chief Executive
Officer and
President since
2018 and
Trustee since
2009
|
President and Director,
Neuberger Berman
Group LLC, since 2009;
President and Chief
Executive Officer, Neuberger
Berman BD LLC and
Neuberger Berman
Holdings LLC (including its
predecessor, Neuberger
Berman Inc.), since 2007;
Chief Investment Officer
(Equities) and President
(Equities), NBIA (formerly,
Neuberger Berman Fixed
Income LLC and including
predecessor entities), since
2007, and Board Member of
NBIA since 2006; formerly,
Global Head of Asset
Management of Lehman
Brothers Holdings Inc.’s
(“LBHI”) Investment
Management Division, 2006
to 2009; formerly, member
of LBHI’s Investment
Management Division’s
Executive Management
Committee, 2006 to 2009;
formerly, Managing Director,
Lehman Brothers Inc.
(“LBI”), 2006 to 2008;
formerly, Chief Recruiting
and Development Officer,
LBI, 2005 to 2006; formerly,
Global Head of LBI’s Equity
Sales and a Member of its
Equities Division Executive
Committee, 2003 to 2005;
President and Chief
Executive Officer, twelve
registered investment
companies for which NBIA
acts as investment manager
and/or administrator.
|
50
|
Member of Board of
Advisors, McDonough
School of Business,
Georgetown University, since
2001; Member of New York
City Board of Advisors, Teach
for America, since 2005;
Trustee, Montclair Kimberley
Academy (private school),
since 2007; Member of
Board of Regents,
Georgetown University, since
2013.
|
(1)
The business address of each listed person is 1290 Avenue of the Americas, New York, NY 10104.
(2)
Pursuant to the Trust’s Amended and Restated Trust Instrument ("Trust Instrument"), subject to
any limitations on the term of service imposed by the By-Laws or any retirement policy adopted by the Fund Trustees, each Fund Trustee shall hold office for life or until his or her successor is elected or the Trust
43
terminates; except that (a) any Fund Trustee may resign by delivering a written resignation; (b) any Fund
Trustee may be removed with or without cause at any time by a written instrument signed by at least two-thirds of the other Fund Trustees; (c) any Fund Trustee who requests to be retired, or who has become unable to serve, may be retired
by a written instrument signed by a majority of the other Fund Trustees; and (d) any Fund Trustee may be removed at any shareholder meeting by a vote of at least two-thirds of the outstanding shares.
(3)
Except as otherwise indicated, each individual has held the positions shown during at least the
last five years.
*
Indicates a Fund Trustee who is an "interested person" within the meaning of the 1940 Act. Mr.
Amato is an interested person of the Trust by virtue of the fact that he is an officer of NBIA and/or its affiliates.
44
Information about the Officers of the Trust
|
Name, (Year of Birth), and
Address(1)
|
Position(s) and
Length of Time
Served(2)
|
Principal Occupation(s)(3)
|
|
Claudia A. Brandon (1956)
|
Executive Vice
President since
2008 and
Secretary since
1985
|
Senior Vice President, Neuberger Berman, since 2007 and Employee since
1999; Senior Vice President, NBIA, since 2008 and Assistant Secretary since
2004; formerly, Vice President, Neuberger Berman, 2002 to 2006; formerly,
Vice President — Mutual Fund Board Relations, NBIA, 2000 to 2008;
formerly, Vice President, NBIA, 1986 to 1999 and Employee, 1984 to 1999;
Executive Vice President and Secretary, thirty-three registered investment
companies for which NBIA acts as investment manager and/or
administrator.
|
|
Agnes Diaz (1971)
|
Vice President
since 2013
|
Senior Vice President, Neuberger Berman, since 2012; Senior Vice
President, NBIA, since 2012 and Employee since 1996; formerly, Vice
President, Neuberger Berman, 2007 to 2012; Vice President, twelve
registered investment companies for which NBIA acts as investment
manager and/or administrator.
|
|
Anthony DiBernardo (1979)
|
Assistant
Treasurer since
2011
|
Senior Vice President, Neuberger Berman, since 2014; Senior Vice
President, NBIA, since 2014, and Employee since 2003; formerly, Vice
President, Neuberger Berman, 2009 to 2014; Assistant Treasurer, twelve
registered investment companies for which NBIA acts as investment
manager and/or administrator.
|
|
Savonne L. Ferguson (1973)
|
Chief
Compliance
Officer since
2018
|
Senior Vice President, Chief Compliance Officer (Mutual Funds) and
Associate General Counsel, NBIA, since November 2018; formerly, Vice
President T. Rowe Price Group, Inc. (2018), Vice President and Senior Legal
Counsel, T. Rowe Price Associates, Inc. (2014-2018), Vice President and
Director of Regulatory Fund Administration, PNC Capital Advisors, LLC
(2009-2014), Secretary, PNC Funds and PNC Advantage Funds
(2010-2014); Chief Compliance Officer, thirty-three registered investment
companies for which NBIA acts as investment manager and/or
administrator.
|
|
Corey A. Issing (1978)
|
Chief Legal
Officer since
2016 (only for
purposes of
sections 307 and
406 of the
Sarbanes-Oxley
Act of 2002)
|
General Counsel— Mutual Funds since 2016 and Managing Director, NBIA,
since 2017; formerly, Associate General Counsel (2015 to 2016), Counsel
(2007 to 2015), Senior Vice President (2013-2016), Vice President (2009 —
2013); Chief Legal Officer (only for purposes of sections 307 and 406 of
the Sarbanes-Oxley Act of 2002), thirty-three registered investment
companies for which NBIA acts as investment manager and/or
administrator.
|
|
Sheila R. James (1965)
|
Assistant
Secretary since
2002
|
Vice President, Neuberger Berman, since 2008 and Employee since 1999;
Vice President, NBIA, since 2008; formerly, Assistant Vice President,
Neuberger Berman, 2007; Employee, NBIA, 1991 to 1999; Assistant
Secretary, thirty-three registered investment companies for which NBIA acts
as investment manager and/or administrator.
|
45
|
Name, (Year of Birth), and
Address(1)
|
Position(s) and
Length of Time
Served(2)
|
Principal Occupation(s)(3)
|
|
Brian Kerrane (1969)
|
Chief Operating
Officer since
2015 and Vice
President since
2008
|
Managing Director, Neuberger Berman, since 2013; Chief Operating
Officer — Mutual Funds and Managing Director, NBIA, since 2015;
formerly, Senior Vice President, Neuberger Berman, 2006 to 2014; Vice
President, NBIA, 2008 to 2015 and Employee since 1991; Chief Operating
Officer, twelve registered investment companies for which NBIA acts as
investment manager and/or administrator; Vice President, thirty-three
registered investment companies for which NBIA acts as investment
manager and/or administrator.
|
|
Anthony Maltese (1959)
|
Vice President
since 2015
|
Senior Vice President, Neuberger Berman, since 2014 and Employee since
2000; Senior Vice President, NBIA, since 2014; Vice President, twelve
registered investment companies for which NBIA acts as investment
manager and/or administrator.
|
|
Josephine Marone (1963)
|
Assistant
Secretary since
2017
|
Senior Paralegal, Neuberger Berman, since 2007 and Employee since 2007;
Assistant Secretary, thirty-three registered investment companies for which
NBIA acts as investment manager and/or administrator.
|
|
Owen F. McEntee, Jr. (1961)
|
Vice President
since 2008
|
Vice President, Neuberger Berman, since 2006; Vice President, NBIA, since
2006 and Employee since 1992; Vice President, twelve registered
investment companies for which NBIA acts as investment manager and/or
administrator.
|
|
John M. McGovern (1970)
|
Treasurer and
Principal
Financial and
Accounting
Officer since
2005
|
Managing Director, Neuberger Berman since 2022; Senior Vice President,
Neuberger Berman, 2007 to 2021; Senior Vice President, NBIA, since 2007
and Employee since 1993; formerly, Vice President, Neuberger Berman,
2004 to 2006; formerly, Assistant Treasurer, 2002 to 2005; Treasurer and
Principal Financial and Accounting Officer, twelve registered investment
companies for which NBIA acts as investment manager and/or
administrator.
|
|
Frank Rosato (1971)
|
Assistant
Treasurer since
2005
|
Vice President, Neuberger Berman, since 2006; Vice President, NBIA, since
2006 and Employee since 1995; Assistant Treasurer, twelve registered
investment companies for which NBIA acts as investment manager and/or
administrator.
|
|
Niketh Velamoor (1979)
|
Anti-Money
Laundering
Compliance
Officer since
2018
|
Senior Vice President and Associate General Counsel, Neuberger Berman,
since July 2018; Assistant United States Attorney, Southern District of New
York, 2009 to 2018; Anti-Money Laundering Compliance Officer, five
registered investment companies for which NBIA acts as investment
manager and/or administrator.
|
(1)
The business address of each listed person is 1290 Avenue of the Americas, New York, New York
10104.
(2)
Pursuant to the By-Laws of the Trust, each officer elected by the Fund Trustees shall hold
office until his or her successor shall have been elected and qualified or until his or her earlier death, inability to serve, or resignation. Officers serve at the pleasure of the Fund Trustees and may be removed at any time with or
without cause.
(3)
Except as otherwise indicated, each individual has held the positions shown during at least the
last five years.
46
Proxy Voting Policies and Procedures
A description of the policies and procedures that the Trust uses to determine how to vote proxies relating to portfolio
securities is available, without charge, by calling 800-877-9700 (toll-free) and on the SEC’s website at www.sec.gov. Information regarding how the Trust voted proxies relating to portfolio securities during the most recent 12-month
period ended June 30 is also available upon request, without charge, by calling 800-877-9700 (toll-free), on the SEC’s website at www.sec.gov, and on Neuberger Berman’s website at www.nb.com.
Quarterly Portfolio Schedule
The Trust files a complete schedule of portfolio holdings with the SEC for the first and third quarters of each fiscal year as
an exhibit to its report on Form N-PORT. The Trust’s Form N-PORT is available on the SEC’s website at www.sec.gov. The portfolio holdings information on Form N-PORT is available upon request, without charge, by calling 800-877-9700
(toll-free).
Liquidity Risk Management Program
Consistent with Rule 22e-4 under the Investment Company Act of 1940 (the "Liquidity Rule"), as amended, the Fund has
established a liquidity risk management program (the "Program"). The Program seeks to assess and manage the Fund's liquidity risk, which is defined as the risk that the Fund is unable to meet investor redemption requests without
significantly diluting the remaining investors' interests in the Fund. The Board has approved the designation of NBIA Funds' Liquidity Committee, comprised of NBIA employees, as the program administrator (the "Program Administrator"). The
Program Administrator is responsible for implementing and monitoring the Program and utilizes NBIA personnel to assess and review, on an ongoing basis, the Fund's liquidity risk.
The Program includes a number of elements that support the management and assessment of liquidity risk, including an annual
assessment of the Fund's liquidity risk factors and the periodic classification (or re-classification, as necessary) of the Fund's investments into buckets (highly liquid, moderately liquid, less liquid and illiquid) that reflect the
Program Administrator's assessment of the investments' liquidity under current market conditions, which for the relevant period included, among other factors, market volatility as a result of geopolitical tensions (e.g., Russia's invasion
of Ukraine) and the emergence of new COVID variants. The Program Administrator also utilizes information about the Fund's investment strategy, the characteristics of the Fund's shareholder base and historical redemption activity.
The Program Administrator provided the Board with a written report that addressed the operation of the Program and assessed
its adequacy and effectiveness of implementation from April 1, 2021 through March 31, 2022. During the period covered by this report, the Program Administrator reported that the Program effectively assisted the Program Administrator in
monitoring whether the Fund maintained a level of liquidity appropriate for its shareholder base and historical redemption activity.
47
Report of Votes of Shareholders
A Special Meeting of Shareholders was held on June 30, 2022 for Neuberger Berman Alternative Funds (the "Trust").
Shareholders voted to approve the election of four trustees to the Board of Trustees of the Trust and to approve the amendment of certain fundamental investment policies of each series of the Trust, including Commodity Strategy.
Proposal 1 – To approve the election of Michael J. Cosgrove, Marc Gary, Deborah C. McLean, and James G.
Stavridis as Trustees to the Board of Trustees of the Trust as follows:
|
Neuberger Berman Alternative Funds
|
|
|
|
|
|
Number of Shares
|
||
|
|
Votes For
|
Votes
Against
|
Abstentions
|
|
Michael J. Cosgrove
|
327,577,100
|
—
|
1,014,069
|
|
Marc Gary
|
327,610,552
|
—
|
980,617
|
|
Deborah C. McLean
|
328,139,995
|
—
|
451,173
|
|
James G. Stavridis
|
325,982,569
|
—
|
2,608,599
|
Proposal 2 – To approve the amendment of certain fundamental investment policies of the Fund as follows:
(A) To approve the amendment of the fundamental investment policy regarding borrowing;
(B) To approve the amendment of the fundamental investment policy regarding commodities;
(C) To approve the amendment of the fundamental investment policy regarding industry concentration;
(D) To approve the amendment of the fundamental investment policy regarding lending;
(E) To approve the amendment of the fundamental investment policy regarding investing in real estate;
(F) To approve the amendment of the fundamental investment policy regarding the issuance of senior securities to permit issuing senior securities; and
(G) To approve the amendment of the fundamental investment policy regarding underwriting.
|
Commodity Strategy:
|
Number of Shares
|
||
|
Proposal
|
Votes For
|
Votes
Against
|
Abstentions
|
|
A
|
14,260,736
|
122,281
|
158,028
|
|
B
|
14,258,084
|
135,218
|
147,743
|
|
C
|
14,274,442
|
110,336
|
156,267
|
|
D
|
14,219,772
|
163,683
|
157,589
|
|
E
|
14,265,943
|
122,062
|
153,040
|
|
F
|
14,229,502
|
149,398
|
162,145
|
|
G
|
14,214,245
|
172,424
|
154,376
|
48
This page has been left blank intentionally
Neuberger Berman Investment Advisers LLC
1290 Avenue of the Americas
New York, NY 10104-0002
Retail Services: 800.877.9700
Broker-Dealer and Institutional Services: 800.366.6264/888.556.9030
www.nb.com
New York, NY 10104-0002
Retail Services: 800.877.9700
Broker-Dealer and Institutional Services: 800.366.6264/888.556.9030
www.nb.com
Statistics and projections in this report are derived from sources deemed to be reliable but cannot be
regarded as a representation of future results of the Funds. This report is prepared for the general information of shareholders and is not an offer of shares of the Funds. Shares are sold only through the currently effective prospectus
which you can obtain by calling 877.628.2583. An investor should consider carefully a Fund’s investment objectives, risks and fees and expenses, which are described in its prospectus, before investing.

X0210 10/22

(b) Not applicable to the Fund.
Item 2. Code of Ethics.
The Board of Trustees (“Board”) of Neuberger Berman Alternative Funds, on behalf of Neuberger Berman Commodity Strategy Fund, (“Registrant”) has adopted a code of ethics that applies to the Registrant’s principal
executive officer, principal financial officer, principal accounting officer or controller, or persons performing similar functions (“Code of Ethics”). During the period covered by this Form N-CSR, there were no substantive amendments to the Code of
Ethics and there were no waivers from the Code of Ethics granted to the Registrant’s principal executive officer, principal financial officer, principal accounting officer or controller, or persons performing similar functions.
A copy of the Code of Ethics is incorporated by
reference to Neuberger Berman Income Funds’ Form N-CSR, Investment Company Act file number 811-03802 (filed June 30, 2020). The Code of Ethics is also available, without charge, by calling 1-800-877-9700
(toll-free).
Item 3. Audit Committee Financial Expert.
The Board has determined that the Registrant has three audit committee financial experts serving on its audit committee. The Registrant’s audit committee financial experts are Michael J. Cosgrove, Martha C. Goss and
Deborah C. McLean. Mr. Cosgrove, Ms. Goss and Ms. McLean are independent trustees as defined by Form N-CSR.
Item 4. Principal Accountant Fees and Services.
Ernst & Young LLP (“E&Y”), serves as independent registered public accounting firm to . the Fund, which commenced operations on August 27, 2012. Effective June 23, 2022, the Fund changed its fiscal year end
from October 31 to August 31. The fiscal period ended 2022 consists of the period from November 1, 2021 to August 31, 2022.
(a) Audit Fees
The aggregate fees billed for professional services rendered by E&Y for the audit of the annual financial statements or services rendered to the Fund that are normally provided by E&Y in connection with
statutory and regulatory filings or engagements were $67,046 and $81,050 for the fiscal year or period ended 2021 and 2022, respectively.
(b) Audit-Related Fees
The aggregate fees billed to the Fund for assurance and related services by E&Y that are reasonably related to the performance of the audit of the Fund’s financial statements and are not reported above in Audit
Fees were $0 and $0 for the fiscal year or period ended 2021 and 2022, respectively. The Audit Committee approved 0% and 0% of these services provided by E&Y for the fiscal year or period ended 2021 and 2022, respectively, pursuant to the waiver
provisions of Rule 2-01(c)(7)(i)(C) of Regulation S-X.
The fees billed to other entities in the investment company complex for assurance and related services by E&Y that are reasonably related to the performance of the audit that the Audit
Committee was required to approve because the engagement related directly to the operations and financial reporting of the Fund were $0 and $0 for the fiscal year or period ended 2021 and 2022, respectively. The Audit Committee approved 0% and 0% of
these services provided by E&Y for the fiscal year or period ended 2021 and 2022, respectively, pursuant to the waiver provisions of Rule 2-01(c)(7)(i)(C) of Regulation S-X.
(c) Tax Fees
The aggregate fees billed to the Fund for professional services rendered by E&Y for tax compliance, tax advice, and tax planning were $19,750 and $20,640 for the fiscal year or period ended
2021 and 2022, respectively. The nature of the services provided includes preparation of the Federal and State tax extensions and tax returns, review of annual excise tax calculations, and preparation of form 8613, in addition to assistance with the
identification of Passive Foreign Investment Companies ("PFICs"), assistance with determination of various foreign withholding taxes, and assistance with Internal Revenue Code and tax regulation requirements for fund investments. The Audit Committee
approved 0% and 0% of these
services provided by E&Y for the fiscal year or period ended 2021 and 2022, respectively, pursuant to the waiver provisions of Rule 2-01(c)(7)(i)(C) of Regulation S-X.
The fees billed to other entities in the investment company complex for professional services rendered by E&Y for tax compliance, tax advice, and tax planning that the Audit Committee was
required to approve because the engagement related directly to the operations and financial reporting of the Fund were $0 and $0 for the fiscal year or period ended 2021 and 2022, respectively. The Audit Committee approved 0% and 0% of these services
provided by E&Y for the fiscal year or period ended 2021 and 2022, respectively, pursuant to the waiver provisions of Rule 2-01(c)(7)(i)(C) of Regulation S-X.
(d) All Other Fees
The aggregate fees billed to the Fund for products and services provided by E&Y, other than services reported in Audit Fees,
Audit-Related Fees, and Tax Fees were $0 and $0 for the fiscal year or period ended 2021 and 2022,
respectively. The Audit Committee approved 0% and 0% of these services provided by E&Y for the fiscal year or period ended 2021 and 2022, respectively, pursuant to the waiver provisions of Rule 2-01(c)(7)(i)(C) of Regulation S-X.
The fees billed to other entities in the investment company complex for products and services provided by E&Y, other than services reported in Audit Fees, Audit-Related Fees, and Tax Fees that the Audit
Committee was required to approve because the engagement related directly to the operations and financial reporting of the Fund were $0 and $0 for the fiscal year or period ended 2021 and 2022, respectively. The Audit Committee approved 0% and 0% of
these services provided by E&Y for the fiscal year or period ended 2021 and 2022, respectively, pursuant to the waiver provisions of Rule 2-01(c)(7)(i)(C) of Regulation S-X.
(e) Audit Committee’s Pre-Approval Policies and Procedures
(1) The Audit Committee’s pre-approval policies and procedures for the Fund to engage an accountant to render audit and non-audit services delegate to each member of the Committee the power to
pre-approve services between meetings of the Committee.
(2) None of the services described in paragraphs (b) through (d) above were approved by the Audit Committee pursuant to paragraph (c)(7)(i)(C) of Rule 2-01 of Regulation S-X.
(f) Hours Attributed to Other Persons
Not applicable.
(g) Non-Audit Fees
Non-audit fees billed by E&Y for services rendered to the Fund were $19,750 and $20,640 for the fiscal year or period ended 2021 and 2022, respectively.
Non-audit fees billed by E&Y for services rendered to the Fund’s investment adviser and any entity controlling, controlled by, or under common control with the adviser that provides ongoing
services to the Fund were $0 and $0 for the fiscal year or period ended 2021 and 2022, respectively.
(h) The Audit Committee of the Board considered whether the provision of non-audit services rendered to the Fund’s investment adviser and any entity controlling, controlled by, or under common
control with the adviser that provides ongoing services to the Fund that were not pre-approved by the Audit Committee because the engagement did not relate directly to the operations and financial reporting of the Fund is compatible with maintaining
E&Y’s independence.
Item 5. Audit Committee of Listed Registrants.
Not applicable to the Registrant.
Item 6. Schedule of Investments.
The complete schedule of investments for the Fund is disclosed in the annual report, which is included in Item 1 of this Form N-CSR.
Item 7. Disclosure of Proxy Voting Policies and Procedures for Closed-End Management Investment Companies.
Not applicable to the Registrant.
Item 8. Portfolio Managers of Closed-End Management Investment Companies.
Not applicable to the Registrant.
Item 9. Purchases of Equity Securities by Closed-End Management Investment Company and Affiliated Purchasers.
Not applicable to the Registrant.
Item 10. Submission of Matters to a Vote of Security Holders.
There were no changes to the procedures by which shareholders may recommend nominees to the Board.
Item 11. Controls and Procedures.
| (a) |
Based on an evaluation of the disclosure controls and procedures (as defined in Rule 30a-3(c) under the Act) as of a date within 90 days of the filing date of this report, the Chief
Executive Officer and President and the Treasurer and Principal Financial and Accounting Officer of the Registrant have concluded that such disclosure controls and procedures are effectively designed to ensure that information required to be
disclosed by the Registrant on Form N-CSR is accumulated and communicated to the Registrant’s management to allow timely decisions regarding required disclosure.
|
| (b) |
There were no significant changes in the Registrant’s internal controls over financial reporting (as defined in Rule 30a-3(d) under the Act) that occurred during the Registrant’s most
recent fiscal half-year period covered by this report that have materially affected, or are reasonably likely to materially affect, the Registrant’s internal control over financial reporting.
|
Item 12. Disclosure of Securities Lending Activities for Closed-End Management Investment Companies.
Not applicable to the Registrant.
Item 13. Exhibits.
| (a)(1) |
| (a)(2) |
| (a)(3) |
Not applicable to the Registrant.
|
| (a)(4) |
Not applicable to the Registrant.
|
The certification furnished pursuant to Rule 30a-2(b) under the Act and Section 906 of the Sarbanes-Oxley Act will not be deemed “filed” for purposes of Section 18 of the Securities Exchange Act of 1934, as amended (“Exchange Act”), or otherwise
subject to the liability of that section. Such certification will not be deemed to be incorporated by reference into any filing under the Securities Act of 1933, as amended, or the Exchange Act, except to the extent that the Registrant specifically
incorporates it by reference.
SIGNATURES
Pursuant to the requirements of the Securities Exchange Act of 1934 and the Investment Company Act of 1940, the Registrant has duly caused this report to be signed on its behalf by the undersigned, thereunto duly
authorized.
Neuberger Berman Alternative Funds
By: /s/ Joseph V. Amato
Joseph V. Amato
Chief Executive Officer and President
Date: November 4, 2022
Pursuant to the requirements of the Securities Exchange Act of 1934 and the Investment Company Act of 1940, this report has been signed below by the following persons on behalf of the Registrant and in the capacities
and on the dates indicated.
By: /s/ Joseph V. Amato
Joseph V. Amato
Chief Executive Officer and President
Date: November 4, 2022
By: /s/ John M. McGovern
John M. McGovern
Treasurer and Principal Financial
and Accounting Officer
Date: November 4, 2022