UNITED STATES
SECURITIES AND EXCHANGE COMMISSION
Washington, D.C. 20549
FORM N-CSR
CERTIFIED SHAREHOLDER REPORT OF REGISTERED MANAGEMENT INVESTMENT COMPANIES
Investment Company Act file number: 811-21702
Name of Fund: BlackRock Health Sciences Trust (BME)
Fund Address: 100 Bellevue Parkway, Wilmington, DE 19809
Name and address of agent for service: John M. Perlowski, Chief Executive Officer, BlackRock Health Sciences
Trust, 55 East 52nd Street, New York, NY 10055
Registrant’s telephone number, including area code: (800) 882-0052, Option 4
Date of fiscal year end: 12/31/2019
Date of reporting period: 06/30/2019
Item 1 – Report to Stockholders
JUNE 30, 2019
| SEMI-ANNUAL REPORT (UNAUDITED) |

|
BlackRock Energy and Resources Trust (BGR)
BlackRock Enhanced Capital and Income Fund, Inc. (CII)
BlackRock Enhanced Equity Dividend Trust (BDJ)
BlackRock Enhanced Global Dividend Trust (BOE)
BlackRock Enhanced International Dividend Trust (BGY)
BlackRock Health Sciences Trust (BME)
BlackRock Resources & Commodities Strategy Trust (BCX)
BlackRock Science and Technology Trust (BST)
BlackRock Science and Technology Trust II (BSTZ)
BlackRock Utilities, Infrastructure & Power Opportunities Trust (BUI)
Beginning on January 1, 2021, as permitted by regulations adopted by the Securities and Exchange Commission, paper copies of each Trust’s shareholder reports will no longer be sent by mail, unless you specifically request paper copies of the reports from BlackRock or from your financial intermediary, such as a broker-dealer or bank. Instead, the reports will be made available on a website, and you will be notified by mail each time a report is posted and provided with a website link to access the report.
You may elect to receive all future reports in paper free of charge. If you hold accounts directly with BlackRock, you can call Computershare at (800) 699-1236 to request that you continue receiving paper copies of your shareholder reports. If you hold accounts through a financial intermediary, you can follow the instructions included with this disclosure, if applicable, or contact your financial intermediary to request that you continue to receive paper copies of your shareholder reports. Please note that not all financial intermediaries may offer this service. Your election to receive reports in paper will apply to all funds advised by BlackRock Advisors, LLC or its affiliates, or all funds held with your financial intermediary, as applicable.
If you already elected to receive shareholder reports electronically, you will not be affected by this change and you need not take any action. You may elect to receive electronic delivery of shareholder reports and other communications by contacting your financial intermediary, if you hold accounts through a financial intermediary. Please note that not all financial intermediaries may offer this service.
| Not FDIC Insured • May Lose Value • No Bank Guarantee |
Supplemental Information (unaudited)
BlackRock Energy and Resources Trust’s (BGR), BlackRock Enhanced Capital and Income Fund, Inc.’s (CII), BlackRock Enhanced Equity Dividend Trust’s (BDJ), BlackRock Enhanced Global Dividend Trust’s (BOE), BlackRock Enhanced International Dividend Trust’s (BGY), BlackRock Health Sciences Trust’s (BME), BlackRock Resources & Commodities Strategy Trust’s (BCX), BlackRock Science and Technology Trust’s (BST), BlackRock Science and Technology Trust II (BSTZ) and BlackRock Utilities, Infrastructure & Power Opportunities Trust’s (BUI) (each, a “Trust” and collectively, the “Trusts”), amounts and sources of distributions reported are estimates and are being provided to you pursuant to regulatory requirements and are not being provided for tax reporting purposes. The actual amounts and sources for tax reporting purposes will depend upon each Trust’s investment experience during the remainder of its fiscal year and may be subject to changes based on tax regulations. Each Trust will provide a Form 1099-DIV each calendar year that will tell you how to report these distributions for U.S. federal income tax purposes.
June 30, 2019
| Total Cumulative Distributions for the Fiscal Period |
% Breakdown of the Total Cumulative Distributions for the Fiscal Period |
|||||||||||||||||||||||||||||||||||||||
| Net Investment Income |
Net Realized Capital Gains Short-Term |
Net Realized Capital Gains Long-Term |
Return of Capital |
Total Per Common |
Net Investment Income |
Net Realized Short-Term |
Net Realized Capital Gains Long-Term |
Return of Capital |
Total Per Common Share |
|||||||||||||||||||||||||||||||
| BGR* |
$ | 0.224815 | $ | — | $ | — | $ | 0.240785 | $ | 0.4656 | 48 | % | — | % | — | % | 52 | % | 100 | % | ||||||||||||||||||||
| CII* |
0.118494 | — | 0.312165 | 0.066141 | 0.4968 | 24 | — | 63 | 13 | 100 | ||||||||||||||||||||||||||||||
| BDJ |
0.121388 | — | 0.158812 | — | 0.2802 | 43 | — | 57 | — | 100 | ||||||||||||||||||||||||||||||
| BOE* |
0.216319 | — | — | 0.161681 | 0.3780 | 57 | — | — | 43 | 100 | ||||||||||||||||||||||||||||||
| BGY* |
0.120973 | — | — | 0.081827 | 0.2028 | 60 | — | — | 40 | 100 | ||||||||||||||||||||||||||||||
| BME |
0.045793 | 0.10126 | 1.052947 | — | 1.2000 | 4 | 8 | 88 | — | 100 | ||||||||||||||||||||||||||||||
| BCX* |
0.158827 | — | — | 0.150773 | 0.3096 | 51 | — | — | 49 | 100 | ||||||||||||||||||||||||||||||
| BST |
— | — | 0.900000 | — | 0.9000 | — | — | 100 | — | 100 | ||||||||||||||||||||||||||||||
| BUI |
0.327428 | — | 0.398572 | — | 0.7260 | 45 | — | 55 | — | 100 | ||||||||||||||||||||||||||||||
| * | Certain Trusts estimate that they have distributed more than the amount of earned income and net realized gains; therefore, a portion of the distribution may be a return of capital. A return of capital may occur, for example, when some or all of the shareholder’s investment in a Trust is returned to the shareholder. A return of capital does not necessarily reflect a Trust’s investment performance and should not be confused with “yield” or “income.” When distributions exceed total return performance, the difference will reduce the Trust’s net asset value per share. |
Section 19(a) notices for the Trusts, as applicable, are available on the BlackRock website at http://www.blackrock.com.
The Trusts, acting pursuant to a U.S. Securities and Exchange Commission (“SEC”) exemptive order and with the approval of each Trust’s Board of Trustees/Directors (the “Board”), each have adopted a plan, consistent with its investment objectives and policies to support a level distribution of income, capital gains and/or return of capital (the “Plan”). In accordance with the Plans, the Trusts currently distribute the following fixed amounts per share on a monthly basis as of June 30, 2019:
| Exchange Symbol | Amount Per Common Share |
|||
| BGR |
$ | 0.0776 | ||
| CII |
0.0828 | |||
| BDJ |
0.0467 | |||
| BOE |
0.0630 | |||
| BGY |
0.0338 | |||
| BME |
0.2000 | |||
| BCX |
0.0516 | |||
| BST |
0.1500 | |||
| BUI |
0.1210 | |||
The fixed amounts distributed per share are subject to change at the discretion of each Trust’s Board. Under its Plan, each Trust will distribute all available investment income to its shareholders, consistent with its primary investment objectives and as required by the Internal Revenue Code of 1986, as amended (the “Code”). If sufficient investment income is not available on a monthly basis, the Trusts will distribute long-term capital gains and/or return of capital to shareholders in order to maintain a level distribution. Each monthly distribution to shareholders is expected to be at the fixed amount established by the Board, except for extraordinary distributions and potential distribution rate increases or decreases to enable the Trusts to comply with the distribution requirements imposed by the Code.
Shareholders should not draw any conclusions about each Trust’s investment performance from the amount of these distributions or from the terms of the Plan. Each Trust’s total return performance on net asset value is presented in its financial highlights table.
The Board may amend, suspend or terminate a Trust’s Plan at any time without prior notice to the Trust’s shareholders if it deems such actions to be in the best interests of the Trust or its shareholders. The suspension or termination of the Plan could have the effect of creating a trading discount (if the Trust’s stock is trading at or above net asset value) or widening an existing trading discount. The Trusts are subject to risks that could have an adverse impact on their ability to maintain level distributions. Examples of potential risks include, but are not limited to, economic downturns impacting the markets, decreased market volatility, companies suspending or decreasing corporate dividend distributions and changes in the Code. Please refer to BME’s prospectus for a more complete description of its risks.
| 2 | 2019 BLACKROCK SEMI-ANNUAL REPORT TO SHAREHOLDERS |


| THIS PAGE IS NOT PART OF YOUR FUND REPORT | 3 |
| Page | ||||
| 2 | ||||
| 2 | ||||
| 3 | ||||
| Semi-Annual Report: |
||||
| Option Over-Writing Strategy |
5 | |||
| 6 | ||||
| 26 | ||||
| 27 | ||||
| 98 | ||||
| 100 | ||||
| 102 | ||||
| 107 | ||||
| 110 | ||||
| 120 | ||||
| Disclosure of Investment Advisory Agreements and Sub-Advisory Agreements |
131 | |||
| 139 | ||||
| 140 | ||||
| 142 | ||||
| 4 |
Overview
In general, the goal of each of the Trusts is to provide total return through a combination of current income and realized and unrealized gains (capital appreciation). The Trusts seek to pursue these goals primarily by investing in a portfolio of equity securities and also by employing a strategy of writing (selling) covered call and put options in an effort to generate current gains from option premiums and to enhance each Trust’s risk-adjusted return. Each Trust’s objectives cannot be achieved in all market conditions.
Each Trust primarily writes single stock covered call options, and may also from time to time write single stock put options. When writing (selling) a covered call option, a Trust holds an underlying equity security and enters into an option transaction which allows the counterparty to purchase the equity security at an agreed-upon price (“strike price”) within an agreed-upon time period. The Trust receives cash premiums from the counterparties upon writing (selling) the option, which along with net investment income and net realized gains, if any, are generally available to support current or future distributions paid by the Trust. During the option term, the counterparty may elect to exercise the option if the market value of the equity security rises above the strike price, and the Trust is obligated to sell the equity security to the counterparty at the strike price, realizing a gain or loss. Premiums received increase gains or reduce losses realized on the sale of the equity security. If the option remains unexercised upon its expiration, the Trust realizes gains equal to the premiums received. Alternatively, an option may be closed out by an offsetting purchase or sale of an option prior to expiration. The Trust realizes a capital gain from a closing purchase or sale transaction if the premium paid is less than the premium received from writing the option. The Trust realizes a capital loss from a closing purchase or sale transaction if the premium received is less than the premium paid to purchase the option.
Writing covered call options entails certain risks, which include, but are not limited to, the following: an increase in the value of the underlying equity security above the strike price can result in the exercise of a written option (sale by a Trust to the counterparty) when the Trust might not otherwise have sold the security; exercise of the option by the counterparty may result in a sale below the current market value and a gain or loss being realized by the Trust; and limiting the potential appreciation that could be realized on the underlying equity security to the extent of the strike price of the option. The premium that a Trust receives from writing a covered call option may not be sufficient to offset the potential appreciation on the underlying equity security above the strike price of the option that could have otherwise been realized by the Trust. As such, an option over-writing strategy may outperform the general equity market in flat or falling markets but underperform in rising markets.
Distributions
Each Trust employs a plan to support a level distribution of income, capital gains and/or return of capital. The goal of the plan is to provide shareholders with consistent and predictable cash flows by setting distribution rates based on expected long-term returns of the Trust. Such distributions, under certain circumstances, may exceed a Trust’s total return performance. When total distributions exceed total return performance for the period, the difference reduces the Trust’s total assets and net asset value per share (“NAV”) and, therefore, could have the effect of increasing the Trust’s expense ratio and reducing the amount of assets the Trust has available for long term investment. In order to make these distributions, a Trust may have to sell portfolio securities at less than opportune times.
The final tax characterization of distributions is determined after the fiscal year and is reported in a Trust’s annual report to shareholders. Distributions can be characterized as ordinary income, capital gains and/or return of capital. The Trust’s taxable net investment income or net realized capital gains (“taxable income”) may not be sufficient to support the level of distributions paid. To the extent that distributions exceed the Trust’s current and accumulated earnings and profits, the excess may be treated as a non-taxable return of capital.
A return of capital distribution does not necessarily reflect a Trust’s investment performance and should not be confused with ‘yield’ or ‘income.’ A return of capital is a return of a portion of an investor’s original investment. A return of capital is not expected to be taxable, but it reduces a shareholder’s tax basis in his or her shares, thus reducing any loss or increasing any gain on a subsequent disposition by the shareholder of his or her shares. It is possible that a substantial portion of the distributions paid during a calendar year may ultimately be classified as return of capital for U.S. federal income tax purposes when the final determination of the source and character of the distributions is made.
Option Over-Writing Illustrative Example
To illustrate these concepts, assume the following: (1) a common stock purchased at and currently trading at $37.15 per share; (2) a three-month call option is written by a Trust with a strike price of $40 (i.e., 7.7% higher than the current market price); and (3) the Trust receives $2.45, or 6.6% of the common stock’s value, as a premium. If the stock price remains unchanged, the option expires and there would be a 6.6% return for the three-month period. If the stock were to decline in price by 6.6% (i.e., decline to $34.70 per share), the option strategy would “break-even” from an economic perspective resulting in neither a gain nor a loss. If the stock were to climb to a price of $40 or above, the option would be exercised and the stock would return 7.7% coupled with the option premium received of 6.6% for a total return of 14.3%. Under this scenario, the Trust loses the benefit of any appreciation of the stock above $40, and thus is limited to a 14.3% total return. The premium from writing the call option serves to offset some of the unrealized loss on the stock in the event that the price of the stock declines, but if the stock were to decline more than 6.6% under this scenario, the Trust’s downside protection is eliminated and the stock could eventually become worthless.
Each Trust intends to write covered call and other options to varying degrees depending upon market conditions. Please refer to each Trust’s Schedule of Investments and the Notes to Financial Statements for details of written options.
| THE BENEFITS AND RISKS OF OPTION OVER-WRITING | 5 |
| Trust Information as of June 30, 2019 | BlackRock Energy and Resources Trust |
Investment Objective
BlackRock Energy and Resources Trust’s (BGR) (the “Trust”) investment objective is to provide total return through a combination of current income, current gains and long-term capital appreciation. The Trust seeks to achieve its investment objective by investing, under normal market conditions, at least 80% of its total assets in equity securities of energy and natural resources companies and equity derivatives with exposure to the energy and natural resources industry. The Trust may invest directly in such securities or synthetically through the use of derivatives. The Trust seeks to pursue this goal primarily by investing in a portfolio of equity securities and also by employing a strategy of writing (selling) covered call and put options.
No assurance can be given that the Trust’s investment objective will be achieved.
Trust Information
| Symbol on New York Stock Exchange (“NYSE”) |
BGR | |
| Initial Offering Date |
December 29, 2004 | |
| Current Distribution Rate on Closing Market Price as of June 30, 2019 ($11.93)(a) |
7.81% | |
| Current Monthly Distribution per Common Share(b) |
$0.0776 | |
| Current Annualized Distribution per Common Share(b) |
$0.9312 |
| (a) | Current distribution rate on closing market price is calculated by dividing the current annualized distribution per share by the closing market price. The current distribution rate consists of income, net realized gains and/or a return of capital. See the Financial Highlights for the actual sources and character of distributions. Past performance does not guarantee future results. |
| (b) | The distribution rate is not constant and is subject to change. A portion of the distribution may be deemed a return of capital or net realized gain. |
Performance and Portfolio Management Commentary
Returns for the six months ended June 30, 2019 were as follows:
| Returns Based On | ||||||||
| Market Price | Net Asset Value | |||||||
| BGR(a)(b) |
18.71 | % | 13.71 | % | ||||
| Lipper Natural Resources Funds(c) |
20.62 | 14.92 | ||||||
| (a) | All returns reflect reinvestment of dividends and/or distributions at actual reinvestment prices. |
| (b) | The Trust’s discount to NAV narrowed during the period, which accounts for the difference between performance based on market price and performance based on NAV. |
| (c) | Average return. Returns reflect reinvestment of dividends and/or distributions at NAV on the ex-dividend date as calculated by Lipper. |
Performance results may include adjustments made for financial reporting purposes in accordance with U.S. generally accepted accounting principles.
Past performance is not indicative of future results.
The following discussion relates to the Trust’s absolute performance based on NAV:
What factors influenced performance?
Oil prices started a strong rally from the beginning of the year through the end of April, leading to robust gains for both West Texas Intermediate and Brent crude oil for the full, semi-annual period. After a short-lived sell-off in May that was caused by concerns about weaker demand, the market quickly recovered in June as investors regained their appetite for risk. In this environment, large-cap, integrated oil companies — including the Trust’s positions in Royal Dutch Shell PLC, Exxon Mobil Corp. and BP PLC — generally performed well.
Among individual stocks, Anadarko Petroleum Corp. — which was bid for by both Occidental Petroleum Corp. and Chevron Corp. — was the leading contributor. The Trust’s investment adviser believes this may be an indication that many energy stocks are undervalued relative to the price of oil.
U.S. natural gas prices were weak during the period, reflecting strong supply growth, adverse weather conditions and weakness in the European gas market. As a result, the Trust’s position in the natural gas producer EQT Corp. was among the largest detractors from absolute performance. Other detractors of note included positions in the refining & marketing company Marathon Petroleum Corp. and the oil services company Halliburton Co.
The Trust made use of options, principally written call options on individual stocks. The option overlay strategy detracted from Trust performance in the rising market.
Describe recent portfolio activity
The investment adviser added to the Trust’s weighting in the integrated energy sector by increasing its positions in TOTAL SA and BP PLC and initiating an investment in ENI SpA. These moves were funded by decreasing the portfolio’s weighting in the exploration & production exposure (“E&P”) industry, which it achieved in part by exiting Devon Energy Corp.
Describe portfolio positioning at period end.
The investment adviser continued to focus on companies that are displaying signs of capital discipline and steady growth, as well as those that stand to benefit from growth in the emerging liquified natural gas industry. The integrated energy subsector represented the Trust’s largest allocation, followed by the E&P, distribution, refining & marketing, and oil services industries, respectively.
| 6 | 2019 BLACKROCK SEMI-ANNUAL REPORT TO SHAREHOLDERS |
| Trust Information as of June 30, 2019 (continued) | BlackRock Energy and Resources Trust |
As of June 30, 2019, the Trust had an options overwriting program in place whereby 33% of the underlying equities were overwritten with call options. These options were typically written at levels above prevailing market prices (estimated to be 3.8% out of the money) with an average time until expiration of 49 days.
The views expressed reflect the opinions of BlackRock as of the date of this report and are subject to change based on changes in market, economic or other conditions. These views are not intended to be a forecast of future events and are no guarantee of future results.
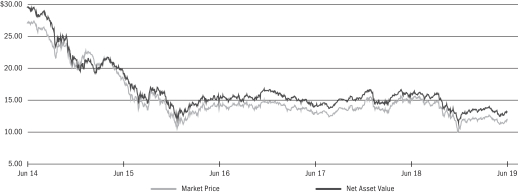
Market Price and Net Asset Value Per Share Summary
| 06/30/19 | 12/31/18 |
Change | High | Low | ||||||||||||||||
| Market Price |
$ | 11.93 | $ | 10.45 | 14.16 | % | $ | 12.61 | $ | 10.21 | ||||||||||
| Net Asset Value |
13.10 | 11.98 | 9.35 | 13.92 | 11.98 | |||||||||||||||
Market Price and Net Asset Value History For the Past Five Years
Overview of the Trust’s Total Investments *
| TRUST INFORMATION | 7 |
| Trust Information as of June 30, 2019 | BlackRock Enhanced Capital and Income Fund, Inc. |
Investment Objective
BlackRock Enhanced Capital and Income Fund, Inc.’s (CII) (the “Trust”) investment objective is to provide investors with a combination of current income and capital appreciation. The Trust seeks to achieve its investment objective by investing in a portfolio of equity securities of U.S. and foreign issuers. The Trust may invest directly in such securities or synthetically through the use of derivatives. The Trust also seeks to achieve its investment objective by employing a strategy of writing (selling) covered call and put options.
No assurance can be given that the Trust’s investment objective will be achieved.
Trust Information
| Symbol on NYSE |
CII | |
| Initial Offering Date |
April 30, 2004 | |
| Current Distribution Rate on Closing Market Price as of June 30, 2019 ($15.80)(a) |
6.29% | |
| Current Monthly Distribution per Common Share(b) |
$0.0828 | |
| Current Annualized Distribution per Common Share(b) |
$0.9936 |
| (a) | Current distribution rate on closing market price is calculated by dividing the current annualized distribution per share by the closing market price. The current distribution rate consists of income, net realized gains and/or a return of capital. See the Financial Highlights for the actual sources and character of distributions. Past performance does not guarantee future results. |
| (b) | The distribution rate is not constant and is subject to change. A portion of the distribution may be deemed a return of capital or net realized gain. |
Performance and Portfolio Management Commentary
Returns for the six months ended June 30, 2019 were as follows:
| Returns Based On | ||||||||
| Market Price | Net Asset Value | |||||||
| CII(a)(b) |
15.80 | % | 13.05 | % | ||||
| S&P 500® Index |
N/A | 18.54 | ||||||
| (a) | All returns reflect reinvestment of dividends and/or distributions at actual reinvestment prices. |
| (b) | The Trust’s discount to NAV narrowed during the period, which accounts for the difference between performance based on market price and performance based on NAV. |
N/A — Not applicable as the index does not have a market price.
Performance results may include adjustments made for financial reporting purposes in accordance with U.S. generally accepted accounting principles.
Past performance is not indicative of future results.
The following discussion relates to the Trust’s relative performance based on the index cited above:
What factors influenced performance?
In the equity allocation of the Trust, the largest contributor to Trust performance for the six-month period was stock selection within the industrials sector. Most notably, exposure to both used auto auction company KAR Auction Services, Inc. and railway Norfolk Southern Corp. added to return. An underweight allocation to as well as stock selection within utilities aided performance as well, as did positioning in the financials sector.
The largest equity allocation detractors from Trust performance for the six-month period was stock selection within the consumer discretionary sector. In particular, positioning across specialty retail challenged performance. Positioning in health care also acted as a constraint on return, as holdings in the managed care and biotechnology segments produced weakness. Finally, positioning in the information technology (“IT”) sector weighed on results.
The Trust utilizes an options overlay strategy in which calls are written on a portion of the portfolio’s holdings. The use of options during the period slightly detracted from Trust performance.
Describe recent portfolio activity.
During the six-month period, the Trust significantly boosted exposure to the consumer discretionary sector. Holdings within communications services and industrials were also increased. Conversely, the Trust significantly reduced its exposure to the health care sector. The Trust also reduced its exposure to utility and materials stocks.
Describe portfolio positioning at period end.
The Trust’s largest allocations were in the IT, health care and financials sectors. Relative to the benchmark, the Trust’s largest overweight positions were in the consumer discretionary, health care and communication services sectors. Conversely, the Trust’s largest relative underweights were in the real estate, utilities and technology sectors.
As of June 30, 2019, the Trust had an option overwriting program whereby 48% of the underlying equities were overwritten with call options on individual stocks. These call options were typically written at levels above prevailing market prices (estimated to be 3.9% out of the money) with maturities averaging 47 days.
The views expressed reflect the opinions of BlackRock as of the date of this report and are subject to change based on changes in market, economic or other conditions. These views are not intended to be a forecast of future events and are no guarantee of future results.
| 8 | 2019 BLACKROCK SEMI-ANNUAL REPORT TO SHAREHOLDERS |
| Trust Information as of June 30, 2019 (continued) | BlackRock Enhanced Capital and Income Fund, Inc. |
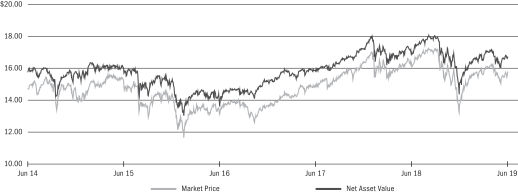
Market Price and Net Asset Value Per Share Summary
| 06/30/19 | 12/31/18 |
Change | High | Low | ||||||||||||||||
| Market Price |
$ | 15.80 | $ | 14.08 | 12.22 | % | $ | 16.31 | $ | 13.92 | ||||||||||
| Net Asset Value |
16.74 | 15.28 | 9.55 | 17.19 | 14.97 | |||||||||||||||
Market Price and Net Asset Value History For the Past Five Years
Overview of the Trust’s Total Investments *
| TRUST INFORMATION | 9 |
| Trust Information as of June 30, 2019 | BlackRock Enhanced Equity Dividend Trust |
Investment Objective
BlackRock Enhanced Equity Dividend Trust’s (BDJ) (the “Trust”) primary investment objective is to provide current income and current gains, with a secondary investment objective of long-term capital appreciation. The Trust seeks to achieve its investment objectives by investing in common stocks that pay dividends and have the potential for capital appreciation and by employing a strategy of writing (selling) covered call and put options. The Trust invests, under normal market conditions, at least 80% of its total assets in dividend paying equities. The Trust may invest directly in such securities or synthetically through the use of derivatives.
No assurance can be given that the Trust’s investment objectives will be achieved.
Trust Information
| Symbol on NYSE |
BDJ | |
| Initial Offering Date |
August 31, 2005 | |
| Current Distribution Rate on Closing Market Price as of June 30, 2019 ($8.87)(a) |
6.32% | |
| Current Monthly Distribution per Common Share(b) |
$0.0467 | |
| Current Annualized Distribution per Common Share(b) |
$0.5604 |
| (a) | Current distribution rate on closing market price is calculated by dividing the current annualized distribution per share by the closing market price. The current distribution rate consists of income, net realized gains and/or a return of capital. See the Financial Highlights for the actual sources and character of distributions. Past performance does not guarantee future results. |
| (b) | The monthly distribution per Common Share, declared on July 1, 2019, was increased to $0.0500 per share. The current distribution rate on closing market price, current monthly distribution per Common Share and current annualized distribution per Common Share do not reflect the new distribution rate. The new distribution rate is not constant and is subject to change in the future. A portion of the distribution may be deemed a return of capital or net realized gain. |
Performance and Portfolio Management Commentary
Returns for the six months ended June 30, 2019 were as follows:
| Returns Based On | ||||||||
| Market Price | Net Asset Value | |||||||
| BDJ(a)(b) |
17.89 | % | 13.44 | % | ||||
| Russell 1000® Value Index |
N/A | 16.24 | ||||||
| (a) | All returns reflect reinvestment of dividends and/or distributions at actual reinvestment prices. |
| (b) | The Trust’s discount to NAV narrowed during the period, which accounts for the difference between performance based on market price and performance based on NAV. |
N/A — Not applicable as the index does not have a market price.
Performance results may include adjustments made for financial reporting purposes in accordance with U.S. generally accepted accounting principles.
Past performance is not indicative of future results.
The following discussion relates to the Trust’s relative performance based on the index cited above:
What factors influenced performance?
The largest contributor to Trust performance for the six-month period was stock selection in the energy sector. In particular, selection decisions within the oil, gas & consumable fuels industry added to relative return. Within financials, stock selection and an overweight in insurance, an underweight exposure to diversified financial services, and selection among banks enhanced relative performance. Lastly, stock selection and allocation decisions within information technology (“IT”) contributed, as did selection within consumer staples.
The largest detractor from relative performance derived from a combination of stock selection and allocation decisions in the health care sector. Most notably, overweight exposure to the health care providers & services industry and an underweight to the life sciences tools & services industry detracted from relative performance. Additionally, stock selection in the utilities sector represented a headwind during the period, mainly among electric utilities. In communication services, stock selection in the diversified telecom services industry was a source of underperformance. Finally, the Trust’s cash position also weighed on performance.
The Trust utilized an options overlay strategy in which calls are written on a portion of the portfolio’s holdings. The Trust’s options overlay strategy detracted slightly from returns during a period when the Trust posted a very strong absolute return.
Describe recent portfolio activity.
During the six-month period, the Trust boosted its exposure to the financials sector. Holdings within consumer discretionary and consumer staples also were increased. The Trust reduced its exposure to the health care and utilities sectors.
Describe portfolio positioning at period end.
The Trust’s largest allocations were in the financials, health care and IT sectors. Relative to the index, the Trust’s largest overweight positions were in the IT, health care and financials sectors. Conversely, the Trust’s largest relative underweights were in the real estate, utilities and industrials sectors.
| 10 | 2019 BLACKROCK SEMI-ANNUAL REPORT TO SHAREHOLDERS |
| Trust Information as of June 30, 2019 (continued) | BlackRock Enhanced Equity Dividend Trust |
As of June 30, 2019, the Trust had an option overwriting program in place whereby 53% of the underlying equities were overwritten with call options on individual stocks. These call options were typically written at levels above the prevailing market prices (estimated to be 3.0% out of the money) and for maturities averaging 48 days.
The views expressed reflect the opinions of BlackRock as of the date of this report and are subject to change based on changes in market, economic or other conditions. These views are not intended to be a forecast of future events and are no guarantee of future results.
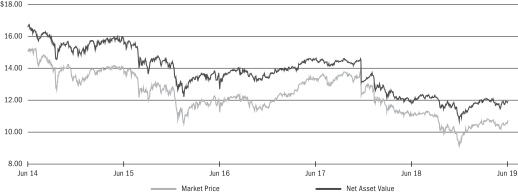
Market Price and Net Asset Value Per Share Summary
| 06/30/19 | 12/31/18 | Change | High | Low | ||||||||||||||||
| Market Price |
$ | 8.87 | $ | 7.77 | 14.16 | % | $ | 8.89 | $ | 7.72 | ||||||||||
| Net Asset Value |
9.60 | 8.74 | 9.84 | 9.64 | 8.64 | |||||||||||||||
Market Price and Net Asset Value History For the Past Five Years

Overview of the Trust’s Total Investments *
| TRUST INFORMATION | 11 |
| Trust Information as of June 30, 2019 | BlackRock Enhanced Global Dividend Trust |
Investment Objective
BlackRock Enhanced Global Dividend Trust’s (BOE) (the “Trust”) primary investment objective is to provide current income and current gains, with a secondary investment objective of long-term capital appreciation. The Trust seeks to achieve its investment objectives by investing primarily in equity securities issued by companies located in countries throughout the world and by employing a strategy of writing (selling) covered call and put options. Under normal circumstances, the Trust invests at least 80% of its net assets in dividend-paying equity securities and at least 40% of its assets outside of the U.S. (unless market conditions are not deemed favorable by Trust management, in which case the Trust would invest at least 30% of its assets outside of the U.S.). The Trust may invest in securities of companies of any market capitalization, but intends to invest primarily in securities of large capitalization companies. The Trust may invest directly in such securities or synthetically through the use of derivatives.
No assurance can be given that the Trust’s investment objectives will be achieved.
Trust Information
| Symbol on NYSE |
BOE | |
| Initial Offering Date |
May 31, 2005 | |
| Current Distribution Rate on Closing Market Price as of June 30, 2019 ($10.73)(a) |
7.05% | |
| Current Monthly Distribution per Common Share(b) |
$0.0630 | |
| Current Annualized Distribution per Common Share(b) |
$0.7560 |
| (a) | Current distribution rate on closing market price is calculated by dividing the current annualized distribution per share by the closing market price. The current distribution rate consists of income, net realized gains and/or a return of capital. See the Financial Highlights for the actual sources and character of distributions. Past performance does not guarantee future results. |
| (b) | The distribution rate is not constant and is subject to change. A portion of the distribution may be deemed a return of capital or net realized gain. |
Performance and Portfolio Management Commentary
Returns for the six months ended June 30, 2019 were as follows:
| Returns Based On | ||||||||
| Market Price | Net Asset Value | |||||||
| BOE(a)(b) |
18.69 | % | 11.41 | % | ||||
| MSCI All Country World Index |
N/A | 16.23 | ||||||
| (a) | All returns reflect reinvestment of dividends and/or distributions at actual reinvestment prices. |
| (b) | The Trust’s discount to NAV narrowed during the period, which accounts for the difference between performance based on market price and performance based on NAV. |
N/A — Not applicable as the index does not have a market price.
Performance results may include adjustments made for financial reporting purposes in accordance with U.S. generally accepted accounting principles.
Past performance is not indicative of future results.
The following discussion relates to the Trust’s relative performance based on the index cited above:
What factors influenced performance?
The Trust’s lack of exposure to the underperforming energy sector represented the top contributor to relative return during the six-month period. Stock selection in materials also was additive, particularly within the containers and packing industry. In addition, an overweight to and stock selection within the industrials sector contributed, especially within the air freight and logistics industry. At the individual security level, the French energy management multinational Schneider Electric SE was among the largest contributors to performance based on strong first quarter sales. Technology conglomerate Cisco Systems, Inc. was another top performer in light of better than expected financial results and a raised earnings forecast. The Finnish engineering company Kone OYJ was a notable contributor as well, as investors rewarded Kone’s profit growth.
Conversely, an underweight to and stock selection within the information technology (“IT”) sector was the principal constraint on Trust performance, with positioning within the IT services industry weighing most heavily on returns. Security selection in consumer staples and overweight exposure to the sector, mainly in tobacco, also detracted, as did stock selection in consumer discretionary and financials. At the security level, the Trust’s positions in the tobacco companies Imperial Brands PLC and Altria Group, Inc. were two of the largest individual detractors from performance. Tobacco companies endured a sharp sell-off stemming from continued headlines regarding falling U.S. industry sales and increased regulatory pressure on “Next Generation” smoking products. Additionally, the Trust’s position in the biopharmaceutical firm AbbVie, Inc. detracted from relative performance as the company reported disappointing earnings.
The Trust made use of options, principally written call options on individual stocks. The Trust’s options writing strategy during the six months detracted from returns during a period when the Trust posted a very strong absolute return.
Describe recent portfolio activity.
During the period, the portfolio added exposure to the consumer discretionary sector, mainly within the leisure products and specialty retail industries. The Trust also added exposure within health care, especially the health care equipment and supplies sub-sector. Exposure to industrials was reduced as the Trust trimmed its position in Kone OYJ following a strong run of performance. Lastly, within consumer staples, the Trust sold its holdings in Japan Tobacco, Inc., modestly reducing its weighting to the sector.
| 12 | 2019 BLACKROCK SEMI-ANNUAL REPORT TO SHAREHOLDERS |
| Trust Information as of June 30, 2019 (continued) | BlackRock Enhanced Global Dividend Trust |
Describe portfolio positioning at period end.
At period end, the Trust’s largest sector exposures were in consumer staples and health care, with an emphasis on the tobacco and pharmaceuticals industries, respectively. The largest underweights were to IT, financials and energy. The Trust had no exposure to the real estate, utilities or energy sectors at the end of the period. From a regional perspective, a majority of portfolio assets was invested either within the United States or Europe, with significant exposure in the United Kingdom and Switzerland.
As of June 30, 2019, the Trust had an option overwriting program in place whereby 43% of the underlying equities were overwritten with call options on individual stocks. These call options were typically written at levels above the prevailing market prices (estimated to be 2.3% out of the money) and for maturities averaging 48 days.
The views expressed reflect the opinions of BlackRock as of the date of this report and are subject to change based on changes in market, economic or other conditions. These views are not intended to be a forecast of future events and are no guarantee of future results.
Market Price and Net Asset Value Per Share Summary
| 06/30/19 | 12/31/18 |
Change | High | Low | ||||||||||||||||
| Market Price |
$ | 10.73 | $ | 9.37 | 14.51 | % | $ | 10.85 | $ | 9.30 | ||||||||||
| Net Asset Value |
11.90 | 11.07 | 7.50 | 12.10 | 10.91 | |||||||||||||||
Market Price and Net Asset Value History For the Past Five Years
Overview of the Trust’s Total Investments *
| TRUST INFORMATION | 13 |
| Trust Information as of June 30, 2019 | BlackRock Enhanced International Dividend Trust |
Investment Objective
BlackRock Enhanced International Dividend Trust’s (BGY) (the “Trust”) primary investment objective is to provide current income and current gains, with a secondary objective of long-term capital appreciation. The Trust seeks to achieve its investment objectives by investing primarily in equity securities issued by companies of any market capitalization located in countries throughout the world and by employing a strategy of writing (selling) covered call and put options. The Trust invests, under normal circumstances, at least 80% of its net assets in dividend-paying equity securities issued by non-U.S. companies of any market capitalization, but intends to invest primarily in securities of large capitalization companies. The Trust may invest directly in such securities or synthetically through the use of derivatives.
No assurance can be given that the Trust’s investment objectives will be achieved.
Trust Information
| Symbol on NYSE |
BGY | |
| Initial Offering Date |
May 30, 2007 | |
| Current Distribution Rate on Closing Market Price as of as of June 30, 2019 ($5.62)(a) |
7.22% | |
| Current Monthly Distribution per Common Share(b) |
$0.0338 | |
| Current Annualized Distribution per Common Share(b) |
$0.4056 |
| (a) | Current distribution rate on closing market price is calculated by dividing the current annualized distribution per share by the closing market price. The current distribution rate consists of income, net realized gains and/or a return of capital. See the Financial Highlights for the actual sources and character of distributions. Past performance does not guarantee future results. |
| (b) | The distribution rate is not constant and is subject to change. A portion of the distribution may be deemed a return of capital or net realized gain. |
Performance and Portfolio Management Commentary
Returns for the six months ended June 30, 2019 were as follows:
| Returns Based On | ||||||||
| Market Price | Net Asset Value | |||||||
| BGY(a)(b) |
17.05 | % | 11.42 | % | ||||
| MSCI All Country World Index ex-USA |
N/A | 13.60 | ||||||
| (a) | All returns reflect reinvestment of dividends and/or distributions at actual reinvestment prices. |
| (b) | The Trust’s discount to NAV narrowed during the period, which accounts for the difference between performance based on market price and performance based on NAV. |
N/A — Not applicable as the index does not have a market price.
Performance results may include adjustments made for financial reporting purposes in accordance with U.S. generally accepted accounting principles.
Past performance is not indicative of future results.
The following discussion relates to the Trust’s relative performance based on the index cited above:
What factors influenced performance?
The largest contributions to the Trust’s relative performance during the six-month period came from stock selection in the health care, industrials and consumer discretionary sectors. Regionally, the Trust benefited from security selection within Europe ex-U.K. and Asia ex-Japan.
Conversely, security selection in information technology, financials and consumer staples detracted from relative performance. By region, holdings in Canadian- and U.K.-listed companies detracted from returns.
During the period, the Trust made use of options, principally written call options on individual stocks. The Trust’s options writing strategy during the past six months detracted slightly from Trust performance during a period when the Trust posted a strong absolute return.
Describe recent portfolio activity.
The Trust reduced its exposure to Japanese securities by exiting its position in Japan Tobacco, Inc. The Trust increased exposure to Swiss-listed companies by initiating a position in the luxury goods firm Compagnie Financière Richemont SA.
Describe portfolio positioning at period end.
At the end of the reporting period, the Fund held its largest sector overweight positions in health care, consumer staples and industrials, and its most significant underweights in financials, consumer discretionary and energy. By region, the Trust’s largest overweights were in European and North American securities, while its largest regional underweights included the emerging markets and Japan-listed securities.
As of June 30, 2019, the Trust had an option overwriting program in place whereby 44% of the underlying equities were overwritten with call options on individual stocks. These call options were typically written at levels above the prevailing market prices (estimated to be 2.2% out of the money) and for maturities averaging 50 days.
The views expressed reflect the opinions of BlackRock as of the date of this report and are subject to change based on changes in market, economic or other conditions. These views are not intended to be a forecast of future events and are no guarantee of future results.
| 14 | 2019 BLACKROCK SEMI-ANNUAL REPORT TO SHAREHOLDERS |
| Trust Information as of June 30, 2019 (continued) | BlackRock Enhanced International Dividend Trust |
Market Price and Net Asset Value Per Share Summary
| 06/30/19 | 12/31/18 |
Change | High | Low | ||||||||||||||||
| Market Price |
$ | 5.62 | $ | 4.98 | 12.85 | % | $ | 5.74 | $ | 4.94 | ||||||||||
| Net Asset Value |
6.22 | 5.79 | 7.43 | 6.32 | 5.73 | |||||||||||||||
Market Price and Net Asset Value History For the Past Five Years

Overview of the Trust’s Total Investments *
| TRUST INFORMATION | 15 |
| Trust Information as of June 30, 2019 | BlackRock Health Sciences Trust |
Investment Objective
BlackRock Health Sciences Trust’s (BME) (the “Trust”) investment objective is to provide total return through a combination of current income, current gains and long-term capital appreciation. The Trust seeks to achieve its investment objective by investing, under normal market conditions, at least 80% of its total assets in equity securities of companies engaged in the health sciences and related industries and equity derivatives with exposure to the health sciences industry. The Trust seeks to pursue this goal primarily by investing in a portfolio of equity securities and by employing a strategy of writing (selling) covered call and put options.
No assurance can be given that the Trust’s investment objective will be achieved.
Trust Information
| Symbol on NYSE |
BME | |
| Initial Offering Date |
March 31, 2005 | |
| Current Distribution Rate on Closing Market Price as of June 30, 2019 ($38.89)(a) |
6.17% | |
| Current Monthly Distribution per Common Share(b) |
$0.2000 | |
| Current Annualized Distribution per Common Share(b) |
$2.4000 |
| (a) | Current distribution rate on closing market price is calculated by dividing the current annualized distribution per share by the closing market price. The current distribution rate consists of income, net realized gains and/or a return of capital. See the Financial Highlights for the actual sources and character of distributions. Past performance does not guarantee future results. |
| (b) | The distribution rate is not constant and is subject to change. A portion of the distribution may be deemed a return of capital or net realized gain. |
Performance and Portfolio Management Commentary
Returns for the six months ended June 30, 2019 were as follows:
| Returns Based On | ||||||||
| Market Price | Net Asset Value | |||||||
| BME(a)(b) |
10.16 | % | 10.12 | % | ||||
| Russell 3000® Healthcare Index |
N/A | 10.23 | ||||||
| (a) | All returns reflect reinvestment of dividends and/or distributions at actual reinvestment prices. |
| (b) | The Trust’s premium to NAV widened during the period, which accounts for the difference between performance based on market price and performance based on NAV. |
N/A — Not applicable as the index does not have a market price.
Performance results may include adjustments made for financial reporting purposes in accordance with U.S. generally accepted accounting principles.
Past performance is not indicative of future results.
The following discussion relates to the Trust’s relative performance based on the index cited above:
What factors influenced performance?
Healthcare stocks produced a strong, double-digit gain in the semiannual period, but the sector failed to keep pace with the even larger advance for the broader market. At a time of robust investor risk appetites, higher-risk and more economically sensitive stocks generally outperformed the types of stable growers typically found in the health care sector.
Consistent with the Trust’s bottom-up approach, stock selection was the primary driver of performance. While selection in the biotechnology and pharmaceuticals subsectors added value, the benefit was offset by the Trust’s somewhat weaker showing in the healthcare providers & services and medical devices & supplies sub-sectors.
At the individual company level, the Trust’s zero weightings in three outperforming stocks — Danaher Corp., Celgene Corp., and Veeva Systems, Inc. — were the largest detractors. Danaher, a medical devices & supplies firm, staged a strong rally as investors grew increasingly optimistic about the potential benefits of the company’s acquisition of GE’s biopharmaceutical business. Celgene was bid up in the first week of January following a takeover bid from the pharmaceutical firm Bristol-Myers Squibb Co., while Veeva rallied after reporting record sales growth for its clinical data management system, Veeva Vault.
A zero weighting in the biotechnology firm AbbVie, Inc. was the leading contributor to performance, as the stock declined after announcing its acquisition of the pharmaceutical firm Allergan PLC. In addition, AbbVie missed earnings expectations and lowered its guidance for 2019. An overweight position in the medical device company Masimo Corp. was also a top contributor. Masimo reported strong earnings with revenue that exceeded expectations, and raised its outlook for the full year due to robust growth in its non-invasive device business. Stryker Corp., which beat earnings expectations due to the solid growth of its surgical robotics technology, was another contributor of note.
The Trust made use of options, principally written call options on individual stocks. The option overlay strategy had a marginally negative impact on results in the rising market.
Describe recent portfolio activity.
The Trust increased its allocation to the medical devices & supplies subsector, while it reduced its weightings in the pharmaceuticals, biotechnology, and health care providers & services subsectors.
| 16 | 2019 BLACKROCK SEMI-ANNUAL REPORT TO SHAREHOLDERS |
| Trust Information as of June 30, 2019 (continued) | BlackRock Health Sciences Trust |
Describe portfolio positioning at period end.
The Trust continued to use a bottom-up, fundamental investment process in an effort to construct a balanced, diversified portfolio of healthcare stocks. The portfolio continues to reflect two broad themes: innovation and value-based healthcare.
Innovation in medical technology remains a secular growth driver for the healthcare sector, as companies continue to develop new therapies or products that fulfill an unmet medical need or that represent an improvement over current treatments. This encompasses not only the biotechnology industry, but also the pharmaceuticals and medical devices & supplies sub-sectors.
With respect to value-based health care, the Trust has an above-benchmark weighting in the health care providers & services industry due to a sizable overweight in managed care stocks. The investment adviser continued to find a number of companies in this area that it believes are well positioned to reduce healthcare costs by leveraging their scale and analytical capabilities. Additionally, select holdings in the health care services industry feature business models that are benefiting from the shift to lower-cost options such as home healthcare.
As of June 30, 2019, the Trust had an options overwriting program in place whereby 30% of the underlying equities were overwritten with call options on individual stocks. These call options were typically written at levels above prevailing market prices (estimated to be 3.7% out of the money) with an average time until expiration of 45 days.
The views expressed reflect the opinions of BlackRock as of the date of this report and are subject to change based on changes in market, economic or other conditions. These views are not intended to be a forecast of future events and are no guarantee of future results.
Market Price and Net Asset Value Per Share Summary
| 06/30/19 |
12/31/18 |
Change | High | Low | ||||||||||||||||
| Market Price |
$ | 38.89 | $ | 36.45 | 6.69 | % | $ | 41.15 | $ | 35.75 | ||||||||||
| Net Asset Value |
38.26 | 35.87 | 6.66 | 38.53 | 34.65 | |||||||||||||||
Market Price and Net Asset Value History For the Past Five Years

Overview of the Trust’s Total Investments *
| TRUST INFORMATION | 17 |
| Trust Information as of June 30, 2019 | BlackRock Resources & Commodities Strategy Trust |
Investment Objective
BlackRock Resources & Commodities Strategy Trust’s (BCX) (the “Trust”) primary investment objective is to seek high current income and current gains, with a secondary objective of capital appreciation. The Trust will seek to achieve its investment objectives, under normal market conditions, by investing at least 80% of its total assets in equity securities issued by commodity or natural resources companies, derivatives with exposure to commodity or natural resources companies or investments in securities and derivatives linked to the underlying price movement of commodities or natural resources. While permitted, the Trust does not currently expect to invest in securities and derivatives linked to the underlying price movement of commodities or natural resources. The Trust seeks to pursue this goal primarily by investing in a portfolio of equity securities and also by employing a strategy of writing (selling) covered call and put options.
No assurance can be given that the Trust’s investment objectives will be achieved.
Trust Information
| Symbol on NYSE |
BCX | |
| Initial Offering Date |
March 30, 2011 | |
| Current Distribution Rate on Closing Market Price as of June 30, 2019 ($8.18)(a) |
7.57% | |
| Current Monthly Distribution per Common Share(b) |
$0.0516 | |
| Current Annualized Distribution per Common Share(b) |
$0.6192 |
| (a) | Current distribution rate on closing market price is calculated by dividing the current annualized distribution per share by the closing market price. The current distribution rate consists of income, net realized gains and/or a return of capital. See the Financial Highlights for the actual sources and character of distributions. Past performance does not guarantee future results. |
| (b) | The distribution rate is not constant and is subject to change. A portion of the distribution may be deemed a return of capital or net realized gain. |
Performance and Portfolio Management Commentary
Returns for the six months ended June 30, 2019 were as follows:
| Returns Based On | ||||||||
| Market Price | Net Asset Value | |||||||
| BCX(a)(b) |
20.42 | % | 14.27 | % | ||||
| Lipper Natural Resources Funds(c) |
20.62 | 14.92 | ||||||
| (a) | All returns reflect reinvestment of dividends and/or distributions at actual reinvestment prices. |
| (b) | The Trust’s discount to NAV narrowed during the period, which accounts for the difference between performance based on market price and performance based on NAV. |
| (c) | Average return. Returns reflect reinvestment of dividends and/or distributions at NAV on the ex-dividend date as calculated by Lipper. |
Performance results may include adjustments made for financial reporting purposes in accordance with U.S. generally accepted accounting principles.
Past performance is not indicative of future results.
The following discussion relates to the Trust’s absolute performance based on NAV:
What factors influenced performance?
Oil prices stated a strong rally from the beginning of the year through the end of April, leading to robust gains for both West Texas Intermediate and Brent crude oil for the full, semiannual period. After a short-lived sell-off in May that was caused by concerns about weaker demand, the market quickly recovered in June as investors regained their appetite for risk. In this environment, large-cap, integrated oil companies — including the Trust’s positions in Royal Dutch Shell PLC and BP PLC — generally performed well.
Iron ore was the standout performer in the industrials metals space due to seasonal restocking by Chinese steel mills and a large producer’s suspension of production. The Trust’s positions in mining companies, particularly BHP Billiton Ltd and Rio Tinto PLC, finished the period among the top contributors to absolute performance.
Umicore NV was the largest individual detractor. The Trust’s investment adviser began building a position in the company in late 2018 on the belief that it would capitalize on the positive trends in the electric vehicle and battery recycling industries. The stock initially performed well, but it turned lower in April after the company issued a profit warning for both 2019 and 2020. In reducing its forward guidance, Umicore cited lower cobalt prices and weaker demand for electric vehicle cathodes in China.
The Trust’s position in the specialist ingredients producer Ingredion, Inc. also detracted from performance. The company reported fourth-quarter results that were ahead of expectations, but it lowered its outlook for 2019. Other detractors of note included positions in the nutrition company Glanbia PLC and the lithium producer Albemarle Corp.
The Trust made use of options, principally written call options on individual stocks. The option overlay strategy detracted from results in the rising market.
Describe recent portfolio activity.
The investment adviser shifted the Trust’s holdings in the diversified mining sector. It sold the Trust’s position in Glencore PLC on the belief that the company had an unfavorable commodity mix and rising environmental, social and governance risks. The proceeds were rotated into Anglo American PLC. The Trust also reduced the portfolio’s weighting in fertilizer companies by exiting CF Industries Holdings, Inc. and increased its allocation to select protein producers, including Tyson Foods, Inc.
| 18 | 2019 BLACKROCK SEMI-ANNUAL REPORT TO SHAREHOLDERS |
| Trust Information as of June 30, 2019 (continued) | BlackRock Resources & Commodities Strategy Trust |
Describe portfolio positioning at period end.
The mining industry represented the Trust’s largest allocation, followed by energy and agriculture, respectively.
As of June 30, 2019, the Trust had an options overwriting program in place whereby 37% of the underlying equities were overwritten with call options. The options were typically written at levels above prevailing market prices (estimated to be 3.7% out of the money) with an average time until expiration of 49 days.
The views expressed reflect the opinions of BlackRock as of the date of this report and are subject to change based on changes in market, economic or other conditions. These views are not intended to be a forecast of future events and are no guarantee of future results.
Market Price and Net Asset Value Per Share Summary
| 06/30/19 | 12/31/18 | Change | High | Low | ||||||||||||||||
| Market Price |
$ | 8.18 | $ | 7.06 | 15.86 | % | $ | 8.38 | $ | 6.98 | ||||||||||
| Net Asset Value |
9.28 | 8.44 | 9.95 | 9.64 | 8.31 | |||||||||||||||
Market Price and Net Asset Value History For Past Five Years

Overview of the Trust’s Total Investments *
| TRUST INFORMATION | 19 |
| Trust Information as of June 30, 2019 | BlackRock Science and Technology Trust |
Investment Objective
BlackRock Science and Technology Trust’s (BST) (the “Trust”) investment objective is to provide income and total return through a combination of current income, current gains and long-term capital appreciation. The Trust seeks to achieve its investment objective by investing, under normal market conditions, at least 80% of its total assets in equity securities of U.S. and non-U.S. science and technology companies in any market capitalization range, selected for their rapid and sustainable growth potential from the development, advancement and use of science and/or technology (high growth science and technology stocks), and/or potential to generate current income from advantageous dividend yields (cyclical science and technology stocks). The Trust seeks to pursue this goal primarily by investing in a portfolio of equity securities and also by employing a strategy of writing (selling) covered call and put options.
No assurance can be given that the Trust’s investment objective will be achieved.
Trust Information
| Symbol on NYSE |
BST | |
| Initial Offering Date |
October 30, 2014 | |
| Current Distribution Rate on Closing Market Price as of June 30, 2019 ($32.31)(a) |
5.57% | |
| Current Monthly Distribution per Common Share(b) |
$0.1500 | |
| Current Annualized Distribution per Common Share(b) |
$1.8000 |
| (a) | Current distribution rate on closing market price is calculated by dividing the current annualized distribution per share by the closing market price. The current distribution rate consists of income, net realized gains and/or a return of capital. See the Financial Highlights for the actual sources and character of distributions. Past performance does not guarantee future results. |
| (b) | The distribution rate is not constant and is subject to change. A portion of the distribution may be deemed a return of capital or net realized gain. |
Performance and Portfolio Management Commentary
Returns for the six months ended June 30, 2019 were as follows:
| Returns Based On | ||||||||
| Market Price | Net Asset Value | |||||||
| BST(a)(b) |
21.00 | % | 27.56 | % | ||||
| MSCI World Information Technology Index |
N/A | 26.60 | ||||||
| (a) | All returns reflect reinvestment of dividends and/or distributions at actual reinvestment prices. |
| (b) | The Trust moved from a premium to NAV to a discount during the period, which accounts for the difference between performance based on market price and performance based on NAV. |
N/A — Not applicable as the index does not have a market price.
Performance results may include adjustments made for financial reporting purposes in accordance with U.S. generally accepted accounting principles.
Past performance is not indicative of future results.
The following discussion relates to the Trust’s relative performance based on the index cited above:
What factors influenced performance?
The Trust’s security selection within software companies made the largest contribution to relative return during the period, driven by the strong performance of enterprise software and cloud computing firms. On a stock specific basis, the Trust’s out-of-benchmark position in the hardware and streaming services company Roku, Inc. was the largest individual contributor to relative return based on the company’s strong sales growth. In addition, the Trust’s lack of holdings in the semiconductor firm Intel Corp. was the second largest contributor as the firm lowered its earnings forecast during the period. The third largest individual contribution came from an overweight position to the digital security company Okta, Inc., as Okta unveiled a new identity management product for servers and the cloud that investors responded to favorably.
Conversely, stock selection within gaming and media companies weighed on relative performance at the sub-sector level. At the security level, a non-benchmark position in the technology conglomerate Alphabet, Inc. represented the largest individual detractor. The Google parent company’s stock sold off due to increased regulatory scrutiny over alleged anti-competitive practices. Additionally, an underweight position to the software giant Microsoft Corp. detracted as the company’s strong first quarter earnings made it the third company in history to reach a $1 trillion valuation. An out-of-benchmark position in the Chinese gaming company Tencent Holdings Ltd. also detracted as several of the company’s new game titles failed to receive approval from Chinese authorities.
The Trust made use of options, principally written call options on individual stocks. The Trust’s options writing strategy detracted slightly from returns during a period when the underlying equity portfolio experienced a strong positive return.
Describe recent portfolio activity.
During the six-month period, exposure to software and internet firms was increased, as the investment team believes that these companies possess the tailwinds of innovation coupled with a lower level of sensitivity to late-cycle macroeconomic factors. Earlier in the year, the Trust also decreased exposure to cyclically exposed technology firms amid a slowing economic backdrop. Finally, the Trust participated in a number of initial public offerings during the period.
Describe portfolio positioning at period end.
The Trust’s investment process aims to provide a balance of legacy technology firms that can continually innovate and newer, disruptive entrants that displace those that fail to innovate, with approximately 40% of the portfolio consisting of “core” legacy companies and 60% making up the “opportunistic,” high-growth portion. At period end,
| 20 | 2019 BLACKROCK SEMI-ANNUAL REPORT TO SHAREHOLDERS |
| Trust Information as of June 30, 2019 (continued) | BlackRock Science and Technology Trust |
the Trust’s largest sub-sector exposures were to internet and software companies, as these firms are supported by the longer-term tailwinds of innovation and the transition to cloud computing. The Trust’s software exposure was characterized by companies that offer enterprise software solutions, cloud computing services and software-as-a-service, and are less cyclical in nature. The Trust also held a substantial investment in the 5G (that is, the next phase in global telecommunication standards) supply chain as this emerging technology is on track to disrupt the internet and communications space.
As of period end, the Trust had an option overwriting program in place whereby 35% of the underlying equities were overwritten with call options on individual stocks. These call options were typically written at levels above the prevailing market prices (estimated to be 6.0% out of the money) and for maturities averaging 44 days.
The views expressed reflect the opinions of BlackRock as of the date of this report and are subject to change based on changes in market, economic or other conditions. These views are not intended to be a forecast of future events and are no guarantee of future results.
Market Price and Net Asset Value Per Share Summary
| 06/30/19 | 12/31/18 | Change | High | Low | ||||||||||||||||
| Market Price |
$ | 32.31 | $ | 27.48 | 17.58 | % | $ | 34.68 | $ | 26.89 | ||||||||||
| Net Asset Value |
32.49 | 26.21 | 23.96 | 32.94 | 25.18 | |||||||||||||||
Market Price and Net Asset Value History Since Inception
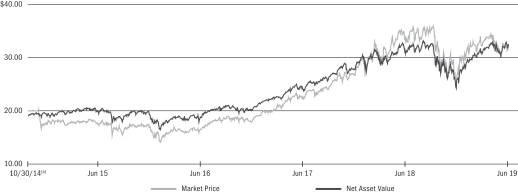
| (a) | Commencement of operations. |
Overview of the Trust’s Total Investments *
| TRUST INFORMATION | 21 |
| Trust Information as of June 30, 2019 | BlackRock Science and Technology Trust II |
Investment Objective
BlackRock Science and Technology Trust II’s (BSTZ) (the “Trust”) investment objective is to provide total return and income through a combination of current income, current gains and long-term capital appreciation. The Trust seeks to achieve its investment objective by investing, under normal market conditions, at least 80% of its total assets in equity securities issued by U.S. and non-U.S. science and technology companies in any market capitalization range, selected for their rapid and sustainable growth potential from the development, advancement and use of science and/or technology. The Trust seeks to pursue this goal primarily by investing in a portfolio of equity securities and also by employing a strategy of writing (selling) covered call and put options.
No assurance can be given that the Trust’s investment objective will be achieved.
Trust Information
| Symbol on NYSE |
BSTZ | |
| Initial Offering Date |
June 27, 2019 |
| 22 | 2019 BLACKROCK SEMI-ANNUAL REPORT TO SHAREHOLDERS |
| Trust Information as of June 30, 2019 (continued) | BlackRock Science and Technology Trust II |
Market Price and Net Asset Value Per Share Summary
| 06/30/19 |
6/27/19 (a) |
Change | High | Low | ||||||||||||||||
| Market Price |
$ | 20.80 | $ | 20.00 | 4.00 | % | $ | 20.95 | $ | 20.00 | ||||||||||
| Net Asset Value |
20.09 | 20.00 | 0.45 | 20.09 | 20.00 | |||||||||||||||
| (a) | Commencement of operations. |
Overview of the Trust’s Total Investments *
| TRUST INFORMATION | 23 |
| Trust Information as of June 30, 2019 |
BlackRock Utilities, Infrastructure & Power Opportunities Trust |
Investment Objective
BlackRock Utilities, Infrastructure & Power Opportunities Trust’s (BUI) (the “Trust”) investment objective is to provide total return through a combination of current income, current gains and long-term capital appreciation. The Trust seeks to achieve its investment objective by investing primarily in equity securities issued by companies that are engaged in the Utilities, Infrastructure and Power Opportunities business segments anywhere in the world and by employing a strategy of writing (selling) covered call and put options. The Trust considers the “Utilities” business segment to include products, technologies and services connected to the management, ownership, operation, construction, development or financing of facilities used to generate, transmit or distribute electricity, water, natural resources or telecommunications, the “Infrastructure” business segment to include companies that own or operate infrastructure assets or that are involved in the development, construction, distribution or financing of infrastructure assets and the “Power Opportunities” business segment to include companies with a significant involvement in, supporting, or necessary to renewable energy technology and development, alternative fuels, energy efficiency, automotive and sustainable mobility and technologies that enable or support the growth and adoption of new power and energy sources. Under normal circumstances, the Trust invests a substantial amount of its total assets in foreign issuers, issuers that primarily trade in a market located outside the United States or issuers that do a substantial amount of business outside the United States. The Trust may invest directly in such securities or synthetically through the use of derivatives.
No assurance can be given that the Trust’s investment objective will be achieved.
Trust Information
| Symbol on NYSE |
BUI | |
| Initial Offering Date |
November 25, 2011 | |
| Current Distribution Rate on Closing Market Price as of June 30, 2019 ($22.14)(a) |
6.56% | |
| Current Monthly Distribution per Common Share(b) |
$0.1210 | |
| Current Annualized Distribution per Common Share(b) |
$1.4520 |
| (a) | Current distribution rate on closing market price is calculated by dividing the current annualized distribution per share by the closing market price. The current distribution rate consists of income, net realized gains and/or a return of capital. See the Financial Highlights for the actual sources and character of distributions. Past performance does not guarantee future results. |
| (b) | The distribution rate is not constant and is subject to change. A portion of the distribution may be deemed a return of capital or net realized gain. |
Performance and Portfolio Management Commentary
Returns for the six months ended June 30, 2019 were as follows:
| Returns Based On | ||||||||
| Market Price | Net Asset Value | |||||||
| BUI(a)(b) |
16.09 | % | 15.98 | % | ||||
| Lipper Utility Funds(c) |
25.26 | 19.36 | ||||||
| (a) | All returns reflect reinvestment of dividends and/or distributions at actual reinvestment prices. |
| (b) | The Trust’s premium to NAV widened during the period, which accounts for the difference between performance based on market price and performance based on NAV. |
| (c) | Average return. Returns reflect reinvestment of dividends and/or distributions at NAV on the ex-dividend date as calculated by Lipper. |
Performance results may include adjustments made for financial reporting purposes in accordance with U.S. generally accepted accounting principles.
Past performance is not indicative of future results.
The following discussion relates to the Trust’s absolute performance based on NAV.
What factors influenced performance?
Merger and acquisition activity had a positive impact on the Trust’s performance during the period. Energy-efficient systems specialist Johnson Controls International PLC announced the sale of its battery business earlier than most had expected, and the company implemented a stock buyback to return capital to shareholders. Also adding to absolute performance were the Trust’s holdings in solar energy, which performed strongly on hopes for Chinese stimulus measures and greater levels of Chinese solar installations for 2019. Siemens Gamesa Renewable Energy SA was a notable contributor in this area. Wind turbine manufacturer Vestas Wind Systems A/S also contributed to returns following a significant increase in free cash flow expectations for the year. In addition, clean-power utility holdings appeared to benefit from dovish comments from the U.S. Fed regarding the likely future direction of interest rates. This included positions in electric utilities NextEra Energy, Inc. and Enel SpA.
Among the largest detractors from the Trust’s absolute returns was its position in materials technology and recycling company Umicore SA, as the Belgian company warned near the middle of the period that lower cobalt prices and weaker demand for Chinese electric vehicle components following cuts in subsidies would likely lead to reduced earnings throughout 2019 and 2020. In addition, semiconductor company Infineon Technologies AG detracted after warning that sluggish results in the first quarter of 2019 would hold back sales growth for the full year. Other notable individual stock detractors included renewable energy specialist China Longyuan Power Group Corp. and U.S. electric utility Pinnacle West Capital Corp.
During the period, the Trust made use of options, principally written call options on individual stocks. The Trust’s option writing strategy detracted from performance during the period.
| 24 | 2019 BLACKROCK SEMI-ANNUAL REPORT TO SHAREHOLDERS |
| Trust Information as of June 30, 2019 (continued) |
BlackRock Utilities, Infrastructure & Power Opportunities Trust |
Describe recent portfolio activity.
During the period, the Trust continued to reduce its exposure to traditional infrastructure companies due to its less favorable outlook on the space, selling its positions in French rail and transport systems designer Getlink SE and Italian transport infrastructure specialist Atlantia SpA. The Trust also reduced its holdings in higher-carbon energy sources by decreasing its holdings of U.S. utilities Dominion Energy Inc. and Duke Energy Corp. The Trust used the proceeds to rotate into favored lower-carbon energy holdings, including Vestas Wind Systems A/S and Johnson Controls International PLC.
Describe portfolio positioning at period end.
At period end, the utilities sector accounted for approximately 55% of the Trust’s assets. The Trust had approximately 19% and 12.5% of its assets invested in the industrials and energy sectors respectively, and the remainder was invested in other infrastructure- and power-related sectors.
As of June 30, 2019, the Trust had an option overwriting program in place whereby 33% of the underlying equities were overwritten with call options on individual stocks. These call options were typically written at levels above the prevailing market prices (estimated to be 2.2% out of the money) and for maturities averaging 51 days.
The views expressed reflect the opinions of BlackRock as of the date of this report and are subject to change based on changes in market, economic or other conditions. These views are not intended to be a forecast of future events and are no guarantee of future results.
Market Price and Net Asset Value Per Share Summary
| 06/30/19 | 12/31/18 | Change | High | Low | ||||||||||||||||
| Market Price |
$ | 22.14 | $ | 19.76 | 12.04 | % | $ | 22.35 | $ | 19.26 | ||||||||||
| Net Asset Value |
21.01 | 18.77 | 11.93 | 21.14 | 18.60 | |||||||||||||||
Market Price and Net Asset Value History For the Past Five Years
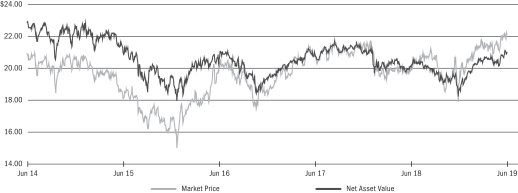
Overview of the Trust’s Total Investments *
| TRUST INFORMATION | 25 |
Derivative Financial Instruments
The Trusts may invest in various derivative financial instruments. These instruments are used to obtain exposure to a security, commodity, index, market, and/or other assets without owning or taking physical custody of securities, commodities and/or other referenced assets or to manage market, equity, credit, interest rate, foreign currency exchange rate, commodity and/or other risks. Derivative financial instruments may give rise to a form of economic leverage and involve risks, including the imperfect correlation between the value of a derivative financial instrument and the underlying asset, possible default of the counterparty to the transaction or illiquidity of the instrument. The Trusts’ successful use of a derivative financial instrument depends on the investment adviser’s ability to predict pertinent market movements accurately, which cannot be assured. The use of these instruments may result in losses greater than if they had not been used, may limit the amount of appreciation a Trust can realize on an investment and/or may result in lower distributions paid to shareholders. The Trusts’ investments in these instruments, if any, are discussed in detail in the Notes to Financial Statements.
| 26 | 2019 BLACKROCK SEMI-ANNUAL REPORT TO SHAREHOLDERS |
| Schedule of Investments (unaudited) June 30, 2019 |
BlackRock Energy and Resources Trust (BGR) (Percentages shown are based on Net Assets) |
| (e) | During the six months ended June 30, 2019, investments in issuers considered to be an affiliate/affiliates of the Trust for purposes of Section 2(a)(3) of the Investment Company Act of 1940, as amended, were as follows: |
| Affiliate | Shares Held at 12/31/18 |
Net Activity |
Shares Held at 06/30/19 |
Value at 06/30/19 |
Income | Net Realized Gain (Loss) (a) |
Change in Unrealized Appreciation (Depreciation) |
|||||||||||||||||||||
| BlackRock Liquidity Funds, T-Fund, Institutional Class |
5,006,975 | 3,394,179 | 8,401,154 | $ | 8,401,154 | $ | 85,938 | $ | — | $ | — | |||||||||||||||||
|
|
|
|
|
|
|
|
|
|||||||||||||||||||||
| (a) | Includes net capital gain distributions, if applicable. |
For Trust compliance purposes, the Trust’s industry classifications refer to one or more of the industry sub-classifications used by one or more widely recognized market indexes or rating group indexes, and/or as defined by the investment adviser. These definitions may not apply for purposes of this report, which may combine such industry sub-classifications for reporting ease.
Derivative Financial Instruments Outstanding as of Period End
Exchange-Traded Options Written
| Description | Number of Contracts |
Expiration Date |
Exercise Price |
Notional Amount (000) |
Value | |||||||||||||||||||
| Call | ||||||||||||||||||||||||
| Exxon Mobil Corp. |
282 | 07/05/19 | USD | 76.00 | USD | 2,161 | $ | (31,866 | ) | |||||||||||||||
| Baker Hughes a GE Co., Class A |
73 | 07/11/19 | USD | 24.50 | USD | 180 | (4,855 | ) | ||||||||||||||||
| Chevron Corp. |
93 | 07/12/19 | USD | 118.00 | USD | 1,157 | (69,053 | ) | ||||||||||||||||
| ConocoPhillips |
209 | 07/12/19 | USD | 61.00 | USD | 1,275 | (25,498 | ) | ||||||||||||||||
| Exxon Mobil Corp. |
147 | 07/12/19 | USD | 74.00 | USD | 1,126 | (44,027 | ) | ||||||||||||||||
| Halliburton Co. |
193 | 07/12/19 | USD | 22.00 | USD | 439 | (23,063 | ) | ||||||||||||||||
| Marathon Petroleum Corp. |
125 | 07/12/19 | USD | 48.00 | USD | 699 | (100,313 | ) | ||||||||||||||||
| SCHEDULES OF INVESTMENTS | 27 |
| Schedule of Investments (unaudited) (continued) June 30, 2019 |
BlackRock Energy and Resources Trust (BGR) |
Exchange-Traded Options Written (continued)
| Description | Number of Contracts |
Expiration Date |
Exercise Price |
Notional Amount (000) |
Value | |||||||||||||||||||
| Call (continued) | ||||||||||||||||||||||||
| Royal Dutch Shell PLC — ADR, Class A |
922 | 07/12/19 | USD | 66.25 | USD | 5,999 | $ | (37,732 | ) | |||||||||||||||
| Schlumberger Ltd. |
69 | 07/12/19 | USD | 36.00 | USD | 274 | (26,910 | ) | ||||||||||||||||
| Valero Energy Corp. |
51 | 07/12/19 | USD | 73.50 | USD | 437 | (62,348 | ) | ||||||||||||||||
| Valero Energy Corp. |
104 | 07/12/19 | USD | 80.00 | USD | 890 | (62,140 | ) | ||||||||||||||||
| Williams Cos., Inc. |
234 | 07/12/19 | USD | 28.09 | USD | 656 | (9,061 | ) | ||||||||||||||||
| Anadarko Petroleum Corp. |
270 | 08/02/19 | USD | 71.00 | USD | 1,905 | (8,340 | ) | ||||||||||||||||
| Baker Hughes a GE Co., Class A |
205 | 07/19/19 | USD | 25.00 | USD | 505 | (12,300 | ) | ||||||||||||||||
| Baker Hughes a GE Co., Class A |
179 | 07/19/19 | USD | 24.00 | USD | 441 | (20,585 | ) | ||||||||||||||||
| Canadian Natural Resources Ltd. |
382 | 07/19/19 | CAD | 38.00 | CAD | 1,349 | (3,646 | ) | ||||||||||||||||
| Canadian Natural Resources Ltd. |
211 | 07/19/19 | CAD | 36.00 | CAD | 745 | (9,426 | ) | ||||||||||||||||
| Chevron Corp. |
106 | 07/19/19 | USD | 125.00 | USD | 1,319 | (19,080 | ) | ||||||||||||||||
| Concho Resources, Inc. |
181 | 07/19/19 | USD | 110.00 | USD | 1,868 | (22,172 | ) | ||||||||||||||||
| ConocoPhillips |
158 | 07/19/19 | USD | 65.00 | USD | 964 | (3,792 | ) | ||||||||||||||||
| ConocoPhillips |
160 | 07/19/19 | USD | 62.50 | USD | 976 | (13,120 | ) | ||||||||||||||||
| EOG Resources, Inc. |
203 | 07/19/19 | USD | 100.00 | USD | 1,891 | (12,180 | ) | ||||||||||||||||
| EOG Resources, Inc. |
82 | 07/19/19 | USD | 90.00 | USD | 764 | (39,360 | ) | ||||||||||||||||
| Exxon Mobil Corp. |
282 | 07/19/19 | USD | 77.50 | USD | 2,161 | (24,675 | ) | ||||||||||||||||
| Halliburton Co. |
369 | 07/19/19 | USD | 22.50 | USD | 839 | (36,531 | ) | ||||||||||||||||
| Marathon Petroleum Corp. |
125 | 07/19/19 | USD | 57.50 | USD | 699 | (14,125 | ) | ||||||||||||||||
| Noble Energy, Inc. |
290 | 07/19/19 | USD | 22.50 | USD | 650 | (22,475 | ) | ||||||||||||||||
| Patterson-UTI Energy, Inc. |
343 | 07/19/19 | USD | 12.00 | USD | 395 | (11,147 | ) | ||||||||||||||||
| Pioneer Natural Resources Co. |
98 | 07/19/19 | USD | 155.00 | USD | 1,508 | (48,020 | ) | ||||||||||||||||
| Royal Dutch Shell PLC — ADR, Class A |
385 | 07/19/19 | USD | 65.00 | USD | 2,505 | (41,388 | ) | ||||||||||||||||
| Schlumberger Ltd. |
120 | 07/19/19 | USD | 37.50 | USD | 477 | (33,180 | ) | ||||||||||||||||
| Suncor Energy, Inc. |
345 | 07/19/19 | CAD | 42.00 | CAD | 1,409 | (6,586 | ) | ||||||||||||||||
| Valero Energy Corp. |
136 | 07/19/19 | USD | 80.00 | USD | 1,164 | (85,340 | ) | ||||||||||||||||
| Williams Cos., Inc. |
322 | 07/19/19 | USD | 29.00 | USD | 903 | (5,313 | ) | ||||||||||||||||
| Baker Hughes a GE Co., Class A |
59 | 07/25/19 | USD | 25.25 | USD | 145 | (3,537 | ) | ||||||||||||||||
| Anadarko Petroleum Corp. |
142 | 07/26/19 | USD | 71.00 | USD | 1,002 | (15,691 | ) | ||||||||||||||||
| ConocoPhillips |
108 | 07/26/19 | USD | 60.00 | USD | 659 | (24,030 | ) | ||||||||||||||||
| EOG Resources, Inc. |
72 | 07/26/19 | USD | 90.00 | USD | 671 | (37,080 | ) | ||||||||||||||||
| Exxon Mobil Corp. |
219 | 07/26/19 | USD | 75.50 | USD | 1,678 | (65,810 | ) | ||||||||||||||||
| Hess Corp. |
96 | 07/26/19 | USD | 62.50 | USD | 610 | (30,480 | ) | ||||||||||||||||
| Marathon Petroleum Corp. |
184 | 07/26/19 | USD | 50.50 | USD | 1,028 | (101,200 | ) | ||||||||||||||||
| Pioneer Natural Resources Co. |
85 | 07/26/19 | USD | 160.00 | USD | 1,308 | (31,450 | ) | ||||||||||||||||
| Royal Dutch Shell PLC — ADR, Class A |
247 | 07/26/19 | USD | 64.50 | USD | 1,607 | (40,137 | ) | ||||||||||||||||
| Valero Energy Corp. |
104 | 07/26/19 | USD | 77.00 | USD | 890 | (95,940 | ) | ||||||||||||||||
| Williams Cos., Inc. |
82 | 07/26/19 | USD | 28.50 | USD | 230 | (3,485 | ) | ||||||||||||||||
| Williams Cos., Inc. |
215 | 07/26/19 | USD | 27.06 | USD | 603 | (29,118 | ) | ||||||||||||||||
| Baker Hughes a GE Co., Class A |
53 | 07/29/19 | USD | 24.25 | USD | 131 | (6,274 | ) | ||||||||||||||||
| Baker Hughes a GE Co., Class A |
145 | 07/29/19 | USD | 25.75 | USD | 357 | (7,793 | ) | ||||||||||||||||
| Anadarko Petroleum Corp. |
270 | 08/02/19 | USD | 71.00 | USD | 1,905 | (36,045 | ) | ||||||||||||||||
| Chevron Corp. |
208 | 08/02/19 | USD | 126.00 | USD | 2,588 | (46,696 | ) | ||||||||||||||||
| ConocoPhillips |
176 | 08/02/19 | USD | 63.00 | USD | 1,074 | (19,272 | ) | ||||||||||||||||
| EOG Resources, Inc. |
50 | 08/02/19 | USD | 95.00 | USD | 466 | (14,850 | ) | ||||||||||||||||
| Exxon Mobil Corp. |
245 | 08/02/19 | USD | 78.00 | USD | 1,877 | (29,277 | ) | ||||||||||||||||
| Halliburton Co. |
170 | 08/02/19 | USD | 22.50 | USD | 387 | (21,760 | ) | ||||||||||||||||
| Hess Corp. |
61 | 08/02/19 | USD | 65.50 | USD | 388 | (13,054 | ) | ||||||||||||||||
| Marathon Petroleum Corp. |
193 | 08/02/19 | USD | 52.00 | USD | 1,078 | (100,360 | ) | ||||||||||||||||
| Pioneer Natural Resources Co. |
70 | 08/02/19 | USD | 147.00 | USD | 1,077 | (78,750 | ) | ||||||||||||||||
| Royal Dutch Shell PLC — ADR, Class A |
247 | 08/02/19 | USD | 66.00 | USD | 1,607 | (25,317 | ) | ||||||||||||||||
| Valero Energy Corp. |
67 | 08/02/19 | USD | 80.00 | USD | 574 | (46,900 | ) | ||||||||||||||||
| Williams Cos., Inc. |
322 | 08/02/19 | USD | 28.00 | USD | 903 | (25,921 | ) | ||||||||||||||||
| Williams Cos., Inc. |
58 | 08/02/19 | USD | 27.50 | USD | 163 | (6,438 | ) | ||||||||||||||||
| ConocoPhillips |
37 | 08/09/19 | USD | 61.82 | USD | 226 | (6,271 | ) | ||||||||||||||||
| Exxon Mobil Corp. |
281 | 08/09/19 | USD | 78.50 | USD | 2,153 | (32,034 | ) | ||||||||||||||||
| Halliburton Co. |
106 | 08/09/19 | USD | 25.50 | USD | 241 | (4,028 | ) | ||||||||||||||||
| Royal Dutch Shell PLC — ADR, Class A |
384 | 08/09/19 | USD | 66.00 | USD | 2,499 | (45,120 | ) | ||||||||||||||||
| Baker Hughes a GE Co., Class A |
145 | 08/16/19 | USD | 26.00 | USD | 357 | (9,787 | ) | ||||||||||||||||
| Baker Hughes a GE Co., Class A |
72 | 08/16/19 | USD | 27.00 | USD | 177 | (2,700 | ) | ||||||||||||||||
| Canadian Natural Resources Ltd. |
593 | 08/16/19 | CAD | 38.00 | CAD | 2,094 | (22,868 | ) | ||||||||||||||||
| Concho Resources, Inc. |
174 | 08/16/19 | USD | 110.00 | USD | 1,795 | (55,680 | ) | ||||||||||||||||
| 28 | 2019 BLACKROCK SEMI-ANNUAL REPORT TO SHAREHOLDERS |
| Schedule of Investments (unaudited) (continued) June 30, 2019 |
BlackRock Energy and Resources Trust (BGR) |
Exchange-Traded Options Written (continued)
| Description | Number of Contracts |
Expiration Date |
Exercise Price |
Notional Amount (000) |
Value | |||||||||||||||||||
| Call (continued) | ||||||||||||||||||||||||
| ConocoPhillips |
153 | 08/16/19 | USD | 62.50 | USD | 933 | $ | (24,327 | ) | |||||||||||||||
| EOG Resources, Inc. |
160 | 08/16/19 | USD | 97.50 | USD | 1,491 | (40,960 | ) | ||||||||||||||||
| Exxon Mobil Corp. |
324 | 08/16/19 | USD | 77.50 | USD | 2,483 | (51,678 | ) | ||||||||||||||||
| Marathon Petroleum Corp. |
283 | 08/16/19 | USD | 55.00 | USD | 1,581 | (98,343 | ) | ||||||||||||||||
| Noble Energy, Inc. |
360 | 08/16/19 | USD | 22.50 | USD | 806 | (45,000 | ) | ||||||||||||||||
| Royal Dutch Shell PLC — ADR, Class A |
360 | 08/16/19 | USD | 65.00 | USD | 2,343 | (60,300 | ) | ||||||||||||||||
| Schlumberger Ltd. |
136 | 08/16/19 | USD | 40.00 | USD | 540 | (23,392 | ) | ||||||||||||||||
| Suncor Energy, Inc. |
412 | 08/16/19 | CAD | 44.00 | CAD | 1,683 | (7,079 | ) | ||||||||||||||||
| Valero Energy Corp. |
107 | 08/16/19 | USD | 85.00 | USD | 916 | (40,660 | ) | ||||||||||||||||
| Williams Cos., Inc. |
363 | 08/16/19 | USD | 29.00 | USD | 1,018 | (17,605 | ) | ||||||||||||||||
| Williams Cos., Inc. |
58 | 08/16/19 | USD | 28.00 | USD | 163 | (5,539 | ) | ||||||||||||||||
| Williams Cos., Inc. |
290 | 09/20/19 | USD | 29.00 | USD | 813 | (20,880 | ) | ||||||||||||||||
|
|
|
|||||||||||||||||||||||
| $ | (2,560,563 | ) | ||||||||||||||||||||||
|
|
|
|||||||||||||||||||||||
OTC Options Written
| Description | Counterparty | Number of Contracts |
Expiration Date |
Exercise Price |
Notional Amount (000) |
Value | ||||||||||||||||||||
| Call | ||||||||||||||||||||||||||
| EQT Corp. |
JPMorgan Chase Bank N.A. | 25,400 | 07/02/19 | USD | 21.92 | USD | 402 | $ | — | |||||||||||||||||
| TC Energy Corp. |
Goldman Sachs International | 21,100 | 07/08/19 | CAD | 63.94 | CAD | 1,370 | (18,426 | ) | |||||||||||||||||
| CNOOC Ltd. |
JPMorgan Chase Bank N.A. | 368,000 | 07/09/19 | HKD | 13.61 | HKD | 4,902 | (7,468 | ) | |||||||||||||||||
| Eni SpA |
Morgan Stanley & Co. International PLC | 74,200 | 07/09/19 | EUR | 14.70 | EUR | 1,085 | (12,189 | ) | |||||||||||||||||
| Patterson-UTI Energy, Inc. |
Citibank N.A. | 17,000 | 07/09/19 | USD | 13.99 | USD | 196 | (41 | ) | |||||||||||||||||
| Royal Dutch Shell PLC — ADR, Class A |
Goldman Sachs International | 40,700 | 07/09/19 | GBP | 25.69 | GBP | 1,046 | (15,424 | ) | |||||||||||||||||
| Galp Energia SGPS SA |
UBS AG | 37,800 | 07/10/19 | EUR | 14.81 | EUR | 511 | (237 | ) | |||||||||||||||||
| Suncor Energy, Inc. |
UBS AG | 23,800 | 07/10/19 | CAD | 44.76 | CAD | 972 | (24 | ) | |||||||||||||||||
| TOTAL SA |
Credit Suisse International | 17,800 | 07/12/19 | EUR | 49.91 | EUR | 878 | (8,827 | ) | |||||||||||||||||
| EQT Corp. |
JPMorgan Chase Bank N.A. | 25,400 | 07/16/19 | USD | 22.13 | USD | 402 | (2 | ) | |||||||||||||||||
| BP PLC |
Credit Suisse International | 566,500 | 07/17/19 | GBP | 5.56 | GBP | 3,110 | (46,254 | ) | |||||||||||||||||
| Galp Energia SGPS SA |
Credit Suisse International | 36,800 | 07/17/19 | EUR | 14.05 | EUR | 498 | (4,543 | ) | |||||||||||||||||
| TOTAL SA |
Goldman Sachs International | 59,600 | 07/17/19 | EUR | 47.56 | EUR | 2,940 | (138,193 | ) | |||||||||||||||||
| TC Energy Corp. |
Credit Suisse International | 32,700 | 07/19/19 | CAD | 64.69 | CAD | 2,123 | (20,409 | ) | |||||||||||||||||
| BP PLC |
Goldman Sachs International | 232,500 | 07/23/19 | GBP | 5.59 | GBP | 1,276 | (20,109 | ) | |||||||||||||||||
| CNOOC Ltd. |
JPMorgan Chase Bank N.A. | 300,000 | 07/23/19 | HKD | 13.64 | HKD | 3,996 | (10,722 | ) | |||||||||||||||||
| TOTAL SA |
Deutsche Bank AG | 31,100 | 07/23/19 | EUR | 47.57 | EUR | 1,534 | (73,456 | ) | |||||||||||||||||
| Eni SpA |
UBS AG | 75,900 | 07/24/19 | EUR | 14.13 | EUR | 1,110 | (52,187 | ) | |||||||||||||||||
| Oil Search Ltd. |
UBS AG | 89,200 | 07/24/19 | AUD | 7.06 | AUD | 633 | (15,219 | ) | |||||||||||||||||
| TC Energy Corp. |
Credit Suisse International | 21,500 | 07/24/19 | CAD | 66.13 | CAD | 1,396 | (5,018 | ) | |||||||||||||||||
| Noble Energy, Inc. |
Credit Suisse International | 26,600 | 07/26/19 | USD | 23.11 | USD | 596 | (18,819 | ) | |||||||||||||||||
| Royal Dutch Shell PLC — ADR, Class A |
Goldman Sachs International | 26,000 | 07/30/19 | GBP | 26.38 | GBP | 668 | (7,478 | ) | |||||||||||||||||
| Eni SpA |
UBS AG | 86,200 | 07/31/19 | EUR | 14.20 | EUR | 1,260 | (56,613 | ) | |||||||||||||||||
| Equinor ASA |
Morgan Stanley & Co. International PLC | 30,000 | 07/31/19 | NOK | 174.10 | NOK | 5,077 | (10,037 | ) | |||||||||||||||||
| Oil Search Ltd. |
JPMorgan Chase Bank N.A. | 124,300 | 07/31/19 | AUD | 7.13 | AUD | 883 | (20,977 | ) | |||||||||||||||||
| BP PLC |
Goldman Sachs International | 270,000 | 08/02/19 | GBP | 5.58 | GBP | 1,482 | (33,525 | ) | |||||||||||||||||
| Galp Energia SGPS SA |
Morgan Stanley & Co. International PLC | 41,800 | 08/02/19 | EUR | 13.75 | EUR | 565 | (13,488 | ) | |||||||||||||||||
| TOTAL SA |
Morgan Stanley & Co. International PLC | 33,100 | 08/02/19 | EUR | 48.32 | EUR | 1,633 | (63,949 | ) | |||||||||||||||||
| Suncor Energy, Inc. |
Royal Bank of Canada | 33,000 | 08/06/19 | CAD | 41.62 | CAD | 1,348 | (14,952 | ) | |||||||||||||||||
| TOTAL SA |
Morgan Stanley & Co. International PLC | 19,900 | 08/06/19 | EUR | 48.80 | EUR | 982 | (32,239 | ) | |||||||||||||||||
| BP PLC |
Credit Suisse International | 595,000 | 08/08/19 | GBP | 5.58 | GBP | 3,267 | (56,728 | ) | |||||||||||||||||
| TC Energy Corp. |
Goldman Sachs International | 34,800 | 08/12/19 | CAD | 65.66 | CAD | 2,259 | (18,604 | ) | |||||||||||||||||
| TOTAL SA |
Morgan Stanley & Co. International PLC | 35,500 | 08/14/19 | EUR | 49.68 | EUR | 1,751 | (44,393 | ) | |||||||||||||||||
| Suncor Energy, Inc. |
Credit Suisse International | 23,800 | 08/28/19 | CAD | 43.01 | CAD | 972 | (8,604 | ) | |||||||||||||||||
|
|
|
|||||||||||||||||||||||||
| $ | (849,154 | ) | ||||||||||||||||||||||||
|
|
|
|||||||||||||||||||||||||
| SCHEDULES OF INVESTMENTS | 29 |
| Schedule of Investments (unaudited) (continued) June 30, 2019 |
BlackRock Energy and Resources Trust (BGR) |
Balances Reported in the Statements of Assets and Liabilities for Options Written
| Swap Premiums Paid |
Swap Premiums Received |
Unrealized Appreciation |
Unrealized Depreciation |
Value | ||||||||||||||||
| Options Written |
N/A | N/A | $ | 440,251 | $ | (1,265,989 | ) | $ | (3,409,717 | ) | ||||||||||
Derivative Financial Instruments Categorized by Risk Exposure
As of period end, the fair values of derivative financial instruments located in the Statements of Assets and Liabilities were as follows:
| Commodity Contracts |
Credit Contracts |
Equity Contracts |
Foreign Currency Exchange Contracts |
Interest Rate Contracts |
Other Contracts |
Total | ||||||||||||||||||||||
| Liabilities — Derivative Financial Instruments |
||||||||||||||||||||||||||||
| Options written |
||||||||||||||||||||||||||||
| Options written at value |
$ | — | $ | — | $ | 3,409,717 | $ | — | $ | — | $ | — | $ | 3,409,717 | ||||||||||||||
|
|
|
|
|
|
|
|
|
|
|
|
|
|
|
|||||||||||||||
For the six months ended June 30, 2019, the effect of derivative financial instruments in the Statements of Operations was as follows:
| Commodity Contracts |
Credit Contracts |
Equity Contracts |
Foreign Currency Exchange Contracts |
Interest Rate Contracts |
Other Contracts |
Total | ||||||||||||||||||||||
| Net Realized Gain (Loss) from: |
||||||||||||||||||||||||||||
| Options purchased(a) |
$ | — | $ | — | $ | (2,157 | ) | $ | — | $ | — | $ | — | $ | (2,157 | ) | ||||||||||||
| Options written |
— | — | 1,384,373 | — | — | — | 1,384,373 | |||||||||||||||||||||
|
|
|
|
|
|
|
|
|
|
|
|
|
|
|
|||||||||||||||
| $ | — | $ | — | $ | 1,382,216 | $ | — | $ | — | $ | — | $ | 1,382,216 | |||||||||||||||
|
|
|
|
|
|
|
|
|
|
|
|
|
|
|
|||||||||||||||
| (a) Options purchased are included in net realized gain (loss) from investments. |
| |||||||||||||||||||||||||||
| Net Change in Unrealized Appreciation (Depreciation) on: |
| |||||||||||||||||||||||||||
| Options purchased(a) |
$ | — | $ | — | $ | (6,598 | ) | $ | — | $ | — | $ | — | $ | (6,598 | ) | ||||||||||||
| Options written |
— | — | (3,331,792 | ) | — | — | — | (3,331,792 | ) | |||||||||||||||||||
|
|
|
|
|
|
|
|
|
|
|
|
|
|
|
|||||||||||||||
| $ | — | $ | — | $ | (3,338,390 | ) | $ | — | $ | — | $ | — | $ | (3,338,390 | ) | |||||||||||||
|
|
|
|
|
|
|
|
|
|
|
|
|
|
|
|||||||||||||||
| (a) Options purchased are included in net change in unrealized appreciation (depreciation) on investments. |
| |||||||||||||||||||||||||||
Average Quarterly Balances of Outstanding Derivative Financial Instruments
| Options: |
| |||
| Average value of option contracts purchased |
$ | — | (a) | |
| Average value of option contracts written |
$ | 3,089,181 | ||
| (a) Derivative not held at quarter-end. The risk exposure table serves as an indicator of activity during the period. |
||||
For more information about the Trust’s investment risks regarding derivative financial instruments, refer to the Notes to Financial Statements.
Derivative Financial Instruments — Offsetting as of Period End
The Trust’s derivative assets and liabilities (by type) are as follows:
| Assets | Liabilities | |||||||
| Derivative Financial Instruments: |
||||||||
| Options |
$ | — | $ | 3,409,717 | ||||
| Derivatives not subject to a Master Netting Agreement or similar agreement (“MNA”) |
— | (2,560,563 | ) | |||||
|
|
|
|
|
|||||
| Total derivative assets and liabilities subject to an MNA |
$ | — | $ | 849,154 | ||||
|
|
|
|
|
|||||
| 30 | 2019 BLACKROCK SEMI-ANNUAL REPORT TO SHAREHOLDERS |
| Schedule of Investments (unaudited) (continued) June 30, 2019 |
BlackRock Energy and Resources Trust (BGR) |
The following table presents the Trust’s derivative assets (and liabilities) by counterparty net of amounts available for offset under an MNA and net of the related collateral received (and pledged) by the Trust:
| Counterparty | Derivative Liabilities Subject to an MNA by Counterparty |
Derivatives Available for Offset |
Non-cash Collateral Pledged (a) |
Cash Collateral Pledged |
Net Amount of Derivative Liabilities (b) |
|||||||||||||||
| Citibank N.A. |
$ | 41 | $ | — | $ | — | $ | — | $ | 41 | ||||||||||
| Credit Suisse International |
169,202 | — | (152,929 | ) | — | 16,273 | ||||||||||||||
| Deutsche Bank AG |
73,456 | — | — | — | 73,456 | |||||||||||||||
| Goldman Sachs International |
251,759 | — | (251,759 | ) | — | — | ||||||||||||||
| JPMorgan Chase Bank N.A. |
39,169 | — | — | — | 39,169 | |||||||||||||||
| Morgan Stanley & Co. International PLC |
176,295 | — | — | — | 176,295 | |||||||||||||||
| Royal Bank of Canada |
14,952 | — | — | — | 14,952 | |||||||||||||||
| UBS AG |
124,280 | — | — | — | 124,280 | |||||||||||||||
|
|
|
|
|
|
|
|
|
|
|
|||||||||||
| $ | 849,154 | $ | — | $ | (404,688 | ) | $ | — | $ | 444,466 | ||||||||||
|
|
|
|
|
|
|
|
|
|
|
|||||||||||
| (a) | Excess of collateral pledged to the individual counterparty is not shown for financial reporting purposes. |
| (b) | Net amount represents the net amount payable due to counterparty in the event of default. Net amount may be offset further by the options written receivable/payable on the Statements of Assets and Liabilities. |
Fair Value Hierarchy as of Period End
Various inputs are used in determining the fair value of investments and derivative financial instruments. For information about the Trust’s policy regarding valuation of investments and derivative financial instruments, refer to the Notes to Financial Statements.
The following tables summarize the Trust’s investments and derivative financial instruments categorized in the disclosure hierarchy:
| Level 1 | Level 2 | Level 3 | Total | |||||||||||||
| Assets: |
| |||||||||||||||
| Investments: |
| |||||||||||||||
| Common Stocks: |
| |||||||||||||||
| Energy Equipment & Services |
$ | 17,348,604 | $ | — | $ | — | $ | 17,348,604 | ||||||||
| Oil, Gas & Consumable Fuels |
268,028,702 | 100,877,015 | — | 368,905,717 | ||||||||||||
| Short-Term Securities |
8,401,154 | — | — | 8,401,154 | ||||||||||||
|
|
|
|
|
|
|
|
|
|||||||||
| $ | 293,778,460 | $ | 100,877,015 | $ | — | $ | 394,655,475 | |||||||||
|
|
|
|
|
|
|
|
|
|||||||||
| Derivative Financial Instruments(a) |
|
|||||||||||||||
| Liabilities: |
| |||||||||||||||
| Equity contracts |
$ | (2,285,832 | ) | $ | (1,123,885 | ) | $ | — | $ | (3,409,717 | ) | |||||
|
|
|
|
|
|
|
|
|
|||||||||
| (a) | Derivative financial instruments are options written which are shown at value. |
See notes to financial statements.
| SCHEDULES OF INVESTMENTS | 31 |
| Schedule of Investments (unaudited) June 30, 2019 |
BlackRock Enhanced Capital and Income Fund (CII) (Percentages shown are based on Net Assets) |
| 32 | 2019 BLACKROCK SEMI-ANNUAL REPORT TO SHAREHOLDERS |
| Schedule of Investments (unaudited) (continued) June 30, 2019 |
BlackRock Enhanced Capital and Income Fund (CII) (Percentages shown are based on Net Assets) |
| (e) | During the six months ended June 30, 2019, investments in issuers considered to be an affiliate/affiliates of the Trust for purposes of Section 2(a)(3) of the Investment Company Act of 1940, as amended, were as follows: |
| Affiliate | Shares Held at |
Net Activity |
Shares Held at |
Value at 06/30/19 |
Income | Net Realized Gain (Loss) (a) |
Change in Unrealized Appreciation (Depreciation) |
|||||||||||||||||||||
| BlackRock Liquidity Funds, T-Fund, Institutional Class |
14,789,354 | (12,055,349 | ) | 2,734,005 | $ | 2,734,005 | $ | 49,519 | $ | — | $ | — | ||||||||||||||||
|
|
|
|
|
|
|
|
|
|||||||||||||||||||||
| (a) | Includes net capital gain distributions, if applicable. |
For Trust compliance purposes, the Trust’s industry classifications refer to one or more of the industry sub-classifications used by one or more widely recognized market indexes or rating group indexes, and/or as defined by the investment adviser. These definitions may not apply for purposes of this report, which may combine such industry sub-classifications for reporting ease.
Derivative Financial Instruments Outstanding as of Period End
Exchange-Traded Options Written
| Description | Number of Contracts |
Expiration Date |
Exercise Price |
Notional Amount (000) |
Value | |||||||||||||||||||
| Call | ||||||||||||||||||||||||
| Comcast Corp., Class A |
292 | 07/02/19 | USD | 43.00 | USD | 1,235 | $ | (1,100 | ) | |||||||||||||||
| Corteva, Inc |
59 | 07/02/19 | USD | 25.25 | USD | 174 | (25,555 | ) | ||||||||||||||||
| Pfizer, Inc. |
71 | 07/02/19 | USD | 42.75 | USD | 308 | (4,922 | ) | ||||||||||||||||
| JPMorgan Chase & Co. |
74 | 07/05/19 | USD | 109.00 | USD | 827 | (21,941 | ) | ||||||||||||||||
| Microsoft Corp. |
81 | 07/05/19 | USD | 132.00 | USD | 1,085 | (21,870 | ) | ||||||||||||||||
| U.S. Bancorp |
277 | 07/05/19 | USD | 53.00 | USD | 1,451 | (6,232 | ) | ||||||||||||||||
| Altria Group, Inc. |
310 | 07/12/19 | USD | 51.50 | USD | 1,468 | (1,240 | ) | ||||||||||||||||
| Apple, Inc. |
593 | 07/12/19 | USD | 185.00 | USD | 11,737 | (824,270 | ) | ||||||||||||||||
| BP PLC — ADR |
76 | 07/12/19 | USD | 42.95 | USD | 317 | (1,202 | ) | ||||||||||||||||
| Bank of America Corp. |
813 | 07/12/19 | USD | 28.00 | USD | 2,358 | (99,593 | ) | ||||||||||||||||
| Bank of America Corp. |
460 | 07/12/19 | USD | 29.20 | USD | 1,334 | (24,321 | ) | ||||||||||||||||
| Baxter International, Inc. |
172 | 07/12/19 | USD | 78.50 | USD | 1,409 | (63,898 | ) | ||||||||||||||||
| Biogen, Inc. |
46 | 07/12/19 | USD | 240.00 | USD | 1,076 | (12,420 | ) | ||||||||||||||||
| Carnival Corp. |
447 | 07/12/19 | USD | 51.50 | USD | 2,081 | (2,235 | ) | ||||||||||||||||
| Chevron Corp. |
223 | 07/12/19 | USD | 118.00 | USD | 2,775 | (165,578 | ) | ||||||||||||||||
| Cisco Systems, Inc. |
85 | 07/12/19 | USD | 55.00 | USD | 465 | (5,610 | ) | ||||||||||||||||
| Cisco Systems, Inc. |
217 | 07/12/19 | USD | 56.00 | USD | 1,188 | (7,269 | ) | ||||||||||||||||
| Cognizant Technology Solutions Corp., Class A |
32 | 07/12/19 | USD | 65.00 | USD | 203 | (1,200 | ) | ||||||||||||||||
| Cognizant Technology Solutions Corp., Class A |
48 | 07/12/19 | USD | 65.50 | USD | 304 | (1,320 | ) | ||||||||||||||||
| Comcast Corp., Class A |
425 | 07/12/19 | USD | 43.91 | USD | 1,797 | (3,517 | ) | ||||||||||||||||
| D.R. Horton, Inc. |
194 | 07/12/19 | USD | 46.50 | USD | 837 | (1,358 | ) | ||||||||||||||||
| DISH Network Corp., Class A |
341 | 07/12/19 | USD | 38.00 | USD | 1,310 | (56,265 | ) | ||||||||||||||||
| Delta Air Lines, Inc. |
180 | 07/12/19 | USD | 55.00 | USD | 1,022 | (45,180 | ) | ||||||||||||||||
| SCHEDULES OF INVESTMENTS | 33 |
| Schedule of Investments (unaudited) (continued) June 30, 2019 |
BlackRock Enhanced Capital and Income Fund (CII) |
Exchange-Traded Options Written (continued)
| Description | Number of Contracts |
Expiration Date |
Exercise Price |
Notional Amount (000) |
Value | |||||||||||||||||||
| Call (continued) | ||||||||||||||||||||||||
| Dow, Inc. |
89 | 07/12/19 | USD | 52.50 | USD | 439 | $ | (890 | ) | |||||||||||||||
| DuPont de Nemours, Inc. |
31 | 07/12/19 | USD | 33.00 | USD | 233 | (5,750 | ) | ||||||||||||||||
| DuPont de Nemours, Inc. |
36 | 07/12/19 | USD | 76.50 | USD | 270 | (2,862 | ) | ||||||||||||||||
| E*Trade Financial Corp. |
328 | 07/12/19 | USD | 48.00 | USD | 1,463 | (4,756 | ) | ||||||||||||||||
| Emerson Electric Co. |
162 | 07/12/19 | USD | 65.00 | USD | 1,081 | (35,235 | ) | ||||||||||||||||
| JPMorgan Chase & Co. |
245 | 07/12/19 | USD | 110.00 | USD | 2,739 | (58,923 | ) | ||||||||||||||||
| Marathon Oil Corp. |
183 | 07/12/19 | USD | 15.60 | USD | 260 | (884 | ) | ||||||||||||||||
| Microsoft Corp. |
158 | 07/12/19 | USD | 128.00 | USD | 2,117 | (101,515 | ) | ||||||||||||||||
| Molson Coors Brewing Co., Class B |
256 | 07/12/19 | USD | 60.00 | USD | 1,434 | (2,560 | ) | ||||||||||||||||
| Pfizer, Inc. |
90 | 07/12/19 | USD | 42.50 | USD | 390 | (10,350 | ) | ||||||||||||||||
| Sony Corp., ADR |
84 | 07/12/19 | USD | 55.00 | USD | 440 | (2,100 | ) | ||||||||||||||||
| Taiwan Semiconductor Manufacturing Co. Ltd. |
220 | 07/12/19 | USD | 38.93 | USD | 862 | (23,185 | ) | ||||||||||||||||
| U.S. Bancorp |
418 | 07/12/19 | USD | 51.50 | USD | 2,190 | (54,131 | ) | ||||||||||||||||
| U.S. Bancorp |
98 | 07/12/19 | USD | 53.00 | USD | 514 | (4,067 | ) | ||||||||||||||||
| UnitedHealth Group, Inc. |
124 | 07/12/19 | USD | 250.00 | USD | 3,026 | (19,778 | ) | ||||||||||||||||
| Verizon Communications, Inc. |
69 | 07/12/19 | USD | 58.00 | USD | 394 | (1,656 | ) | ||||||||||||||||
| Walmart, Inc. |
146 | 07/12/19 | USD | 105.00 | USD | 1,613 | (82,855 | ) | ||||||||||||||||
| Microsoft Corp. |
81 | 07/16/19 | USD | 129.50 | USD | 1,085 | (46,110 | ) | ||||||||||||||||
| AES Corp. |
734 | 07/19/19 | USD | 16.00 | USD | 1,230 | (62,390 | ) | ||||||||||||||||
| Alcon, Inc. |
157 | 07/19/19 | USD | 60.00 | USD | 974 | (40,035 | ) | ||||||||||||||||
| Ally Financial, Inc. |
642 | 07/19/19 | USD | 30.00 | USD | 1,990 | (91,485 | ) | ||||||||||||||||
| Ally Financial, Inc. |
620 | 07/19/19 | USD | 31.00 | USD | 1,921 | (49,600 | ) | ||||||||||||||||
| Alphabet, Inc., Class A |
3 | 07/19/19 | USD | 1,195.00 | USD | 325 | (195 | ) | ||||||||||||||||
| Alphabet, Inc., Class A |
16 | 07/19/19 | USD | 1,070.00 | USD | 1,732 | (48,080 | ) | ||||||||||||||||
| Altria Group, Inc. |
438 | 07/19/19 | USD | 52.50 | USD | 2,074 | (1,971 | ) | ||||||||||||||||
| Apple, Inc. |
36 | 07/19/19 | USD | 190.00 | USD | 713 | (36,990 | ) | ||||||||||||||||
| Apple, Inc. |
96 | 07/19/19 | USD | 195.00 | USD | 1,900 | (65,520 | ) | ||||||||||||||||
| Assured Guaranty Ltd. |
316 | 07/19/19 | USD | 43.00 | USD | 1,330 | (10,586 | ) | ||||||||||||||||
| BP PLC — ADR |
320 | 07/19/19 | USD | 43.00 | USD | 1,334 | (7,680 | ) | ||||||||||||||||
| Bank of America Corp. |
186 | 07/19/19 | USD | 29.00 | USD | 539 | (14,043 | ) | ||||||||||||||||
| Baxter International, Inc. |
82 | 07/19/19 | USD | 77.50 | USD | 672 | (39,155 | ) | ||||||||||||||||
| Baxter International, Inc. |
83 | 07/19/19 | USD | 80.00 | USD | 680 | (20,584 | ) | ||||||||||||||||
| Biogen, Inc. |
120 | 07/19/19 | USD | 240.00 | USD | 2,806 | (48,000 | ) | ||||||||||||||||
| CDK Global, Inc. |
190 | 07/19/19 | USD | 51.00 | USD | 939 | (9,098 | ) | ||||||||||||||||
| CDW Corp. |
604 | 07/19/19 | USD | 110.00 | USD | 6,704 | (181,200 | ) | ||||||||||||||||
| Carnival Corp. |
259 | 07/19/19 | USD | 55.00 | USD | 1,206 | (1,295 | ) | ||||||||||||||||
| Carnival Corp. |
300 | 07/19/19 | USD | 47.00 | USD | 1,397 | (23,250 | ) | ||||||||||||||||
| Centene Corp. |
89 | 07/19/19 | USD | 57.50 | USD | 467 | (2,002 | ) | ||||||||||||||||
| Chevron Corp. |
223 | 07/19/19 | USD | 125.00 | USD | 2,775 | (40,140 | ) | ||||||||||||||||
| Cisco Systems, Inc. |
217 | 07/19/19 | USD | 55.00 | USD | 1,188 | (18,337 | ) | ||||||||||||||||
| Cisco Systems, Inc. |
85 | 07/19/19 | USD | 57.50 | USD | 465 | (1,572 | ) | ||||||||||||||||
| Cognizant Technology Solutions Corp., Class A |
59 | 07/19/19 | USD | 65.00 | USD | 374 | (3,540 | ) | ||||||||||||||||
| Comcast Corp., Class A |
388 | 07/19/19 | USD | 43.10 | USD | 1,640 | (13,251 | ) | ||||||||||||||||
| Corteva, Inc. |
283 | 07/19/19 | USD | 28.00 | USD | 837 | (51,648 | ) | ||||||||||||||||
| D.R. Horton, Inc. |
283 | 07/19/19 | USD | 45.00 | USD | 1,221 | (10,612 | ) | ||||||||||||||||
| D.R. Horton, Inc. |
278 | 07/19/19 | USD | 46.00 | USD | 1,199 | (5,143 | ) | ||||||||||||||||
| DISH Network Corp., Class A |
471 | 07/19/19 | USD | 35.00 | USD | 1,809 | (188,400 | ) | ||||||||||||||||
| Delta Air Lines, Inc. |
363 | 07/19/19 | USD | 57.50 | USD | 2,060 | (45,375 | ) | ||||||||||||||||
| Dollar General Corp. |
87 | 07/19/19 | USD | 125.00 | USD | 1,176 | (89,610 | ) | ||||||||||||||||
| Dollar Tree, Inc. |
234 | 07/19/19 | USD | 105.00 | USD | 2,513 | (91,260 | ) | ||||||||||||||||
| Dow, Inc. |
94 | 07/19/19 | USD | 52.50 | USD | 464 | (1,410 | ) | ||||||||||||||||
| Dow, Inc. |
63 | 07/19/19 | USD | 50.00 | USD | 311 | (5,355 | ) | ||||||||||||||||
| DuPont de Nemours, Inc. |
35 | 07/19/19 | USD | 32.50 | USD | 263 | (8,400 | ) | ||||||||||||||||
| E*Trade Financial Corp. |
320 | 07/19/19 | USD | 50.00 | USD | 1,427 | (5,760 | ) | ||||||||||||||||
| DuPont de Nemours, Inc. |
90 | 07/19/19 | USD | 77.50 | USD | 676 | (6,840 | ) | ||||||||||||||||
| Fortive Corp. |
302 | 07/19/19 | USD | 81.26 | USD | 2,462 | (56,105 | ) | ||||||||||||||||
| Hubbell, Inc. |
180 | 07/19/19 | USD | 123.25 | USD | 2,347 | (141,992 | ) | ||||||||||||||||
| Humana, Inc. |
54 | 07/19/19 | USD | 270.00 | USD | 1,433 | (24,840 | ) | ||||||||||||||||
| J.M. Smucker Co. |
207 | 07/19/19 | USD | 125.00 | USD | 2,384 | (3,105 | ) | ||||||||||||||||
| JPMorgan Chase & Co. |
17 | 07/19/19 | USD | 115.00 | USD | 190 | (1,190 | ) | ||||||||||||||||
| JPMorgan Chase & Co. |
113 | 07/19/19 | USD | 111.05 | USD | 1,263 | (25,726 | ) | ||||||||||||||||
| KAR Auction Services, Inc. |
303 | 07/19/19 | USD | 65.00 | USD | 758 | (69,690 | ) | ||||||||||||||||
| 34 | 2019 BLACKROCK SEMI-ANNUAL REPORT TO SHAREHOLDERS |
| Schedule of Investments (unaudited) (continued) June 30, 2019 |
BlackRock Enhanced Capital and Income Fund (CII) |
Exchange-Traded Options Written (continued)
| Description | Number of Contracts |
Expiration Date |
Exercise Price |
Notional Amount (000) |
Value | |||||||||||||||||||
| Call (continued) | ||||||||||||||||||||||||
| KAR Auction Services, Inc. |
476 | 07/19/19 | USD | 60.00 | USD | 1,190 | $ | (197,540 | ) | |||||||||||||||
| Laboratory Corp. of America Holdings |
368 | 07/19/19 | USD | 165.00 | USD | 6,363 | (329,360 | ) | ||||||||||||||||
| Lowe’s Cos., Inc. |
339 | 07/19/19 | USD | 97.50 | USD | 3,421 | (148,313 | ) | ||||||||||||||||
| Marathon Oil Corp. |
221 | 07/19/19 | USD | 17.00 | USD | 314 | (331 | ) | ||||||||||||||||
| Marathon Oil Corp. |
160 | 07/19/19 | USD | 14.00 | USD | 227 | (10,080 | ) | ||||||||||||||||
| Microsoft Corp. |
170 | 07/19/19 | USD | 130.00 | USD | 2,277 | (94,350 | ) | ||||||||||||||||
| Molson Coors Brewing Co., Class B |
278 | 07/19/19 | USD | 57.50 | USD | 1,557 | (15,290 | ) | ||||||||||||||||
| Norfolk Southern Corp. |
18 | 07/19/19 | USD | 210.00 | USD | 359 | (855 | ) | ||||||||||||||||
| Novartis AG — ADR |
28 | 07/19/19 | USD | 87.50 | USD | 256 | (12,040 | ) | ||||||||||||||||
| Novo Nordisk A/S — ADR |
419 | 07/19/19 | USD | 47.31 | USD | 2,139 | (161,134 | ) | ||||||||||||||||
| O’Reilly Automotive, Inc. |
167 | 07/19/19 | USD | 380.00 | USD | 6,168 | (60,955 | ) | ||||||||||||||||
| Packaging Corp. of America |
448 | 07/19/19 | USD | 100.00 | USD | 4,270 | (31,360 | ) | ||||||||||||||||
| Pfizer, Inc. |
190 | 07/19/19 | USD | 43.00 | USD | 823 | (18,145 | ) | ||||||||||||||||
| Quanta Services, Inc. |
228 | 07/19/19 | USD | 37.00 | USD | 871 | (38,190 | ) | ||||||||||||||||
| Quanta Services, Inc. |
150 | 07/19/19 | USD | 39.00 | USD | 573 | (6,750 | ) | ||||||||||||||||
| Regions Financial Corp. |
543 | 07/19/19 | USD | 15.00 | USD | 811 | (19,277 | ) | ||||||||||||||||
| SLM Corp. |
625 | 07/19/19 | USD | 11.00 | USD | 608 | (15,625 | ) | ||||||||||||||||
| SLM Corp. |
500 | 07/19/19 | USD | 9.50 | USD | 486 | (17,782 | ) | ||||||||||||||||
| Sony Corp., ADR |
195 | 07/19/19 | USD | 55.00 | USD | 1,022 | (7,800 | ) | ||||||||||||||||
| Suncor Energy, Inc. |
593 | 07/19/19 | USD | 62.50 | USD | 3,727 | (101,700 | ) | ||||||||||||||||
| Suncor Energy, Inc. |
17 | 07/19/19 | USD | 34.00 | USD | 53 | (42 | ) | ||||||||||||||||
| Suncor Energy, Inc. |
280 | 07/19/19 | USD | 32.00 | USD | 872 | (8,820 | ) | ||||||||||||||||
| Taiwan Semiconductor Manufacturing Co. Ltd. — ADR |
205 | 07/19/19 | USD | 40.00 | USD | 803 | (15,375 | ) | ||||||||||||||||
| U.S. Bancorp |
98 | 07/19/19 | USD | 52.50 | USD | 514 | (8,918 | ) | ||||||||||||||||
| UnitedHealth Group, Inc. |
124 | 07/19/19 | USD | 250.00 | USD | 3,026 | (44,950 | ) | ||||||||||||||||
| Verizon Communications, Inc. |
40 | 07/19/19 | USD | 57.50 | USD | 229 | (2,000 | ) | ||||||||||||||||
| Verizon Communications, Inc. |
625 | 07/19/19 | USD | 60.00 | USD | 3,571 | (4,062 | ) | ||||||||||||||||
| Verizon Communications, Inc. |
37 | 07/19/19 | USD | 58.00 | USD | 211 | (1,040 | ) | ||||||||||||||||
| Verizon Communications, Inc. |
76 | 07/24/19 | USD | 59.00 | USD | 434 | (1,379 | ) | ||||||||||||||||
| Apple, Inc. |
36 | 07/26/19 | USD | 202.50 | USD | 713 | (14,040 | ) | ||||||||||||||||
| BP PLC — ADR |
76 | 07/26/19 | USD | 42.00 | USD | 317 | (5,434 | ) | ||||||||||||||||
| Bank of America Corp. |
342 | 07/26/19 | USD | 28.50 | USD | 992 | (38,817 | ) | ||||||||||||||||
| Baxter International, Inc. |
112 | 07/26/19 | USD | 84.00 | USD | 917 | (11,592 | ) | ||||||||||||||||
| Biogen, Inc. |
121 | 07/26/19 | USD | 247.50 | USD | 2,830 | (49,005 | ) | ||||||||||||||||
| Chevron Corp. |
124 | 07/26/19 | USD | 123.00 | USD | 1,543 | (41,664 | ) | ||||||||||||||||
| Cisco Systems, Inc. |
103 | 07/26/19 | USD | 56.00 | USD | 564 | (6,695 | ) | ||||||||||||||||
| Cisco Systems, Inc. |
104 | 07/26/19 | USD | 56.50 | USD | 569 | (4,732 | ) | ||||||||||||||||
| Cognizant Technology Solutions Corp., Class A |
36 | 07/26/19 | USD | 65.50 | USD | 228 | (2,340 | ) | ||||||||||||||||
| Cognizant Technology Solutions Corp., Class A |
32 | 07/26/19 | USD | 66.00 | USD | 203 | (1,760 | ) | ||||||||||||||||
| Comcast Corp., Class A |
109 | 07/26/19 | USD | 44.00 | USD | 461 | (3,433 | ) | ||||||||||||||||
| D.R. Horton, Inc. |
189 | 07/26/19 | USD | 47.50 | USD | 815 | (2,551 | ) | ||||||||||||||||
| DISH Network Corp., Class A |
326 | 07/26/19 | USD | 37.50 | USD | 1,252 | (92,095 | ) | ||||||||||||||||
| Delta Air Lines, Inc. |
195 | 07/26/19 | USD | 58.00 | USD | 1,107 | (22,523 | ) | ||||||||||||||||
| Dow, Inc. |
102 | 07/26/19 | USD | 51.50 | USD | 503 | (6,375 | ) | ||||||||||||||||
| DuPont de Nemours, Inc. |
62 | 07/26/19 | USD | 78.00 | USD | 465 | (6,510 | ) | ||||||||||||||||
| E*Trade Financial Corp. |
152 | 07/26/19 | USD | 47.00 | USD | 678 | (11,324 | ) | ||||||||||||||||
| JPMorgan Chase & Co. |
138 | 07/26/19 | USD | 113.20 | USD | 1,543 | (21,100 | ) | ||||||||||||||||
| Lowe’s Cos., Inc. |
112 | 07/26/19 | USD | 100.00 | USD | 1,130 | (31,248 | ) | ||||||||||||||||
| Marathon Oil Corp. |
166 | 07/26/19 | USD | 15.00 | USD | 236 | (4,565 | ) | ||||||||||||||||
| Marathon Oil Corp. |
216 | 07/26/19 | USD | 14.50 | USD | 307 | (9,828 | ) | ||||||||||||||||
| Microsoft Corp. |
228 | 07/26/19 | USD | 136.00 | USD | 3,054 | (62,472 | ) | ||||||||||||||||
| Molson Coors Brewing Co., Class B |
201 | 07/26/19 | USD | 56.50 | USD | 1,126 | (23,115 | ) | ||||||||||||||||
| Pfizer, Inc. |
178 | 07/26/19 | USD | 43.00 | USD | 771 | (19,224 | ) | ||||||||||||||||
| Sony Corp., ADR |
195 | 07/26/19 | USD | 55.00 | USD | 1,022 | (11,700 | ) | ||||||||||||||||
| Sony Corp., ADR |
55 | 07/26/19 | USD | 56.00 | USD | 288 | (2,062 | ) | ||||||||||||||||
| Suncor Energy, Inc. |
494 | 07/26/19 | USD | 32.00 | USD | 1,539 | (23,465 | ) | ||||||||||||||||
| UnitedHealth Group, Inc. |
160 | 07/26/19 | USD | 252.50 | USD | 3,904 | (53,600 | ) | ||||||||||||||||
| Verizon Communications, Inc. |
75 | 07/26/19 | USD | 59.00 | USD | 428 | (1,575 | ) | ||||||||||||||||
| Verizon Communications, Inc. |
74 | 07/26/19 | USD | 58.00 | USD | 423 | (3,219 | ) | ||||||||||||||||
| Verizon Communications, Inc. |
69 | 07/26/19 | USD | 57.89 | USD | 394 | (2,742 | ) | ||||||||||||||||
| Walmart, Inc. |
295 | 07/26/19 | USD | 107.00 | USD | 3,259 | (125,375 | ) | ||||||||||||||||
| Corteva, Inc |
84 | 07/29/19 | USD | 26.50 | USD | 248 | (26,681 | ) | ||||||||||||||||
| SCHEDULES OF INVESTMENTS | 35 |
| Schedule of Investments (unaudited) (continued) June 30, 2019 |
BlackRock Enhanced Capital and Income Fund (CII) |
Exchange-Traded Options Written (continued)
| Description | Number of Contracts |
Expiration Date |
Exercise Price |
Notional Amount (000) |
Value | |||||||||||||||||||
| Call (continued) | ||||||||||||||||||||||||
| Marathon Oil Corp. |
149 | 07/31/19 | USD | 15.00 | USD | 212 | $ | (4,760 | ) | |||||||||||||||
| Novartis AG — ADR |
279 | 07/31/19 | USD | 92.62 | USD | 2,548 | (42,080 | ) | ||||||||||||||||
| Verizon Communications, Inc. |
309 | 07/31/19 | USD | 58.50 | USD | 1,765 | (16,821 | ) | ||||||||||||||||
| Alphabet, Inc., Class A |
1 | 08/02/19 | USD | 1,145.00 | USD | 108 | (1,285 | ) | ||||||||||||||||
| Altria Group, Inc. |
479 | 08/02/19 | USD | 52.00 | USD | 2,268 | (11,975 | ) | ||||||||||||||||
| Bank of America Corp. |
585 | 08/02/19 | USD | 29.00 | USD | 1,697 | (54,113 | ) | ||||||||||||||||
| Baxter International, Inc. |
84 | 08/02/19 | USD | 80.50 | USD | 688 | (24,948 | ) | ||||||||||||||||
| Chevron Corp. |
98 | 08/02/19 | USD | 126.00 | USD | 1,220 | (22,001 | ) | ||||||||||||||||
| Cisco Systems, Inc. |
207 | 08/02/19 | USD | 56.50 | USD | 1,133 | (13,662 | ) | ||||||||||||||||
| Cognizant Technology Solutions Corp., Class A |
95 | 08/02/19 | USD | 66.00 | USD | 602 | (9,737 | ) | ||||||||||||||||
| Comcast Corp. |
393 | 08/02/19 | USD | 44.00 | USD | 1,662 | (15,917 | ) | ||||||||||||||||
| D.R. Horton, Inc. |
280 | 08/02/19 | USD | 45.50 | USD | 1,208 | (23,380 | ) | ||||||||||||||||
| DISH Network Corp., Class A |
471 | 08/02/19 | USD | 40.50 | USD | 1,809 | (149,543 | ) | ||||||||||||||||
| Delta Air Lines, Inc. |
296 | 08/02/19 | USD | 58.00 | USD | 1,680 | (37,888 | ) | ||||||||||||||||
| Dollar General Corp. |
63 | 08/02/19 | USD | 138.00 | USD | 852 | (10,552 | ) | ||||||||||||||||
| Dollar Tree, Inc. |
165 | 08/02/19 | USD | 115.00 | USD | 1,772 | (41,663 | ) | ||||||||||||||||
| Dow, Inc. |
69 | 08/02/19 | USD | 53.50 | USD | 340 | (1,897 | ) | ||||||||||||||||
| Dow, Inc. |
31 | 08/02/19 | USD | 51.50 | USD | 153 | (2,402 | ) | ||||||||||||||||
| E*Trade Financial Corp. |
197 | 08/02/19 | USD | 47.50 | USD | 879 | (12,805 | ) | ||||||||||||||||
| Emerson Electric Co. |
387 | 08/02/19 | USD | 65.00 | USD | 2,582 | (112,230 | ) | ||||||||||||||||
| Fortive Corp. |
46 | 08/02/19 | USD | 82.50 | USD | 375 | (9,131 | ) | ||||||||||||||||
| Humana, Inc. |
44 | 08/02/19 | USD | 255.00 | USD | 1,167 | (72,160 | ) | ||||||||||||||||
| JPMorgan Chase & Co. |
80 | 08/02/19 | USD | 113.00 | USD | 894 | (15,560 | ) | ||||||||||||||||
| JPMorgan Chase & Co. |
52 | 08/02/19 | USD | 113.10 | USD | 581 | (9,890 | ) | ||||||||||||||||
| Lowe’s Cos., Inc. |
153 | 08/02/19 | USD | 105.00 | USD | 1,544 | (15,147 | ) | ||||||||||||||||
| Lowe’s Cos., Inc. |
159 | 08/02/19 | USD | 103.00 | USD | 1,604 | (25,838 | ) | ||||||||||||||||
| Marathon Oil Corp. |
408 | 08/02/19 | USD | 13.50 | USD | 580 | (45,900 | ) | ||||||||||||||||
| Marathon Oil Corp. |
500 | 08/02/19 | USD | 15.00 | USD | 711 | (18,750 | ) | ||||||||||||||||
| Microsoft Corp. |
246 | 08/02/19 | USD | 138.00 | USD | 3,295 | (56,088 | ) | ||||||||||||||||
| Norfolk Southern Corp. |
107 | 08/02/19 | USD | 200.00 | USD | 2,133 | (57,245 | ) | ||||||||||||||||
| Pfizer, Inc. |
71 | 08/02/19 | USD | 43.50 | USD | 308 | (6,816 | ) | ||||||||||||||||
| Pfizer, Inc. |
91 | 08/02/19 | USD | 44.50 | USD | 394 | (4,823 | ) | ||||||||||||||||
| Pfizer, Inc. |
46 | 08/02/19 | USD | 43.00 | USD | 199 | (5,658 | ) | ||||||||||||||||
| Sony Corp., ADR |
129 | 08/02/19 | USD | 57.50 | USD | 676 | (7,095 | ) | ||||||||||||||||
| Suncor Energy, Inc. |
525 | 08/02/19 | USD | 32.00 | USD | 1,636 | (30,450 | ) | ||||||||||||||||
| Taiwan Semiconductor Manufacturing Co. Ltd. |
108 | 08/02/19 | USD | 40.63 | USD | 423 | (8,510 | ) | ||||||||||||||||
| U.S. Bancorp |
371 | 08/02/19 | USD | 54.00 | USD | 1,944 | (19,107 | ) | ||||||||||||||||
| UnitedHealth Group, Inc. |
81 | 08/02/19 | USD | 257.50 | USD | 1,976 | (20,331 | ) | ||||||||||||||||
| Verizon Communications, Inc. |
37 | 08/02/19 | USD | 59.00 | USD | 211 | (1,646 | ) | ||||||||||||||||
| Verizon Communications, Inc. |
131 | 08/02/19 | USD | 58.00 | USD | 748 | (9,759 | ) | ||||||||||||||||
| Walmart, Inc. |
294 | 08/02/19 | USD | 110.00 | USD | 3,248 | (71,589 | ) | ||||||||||||||||
| Alphabet, Inc., Class A |
13 | 08/09/19 | USD | 1,115.00 | USD | 1,408 | (32,630 | ) | ||||||||||||||||
| Apple, Inc. |
68 | 08/09/19 | USD | 205.00 | USD | 1,346 | (36,040 | ) | ||||||||||||||||
| BP PLC — ADR |
366 | 08/09/19 | USD | 43.00 | USD | 1,526 | (21,594 | ) | ||||||||||||||||
| Bank of America Corp. |
250 | 08/09/19 | USD | 29.73 | USD | 725 | (17,200 | ) | ||||||||||||||||
| Cisco Systems, Inc. |
414 | 08/09/19 | USD | 57.00 | USD | 2,266 | (27,738 | ) | ||||||||||||||||
| Comcast Corp., Class A |
283 | 08/09/19 | USD | 43.00 | USD | 1,197 | (26,178 | ) | ||||||||||||||||
| Dollar General Corp. |
47 | 08/09/19 | USD | 138.00 | USD | 635 | (9,517 | ) | ||||||||||||||||
| Dollar Tree, Inc. |
115 | 08/09/19 | USD | 110.00 | USD | 1,235 | (24,725 | ) | ||||||||||||||||
| E*Trade Financial Corp. |
347 | 08/09/19 | USD | 46.50 | USD | 1,548 | (33,312 | ) | ||||||||||||||||
| JPMorgan Chase & Co. |
137 | 08/09/19 | USD | 112.84 | USD | 1532 | (31,428 | ) | ||||||||||||||||
| Lowe’s Cos., Inc. |
159 | 08/09/19 | USD | 103.00 | USD | 1,604 | (30,608 | ) | ||||||||||||||||
| Marathon Oil Corp. |
222 | 08/09/19 | USD | 14.88 | USD | 315 | (10,426 | ) | ||||||||||||||||
| Microsoft Corp. |
168 | 08/09/19 | USD | 137.00 | USD | 2,251 | (50,568 | ) | ||||||||||||||||
| Norfolk Southern Corp. |
70 | 08/09/19 | USD | 202.50 | USD | 1,395 | (32,900 | ) | ||||||||||||||||
| Pfizer, Inc. |
44 | 08/09/19 | USD | 42.75 | USD | 191 | (5,368 | ) | ||||||||||||||||
| Pfizer, Inc. |
40 | 08/09/19 | USD | 43.05 | USD | 173 | (4,239 | ) | ||||||||||||||||
| Pfizer, Inc. |
114 | 08/09/19 | USD | 43.64 | USD | 494 | (9,853 | ) | ||||||||||||||||
| Pfizer, Inc. |
91 | 08/09/19 | USD | 44.47 | USD | 394 | (5,091 | ) | ||||||||||||||||
| Suncor Energy, Inc. |
408 | 08/09/19 | USD | 32.50 | USD | 1,271 | (19,176 | ) | ||||||||||||||||
| U.S. Bancorp |
93 | 08/09/19 | USD | 53.00 | USD | 487 | (9,486 | ) | ||||||||||||||||
| Verizon Communications, Inc. |
130 | 08/09/19 | USD | 59.00 | USD | 743 | (7,020 | ) | ||||||||||||||||
| 36 | 2019 BLACKROCK SEMI-ANNUAL REPORT TO SHAREHOLDERS |
| Schedule of Investments (unaudited) (continued) June 30, 2019 |
BlackRock Enhanced Capital and Income Fund (CII) |
Exchange-Traded Options Written (continued)
| Description | Number of Contracts |
Expiration Date |
Exercise Price |
Notional Amount (000) |
Value | |||||||||||||||||||
| Call (continued) | ||||||||||||||||||||||||
| AES Corp. |
902 | 08/16/19 | USD | 16.35 | USD | 1,512 | $ | (63,202 | ) | |||||||||||||||
| Alcon, Inc. |
157 | 08/16/19 | USD | 60.00 | USD | 974 | (51,810 | ) | ||||||||||||||||
| Alphabet, Inc., Class A |
24 | 08/16/19 | USD | 1,165.00 | USD | 2,599 | (28,440 | ) | ||||||||||||||||
| Altria Group, Inc. |
711 | 08/16/19 | USD | 50.00 | USD | 3,367 | (58,658 | ) | ||||||||||||||||
| Apple, Inc. |
103 | 08/16/19 | USD | 205.00 | USD | 2,039 | (52,530 | ) | ||||||||||||||||
| BP PLC — ADR |
314 | 08/16/19 | USD | 43.00 | USD | 1,309 | (18,526 | ) | ||||||||||||||||
| Bank of America Corp. |
171 | 08/16/19 | USD | 28.00 | USD | 496 | (29,327 | ) | ||||||||||||||||
| Baxter International, Inc. |
163 | 08/16/19 | USD | 85.00 | USD | 1,335 | (21,027 | ) | ||||||||||||||||
| CDK Global, Inc. |
314 | 08/16/19 | USD | 51.00 | USD | 1,552 | (39,355 | ) | ||||||||||||||||
| Centene Corp. |
379 | 08/16/19 | USD | 56.85 | USD | 1,987 | (34,801 | ) | ||||||||||||||||
| Cognizant Technology Solutions Corp., Class A |
74 | 08/16/19 | USD | 67.50 | USD | 469 | (6,845 | ) | ||||||||||||||||
| Corteva, Inc. |
114 | 08/16/19 | USD | 30.00 | USD | 337 | (12,825 | ) | ||||||||||||||||
| Corteva, Inc. |
114 | 08/16/19 | USD | 31.00 | USD | 337 | (8,265 | ) | ||||||||||||||||
| DISH Network Corp., Class A |
477 | 08/16/19 | USD | 40.00 | USD | 1,832 | (106,133 | ) | ||||||||||||||||
| Delta Air Lines, Inc. |
195 | 08/16/19 | USD | 57.50 | USD | 1,107 | (33,735 | ) | ||||||||||||||||
| Dollar General Corp. |
261 | 08/16/19 | USD | 135.00 | USD | 3,528 | (97,875 | ) | ||||||||||||||||
| Dollar Tree, Inc. |
184 | 08/16/19 | USD | 110.00 | USD | 1,976 | (47,380 | ) | ||||||||||||||||
| Humana, Inc. |
77 | 08/16/19 | USD | 270.00 | USD | 2,043 | (73,150 | ) | ||||||||||||||||
| JPMorgan Chase & Co. |
76 | 08/16/19 | USD | 112.40 | USD | 850 | (21,671 | ) | ||||||||||||||||
| Laboratory Corp. of America Holdings |
279 | 08/16/19 | USD | 170.00 | USD | 4,824 | (212,040 | ) | ||||||||||||||||
| Marathon Oil Corp. |
264 | 08/16/19 | USD | 15.00 | USD | 375 | (13,068 | ) | ||||||||||||||||
| Microsoft Corp. |
61 | 08/16/19 | USD | 140.00 | USD | 817 | (12,261 | ) | ||||||||||||||||
| Norfolk Southern Corp. |
107 | 08/16/19 | USD | 200.00 | USD | 2,133 | (68,480 | ) | ||||||||||||||||
| O’Reilly Automative, Inc. |
55 | 08/16/19 | USD | 390.00 | USD | 2,031 | (36,575 | ) | ||||||||||||||||
| O’Reilly Automative, Inc. |
28 | 08/16/19 | USD | 400.00 | USD | 1,034 | (11,620 | ) | ||||||||||||||||
| Pfizer, Inc. |
91 | 08/16/19 | USD | 45.00 | USD | 394 | (4,368 | ) | ||||||||||||||||
| Pfizer, Inc. |
178 | 08/16/19 | USD | 43.90 | USD | 771 | (14,566 | ) | ||||||||||||||||
| Quanta Services, Inc. |
344 | 08/16/19 | USD | 37.00 | USD | 1,314 | (79,120 | ) | ||||||||||||||||
| Quanta Services, Inc. |
210 | 08/16/19 | USD | 39.00 | USD | 802 | (24,150 | ) | ||||||||||||||||
| Regions Financial Corp. |
502 | 08/16/19 | USD | 15.00 | USD | 750 | (28,865 | ) | ||||||||||||||||
| SLM Corp. |
627 | 08/16/19 | USD | 10.00 | USD | 609 | (17,556 | ) | ||||||||||||||||
| Emerson Electric Co. |
362 | 08/09/19 | USD | 68.00 | USD | 2,415 | (49,775 | ) | ||||||||||||||||
| SunTrust Banks, Inc. |
478 | 08/16/19 | USD | 63.10 | USD | 3,004 | (107,206 | ) | ||||||||||||||||
| U.S. Bancorp |
229 | 08/16/19 | USD | 52.50 | USD | 1,200 | (31,946 | ) | ||||||||||||||||
| Walmart, Inc. |
219 | 08/16/19 | USD | 110.00 | USD | 2,420 | (72,270 | ) | ||||||||||||||||
| Walmart, Inc. |
146 | 08/16/19 | USD | 112.39 | USD | 1,613 | (30,907 | ) | ||||||||||||||||
| Pfizer, Inc. |
223 | 08/23/19 | USD | 44.06 | USD | 966 | (18,678 | ) | ||||||||||||||||
| Bank of America Corp. |
283 | 09/20/19 | USD | 31.00 | USD | 821 | (14,009 | ) | ||||||||||||||||
| Novo Nordisk A/S — ADR |
404 | 09/20/19 | USD | 52.25 | USD | 2,062 | (60,510 | ) | ||||||||||||||||
| Pfizer, Inc. |
62 | 09/20/19 | USD | 44.00 | USD | 269 | (6,789 | ) | ||||||||||||||||
|
|
|
|||||||||||||||||||||||
| $ | (8,921,050 | ) | ||||||||||||||||||||||
|
|
|
|||||||||||||||||||||||
OTC Options Written
| Description | Counterparty | Number of Contracts |
Expiration Date |
Exercise Price |
Notional Amount (000) |
Value | ||||||||||||||||||||||||
| Call |
| |||||||||||||||||||||||||||||
| Hubbell, Inc. |
Credit Suisse International | 12,600 | 07/08/19 | USD | 125.09 | USD | 1,643 | $ | (72,230 | ) | ||||||||||||||||||||
| Assured Guaranty Ltd. |
Barclays Bank PLC | 32,000 | 07/10/19 | USD | 42.85 | USD | 1,347 | (7,274 | ) | |||||||||||||||||||||
| CDK Global, Inc. |
Barclays Bank PLC | 27,100 | 07/10/19 | USD | 49.47 | USD | 1,340 | (21,346 | ) | |||||||||||||||||||||
| AES Corp. |
Credit Suisse International | 125,900 | 07/12/19 | USD | 16.53 | USD | 2,110 | (50,472 | ) | |||||||||||||||||||||
| Regions Financial Corp. |
Credit Suisse International | 35,300 | 07/12/19 | USD | 14.93 | USD | 527 | (11,942 | ) | |||||||||||||||||||||
| SLM Corp. |
JPMorgan Chase Bank N.A. | 147,000 | 07/12/19 | USD | 10.24 | USD | 1,429 | (4,697 | ) | |||||||||||||||||||||
| J.M. Smucker Co. |
Morgan Stanley & Co. International PLC | 12,600 | 07/19/19 | USD | 126.02 | USD | 1,451 | (1,252 | ) | |||||||||||||||||||||
| Ally Financial, Inc. |
Citibank N.A. | 61,100 | 07/24/19 | USD | 31.39 | USD | 1,893 | (36,660 | ) | |||||||||||||||||||||
| Packaging Corp. of America |
Credit Suisse International | 17,100 | 07/26/19 | USD | 97.19 | USD | 1,630 | (40,691 | ) | |||||||||||||||||||||
| Hubbell, Inc. |
Barclays Bank PLC | 18,000 | 07/29/19 | USD | 120.62 | USD | 2,347 | (189,512 | ) | |||||||||||||||||||||
| Regions Financial Corp. |
Citibank N.A. | 48,100 | 08/01/19 | USD | 15.38 | USD | 719 | (16,490 | ) | |||||||||||||||||||||
| Novo Nordisk A/S — ADR |
Bank of America N.A. | 60,000 | 08/05/19 | USD | 50.06 | USD | 3,062 | (113,787 | ) | |||||||||||||||||||||
| Novartis AG — ADR |
Barclays Bank PLC | 40,300 | 08/21/19 | USD | 91.25 | USD | 3,680 | (96,665 | ) | |||||||||||||||||||||
| AES Corp. |
Barclays Bank PLC | 126,900 | 08/22/19 | USD | 17.09 | USD | 2,127 | (44,396 | ) | |||||||||||||||||||||
|
|
|
|||||||||||||||||||||||||||||
| $ | (707,414 | ) | ||||||||||||||||||||||||||||
|
|
|
|||||||||||||||||||||||||||||
| SCHEDULES OF INVESTMENTS | 37 |
| Schedule of Investments (unaudited) (continued) June 30, 2019 |
BlackRock Enhanced Capital and Income Fund (CII) |
Balances Reported in the Statements of Assets and Liabilities for Options Written
| Swap Premium Paid |
Swap Premium Received |
Unrealized Appreciation |
Unrealized Depreciation |
Value | ||||||||||||||||
| Options Written |
N/A | N/A | $ | 1,408,554 | $ | (3,512,475 | ) | $ | (9,628,464 | ) | ||||||||||
Derivative Financial Instruments Categorized by Risk Exposure
As of period end, the fair values of derivative financial instruments located in the Statements of Assets and Liabilities were as follows:
| Commodity Contracts |
Credit Contracts |
Equity Contracts |
Foreign Currency Exchange Contracts |
Interest Rate Contracts |
Other Contracts |
Total | ||||||||||||||||||||||
| Liabilities — Derivative Financial Instruments |
||||||||||||||||||||||||||||
| Options Written |
||||||||||||||||||||||||||||
| Investments at value |
$ | — | $ | — | $ | 9,628,464 | $ | — | $ | — | $ | — | $ | 9,628,464 | ||||||||||||||
|
|
|
|
|
|
|
|
|
|
|
|
|
|
|
|||||||||||||||
For the six months ended June 30, 2019, the effect of derivative financial instruments in the Statements of Operations was as follows:
| Commodity Contracts |
Credit Contracts |
Equity Contracts |
Foreign Currency Exchange Contracts |
Interest Rate Contracts |
Other Contracts |
Total | ||||||||||||||||||||||
| Net Realized Gain (Loss) from: |
||||||||||||||||||||||||||||
| Options purchased(a) |
$ | — | $ | — | $ | (1,463 | ) | $ | — | $ | — | $ | — | $ | (1,463 | ) | ||||||||||||
| Options written |
— | — | (4,972,451 | ) | — | — | — | (4,972,451 | ) | |||||||||||||||||||
|
|
|
|
|
|
|
|
|
|
|
|
|
|
|
|||||||||||||||
| $ | — | $ | — | $ | (4,973,914 | ) | $ | — | $ | — | $ | — | $ | (4,973,914 | ) | |||||||||||||
|
|
|
|
|
|
|
|
|
|
|
|
|
|
|
|||||||||||||||
| (a) Options purchased are included in net realized gain (loss) from investments. |
| |||||||||||||||||||||||||||
| Net Change in Unrealized Appreciation (Depreciation) on: |
||||||||||||||||||||||||||||
| Options purchased(a) |
$ | — | $ | — | $ | 7,849 | $ | — | $ | — | $ | — | $ | 7,849 | ||||||||||||||
| Options written |
— | — | (6,664,395 | ) | — | — | — | (6,664,395 | ) | |||||||||||||||||||
|
|
|
|
|
|
|
|
|
|
|
|
|
|
|
|||||||||||||||
| $ | — | $ | — | $ | (6,656,546 | ) | $ | — | $ | — | $ | — | $ | (6,656,546 | ) | |||||||||||||
|
|
|
|
|
|
|
|
|
|
|
|
|
|
|
|||||||||||||||
| (a) | Options purchased are included in net change in unrealized appreciation (depreciation) on investments. |
Average Quarterly Balances of Outstanding Derivative Financial Instruments
| Options: |
| |||
| Average market value of option contracts purchased |
$ | — | (a) | |
| Average market value of option contracts written |
$ | 8,616,659 | ||
| (a) | Derivative not held at quarter-end. The risk exposure table serves as an indicator of activity during the period. |
For more information about the Trust’s investment risks regarding derivative financial instruments, refer to the Notes to Financial Statements.
Derivative Financial Instruments — Offsetting as of Period End
The Trust’s derivative assets and liabilities (by type) are as follows:
| Assets | Liabilities | |||||||
| Derivative Financial Instruments: |
||||||||
| Options |
$ | — | $ | 9,628,464 | ||||
|
|
|
|
|
|||||
| Derivatives not subject to a Master Netting Agreement or similar agreement (“MNA”) |
— | (8,921,050 | ) | |||||
|
|
|
|
|
|||||
| Total derivative assets and liabilities subject to an MNA |
$ | — | $ | 707,414 | ||||
|
|
|
|
|
|||||
| 38 | 2019 BLACKROCK SEMI-ANNUAL REPORT TO SHAREHOLDERS |
| Schedule of Investments (unaudited) (continued) June 30, 2019 |
BlackRock Enhanced Capital and Income Fund (CII) |
The following table presents the Trust’s derivative assets and (liabilities) by counterparty net of amounts available for offset under an MNA and net of the related collateral received and pledged by the Trust:
| Counterparty | Derivative Liabilities Subject to an MNA by Counterparty |
Derivatives Available for Offset |
Non-cash Collateral Pledged (a) |
Cash Collateral Pledged (a) |
Net Amount of Derivative Liabilities (b) |
|||||||||||||||
| Bank of America N.A. |
$ | 113,787 | $ | — | $ | — | $ | — | $ | 113,787 | ||||||||||
| Barclays Bank PLC |
359,193 | — | — | (359,193 | ) | — | ||||||||||||||
| Citibank N.A. |
53,150 | — | (53,150 | ) | — | — | ||||||||||||||
| Credit Suisse International |
175,335 | — | — | — | 175,335 | |||||||||||||||
| JPMorgan Chase Bank N.A. |
4,697 | — | (4,697 | ) | — | — | ||||||||||||||
| Morgan Stanley & Co. International PLC |
1,252 | — | — | — | 1,252 | |||||||||||||||
|
|
|
|
|
|
|
|
|
|
|
|||||||||||
| $ | 707,414 | $ | — | $ | (57,847 | ) | $ | (359,193 | ) | $ | 290,374 | |||||||||
|
|
|
|
|
|
|
|
|
|
|
|||||||||||
| (a) | Excess of collateral pledged to the individual counterparty is not shown for financial reporting purposes. |
| (b) | Net amount represents the net amount payable due to counterparty in the event of default. Net amount may be offset further by the options written receivable/payable on the Statements of Assets and Liabilities. |
Fair Value Hierarchy as of Period End
Various inputs are used in determining the fair value of investments and derivative financial instruments. For information about the Trust’s policy regarding valuation of investments and derivative financial instruments, refer to the Notes to Financial Statements.
The following tables summarize the Trust’s investments and derivative financial instruments categorized in the disclosure hierarchy:
| Level 1 | Level 2 | Level 3 | Total | |||||||||||||
| Assets: |
| |||||||||||||||
| Investments: |
| |||||||||||||||
| Long-Term Investments(a) |
$ | 744,985,821 | $ | — | $ | — | $ | 744,985,821 | ||||||||
| Short-Term Securities |
2,734,005 | — | — | 2,734,005 | ||||||||||||
|
|
|
|
|
|
|
|
|
|||||||||
| $ | 747,719,826 | $ | — | $ | — | $ | 747,719,826 | |||||||||
|
|
|
|
|
|
|
|
|
|||||||||
| Derivative Financial Instruments(b): |
| |||||||||||||||
| Liabilities: |
| |||||||||||||||
| Equity contracts |
$ | (7,729,014 | ) | $ | (1,899,450 | ) | $ | — | $ | (9,628,464 | ) | |||||
|
|
|
|
|
|
|
|
|
|||||||||
| (a) | See above Schedule of Investments for values in each industry. |
| (b) | Derivative financial instruments are options written, which are shown at value. |
See notes to financial statements.
| SCHEDULES OF INVESTMENTS | 39 |
| Schedule of Investments (unaudited) June 30, 2019 |
BlackRock Enhanced Equity Dividend Trust (BDJ) (Percentages shown are based on Net Assets) |
| 40 | 2019 BLACKROCK SEMI-ANNUAL REPORT TO SHAREHOLDERS |
| Schedule of Investments (unaudited) (continued) June 30, 2019 |
BlackRock Enhanced Equity Dividend Trust (BDJ) (Percentages shown are based on Net Assets) |
| (e) | During the six months ended June 30, 2019, investments in issuers considered to be an affiliate/affiliates of the Trust for purposes of Section 2(a)(3) of the Investment Company Act of 1940, as amended, were as follows: |
| Affiliate | Shares Held at 12/31/18 |
Net Activity |
Shares Held at 06/30/19 |
Value at 06/30/19 |
Income | Net Realized Gain (Loss) (a) |
Change in Unrealized Appreciation (Depreciation) |
|||||||||||||||||||||
| BlackRock Liquidity Funds, T-Fund, Institutional Class |
44,526,058 | (16,761,269 | ) | 27,764,789 | $ | 27,764,789 | $ | 269,751 | $ | — | $ | — | ||||||||||||||||
|
|
|
|
|
|
|
|
|
|||||||||||||||||||||
| (a) | Includes net capital gain distributions, if applicable. |
For Trust compliance purposes, the Trust’s industry classifications refer to one or more of the industry sub-classifications used by one or more widely recognized market indexes or rating group indexes, and/or as defined by the investment adviser. These definitions may not apply for purposes of this report, which may combine such industry sub-classifications for reporting ease.
Derivative Financial Instruments Outstanding as of Period End
Exchange-Traded Options Written
| Description | Number of Contracts |
Expiration Date |
Exercise Price |
Notional Amount (000) |
Value | |||||||||||||||||||
| Call | ||||||||||||||||||||||||
| Comcast Corp., Class A |
665 | 07/02/19 | USD | 43.00 | USD | 2,812 | $ | (2,506 | ) | |||||||||||||||
| Corteva, Inc |
116 | 07/02/19 | USD | 25.25 | USD | 343 | (50,244 | ) | ||||||||||||||||
| FirstEnergy Corp. |
515 | 07/02/19 | USD | 41.50 | USD | 2,205 | (69,065 | ) | ||||||||||||||||
| General Electric Co. |
416 | 07/02/19 | USD | 10.50 | USD | 437 | (5,497 | ) | ||||||||||||||||
| Pfizer, Inc. |
322 | 07/02/19 | USD | 42.75 | USD | 1,395 | (22,324 | ) | ||||||||||||||||
| Wells Fargo & Co. |
252 | 07/02/19 | USD | 48.00 | USD | 1,192 | (5,882 | ) | ||||||||||||||||
| TOTAL SA — ADR |
264 | 07/03/19 | USD | 55.73 | USD | 1,473 | (14,500 | ) | ||||||||||||||||
| Citigroup, Inc. |
847 | 07/05/19 | USD | 70.00 | USD | 5,932 | (73,266 | ) | ||||||||||||||||
| JPMorgan Chase & Co. |
493 | 07/05/19 | USD | 109.00 | USD | 5,512 | (146,175 | ) | ||||||||||||||||
| SCHEDULES OF INVESTMENTS | 41 |
| Schedule of Investments (unaudited) (continued) June 30, 2019 |
BlackRock Enhanced Equity Dividend Trust (BDJ) |
Exchange-Traded Options Written (continued)
| Description | Number of Contracts |
Expiration Date |
Exercise Price |
Notional Amount (000) |
Value | |||||||||||||||||||
| Call (continued) | ||||||||||||||||||||||||
| Microsoft Corp. |
171 | 07/05/19 | USD | 132.00 | USD | 2,291 | $ | (46,170 | ) | |||||||||||||||
| PepsiCo, Inc. |
113 | 07/05/19 | USD | 129.00 | USD | 1,482 | (27,572 | ) | ||||||||||||||||
| Wells Fargo & Co. |
204 | 07/05/19 | USD | 47.50 | USD | 965 | (9,282 | ) | ||||||||||||||||
| TOTAL SA — ADR |
264 | 07/10/19 | USD | 55.73 | USD | 1,473 | (22,165 | ) | ||||||||||||||||
| Baker Hughes a GE Co. |
184 | 07/11/19 | USD | 24.50 | USD | 453 | (12,237 | ) | ||||||||||||||||
| AXA Equitable Holdings, Inc. |
565 | 07/12/19 | USD | 21.75 | USD | 1,181 | (9,647 | ) | ||||||||||||||||
| Altria Group, Inc. |
637 | 07/12/19 | USD | 51.50 | USD | 3,016 | (2,548 | ) | ||||||||||||||||
| Anthem, Inc. |
97 | 07/12/19 | USD | 287.50 | USD | 2,737 | (28,469 | ) | ||||||||||||||||
| Bank of America Corp. |
1,634 | 07/12/19 | USD | 29.20 | USD | 4,739 | (86,391 | ) | ||||||||||||||||
| Charles Schwab Corp. |
196 | 07/12/19 | USD | 44.00 | USD | 788 | (1,960 | ) | ||||||||||||||||
| Citigroup, Inc. |
379 | 07/12/19 | USD | 67.00 | USD | 2,654 | (128,860 | ) | ||||||||||||||||
| Cognizant Technology Solutions Corp., Class A |
237 | 07/12/19 | USD | 65.00 | USD | 1,502 | (8,887 | ) | ||||||||||||||||
| Cognizant Technology Solutions Corp., Class A |
357 | 07/12/19 | USD | 65.50 | USD | 2,263 | (9,817 | ) | ||||||||||||||||
| Comcast Corp., Class A |
1,098 | 07/12/19 | USD | 43.91 | USD | 4,642 | (9,087 | ) | ||||||||||||||||
| Constellation Software, Inc. |
110 | 07/12/19 | USD | 197.50 | USD | 2,166 | (39,600 | ) | ||||||||||||||||
| Dollar General Corp. |
141 | 07/12/19 | USD | 130.00 | USD | 1,906 | (78,255 | ) | ||||||||||||||||
| Dow, Inc. |
184 | 07/12/19 | USD | 52.50 | USD | 907 | (1,840 | ) | ||||||||||||||||
| DuPont de Nemours, Inc. |
259 | 07/12/19 | USD | 33.00 | USD | 1,944 | (48,045 | ) | ||||||||||||||||
| DuPont de Nemours, Inc. |
177 | 07/12/19 | USD | 76.50 | USD | 1,329 | (14,071 | ) | ||||||||||||||||
| Enterprise Products Partners LP |
769 | 07/12/19 | USD | 28.50 | USD | 2,220 | (40,456 | ) | ||||||||||||||||
| General Electric Co. |
246 | 07/12/19 | USD | 10.00 | USD | 258 | (14,145 | ) | ||||||||||||||||
| General Electric Co. |
510 | 07/12/19 | USD | 10.55 | USD | 536 | (10,528 | ) | ||||||||||||||||
| General Motors Co. |
582 | 07/12/19 | USD | 35.00 | USD | 2,242 | (210,975 | ) | ||||||||||||||||
| Johnson Controls International PLC |
332 | 07/12/19 | USD | 40.00 | USD | 1,371 | (49,468 | ) | ||||||||||||||||
| Kellogg Co. |
317 | 07/12/19 | USD | 58.50 | USD | 1,698 | (234 | ) | ||||||||||||||||
| Lockheed Martin Corp. |
55 | 07/12/19 | USD | 342.50 | USD | 1,999 | (117,975 | ) | ||||||||||||||||
| Marathon Oil Corp. |
201 | 07/12/19 | USD | 15.60 | USD | 286 | (971 | ) | ||||||||||||||||
| Marathon Petroleum Corp. |
682 | 07/12/19 | USD | 48.00 | USD | 3,811 | (547,305 | ) | ||||||||||||||||
| Marathon Petroleum Corp. |
123 | 07/12/19 | USD | 48.50 | USD | 687 | (91,635 | ) | ||||||||||||||||
| Marvell Technology Group Ltd. |
285 | 07/12/19 | USD | 25.00 | USD | 680 | (4,845 | ) | ||||||||||||||||
| Mattel, Inc. |
532 | 07/12/19 | USD | 12.02 | USD | 596 | (5,929 | ) | ||||||||||||||||
| Medtronic PLC |
405 | 07/12/19 | USD | 93.50 | USD | 3,944 | (164,025 | ) | ||||||||||||||||
| MetLife, Inc. |
1,185 | 07/12/19 | USD | 48.50 | USD | 5,886 | (182,490 | ) | ||||||||||||||||
| Microsoft Corp. |
341 | 07/12/19 | USD | 128.00 | USD | 4,568 | (219,093 | ) | ||||||||||||||||
| Morgan Stanley |
1,056 | 07/12/19 | USD | 43.00 | USD | 4,626 | (143,616 | ) | ||||||||||||||||
| ONEOK, Inc. |
166 | 07/12/19 | USD | 65.50 | USD | 1,142 | (58,930 | ) | ||||||||||||||||
| Oracle Corp. |
468 | 07/12/19 | USD | 55.50 | USD | 2,666 | (81,432 | ) | ||||||||||||||||
| Pentair PLC |
475 | 07/12/19 | USD | 36.00 | USD | 1,767 | (69,330 | ) | ||||||||||||||||
| PepsiCo, Inc. |
486 | 07/12/19 | USD | 133.00 | USD | 6,373 | (59,535 | ) | ||||||||||||||||
| Pfizer, Inc. |
331 | 07/12/19 | USD | 42.50 | USD | 1,434 | (38,065 | ) | ||||||||||||||||
| Procter & Gamble Co. |
215 | 07/12/19 | USD | 106.00 | USD | 2,357 | (83,850 | ) | ||||||||||||||||
| QUALCOMM, Inc. |
45 | 07/12/19 | USD | 73.00 | USD | 342 | (18,225 | ) | ||||||||||||||||
| Taiwan Semiconductor Manufacturing Co. Ltd. — ADR |
293 | 07/12/19 | USD | 38.93 | USD | 1,148 | (30,878 | ) | ||||||||||||||||
| Union Pacific Corp. |
103 | 07/12/19 | USD | 175.00 | USD | 1,742 | (4,841 | ) | ||||||||||||||||
| UnitedHealth Group, Inc. |
81 | 07/12/19 | USD | 250.00 | USD | 1,976 | (12,919 | ) | ||||||||||||||||
| Verizon Communications, Inc. |
1,236 | 07/12/19 | USD | 57.07 | USD | 7,061 | (52,870 | ) | ||||||||||||||||
| Verizon Communications, Inc. |
804 | 07/12/19 | USD | 59.77 | USD | 4,593 | (5,583 | ) | ||||||||||||||||
| Wells Fargo & Co. |
222 | 07/12/19 | USD | 47.00 | USD | 1,051 | (21,423 | ) | ||||||||||||||||
| Wells Fargo & Co. |
862 | 07/12/19 | USD | 47.50 | USD | 4,079 | (58,616 | ) | ||||||||||||||||
| Wells Fargo & Co. |
183 | 07/12/19 | USD | 48.05 | USD | 866 | (7,950 | ) | ||||||||||||||||
| Williams Cos., Inc. |
892 | 07/12/19 | USD | 28.09 | USD | 2,501 | (34,541 | ) | ||||||||||||||||
| Wells Fargo & Co. |
500 | 07/15/19 | USD | 48.00 | USD | 2,366 | (36,975 | ) | ||||||||||||||||
| Microsoft Corp. |
170 | 07/16/19 | USD | 129.50 | USD | 2,277 | (96,774 | ) | ||||||||||||||||
| General Electric Co. |
370 | 07/17/19 | USD | 10.55 | USD | 389 | (8,800 | ) | ||||||||||||||||
| AXA Equitable Holdings, Inc. |
565 | 07/19/19 | USD | 22.28 | USD | 1,181 | (8,406 | ) | ||||||||||||||||
| Alcon, Inc. |
84 | 07/19/19 | USD | 60.00 | USD | 521 | (21,420 | ) | ||||||||||||||||
| Altria Group, Inc. |
487 | 07/19/19 | USD | 52.50 | USD | 2,306 | (2,191 | ) | ||||||||||||||||
| American International Group, Inc. |
512 | 07/19/19 | USD | 52.50 | USD | 2,728 | (76,544 | ) | ||||||||||||||||
| American International Group, Inc. |
682 | 07/19/19 | USD | 53.00 | USD | 3,634 | (80,135 | ) | ||||||||||||||||
| Anthem, Inc. |
307 | 07/19/19 | USD | 280.00 | USD | 8,664 | (234,855 | ) | ||||||||||||||||
| Arthur J Gallagher & Co. |
613 | 07/19/19 | USD | 85.00 | USD | 5,369 | (186,965 | ) | ||||||||||||||||
| 42 | 2019 BLACKROCK SEMI-ANNUAL REPORT TO SHAREHOLDERS |
| Schedule of Investments (unaudited) (continued) June 30, 2019 |
BlackRock Enhanced Equity Dividend Trust (BDJ) |
Exchange-Traded Options Written (continued)
| Description | Number of Contracts |
Expiration Date |
Exercise Price |
Notional Amount (000) |
Value | |||||||||||||||||||
| Call (continued) | ||||||||||||||||||||||||
| BCE, Inc. |
361 | 07/19/19 | USD | 45.16 | USD | 1,642 | $ | (25,584 | ) | |||||||||||||||
| Baker Hughes a GE Co. |
548 | 07/19/19 | USD | 25.00 | USD | 1,350 | (32,880 | ) | ||||||||||||||||
| Baker Hughes a GE Co. |
605 | 07/19/19 | USD | 24.00 | USD | 1,490 | (69,575 | ) | ||||||||||||||||
| Bank of America Corp. |
1,394 | 07/19/19 | USD | 29.00 | USD | 4,043 | (105,247 | ) | ||||||||||||||||
| CVS Health Corp. |
407 | 07/19/19 | USD | 55.00 | USD | 2,218 | (42,532 | ) | ||||||||||||||||
| Charles Schwab Corp. |
200 | 07/19/19 | USD | 45.00 | USD | 804 | (2,000 | ) | ||||||||||||||||
| Citigroup, Inc. |
891 | 07/19/19 | USD | 67.50 | USD | 6,240 | (305,168 | ) | ||||||||||||||||
| Cognizant Technology Solutions Corp., Class A |
438 | 07/19/19 | USD | 65.00 | USD | 2,776 | (26,280 | ) | ||||||||||||||||
| Comcast Corp., Class A |
890 | 07/19/19 | USD | 43.10 | USD | 3,763 | (30,394 | ) | ||||||||||||||||
| Conagra Brands, Inc. |
809 | 07/19/19 | USD | 31.00 | USD | 2,145 | (4,045 | ) | ||||||||||||||||
| Constellation Software, Inc. |
111 | 07/19/19 | USD | 190.00 | USD | 2,186 | (103,785 | ) | ||||||||||||||||
| Corteva, Inc. |
485 | 07/19/19 | USD | 28.00 | USD | 1,434 | (88,513 | ) | ||||||||||||||||
| Dollar General Corp. |
140 | 07/19/19 | USD | 125.00 | USD | 1,892 | (144,200 | ) | ||||||||||||||||
| Dow, Inc. |
241 | 07/19/19 | USD | 52.50 | USD | 1,188 | (3,615 | ) | ||||||||||||||||
| Dow, Inc. |
119 | 07/19/19 | USD | 50.00 | USD | 587 | (10,115 | ) | ||||||||||||||||
| DuPont de Nemours, Inc. |
411 | 07/19/19 | USD | 32.50 | USD | 3,085 | (98,640 | ) | ||||||||||||||||
| DuPont de Nemours, Inc. |
361 | 07/19/19 | USD | 77.50 | USD | 2,710 | (27,436 | ) | ||||||||||||||||
| Enterprise Products Partners LP |
257 | 07/19/19 | USD | 29.00 | USD | 742 | (8,995 | ) | ||||||||||||||||
| FirstEnergy Corp. |
541 | 07/19/19 | USD | 42.00 | USD | 2,316 | (68,978 | ) | ||||||||||||||||
| FirstEnergy Corp. |
266 | 07/19/19 | USD | 45.00 | USD | 1,139 | (2,660 | ) | ||||||||||||||||
| General Electric Co. |
1,128 | 07/19/19 | USD | 11.00 | USD | 1,184 | (10,716 | ) | ||||||||||||||||
| General Motors Co. |
602 | 07/19/19 | USD | 37.00 | USD | 2,320 | (114,681 | ) | ||||||||||||||||
| Humana, Inc. |
148 | 07/19/19 | USD | 270.00 | USD | 3,926 | (68,080 | ) | ||||||||||||||||
| International Paper Co. |
274 | 07/19/19 | USD | 45.00 | USD | 1,187 | (10,823 | ) | ||||||||||||||||
| JPMorgan Chase & Co. |
118 | 07/19/19 | USD | 115.00 | USD | 1,319 | (8,260 | ) | ||||||||||||||||
| JPMorgan Chase & Co. |
629 | 07/19/19 | USD | 111.05 | USD | 7,032 | (143,198 | ) | ||||||||||||||||
| Kellogg Co. |
318 | 07/19/19 | USD | 60.00 | USD | 1,704 | (1,590 | ) | ||||||||||||||||
| Kellogg Co. |
254 | 07/19/19 | USD | 57.50 | USD | 1,361 | (1,905 | ) | ||||||||||||||||
| Lockheed Martin Corp. |
89 | 07/19/19 | USD | 345.00 | USD | 3,236 | (178,890 | ) | ||||||||||||||||
| Lowe’s Cos., Inc. |
45 | 07/19/19 | USD | 97.50 | USD | 454 | (19,687 | ) | ||||||||||||||||
| Marathon Oil Corp. |
511 | 07/19/19 | USD | 17.00 | USD | 726 | (766 | ) | ||||||||||||||||
| Marathon Oil Corp. |
230 | 07/19/19 | USD | 14.00 | USD | 327 | (14,490 | ) | ||||||||||||||||
| Marathon Petroleum Corp. |
1,116 | 07/19/19 | USD | 57.50 | USD | 6,236 | (126,108 | ) | ||||||||||||||||
| Marsh & McLennan Cos., Inc. |
108 | 07/19/19 | USD | 97.50 | USD | 1,077 | (26,163 | ) | ||||||||||||||||
| Marvell Technology Group Ltd. |
266 | 07/19/19 | USD | 24.00 | USD | 635 | (17,689 | ) | ||||||||||||||||
| Marvell Technology Group Ltd. |
267 | 07/19/19 | USD | 25.00 | USD | 637 | (8,143 | ) | ||||||||||||||||
| Mattel, Inc. |
534 | 07/19/19 | USD | 11.00 | USD | 599 | (32,040 | ) | ||||||||||||||||
| McKesson Corp. |
164 | 07/19/19 | USD | 130.00 | USD | 2,204 | (95,120 | ) | ||||||||||||||||
| Medtronic PLC |
726 | 07/19/19 | USD | 97.50 | USD | 7,071 | (92,928 | ) | ||||||||||||||||
| MetLife, Inc. |
712 | 07/19/19 | USD | 50.00 | USD | 3,537 | (56,604 | ) | ||||||||||||||||
| Microsoft Corp. |
227 | 07/19/19 | USD | 130.00 | USD | 3,041 | (125,985 | ) | ||||||||||||||||
| Morgan Stanley |
929 | 07/19/19 | USD | 44.00 | USD | 4,070 | (104,513 | ) | ||||||||||||||||
| Motorola Solutions, Inc. |
333 | 07/19/19 | USD | 150.00 | USD | 5,552 | (578,588 | ) | ||||||||||||||||
| Newell Brands, Inc. |
1,194 | 07/19/19 | USD | 16.35 | USD | 1,841 | (18,597 | ) | ||||||||||||||||
| NextEra Energy, Inc. |
183 | 07/19/19 | USD | 198.50 | USD | 3,749 | (137,110 | ) | ||||||||||||||||
| Northrop Grumman Corp. |
95 | 07/19/19 | USD | 315.00 | USD | 3,070 | (109,250 | ) | ||||||||||||||||
| Novo Nordisk A/S |
377 | 07/19/19 | USD | 47.31 | USD | 1,924 | (144,982 | ) | ||||||||||||||||
| ONEOK, Inc. |
322 | 07/19/19 | USD | 67.50 | USD | 2,216 | (66,815 | ) | ||||||||||||||||
| Oracle Corp. |
776 | 07/19/19 | USD | 52.50 | USD | 4,421 | (356,960 | ) | ||||||||||||||||
| Pentair PLC |
490 | 07/19/19 | USD | 37.72 | USD | 1,823 | (31,971 | ) | ||||||||||||||||
| Pfizer, Inc. |
523 | 07/19/19 | USD | 43.00 | USD | 2,266 | (49,947 | ) | ||||||||||||||||
| Public Service Enterprise Group, Inc. |
315 | 07/19/19 | USD | 60.97 | USD | 1,853 | (6,286 | ) | ||||||||||||||||
| QUALCOMM, Inc. |
300 | 07/19/19 | USD | 67.50 | USD | 2,282 | (267,750 | ) | ||||||||||||||||
| Quest Diagnostics, Inc. |
265 | 07/19/19 | USD | 100.00 | USD | 2,698 | (66,250 | ) | ||||||||||||||||
| State Street Corp. |
573 | 07/19/19 | USD | 57.50 | USD | 3,212 | (66,468 | ) | ||||||||||||||||
| Suncor Energy, Inc. |
319 | 07/19/19 | USD | 34.00 | USD | 994 | (797 | ) | ||||||||||||||||
| TOTAL SA — ADR |
97 | 07/19/19 | USD | 55.00 | USD | 541 | (15,035 | ) | ||||||||||||||||
| Taiwan Semiconductor Manufacturing Co. Ltd. — ADR |
552 | 07/19/19 | USD | 40.00 | USD | 2,162 | (41,400 | ) | ||||||||||||||||
| Travelers Cos., Inc. |
275 | 07/19/19 | USD | 148.09 | USD | 4,112 | (85,586 | ) | ||||||||||||||||
| Unilever NV — NY Shares |
170 | 07/19/19 | USD | 60.00 | USD | 1,032 | (22,525 | ) | ||||||||||||||||
| Unilever NV — NY Shares |
652 | 07/19/19 | USD | 62.50 | USD | 3,959 | (14,670 | ) | ||||||||||||||||
| Union Pacific Corp. |
105 | 07/19/19 | USD | 175.00 | USD | 1,776 | (16,852 | ) | ||||||||||||||||
| SCHEDULES OF INVESTMENTS | 43 |
| Schedule of Investments (unaudited) (continued) June 30, 2019 |
BlackRock Enhanced Equity Dividend Trust (BDJ) |
Exchange-Traded Options Written (continued)
| Description | Number of Contracts |
Expiration Date |
Exercise Price |
Notional Amount (000) |
Value | |||||||||||||||||||
| Call (continued) | ||||||||||||||||||||||||
| UnitedHealth Group, Inc. |
60 | 07/19/19 | USD | 250.00 | USD | 1,464 | $ | (21,750 | ) | |||||||||||||||
| Verizon Communications, Inc. |
776 | 07/19/19 | USD | 57.50 | USD | 4,433 | (38,800 | ) | ||||||||||||||||
| Verizon Communications, Inc. |
304 | 07/19/19 | USD | 58.00 | USD | 1,737 | (8,548 | ) | ||||||||||||||||
| Wells Fargo & Co. |
227 | 07/19/19 | USD | 47.50 | USD | 1,074 | (24,289 | ) | ||||||||||||||||
| Williams Cos., Inc. |
445 | 07/19/19 | USD | 29.00 | USD | 1,248 | (7,342 | ) | ||||||||||||||||
| Arthur J Gallagher & Co. |
694 | 07/23/19 | USD | 87.31 | USD | 6,079 | (112,059 | ) | ||||||||||||||||
| Comcast Corp., Class A |
702 | 07/23/19 | USD | 42.21 | USD | 2,968 | (63,169 | ) | ||||||||||||||||
| Verizon Communications, Inc. |
475 | 07/24/19 | USD | 59.00 | USD | 2,714 | (8,618 | ) | ||||||||||||||||
| BCE, Inc. |
435 | 07/25/19 | USD | 46.82 | USD | 1,978 | (5,152 | ) | ||||||||||||||||
| Baker Hughes a GE Co. |
149 | 07/25/19 | USD | 25.25 | USD | 367 | (8,932 | ) | ||||||||||||||||
| Motorola Solutions, Inc. |
277 | 07/25/19 | USD | 163.68 | USD | 4,618 | (150,513 | ) | ||||||||||||||||
| AXA Equitable Holdings, Inc. |
413 | 07/26/19 | USD | 21.21 | USD | 863 | (22,851 | ) | ||||||||||||||||
| American International Group, Inc. |
287 | 07/26/19 | USD | 54.00 | USD | 1,529 | (24,395 | ) | ||||||||||||||||
| Anthem, Inc. |
233 | 07/26/19 | USD | 292.50 | USD | 6,575 | (104,268 | ) | ||||||||||||||||
| Bank of America Corp. |
1,704 | 07/26/19 | USD | 28.50 | USD | 4,942 | (193,404 | ) | ||||||||||||||||
| CVS Health Corp. |
372 | 07/26/19 | USD | 57.00 | USD | 2,027 | (16,926 | ) | ||||||||||||||||
| Citigroup, Inc. |
847 | 07/26/19 | USD | 70.50 | USD | 5,932 | (145,261 | ) | ||||||||||||||||
| Cognizant Technology Solutions Corp., Class A |
268 | 07/26/19 | USD | 65.50 | USD | 1,699 | (17,420 | ) | ||||||||||||||||
| Cognizant Technology Solutions Corp., Class A |
239 | 07/26/19 | USD | 66.00 | USD | 1,515 | (13,145 | ) | ||||||||||||||||
| Comcast Corp., Class A |
498 | 07/26/19 | USD | 44.00 | USD | 2,106 | (15,687 | ) | ||||||||||||||||
| Dow, Inc. |
149 | 07/26/19 | USD | 51.50 | USD | 735 | (9,312 | ) | ||||||||||||||||
| DuPont de Nemours, Inc. |
236 | 07/26/19 | USD | 78.00 | USD | 1,772 | (24,780 | ) | ||||||||||||||||
| Enterprise Products Partners LP |
770 | 07/26/19 | USD | 29.00 | USD | 2,223 | (34,650 | ) | ||||||||||||||||
| General Electric Co. |
315 | 07/26/19 | USD | 10.50 | USD | 331 | (10,867 | ) | ||||||||||||||||
| General Electric Co. |
945 | 07/26/19 | USD | 11.00 | USD | 992 | (13,230 | ) | ||||||||||||||||
| General Electric Co. |
370 | 07/26/19 | USD | 10.60 | USD | 389 | (13,471 | ) | ||||||||||||||||
| General Motors Co. |
282 | 07/26/19 | USD | 36.50 | USD | 1,087 | (68,667 | ) | ||||||||||||||||
| Goldman Sachs Group, Inc. |
161 | 07/26/19 | USD | 200.00 | USD | 3,294 | (142,888 | ) | ||||||||||||||||
| International Paper Co. |
211 | 07/26/19 | USD | 44.50 | USD | 914 | (17,302 | ) | ||||||||||||||||
| JPMorgan Chase & Co. |
790 | 07/26/19 | USD | 113.20 | USD | 8,832 | (120,789 | ) | ||||||||||||||||
| Johnson Controls International PLC |
655 | 07/26/19 | USD | 40.00 | USD | 2,706 | (115,608 | ) | ||||||||||||||||
| Lowe’s Cos., Inc. |
124 | 07/26/19 | USD | 100.00 | USD | 1,251 | (34,596 | ) | ||||||||||||||||
| Marathon Oil Corp. |
222 | 07/26/19 | USD | 15.00 | USD | 315 | (6,105 | ) | ||||||||||||||||
| Marathon Oil Corp. |
310 | 07/26/19 | USD | 14.50 | USD | 441 | (14,105 | ) | ||||||||||||||||
| Marathon Petroleum Corp. |
814 | 07/26/19 | USD | 50.50 | USD | 4,549 | (447,700 | ) | ||||||||||||||||
| Marvell Technology Group Ltd. |
291 | 07/26/19 | USD | 25.00 | USD | 695 | (11,785 | ) | ||||||||||||||||
| Medtronic PLC |
73 | 07/26/19 | USD | 99.00 | USD | 711 | (6,752 | ) | ||||||||||||||||
| Microsoft Corp. |
711 | 07/26/19 | USD | 136.00 | USD | 9,525 | (194,814 | ) | ||||||||||||||||
| Mondelez International, Inc., Class A |
382 | 07/26/19 | USD | 56.00 | USD | 2,059 | (15,471 | ) | ||||||||||||||||
| Morgan Stanley |
982 | 07/26/19 | USD | 45.00 | USD | 4,302 | (77,087 | ) | ||||||||||||||||
| Morgan Stanley & Co. LLC |
271 | 07/26/19 | USD | 44.00 | USD | 1,187 | (33,604 | ) | ||||||||||||||||
| NextEra Energy, Inc. |
132 | 07/26/19 | USD | 200.05 | USD | 2,704 | (89,647 | ) | ||||||||||||||||
| Northrop Grumman Corp. |
99 | 07/26/19 | USD | 327.50 | USD | 3,199 | (70,785 | ) | ||||||||||||||||
| Pentair PLC |
475 | 07/26/19 | USD | 36.00 | USD | 1,767 | (80,056 | ) | ||||||||||||||||
| Pfizer, Inc. |
896 | 07/26/19 | USD | 43.00 | USD | 3,881 | (96,768 | ) | ||||||||||||||||
| Procter & Gamble Co. |
118 | 07/26/19 | USD | 111.00 | USD | 1,294 | (11,505 | ) | ||||||||||||||||
| Procter & Gamble Co. |
17 | 07/26/19 | USD | 114.00 | USD | 186 | (544 | ) | ||||||||||||||||
| QUALCOMM, Inc. |
36 | 07/26/19 | USD | 73.00 | USD | 274 | (16,560 | ) | ||||||||||||||||
| Suncor Energy, Inc. |
352 | 07/26/19 | USD | 32.00 | USD | 1,097 | (16,720 | ) | ||||||||||||||||
| UnitedHealth Group, Inc. |
61 | 07/26/19 | USD | 252.50 | USD | 1,488 | (20,435 | ) | ||||||||||||||||
| Verizon Communications, Inc. |
475 | 07/26/19 | USD | 59.00 | USD | 2,714 | (9,975 | ) | ||||||||||||||||
| Verizon Communications, Inc. |
609 | 07/26/19 | USD | 58.00 | USD | 3,479 | (26,491 | ) | ||||||||||||||||
| Verizon Communications, Inc. |
1,810 | 07/26/19 | USD | 57.89 | USD | 10,341 | (71,929 | ) | ||||||||||||||||
| Wells Fargo & Co. |
250 | 07/26/19 | USD | 48.50 | USD | 1,183 | (18,875 | ) | ||||||||||||||||
| Williams Cos., Inc. |
99 | 07/26/19 | USD | 28.50 | USD | 278 | (4,207 | ) | ||||||||||||||||
| Williams Cos., Inc. |
1,585 | 07/26/19 | USD | 27.06 | USD | 4,444 | (214,663 | ) | ||||||||||||||||
| Baker Hughes a GE Co. |
134 | 07/29/19 | USD | 24.25 | USD | 330 | (15,863 | ) | ||||||||||||||||
| Baker Hughes a GE Co. |
469 | 07/29/19 | USD | 25.75 | USD | 1,155 | (25,207 | ) | ||||||||||||||||
| Corteva, Inc |
166 | 07/29/19 | USD | 26.50 | USD | 491 | (52,727 | ) | ||||||||||||||||
| Willis Towers Watson PLC |
220 | 07/29/19 | USD | 190.89 | USD | 4,214 | (26,343 | ) | ||||||||||||||||
| AXA Equitable Holdings, Inc. |
518 | 07/31/19 | USD | 22.50 | USD | 1,083 | (11,140 | ) | ||||||||||||||||
| American International Group, Inc. |
682 | 07/31/19 | USD | 53.00 | USD | 3,634 | (102,517 | ) | ||||||||||||||||
| 44 | 2019 BLACKROCK SEMI-ANNUAL REPORT TO SHAREHOLDERS |
| Schedule of Investments (unaudited) (continued) June 30, 2019 |
BlackRock Enhanced Equity Dividend Trust (BDJ) |
Exchange-Traded Options Written (continued)
| Description | Number of Contracts |
Expiration Date |
Exercise Price |
Notional Amount (000) |
Value | |||||||||||||||||||
| Call (continued) | ||||||||||||||||||||||||
| Marathon Oil Corp. |
199 | 07/31/19 | USD | 15.00 | USD | 283 | $ | (6,357 | ) | |||||||||||||||
| Novartis ADR Representing AG |
170 | 07/31/19 | USD | 92.62 | USD | 1,552 | (25,640 | ) | ||||||||||||||||
| Verizon Communications, Inc. |
799 | 07/31/19 | USD | 58.50 | USD | 4,565 | (43,495 | ) | ||||||||||||||||
| NextEra Energy, Inc. |
132 | 08/01/19 | USD | 203.00 | USD | 2,704 | (69,856 | ) | ||||||||||||||||
| State Street Corp. |
575 | 08/01/19 | USD | 57.21 | USD | 3,223 | (112,993 | ) | ||||||||||||||||
| Altria Group, Inc. |
562 | 08/02/19 | USD | 52.00 | USD | 2,661 | (14,050 | ) | ||||||||||||||||
| American International Group, Inc. |
794 | 08/02/19 | USD | 55.00 | USD | 4,230 | (51,610 | ) | ||||||||||||||||
| Bank of America Corp. |
1,592 | 08/02/19 | USD | 29.00 | USD | 4,617 | (147,260 | ) | ||||||||||||||||
| CVS Health Corp. |
407 | 08/02/19 | USD | 56.00 | USD | 2,218 | (35,002 | ) | ||||||||||||||||
| Charles Schwab Corp. |
296 | 08/02/19 | USD | 42.00 | USD | 1,190 | (19,240 | ) | ||||||||||||||||
| Citigroup, Inc. |
442 | 08/02/19 | USD | 71.00 | USD | 3,095 | (73,593 | ) | ||||||||||||||||
| Cognizant Technology Solutions Corp., Class A |
732 | 08/02/19 | USD | 66.00 | USD | 4,640 | (75,030 | ) | ||||||||||||||||
| Comcast Corp., Class A |
700 | 08/02/19 | USD | 44.00 | USD | 2,960 | (28,350 | ) | ||||||||||||||||
| Constellation Software, Inc. |
90 | 08/02/19 | USD | 190.00 | USD | 1,772 | (94,950 | ) | ||||||||||||||||
| Dollar General Corp. |
89 | 08/02/19 | USD | 138.00 | USD | 1,203 | (14,907 | ) | ||||||||||||||||
| Dow, Inc. |
122 | 08/02/19 | USD | 51.50 | USD | 602 | (9,455 | ) | ||||||||||||||||
| Enterprise Products Partners LP |
1,051 | 08/02/19 | USD | 29.00 | USD | 3,034 | (49,923 | ) | ||||||||||||||||
| FedEx Corp. |
438 | 08/02/19 | USD | 170.00 | USD | 7,192 | (126,144 | ) | ||||||||||||||||
| General Electric Co. |
1,538 | 08/02/19 | USD | 11.00 | USD | 1,615 | (40,757 | ) | ||||||||||||||||
| General Motors Co. |
264 | 08/02/19 | USD | 38.50 | USD | 1,017 | (35,112 | ) | ||||||||||||||||
| General Motors Co. |
294 | 08/02/19 | USD | 37.00 | USD | 1,133 | (67,179 | ) | ||||||||||||||||
| Goldman Sachs Group, Inc. |
149 | 08/02/19 | USD | 200.00 | USD | 3,049 | (141,923 | ) | ||||||||||||||||
| Humana, Inc. |
115 | 08/02/19 | USD | 255.00 | USD | 3,051 | (188,600 | ) | ||||||||||||||||
| International Paper Co. |
274 | 08/02/19 | USD | 44.00 | USD | 1,187 | (32,195 | ) | ||||||||||||||||
| JPMorgan Chase & Co. |
339 | 08/02/19 | USD | 113.00 | USD | 3,790 | (65,936 | ) | ||||||||||||||||
| JPMorgan Chase & Co. |
260 | 08/02/19 | USD | 113.10 | USD | 2,907 | (49,452 | ) | ||||||||||||||||
| Johnson Controls International PLC |
419 | 08/02/19 | USD | 40.00 | USD | 1,731 | (82,543 | ) | ||||||||||||||||
| Lockheed Martin Corp. |
58 | 08/02/19 | USD | 365.00 | USD | 2,109 | (48,720 | ) | ||||||||||||||||
| Lowe’s Cos., Inc. |
338 | 08/02/19 | USD | 103.00 | USD | 3,411 | (54,925 | ) | ||||||||||||||||
| Marathon Oil Corp. |
586 | 08/02/19 | USD | 13.50 | USD | 833 | (65,925 | ) | ||||||||||||||||
| Marathon Oil Corp. |
105 | 08/02/19 | USD | 15.00 | USD | 149 | (3,937 | ) | ||||||||||||||||
| Marathon Petroleum Corp. |
362 | 08/02/19 | USD | 50.50 | USD | 2,023 | (225,345 | ) | ||||||||||||||||
| Marathon Petroleum Corp. |
141 | 08/02/19 | USD | 52.00 | USD | 788 | (73,320 | ) | ||||||||||||||||
| Marvell Technology Group Ltd. |
285 | 08/02/19 | USD | 26.00 | USD | 680 | (10,260 | ) | ||||||||||||||||
| Marvell Technology Group Ltd. |
283 | 08/02/19 | USD | 25.00 | USD | 676 | (14,008 | ) | ||||||||||||||||
| Mattel, Inc. |
211 | 08/02/19 | USD | 12.50 | USD | 237 | (6,857 | ) | ||||||||||||||||
| McKesson Corp. |
48 | 08/02/19 | USD | 139.00 | USD | 645 | (13,560 | ) | ||||||||||||||||
| Medtronic PLC |
72 | 08/02/19 | USD | 99.00 | USD | 701 | (8,208 | ) | ||||||||||||||||
| MetLife, Inc. |
751 | 08/02/19 | USD | 50.00 | USD | 3,730 | (87,492 | ) | ||||||||||||||||
| Microsoft Corp. |
259 | 08/02/19 | USD | 138.00 | USD | 3,470 | (59,052 | ) | ||||||||||||||||
| ONEOK, Inc. |
322 | 08/02/19 | USD | 67.00 | USD | 2,216 | (103,040 | ) | ||||||||||||||||
| Oracle Corp. |
998 | 08/02/19 | USD | 55.50 | USD | 5,686 | (218,063 | ) | ||||||||||||||||
| Pentair PLC |
145 | 08/02/19 | USD | 36.64 | USD | 539 | (21,022 | ) | ||||||||||||||||
| PepsiCo, Inc. |
348 | 08/02/19 | USD | 133.00 | USD | 4,563 | (68,382 | ) | ||||||||||||||||
| Pfizer, Inc. |
322 | 08/02/19 | USD | 43.50 | USD | 1,395 | (30,912 | ) | ||||||||||||||||
| Pfizer, Inc. |
194 | 08/02/19 | USD | 44.50 | USD | 840 | (10,282 | ) | ||||||||||||||||
| Pfizer, Inc. |
307 | 08/02/19 | USD | 43.00 | USD | 1,330 | (37,761 | ) | ||||||||||||||||
| Procter & Gamble Co. |
94 | 08/02/19 | USD | 114.00 | USD | 1,031 | (8,413 | ) | ||||||||||||||||
| QUALCOMM, Inc. |
372 | 08/02/19 | USD | 77.00 | USD | 2,830 | (115,506 | ) | ||||||||||||||||
| Suncor Energy, Inc. |
532 | 08/02/19 | USD | 32.00 | USD | 1,658 | (30,856 | ) | ||||||||||||||||
| Taiwan Semiconductor Manufacturing Co. Ltd. — ADR |
265 | 08/02/19 | USD | 40.63 | USD | 1,038 | (20,881 | ) | ||||||||||||||||
| Union Pacific Corp. |
62 | 08/02/19 | USD | 177.50 | USD | 1,048 | (10,199 | ) | ||||||||||||||||
| UnitedHealth Group, Inc. |
40 | 08/02/19 | USD | 257.50 | USD | 976 | (10,040 | ) | ||||||||||||||||
| Verizon Communications, Inc. |
304 | 08/02/19 | USD | 59.00 | USD | 1,737 | (13,528 | ) | ||||||||||||||||
| Verizon Communications, Inc. |
388 | 08/02/19 | USD | 58.00 | USD | 2,217 | (28,906 | ) | ||||||||||||||||
| Wells Fargo & Co. |
574 | 08/02/19 | USD | 46.50 | USD | 2,716 | (110,208 | ) | ||||||||||||||||
| Williams Cos., Inc. |
445 | 08/02/19 | USD | 28.00 | USD | 1,248 | (35,822 | ) | ||||||||||||||||
| Williams Cos., Inc. |
793 | 08/02/19 | USD | 27.50 | USD | 2,224 | (88,023 | ) | ||||||||||||||||
| Travelers Cos., Inc. |
407 | 08/05/19 | USD | 147.50 | USD | 6,085 | (190,263 | ) | ||||||||||||||||
| Conagra Brands, Inc. |
599 | 08/06/19 | USD | 30.25 | USD | 1,589 | (20,632 | ) | ||||||||||||||||
| American International Group, Inc. |
683 | 08/09/19 | USD | 54.00 | USD | 3,639 | (104,499 | ) | ||||||||||||||||
| Bank of America Corp. |
1,657 | 08/09/19 | USD | 29.73 | USD | 4,805 | (114,002 | ) | ||||||||||||||||
| SCHEDULES OF INVESTMENTS | 45 |
| Schedule of Investments (unaudited) (continued) June 30, 2019 |
BlackRock Enhanced Equity Dividend Trust (BDJ) |
Exchange-Traded Options Written (continued)
| Description | Number of Contracts |
Expiration Date |
Exercise Price |
Notional Amount (000) |
Value | |||||||||||||||||||
| Call (continued) | ||||||||||||||||||||||||
| Comcast Corp., Class A |
201 | 08/09/19 | USD | 43.00 | USD | 850 | $ | (18,592 | ) | |||||||||||||||
| Dollar General Corp. |
162 | 08/09/19 | USD | 138.00 | USD | 2,190 | (32,805 | ) | ||||||||||||||||
| Enterprise Products Partners LP |
3,337 | 08/09/19 | USD | 29.00 | USD | 9,634 | (158,508 | ) | ||||||||||||||||
| General Electric Co. |
1,435 | 08/09/19 | USD | 10.94 | USD | 1,507 | (45,554 | ) | ||||||||||||||||
| JPMorgan Chase & Co. |
578 | 08/09/19 | USD | 112.84 | USD | 6,462 | (132,592 | ) | ||||||||||||||||
| Lowe’s Cos., Inc. |
337 | 08/09/19 | USD | 103.00 | USD | 3,401 | (64,873 | ) | ||||||||||||||||
| Marathon Oil Corp. |
485 | 08/09/19 | USD | 14.88 | USD | 689 | (22,777 | ) | ||||||||||||||||
| Mattel, Inc. |
535 | 08/09/19 | USD | 12.00 | USD | 600 | (24,075 | ) | ||||||||||||||||
| McKesson Corp. |
93 | 08/09/19 | USD | 135.00 | USD | 1,250 | (46,965 | ) | ||||||||||||||||
| Medtronic PLC |
637 | 08/09/19 | USD | 99.00 | USD | 6,204 | (85,040 | ) | ||||||||||||||||
| MetLife, Inc. |
157 | 08/09/19 | USD | 50.00 | USD | 780 | (20,488 | ) | ||||||||||||||||
| Microsoft Corp. |
96 | 08/09/19 | USD | 137.00 | USD | 1,286 | (28,896 | ) | ||||||||||||||||
| Morgan Stanley |
498 | 08/09/19 | USD | 46.00 | USD | 2,182 | (29,631 | ) | ||||||||||||||||
| Motorola Solutions, Inc. |
333 | 08/09/19 | USD | 158.75 | USD | 5,552 | (329,301 | ) | ||||||||||||||||
| Pfizer, Inc. |
81 | 08/09/19 | USD | 42.75 | USD | 351 | (9,882 | ) | ||||||||||||||||
| Pfizer, Inc. |
268 | 08/09/19 | USD | 43.05 | USD | 1,161 | (28,405 | ) | ||||||||||||||||
| Pfizer, Inc. |
242 | 08/09/19 | USD | 43.64 | USD | 1,048 | (20,917 | ) | ||||||||||||||||
| Pfizer, Inc. |
194 | 08/09/19 | USD | 44.47 | USD | 840 | (10,854 | ) | ||||||||||||||||
| Suncor Energy, Inc. |
203 | 08/09/19 | USD | 32.50 | USD | 633 | (9,541 | ) | ||||||||||||||||
| Verizon Communications, Inc. |
388 | 08/09/19 | USD | 59.00 | USD | 2,217 | (20,952 | ) | ||||||||||||||||
| Wells Fargo & Co. |
1,193 | 08/09/19 | USD | 48.50 | USD | 5,645 | (112,739 | ) | ||||||||||||||||
| FirstEnergy Corp. |
959 | 08/12/19 | USD | 44.00 | USD | 4,105 | (41,058 | ) | ||||||||||||||||
| AXA Equitable Holdings, Inc. |
478 | 08/16/19 | USD | 20.43 | USD | 999 | (217,597 | ) | ||||||||||||||||
| Alcon, Inc. |
84 | 08/16/19 | USD | 60.00 | USD | 521 | (27,720 | ) | ||||||||||||||||
| Altria Group, Inc. |
1,201 | 08/16/19 | USD | 50.00 | USD | 5,687 | (99,083 | ) | ||||||||||||||||
| American International Group, Inc. |
558 | 08/16/19 | USD | 55.00 | USD | 2,973 | (64,728 | ) | ||||||||||||||||
| Baker Hughes a GE Co. |
469 | 08/16/19 | USD | 26.00 | USD | 1,155 | (31,657 | ) | ||||||||||||||||
| Baker Hughes a GE Co. |
235 | 08/16/19 | USD | 27.00 | USD | 579 | (8,812 | ) | ||||||||||||||||
| Bank of America Corp. |
1,413 | 08/16/19 | USD | 28.00 | USD | 4,098 | (242,330 | ) | ||||||||||||||||
| Charles Schwab Corp. |
296 | 08/16/19 | USD | 42.00 | USD | 1,190 | (23,680 | ) | ||||||||||||||||
| Cognizant Technology Solutions Corp., Class A |
896 | 08/16/19 | USD | 67.50 | USD | 5,680 | (82,880 | ) | ||||||||||||||||
| Corteva, Inc. |
281 | 08/16/19 | USD | 30.00 | USD | 831 | (31,612 | ) | ||||||||||||||||
| Corteva, Inc. |
281 | 08/16/19 | USD | 31.00 | USD | 831 | (20,372 | ) | ||||||||||||||||
| Dollar General Corp. |
162 | 08/16/19 | USD | 135.00 | USD | 2,190 | (60,750 | ) | ||||||||||||||||
| DuPont de Nemours, Inc. |
17 | 08/16/19 | USD | 77.50 | USD | 128 | (3,383 | ) | ||||||||||||||||
| FirstEnergy Corp. |
515 | 08/16/19 | USD | 43.99 | USD | 2,205 | (24,323 | ) | ||||||||||||||||
| FirstEnergy Corp. |
266 | 08/16/19 | USD | 44.65 | USD | 1,139 | (9,099 | ) | ||||||||||||||||
| General Electric Co. |
1,369 | 08/16/19 | USD | 11.00 | USD | 1,437 | (45,862 | ) | ||||||||||||||||
| General Motors Co. |
262 | 08/16/19 | USD | 38.00 | USD | 1,009 | (47,815 | ) | ||||||||||||||||
| Goldman Sachs Group, Inc. |
61 | 08/16/19 | USD | 205.00 | USD | 1,248 | (45,750 | ) | ||||||||||||||||
| Humana, Inc. |
208 | 08/16/19 | USD | 270.00 | USD | 5,518 | (197,600 | ) | ||||||||||||||||
| JPMorgan Chase & Co. |
377 | 08/16/19 | USD | 112.40 | USD | 4,215 | (107,500 | ) | ||||||||||||||||
| Johnson Controls International PLC |
419 | 08/16/19 | USD | 41.00 | USD | 1,731 | (64,526 | ) | ||||||||||||||||
| Kellogg Co. |
127 | 08/16/19 | USD | 55.00 | USD | 680 | (17,145 | ) | ||||||||||||||||
| Marathon Oil Corp. |
710 | 08/16/19 | USD | 15.00 | USD | 1,009 | (35,145 | ) | ||||||||||||||||
| Marsh & McLennan Cos., Inc. |
708 | 08/16/19 | USD | 100.00 | USD | 7,062 | (153,990 | ) | ||||||||||||||||
| Marvell Technology Group Ltd. |
457 | 08/16/19 | USD | 26.00 | USD | 1,091 | (17,823 | ) | ||||||||||||||||
| Mattel, Inc. |
287 | 08/16/19 | USD | 13.00 | USD | 322 | (7,175 | ) | ||||||||||||||||
| McKesson Corp. |
90 | 08/16/19 | USD | 130.00 | USD | 1,210 | (75,150 | ) | ||||||||||||||||
| Medtronic PLC |
688 | 08/16/19 | USD | 100.00 | USD | 6,700 | (80,152 | ) | ||||||||||||||||
| MetLife, Inc. |
1,558 | 08/16/19 | USD | 50.00 | USD | 7,739 | (216,562 | ) | ||||||||||||||||
| Newell Brands, Inc. |
1,490 | 08/16/19 | USD | 16.00 | USD | 2,298 | (119,200 | ) | ||||||||||||||||
| Oracle Corp. |
995 | 08/16/19 | USD | 55.00 | USD | 5,669 | (270,640 | ) | ||||||||||||||||
| Pfizer, Inc. |
194 | 08/16/19 | USD | 45.00 | USD | 840 | (9,312 | ) | ||||||||||||||||
| Pfizer, Inc. |
888 | 08/16/19 | USD | 43.90 | USD | 3,847 | (72,669 | ) | ||||||||||||||||
| Procter & Gamble Co. |
83 | 08/16/19 | USD | 115.00 | USD | 910 | (7,594 | ) | ||||||||||||||||
| Public Service Enterprise Group, Inc. |
614 | 08/16/19 | USD | 61.05 | USD | 3,612 | (43,362 | ) | ||||||||||||||||
| QUALCOMM, Inc. |
360 | 08/16/19 | USD | 82.50 | USD | 2,739 | (52,020 | ) | ||||||||||||||||
| Quest Diagnostics, Inc. |
207 | 08/16/19 | USD | 105.00 | USD | 2,107 | (33,120 | ) | ||||||||||||||||
| State Street Corp. |
558 | 08/16/19 | USD | 65.00 | USD | 3,128 | (12,555 | ) | ||||||||||||||||
| TOTAL SA — ADR |
277 | 08/16/19 | USD | 55.00 | USD | 1,545 | (58,863 | ) | ||||||||||||||||
| Travelers Cos., Inc. |
275 | 08/16/19 | USD | 149.85 | USD | 4,112 | (94,230 | ) | ||||||||||||||||
| 46 | 2019 BLACKROCK SEMI-ANNUAL REPORT TO SHAREHOLDERS |
| Schedule of Investments (unaudited) (continued) June 30, 2019 |
BlackRock Enhanced Equity Dividend Trust (BDJ) |
Exchange-Traded Options Written (continued)
| Description | Number of Contracts |
Expiration Date |
Exercise Price |
Notional Amount (000) |
Value | |||||||||||||||||||
| Call (continued) | ||||||||||||||||||||||||
| Unilever NV — NY Shares |
998 | 08/16/19 | USD | 62.50 | USD | 6,060 | $ | (67,365 | ) | |||||||||||||||
| Union Pacific Corp. |
42 | 08/16/19 | USD | 175.00 | USD | 710 | (12,873 | ) | ||||||||||||||||
| Wells Fargo & Co. |
635 | 08/16/19 | USD | 47.50 | USD | 3,005 | (93,345 | ) | ||||||||||||||||
| Williams Cos., Inc. |
497 | 08/16/19 | USD | 29.00 | USD | 1,394 | (24,104 | ) | ||||||||||||||||
| Williams Cos., Inc. |
793 | 08/16/19 | USD | 28.00 | USD | 2,224 | (75,732 | ) | ||||||||||||||||
| Willis Towers Watson PLC |
305 | 08/16/19 | USD | 191.50 | USD | 5,842 | (161,827 | ) | ||||||||||||||||
| FirstEnergy Corp. |
426 | 08/23/19 | USD | 43.55 | USD | 1,824 | (31,167 | ) | ||||||||||||||||
| FirstEnergy Corp. |
541 | 08/23/19 | USD | 42.95 | USD | 2,316 | (51,265 | ) | ||||||||||||||||
| General Electric Co. |
1,182 | 08/23/19 | USD | 10.95 | USD | 1,241 | (41,087 | ) | ||||||||||||||||
| Pfizer, Inc. |
655 | 08/23/19 | USD | 44.06 | USD | 2,837 | (54,862 | ) | ||||||||||||||||
| Bank of America Corp. |
1,781 | 09/20/19 | USD | 31.00 | USD | 5,165 | (88,160 | ) | ||||||||||||||||
| Conagra Brands, Inc. |
599 | 09/20/19 | USD | 30.00 | USD | 1,589 | (17,970 | ) | ||||||||||||||||
| Pfizer, Inc. |
256 | 09/20/19 | USD | 44.00 | USD | 1,109 | (28,032 | ) | ||||||||||||||||
| Williams Cos., Inc. |
200 | 09/20/19 | USD | 29.00 | USD | 561 | (14,400 | ) | ||||||||||||||||
|
|
|
|||||||||||||||||||||||
| $ | (20,780,855 | ) | ||||||||||||||||||||||
|
|
|
|||||||||||||||||||||||
OTC Options Written
| Description | Counterparty | Number of Contracts |
Expiration Date |
Exercise Price |
Notional Amount (000) |
Value | ||||||||||||||||||||||||
| Call | ||||||||||||||||||||||||||||||
| Willis Towers Watson PLC |
Barclays Bank PLC | 20,800 | 07/02/19 | USD | 178.70 | USD | 3,984 | $ | (268,107 | ) | ||||||||||||||||||||
| Alcon, Inc. |
UBS AG | 29,000 | 07/09/19 | CHF | 59.49 | CHF | 1,748 | (37,527 | ) | |||||||||||||||||||||
| BAE Systems PLC |
UBS AG | 327,000 | 07/09/19 | GBP | 4.73 | GBP | 1,619 | (93,024 | ) | |||||||||||||||||||||
| BAE Systems PLC |
UBS AG | 131,500 | 07/09/19 | GBP | 4.74 | GBP | 651 | (36,409 | ) | |||||||||||||||||||||
| Koninklijke Philips NV |
UBS AG | 184,500 | 07/09/19 | EUR | 36.97 | EUR | 7,053 | (285,170 | ) | |||||||||||||||||||||
| Nestle SA, Registered Shares |
UBS AG | 800 | 07/09/19 | CHF | 99.68 | CHF | 81 | (1,437 | ) | |||||||||||||||||||||
| CRH PLC |
Goldman Sachs International | 45,000 | 07/10/19 | GBP | 25.92 | GBP | 1,158 | (24,202 | ) | |||||||||||||||||||||
| BAE Systems PLC |
UBS AG | 815,700 | 07/16/19 | GBP | 4.73 | GBP | 4,038 | (244,698 | ) | |||||||||||||||||||||
| Bayer AG |
UBS AG | 60,700 | 07/16/19 | EUR | 60.00 | EUR | 3,703 | (145,684 | ) | |||||||||||||||||||||
| Diageo PLC |
Goldman Sachs International | 99,000 | 07/16/19 | GBP | 34.30 | GBP | 3,355 | (34,285 | ) | |||||||||||||||||||||
| AstraZeneca PLC |
Morgan Stanley & Co. International PLC | 41,700 | 07/17/19 | GBP | 60.47 | GBP | 2,684 | (214,485 | ) | |||||||||||||||||||||
| BP PLC |
Credit Suisse International | 178,100 | 07/17/19 | GBP | 5.56 | GBP | 978 | (14,542 | ) | |||||||||||||||||||||
| CRH PLC |
Goldman Sachs International | 45,000 | 07/17/19 | GBP | 25.16 | GBP | 1,158 | (56,858 | ) | |||||||||||||||||||||
| Koninklijke Philips NV |
Goldman Sachs International | 97,000 | 07/17/19 | EUR | 36.59 | EUR | 3,708 | (192,845 | ) | |||||||||||||||||||||
| Koninklijke Philips NV |
Deutsche Bank AG | 248,000 | 07/17/19 | EUR | 36.11 | EUR | 9,481 | (628,847 | ) | |||||||||||||||||||||
| Nestle SA, Registered Shares |
Goldman Sachs International | 53,200 | 07/17/19 | CHF | 100.32 | CHF | 5,376 | (85,193 | ) | |||||||||||||||||||||
| AstraZeneca PLC |
UBS AG | 151,200 | 07/23/19 | GBP | 60.79 | GBP | 9,733 | (758,401 | ) | |||||||||||||||||||||
| BP PLC |
Goldman Sachs International | 915,000 | 07/23/19 | GBP | 5.59 | GBP | 5,023 | (79,139 | ) | |||||||||||||||||||||
| Diageo PLC |
Deutsche Bank AG | 52,500 | 07/23/19 | GBP | 33.69 | GBP | 1,779 | (50,065 | ) | |||||||||||||||||||||
| BAE Systems PLC |
UBS AG | 131,500 | 07/24/19 | GBP | 4.74 | GBP | 651 | (40,080 | ) | |||||||||||||||||||||
| Imperial Brands PLC |
Goldman Sachs International | 20,350 | 07/24/19 | GBP | 19.66 | GBP | 376 | (5,384 | ) | |||||||||||||||||||||
| Nestle SA, Registered Shares |
UBS AG | 42,000 | 07/24/19 | CHF | 99.80 | CHF | 4,245 | (89,216 | ) | |||||||||||||||||||||
| Koninklijke Philips NV |
UBS AG | 25,000 | 07/30/19 | EUR | 38.30 | EUR | 956 | (24,414 | ) | |||||||||||||||||||||
| Siemens AG, Registered Shares |
Morgan Stanley & Co. International PLC | 39,500 | 07/30/19 | EUR | 107.92 | EUR | 4,136 | (48,949 | ) | |||||||||||||||||||||
| Alcon, Inc. |
UBS AG | 43,400 | 07/31/19 | CHF | 59.51 | CHF | 2,616 | (84,835 | ) | |||||||||||||||||||||
| Imperial Brands PLC |
Goldman Sachs International | 20,350 | 08/01/19 | GBP | 20.05 | GBP | 376 | (4,999 | ) | |||||||||||||||||||||
| BP PLC |
Goldman Sachs International | 1,336,000 | 08/02/19 | GBP | 5.58 | GBP | 7,335 | (165,888 | ) | |||||||||||||||||||||
| CRH PLC |
Goldman Sachs International | 46,600 | 08/02/19 | GBP | 25.63 | GBP | 1,199 | (53,926 | ) | |||||||||||||||||||||
| Diageo PLC |
Goldman Sachs International | 25,200 | 08/02/19 | GBP | 34.99 | GBP | 854 | (10,477 | ) | |||||||||||||||||||||
| Nestle SA, Registered Shares |
Morgan Stanley & Co. International PLC | 52,300 | 08/02/19 | CHF | 103.73 | CHF | 5,285 | (33,231 | ) | |||||||||||||||||||||
| Novo Nordisk A/S — ADR |
Bank of America N.A. | 66,600 | 08/05/19 | USD | 50.06 | USD | 3,399 | (126,304 | ) | |||||||||||||||||||||
| CRH PLC |
Goldman Sachs International | 72,500 | 08/06/19 | GBP | 26.07 | GBP | 1,865 | (70,440 | ) | |||||||||||||||||||||
| Constellation Software, Inc. |
Morgan Stanley & Co. International PLC | 3,500 | 08/06/19 | CAD | 1,231.95 | CAD | 4,320 | (97,638 | ) | |||||||||||||||||||||
| Siemens AG, Registered Shares |
Morgan Stanley & Co. International PLC | 39,500 | 08/06/19 | EUR | 107.92 | EUR | 4,136 | (59,640 | ) | |||||||||||||||||||||
| BP PLC |
Credit Suisse International | 1,347,100 | 08/08/19 | GBP | 5.58 | GBP | 7,396 | (128,434 | ) | |||||||||||||||||||||
| Diageo PLC — ADR |
UBS AG | 15,800 | 08/08/19 | GBP | 34.74 | GBP | 535 | (9,373 | ) | |||||||||||||||||||||
| AstraZeneca PLC |
UBS AG | 41,700 | 08/09/19 | GBP | 66.81 | GBP | 2,684 | (36,425 | ) | |||||||||||||||||||||
| Diageo PLC |
UBS AG | 15,800 | 08/14/19 | GBP | 34.74 | GBP | 535 | (7,439 | ) | |||||||||||||||||||||
| Constellation Software, Inc. |
Credit Suisse International | 3,500 | 08/21/19 | CAD | 1,259.11 | CAD | 4,320 | (61,394 | ) | |||||||||||||||||||||
| Novartis AG — ADR |
Barclays Bank PLC | 32,800 | 08/21/19 | USD | 91.25 | USD | 2,995 | (78,676 | ) | |||||||||||||||||||||
|
|
|
|||||||||||||||||||||||||||||
| $ | (4,488,080 | ) | ||||||||||||||||||||||||||||
|
|
|
|||||||||||||||||||||||||||||
| SCHEDULES OF INVESTMENTS | 47 |
| Schedule of Investments (unaudited) (continued) June 30, 2019 |
BlackRock Enhanced Equity Dividend Trust (BDJ) |
Balances Reported in the Statements of Assets and Liabilities for Options Written
| Swap Premium Paid |
Swap Premium Received |
Unrealized Appreciation |
Unrealized Depreciation |
Value | ||||||||||||||||
| Options Written |
N/A | N/A | $ | 3,008,181 | $ | (9,278,209 | ) | $ | (25,268,935 | ) | ||||||||||
Derivative Financial Instruments Categorized by Risk Exposure
As of period end, the fair values of derivative financial instruments located in the Statements of Assets and Liabilities were as follows:
| Commodity Contracts |
Credit Contracts |
Equity Contracts |
Foreign Currency Exchange Contracts |
Interest Rate Contracts |
Other Contracts |
Total | ||||||||||||||||||||||
| Liabilities — Derivative Financial Instruments |
||||||||||||||||||||||||||||
| Options written |
||||||||||||||||||||||||||||
| Options written, at value |
$ | — | $ | — | $ | 25,268,935 | $ | — | $ | — | $ | — | $ | 25,268,935 | ||||||||||||||
|
|
|
|
|
|
|
|
|
|
|
|
|
|
|
|||||||||||||||
For the six months ended June, 2019, the effect of derivative financial instruments in the Statements of Operations was as follows:
| Commodity Contracts |
Credit Contracts |
Equity Contracts |
Foreign Currency Exchange Contracts |
Interest Rate Contracts |
Other Contracts |
Total | ||||||||||||||||||||||
| Net Realized Gain (Loss) from: |
||||||||||||||||||||||||||||
| Options purchased(a) |
$ | — | $ | — | $ | 77,762 | $ | — | $ | — | $ | — | $ | 77,762 | ||||||||||||||
| Options written |
— | — | (29,369,272 | ) | — | — | — | (29,369,272 | ) | |||||||||||||||||||
|
|
|
|
|
|
|
|
|
|
|
|
|
|
|
|||||||||||||||
| $ | — | $ | — | $ | (29,291,510 | ) | $ | — | $ | — | $ | — | $ | (29,291,510 | ) | |||||||||||||
|
|
|
|
|
|
|
|
|
|
|
|
|
|
|
|||||||||||||||
| (a) | Options purchased are included in net realized gain (loss) from investments. |
| Commodity Contracts |
Credit Contracts |
Equity Contracts |
Foreign Currency Exchange Contracts |
Interest Rate Contracts |
Other Contracts |
Total | ||||||||||||||||||||||
| Net Change in Unrealized Appreciation on: |
||||||||||||||||||||||||||||
| Options purchased(a) |
$ | — | $ | — | $ | 21,427 | $ | — | $ | — | $ | — | $ | 21,427 | ||||||||||||||
| Options written |
— | — | (19,651,452 | ) | — | — | — | (19,651,452 | ) | |||||||||||||||||||
|
|
|
|
|
|
|
|
|
|
|
|
|
|
|
|||||||||||||||
| $ | — | $ | — | $ | (19,630,025 | ) | $ | — | $ | — | $ | — | $ | (19,630,025 | ) | |||||||||||||
|
|
|
|
|
|
|
|
|
|
|
|
|
|
|
|||||||||||||||
| (a) | Options purchased are included in net change in unrealized appreciation (depreciation) from investments. |
Average Quarterly Balances of Outstanding Derivative Financial Instruments
| Options: |
||||
| Average value of option contracts purchased |
$ | — | (a) | |
| Average value of option contracts written |
$ | 23,034,416 |
| (a) | Derivative not held at quarter-end. The risk exposure table serves as an indicator of activity during the period. |
For more information about the Trust’s investment risks regarding derivative financial instruments, refer to the Notes to Financial Statements.
Derivative Financial Instruments — Offsetting as of Period End
| Assets | Liabilities | |||||||
| Options |
$ | — | $ | 25,268,935 | (a) | |||
| Derivatives not subject to a Master Netting Agreement or similar agreement (“MNA”) |
— | (20,780,855 | ) | |||||
|
|
|
|
|
|||||
| Total derivative assets and liabilities subject to an MNA |
$ | — | $ | 4,488,080 | ||||
|
|
|
|
|
|||||
| (a) | Includes unrealized appreciation (depreciation) on OTC swaps and swap premiums (paid/received) in the Statements of Assets and Liabilities. |
| 48 | 2019 BLACKROCK SEMI-ANNUAL REPORT TO SHAREHOLDERS |
| Schedule of Investments (unaudited) (continued) June 30, 2019 |
BlackRock Enhanced Equity Dividend Trust (BDJ) |
The following table presents the Trust’s derivative assets (and liabilities) by counterparty net of amounts available for offset under an MNA and net of the related collateral received (and pledged) by the Trust:
| Counterparty | Derivative Liabilities Subject to an MNA by Counterparty |
Derivatives Available for Offset |
Non-cash Collateral Pledged (a) |
Cash Collateral Pledged |
Net Amount of Derivative Liabilities (b) |
|||||||||||||||
| Bank of America N.A. |
$ | 126,304 | $ | — | $ | — | $ | — | $ | 126,304 | ||||||||||
| Barclays Bank PLC |
346,783 | — | — | — | 346,783 | |||||||||||||||
| Credit Suisse International |
204,370 | — | (204,370 | ) | — | — | ||||||||||||||
| Deutsche Bank AG |
678,912 | — | (678,912 | ) | — | — | ||||||||||||||
| Goldman Sachs International |
783,636 | — | (783,636 | ) | — | — | ||||||||||||||
| Morgan Stanley & Co. International PLC |
453,943 | — | (453,943 | ) | — | — | ||||||||||||||
| UBS AG |
1,894,132 | — | (1,894,132 | ) | — | — | ||||||||||||||
|
|
|
|
|
|
|
|
|
|
|
|||||||||||
| $ | 4,488,080 | $ | — | $ | (4,014,993 | ) | $ | — | $ | 473,087 | ||||||||||
|
|
|
|
|
|
|
|
|
|
|
|||||||||||
| (a) | Excess of collateral pledged to the individual counterparty is not shown for financial reporting purposes. |
| (b) | Net amount represents the net amount payable due to counterparty in the event of default. Net amount may be offset further by the options written receivable/payable on the Statements of Assets and Liabilities. |
Fair Value Hierarchy as of Period End
Various inputs are used in determining the fair value of investments and derivative financial instruments. For information about the Trust’s policy regarding valuation of investments and derivative financial instruments, refer to the Notes to Financial Statements.
The following tables summarize the Trust’s investments and derivative financial instruments categorized in the disclosure hierarchy:
| Level 1 | Level 2 | Level 3 | Total | |||||||||||||
| Assets: |
| |||||||||||||||
| Investments: |
| |||||||||||||||
| Common Stocks: |
| |||||||||||||||
| Aerospace & Defense |
$ | 23,554,948 | $ | 17,098,142 | $ | — | $ | 40,653,090 | ||||||||
| Air Freight & Logistics |
12,414,406 | — | — | 12,414,406 | ||||||||||||
| Automobiles |
15,187,755 | — | — | 15,187,755 | ||||||||||||
| Banks |
262,132,137 | — | — | 262,132,137 | ||||||||||||
| Beverages |
29,709,529 | 13,787,035 | — | 43,496,564 | ||||||||||||
| Building Products |
13,003,975 | — | — | 13,003,975 | ||||||||||||
| Capital Markets |
64,661,123 | — | — | 64,661,123 | ||||||||||||
| Chemicals |
30,828,061 | — | — | 30,828,061 | ||||||||||||
| Communications Equipment |
24,207,529 | — | — | 24,207,529 | ||||||||||||
| Construction Materials |
— | 11,784,389 | — | 11,784,389 | ||||||||||||
| Containers & Packaging |
5,062,808 | — | — | 5,062,808 | ||||||||||||
| Diversified Financial Services |
15,162,574 | — | — | 15,162,574 | ||||||||||||
| Diversified Telecommunication Services |
88,005,891 | — | — | 88,005,891 | ||||||||||||
| Electric Utilities |
43,845,947 | — | — | 43,845,947 | ||||||||||||
| Energy Equipment & Services |
11,863,778 | — | — | 11,863,778 | ||||||||||||
| Food Products |
22,116,015 | 26,473,735 | — | 48,589,750 | ||||||||||||
| Health Care Equipment & Supplies |
57,809,239 | 41,562,937 | — | 99,372,176 | ||||||||||||
| Health Care Providers & Services |
118,517,954 | — | — | 118,517,954 | ||||||||||||
| Household Durables |
11,828,065 | 13,657,732 | — | 25,485,797 | ||||||||||||
| Household Products |
8,899,194 | — | — | 8,899,194 | ||||||||||||
| Industrial Conglomerates |
17,781,152 | 16,227,242 | — | 34,008,394 | ||||||||||||
| Insurance |
158,629,496 | — | — | 158,629,496 | ||||||||||||
| IT Services |
34,613,412 | — | — | 34,613,412 | ||||||||||||
| Leisure Products |
4,057,975 | — | — | 4,057,975 | ||||||||||||
| Machinery |
10,170,852 | — | — | 10,170,852 | ||||||||||||
| Media |
34,659,241 | — | — | 34,659,241 | ||||||||||||
| Multi-Utilities |
6,396,734 | — | — | 6,396,734 | ||||||||||||
| Multiline Retail |
26,809,932 | — | — | 26,809,932 | ||||||||||||
| Oil, Gas & Consumable Fuels |
129,101,155 | 45,359,044 | — | 174,460,199 | ||||||||||||
| Personal Products |
19,056,365 | — | — | 19,056,365 | ||||||||||||
| Pharmaceuticals |
59,411,011 | 49,956,104 | — | 109,367,115 | ||||||||||||
| Road & Rail |
9,101,500 | — | — | 9,101,500 | ||||||||||||
| Semiconductors & Semiconductor Equipment |
40,496,616 | — | — | 40,496,616 | ||||||||||||
| SCHEDULES OF INVESTMENTS | 49 |
| Schedule of Investments (unaudited) (continued) June 30, 2019 |
BlackRock Enhanced Equity Dividend Trust (BDJ) |
Fair Value Hierarchy as of Period End (continued)
| Level 1 | Level 2 | Level 3 | Total | |||||||||||||
| Software |
$ | 84,935,555 | $ | — | $ | — | $ | 84,935,555 | ||||||||
| Specialty Retail |
14,689,469 | — | — | 14,689,469 | ||||||||||||
| Technology Hardware, Storage & Peripherals |
— | 30,547,953 | — | 30,547,953 | ||||||||||||
| Tobacco |
23,556,152 | 1,648,661 | — | 25,204,813 | ||||||||||||
| Short-Term Securities |
27,764,789 | — | — | 27,764,789 | ||||||||||||
|
|
|
|
|
|
|
|
|
|||||||||
| $ | 1,560,042,334 | $ | 268,102,974 | $ | — | $ | 1,828,145,308 | |||||||||
|
|
|
|
|
|
|
|
|
|||||||||
| Derivative Financial Instruments(a) |
| |||||||||||||||
| Liabilities: |
| |||||||||||||||
| Equity contracts |
$ | (15,736,613 | ) | $ | (9,532,322 | ) | $ | — | $ | (25,268,935 | ) | |||||
|
|
|
|
|
|
|
|
|
|||||||||
| (a) | Derivative financial instruments are options written which are shown at value. |
See notes to financial statements.
| 50 | 2019 BLACKROCK SEMI-ANNUAL REPORT TO SHAREHOLDERS |
| Schedule of Investments (unaudited) June 30, 2019 |
BlackRock Enhanced Global Dividend Trust (BOE) (Percentages shown are based on Net Assets) |
| SCHEDULES OF INVESTMENTS | 51 |
| Schedule of Investments (unaudited) (continued) June 30, 2019 |
BlackRock Enhanced Global Dividend Trust (BOE) |
| (g) | During the six months ended June 30, 2019, investments in issuers considered to be an affiliate/affiliates of the Trust for purposes of Section 2(a)(3) of the Investment Company Act of 1940, as amended, were as follows: |
| Affiliate | Shares Held at 12/31/18 |
Net Activity |
Shares Held at 06/30/19 |
Value at 06/30/19 |
Income | Net Realized Gain (Loss) (a) |
Change in Unrealized Appreciation (Depreciation) |
|||||||||||||||||||||
| BlackRock Liquidity Funds, T-Fund, Institutional Class |
19,702,446 | (18,785,823 | ) | 916,623 | $ | 916,623 | $ | 72,591 | $ | — | $ | — | ||||||||||||||||
|
|
|
|
|
|
|
|
|
|||||||||||||||||||||
| (a) | Includes net capital gain distributions, if applicable. |
Derivative Financial Instruments Outstanding as of Period End
Exchange-Traded Options Written
| Description | Number of Contracts |
Expiration Date |
Exercise Price |
Notional Amount (000) |
Value | |||||||||||||||||||
| Call | ||||||||||||||||||||||||
| Pfizer, Inc. |
119 | 07/02/19 | USD | 42.75 | USD | 516 | $ | (8,250 | ) | |||||||||||||||
| Wells Fargo & Co. |
50 | 07/02/19 | USD | 48.00 | USD | 237 | (1,167 | ) | ||||||||||||||||
| Microsoft Corp. |
24 | 07/05/19 | USD | 132.00 | USD | 322 | (6,480 | ) | ||||||||||||||||
| PepsiCo, Inc. |
158 | 07/05/19 | USD | 129.00 | USD | 2,072 | (38,552 | ) | ||||||||||||||||
| U.S. Bancorp |
289 | 07/05/19 | USD | 53.00 | USD | 1,514 | (6,502 | ) | ||||||||||||||||
| Wells Fargo & Co. |
41 | 07/05/19 | USD | 47.50 | USD | 194 | (1,865 | ) | ||||||||||||||||
| Altria Group, Inc. |
37 | 07/12/19 | USD | 51.50 | USD | 175 | (148 | ) | ||||||||||||||||
| Cisco Systems, Inc. |
149 | 07/12/19 | USD | 55.00 | USD | 815 | (9,834 | ) | ||||||||||||||||
| Cisco Systems, Inc. |
59 | 07/12/19 | USD | 56.00 | USD | 323 | (1,976 | ) | ||||||||||||||||
| Genuine Parts Co. |
127 | 07/12/19 | USD | 103.00 | USD | 1,315 | (21,590 | ) | ||||||||||||||||
| Medtronic PLC |
75 | 07/12/19 | USD | 93.50 | USD | 730 | (30,375 | ) | ||||||||||||||||
| Microsoft Corp. |
49 | 07/12/19 | USD | 128.00 | USD | 656 | (31,483 | ) | ||||||||||||||||
| PepsiCo, Inc. |
400 | 07/12/19 | USD | 133.00 | USD | 5,245 | (49,000 | ) | ||||||||||||||||
| Pfizer, Inc. |
82 | 07/12/19 | USD | 42.50 | USD | 355 | (9,430 | ) | ||||||||||||||||
| Philip Morris International, Inc. |
292 | 07/12/19 | USD | 80.00 | USD | 2,293 | (20,002 | ) | ||||||||||||||||
| Procter & Gamble Co. |
156 | 07/12/19 | USD | 106.00 | USD | 1,711 | (60,840 | ) | ||||||||||||||||
| U.S. Bancorp |
166 | 07/12/19 | USD | 51.50 | USD | 870 | (21,497 | ) | ||||||||||||||||
| U.S. Bancorp |
72 | 07/12/19 | USD | 53.00 | USD | 377 | (2,988 | ) | ||||||||||||||||
| Wells Fargo & Co. |
45 | 07/12/19 | USD | 47.00 | USD | 213 | (4,342 | ) | ||||||||||||||||
| Wells Fargo & Co. |
168 | 07/12/19 | USD | 47.50 | USD | 795 | (11,424 | ) | ||||||||||||||||
| Wells Fargo & Co. |
37 | 07/12/19 | USD | 48.05 | USD | 175 | (1,607 | ) | ||||||||||||||||
| Wells Fargo & Co. |
99 | 07/15/19 | USD | 48.00 | USD | 468 | (7,321 | ) | ||||||||||||||||
| Microsoft Corp. |
25 | 07/16/19 | USD | 129.50 | USD | 335 | (14,231 | ) | ||||||||||||||||
| 3M Co. |
116 | 07/19/19 | USD | 180.00 | USD | 2,011 | (10,034 | ) | ||||||||||||||||
| AbbVie, Inc. |
320 | 07/19/19 | USD | 80.00 | USD | 2,327 | (5,920 | ) | ||||||||||||||||
| Altria Group, Inc. |
241 | 07/19/19 | USD | 52.50 | USD | 1,141 | (1,084 | ) | ||||||||||||||||
| Cisco Systems, Inc. |
59 | 07/19/19 | USD | 55.00 | USD | 323 | (4,985 | ) | ||||||||||||||||
| Cisco Systems, Inc. |
148 | 07/19/19 | USD | 57.50 | USD | 810 | (2,738 | ) | ||||||||||||||||
| Citizens Financial Group, Inc. |
233 | 07/19/19 | USD | 35.00 | USD | 824 | (27,960 | ) | ||||||||||||||||
| Coca-Cola Co. |
550 | 07/19/19 | USD | 50.00 | USD | 2,801 | (70,675 | ) | ||||||||||||||||
| Genuine Parts Co. |
337 | 07/19/19 | USD | 100.00 | USD | 3,491 | (156,705 | ) | ||||||||||||||||
| International Paper Co. |
841 | 07/19/19 | USD | 45.00 | USD | 3,643 | (33,220 | ) | ||||||||||||||||
| Johnson & Johnson |
135 | 07/19/19 | USD | 140.00 | USD | 1,880 | (28,958 | ) | ||||||||||||||||
| M&T Bank Corp. |
150 | 07/19/19 | USD | 170.00 | USD | 2,551 | (54,750 | ) | ||||||||||||||||
| Medtronic PLC |
116 | 07/19/19 | USD | 97.50 | USD | 1,130 | (14,848 | ) | ||||||||||||||||
| Microsoft Corp. |
57 | 07/19/19 | USD | 130.00 | USD | 764 | (31,635 | ) | ||||||||||||||||
| Paychex, Inc. |
269 | 07/19/19 | USD | 90.00 | USD | 2,214 | (1,345 | ) | ||||||||||||||||
| Pfizer, Inc. |
154 | 07/19/19 | USD | 43.00 | USD | 667 | (14,707 | ) | ||||||||||||||||
| Philip Morris International, Inc. |
162 | 07/19/19 | USD | 82.50 | USD | 1,272 | (11,745 | ) | ||||||||||||||||
| Procter & Gamble Co. |
109 | 07/19/19 | USD | 110.00 | USD | 1,195 | (14,006 | ) | ||||||||||||||||
| Rogers Communications, Inc., Class B |
401 | 07/19/19 | CAD | 72.00 | CAD | 2,811 | (9,799 | ) | ||||||||||||||||
| 52 | 2019 BLACKROCK SEMI-ANNUAL REPORT TO SHAREHOLDERS |
| Schedule of Investments (unaudited) (continued) June 30, 2019 |
BlackRock Enhanced Global Dividend Trust (BOE) |
Exchange-Traded Options Written (continued)
| Description | Number of Contracts |
Expiration Date |
Exercise Price |
Notional Amount (000) |
Value | |||||||||||||||||||
| Call (continued) | ||||||||||||||||||||||||
| Texas Instruments, Inc. |
136 | 07/19/19 | USD | 115.00 | USD | 1,561 | $ | (36,244 | ) | |||||||||||||||
| U.S. Bancorp |
73 | 07/19/19 | USD | 52.50 | USD | 383 | (6,643 | ) | ||||||||||||||||
| Wells Fargo & Co. |
45 | 07/19/19 | USD | 47.50 | USD | 213 | (4,815 | ) | ||||||||||||||||
| 3M Co. |
65 | 07/26/19 | USD | 177.50 | USD | 1,127 | (21,125 | ) | ||||||||||||||||
| AbbVie, Inc. |
179 | 07/26/19 | USD | 80.00 | USD | 1,302 | (7,339 | ) | ||||||||||||||||
| Cisco Systems, Inc. |
265 | 07/26/19 | USD | 56.00 | USD | 1,450 | (17,225 | ) | ||||||||||||||||
| Cisco Systems, Inc. |
265 | 07/26/19 | USD | 56.50 | USD | 1,450 | (12,057 | ) | ||||||||||||||||
| Coca-Cola Co. |
608 | 07/26/19 | USD | 52.00 | USD | 3,096 | (32,832 | ) | ||||||||||||||||
| Genuine Parts Co. |
285 | 07/26/19 | USD | 106.00 | USD | 2,952 | (37,763 | ) | ||||||||||||||||
| Hasbro, Inc. |
215 | 07/26/19 | USD | 110.00 | USD | 2,272 | (60,738 | ) | ||||||||||||||||
| International Paper Co. |
626 | 07/26/19 | USD | 44.50 | USD | 2,712 | (51,332 | ) | ||||||||||||||||
| Medtronic PLC |
102 | 07/26/19 | USD | 99.00 | USD | 993 | (9,435 | ) | ||||||||||||||||
| Pfizer, Inc. |
380 | 07/26/19 | USD | 43.00 | USD | 1,646 | (41,040 | ) | ||||||||||||||||
| Philip Morris International, Inc. |
423 | 07/26/19 | USD | 80.00 | USD | 3,322 | (73,179 | ) | ||||||||||||||||
| Procter & Gamble Co. |
72 | 07/26/19 | USD | 111.00 | USD | 789 | (7,020 | ) | ||||||||||||||||
| Procter & Gamble Co. |
23 | 07/26/19 | USD | 114.00 | USD | 252 | (736 | ) | ||||||||||||||||
| Texas Instruments, Inc. |
136 | 07/26/19 | USD | 115.00 | USD | 1,561 | (56,100 | ) | ||||||||||||||||
| United Technologies Corp. |
74 | 07/26/19 | USD | 137.00 | USD | 963 | (5,476 | ) | ||||||||||||||||
| Wells Fargo & Co. |
49 | 07/26/19 | USD | 48.50 | USD | 232 | (3,699 | ) | ||||||||||||||||
| AbbVie, Inc. |
124 | 08/02/19 | USD | 80.00 | USD | 902 | (5,890 | ) | ||||||||||||||||
| Altria Group, Inc. |
366 | 08/02/19 | USD | 52.00 | USD | 1,733 | (9,150 | ) | ||||||||||||||||
| Cisco Systems, Inc. |
530 | 08/02/19 | USD | 56.50 | USD | 2,901 | (34,980 | ) | ||||||||||||||||
| Coca-Cola Co. |
184 | 08/02/19 | USD | 52.00 | USD | 937 | (11,408 | ) | ||||||||||||||||
| Home Depot, Inc. |
88 | 08/02/19 | USD | 212.50 | USD | 1,830 | (23,144 | ) | ||||||||||||||||
| International Paper Co. |
841 | 08/02/19 | USD | 44.00 | USD | 3,643 | (98,818 | ) | ||||||||||||||||
| Johnson & Johnson |
163 | 08/02/19 | USD | 144.00 | USD | 2,270 | (20,049 | ) | ||||||||||||||||
| Medtronic PLC |
103 | 08/02/19 | USD | 99.00 | USD | 1,003 | (11,742 | ) | ||||||||||||||||
| Microsoft Corp. |
116 | 08/02/19 | USD | 138.00 | USD | 1,554 | (26,448 | ) | ||||||||||||||||
| PepsiCo, Inc. |
129 | 08/02/19 | USD | 133.00 | USD | 1,692 | (25,349 | ) | ||||||||||||||||
| Pfizer, Inc. |
118 | 08/02/19 | USD | 43.50 | USD | 511 | (11,328 | ) | ||||||||||||||||
| Pfizer, Inc. |
74 | 08/02/19 | USD | 44.50 | USD | 321 | (3,922 | ) | ||||||||||||||||
| Pfizer, Inc. |
129 | 08/02/19 | USD | 43.00 | USD | 559 | (15,867 | ) | ||||||||||||||||
| Philip Morris International, Inc. |
249 | 08/02/19 | USD | 79.00 | USD | 1,955 | (60,134 | ) | ||||||||||||||||
| Procter & Gamble Co. |
133 | 08/02/19 | USD | 114.00 | USD | 1,458 | (11,903 | ) | ||||||||||||||||
| Texas Instruments, Inc. |
80 | 08/02/19 | USD | 115.00 | USD | 918 | (33,400 | ) | ||||||||||||||||
| U.S. Bancorp |
280 | 08/02/19 | USD | 54.00 | USD | 1,467 | (14,420 | ) | ||||||||||||||||
| United Technologies Corp. |
162 | 08/02/19 | USD | 131.00 | USD | 2,109 | (49,491 | ) | ||||||||||||||||
| Wells Fargo & Co. |
120 | 08/02/19 | USD | 46.50 | USD | 568 | (23,040 | ) | ||||||||||||||||
| 3M Co. |
132 | 08/09/19 | USD | 180.00 | USD | 2,288 | (39,072 | ) | ||||||||||||||||
| AbbVie, Inc. |
112 | 08/09/19 | USD | 75.00 | USD | 814 | (16,968 | ) | ||||||||||||||||
| Cisco Systems, Inc. |
1,081 | 08/09/19 | USD | 57.00 | USD | 5,916 | (72,427 | ) | ||||||||||||||||
| Genuine Parts Co. |
300 | 08/09/19 | USD | 103.00 | USD | 3,107 | (94,500 | ) | ||||||||||||||||
| Hasbro, Inc. |
215 | 08/09/19 | USD | 109.00 | USD | 2,272 | (80,625 | ) | ||||||||||||||||
| Medtronic PLC |
214 | 08/09/19 | USD | 99.00 | USD | 2,084 | (28,569 | ) | ||||||||||||||||
| Microsoft Corp. |
66 | 08/09/19 | USD | 137.00 | USD | 884 | (19,866 | ) | ||||||||||||||||
| Pfizer, Inc. |
64 | 08/09/19 | USD | 42.75 | USD | 277 | (7,808 | ) | ||||||||||||||||
| Pfizer, Inc. |
113 | 08/09/19 | USD | 43.05 | USD | 490 | (11,977 | ) | ||||||||||||||||
| Pfizer, Inc. |
92 | 08/09/19 | USD | 43.64 | USD | 399 | (7,952 | ) | ||||||||||||||||
| Pfizer, Inc. |
74 | 08/09/19 | USD | 44.47 | USD | 321 | (4,140 | ) | ||||||||||||||||
| Texas Instruments, Inc. |
159 | 08/09/19 | USD | 120.00 | USD | 1,825 | (38,160 | ) | ||||||||||||||||
| U.S. Bancorp |
42 | 08/09/19 | USD | 53.00 | USD | 220 | (4,284 | ) | ||||||||||||||||
| Wells Fargo & Co. |
241 | 08/09/19 | USD | 48.50 | USD | 1,140 | (22,775 | ) | ||||||||||||||||
| Altria Group, Inc. |
554 | 08/16/19 | USD | 50.00 | USD | 2,623 | (45,705 | ) | ||||||||||||||||
| Coca-Cola Co. |
316 | 08/16/19 | USD | 50.00 | USD | 1,609 | (59,092 | ) | ||||||||||||||||
| Coca-Cola Co. |
242 | 08/16/19 | USD | 52.50 | USD | 1,232 | (14,278 | ) | ||||||||||||||||
| Home Depot, Inc. |
89 | 08/16/19 | USD | 210.00 | USD | 1,851 | (42,275 | ) | ||||||||||||||||
| Johnson & Johnson |
163 | 08/16/19 | USD | 145.00 | USD | 2,270 | (22,168 | ) | ||||||||||||||||
| Medtronic PLC |
153 | 08/16/19 | USD | 100.00 | USD | 1,490 | (17,825 | ) | ||||||||||||||||
| Microsoft Corp. |
36 | 08/16/19 | USD | 140.00 | USD | 482 | (7,236 | ) | ||||||||||||||||
| Paychex, Inc. |
350 | 08/16/19 | USD | 87.50 | USD | 2,880 | (9,625 | ) | ||||||||||||||||
| SCHEDULES OF INVESTMENTS | 53 |
| Schedule of Investments (unaudited) (continued) June 30, 2019 |
BlackRock Enhanced Global Dividend Trust (BOE) |
Exchange-Traded Options Written (continued)
| Description | Number of Contracts |
Expiration Date |
Exercise Price |
Notional Amount (000) |
Value | |||||||||||||||||||
| Call (continued) | ||||||||||||||||||||||||
| Pfizer, Inc. |
74 | 08/16/19 | USD | 45.00 | USD | 321 | $ | (3,552 | ) | |||||||||||||||
| Pfizer, Inc. |
394 | 08/16/19 | USD | 43.90 | USD | 1,707 | (32,243 | ) | ||||||||||||||||
| Procter & Gamble Co. |
56 | 08/16/19 | USD | 115.00 | USD | 614 | (5,124 | ) | ||||||||||||||||
| TELUS Corp. |
943 | 08/16/19 | CAD | 52.00 | CAD | 4,565 | (5,041 | ) | ||||||||||||||||
| U.S. Bancorp |
107 | 08/16/19 | USD | 52.50 | USD | 561 | (14,927 | ) | ||||||||||||||||
| United Technologies Corp. |
163 | 08/16/19 | USD | 135.00 | USD | 2,122 | (30,318 | ) | ||||||||||||||||
| Wells Fargo & Co. |
132 | 08/16/19 | USD | 47.50 | USD | 625 | (19,404 | ) | ||||||||||||||||
| Pfizer, Inc. |
286 | 08/23/19 | USD | 44.06 | USD | 1,239 | (23,955 | ) | ||||||||||||||||
| Pfizer, Inc. |
75 | 09/20/19 | USD | 44.00 | USD | 325 | (8,212 | ) | ||||||||||||||||
|
|
|
|||||||||||||||||||||||
| $ | (2,641,402 | ) | ||||||||||||||||||||||
|
|
|
|||||||||||||||||||||||
OTC Options Written
| Description | Counterparty | Number of Contracts |
Expiration Date |
Exercise Price |
Notional Amount (000) |
Value | ||||||||||||||||||||
| Call | ||||||||||||||||||||||||||
| TELUS Corp. |
Royal Bank of Canada | 41,500 | 07/02/19 | CAD | 49.19 | CAD | 1,532 | $ | (447 | ) | ||||||||||||||||
| Amcor PLC |
JPMorgan Chase Bank N.A. | 88,700 | 07/09/19 | AUD | 16.77 | AUD | 1,438 | (1,841 | ) | |||||||||||||||||
| Amcor PLC |
Morgan Stanley & Co. International PLC | 155,000 | 07/09/19 | AUD | 17.00 | AUD | 2,513 | (993 | ) | |||||||||||||||||
| BAE Systems PLC |
UBS AG | 82,500 | 07/09/19 | GBP | 4.73 | GBP | 408 | (23,469 | ) | |||||||||||||||||
| BAE Systems PLC |
UBS AG | 207,900 | 07/09/19 | GBP | 4.74 | GBP | 1,029 | (57,563 | ) | |||||||||||||||||
| GlaxoSmithKline PLC |
Goldman Sachs International | 50,000 | 07/09/19 | GBP | 15.75 | GBP | 789 | (14,261 | ) | |||||||||||||||||
| Imperial Brands PLC |
UBS AG | 107,600 | 07/09/19 | GBP | 21.85 | GBP | 1,988 | (16 | ) | |||||||||||||||||
| Koninklijke Philips NV |
UBS AG | 24,000 | 07/09/19 | EUR | 36.97 | EUR | 918 | (37,095 | ) | |||||||||||||||||
| Nestle SA, Registered Shares |
UBS AG | 35,300 | 07/09/19 | CHF | 99.68 | CHF | 3,567 | (63,411 | ) | |||||||||||||||||
| RELX PLC |
UBS AG | 69,700 | 07/09/19 | EUR | 20.93 | EUR | 1,483 | (34,900 | ) | |||||||||||||||||
| Sonic Healthcare Ltd. |
Goldman Sachs International | 87,100 | 07/09/19 | AUD | 26.69 | AUD | 2,364 | (38,702 | ) | |||||||||||||||||
| Sonic Healthcare Ltd. |
Morgan Stanley & Co. International PLC | 20,000 | 07/09/19 | AUD | 27.26 | AUD | 543 | (4,015 | ) | |||||||||||||||||
| United Overseas Bank Ltd. |
Morgan Stanley & Co. International PLC | 74,700 | 07/09/19 | SGD | 26.01 | SGD | 1,954 | (26,651 | ) | |||||||||||||||||
| Ansell Ltd. |
JPMorgan Chase Bank N.A. | 29,000 | 07/10/19 | AUD | 26.13 | AUD | 780 | (18,839 | ) | |||||||||||||||||
| Rogers Communications, Inc., Class B |
Credit Suisse International | 28,200 | 07/10/19 | CAD | 71.74 | CAD | 1,977 | (4,689 | ) | |||||||||||||||||
| Schneider Electric SE |
UBS AG | 11,000 | 07/10/19 | EUR | 75.42 | EUR | 875 | (54,201 | ) | |||||||||||||||||
| Svenska Handelsbanken AB, Class A |
Credit Suisse International | 117,200 | 07/10/19 | SEK | 103.99 | SEK | 10,740 | (3 | ) | |||||||||||||||||
| Taiwan Semiconductor Manufacturing Co. Ltd. |
UBS AG | 296,000 | 07/10/19 | USD | 234.62 | USD | 70,315 | (67,512 | ) | |||||||||||||||||
| ANTA Sports Products Ltd. |
Goldman Sachs International | 179,000 | 07/12/19 | HKD | 52.23 | HKD | 9,645 | (63,956 | ) | |||||||||||||||||
| Citizens Financial Group, Inc. |
Citibank N.A. | 28,700 | 07/12/19 | USD | 35.67 | USD | 1,015 | (19,449 | ) | |||||||||||||||||
| DBS Group Holdings Ltd. |
JPMorgan Chase Bank N.A. | 155,800 | 07/12/19 | SGD | 26.36 | SGD | 4,049 | (30,612 | ) | |||||||||||||||||
| Johnson & Johnson |
Bank of America N.A. | 14,300 | 07/12/19 | USD | 138.16 | USD | 1,992 | (33,303 | ) | |||||||||||||||||
| Novo Nordisk A/S, Class B |
Goldman Sachs International | 30,800 | 07/12/19 | DKK | 329.90 | DKK | 10,327 | (38,673 | ) | |||||||||||||||||
| BAE Systems PLC |
UBS AG | 144,500 | 07/16/19 | GBP | 4.73 | GBP | 715 | (43,348 | ) | |||||||||||||||||
| British American Tobacco PLC |
UBS AG | 57,400 | 07/16/19 | GBP | 30.46 | GBP | 1,578 | (2,799 | ) | |||||||||||||||||
| Cie Financiere Richemont SA, Registered Shares |
Citibank N.A. | 20,300 | 07/16/19 | CHF | 73.04 | CHF | 1,684 | (208,158 | ) | |||||||||||||||||
| Diageo PLC |
Goldman Sachs International | 9,400 | 07/16/19 | GBP | 34.30 | GBP | 319 | (3,255 | ) | |||||||||||||||||
| ANTA Sports Products Ltd. |
UBS AG | 175,000 | 07/17/19 | HKD | 51.88 | HKD | 9,429 | (72,100 | ) | |||||||||||||||||
| Ansell Ltd. |
Goldman Sachs International | 31,100 | 07/17/19 | AUD | 27.13 | AUD | 837 | (9,449 | ) | |||||||||||||||||
| AstraZeneca PLC |
Morgan Stanley & Co. International PLC | 33,100 | 07/17/19 | GBP | 60.47 | GBP | 2,131 | (170,251 | ) | |||||||||||||||||
| GlaxoSmithKline PLC |
Morgan Stanley & Co. International PLC | 164,000 | 07/17/19 | GBP | 15.82 | GBP | 2,588 | (46,782 | ) | |||||||||||||||||
| Koninklijke Philips NV |
Deutsche Bank AG | 27,000 | 07/17/19 | EUR | 36.11 | EUR | 1,032 | (68,463 | ) | |||||||||||||||||
| Schneider Electric SE |
Goldman Sachs International | 31,200 | 07/17/19 | EUR | 73.37 | EUR | 2,483 | (228,126 | ) | |||||||||||||||||
| Rogers Communications, Inc., Class B |
Morgan Stanley & Co. International PLC | 67,000 | 07/19/19 | CAD | 68.25 | CAD | 4,697 | (113,679 | ) | |||||||||||||||||
| Diageo PLC |
Deutsche Bank AG | 24,900 | 07/23/19 | GBP | 33.69 | GBP | 844 | (23,745 | ) | |||||||||||||||||
| GlaxoSmithKline PLC |
Morgan Stanley & Co. International PLC | 246,100 | 07/23/19 | GBP | 15.92 | GBP | 3,883 | (72,197 | ) | |||||||||||||||||
| Imperial Brands PLC |
UBS AG | 114,100 | 07/23/19 | GBP | 21.51 | GBP | 2,109 | (2,332 | ) | |||||||||||||||||
| RELX PLC |
Goldman Sachs International | 52,000 | 07/23/19 | EUR | 21.36 | EUR | 1,106 | (18,896 | ) | |||||||||||||||||
| Unilever PLC |
Deutsche Bank AG | 60,400 | 07/23/19 | GBP | 49.07 | GBP | 2,952 | (58,616 | ) | |||||||||||||||||
| Ansell Ltd. |
Morgan Stanley & Co. International PLC | 27,000 | 07/24/19 | AUD | 25.20 | AUD | 726 | (35,631 | ) | |||||||||||||||||
| BAE Systems PLC |
Goldman Sachs International | 172,500 | 07/24/19 | GBP | 4.51 | GBP | 854 | (98,370 | ) | |||||||||||||||||
| BAE Systems PLC |
UBS AG | 207,900 | 07/24/19 | GBP | 4.74 | GBP | 1,029 | (63,366 | ) | |||||||||||||||||
| British American Tobacco PLC |
Goldman Sachs International | 26,900 | 07/24/19 | GBP | 28.46 | GBP | 739 | (16,523 | ) | |||||||||||||||||
| 54 | 2019 BLACKROCK SEMI-ANNUAL REPORT TO SHAREHOLDERS |
| Schedule of Investments (unaudited) (continued) June 30, 2019 |
BlackRock Enhanced Global Dividend Trust (BOE) |
OTC Options Written (continued)
| Description | Counterparty | Number of Contracts |
Expiration Date |
Exercise Price |
Notional Amount (000) |
Value | ||||||||||||||||||||
| Call (continued) | ||||||||||||||||||||||||||
| Deutsche Post AG, Registered Shares |
Deutsche Bank AG | 73,200 | 07/24/19 | EUR | 27.48 | EUR | 2,118 | $ | (134,183 | ) | ||||||||||||||||
| Heineken NV |
Deutsche Bank AG | 19,100 | 07/24/19 | EUR | 97.54 | EUR | 1,872 | (51,092 | ) | |||||||||||||||||
| Novartis AG, Registered Shares |
Goldman Sachs International | 93,300 | 07/24/19 | CHF | 90.12 | CHF | 8,315 | (105,992 | ) | |||||||||||||||||
| Novo Nordisk A/S, Class B |
Goldman Sachs International | 37,100 | 07/24/19 | DKK | 325.44 | DKK | 12,439 | (79,130 | ) | |||||||||||||||||
| SGS SA, Registered Shares |
UBS AG | 733 | 07/24/19 | CHF | 2,593.34 | CHF | 1,824 | (6,862 | ) | |||||||||||||||||
| TELUS Corp. |
Goldman Sachs International | 21,700 | 07/24/19 | CAD | 50.81 | CAD | 801 | (603 | ) | |||||||||||||||||
| United Overseas Bank Ltd. |
JPMorgan Chase Bank N.A. | 73,800 | 07/24/19 | SGD | 24.16 | SGD | 1,931 | (115,912 | ) | |||||||||||||||||
| DBS Group Holdings Ltd. |
Morgan Stanley & Co. International PLC | 74,000 | 07/26/19 | SGD | 25.00 | SGD | 1,923 | (67,959 | ) | |||||||||||||||||
| Schneider Electric SE |
Goldman Sachs International | 8,500 | 07/26/19 | EUR | 74.45 | EUR | 676 | (54,344 | ) | |||||||||||||||||
| Koninklijke Philips NV |
UBS AG | 114,000 | 07/30/19 | EUR | 38.30 | EUR | 4,358 | (111,326 | ) | |||||||||||||||||
| Novo Nordisk A/S, Class B |
Morgan Stanley & Co. International PLC | 27,200 | 07/30/19 | DKK | 344.10 | DKK | 9,120 | (22,521 | ) | |||||||||||||||||
| United Overseas Bank Ltd. |
Morgan Stanley & Co. International PLC | 124,000 | 07/30/19 | SGD | 26.21 | SGD | 3,244 | (56,429 | ) | |||||||||||||||||
| ANTA Sports Products Ltd. |
JPMorgan Chase Bank N.A. | 200,000 | 07/31/19 | HKD | 50.15 | HKD | 10,776 | (127,354 | ) | |||||||||||||||||
| Deutsche Post AG, Registered Shares |
Goldman Sachs International | 84,700 | 07/31/19 | EUR | 28.89 | EUR | 2,450 | (60,636 | ) | |||||||||||||||||
| Deutsche Post AG, Registered Shares |
Morgan Stanley & Co. International PLC | 58,900 | 07/31/19 | EUR | 27.90 | EUR | 1,704 | (88,522 | ) | |||||||||||||||||
| GlaxoSmithKline PLC |
Goldman Sachs International | 31,900 | 07/31/19 | GBP | 16.14 | GBP | 503 | (7,562 | ) | |||||||||||||||||
| Heineken NV |
UBS AG | 24,000 | 07/31/19 | EUR | 100.53 | EUR | 2,352 | (33,977 | ) | |||||||||||||||||
| RELX PLC |
Goldman Sachs International | 52,000 | 07/31/19 | EUR | 21.56 | EUR | 1,106 | (17,070 | ) | |||||||||||||||||
| Svenska Handelsbanken AB, Class A |
UBS AG | 304,400 | 07/31/19 | SEK | 94.44 | SEK | 27,895 | (27,263 | ) | |||||||||||||||||
| Unilever PLC |
UBS AG | 66,300 | 07/31/19 | GBP | 49.96 | GBP | 3,241 | (44,819 | ) | |||||||||||||||||
| Imperial Brands PLC |
Goldman Sachs International | 86,200 | 08/01/19 | GBP | 20.85 | GBP | 1,593 | (8,813 | ) | |||||||||||||||||
| Ansell Ltd. |
Morgan Stanley & Co. International PLC | 31,100 | 08/02/19 | AUD | 26.63 | AUD | 837 | (19,282 | ) | |||||||||||||||||
| BAE Systems PLC |
UBS AG | 216,000 | 08/02/19 | GBP | 4.91 | GBP | 1,069 | (39,552 | ) | |||||||||||||||||
| British American Tobacco PLC |
Goldman Sachs International | 50,700 | 08/02/19 | GBP | 30.17 | GBP | 1,394 | (12,797 | ) | |||||||||||||||||
| Diageo PLC |
Goldman Sachs International | 53,900 | 08/02/19 | GBP | 34.99 | GBP | 1,827 | (22,408 | ) | |||||||||||||||||
| Kone OYJ, Class B |
Goldman Sachs International | 33,100 | 08/02/19 | EUR | 51.85 | EUR | 1,719 | (61,993 | ) | |||||||||||||||||
| Sanofi |
Goldman Sachs International | 18,700 | 08/02/19 | EUR | 78.10 | EUR | 1,421 | (17,822 | ) | |||||||||||||||||
| Sonic Healthcare Ltd. |
UBS AG | 34,300 | 08/02/19 | AUD | 27.64 | AUD | 931 | (9,474 | ) | |||||||||||||||||
| Citizens Financial Group, Inc. |
Credit Suisse International | 23,300 | 08/05/19 | USD | 35.67 | USD | 824 | (24,703 | ) | |||||||||||||||||
| Amcor PLC |
JPMorgan Chase Bank N.A. | 221,000 | 08/06/19 | AUD | 16.05 | AUD | 3,582 | (67,264 | ) | |||||||||||||||||
| BAE Systems PLC |
Credit Suisse International | 146,500 | 08/06/19 | GBP | 4.99 | GBP | 725 | (20,599 | ) | |||||||||||||||||
| Nestle SA, Registered Shares |
Morgan Stanley & Co. International PLC | 56,900 | 08/06/19 | CHF | 102.75 | CHF | 5,750 | (58,172 | ) | |||||||||||||||||
| Rogers Communications, Inc., Class B |
Citibank N.A. | 37,200 | 08/06/19 | CAD | 71.60 | CAD | 2,608 | (20,514 | ) | |||||||||||||||||
| SGS SA, Registered Shares |
Goldman Sachs International | 733 | 08/06/19 | CHF | 2,628.05 | CHF | 1,824 | (7,286 | ) | |||||||||||||||||
| Sanofi |
Credit Suisse International | 24,050 | 08/06/19 | EUR | 79.02 | EUR | 1,828 | (16,930 | ) | |||||||||||||||||
| Schneider Electric SE |
Morgan Stanley & Co. International PLC | 27,200 | 08/06/19 | EUR | 78.60 | EUR | 2,164 | (85,582 | ) | |||||||||||||||||
| Taiwan Semiconductor Manufacturing Co. Ltd. |
Citibank N.A. | 177,000 | 08/06/19 | USD | 239.80 | USD | 42,046 | (45,528 | ) | |||||||||||||||||
| Novo Nordisk A/S, Class B |
Goldman Sachs International | 13,000 | 08/07/19 | DKK | 334.14 | DKK | 4,359 | (21,235 | ) | |||||||||||||||||
| Ansell Ltd. |
JPMorgan Chase Bank N.A. | 32,300 | 08/08/19 | AUD | 27.23 | AUD | 869 | (16,678 | ) | |||||||||||||||||
| Deutsche Post AG, Registered Shares |
UBS AG | 65,400 | 08/08/19 | EUR | 28.69 | EUR | 1,892 | (63,405 | ) | |||||||||||||||||
| Diageo PLC |
Credit Suisse International | 29,000 | 08/08/19 | GBP | 34.53 | GBP | 983 | (19,985 | ) | |||||||||||||||||
| Kone OYJ, Class B |
Morgan Stanley & Co. International PLC | 27,400 | 08/08/19 | EUR | 52.51 | EUR | 1,423 | (44,494 | ) | |||||||||||||||||
| Sonic Healthcare Ltd. |
UBS AG | 79,400 | 08/08/19 | AUD | 28.48 | AUD | 2,155 | (11,003 | ) | |||||||||||||||||
| TELUS Corp. |
Goldman Sachs International | 35,000 | 08/08/19 | CAD | 50.50 | CAD | 1,292 | (3,527 | ) | |||||||||||||||||
| AstraZeneca PLC |
UBS AG | 33,200 | 08/09/19 | GBP | 66.81 | GBP | 2,137 | (29,000 | ) | |||||||||||||||||
| British American Tobacco PLC |
Morgan Stanley & Co. International PLC | 50,800 | 08/09/19 | GBP | 28.53 | GBP | 1,396 | (41,679 | ) | |||||||||||||||||
| Cie Financiere Richemont SA, Registered Shares |
UBS AG | 15,500 | 08/09/19 | CHF | 84.25 | CHF | 1,286 | (28,984 | ) | |||||||||||||||||
| DBS Group Holdings Ltd. |
Citibank N.A. | 68,000 | 08/13/19 | SGD | 26.61 | SGD | 1,767 | (23,717 | ) | |||||||||||||||||
| Rogers Communications, Inc., Class B |
Citibank N.A. | 37,200 | 08/13/19 | CAD | 71.60 | CAD | 2,608 | (23,423 | ) | |||||||||||||||||
| Amcor PLC |
UBS AG | 415,200 | 08/14/19 | AUD | 15.92 | AUD | 6,730 | (158,668 | ) | |||||||||||||||||
| Ansell Ltd. |
JPMorgan Chase Bank N.A. | 32,300 | 08/14/19 | AUD | 27.24 | AUD | 869 | (18,095 | ) | |||||||||||||||||
| Diageo PLC |
UBS AG | 24,900 | 08/14/19 | GBP | 34.74 | GBP | 844 | (11,723 | ) | |||||||||||||||||
| Kone OYJ, Class B |
Morgan Stanley & Co. International PLC | 38,800 | 08/14/19 | EUR | 52.95 | EUR | 2,015 | (59,670 | ) | |||||||||||||||||
| M&T Bank Corp. |
Barclays Bank PLC | 16,300 | 08/14/19 | USD | 170.65 | USD | 2,772 | (85,366 | ) | |||||||||||||||||
| Novo Nordisk A/S, Class B |
Goldman Sachs International | 13,000 | 08/14/19 | DKK | 356.38 | DKK | 4,359 | (7,441 | ) | |||||||||||||||||
| Sonic Healthcare Ltd. |
UBS AG | 68,900 | 08/14/19 | AUD | 27.75 | AUD | 1,870 | (23,000 | ) | |||||||||||||||||
| TELUS Corp. |
Royal Bank of Canada | 34,900 | 08/15/19 | CAD | 50.50 | CAD | 1,288 | (4,603 | ) | |||||||||||||||||
| TELUS Corp. |
Goldman Sachs International | 38,800 | 08/23/19 | CAD | 49.07 | CAD | 1,432 | (18,347 | ) | |||||||||||||||||
| TELUS Corp. |
Goldman Sachs International | 38,900 | 08/23/19 | CAD | 48.66 | CAD | 1,436 | (23,806 | ) | |||||||||||||||||
| TELUS Corp. |
Royal Bank of Canada | 21,700 | 09/04/19 | CAD | 48.84 | CAD | 801 | (13,597 | ) | |||||||||||||||||
|
|
|
|||||||||||||||||||||||||
| $ | (4,494,408 | ) | ||||||||||||||||||||||||
|
|
|
|||||||||||||||||||||||||
| SCHEDULES OF INVESTMENTS | 55 |
| Schedule of Investments (unaudited) (continued) June 30, 2019 |
BlackRock Enhanced Global Dividend Trust (BOE) |
Balances Reported in the Statements of Assets and Liabilities for Options Written
| Swap Premium Paid |
Swap Premium Received |
Unrealized Appreciation |
Unrealized Depreciation |
Value | ||||||||||||||||
| Options Written |
N/A | N/A | $ | 1,356,324 | $ | (2,446,772 | ) | $ | (7,135,810 | ) | ||||||||||
Derivative Financial Instruments Categorized by Risk Exposure
As of period end, the fair values of derivative financial instruments located in the Statements of Assets and Liabilities were as follows:
| Commodity Contracts |
Credit Contracts |
Equity Contracts |
Foreign Currency Exchange Contracts |
Interest Rate Contracts |
Other Contracts |
Total | ||||||||||||||||||||||
| Liabilities — Derivative Financial Instruments |
|
|||||||||||||||||||||||||||
| Options written |
||||||||||||||||||||||||||||
| Options written, at value |
$ | — | $ | — | $ | 7,135,810 | $ | — | $ | — | $ | — | $ | 7,135,810 | ||||||||||||||
|
|
|
|
|
|
|
|
|
|
|
|
|
|
|
|||||||||||||||
For the six month ended June 30, 2019, the effect of derivative financial instruments in the Statements of Operations was as follows:
| Commodity Contracts |
Credit Contracts |
Equity Contracts |
Foreign Currency Exchange Contracts |
Interest Rate Contracts |
Other Contracts |
Total | ||||||||||||||||||||||
| Net Realized Gain (Loss) from: |
||||||||||||||||||||||||||||
| Options purchased(a) |
$ | — | $ | — | $ | (5,236 | ) | $ | — | $ | — | $ | — | $ | (5,236 | ) | ||||||||||||
| Options written |
— | — | (14,000,549 | ) | — | — | — | (14,000,549 | ) | |||||||||||||||||||
|
|
|
|
|
|
|
|
|
|
|
|
|
|
|
|||||||||||||||
| $ | — | — | $ | (14,005,785 | ) | $ | — | $ | — | $ | — | $ | (14,005,785 | ) | ||||||||||||||
|
|
|
|
|
|
|
|
|
|
|
|
|
|
|
|||||||||||||||
| (a) | Options purchased are included in net realized gain (loss) from investments. |
| Commodity Contracts |
Credit Contracts |
Equity Contracts |
Foreign Currency Exchange Contracts |
Interest Rate Contracts |
Other Contracts |
Total | ||||||||||||||||||||||
| Net Change in Unrealized Appreciation (Depreciation) on: |
|
|||||||||||||||||||||||||||
| Options purchased(a) |
$ | — | $ | — | $ | 3,011 | $ | — | $ | — | $ | — | $ | 3,011 | ||||||||||||||
| Options written |
— | — | (4,876,782 | ) | — | — | — | (4,876,782 | ) | |||||||||||||||||||
|
|
|
|
|
|
|
|
|
|
|
|
|
|
|
|||||||||||||||
| $ | — | $ | — | $ | (4,873,771 | ) | $ | — | $ | — | $ | — | $ | (4,873,771 | ) | |||||||||||||
|
|
|
|
|
|
|
|
|
|
|
|
|
|
|
|||||||||||||||
| (a) | Options purchased are included in net change in unrealized appreciation (depreciation) on investments. |
Average Quarterly Balances of Outstanding Derivative Financial Instruments
| Options: |
| |||
| Average market value of option contracts purchased |
$ | — | (a) | |
| Average value of option contracts written |
$ | 8,084,557 | ||
| (a) | Derivative not held at quarter-end. The risk exposure table serves as an indicator of activity during the period. |
For more information about the Trust’s investment risks regarding derivative financial instruments, refer to the Notes to Financial Statements.
Derivative Financial Instruments — Offsetting as of Period End
The Trust’s derivative assets and liabilities (by type) are as follows:
| Assets | Liabilities | |||||||
| Derivative Financial Instruments: |
||||||||
| Options |
$ | — | $ | 7,135,810 | ||||
| Derivatives not subject to a Master Netting Agreement or similar agreement (“MNA”) |
— | (2,641,402 | ) | |||||
|
|
|
|
|
|||||
| Total derivative assets and liabilities subject to an MNA |
$ | — | $ | 4,494,408 | ||||
|
|
|
|
|
|||||
| 56 | 2019 BLACKROCK SEMI-ANNUAL REPORT TO SHAREHOLDERS |
| Schedule of Investments (unaudited) (continued) June 30, 2019 |
BlackRock Enhanced Global Dividend Trust (BOE) |
The following table presents the Trust’s derivative assets (and liabilities) by counterparty net of amounts available for offset under an MNA and net of the related collateral received (and pledged) by the Trust:
| Counterparty | Derivative Liabilities Subject to an MNA by Counterparty |
Derivatives Available for Offset |
Non-cash Collateral Pledged (a) |
Cash Collateral Pledged |
Net Amount of Derivative Liabilities (b) |
|||||||||||||||
| Bank of America N.A. |
$ | 33,303 | $ | — | $ | — | $ | — | $ | 33,303 | ||||||||||
| Barclays Bank PLC |
85,366 | — | — | — | 85,366 | |||||||||||||||
| Citibank N.A. |
340,789 | — | (340,789 | ) | — | — | ||||||||||||||
| Credit Suisse International |
86,909 | — | (86,909 | ) | — | — | ||||||||||||||
| Deutsche Bank AG |
336,099 | — | (52,116 | ) | — | 283,983 | ||||||||||||||
| Goldman Sachs International |
1,061,023 | — | (1,061,023 | ) | — | — | ||||||||||||||
| JPMorgan Chase Bank N.A. |
396,595 | — | (396,595 | ) | — | — | ||||||||||||||
| Morgan Stanley & Co. International PLC |
1,014,509 | — | (1,014,509 | ) | — | — | ||||||||||||||
| Royal Bank of Canada |
18,647 | — | — | — | 18,647 | |||||||||||||||
| UBS AG |
1,121,168 | — | (1,121,168 | ) | — | — | ||||||||||||||
|
|
|
|
|
|
|
|
|
|
|
|||||||||||
| $ | 4,494,408 | $ | — | $ | (4,073,109 | ) | $ | — | $ | 421,299 | ||||||||||
|
|
|
|
|
|
|
|
|
|
|
|||||||||||
| (a) | Excess of collateral pledged to the individual counterparty is not shown for financial reporting purposes. |
| (b) | Net amount represents the net amount payable due to counterparty in the event of default. Net amount may be offset further by the options written receivable/payable on the Statements of Assets and Liabilities. |
Fair Value Hierarchy as of Period End
Various inputs are used in determining the fair value of investments and derivative financial instruments. For information about the Trust’s policy regarding valuation of investments and derivative financial instruments, refer to the Notes to Financial Statements.
The following tables summarizes the Trust’s investments and derivative financial instruments categorized in the disclosure hierarchy:
| Level 1 | Level 2 | Level 3 | Total | |||||||||||||
| Assets: |
| |||||||||||||||
| Investments: |
| |||||||||||||||
| Common Stocks: |
| |||||||||||||||
| Australia |
$ | — | $ | 42,185,093 | $ | 3 | $ | 42,185,096 | ||||||||
| Canada |
51,784,306 | — | — | 51,784,306 | ||||||||||||
| China |
— | 6,366,111 | — | 6,366,111 | ||||||||||||
| Denmark |
— | 13,746,968 | — | 13,746,968 | ||||||||||||
| Finland |
— | 13,030,530 | — | 13,030,530 | ||||||||||||
| France |
— | 23,871,781 | — | 23,871,781 | ||||||||||||
| Germany |
— | 20,623,726 | — | 20,623,726 | ||||||||||||
| India |
— | 6,268,957 | 1,132,233 | 7,401,190 | ||||||||||||
| Ireland |
16,523,382 | — | — | 16,523,382 | ||||||||||||
| Netherlands |
— | 25,176,945 | — | 25,176,945 | ||||||||||||
| Singapore |
— | 24,431,709 | — | 24,431,709 | ||||||||||||
| Sweden |
— | 9,247,307 | — | 9,247,307 | ||||||||||||
| Switzerland |
— | 52,799,634 | — | 52,799,634 | ||||||||||||
| Taiwan |
— | 8,038,444 | — | 8,038,444 | ||||||||||||
| United Kingdom |
— | 131,060,862 | — | 131,060,862 | ||||||||||||
| United States |
341,894,845 | — | 3,849,984 | 345,744,829 | ||||||||||||
| Preferred Stocks |
— | 3,071,388 | 3,312,288 | 6,383,676 | ||||||||||||
| Short-Term Securities |
916,623 | — | — | 916,623 | ||||||||||||
|
|
|
|
|
|
|
|
|
|||||||||
| $ | 411,119,156 | $ | 379,919,455 | $ | 8,294,508 | $ | 799,333,119 | |||||||||
|
|
|
|
|
|
|
|
|
|||||||||
| Derivative Financial Instruments(a) |
| |||||||||||||||
| Liabilities: |
| |||||||||||||||
| Equity contracts |
$ | (2,504,884 | ) | $ | (4,630,926 | ) | $ | — | $ | (7,135,810 | ) | |||||
|
|
|
|
|
|
|
|
|
|||||||||
| (a) | Derivative financial instruments are options written which are shown at value. |
| SCHEDULES OF INVESTMENTS | 57 |
| Schedule of Investments (unaudited) (continued) June 30, 2019 |
BlackRock Enhanced Global Dividend Trust (BOE) |
A reconciliation of Level 3 investments is presented when the Trust had a significant amount of Level 3 investments at the beginning and/or rend of the period in relation to net assets. The following table is a reconciliation of Level 3 investments for which significant unobservable inputs were used in determining fair value:
| Common Stocks |
Preferred Stocks |
Total | ||||||||||
| Assets: |
||||||||||||
| Opening Balance, as of December 31, 2018 |
$ | 4,529,927 | $ | 5,843,081 | $ | 10,373,008 | ||||||
| Transfers into Level 3 |
— | — | — | |||||||||
| Transfers out of Level 3 |
— | — | — | |||||||||
| Accrued discounts/premiums |
— | — | — | |||||||||
| Net realized gain (loss) |
— | — | — | |||||||||
| Net change in unrealized appreciation (depreciation)(a)(b) |
452,293 | (1,464,692 | ) | (1,012,399 | ) | |||||||
| Purchases |
— | — | — | |||||||||
| Sales |
— | (1,066,101 | ) | (1,066,101 | ) | |||||||
|
|
|
|
|
|
|
|||||||
| Closing Balance, as of June 30, 2019 |
$ | 4,982,220 | $ | 3,312,288 | $ | 8,294,508 | ||||||
|
|
|
|
|
|
|
|||||||
| Net change in unrealized appreciation (depreciation) on investments still held at June 30, 2019(b) |
$ | 452,293 | $ | 559,680 | $ | 1,011,973 | ||||||
|
|
|
|
|
|
|
|||||||
| (a) | Included in the related net change in unrealized appreciation (depreciation) in the Statements of Operations. |
| (b) | Any difference between net change in unrealized appreciation (depreciation) and net change in unrealized appreciation (depreciation) on derivative financial instruments still held at June 30, 2019 is generally due to derivative financial instruments no longer held or categorized as Level 3 at period end. |
The following table summarizes the valuation approaches used and unobservable inputs utilized by the BlackRock Global Valuation Methodologies Committee (the “Global Valuation Committee”) to determine the value of certain of the Fund’s Level 3 investments as of period end. The table does not include Level 3 investments with values based upon unadjusted third party pricing information in the amount of $3. A significant change in the third party information could result in a significantly lower or higher value of such Level 3 investments.
| Value | Valuation Approach | Unobservable Inputs | Range of Unobservable Inputs Utilized |
|||||||||||||
| Common Stocks |
$ | 4,982,217 | Market | Tangible Book Value Multiple(a) | 1.60x | |||||||||||
| Revenue Multiple(a) | 7.00x | |||||||||||||||
| Preferred Stocks |
3,312,288 | Market | Revenue Multiple(a) | 17.25x | ||||||||||||
|
|
|
|||||||||||||||
| $ | 8,294,505 | |||||||||||||||
|
|
|
|||||||||||||||
| (a) | Increase in unobservable input may result in a significant increase to value, while a decrease in unobservable input may result in a significant decrease to value. |
See notes to financial statements.
| 58 | 2019 BLACKROCK SEMI-ANNUAL REPORT TO SHAREHOLDERS |
| Schedule of Investments (unaudited) June 30, 2019 |
BlackRock Enhanced International Dividend Trust (BGY) (Percentages shown are based on Net Assets) |
| SCHEDULES OF INVESTMENTS | 59 |
| Schedule of Investments (unaudited) (continued) June 30, 2019 |
BlackRock Enhanced International Dividend Trust (BGY) |
| (g) | During the six months ended June 30, 2019, investments in issuers considered to be an affiliate/affiliates of the Trust for purposes of Section 2(a)(3) of the Investment Company Act of 1940, as amended, were as follows: |
| Affiliate | Shares Held at 12/31/18 |
Net Activity |
Shares Held at 06/30/19 |
Value at 06/30/19 |
Income | Net Realized Gain (Loss) (a) |
Change in Unrealized Appreciation (Depreciation) |
|||||||||||||||||||||
|
BlackRock Liquidity Funds, T-Fund, Institutional Class |
25,489,943 | (20,188,180 | ) | 5,301,763 | $ | 5,301,763 | $ | 122,676 | $ | — | $ | — | ||||||||||||||||
|
|
|
|
|
|
|
|
|
|||||||||||||||||||||
| (a) | Includes net capital gain distributions, if applicable. |
For Trust compliance purposes, the Trust’s sector classifications refer to one or more of the sector sub-classifications used by one or more widely recognized market indexes or rating group indexes, and/or as defined by the investment adviser. These definitions may not apply for purposes of this report, which may combine such sector sub-classifications for reporting ease.
Derivative Financial Instruments Outstanding as of Period End
Exchange-Traded Options Written
| Description | Number of Contracts |
Expiration Date |
Exercise Price |
Notional Amount (000) |
Value | |||||||||||||||||||
| Call | ||||||||||||||||||||||||
| Microsoft Corp. |
36 | 07/05/19 | USD | 132.00 | USD | 482 | $ | (9,720 | ) | |||||||||||||||
| Microsoft Corp. |
73 | 07/12/19 | USD | 128.00 | USD | 978 | (46,902 | ) | ||||||||||||||||
| Microsoft Corp. |
37 | 07/16/19 | USD | 129.50 | USD | 496 | (21,063 | ) | ||||||||||||||||
| 3M Co. |
164 | 07/19/19 | USD | 180.00 | USD | 2,843 | (14,186 | ) | ||||||||||||||||
| Microsoft Corp. |
92 | 07/19/19 | USD | 130.00 | USD | 1,232 | (51,060 | ) | ||||||||||||||||
| Rogers Communications, Inc., Class B |
738 | 07/19/19 | CAD | 72.00 | CAD | 5,173 | (18,034 | ) | ||||||||||||||||
| 3M Co. |
88 | 07/26/19 | USD | 177.50 | USD | 1,525 | (28,600 | ) | ||||||||||||||||
| Microsoft Corp. |
69 | 07/26/19 | USD | 136.00 | USD | 924 | (18,906 | ) | ||||||||||||||||
| Microsoft Corp. |
141 | 08/02/19 | USD | 138.00 | USD | 1,889 | (32,148 | ) | ||||||||||||||||
| 3M Co. |
177 | 08/09/19 | USD | 180.00 | USD | 3,068 | (52,392 | ) | ||||||||||||||||
| Microsoft Corp. |
64 | 08/16/19 | USD | 140.00 | USD | 857 | (12,864 | ) | ||||||||||||||||
| TELUS Corp. |
1,142 | 08/16/19 | CAD | 52.00 | CAD | 5,528 | (6,104 | ) | ||||||||||||||||
|
|
|
|||||||||||||||||||||||
| $ | (311,979 | ) | ||||||||||||||||||||||
|
|
|
|||||||||||||||||||||||
OTC Options Written
| Description | Counterparty | Number of Contracts |
Expiration Date |
Exercise Price |
Notional Amount (000) |
Value | ||||||||||||||||||||
| Call | ||||||||||||||||||||||||||
| TELUS Corp. |
Royal Bank of Canada | 53,500 | 07/02/19 | CAD | 49.19 | CAD | 5,528 | $ | (576 | ) | ||||||||||||||||
| Amcor PLC |
JPMorgan Chase Bank N.A. | 94,700 | 07/09/19 | AUD | 16.77 | AUD | 1,535 | (1,966 | ) | |||||||||||||||||
| Amcor PLC |
Morgan Stanley & Co. International PLC | 185,000 | 07/09/19 | AUD | 17.00 | AUD | 2,999 | (1,185 | ) | |||||||||||||||||
| BAE Systems PLC |
UBS AG | 129,100 | 07/09/19 | GBP | 4.73 | GBP | 639 | (36,726 | ) | |||||||||||||||||
| BAE Systems PLC |
UBS AG | 178,400 | 07/09/19 | GBP | 4.74 | GBP | 883 | (49,395 | ) | |||||||||||||||||
| GlaxoSmithKline PLC |
Goldman Sachs International | 286,000 | 07/09/19 | GBP | 15.75 | GBP | 4,513 | (81,573 | ) | |||||||||||||||||
| Imperial Brands PLC |
UBS AG | 85,200 | 07/09/19 | GBP | 21.85 | GBP | 1,574 | (13 | ) | |||||||||||||||||
| Koninklijke Philips NV |
UBS AG | 34,600 | 07/09/19 | EUR | 36.97 | EUR | 1,323 | (53,479 | ) | |||||||||||||||||
| Nestle SA, Registered Shares |
UBS AG | 85,400 | 07/09/19 | CHF | 99.68 | CHF | 8,631 | (153,409 | ) | |||||||||||||||||
| RELX PLC |
UBS AG | 93,100 | 07/09/19 | EUR | 20.93 | EUR | 1,980 | (46,616 | ) | |||||||||||||||||
| Sonic Healthcare Ltd. |
Goldman Sachs International | 75,800 | 07/09/19 | AUD | 26.69 | AUD | 2,057 | (33,681 | ) | |||||||||||||||||
| Sonic Healthcare Ltd. |
Morgan Stanley & Co. International PLC | 52,000 | 07/09/19 | AUD | 27.26 | AUD | 1,411 | (10,438 | ) | |||||||||||||||||
| Taiwan Semiconductor Manufacturing Co. Ltd. |
JPMorgan Chase Bank N.A. | 43,000 | 07/09/19 | USD | 236.72 | USD | 10,215 | (7,859 | ) | |||||||||||||||||
| United Overseas Bank Ltd. |
Morgan Stanley & Co. International PLC | 118,400 | 07/09/19 | SGD | 26.01 | SGD | 3,097 | (42,242 | ) | |||||||||||||||||
| Ansell Ltd. |
JPMorgan Chase Bank N.A. | 58,000 | 07/10/19 | AUD | 26.13 | AUD | 1,560 | (37,678 | ) | |||||||||||||||||
| Deutsche Post AG, Registered Shares |
Goldman Sachs International | 35,100 | 07/10/19 | EUR | 28.03 | EUR | 1,015 | (39,281 | ) | |||||||||||||||||
| Rogers Communications, Inc., Class B |
Credit Suisse International | 22,100 | 07/10/19 | CAD | 71.74 | CAD | 1,549 | (3,675 | ) | |||||||||||||||||
| Schneider Electric SE |
UBS AG | 21,100 | 07/10/19 | EUR | 75.42 | EUR | 1,679 | (103,967 | ) | |||||||||||||||||
| Svenska Handelsbanken AB, Class A |
Credit Suisse International | 210,800 | 07/10/19 | SEK | 103.99 | SEK | 19,318 | (6 | ) | |||||||||||||||||
| Taiwan Semiconductor Manufacturing Co. Ltd. |
UBS AG | 514,000 | 07/10/19 | USD | 234.62 | USD | 122,101 | (117,233 | ) | |||||||||||||||||
| ANTA Sports Products Ltd. |
Goldman Sachs International | 265,000 | 07/12/19 | HKD | 52.23 | HKD | 14,278 | (94,684 | ) | |||||||||||||||||
| DBS Group Holdings Ltd. |
JPMorgan Chase Bank N.A. | 252,400 | 07/12/19 | SGD | 26.36 | SGD | 6,560 | (49,592 | ) | |||||||||||||||||
| Novo Nordisk A/S, Class B |
Goldman Sachs International | 39,900 | 07/12/19 | DKK | 329.90 | DKK | 13,378 | (50,100 | ) | |||||||||||||||||
| BAE Systems PLC |
UBS AG | 327,400 | 07/16/19 | GBP | 4.73 | GBP | 1,621 | (98,215 | ) | |||||||||||||||||
| British American Tobacco PLC |
UBS AG | 116,400 | 07/16/19 | GBP | 30.46 | GBP | 3,200 | (5,677 | ) | |||||||||||||||||
| Cie Financiere Richemont SA, Registered Shares |
Citibank N.A. | 27,500 | 07/16/19 | CHF | 73.04 | CHF | 2,281 | (281,987 | ) | |||||||||||||||||
| 60 | 2019 BLACKROCK SEMI-ANNUAL REPORT TO SHAREHOLDERS |
| Schedule of Investments (unaudited) (continued) June 30, 2019 |
BlackRock Enhanced International Dividend Trust (BGY) |
OTC Options Written (continued)
| Description | Counterparty | Number of Contracts |
Expiration Date |
Exercise Price |
Notional Amount (000) |
Value | ||||||||||||||||||||||
| Call (continued) | ||||||||||||||||||||||||||||
| Diageo PLC |
Goldman Sachs International | 20,600 | 07/16/19 | GBP | 34.30 | GBP | 698 | $ | (7,134 | ) | ||||||||||||||||||
| ANTA Sports Products Ltd. |
UBS AG | 111,000 | 07/17/19 | HKD | 51.88 | HKD | 5,981 | (45,732 | ) | |||||||||||||||||||
| Ansell Ltd. |
Goldman Sachs International | 45,900 | 07/17/19 | AUD | 27.13 | AUD | 1,235 | (13,946 | ) | |||||||||||||||||||
| AstraZeneca PLC |
Morgan Stanley & Co. International PLC | 40,500 | 07/17/19 | GBP | 60.47 | GBP | 2,607 | (208,313 | ) | |||||||||||||||||||
| Koninklijke Philips NV |
Deutsche Bank AG | 40,000 | 07/17/19 | EUR | 36.11 | EUR | 1,529 | (101,427 | ) | |||||||||||||||||||
| Schneider Electric SE |
Goldman Sachs International | 58,200 | 07/17/19 | EUR | 73.37 | EUR | 4,631 | (425,543 | ) | |||||||||||||||||||
| Rogers Communications, Inc., Class B |
Morgan Stanley & Co. International PLC | 131,500 | 07/19/19 | CAD | 68.25 | CAD | 9,218 | (223,116 | ) | |||||||||||||||||||
| AstraZeneca PLC |
UBS AG | 8,000 | 07/23/19 | GBP | 60.79 | GBP | 515 | (40,127 | ) | |||||||||||||||||||
| Diageo PLC |
Deutsche Bank AG | 33,700 | 07/23/19 | GBP | 33.69 | GBP | 1,142 | (32,137 | ) | |||||||||||||||||||
| GlaxoSmithKline PLC |
Morgan Stanley & Co. International PLC | 172,100 | 07/23/19 | GBP | 15.92 | GBP | 2,716 | (50,488 | ) | |||||||||||||||||||
| Imperial Brands PLC |
UBS AG | 92,000 | 07/23/19 | GBP | 21.51 | GBP | 1,700 | (1,881 | ) | |||||||||||||||||||
| RELX PLC |
Goldman Sachs International | 69,000 | 07/23/19 | EUR | 21.36 | EUR | 1,468 | (25,073 | ) | |||||||||||||||||||
| Unilever PLC |
Deutsche Bank AG | 53,700 | 07/23/19 | GBP | 49.07 | GBP | 2,625 | (52,114 | ) | |||||||||||||||||||
| Ansell Ltd. |
Morgan Stanley & Co. International PLC | 52,600 | 07/24/19 | AUD | 25.20 | AUD | 1,415 | (69,414 | ) | |||||||||||||||||||
| BAE Systems PLC |
Goldman Sachs International | 228,500 | 07/24/19 | GBP | 4.51 | GBP | 1,131 | (130,304 | ) | |||||||||||||||||||
| BAE Systems PLC |
UBS AG | 178,400 | 07/24/19 | GBP | 4.74 | GBP | 883 | (54,375 | ) | |||||||||||||||||||
| British American Tobacco PLC |
Goldman Sachs International | 64,700 | 07/24/19 | GBP | 28.46 | GBP | 1,779 | (39,742 | ) | |||||||||||||||||||
| Deutsche Post AG, Registered Shares |
Deutsche Bank AG | 81,600 | 07/24/19 | EUR | 27.48 | EUR | 2,361 | (149,581 | ) | |||||||||||||||||||
| Heineken NV |
Deutsche Bank AG | 16,600 | 07/24/19 | EUR | 97.54 | EUR | 1,627 | (44,404 | ) | |||||||||||||||||||
| Novartis AG, Registered Shares |
UBS AG | 82,600 | 07/24/19 | CHF | 88.98 | CHF | 7,361 | (137,876 | ) | |||||||||||||||||||
| Novo Nordisk A/S, Class B |
Goldman Sachs International | 58,100 | 07/24/19 | DKK | 325.44 | DKK | 19,480 | (123,921 | ) | |||||||||||||||||||
| SGS SA, Registered Shares |
UBS AG | 1,000 | 07/24/19 | CHF | 2,593.34 | CHF | 2,488 | (9,361 | ) | |||||||||||||||||||
| TELUS Corp. |
Goldman Sachs International | 24,900 | 07/24/19 | CAD | 50.81 | CAD | 1,205 | (692 | ) | |||||||||||||||||||
| United Overseas Bank Ltd. |
JPMorgan Chase Bank N.A. | 117,700 | 07/24/19 | SGD | 24.16 | SGD | 3,079 | (184,863 | ) | |||||||||||||||||||
| DBS Group Holdings Ltd. |
Morgan Stanley & Co. International PLC | 61,000 | 07/26/19 | SGD | 25.00 | SGD | 1,585 | (56,020 | ) | |||||||||||||||||||
| Schneider Electric SE |
Goldman Sachs International | 18,500 | 07/26/19 | EUR | 74.45 | EUR | 1,472 | (118,278 | ) | |||||||||||||||||||
| Koninklijke Philips NV |
UBS AG | 150,700 | 07/30/19 | EUR | 38.30 | EUR | 5,761 | (147,165 | ) | |||||||||||||||||||
| Novartis AG, Registered Shares |
Goldman Sachs International | 53,400 | 07/30/19 | CHF | 90.36 | CHF | 4,759 | (61,907 | ) | |||||||||||||||||||
| Novo Nordisk A/S, Class B |
Morgan Stanley & Co. International PLC | 17,100 | 07/30/19 | DKK | 344.10 | DKK | 5,733 | (14,159 | ) | |||||||||||||||||||
| United Overseas Bank Ltd. |
Morgan Stanley & Co. International PLC | 112,000 | 07/30/19 | SGD | 26.21 | SGD | 2,930 | (50,968 | ) | |||||||||||||||||||
| ANTA Sports Products Ltd. |
JPMorgan Chase Bank N.A. | 405,000 | 07/31/19 | HKD | 50.15 | HKD | 21,821 | (257,891 | ) | |||||||||||||||||||
| Deutsche Post AG, Registered Shares |
Goldman Sachs International | 116,000 | 07/31/19 | EUR | 28.89 | EUR | 3,356 | (83,044 | ) | |||||||||||||||||||
| Deutsche Post AG, Registered Shares |
Morgan Stanley & Co. International PLC | 107,000 | 07/31/19 | EUR | 27.90 | EUR | 3,096 | (160,813 | ) | |||||||||||||||||||
| GlaxoSmithKline PLC |
Goldman Sachs International | 260,300 | 07/31/19 | GBP | 16.14 | GBP | 4,108 | (61,707 | ) | |||||||||||||||||||
| Heineken NV |
UBS AG | 45,000 | 07/31/19 | EUR | 100.53 | EUR | 4,410 | (63,707 | ) | |||||||||||||||||||
| RELX PLC |
Goldman Sachs International | 40,700 | 07/31/19 | EUR | 21.56 | EUR | 866 | (13,361 | ) | |||||||||||||||||||
| Svenska Handelsbanken AB, Class A |
UBS AG | 451,200 | 07/31/19 | SEK | 94.44 | SEK | 41,348 | (40,411 | ) | |||||||||||||||||||
| Unilever PLC |
UBS AG | 128,400 | 07/31/19 | GBP | 49.96 | GBP | 6,276 | (86,798 | ) | |||||||||||||||||||
| Imperial Brands PLC |
Citibank N.A. | 31,500 | 08/01/19 | GBP | 19.36 | GBP | 582 | (15,110 | ) | |||||||||||||||||||
| Imperial Brands PLC |
Goldman Sachs International | 226,000 | 08/01/19 | GBP | 20.85 | GBP | 4,176 | (23,106 | ) | |||||||||||||||||||
| Ansell Ltd. |
Morgan Stanley & Co. International PLC | 45,900 | 08/02/19 | AUD | 26.63 | AUD | 1,235 | (28,458 | ) | |||||||||||||||||||
| BAE Systems PLC |
UBS AG | 316,000 | 08/02/19 | GBP | 4.91 | GBP | 1,564 | (57,862 | ) | |||||||||||||||||||
| British American Tobacco PLC |
Goldman Sachs International | 64,700 | 08/02/19 | GBP | 30.17 | GBP | 1,779 | (16,330 | ) | |||||||||||||||||||
| Diageo PLC |
Goldman Sachs International | 75,100 | 08/02/19 | GBP | 34.99 | GBP | 2,545 | (31,222 | ) | |||||||||||||||||||
| Kone OYJ, Class B |
Goldman Sachs International | 42,100 | 08/02/19 | EUR | 51.85 | EUR | 2,186 | (78,849 | ) | |||||||||||||||||||
| Sanofi |
Goldman Sachs International | 29,200 | 08/02/19 | EUR | 78.10 | EUR | 2,219 | (27,830 | ) | |||||||||||||||||||
| Sonic Healthcare Ltd. |
UBS AG | 89,000 | 08/02/19 | AUD | 27.64 | AUD | 2,415 | (24,583 | ) | |||||||||||||||||||
| Amcor PLC |
JPMorgan Chase Bank N.A. | 283,000 | 08/06/19 | AUD | 16.05 | AUD | 4,587 | (86,135 | ) | |||||||||||||||||||
| BAE Systems PLC |
Credit Suisse International | 435,600 | 08/06/19 | GBP | 4.99 | GBP | 2,156 | (61,249 | ) | |||||||||||||||||||
| Nestle SA, Registered Shares |
Morgan Stanley & Co. International PLC | 36,500 | 08/06/19 | CHF | 102.75 | CHF | 3,689 | (37,316 | ) | |||||||||||||||||||
| Rogers Communications, Inc., Class B |
Citibank N.A. | 46,800 | 08/06/19 | CAD | 71.60 | CAD | 3,281 | (25,807 | ) | |||||||||||||||||||
| SGS SA, Registered Shares |
Goldman Sachs International | 1,000 | 08/06/19 | CHF | 2,628.05 | CHF | 2,488 | (9,940 | ) | |||||||||||||||||||
| Sanofi |
Credit Suisse International | 29,050 | 08/06/19 | EUR | 79.02 | EUR | 2,208 | (20,449 | ) | |||||||||||||||||||
| Schneider Electric SE |
Morgan Stanley & Co. International PLC | 25,700 | 08/06/19 | EUR | 78.60 | EUR | 2,045 | (80,862 | ) | |||||||||||||||||||
| Taiwan Semiconductor Manufacturing Co. Ltd. |
Citibank N.A. | 131,000 | 08/06/19 | USD | 239.80 | USD | 31,119 | (33,696 | ) | |||||||||||||||||||
| Novo Nordisk A/S, Class B |
Goldman Sachs International | 41,000 | 08/07/19 | DKK | 334.14 | DKK | 13,746 | (66,971 | ) | |||||||||||||||||||
| Ansell Ltd. |
JPMorgan Chase Bank N.A. | 43,400 | 08/08/19 | AUD | 27.23 | AUD | 1,167 | (22,409 | ) | |||||||||||||||||||
| Deutsche Post AG, Registered Shares |
UBS AG | 108,900 | 08/08/19 | EUR | 28.69 | EUR | 3,150 | (105,578 | ) | |||||||||||||||||||
| Diageo PLC |
Credit Suisse International | 74,000 | 08/08/19 | GBP | 34.53 | GBP | 2,508 | (50,997 | ) | |||||||||||||||||||
| Kone OYJ, Class B |
Morgan Stanley & Co. International PLC | 65,150 | 08/08/19 | EUR | 52.51 | EUR | 3,383 | (105,794 | ) | |||||||||||||||||||
| Sonic Healthcare Ltd. |
UBS AG | 120,600 | 08/08/19 | AUD | 28.48 | AUD | 3,273 | (16,712 | ) | |||||||||||||||||||
| TELUS Corp. |
Goldman Sachs International | 51,200 | 08/08/19 | CAD | 50.50 | CAD | 2,479 | (5,160 | ) | |||||||||||||||||||
| SCHEDULES OF INVESTMENTS | 61 |
| Schedule of Investments (unaudited) (continued) June 30, 2019 |
BlackRock Enhanced International Dividend Trust (BGY) |
OTC Options Written (continued)
| Description | Counterparty | Number of Contracts |
Expiration Date |
Exercise Price |
Notional Amount (000) |
Value | ||||||||||||||||||||
| Call (continued) | ||||||||||||||||||||||||||
| AstraZeneca PLC |
UBS AG | 48,300 | 08/09/19 | GBP | 66.81 | GBP | 3,109 | $ | (42,190 | ) | ||||||||||||||||
| British American Tobacco PLC |
Goldman Sachs International | 25,000 | 08/09/19 | GBP | 28.81 | GBP | 687 | (19,272 | ) | |||||||||||||||||
| British American Tobacco PLC |
Morgan Stanley & Co. International PLC | 37,800 | 08/09/19 | GBP | 28.53 | GBP | 1,039 | (31,013 | ) | |||||||||||||||||
| Cie Financiere Richemont SA, Registered Shares |
UBS AG | 27,500 | 08/09/19 | CHF | 84.25 | CHF | 2,281 | (51,424 | ) | |||||||||||||||||
| Imperial Brands PLC |
UBS AG | 38,000 | 08/09/19 | GBP | 19.30 | GBP | 702 | (21,552 | ) | |||||||||||||||||
| DBS Group Holdings Ltd. |
Citibank N.A. | 60,000 | 08/13/19 | SGD | 26.61 | SGD | 1,559 | (20,926 | ) | |||||||||||||||||
| Rogers Communications, Inc., Class B |
Citibank N.A. | 46,800 | 08/13/19 | CAD | 71.60 | CAD | 3,281 | (29,467 | ) | |||||||||||||||||
| Amcor PLC |
UBS AG | 679,200 | 08/14/19 | AUD | 15.92 | AUD | 11,010 | (259,556 | ) | |||||||||||||||||
| Ansell Ltd. |
JPMorgan Chase Bank N.A. | 43,400 | 08/14/19 | AUD | 27.24 | AUD | 1,167 | (24,314 | ) | |||||||||||||||||
| Diageo PLC |
UBS AG | 6,100 | 08/14/19 | GBP | 34.74 | GBP | 207 | (2,872 | ) | |||||||||||||||||
| Kone OYJ, Class B |
Morgan Stanley & Co. International PLC | 34,600 | 08/14/19 | EUR | 52.95 | EUR | 1,797 | (53,211 | ) | |||||||||||||||||
| Novo Nordisk A/S, Class B |
Goldman Sachs International | 27,000 | 08/14/19 | DKK | 356.38 | DKK | 9,053 | (15,453 | ) | |||||||||||||||||
| Sonic Healthcare Ltd. |
UBS AG | 95,000 | 08/14/19 | AUD | 27.75 | AUD | 2,578 | (31,712 | ) | |||||||||||||||||
| TELUS Corp. |
Royal Bank of Canada | 51,300 | 08/15/19 | CAD | 50.50 | CAD | 2,483 | (6,766 | ) | |||||||||||||||||
| Svenska Handelsbanken AB, Class A |
Goldman Sachs International | 125,400 | 08/20/19 | SEK | 93.43 | SEK | 11,492 | (28,356 | ) | |||||||||||||||||
| TELUS Corp. |
Goldman Sachs International | 68,800 | 08/23/19 | CAD | 49.07 | CAD | 3,330 | (32,532 | ) | |||||||||||||||||
| TELUS Corp. |
Goldman Sachs International | 68,800 | 08/23/19 | CAD | 48.66 | CAD | 3,330 | (42,103 | ) | |||||||||||||||||
| TELUS Corp. |
Royal Bank of Canada | 24,900 | 09/04/19 | CAD | 48.84 | CAD | 1,205 | (15,602 | ) | |||||||||||||||||
|
|
|
|||||||||||||||||||||||||
| $ | (6,549,792 | ) | ||||||||||||||||||||||||
|
|
|
|||||||||||||||||||||||||
Balances Reported in the Statements of Assets and Liabilities for Options Written
| Swap Premium Paid |
Swap Premium Received |
Unrealized Appreciation |
Unrealized Depreciation |
Value | ||||||||||||||||
| Options Written |
N/A | N/A | $ | 1,085,924 | $ | (2,972,932 | ) | $ | (6,861,771 | ) | ||||||||||
Derivative Financial Instruments Categorized by Risk Exposure
As of period end, the fair values of derivative financial instruments located in the Statements of Assets and Liabilities were as follows:
| Commodity Contracts |
Credit Contracts |
Equity Contracts |
Foreign Currency Exchange Contracts |
Interest Rate Contracts |
Other Contracts |
Total | ||||||||||||||||||||||
| Liabilities — Derivative Financial Instrument |
| |||||||||||||||||||||||||||
| Options written |
| |||||||||||||||||||||||||||
| Options written, at value |
$ | — | $ | — | $ | 6,861,771 | $ | — | $ | — | $ | — | $ | 6,861,771 | ||||||||||||||
|
|
|
|
|
|
|
|
|
|
|
|
|
|
|
|||||||||||||||
For the six month ended June 30, 2019, the effect of derivative financial instruments in the Statements of Operations was as follows:
| Commodity Contracts |
Credit Contracts |
Equity Contracts |
Foreign Currency Exchange Contracts |
Interest Rate Contracts |
Other Contracts |
Total | ||||||||||||||||||||||
| Net Realized Gain (Loss) from: |
||||||||||||||||||||||||||||
| Options purchased(a) |
$ | — | $ | — | $ | (468 | ) | $ | — | $ | — | $ | — | $ | (468 | ) | ||||||||||||
| Options written |
— | — | (12,249,773 | ) | — | — | — | (12,249,773 | ) | |||||||||||||||||||
|
|
|
|
|
|
|
|
|
|
|
|
|
|
|
|||||||||||||||
| $ | — | $ | — | $ | (12,250,241 | ) | $ | — | $ | — | $ | — | $ | (12,250,241 | ) | |||||||||||||
|
|
|
|
|
|
|
|
|
|
|
|
|
|
|
|||||||||||||||
| (a) | Options purchased are included in net realized gain (loss) from investments. |
| Commodity Contracts |
Credit Contracts |
Equity Contracts |
Foreign Currency Exchange Contracts |
Interest Rate Contracts |
Other Contracts |
Total | ||||||||||||||||||||||
| Net Change in Unrealized Appreciation (Depreciation) on: |
||||||||||||||||||||||||||||
| Options written |
$ | — | $ | — | $ | (4,785,167 | ) | $ | — | $ | — | $ | — | $ | (4,785,167 | ) | ||||||||||||
|
|
|
|
|
|
|
|
|
|
|
|
|
|
|
|||||||||||||||
| 62 | 2019 BLACKROCK SEMI-ANNUAL REPORT TO SHAREHOLDERS |
| Schedule of Investments (unaudited) (continued) June 30, 2019 |
BlackRock Enhanced International Dividend Trust (BGY) |
Average Quarterly Balances of Outstanding Derivative Financial Instruments
| Options: |
| |||||||||||||||
| Average market value of option contracts purchased |
$ | — | (a) | |||||||||||||
| Average market value of option contracts written |
$ | 7,438,112 | ||||||||||||||
| (a) | Derivative not held at quarter-end. The risk exposure table serves as an indicator of activity during the period. |
For more information about the Trust’s Investment risks regarding derivative financial instruments, refer to the Notes to Financial Statements.
Derivative Financial Instruments — Offsetting as of Period End
The Trust’s derivative assets and liabilities (by type) are as follows:
| Assets | Liabilities | |||||||
| Derivative Financial Instruments: |
||||||||
| Options |
$ | — | $ | 6,861,771 | ||||
| Derivatives not subject to a Master Netting Agreement or similar agreement (“MNA”) |
— | (311,979 | ) | |||||
|
|
|
|
|
|||||
| Total derivative assets and liabilities subject to an MNA |
$ | — | $ | 6,549,792 | ||||
|
|
|
|
|
|||||
The following table presents the Trust’s derivative assets (and liabilities) by counterparty net of amounts available for offset under an MNA and net of the related collateral received (and pledged) by the Trust:
| Counterparty | Derivative Liabilities Subject to an MNA by Counterparty |
Derivatives Available for Offset |
Non-cash Collateral Pledged (a) |
Cash Collateral Pledged |
Net Amount of Derivative Liabilities (b) |
|||||||||||||||
| Citibank N.A. |
$ | 406,993 | $ | — | $ | (406,993) | $ | — | $ | — | ||||||||||
| Credit Suisse International |
136,376 | — | (136,376 | ) | — | — | ||||||||||||||
| Deutsche Bank AG |
379,663 | — | (128,792 | ) | — | 250,871 | ||||||||||||||
| Goldman Sachs International |
1,801,095 | — | (1,801,095 | ) | — | — | ||||||||||||||
| JPMorgan Chase Bank N.A. |
672,707 | — | (672,707 | ) | — | — | ||||||||||||||
| Morgan Stanley & Co. International PLC |
1,223,810 | — | (1,223,810 | ) | — | — | ||||||||||||||
| Royal Bank of Canada |
22,944 | — | — | — | 22,944 | |||||||||||||||
| UBS AG |
1,906,204 | — | (1,906,204 | ) | — | — | ||||||||||||||
|
|
|
|
|
|
|
|
|
|
|
|||||||||||
| $ | 6,549,792 | $ | — | $ | (6,275,977 | ) | $ | — | $ | 273,815 | ||||||||||
|
|
|
|
|
|
|
|
|
|
|
|||||||||||
| (a) | Excess of collateral pledged to the individual counterparty is not shown for financial reporting purposes. |
| (b) | Net amount represents the net amount payable due to counterparty in the event of default. Net amount may be offset further by the options written receivable/payable on the Statements of Assets and Liabilities. |
Fair Value Hierarchy as of Period End
Various inputs are used in determining the fair value of investments and derivative financial instruments. For information about the Trust’s policy regarding valuation of investments and derivative financial instruments, refer to the Notes to Financial Statements.
The following tables summarize the Trust’s investments and derivative financial instruments categorized in the disclosure hierarchy:
| Level 1 | Level 2 | Level 3 | Total | |||||||||||||
| Assets: |
| |||||||||||||||
| Investments: |
| |||||||||||||||
| Common Stocks: |
| |||||||||||||||
| Australia |
$ | — | $ | 61,842,139 | $ | — | $ | 61,842,139 | ||||||||
| Canada |
76,909,571 | — | — | 76,909,571 | ||||||||||||
| China |
— | 8,977,389 | — | 8,977,389 | ||||||||||||
| Denmark |
— | 20,779,685 | — | 20,779,685 | ||||||||||||
| Finland |
— | 18,608,648 | — | 18,608,648 | ||||||||||||
| France |
— | 33,304,441 | — | 33,304,441 | ||||||||||||
| Germany |
— | 32,801,496 | — | 32,801,496 | ||||||||||||
| India |
— | 9,675,034 | 1,695,152 | 11,370,186 | ||||||||||||
| Netherlands |
— | 37,023,594 | — | 37,023,594 | ||||||||||||
| Singapore |
— | 30,884,223 | — | 30,884,223 | ||||||||||||
| Sweden |
— | 17,268,113 | — | 17,268,113 | ||||||||||||
| Switzerland |
— | 76,860,470 | — | 76,860,470 | ||||||||||||
| Taiwan |
— | 11,694,368 | — | 11,694,368 | ||||||||||||
| SCHEDULES OF INVESTMENTS | 63 |
| Schedule of Investments (unaudited) (continued) June 30, 2019 |
BlackRock Enhanced International Dividend Trust (BGY) |
Fair Value Hierarchy as of Period End (continued)
| Level 1 | Level 2 | Level 3 | Total | |||||||||||||
| United Kingdom |
$ | — | $ | 191,632,018 | $ | — | $ | 191,632,018 | ||||||||
| United States |
28,164,700 | — | — | 28,164,700 | ||||||||||||
| Preferred Stock |
— | — | 3,321,600 | 3,321,600 | ||||||||||||
| Short-Term Securities |
5,301,763 | — | — | 5,301,763 | ||||||||||||
|
|
|
|
|
|
|
|
|
|||||||||
| $ | 110,376,034 | $ | 551,351,618 | $ | 5,016,752 | $ | 666,744,404 | |||||||||
|
|
|
|
|
|
|
|
|
|||||||||
| Derivative Financial Instruments(a) |
| |||||||||||||||
| Liabilities: |
| |||||||||||||||
| Equity contracts |
$ | (290,916 | ) | $ | (6,570,855 | ) | $ | — | $ | (6,861,771 | ) | |||||
|
|
|
|
|
|
|
|
|
|||||||||
| (a) | Derivative financial instruments are options written, which are shown at value. |
See notes to financial statements.
| 64 | 2019 BLACKROCK SEMI-ANNUAL REPORT TO SHAREHOLDERS |
| Schedule of Investments (unaudited) June 30, 2019 |
BlackRock Health Sciences Trust (BME) (Percentages shown are based on Net Assets) |
| SCHEDULES OF INVESTMENTS | 65 |
| Schedule of Investments (unaudited) (continued) June 30, 2019 |
BlackRock Health Sciences Trust (BME) (Percentages shown are based on Net Assets) |
| (j) | During the six months ended June 30, 2019, investments in issuers considered to be an affiliate/affiliates of the Trust for purposes of Section 2(a)(3) of the Investment Company Act of 1940, as amended, were as follows: |
| Affiliate | Shares Held at 12/31/18 |
Net Activity |
Shares Held at 06/30/19 |
Value at 06/30/19 |
Income | Net Realized Gain (Loss) (a) |
Change in Unrealized Appreciation (Depreciation) |
|||||||||||||||||||||
| BlackRock Liquidity Funds, T-Fund, Institutional Class |
25,967,520 | (13,385,383 | ) | 12,582,137 | $ | 12,582,137 | $ | 201,743 | $ | — | $ | — | ||||||||||||||||
| SL Liquidity Series, LLC, Money Market Series |
4,665 | 324,295 | 328,960 | 329,058 | 44,310 | (b) | 140 | 20 | ||||||||||||||||||||
|
|
|
|
|
|
|
|
|
|||||||||||||||||||||
| $ | 12,911,195 | $ | 246,053 | $ | 140 | $ | 20 | |||||||||||||||||||||
|
|
|
|
|
|
|
|
|
|||||||||||||||||||||
| (a) | Includes net capital gain distributions, if applicable. |
| (b) | Represents all or a portion of securities lending income earned from the reinvestment of cash collateral from loaned securities, net of fees and collateral investment expenses, and other payments to and from borrowers of securities. |
For Trust compliance purposes, the Trust’s sector classifications refer to one or more of the industry sub-classifications used by one or more widely recognized market indexes or rating group indexes, and/or as defined by the investment adviser. These definitions may not apply for purposes of this report, which may combine such industry sub-classifications for reporting ease.
Derivative Financial Instruments Outstanding as of Period End
Exchange-Traded Options Written
| Description | Number of Contracts |
Expiration Date |
Exercise Price |
Notional Amount (000) |
Value | |||||||||||||||||||
| Call | ||||||||||||||||||||||||
| Pfizer, Inc. |
85 | 07/02/19 | USD | 42.75 | USD | 368 | $ | (5,893 | ) | |||||||||||||||
| Align Technology, Inc. |
18 | 07/12/19 | USD | 320.00 | USD | 493 | (270 | ) | ||||||||||||||||
| Arena Pharmaceuticals, Inc. |
54 | 07/12/19 | USD | 54.50 | USD | 317 | (26,325 | ) | ||||||||||||||||
| AstraZeneca PLC — ADR |
77 | 07/12/19 | USD | 38.00 | USD | 318 | (25,410 | ) | ||||||||||||||||
| Baxter International, Inc. |
168 | 07/12/19 | USD | 78.50 | USD | 1,376 | (62,412 | ) | ||||||||||||||||
| 66 | 2019 BLACKROCK SEMI-ANNUAL REPORT TO SHAREHOLDERS |
| Schedule of Investments (unaudited) (continued) June 30, 2019 |
BlackRock Health Sciences Trust (BME) |
Exchange-Traded Options Written (continued)
| Description | Number of Contracts |
Expiration Date |
Exercise Price |
Notional Amount (000) |
Value | |||||||||||||||||||
| Call (continued) | ||||||||||||||||||||||||
| Becton Dickinson & Co. |
37 | 07/12/19 | USD | 240.00 | USD | 932 | $ | (44,955 | ) | |||||||||||||||
| Bristol-Myers Squibb Co. |
179 | 07/12/19 | USD | 48.00 | USD | 812 | (1,163 | ) | ||||||||||||||||
| Cigna Corp. |
24 | 07/12/19 | USD | 152.50 | USD | 378 | (15,720 | ) | ||||||||||||||||
| Eli Lilly & Co. |
180 | 07/12/19 | USD | 120.00 | USD | 1,994 | (3,060 | ) | ||||||||||||||||
| Gilead Sciences, Inc. |
23 | 07/12/19 | USD | 66.00 | USD | 155 | (4,945 | ) | ||||||||||||||||
| Intuitive Surgical, Inc. |
17 | 07/12/19 | USD | 545.00 | USD | 892 | (4,080 | ) | ||||||||||||||||
| Medtronic PLC |
141 | 07/12/19 | USD | 93.50 | USD | 1,373 | (57,105 | ) | ||||||||||||||||
| Merck & Co., Inc. |
245 | 07/12/19 | USD | 81.00 | USD | 2,054 | (73,623 | ) | ||||||||||||||||
| Pfizer, Inc. |
66 | 07/12/19 | USD | 42.50 | USD | 286 | (7,590 | ) | ||||||||||||||||
| Acceleron Pharma, Inc. |
87 | 07/19/19 | USD | 45.00 | USD | 357 | (4,567 | ) | ||||||||||||||||
| Agilent Technologies, Inc. |
108 | 07/19/19 | USD | 70.00 | USD | 806 | (53,460 | ) | ||||||||||||||||
| Alexion Pharmaceuticals, Inc. |
37 | 07/19/19 | USD | 135.00 | USD | 485 | (18,870 | ) | ||||||||||||||||
| Allakos, Inc. |
62 | 07/19/19 | USD | 50.00 | USD | 269 | (29,760 | ) | ||||||||||||||||
| Amedisys, Inc. |
68 | 07/19/19 | USD | 130.00 | USD | 826 | (7,106 | ) | ||||||||||||||||
| Amgen, Inc. |
88 | 07/19/19 | USD | 180.00 | USD | 1,622 | (61,160 | ) | ||||||||||||||||
| Assembly Biosciences, Inc. |
10 | 07/19/19 | USD | 15.46 | USD | 13 | (313 | ) | ||||||||||||||||
| AstraZeneca PLC — ADR |
77 | 07/19/19 | USD | 41.50 | USD | 318 | (4,620 | ) | ||||||||||||||||
| Baxter International, Inc. |
22 | 07/19/19 | USD | 77.50 | USD | 180 | (10,505 | ) | ||||||||||||||||
| Baxter International, Inc. |
110 | 07/19/19 | USD | 83.50 | USD | 901 | (7,975 | ) | ||||||||||||||||
| BioMarin Pharmaceutical, Inc. |
100 | 07/19/19 | USD | 95.00 | USD | 857 | (4,500 | ) | ||||||||||||||||
| Biogen, Inc. |
25 | 07/19/19 | USD | 240.00 | USD | 585 | (10,000 | ) | ||||||||||||||||
| Blueprint Medicines Corp. |
7 | 07/19/19 | USD | 90.00 | USD | 66 | (5,495 | ) | ||||||||||||||||
| Blueprint Medicines Corp. |
14 | 07/19/19 | USD | 95.00 | USD | 132 | (7,000 | ) | ||||||||||||||||
| Boston Scientific Corp. |
580 | 07/19/19 | USD | 43.00 | USD | 2,493 | (47,850 | ) | ||||||||||||||||
| Centene Corp. |
178 | 07/19/19 | USD | 57.50 | USD | 933 | (4,005 | ) | ||||||||||||||||
| Cerner Corp. |
59 | 07/19/19 | USD | 75.00 | USD | 432 | (4,130 | ) | ||||||||||||||||
| Cerner Corp. |
29 | 07/19/19 | USD | 72.50 | USD | 213 | (5,582 | ) | ||||||||||||||||
| Charles River Laboratories International, Inc. |
21 | 07/19/19 | USD | 135.00 | USD | 298 | (17,010 | ) | ||||||||||||||||
| Cigna Corp. |
14 | 07/19/19 | USD | 155.00 | USD | 221 | (8,120 | ) | ||||||||||||||||
| Elanco Animal Health, Inc. |
203 | 07/19/19 | USD | 35.00 | USD | 686 | (10,658 | ) | ||||||||||||||||
| Eli Lilly & Co. |
99 | 07/19/19 | USD | 120.00 | USD | 1,097 | (1,980 | ) | ||||||||||||||||
| Encompass Health Corp. |
122 | 07/19/19 | USD | 60.00 | USD | 773 | (43,920 | ) | ||||||||||||||||
| Exact Sciences Corp. |
29 | 07/19/19 | USD | 105.00 | USD | 342 | (39,585 | ) | ||||||||||||||||
| Galapagos NV, ADR |
22 | 07/19/19 | USD | 120.00 | USD | 284 | (21,890 | ) | ||||||||||||||||
| Gilead Sciences, Inc. |
153 | 07/19/19 | USD | 67.50 | USD | 1,034 | (22,797 | ) | ||||||||||||||||
| HCA Healthcare, Inc. |
50 | 07/19/19 | USD | 125.00 | USD | 676 | (55,250 | ) | ||||||||||||||||
| Halozyme Therapeutics, Inc. |
100 | 07/19/19 | USD | 17.00 | USD | 172 | (6,500 | ) | ||||||||||||||||
| Humana, Inc. |
45 | 07/19/19 | USD | 270.00 | USD | 1,194 | (20,700 | ) | ||||||||||||||||
| Incyte Corp. |
71 | 07/19/19 | USD | 90.00 | USD | 603 | (8,875 | ) | ||||||||||||||||
| Insmed, Inc. |
60 | 07/19/19 | USD | 25.00 | USD | 154 | (11,400 | ) | ||||||||||||||||
| LHC Group, Inc. |
66 | 07/19/19 | USD | 120.00 | USD | 789 | (19,635 | ) | ||||||||||||||||
| Masimo Corp. |
164 | 07/19/19 | USD | 150.00 | USD | 2,441 | (60,270 | ) | ||||||||||||||||
| Medtronic PLC |
83 | 07/19/19 | USD | 97.50 | USD | 808 | (10,624 | ) | ||||||||||||||||
| Merck & Co., Inc. |
50 | 07/19/19 | USD | 85.00 | USD | 419 | (4,250 | ) | ||||||||||||||||
| Merck & Co., Inc. |
169 | 07/19/19 | USD | 82.50 | USD | 1,417 | (38,363 | ) | ||||||||||||||||
| Mirati Therapeutics, Inc. |
18 | 07/19/19 | USD | 115.00 | USD | 185 | (1,665 | ) | ||||||||||||||||
| Mirati Therapeutics, Inc. |
18 | 07/19/19 | USD | 105.00 | USD | 185 | (6,390 | ) | ||||||||||||||||
| Natera, Inc. |
57 | 07/19/19 | USD | 28.00 | USD | 157 | (8,190 | ) | ||||||||||||||||
| Neurocrine Biosciences, Inc. |
44 | 07/19/19 | USD | 85.00 | USD | 371 | (12,540 | ) | ||||||||||||||||
| Nevro Corp. |
25 | 07/19/19 | USD | 65.00 | USD | 162 | (6,187 | ) | ||||||||||||||||
| Novo Nordisk A/S — ADR |
117 | 07/19/19 | USD | 47.31 | USD | 597 | (44,994 | ) | ||||||||||||||||
| Pfizer, Inc. |
73 | 07/19/19 | USD | 43.00 | USD | 316 | (6,971 | ) | ||||||||||||||||
| Quest Diagnostics, Inc. |
56 | 07/19/19 | USD | 100.00 | USD | 570 | (14,000 | ) | ||||||||||||||||
| Reata Pharmaceuticals, Inc. |
36 | 07/19/19 | USD | 95.00 | USD | 340 | (18,720 | ) | ||||||||||||||||
| ResMed, Inc. |
165 | 07/19/19 | USD | 125.00 | USD | 2,013 | (18,150 | ) | ||||||||||||||||
| Sanofi — ADR |
173 | 07/19/19 | USD | 43.00 | USD | 749 | (14,705 | ) | ||||||||||||||||
| Seattle Genetics, Inc. |
53 | 07/19/19 | USD | 75.00 | USD | 367 | (2,782 | ) | ||||||||||||||||
| Teladoc Health, Inc. |
70 | 07/19/19 | USD | 65.00 | USD | 465 | (25,550 | ) | ||||||||||||||||
| Thermo Fisher Scientific, Inc. |
95 | 07/19/19 | USD | 300.00 | USD | 2,790 | (26,600 | ) | ||||||||||||||||
| Varian Medical Systems, Inc. |
57 | 07/19/19 | USD | 130.00 | USD | 776 | (39,900 | ) | ||||||||||||||||
| Wright Medical Group NV |
97 | 07/19/19 | USD | 32.50 | USD | 289 | (1,940 | ) | ||||||||||||||||
| Zimmer Biomet Holdings, Inc. |
75 | 07/19/19 | USD | 120.00 | USD | 883 | (8,625 | ) | ||||||||||||||||
| SCHEDULES OF INVESTMENTS | 67 |
| Schedule of Investments (unaudited) (continued) June 30, 2019 |
BlackRock Health Sciences Trust (BME) |
Exchange-Traded Options Written (continued)
| Description | Number of Contracts |
Expiration Date |
Exercise Price |
Notional Amount (000) |
Value | |||||||||||||||||||
| Call (continued) | ||||||||||||||||||||||||
| Zimmer Biomet Holdings, Inc. |
75 | 07/19/19 | USD | 125.00 | USD | 883 | $ | (2,250 | ) | |||||||||||||||
| Amgen, Inc. |
56 | 07/26/19 | USD | 190.00 | USD | 1,032 | (12,404 | ) | ||||||||||||||||
| AstraZeneca PLC — ADR |
21 | 07/26/19 | USD | 42.50 | USD | 87 | (1,050 | ) | ||||||||||||||||
| Baxter International, Inc. |
159 | 07/26/19 | USD | 84.00 | USD | 1,302 | (16,457 | ) | ||||||||||||||||
| Becton Dickinson & Co. |
54 | 07/26/19 | USD | 242.50 | USD | 1,361 | (62,100 | ) | ||||||||||||||||
| Becton Dickinson & Co. |
37 | 07/26/19 | USD | 257.50 | USD | 932 | (9,620 | ) | ||||||||||||||||
| Biogen, Inc. |
24 | 07/26/19 | USD | 247.50 | USD | 561 | (9,720 | ) | ||||||||||||||||
| Blueprint Medicines Corp. |
16 | 07/26/19 | USD | 101.50 | USD | 151 | (5,766 | ) | ||||||||||||||||
| Bristol-Myers Squibb Co. |
131 | 07/26/19 | USD | 51.00 | USD | 594 | (917 | ) | ||||||||||||||||
| Cigna Corp. |
102 | 07/26/19 | USD | 165.00 | USD | 1,607 | (17,952 | ) | ||||||||||||||||
| Edwards Lifesciences Corp. |
126 | 07/26/19 | USD | 197.50 | USD | 2,328 | (28,035 | ) | ||||||||||||||||
| Exact Sciences Corp. |
31 | 07/26/19 | USD | 113.00 | USD | 366 | (25,730 | ) | ||||||||||||||||
| Gilead Sciences, Inc. |
144 | 07/26/19 | USD | 71.50 | USD | 973 | (8,136 | ) | ||||||||||||||||
| HCA Healthcare, Inc. |
72 | 07/26/19 | USD | 131.00 | USD | 973 | (46,440 | ) | ||||||||||||||||
| Illumina, Inc. |
13 | 07/26/19 | USD | 370.00 | USD | 479 | (14,950 | ) | ||||||||||||||||
| Intuitive Surgical, Inc. |
69 | 07/26/19 | USD | 540.00 | USD | 3,619 | (78,315 | ) | ||||||||||||||||
| Medtronic PLC |
30 | 07/26/19 | USD | 99.00 | USD | 292 | (2,775 | ) | ||||||||||||||||
| Merck & Co., Inc. |
141 | 07/26/19 | USD | 84.50 | USD | 1,182 | (19,106 | ) | ||||||||||||||||
| Nektar Therapeutics |
15 | 07/26/19 | USD | 37.50 | USD | 53 | (1,387 | ) | ||||||||||||||||
| Pfizer, Inc. |
167 | 07/26/19 | USD | 43.00 | USD | 723 | (18,036 | ) | ||||||||||||||||
| Teladoc Health, Inc. |
70 | 07/26/19 | USD | 64.77 | USD | 465 | (29,569 | ) | ||||||||||||||||
| Zoetis, Inc. |
146 | 07/26/19 | USD | 111.00 | USD | 1,657 | (56,210 | ) | ||||||||||||||||
| Charles River Laboratories International, Inc. |
21 | 07/31/19 | USD | 138.50 | USD | 298 | (14,620 | ) | ||||||||||||||||
| ACADIA Pharmaceuticals, Inc. |
60 | 08/02/19 | USD | 27.00 | USD | 160 | (10,500 | ) | ||||||||||||||||
| Alexion Pharmaceuticals, Inc. |
37 | 08/02/19 | USD | 134.00 | USD | 485 | (25,345 | ) | ||||||||||||||||
| Amgen, Inc. |
7 | 08/02/19 | USD | 190.00 | USD | 129 | (2,502 | ) | ||||||||||||||||
| Baxter International, Inc. |
44 | 08/02/19 | USD | 83.50 | USD | 360 | (6,380 | ) | ||||||||||||||||
| Bristol-Myers Squibb Co. |
62 | 08/02/19 | USD | 48.00 | USD | 281 | (2,511 | ) | ||||||||||||||||
| Humana, Inc. |
45 | 08/02/19 | USD | 255.00 | USD | 1,194 | (73,800 | ) | ||||||||||||||||
| Medtronic PLC |
30 | 08/02/19 | USD | 99.00 | USD | 292 | (3,420 | ) | ||||||||||||||||
| Nektar Therapeutics |
14 | 08/02/19 | USD | 38.00 | USD | 50 | (1,820 | ) | ||||||||||||||||
| Pfizer, Inc. |
84 | 08/02/19 | USD | 43.50 | USD | 364 | (8,064 | ) | ||||||||||||||||
| Pfizer, Inc. |
35 | 08/02/19 | USD | 44.50 | USD | 152 | (1,855 | ) | ||||||||||||||||
| Pfizer, Inc. |
47 | 08/02/19 | USD | 43.00 | USD | 204 | (5,781 | ) | ||||||||||||||||
| Sarepta Therapeutics, Inc. |
40 | 08/02/19 | USD | 134.00 | USD | 608 | (85,800 | ) | ||||||||||||||||
| Zoetis, Inc. |
100 | 08/02/19 | USD | 115.00 | USD | 1,135 | (18,500 | ) | ||||||||||||||||
| Align Technology, Inc. |
7 | 08/09/19 | USD | 282.50 | USD | 192 | (9,520 | ) | ||||||||||||||||
| Edwards Lifesciences Corp. |
80 | 08/09/19 | USD | 187.50 | USD | 1,478 | (53,600 | ) | ||||||||||||||||
| Medtronic PLC |
158 | 08/09/19 | USD | 99.00 | USD | 1,539 | (21,093 | ) | ||||||||||||||||
| Pfizer, Inc. |
8 | 08/09/19 | USD | 42.75 | USD | 35 | (976 | ) | ||||||||||||||||
| Pfizer, Inc. |
47 | 08/09/19 | USD | 43.05 | USD | 204 | (4,981 | ) | ||||||||||||||||
| Pfizer, Inc. |
43 | 08/09/19 | USD | 43.64 | USD | 186 | (3,717 | ) | ||||||||||||||||
| Pfizer, Inc. |
35 | 08/09/19 | USD | 44.47 | USD | 152 | (1,958 | ) | ||||||||||||||||
| Vertex Pharmaceuticals, Inc. |
69 | 08/09/19 | USD | 182.50 | USD | 1,265 | (59,340 | ) | ||||||||||||||||
| Acceleron Pharma, Inc. |
87 | 08/16/19 | USD | 45.00 | USD | 357 | (18,923 | ) | ||||||||||||||||
| Agilent Technologies, Inc. |
53 | 08/16/19 | USD | 75.00 | USD | 396 | (13,913 | ) | ||||||||||||||||
| Agios Pharmaceuticals, Inc. |
66 | 08/16/19 | USD | 55.00 | USD | 329 | (14,685 | ) | ||||||||||||||||
| AnaptysBio, Inc. |
8 | 08/16/19 | USD | 70.00 | USD | 45 | (1,100 | ) | ||||||||||||||||
| Arena Pharmaceuticals, Inc. |
57 | 08/16/19 | USD | 60.00 | USD | 334 | (20,064 | ) | ||||||||||||||||
| Assembly Biosciences, Inc. |
10 | 08/16/19 | USD | 15.46 | USD | 13 | (508 | ) | ||||||||||||||||
| Baxter International, Inc. |
44 | 08/16/19 | USD | 85.00 | USD | 360 | (5,676 | ) | ||||||||||||||||
| BioMarin Pharmaceutical, Inc. |
116 | 08/16/19 | USD | 90.00 | USD | 994 | (33,640 | ) | ||||||||||||||||
| Centene Corp. |
178 | 08/16/19 | USD | 56.85 | USD | 933 | (16,344 | ) | ||||||||||||||||
| Cerner Corp. |
59 | 08/16/19 | USD | 75.00 | USD | 432 | (11,800 | ) | ||||||||||||||||
| Eli Lilly & Co. |
105 | 08/16/19 | USD | 115.00 | USD | 1,163 | (21,420 | ) | ||||||||||||||||
| Gilead Sciences, Inc. |
32 | 08/16/19 | USD | 70.00 | USD | 216 | (5,184 | ) | ||||||||||||||||
| Humana, Inc. |
24 | 08/16/19 | USD | 270.00 | USD | 637 | (22,800 | ) | ||||||||||||||||
| IQVIA Holdings, Inc. |
99 | 08/16/19 | USD | 160.00 | USD | 1,593 | (62,370 | ) | ||||||||||||||||
| Insmed, Inc. |
99 | 08/16/19 | USD | 28.00 | USD | 253 | (13,860 | ) | ||||||||||||||||
| Medtronic PLC |
88 | 08/16/19 | USD | 100.00 | USD | 857 | (10,252 | ) | ||||||||||||||||
| Neurocrine Biosciences, Inc. |
63 | 08/16/19 | USD | 90.00 | USD | 532 | (21,420 | ) | ||||||||||||||||
| Nevro Corp. |
26 | 08/16/19 | USD | 67.50 | USD | 169 | (8,580 | ) | ||||||||||||||||
| 68 | 2019 BLACKROCK SEMI-ANNUAL REPORT TO SHAREHOLDERS |
| Schedule of Investments (unaudited) (continued) June 30, 2019 |
BlackRock Health Sciences Trust (BME) |
Exchange-Traded Options Written (continued)
| Description | Number of Contracts |
Expiration Date |
Exercise Price |
Notional Amount (000) |
Value | |||||||||||||||||||
| Call (continued) | ||||||||||||||||||||||||
| Pfizer, Inc. |
35 | 08/16/19 | USD | 45.00 | USD | 152 | $ | (1,680 | ) | |||||||||||||||
| Pfizer, Inc. |
194 | 08/16/19 | USD | 43.90 | USD | 840 | (15,876 | ) | ||||||||||||||||
| QIAGEN NV |
97 | 08/16/19 | USD | 39.00 | USD | 393 | (29,100 | ) | ||||||||||||||||
| Quest Diagnostics, Inc. |
33 | 08/16/19 | USD | 105.00 | USD | 336 | (5,280 | ) | ||||||||||||||||
| Seattle Genetics, Inc. |
44 | 08/16/19 | USD | 75.00 | USD | 305 | (9,790 | ) | ||||||||||||||||
| Teleflex, Inc. |
79 | 08/16/19 | USD | 340.00 | USD | 2,616 | (55,300 | ) | ||||||||||||||||
| Thermo Fisher Scientific, Inc. |
108 | 08/16/19 | USD | 300.00 | USD | 3,172 | (76,140 | ) | ||||||||||||||||
| Varian Medical Systems, Inc. |
84 | 08/16/19 | USD | 140.00 | USD | 1,143 | (29,820 | ) | ||||||||||||||||
| Vertex Pharmaceuticals, Inc. |
71 | 08/16/19 | USD | 185.00 | USD | 1,302 | (55,735 | ) | ||||||||||||||||
| Wright Medical Group NV |
130 | 08/16/19 | USD | 35.00 | USD | 388 | (2,600 | ) | ||||||||||||||||
| Zoetis, Inc. |
104 | 08/16/19 | USD | 115.00 | USD | 1,180 | (32,240 | ) | ||||||||||||||||
| Pfizer, Inc. |
163 | 08/23/19 | USD | 44.06 | USD | 706 | (13,653 | ) | ||||||||||||||||
| Incyte Corp. |
27 | 09/20/19 | USD | 90.00 | USD | 229 | (11,340 | ) | ||||||||||||||||
| Novo Nordisk A/S — ADR |
81 | 09/20/19 | USD | 52.25 | USD | 413 | (12,132 | ) | ||||||||||||||||
| Pfizer, Inc. |
77 | 09/20/19 | USD | 44.00 | USD | 334 | (8,432 | ) | ||||||||||||||||
|
|
|
|||||||||||||||||||||||
| $ | (2,823,850 | ) | ||||||||||||||||||||||
|
|
|
|||||||||||||||||||||||
OTC Options Written
| Description | Counterparty | Number of Contracts |
Expiration Date |
Exercise Price |
Notional Amount (000) |
Value | ||||||||||||||||||||
| Call | ||||||||||||||||||||||||||
| GlaxoSmithKline PLC |
Credit Suisse International | 60,600 | 07/09/19 | GBP | 15.78 | GBP | 956 | $ | (15,127 | ) | ||||||||||||||||
| Roche Holding AG |
Goldman Sachs International | 2,800 | 07/12/19 | CHF | 270.20 | CHF | 769 | (16,429 | ) | |||||||||||||||||
| Genmab A/S |
Goldman Sachs International | 2,200 | 07/16/19 | DKK | 1,174.18 | DKK | 2,655 | (16,219 | ) | |||||||||||||||||
| AstraZeneca PLC — ADR |
Morgan Stanley & Co. International PLC | 14,800 | 07/17/19 | GBP | 60.47 | GBP | 953 | (76,124 | ) | |||||||||||||||||
| GlaxoSmithKline PLC |
MorganStanley & Co. International PLC | 19,000 | 07/17/19 | GBP | 15.82 | GBP | 300 | (5,420 | ) | |||||||||||||||||
| Stryker Corp. |
Bank of America N.A. | 13,800 | 07/19/19 | USD | 189.35 | USD | 2,837 | (231,155 | ) | |||||||||||||||||
| Stryker Corp. |
Bank of America N.A. | 13,400 | 07/19/19 | USD | 205.72 | USD | 2,755 | (40,296 | ) | |||||||||||||||||
| Daiichi Sankyo Co. Ltd. |
Goldman Sachs International | 5,400 | 07/26/19 | JPY | 6,348.34 | JPY | 30,534 | (3,362 | ) | |||||||||||||||||
| Merck & Co., Inc. |
Credit Suisse International | 7,000 | 07/26/19 | EUR | 91.48 | EUR | 643 | (16,751 | ) | |||||||||||||||||
| QIAGEN NV |
Citibank N.A. | 11,000 | 07/26/19 | USD | 41.32 | USD | 446 | (106 | ) | |||||||||||||||||
| Wright Medical Group NV |
Citibank N.A. | 6,100 | 07/26/19 | USD | 31.03 | USD | 182 | (4,344 | ) | |||||||||||||||||
| Conva Tec Group PLC |
Goldman Sachs International | 208,000 | 07/31/19 | GBP | 1.46 | GBP | 304 | (11,932 | ) | |||||||||||||||||
| WuXi Biologics, Cayman, Inc. |
JPMorgan Chase Bank N.A. | 27,000 | 07/31/19 | HKD | 74.29 | HKD | 1,892 | (7,636 | ) | |||||||||||||||||
| Sanofi — ADR |
Goldman Sachs International | 6,900 | 08/02/19 | EUR | 78.10 | EUR | 524 | (6,576 | ) | |||||||||||||||||
| Novo Nordisk A/S — ADR |
Bank of America N.A. | 9,400 | 08/05/19 | USD | 50.06 | USD | 480 | (17,827 | ) | |||||||||||||||||
| Daiichi Sankyo Co. Ltd. |
JPMorgan Chase Bank N.A. | 7,500 | 08/06/19 | JPY | 6,539.84 | JPY | 42,408 | (1,695 | ) | |||||||||||||||||
| Sanofi — ADR |
Credit Suisse International | 6,800 | 08/06/19 | EUR | 79.02 | EUR | 517 | (4,787 | ) | |||||||||||||||||
| Conva Tec Group PLC |
UBS AG | 209,400 | 08/07/19 | GBP | 1.44 | GBP | 306 | (15,820 | ) | |||||||||||||||||
| AstraZeneca PLC — ADR |
UBS AG | 15,600 | 08/09/19 | GBP | 66.81 | GBP | 1,004 | (13,627 | ) | |||||||||||||||||
| WuXi Biologics, Cayman, Inc. |
JPMorgan Chase Bank N.A. | 26,000 | 08/14/19 | HKD | 73.82 | HKD | 1,822 | (10,172 | ) | |||||||||||||||||
| Elanco Animal Health, Inc. |
Credit Suisse International | 19,500 | 08/19/19 | USD | 34.79 | USD | 659 | (25,639 | ) | |||||||||||||||||
|
|
|
|||||||||||||||||||||||||
| $ | (541,044 | ) | ||||||||||||||||||||||||
|
|
|
|||||||||||||||||||||||||
Balances Reported in the Statements of Assets and Liabilities for Options Written
| Swap Premiums Paid |
Swap Premiums Received |
Unrealized Appreciation |
Unrealized Depreciation |
Value | ||||||||||||||||
| Options Written |
N/A | N/A | $ | 437,910 | $ | (1,142,593 | ) | $ | (3,364,894 | ) | ||||||||||
| SCHEDULES OF INVESTMENTS | 69 |
| Schedule of Investments (unaudited) (continued) June 30, 2019 |
BlackRock Health Sciences Trust (BME) |
Derivative Financial Instruments Categorized by Risk Exposure
As of period end, the fair values of derivative financial instruments located in the Statements of Assets and Liabilities were as follows:
| Commodity Contracts |
Credit Contracts |
Equity Contracts |
Foreign Currency Exchange Contracts |
Interest Rate Contracts |
Other Contracts |
Total | ||||||||||||||||||||||
| Liabilities — Derivative Financial Instruments |
||||||||||||||||||||||||||||
| Options written |
||||||||||||||||||||||||||||
| Options written at value |
$ | — | $ | — | $ | 3,364,894 | $ | — | $ | — | $ | — | $ | 3,364,894 | ||||||||||||||
|
|
|
|
|
|
|
|
|
|
|
|
|
|
|
|||||||||||||||
For the six months ended June 30, 2019, the effect of derivative financial instruments in the Statements of Operations was as follows:
| Commodity Contracts |
Credit Contracts |
Equity Contracts |
Foreign Currency Exchange Contracts |
Interest Rate Contracts |
Other Contracts |
Total | ||||||||||||||||||||||
| Net Realized Gain (Loss) from: |
||||||||||||||||||||||||||||
| Options purchased(a) |
$ | — | $ | — | $ | (2,229 | ) | $ | — | $ | — | $ | — | $ | (2,229 | ) | ||||||||||||
| Options written |
— | — | (1,366,144 | ) | — | — | — | (1,366,144 | ) | |||||||||||||||||||
|
|
|
|
|
|
|
|
|
|
|
|
|
|
|
|||||||||||||||
| $ | — | $ | — | $ | (1,368,373 | ) | $ | — | $ | — | $ | — | $ | (1,368,373 | ) | |||||||||||||
|
|
|
|
|
|
|
|
|
|
|
|
|
|
|
|||||||||||||||
| (a) | Options purchased are included in net realized gain (loss) from investments. |
| Commodity Contracts |
Credit Contracts |
Equity Contracts |
Foreign Currency Exchange Contracts |
Interest Rate Contracts |
Other Contracts |
Total | ||||||||||||||||||||||
| Net Change in Unrealized Appreciation (Depreciation) on: |
||||||||||||||||||||||||||||
| Options purchased(a) |
$ | — | $ | — | $ | 49 | $ | — | $ | — | $ | — | $ | 49 | ||||||||||||||
| Options written |
— | — | (1,821,665 | ) | — | — | — | (1,821,665 | ) | |||||||||||||||||||
|
|
|
|
|
|
|
|
|
|
|
|
|
|
|
|||||||||||||||
| $ | — | $ | — | $ | (1,821,616 | ) | $ | — | $ | — | $ | — | $ | (1,821,616 | ) | |||||||||||||
|
|
|
|
|
|
|
|
|
|
|
|
|
|
|
|||||||||||||||
| (a) | Options purchased are included in net change in unrealized appreciation (depreciation) on investments. |
Average Quarterly Balances of Outstanding Derivative Financial Instruments
| Options: |
| |||
| Average value of option contracts purchased |
$ | — | (a) | |
| Average value of option contracts written |
$ | 3,436,298 | ||
| (a) | Derivative not held at quarter-end. The risk exposure table serves as an indicator of activity during the period. |
For more information about the Trust’s investment risks regarding derivative financial instruments, refer to the Notes to Financial Statements.
Derivative Financial Instruments — Offsetting as of Period End
The Trust’s derivative assets and liabilities (by type) were as follows:
| Assets | Liabilities | |||||||
| Derivative Financial Instruments: |
||||||||
| Options |
$ | — | $ | 3,364,894 | ||||
| Derivatives not subject to a Master Netting Agreement or similar agreement (“MNA”) |
— | (2,823,850 | ) | |||||
|
|
|
|
|
|||||
| Total derivative assets and liabilities subject to an MNA |
$ | — | $ | 541,044 | ||||
|
|
|
|
|
|||||
| 70 | 2019 BLACKROCK SEMI-ANNUAL REPORT TO SHAREHOLDERS |
| Schedule of Investments (unaudited) (continued) June 30, 2019 |
BlackRock Health Sciences Trust (BME) |
The following table presents the Trust’s derivative assets (and liabilities) by counterparty net of amounts available for offset under an MNA and net of the related collateral received (and pledged) by the Trust:
| Counterparty | Derivative Liabilities an MNA by |
Derivatives for Offset |
Non-cash Collateral |
Cash Collateral |
Net Amount of Derivative Liabilities (a) |
|||||||||||||||
| Bank of America N.A. |
$ | 289,278 | $ | — | $ | — | $ | — | $ | 289,278 | ||||||||||
| Citibank N.A. |
4,450 | — | — | — | 4,450 | |||||||||||||||
| Credit Suisse International |
62,304 | — | — | — | 62,304 | |||||||||||||||
| Goldman Sachs International |
54,518 | — | — | — | 54,518 | |||||||||||||||
| JPMorgan Chase Bank N.A. |
19,503 | — | — | — | 19,503 | |||||||||||||||
| Morgan Stanley & Co. International PLC |
81,544 | — | — | — | 81,544 | |||||||||||||||
| UBS AG |
29,447 | — | — | — | 29,447 | |||||||||||||||
|
|
|
|
|
|
|
|
|
|
|
|||||||||||
| $ | 541,044 | $ | — | $ | — | $ | — | $ | 541,044 | |||||||||||
|
|
|
|
|
|
|
|
|
|
|
|||||||||||
| (a) | Net amount represents the net amount payable due to counterparty in the event of default. Net amount may be offset further by the options written receivable/payable on the Statements of Assets and Liabilities. |
Fair Value Hierarchy as of Period End
Various inputs are used in determining the fair value of investments and derivative financial instruments. For information about the Trust’s policy regarding valuation of investments and derivative financial instruments, refer to the Notes to Financial Statements.
The following tables summarize the Trust’s investments and derivative financial instruments categorized in the disclosure hierarchy:
| Level 1 | Level 2 | Level 3 | Total | |||||||||||||
| Assets: |
| |||||||||||||||
| Investments: |
| |||||||||||||||
| Common Stocks: |
| |||||||||||||||
| Biotechnology |
$ | 52,958,597 | $ | 886,211 | $ | 2,088,436 | $ | 55,933,244 | ||||||||
| Health Care Equipment & Supplies |
135,370,532 | 1,933,662 | — | 137,304,194 | ||||||||||||
| Health Care Providers & Services |
71,992,283 | — | — | 71,992,283 | ||||||||||||
| Health Care Technology |
4,506,623 | — | — | 4,506,623 | ||||||||||||
| Interactive Media & Services |
596,965 | — | — | 596,965 | ||||||||||||
| Life Sciences Tools & Services |
33,764,628 | 1,139,380 | — | 34,904,008 | ||||||||||||
| Pharmaceuticals |
65,275,251 | 19,106,679 | — | 84,381,930 | ||||||||||||
| Other Interests |
— | — | 125,506 | 125,506 | ||||||||||||
| Short-Term Securities |
12,582,137 | — | — | 12,582,137 | ||||||||||||
|
|
|
|
|
|
|
|
|
|||||||||
| Subtotal |
$ | 377,047,016 | $ | 23,065,932 | $ | 2,213,942 | $ | 402,326,890 | ||||||||
|
|
|
|
|
|
|
|
|
|||||||||
| Investments Valued at NAV(a) |
329,058 | |||||||||||||||
|
|
|
|||||||||||||||
| Total Investments |
$ | 402,655,948 | ||||||||||||||
|
|
|
|||||||||||||||
| Derivative Financial Instruments(b) |
| |||||||||||||||
| Liabilities: |
| |||||||||||||||
| Equity contracts |
$ | (2,638,579 | ) | $ | (726,315 | ) | $ | — | $ | (3,364,894 | ) | |||||
|
|
|
|
|
|
|
|
|
|||||||||
| (a) | Certain investments of the Trust were fair valued using net asset value (“NAV”) per share as no quoted market value is available and therefore have been excluded from the fair value hierarchy. |
| (b) | Derivative financial instruments are options written which are shown at value. |
See notes to financial statements.
| SCHEDULES OF INVESTMENTS | 71 |
| Consolidated Schedule of Investments (unaudited) June 30, 2019 |
BlackRock Resources & Commodities Strategy Trust (BCX) (Percentages shown are based on Net Assets) |
| 72 | 2019 BLACKROCK SEMI-ANNUAL REPORT TO SHAREHOLDERS |
| Consolidated Schedule of Investments (unaudited) (continued) June 30, 2019 |
BlackRock Resources & Commodities Strategy Trust (BCX) |
| (h) | During the six months ended June 30, 2019, investments in issuers considered to be an affiliate/affiliates of the Trust for purposes of Section 2(a)(3) of the Investment Company Act of 1940, as amended, were as follows: |
| Affiliate | Shares Held at 12/31/18 |
Net Activity |
Shares Held at 06/30/19 |
Value at 06/30/19 |
Income | Net Realized Gain (Loss) (a) |
Change in Unrealized Appreciation (Depreciation) |
|||||||||||||||||||||
| BlackRock Liquidity Funds, T-Fund, Institutional Class |
13,652,388 | (9,268,492 | ) | 4,383,896 | $ | 4,383,896 | $ | 168,412 | $ | — | $ | — | ||||||||||||||||
| SL Liquidity Series, LLC, Money Market Series |
276,499 | 204,278 | 480,777 | 480,921 | 24,699 | (b) | — | 138 | ||||||||||||||||||||
|
|
|
|
|
|
|
|
|
|||||||||||||||||||||
| $ | 4,864,817 | $ | 193,111 | $ | — | $ | 138 | |||||||||||||||||||||
|
|
|
|
|
|
|
|
|
|||||||||||||||||||||
| (a) | Includes net capital gain distributions, if applicable. |
| (b) | Represents all or a portion of securities lending income earned from the reinvestment of cash collateral from loaned securities, net of fees and collateral investment expenses, and other payments to and from borrowers of securities. |
For Trust compliance purposes, the Trust’s sector classifications refer to one or more of the industry sub-classifications used by one or more widely recognized market indexes or rating group indexes, and/or as defined by the investment adviser. These definitions may not apply for purposes of this report, which may combine such sector sub-classifications for reporting ease.
Derivative Financial Instruments Outstanding as of Period End
Exchange-Traded Options Written
| Description | Number of Contracts |
Expiration Date |
Exercise Price |
Notional Amount (000) |
Value | |||||||||||||||||||
| Call | ||||||||||||||||||||||||
| Barrick Gold Corp. |
1,153 | 07/05/19 | USD | 12.50 | USD | 1,818 | $ | (377,608 | ) | |||||||||||||||
| Exxon Mobil Corp. |
232 | 07/05/19 | USD | 76.00 | USD | 1,778 | (26,216 | ) | ||||||||||||||||
| FMC Corp. |
323 | 07/08/19 | USD | 74.00 | USD | 2,679 | (290,735 | ) | ||||||||||||||||
| BP PLC — ADR |
624 | 07/12/19 | USD | 42.00 | USD | 2,602 | (29,640 | ) | ||||||||||||||||
| BP PLC — ADR |
758 | 07/12/19 | USD | 42.95 | USD | 3,161 | (11,992 | ) | ||||||||||||||||
| ConocoPhillips |
57 | 07/12/19 | USD | 61.00 | USD | 348 | (6,954 | ) | ||||||||||||||||
| Exxon Mobil Corp. |
107 | 07/12/19 | USD | 74.00 | USD | 820 | (32,046 | ) | ||||||||||||||||
| Marathon Petroleum Corp. |
49 | 07/12/19 | USD | 48.00 | USD | 274 | (39,322 | ) | ||||||||||||||||
| Newmont Goldcorp Corp. |
328 | 07/12/19 | USD | 35.00 | USD | 1,262 | (115,128 | ) | ||||||||||||||||
| Newmont Goldcorp Corp. |
346 | 07/12/19 | USD | 35.50 | USD | 1,331 | (111,585 | ) | ||||||||||||||||
| Royal Dutch Shell PLC — ADR, Class A |
1,064 | 07/12/19 | USD | 66.25 | USD | 6,923 | (43,543 | ) | ||||||||||||||||
| Teck Resources Ltd., Class B |
306 | 07/12/19 | USD | 22.00 | USD | 706 | (39,015 | ) | ||||||||||||||||
| Tractor Supply Co. |
314 | 07/12/19 | USD | 111.00 | USD | 3,416 | (29,830 | ) | ||||||||||||||||
| Vale SA — ADR |
1,054 | 07/12/19 | USD | 13.50 | USD | 1,417 | (35,309 | ) | ||||||||||||||||
| Valero Energy Corp. |
132 | 07/12/19 | USD | 73.50 | USD | 1,130 | (161,370 | ) | ||||||||||||||||
| Valero Energy Corp. |
83 | 07/12/19 | USD | 80.00 | USD | 711 | (49,593 | ) | ||||||||||||||||
| Williams Cos., Inc. |
73 | 07/12/19 | USD | 28.09 | USD | 205 | (2,827 | ) | ||||||||||||||||
| Albemarle Corp. |
204 | 07/19/19 | USD | 75.00 | USD | 1,436 | (8,160 | ) | ||||||||||||||||
| Anadarko Petroleum Corp. |
77 | 07/19/19 | USD | 72.70 | USD | 543 | (2,378 | ) | ||||||||||||||||
| BP PLC — ADR |
878 | 07/19/19 | USD | 43.00 | USD | 3,661 | (21,072 | ) | ||||||||||||||||
| Barrick Gold Corp. |
1,127 | 07/19/19 | USD | 13.00 | USD | 1,777 | (313,306 | ) | ||||||||||||||||
| Concho Resources, Inc. |
78 | 07/19/19 | USD | 110.00 | USD | 805 | (9,555 | ) | ||||||||||||||||
| ConocoPhillips |
152 | 07/19/19 | USD | 65.00 | USD | 927 | (3,648 | ) | ||||||||||||||||
| EOG Resources, Inc. |
42 | 07/19/19 | USD | 90.00 | USD | 391 | (20,160 | ) | ||||||||||||||||
| Exxon Mobil Corp. |
232 | 07/19/19 | USD | 77.50 | USD | 1,778 | (20,300 | ) | ||||||||||||||||
| FMC Corp. |
205 | 07/19/19 | USD | 82.50 | USD | 1,700 | (40,488 | ) | ||||||||||||||||
| First Quantum Minerals Ltd. |
740 | 07/19/19 | CAD | 14.00 | CAD | 921 | (3,673 | ) | ||||||||||||||||
| Franco-Nevada Corp. |
169 | 07/19/19 | CAD | 115.00 | CAD | 1,878 | (11,292 | ) | ||||||||||||||||
| Ingredion, Inc. |
140 | 07/19/19 | USD | 85.00 | USD | 1,155 | (9,450 | ) | ||||||||||||||||
| Marathon Petroleum Corp. |
86 | 07/19/19 | USD | 57.50 | USD | 481 | (9,718 | ) | ||||||||||||||||
| Newmont Goldcorp Corp. |
282 | 07/19/19 | USD | 32.00 | USD | 1,085 | (190,350 | ) | ||||||||||||||||
| Newmont Goldcorp Corp. |
356 | 07/19/19 | USD | 33.00 | USD | 1,370 | (201,140 | ) | ||||||||||||||||
| Nutrien Ltd. |
268 | 07/19/19 | CAD | 72.00 | CAD | 1,877 | (6,446 | ) | ||||||||||||||||
| Packaging Corp. of America |
345 | 07/19/19 | USD | 100.00 | USD | 3,289 | (24,150 | ) | ||||||||||||||||
| Pioneer Natural Resources Co. |
64 | 07/19/19 | USD | 155.00 | USD | 985 | (31,360 | ) | ||||||||||||||||
| Rio Tinto PLC — ADR |
292 | 07/19/19 | USD | 62.50 | USD | 1,820 | (37,960 | ) | ||||||||||||||||
| Rio Tinto PLC — ADR |
292 | 07/19/19 | USD | 65.00 | USD | 1,820 | (10,950 | ) | ||||||||||||||||
| Royal Dutch Shell PLC — ADR, Class A |
511 | 07/19/19 | USD | 65.00 | USD | 3,325 | (54,933 | ) | ||||||||||||||||
| Stelco Holdings, Inc. |
250 | 07/19/19 | CAD | 14.87 | CAD | 380 | (11,454 | ) | ||||||||||||||||
| Stelco Holdings, Inc. |
500 | 07/19/19 | CAD | 16.87 | CAD | 760 | (5,727 | ) | ||||||||||||||||
| CONSOLIDATED SCHEDULES OF INVESTMENTS | 73 |
| Consolidated Schedule of Investments (unaudited) (continued) June 30, 2019 |
BlackRock Resources & Commodities Strategy Trust (BCX) |
Exchange-Traded Options Written (continued)
| Description | Number of Contracts |
Expiration Date |
Exercise Price |
Notional Amount (000) |
Value | |||||||||||||||||||
| Call (continued) | ||||||||||||||||||||||||
| Stelco Holdings, Inc. |
100 | 07/19/19 | CAD | 15.87 | CAD | 152 | $ | (1,222 | ) | |||||||||||||||
| Suncor Energy, Inc. |
523 | 07/19/19 | CAD | 42.00 | CAD | 2,136 | (9,984 | ) | ||||||||||||||||
| Teck Resources Ltd., Class B |
1,292 | 07/19/19 | USD | 23.00 | USD | 2,979 | (104,006 | ) | ||||||||||||||||
| Tyson Foods, Inc., Class A |
270 | 07/19/19 | USD | 80.00 | USD | 2,180 | (60,075 | ) | ||||||||||||||||
| Vale SA — ADR |
2,042 | 07/19/19 | USD | 13.00 | USD | 2,744 | (146,003 | ) | ||||||||||||||||
| Vale SA — ADR |
612 | 07/19/19 | USD | 14.00 | USD | 823 | (12,852 | ) | ||||||||||||||||
| Valero Energy Corp. |
19 | 07/19/19 | USD | 80.00 | USD | 163 | (11,922 | ) | ||||||||||||||||
| Williams Cos., Inc. |
169 | 07/19/19 | USD | 29.00 | USD | 474 | (2,788 | ) | ||||||||||||||||
| Anadarko Petroleum Corp. |
76 | 07/26/19 | USD | 71.00 | USD | 536 | (8,398 | ) | ||||||||||||||||
| BP PLC — ADR |
688 | 07/26/19 | USD | 42.00 | USD | 2,869 | (49,192 | ) | ||||||||||||||||
| Barrick Gold Corp. |
2,460 | 07/26/19 | USD | 14.00 | USD | 3,879 | (463,710 | ) | ||||||||||||||||
| ConocoPhillips |
146 | 07/26/19 | USD | 60.00 | USD | 891 | (32,485 | ) | ||||||||||||||||
| Deere & Co. |
59 | 07/26/19 | USD | 157.50 | USD | 978 | (60,180 | ) | ||||||||||||||||
| EOG Resources, Inc. |
42 | 07/26/19 | USD | 90.00 | USD | 391 | (21,630 | ) | ||||||||||||||||
| Exxon Mobil Corp. |
223 | 07/26/19 | USD | 75.50 | USD | 1,709 | (67,012 | ) | ||||||||||||||||
| Marathon Petroleum Corp. |
122 | 07/26/19 | USD | 50.50 | USD | 682 | (67,100 | ) | ||||||||||||||||
| Pioneer Natural Resources Co. |
86 | 07/26/19 | USD | 160.00 | USD | 1,323 | (31,820 | ) | ||||||||||||||||
| Royal Dutch Shell PLC — ADR, Class A |
283 | 07/26/19 | USD | 64.50 | USD | 1,841 | (45,988 | ) | ||||||||||||||||
| Teck Resources Ltd., Class B |
500 | 07/26/19 | USD | 22.50 | USD | 1,153 | (64,750 | ) | ||||||||||||||||
| Teck Resources Ltd., Class B |
807 | 07/26/19 | USD | 23.00 | USD | 1,861 | (83,928 | ) | ||||||||||||||||
| Tyson Foods, Inc., Class A |
353 | 07/26/19 | USD | 81.50 | USD | 2,850 | (62,658 | ) | ||||||||||||||||
| Vale SA — ADR |
613 | 07/26/19 | USD | 14.00 | USD | 824 | (17,164 | ) | ||||||||||||||||
| Vale SA — ADR |
1,195 | 07/26/19 | USD | 13.00 | USD | 1,606 | (95,003 | ) | ||||||||||||||||
| Valero Energy Corp. |
84 | 07/26/19 | USD | 77.00 | USD | 719 | (77,490 | ) | ||||||||||||||||
| Williams Cos., Inc. |
42 | 07/26/19 | USD | 28.50 | USD | 118 | (1,785 | ) | ||||||||||||||||
| Williams Cos., Inc. |
157 | 07/26/19 | USD | 27.06 | USD | 440 | (21,263 | ) | ||||||||||||||||
| FMC Corp. |
310 | 07/29/19 | USD | 75.00 | USD | 2,571 | (524,684 | ) | ||||||||||||||||
| Trimble, Inc. |
128 | 07/31/19 | USD | 43.00 | USD | 577 | (37,393 | ) | ||||||||||||||||
| Anadarko Petroleum Corp. |
77 | 08/02/19 | USD | 71.00 | USD | 543 | (10,279 | ) | ||||||||||||||||
| Barrick Gold Corp. |
930 | 08/02/19 | USD | 15.00 | USD | 1,467 | (132,060 | ) | ||||||||||||||||
| ConocoPhillips |
70 | 08/02/19 | USD | 63.00 | USD | 427 | (7,665 | ) | ||||||||||||||||
| Deere & Co. |
68 | 08/02/19 | USD | 172.50 | USD | 1,127 | (15,640 | ) | ||||||||||||||||
| EOG Resources, Inc. |
248 | 08/02/19 | USD | 95.00 | USD | 2,310 | (73,656 | ) | ||||||||||||||||
| Exxon Mobil Corp. |
224 | 08/02/19 | USD | 78.00 | USD | 1,717 | (26,768 | ) | ||||||||||||||||
| Marathon Petroleum Corp. |
191 | 08/02/19 | USD | 52.00 | USD | 1,067 | (99,320 | ) | ||||||||||||||||
| Pioneer Natural Resources Co. |
40 | 08/02/19 | USD | 147.00 | USD | 615 | (45,000 | ) | ||||||||||||||||
| Royal Dutch Shell PLC — ADR, Class A |
163 | 08/02/19 | USD | 66.00 | USD | 1,061 | (16,707 | ) | ||||||||||||||||
| Teck Resources Ltd., Class B |
653 | 08/02/19 | USD | 24.50 | USD | 1,506 | (35,262 | ) | ||||||||||||||||
| Vale SA — ADR |
1,482 | 08/02/19 | USD | 14.00 | USD | 1,992 | (51,870 | ) | ||||||||||||||||
| Valero Energy Corp. |
20 | 08/02/19 | USD | 80.00 | USD | 171 | (14,000 | ) | ||||||||||||||||
| Williams Cos., Inc. |
169 | 08/02/19 | USD | 28.00 | USD | 474 | (13,604 | ) | ||||||||||||||||
| Williams Cos., Inc. |
85 | 08/02/19 | USD | 27.50 | USD | 238 | (9,435 | ) | ||||||||||||||||
| BP PLC — ADR |
758 | 08/09/19 | USD | 43.00 | USD | 3,161 | (44,722 | ) | ||||||||||||||||
| ConocoPhillips |
352 | 08/09/19 | USD | 61.82 | USD | 2,147 | (59,655 | ) | ||||||||||||||||
| Exxon Mobil Corp. |
268 | 08/09/19 | USD | 78.50 | USD | 2,054 | (30,552 | ) | ||||||||||||||||
| Royal Dutch Shell PLC — ADR, Class A |
511 | 08/09/19 | USD | 66.00 | USD | 3,325 | (60,043 | ) | ||||||||||||||||
| Teck Resources Ltd., Class B |
656 | 08/09/19 | USD | 24.00 | USD | 1,513 | (52,152 | ) | ||||||||||||||||
| Tractor Supply Co. |
268 | 08/09/19 | USD | 110.00 | USD | 2,916 | (108,540 | ) | ||||||||||||||||
| Tyson Foods, Inc., Class A |
270 | 08/09/19 | USD | 82.00 | USD | 2,180 | (70,200 | ) | ||||||||||||||||
| Vale SA — ADR |
446 | 08/09/19 | USD | 14.00 | USD | 599 | (17,840 | ) | ||||||||||||||||
| BP PLC — ADR |
815 | 08/16/19 | USD | 43.00 | USD | 3,399 | (48,085 | ) | ||||||||||||||||
| Barrick Gold Corp. |
1,657 | 08/16/19 | USD | 17.00 | USD | 2,613 | (57,995 | ) | ||||||||||||||||
| Concho Resources, Inc. |
78 | 08/16/19 | USD | 110.00 | USD | 805 | (24,960 | ) | ||||||||||||||||
| ConocoPhillips |
145 | 08/16/19 | USD | 62.50 | USD | 885 | (23,055 | ) | ||||||||||||||||
| Deere & Co. |
69 | 08/16/19 | USD | 150.00 | USD | 1,143 | (124,200 | ) | ||||||||||||||||
| Deere & Co. |
59 | 08/16/19 | USD | 160.00 | USD | 978 | (61,213 | ) | ||||||||||||||||
| Deere & Co. |
91 | 08/16/19 | USD | 170.00 | USD | 1,508 | (45,045 | ) | ||||||||||||||||
| EOG Resources, Inc. |
88 | 08/16/19 | USD | 97.50 | USD | 820 | (22,528 | ) | ||||||||||||||||
| Exxon Mobil Corp. |
362 | 08/16/19 | USD | 77.50 | USD | 2,774 | (57,739 | ) | ||||||||||||||||
| FMC Corp. |
240 | 08/16/19 | USD | 85.00 | USD | 1,991 | (51,000 | ) | ||||||||||||||||
| First Quantum Minerals Ltd. |
411 | 08/16/19 | CAD | 13.00 | CAD | 511 | (16,477 | ) | ||||||||||||||||
| Ingredion, Inc. |
213 | 08/16/19 | USD | 85.00 | USD | 1,757 | (40,470 | ) | ||||||||||||||||
| 74 | 2019 BLACKROCK SEMI-ANNUAL REPORT TO SHAREHOLDERS |
| Consolidated Schedule of Investments (unaudited) (continued) June 30, 2019 |
BlackRock Resources & Commodities Strategy Trust (BCX) |
Exchange-Traded Options Written (continued)
| Description | Number of Contracts |
Expiration Date |
Exercise Price |
Notional Amount (000) |
Value | |||||||||||||||||||
| Call (continued) | ||||||||||||||||||||||||
| Marathon Petroleum Corp. |
183 | 08/16/19 | USD | 55.00 | USD | 1,023 | $ | (63,593 | ) | |||||||||||||||
| Nutrien Ltd. |
536 | 08/16/19 | CAD | 74.00 | CAD | 3,755 | (15,553 | ) | ||||||||||||||||
| Rio Tinto PLC — ADR |
584 | 08/16/19 | USD | 62.50 | USD | 3,641 | (113,880 | ) | ||||||||||||||||
| Royal Dutch Shell PLC — ADR, Class A |
434 | 08/16/19 | USD | 65.00 | USD | 2,824 | (72,695 | ) | ||||||||||||||||
| Suncor Energy, Inc. |
645 | 08/16/19 | CAD | 44.00 | CAD | 2,635 | (11,082 | ) | ||||||||||||||||
| Trimble, Inc. |
345 | 08/16/19 | USD | 45.00 | USD | 1,556 | (71,588 | ) | ||||||||||||||||
| Vale SA — ADR |
416 | 08/16/19 | USD | 14.00 | USD | 559 | (18,928 | ) | ||||||||||||||||
| Valero Energy Corp. |
58 | 08/16/19 | USD | 85.00 | USD | 497 | (22,040 | ) | ||||||||||||||||
| Williams Cos., Inc. |
42 | 08/16/19 | USD | 29.00 | USD | 118 | (2,037 | ) | ||||||||||||||||
| Williams Cos., Inc. |
85 | 08/16/19 | USD | 28.00 | USD | 238 | (8,117 | ) | ||||||||||||||||
| Albemarle Corp. |
213 | 09/20/19 | USD | 75.00 | USD | 1,500 | (50,055 | ) | ||||||||||||||||
| Williams Cos., Inc. |
84 | 09/20/19 | USD | 29.00 | USD | 236 | (6,048 | ) | ||||||||||||||||
|
|
|
|||||||||||||||||||||||
| $ | (6,656,221 | ) | ||||||||||||||||||||||
|
|
|
|||||||||||||||||||||||
OTC Options Written
| Description | Counterparty | Number of Contracts |
Expiration Date |
Exercise Price |
Notional Amount (000) |
Value | ||||||||||||||||||||
| Call | ||||||||||||||||||||||||||
| Stelco Holdings, Inc. |
UBS AG | 50,000 | 07/02/19 | CAD | 17.13 | CAD | 760 | $ | (35 | ) | ||||||||||||||||
| CNOOC Ltd. |
JPMorgan Chase Bank N.A. | 500,000 | 07/09/19 | HKD | 13.61 | HKD | 6,660 | (10,146 | ) | |||||||||||||||||
| Eni SpA |
Morgan Stanley & Co. International PLC | 115,300 | 07/09/19 | EUR | 14.70 | EUR | 1,686 | (18,941 | ) | |||||||||||||||||
| Fresnillo PLC |
Morgan Stanley & Co. International PLC | 147,700 | 07/09/19 | GBP | 7.67 | GBP | 1,288 | (197,554 | ) | |||||||||||||||||
| Ingredion, Inc. |
Barclays Bank PLC | 17,000 | 07/09/19 | USD | 97.25 | USD | 1,402 | — | ||||||||||||||||||
| Nutrien Ltd. |
Goldman Sachs International | 40,100 | 07/09/19 | CAD | 66.78 | CAD | 2,809 | (103,207 | ) | |||||||||||||||||
| Rio Tinto PLC — ADR |
Citibank N.A. | 30,000 | 07/09/19 | USD | 61.45 | USD | 1,870 | (44,767 | ) | |||||||||||||||||
| Stelco Holdings, Inc. |
Morgan Stanley & Co. International PLC | 53,000 | 07/09/19 | CAD | 17.52 | CAD | 806 | (2,676 | ) | |||||||||||||||||
| Umicore SA |
Goldman Sachs International | 20,000 | 07/09/19 | EUR | 30.51 | EUR | 564 | (5,243 | ) | |||||||||||||||||
| Albemarle Corp. |
Credit Suisse International | 13,800 | 07/10/19 | USD | 74.03 | USD | 972 | (3,676 | ) | |||||||||||||||||
| Gazprom PJSC — ADR |
Goldman Sachs International | 522,000 | 07/10/19 | USD | 6.74 | USD | 3,831 | (327,456 | ) | |||||||||||||||||
| Suncor Energy, Inc. |
UBS AG | 43,000 | 07/10/19 | CAD | 44.76 | CAD | 1,757 | (44 | ) | |||||||||||||||||
| Trimble, Inc. |
JPMorgan Chase Bank N.A. | 22,800 | 07/10/19 | USD | 41.80 | USD | 1,029 | (79,019 | ) | |||||||||||||||||
| First Quantum Minerals Ltd. |
Goldman Sachs International | 366,800 | 07/11/19 | CAD | 10.73 | CAD | 3,477 | (487,104 | ) | |||||||||||||||||
| Stelco Holdings, Inc. |
Credit Suisse International | 40,000 | 07/11/19 | CAD | 16.70 | CAD | 608 | (2,598 | ) | |||||||||||||||||
| Anglo American PLC |
Goldman Sachs International | 128,700 | 07/12/19 | GBP | 19.85 | GBP | 2,896 | (435,529 | ) | |||||||||||||||||
| Graphic Packaging Holding Co. |
Credit Suisse International | 85,400 | 07/12/19 | USD | 13.41 | USD | 1,194 | (61,345 | ) | |||||||||||||||||
| Nutrien Ltd. |
Citibank N.A. | 46,700 | 07/12/19 | CAD | 68.09 | CAD | 3,271 | (81,065 | ) | |||||||||||||||||
| Stelco Holdings, Inc. |
Credit Suisse International | 25,000 | 07/12/19 | CAD | 15.87 | CAD | 380 | (1,922 | ) | |||||||||||||||||
| TOTAL SA |
Credit Suisse International | 66,700 | 07/12/19 | EUR | 49.91 | EUR | 3,290 | (33,077 | ) | |||||||||||||||||
| BHP Group PLC |
Goldman Sachs International | 26,000 | 07/16/19 | GBP | 18.43 | GBP | 524 | (57,933 | ) | |||||||||||||||||
| BHP Group PLC |
UBS AG | 218,600 | 07/16/19 | GBP | 18.20 | GBP | 4,403 | (546,241 | ) | |||||||||||||||||
| Glanbia PLC |
UBS AG | 77,400 | 07/16/19 | EUR | 16.18 | EUR | 1,107 | (339 | ) | |||||||||||||||||
| Anglo American PLC |
Goldman Sachs International | 259,172 | 07/17/19 | GBP | 19.54 | GBP | 5,831 | (981,771 | ) | |||||||||||||||||
| Oz Minerals Ltd. |
UBS AG | 63,700 | 07/17/19 | AUD | 9.46 | AUD | 642 | (31,835 | ) | |||||||||||||||||
| TOTAL SA |
Goldman Sachs International | 72,000 | 07/17/19 | EUR | 47.56 | EUR | 3,552 | (166,944 | ) | |||||||||||||||||
| Umicore SA |
Credit Suisse International | 44,000 | 07/17/19 | EUR | 27.32 | EUR | 1,242 | (64,390 | ) | |||||||||||||||||
| Umicore SA |
Goldman Sachs International | 45,000 | 07/17/19 | EUR | 27.60 | EUR | 1,270 | (57,565 | ) | |||||||||||||||||
| Graphic Packaging Holding Co. |
Credit Suisse International | 85,200 | 07/19/19 | USD | 13.61 | USD | 1,191 | (56,212 | ) | |||||||||||||||||
| Trimble, Inc. |
Citibank N.A. | 34,500 | 07/19/19 | USD | 41.92 | USD | 1,556 | (114,668 | ) | |||||||||||||||||
| CNOOC Ltd. |
JPMorgan Chase Bank N.A. | 660,000 | 07/23/19 | HKD | 13.64 | HKD | 8,791 | (23,588 | ) | |||||||||||||||||
| Fresnillo PLC |
Goldman Sachs International | 139,600 | 07/23/19 | GBP | 7.52 | GBP | 1,217 | (213,502 | ) | |||||||||||||||||
| TOTAL SA |
Deutsche Bank AG | 27,400 | 07/23/19 | EUR | 47.57 | EUR | 1,352 | (64,717 | ) | |||||||||||||||||
| Umicore SA |
Credit Suisse International | 33,700 | 07/23/19 | EUR | 28.34 | EUR | 951 | (33,136 | ) | |||||||||||||||||
| Eni SpA |
UBS AG | 140,000 | 07/24/19 | EUR | 14.13 | EUR | 2,047 | (96,261 | ) | |||||||||||||||||
| Glanbia PLC |
Goldman Sachs International | 77,400 | 07/24/19 | EUR | 15.65 | EUR | 1,107 | (2,069 | ) | |||||||||||||||||
| Nestle SA, Registered Shares |
Goldman Sachs International | 32,600 | 07/24/19 | CHF | 102.13 | CHF | 3,295 | (29,671 | ) | |||||||||||||||||
| Nutrien Ltd. |
Credit Suisse International | 53,500 | 07/24/19 | CAD | 72.02 | CAD | 3,748 | (16,148 | ) | |||||||||||||||||
| Nutrien Ltd. |
Goldman Sachs International | 41,100 | 07/24/19 | CAD | 69.75 | CAD | 2,879 | (43,883 | ) | |||||||||||||||||
| Oz Minerals Ltd. |
JPMorgan Chase Bank N.A. | 109,400 | 07/24/19 | AUD | 9.50 | AUD | 1,103 | (55,458 | ) | |||||||||||||||||
| First Quantum Minerals Ltd. |
Goldman Sachs International | 114,000 | 07/25/19 | CAD | 10.41 | CAD | 1,081 | (183,333 | ) | |||||||||||||||||
| Stelco Holdings, Inc. |
Credit Suisse International | 27,000 | 07/25/19 | CAD | 15.29 | CAD | 410 | (8,665 | ) | |||||||||||||||||
| CONSOLIDATED SCHEDULES OF INVESTMENTS | 75 |
| Consolidated Schedule of Investments (unaudited) (continued) June 30, 2019 |
BlackRock Resources & Commodities Strategy Trust (BCX) |
OTC Options Written (continued)
| Description | Counterparty | Number of Contracts |
Expiration Date |
Exercise Price |
Notional Amount (000) |
Value | ||||||||||||||||||||
| Call (continued) | ||||||||||||||||||||||||||
| Trimble, Inc. |
UBS AG | 38,800 | 07/25/19 | USD | 42.24 | USD | 1,750 | $ | (133,606 | ) | ||||||||||||||||
| FMC Corp. |
Citibank N.A. | 24,000 | 07/26/19 | USD | 84.47 | USD | 1,991 | (38,299 | ) | |||||||||||||||||
| Fresnillo PLC |
Morgan Stanley & Co. International PLC | 91,300 | 07/26/19 | GBP | 8.11 | GBP | 796 | (80,872 | ) | |||||||||||||||||
| Graphic Packaging Holding Co. |
Credit Suisse International | 78,600 | 07/26/19 | USD | 14.41 | USD | 1,099 | (25,907 | ) | |||||||||||||||||
| Packaging Corp. of America |
Credit Suisse International | 40,300 | 07/26/19 | USD | 97.19 | USD | 3,841 | (95,897 | ) | |||||||||||||||||
| Rio Tinto PLC — ADR |
Barclays Bank PLC | 34,800 | 07/26/19 | USD | 61.97 | USD | 2,169 | (62,706 | ) | |||||||||||||||||
| Stelco Holdings, Inc. |
Morgan Stanley & Co. International PLC | 50,000 | 07/29/19 | CAD | 15.67 | CAD | 760 | (11,339 | ) | |||||||||||||||||
| Anglo American PLC |
UBS AG | 110,800 | 07/31/19 | GBP | 21.60 | GBP | 2,493 | (180,673 | ) | |||||||||||||||||
| BHP Group PLC |
JPMorgan Chase Bank N.A. | 257,000 | 07/31/19 | GBP | 19.61 | GBP | 5,176 | (296,262 | ) | |||||||||||||||||
| Eni SpA |
UBS AG | 115,400 | 07/31/19 | EUR | 14.20 | EUR | 1,687 | (75,791 | ) | |||||||||||||||||
| Kerry Group PLC, Class A |
Morgan Stanley & Co. International PLC | 21,200 | 07/31/19 | EUR | 108.63 | EUR | 2,226 | (23,860 | ) | |||||||||||||||||
| Oz Minerals Ltd. |
Morgan Stanley & Co. International PLC | 130,000 | 07/31/19 | AUD | 9.72 | AUD | 1,310 | (53,998 | ) | |||||||||||||||||
| First Quantum Minerals Ltd. |
Credit Suisse International | 82,300 | 08/01/19 | CAD | 11.80 | CAD | 780 | (62,637 | ) | |||||||||||||||||
| Glanbia PLC |
UBS AG | 60,000 | 08/02/19 | EUR | 15.10 | EUR | 858 | (8,927 | ) | |||||||||||||||||
| Graphic Packaging Holding Co. |
Credit Suisse International | 78,600 | 08/02/19 | USD | 14.41 | USD | 1,099 | (32,367 | ) | |||||||||||||||||
| Nutrien Ltd. |
Credit Suisse International | 53,300 | 08/02/19 | CAD | 70.41 | CAD | 3,734 | (64,877 | ) | |||||||||||||||||
| Stelco Holdings, Inc. |
Morgan Stanley & Co. International PLC | 35,000 | 08/02/19 | CAD | 15.48 | CAD | 532 | (10,770 | ) | |||||||||||||||||
| TOTAL SA |
Morgan Stanley & Co. International PLC | 70,200 | 08/02/19 | EUR | 48.32 | EUR | 3,463 | (135,627 | ) | |||||||||||||||||
| Fresnillo PLC |
Goldman Sachs International | 71,100 | 08/06/19 | GBP | 8.52 | GBP | 620 | (41,736 | ) | |||||||||||||||||
| Kerry Group PLC, Class A |
UBS AG | 21,700 | 08/06/19 | EUR | 107.59 | EUR | 2,279 | (39,309 | ) | |||||||||||||||||
| Stelco Holdings, Inc. |
Citibank N.A. | 30,000 | 08/06/19 | CAD | 15.73 | CAD | 456 | (7,607 | ) | |||||||||||||||||
| Suncor Energy, Inc. |
Royal Bank of Canada | 39,000 | 08/06/19 | CAD | 41.62 | CAD | 1,593 | (17,671 | ) | |||||||||||||||||
| TOTAL SA |
Morgan Stanley & Co. International PLC | 60,500 | 08/06/19 | EUR | 48.80 | EUR | 2,984 | (98,013 | ) | |||||||||||||||||
| Anglo American PLC |
Goldman Sachs International | 91,700 | 08/07/19 | GBP | 22.39 | GBP | 2,063 | (101,906 | ) | |||||||||||||||||
| BHP Group PLC |
UBS AG | 208,200 | 08/07/19 | GBP | 20.47 | GBP | 4,193 | (126,039 | ) | |||||||||||||||||
| CNOOC Ltd. |
JPMorgan Chase Bank N.A. | 1,230,000 | 08/07/19 | HKD | 12.42 | HKD | 16,384 | (170,442 | ) | |||||||||||||||||
| JBS SA |
Goldman Sachs International | 377,000 | 08/07/19 | USD | 21.76 | USD | 8,000 | (83,505 | ) | |||||||||||||||||
| Oz Minerals Ltd. |
JPMorgan Chase Bank N.A. | 130,000 | 08/08/19 | AUD | 10.23 | AUD | 1,310 | (32,603 | ) | |||||||||||||||||
| First Quantum Minerals Ltd. |
Citibank N.A. | 41,500 | 08/09/19 | CAD | 12.80 | CAD | 393 | (17,419 | ) | |||||||||||||||||
| Glanbia PLC |
Morgan Stanley & Co. International PLC | 40,000 | 08/14/19 | EUR | 14.88 | EUR | 572 | (11,109 | ) | |||||||||||||||||
| Glanbia PLC |
UBS AG | 53,100 | 08/14/19 | EUR | 15.26 | EUR | 759 | (9,140 | ) | |||||||||||||||||
| Kerry Group PLC, Class A |
Credit Suisse International | 16,700 | 08/14/19 | EUR | 109.45 | EUR | 1,754 | (21,124 | ) | |||||||||||||||||
| Oz Minerals Ltd. |
Goldman Sachs International | 140,800 | 08/14/19 | AUD | 10.24 | AUD | 1,419 | (37,871 | ) | |||||||||||||||||
| TOTAL SA |
Morgan Stanley & Co. International PLC | 44,900 | 08/14/19 | EUR | 49.68 | EUR | 2,215 | (56,148 | ) | |||||||||||||||||
| Franco-Nevada Corp. |
Royal Bank of Canada | 28,300 | 08/19/19 | CAD | 111.00 | CAD | 2,402 | (81,039 | ) | |||||||||||||||||
| First Quantum Minerals Ltd. |
Goldman Sachs International | 63,000 | 08/23/19 | CAD | 12.40 | CAD | 597 | (39,049 | ) | |||||||||||||||||
| Suncor Energy, Inc. |
Credit Suisse International | 43,000 | 08/28/19 | CAD | 43.01 | CAD | 1,757 | (15,546 | ) | |||||||||||||||||
|
|
|
|||||||||||||||||||||||||
| $ | (7,145,424 | ) | ||||||||||||||||||||||||
|
|
|
|||||||||||||||||||||||||
Balances Reported in the Consolidated Statements of Assets and Liabilities for Options Written
| Swap Premium Paid |
Swap Premium Received |
Unrealized Appreciation |
Unrealized Depreciation |
Value | ||||||||||||||||
| Options Written |
N/A | N/A | $ | 869,038 | $ | (7,749,453 | ) | $ | (13,801,645 | ) | ||||||||||
Derivative Financial Instruments Categorized by Risk Exposure
As of period end, the fair values of derivative financial instruments located in the Consolidated Statements of Assets and Liabilities were as follows:
| Commodity Contracts |
Credit Contracts |
Equity Contracts |
Foreign Currency Exchange Contracts |
Interest Rate Contracts |
Other Contracts |
Total | ||||||||||||||||||||||
| Liabilities — Derivative Financial Instrument |
| |||||||||||||||||||||||||||
| Options written |
| |||||||||||||||||||||||||||
| Options written at value |
$ | — | $ | — | $ | 13,801,645 | $ | — | $ | — | $ | — | $ | 13,801,645 | ||||||||||||||
|
|
|
|
|
|
|
|
|
|
|
|
|
|
|
|||||||||||||||
| 76 | 2019 BLACKROCK SEMI-ANNUAL REPORT TO SHAREHOLDERS |
| Consolidated Schedule of Investments (unaudited) (continued) June 30, 2019 |
BlackRock Resources & Commodities Strategy Trust (BCX) |
For the six months ended June 30, 2019, the effect of derivative financial instruments in the Consolidated Statements of Operations was as follows:
| Commodity Contracts |
Credit Contracts |
Equity Contracts |
Foreign Currency Exchange Contracts |
Interest Rate Contracts |
Other Contracts |
Total | ||||||||||||||||||||||
| Net Realized Gain (Loss) from: |
||||||||||||||||||||||||||||
| Options purchased(a) |
$ | — | $ | — | $ | (10,135 | ) | $ | — | $ | — | $ | — | $ | (10,135 | ) | ||||||||||||
| Options written |
— | — | 3,772,773 | — | — | — | 3,772,773 | |||||||||||||||||||||
|
|
|
|
|
|
|
|
|
|
|
|
|
|
|
|||||||||||||||
| $ | — | $ | — | $ | 3,762,638 | $ | — | $ | — | $ | — | $ | 3,762,638 | |||||||||||||||
|
|
|
|
|
|
|
|
|
|
|
|
|
|
|
|||||||||||||||
| (a) | Options purchased are included in net realized gain (loss) from investments. |
| Commodity Contracts |
Credit Contracts |
Equity Contracts |
Foreign Currency Exchange Contracts |
Interest Rate Contracts |
Other Contracts |
Total | ||||||||||||||||||||||
| Net Change in Unrealized Appreciation (Depreciation) on: |
||||||||||||||||||||||||||||
| Options purchased(a) |
$ | — | $ | — | $ | (3,011 | ) | $ | — | $ | — | $ | — | $ | (3,011 | ) | ||||||||||||
| Options written |
— | — | (11,136,585 | ) | — | — | — | (11,136,585 | ) | |||||||||||||||||||
|
|
|
|
|
|
|
|
|
|
|
|
|
|
|
|||||||||||||||
| $ | — | $ | — | $ | (11,139,596 | ) | $ | — | $ | — | $ | — | $ | (11,139,596 | ) | |||||||||||||
|
|
|
|
|
|
|
|
|
|
|
|
|
|
|
|||||||||||||||
| (a) | Options purchased are included in net change in unrealized appreciation (depreciation) on investments |
Average Quarterly Balances of Outstanding Derivative Financial Instruments
| Options: |
| |||
| Average market value of option contracts purchased |
$ | — | (a) | |
| Average market value of option contracts written |
$ | 10,653,823 | ||
| (a) | Derivative not held at quarter-end. The risk exposure table serves as an indicator of activity during the period. |
For more information about the Trust’s Investment risks regarding derivative financial instruments, refer to the Notes to Financial Statements
Derivative Financial Instruments — Offsetting as of Period End
The Trust’s derivative assets and liabilities (by type) are as follows:
| Assets | Liabilities | |||||||
| Derivative Financial Instruments: |
||||||||
| Options |
$ | — | $ | 13,801,645 | ||||
| Derivatives not subject to a Master Netting Agreement or similar agreement (“MNA”) |
— | (6,656,221 | ) | |||||
|
|
|
|
|
|||||
| Total derivative assets and liabilities subject to an MNA |
$ | — | $ | 7,145,424 | ||||
|
|
|
|
|
|||||
The following table presents the Trust’s derivative assets (and liabilities) by counterparty net of amounts available for offset under an MNA and net of the related collateral received (and pledged) by the Trust:
| Counterparty | Derivative Liabilities Subject to an MNA by Counterparty |
Derivatives Available for Offset |
Non-cash Collateral Pledged (a) |
Cash Collateral Pledged |
Net Amount of Derivative Liabilities (b) |
|||||||||||||||
| Barclays Bank PLC |
$ | 62,706 | $ | — | $ | (62,706 | ) | $ | — | $ | — | |||||||||
| Citibank N.A. |
303,825 | — | (303,825 | ) | — | — | ||||||||||||||
| Credit Suisse International |
599,524 | — | (599,524 | ) | — | — | ||||||||||||||
| Deutsche Bank AG |
64,717 | — | — | — | 64,717 | |||||||||||||||
| Goldman Sachs International |
3,399,277 | — | (3,399,277 | ) | — | — | ||||||||||||||
| JPMorgan Chase Bank N.A. |
667,518 | — | (667,518 | ) | — | — | ||||||||||||||
| Morgan Stanley & Co. International PLC |
700,907 | — | (700,907 | ) | — | — | ||||||||||||||
| Royal Bank of Canada |
98,710 | — | — | — | 98,710 | |||||||||||||||
| UBS AG |
1,248,240 | — | (1,248,240 | ) | — | — | ||||||||||||||
|
|
|
|
|
|
|
|
|
|
|
|||||||||||
| $ | 7,145,424 | $ | — | $ | (6,981,997 | ) | $ | — | $ | 163,427 | ||||||||||
|
|
|
|
|
|
|
|
|
|
|
|||||||||||
| (a) | Excess of collateral pledged to the individual counterparty is not shown for financial reporting purposes. |
| (b) | Net amount represents the net amount payable due to counterparty in the event of default. Net amount may be offset further by the options written receivable/payable on the Statements of Assets and Liabilities. |
| CONSOLIDATED SCHEDULES OF INVESTMENTS | 77 |
| Consolidated Schedule of Investments (unaudited) (continued) June 30, 2019 |
BlackRock Resources & Commodities Strategy Trust (BCX) |
Fair Value Hierarchy as of Period End
Various inputs are used in determining the fair value of investments and derivative financial instruments. For information about the Trust’s policy regarding valuation of investments and derivative financial instruments, refer to the Notes to Financial Statements.
The following tables summarize the Trust’s investments and derivative financial instruments categorized in the disclosure hierarchy:
| Level 1 | Level 2 | Level 3 | Total | |||||||||||||
| Assets: |
| |||||||||||||||
| Investments: |
| |||||||||||||||
| Common Stocks: |
| |||||||||||||||
| Chemicals |
$ | 76,435,803 | $ | 11,305,204 | $ | — | $ | 87,741,007 | ||||||||
| Containers & Packaging |
29,286,028 | — | — | 29,286,028 | ||||||||||||
| Electronic Equipment, Instruments & Components |
16,179,378 | — | — | 16,179,378 | ||||||||||||
| Food Products |
62,220,396 | 20,970,199 | — | 83,190,595 | ||||||||||||
| Machinery |
14,339,218 | — | — | 14,339,218 | ||||||||||||
| Metals & Mining |
173,864,099 | 130,171,447 | — | 304,035,546 | ||||||||||||
| Oil, Gas & Consumable Fuels |
213,369,373 | 86,441,713 | — | 299,811,086 | ||||||||||||
| Paper & Forest Products |
— | 163,901 | 54 | 163,955 | ||||||||||||
| Pharmaceuticals |
7,281,019 | — | — | 7,281,019 | ||||||||||||
| Specialty Retail |
15,833,881 | — | — | 15,833,881 | ||||||||||||
| Corporate Bonds |
4,449,912 | 9,991,926 | — | 14,441,838 | ||||||||||||
| Short-Term Securities |
4,383,896 | — | — | 4,383,896 | ||||||||||||
|
|
|
|
|
|
|
|
|
|||||||||
| Subtotal |
$ | 617,643,003 | $ | 259,044,390 | $ | 54 | $ | 876,687,447 | ||||||||
|
|
|
|
|
|
|
|
|
|||||||||
| Investments Valued at NAV(a) |
480,921 | |||||||||||||||
|
|
|
|||||||||||||||
| Total Investments |
$ | 877,168,368 | ||||||||||||||
|
|
|
|||||||||||||||
| Derivative Financial Instruments(b) |
| |||||||||||||||
| Liabilities: |
| |||||||||||||||
| Equity contracts |
$ | (5,422,246 | ) | $ | (8,379,399 | ) | $ | — | $ | (13,801,645 | ) | |||||
|
|
|
|
|
|
|
|
|
|||||||||
| (a) | Certain investments of the Trust were fair valued using net asset value (“NAV”) per share as no quoted market value is available and therefore have been excluded from the fair value hierarchy. |
| (b) | Derivative financial instruments are options written, which are shown at value. |
A reconciliation of Level 3 investments is presented when the Trust had a significant amount of Level 3 investments at the beginning and/or rend of the period in relation to net assets. The following table is a reconciliation of Level 3 investments for which significant unobservable inputs were used in determining fair value:
| Common Stocks |
Corporate Bonds |
Total | ||||||||||
| Assets: |
||||||||||||
| Opening Balance, as of December 31, 2018 |
$ | 15,030,251 | $ | 1,578,600 | $ | 16,608,851 | ||||||
| Transfers into Level 3 |
— | — | — | |||||||||
| Transfers out of Level 3 |
— | — | — | |||||||||
| Accrued discounts/premiums |
— | — | — | |||||||||
| Net realized gain (loss) |
(139,631 | ) | 90,000 | (49,631 | ) | |||||||
| Net change in unrealized appreciation (depreciation)(a)(b) |
(2,482,916 | ) | 188,640 | (2,294,276 | ) | |||||||
| Purchases |
— | — | — | |||||||||
| Sales |
(12,407,650 | ) | (1,857,240 | ) | (14,264,890 | ) | ||||||
|
|
|
|
|
|
|
|||||||
| Closing Balance, as of June 30, 2019 |
$ | 54 | $ | — | $ | 54 | ||||||
|
|
|
|
|
|
|
|||||||
| Net change in unrealized appreciation (depreciation) on investments still held at June 30, 2019(b) |
$ | 170,138 | $ | — | $ | 170,138 | ||||||
|
|
|
|
|
|
|
|||||||
| (a) | Included in the related net change in unrealized appreciation (depreciation) in the Statements of Operations. |
| (b) | Any difference between net change in unrealized appreciation (depreciation) and net change in unrealized appreciation (depreciation) on derivative financial instruments still held at June 30, 2019 is generally due to derivative financial instruments no longer held or categorized as Level 3 at period end. |
See notes to financial statements.
| 78 | 2019 BLACKROCK SEMI-ANNUAL REPORT TO SHAREHOLDERS |
| Schedule of Investments (unaudited) June 30, 2019 |
BlackRock Science and Technology Trust (BST) (Percentages shown are based on Net Assets) |
| SCHEDULES OF INVESTMENTS | 79 |
| Schedule of Investments (unaudited) (continued) June 30, 2019 |
BlackRock Science and Technology Trust (BST) (Percentages shown are based on Net Assets) |
| (i) | During the six months ended June 30, 2019, investments in issuers considered to be an affiliate/affiliates of the Trust for purposes of Section 2(a)(3) of the Investment Company Act of 1940, as amended, were as follows: |
| Affiliate | Shares Held at 12/31/18 |
Net Activity |
Shares Held at 06/30/19 |
Value at 06/30/19 |
Income | Net Realized Gain (Loss) (a) |
Change in Unrealized Appreciation (Depreciation) |
|||||||||||||||||||||
| BlackRock Liquidity Funds, T-Fund, Institutional Class |
4,738,937 | (3,741,723 | ) | 997,214 | $ | 997,214 | $ | 25,464 | $ | — | $ | — | ||||||||||||||||
| SL Liquidity Series, LLC, Money Market Series |
1,710,252 | 582,021 | 2,292,273 | 2,292,961 | 210,322 | (b) | 278 | 600 | ||||||||||||||||||||
|
|
|
|
|
|
|
|
|
|||||||||||||||||||||
| $ | 3,290,175 | $ | 235,786 | $ | 278 | $ | 600 | |||||||||||||||||||||
|
|
|
|
|
|
|
|
|
|||||||||||||||||||||
| (a) | Includes net capital gain distributions, if applicable. |
| (b) | All or a portion represents securities lending income earned from the reinvestment of cash collateral from loaned securities, net of fees and collateral investment expenses, and other payments to and from borrowers of securities. |
For Trust compliance purposes, the Trust’s sector classifications refer to one or more of the sector sub-classifications used by one or more widely recognized market indexes or rating group indexes, and/or as defined by the investment adviser. These definitions may not apply for purposes of this report, which may combine such sector sub-classifications for reporting ease.
| 80 | 2019 BLACKROCK SEMI-ANNUAL REPORT TO SHAREHOLDERS |
| Schedule of Investments (unaudited) (continued) June 30, 2019 |
BlackRock Science and Technology Trust (BST) |
Derivative Financial Instruments Outstanding as of Period End
Exchange-Traded Options Written
| Description | Number of Contracts |
Expiration Date |
Exercise Price |
Notional Amount (000) |
Value | |||||||||||||||||||
| Call | ||||||||||||||||||||||||
| Microsoft Corp. |
76 | 07/05/19 | USD | 132.00 | USD | 1,018 | $ | (20,520 | ) | |||||||||||||||
| Avalara, Inc. |
165 | 07/09/19 | USD | 76.80 | USD | 1,191 | (17,917 | ) | ||||||||||||||||
| Advanced Micro Devices, Inc. |
309 | 07/12/19 | USD | 32.00 | USD | 938 | (16,068 | ) | ||||||||||||||||
| Alibaba Group Holding Ltd. — ADR |
151 | 07/12/19 | USD | 160.00 | USD | 2,559 | (163,458 | ) | ||||||||||||||||
| Amazon.com, Inc. |
17 | 07/12/19 | USD | 1,905.00 | USD | 3,219 | (45,603 | ) | ||||||||||||||||
| Apple, Inc. |
112 | 07/12/19 | USD | 190.00 | USD | 2,217 | (108,640 | ) | ||||||||||||||||
| Atlassian Corp. PLC, Class A |
92 | 07/12/19 | USD | 135.00 | USD | 1,204 | (25,300 | ) | ||||||||||||||||
| Autodesk, Inc. |
60 | 07/12/19 | USD | 170.00 | USD | 977 | (6,060 | ) | ||||||||||||||||
| Lam Research Corp. |
60 | 07/12/19 | USD | 200.00 | USD | 1,127 | (10,890 | ) | ||||||||||||||||
| Marvell Technology Group Ltd. |
211 | 07/12/19 | USD | 23.50 | USD | 504 | (16,141 | ) | ||||||||||||||||
| Marvell Technology Group Ltd. |
103 | 07/12/19 | USD | 25.00 | USD | 246 | (1,751 | ) | ||||||||||||||||
| Mastercard, Inc., Class A |
61 | 07/12/19 | USD | 270.00 | USD | 1,614 | (10,736 | ) | ||||||||||||||||
| Microsoft Corp. |
158 | 07/12/19 | USD | 128.00 | USD | 2,117 | (101,515 | ) | ||||||||||||||||
| Netflix, Inc. |
18 | 07/12/19 | USD | 365.00 | USD | 661 | (18,180 | ) | ||||||||||||||||
| Netflix, Inc. |
12 | 07/12/19 | USD | 370.00 | USD | 441 | (8,820 | ) | ||||||||||||||||
| PayPal Holdings, Inc. |
95 | 07/12/19 | USD | 113.00 | USD | 1,087 | (29,165 | ) | ||||||||||||||||
| ServiceNow, Inc. |
33 | 07/12/19 | USD | 275.00 | USD | 906 | (24,090 | ) | ||||||||||||||||
| ServiceNow, Inc. |
29 | 07/12/19 | USD | 285.00 | USD | 796 | (8,990 | ) | ||||||||||||||||
| Shopify, Inc. |
35 | 07/12/19 | USD | 310.00 | USD | 1,051 | (21,700 | ) | ||||||||||||||||
| Xilinx, Inc. |
58 | 07/12/19 | USD | 116.00 | USD | 684 | (31,900 | ) | ||||||||||||||||
| Yandex NV, Class A |
215 | 07/12/19 | USD | 38.00 | USD | 817 | (20,425 | ) | ||||||||||||||||
| Zscaler, Inc. |
38 | 07/12/19 | USD | 72.00 | USD | 291 | (23,560 | ) | ||||||||||||||||
| salesforce.com, Inc. |
48 | 07/12/19 | USD | 165.00 | USD | 728 | (720 | ) | ||||||||||||||||
| Microsoft Corp. |
75 | 07/16/19 | USD | 129.50 | USD | 1,005 | (42,695 | ) | ||||||||||||||||
| 58.com, Inc. — ADR |
87 | 07/19/19 | USD | 70.00 | USD | 541 | (1,957 | ) | ||||||||||||||||
| Adobe, Inc. |
38 | 07/19/19 | USD | 285.00 | USD | 1,120 | (49,400 | ) | ||||||||||||||||
| Advanced Micro Devices, Inc. |
154 | 07/19/19 | USD | 30.00 | USD | 468 | (25,564 | ) | ||||||||||||||||
| Alibaba Group Holding Ltd. — ADR |
60 | 07/19/19 | USD | 155.00 | USD | 1,017 | (93,600 | ) | ||||||||||||||||
| Alphabet, Inc., Class A |
12 | 07/19/19 | USD | 1,195.00 | USD | 1,299 | (780 | ) | ||||||||||||||||
| Alphabet, Inc., Class A |
6 | 07/19/19 | USD | 1,070.00 | USD | 650 | (18,030 | ) | ||||||||||||||||
| Apple, Inc. |
7 | 07/19/19 | USD | 195.00 | USD | 139 | (4,777 | ) | ||||||||||||||||
| Aspen Technology, Inc. |
120 | 07/19/19 | USD | 125.00 | USD | 1,491 | (31,200 | ) | ||||||||||||||||
| Atlassian Corp. PLC, Class A |
100 | 07/19/19 | USD | 130.00 | USD | 1,308 | (53,500 | ) | ||||||||||||||||
| Atlassian Corp. PLC, Class A |
13 | 07/19/19 | USD | 131.00 | USD | 170 | (5,980 | ) | ||||||||||||||||
| Atlassian Corp. PLC, Class A |
13 | 07/19/19 | USD | 135.00 | USD | 170 | (3,737 | ) | ||||||||||||||||
| Avalara, Inc. |
131 | 07/19/19 | USD | 75.00 | USD | 946 | (23,580 | ) | ||||||||||||||||
| Coupa Software, Inc. |
100 | 07/19/19 | USD | 135.00 | USD | 1,266 | (27,250 | ) | ||||||||||||||||
| CrowdStrike Holdings, Inc. |
120 | 07/19/19 | USD | 75.00 | USD | 819 | (26,100 | ) | ||||||||||||||||
| Elastic NV |
70 | 07/19/19 | USD | 90.00 | USD | 523 | (875 | ) | ||||||||||||||||
| Facebook, Inc., Class A |
20 | 07/19/19 | USD | 185.00 | USD | 386 | (20,950 | ) | ||||||||||||||||
| Farfetch Ltd., Class A |
648 | 07/19/19 | USD | 24.00 | USD | 1,348 | (6,480 | ) | ||||||||||||||||
| Fastly Inc., Class A |
100 | 07/19/19 | USD | 25.00 | USD | 203 | (2,000 | ) | ||||||||||||||||
| IAC/InterActiveCorp |
50 | 07/19/19 | USD | 250.00 | USD | 1,088 | (1,750 | ) | ||||||||||||||||
| IAC/InterActiveCorp |
53 | 07/19/19 | USD | 230.00 | USD | 1,153 | (8,877 | ) | ||||||||||||||||
| II-VI, Inc. |
140 | 07/19/19 | USD | 35.00 | USD | 512 | (32,550 | ) | ||||||||||||||||
| Inphi Corp. |
157 | 07/19/19 | USD | 45.00 | USD | 787 | (83,995 | ) | ||||||||||||||||
| InterXion Holding NV |
86 | 07/19/19 | USD | 75.00 | USD | 654 | (18,060 | ) | ||||||||||||||||
| Keysight Technologies, Inc. |
87 | 07/19/19 | USD | 80.00 | USD | 781 | (85,695 | ) | ||||||||||||||||
| Marvell Technology Group Ltd. |
58 | 07/19/19 | USD | 24.00 | USD | 138 | (3,857 | ) | ||||||||||||||||
| Marvell Technology Group Ltd. |
58 | 07/19/19 | USD | 25.00 | USD | 138 | (1,769 | ) | ||||||||||||||||
| MercadoLibre, Inc. |
21 | 07/19/19 | USD | 640.00 | USD | 1,285 | (18,900 | ) | ||||||||||||||||
| Microsoft Corp. |
131 | 07/19/19 | USD | 130.00 | USD | 1,755 | (72,705 | ) | ||||||||||||||||
| Monolithic Power Systems, Inc. |
118 | 07/19/19 | USD | 135.00 | USD | 1,602 | (56,050 | ) | ||||||||||||||||
| NetEase, Inc. — ADR |
15 | 07/19/19 | USD | 270.00 | USD | 384 | (4,050 | ) | ||||||||||||||||
| Netflix, Inc. |
28 | 07/19/19 | USD | 370.00 | USD | 1,028 | (42,840 | ) | ||||||||||||||||
| Okta, Inc. |
79 | 07/19/19 | USD | 125.00 | USD | 976 | (33,970 | ) | ||||||||||||||||
| Pagerduty, Inc. |
24 | 07/19/19 | USD | 60.00 | USD | 113 | (360 | ) | ||||||||||||||||
| Pagerduty, Inc. |
35 | 07/19/19 | USD | 55.00 | USD | 165 | (1,925 | ) | ||||||||||||||||
| Pagseguro Digital Ltd., Class A |
400 | 07/19/19 | USD | 32.32 | USD | 1,559 | (272,715 | ) | ||||||||||||||||
| Pagseguro Digital Ltd., Class A |
528 | 07/19/19 | USD | 37.50 | USD | 2,058 | (126,720 | ) | ||||||||||||||||
| SCHEDULES OF INVESTMENTS | 81 |
| Schedule of Investments (unaudited) (continued) June 30, 2019 |
BlackRock Science and Technology Trust (BST) |
Exchange-Traded Options Written (continued)
| Description | Number of Contracts |
Expiration Date |
Exercise Price |
Notional Amount (000) |
Value | |||||||||||||||||||
| Call (continued) | ||||||||||||||||||||||||
| Pluralsight, Inc., Class A |
369 | 07/19/19 | USD | 40.00 | USD | 1,119 | $ | (5,535 | ) | |||||||||||||||
| Pluralsight, Inc., Class A |
220 | 07/19/19 | USD | 35.00 | USD | 667 | (3,300 | ) | ||||||||||||||||
| RingCentral, Inc., Class A |
122 | 07/19/19 | USD | 125.00 | USD | 1,402 | (8,845 | ) | ||||||||||||||||
| Roku, Inc. |
201 | 07/19/19 | USD | 95.00 | USD | 1,821 | (56,180 | ) | ||||||||||||||||
| SVMK, Inc. |
163 | 07/19/19 | USD | 17.50 | USD | 269 | (4,075 | ) | ||||||||||||||||
| ServiceNow, Inc. |
33 | 07/19/19 | USD | 270.00 | USD | 906 | (40,095 | ) | ||||||||||||||||
| ServiceNow, Inc. |
30 | 07/19/19 | USD | 290.00 | USD | 824 | (9,675 | ) | ||||||||||||||||
| Shopify, Inc. |
20 | 07/19/19 | USD | 280.00 | USD | 600 | (51,900 | ) | ||||||||||||||||
| Silicon Laboratories, Inc. |
121 | 07/19/19 | USD | 100.00 | USD | 1,251 | (62,920 | ) | ||||||||||||||||
| Slack Technologies, Inc., Class A |
142 | 07/19/19 | USD | 40.00 | USD | 533 | (14,910 | ) | ||||||||||||||||
| Smartsheet, Inc., Class A |
107 | 07/19/19 | USD | 45.00 | USD | 518 | (44,405 | ) | ||||||||||||||||
| Square, Inc., Class A |
662 | 07/19/19 | USD | 70.00 | USD | 4,801 | (263,145 | ) | ||||||||||||||||
| StoneCo Ltd. |
136 | 07/19/19 | USD | 34.00 | USD | 402 | (2,040 | ) | ||||||||||||||||
| StoneCo Ltd. |
143 | 07/19/19 | USD | 31.00 | USD | 423 | (9,652 | ) | ||||||||||||||||
| Teladoc Health, Inc. |
118 | 07/19/19 | USD | 65.00 | USD | 784 | (43,070 | ) | ||||||||||||||||
| Tradeweb Markets, Inc., Class A |
121 | 07/19/19 | USD | 45.00 | USD | 530 | (13,310 | ) | ||||||||||||||||
| Twilio, Inc., Class A |
77 | 07/19/19 | USD | 155.00 | USD | 1,050 | (5,659 | ) | ||||||||||||||||
| Twilio, Inc., Class A |
86 | 07/19/19 | USD | 140.00 | USD | 1,173 | (36,335 | ) | ||||||||||||||||
| Viavi Solutions, Inc. |
260 | 07/19/19 | USD | 14.00 | USD | 346 | (2,470 | ) | ||||||||||||||||
| Visa, Inc., Class A |
107 | 07/19/19 | USD | 165.00 | USD | 1,857 | (94,428 | ) | ||||||||||||||||
| Wix.com Ltd. |
91 | 07/19/19 | USD | 140.00 | USD | 1,293 | (51,415 | ) | ||||||||||||||||
| Wix.com Ltd. |
92 | 07/19/19 | USD | 150.00 | USD | 1,307 | (13,110 | ) | ||||||||||||||||
| Yandex NV, Class A |
215 | 07/19/19 | USD | 38.00 | USD | 817 | (26,338 | ) | ||||||||||||||||
| Zendesk, Inc. |
203 | 07/19/19 | USD | 95.00 | USD | 1,807 | (18,777 | ) | ||||||||||||||||
| Zendesk, Inc. |
164 | 07/19/19 | USD | 100.00 | USD | 1,460 | (4,510 | ) | ||||||||||||||||
| Zoom Video Communications, Inc. |
155 | 07/19/19 | USD | 115.00 | USD | 1,376 | (2,712 | ) | ||||||||||||||||
| Zoom Video Communications, Inc. |
8 | 07/19/19 | USD | 95.50 | USD | 71 | (1,660 | ) | ||||||||||||||||
| Zscaler, Inc. |
130 | 07/19/19 | USD | 75.00 | USD | 996 | (57,200 | ) | ||||||||||||||||
| salesforce.com, Inc. |
68 | 07/19/19 | USD | 160.00 | USD | 1,032 | (6,324 | ) | ||||||||||||||||
| Activision Blizzard, Inc. |
165 | 07/26/19 | USD | 48.00 | USD | 779 | (22,028 | ) | ||||||||||||||||
| Adobe, Inc. |
50 | 07/26/19 | USD | 285.00 | USD | 1,473 | (70,125 | ) | ||||||||||||||||
| Advanced Micro Devices, Inc. |
177 | 07/26/19 | USD | 33.50 | USD | 538 | (16,107 | ) | ||||||||||||||||
| Alibaba Group Holding Ltd. — ADR |
62 | 07/26/19 | USD | 167.50 | USD | 1,051 | (45,105 | ) | ||||||||||||||||
| Apple, Inc. |
112 | 07/26/19 | USD | 202.50 | USD | 2,217 | (43,680 | ) | ||||||||||||||||
| Atlassian Corp. PLC, Class A |
17 | 07/26/19 | USD | 136.00 | USD | 222 | (8,840 | ) | ||||||||||||||||
| Cree, Inc. |
100 | 07/26/19 | USD | 59.50 | USD | 562 | (11,000 | ) | ||||||||||||||||
| Facebook, Inc., Class A |
78 | 07/26/19 | USD | 200.00 | USD | 1,505 | (33,150 | ) | ||||||||||||||||
| Luckin Coffee, Inc., ADR |
296 | 07/26/19 | USD | 25.00 | USD | 577 | (6,660 | ) | ||||||||||||||||
| Marvell Technology Group Ltd. |
328 | 07/26/19 | USD | 25.00 | USD | 783 | (13,284 | ) | ||||||||||||||||
| Microsoft Corp. |
43 | 07/26/19 | USD | 140.00 | USD | 576 | (5,762 | ) | ||||||||||||||||
| MongoDB, Inc. |
93 | 07/26/19 | USD | 192.50 | USD | 1,414 | (5,115 | ) | ||||||||||||||||
| NetEase, Inc. — ADR |
14 | 07/26/19 | USD | 275.00 | USD | 358 | (3,535 | ) | ||||||||||||||||
| Okta, Inc. |
79 | 07/26/19 | USD | 126.00 | USD | 976 | (37,525 | ) | ||||||||||||||||
| PayPal Holdings, Inc. |
95 | 07/26/19 | USD | 120.00 | USD | 1,087 | (18,335 | ) | ||||||||||||||||
| Pinterest, Inc., Class A |
140 | 07/26/19 | USD | 29.00 | USD | 381 | (10,500 | ) | ||||||||||||||||
| Shopify, Inc., Class A |
35 | 07/26/19 | USD | 312.50 | USD | 1,051 | (36,225 | ) | ||||||||||||||||
| Skyworks Solutions, Inc. |
100 | 07/26/19 | USD | 75.00 | USD | 773 | (40,500 | ) | ||||||||||||||||
| Square, Inc., Class A |
288 | 07/26/19 | USD | 78.50 | USD | 2,089 | (24,912 | ) | ||||||||||||||||
| Teladoc Health, Inc. |
118 | 07/26/19 | USD | 64.77 | USD | 784 | (49,845 | ) | ||||||||||||||||
| Twilio, Inc., Class A |
77 | 07/26/19 | USD | 150.00 | USD | 1,050 | (15,631 | ) | ||||||||||||||||
| Visa, Inc., Class A |
84 | 07/26/19 | USD | 170.00 | USD | 1,458 | (47,040 | ) | ||||||||||||||||
| Zoom Video Communications, Inc. |
8 | 07/26/19 | USD | 97.50 | USD | 71 | (1,980 | ) | ||||||||||||||||
| Zoom Video Communications, Inc. |
17 | 07/26/19 | USD | 100.00 | USD | 151 | (3,102 | ) | ||||||||||||||||
| salesforce.com, Inc. |
87 | 07/26/19 | USD | 160.00 | USD | 1,320 | (12,354 | ) | ||||||||||||||||
| 58.com, Inc. — ADR |
92 | 08/02/19 | USD | 64.50 | USD | 572 | (17,018 | ) | ||||||||||||||||
| Adobe, Inc. |
73 | 08/02/19 | USD | 307.50 | USD | 2,151 | (25,915 | ) | ||||||||||||||||
| Advanced Micro Devices, Inc. |
185 | 08/02/19 | USD | 36.00 | USD | 562 | (12,117 | ) | ||||||||||||||||
| Alibaba Group Holding Ltd. — ADR |
80 | 08/02/19 | USD | 172.50 | USD | 1,356 | (44,400 | ) | ||||||||||||||||
| Alphabet, Inc., Class A |
9 | 08/02/19 | USD | 1,145.00 | USD | 975 | (12,150 | ) | ||||||||||||||||
| Amazon.com, Inc. |
23 | 08/02/19 | USD | 1,920.00 | USD | 4,355 | (131,503 | ) | ||||||||||||||||
| Atlassian Corp. PLC, Class A |
17 | 08/02/19 | USD | 139.00 | USD | 222 | (8,500 | ) | ||||||||||||||||
| Autodesk, Inc. |
92 | 08/02/19 | USD | 167.50 | USD | 1,499 | (33,120 | ) | ||||||||||||||||
| 82 | 2019 BLACKROCK SEMI-ANNUAL REPORT TO SHAREHOLDERS |
| Schedule of Investments (unaudited) (continued) June 30, 2019 |
BlackRock Science and Technology Trust (BST) |
Exchange-Traded Options Written (continued)
| Description | Number of Contracts |
Expiration Date |
Exercise Price |
Notional Amount (000) |
Value | |||||||||||||||||||
| Call (continued) | ||||||||||||||||||||||||
| Cree, Inc. |
124 | 08/02/19 | USD | 63.00 | USD | 697 | $ | (7,688 | ) | |||||||||||||||
| Facebook, Inc., Class A |
84 | 08/02/19 | USD | 192.50 | USD | 1,621 | (78,750 | ) | ||||||||||||||||
| Luckin Coffee, Inc., ADR |
296 | 08/02/19 | USD | 25.00 | USD | 577 | (9,620 | ) | ||||||||||||||||
| Marvell Technology Group Ltd. |
103 | 08/02/19 | USD | 26.00 | USD | 246 | (3,708 | ) | ||||||||||||||||
| Marvell Technology Group Ltd. |
168 | 08/02/19 | USD | 25.00 | USD | 401 | (8,316 | ) | ||||||||||||||||
| Mastercard, Inc., Class A |
163 | 08/02/19 | USD | 262.50 | USD | 4,312 | (162,593 | ) | ||||||||||||||||
| Microsoft Corp. |
25 | 08/02/19 | USD | 137.00 | USD | 335 | (6,575 | ) | ||||||||||||||||
| MongoDB, Inc. |
93 | 08/02/19 | USD | 192.50 | USD | 1,414 | (7,672 | ) | ||||||||||||||||
| NetEase, Inc. — ADR |
25 | 08/02/19 | USD | 280.00 | USD | 639 | (5,812 | ) | ||||||||||||||||
| Netflix, Inc. |
20 | 08/02/19 | USD | 397.50 | USD | 735 | (15,100 | ) | ||||||||||||||||
| Okta, Inc. |
79 | 08/02/19 | USD | 128.00 | USD | 976 | (36,735 | ) | ||||||||||||||||
| Pinterest, Inc., Class A |
140 | 08/02/19 | USD | 29.00 | USD | 381 | (12,950 | ) | ||||||||||||||||
| Roku, Inc. |
116 | 08/02/19 | USD | 105.00 | USD | 1,051 | (24,766 | ) | ||||||||||||||||
| ServiceNow, Inc. |
33 | 08/02/19 | USD | 280.00 | USD | 906 | (42,405 | ) | ||||||||||||||||
| ServiceNow, Inc. |
29 | 08/02/19 | USD | 295.00 | USD | 796 | (19,575 | ) | ||||||||||||||||
| Square, Inc., Class A |
113 | 08/02/19 | USD | 72.50 | USD | 820 | (44,635 | ) | ||||||||||||||||
| Twilio, Inc., Class A |
176 | 08/02/19 | USD | 145.00 | USD | 2,400 | (82,280 | ) | ||||||||||||||||
| Twilio, Inc., Class A |
160 | 08/02/19 | USD | 141.00 | USD | 2,182 | (95,600 | ) | ||||||||||||||||
| Visa, Inc. |
163 | 08/02/19 | USD | 175.00 | USD | 2,829 | (57,865 | ) | ||||||||||||||||
| Visa, Inc., Class A |
64 | 08/02/19 | USD | 177.50 | USD | 1,111 | (16,384 | ) | ||||||||||||||||
| Yandex NV, Class A |
188 | 08/02/19 | USD | 40.00 | USD | 714 | (22,560 | ) | ||||||||||||||||
| Zoom Video Communications, Inc. |
8 | 08/02/19 | USD | 99.00 | USD | 71 | (2,280 | ) | ||||||||||||||||
| Zoom Video Communications, Inc. |
17 | 08/02/19 | USD | 100.00 | USD | 151 | (4,165 | ) | ||||||||||||||||
| Zscaler, Inc. |
210 | 08/02/19 | USD | 81.50 | USD | 1,609 | (55,125 | ) | ||||||||||||||||
| salesforce.com, Inc. |
87 | 08/02/19 | USD | 160.00 | USD | 1,320 | (16,486 | ) | ||||||||||||||||
| Adobe, Inc. |
35 | 08/09/19 | USD | 302.50 | USD | 1,031 | (21,875 | ) | ||||||||||||||||
| Alibaba Group Holding Ltd. — ADR |
131 | 08/09/19 | USD | 175.00 | USD | 2,220 | (68,448 | ) | ||||||||||||||||
| Alphabet, Inc., Class A |
1 | 08/09/19 | USD | 1,115.00 | USD | 108 | (2,510 | ) | ||||||||||||||||
| Apple, Inc. |
79 | 08/09/19 | USD | 205.00 | USD | 1,564 | (41,870 | ) | ||||||||||||||||
| Cree, Inc. |
164 | 08/09/19 | USD | 60.00 | USD | 921 | (24,682 | ) | ||||||||||||||||
| Lam Research Corp. |
79 | 08/09/19 | USD | 192.50 | USD | 1,484 | (65,965 | ) | ||||||||||||||||
| Mastercard, Inc., Class A |
77 | 08/09/19 | USD | 267.50 | USD | 2,037 | (60,445 | ) | ||||||||||||||||
| Microsoft Corp. |
25 | 08/09/19 | USD | 137.00 | USD | 335 | (7,525 | ) | ||||||||||||||||
| PayPal Holdings, Inc. |
155 | 08/09/19 | USD | 118.00 | USD | 1,774 | (47,895 | ) | ||||||||||||||||
| Roku, Inc. |
100 | 08/09/19 | USD | 95.00 | USD | 906 | (72,500 | ) | ||||||||||||||||
| Shopify, Inc., Class A |
48 | 08/09/19 | USD | 302.50 | USD | 1,441 | (97,680 | ) | ||||||||||||||||
| Xilinx, Inc. |
59 | 08/09/19 | USD | 119.00 | USD | 696 | (44,398 | ) | ||||||||||||||||
| Activision Blizzard, Inc. |
165 | 08/16/19 | USD | 50.00 | USD | 779 | (25,080 | ) | ||||||||||||||||
| Advanced Micro Devices, Inc. |
155 | 08/16/19 | USD | 31.00 | USD | 471 | (36,425 | ) | ||||||||||||||||
| Alphabet, Inc., Class A |
13 | 08/16/19 | USD | 1,165.00 | USD | 1,408 | (15,405 | ) | ||||||||||||||||
| Amazon.com, Inc. |
13 | 08/16/19 | USD | 1,930.00 | USD | 2,462 | (79,073 | ) | ||||||||||||||||
| Apple, Inc. |
14 | 08/16/19 | USD | 205.00 | USD | 277 | (7,140 | ) | ||||||||||||||||
| Atlassian Corp. PLC, Class A |
17 | 08/16/19 | USD | 140.00 | USD | 222 | (9,095 | ) | ||||||||||||||||
| Autodesk, Inc. |
62 | 08/16/19 | USD | 170.00 | USD | 1,010 | (24,025 | ) | ||||||||||||||||
| Avalara, Inc. |
66 | 08/16/19 | USD | 80.00 | USD | 477 | (19,140 | ) | ||||||||||||||||
| Coupa Software, Inc. |
100 | 08/16/19 | USD | 140.00 | USD | 1,266 | (38,000 | ) | ||||||||||||||||
| CrowdStrike Holdings, Inc. |
120 | 08/16/19 | USD | 80.00 | USD | 819 | (33,300 | ) | ||||||||||||||||
| Elastic NV |
88 | 08/16/19 | USD | 85.00 | USD | 657 | (10,780 | ) | ||||||||||||||||
| II-VI, Inc. |
255 | 08/16/19 | USD | 40.00 | USD | 932 | (31,238 | ) | ||||||||||||||||
| Keysight Technologies, Inc. |
98 | 08/16/19 | USD | 90.00 | USD | 880 | (40,670 | ) | ||||||||||||||||
| Marvell Technology Group Ltd. |
328 | 08/16/19 | USD | 26.00 | USD | 783 | (12,792 | ) | ||||||||||||||||
| MercadoLibre, Inc. |
42 | 08/16/19 | USD | 690.00 | USD | 2,569 | (61,950 | ) | ||||||||||||||||
| MercadoLibre, Inc. |
20 | 08/16/19 | USD | 650.00 | USD | 1,224 | (54,900 | ) | ||||||||||||||||
| Microsoft Corp. |
427 | 08/16/19 | USD | 140.00 | USD | 5,720 | (85,827 | ) | ||||||||||||||||
| Netflix, Inc. |
36 | 08/16/19 | USD | 365.00 | USD | 1,322 | (82,710 | ) | ||||||||||||||||
| Okta, Inc. |
137 | 08/16/19 | USD | 125.00 | USD | 1,692 | (101,380 | ) | ||||||||||||||||
| Okta, Inc. |
79 | 08/16/19 | USD | 135.00 | USD | 976 | (28,440 | ) | ||||||||||||||||
| Pagerduty, Inc. |
24 | 08/16/19 | USD | 65.00 | USD | 113 | (900 | ) | ||||||||||||||||
| Pagerduty, Inc. |
34 | 08/16/19 | USD | 60.00 | USD | 160 | (2,975 | ) | ||||||||||||||||
| Skyworks Solutions, Inc. |
82 | 08/16/19 | USD | 82.50 | USD | 634 | (17,630 | ) | ||||||||||||||||
| Slack Technologies, Inc., Class A |
142 | 08/16/19 | USD | 45.00 | USD | 533 | (13,135 | ) | ||||||||||||||||
| Smartsheet, Inc., Class A |
107 | 08/16/19 | USD | 50.00 | USD | 518 | (28,355 | ) | ||||||||||||||||
| SCHEDULES OF INVESTMENTS | 83 |
| Schedule of Investments (unaudited) (continued) June 30, 2019 |
BlackRock Science and Technology Trust (BST) |
Exchange-Traded Options Written (continued)
| Description | Number of Contracts |
Expiration Date |
Exercise Price |
Notional Amount (000) |
Value | |||||||||||||||||||
| Call (continued) | ||||||||||||||||||||||||
| StoneCo Ltd. |
170 | 08/16/19 | USD | 31.00 | USD | 503 | $ | (32,300 | ) | |||||||||||||||
| Viavi Solutions, Inc. |
611 | 08/16/19 | USD | 14.00 | USD | 812 | (24,135 | ) | ||||||||||||||||
| Yandex NV, Class A |
150 | 08/16/19 | USD | 40.00 | USD | 570 | (21,375 | ) | ||||||||||||||||
| Zendesk, Inc. |
46 | 08/16/19 | USD | 95.00 | USD | 410 | (16,330 | ) | ||||||||||||||||
| Zendesk, Inc. |
45 | 08/16/19 | USD | 100.00 | USD | 401 | (9,562 | ) | ||||||||||||||||
| Zoom Video Communications, Inc. |
8 | 08/16/19 | USD | 105.00 | USD | 71 | (1,980 | ) | ||||||||||||||||
| Zscaler, Inc. |
38 | 08/16/19 | USD | 80.00 | USD | 291 | (15,580 | ) | ||||||||||||||||
| salesforce.com, Inc. |
92 | 08/16/19 | USD | 160.00 | USD | 1,396 | (24,702 | ) | ||||||||||||||||
|
|
|
|||||||||||||||||||||||
| $ | (6,260,217 | ) | ||||||||||||||||||||||
|
|
|
|||||||||||||||||||||||
OTC Options Written
| Description | Counterparty | Number of Contracts |
Expiration Date |
Exercise Price |
Notional Amount (000) |
Value | ||||||||||||||||||||
| Call | ||||||||||||||||||||||||||
| Elastic NV |
Morgan Stanley & Co. International PLC | 8,800 | 07/08/19 | USD | 89.93 | USD | 657 | $ | (29 | ) | ||||||||||||||||
| Kingdee International Software Group Co. Ltd. |
JPMorgan Chase Bank N.A. | 578,000 | 07/09/19 | HKD | 9.06 | HKD | 4,890 | (11,332 | ) | |||||||||||||||||
| SVMK, Inc. |
Citibank N.A. | 21,100 | 07/09/19 | USD | 17.35 | USD | 348 | (3,041 | ) | |||||||||||||||||
| StoneCo Ltd. |
Barclays Bank PLC | 32,500 | 07/09/19 | USD | 28.52 | USD | 961 | (51,729 | ) | |||||||||||||||||
| Taiwan Semiconductor Manufacturing Co. Ltd. |
JPMorgan Chase Bank N.A. | 222,000 | 07/09/19 | USD | 236.72 | USD | 52,736 | (40,573 | ) | |||||||||||||||||
| Takeaway.com NV |
Goldman Sachs International | 4,400 | 07/09/19 | EUR | 79.72 | EUR | 362 | (16,891 | ) | |||||||||||||||||
| Takeaway.com NV |
Goldman Sachs International | 3,800 | 07/09/19 | EUR | 78.49 | EUR | 313 | (18,822 | ) | |||||||||||||||||
| Meituan Dianping |
Goldman Sachs International | 115,900 | 07/10/19 | HKD | 62.45 | HKD | 7,952 | (100,237 | ) | |||||||||||||||||
| Taiwan Semiconductor Manufacturing Co. Ltd. |
UBS AG | 114,000 | 07/10/19 | USD | 234.62 | USD | 27,081 | (26,001 | ) | |||||||||||||||||
| UbiSoft Entertainment SA |
Goldman Sachs International | 12,400 | 07/10/19 | EUR | 83.03 | EUR | 853 | (29 | ) | |||||||||||||||||
| Zuora, Inc. Class A |
Citibank N.A. | 35,000 | 07/10/19 | USD | 24.06 | USD | 536 | (40 | ) | |||||||||||||||||
| Endava PLC |
Goldman Sachs International | 10,000 | 07/11/19 | USD | 43.23 | USD | 402 | (4,484 | ) | |||||||||||||||||
| SOITEC |
UBS AG | 17,000 | 07/11/19 | EUR | 78.14 | EUR | 1,636 | (351,170 | ) | |||||||||||||||||
| Altair Engineering, Inc., Class A |
Citibank N.A. | 23,100 | 07/12/19 | USD | 39.52 | USD | 933 | (37,257 | ) | |||||||||||||||||
| Bandwidth, Inc., Class A |
Bank of America N.A. | 12,500 | 07/15/19 | USD | 79.50 | USD | 938 | (12,502 | ) | |||||||||||||||||
| Aixtron SE |
Goldman Sachs International | 32,800 | 07/17/19 | EUR | 9.18 | EUR | 276 | (3,438 | ) | |||||||||||||||||
| Altium Ltd. |
Morgan Stanley & Co. International PLC | 47,000 | 07/17/19 | AUD | 32.86 | AUD | 1,616 | (70,421 | ) | |||||||||||||||||
| Kingdee International Software Group Co. Ltd. |
UBS AG | 626,000 | 07/17/19 | HKD | 9.22 | HKD | 5,296 | (16,258 | ) | |||||||||||||||||
| Takeaway.com NV |
Goldman Sachs International | 4,400 | 07/17/19 | EUR | 79.21 | EUR | 362 | (21,031 | ) | |||||||||||||||||
| STMicroelectronics NV |
UBS AG | 22,600 | 07/18/19 | EUR | 15.22 | EUR | 353 | (20,565 | ) | |||||||||||||||||
| Viavi Solutions, Inc. |
JPMorgan Chase Bank N.A. | 40,000 | 07/19/19 | USD | 13.35 | USD | 532 | (13,278 | ) | |||||||||||||||||
| Aixtron SE |
Goldman Sachs International | 67,000 | 07/23/19 | EUR | 8.89 | EUR | 563 | (13,400 | ) | |||||||||||||||||
| Kingdee International Software Group Co. Ltd. |
UBS AG | 575,000 | 07/23/19 | HKD | 8.91 | HKD | 4,865 | (26,433 | ) | |||||||||||||||||
| Takeaway.com NV |
Deutsche Bank AG | 4,500 | 07/24/19 | EUR | 79.10 | EUR | 370 | (24,588 | ) | |||||||||||||||||
| Wirecard AG |
Goldman Sachs International | 5,650 | 07/24/19 | EUR | 156.18 | EUR | 839 | (27,338 | ) | |||||||||||||||||
| Inphi Corp. |
Citibank N.A. | 15,700 | 07/25/19 | USD | 53.35 | USD | 787 | (14,694 | ) | |||||||||||||||||
| ASML Holding NV |
UBS AG | 5,700 | 07/26/19 | EUR | 174.13 | EUR | 1,043 | (71,347 | ) | |||||||||||||||||
| Bandwidth, Inc., Class A |
UBS AG | 16,800 | 07/26/19 | USD | 81.43 | USD | 1,260 | (19,264 | ) | |||||||||||||||||
| SOITEC |
UBS AG | 12,400 | 07/26/19 | EUR | 80.02 | EUR | 1,193 | (230,164 | ) | |||||||||||||||||
| Tencent Holdings Ltd. |
JPMorgan Chase Bank N.A. | 99,800 | 07/26/19 | HKD | 335.31 | HKD | 35,269 | (282,069 | ) | |||||||||||||||||
| Xero Ltd. |
Goldman Sachs International | 21,000 | 07/26/19 | AUD | 61.04 | AUD | 1,263 | (25,750 | ) | |||||||||||||||||
| InterXion Holding N.V. |
Credit Suisse International | 21,600 | 07/29/19 | USD | 76.44 | USD | 1,644 | (14,310 | ) | |||||||||||||||||
| Altium Ltd. |
Goldman Sachs International | 25,800 | 07/30/19 | AUD | 35.33 | AUD | 887 | (21,638 | ) | |||||||||||||||||
| Meituan Dianping |
Goldman Sachs International | 134,000 | 07/30/19 | HKD | 66.23 | HKD | 9,194 | (64,370 | ) | |||||||||||||||||
| Network International Holdings PLC |
Citibank N.A. | 137,600 | 07/30/19 | GBP | 6.04 | GBP | 816 | (26,563 | ) | |||||||||||||||||
| Tencent Holdings Ltd. |
JPMorgan Chase Bank N.A. | 102,700 | 07/30/19 | HKD | 357.90 | HKD | 36,294 | (117,796 | ) | |||||||||||||||||
| UbiSoft Entertainment SA |
Goldman Sachs International | 10,800 | 07/30/19 | EUR | 71.83 | EUR | 743 | (23,210 | ) | |||||||||||||||||
| Adyen NV |
Credit Suisse International | 1,500 | 07/31/19 | EUR | 695.25 | EUR | 1,018 | (35,525 | ) | |||||||||||||||||
| Adyen NV |
UBS AG | 2,500 | 07/31/19 | EUR | 753.61 | EUR | 1,696 | (16,853 | ) | |||||||||||||||||
| Aixtron SE |
Goldman Sachs International | 6,500 | 07/31/19 | EUR | 8.73 | EUR | 55 | (2,683 | ) | |||||||||||||||||
| Delivery Hero AG |
JPMorgan Chase Bank N.A. | 26,600 | 07/31/19 | EUR | 39.63 | EUR | 1,062 | (58,388 | ) | |||||||||||||||||
| GMO Payment Gateway, Inc. |
Morgan Stanley & Co. International PLC | 31,400 | 07/31/19 | JPY | 7,682.64 | JPY | 233,956 | (84,414 | ) | |||||||||||||||||
| II-VI, Inc. |
JPMorgan Chase Bank N.A. | 30,000 | 07/31/19 | USD | 36.68 | USD | 1,097 | (63,762 | ) | |||||||||||||||||
| Ping An Healthcare and Technology Co. Ltd. |
JPMorgan Chase Bank N.A. | 118,500 | 07/31/19 | HKD | 37.41 | HKD | 3,864 | (7,247 | ) | |||||||||||||||||
| STMicroelectronics NV |
Goldman Sachs International | 63,500 | 07/31/19 | EUR | 15.14 | EUR | 991 | (76,816 | ) | |||||||||||||||||
| 84 | 2019 BLACKROCK SEMI-ANNUAL REPORT TO SHAREHOLDERS |
| Schedule of Investments (unaudited) (continued) June 30, 2019 |
BlackRock Science and Technology Trust (BST) |
OTC Options Written (continued)
| Description | Counterparty | Number of Contracts |
Expiration Date |
Exercise Price |
Notional Amount (000) |
Value | ||||||||||||||||||||
| Call (continued) | ||||||||||||||||||||||||||
| Tongcheng-Elong Holdings Ltd. |
JPMorgan Chase Bank N.A. | 100,000 | 07/31/19 | HKD | 16.60 | HKD | 1,551 | $ | (7,688 | ) | ||||||||||||||||
| Wirecard AG |
Goldman Sachs International | 5,650 | 08/01/19 | EUR | 157.89 | EUR | 839 | (30,109 | ) | |||||||||||||||||
| Takeaway.com NV |
Credit Suisse International | 3,800 | 08/06/19 | EUR | 80.63 | EUR | 313 | (19,414 | ) | |||||||||||||||||
| Zuora, Inc. Class A |
Citibank N.A. | 50,000 | 08/06/19 | USD | 17.39 | USD | 766 | (13,764 | ) | |||||||||||||||||
| Tongcheng-Elong Holdings Ltd. |
JPMorgan Chase Bank N.A. | 186,000 | 08/07/19 | HKD | 16.49 | HKD | 2,885 | (17,641 | ) | |||||||||||||||||
| Delivery Hero AG |
Goldman Sachs International | 13,500 | 08/08/19 | EUR | 38.73 | EUR | 539 | (40,923 | ) | |||||||||||||||||
| Endava PLC |
Credit Suisse International | 17,400 | 08/08/19 | USD | 39.59 | USD | 700 | (50,569 | ) | |||||||||||||||||
| Xero Ltd. |
UBS AG | 21,000 | 08/08/19 | AUD | 62.62 | AUD | 1,263 | (22,725 | ) | |||||||||||||||||
| ASML Holding NV |
Morgan Stanley & Co. International PLC | 8,700 | 08/09/19 | EUR | 185.37 | EUR | 1,592 | (54,104 | ) | |||||||||||||||||
| Pinterest, Inc., Class A |
Citibank N.A. | 15,100 | 08/09/19 | USD | 29.31 | USD | 411 | (20,119 | ) | |||||||||||||||||
| SVMK, Inc. |
Citibank N.A. | 36,000 | 08/09/19 | USD | 17.39 | USD | 594 | (27,056 | ) | |||||||||||||||||
| Ping An Healthcare and Technology Co. Ltd. |
JPMorgan Chase Bank N.A. | 137,700 | 08/13/19 | HKD | 36.37 | HKD | 4,490 | (16,822 | ) | |||||||||||||||||
| Altair Engineering, Inc., Class A |
JPMorgan Chase Bank N.A. | 22,000 | 08/21/19 | USD | 40.35 | USD | 889 | (53,886 | ) | |||||||||||||||||
|
|
|
|||||||||||||||||||||||||
| $ | (2,542,570 | ) | ||||||||||||||||||||||||
|
|
|
|||||||||||||||||||||||||
Balances Reported in the Statements of Assets and Liabilities for OTC Derivatives
| Swap Premium Paid |
Swap Premium Received |
Unrealized Appreciation |
Unrealized Depreciation |
Value | ||||||||||||||||
| Options Written |
N/A | N/A | $ | 1,933,019 | $ | (2,619,193 | ) | $ | (8,802,787 | ) | ||||||||||
Derivative Financial Instruments Categorized by Risk Exposure
As of period end, the fair values of derivative financial instruments located in the Statements of Assets and Liabilities were as follows:
| Commodity Contracts |
Credit Contracts |
Equity Contracts |
Foreign Currency Exchange Contracts |
Interest Rate Contracts |
Other Contracts |
Total | ||||||||||||||||||||||
| Liabilities — Derivative Financial Instruments |
||||||||||||||||||||||||||||
| Options written |
||||||||||||||||||||||||||||
| Options written at value |
$ | — | $ | — | $ | 8,802,787 | $ | — | $ | — | $ | — | $ | 8,802,787 | ||||||||||||||
|
|
|
|
|
|
|
|
|
|
|
|
|
|
|
|||||||||||||||
For the period ended June 30, 2019, the effect of derivative financial instruments in the Statements of Operations was as follows:
| Commodity Contracts |
Credit Contracts |
Equity Contracts |
Foreign Currency Exchange Contracts |
Interest Rate Contracts |
Other Contracts |
Total | ||||||||||||||||||||||
| Net Realized Gain (Loss) from: |
||||||||||||||||||||||||||||
| Options purchased(a) |
$ | — | $ | — | $ | (7,374 | ) | $ | — | $ | — | $ | — | $ | (7,374 | ) | ||||||||||||
| Options written |
— | — | (18,275,290 | ) | — | — | — | (18,275,290 | ) | |||||||||||||||||||
|
|
|
|
|
|
|
|
|
|
|
|
|
|
|
|||||||||||||||
| $ | — | $ | — | $ | (18,282,664 | ) | $ | — | $ | — | $ | — | $ | (18,282,664 | ) | |||||||||||||
|
|
|
|
|
|
|
|
|
|
|
|
|
|
|
|||||||||||||||
| (a) Options purchased are included in net realized gain (loss) from investments. |
| |||||||||||||||||||||||||||
| Net Change in Unrealized Appreciation (Depreciation) on: |
||||||||||||||||||||||||||||
| Options written |
$ | — | $ | — | $ | (3,913,722 | ) | $ | — | $ | — | $ | — | $ | (3,913,722 | ) | ||||||||||||
|
|
|
|
|
|
|
|
|
|
|
|
|
|
|
|||||||||||||||
Average Quarterly Balances of Outstanding Derivative Financial Instruments
| Options: |
| |||
| Average value of option contracts purchased |
$ | — | (a) | |
| Average value of option contracts written |
$ | 9,829,946 | ||
| (a) | Derivative not held at quarter-end. The risk exposure table serves as an indicator of activity during the period. |
For more information about the Trust’s investment risks regarding derivative financial instruments, refer to the Notes to Financial Statements.
| SCHEDULES OF INVESTMENTS | 85 |
| Schedule of Investments (unaudited) (continued) June 30, 2019 |
BlackRock Science and Technology Trust (BST) |
Derivative Financial Instruments — Offsetting as of Period End
The Trust’s derivative assets and liabilities (by type) are as follows:
| Assets | Liabilities | |||||||
| Options |
$ | — | $ | 8,802,787 | ||||
| Derivatives not subject to a Master Netting Agreement or similar agreement (“MNA”) |
— | (6,260,217 | ) | |||||
|
|
|
|
|
|||||
| Total derivative assets and liabilities subject to an MNA |
$ | — | $ | 2,542,570 | ||||
|
|
|
|
|
|||||
The following table presents the Trust’s derivative assets (and liabilities) by counterparty net of amounts available for offset under an MNA and net of the related collateral received (and pledged) by the Trust:
| Counterparty | Derivative Liabilities Subject to an MNA by Counterparty |
Derivatives Available for Offset |
Non-cash Collateral Pledged |
Cash Collateral Pledged (a) |
Net Amount of Derivative Liabilities (b) |
|||||||||||||||
| Bank of America N.A. |
$ | 12,502 | $ | — | $ | — | $ | — | $ | 12,502 | ||||||||||
| Barclays Bank PLC |
51,729 | — | — | (10,000 | ) | 41,729 | ||||||||||||||
| Citibank N.A. |
142,534 | — | — | (142,534 | ) | — | ||||||||||||||
| Credit Suisse International |
119,818 | — | — | (20,000 | ) | 99,818 | ||||||||||||||
| Deutsche Bank AG |
24,588 | — | — | — | 24,588 | |||||||||||||||
| Goldman Sachs International |
491,169 | — | — | (170,000 | ) | 321,169 | ||||||||||||||
| JPMorgan Chase Bank N.A. |
690,482 | — | — | (610,000 | ) | 80,482 | ||||||||||||||
| Morgan Stanley & Co. International PLC |
208,968 | — | — | (208,968 | ) | — | ||||||||||||||
| UBS AG |
800,780 | — | — | (570,000 | ) | 230,780 | ||||||||||||||
|
|
|
|
|
|
|
|
|
|
|
|||||||||||
| $ | 2,542,570 | $ | — | $ | — | $ | (1,731,502 | ) | $ | 811,068 | ||||||||||
|
|
|
|
|
|
|
|
|
|
|
|||||||||||
| (a) | Excess of collateral pledged to the individual counterparty is not shown for financial reporting purposes. |
| (b) | Net amount represents the net amount payable due to counterparty in the event of default. Net amount may be offset further by the options written receivable/payable on the Statements of Assets and Liabilities. |
Fair Value Hierarchy as of Period End
Various inputs are used in determining the fair value of investments and derivative financial instruments. For information about the Trust’s policy regarding valuation of investments and derivative financial instruments, refer to the Notes to Financial Statements.
The following tables summarize the Trust’s investments and derivative financial instruments categorized in the disclosure hierarchy:
| Level 1 | Level 2 | Level 3 | Total | |||||||||||||
| Assets: |
| |||||||||||||||
| Investments: |
| |||||||||||||||
| Common Stocks: |
| |||||||||||||||
| Capital Markets |
$ | 3,024,029 | $ | — | $ | — | $ | 3,024,029 | ||||||||
| Communications Equipment |
4,828,377 | — | — | 4,828,377 | ||||||||||||
| Diversified Consumer Services |
8,853,586 | — | — | 8,853,586 | ||||||||||||
| Diversified Financial Services |
— | 2,459,160 | — | 2,459,160 | ||||||||||||
| Diversified Telecommunication Services |
6,284,575 | — | — | 6,284,575 | ||||||||||||
| Electrical Equipment |
7,108,434 | — | — | 7,108,434 | ||||||||||||
| Electronic Equipment, Instruments & Components |
4,769,809 | — | — | 4,769,809 | ||||||||||||
| Entertainment |
20,589,045 | 5,174,512 | — | 25,763,557 | ||||||||||||
| Food Products |
1,153,522 | — | — | 1,153,522 | ||||||||||||
| Health Care Technology |
4,515,415 | 3,056,994 | — | 7,572,409 | ||||||||||||
| Hotels, Restaurants & Leisure |
3,299,540 | — | — | 3,299,540 | ||||||||||||
| Household Durables |
7,553,647 | — | — | 7,553,647 | ||||||||||||
| Interactive Media & Services |
54,082,286 | 30,190,734 | — | 84,273,020 | ||||||||||||
| Internet & Direct Marketing Retail |
65,437,737 | 18,951,992 | 337,112 | 84,726,841 | ||||||||||||
| IT Services |
148,863,098 | 17,644,289 | — | 166,507,387 | ||||||||||||
| Professional Services |
3,372,964 | — | — | 3,372,964 | ||||||||||||
| Semiconductors & Semiconductor Equipment |
56,778,717 | 31,405,158 | — | 88,183,875 | ||||||||||||
| Software |
175,296,722 | 15,594,021 | — | 190,890,743 | ||||||||||||
| Technology Hardware, Storage & Peripherals |
18,047,533 | — | — | 18,047,533 | ||||||||||||
| Preferred Stocks |
— | 2,340,800 | 14,463,224 | 16,804,024 | ||||||||||||
| Short-Term Securities |
997,214 | — | — | 997,214 | ||||||||||||
|
|
|
|
|
|
|
|
|
|||||||||
| Subtotal |
$ | 594,856,250 | $ | 126,817,660 | $ | 14,800,336 | $ | 736,474,246 | ||||||||
|
|
|
|
|
|
|
|
|
|||||||||
| Investments Valued at NAV(a) |
2,292,961 | |||||||||||||||
|
|
|
|||||||||||||||
| Total Investments |
$ | 738,767,207 | ||||||||||||||
|
|
|
|||||||||||||||
| 86 | 2019 BLACKROCK SEMI-ANNUAL REPORT TO SHAREHOLDERS |
| Schedule of Investments (unaudited) (continued) June 30, 2019 |
BlackRock Science and Technology Trust (BST) |
Fair Value Hierarchy as of Period End (continued)
| Level 1 | Level 2 | Level 3 | Total | |||||||||||||
| Derivative Financial Instruments(b) |
|
|||||||||||||||
| Liabilities: |
| |||||||||||||||
| Equity contracts |
$ | (5,792,542 | ) | $ | (3,010,245 | ) | $ | — | $ | (8,802,787 | ) | |||||
|
|
|
|
|
|
|
|
|
|||||||||
| (a) | Certain investments of the Trust were fair valued using net asset value (“NAV”) per share as no quoted market value is available and therefore have been excluded from the fair value hierarchy. |
| (b) | Derivative financial instruments are options written which are shown at value. |
A reconciliation of Level 3 investments is presented when the Trust had a significant amount of Level 3 investments at the beginning and/or rend of the period in relation to net assets. The following table is a reconciliation of Level 3 investments for which significant unobservable inputs were used in determining fair value:
| Common Stocks |
Preferred Stocks |
Total | ||||||||||
| Assets: |
||||||||||||
| Opening Balance, as of December 31, 2018 |
$ | 211,760 | $ | 15,491,176 | $ | 15,702,936 | ||||||
| Transfers into Level 3 |
— | — | — | |||||||||
| Transfers out of Level 3 |
— | — | — | |||||||||
| Accrued discounts/premiums |
— | — | — | |||||||||
| Net realized gain (loss) |
— | — | — | |||||||||
| Net change in unrealized appreciation (depreciation)(a)(b) |
125,352 | (1,157,905 | ) | (1,032,553 | ) | |||||||
| Purchases |
— | 3,130,001 | 3,130,001 | |||||||||
| Sales |
— | (3,000,048 | ) | (3,000,048 | ) | |||||||
|
|
|
|
|
|
|
|||||||
| Closing Balance, as of June 30, 2019 |
$ | 337,112 | $ | 14,463,224 | $ | 14,800,336 | ||||||
|
|
|
|
|
|
|
|||||||
| Net change in unrealized appreciation (depreciation) on investments still held at June 30, 2019(b) |
$ | 125,352 | $ | (108,674 | ) | $ | 16,678 | |||||
|
|
|
|
|
|
|
|||||||
| (a) | Included in the related net change in unrealized appreciation (depreciation) in the Statements of Operations. |
| (b) | Any difference between net change in unrealized appreciation (depreciation) and net change in unrealized appreciation (depreciation) on derivative financial instruments still held at June 30, 2019 is generally due to derivative financial instruments no longer held or categorized as Level 3 at period end. |
The following table summarizes the valuation approaches used and unobservable inputs utilized by the BlackRock Global Valuation Methodologies Committee (the “Global Valuation Committee”) to determine the value of certain of the Fund’s Level 3 investments as of period end. The table does not include Level 3 investments with values based upon unadjusted third party pricing information in the amount of $1. A significant change in the third party information could result in a significantly lower or higher value of such Level 3 investments.
| Value | Valuation Approach | Unobservable Inputs | Range of Unobservable Inputs Utilized |
Weighted Average of Unobservable Inputs |
||||||||||||||||
| Assets: |
||||||||||||||||||||
| Common Stocks |
$ | 337,111 | Market | Revenue Multiple(a) | 7.00x | — | ||||||||||||||
| Preferred Stocks(a) |
14,463,224 | Market | Revenue Multiple(a) | 2.50x – 5.00x | 3.51x | |||||||||||||||
| Recent Transactions(a) | — | — | ||||||||||||||||||
|
|
|
|||||||||||||||||||
| $ | 14,800,335 | |||||||||||||||||||
|
|
|
|||||||||||||||||||
| (a) | Increase in unobservable input may result in a significant increase to value, while a decrease in unobservable input may result in a significant decrease to value. |
See notes to financial statements.
| SCHEDULES OF INVESTMENTS | 87 |
| Schedule of Investments (unaudited) June 30, 2019 |
BlackRock Science and Technology Trust II (BSTZ) (Percentages shown are based on Net Assets) |
| 88 | 2019 BLACKROCK SEMI-ANNUAL REPORT TO SHAREHOLDERS |
| Schedule of Investments (unaudited) (continued) June 30, 2019 |
BlackRock Science and Technology Trust II (BSTZ) (Percentages shown are based on Net Assets) |
| (d) | During the period ended June 30, 2019, investments in issuers considered to be an affiliate/affiliates of the Trust for purposes of Section 2(a)(3) of the Investment Company Act of 1940, as amended, were as follows: |
| Affiliate | Net Activity |
Shares Held at 06/30/19 |
Value at 06/30/19 |
Income | Net Realized Gain (Loss) (a) |
Change in Unrealized Appreciation (Depreciation) |
||||||||||||||||||
| BlackRock Liquidity Funds, T-Fund, Institutional Class |
1,280,123,797 | 1,280,123,797 | $ | 1,280,123,797 | $ | 246,927 | $ | — | $ | — | ||||||||||||||
|
|
|
|
|
|
|
|
|
|||||||||||||||||
| (a) | Includes net capital gain distributions, if applicable. |
For Trust compliance purposes, the Trust’s industry classifications refer to one or more of the industry sub-classifications used by one or more widely recognized market indexes or rating group indexes, and/or as defined by the investment adviser. These definitions may not apply for purposes of this report, which may combine such industry sub-classifications for reporting ease.
Derivative Financial Instruments Outstanding as of Period End
OTC Options Written
| Description | Counterparty | Number of Contracts |
Expiration Date |
Exercise Price |
Notional Amount (000) |
Value | ||||||||||||||||||||
| Put | ||||||||||||||||||||||||||
| Atlassian Corp. PLC, Class A |
Citibank N.A. | 11,100 | 07/19/19 | USD | 117.49 | USD | 1,452 | $ | (14,672 | ) | ||||||||||||||||
| Costar Group, Inc. |
Credit Suisse International | 1,600 | 07/19/19 | USD | 508.76 | USD | 886 | (1,011 | ) | |||||||||||||||||
| Costar Group, Inc. |
Credit Suisse International | 3,100 | 07/19/19 | USD | 481.99 | USD | 1,718 | (92 | ) | |||||||||||||||||
| Monolithic Power Systems, Inc. |
Citibank N.A. | 5,600 | 07/19/19 | USD | 118.27 | USD | 760 | (1,464 | ) | |||||||||||||||||
| Pluralsight, Inc., Class A |
Citibank N.A. | 28,600 | 07/22/19 | USD | 26.14 | USD | 867 | (8,916 | ) | |||||||||||||||||
| Silicon Laboratories, Inc. |
Citibank N.A. | 7,300 | 07/22/19 | USD | 89.52 | USD | 755 | (1,887 | ) | |||||||||||||||||
| Network International Holdings PLC |
Citibank N.A. | 121,000 | 07/25/19 | GBP | 5.46 | GBP | 718 | (4,724 | ) | |||||||||||||||||
| SOITEC SA |
Goldman Sachs International | 9,100 | 07/25/19 | EUR | 91.42 | EUR | 876 | (16,703 | ) | |||||||||||||||||
| Activision Blizzard, Inc. |
Goldman Sachs International | 21,200 | 07/26/19 | USD | 41.97 | USD | 1,001 | (5,972 | ) | |||||||||||||||||
| Advanced Micro Devices, Inc. |
Citibank N.A. | 63,100 | 07/26/19 | USD | 26.92 | USD | 1,916 | (43,989 | ) | |||||||||||||||||
| Advanced Micro Devices, Inc. |
Citibank N.A. | 31,500 | 07/26/19 | USD | 28.41 | USD | 957 | (36,389 | ) | |||||||||||||||||
| Alteryx, Inc., Class A |
Credit Suisse International | 21,500 | 07/26/19 | USD | 95.19 | USD | 2,346 | (42,214 | ) | |||||||||||||||||
| Alteryx, Inc., Class A |
Credit Suisse International | 10,800 | 07/26/19 | USD | 100.48 | USD | 1,178 | (35,743 | ) | |||||||||||||||||
| Anaplan, Inc. |
Goldman Sachs International | 33,900 | 07/26/19 | USD | 44.48 | USD | 1,711 | (22,424 | ) | |||||||||||||||||
| Arco Platform Ltd., Class A |
Credit Suisse International | 29,400 | 07/26/19 | USD | 43.23 | USD | 1,287 | (81,545 | ) | |||||||||||||||||
| Arista Networks, Inc. |
Citibank N.A. | 2,800 | 07/26/19 | USD | 229.17 | USD | 727 | (4,223 | ) | |||||||||||||||||
| Avalara, Inc. |
Credit Suisse International | 14,300 | 07/26/19 | USD | 61.91 | USD | 1,032 | (15,894 | ) | |||||||||||||||||
| Coupa Software, Inc. |
Citibank N.A. | 7,000 | 07/26/19 | USD | 113.05 | USD | 886 | (11,239 | ) | |||||||||||||||||
| Coupa Software, Inc. |
Citibank N.A. | 13,900 | 07/26/19 | USD | 107.10 | USD | 1,760 | (11,633 | ) | |||||||||||||||||
| Cree, Inc. |
Citibank N.A. | 17,700 | 07/26/19 | USD | 54.35 | USD | 994 | (28,047 | ) | |||||||||||||||||
| Cree, Inc. |
Citibank N.A. | 35,600 | 07/26/19 | USD | 51.49 | USD | 2,000 | (31,326 | ) | |||||||||||||||||
| Crowdstrike Holdings, Inc., Class A |
Goldman Sachs International | 6,800 | 07/26/19 | USD | 59.46 | USD | 464 | (11,505 | ) | |||||||||||||||||
| Crowdstrike Holdings, Inc., Class A |
Goldman Sachs International | 13,700 | 07/26/19 | USD | 56.28 | USD | 936 | (14,846 | ) | |||||||||||||||||
| SCHEDULES OF INVESTMENTS | 89 |
| Schedule of Investments (unaudited) (continued) June 30, 2019 |
BlackRock Science and Technology Trust II (BSTZ) |
OTC Options Written (continued)
| Description | Counterparty | Number of Contracts |
Expiration Date |
Exercise Price |
Notional Amount (000) |
Value | ||||||||||||||||||||
| Put (continued) | ||||||||||||||||||||||||||
| Elastic NV |
Goldman Sachs International | 26,400 | 07/26/19 | USD | 65.34 | USD | 1,971 | $ | (14,095 | ) | ||||||||||||||||
| Elastic NV |
Goldman Sachs International | 13,200 | 07/26/19 | USD | 68.97 | USD | 986 | (16,137 | ) | |||||||||||||||||
| Farfetch Ltd., Class A |
Credit Suisse International | 46,200 | 07/26/19 | USD | 18.27 | USD | 961 | (18,428 | ) | |||||||||||||||||
| Five9, Inc. |
Goldman Sachs International | 22,300 | 07/26/19 | USD | 44.43 | USD | 1,144 | (13,331 | ) | |||||||||||||||||
| GDS Holdings Ltd. — ADR |
Citibank N.A. | 29,800 | 07/26/19 | USD | 31.26 | USD | 1,120 | (10,453 | ) | |||||||||||||||||
| Global Payments, Inc. |
Citibank N.A. | 5,300 | 07/26/19 | USD | 151.76 | USD | 849 | (7,256 | ) | |||||||||||||||||
| Keysight Technologies, Inc. |
Citibank N.A. | 13,100 | 07/26/19 | USD | 83.08 | USD | 1,177 | (10,726 | ) | |||||||||||||||||
| MercadoLibre, Inc. |
Citibank N.A. | 1,400 | 07/26/19 | USD | 579.69 | USD | 856 | (25,698 | ) | |||||||||||||||||
| MongoDB, Inc., Class A |
Citibank N.A. | 6,100 | 07/26/19 | USD | 146.68 | USD | 928 | (38,989 | ) | |||||||||||||||||
| NetEase, Inc. — ADR |
Citibank N.A. | 3,900 | 07/26/19 | USD | 230.94 | USD | 998 | (7,398 | ) | |||||||||||||||||
| Okta, Inc., Class A |
Goldman Sachs International | 11,600 | 07/26/19 | USD | 114.69 | USD | 1,433 | (27,811 | ) | |||||||||||||||||
| Okta, Inc., Class A |
Goldman Sachs International | 23,100 | 07/26/19 | USD | 108.65 | USD | 2,853 | (27,822 | ) | |||||||||||||||||
| Pagseguro Digital Ltd., Class A |
Citibank N.A. | 33,900 | 07/26/19 | USD | 35.99 | USD | 1,321 | (27,427 | ) | |||||||||||||||||
| Pagseguro Digital Ltd., Class A |
Citibank N.A. | 68,000 | 07/26/19 | USD | 34.10 | USD | 2,650 | (25,430 | ) | |||||||||||||||||
| Pinterest, Inc., Class A |
Citibank N.A. | 21,400 | 07/26/19 | USD | 24.91 | USD | 583 | (11,699 | ) | |||||||||||||||||
| Pinterest, Inc., Class A |
Citibank N.A. | 42,900 | 07/26/19 | USD | 23.60 | USD | 1,168 | (9,045 | ) | |||||||||||||||||
| RingCentral, Inc., Class A |
Credit Suisse International | 8,800 | 07/26/19 | USD | 99.80 | USD | 1,011 | (7,000 | ) | |||||||||||||||||
| Roku, Inc., Class A |
Goldman Sachs International | 8,300 | 07/26/19 | USD | 83.02 | USD | 752 | (19,792 | ) | |||||||||||||||||
| SVMK, Inc. |
Citibank N.A. | 77,700 | 07/26/19 | USD | 14.26 | USD | 1,283 | (14,321 | ) | |||||||||||||||||
| Shopify, Inc., Class A |
Credit Suisse International | 3,000 | 07/26/19 | USD | 271.76 | USD | 900 | (15,619 | ) | |||||||||||||||||
| Shopify, Inc., Class A |
Credit Suisse International | 5,900 | 07/26/19 | USD | 257.46 | USD | 1,771 | (18,202 | ) | |||||||||||||||||
| Slack Technologies, Inc., Class A |
Goldman Sachs International | 31,800 | 07/26/19 | USD | 33.64 | USD | 1,193 | (24,766 | ) | |||||||||||||||||
| Slack Technologies, Inc., Class A |
Goldman Sachs International | 15,900 | 07/26/19 | USD | 35.51 | USD | 596 | (22,032 | ) | |||||||||||||||||
| Smartsheet, Inc., Class A |
Goldman Sachs International | 16,600 | 07/26/19 | USD | 45.28 | USD | 803 | (21,465 | ) | |||||||||||||||||
| Smartsheet, Inc., Class A |
Goldman Sachs International | 33,300 | 07/26/19 | USD | 42.90 | USD | 1,612 | (21,705 | ) | |||||||||||||||||
| Square, Inc., Class A |
Citibank N.A. | 40,100 | 07/26/19 | USD | 63.07 | USD | 2,908 | (15,318 | ) | |||||||||||||||||
| Square, Inc., Class A |
Citibank N.A. | 20,000 | 07/26/19 | USD | 66.58 | USD | 1,451 | (16,954 | ) | |||||||||||||||||
| Trade Desk, Inc., Class A |
Credit Suisse International | 4,900 | 07/26/19 | USD | 202.50 | USD | 1,116 | (14,429 | ) | |||||||||||||||||
| Tradeweb Markets, Inc., Class A |
Credit Suisse International | 23,900 | 07/26/19 | USD | 37.45 | USD | 1,047 | (9,331 | ) | |||||||||||||||||
| Tradeweb Markets, Inc., Class A |
Credit Suisse International | 11,900 | 07/26/19 | USD | 39.53 | USD | 521 | (8,044 | ) | |||||||||||||||||
| Twilio, Inc., Class A |
Citibank N.A. | 31,100 | 07/26/19 | USD | 120.64 | USD | 4,240 | (58,521 | ) | |||||||||||||||||
| Twilio, Inc., Class A |
Citibank N.A. | 15,600 | 07/26/19 | USD | 127.34 | USD | 2,127 | (52,339 | ) | |||||||||||||||||
| Wix.com Ltd. |
Goldman Sachs International | 9,000 | 07/26/19 | USD | 126.17 | USD | 1,279 | (16,078 | ) | |||||||||||||||||
| Zendesk, Inc. |
Goldman Sachs International | 15,900 | 07/26/19 | USD | 77.68 | USD | 1,416 | (14,887 | ) | |||||||||||||||||
| Zoom Video Communications, Inc., Class A |
Goldman Sachs International | 9,100 | 07/26/19 | USD | 82.93 | USD | 808 | (29,768 | ) | |||||||||||||||||
| Altium Ltd. |
Citibank N.A. | 39,600 | 07/29/19 | AUD | 30.50 | AUD | 1,361 | (7,852 | ) | |||||||||||||||||
| China Tower Corp. Ltd., Class H |
Morgan Stanley & Co. International PLC | 3,200,000 | 07/29/19 | HKD | 1.86 | HKD | 6,560 | (6,276 | ) | |||||||||||||||||
| GMO Payment Gateway, Inc. |
Goldman Sachs International | 19,200 | 07/29/19 | JPY | 6,740.26 | JPY | 143,056 | (20,389 | ) | |||||||||||||||||
| GMO Payment Gateway, Inc. |
Goldman Sachs International | 38,500 | 07/29/19 | JPY | 6,385.51 | JPY | 286,857 | (17,588 | ) | |||||||||||||||||
| IAC InterActive Corp. |
Citibank N.A. | 6,600 | 07/29/19 | USD | 198.55 | USD | 1,436 | (16,350 | ) | |||||||||||||||||
| II-VI, Inc. |
Citibank N.A. | 24,240 | 07/29/19 | USD | 31.50 | USD | 886 | (12,115 | ) | |||||||||||||||||
| Inphi Corp. |
Goldman Sachs International | 23,100 | 07/29/19 | USD | 46.82 | USD | 1,157 | (32,941 | ) | |||||||||||||||||
| InterXion Holding NV |
Credit Suisse International | 13,050 | 07/29/19 | USD | 69.16 | USD | 993 | (3,756 | ) | |||||||||||||||||
| Kingdee International Software Group Co. Ltd. |
Goldman Sachs International | 927,000 | 07/29/19 | HKD | 7.63 | HKD | 7,842 | (26,951 | ) | |||||||||||||||||
| Meituan Dianping, Class B |
BNP Paribas S.A. | 102,000 | 07/29/19 | HKD | 59.92 | HKD | 6,998 | (3,522 | ) | |||||||||||||||||
| NEXTDC Ltd. |
Goldman Sachs International | 186,900 | 07/29/19 | AUD | 5.76 | AUD | 1,215 | (1,287 | ) | |||||||||||||||||
| New Relic, Inc. |
Goldman Sachs International | 10,200 | 07/29/19 | USD | 79.24 | USD | 882 | (15,522 | ) | |||||||||||||||||
| Xero Ltd. |
Goldman Sachs International | 19,800 | 07/29/19 | AUD | 54.99 | AUD | 1,191 | (6,637 | ) | |||||||||||||||||
| Adyen NV |
Goldman Sachs International | 1,300 | 07/30/19 | EUR | 628.30 | EUR | 882 | (11,294 | ) | |||||||||||||||||
| Aixtron SE |
Citibank N.A. | 52,400 | 07/30/19 | EUR | 7.53 | EUR | 440 | (10,580 | ) | |||||||||||||||||
| Delivery Hero SE |
Goldman Sachs International | 28,000 | 07/30/19 | EUR | 35.29 | EUR | 1,118 | (11,352 | ) | |||||||||||||||||
| Network International Holdings PLC |
Citibank N.A. | 242,500 | 07/30/19 | GBP | 5.35 | GBP | 1,438 | (7,243 | ) | |||||||||||||||||
| SOITEC SA |
Goldman Sachs International | 18,100 | 07/30/19 | EUR | 89.02 | EUR | 1,741 | (26,730 | ) | |||||||||||||||||
| UbiSoft Entertainment SA |
Citibank N.A. | 10,900 | 07/30/19 | EUR | 62.94 | EUR | 750 | (15,035 | ) | |||||||||||||||||
| Wirecard AG |
Citibank N.A. | 7,500 | 07/30/19 | EUR | 133.39 | EUR | 1,113 | (29,106 | ) | |||||||||||||||||
| Linx SA, ADR |
Credit Suisse International | 96,800 | 08/02/19 | USD | 8.17 | USD | 883 | (16,078 | ) | |||||||||||||||||
| Magazine Luiza SA |
Goldman Sachs International | 23,300 | 08/02/19 | USD | 198.15 | USD | 4,919 | (27,865 | ) | |||||||||||||||||
| Marvell Technology Group Ltd. |
Citibank N.A. | 47,800 | 08/02/19 | USD | 22.65 | USD | 1,141 | (23,339 | ) | |||||||||||||||||
| MercadoLibre, Inc. |
Goldman Sachs International | 2,700 | 08/02/19 | USD | 548.61 | USD | 1,652 | (34,319 | ) | |||||||||||||||||
| MongoDB, Inc., Class A |
Citibank N.A. | 12,400 | 08/02/19 | USD | 138.96 | USD | 1,886 | (58,412 | ) | |||||||||||||||||
| Zoom Video Communications, Inc., Class A |
Goldman Sachs International | 18,100 | 08/02/19 | USD | 78.56 | USD | 1,607 | (44,034 | ) | |||||||||||||||||
| Zscaler, Inc. |
Citibank N.A. | 15,200 | 08/02/19 | USD | 70.95 | USD | 1,165 | (48,293 | ) | |||||||||||||||||
| 90 | 2019 BLACKROCK SEMI-ANNUAL REPORT TO SHAREHOLDERS |
| Schedule of Investments (unaudited) (continued) June 30, 2019 |
BlackRock Science and Technology Trust II (BSTZ) |
OTC Options Written (continued)
| Description | Counterparty | Number of Contracts |
Expiration Date |
Exercise Price |
Notional Amount (000) |
Value | ||||||||||||||||||||||||
| Put (continued) | ||||||||||||||||||||||||||||||
| Magazine Luiza SA |
Credit Suisse International | 46,800 | 08/07/19 | USD | 191.92 | USD | 9,880 | $ | (39,710 | ) | ||||||||||||||||||||
| Aspen Technology, Inc. |
Citibank N.A. | 6,400 | 08/16/19 | USD | 108.45 | USD | 795 | (7,984 | ) | |||||||||||||||||||||
| Bandwidth, Inc., Class A |
Goldman Sachs International | 10,700 | 08/16/19 | USD | 65.22 | USD | 803 | (21,809 | ) | |||||||||||||||||||||
| Global Payments, Inc. |
Citibank N.A. | 10,700 | 08/16/19 | USD | 143.77 | USD | 1,713 | (10,341 | ) | |||||||||||||||||||||
| Inphi Corp. |
Citibank N.A. | 46,140 | 08/16/19 | USD | 44.35 | USD | 2,312 | (57,233 | ) | |||||||||||||||||||||
| Marvell Technology Group Ltd. |
Citibank N.A. | 95,800 | 08/16/19 | USD | 21.93 | USD | 2,287 | (42,403 | ) | |||||||||||||||||||||
| Zscaler, Inc. |
Citibank N.A. | 30,300 | 08/16/19 | USD | 67.21 | USD | 2,322 | (60,633 | ) | |||||||||||||||||||||
|
|
|
|||||||||||||||||||||||||||||
| $ | (1,913,753 | ) | ||||||||||||||||||||||||||||
|
|
|
|||||||||||||||||||||||||||||
Balances Reported in the Statements of Assets and Liabilities for Options Written
| Swap Premiums Paid |
Swap Premiums Received |
Unrealized Appreciation |
Unrealized Depreciation |
Value | ||||||||||||||||
| Options Written |
N/A | N/A | $ | 455,921 | $ | (127,603 | ) | $ | (1,913,753 | ) | ||||||||||
Derivative Financial Instruments Categorized by Risk Exposure
As of period end, the fair values of derivative financial instruments located in the Statements of Assets and Liabilities were as follows:
| Commodity Contracts |
Credit Contracts |
Equity Contracts |
Foreign Currency Exchange Contracts |
Interest Rate Contracts |
Other Contracts |
Total | ||||||||||||||||||||||
| Liabilities — Derivative Financial Instruments |
| |||||||||||||||||||||||||||
| Options written |
||||||||||||||||||||||||||||
| Options written at value |
$ | — | $ | — | $ | 1,913,753 | $ | — | $ | — | $ | — | $ | 1,913,753 | ||||||||||||||
|
|
|
|
|
|
|
|
|
|
|
|
|
|
|
|||||||||||||||
For the period ended June 30, 2019, the effect of derivative financial instruments in the Statements of Operations was as follows:
| Commodity Contracts |
Credit Contracts |
Equity Contracts |
Foreign Currency Exchange Contracts |
Interest Rate Contracts |
Other Contracts |
Total | ||||||||||||||||||||||
| Net Change in Unrealized Appreciation (Depreciation) on: |
| |||||||||||||||||||||||||||
| Options written |
$ | — | $ | — | $ | 328,318 | $ | — | $ | — | $ | — | $ | 328,318 | ||||||||||||||
|
|
|
|
|
|
|
|
|
|
|
|
|
|
|
|||||||||||||||
Average Quarterly Balances of Outstanding Derivative Financial Instruments
| Options: |
| |||
| Average value of option contracts written |
$ | 1,913,753 | ||
For more information about the Trust’s investment risks regarding derivative financial instruments, refer to the Notes to Financial Statements.
Derivative Financial Instruments — Offsetting as of Period End
The Trust’s derivative assets and liabilities (by type) are as follows:
| Assets | Liabilities | |||||||
| Derivative Financial Instruments: |
||||||||
| Options |
$ | — | $ | 1,913,753 | ||||
| Derivatives not subject to a Master Netting Agreement or similar agreement (“MNA”) |
— | — | ||||||
|
|
|
|
|
|||||
| Total derivative assets and liabilities subject to an MNA |
$ | — | $ | 1,913,753 | ||||
|
|
|
|
|
|||||
| SCHEDULES OF INVESTMENTS | 91 |
| Schedule of Investments (unaudited) (continued) June 30, 2019 |
BlackRock Science and Technology Trust II (BSTZ) |
The following table presents the Trust’s derivative assets (and liabilities) by counterparty net of amounts available for offset under an MNA and net of the related collateral received (and pledged) by the Trust:
| Counterparty | Derivative Liabilities Subject to an MNA by Counterparty |
Derivatives Available for Offset |
Non-cash Collateral Pledged |
Cash Collateral Pledged |
Net Amount of Derivative Liabilities (a) |
|||||||||||||||
| BNP Paribas S.A. |
$ | 3,522 | $ | — | $ | — | $ | — | $ | 3,522 | ||||||||||
| Citibank N.A. |
937,002 | — | — | — | 937,002 | |||||||||||||||
| Credit Suisse International |
327,096 | — | — | — | 327,096 | |||||||||||||||
| Goldman Sachs International |
639,857 | — | — | — | 639,857 | |||||||||||||||
| Morgan Stanley & Co. International PLC |
6,276 | — | — | — | 6,276 | |||||||||||||||
|
|
|
|
|
|
|
|
|
|
|
|||||||||||
| $ | 1,913,753 | $ | — | $ | — | $ | — | $ | 1,913,753 | |||||||||||
|
|
|
|
|
|
|
|
|
|
|
|||||||||||
| (a) | Net amount represents the net amount payable due to counterparty in the event of default. Net amount may be offset further by the options written receivable/payable on the Statements of Assets and Liabilities. |
Fair Value Hierarchy as of Period End
Various inputs are used in determining the fair value of investments and derivative financial instruments. For information about the Trust’s policy regarding valuation of investments and derivative financial instruments, refer to the Notes to Financial Statements.
The following tables summarize the Trust’s investments and derivative financial instruments categorized in the disclosure hierarchy:
| Level 1 | Level 2 | Level 3 | Total | |||||||||||||
| Assets: |
| |||||||||||||||
| Investments: |
| |||||||||||||||
| Common Stocks: |
| |||||||||||||||
| Capital Markets |
$ | 1,605,943 | $ | — | $ | — | $ | 1,605,943 | ||||||||
| Communications Equipment |
5,387,277 | — | — | 5,387,277 | ||||||||||||
| Diversified Consumer Services |
6,388,254 | — | — | 6,388,254 | ||||||||||||
| Diversified Telecommunication Services |
3,184,674 | 2,572,611 | — | 5,757,285 | ||||||||||||
| Electrical Equipment |
3,501,424 | — | — | 3,501,424 | ||||||||||||
| Electronic Equipment, Instruments & Components |
2,073,803 | — | — | 2,073,803 | ||||||||||||
| Entertainment |
7,840,486 | 2,608,568 | — | 10,449,054 | ||||||||||||
| Health Care Technology |
3,696,712 | 1,553,382 | — | 5,250,094 | ||||||||||||
| Hotels, Restaurants & Leisure |
3,318,056 | — | — | 3,318,056 | ||||||||||||
| Household Durables |
2,954,539 | — | — | 2,954,539 | ||||||||||||
| Interactive Media & Services |
15,761,914 | 2,610,151 | — | 18,372,065 | ||||||||||||
| Internet & Direct Marketing Retail |
13,783,086 | 8,274,052 | — | 22,057,138 | ||||||||||||
| IT Services |
47,134,191 | 8,380,313 | — | 55,514,504 | ||||||||||||
| Multiline Retail |
3,951,074 | — | — | 3,951,074 | ||||||||||||
| Professional Services |
2,651,177 | — | — | 2,651,177 | ||||||||||||
| Semiconductors & Semiconductor Equipment |
33,369,166 | 6,800,485 | — | 40,169,651 | ||||||||||||
| Software |
91,437,489 | 8,543,834 | — | 99,981,323 | ||||||||||||
| Short-Term Securities |
1,280,123,797 | — | — | 1,280,123,797 | ||||||||||||
|
|
|
|
|
|
|
|
|
|||||||||
| $ | 1,528,163,062 | $ | 41,343,396 | $ | — | $ | 1,569,506,458 | |||||||||
|
|
|
|
|
|
|
|
|
|||||||||
| Derivative Financial Instruments(a) |
| |||||||||||||||
| Liabilities: |
| |||||||||||||||
| Equity contracts |
$ | — | $ | (1,913,753 | ) | $ | — | $ | (1,913,753 | ) | ||||||
|
|
|
|
|
|
|
|
|
|||||||||
| (a) | Derivative financial instruments are options written which are shown at value. |
See notes to financial statements.
| 92 | 2019 BLACKROCK SEMI-ANNUAL REPORT TO SHAREHOLDERS |
| Schedule of Investments (unaudited) June 30, 2019 |
BlackRock Utilities, Infrastructure & Power Opportunities Trust (BUI) (Percentages shown are based on Net Assets) |
| (e) | During the six months ended June 30, 2019, investments in issuers considered to be an affiliate/affiliates of the Trust for purposes of Section 2(a)(3) of the Investment Company Act of 1940, as amended, were as follows: |
| Affiliate | Shares Held at 12/31/18 |
Net Activity |
Shares Held at 06/30/19 |
Value at 06/30/19 |
Income | Net Realized Gain (Loss) (a) |
Change in Unrealized Appreciation (Depreciation) |
|||||||||||||||||||||
|
BlackRock Liquidity Funds, T-Fund, Institutional Class |
9,797,799 | (1,852,709 | ) | 7,945,090 | $ | 7,945,090 | $ | 81,108 | $ | — | $ | — | ||||||||||||||||
|
|
|
|
|
|
|
|
|
|||||||||||||||||||||
| (a) | Includes net capital gain distributions, if applicable. |
For Trust compliance purposes, the Trust’s industry classifications refer to one or more of the industry sub-classifications used by one or more widely recognized market indexes or rating group indexes, and/or as defined by the investment adviser. These definitions may not apply for purposes of this report, which may combine such industry sub-classifications for reporting ease.
| SCHEDULES OF INVESTMENTS | 93 |
| Schedule of Investments (unaudited) (continued) June 30, 2019 |
BlackRock Utilities, Infrastructure & Power Opportunities Trust (BUI) |
Derivative Financial Instruments Outstanding as of Period End
Exchange-Traded Options Written
| Description | Number of Contracts |
Expiration Date |
Exercise Price |
Notional Amount (000) |
Value | |||||||||||||||||||
| Call | ||||||||||||||||||||||||
| FirstEnergy Corp. |
124 | 07/02/19 | USD | 41.50 | USD | 531 | $ | (16,629 | ) | |||||||||||||||
| CMS Energy Corp. |
223 | 07/09/19 | USD | 57.12 | USD | 1,291 | (25,551 | ) | ||||||||||||||||
| Xcel Energy, Inc. |
124 | 07/10/19 | USD | 57.67 | USD | 738 | (24,741 | ) | ||||||||||||||||
| Enterprise Products Partners LP |
15 | 07/12/19 | USD | 28.50 | USD | 43 | (789 | ) | ||||||||||||||||
| ONEOK, Inc. |
52 | 07/12/19 | USD | 65.50 | USD | 358 | (18,460 | ) | ||||||||||||||||
| Williams Cos., Inc. |
120 | 07/12/19 | USD | 28.09 | USD | 336 | (4,647 | ) | ||||||||||||||||
| American Electric Power Co., Inc. |
112 | 07/19/19 | USD | 87.50 | USD | 986 | (17,920 | ) | ||||||||||||||||
| CMS Energy Corp. |
223 | 07/19/19 | USD | 59.69 | USD | 1,291 | (5,747 | ) | ||||||||||||||||
| DTE Energy Co. |
88 | 07/19/19 | USD | 131.44 | USD | 1,125 | (4,565 | ) | ||||||||||||||||
| Dominion Energy, Inc. |
356 | 07/19/19 | USD | 80.00 | USD | 2,753 | (20,470 | ) | ||||||||||||||||
| Duke Energy Corp. |
176 | 07/19/19 | USD | 87.50 | USD | 1,553 | (30,360 | ) | ||||||||||||||||
| Eaton Corp PLC |
47 | 07/19/19 | USD | 80.00 | USD | 391 | (18,565 | ) | ||||||||||||||||
| Enbridge, Inc. |
306 | 07/19/19 | USD | 37.50 | USD | 1,104 | (3,825 | ) | ||||||||||||||||
| Enterprise Products Partners LP |
232 | 07/19/19 | USD | 29.00 | USD | 670 | (8,120 | ) | ||||||||||||||||
| Eversource Energy |
10 | 07/19/19 | USD | 75.00 | USD | 76 | (1,550 | ) | ||||||||||||||||
| Eversource Energy |
46 | 07/19/19 | USD | 73.55 | USD | 348 | (11,911 | ) | ||||||||||||||||
| Exelon Corp. |
100 | 07/19/19 | USD | 49.00 | USD | 479 | (2,750 | ) | ||||||||||||||||
| First Solar, Inc. |
84 | 07/19/19 | USD | 62.50 | USD | 552 | (34,440 | ) | ||||||||||||||||
| FirstEnergy Corp. |
71 | 07/19/19 | USD | 42.00 | USD | 304 | (9,052 | ) | ||||||||||||||||
| FirstEnergy Corp. |
53 | 07/19/19 | USD | 45.00 | USD | 227 | (530 | ) | ||||||||||||||||
| Johnson Controls International PLC |
353 | 07/19/19 | USD | 39.00 | USD | 1,458 | (88,780 | ) | ||||||||||||||||
| NextEra Energy, Inc. |
180 | 07/19/19 | USD | 198.50 | USD | 3,687 | (134,862 | ) | ||||||||||||||||
| ON Semiconductor Corp. |
216 | 07/19/19 | USD | 21.00 | USD | 437 | (9,720 | ) | ||||||||||||||||
| ONEOK, Inc. |
52 | 07/19/19 | USD | 67.50 | USD | 358 | (10,790 | ) | ||||||||||||||||
| PPL Corp. |
342 | 07/19/19 | USD | 32.00 | USD | 1,061 | (5,130 | ) | ||||||||||||||||
| Public Service Enterprise Group, Inc. |
204 | 07/19/19 | USD | 60.97 | USD | 1,200 | (4,071 | ) | ||||||||||||||||
| Sempra Energy |
129 | 07/19/19 | USD | 140.00 | USD | 1,773 | (9,998 | ) | ||||||||||||||||
| Texas Instruments, Inc. |
37 | 07/19/19 | USD | 115.00 | USD | 425 | (9,861 | ) | ||||||||||||||||
| WEC Energy Group, Inc. |
82 | 07/19/19 | USD | 81.05 | USD | 684 | (22,115 | ) | ||||||||||||||||
| Williams Cos., Inc. |
248 | 07/19/19 | USD | 29.00 | USD | 695 | (4,092 | ) | ||||||||||||||||
| Williams Cos., Inc. |
19 | 07/19/19 | USD | 28.00 | USD | 53 | (1,092 | ) | ||||||||||||||||
| Xcel Energy, Inc. |
125 | 07/19/19 | USD | 60.00 | USD | 744 | (14,063 | ) | ||||||||||||||||
| Enterprise Products Partners LP |
51 | 07/26/19 | USD | 29.00 | USD | 147 | (2,295 | ) | ||||||||||||||||
| Johnson Controls International PLC |
113 | 07/26/19 | USD | 40.00 | USD | 467 | (19,945 | ) | ||||||||||||||||
| NextEra Energy, Inc. |
188 | 07/26/19 | USD | 200.05 | USD | 3,851 | (127,679 | ) | ||||||||||||||||
| ONEOK, Inc. |
52 | 07/26/19 | USD | 70.00 | USD | 358 | (4,420 | ) | ||||||||||||||||
| Texas Instruments, Inc. |
28 | 07/26/19 | USD | 115.00 | USD | 321 | (11,550 | ) | ||||||||||||||||
| Williams Cos., Inc. |
256 | 07/26/19 | USD | 28.50 | USD | 718 | (10,880 | ) | ||||||||||||||||
| Williams Cos., Inc. |
60 | 07/26/19 | USD | 27.06 | USD | 168 | (8,126 | ) | ||||||||||||||||
| WEC Energy Group, Inc. |
68 | 07/29/19 | USD | 85.68 | USD | 567 | (3,320 | ) | ||||||||||||||||
| Eversource Energy |
92 | 07/30/19 | USD | 73.55 | USD | 697 | (25,825 | ) | ||||||||||||||||
| Duke Energy Corp. |
162 | 08/01/19 | USD | 88.99 | USD | 1,429 | (21,463 | ) | ||||||||||||||||
| NextEra Energy, Inc. |
212 | 08/01/19 | USD | 203.00 | USD | 4,343 | (112,192 | ) | ||||||||||||||||
| Enterprise Products Partners LP |
104 | 08/02/19 | USD | 29.00 | USD | 300 | (4,940 | ) | ||||||||||||||||
| First Solar, Inc. |
84 | 08/02/19 | USD | 65.00 | USD | 552 | (32,130 | ) | ||||||||||||||||
| Johnson Controls International PLC |
113 | 08/02/19 | USD | 40.00 | USD | 467 | (22,261 | ) | ||||||||||||||||
| ONEOK, Inc. |
37 | 08/02/19 | USD | 67.00 | USD | 255 | (11,840 | ) | ||||||||||||||||
| Texas Instruments, Inc. |
50 | 08/02/19 | USD | 115.00 | USD | 574 | (20,875 | ) | ||||||||||||||||
| Williams Cos., Inc. |
247 | 08/02/19 | USD | 28.00 | USD | 693 | (19,884 | ) | ||||||||||||||||
| Williams Cos., Inc. |
30 | 08/02/19 | USD | 27.50 | USD | 84 | (3,330 | ) | ||||||||||||||||
| Enterprise Products Partners LP |
17 | 08/09/19 | USD | 29.00 | USD | 49 | (807 | ) | ||||||||||||||||
| First Solar, Inc. |
37 | 08/09/19 | USD | 70.00 | USD | 243 | (7,122 | ) | ||||||||||||||||
| FirstEnergy Corp. |
159 | 08/12/19 | USD | 44.00 | USD | 681 | (6,807 | ) | ||||||||||||||||
| American Electric Power Co., Inc. |
121 | 08/16/19 | USD | 90.00 | USD | 1,065 | (14,520 | ) | ||||||||||||||||
| Eaton Corp PLC |
113 | 08/16/19 | USD | 82.50 | USD | 941 | (33,618 | ) | ||||||||||||||||
| Edison International |
154 | 08/16/19 | USD | 65.00 | USD | 1,038 | (60,830 | ) | ||||||||||||||||
| Exelon Corp. |
273 | 08/16/19 | USD | 51.00 | USD | 1,309 | (5,410 | ) | ||||||||||||||||
| FirstEnergy Corp. |
124 | 08/16/19 | USD | 43.99 | USD | 531 | (5,857 | ) | ||||||||||||||||
| FirstEnergy Corp. |
53 | 08/16/19 | USD | 44.65 | USD | 227 | (1,813 | ) | ||||||||||||||||
| Johnson Controls International PLC |
225 | 08/16/19 | USD | 41.00 | USD | 929 | (34,650 | ) | ||||||||||||||||
| 94 | 2019 BLACKROCK SEMI-ANNUAL REPORT TO SHAREHOLDERS |
| Schedule of Investments (unaudited) (continued) June 30, 2019 |
BlackRock Utilities, Infrastructure & Power Opportunities Trust (BUI) |
Exchange-Traded Options Written (continued)
| Description | Number of Contracts |
Expiration Date |
Exercise Price |
Notional Amount (000) |
Value | |||||||||||||||||||
| Call (continued) | ||||||||||||||||||||||||
| ON Semiconductor Corp. |
135 | 08/16/19 | USD | 21.00 | USD | 273 | $ | (13,163 | ) | |||||||||||||||
| ON Semiconductor Corp. |
216 | 08/16/19 | USD | 22.00 | USD | 437 | (13,500 | ) | ||||||||||||||||
| Public Service Enterprise Group, Inc. |
385 | 08/16/19 | USD | 61.05 | USD | 2,265 | (27,189 | ) | ||||||||||||||||
| Williams Cos., Inc. |
649 | 08/16/19 | USD | 29.00 | USD | 1,820 | (31,477 | ) | ||||||||||||||||
| Williams Cos., Inc. |
30 | 08/16/19 | USD | $ | 28.00 | USD | 84 | (2,865 | ) | |||||||||||||||
| FirstEnergy Corp. |
55 | 08/23/19 | USD | 43.55 | USD | 235 | (4,024 | ) | ||||||||||||||||
| FirstEnergy Corp. |
71 | 08/23/19 | USD | 42.95 | USD | 304 | (6728 | ) | ||||||||||||||||
| Williams Cos., Inc. |
278 | 09/20/19 | USD | 29.00 | USD | 780 | (20,016 | ) | ||||||||||||||||
|
|
|
|||||||||||||||||||||||
| $ | (1,328,547 | ) | ||||||||||||||||||||||
|
|
|
|||||||||||||||||||||||
OTC Options Written
| Description | Counterparty | Number of Contracts |
Expiration Date |
Exercise Price |
Notional Amount (000) |
Value | ||||||||||||||||||||
| Call | ||||||||||||||||||||||||||
| TC Energy Corp. |
Goldman Sachs International | 14,800 | 07/08/19 | CAD | 63.94 | CAD | 961 | $ | (12,924 | ) | ||||||||||||||||
| ABB Ltd., Registered Shares |
UBS AG | 5,000 | 07/09/19 | CHF | 19.57 | CHF | 98 | (1,468 | ) | |||||||||||||||||
| Air Liquide SA |
Goldman Sachs International | 13,200 | 07/09/19 | EUR | 115.98 | EUR | 1,624 | (106,520 | ) | |||||||||||||||||
| Air Liquide |
UBS AG | 3,100 | 07/09/19 | EUR | 116.15 | EUR | 381 | (24,432 | ) | |||||||||||||||||
| EDP Renovaveis SA |
Credit Suisse International | 30,000 | 07/09/19 | EUR | 8.85 | EUR | 271 | (6,789 | ) | |||||||||||||||||
| Eiffage SA |
UBS AG | 8,700 | 07/09/19 | EUR | 92.47 | EUR | 756 | (578 | ) | |||||||||||||||||
| Johnson Matthey PLC |
Goldman Sachs International | 28,500 | 07/09/19 | GBP | 31.91 | GBP | 949 | (53,010 | ) | |||||||||||||||||
| Sika AG, Registered Shares |
UBS AG | 4,400 | 07/09/19 | CHF | 160.47 | CHF | 734 | (30,131 | ) | |||||||||||||||||
| Umicore SA |
Goldman Sachs International | 28,600 | 07/09/19 | EUR | 30.51 | EUR | 807 | (7,497 | ) | |||||||||||||||||
| Kingspan Group PLC |
UBS AG | 30,700 | 07/10/19 | EUR | 46.76 | EUR | 1,466 | (48,690 | ) | |||||||||||||||||
| National Grid PLC |
Credit Suisse International | 193,900 | 07/10/19 | GBP | 8.17 | GBP | 1,623 | (61,211 | ) | |||||||||||||||||
| National Grid PLC |
UBS AG | 35,400 | 07/10/19 | GBP | 8.15 | GBP | 296 | (11,912 | ) | |||||||||||||||||
| ON Semiconductor Corp. |
Barclays Bank PLC | 11,500 | 07/10/19 | USD | 19.41 | USD | 232 | (12,783 | ) | |||||||||||||||||
| RWE AG |
Credit Suisse International | 50,500 | 07/10/19 | EUR | 23.83 | EUR | 1,096 | (897 | ) | |||||||||||||||||
| Schneider Electric SE |
UBS AG | 4,400 | 07/10/19 | EUR | 75.42 | EUR | 350 | (21,680 | ) | |||||||||||||||||
| Vestas Wind Systems A/S |
Goldman Sachs International | 15,500 | 07/10/19 | DKK | 576.87 | DKK | 8,815 | (19,803 | ) | |||||||||||||||||
| China Longyuan Power Group Corp., Ltd., Class H |
JPMorgan Chase Bank N.A. | 1,267,000 | 07/11/19 | HKD | 4.93 | HKD | 6,360 | (27,163 | ) | |||||||||||||||||
| Enel S.P.A |
Goldman Sachs International | 364,600 | 07/11/19 | EUR | 5.79 | EUR | 2,235 | (144,987 | ) | |||||||||||||||||
| EDP Renovaveis SA |
Credit Suisse International | 30,000 | 07/16/19 | EUR | 8.89 | EUR | 271 | (6,419 | ) | |||||||||||||||||
| Iberdrola SA |
UBS AG | 147,000 | 07/16/19 | EUR | 8.35 | EUR | 1,288 | (69,859 | ) | |||||||||||||||||
| Siemens Gamesa Renewable Energy SA |
Morgan Stanley & Co. International PLC | 73,700 | 07/17/19 | EUR | 14.53 | EUR | 1,077 | (30,061 | ) | |||||||||||||||||
| Siemens Gamesa Renewable Energy SA |
UBS AG | 18,000 | 07/17/19 | EUR | 15.74 | EUR | 263 | (593 | ) | |||||||||||||||||
| Schneider Electric SE |
Goldman Sachs International | 23,200 | 07/17/19 | EUR | 73.37 | EUR | 1,846 | (169,632 | ) | |||||||||||||||||
| Umicore SA |
Credit Suisse International | 9,500 | 07/17/19 | EUR | 27.32 | EUR | 268 | (13,902 | ) | |||||||||||||||||
| Vinci SA |
UBS AG | 19,000 | 07/17/19 | EUR | 92.74 | EUR | 1,706 | (10,495 | ) | |||||||||||||||||
| Enel SpA |
Goldman Sachs International | 364,600 | 07/18/19 | EUR | 5.79 | EUR | 2,235 | (148,479 | ) | |||||||||||||||||
| TC Energy Corp. |
Credit Suisse International | 24,000 | 07/19/19 | CAD | 64.69 | CAD | 1,558 | (14,979 | ) | |||||||||||||||||
| ABB Ltd., Registered Shares |
Morgan Stanley & Co. International PLC | 31,000 | 07/23/19 | CHF | 19.40 | CHF | 607 | (15,089 | ) | |||||||||||||||||
| Umicore SA |
Credit Suisse International | 6,500 | 07/23/19 | EUR | 28.34 | EUR | 183 | (6,391 | ) | |||||||||||||||||
| China Longyuan Power Group Corp., Ltd., Class H |
UBS AG | 1,073,000 | 07/24/19 | HKD | 5.03 | HKD | 5,386 | (21,770 | ) | |||||||||||||||||
| Johnson Matthey PLC |
Deutsche Bank AG | 17,700 | 07/24/19 | GBP | 32.14 | GBP | 589 | (33,370 | ) | |||||||||||||||||
| TC Energy Corp. |
Credit Suisse International | 15,300 | 07/24/19 | CAD | 66.13 | CAD | 993 | (3,571 | ) | |||||||||||||||||
| Iberdrola SA |
Goldman Sachs International | 220,200 | 07/26/19 | EUR | 8.73 | EUR | 1,929 | (24,367 | ) | |||||||||||||||||
| Iberdrola SA |
Morgan Stanley & Co. International PLC | 74,300 | 07/26/19 | EUR | 8.78 | EUR | 651 | (7,053 | ) | |||||||||||||||||
| Kingspan Group PLC |
Morgan Stanley & Co. International PLC | 10,500 | 07/26/19 | EUR | 48.35 | EUR | 501 | (9,636 | ) | |||||||||||||||||
| Schneider Electric SE |
Goldman Sachs International | 15,100 | 07/26/19 | EUR | 74.45 | EUR | 1,202 | (96,541 | ) | |||||||||||||||||
| Fortis, Inc. |
Barclays Bank PLC | 25,400 | 07/30/19 | USD | 39.07 | USD | 1,003 | (20,386 | ) | |||||||||||||||||
| Enel SpA |
Credit Suisse International | 89,400 | 07/31/19 | EUR | 6.23 | EUR | 548 | (5,349 | ) | |||||||||||||||||
| Enel SpA |
JPMorgan Chase Bank N.A. | 158,500 | 07/31/19 | EUR | 5.97 | EUR | 972 | (32,655 | ) | |||||||||||||||||
| Linde PLC |
JPMorgan Chase Bank N.A. | 6,400 | 07/31/19 | EUR | 181.80 | EUR | 1,130 | (17,710 | ) | |||||||||||||||||
| RWE AG |
Goldman Sachs International | 42,900 | 07/31/19 | EUR | 23.23 | EUR | 931 | (10,067 | ) | |||||||||||||||||
| Sika AG, Registered Shares |
UBS AG | 4,500 | 07/31/19 | CHF | 161.15 | CHF | 751 | (33,981 | ) | |||||||||||||||||
| Kone OYJ,Class B |
Goldman Sachs International | 6,700 | 08/02/19 | EUR | 51.85 | EUR | 348 | (12,548 | ) | |||||||||||||||||
| Vinci SA |
Morgan Stanley & Co. International PLC | 19,000 | 08/02/19 | EUR | 92.86 | EUR | 1,706 | (22,564 | ) | |||||||||||||||||
| ABB Ltd., Registered Shares |
UBS AG | 54,100 | 08/06/19 | CHF | 19.53 | CHF | 1,059 | (28,804 | ) | |||||||||||||||||
| Eiffage SA |
Goldman Sachs International | 8,700 | 08/06/19 | EUR | 90.13 | EUR | 756 | (9,026 | ) | |||||||||||||||||
| SCHEDULES OF INVESTMENTS | 95 |
| Schedule of Investments (unaudited) (continued) June 30, 2019 |
BlackRock Utilities, Infrastructure & Power Opportunities Trust (BUI) |
OTC Options Written (continued)
| Description | Counterparty | Number of Contracts |
Expiration Date |
Exercise Price |
Notional Amount (000) |
Value | ||||||||||||||||||||
| Call (continued) | ||||||||||||||||||||||||||
| Linde PLC |
Credit Suisse International | 5,500 | 08/06/19 | EUR | 186.05 | EUR | 972 | $ | (10,459 | ) | ||||||||||||||||
| National Grid PLC |
Credit Suisse International | 106,100 | 08/06/19 | GBP | 8.54 | GBP | 888 | (14,001 | ) | |||||||||||||||||
| Vestas Wind Systems A/S |
Goldman Sachs International | 23,000 | 08/06/19 | DKK | 592.05 | DKK | 13,080 | (54,999 | ) | |||||||||||||||||
| Exelon Corp. |
Citibank N.A. | 32,400 | 08/08/19 | USD | 48.73 | USD | 1,553 | (22,233 | ) | |||||||||||||||||
| Kone OYJ,Class B |
Morgan Stanley & Co. International PLC | 6,650 | 08/08/19 | EUR | 52.51 | EUR | 345 | (10,799 | ) | |||||||||||||||||
| China Longyuan Power Group Corp., Ltd., Class H |
JPMorgan Chase Bank N.A. | 1,083,000 | 08/09/19 | HKD | 5.25 | HKD | 5,437 | (15,468 | ) | |||||||||||||||||
| Enbridge, Inc. |
Credit Suisse International | 33,400 | 08/09/19 | USD | 36.78 | USD | 1,205 | (16,974 | ) | |||||||||||||||||
| TC Energy Corp. |
Goldman Sachs International | 25,800 | 08/12/19 | CAD | 65.66 | CAD | 1,675 | (13,793 | ) | |||||||||||||||||
| Kone OYJ,Class B |
Morgan Stanley & Co. International PLC | 21,400 | 08/14/19 | EUR | 52.95 | EUR | 1,111 | (32,911 | ) | |||||||||||||||||
| China Longyuan Power Group Corp., Ltd., Class H |
JPMorgan Chase Bank N.A. | 1,083,000 | 08/15/19 | HKD | 5.25 | HKD | 5,437 | (17,374 | ) | |||||||||||||||||
| Enbridge, Inc. |
Credit Suisse International | 30,600 | 08/26/19 | USD | 35.18 | USD | 1,104 | (39,670 | ) | |||||||||||||||||
| Fortis, Inc. |
Bank of America N.A. | 25,000 | 08/27/19 | USD | 39.35 | USD | 987 | (14,780 | ) | |||||||||||||||||
|
|
|
|||||||||||||||||||||||||
| $ | (1,731,233 | ) | ||||||||||||||||||||||||
|
|
|
|||||||||||||||||||||||||
Balances Reported in the Statements of Assets and Liabilities for options written
| Swap Premium Paid |
Swap Premium Received |
Unrealized Appreciation |
Unrealized Depreciation |
Value | ||||||||||||||||
| Options Written |
N/A | N/A | $ | 377,699 | $ | (1,290,106 | ) | $ | 3,059,780 | |||||||||||
Derivative Financial Instruments Categorized by Risk Exposure
As of period end, the fair values of derivative financial instruments located in the Statements of Assets and Liabilities were as follows:
| Commodity Contracts |
Credit Contracts |
Equity Contracts |
Foreign Currency Exchange Contracts |
Interest Rate Contracts |
Other Contracts |
Total | ||||||||||||||||||||||
| Liabilities — Derivative Financial Instruments |
||||||||||||||||||||||||||||
| Options written |
||||||||||||||||||||||||||||
| Options written, at value |
$ | — | $ | — | $ | 3,059,780 | $ | — | $ | — | $ | — | $ | 3,059,780 | ||||||||||||||
|
|
|
|
|
|
|
|
|
|
|
|
|
|
|
|||||||||||||||
For the period ended June 30, 2019, the effect of derivative financial instruments in the Statements of Operations was as follows:
| Commodity Contracts |
Credit Contracts |
Equity Contracts |
Foreign Currency Exchange Contracts |
Interest Rate Contracts |
Other Contracts |
Total | ||||||||||||||||||||||
| Net Realized Gain (Loss) from: |
|
|||||||||||||||||||||||||||
| Options written |
$ | — | $ | — | $ | (5,647,508 | ) | $ | — | $ | — | $ | — | $ | (5,647,508 | ) | ||||||||||||
|
|
|
|
|
|
|
|
|
|
|
|
|
|
|
|||||||||||||||
| Net Change in Unrealized Appreciation (Depreciation) on: | ||||||||||||||||||||||||||||
| Options written |
$ | — | $ | — | $ | (2,107,873 | ) | $ | — | $ | — | $ | — | $ | (2,107,873 | ) | ||||||||||||
|
|
|
|
|
|
|
|
|
|
|
|
|
|
|
|||||||||||||||
Average Quarterly Balances of Outstanding Derivative Financial Instruments
| Options: |
| |||
| Average Market value of option contracts written |
$ | 3,115,899 | ||
For more information about the Trust’s investment risks regarding derivative financial instruments, refer to the Notes to Financial Statements.
| 96 | 2019 BLACKROCK SEMI-ANNUAL REPORT TO SHAREHOLDERS |
| Schedule of Investments (unaudited) (continued) June 30, 2019 |
BlackRock Utilities, Infrastructure & Power Opportunities Trust (BUI) |
Derivative Financial Instruments — Offsetting as of Period End
The Trust’s derivative asset and liabilities (by type) are as follows:
| Assets | Liabilities | |||||||
| Derivative Financial Instruments: |
||||||||
| Options |
$ | — | $ | 3,059,780 | ||||
| Derivatives not subject to a Master Netting Agreement or similar agreement (“MNA”) |
— | (1,328,547 | ) | |||||
|
|
|
|
|
|||||
| Total derivative assets and liabilities subject to an MNA |
$ | — | $ | 1,731,233 | ||||
|
|
|
|
|
|||||
| (a) | Includes options purchased at value which is included in Investments at value — unaffiliated in the Statements of Assets and Liabilities and reported in the Schedule of Investments. |
The following table presents the Trust’s derivative assets (and liabilities) by counterparty net of amounts available for offset under an MNA and net of the related collateral received (and pledged) by the Trust:
| Counterparty |
Derivative an
MNA by |
Derivatives Available for Offset |
Non-cash Collateral Pledged (a) |
Cash Collateral Pledged (a) |
Net Amount of Derivative Liabilities (b) |
|||||||||||||||
| Bank of America N.A. |
$ | 14,780 | $ | — | $ | — | $ | — | $ | 14,780 | ||||||||||
| Barclays Bank PLC |
33,169 | — | (2,806 | ) | — | 30,363 | ||||||||||||||
| Citibank N.A. |
22,233 | — | — | — | 22,233 | |||||||||||||||
| Credit Suisse International |
200,612 | — | (200,612 | ) | — | — | ||||||||||||||
| Deutsche Bank AG |
33,370 | — | — | — | 33,370 | |||||||||||||||
| Goldman Sachs International |
884,193 | — | — | (884,193 | ) | — | ||||||||||||||
| JPMorgan Chase Bank N.A. |
110,370 | — | (110,370 | ) | — | — | ||||||||||||||
| Morgan Stanley & Co. International PLC |
128,113 | — | (65,047 | ) | — | 63,066 | ||||||||||||||
| UBS AG |
304,393 | — | (304,393 | ) | — | — | ||||||||||||||
|
|
|
|
|
|
|
|
|
|
|
|||||||||||
| $ | 1,731,233 | $ | — | $ | (683,228 | ) | $ | (884,193 | ) | $ | 163,812 | |||||||||
|
|
|
|
|
|
|
|
|
|
|
|||||||||||
| (a) | Excess of collateral pledged to the individual counterparty is not shown for financial reporting purposes. |
| (b) | Net amount represents the net amount payable due to the counterparty in the event of default. Net amount may be offset further by the options written receivable/payable on the Statements of Assets and Liabilities. |
Fair Value Hierarchy as of Period End
Various inputs are used in determining the fair value of investments and derivative financial instruments. For information about the Trust’s policy regarding valuation of investments and derivative financial instruments, refer to the Notes to Financial Statements.
The following tables summarize the Trust’s investments and derivative financial instruments categorized in the disclosure hierarchy:
| Level 1 | Level 2 | Level 3 | Total | |||||||||||||
| Assets: |
| |||||||||||||||
| Investments: |
| |||||||||||||||
| Common Stocks: |
| |||||||||||||||
| Building Products |
$ | 15,894,717 | $ | 4,322,319 | $ | — | $ | 20,217,036 | ||||||||
| Chemicals |
— | 23,555,430 | — | 23,555,430 | ||||||||||||
| Construction & Engineering |
— | 16,022,596 | — | 16,022,596 | ||||||||||||
| Electric Utilities |
85,809,505 | 32,033,225 | — | 117,842,730 | ||||||||||||
| Electrical Equipment |
3,822,552 | 30,061,299 | — | 33,883,851 | ||||||||||||
| Independent Power and Renewable Electricity Producers |
16,069,083 | 8,272,914 | — | 24,341,997 | ||||||||||||
| Machinery |
— | 5,858,503 | — | 5,858,503 | ||||||||||||
| Multi-Utilities |
37,053,159 | 17,043,156 | — | 54,096,315 | ||||||||||||
| Oil, Gas & Consumable Fuels |
43,858,332 | — | — | 43,858,332 | ||||||||||||
| Semiconductors & Semiconductor Equipment |
11,573,002 | — | — | 11,573,002 | ||||||||||||
| Short-Term Securities |
7,945,090 | — | — | 7,945,090 | ||||||||||||
|
|
|
|
|
|
|
|
|
|||||||||
| $ | 222,025,440 | $ | 137,169,442 | $ | — | $ | 359,194,882 | |||||||||
|
|
|
|
|
|
|
|
|
|||||||||
| Derivative Financial Instruments(a) |
| |||||||||||||||
| Liabilities: |
| |||||||||||||||
| Equity contracts |
$ | (716,486 | ) | $ | (2,343,294 | ) | $ | — | $ | (3,059,780 | ) | |||||
|
|
|
|
|
|
|
|
|
|||||||||
| (a) | Derivative financial instruments are options written which are shown at value. |
See notes to financial statements.
| SCHEDULES OF INVESTMENTS | 97 |
Statements of Assets and Liabilities (unaudited)
June 30, 2019
| BGR | CII | BDJ | BOE | BGY | ||||||||||||||||
| ASSETS |
| |||||||||||||||||||
| Investments at value — unaffiliated(a) |
$ | 386,254,321 | $ | 744,985,821 | $ | 1,800,380,519 | $ | 798,416,496 | $ | 661,442,641 | ||||||||||
| Investments at value — affiliated(b) |
8,401,154 | 2,734,005 | 27,764,789 | 916,623 | 5,301,763 | |||||||||||||||
| Cash |
— | — | — | — | — | |||||||||||||||
| Cash pledged: |
||||||||||||||||||||
| Collateral — options written |
— | — | — | — | 4,261,000 | |||||||||||||||
| Collateral — OTC derivatives |
— | 480,000 | — | 3,455,000 | 577,000 | |||||||||||||||
| Foreign currency at value(c) |
— | — | 1,297 | 357,573 | 470,230 | |||||||||||||||
| Receivables: |
| |||||||||||||||||||
| Investments sold |
— | 772,141 | 4,673,545 | 3,309,681 | 3,162,131 | |||||||||||||||
| Options written |
292,673 | 779,840 | 1,390,312 | 538,859 | 146,308 | |||||||||||||||
| Securities lending income — affiliated |
— | — | — | — | — | |||||||||||||||
| Capital shares sold |
— | — | — | — | — | |||||||||||||||
| Dividends — affiliated |
13,416 | 10,725 | 56,500 | 5,341 | 18,609 | |||||||||||||||
| Dividends — unaffiliated |
433,950 | 1,022,185 | 1,943,906 | 3,753,783 | 3,958,724 | |||||||||||||||
| Deferred offering costs |
— | — | — | — | — | |||||||||||||||
| Prepaid expenses |
— | 10,633 | 37,912 | 9,260 | 15,673 | |||||||||||||||
|
|
|
|
|
|
|
|
|
|
|
|||||||||||
| Total assets |
395,395,514 | 750,795,350 | 1,836,248,780 | 810,762,616 | 679,354,079 | |||||||||||||||
|
|
|
|
|
|
|
|
|
|
|
|||||||||||
| LIABILITIES |
| |||||||||||||||||||
| Bank overdraft |
— | 56,241 | 105,903 | — | — | |||||||||||||||
| Options written at value(d) |
3,409,717 | 9,628,464 | 25,268,935 | 7,135,810 | 6,861,771 | |||||||||||||||
| Payables: |
| |||||||||||||||||||
| Investments purchased |
— | 1,061,544 | 6,223,716 | 2,941,139 | 3,892,513 | |||||||||||||||
| Capital shares redeemed |
— | — | — | 314,412 | 262,936 | |||||||||||||||
| Income dividend distributions |
163,448 | 200,281 | 299,857 | 163,256 | 197,171 | |||||||||||||||
| Investment advisory fees |
327,888 | 510,533 | 1,160,765 | 537,638 | 486,956 | |||||||||||||||
| Offering costs |
— | — | — | — | — | |||||||||||||||
| Trustees’ and Officer’s fees |
457,874 | 197,731 | 922,360 | 662,285 | 569,197 | |||||||||||||||
| Options written |
37,020 | 552,115 | 1,286,122 | 181,734 | — | |||||||||||||||
| Other accrued expenses |
238,211 | 162,371 | 369,691 | 271,763 | 272,438 | |||||||||||||||
|
|
|
|
|
|
|
|
|
|
|
|||||||||||
| Total liabilities |
4,634,158 | 12,369,280 | 35,637,349 | 12,208,037 | 12,542,982 | |||||||||||||||
|
|
|
|
|
|
|
|
|
|
|
|||||||||||
| NET ASSETS |
$ | 390,761,356 | $ | 738,426,070 | $ | 1,800,611,431 | $ | 798,554,579 | $ | 666,811,097 | ||||||||||
|
|
|
|
|
|
|
|
|
|
|
|||||||||||
| NET ASSETS CONSIST OF |
| |||||||||||||||||||
| Paid-in capital |
$ | 579,907,704 | $ | 577,671,748 | $ | 1,320,628,954 | $ | 811,590,926 | $ | 671,004,730 | ||||||||||
| Accumulated earnings (loss) |
(189,146,348 | ) | 160,754,322 | 479,982,477 | (13,036,347 | ) | (4,193,633 | ) | ||||||||||||
|
|
|
|
|
|
|
|
|
|
|
|||||||||||
| NET ASSETS |
$ | 390,761,356 | $ | 738,426,070 | $ | 1,800,611,431 | $ | 798,554,579 | $ | 666,811,097 | ||||||||||
|
|
|
|
|
|
|
|
|
|
|
|||||||||||
| Net asset value(e)(f) |
$ | 13.10 | $ | 16.74 | $ | 9.60 | $ | 11.90 | $ | 6.22 | ||||||||||
|
|
|
|
|
|
|
|
|
|
|
|||||||||||
| (a) Investments at cost — unaffiliated |
$ | 380,708,391 | $ | 571,575,818 | $ | 1,423,022,818 | $ | 775,131,373 | $ | 648,224,267 | ||||||||||
| (b) Investments at cost — affiliated |
$ | 8,401,154 | $ | 2,734,005 | $ | 27,764,789 | $ | 916,623 | $ | 5,301,763 | ||||||||||
| (c) Foreign currency at cost |
$ | — | $ | — | $ | 1,409 | $ | 361,057 | $ | 471,107 | ||||||||||
| (d) Premiums received |
$ | 2,583,979 | $ | 7,524,543 | $ | 18,998,907 | $ | 6,045,362 | $ | 4,974,763 | ||||||||||
| (e) Shares outstanding, unlimited number of shares authorized, $0.001 par value |
29,825,326 | — | 187,542,405 | 67,085,535 | 107,278,332 | |||||||||||||||
| (f) Shares outstanding, 200 million shares authorized, $0.10 par value |
— | 44,121,400 | — | — | — | |||||||||||||||
See notes to financial statements.
| 98 | 2019 BLACKROCK SEMI-ANNUAL REPORT TO SHAREHOLDERS |
Statements of Assets and Liabilities (unaudited) (continued)
June 30, 2019
| BME | BCX(a) | BST | BSTZ | BUI | ||||||||||||||||
| ASSETS |
| |||||||||||||||||||
| Investments at value — unaffiliated(b)(c) |
$ | 389,744,753 | $ | 872,303,551 | $ | 735,477,032 | $ | 289,382,661 | $ | 351,249,792 | ||||||||||
| Investments at value — affiliated(d) |
12,911,195 | 4,864,817 | 3,290,175 | 1,280,123,797 | 7,945,090 | |||||||||||||||
| Cash |
26,738 | 34,640 | 14,868 | — | — | |||||||||||||||
| Cash pledged: |
||||||||||||||||||||
| Collateral — OTC derivatives |
— | — | 1,930,000 | — | 980,000 | |||||||||||||||
| Foreign currency at value(e) |
156 | 24,461 | 58,767 | 8,037,068 | — | |||||||||||||||
| Receivables: |
| |||||||||||||||||||
| Investments sold |
2,140,869 | 169,297 | 3,327 | 4,985 | — | |||||||||||||||
| Options written |
218,577 | 827,562 | 769,156 | 1,219,409 | 116,907 | |||||||||||||||
| Securities lending income — affiliated |
1,223 | 12,053 | 47,879 | — | — | |||||||||||||||
| Capital shares sold |
891,108 | — | — | — | — | |||||||||||||||
| Dividends — affiliated |
16,170 | 20,619 | 6,852 | 246,927 | 18,977 | |||||||||||||||
| Dividends — unaffiliated |
321,273 | 1,537,765 | 307,109 | 5,070 | 1,121,048 | |||||||||||||||
| Deferred offering costs |
160,796 | — | — | — | — | |||||||||||||||
| Prepaid expenses |
— | — | 162 | — | — | |||||||||||||||
|
|
|
|
|
|
|
|
|
|
|
|||||||||||
| Total assets |
406,432,858 | 879,794,765 | 741,905,327 | 1,579,019,917 | 361,431,814 | |||||||||||||||
|
|
|
|
|
|
|
|
|
|
|
|||||||||||
| LIABILITIES |
| |||||||||||||||||||
| Cash collateral on securities loaned at value |
328,908 | 478,185 | 2,292,285 | — | — | |||||||||||||||
| Bank overdraft |
— | — | — | 7,012,220 | — | |||||||||||||||
| Options written at value(f) |
3,364,894 | 13,801,645 | 8,802,787 | 1,913,753 | 3,059,780 | |||||||||||||||
| Payables: |
| |||||||||||||||||||
| Investments purchased |
145,578 | — | — | 163,402,521 | — | |||||||||||||||
| Capital shares redeemed |
— | 380,340 | — | — | — | |||||||||||||||
| Income dividend distributions |
— | 194,090 | — | — | — | |||||||||||||||
| Investment advisory fees |
321,353 | 689,303 | 499,623 | 144,156 | 282,870 | |||||||||||||||
| Offering costs |
47,957 | — | — | — | — | |||||||||||||||
| Trustees’ and Officer’s fees |
21,203 | 287,827 | 2,891 | 441 | 914 | |||||||||||||||
| Options written |
638,729 | 420,027 | 220,699 | — | 181,514 | |||||||||||||||
| Other accrued expenses |
156,253 | 390,779 | 416,865 | 12,222 | 176,792 | |||||||||||||||
|
|
|
|
|
|
|
|
|
|
|
|||||||||||
| Total liabilities |
5,024,875 | 16,642,196 | 12,235,150 | 172,485,313 | 3,701,870 | |||||||||||||||
|
|
|
|
|
|
|
|
|
|
|
|||||||||||
| NET ASSETS |
$ | 401,407,983 | $ | 863,152,569 | $ | 729,670,177 | $ | 1,406,534,604 | $ | 357,729,944 | ||||||||||
|
|
|
|
|
|
|
|
|
|
|
|||||||||||
| NET ASSETS CONSIST OF |
| |||||||||||||||||||
| Paid-in capital |
$ | 278,375,976 | $ | 1,210,217,775 | $ | 347,126,246 | $ | 1,400,100,000 | $ | 283,286,563 | ||||||||||
| Accumulated earnings (loss) |
123,032,007 | (347,065,206 | ) | 382,543,931 | 6,434,604 | 74,443,381 | ||||||||||||||
|
|
|
|
|
|
|
|
|
|
|
|||||||||||
| NET ASSETS |
$ | 401,407,983 | $ | 863,152,569 | $ | 729,670,177 | $ | 1,406,534,604 | $ | 357,729,944 | ||||||||||
|
|
|
|
|
|
|
|
|
|
|
|||||||||||
| Net asset value(g) |
$ | 38.26 | $ | 9.28 | $ | 32.49 | $ | 20.09 | $ | 21.01 | ||||||||||
|
|
|
|
|
|
|
|
|
|
|
|||||||||||
| (a) Consolidated Statement of Assets and Liabilities |
||||||||||||||||||||
| (b) Investments at cost — unaffiliated |
$ | 260,106,460 | $ | 787,099,716 | $ | 371,391,745 | $ | 283,344,958 | $ | 264,417,404 | ||||||||||
| (c) Securities loaned at value |
$ | 319,856 | $ | 426,078 | $ | 2,296,419 | $ | — | $ | — | ||||||||||
| (d) Investments at cost — affiliated |
$ | 12,911,175 | $ | 4,864,708 | $ | 3,289,742 | $ | 1,280,123,797 | $ | 7,945,090 | ||||||||||
| (e) Foreign currency at cost |
$ | 158 | $ | 24,449 | $ | 58,819 | $ | 7,991,624 | $ | — | ||||||||||
| (f) Premiums received |
$ | 2,660,211 | $ | 6,921,230 | $ | 8,116,613 | $ | 2,242,071 | $ | 2,147,373 | ||||||||||
| (g) Shares outstanding, unlimited number of shares authorized, $0.001 par value |
10,492,227 | 92,976,355 | 22,459,793 | 70,005,000 | 17,027,628 | |||||||||||||||
See notes to financial statements.
| FINANCIAL STATEMENTS | 99 |
Statements of Operations (unaudited)
Six Months Ended June 30, 2019
| BGR | CII | BDJ | BOE | BGY | ||||||||||||||||
| INVESTMENT INCOME |
| |||||||||||||||||||
| Dividends — unaffiliated |
$ | 7,848,029 | $ | 7,723,886 | $ | 27,599,703 | $ | 17,054,584 | $ | 16,230,701 | ||||||||||
| Dividends — affiliated |
85,938 | 49,519 | 269,751 | 72,591 | 122,676 | |||||||||||||||
| Foreign taxes withheld |
(551,337 | ) | (177,854 | ) | (813,524 | ) | (808,257 | ) | (1,149,302 | ) | ||||||||||
|
|
|
|
|
|
|
|
|
|
|
|||||||||||
| Total investment income |
7,382,630 | 7,595,551 | 27,055,930 | 16,318,918 | 15,204,075 | |||||||||||||||
|
|
|
|
|
|
|
|
|
|
|
|||||||||||
| EXPENSES |
| |||||||||||||||||||
| Investment advisory |
2,333,322 | 3,071,839 | 6,953,165 | 3,933,280 | 3,263,209 | |||||||||||||||
| Trustees and Officer |
57,473 | 44,568 | 145,817 | 89,292 | 76,220 | |||||||||||||||
| Professional |
43,622 | 60,408 | 117,092 | 73,927 | 65,081 | |||||||||||||||
| Transfer agent |
39,962 | 43,265 | 87,166 | 58,143 | 52,609 | |||||||||||||||
| Custodian |
27,293 | 20,298 | 98,477 | 63,148 | 50,360 | |||||||||||||||
| Accounting services |
21,939 | 24,419 | 46,734 | 29,376 | 24,424 | |||||||||||||||
| Printing |
6,310 | 8,713 | 16,585 | 9,078 | 7,653 | |||||||||||||||
| Rating agency |
5,812 | 7,482 | 12,559 | 7,801 | 7,131 | |||||||||||||||
| Registration |
5,547 | 8,207 | 34,873 | 12,731 | 20,113 | |||||||||||||||
| Miscellaneous |
104,118 | 20,897 | 34,515 | 60,804 | 78,954 | |||||||||||||||
|
|
|
|
|
|
|
|
|
|
|
|||||||||||
| Total expenses |
2,645,398 | 3,310,096 | 7,546,983 | 4,337,580 | 3,645,754 | |||||||||||||||
|
|
|
|
|
|
|
|
|
|
|
|||||||||||
| Less fees waived and/or reimbursed by the Manager |
(294,334 | ) | (1,554 | ) | (8,369 | ) | (690,601 | ) | (330,169 | ) | ||||||||||
|
|
|
|
|
|
|
|
|
|
|
|||||||||||
| Total expenses after fees waived and/or reimbursed |
2,351,064 | 3,308,542 | 7,538,614 | 3,646,979 | 3,315,585 | |||||||||||||||
|
|
|
|
|
|
|
|
|
|
|
|||||||||||
| Net investment income |
5,031,566 | 4,287,009 | 19,517,316 | 12,671,939 | 11,888,490 | |||||||||||||||
|
|
|
|
|
|
|
|
|
|
|
|||||||||||
| REALIZED AND UNREALIZED GAIN (LOSS) |
| |||||||||||||||||||
| Net realized gain (loss) from: |
| |||||||||||||||||||
| Investments — unaffiliated |
(16,825,413 | ) | 15,749,864 | 65,692,134 | (3,522,500 | ) | (8,211,016 | ) | ||||||||||||
| Investments — affiliated |
— | — | — | — | — | |||||||||||||||
| Foreign currency transactions |
(4,722 | ) | 644 | 100,869 | (56,400 | ) | (104,166 | ) | ||||||||||||
| Options written |
1,384,373 | (4,972,451 | ) | (29,369,272 | ) | (14,000,549 | ) | (12,249,773 | ) | |||||||||||
|
|
|
|
|
|
|
|
|
|
|
|||||||||||
| (15,445,762 | ) | 10,778,057 | 36,423,731 | (17,579,449 | ) | (20,564,955 | ) | |||||||||||||
|
|
|
|
|
|
|
|
|
|
|
|||||||||||
| Net change in unrealized appreciation (depreciation) on: |
||||||||||||||||||||
| Investments — unaffiliated |
61,001,327 | 77,867,965 | 178,629,657 | 90,686,555 | 81,142,177 | |||||||||||||||
| Investments — affiliated |
— | — | — | — | — | |||||||||||||||
| Foreign currency translations |
2,115 | — | 5,053 | 18,479 | 25,183 | |||||||||||||||
| Options written |
(3,331,792 | ) | (6,664,395 | ) | (19,651,452 | ) | (4,876,782 | ) | (4,785,167 | ) | ||||||||||
|
|
|
|
|
|
|
|
|
|
|
|||||||||||
| 57,671,650 | 71,203,570 | 158,983,258 | 85,828,252 | 76,382,193 | ||||||||||||||||
|
|
|
|
|
|
|
|
|
|
|
|||||||||||
| Net realized and unrealized gain |
42,225,888 | 81,981,627 | 195,406,989 | 68,248,803 | 55,817,238 | |||||||||||||||
|
|
|
|
|
|
|
|
|
|
|
|||||||||||
| NET INCREASE IN NET ASSETS RESULTING FROM OPERATIONS |
$ | 47,257,454 | $ | 86,268,636 | $ | 214,924,305 | $ | 80,920,742 | $ | 67,705,728 | ||||||||||
|
|
|
|
|
|
|
|
|
|
|
|||||||||||
See notes to financial statements.
| 100 | 2019 BLACKROCK SEMI-ANNUAL REPORT TO SHAREHOLDERS |
Statements of Operations (unaudited) (continued)
Six Months Ended June 30, 2019
| BME | BCX(a) | BST | BSTZ(b) | BUI | ||||||||||||||||
| INVESTMENT INCOME |
| |||||||||||||||||||
| Dividends — unaffiliated |
$ | 2,389,618 | $ | 17,601,870 | $ | 1,346,632 | $ | 5,070 | $ | 6,510,907 | ||||||||||
| Dividends — affiliated |
201,743 | 168,412 | 25,464 | 246,927 | 81,108 | |||||||||||||||
| Interest — unaffiliated |
— | 640,692 | — | — | — | |||||||||||||||
| Securities lending income — affiliated — net |
44,310 | 24,699 | 210,322 | — | — | |||||||||||||||
| Foreign taxes withheld |
(51,936 | ) | (954,044 | ) | (68,696 | ) | — | (381,914 | ) | |||||||||||
|
|
|
|
|
|
|
|
|
|
|
|||||||||||
| Total investment income |
2,583,735 | 17,481,629 | 1,513,722 | 251,997 | 6,210,101 | |||||||||||||||
|
|
|
|
|
|
|
|
|
|
|
|||||||||||
| EXPENSES |
| |||||||||||||||||||
| Investment advisory |
1,878,672 | 4,239,861 | 3,408,110 | 144,156 | 1,706,138 | |||||||||||||||
| Trustees and Officer |
16,579 | 56,902 | 24,597 | 441 | 13,449 | |||||||||||||||
| Professional |
27,352 | 89,353 | 66,267 | 2,313 | 44,777 | |||||||||||||||
| Transfer agent |
26,754 | 61,302 | 42,293 | 1,438 | 32,255 | |||||||||||||||
| Custodian |
47,710 | 54,822 | 57,242 | 1,438 | 29,395 | |||||||||||||||
| Accounting services |
14,503 | 29,376 | 24,424 | 1,019 | 24,424 | |||||||||||||||
| Printing |
5,805 | 9,520 | 8,401 | 205 | 5,359 | |||||||||||||||
| Rating agency |
5,747 | 21,696 | 7,276 | 4,740 | 19,162 | |||||||||||||||
| Registration |
5,503 | 17,697 | 4,536 | — | 4,624 | |||||||||||||||
| Offering costs |
46,886 | — | — | — | — | |||||||||||||||
| Miscellaneous |
13,982 | 145,747 | 13,208 | 1,069 | 27,494 | |||||||||||||||
|
|
|
|
|
|
|
|
|
|
|
|||||||||||
| Total expenses |
2,089,493 | 4,726,276 | 3,656,354 | 156,819 | 1,907,077 | |||||||||||||||
| Less fees waived and/or reimbursed by the Manager |
(6,248 | ) | (5,244 | ) | (512,005 | ) | — | (45,186 | ) | |||||||||||
|
|
|
|
|
|
|
|
|
|
|
|||||||||||
| Total expenses after fees waived and/or reimbursed |
2,083,245 | 4,721,032 | 3,144,349 | 156,819 | 1,861,891 | |||||||||||||||
|
|
|
|
|
|
|
|
|
|
|
|||||||||||
| Net investment income (loss) |
500,490 | 12,760,597 | (1,630,627 | ) | 95,178 | 4,348,210 | ||||||||||||||
|
|
|
|
|
|
|
|
|
|
|
|||||||||||
| REALIZED AND UNREALIZED GAIN (LOSS) |
| |||||||||||||||||||
| Net realized gain (loss) from: |
| |||||||||||||||||||
| Investments — unaffiliated |
9,483,269 | 5,449,188 | 39,398,587 | — | 11,128,696 | |||||||||||||||
| Investments — affiliated |
140 | — | 278 | — | — | |||||||||||||||
| Foreign currency transactions |
(17,290 | ) | 72,577 | 123,792 | (48,126 | ) | (82,289 | ) | ||||||||||||
| Options written |
(1,366,144 | ) | 3,772,773 | (18,275,290 | ) | — | (5,647,508 | ) | ||||||||||||
|
|
|
|
|
|
|
|
|
|
|
|||||||||||
| 8,099,975 | 9,294,538 | 21,247,367 | (48,126 | ) | 5,398,899 | |||||||||||||||
|
|
|
|
|
|
|
|
|
|
|
|||||||||||
| Net change in unrealized appreciation (depreciation) on: |
||||||||||||||||||||
| Investments — unaffiliated |
28,765,884 | 95,399,512 | 145,384,873 | 6,037,703 | 42,668,542 | |||||||||||||||
| Investments — affiliated |
20 | 138 | 600 | — | — | |||||||||||||||
| Foreign currency translations |
(59 | ) | 1,821 | 274 | 21,531 | 11,305 | ||||||||||||||
| Options written |
(1,821,665 | ) | (11,136,585 | ) | (3,913,722 | ) | 328,318 | (2,107,873 | ) | |||||||||||
|
|
|
|
|
|
|
|
|
|
|
|||||||||||
| 26,944,180 | 84,264,886 | 141,472,025 | 6,387,552 | 40,571,974 | ||||||||||||||||
|
|
|
|
|
|
|
|
|
|
|
|||||||||||
| Net realized and unrealized gain |
35,044,155 | 93,559,424 | 162,719,392 | 6,339,426 | 45,970,873 | |||||||||||||||
|
|
|
|
|
|
|
|
|
|
|
|||||||||||
| NET INCREASE IN NET ASSETS RESULTING FROM OPERATIONS |
$ | 35,544,645 | $ | 106,320,021 | $ | 161,088,765 | $ | 6,434,604 | $ | 50,319,083 | ||||||||||
|
|
|
|
|
|
|
|
|
|
|
|||||||||||
| (a) | Consolidated Statement of Operations. |
| (b) | Commencement of Operations June 27, 2019. |
See notes to financial statements.
| FINANCIAL STATEMENTS | 101 |
Statements of Changes in Net Assets
| BGR | CII | |||||||||||||||||||
| Six Months Ended 06/30/19 (unaudited) |
Year Ended 12/31/18 |
Six Months Ended 06/30/19 (unaudited) |
Year Ended 12/31/18 |
|||||||||||||||||
| INCREASE (DECREASE) IN NET ASSETS |
||||||||||||||||||||
| OPERATIONS |
|
|||||||||||||||||||
| Net investment income |
$ | 5,031,566 | $ | 8,403,497 | $ | 4,287,009 | $ | 7,566,999 | ||||||||||||
| Net realized gain (loss) |
(15,445,762 | ) | 4,084,438 | 10,778,057 | 35,126,726 | |||||||||||||||
| Net change in unrealized appreciation (depreciation) |
57,671,650 | (98,385,944 | ) | 71,203,570 | (83,178,025 | ) | ||||||||||||||
|
|
|
|
|
|
|
|
|
|||||||||||||
| Net increase (decrease) in net assets resulting from operations |
47,257,454 | (85,898,009 | ) | 86,268,636 | (40,484,300 | ) | ||||||||||||||
|
|
|
|
|
|
|
|
|
|||||||||||||
| DISTRIBUTIONS TO SHAREHOLDERS(a) |
|
|||||||||||||||||||
| From net investment income and net realized gain |
(13,886,672 | )(b) | (8,135,490 | ) | (21,919,512 | )(b) | (19,927,105 | ) | ||||||||||||
| From return of capital |
— | (19,637,853 | ) | — | (23,911,918 | ) | ||||||||||||||
|
|
|
|
|
|
|
|
|
|
|
|||||||||||
| Decrease in net assets resulting from distributions to shareholders |
(13,886,672 | ) | (27,773,343 | ) | (21,919,512 | ) | (43,839,023 | ) | ||||||||||||
|
|
|
|
|
|
|
|
|
|||||||||||||
| NET ASSETS |
|
|||||||||||||||||||
| Total increase (decrease) in net assets |
33,370,782 | (113,671,352 | ) | 64,349,124 | (84,323,323 | ) | ||||||||||||||
| Beginning of period |
357,390,574 | 471,061,926 | 674,076,946 | 758,400,269 | ||||||||||||||||
|
|
|
|
|
|
|
|
|
|||||||||||||
| End of period |
$ | 390,761,356 | $ | 357,390,574 | $ | 738,426,070 | $ | 674,076,946 | ||||||||||||
|
|
|
|
|
|
|
|
|
|||||||||||||
| (a) | Distributions for annual periods determined in accordance with U.S. federal income tax regulations. |
| (b) | A portion of the distributions from net investment income may be deemed a return of capital or net realized gain at fiscal year end. |
See notes to financial statements.
| 102 | 2019 BLACKROCK SEMI-ANNUAL REPORT TO SHAREHOLDERS |
Statements of Changes in Net Assets (continued)
| BDJ | BOE | |||||||||||||||||||
| Six Months Ended 06/30/19 (unaudited) |
Year Ended 12/31/18 |
Six Months Ended 06/30/19 (unaudited) |
Year Ended 12/31/18 |
|||||||||||||||||
| INCREASE (DECREASE) IN NET ASSETS |
|
|||||||||||||||||||
| OPERATIONS |
|
|||||||||||||||||||
| Net investment income |
$ | 19,517,316 | $ | 33,747,656 | $ | 12,671,939 | $ | 21,234,142 | ||||||||||||
| Net realized gain (loss) |
36,423,731 | 131,492,050 | (17,579,449 | ) | 384,068 | |||||||||||||||
| Net change in unrealized appreciation (depreciation) |
158,983,258 | (290,361,539 | ) | 85,828,252 | (112,910,961 | ) | ||||||||||||||
|
|
|
|
|
|
|
|
|
|||||||||||||
| Net increase (decrease) in net assets resulting from operations |
214,924,305 | (125,121,833 | ) | 80,920,742 | (91,292,751 | ) | ||||||||||||||
|
|
|
|
|
|
|
|
|
|||||||||||||
| DISTRIBUTIONS TO SHAREHOLDERS(a) |
|
|||||||||||||||||||
| From net investment income and net realized gain |
(52,549,382 | )(b) | (105,098,764 | ) | (25,569,610 | )(b) | (56,899,700 | ) | ||||||||||||
| From return of capital |
— | — | — | (1,381,549 | ) | |||||||||||||||
|
|
|
|
|
|
|
|
|
|||||||||||||
| Decrease in net assets resulting from distributions to shareholders |
(52,549,382 | ) | (105,098,764 | ) | (25,569,610 | ) | (58,281,249 | ) | ||||||||||||
|
|
|
|
|
|
|
|
|
|||||||||||||
| CAPITAL SHARE TRANSACTIONS |
||||||||||||||||||||
| Redemption of shares resulting from share repurchase program (including transaction costs) |
— | — | (11,398,114 | ) | (7,051,296 | ) | ||||||||||||||
|
|
|
|
|
|
|
|
|
|||||||||||||
| NET ASSETS |
|
|||||||||||||||||||
| Total increase (decrease) in net assets |
162,374,923 | (230,220,597 | ) | 43,953,018 | (156,625,296 | ) | ||||||||||||||
| Beginning of period |
1,638,236,508 | 1,868,457,105 | 754,601,561 | 911,226,857 | ||||||||||||||||
|
|
|
|
|
|
|
|
|
|||||||||||||
| End of period |
$ | 1,800,611,431 | $ | 1,638,236,508 | $ | 798,554,579 | $ | 754,601,561 | ||||||||||||
|
|
|
|
|
|
|
|
|
|||||||||||||
| (a) | Distributions for annual periods determined in accordance with U.S. federal income tax regulations. |
| (b) | A portion of the distributions from net investment income may be deemed a return of capital or net realized gain at fiscal year end. |
See notes to financial statements.
| FINANCIAL STATEMENTS | 103 |
Statements of Changes in Net Assets (continued)
| BGY | BME | |||||||||||||||||||
| Six Months Ended 06/30/19 (unaudited) |
Year Ended 12/31/18 |
Six Months Ended (unaudited) |
Year Ended 12/31/18 |
|||||||||||||||||
| INCREASE (DECREASE) IN NET ASSETS |
||||||||||||||||||||
| OPERATIONS |
||||||||||||||||||||
| Net investment income |
$ | 11,888,490 | $ | 18,248,886 | $ | 500,490 | $ | 655,319 | ||||||||||||
| Net realized gain (loss) |
(20,564,955 | ) | 85,049,308 | 8,099,975 | 23,295,553 | |||||||||||||||
| Net change in unrealized appreciation (depreciation) |
76,382,193 | (194,507,169 | ) | 26,944,180 | (1,509,114 | ) | ||||||||||||||
|
|
|
|
|
|
|
|
|
|||||||||||||
| Net increase (decrease) in net assets resulting from operations |
67,705,728 | (91,208,975 | ) | 35,544,645 | 22,441,758 | |||||||||||||||
|
|
|
|
|
|
|
|
|
|||||||||||||
| DISTRIBUTIONS TO SHAREHOLDERS(a) |
||||||||||||||||||||
| Decrease in net assets resulting from distributions to shareholders |
(21,811,392 | )(b) | (48,308,022 | ) | (12,212,563 | )(b) | (22,690,477 | ) | ||||||||||||
|
|
|
|
|
|
|
|
|
|||||||||||||
| CAPITAL SHARE TRANSACTIONS |
||||||||||||||||||||
| Proceeds from shares sold |
— | — | 24,538,841 | 19,980,202 | ||||||||||||||||
| Reinvestment of common distributions |
— | — | 862,082 | 1,085,098 | ||||||||||||||||
| Redemption of shares resulting from share repurchase program (including transaction costs) |
(2,317,689 | ) | (6,926,639 | ) | — | — | ||||||||||||||
|
|
|
|
|
|
|
|
|
|||||||||||||
| Net increase (decrease) in net assets derived from capital share transactions |
(2,317,689 | ) | (6,926,639 | ) | 25,400,923 | 21,065,300 | ||||||||||||||
|
|
|
|
|
|
|
|
|
|||||||||||||
| NET ASSETS |
||||||||||||||||||||
| Total increase (decrease) in net assets |
43,576,647 | (146,443,636 | ) | 48,733,005 | 20,816,581 | |||||||||||||||
| Beginning of period |
623,234,450 | 769,678,086 | 352,674,978 | 331,858,397 | ||||||||||||||||
|
|
|
|
|
|
|
|
|
|||||||||||||
| End of period |
$ | 666,811,097 | $ | 623,234,450 | $ | 401,407,983 | $ | 352,674,978 | ||||||||||||
|
|
|
|
|
|
|
|
|
|||||||||||||
| (a) | Distributions for annual periods determined in accordance with U.S. federal income tax regulations. |
| (b) | A portion of the distributions from net investment income may be deemed a return of capital or net realized gain at fiscal year end. |
See notes to financial statements.
| 104 | 2019 BLACKROCK SEMI-ANNUAL REPORT TO SHAREHOLDERS |
Statements of Changes in Net Assets (continued)
| BCX(a) | BST | |||||||||||||||||||
| Six Months Ended 06/30/19 (unaudited) |
Year Ended 12/31/18 |
Six Months Ended (unaudited) |
Year Ended 12/31/18 |
|||||||||||||||||
| INCREASE (DECREASE) IN NET ASSETS |
||||||||||||||||||||
| OPERATIONS |
|
|||||||||||||||||||
| Net investment income (loss) |
$ | 12,760,597 | $ | 20,773,524 | $ | (1,630,627 | ) | $ | (2,924,164 | ) | ||||||||||
| Net realized gain |
9,294,538 | 41,800,914 | 21,247,367 | 65,743,514 | ||||||||||||||||
| Net change in unrealized appreciation (depreciation) |
84,264,886 | (215,389,129 | ) | 141,472,025 | (57,603,461 | ) | ||||||||||||||
|
|
|
|
|
|
|
|
|
|||||||||||||
| Net increase (decrease) in net assets resulting from operations |
106,320,021 | (152,814,691 | ) | 161,088,765 | 5,215,889 | |||||||||||||||
|
|
|
|
|
|
|
|
|
|||||||||||||
| DISTRIBUTIONS TO SHAREHOLDERS(b) |
|
|||||||||||||||||||
| From net investment income and net realized gain |
(29,042,353 | )(c) | (17,715,545 | ) | (20,200,880 | )(c) | (39,423,699 | ) | ||||||||||||
| From return of capital |
— | (41,596,743 | ) | — | — | |||||||||||||||
|
|
|
|
|
|
|
|
|
|
|
|||||||||||
| Decrease in net assets resulting from distributions to shareholders |
(29,042,353 | ) | (59,312,288 | ) | (20,200,880 | ) | (39,423,699 | ) | ||||||||||||
|
|
|
|
|
|
|
|
|
|||||||||||||
| CAPITAL SHARE TRANSACTIONS |
|
|||||||||||||||||||
| Cost of shares redeemed |
(12,406,758 | ) | (17,063,427 | ) | — | — | ||||||||||||||
| Reinvestment of common distributions |
— | — | 874,607 | 1,815,026 | ||||||||||||||||
|
|
|
|
|
|
|
|
|
|||||||||||||
| Net increase (decrease) in net assets derived from capital share transactions |
(12,406,758 | ) | (17,063,427 | ) | 874,607 | 1,815,026 | ||||||||||||||
|
|
|
|
|
|
|
|
|
|
|
|||||||||||
| NET ASSETS |
|
|||||||||||||||||||
| Total increase (decrease) in net assets |
64,870,910 | (229,190,406 | ) | 141,762,492 | (32,392,784 | ) | ||||||||||||||
| Beginning of period |
798,281,659 | 1,027,472,065 | 587,907,685 | 620,300,469 | ||||||||||||||||
|
|
|
|
|
|
|
|
|
|||||||||||||
| End of period |
$ | 863,152,569 | $ | 798,281,659 | $ | 729,670,177 | $ | 587,907,685 | ||||||||||||
|
|
|
|
|
|
|
|
|
|||||||||||||
| (a) | Consolidated Statements of Changes in Net Assets. |
| (b) | Distributions for annual periods determined in accordance with U.S. federal income tax regulations. |
| (c) | A portion of the distributions from net investment income may be deemed a return of capital or net realized gain at fiscal year end. |
See notes to financial statements.
| FINANCIAL STATEMENTS | 105 |
Statements of Changes in Net Assets (continued)
| BSTZ | BUI | |||||||||||||||
| Period from to 06/30/19 |
Six Months Ended 06/30/19 (unaudited) |
Year Ended 12/31/18 |
||||||||||||||
| INCREASE (DECREASE) IN NET ASSETS |
||||||||||||||||
| OPERATIONS |
||||||||||||||||
| Net investment income |
$ | 95,178 | $ | 4,348,210 | $ | 8,349,272 | ||||||||||
| Net realized gain (loss) |
(48,126 | ) | 5,398,899 | 6,588,181 | ||||||||||||
| Net change in unrealized appreciation (depreciation) |
6,387,552 | 40,571,974 | (30,087,212 | ) | ||||||||||||
|
|
|
|
|
|
|
|||||||||||
| Net increase (decrease) in net assets resulting from operations |
6,434,604 | 50,319,083 | (15,149,759 | ) | ||||||||||||
|
|
|
|
|
|
|
|||||||||||
| DISTRIBUTIONS TO SHAREHOLDERS(b) |
||||||||||||||||
| From net investment income and net realized gain |
— | (12,345,194 | )(c) | (24,524,104 | ) | |||||||||||
| From return of capital |
— | — | (98,239 | ) | ||||||||||||
|
|
|
|
|
|
|
|||||||||||
| Decrease in net assets resulting from distributions to shareholders |
— | (12,345,194 | ) | (24,622,343 | ) | |||||||||||
|
|
|
|
|
|
|
|||||||||||
| CAPITAL SHARE TRANSACTIONS |
|
|||||||||||||||
| Net increase in net assets derived from capital share transactions |
1,400,000,000 | — | — | |||||||||||||
| Reinvestment of common distributions |
— | 822,793 | 928,907 | |||||||||||||
|
|
|
|
|
|
|
|||||||||||
| Net increase in net assets derived from capital share transactions |
1,400,000,000 | 822,793 | 928,907 | |||||||||||||
|
|
|
|
|
|
|
|
|
|||||||||
| NET ASSETS |
||||||||||||||||
| Total increase (decrease) in net assets |
1,406,434,604 | 38,796,682 | (38,843,195 | ) | ||||||||||||
| Beginning of period |
100,000 | 318,933,262 | 357,776,457 | |||||||||||||
|
|
|
|
|
|
|
|||||||||||
| End of period |
$ | 1,406,534,604 | $ | 357,729,944 | $ | 318,933,262 | ||||||||||
|
|
|
|
|
|
|
|||||||||||
| (a) | Commencement of operations. |
| (b) | Distributions for annual periods determined in accordance with U.S. federal income tax regulations. |
| (c) | A portion of the distributions from net investment income may be deemed a return of capital or net realized gain at fiscal year end. |
See notes to financial statements.
| 106 | 2019 BLACKROCK SEMI-ANNUAL REPORT TO SHAREHOLDERS |
Statements of Cash Flows (unaudited)
Six Months Ended June 30, 2019
| BGR | CII | BDJ | BOE | BGY | ||||||||||||||||
| CASH PROVIDED BY (USED FOR) OPERATING ACTIVITIES |
| |||||||||||||||||||
| Net increase in net assets resulting from operations |
$ | 47,257,454 | $ | 86,268,636 | $ | 214,924,305 | $ | 80,920,742 | $ | 67,705,728 | ||||||||||
| Adjustments to reconcile net increase in net assets resulting from operations to net cash provided by (used for) operating activities: |
||||||||||||||||||||
| Proceeds from sales of long-term investments and principal paydowns |
53,083,521 | 145,074,539 | 441,367,295 | 123,230,662 | 90,437,252 | |||||||||||||||
| Purchases of long-term investments |
(41,285,086 | ) | (133,355,918 | ) | (392,730,773 | ) | (100,391,181 | ) | (83,790,604 | ) | ||||||||||
| Net proceeds from sales (purchases) of short-term securities |
(3,394,179 | ) | 12,055,348 | 16,761,269 | 18,785,822 | 20,188,181 | ||||||||||||||
| Premiums paid on closing options written |
(10,764,084 | ) | (37,528,158 | ) | (108,629,793 | ) | (40,815,721 | ) | (33,328,582 | ) | ||||||||||
| Premiums received from options written |
10,929,159 | 31,831,012 | 75,886,902 | 25,111,175 | 20,017,455 | |||||||||||||||
| Net realized (gain) loss on investments and options written |
15,430,721 | (10,768,975 | ) | (36,457,072 | ) | 17,519,865 | 20,462,664 | |||||||||||||
| Net unrealized appreciation on investments, options written and foreign currency translations |
(57,669,535 | ) | (71,203,570 | ) | (158,978,205 | ) | (85,809,773 | ) | (76,357,011 | ) | ||||||||||
| (Increase) Decrease in Assets: |
||||||||||||||||||||
| Receivables: |
||||||||||||||||||||
| Dividends — unaffiliated |
182,638 | (147,752 | ) | 110,207 | (464,823 | ) | (743,137 | ) | ||||||||||||
| Dividends — affiliated |
(4,382 | ) | 3,134 | 25,495 | 5,777 | (18,609 | ) | |||||||||||||
| Prepaid expenses |
— | (3,250 | ) | (30,900 | ) | (8,732 | ) | (15,673 | ) | |||||||||||
| Increase (Decrease) in Liabilities: |
||||||||||||||||||||
| Payables: |
||||||||||||||||||||
| Investment advisory fees |
(3,885 | ) | 11,058 | 23,552 | (4,205 | ) | 3,742 | |||||||||||||
| Trustees’ and Officer’s fees |
8,939 | 5,845 | 32,277 | 17,550 | 11,332 | |||||||||||||||
| Other accrued expenses |
137,345 | 67,021 | 122,505 | 97,523 | 129,486 | |||||||||||||||
|
|
|
|
|
|
|
|
|
|
|
|||||||||||
| Net cash provided by operating activities |
13,908,626 | 22,308,970 | 52,427,064 | 38,194,681 | 24,702,224 | |||||||||||||||
|
|
|
|
|
|
|
|
|
|
|
|||||||||||
| CASH (USED FOR) FINANCING ACTIVITIES |
| |||||||||||||||||||
| Cash dividends paid to Common Shareholders |
(13,892,067 | ) | (21,930,356 | ) | (52,576,672 | ) | (25,603,080 | ) | (21,813,449 | ) | ||||||||||
| Payments on redemption of Common Shares |
— | — | — | (12,169,018 | ) | (2,721,637 | ) | |||||||||||||
| Increase (decrease) in bank overdraft |
(23,035 | ) | 56,241 | 105,903 | — | — | ||||||||||||||
|
|
|
|
|
|
|
|
|
|
|
|||||||||||
| Net cash used for financing activities |
(13,915,102 | ) | (21,874,115 | ) | (52,470,769 | ) | (37,772,098 | ) | (24,535,086 | ) | ||||||||||
|
|
|
|
|
|
|
|
|
|
|
|||||||||||
| CASH IMPACT FROM FOREIGN EXCHANGE FLUCTUATIONS |
| |||||||||||||||||||
| Cash impact from foreign exchange fluctuations |
$ | 17 | $ | — | $ | — | $ | (145 | ) | $ | (1,878 | ) | ||||||||
|
|
|
|
|
|
|
|
|
|
|
|||||||||||
| CASH AND FOREIGN CURRENCY |
||||||||||||||||||||
| Net increase (decrease) in restricted and unrestricted cash and foreign currency |
(6,459 | ) | 434,855 | (43,705 | ) | 422,438 | 165,260 | |||||||||||||
| Restricted and unrestricted cash and foreign currency at beginning of period |
6,459 | 45,145 | 45,002 | 3,390,135 | 5,142,970 | |||||||||||||||
|
|
|
|
|
|
|
|
|
|
|
|||||||||||
| Restricted and unrestricted cash and foreign currency at end of period |
$ | — | $ | 480,000 | $ | 1,297 | $ | 3,812,573 | $ | 5,308,230 | ||||||||||
|
|
|
|
|
|
|
|
|
|
|
|||||||||||
| SUPPLEMENTAL DISCLOSURE OF CASH FLOW INFORMATION |
| |||||||||||||||||||
| NON-CASH FINANCING ACTIVITIES |
||||||||||||||||||||
| Capital shares issued in reinvestment of distributions paid to Common Shareholders |
— | — | — | — | — | |||||||||||||||
|
|
|
|
|
|
|
|
|
|
|
|||||||||||
| RECONCILIATION OF RESTRICTED AND UNRESTRICTED CASH AND FOREIGN CURRENCY AT THE END OF PERIOD TO THE STATEMENTS OF ASSETS AND LIABILITIES: |
||||||||||||||||||||
| Cash pledged: |
||||||||||||||||||||
| Collateral — options written |
— | — | — | — | 4,261,000 | |||||||||||||||
| Collateral — OTC derivatives |
— | 480,000 | — | 3,455,000 | 577,000 | |||||||||||||||
| Foreign currency at value |
— | — | 1,297 | 357,573 | 470,230 | |||||||||||||||
|
|
|
|
|
|
|
|
|
|
|
|||||||||||
| $ | — | $ | 480,000 | $ | 1,297 | $ | 3,812,573 | $ | 5,308,230 | |||||||||||
|
|
|
|
|
|
|
|
|
|
|
|||||||||||
| RECONCILIATION OF RESTRICTED AND UNRESTRICTED CASH AND FOREIGN CURRENCY AT THE BEGINNING OF PERIOD TO THE STATEMENTS OF ASSETS AND LIABILITIES |
||||||||||||||||||||
| Cash |
— | 45,145 | 43,458 | — | — | |||||||||||||||
| Cash pledged: |
||||||||||||||||||||
| Collateral — options written |
— | — | — | 2,785,000 | 4,136,000 | |||||||||||||||
| Collateral — OTC derivatives |
— | — | — | — | 201,000 | |||||||||||||||
| Foreign currency at value |
6,459 | — | 1,544 | 605,135 | 805,970 | |||||||||||||||
|
|
|
|
|
|
|
|
|
|
|
|||||||||||
| $ | 6,459 | $ | 45,145 | $ | 45,002 | $ | 3,390,135 | $ | 5,142,970 | |||||||||||
|
|
|
|
|
|
|
|
|
|
|
|||||||||||
See notes to financial statements.
| FINANCIAL STATEMENTS | 107 |
Statements of Cash Flows (unaudited) (continued)
Six Months Ended June 30, 2019
| BME | BCX(a) | BST | BSTZ(b) | BUI | ||||||||||||||||
| CASH PROVIDED BY (USED FOR) OPERATING ACTIVITIES |
||||||||||||||||||||
| Net increase in net assets resulting from operations |
$ | 35,544,645 | $ | 106,320,021 | $ | 161,088,765 | $ | 6,434,604 | $ | 50,319,083 | ||||||||||
| Adjustments to reconcile net increase in net assets resulting from operations to net cash provided by (used for) operating activities: |
||||||||||||||||||||
| Proceeds from sales of long-term investments and principal paydowns |
89,250,338 | 361,233,465 | 182,396,211 | (4,985 | ) | 92,939,927 | ||||||||||||||
| Purchases of long-term investments |
(115,170,667 | ) | (343,987,610 | ) | (145,879,341 | ) | (119,942,437 | ) | (80,179,469 | ) | ||||||||||
| Net proceeds from sales (purchases) of short-term securities |
13,061,150 | 9,064,180 | 3,159,721 | (1,280,123,797 | ) | 1,639,513 | ||||||||||||||
| Premiums paid on closing options written |
(13,181,899 | ) | (28,548,967 | ) | (53,911,901 | ) | — | (14,653,521 | ) | |||||||||||
| Premiums received from options written |
12,462,155 | 30,507,986 | 35,404,075 | 1,022,662 | 8,765,061 | |||||||||||||||
| Net realized (gain) loss on investments amd options written |
(8,115,489 | ) | (9,174,752 | ) | (21,253,346 | ) | (45,444 | ) | (5,464,788 | ) | ||||||||||
| Net unrealized appreciation on investments, options written and foreign currency translations |
(26,944,239 | ) | (84,263,065 | ) | (141,471,751 | ) | (6,366,021 | ) | (40,560,668 | ) | ||||||||||
| (Increase) Decrease in Assets: | ||||||||||||||||||||
| Receivables: |
||||||||||||||||||||
| Dividends — unaffiliated |
(16,280 | ) | 158,324 | (266,822 | ) | (5,070 | ) | (246,713 | ) | |||||||||||
| Dividends — affiliated |
30,881 | 15,471 | 13,077 | (246,927 | ) | (7,986 | ) | |||||||||||||
| Securities lending income — affiliated |
(1,146 | ) | (10,005 | ) | (43,881 | ) | — | — | ||||||||||||
| Deferred offering costs |
(87,909 | ) | — | — | — | — | ||||||||||||||
| Prepaid expenses |
— | — | (162 | ) | — | — | ||||||||||||||
| Increase (Decrease) in Liabilities: | ||||||||||||||||||||
| Collateral on securities loaned at value |
324,233 | 204,200 | 582,002 | — | — | |||||||||||||||
| Payables: |
| |||||||||||||||||||
| Investment advisory fees |
18,491 | (1,115 | ) | 94,994 | 144,156 | 13,970 | ||||||||||||||
| Trustees’ and Officer’s fees |
(5,628 | ) | (10,952 | ) | (13,707 | ) | 441 | (6,752 | ) | |||||||||||
| Other accrued expenses |
51,357 | 217,108 | 248,641 | 12,222 | 71,442 | |||||||||||||||
|
|
|
|
|
|
|
|
|
|
|
|||||||||||
| Net cash provided by (used for) operating activities |
(12,780,007 | ) | 41,724,289 | 20,146,575 | (1,399,120,596 | ) | 12,629,099 | |||||||||||||
|
|
|
|
|
|
|
|
|
|
|
|||||||||||
| CASH PROVIDED BY (USED FOR) FINANCING ACTIVITIES |
||||||||||||||||||||
| Cash dividends paid to Common Shareholders |
(11,350,481 | ) | (29,050,347 | ) | (19,326,273 | ) | — | (11,522,401 | ) | |||||||||||
| Payments for offering costs |
23,957 | — | — | — | — | |||||||||||||||
| Payments on Common Shares redeemed |
— | (12,860,111 | ) | — | — | — | ||||||||||||||
| Proceeds from issuance of Common Shares |
24,133,137 | — | — | 1,400,100,000 | — | |||||||||||||||
| Increase (decrease) in bank overdraft |
— | — | — | 7,012,220 | (126,775 | ) | ||||||||||||||
|
|
|
|
|
|
|
|
|
|
|
|||||||||||
| Net cash (provided by) used for financing activities |
12,806,613 | (41,910,458 | ) | (19,326,273 | ) | 1,407,112,220 | (11,649,176 | ) | ||||||||||||
|
|
|
|
|
|
|
|
|
|
|
|||||||||||
| CASH IMPACT FROM FOREIGN EXCHANGE FLUCTUATIONS |
||||||||||||||||||||
| Cash impact from foreign exchange fluctuations |
$ | — | $ | (27 | ) | $ | 36 | $ | 45,444 | $ | 20 | |||||||||
|
|
|
|
|
|
|
|
|
|
|
|||||||||||
| CASH AND FOREIGN CURRENCY |
||||||||||||||||||||
| Net increase (decrease) in restricted and unrestricted cash and foreign currency |
26,606 | (186,196 | ) | 820,338 | 8,037,068 | 979,943 | ||||||||||||||
| Restricted and unrestricted cash and foreign currency at beginning of period |
288 | 245,297 | 1,183,297 | — | 57 | |||||||||||||||
|
|
|
|
|
|
|
|
|
|
|
|||||||||||
| Restricted and unrestricted cash and foreign currency at end of period |
$ | 26,894 | $ | 59,101 | $ | 2,003,635 | $ | 8,037,068 | $ | 980,000 | ||||||||||
|
|
|
|
|
|
|
|
|
|
|
|||||||||||
| SUPPLEMENTAL DISCLOSURE OF CASH FLOW INFORMATION |
||||||||||||||||||||
| NON-CASH FINANCING ACTIVITIES |
| |||||||||||||||||||
| Capital shares issued in reinvestment of distributions paid to Common Shareholders |
862,082 | — | 874,607 | — | 822,793 | |||||||||||||||
|
|
|
|
|
|
|
|
|
|
|
|||||||||||
| RECONCILIATION OF RESTRICTED AND UNRESTRICTED CASH AND FOREIGN CURRENCY AT THE END OF PERIOD TO THE STATEMENTS OF ASSETS AND LIABILITIES: |
||||||||||||||||||||
| Cash |
26,738 | 34,640 | 14,868 | — | — | |||||||||||||||
| Cash pledged: |
| |||||||||||||||||||
| Collateral — OTC derivatives |
— | — | 1,930,000 | — | 980,000 | |||||||||||||||
| Foreign currency at value |
156 | 24,461 | 58,767 | 8,037,068 | — | |||||||||||||||
|
|
|
|
|
|
|
|
|
|
|
|||||||||||
| $ | 26,894 | $ | 59,101 | $ | 2,003,635 | $ | 8,037,068 | $ | 980,000 | |||||||||||
|
|
|
|
|
|
|
|
|
|
|
|||||||||||
See notes to financial statements.
| 108 | 2019 BLACKROCK SEMI-ANNUAL REPORT TO SHAREHOLDERS |
Statements of Cash Flows (unaudited) (continued)
Six Months Ended June 30, 2019
| BME | BCX(a) | BST | BSTZ(b) | BUI | ||||||||||||||||
| RECONCILIATION OF RESTRICTED AND UNRESTRICTED CASH AND FOREIGN CURRENCY AT THE BEGINNING OF PERIOD TO THE STATEMENTS OF ASSETS AND LIABILITIES |
||||||||||||||||||||
| Cash |
$ | — | $ | 43,980 | $ | 21,377 | $ | — | $ | — | ||||||||||
| Cash pledged: |
| |||||||||||||||||||
| Collateral — OTC derivatives |
— | — | 1,160,000 | — | — | |||||||||||||||
| Foreign currency at value |
288 | 201,317 | 1,920 | — | 57 | |||||||||||||||
|
|
|
|
|
|
|
|
|
|
|
|||||||||||
| $ | 288 | $ | 245,297 | $ | 1,183,297 | $ | — | $ | 57 | |||||||||||
|
|
|
|
|
|
|
|
|
|
|
|||||||||||
| (a) | Consolidated Statement of Cash Flows. |
| (b) | Commencement of Operations June 27, 2019. |
See notes to financial statements.
| FINANCIAL STATEMENTS | 109 |
(For a share outstanding throughout each period)
| BGR | ||||||||||||||||||||||||||||||||||||
| Six Months Ended 06/30/19 (unaudited) |
Year Ended December 31, | Period from 11/01/14 to 12/31/14 |
Year Ended 10/31/14 |
|||||||||||||||||||||||||||||||||
| 2018 | 2017 | 2016 | 2015 | |||||||||||||||||||||||||||||||||
| Net asset value, beginning of period |
$ | 11.98 | $ | 15.79 | $ | 16.33 | $ | 14.05 | $ | 21.15 | $ | 24.90 | $ | 30.12 | ||||||||||||||||||||||
|
|
|
|
|
|
|
|
|
|
|
|
|
|
|
|||||||||||||||||||||||
| Net investment income(a) |
0.17 | 0.28 | 0.40 | (b) | 0.27 | 0.29 | 0.07 | 0.25 | ||||||||||||||||||||||||||||
| Net realized and unrealized gain (loss) |
1.42 | (3.16 | ) | (0.01 | ) | 3.01 | (5.89 | ) | (2.41 | ) | (1.21 | ) | ||||||||||||||||||||||||
|
|
|
|
|
|
|
|
|
|
|
|
|
|
|
|||||||||||||||||||||||
| Net increase (decrease) from investment operations |
1.59 | (2.88 | ) | 0.39 | 3.28 | (5.60 | ) | (2.34 | ) | (0.96 | ) | |||||||||||||||||||||||||
|
|
|
|
|
|
|
|
|
|
|
|
|
|
|
|||||||||||||||||||||||
| Distributions(c) |
||||||||||||||||||||||||||||||||||||
| From net investment income |
(0.47 | )(d) | (0.27 | ) | (0.40 | ) | (0.27 | ) | (0.29 | ) | (0.47 | ) | (0.44 | ) | ||||||||||||||||||||||
| From net realized gain |
— | — | — | — | — | (0.94 | ) | (3.82 | ) | |||||||||||||||||||||||||||
| From return of capital |
— | (0.66 | ) | (0.53 | ) | (0.73 | ) | (1.21 | ) | — | — | |||||||||||||||||||||||||
|
|
|
|
|
|
|
|
|
|
|
|
|
|
|
|||||||||||||||||||||||
| Total distributions |
(0.47 | ) | (0.93 | ) | (0.93 | ) | (1.00 | ) | (1.50 | ) | (1.41 | ) | (4.26 | ) | ||||||||||||||||||||||
|
|
|
|
|
|
|
|
|
|
|
|
|
|
|
|||||||||||||||||||||||
| Net asset value, end of period |
$ | 13.10 | $ | 11.98 | $ | 15.79 | $ | 16.33 | $ | 14.05 | $ | 21.15 | $ | 24.90 | ||||||||||||||||||||||
|
|
|
|
|
|
|
|
|
|
|
|
|
|
|
|||||||||||||||||||||||
| Market price, end of period |
$ | 11.93 | $ | 10.45 | $ | 14.18 | $ | 14.44 | $ | 12.53 | $ | 19.95 | $ | 23.78 | ||||||||||||||||||||||
|
|
|
|
|
|
|
|
|
|
|
|
|
|
|
|||||||||||||||||||||||
| Total Return(e) |
||||||||||||||||||||||||||||||||||||
| Based on net asset value |
13.71 | %(f) | (18.84 | )% | 3.49 | % | 25.07 | % | (27.47 | )% | (9.06 | )%(f) | (2.36 | )% | ||||||||||||||||||||||
|
|
|
|
|
|
|
|
|
|
|
|
|
|
|
|||||||||||||||||||||||
| Based on market price |
18.71 | %(f) | (21.16 | )% | 5.11 | % | 24.01 | % | (31.42 | )% | (10.18 | )%(f) | 4.73 | % | ||||||||||||||||||||||
|
|
|
|
|
|
|
|
|
|
|
|
|
|
|
|||||||||||||||||||||||
| Ratios to Average Net Assets |
||||||||||||||||||||||||||||||||||||
| Total expenses |
1.36 | %(g) | 1.29 | % | 1.31 | % | 1.31 | % | 1.29 | % | 1.30 | %(g) | 1.26 | % | ||||||||||||||||||||||
|
|
|
|
|
|
|
|
|
|
|
|
|
|
|
|||||||||||||||||||||||
| Total expenses after fees waived and/or reimbursed |
1.21 | %(g) | 1.14 | % | 1.18 | % | 1.24 | % | 1.26 | % | 1.26 | %(g) | 1.26 | % | ||||||||||||||||||||||
|
|
|
|
|
|
|
|
|
|
|
|
|
|
|
|||||||||||||||||||||||
| Net investment income |
2.59 | %(g) | 1.87 | % | 2.69 | %(b) | 1.80 | % | 1.60 | % | 1.82 | %(g) | 0.89 | % | ||||||||||||||||||||||
|
|
|
|
|
|
|
|
|
|
|
|
|
|
|
|||||||||||||||||||||||
| Supplemental Data |
||||||||||||||||||||||||||||||||||||
| Net assets, end of period (000) |
$ | 390,761 | $ | 357,391 | $ | 471,062 | $ | 487,064 | $ | 418,981 | $ | 629,603 | $ | 741,109 | ||||||||||||||||||||||
|
|
|
|
|
|
|
|
|
|
|
|
|
|
|
|||||||||||||||||||||||
| Portfolio turnover rate |
11 | % | 32 | % | 24 | % | 33 | % | 56 | % | 4 | % | 85 | % | ||||||||||||||||||||||
|
|
|
|
|
|
|
|
|
|
|
|
|
|
|
|||||||||||||||||||||||
| (a) | Based on average shares outstanding. |
| (b) | Net investment income per share and the ratio of net investment income to average net assets include $0.15 per share and 0.99%, respectively, resulting from a special dividend from BakerHughes, Inc. in July 2017. |
| (c) | Distributions for annual periods determined in accordance with U.S. federal income tax regulations. |
| (d) | A portion of the distributions from net investment income may be deemed a return of capital or net realized gain at fiscal year end. |
| (e) | Total returns based on market price, which can be significantly greater or less than the net asset value, may result in substantially different returns. Where applicable, excludes the effects of any sales charges and assumes the reinvestment of distributions at actual reinvestment prices. |
| (f) | Aggregate total return. |
| (g) | Annualized. |
See notes to financial statements.
| 110 | 2019 BLACKROCK SEMI-ANNUAL REPORT TO SHAREHOLDERS |
Financial Highlights (continued)
(For a share outstanding throughout each period)
| CII | ||||||||||||||||||||||||||||||||||||
| Six Months Ended 06/30/19 (unaudited) |
Year Ended December 31, | Period from 11/01/14 to 12/31/14 |
Year Ended 10/31/14 |
|||||||||||||||||||||||||||||||||
| 2018 | 2017 | 2016 | 2015 | |||||||||||||||||||||||||||||||||
| Net asset value, beginning of period |
$ | 15.28 | $ | 17.19 | $ | 15.08 | $ | 15.11 | $ | 15.67 | $ | 15.47 | $ | 15.31 | ||||||||||||||||||||||
|
|
|
|
|
|
|
|
|
|
|
|
|
|
|
|||||||||||||||||||||||
| Net investment income(a) |
0.10 | 0.17 | 0.15 | 0.13 | 0.11 | 0.04 | 0.55 | |||||||||||||||||||||||||||||
| Net realized and unrealized gain (loss) |
1.86 | (1.09 | ) | 2.95 | 0.99 | 0.53 | 0.36 | 0.91 | ||||||||||||||||||||||||||||
|
|
|
|
|
|
|
|
|
|
|
|
|
|
|
|||||||||||||||||||||||
| Net increase (decrease) from investment operations |
1.96 | (0.92 | ) | 3.10 | 1.12 | 0.64 | 0.40 | 1.46 | ||||||||||||||||||||||||||||
|
|
|
|
|
|
|
|
|
|
|
|
|
|
|
|||||||||||||||||||||||
| Distributions(b) |
||||||||||||||||||||||||||||||||||||
| From net investment income |
(0.50 | )(c) | (0.17 | )(g) | (0.15 | ) | (0.13 | ) | (0.14 | ) | (0.10 | ) | (0.65 | ) | ||||||||||||||||||||||
| From net realized gain |
— | (0.28 | )(g) | — | (0.04 | ) | (1.06 | ) | — | — | ||||||||||||||||||||||||||
| From return of capital |
— | (0.54 | ) | (0.84 | ) | (0.98 | ) | — | (0.10 | ) | (0.65 | ) | ||||||||||||||||||||||||
|
|
|
|
|
|
|
|
|
|
|
|
|
|
|
|||||||||||||||||||||||
| Total distributions |
(0.50 | ) | (0.99 | ) | (0.99 | ) | (1.15 | ) | (1.20 | ) | (0.20 | ) | (1.30 | ) | ||||||||||||||||||||||
|
|
|
|
|
|
|
|
|
|
|
|
|
|
|
|||||||||||||||||||||||
| Net asset value, end of period |
$ | 16.74 | $ | 15.28 | $ | 17.19 | $ | 15.08 | $ | 15.11 | $ | 15.67 | $ | 15.47 | ||||||||||||||||||||||
|
|
|
|
|
|
|
|
|
|
|
|
|
|
|
|||||||||||||||||||||||
| Market price, end of period |
$ | 15.80 | $ | 14.08 | $ | 16.38 | $ | 13.71 | $ | 14.14 | $ | 13.97 | $ | 14.89 | ||||||||||||||||||||||
|
|
|
|
|
|
|
|
|
|
|
|
|
|
|
|||||||||||||||||||||||
| Total Return(d) |
||||||||||||||||||||||||||||||||||||
| Based on net asset value |
13.05 | %(e) | (5.44 | )% | 21.69 | % | 8.66 | % | 4.66 | % | 2.69 | %(e) | 10.49 | % | ||||||||||||||||||||||
|
|
|
|
|
|
|
|
|
|
|
|
|
|
|
|||||||||||||||||||||||
| Based on market price |
15.80 | %(e) | (8.56 | )% | 27.54 | % | 5.56 | % | 9.86 | % | (4.88 | )%(e) | 20.43 | % | ||||||||||||||||||||||
|
|
|
|
|
|
|
|
|
|
|
|
|
|
|
|||||||||||||||||||||||
| Ratios to Average Net Assets |
||||||||||||||||||||||||||||||||||||
| Total expenses |
0.92 | %(f) | 0.90 | % | 0.93 | % | 0.95 | % | 0.94 | % | 0.99 | %(f) | 0.93 | % | ||||||||||||||||||||||
|
|
|
|
|
|
|
|
|
|
|
|
|
|
|
|||||||||||||||||||||||
| Total expenses after fees waived and/or reimbursed and paid indirectly |
0.92 | %(f) | 0.90 | % | 0.93 | % | 0.95 | % | 0.94 | % | 0.95 | %(f) | 0.93 | % | ||||||||||||||||||||||
|
|
|
|
|
|
|
|
|
|
|
|
|
|
|
|||||||||||||||||||||||
| Net investment income |
1.19 | %(f) | 1.00 | % | 0.94 | % | 0.89 | % | 0.71 | % | 1.42 | %(f) | 3.56 | % | ||||||||||||||||||||||
|
|
|
|
|
|
|
|
|
|
|
|
|
|
|
|||||||||||||||||||||||
| Supplemental Data |
||||||||||||||||||||||||||||||||||||
| Net assets, end of period (000) |
$ | 738,426 | $ | 674,077 | $ | 758,400 | $ | 665,159 | $ | 666,492 | $ | 691,380 | $ | 682,485 | ||||||||||||||||||||||
|
|
|
|
|
|
|
|
|
|
|
|
|
|
|
|||||||||||||||||||||||
| Portfolio turnover rate |
17 | % | 27 | % | 32 | % | 54 | % | 133 | % | 2 | % | 80 | % | ||||||||||||||||||||||
|
|
|
|
|
|
|
|
|
|
|
|
|
|
|
|||||||||||||||||||||||
| (a) | Based on average shares outstanding. |
| (b) | Distributions for annual periods determined in accordance with U.S. federal income tax regulations. |
| (c) | A portion of the distributions from net investment income may be deemed a return of capital or net realized gain at fiscal year end. |
| (d) | Total returns based on market price, which can be significantly greater or less than the net asset value, may result in substantially different returns. Where applicable, excludes the effects of any sales charges and assumes the reinvestment of distributions at actual reinvestment prices. |
| (e) | Aggregate total return. |
| (f) | Annualized. |
| (g) | Amount previously presented incorrectly as solely distributions from net investment income has been revised to reflect the proper classification of distributions between net realized gain and net investment income. |
See notes to financial statements.
| FINANCIAL HIGHLIGHTS | 111 |
Financial Highlights (continued)
(For a share outstanding throughout each period)
| BDJ | ||||||||||||||||||||||||||||||||||||
| Six Months Ended 06/30/19 (unaudited) |
Year Ended December 31, | Period from 11/01/14 to 12/31/14 |
Year Ended 10/31/14 |
|||||||||||||||||||||||||||||||||
| 2018 | 2017 | 2016 | 2015 | |||||||||||||||||||||||||||||||||
| Net asset value, beginning of period |
$ | 8.74 | $ | 9.96 | $ | 9.22 | $ | 8.70 | $ | 9.24 | $ | 9.19 | $ | 8.88 | ||||||||||||||||||||||
|
|
|
|
|
|
|
|
|
|
|
|
|
|
|
|||||||||||||||||||||||
| Net investment income(a) |
0.11 | 0.18 | (b) | 0.16 | 0.17 | 0.17 | 0.04 | 0.16 | ||||||||||||||||||||||||||||
| Net realized and unrealized gain (loss) |
1.03 | (0.84 | ) | 1.14 | 0.91 | (0.15 | ) | 0.10 | 0.76 | |||||||||||||||||||||||||||
|
|
|
|
|
|
|
|
|
|
|
|
|
|
|
|||||||||||||||||||||||
| Net increase (decrease) from investment operations |
1.14 | (0.66 | ) | 1.30 | 1.08 | 0.02 | 0.14 | 0.92 | ||||||||||||||||||||||||||||
|
|
|
|
|
|
|
|
|
|
|
|
|
|
|
|||||||||||||||||||||||
| Distributions(c) |
||||||||||||||||||||||||||||||||||||
| From net investment income |
(0.28 | )(d) | (0.18 | )(j) | (0.17 | ) | (0.17 | ) | (0.17 | ) | (0.03 | ) | (0.17 | ) | ||||||||||||||||||||||
| From net realized gain |
— | (0.38 | )(j) | (0.39 | ) | — | — | — | — | |||||||||||||||||||||||||||
| From return of capital |
— | — | — | (0.39 | ) | (0.39 | ) | (0.06 | ) | (0.44 | ) | |||||||||||||||||||||||||
|
|
|
|
|
|
|
|
|
|
|
|
|
|
|
|||||||||||||||||||||||
| Total distributions |
(0.28 | ) | (0.56 | ) | (0.56 | ) | (0.56 | ) | (0.56 | ) | (0.09 | ) | (0.61 | ) | ||||||||||||||||||||||
|
|
|
|
|
|
|
|
|
|
|
|
|
|
|
|||||||||||||||||||||||
| Net asset value, end of period |
$ | 9.60 | $ | 8.74 | $ | 9.96 | $ | 9.22 | $ | 8.70 | $ | 9.24 | $ | 9.19 | ||||||||||||||||||||||
|
|
|
|
|
|
|
|
|
|
|
|
|
|
|
|||||||||||||||||||||||
| Market price, end of period |
$ | 8.87 | $ | 7.77 | $ | 9.23 | $ | 8.15 | $ | 7.61 | $ | 8.12 | $ | 8.35 | ||||||||||||||||||||||
|
|
|
|
|
|
|
|
|
|
|
|
|
|
|
|||||||||||||||||||||||
| Total Return(e) |
||||||||||||||||||||||||||||||||||||
| Based on net asset value |
13.44 | %(f) | (6.59 | )% | 15.06 | % | 13.90 | % | 1.10 | % | 1.69 | %(f) | 11.40 | % | ||||||||||||||||||||||
|
|
|
|
|
|
|
|
|
|
|
|
|
|
|
|||||||||||||||||||||||
| Based on market price |
17.89 | %(f) | (10.39 | )% | 20.63 | % | 15.11 | % | 0.63 | % | (1.65 | )%(f) | 16.42 | % | ||||||||||||||||||||||
|
|
|
|
|
|
|
|
|
|
|
|
|
|
|
|||||||||||||||||||||||
| Ratios to Average Net Assets |
||||||||||||||||||||||||||||||||||||
| Total expenses |
0.87 | %(g) | 0.85 | % | 0.86 | % | 0.87 | % | 0.86 | % | 0.87 | %(g) | 0.87 | %(h) | ||||||||||||||||||||||
|
|
|
|
|
|
|
|
|
|
|
|
|
|
|
|||||||||||||||||||||||
| Total expenses after fees waived and/or reimbursed |
0.87 | %(g) | 0.85 | % | 0.86 | % | 0.85 | % | 0.85 | % | 0.84 | %(g) | 0.86 | %(h) | ||||||||||||||||||||||
|
|
|
|
|
|
|
|
|
|
|
|
|
|
|
|||||||||||||||||||||||
| Net investment income |
2.25 | %(g) | 1.85 | %(b) | 1.73 | % | 1.91 | % | 1.85 | % | 2.30 | %(g) | 1.81 | % | ||||||||||||||||||||||
|
|
|
|
|
|
|
|
|
|
|
|
|
|
|
|||||||||||||||||||||||
| Supplemental Data |
||||||||||||||||||||||||||||||||||||
| Net assets, end of period (000) |
$ | 1,800,611 | $ | 1,638,237 | $ | 1,868,457 | $ | 1,741,649 | $ | 1,643,508 | $ | 1,747,070 | $ | 1,648,683 | ||||||||||||||||||||||
|
|
|
|
|
|
|
|
|
|
|
|
|
|
|
|||||||||||||||||||||||
| Portfolio turnover rate |
23 | % | 34 | % | 42 | % | 33 | % | 26 | % | 0 | %(i) | 63 | % | ||||||||||||||||||||||
|
|
|
|
|
|
|
|
|
|
|
|
|
|
|
|||||||||||||||||||||||
| (a) | Based on average Common Shares outstanding. |
| (b) | Net investment income per share and the ratio of net investment income to average net assets includes $0.01 per share and 0.14%, respectively, resulting from a special dividend. |
| (c) | Distributions for annual periods determined in accordance with U.S. federal income tax regulations. |
| (d) | A portion of the distributions from net investment income may be deemed a return of capital or net realized gain at fiscal year end. |
| (e) | Total returns based on market price, which can be significantly greater or less than the net asset value, may result in substantially different returns. Where applicable, excludes the effects of any sales charges and assumes the reinvestment of distributions at actual reinvestment prices. |
| (f) | Aggregate total return. |
| (g) | Annualized. |
| (h) | Includes reorganization costs associated with the Trust’s merger. Without these costs, total expenses and total expenses after fees waived and/or reimbursed would have been 0.86% and 0.86%, respectively. |
| (i) | Amount is less than 0.5% |
| (j) | Amount previously presented incorrectly as solely distributions from net investment income has been revised to reflect the proper classification of distributions between net realized gain and net investment income. |
See notes to financial statements.
| 112 | 2019 BLACKROCK SEMI-ANNUAL REPORT TO SHAREHOLDERS |
Financial Highlights (continued)
(For a share outstanding throughout each period)
| BOE | ||||||||||||||||||||||||||||||||||||
| Six Months Ended 06/30/19 (unaudited) |
Year Ended December 31, | Period from 11/01/14 to 12/31/14 |
Year Ended 10/31/14 |
|||||||||||||||||||||||||||||||||
| 2018 | 2017 | 2016 | 2015 | |||||||||||||||||||||||||||||||||
| Net asset value, beginning of period |
$ | 11.07 | $ | 13.22 | $ | 13.38 | $ | 14.25 | $ | 15.27 | $ | 15.54 | $ | 16.68 | ||||||||||||||||||||||
|
|
|
|
|
|
|
|
|
|
|
|
|
|
|
|||||||||||||||||||||||
| Net investment income(a) |
0.18 | 0.31 | 0.17 | 0.15 | 0.11 | 0.00 | (b) | 0.14 | ||||||||||||||||||||||||||||
| Net realized and unrealized gain (loss) |
1.03 | (1.61 | ) | 1.96 | 0.03 | 0.03 | (0.07 | ) | 0.07 | |||||||||||||||||||||||||||
|
|
|
|
|
|
|
|
|
|
|
|
|
|
|
|||||||||||||||||||||||
| Net increase (decrease) from investment operations |
1.21 | (1.30 | ) | 2.13 | 0.18 | 0.14 | (0.07 | ) | 0.21 | |||||||||||||||||||||||||||
|
|
|
|
|
|
|
|
|
|
|
|
|
|
|
|||||||||||||||||||||||
| Distributions(c) |
||||||||||||||||||||||||||||||||||||
| From net investment income |
(0.38 | )(d) | (0.31 | )(l) | (0.19 | ) | (0.10 | ) | (0.17 | ) | — | (0.17 | ) | |||||||||||||||||||||||
| In excess of net investment income(e) |
— | — | — | — | (0.10 | ) | — | (0.28 | ) | |||||||||||||||||||||||||||
| From net realized gain |
— | (0.52 | )(l) | (2.10 | ) | — | — | — | — | |||||||||||||||||||||||||||
| From return of capital |
— | (0.02 | ) | — | (0.95 | ) | (0.89 | ) | (0.20 | ) | (0.90 | ) | ||||||||||||||||||||||||
|
|
|
|
|
|
|
|
|
|
|
|
|
|
|
|||||||||||||||||||||||
| Total distributions |
(0.38 | ) | (0.85 | ) | (2.29 | ) | (1.05 | ) | (1.16 | ) | (0.20 | ) | (1.35 | ) | ||||||||||||||||||||||
|
|
|
|
|
|
|
|
|
|
|
|
|
|
|
|||||||||||||||||||||||
| Net asset value, end of period |
$ | 11.90 | $ | 11.07 | $ | 13.22 | $ | 13.38 | $ | 14.25 | $ | 15.27 | $ | 15.54 | ||||||||||||||||||||||
|
|
|
|
|
|
|
|
|
|
|
|
|
|
|
|||||||||||||||||||||||
| Market price, end of period |
$ | 10.73 | $ | 9.37 | $ | 12.51 | $ | 11.57 | $ | 12.76 | $ | 13.13 | $ | 14.00 | ||||||||||||||||||||||
|
|
|
|
|
|
|
|
|
|
|
|
|
|
|
|||||||||||||||||||||||
| Total Return(f) |
||||||||||||||||||||||||||||||||||||
| Based on net asset value |
11.41 | %(g) | (9.63 | )% | 17.22 | %(h) | 2.62 | % | 1.81 | % | (0.27 | )%(g) | 2.10 | % | ||||||||||||||||||||||
|
|
|
|
|
|
|
|
|
|
|
|
|
|
|
|||||||||||||||||||||||
| Based on market price |
18.69 | %(g) | (19.16 | )% | 28.28 | % | (0.90 | )% | 6.03 | % | (4.82 | )%(g) | 4.09 | % | ||||||||||||||||||||||
|
|
|
|
|
|
|
|
|
|
|
|
|
|
|
|||||||||||||||||||||||
| Ratios to Average Net Assets(i) |
||||||||||||||||||||||||||||||||||||
| Total expenses |
1.11 | %(j) | 1.08 | % | 1.09 | % | 1.10 | % | 1.08 | % | 1.10 | %(j) | 1.08 | % | ||||||||||||||||||||||
|
|
|
|
|
|
|
|
|
|
|
|
|
|
|
|||||||||||||||||||||||
| Total expenses after fees waived and/or reimbursed |
0.93 | %(j) | 0.94 | % | 1.02 | % | 1.05 | % | 1.05 | % | 1.07 | %(j) | 1.08 | % | ||||||||||||||||||||||
|
|
|
|
|
|
|
|
|
|
|
|
|
|
|
|||||||||||||||||||||||
| Net investment income |
3.22 | %(j) | 2.52 | % | 1.20 | % | 1.15 | % | 0.73 | % | 0.00 | %(j)(k) | 0.83 | % | ||||||||||||||||||||||
|
|
|
|
|
|
|
|
|
|
|
|
|
|
|
|||||||||||||||||||||||
| Supplemental Data |
||||||||||||||||||||||||||||||||||||
| Net assets, end of period (000) |
$ | 798,555 | $ | 754,602 | $ | 911,227 | $ | 929,897 | $ | 990,318 | $ | 1,060,687 | $ | 1,079,862 | ||||||||||||||||||||||
|
|
|
|
|
|
|
|
|
|
|
|
|
|
|
|||||||||||||||||||||||
| Portfolio turnover rate |
13 | % | 28 | % | 133 | % | 64 | % | 72 | % | 16 | % | 150 | % | ||||||||||||||||||||||
|
|
|
|
|
|
|
|
|
|
|
|
|
|
|
|||||||||||||||||||||||
| (a) | Based on average shares outstanding. |
| (b) | Amount is less than $0.005 per share. |
| (c) | Distributions for annual periods determined in accordance with U.S. federal income tax regulations. |
| (d) | A portion of the distributions from net investment income may be deemed a return of capital or net realized gain at fiscal year end. |
| (e) | Taxable distribution. |
| (f) | Total returns based on market price, which can be significantly greater or less than the net asset value, may result in substantially different returns. Where applicable, excludes the effects of any sales charges and assumes the reinvestment of distributions at actual reinvestment prices. |
| (g) | Aggregate total return. |
| (h) | Includes payment received from an affiliate, which had no impact on the Trust’s total return. |
| (i) | Excludes expenses incurred indirectly as a result of investments in underlying funds as follows: |
| Six Months Ended 06/30/19 (unaudited) |
Year Ended December 31, | Period from 11/01/14 to 12/31/14 |
Year Ended 10/31/14 |
|||||||||||||||||||||||||||||||||||||||||||||||||||||
| 2018 | 2017 | 2016 | 2015 | |||||||||||||||||||||||||||||||||||||||||||||||||||||
| Investments in underlying funds |
— | % | 0.01 | % | — | % | — | % | — | % | — | % | — | % | ||||||||||||||||||||||||||||||||||||||||||
|
|
|
|
|
|
|
|
|
|
|
|
|
|
|
|||||||||||||||||||||||||||||||||||||||||||
| (j) | Annualized. |
| (k) | Amount is less than 0.005%. |
| (l) | Amount previously presented incorrectly as solely distributions from net investment income has been revised to reflect the proper classification of distributions between net realized gain and net investment income. |
See notes to financial statements.
| FINANCIAL HIGHLIGHTS | 113 |
Financial Highlights (continued)
(For a share outstanding throughout each period)
| BGY | ||||||||||||||||||||||||||||||||||||
| Six Months Ended 06/30/19 (unaudited) |
Year Ended December 31, | Period from 11/01/14 to 12/31/14 |
Year Ended 10/31/14 |
|||||||||||||||||||||||||||||||||
| 2018 | 2017 | 2016 | 2015 | |||||||||||||||||||||||||||||||||
| Net asset value, beginning of period |
$ | 5.79 | $ | 7.06 | $ | 6.28 | $ | 6.95 | $ | 7.61 | $ | 7.89 | $ | 9.05 | ||||||||||||||||||||||
|
|
|
|
|
|
|
|
|
|
|
|
|
|
|
|||||||||||||||||||||||
| Net investment income (loss)(a) |
0.11 | 0.17 | (b) | 0.09 | 0.09 | 0.08 | (0.00 | )(c) | 0.10 | |||||||||||||||||||||||||||
| Net realized and unrealized gain (loss) |
0.52 | (1.00 | ) | 1.15 | (0.24 | ) | (0.15 | ) | (0.17 | ) | (0.53 | ) | ||||||||||||||||||||||||
|
|
|
|
|
|
|
|
|
|
|
|
|
|
|
|||||||||||||||||||||||
| Net increase (decrease) from investment operations |
0.63 | (0.83 | ) | 1.24 | (0.15 | ) | (0.07 | ) | (0.17 | ) | (0.43 | ) | ||||||||||||||||||||||||
|
|
|
|
|
|
|
|
|
|
|
|
|
|
|
|||||||||||||||||||||||
| Distributions(d) |
||||||||||||||||||||||||||||||||||||
| From net investment income |
(0.20 | )(e) | (0.16 | )(l) | (0.09 | ) | (0.07 | ) | (0.11 | ) | — | (0.13 | ) | |||||||||||||||||||||||
| In excess of net investment income(f) |
— | — | — | — | — | — | (0.08 | ) | ||||||||||||||||||||||||||||
| From net realized gain |
— | (0.28 | )(l) | — | — | — | — | — | ||||||||||||||||||||||||||||
| From return of capital |
— | — | (0.37 | ) | (0.45 | ) | (0.48 | ) | (0.11 | ) | (0.52 | ) | ||||||||||||||||||||||||
|
|
|
|
|
|
|
|
|
|
|
|
|
|
|
|||||||||||||||||||||||
| Total distributions |
(0.20 | ) | (0.44 | ) | (0.46 | ) | (0.52 | ) | (0.59 | ) | (0.11 | ) | (0.73 | ) | ||||||||||||||||||||||
|
|
|
|
|
|
|
|
|
|
|
|
|
|
|
|||||||||||||||||||||||
| Net asset value, end of period |
$ | 6.22 | $ | 5.79 | $ | 7.06 | $ | 6.28 | $ | 6.95 | $ | 7.61 | $ | 7.89 | ||||||||||||||||||||||
|
|
|
|
|
|
|
|
|
|
|
|
|
|
|
|||||||||||||||||||||||
| Market price, end of period |
$ | 5.62 | $ | 4.98 | $ | 6.52 | $ | 5.51 | $ | 6.24 | $ | 6.74 | $ | 7.26 | ||||||||||||||||||||||
|
|
|
|
|
|
|
|
|
|
|
|
|
|
|
|||||||||||||||||||||||
| Total Return(g) |
||||||||||||||||||||||||||||||||||||
| Based on net asset value |
11.42 | %(h) | (11.48 | )% | 20.88 | %(i) | (1.12 | )% | (0.47 | )% | (2.10 | )%(h) | (4.49 | )% | ||||||||||||||||||||||
|
|
|
|
|
|
|
|
|
|
|
|
|
|
|
|||||||||||||||||||||||
| Based on market price |
17.05 | %(h) | (17.55 | )% | 27.23 | % | (3.37 | )% | 0.90 | % | (5.77 | )%(h) | (2.29 | )% | ||||||||||||||||||||||
|
|
|
|
|
|
|
|
|
|
|
|
|
|
|
|||||||||||||||||||||||
| Ratios to Average Net Assets(j) |
||||||||||||||||||||||||||||||||||||
| Total expenses |
1.12 | %(k) | 1.09 | % | 1.12 | % | 1.12 | % | 1.09 | % | 1.12 | %(k) | 1.10 | % | ||||||||||||||||||||||
|
|
|
|
|
|
|
|
|
|
|
|
|
|
|
|||||||||||||||||||||||
| Total expenses after fees waived and/or reimbursed |
1.02 | %(k) | 0.99 | % | 1.02 | % | 1.02 | % | 1.01 | % | 1.03 | %(k) | 1.05 | % | ||||||||||||||||||||||
|
|
|
|
|
|
|
|
|
|
|
|
|
|
|
|||||||||||||||||||||||
| Net investment income (loss) |
3.64 | %(k) | 2.59 | %(b) | 1.31 | % | 1.41 | % | 1.09 | % | (0.13 | )%(k) | 1.17 | % | ||||||||||||||||||||||
|
|
|
|
|
|
|
|
|
|
|
|
|
|
|
|||||||||||||||||||||||
| Supplemental Data |
||||||||||||||||||||||||||||||||||||
| Net assets, end of period (000) |
$ | 666,811 | $ | 623,234 | $ | 769,678 | $ | 690,628 | $ | 764,154 | $ | 836,552 | $ | 867,986 | ||||||||||||||||||||||
|
|
|
|
|
|
|
|
|
|
|
|
|
|
|
|||||||||||||||||||||||
| Portfolio turnover rate |
14 | % | 60 | % | 90 | % | 74 | % | 67 | % | 14 | % | 195 | % | ||||||||||||||||||||||
|
|
|
|
|
|
|
|
|
|
|
|
|
|
|
|||||||||||||||||||||||
| (a) | Based on average shares outstanding. |
| (b) | Net investment income per share and the ratio of net investment income to average net assets include $0.01 per share and 0.10%, respectively, resulting from a special dividend. |
| (c) | Amount is greater than $(0.005) per share. |
| (d) | Distributions for annual periods determined in accordance with U.S. federal income tax regulations. |
| (e) | A portion of the distributions from net investment income may be deemed a return of capital or net realized gain at fiscal year end. |
| (f) | Taxable distribution. |
| (g) | Total returns based on market price, which can be significantly greater or less than the net asset value, may result in substantially different returns. Where applicable, excludes the effects of any sales charges and assumes the reinvestment of distributions at actual reinvestment prices. |
| (h) | Aggregate total return. |
| (i) | Includes payment received from an affiliate, which had no impact on the Trust’s total return. |
| (j) | Excludes expenses incurred indirectly as a result of investments in underlying funds as follows: |
| Six Months Ended 06/30/19 (unaudited) |
Year Ended December 31, | Period from 11/01/14 to 12/31/14 |
Year Ended 10/31/14 |
|||||||||||||||||||||||||||||||||||||||||||||||||||||
| 2018 | 2017 | 2016 | 2015 | |||||||||||||||||||||||||||||||||||||||||||||||||||||
| Investments in underlying funds |
— | % | — | % | 0.02 | % | 0.01 | % | 0.01 | % | — | % | — | % | ||||||||||||||||||||||||||||||||||||||||||
|
|
|
|
|
|
|
|
|
|
|
|
|
|
|
|||||||||||||||||||||||||||||||||||||||||||
| (k) | Annualized. |
| (l) | Amount previously presented incorrectly as solely distributions from net investment income has been revised to reflect the proper classification of distributions between net realized gain and net investment income. |
See notes to financial statements.
| 114 | 2019 BLACKROCK SEMI-ANNUAL REPORT TO SHAREHOLDERS |
Financial Highlights (continued)
(For a share outstanding throughout each period)
| BME | ||||||||||||||||||||||||||||||||||||
| Six Months Ended 06/30/19 (unaudited) |
Year Ended December 31, | Period from 11/01/14 to 12/31/14 |
Year Ended 10/31/14 |
|||||||||||||||||||||||||||||||||
| 2018 | 2017 | 2016 | 2015 | |||||||||||||||||||||||||||||||||
| Net asset value, beginning of period |
$ | 35.87 | $ | 35.69 | $ | 31.30 | $ | 36.19 | $ | 38.61 | $ | 40.22 | $ | 34.92 | ||||||||||||||||||||||
|
|
|
|
|
|
|
|
|
|
|
|
|
|
|
|||||||||||||||||||||||
| Net investment income (loss)(a) |
0.05 | 0.07 | 0.02 | 0.02 | (0.06 | ) | (0.01 | ) | (0.00 | )(b) | ||||||||||||||||||||||||||
| Net realized and unrealized gain (loss) |
3.54 | 2.51 | 6.77 | (1.91 | ) | 4.34 | 1.10 | 9.14 | ||||||||||||||||||||||||||||
|
|
|
|
|
|
|
|
|
|
|
|
|
|
|
|||||||||||||||||||||||
| Net increase (decrease) from investment operations |
3.59 | 2.58 | 6.79 | (1.89 | ) | 4.28 | 1.09 | 9.14 | ||||||||||||||||||||||||||||
|
|
|
|
|
|
|
|
|
|
|
|
|
|
|
|||||||||||||||||||||||
| Distributions(c) |
||||||||||||||||||||||||||||||||||||
| From net investment income |
(1.20 | )(d) | (0.07 | )(j) | (0.04 | ) | (0.03 | ) | (0.63 | ) | (0.01 | ) | (0.10 | ) | ||||||||||||||||||||||
| From net realized gain |
— | (2.33 | )(j) | (2.11 | ) | (2.97 | ) | (6.07 | ) | (2.69 | ) | (3.74 | ) | |||||||||||||||||||||||
| From return of capital |
— | — | (0.25 | ) | — | — | — | — | ||||||||||||||||||||||||||||
|
|
|
|
|
|
|
|
|
|
|
|
|
|
|
|||||||||||||||||||||||
| Total distributions |
(1.20 | ) | (2.40 | ) | (2.40 | ) | (3.00 | ) | (6.70 | ) | (2.70 | ) | (3.84 | ) | ||||||||||||||||||||||
|
|
|
|
|
|
|
|
|
|
|
|
|
|
|
|||||||||||||||||||||||
| Net asset value, end of period |
$ | 38.26 | $ | 35.87 | $ | 35.69 | $ | 31.30 | $ | 36.19 | $ | 38.61 | $ | 40.22 | ||||||||||||||||||||||
|
|
|
|
|
|
|
|
|
|
|
|
|
|
|
|||||||||||||||||||||||
| Market price, end of period |
$ | 38.89 | $ | 36.45 | $ | 36.50 | $ | 31.75 | $ | 39.35 | $ | 42.70 | $ | 41.37 | ||||||||||||||||||||||
|
|
|
|
|
|
|
|
|
|
|
|
|
|
|
|||||||||||||||||||||||
| Total Return(e) |
||||||||||||||||||||||||||||||||||||
| Based on net asset value |
10.12 | %(f) | 7.26 | % | 22.17 | % | (5.36 | )% | 10.70 | % | 2.38 | %(f) | 28.00 | % | ||||||||||||||||||||||
|
|
|
|
|
|
|
|
|
|
|
|
|
|
|
|||||||||||||||||||||||
| Based on market price |
10.16 | %(f) | 6.57 | % | 23.17 | % | (11.71 | )% | 8.87 | % | 10.07 | %(f) | 36.99 | % | ||||||||||||||||||||||
|
|
|
|
|
|
|
|
|
|
|
|
|
|
|
|||||||||||||||||||||||
| Ratios to Average Net Assets(g) |
||||||||||||||||||||||||||||||||||||
| Total expenses |
1.11 | %(h) | 1.11 | % | 1.12 | % | 1.15 | %(i) | 1.13 | % | 1.16 | %(h) | 1.11 | % | ||||||||||||||||||||||
|
|
|
|
|
|
|
|
|
|
|
|
|
|
|
|||||||||||||||||||||||
| Total expenses after fees waived and/or reimbursed and excluding amortization of offering costs |
1.11 | %(h) | 1.11 | % | 1.12 | % | 1.14 | % | 1.12 | % | 1.11 | %(h) | 1.11 | % | ||||||||||||||||||||||
|
|
|
|
|
|
|
|
|
|
|
|
|
|
|
|||||||||||||||||||||||
| Net investment income (loss) |
0.27 | %(h) | 0.19 | % | 0.06 | % | 0.07 | % | (0.14 | )% | (0.10 | )%(h) | (0.01 | )% | ||||||||||||||||||||||
|
|
|
|
|
|
|
|
|
|
|
|
|
|
|
|||||||||||||||||||||||
| Supplemental Data |
||||||||||||||||||||||||||||||||||||
| Net assets, end of period (000) |
$ | 401,408 | $ | 352,675 | $ | 331,858 | $ | 270,693 | $ | 297,530 | $ | 303,103 | $ | 313,933 | ||||||||||||||||||||||
|
|
|
|
|
|
|
|
|
|
|
|
|
|
|
|||||||||||||||||||||||
| Portfolio turnover rate |
25 | % | 37 | % | 38 | % | 59 | % | 68 | % | 6 | % | 74 | % | ||||||||||||||||||||||
|
|
|
|
|
|
|
|
|
|
|
|
|
|
|
|||||||||||||||||||||||
| (a) | Based on average shares outstanding. |
| (b) | Amount is greater than $(0.005) per share. |
| (c) | Distributions for annual periods determined in accordance with U.S. federal income tax regulations. |
| (d) | A portion of the distributions from net investment income may be deemed a return of capital or net realized gain at fiscal year end. |
| (e) | Total returns based on market price, which can be significantly greater or less than the net asset value, may result in substantially different returns. Where applicable, excludes the effects of any sales charges and assumes the reinvestment of distributions at actual reinvestment prices. |
| (f) | Aggregate total return. |
| (g) | Excludes expenses incurred indirectly as a result of investments in underlying funds as follows: |
| Six Months Ended 06/30/19 (unaudited) |
Year Ended December 31, | Period from 11/01/14 to 12/31/14 |
Year Ended 10/31/14 |
|||||||||||||||||||||||||||||||||||||||||||||||||||||
| 2018 | 2017 | 2016 | 2015 | |||||||||||||||||||||||||||||||||||||||||||||||||||||
| Investments in underlying funds |
0.01 | % | 0.01 | % | 0.01 | % | — | % | — | % | — | % | — | % | ||||||||||||||||||||||||||||||||||||||||||
|
|
|
|
|
|
|
|
|
|
|
|
|
|
|
|||||||||||||||||||||||||||||||||||||||||||
| (h) | Annualized. |
| (i) | Offering costs were not annualized in the calculation of the expense ratios. If these expenses were annualized, the total expenses would have been 1.16%. |
| (j) | Amount previously presented incorrectly as solely distributions from net investment income has been revised to reflect the proper classification of distributions between net realized gain and net investment income. |
See notes to financial statements.
| FINANCIAL HIGHLIGHTS | 115 |
Financial Highlights (continued)
(For a share outstanding throughout each period)
| BCX | ||||||||||||||||||||||||||||||||||||
| Six Months Ended 06/30/19 (unaudited) |
Year Ended December 31, | Period from 11/01/14 to 12/31/14 |
Year Ended 10/31/14 |
|||||||||||||||||||||||||||||||||
| 2018 | 2017 | 2016 | 2015 | |||||||||||||||||||||||||||||||||
| Net asset value, beginning of period |
$ | 8.44 | $ | 10.64 | $ | 9.86 | $ | 8.35 | $ | 11.67 | $ | 12.50 | $ | 13.54 | ||||||||||||||||||||||
|
|
|
|
|
|
|
|
|
|
|
|
|
|
|
|||||||||||||||||||||||
| Net investment income(a) |
0.14 | 0.22 | 0.20 | (b) | 0.14 | 0.25 | 0.04 | 0.23 | ||||||||||||||||||||||||||||
| Net realized and unrealized gain (loss) |
1.01 | (1.80 | ) | 1.19 | 1.95 | (2.76 | ) | (0.72 | ) | (0.27 | ) | |||||||||||||||||||||||||
|
|
|
|
|
|
|
|
|
|
|
|
|
|
|
|||||||||||||||||||||||
| Net increase (decrease) from investment operations |
1.15 | (1.58 | ) | 1.39 | 2.09 | (2.51 | ) | (0.68 | ) | (0.04 | ) | |||||||||||||||||||||||||
|
|
|
|
|
|
|
|
|
|
|
|
|
|
|
|||||||||||||||||||||||
| Distributions(c) |
||||||||||||||||||||||||||||||||||||
| From net investment income |
(0.31 | )(d) | (0.19 | ) | (0.24 | ) | (0.15 | ) | (0.25 | ) | (0.02 | ) | (0.31 | ) | ||||||||||||||||||||||
| From return of capital |
— | (0.43 | ) | (0.37 | ) | (0.43 | ) | (0.56 | ) | (0.13 | ) | (0.69 | ) | |||||||||||||||||||||||
|
|
|
|
|
|
|
|
|
|
|
|
|
|
|
|||||||||||||||||||||||
| Total distributions |
(0.31 | ) | (0.62 | ) | (0.61 | ) | (0.58 | ) | (0.81 | ) | (0.15 | ) | (1.00 | ) | ||||||||||||||||||||||
|
|
|
|
|
|
|
|
|
|
|
|
|
|
|
|||||||||||||||||||||||
| Net asset value, end of period |
$ | 9.28 | $ | 8.44 | $ | 10.64 | $ | 9.86 | $ | 8.35 | $ | 11.67 | $ | 12.50 | ||||||||||||||||||||||
|
|
|
|
|
|
|
|
|
|
|
|
|
|
|
|||||||||||||||||||||||
| Market price, end of period |
$ | 8.18 | $ | 7.06 | $ | 9.77 | $ | 8.27 | $ | 7.11 | $ | 9.71 | $ | 10.78 | ||||||||||||||||||||||
|
|
|
|
|
|
|
|
|
|
|
|
|
|
|
|||||||||||||||||||||||
| Total Return(e) |
||||||||||||||||||||||||||||||||||||
| Based on net asset value |
14.27 | %(f) | (14.90 | )% | 15.60 | % | 27.41 | % | (21.31 | )% | (5.20 | )%(f) | 0.61 | % | ||||||||||||||||||||||
|
|
|
|
|
|
|
|
|
|
|
|
|
|
|
|||||||||||||||||||||||
| Based on market price |
20.42 | %(f) | (22.47 | )% | 26.55 | % | 25.50 | % | (19.47 | )% | (8.53 | )%(f) | 0.58 | % | ||||||||||||||||||||||
|
|
|
|
|
|
|
|
|
|
|
|
|
|
|
|||||||||||||||||||||||
| Ratios to Average Net Assets |
||||||||||||||||||||||||||||||||||||
| Total expenses |
1.12 | %(g) | 1.08 | % | 1.08 | % | 1.08 | % | 1.07 | % | 1.15 | %(g) | 1.35 | %(h) | ||||||||||||||||||||||
|
|
|
|
|
|
|
|
|
|
|
|
|
|
|
|||||||||||||||||||||||
| Total expenses after fees waived and/or reimbursed |
1.12 | %(g) | 1.08 | % | 1.08 | % | 1.08 | % | 1.07 | % | 1.04 | %(g) | 1.06 | %(h) | ||||||||||||||||||||||
|
|
|
|
|
|
|
|
|
|
|
|
|
|
|
|||||||||||||||||||||||
| Net investment income |
3.01 | %(g) | 2.17 | % | 2.06 | %(b) | 1.61 | % | 2.43 | % | 2.01 | %(g) | 1.70 | %(h) | ||||||||||||||||||||||
|
|
|
|
|
|
|
|
|
|
|
|
|
|
|
|||||||||||||||||||||||
| Supplemental Data |
||||||||||||||||||||||||||||||||||||
| Net assets, end of period (000) |
$ | 863,153 | $ | 798,282 | $ | 1,027,472 | $ | 976,899 | $ | 827,040 | $ | 1,156,499 | $ | 582,220 | ||||||||||||||||||||||
|
|
|
|
|
|
|
|
|
|
|
|
|
|
|
|||||||||||||||||||||||
| Portfolio turnover rate |
41 | % | 66 | % | 73 | % | 101 | % | 74 | % | 2 | % | 62 | % | ||||||||||||||||||||||
|
|
|
|
|
|
|
|
|
|
|
|
|
|
|
|||||||||||||||||||||||
| (a) | Based on average shares outstanding. |
| (b) | Net investment income per share and the ratio of net investment income to average net assets include less than $0.04 per share and 0.39% respectively, resulting from a special dividend from Baker Hughes Inc. in July 2017. |
| (c) | Distributions for annual periods determined in accordance with U.S. federal income tax regulations. |
| (d) | A portion of the distributions from net investment income may be deemed a return of capital or net realized gain at fiscal year end. |
| (e) | Total returns based on market price, which can be significantly greater or less than the net asset value, may result in substantially different returns. Where applicable, excludes the effects of any sales charges and assumes the reinvestment of distributions at actual reinvestment prices. |
| (f) | Aggregate total return. |
| (g) | Annualized. |
| (h) | Includes reorganization costs associated with the Trust’s merger. Without these costs, total expenses and total expenses after fees waived and/or reimbursed would have been 1.26% and 1.06%, respectively. |
See notes to financial statements.
| 116 | 2019 BLACKROCK SEMI-ANNUAL REPORT TO SHAREHOLDERS |
Financial Highlights (continued)
(For a share outstanding throughout each period)
| BST | ||||||||||||||||||||||||||||||||
| Six Months Ended 06/30/19 (unaudited) |
Year Ended December 31, | Period from to 12/31/14 |
||||||||||||||||||||||||||||||
| 2018 | 2017 | 2016 | 2015 | |||||||||||||||||||||||||||||
| Net asset value, beginning of period |
$ | 26.21 | $ | 27.73 | $ | 20.10 | $ | 19.70 | $ | 19.43 | $ | 19.10 | (b) | |||||||||||||||||||
|
|
|
|
|
|
|
|
|
|
|
|
|
|||||||||||||||||||||
| Net investment income (loss)(c) |
(0.07 | ) | (0.13 | ) | (0.05 | ) | 0.00 | (d) | 0.03 | (0.01 | ) | |||||||||||||||||||||
| Net realized and unrealized gain |
7.25 | 0.37 | 8.96 | 1.60 | 1.44 | 0.48 | ||||||||||||||||||||||||||
|
|
|
|
|
|
|
|
|
|
|
|
|
|||||||||||||||||||||
| Net increase from investment operations |
7.18 | 0.24 | 8.91 | 1.60 | 1.47 | 0.47 | ||||||||||||||||||||||||||
|
|
|
|
|
|
|
|
|
|
|
|
|
|||||||||||||||||||||
| Distributions(e) |
||||||||||||||||||||||||||||||||
| From net investment income |
(0.90 | )(f) | — | (k) | (0.05 | ) | — | (0.03 | ) | (0.00 | )(g) | |||||||||||||||||||||
| From net realized gain |
— | (1.76 | )(k) | (0.22 | ) | — | (0.01 | ) | — | |||||||||||||||||||||||
| From return of capital |
— | — | (1.01 | ) | (1.20 | ) | (1.16 | ) | (0.10 | ) | ||||||||||||||||||||||
|
|
|
|
|
|
|
|
|
|
|
|
|
|||||||||||||||||||||
| Total distributions |
(0.90 | ) | (1.76 | ) | (1.28 | ) | (1.20 | ) | (1.20 | ) | (0.10 | ) | ||||||||||||||||||||
|
|
|
|
|
|
|
|
|
|
|
|
|
|||||||||||||||||||||
| Capital changes with respect to issuance of Preferred Shares |
— | — | — | — | — | (0.04 | ) | |||||||||||||||||||||||||
|
|
|
|
|
|
|
|
|
|
|
|
|
|||||||||||||||||||||
| Net asset value, end of period |
$ | 32.49 | $ | 26.21 | $ | 27.73 | $ | 20.10 | $ | 19.70 | $ | 19.43 | ||||||||||||||||||||
|
|
|
|
|
|
|
|
|
|
|
|
|
|||||||||||||||||||||
| Market price, end of period |
$ | 32.31 | $ | 27.48 | $ | 26.69 | $ | 17.94 | $ | 17.31 | $ | 17.59 | ||||||||||||||||||||
|
|
|
|
|
|
|
|
|
|
|
|
|
|||||||||||||||||||||
| Total Return(h) |
||||||||||||||||||||||||||||||||
| Based on net asset value |
27.56 | %(i) | 0.24 | % | 45.73 | % | 9.36 | % | 8.61 | % | 2.31 | %(i) | ||||||||||||||||||||
|
|
|
|
|
|
|
|
|
|
|
|
|
|||||||||||||||||||||
| Based on market price |
21.00 | %(i) | 9.18 | % | 57.15 | % | 11.08 | % | 5.36 | % | (11.55 | )%(i) | ||||||||||||||||||||
|
|
|
|
|
|
|
|
|
|
|
|
|
|||||||||||||||||||||
| Ratios to Average Net Assets |
||||||||||||||||||||||||||||||||
| Total expenses |
1.07 | %(j) | 1.09 | % | 1.09 | % | 1.10 | % | 1.12 | % | 1.19 | %(j) | ||||||||||||||||||||
|
|
|
|
|
|
|
|
|
|
|
|
|
|||||||||||||||||||||
| Total expenses after fees waived and/or reimbursed |
0.92 | %(j) | 0.89 | % | 0.89 | % | 0.90 | % | 0.92 | % | 0.97 | %(j) | ||||||||||||||||||||
|
|
|
|
|
|
|
|
|
|
|
|
|
|||||||||||||||||||||
| Net investment income (loss) |
(0.48 | )%(j) | (0.43 | )% | (0.19 | )% | 0.02 | % | 0.15 | % | (0.24 | )%(j) | ||||||||||||||||||||
|
|
|
|
|
|
|
|
|
|
|
|
|
|||||||||||||||||||||
| Supplemental Data |
||||||||||||||||||||||||||||||||
| Net assets, end of period (000) |
$ | 729,670 | $ | 587,908 | $ | 620,300 | $ | 452,443 | $ | 443,477 | $ | 437,380 | ||||||||||||||||||||
|
|
|
|
|
|
|
|
|
|
|
|
|
|||||||||||||||||||||
| Portfolio turnover rate |
15 | % | 53 | % | 41 | % | 74 | % | 91 | % | 7 | % | ||||||||||||||||||||
|
|
|
|
|
|
|
|
|
|
|
|
|
|||||||||||||||||||||
| (a) | Commencement of investment operations. This information includes the initial investment by BlackRock HoldCo2, Inc. |
| (b) | Net asset value, beginning of period, reflects a deduction of $0.8975 per share sales charge from initial offering price of $20.00 per share. |
| (c) | Based on average shares outstanding. |
| (d) | Amount is less than $0.005 per share. |
| (e) | Distributions for annual periods determined in accordance with U.S. federal income tax regulations. |
| (f) | A portion of the distributions from net investment income may be deemed a return of capital or net realized gain at fiscal year end. |
| (g) | Amount is greater than $(0.005) per share. |
| (h) | Total returns based on market price, which can be significantly greater or less than the net asset value, may result in substantially different returns. Where applicable, excludes the effects of any sales charges and assumes the reinvestment of distributions at actual reinvestment prices. |
| (i) | Aggregate total return. |
| (j) | Annualized. |
| (k) | Amount previously presented incorrectly as solely distributions from net investment income has been revised to reflect the proper classification of distributions between net realized gain and net investment income. |
See notes to financial statements.
| FINANCIAL HIGHLIGHTS | 117 |
Financial Highlights (continued)
(For a share outstanding throughout each period)
| BSTZ | ||||
| Period from 06/27/19 (a) to 06/30/19 |
||||
| Net asset value, beginning of period |
$ | 20.00 | ||
|
|
|
|||
| Net investment income(b) |
0.00 | (c) | ||
| Net realized and unrealized gain |
0.09 | |||
|
|
|
|||
| Net increase from investment operations |
0.09 | |||
|
|
|
|||
| Net asset value, end of period |
$ | 20.09 | ||
|
|
|
|||
| Market price, end of period |
$ | 20.80 | ||
|
|
|
|||
| Total Return(d) |
| |||
| Based on net asset value |
0.45 | %(e) | ||
|
|
|
|||
| Based on market price |
4.00 | %(e) | ||
|
|
|
|||
| Ratios to Average Net Assets |
| |||
| Total expenses |
1.36 | %(f)(g) | ||
|
|
|
|||
| Total expenses after fees waived and/or reimbursed |
1.36 | %(f)(g) | ||
|
|
|
|||
| Net investment income |
0.83 | %(f)(g) | ||
|
|
|
|||
| Supplemental Data |
| |||
| Net assets, end of period (000) |
$ | 1,406,535 | ||
|
|
|
|||
| Portfolio turnover rate |
0 | % | ||
|
|
|
|||
| (a) | Commencement of operations. This information includes the initial investment by BlackRock HoldCo2, Inc. |
| (b) | Based on average shares outstanding. |
| (c) | Amount is less than $0.005 per share. |
| (d) | Total returns based on market price, which can be significantly greater or less than the net asset value, may result in substantially different returns. Where applicable, excludes the effects of any sales charges and assumes the reinvestment of distributions at actual reinvestment prices. |
| (e) | Aggregate total return. |
| (f) | Annualized. |
| (g) | Excludes expenses incurred indirectly as a result of investments in underlying funds of 0.15%. |
See notes to financial statements.
| 118 | 2019 BLACKROCK SEMI-ANNUAL REPORT TO SHAREHOLDERS |
Financial Highlights (continued)
(For a share outstanding throughout each period)
| BUI | ||||||||||||||||||||||||||||||||||||
| Six Months Ended 06/30/19 (unaudited) |
Year Ended December 31, | Period from 11/01/14 to 12/31/14 |
Year Ended 10/31/14 |
|||||||||||||||||||||||||||||||||
| 2018 | 2017 | 2016 | 2015 | |||||||||||||||||||||||||||||||||
| Net asset value, beginning of period |
$ | 18.77 | $ | 21.12 | $ | 19.42 | $ | 19.50 | $ | 22.47 | $ | 22.40 | $ | 20.78 | ||||||||||||||||||||||
|
|
|
|
|
|
|
|
|
|
|
|
|
|
|
|||||||||||||||||||||||
| Net investment income(a) |
0.26 | 0.49 | 0.56 | 0.56 | 0.47 | 0.11 | 0.51 | |||||||||||||||||||||||||||||
| Net realized and unrealized gain (loss) |
2.71 | (1.39 | ) | 2.59 | 0.81 | (1.99 | ) | 0.20 | 2.68 | |||||||||||||||||||||||||||
|
|
|
|
|
|
|
|
|
|
|
|
|
|
|
|||||||||||||||||||||||
| Net increase (decrease) from investment operations |
2.97 | (0.90 | ) | 3.15 | 1.37 | (1.52 | ) | 0.31 | 3.19 | |||||||||||||||||||||||||||
|
|
|
|
|
|
|
|
|
|
|
|
|
|
|
|||||||||||||||||||||||
| Distributions(b) |
||||||||||||||||||||||||||||||||||||
| From net investment income |
(0.73 | )(c) | (0.63 | )(g) | (0.47 | ) | (0.49 | ) | (0.42 | ) | (0.10 | ) | (0.51 | ) | ||||||||||||||||||||||
| From net realized gain |
— | (0.81 | )(g) | (0.98 | ) | (0.53 | ) | (0.54 | ) | — | (0.37 | ) | ||||||||||||||||||||||||
| From return of capital |
— | (0.01 | ) | — | (0.43 | ) | (0.49 | ) | (0.14 | ) | (0.69 | ) | ||||||||||||||||||||||||
|
|
|
|
|
|
|
|
|
|
|
|
|
|
|
|||||||||||||||||||||||
| Total distributions |
(0.73 | ) | (1.45 | ) | (1.45 | ) | (1.45 | ) | (1.45 | ) | (0.24 | ) | (1.57 | ) | ||||||||||||||||||||||
|
|
|
|
|
|
|
|
|
|
|
|
|
|
|
|||||||||||||||||||||||
| Net asset value, end of period |
$ | 21.01 | $ | 18.77 | $ | 21.12 | $ | 19.42 | $ | 19.50 | $ | 22.47 | $ | 22.40 | ||||||||||||||||||||||
|
|
|
|
|
|
|
|
|
|
|
|
|
|
|
|||||||||||||||||||||||
| Market price, end of period |
$ | 22.14 | $ | 19.76 | $ | 21.62 | $ | 18.41 | $ | 16.78 | $ | 20.74 | $ | 20.02 | ||||||||||||||||||||||
|
|
|
|
|
|
|
|
|
|
|
|
|
|
|
|||||||||||||||||||||||
| Total Return(d) |
||||||||||||||||||||||||||||||||||||
| Based on net asset value |
15.98 | %(e) | (4.40 | )% | 16.62 | % | 7.57 | % | (6.09 | )% | 1.50 | %(e) | 16.94 | % | ||||||||||||||||||||||
|
|
|
|
|
|
|
|
|
|
|
|
|
|
|
|||||||||||||||||||||||
| Based on market price |
16.09 | %(e) | (1.68 | )% | 25.93 | % | 18.50 | % | (12.45 | )% | 4.82 | %(e) | 18.29 | % | ||||||||||||||||||||||
|
|
|
|
|
|
|
|
|
|
|
|
|
|
|
|||||||||||||||||||||||
| Ratios to Average Net Assets |
||||||||||||||||||||||||||||||||||||
| Total expenses |
1.12 | %(f) | 1.12 | % | 1.11 | % | 1.13 | % | 1.11 | % | 1.17 | %(f) | 1.10 | % | ||||||||||||||||||||||
|
|
|
|
|
|
|
|
|
|
|
|
|
|
|
|||||||||||||||||||||||
| Total expenses after fees waived and/or reimbursed |
1.09 | %(f) | 1.09 | % | 1.09 | % | 1.13 | % | 1.11 | % | 1.11 | %(f) | 1.10 | % | ||||||||||||||||||||||
|
|
|
|
|
|
|
|
|
|
|
|
|
|
|
|||||||||||||||||||||||
| Net investment income |
2.55 | %(f) | 2.46 | % | 2.70 | % | 2.83 | % | 2.24 | % | 2.83 | %(f) | 2.36 | % | ||||||||||||||||||||||
|
|
|
|
|
|
|
|
|
|
|
|
|
|
|
|||||||||||||||||||||||
| Supplemental Data |
||||||||||||||||||||||||||||||||||||
| Net assets, end of period (000) |
$ | 357,730 | $ | 318,933 | $ | 357,776 | $ | 328,297 | $ | 329,747 | $ | 379,830 | $ | 378,762 | ||||||||||||||||||||||
|
|
|
|
|
|
|
|
|
|
|
|
|
|
|
|||||||||||||||||||||||
| Portfolio turnover rate |
24 | % | 28 | % | 31 | % | 8 | % | 20 | % | 2 | % | 41 | % | ||||||||||||||||||||||
|
|
|
|
|
|
|
|
|
|
|
|
|
|
|
|||||||||||||||||||||||
| (a) | Based on average shares outstanding. |
| (b) | Distributions for annual periods determined in accordance with U.S. federal income tax regulations. |
| (c) | A portion of the distributions from net investment income may be deemed a return of capital or net realized gain at fiscal year end. |
| (d) | Total returns based on market price, which can be significantly greater or less than the net asset value, may result in substantially different returns. Where applicable, excludes the effects of any sales charges and assumes the reinvestment of distributions at actual reinvestment prices. |
| (e) | Aggregate total return. |
| (f) | Annualized. |
| (g) | Amount previously presented incorrectly as solely distributions from net investment income has been revised to reflect the proper classification of distributions between net realized gain and net investment income. |
See notes to financial statements.
| FINANCIAL HIGHLIGHTS | 119 |
Notes to Financial Statements (unaudited)
| 1. | ORGANIZATION |
The following are registered under the Investment Company Act of 1940, as amended (the “1940 Act”), as closed-end management investment companies and are referred to herein collectively as the “Trusts”, or individually as a “Trust”:
| Trust Name | Herein Referred To As | Organized |
Diversification Classification | |||
| BlackRock Energy and Resources Trust |
BGR | Delaware | Non-diversified | |||
| BlackRock Enhanced Capital and Income Fund, Inc. |
CII | Maryland | Diversified | |||
| BlackRock Enhanced Equity Dividend Trust |
BDJ | Delaware | Diversified | |||
| BlackRock Enhanced Global Dividend Trust |
BOE | Delaware | Diversified | |||
| BlackRock Enhanced International Dividend Trust |
BGY | Delaware | Diversified | |||
| BlackRock Health Sciences Trust |
BME | Delaware | Diversified | |||
| BlackRock Resources & Commodities Strategy Trust |
BCX | Delaware | Non-diversified | |||
| BlackRock Science and Technology Trust |
BST | Delaware | Non-diversified | |||
| BlackRock Science and Technology Trust II* |
BSTZ | Delaware | Non-diversified | |||
| BlackRock Utilities, Infrastructure & Power Opportunities Trust |
BUI | Delaware | Diversified |
| * | Commenced operations on June 27, 2019. |
The Boards of Directors and Boards of Trustees of the Trusts are collectively referred to throughout this report as the “Board of Trustees” or the “Board,” and the directors/trustees thereof are collectively referred to throughout this report as “Trustees”. The Trusts determine and make available for publication the net asset values (“NAVs”) of their Common Shares on a daily basis.
The Trusts, together with certain other registered investment companies advised by BlackRock Advisors, LLC (the “Manager”) or its affiliates, are included in a complex of non-index fixed-income mutual funds and all BlackRock-advised closed-end funds referred to as the BlackRock Fixed-Income Complex.
Prior to commencement of operations on June 27, 2019, BSTZ had no operations other than those relating to organizational matters and the sale of 5,000 common shares on May 3, 2019 to BlackRock Financial Management, Inc., an affiliate of BSTZ, for $100,000. Investment operations for BSTZ commenced on June 27, 2019.
Basis of Consolidation: The accompanying consolidated financial statements of BCX include the account of BlackRock Cayman Resources & Commodities Strategy Fund, Ltd. (the “Subsidiary”), which is a wholly-owned subsidiary of BCX and primarily invests in commodity-related instruments. The Subsidiary enables BCX to hold these commodity-related instruments and satisfy regulated investment company tax requirements. BCX may invest up to 25% of its total assets in the Subsidiary. Intercompany accounts and transactions, if any, have been eliminated. During the six months ended June 30, 2019, there were no transactions in the Subsidiary. The Subsidiary is subject to the same investment policies and restrictions that apply to BCX, except that the Subsidiary may invest without limitation in commodity-related instruments.
| 2. | SIGNIFICANT ACCOUNTING POLICIES |
The financial statements are prepared in conformity with accounting principles generally accepted in the United States of America (“U.S. GAAP”), which may require management to make estimates and assumptions that affect the reported amounts of assets and liabilities in the financial statements, disclosure of contingent assets and liabilities at the date of the financial statements and the reported amounts of increases and decreases in net assets from operations during the reporting period. Actual results could differ from those estimates. Each Trust is considered an investment company under U.S. GAAP and follows the accounting and reporting guidance applicable to investment companies. Below is a summary of significant accounting policies:
Investment Transactions and Income Recognition: For financial reporting purposes, investment transactions are recorded on the dates the transactions are executed (the “trade dates”). Realized gains and losses on investment transactions are determined on the identified cost basis. Dividend income is recorded on the ex-dividend date. Dividends from foreign securities where the ex-dividend date may have passed are subsequently recorded when the Trusts are informed of the ex-dividend date. Under the applicable foreign tax laws, a withholding tax at various rates may be imposed on capital gains, dividends and interest. Interest income, including amortization and accretion of premiums and discounts on debt securities, are recognized on an accrual basis.
Foreign Currency Translation: Each Trust’s books and records are maintained in U.S. dollars. Securities and other assets and liabilities denominated in foreign currencies are translated into U.S. dollars using exchange rates determined as of the close of trading on the New York Stock Exchange (“NYSE”). Purchases and sales of investments are recorded at the rates of exchange prevailing on the respective dates of such transactions. Generally, when the U.S. dollar rises in value against a foreign currency, the investments denominated in that currency will lose value; the opposite effect occurs if the U.S. dollar falls in relative value.
Each Trust does not isolate the portion of the results of operations arising as a result of changes in the exchange rates from the changes in the market prices of investments held or sold for financial reporting purposes. Accordingly, the effects of changes in exchange rates on investments are not segregated in the Statements of Operations from the effects of changes in market prices of those investments, but are included as a component of net realized and unrealized gain (loss) from investments. Each Trust reports realized currency gains (losses) on foreign currency related transactions as components of net realized gain (loss) for financial reporting purposes, whereas such components are generally treated as ordinary income for U.S. federal income tax purposes.
Segregation and Collateralization: In cases where a Trust enters into certain investments (e.g., futures contracts, forward foreign currency exchange contracts and options written) that would be treated as “senior securities” for 1940 Act purposes, a Trust may segregate or designate on its books and records cash or liquid assets having a market value at least equal to the amount of its future obligations under such investments. Doing so allows the investment to be excluded from treatment as a “senior security.” Furthermore, if required by an exchange or counterparty agreement, the Trusts may be required to deliver/deposit cash and/or securities to/with an exchange, or broker-dealer or custodian as collateral for certain investments or obligations.
| 120 | 2019 BLACKROCK SEMI-ANNUAL REPORT TO SHAREHOLDERS |
Notes to Financial Statements (unaudited) (continued)
Distributions: Distributions paid by the Trusts are recorded on the ex-dividend date. Subject to the Trusts’ level distribution plan, the Trusts intend to make monthly cash distributions to shareholders, which may consist of net investment income, net options premium and net realized and unrealized gains on investments and/or return of capital.
The character of distributions is determined in accordance with U.S. federal income tax regulations, which may differ from U.S. GAAP. The portion of distributions that exceeds a Trust’s current and accumulated earnings and profits, which are measured on a tax basis, will constitute a non-taxable return of capital.
Net income and realized gains from investments held by the Subsidiary are treated as ordinary income for tax purposes. If a net loss is realized by the Subsidiary in any taxable year, the loss will generally not be available to offset BCX’s ordinary income and/or capital gains for that year.
Deferred Compensation Plan: Under the Deferred Compensation Plan (the “Plan”) approved by each Trust’s Board, the trustees who are not “interested persons” of the Trusts, as defined in the 1940 Act (“Independent Trustees”), may defer a portion of their annual complex-wide compensation. Deferred amounts earn an approximate return as though equivalent dollar amounts had been invested in common shares of certain funds in the BlackRock Fixed-Income Complex selected by the Independent Trustees. This has the same economic effect for the Independent Trustees as if the Independent Trustees had invested the deferred amounts directly in certain funds in the BlackRock Fixed-Income Complex.
The Plan is not funded and obligations thereunder represent general unsecured claims against the general assets of each Trust, as applicable. Deferred compensation liabilities are included in the Trustees’ and Officer’s fees payable in the Statements of Assets and Liabilities and will remain as a liability of the Trusts until such amounts are distributed in accordance with the Plan.
Organization and Offering Costs: Organization costs associated with the establishment of BSTZ and offering expenses of BSTZ with respect to the issuance of shares in the amounts of $140,500 and $1,353,100, respectively, were paid by the Manager. BSTZ is not obligated to repay any such organizational costs or offering expenses paid by the Manager.
Indemnifications: In the normal course of business, a Trust enters into contracts that contain a variety of representations that provide general indemnification. A Trust’s maximum exposure under these arrangements is unknown because it involves future potential claims against a Trust, which cannot be predicted with any certainty.
Other: Expenses directly related to a Trust are charged to that Trust. Other operating expenses shared by several funds, including other funds managed by the Manager, are prorated among those funds on the basis of relative net assets or other appropriate methods.
| 3. | INVESTMENT VALUATION AND FAIR VALUE MEASUREMENTS |
Investment Valuation Policies: The Trusts’ investments are valued at fair value (also referred to as “market value” within the financial statements) as of the close of trading on the NYSE (generally 4:00 p.m., Eastern time) (or if the reporting date falls on a day the NYSE is closed, investments are valued at fair value as of the period end). U.S. GAAP defines fair value as the price the Trusts would receive to sell an asset or pay to transfer a liability in an orderly transaction between market participants at the measurement date. The Trusts determine the fair values of their financial instruments using various independent dealers or pricing services under policies approved by the Board. The BlackRock Global Valuation Methodologies Committee (the “Global Valuation Committee”) is the committee formed by management to develop global pricing policies and procedures and to oversee the pricing function for all financial instruments.
Fair Value Inputs and Methodologies: The following methods and inputs are used to establish the fair value of each Trust’s assets and liabilities:
| • | Equity investments traded on a recognized securities exchange are valued at the official closing price each day, if available. For equity investments traded on more than one exchange, the official closing price on the exchange where the stock is primarily traded is used. Equity investments traded on a recognized exchange for which there were no sales on that day may be valued at the last available bid (long positions) or ask (short positions) price. |
Generally, trading in foreign instruments is substantially completed each day at various times prior to the close of trading on the NYSE. Occasionally, events affecting the values of such instruments may occur between the foreign market close and the close of trading on the NYSE that may not be reflected in the computation of the Trusts’ net assets. Each business day, the Trusts use a pricing service to assist with the valuation of certain foreign exchange-traded equity securities and foreign exchange-traded and over-the-counter (“OTC”) options (the “Systematic Fair Value Price”). Using current market factors, the Systematic Fair Value Price is designed to value such foreign securities and foreign options at fair value as of the close of trading on the NYSE, which follows the close of the local markets.
| • | Fixed-income securities for which market quotations are readily available are generally valued using the last available bid prices or current market quotations provided by independent dealers or third party pricing services. Floating rate loan interests are valued at the mean of the bid prices from one or more independent brokers or dealers as obtained from a third party pricing service. Pricing services generally value fixed-income securities assuming orderly transactions of an institutional round lot size, but a fund may hold or transact in such securities in smaller, odd lot sizes. Odd lots may trade at lower prices than institutional round lots. The pricing services may use matrix pricing or valuation models that utilize certain inputs and assumptions to derive values, including transaction data (e.g., recent representative bids and offers), credit quality information, perceived market movements, news, and other relevant information. Certain fixed-income securities, including asset-backed and mortgage related securities may be valued based on valuation models that consider the estimated cash flows of each tranche of the entity, establish a benchmark yield and develop an estimated tranche specific spread to the benchmark yield based on the unique attributes of the tranche. The amortized cost method of valuation may be used with respect to debt obligations with sixty days or less remaining to maturity unless the Manager determines such method does not represent fair value. |
| • | Investments in open-end U.S. mutual funds are valued at NAV each business day. |
| NOTES TO FINANCIAL STATEMENTS | 121 |
Notes to Financial Statements (unaudited) (continued)
| • | The Trusts value their investment in SL Liquidity Series, LLC, Money Market Series (the “Money Market Series”) at fair value, which is ordinarily based upon their pro rata ownership in the underlying fund’s net assets. The Money Market Series seeks current income consistent with maintaining liquidity and preserving capital. Although the Money Market Series is not registered under the 1940 Act, its investments may follow the parameters of investments by a money market fund that is subject to Rule 2a-7 under the 1940 Act. |
| • | Exchange-traded options are valued at the mean between the last bid and ask prices at the close of the options market in which the options trade. An exchange-traded option for which there is no mean price is valued at the last bid (long positions) or ask (short positions) price. If no bid or ask price is available, the prior day’s price will be used, unless it is determined that the prior day’s price no longer reflects the fair value of the option. OTC options are valued by an independent pricing service using a mathematical model, which incorporates a number of market data factors, such as the trades and prices of the underlying instruments. |
If events (e.g., a company announcement, market volatility or a natural disaster) occur that are expected to materially affect the value of such investments, or in the event that the application of these methods of valuation results in a price for an investment that is deemed not to be representative of the market value of such investment, or if a price is not available, the investment will be valued by the Global Valuation Committee, or its delegate, in accordance with a policy approved by the Board as reflecting fair value (“Fair Valued Investments”). The fair valuation approaches that may be used by the Global Valuation Committee will include market approach, income approach and cost approach. Valuation techniques such as discounted cash flow, use of market comparables and matrix pricing are types of valuation approaches and are typically used in determining fair value. When determining the price for Fair Valued Investments, the Global Valuation Committee, or its delegate, seeks to determine the price that each Trust might reasonably expect to receive or pay from the current sale or purchase of that asset or liability in an arm’s-length transaction. Fair value determinations shall be based upon all available factors that the Global Valuation Committee, or its delegate, deems relevant and consistent with the principles of fair value measurement. The pricing of all Fair Valued Investments is subsequently reported to the Board or a committee thereof on a quarterly basis.
For investments in equity or debt issued by privately held companies or funds (“Private Company” or collectively, the “Private Companies”) and other Fair Valued Investments, the fair valuation approaches that are used by third party pricing services utilize one or a combination of, but not limited to, the following inputs.
| Standard Inputs Generally Considered By Third Party Pricing Services | ||
| Market approach |
(i) recent market transactions, including subsequent rounds of financing, in the underlying investment or comparable issuers; (ii) recapitalizations and other transactions across the capital structure; and (iii) market multiples of comparable issuers. | |
| Income approach |
(i) future cash flows discounted to present and adjusted as appropriate for liquidity, credit, and/or market risks; (ii) quoted prices for similar investments or assets in active markets; and (iii) other risk factors, such as interest rates, yield curves, volatilities, prepayment speeds, loss severities, credit risks, recovery rates, liquidation amounts and/or default rates. | |
| Cost approach |
(i) audited or unaudited financial statements, investor communications and financial or operational metrics issued by the Private Company; (ii) changes in the valuation of relevant indices or publicly traded companies comparable to the Private Company; (iii) relevant news and other public sources; and (iv) known secondary market transactions in the Private Company’s interests and merger or acquisition activity in companies comparable to the Private Company. |
Investments in series of preferred stock issued by Private Companies are typically valued utilizing market approach in determining the enterprise value of the company. Such investments often contain rights and preferences that differ from other series of preferred and common stock of the same issuer. Valuation techniques such as an option pricing model (“OPM”), a probability weighted expected return model (“PWERM”) or a hybrid of those techniques are used in allocating enterprise value of the company, as deemed appropriate under the circumstances. The use of OPM and PWERM techniques involve a determination of the exit scenarios of the investment in order to appropriately allocate the enterprise value of the company among the various parts of its capital structure.
The Private Companies are not subject to the public company disclosure, timing, and reporting standards as other investments held by a Trust. Typically, the most recently available information by a Private Company is as of a date that is earlier than the date a Trust is calculating its NAV. This factor may result in a difference between the value of the investment and the price a Trust could receive upon the sale of the investment.
Fair Value Hierarchy: Various inputs are used in determining the fair value of investments and derivative financial instruments. These inputs to valuation techniques are categorized into a fair value hierarchy consisting of three broad levels for financial statement purposes as follows:
| • | Level 1 — Unadjusted price quotations in active markets/exchanges for identical assets or liabilities that each Trust has the ability to access |
| • | Level 2 — Other observable inputs (including, but not limited to, quoted prices for similar assets or liabilities in markets that are active, quoted prices for identical or similar assets or liabilities in markets that are not active, inputs other than quoted prices that are observable for the assets or liabilities (such as interest rates, yield curves, volatilities, prepayment speeds, loss severities, credit risks and default rates) or other market-corroborated inputs) |
| • | Level 3 — Unobservable inputs based on the best information available in the circumstances, to the extent observable inputs are not available (including each Trust’s own assumptions used in determining the fair value of investments and derivative financial instruments) |
The hierarchy gives the highest priority to unadjusted quoted prices in active markets for identical assets or liabilities (Level 1 measurements) and the lowest priority to unobservable inputs (Level 3 measurements). Accordingly, the degree of judgment exercised in determining fair value is greatest for instruments categorized in Level 3. The inputs used to measure fair value may fall into different levels of the fair value hierarchy. In such cases, for disclosure purposes, the fair value hierarchy classification is determined based on the lowest level input that is significant to the fair value measurement in its entirety. Investments classified within Level 3 have significant unobservable inputs used by the Global Valuation Committee in determining the price for Fair Valued Investments. Level 3 investments include equity or debt issued by
| 122 | 2019 BLACKROCK SEMI-ANNUAL REPORT TO SHAREHOLDERS |
Notes to Financial Statements (unaudited) (continued)
Private Companies. There may not be a secondary market, and/or there are a limited number of investors. The categorization of a value determined for investments and derivative financial instruments is based on the pricing transparency of the investments and derivative financial instruments and is not necessarily an indication of the risks associated with investing in those securities.
As of June 30, 2019, certain investments of BME, BCX and BST were valued using NAV or its equivalent as no quoted market value is available and therefore have been excluded from the fair value hierarchy.
| 4. | SECURITIES AND OTHER INVESTMENTS |
Preferred Stocks: Preferred stock has a preference over common stock in liquidation (and generally in receiving dividends as well), but is subordinated to the liabilities of the issuer in all respects. As a general rule, the market value of preferred stock with a fixed dividend rate and no conversion element varies inversely with interest rates and perceived credit risk, while the market price of convertible preferred stock generally also reflects some element of conversion value. Because preferred stock is junior to debt securities and other obligations of the issuer, deterioration in the credit quality of the issuer will cause greater changes in the value of a preferred stock than in a more senior debt security with similar stated yield characteristics. Unlike interest payments on debt securities, preferred stock dividends are payable only if declared by the issuer’s board of directors. Preferred stock also may be subject to optional or mandatory redemption provisions.
Securities Lending: Certain Trusts may lend their securities to approved borrowers, such as brokers, dealers and other financial institutions. The borrower pledges and maintains with the Trusts collateral consisting of cash, an irrevocable letter of credit issued by a bank, or securities issued or guaranteed by the U.S. Government. The initial collateral received by each Trust is required to have a value of at least 102% of the current value of the loaned securities for securities traded on U.S. exchanges and a value of at least 105% for all other securities. The collateral is maintained thereafter at a value equal to at least 100% of the current market value of the securities on loan. The market value of the loaned securities is determined at the close of each business day of the Trust and any additional required collateral is delivered to the Trust, or excess collateral returned by the Trust, on the next business day. During the term of the loan, the Trusts are entitled to all distributions made on or in respect of the loaned securities, but do not receive interest income on securities received as collateral. Loans of securities are terminable at any time and the borrower, after notice, is required to return borrowed securities within the standard time period for settlement of securities transactions.
The market value of any securities on loan, all of which were classified as common stocks in the Trusts’ Schedules of Investments, and the value of any related collateral are shown separately in the Statements of Assets and Liabilities as a component of investments at value-unaffiliated, and collateral on securities loaned at value, respectively. As of period end, any securities on loan were collateralized by cash and/or U.S. Government obligations. Cash collateral invested by the securities lending agent, BlackRock Investment Management, LLC (“BIM”), if any, is disclosed in the Schedules of Investments.
Securities lending transactions are entered into by the Trusts under Master Securities Lending Agreements (each, an “MSLA”), which provide the right, in the event of default (including bankruptcy or insolvency), for the non-defaulting party to liquidate the collateral and calculate a net exposure to the defaulting party or request additional collateral. In the event that a borrower defaults, the Trusts, as lender, would offset the market value of the collateral received against the market value of the securities loaned. When the value of the collateral is greater than that of the market value of the securities loaned, the lender is left with a net amount payable to the defaulting party. However, bankruptcy or insolvency laws of a particular jurisdiction may impose restrictions on or prohibitions against such a right of offset in the event of an MSLA counterparty’s bankruptcy or insolvency. Under the MSLA, absent an event of default, the borrower can resell or re-pledge the loaned securities, and a Trust can reinvest cash collateral received in connection with loaned securities. Upon an event of default, the parties’ obligations to return the securities or collateral to the other party are extinguished, and the parties can resell or re-pledge the loaned securities or the collateral received in connection with the loaned securities in order to satisfy the defaulting party’s net payment obligation for all transactions under the MSLA. The defaulting party remains liable for any deficiency.
As of period end, the following tables are a summary of the Trusts’ securities lending agreements by counterparty which are subject to offset under an MSLA:
| Counterparty | Securities Loaned at Value |
Cash Collateral Received (a) |
Net Amount |
|||||||||
| BME |
||||||||||||
| Barclays Bank PLC |
$ | 80,580 | $ | (80,580 | ) | $ | — | |||||
| Goldman Sachs & Co. |
73,349 | (73,349 | ) | — | ||||||||
| Jefferies & Co. |
138,900 | (138,900 | ) | — | ||||||||
| Societe Generale |
27,027 | (27,027 | ) | — | ||||||||
|
|
|
|
|
|
|
|||||||
| $ | 319,856 | $ | (319,856 | ) | $ | — | ||||||
|
|
|
|
|
|
|
|||||||
| BCX |
||||||||||||
| Goldman Sachs & Co. |
$ | 426,064 | $ | (426,064 | ) | $ | — | |||||
| Merrill Lynch, Pierce, Fenner & Smith Inc. |
11 | (11 | ) | — | ||||||||
| Morgan Stanley & Co. LLC |
3 | (3 | ) | — | ||||||||
|
|
|
|
|
|
|
|||||||
| $ | 426,078 | $ | (426,078 | ) | $ | — | ||||||
|
|
|
|
|
|
|
|||||||
| BST |
||||||||||||
| Credit Suisse Securities (USA) LLC |
$ | 533,936 | $ | (533,936 | ) | $ | — | |||||
| Goldman Sachs & Co. |
1,305,830 | (1,305,830 | ) | — | ||||||||
| Merrill Lynch, Pierce, Fenner & Smith Inc |
456,653 | (456,653 | ) | — | ||||||||
|
|
|
|
|
|
|
|||||||
| $ | 2,296,419 | $ | (2,296,419 | ) | $ | — | ||||||
|
|
|
|
|
|
|
|||||||
| (a) | Cash collateral with a value of $328,908, $478,185 and $2,292,285 for BME, BCX and BST, respectively, has been received in connection with securities lending agreements. Collateral received in excess of the value of securities loaned from the individual counterparty is not shown for financial reporting purposes in the table above. |
| NOTES TO FINANCIAL STATEMENTS | 123 |
Notes to Financial Statements (unaudited) (continued)
The risks of securities lending include the risk that the borrower may not provide additional collateral when required or may not return the securities when due. To mitigate these risks, the Trusts benefit from a borrower default indemnity provided by BIM. BIM’s indemnity allows for full replacement of the securities loaned if the collateral received does not cover the value on the securities loaned in the event of borrower default. Each Trust could incur a loss if the value of an investment purchased with cash collateral falls below the market value of loaned securities or if the value of an investment purchased with cash collateral falls below the value of the original cash collateral received.
| 5. | DERIVATIVE FINANCIAL INSTRUMENTS |
The Trusts engage in various portfolio investment strategies using derivative contracts both to increase the returns of the Trusts and/or to manage their exposure to certain risks such as credit risk, equity risk, interest rate risk, foreign currency exchange rate risk, commodity price risk or other risks (e.g., inflation risk). Derivative financial instruments categorized by risk exposure are included in the Schedules of Investments. These contracts may be transacted on an exchange or OTC.
Options: Certain Trusts purchase and write call and put options to increase or decrease their exposure to the risks of underlying instruments, including equity risk, interest rate risk and/or commodity price risk and/or, in the case of options written, to generate gains from options premiums.
A call option gives the purchaser (holder) of the option the right (but not the obligation) to buy, and obligates the seller (writer) to sell (when the option is exercised) the underlying instrument at the exercise or strike price at any time or at a specified time during the option period. A put option gives the holder the right to sell and obligates the writer to buy the underlying instrument at the exercise or strike price at any time or at a specified time during the option period.
Premiums paid on options purchased and premiums received on options written, as well as the daily fluctuation in market value, are included in investments at value — unaffiliated and options written at value, respectively, in the Statements of Assets and Liabilities. When an instrument is purchased or sold through the exercise of an option, the premium is offset against the cost or proceeds of the underlying instrument. When an option expires, a realized gain or loss is recorded in the Statements of Operations to the extent of the premiums received or paid. When an option is closed or sold, a gain or loss is recorded in the Statements of Operations to the extent the cost of the closing transaction exceeds the premiums received or paid. When the Trusts write a call option, such option is typically “covered,” meaning that they hold the underlying instrument subject to being called by the option counterparty. When the Trusts write a put option, such option is covered by cash in an amount sufficient to cover the obligation. These amounts, which are considered restricted, are included in cash pledged as collateral for options written in the Statements of Assets and Liabilities.
In purchasing and writing options, the Trusts bear the risk of an unfavorable change in the value of the underlying instrument or the risk that they may not be able to enter into a closing transaction due to an illiquid market. Exercise of a written option could result in the Trusts purchasing or selling a security when they otherwise would not, or at a price different from the current market value.
Master Netting Arrangements: In order to define their contractual rights and to secure rights that will help them mitigate their counterparty risk, the Trusts may enter into an International Swaps and Derivatives Association, Inc. Master Agreement (“ISDA Master Agreement”) or similar agreement with their counterparties. An ISDA Master Agreement is a bilateral agreement between each Trust and a counterparty that governs certain OTC derivatives and typically contains, among other things, collateral posting terms and netting provisions in the event of a default and/or termination event. Under an ISDA Master Agreement, each Trust may, under certain circumstances, offset with the counterparty certain derivative financial instruments’ payables and/or receivables with collateral held and/or posted and create one single net payment. The provisions of the ISDA Master Agreement typically permit a single net payment in the event of default including the bankruptcy or insolvency of the counterparty. Bankruptcy or insolvency laws of a particular jurisdiction may restrict or prohibit the right of offset in bankruptcy, insolvency or other events.
Collateral Requirements: For derivatives traded under an ISDA Master Agreement, the collateral requirements are typically calculated by netting the mark-to-market amount for each transaction under such agreement and comparing that amount to the value of any collateral currently pledged by the Trusts and the counterparty.
Cash collateral that has been pledged to cover obligations of the Trusts and cash collateral received from the counterparty, if any, is reported separately on the Statements of Assets and Liabilities as cash pledged as collateral and cash received as collateral, respectively. Non-cash collateral pledged by the Trusts, if any, is noted in the Schedules of Investments. Generally, the amount of collateral due from or to a counterparty is subject to a certain minimum transfer amount threshold before a transfer is required, which is determined at the close of business of the Trusts. Any additional required collateral is delivered to/pledged by the Trusts on the next business day. Typically, the counterparty is not permitted to sell, re-pledge or use cash and non-cash collateral it receives. A Trust generally agrees not to use non-cash collateral that it receives but may, absent default or certain other circumstances defined in the underlying ISDA Master Agreement, be permitted to use cash collateral received. In such cases, interest may be paid pursuant to the collateral arrangement with the counterparty. To the extent amounts due to the Trusts from their counterparties are not fully collateralized, they bear the risk of loss from counterparty non-performance. Likewise, to the extent the Trusts have delivered collateral to a counterparty and stand ready to perform under the terms of their agreement with such counterparty, they bear the risk of loss from a counterparty in the amount of the value of the collateral in the event the counterparty fails to return such collateral. Based on the terms of agreements, collateral may not be required for all derivative contracts.
For financial reporting purposes, the Trusts do not offset derivative assets and derivative liabilities that are subject to netting arrangements, if any, in the Statements of Assets and Liabilities.
| 6. | INVESTMENT ADVISORY AGREEMENT AND OTHER TRANSACTIONS WITH AFFILIATES |
Investment Advisory: Each Trust entered into an Investment Advisory Agreement with the Manager, the Trusts’ investment adviser and an indirect, wholly-owned subsidiary of BlackRock Inc. (“BlackRock”), to provide investment advisory and administrative services. The Manager is responsible for the management of each Trust’s portfolio and provides the personnel, facilities, equipment and certain other services necessary to the operations of each Trust.
| 124 | 2019 BLACKROCK SEMI-ANNUAL REPORT TO SHAREHOLDERS |
Notes to Financial Statements (unaudited) (continued)
For such services, each Trust, except BCX, BST and BSTZ, pays the Manager a monthly fee at the following annual rates:
| Average weekly value of each Trust’s net assets: |
| |||
| BGR |
1.20 | % | ||
| BDJ |
0.80 | |||
| BOE |
1.00 | |||
| BME |
1.00 | |||
| Average daily value of each Trust’s net assets: |
| |||
| CII |
0.85 | % | ||
| BGY |
1.00 | |||
| BUI |
1.00 | |||
For such services, BCX pays the Manager a monthly fee of 1.00% of the sum of the average daily value of the net assets of the Trust (excluding the value of the Trust’s interest in the Subsidiary) and the average daily value of the net assets of the Subsidiary, which fee is allocated pro rata between the Trust and the Subsidiary based on the average daily value of their respective net assets (excluding, in the case of the Trust, the value of the Trust’s interest in the Subsidiary).
For such services, BST and BSTZ pay the Manager a monthly fee at an annual rate equal to 1.00% and 1.25%, respectively, of the average daily value of the Trusts’ managed assets. For purposes of calculating these fees, “managed assets” means the total assets of the Trusts (including any assets attributable to money borrowed for investment purposes) minus the sum of its accrued liabilities (other than money borrowed for investment purposes).
With respect to BGR, BOE, BGY, BCX and BUI, the Manager entered into separate sub-advisory agreements with BlackRock International Limited (“BIL”), an affiliate of the Manager. The Manager pays BIL for services it provides, a monthly fee that is equal to a percentage of the investment advisory fees paid by each Trust to the Manager.
The Manager provides investment management and other services to BCX’s Subsidiary. The Manager does not receive separate compensation from the Subsidiary for providing investment management or administrative services. However, BCX pays the Manager based on the Trust’s net assets which includes the assets of the Subsidiary.
Distribution Fees: BME has entered into a Distribution Agreement with BlackRock Investments, LLC (“BRIL”), an affiliate of the Manager, to provide for distribution of BME common shares on a reasonable best efforts basis through an equity shelf offering (a “Shelf Offering”) (the “Distribution Agreement”). Pursuant to the Distribution Agreement, BME will compensate BRIL with respect to sales of common shares at a commission rate of 1.00% of the gross proceeds of the sale of BME’s common shares and a portion of such commission is re-allowed to broker-dealers engaged by BRIL. The commissions retained by BRIL during the period ended June 30, 2019 amounted to $49,636.
Expense Limitations, Waivers and Reimbursements: The Manager has contractually agreed to waive a portion of the investment advisory fees on BST as a percentage of its average daily managed assets as follows:
| Expiration Date | ||||||||
| BST |
0.15 | % | December 31, 2019 | |||||
| 0.10 | December 31, 2020 | |||||||
| 0.05 | December 31, 2021 | |||||||
The Manager voluntarily agreed to waive a portion of the investment advisory fees on the following Trusts as a percentage of their average weekly net assets, except BUI and BGY, which is average daily net assets, as follows:
| BGR |
0.150 | % | ||
| BOE |
0.175 | |||
| BUI |
0.025 | |||
| BGY |
0.100 |
These voluntary waivers may be reduced or discontinued at any time without notice.
For the six months ended June 30, 2019, the investment advisory fees waived, which are included in fees waived and/or reimbursed by the Manager in the Statements of Operations, were as follows:
| BGR |
$ | 291,665 | ||
| BOE |
688,324 | |||
| BGY |
326,321 | |||
| BST |
511,216 | |||
| BUI |
42,653 |
| NOTES TO FINANCIAL STATEMENTS | 125 |
Notes to Financial Statements (unaudited) (continued)
With respect to each Trust, the Manager voluntarily agreed to waive its investment advisory fees by the amount of investment advisory fees each Trust pays to the Manager indirectly through its investment in affiliated money market funds (the “affiliated money market fund waiver”). These amounts are included in fees waived and/or reimbursed by the Manager in the Statements of Operations. For the six months ended June 30, 2019, the amounts waived were as follows:
| Amount Waived | ||||
| BGR |
$ | 2,669 | ||
| CII |
1,554 | |||
| BDJ |
8,369 | |||
| BOE |
2,277 | |||
| BGY |
3,848 | |||
| BME |
6,248 | |||
| BCX |
5,244 | |||
| BST |
789 | |||
| BSTZ |
— | |||
| BUI |
2,532 | |||
The Manager contractually agreed to waive its investment advisory fee with respect to any portion of each Trust’s assets invested in affiliated equity and fixed-income mutual funds and affiliated exchange-traded funds that have a contractual management fee through June 30, 2020. The agreement can be renewed for annual periods thereafter, and may be terminated on 90 days’ notice, each subject to approval by a majority of the Trusts’ Independent Trustees. For the six months ended June 30, 2019, there were no fees waived and/or reimbursed by the Manager.
Securities Lending: The U.S. Securities and Exchange Commission (“SEC”) has issued an exemptive order which permits BIM, an affiliate of the Manager, to serve as securities lending agent for the Trusts, subject to applicable conditions. As securities lending agent, BIM bears all operational costs directly related to securities lending. The Trusts are responsible for expenses in connection with the investment of cash collateral received for securities on loan (the “collateral investment expenses”). The cash collateral is invested in a private investment company managed by the Manager or its affiliates. However, BIM has agreed to cap the collateral investment expenses of the private investment company to an annual rate of 0.04%. The investment adviser to the private investment company will not charge any advisory fees with respect to shares purchased by the Trusts. The private investment company in which the cash collateral has been invested may, under certain circumstances, impose a liquidity fee of up to 2% of the value withdrawn or temporarily restrict withdrawals for up to 10 business days during a 90 day period, in the event that the private investment company’s weekly liquid assets fall below certain thresholds.
Securities lending income is equal to the total of income earned from the reinvestment of cash collateral, net of fees and other payments to and from borrowers of securities, and less the collateral investment expenses. Each Trust retains a portion of securities lending income and remits a remaining portion to BIM as compensation for its services as securities lending agent.
Pursuant to the current securities lending agreement, BIM may lend securities only when the difference between the borrower rebate rate and the risk free rate exceeds a certain level (such securities, the “specials only securities”). Each Trust retains 82% of securities lending income (which excludes collateral investment expenses).
In addition, commencing the business day following the date that the aggregate securities lending income earned across the BlackRock Fixed-Income Complex in a calendar year exceeds a specified threshold, each Trust, pursuant to the securities lending agreement, will retain for the remainder of that calendar year securities lending income (which excludes collateral investment expenses) in an amount equal to 85% of securities lending income.
Prior to January 1, 2019, each Trust (other than BSTZ, which commenced operations after such date) retained 80% of securities lending income (which excluded collateral investment expenses). In addition, commencing the business day following the date that the aggregate securities lending income earned across a complex of closed-end funds referred to as the Closed-End Complex in a calendar year exceeded a specified threshold, the Fund would retain for the remainder of that calendar year 85% of securities lending income (which excluded collateral investment expenses).
The share of securities lending income earned by each Trust is shown as securities lending income — affiliated — net in the Statements of Operations. For the six months ended June 30, 2019, each Trust paid BIM the following amounts for securities lending agent services:
| BME |
$ | 9,727 | ||
| BCX |
5,422 | |||
| BST |
46,168 |
Trustees and Officers: Certain trustees and/or officers of the Trusts are trustees and/or officers of BlackRock or its affiliates. The Trusts reimburse the Manager for a portion of the compensation paid to the Trusts’ Chief Compliance Officer, which is included in Trustees and Officer in the Statements of Operations.
| 126 | 2019 BLACKROCK SEMI-ANNUAL REPORT TO SHAREHOLDERS |
Notes to Financial Statements (unaudited) (continued)
| 7. | PURCHASES AND SALES |
For the six months ended June 30, 2019, purchases and sales of investments, excluding short-term securities, were as follows:
| Purchases | Sales | |||||||
| BGR |
$ | 41,285,086 | $ | 53,083,521 | ||||
| CII |
123,468,353 | 145,835,323 | ||||||
| BDJ |
397,711,347 | 445,195,543 | ||||||
| BOE |
103,331,719 | 126,523,993 | ||||||
| BGY |
87,682,649 | 93,599,383 | ||||||
| BME |
114,385,733 | 91,391,207 | ||||||
| BCX |
343,978,459 | 361,402,762 | ||||||
| BST |
103,082,519 | 150,395,894 | ||||||
| BSTZ |
63,658,837 | — | ||||||
| BUI |
80,179,469 | 92,939,927 | ||||||
| 8. | INCOME TAX INFORMATION |
It is each Trust’s policy to comply with the requirements of the Internal Revenue Code of 1986, as amended, applicable to regulated investment companies, and to distribute substantially all of its taxable income to its shareholders. Therefore, no U.S. federal income tax provision is required.
Each Trust files U.S. federal and various state and local tax returns. No income tax returns are currently under examination. The statute of limitations on each Trust’s U.S. federal tax returns generally remains open for each of the four years ended December 31, 2018. The statutes of limitations on each Trust’s state and local tax returns may remain open for an additional year depending upon the jurisdiction.
Management has analyzed tax laws and regulations and their application to the Trusts as of June 30, 2019, inclusive of the open tax return years, and does not believe that there are any uncertain tax positions that require recognition of a tax liability in the Trusts’ financial statements.
As of December 31, 2018, the Trusts had non-expiring capital loss carryforwards available to offset future realized capital gains as follows:
| BGR | BCX | |||||||
| No expiration date |
$ | 158,185,500 | $ | 402,068,922 | ||||
As of June 30, 2019, gross unrealized appreciation and depreciation for investments and derivatives based on cost for U.S. federal income tax purposes were as follows:
| BGR | CII | BDJ | BOE | BGY | ||||||||||||||||
| Tax cost |
$ | 398,523,371 | $ | 576,410,148 | $ | 1,465,478,304 | $ | 776,549,840 | $ | 655,701,879 | ||||||||||
|
|
|
|
|
|
|
|
|
|
|
|||||||||||
| Gross unrealized appreciation |
$ | 38,762,818 | $ | 184,753,989 | $ | 427,770,580 | $ | 87,380,285 | $ | 67,730,473 | ||||||||||
| Gross unrealized depreciation |
(43,456,452 | ) | (15,548,233 | ) | (71,373,604 | ) | (65,687,454 | ) | (58,574,956 | ) | ||||||||||
|
|
|
|
|
|
|
|
|
|
|
|||||||||||
| Net unrealized appreciation (depreciation) |
$ | (4,693,634 | ) | $ | 169,205,756 | $ | 356,396,976 | $ | 21,692,831 | $ | 9,155,517 | |||||||||
|
|
|
|
|
|
|
|
|
|
|
|||||||||||
| BME | BCX | BST | BSTZ | BUI | ||||||||||||||||
| Tax cost |
$ | 274,141,243 | $ | 802,087,789 | $ | 375,675,726 | $ | 1,563,468,755 | $ | 264,946,150 | ||||||||||
|
|
|
|
|
|
|
|
|
|
|
|||||||||||
| Gross unrealized appreciation |
$ | 132,362,931 | $ | 129,344,321 | $ | 371,283,435 | $ | 6,947,038 | $ | 99,657,728 | ||||||||||
| Gross unrealized depreciation |
(4,552,909 | ) | (61,144,157 | ) | (8,878,128 | ) | (581,017 | ) | (6,321,403 | ) | ||||||||||
|
|
|
|
|
|
|
|
|
|
|
|||||||||||
| Net unrealized appreciation |
$ | 127,810,022 | $ | 68,200,164 | $ | 362,405,307 | $ | 6,366,021 | $ | 93,336,325 | ||||||||||
|
|
|
|
|
|
|
|
|
|
|
|||||||||||
| 9. | PRINCIPAL RISKS |
In the normal course of business, certain Trusts invest in securities or other instruments and may enter into certain transactions, and such activities subject each Trust to various risks, including among others, fluctuations in the market (market risk) or failure of an issuer to meet all of its obligations. The value of securities or other instruments may also be affected by various factors, including, without limitation: (i) the general economy; (ii) the overall market as well as local, regional or global political and/or social instability; (iii) regulation, taxation or international tax treaties between various countries; or (iv) currency, interest rate and price fluctuations.
The Trusts may be exposed to additional risks when reinvesting cash collateral in money market funds that do not seek to maintain a stable NAV per share of $1.00, which may be subject to redemption gates or liquidity fees under certain circumstances.
Valuation Risk: The market values of equities, such as common stocks and preferred securities or equity related investments, such as futures and options, may decline due to general market conditions which are not specifically related to a particular company. They may also decline due to factors which affect a particular industry or industries. A Trust may invest in illiquid investments. An illiquid investment is any investment that a Trust reasonably expects cannot be sold or disposed of in current market conditions in seven calendar days or less without the sale or disposition significantly changing the market value of the investment. A Trust may experience difficulty in selling illiquid investments in a timely manner at the price that they believe the investments are worth. Prices may fluctuate widely over short or extended periods in response to company, market or economic news. Markets also tend to move in cycles, with periods of rising and falling prices. This volatility may cause each Trust’s NAV
| NOTES TO FINANCIAL STATEMENTS | 127 |
Notes to Financial Statements (unaudited) (continued)
to experience significant increases or decreases over short periods of time. If there is a general decline in the securities and other markets, the NAV of a Trust may lose value, regardless of the individual results of the securities and other instruments in which a Trust invests.
The price a Trust could receive upon the sale of any particular portfolio investment may differ from a Trust’s valuation of the investment, particularly for securities that trade in thin or volatile markets or that are valued using a fair valuation technique or a price provided by an independent pricing service. Changes to significant unobservable inputs and assumptions (i.e., publicly traded company multiples, growth rate, time to exit) due to the lack of observable inputs may significantly impact the resulting fair value and therefore a Trust’s results of operations. As a result, the price received upon the sale of an investment may be less than the value ascribed by a Trust, and a Trust could realize a greater than expected loss or lesser than expected gain upon the sale of the investment. A Trust’s ability to value its investments may also be impacted by technological issues and/or errors by pricing services or other third party service providers.
Counterparty Credit Risk: The Trusts may be exposed to counterparty credit risk, or the risk that an entity may fail to or be unable to perform on its commitments related to unsettled or open transactions. The Trusts manage counterparty credit risk by entering into transactions only with counterparties that the Manager believes have the financial resources to honor their obligations and by monitoring the financial stability of those counterparties. Financial assets, which potentially expose the Trusts to market, issuer and counterparty credit risks, consist principally of financial instruments and receivables due from counterparties. The extent of the Trusts’ exposure to market, issuer and counterparty credit risks with respect to these financial assets is approximately their value recorded in the Statements of Assets and Liabilities, less any collateral held by the Trusts.
A derivative contract may suffer a mark-to-market loss if the value of the contract decreases due to an unfavorable change in the market rates or values of the underlying instrument. Losses can also occur if the counterparty does not perform under the contract.
A Trust’s risk of loss from counterparty credit risk on OTC derivatives is generally limited to the aggregate unrealized gain less the value of any collateral held by such Trust.
For OTC options purchased, each Trust bears the risk of loss in the amount of the premiums paid plus the positive change in market values net of any collateral held by the Trusts should the counterparty fail to perform under the contracts. Options written by the Trusts do not typically give rise to counterparty credit risk, as options written generally obligate the Trusts, and not the counterparty, to perform. The Trusts may be exposed to counterparty credit risk with respect to options written to the extent the Trusts deposit collateral with its counterparty to a written option.
With exchange-traded options purchased and futures, there is less counterparty credit risk to the Trusts since the exchange or clearinghouse, as counterparty to such instruments, guarantees against a possible default. The clearinghouse stands between the buyer and the seller of the contract; therefore, credit risk is limited to failure of the clearinghouse. While offset rights may exist under applicable law, a Trust does not have a contractual right of offset against a clearing broker or clearinghouse in the event of a default (including the bankruptcy or insolvency). Additionally, credit risk exists in exchange-traded futures with respect to initial and variation margin that is held in a clearing broker’s customer accounts. While clearing brokers are required to segregate customer margin from their own assets, in the event that a clearing broker becomes insolvent or goes into bankruptcy and at that time there is a shortfall in the aggregate amount of margin held by the clearing broker for all its clients, typically the shortfall would be allocated on a pro rata basis across all the clearing broker’s customers, potentially resulting in losses to the Trusts.
Concentration Risk: As of period end, the Trusts listed below invested a significant portion of their assets in securities in the following sectors:
| Energy |
BGR, BCX | |||
| Financials |
BDJ | |||
| Health Care |
BME | |||
| Information Technology |
BST, BSTZ | |||
| Materials |
BCX | |||
| Utilities |
BUI |
Changes in economic conditions affecting such sectors would have a greater impact on the Trusts and could affect the value, income and/or liquidity of positions in such securities.
BOE and BGY invests a substantial amount of their assets in issuers located in a single country or a limited number of countries. When the Trusts concentrate their investments in this manner, it assumes the risk that economic, political and social conditions in those countries may have a significant impact on their investment performance. Foreign issuers may not be subject to the same uniform accounting, auditing and financial reporting standards and practices as used in the United States. Foreign securities markets may also be more volatile and less liquid than U.S. securities and may be less subject to governmental supervision not typically associated with investing in U.S. securities. Investment percentages in specific countries are presented in the Schedules of Investments.
BGY, BOE, and BCX invest a significant portion of their assets in securities of issuers located in Europe or with significant exposure to European issuers or countries. The European financial markets have recently experienced volatility and adverse trends due to concerns about economic downturns in, or rising government debt levels of, several European countries. These events may spread to other countries in Europe and may affect the value and liquidity of certain of the Trusts’ investments.
Responses to the financial problems by European governments, central banks and others, including austerity measures and reforms, may not work, may result in social unrest and may limit future growth and economic recovery or have other unintended consequences. Further defaults or restructurings by governments and others of their debt could have additional adverse effects on economies, financial markets and asset valuations around the world. In addition, the United Kingdom has voted to withdraw from the European Union, and one or more other countries may withdraw from the European Union and/or abandon the Euro, the common currency of the European Union. The impact of these actions, especially if they occur in a disorderly fashion, is not clear but could be significant and far reaching.
| 128 | 2019 BLACKROCK SEMI-ANNUAL REPORT TO SHAREHOLDERS |
Notes to Financial Statements (unaudited) (continued)
| 10. | CAPITAL SHARE TRANSACTIONS |
Each Trust is authorized to issue an unlimited number of shares, with the exception of CII, all of which were initially classified as Common Shares. CII is authorized to issue 200 million Common Shares. The par value for each Trust’s Common Shares is $0.001, except for CII, which is $0.10. The Board is authorized, however, to reclassify any unissued Common Shares to Preferred Shares without the approval of Common Shareholders.
For the periods shown, shares issued and outstanding increased by the following amounts as a result of shares issued through the Shelf Offering:
|
Six Months Ended 06/30/19 |
Year Ended 12/31/18 |
|||||||
| BME |
638,202 | 504,770 | ||||||
For the periods shown, shares issued and outstanding increased by the following amounts as a result of dividend reinvestment:
|
Six Months Ended 06/30/19 |
Year Ended 12/31/18 |
|||||||
| BME |
23,007 | 28,688 | ||||||
| BST |
28,215 | 60,353 | ||||||
| BUI |
40,336 | 46,552 | ||||||
For the six months ended June 30, 2019 and year ended December 31, 2018, for BGR, CII, and BDJ, shares issued and outstanding remained constant.
Shares of BSTZ issued and outstanding for the period June 27, 2019 to June 30, 2019, increased by 70,000,000 from the Trust’s initial public offering. As of June 30, 2019, BlackRock Financial Management, Inc., an affiliate of BSTZ, owned 5,000 shares of BSTZ.
BME has filed a final prospectus dated April 29, 2019 with the SEC allowing it to issue an additional 5,000,000 Common Shares through an equity Shelf Offering. Under the Shelf Offering, BME, subject to market conditions, may raise additional equity capital from time to time in varying amounts and utilizing various offering methods at a net price at or above BME’s NAV per Common Share (calculated within 48 hours of pricing). As of period end, 4,852,432 Common Shares remain available for issuance under the Shelf Offering. From June 9, 2016 to April 28, 2019 and August 12, 2015 to June 8, 2016, BME was authorized to issue 2,500,000 Common Shares and 453,000 Common Shares, respectively, under previous Shelf Offerings. See Additional Information — Shelf Offering Program for additional information about the Shelf Offering.
Initial costs incurred by BME in connection with its Shelf Offering are recorded as “Deferred offering cost” in the Statements of Assets and Liabilities. As shares are sold, a portion of the costs attributable to the shares sold will be charged against paid-in-capital. Any remaining deferred charges at the end of the shelf offering period will be charged to expense. Any subsequent costs incurred to keep the filing active will be charged to expense as incurred.
The Trusts (other than BSTZ) participate in an open market share repurchase program (the “Repurchase Program”). From December 1, 2017 through November 30, 2018, the Trusts (other than BSTZ) were permitted to repurchase up to 5% of their outstanding common shares under the Repurchase Program, based on common shares outstanding as of the close of business on November 30, 2017, subject to certain conditions. On September 7, 2018, the Trusts (other than BSTZ) announced a continuation of the Repurchase Program. From December 1, 2018 through November 30, 2019, the Trusts (other than BSTZ) may repurchase up to 5% of their outstanding common shares under the Repurchase Program, based on common shares outstanding as of the close of business on November 30, 2018, subject to certain conditions. There is no assurance that the Trusts will purchase shares in any particular amounts. The total cost of the shares repurchased is reflected in the Trusts’ Statements of Changes in Net Assets.
For the periods shown, shares repurchased and cost, including transaction costs, were as follows:
| BOE | Shares | Amount | ||||||
| June 30, 2019 |
1,098,191 | $ | 11,398,114 | |||||
| December 31, 2018 |
728,069 | 7,051,296 | ||||||
| BGY | Shares | Amount | ||||||
| June 30, 2019 |
428,264 | $ | 2,317,689 | |||||
| December 31, 2018 |
1,342,421 | 6,926,639 | ||||||
| BCX | Shares | Amount | ||||||
| June 30, 2019 |
1,568,773 | $ | 12,406,758 | |||||
| December 31, 2018 |
2,000,565 | 17,063,427 | ||||||
| NOTES TO FINANCIAL STATEMENTS | 129 |
Notes to Financial Statements (unaudited) (continued)
| 11. | SUBSEQUENT EVENTS |
Management’s evaluation of the impact of all subsequent events on the Trusts’ financial statements was completed through the date the financial statements were issued and the following items were noted:
| Common Dividend Per Share |
||||||||
| Paid (a) | Declared (b) | |||||||
| BGR |
$ | 0.077600 | $ | 0.077600 | ||||
| CII |
0.082800 | 0.082800 | ||||||
| BDJ |
0.050000 | 0.050000 | ||||||
| BOE |
0.063000 | 0.063000 | ||||||
| BME |
0.200000 | 0.200000 | ||||||
| BGY |
0.033800 | 0.033800 | ||||||
| BCX |
0.051600 | 0.051600 | ||||||
| BST |
0.150000 | 0.150000 | ||||||
| BUI |
0.121000 | 0.121000 | ||||||
| (a) | Net investment income dividend paid on July 31, 2019 to shareholders of record on July 15, 2019. |
| (b) | Net investment income dividend declared on August 1, 2019, payable to shareholders of record on August 15, 2019. |
| 130 | 2019 BLACKROCK SEMI-ANNUAL REPORT TO SHAREHOLDERS |
Disclosure of Investment Advisory Agreements and Sub-Advisory Agreements
The Board of Directors or Trustees (collectively, the “Board,” the members of which are referred to as “Board Members”) of BlackRock Energy and Resources Trust (“BGR”), BlackRock Enhanced Capital and Income Fund, Inc. (“CII”), BlackRock Enhanced Equity Dividend Trust (“BDJ”), BlackRock Enhanced Global Dividend Trust (“BOE”), BlackRock Health Sciences Trust (“BME”), BlackRock Enhanced International Dividend Trust (“BGY”), BlackRock Resources & Commodities Strategy Trust (“BCX”), BlackRock Utilities, Infrastructure & Power Opportunities Trust (“BUI”) and BlackRock Science and Technology Trust (“BST” and together with BGR, CII, BDJ, BOE, BGY, BME, BCX and BST the “Funds”) met in person on May 1, 2019 (the “May Meeting”) and June 5-6, 2019 (the “June Meeting”) to consider the approval of each Fund’s investment advisory agreement (the “Advisory Agreements”) with BlackRock Advisors, LLC (the “Manager”), each Fund’s investment advisor. The Board of each of BGR, BCX, BOE, BGY and BUI also considered the approval of the sub-advisory agreements (collectively, the “Sub-Advisory Agreements”) between the Manager, BlackRock International Limited (the “Sub-Advisor”), and each of BGR, BCX, BOE, BGY and BUI. The Manager and the Sub-Advisor are referred to herein as “BlackRock.” The Advisory Agreement and the Sub-Advisory Agreement are referred to herein as the “Agreements.”
Activities and Composition of the Board
On the date of the June Meeting, the Board consisted of eleven individuals, nine of whom were not “interested persons” of each Fund as defined in the Investment Company Act of 1940, as amended (the “1940 Act”) (the “Independent Board Members”). The Board Members are responsible for the oversight of the operations of each Fund and perform the various duties imposed on the directors of investment companies by the 1940 Act. The Independent Board Members have retained independent legal counsel to assist them in connection with their duties. The Co-Chairs of the Board are Independent Board Members. The Board has established five standing committees: an Audit Committee, a Governance and Nominating Committee, a Compliance Committee, a Performance Oversight Committee and an Executive Committee, each of which is chaired by an Independent Board Member and composed of Independent Board Members (except for the Executive Committee, which also has one interested Board Member).
The Agreements
Consistent with the requirements of the 1940 Act, the Board considers the continuation of the Agreements on an annual basis. The Board has four quarterly meetings per year, each typically extending for two days, and additional in-person and telephonic meetings throughout the year, as needed. While the Board also has a fifth one-day meeting to consider specific information surrounding the renewal of the Agreements, the Board’s consideration entails a year-long deliberative process whereby the Board and its committees assess BlackRock’s services to each Fund. In particular, the Board assessed, among other things, the nature, extent and quality of the services provided to each Fund by BlackRock, BlackRock’s personnel and affiliates, including (as applicable): investment management; accounting, administrative and shareholder services; oversight of each Fund’s service providers; risk management and oversight; legal and compliance services; and ability to meet applicable legal and regulatory requirements. Throughout the year, including during the contract renewal process, the Independent Board Members were advised by independent legal counsel, and met with independent legal counsel in various executive sessions outside of the presence of management.
During the year, the Board, acting directly and through its committees, considers information that is relevant to its annual consideration of the renewal of the Agreements, including the services and support provided by BlackRock to each Fund and its shareholders. BlackRock also furnished additional information to the Board in response to specific questions from the Board. This additional information is discussed further below in the section titled “Board Considerations in Approving the Agreements.” Among the matters the Board considered were: (a) investment performance for one-year, three-year, five-year, ten-year, and/or since inception periods, as applicable, against peer funds, applicable benchmarks, and performance metrics, as applicable, as well as senior management’s and portfolio managers’ analyses of the reasons for any over-performance or underperformance relative to its peers, benchmarks, and other performance metrics, as applicable; (b) leverage management, as applicable; (c) fees, including advisory, administration, if applicable, and other amounts paid to BlackRock and its affiliates by each Fund for services; (d) Fund operating expenses and how BlackRock allocates expenses to each Fund; (e) the resources devoted to, risk oversight of, and compliance reports relating to, implementation of each Fund’s investment objective, policies and restrictions, and meeting regulatory requirements; (f) BlackRock and each Fund’s adherence to applicable compliance policies and procedures; (g) the nature, character and scope of non-investment management services provided by BlackRock and its affiliates and the estimated cost of such services; (h) BlackRock’s and other service providers’ internal controls and risk and compliance oversight mechanisms; (i) BlackRock’s implementation of the proxy voting policies approved by the Board; (j) the use of brokerage commissions and execution quality of portfolio transactions; (k) BlackRock’s implementation of each Fund’s valuation and liquidity procedures; (l) an analysis of management fees for products with similar investment mandates across the open-end fund, closed-end fund, sub-advised mutual fund, collective investment trust, and institutional separate account product channels, as applicable, and the similarities and differences between these products and the services provided as compared to each Fund; (m) BlackRock’s compensation methodology for its investment professionals and the incentives and accountability it creates, along with investment professionals’ investments in the fund(s) they manage; (n) periodic updates on BlackRock’s business; and (o) each Fund’s market discount/premium compared to peer funds.
Board Considerations in Approving the Agreements
The Approval Process: Prior to the May Meeting, the Board requested and received materials specifically relating to the Agreements. The Independent Board Members are continuously engaged in a process with their independent legal counsel and BlackRock to review the nature and scope of the information provided to better assist its deliberations. The materials provided in connection with the May Meeting included, among other things: (a) information independently compiled and prepared by Broadridge Financial Solutions, Inc. (“Broadridge”), based on Lipper classifications, regarding each Fund’s fees and expenses as compared with a peer group of funds as determined by Broadridge (“Expense Peers”), the investment performance of each Fund as compared with a peer group of funds (“Performance Peers”) and other metrics, as applicable; (b) information on the composition of the Expense Peers and Performance Peers, and a description of Broadridge’s methodology; (c) information on the estimated profits realized by BlackRock and its affiliates pursuant to the Agreements and a discussion of fall-out benefits to BlackRock and its affiliates; (d) a general analysis provided by BlackRock concerning investment management fees received in connection with other types of investment products, such as institutional accounts, sub-advised mutual funds, closed-end funds, and open-end funds, under similar investment mandates, as applicable; (e) review of non-management fees; (f) the existence, impact and sharing of potential economies of scale, if any, with each Fund; (g) a summary of aggregate amounts paid by each Fund to BlackRock; and (h) various additional information requested by the Board as appropriate regarding BlackRock’s and each Fund’s operations.
| DISCLOSURE OF INVESTMENT ADVISORY AGREEMENTS AND SUB-ADVISORY AGREEMENTS | 131 |
Disclosure of Investment Advisory Agreements and Sub-Advisory Agreements (continued)
At the May Meeting, the Board reviewed materials relating to its consideration of the Agreements. As a result of the discussions that occurred during the May Meeting, and as a culmination of the Board’s year-long deliberative process, the Board presented BlackRock with questions and requests for additional information. BlackRock responded to these requests with additional written information in advance of the June Meeting. Topics covered included: (a) the methodology for measuring estimated fund profitability; (b) fund expenses and potential fee waivers; (c) differences in services provided and management fees between closed-end funds and other product channels; and (d) BlackRock’s option overwrite strategy.
At the June Meeting, the Board concluded its assessment of, among other things: (a) the nature, extent and quality of the services provided by BlackRock; (b) the investment performance of each Fund as compared with Performance Peers and other metrics, as applicable; (c) the advisory fee and the estimated cost of the services and estimated profits realized by BlackRock and its affiliates from their relationship with each Fund; (d) each Fund’s fees and expenses compared to Expense Peers; (e) the sharing of potential economies of scale; (f) fall-out benefits to BlackRock and its affiliates as a result of BlackRock’s relationship with each Fund; and (g) other factors deemed relevant by the Board Members.
The Board also considered other matters it deemed important to the approval process, such as other payments made to BlackRock or its affiliates relating to securities lending and cash management, and BlackRock’s services related to the valuation and pricing of Fund portfolio holdings. The Board noted the willingness of BlackRock personnel to engage in open, candid discussions with the Board. The Board did not identify any particular information as determinative, and each Board Member may have attributed different weights to the various items considered.
A. Nature, Extent and Quality of the Services Provided by BlackRock: The Board, including the Independent Board Members, reviewed the nature, extent and quality of services provided by BlackRock, including the investment advisory services and the resulting performance of each Fund. Throughout the year, the Board compared Fund performance to the performance of a comparable group of closed-end funds, relevant benchmarks, and performance metrics, as applicable. The Board met with BlackRock’s senior management personnel responsible for investment activities, including the senior investment officers. The Board also reviewed the materials provided by each Fund’s portfolio management team discussing each Fund’s performance and each Fund’s investment objective, strategies and outlook.
The Board considered, among other factors, with respect to BlackRock: the number, education and experience of investment personnel generally and each Fund’s portfolio management team; BlackRock’s research capabilities; investments by portfolio managers in the funds they manage; portfolio trading capabilities; use of technology; commitment to compliance; credit analysis capabilities; risk analysis and oversight capabilities; and the approach to training and retaining portfolio managers and other research, advisory and management personnel. The Board also considered BlackRock’s overall risk management program, including the continued efforts of BlackRock and its affiliates to address cybersecurity risks and the role of BlackRock’s Risk & Quantitative Analysis Group. The Board engaged in a review of BlackRock’s compensation structure with respect to each Fund’s portfolio management team and BlackRock’s ability to attract and retain high-quality talent and create performance incentives.
In addition to investment advisory services, the Board considered the nature and quality of the administrative and other non-investment advisory services provided to each Fund. BlackRock and its affiliates provide each Fund with certain administrative, shareholder and other services (in addition to any such services provided to each Fund by third parties) and officers and other personnel as are necessary for the operations of each Fund. In particular, BlackRock and its affiliates provide each Fund with administrative services including, among others: (i) responsibility for disclosure documents, such as the prospectus and the statement of additional information in connection with the initial public offering, registration statements in connection with BME’s equity shelf program and periodic shareholder reports; (ii) preparing communications with analysts to support secondary market trading of each Fund; (iii) oversight of daily accounting and pricing; (iv) responsibility for periodic filings with regulators and stock exchanges; (v) overseeing and coordinating the activities of other service providers including, among others, each Fund’s custodian, fund accountant, transfer agent, and auditor; (vi) organizing Board meetings and preparing the materials for such Board meetings; (vii) providing legal and compliance support; (viii) furnishing analytical and other support to assist the Board in its consideration of strategic issues such as the merger, consolidation or repurposing of certain closed-end funds; and (ix) performing or managing administrative functions necessary for the operation of each Fund, such as tax reporting, expense management, fulfilling regulatory filing requirements, and shareholder call center and other services. The Board reviewed the structure and duties of BlackRock’s fund administration, shareholder services, and legal & compliance departments and considered BlackRock’s policies and procedures for assuring compliance with applicable laws and regulations.
B. The Investment Performance of each Fund and BlackRock: The Board, including the Independent Board Members, also reviewed and considered the performance history of each Fund. In preparation for the May Meeting, the Board was provided with reports independently prepared by Broadridge, which included a comprehensive analysis of each Fund’s performance as of December 31, 2018. The performance information is based on net asset value (NAV), and utilizes Lipper data. Lipper’s methodology calculates a fund’s total return assuming distributions are reinvested on the ex-date at a fund’s ex-date NAV. Broadridge ranks funds in quartiles, ranging from first to fourth, where first is the most desirable quartile position and fourth is the least desirable. In connection with its review, the Board received and reviewed information regarding the investment performance of each Fund as compared to its Performance Peers. The Board and its Performance Oversight Committee regularly review, and meet with Fund management to discuss, the performance of each Fund throughout the year.
In evaluating performance, the Board focused particular attention on funds with less favorable performance records. The Board also noted that while it found the data provided by Broadridge generally useful, it recognized the limitations of such data, including in particular, that notable differences may exist between a fund and the Performance Peer funds (for example, the investment objective(s) and investment strategies). Further, the Board recognized that the performance data reflects a snapshot of a period as of a particular date and that selecting a different performance period could produce significantly different results. The Board also acknowledged that long-term performance could be impacted by even one period of significant outperformance or underperformance, and that a single investment theme could have the ability to affect long-term performance disproportionately.
The Board noted that for the one-, three- and five-year periods reported, BGR ranked in the third, third, and fourth quartiles, respectively, against its Performance Peers. The Board noted BGR’s underperformance for the applicable period reported as compared to its Performance Peers.
| 132 | 2019 BLACKROCK SEMI-ANNUAL REPORT TO SHAREHOLDERS |
Disclosure of Investment Advisory Agreements and Sub-Advisory Agreements (continued)
BlackRock believes that certain other performance metrics may be more appropriate than the Performance Peers, and the Board was provided with a comparison of BGR’s performance relative to these metrics. These metrics include fund return, Sharpe Ratio, stability of distribution and yield. Based on an overall rating relative to these metrics, as determined by BlackRock, BGR generally performed below expectations. The Board and BlackRock reviewed BGR’s underperformance.
The Board noted that for the one-, three- and five-year periods reported, CII ranked in the second, first and first quartiles, respectively, against its Performance Peers.
BlackRock believes that certain other performance metrics may be more appropriate than the Performance Peers, and the Board was provided with a comparison of CII’s performance relative to these metrics. These metrics include fund return, Sharpe Ratio, stability of distribution and yield. BlackRock and the Board considered CII’s overall performance relative to these metrics.
The Board noted that for each of the one-, three- and five-year periods reported, BDJ ranked in the third, second and second quartiles, respectively, against its Performance Peers. The Board noted BDJ’s underperformance for the applicable period reported as compared to its Performance Peers.
BlackRock believes that certain other performance metrics may be more appropriate than the Performance Peers, and the Board was provided with a comparison of BDJ’s performance relative to these metrics. These metrics include fund return, Sharpe Ratio, stability of distribution and yield. BlackRock and the Board considered BDJ’s overall performance relative to these metrics.
The Board noted that for each of the one-, three- and five-year periods reported, BOE ranked in the fourth quartile against its Performance Peers. The Board noted BOE’s underperformance for the applicable periods reported as compared to its Performance Peers.
BlackRock believes that certain other performance metrics may be more appropriate than the Performance Peers, and the Board was provided with a comparison of BOE’s performance relative to these metrics. These metrics include fund return, Sharpe Ratio, stability of distribution and yield. Based on an overall rating relative to these metrics, as determined by BlackRock, BOE generally performed below expectations. The Board and BlackRock reviewed BOE’s underperformance.
The Board noted that for each of the one-, three- and five-year periods reported, BGY ranked in the fourth quartile against its Performance Peers. The Board noted BGY’s underperformance for the applicable periods reported as compared to its Performance Peers.
BlackRock believes that certain other performance metrics may be more appropriate than the Performance Peers, and the Board was provided with a comparison of BGY’s performance relative to these metrics. These metrics include fund return, Sharpe Ratio, stability of distribution and yield. Based on an overall rating relative to these metrics, as determined by BlackRock, BGY generally performed below expectations. The Board and BlackRock reviewed BGY’s underperformance.
The Board noted that for each of the one-, three- and five-year periods reported, BME ranked in the first quartile against its Performance Peers.
BlackRock believes that certain other performance metrics may be more appropriate than the Performance Peers, and the Board was provided with a comparison of BME’s performance relative to these metrics. These metrics include fund return, Sharpe Ratio, stability of distribution and yield. BlackRock and the Board considered BME’s overall performance relative to these metrics.
The Board noted that for the one-, three- and five-year periods reported, BCX ranked in second, first and first quartiles, respectively, against its Performance Peers.
BlackRock believes that certain other performance metrics may be more appropriate than the Performance Peers, and the Board was provided with a comparison of BCX’s performance relative to these metrics. These metrics include fund return, Sharpe Ratio, stability of distribution and yield. Based on an overall rating relative to these metrics, as determined by BlackRock, BCX generally performed below expectations. The Board and BlackRock reviewed BCX’s underperformance.
The Board noted that for the one-year, three-year and since-inception periods reported, BST ranked in the second, first, and first quartiles, respectively, against its Performance Peers.
BlackRock believes that certain other performance metrics may be more appropriate than the Performance Peers, and the Board was provided with a comparison of BST’s performance relative to these metrics. These metrics include fund return, Sharpe Ratio, stability of distribution and yield. BlackRock and the Board considered BST’s overall performance relative to these metrics.
The Board noted that for the one-, three- and five-year periods reported, BUI ranked in the first, second and second quartiles, respectively, against its Performance Peers.
BlackRock believes that certain other performance metrics may be more appropriate than the Performance Peers, and the Board was provided with a comparison of BUI’s performance relative to these metrics. These metrics include fund return, Sharpe Ratio, stability of distribution and yield. BlackRock and the Board considered BUI’s overall performance relative to these metrics.
C. Consideration of the Advisory/Management Fees and the Estimated Cost of the Services and Estimated Profits Realized by BlackRock and its Affiliates from their Relationship with each Fund: The Board, including the Independent Board Members, reviewed each Fund’s contractual management fee rate compared with those of its Expense Peers. The contractual management fee rate represents a combination of the advisory fee and any administrative fees, before taking into account any reimbursements or fee waivers. The Board also compared each Fund’s total expense ratio, as well as its actual management fee rate as a percentage of total assets, to those of its Expense Peers. The total expense ratio represents a fund’s total net operating expenses, excluding any investment related expenses. The total expense ratio gives effect to any expense reimbursements or fee waivers that benefit a fund, and the actual management fee rate gives effect to any management fee reimbursements or waivers that benefit a fund. The Board considered the services provided and the fees charged by BlackRock and its affiliates to other types of clients with similar investment mandates, as applicable, including institutional accounts and sub-advised mutual funds (including mutual funds sponsored by third parties).
The Board received and reviewed statements relating to BlackRock’s financial condition. The Board reviewed BlackRock’s profitability methodology and was also provided with an estimated profitability analysis that detailed the revenues earned and the expenses incurred by BlackRock for services provided to each Fund. The Board reviewed
| DISCLOSURE OF INVESTMENT ADVISORY AGREEMENTS AND SUB-ADVISORY AGREEMENTS | 133 |
Disclosure of Investment Advisory Agreements and Sub-Advisory Agreements (continued)
BlackRock’s estimated profitability with respect to each Fund and other funds the Board currently oversees for the year ended December 31, 2018 compared to available aggregate estimated profitability data provided for the prior two years. The Board reviewed BlackRock’s estimated profitability with respect to certain other U.S. fund complexes managed by the Manager and/or its affiliates. The Board reviewed BlackRock’s assumptions and methodology of allocating expenses in the estimated profitability analysis, noting the inherent limitations in allocating costs among various advisory products. The Board recognized that profitability may be affected by numerous factors including, among other things, fee waivers and expense reimbursements by the Manager, the types of funds managed, precision of expense allocations and business mix. The Board thus recognized that calculating and comparing profitability at individual fund levels is difficult.
The Board noted that, in general, individual fund or product line profitability of other advisors is not publicly available. The Board reviewed BlackRock’s overall operating margin, in general, compared to that of certain other publicly-traded asset management firms. The Board considered the differences between BlackRock and these other firms, including the contribution of technology at BlackRock, BlackRock’s expense management, and the relative product mix.
In addition, the Board considered the estimated cost of the services provided to each Fund by BlackRock, and BlackRock’s and its affiliates’ estimated profits relating to the management of each Fund and the other funds advised by BlackRock and its affiliates. As part of its analysis, the Board reviewed BlackRock’s methodology in allocating its costs of managing the Funds, to each Fund. The Board considered whether BlackRock has the financial resources necessary to attract and retain high quality investment management personnel to perform its obligations under the Agreements and to continue to provide the high quality of services that is expected by the Board. The Board further considered factors including but not limited to BlackRock’s commitment of time, assumption of risk, and liability profile in servicing each Fund, including in contrast to what is required of BlackRock with respect to other products with similar investment mandates across the open-end fund, closed-end fund, sub-advised mutual fund, collective investment trust, and institutional separate account product channels, as applicable.
The Board noted that BGR’s contractual management fee rate ranked in the third quartile, and that the actual management fee rate and total expense ratio each ranked in the first quartile, relative to the Expense Peers. In addition, the Board noted that BlackRock had agreed to voluntarily waive a portion of the advisory fee payable by BGR. An advisory fee waiver has been in effect since 2015, the amount of which may have varied from time to time. After discussion between the Board, including the Independent Board Members, and BlackRock, the Board and BlackRock agreed to increase the voluntary advisory fee waiver from 15 basis points to 22 basis points. The waiver increase was implemented on July 3, 2019.
The Board noted that CII’s contractual management fee rate ranked in the first quartile, and that the actual management fee rate and total expense ratio each ranked in the first quartile, relative to the Expense Peers.
The Board noted that BDJ’s contractual management fee rate ranked in the first quartile, and that the actual management fee rate and total expense ratio each ranked in the first quartile, relative to the Expense Peers.
The Board noted that BOE’s contractual management fee rate ranked in the first quartile, and that the actual management fee rate and total expense ratio each ranked in the first quartile, relative to the Expense Peers. In addition, the Board noted that BlackRock had agreed to voluntarily waive a portion of the advisory fee payable by BOE. An advisory fee waiver has been in effect since 2015, the amount of which may have varied from time to time. After discussion between the Board, including the Independent Board Members, and BlackRock, the Board and BlackRock agreed to a continuation of the current 17.5 basis points voluntary advisory fee waiver.
The Board noted that BGY’s contractual management fee rate ranked in the first quartile, and that the actual management fee rate and total expense ratio each ranked in the first quartile, relative to the Expense Peers. The Board also noted that BlackRock had agreed to voluntarily waive a portion of the advisory fee payable by BGY. An advisory fee waiver has been in effect since 2013, the amount of which may have varied from time to time. After discussions between the Board, including Independent Board Members, and BlackRock, the Board and BlackRock agreed to a continuation of the current 10 basis points voluntary advisory fee waiver.
The Board noted that BME’s contractual management fee rate ranked first out of three funds, and that the actual management fee rate and total expense ratio ranked in the second and first quartiles, respectively, relative to the Expense Peers.
The Board noted that BCX’s contractual management fee rate ranked in the first quartile, and that the actual management fee rate and total expense ratio each ranked in the first quartile relative to the Expense Peers.
The Board noted that BST’s contractual management fee rate ranked first out of three funds, and that the actual management fee rate and total expense ratio each ranked in the first quartile relative to the Expense Peers. The Board also noted that, in connection with BST’s launch, BlackRock has contractually agreed to waive a portion of the advisory fee payable by BST through December 31, 2021. The contractual advisory fee waiver is 15 basis points through December 31, 2019, will be 10 basis points through December 31, 2020, and then will be 5 basis points through December 31, 2021.
The Board noted that BUI’s contractual management fee rate ranked in the second quartile, and that the actual management fee rate and total expense ratio each ranked in the first quartile, relative to the Expense Peers. The Board also noted that BlackRock had agreed to voluntarily waive a portion of the advisory fee payable by BUI. An advisory fee waiver has been in effect since 2017, the amount of which may have varied from time to time. After discussion between the Board, including the Independent Board Members, and BlackRock, the Board and BlackRock agreed to a continuation of the current 2.5 basis points voluntary advisory fee waiver.
D. Economies of Scale: The Board, including the Independent Board Members, considered the extent to which economies of scale might be realized as the assets of each Fund increase. The Board also considered the extent to which each Fund benefits from such economies in a variety of ways, and whether there should be changes in the advisory fee rate or breakpoint structure in order to enable each Fund to more fully participate in these economies of scale. The Board considered each Fund’s asset levels and whether the current fee was appropriate.
Based on the Board’s review and consideration of the issue, the Board concluded that most closed-end funds do not have fund level breakpoints because closed-end funds generally do not experience substantial growth after the initial public offering. They are typically priced at scale at a fund’s inception. The Board noted that although BME may from time-to-time make additional share offerings pursuant to its equity shelf program, the growth of BME’s assets will occur primarily through the appreciation of its investment portfolio.
| 134 | 2019 BLACKROCK SEMI-ANNUAL REPORT TO SHAREHOLDERS |
Disclosure of Investment Advisory Agreements and Sub-Advisory Agreements (continued)
E. Other Factors Deemed Relevant by the Board Members: The Board, including the Independent Board Members, also took into account other ancillary or “fall-out” benefits that BlackRock or its affiliates may derive from BlackRock’s respective relationships with each Fund, both tangible and intangible, such as BlackRock’s ability to leverage its investment professionals who manage other portfolios and risk management personnel, an increase in BlackRock’s profile in the investment advisory community, and the engagement of BlackRock’s affiliates as service providers to each Fund, including for administrative, securities lending and cash management services. The Board also considered BlackRock’s overall operations and its efforts to expand the scale of, and improve the quality of, its operations. The Board also noted that, subject to applicable law, BlackRock may use and benefit from third party research obtained by soft dollars generated by certain registered fund transactions to assist in managing all or a number of its other client accounts.
In connection with its consideration of the Agreements, the Board also received information regarding BlackRock’s brokerage and soft dollar practices. The Board received reports from BlackRock which included information on brokerage commissions and trade execution practices throughout the year.
The Board noted the competitive nature of the closed-end fund marketplace, and that shareholders are able to sell their Fund shares in the secondary market if they believe that each Fund’s fees and expenses are too high or if they are dissatisfied with the performance of each Fund.
The Board also considered the various notable initiatives and projects BlackRock performed in connection with its closed-end fund product line. These initiatives included developing equity shelf programs; efforts to eliminate product overlap with fund mergers; ongoing services to manage leverage that has become increasingly complex; periodic evaluation of share repurchases and other support initiatives for certain BlackRock funds; and continued communications efforts with shareholders, fund analysts and financial advisers. With respect to the latter, the Independent Board Members noted BlackRock’s continued commitment to supporting the secondary market for the common shares of its closed-end funds through a comprehensive secondary market communication program designed to raise investor and analyst awareness and understanding of closed-end funds. BlackRock’s support services included, among other things: sponsoring and participating in conferences; communicating with closed-end fund analysts covering the BlackRock funds throughout the year; providing marketing and product updates for the closed-end funds; and maintaining and enhancing its closed-end fund website.
Conclusion
The Board, including the Independent Board Members, approved the continuation of the Advisory Agreement between the Manager and each Fund, except BUI, for a one-year term ending June 30, 2020, and the Sub-Advisory Agreements between the Manager, the Sub-Advisor, and each of BGR, BCX, BOE and BGY, for a one-year term ending June 30, 2020. The Board, including the Independent Board Members, approved the continuation of the Advisory Agreement between the Manager and BUI for a three-month term ending September 30, 2019, with further continuation to be considered by the Board at its September 2019 meeting, and the Sub-Advisory Agreement between the Manager, the Sub-Advisor and BUI, for a three-month term ending September 30, 2019, with further continuation to be considered by the Board at its September 2019 meeting. Based upon its evaluation of all of the aforementioned factors in their totality, as well as other information, the Board, including the Independent Board Members, was satisfied that the terms of the Agreements were fair and reasonable and in the best interest of each Fund and its shareholders. In arriving at its decision to approve the Agreements, the Board did not identify any single factor or group of factors as all-important or controlling, but considered all factors together, and different Board Members may have attributed different weights to the various factors considered. The Independent Board Members were also assisted by the advice of independent legal counsel in making this determination.
| DISCLOSURE OF INVESTMENT ADVISORY AGREEMENTS AND SUB-ADVISORY AGREEMENTS | 135 |
Disclosure of Investment Advisory Agreements and Sub-Advisory Agreements (continued)
The Board of Trustees (the “Board,” the members of which are referred to as “Board Members”) of BlackRock Science and Technology Trust II (the “Fund”) met in person on May 1, 2019 (the “Meeting”) to consider the approval of the proposed investment advisory agreement (the “Advisory Agreement” or the “Agreement”) between the Fund and BlackRock Advisors, LLC (the “Manager” or “BlackRock”), the Fund’s investment advisor.
Activities and Composition of the Board
On the date of the Meeting, a majority of the Board Members were not “interested persons” of the Fund as defined in the Investment Company Act of 1940, as amended (the “1940 Act”) (the “Independent Board Members”). The Board Members are responsible for the oversight of the operations of the Fund and perform the various duties imposed on the directors of investment companies by the 1940 Act. The Independent Board Members have retained independent legal counsel to assist them in connection with their duties. The Co-Chairs of the Board are Independent Board Members. The Board has established five standing committees: an Audit Committee, a Governance and Nominating Committee, a Compliance Committee, a Performance Oversight Committee and an Executive Committee, each of which is chaired by an Independent Board Member and composed of Independent Board Members (except for the Executive Committee, which also has one interested Board Member).
The Agreement
Pursuant to the 1940 Act, the Board is required to consider the initial approval of the Agreement. In connection with this process, the Board assessed, among other things, the nature, extent and quality of the services to be provided to the Fund by BlackRock, BlackRock’s personnel and affiliates, including (as applicable): investment management; accounting, administrative and shareholder services; oversight of the Fund’s service providers; marketing; risk management and oversight; legal and compliance services; and ability to meet applicable legal and regulatory requirements.
Board Considerations in Approving the Agreement
The Approval Process: At the Meeting, the Board reviewed materials relating to its consideration of the Agreement. The Board considered all factors it believed relevant with respect to the Fund, including, among other factors: (a) the nature, extent and quality of the services to be provided by BlackRock; (b) the investment performance of BlackRock portfolio management; (c) the advisory fee and the estimated cost of the services to be provided and profits to be realized by BlackRock and its affiliates from their relationship with the Fund; (d) the sharing of potential economies of scale; (e) potential fall-out benefits to BlackRock and its affiliates as a result of its relationship with the Fund; (f) the policies and practices of BlackRock with respect to portfolio transactions for the Fund; and (g) other factors deemed relevant by the Board Members.
In determining whether to approve the Agreement, the Board met with the relevant investment advisory personnel from BlackRock and considered all information it deemed reasonably necessary to evaluate the terms of the Agreement. The Board received materials in advance of the Meeting relating to its consideration of the Agreement, including, among other things, (a) fees and estimated expense ratios of the Fund in comparison to the fees and expense ratios of a peer group of funds as determined by Broadridge Financial Solutions, Inc. (“Broadridge”) and other metrics, as applicable; (b) information on the composition of the peer group of funds and a description of Broadridge’s methodology; (c) information regarding BlackRock’s economic outlook for the Fund and its general investment outlook for the markets; (d) information regarding fees paid to service providers that are affiliates of BlackRock; and (e) information outlining the legal duties of the Board under the 1940 Act with respect to the consideration and approval of the Agreement. The Board also noted information received at prior Board meetings concerning compliance records and regulatory matters relating to BlackRock.
The Board also considered other matters it deemed important to the approval process, such as other payments to be made to BlackRock or its affiliates relating to securities lending and cash management, services related to the valuation and pricing of Fund portfolio holdings, and advice from independent legal counsel with respect to the review process and materials submitted for the Board’s review. The Board noted the willingness of BlackRock personnel to engage in open, candid discussions with the Board. The Board did not identify any particular information as determinative, and each Board Member may have attributed different weights to the various items considered.
A. Nature, Extent and Quality of the Services to be Provided by BlackRock: The Board, including the Independent Board Members, reviewed the nature, extent and quality of services to be provided by BlackRock, including the investment advisory services to be provided to the Fund. The Board received information concerning the investment philosophy and investment process to be used by BlackRock in managing the Fund, as well as a description of the capabilities, personnel and services of BlackRock. In connection with this review, the Board considered BlackRock’s in-house research capabilities as well as other resources available to its personnel. The Board considered the scope of the services to be provided by BlackRock to the Fund under the Agreement relative to services typically provided by third parties to other funds. The Board noted that the standard of care applicable under the Agreement was comparable to that found generally in investment company advisory agreements. The Board concluded that the scope of BlackRock’s services to be provided to the Fund was consistent with the Fund’s operational requirements, including, in addition to seeking to meet its investment objective, compliance with investment restrictions, tax and reporting requirements and related shareholder services.
The Board, including the Independent Board Members, also considered the quality of the administrative and other non-investment advisory services to be provided by BlackRock and its affiliates to the Fund. The Board evaluated the procedures of BlackRock designed to fulfill its fiduciary duty to the Fund with respect to possible conflicts of interest, including BlackRock’s code of ethics (regulating the personal trading of BlackRock’s officers and employees), the procedures by which BlackRock allocates trades among its various investment advisory clients, the integrity of the systems in place to ensure compliance with the foregoing and the record of BlackRock in these matters. The Board also noted information received at prior Board meetings concerning the standards of BlackRock with respect to the execution of portfolio transactions.
The Board, including the Independent Board Members, considered, among other factors, with respect to BlackRock: the number, education and experience of investment personnel generally and the Fund’s portfolio management team; BlackRock’s research capabilities; investments by portfolio managers in the funds they manage; portfolio trading capabilities; use of technology; commitment to compliance; credit analysis capabilities; risk analysis and oversight capabilities; and the approach to training and retaining portfolio managers and other research, advisory and management personnel. The Board also considered BlackRock’s overall risk management program, including the continued efforts of BlackRock and its affiliates to address cybersecurity risks and the role of BlackRock’s Risk & Quantitative Analysis Group. The Board
| 136 | 2019 BLACKROCK SEMI-ANNUAL REPORT TO SHAREHOLDERS |
Disclosure of Investment Advisory Agreements and Sub-Advisory Agreements (continued)
engaged in a review of BlackRock’s compensation structure with respect to the Fund’s portfolio management team and BlackRock’s ability to attract and retain high-quality talent and create performance incentives. The Board also considered the business reputation of BlackRock and its financial resources and concluded that BlackRock would be able to meet any reasonably foreseeable obligation under the Agreement.
In addition to investment advisory services, the Board, including the Independent Board Members, considered the quality of the administrative and other non-investment advisory services to be provided by BlackRock and its affiliates to the Fund. The Board noted that BlackRock and its affiliates will provide the Fund with certain administrative, shareholder and other services (in addition to any such services provided to the Fund by third parties) and officers and other personnel as are necessary for the operations of the Fund. In particular, the Board noted that BlackRock and its affiliates will provide the Fund with administrative services including, among others: (i) responsibility for disclosure documents, such as the prospectus and the statement of additional information in connection with the initial public offering and periodic shareholder reports; (ii) preparing communications with analysts to support secondary market trading of the Fund; (iii) oversight of daily accounting and pricing; (iv) responsibility for periodic filings with regulators and stock exchanges; (v) overseeing and coordinating the activities of other service providers including, among others, the Fund’s custodian, fund accountant, transfer agent, and auditor; (vi) organizing Board meetings and preparing the materials for such Board meetings; (vii) providing legal and compliance support; (viii) furnishing analytical and other support to assist the Board in its consideration of strategic issues such as the merger, consolidation or repurposing of certain closed-end funds; and (ix) performing administrative functions necessary for the operation of the Fund, such as tax reporting, expense management, fulfilling regulatory filing requirements and shareholder call center and other services. The Board reviewed the structure and duties of BlackRock’s fund administration, shareholder services, and legal & compliance departments and considered BlackRock’s policies and procedures for assuring compliance with applicable laws and regulations.
B. The Investment Performance of the Fund and BlackRock: In their capacity as members of the boards of directors or trustees of certain other BlackRock-advised funds, the Board, including the Independent Board Members, previously received and considered information about BlackRock’s investment performance for other funds. The Board, however, could not consider the performance history of the Fund because the Fund was not yet organized and had not yet commenced operations as of the date of the Meeting.
C. Consideration of the Advisory/Management Fees and the Estimated Cost of the Services to be Provided and Estimated Profits to be Realized by BlackRock and its Affiliates from their Relationship with the Fund: In connection with the initial approval of the Agreement, the Board, including the Independent Board Members, reviewed the Fund’s proposed contractual management fee rate compared with the other funds in its Broadridge category. The contractual management fee rate represents a combination of the advisory fee and any administrative fees, before taking into account any reimbursements or fee waivers. In addition, the Board, including the Independent Board Members, considered the Fund’s estimated total net expense ratio, as well as the actual management fee rate as a percentage of total assets, to those of other funds in its Broadridge category. The estimated total expense ratio represents a fund’s total net operating expenses, excluding any investment related expenses. The estimated total expense ratio gives effect to any expense reimbursements or fee waivers that benefit a fund, and the actual management fee rate gives effect to any management fee reimbursements or waivers that benefit a fund. The Board considered the services provided and the fees charged by BlackRock and its affiliates to other types of clients with similar investment mandates, as applicable, including institutional separate accounts and sub-advised mutual funds (including mutual funds sponsored by third parties).
The Board noted that it had previously received and reviewed statements relating to BlackRock’s financial condition in connection with their duties as trustees or directors of other funds in the BlackRock family of closed-end funds. The Board had previously reviewed BlackRock’s profitability methodology and was also provided with an estimated profitability analysis that detailed the revenues earned and the expenses incurred by BlackRock for services provided to the Fund. The Board reviewed BlackRock’s estimated profitability with respect to other funds the Board oversees for the year ended December 31, 2018 compared to available aggregate estimated profitability data provided for the prior two years. The Board acknowledged the Manager’s representation that it expected the Fund’s costs of services and profitability to be broadly in line with those of other similar funds managed by the Manager. The Board then noted its previous review of BlackRock’s estimated profitability with respect to certain other U.S. fund complexes managed by the Manager and/or its affiliates. The Board reviewed BlackRock’s assumptions and methodology of allocating expenses in the estimated profitability analysis, noting the inherent limitations in allocating costs among various advisory products. The Board recognized that profitability may be affected by numerous factors including, among other things, fee waivers and expense reimbursements by the Manager, the types of funds managed, precision of expense allocations and business mix. The Board noted that, as a result, calculating and comparing profitability at the individual fund level is difficult.
The Board noted that, in general, individual fund or product line profitability of other advisors is not publicly available. The Board then noted its previous review, as described above, of BlackRock’s overall operating margin, in general, compared to that of certain other publicly-traded asset management firms. The Board reviewed its previous consideration of the differences between BlackRock and these other firms, including the contribution of technology at BlackRock, BlackRock’s expense management, and the relative product mix.
The Board considered whether BlackRock has the financial resources necessary to attract and retain high quality investment management personnel to perform its obligations under the Agreements and to provide the high quality of services that is expected by the Board. The Board further considered factors including but not limited to BlackRock’s commitment of time, assumption of risk, and liability profile in servicing the Trust in contrast to what is required of BlackRock with respect to other products with similar investment mandates across the open-end fund, closed-end fund, sub-advised mutual fund, collective investment trust and institutional separate account product channels, as applicable.
The Board noted that the Fund’s contractual management fee rate ranked second out of three funds and the Fund’s estimated actual management fee rate and estimated total expense ratio ranked in the third and second quartiles, respectively, relative to the Fund’s peers.
Following consideration of this information, the Board, including the Independent Board Members, concluded that the fees to be paid pursuant to the Agreement were fair and reasonable in light of the services to be provided.
As the Fund has not commenced operations as of the date of the Meeting, BlackRock was not able to provide the Board with specific information concerning the expected profits to be realized by BlackRock and its affiliates from their relationships with the Fund. BlackRock, however, will provide the Board with such information at future meetings.
| DISCLOSURE OF INVESTMENT ADVISORY AGREEMENTS AND SUB-ADVISORY AGREEMENTS | 137 |
Disclosure of Investment Advisory Agreements and Sub-Advisory Agreements (continued)
D. Economies of Scale: The Board, including the Independent Board Members, considered the extent to which economies of scale might be realized as the assets of the Fund increase. The Board also considered the extent to which the Fund may benefit from such economies in a variety of ways, and whether there should be changes in the advisory fee rate or breakpoint structure in order to enable the Fund to more fully participate in these economies of scale.
Based on the Board’s review and consideration of the issue, the Board concluded that most closed-end funds do not have fund level breakpoints because closed-end funds generally do not experience substantial growth after the initial public offering. They are typically priced at scale at a fund’s inception.
E. Other Factors Deemed Relevant by the Board Members: The Board, including the Independent Board Members, also took into account other potential ancillary or “fall-out” benefits that BlackRock or its affiliates may derive from BlackRock’s respective relationships with the Fund, both tangible and intangible, such as BlackRock’s ability to leverage its investment professionals who manage other portfolios and risk management personnel, an increase in BlackRock’s profile in the investment advisory community, and the engagement of BlackRock’s affiliates as service providers to the Fund, including for administrative, securities lending and cash management services. The Board also considered BlackRock’s overall operations and its efforts to expand the scale of, and improve the quality of, its operations. The Board also noted that, subject to applicable law, BlackRock may use and benefit from third party research obtained by soft dollars generated by certain registered fund transactions to assist in managing all or a number of its other client accounts.
In connection with its consideration of the Agreements, the Board also received information regarding BlackRock’s brokerage and soft dollar practices. The Board received reports from BlackRock which included information on brokerage commissions and trade execution practices for BlackRock closed-end funds throughout the year.
The Board noted the competitive nature of the closed-end fund marketplace, and that shareholders are able to sell their Fund shares in the secondary market if they believe that the Fund’s fees and expenses are too high or if they are dissatisfied with the performance of the Fund.
The Board also considered the various notable initiatives and projects BlackRock performed in connection with its closed-end fund product line. These initiatives included developing equity shelf programs; efforts to eliminate product overlap with fund mergers; ongoing services to manage leverage that has become increasingly complex; periodic evaluation of share repurchases and other support initiatives for certain BlackRock funds; and continued communications efforts with shareholders, fund analysts and financial advisers. With respect to the latter, the Independent Board Members noted BlackRock’s continued commitment to supporting the secondary market for the common shares of its closed-end funds through a comprehensive secondary market communication program designed to raise investor and analyst awareness and understanding of closed-end funds. BlackRock’s support services included, among other things: sponsoring and participating in conferences; communicating with closed-end fund analysts covering the BlackRock funds throughout the year; providing marketing and product updates for the closed-end funds; and maintaining and enhancing its closed-end fund website.
The Board, including all of the Independent Board Members, concluded that these potential ancillary benefits that BlackRock and its affiliates could receive with regard to providing investment advisory and other services to the Fund were consistent with those generally available to other fund sponsors.
Conclusion
The Board, including all the Independent Board Members, approved the Advisory Agreement between the Manager and the Fund, for a two-year term beginning on the effective date of the Agreement. Based upon its evaluation of all of the aforementioned factors in their totality, as well as other information, the Board, including the Independent Board Members, was satisfied that the terms of the Agreement were fair and reasonable and in the best interest of the Fund and its shareholders. In arriving at its decision to approve the Agreement, the Board did not identify any single factor or group of factors as all-important or controlling, but considered all factors together, and different Board Members may have attributed different weights to the various factors considered. The Independent Board Members were also assisted by the advice of independent legal counsel in making this determination.
| 138 | 2019 BLACKROCK SEMI-ANNUAL REPORT TO SHAREHOLDERS |
Trustee and Officer Information
Richard E. Cavanagh, Co-Chair of the Board and Trustee
Karen P. Robards, Co-Chair of the Board and Trustee
Michael J. Castellano, Trustee
Cynthia L. Egan, Trustee
Frank J. Fabozzi, Trustee
Henry Gabbay, Trustee
R. Glenn Hubbard, Trustee
W. Carl Kester, Trustee
Catherine A. Lynch, Trustee
Robert Fairbairn, Trustee
John M. Perlowski, Trustee, President and Chief Executive Officer
Jonathan Diorio, Vice President
Neal J. Andrews, Chief Financial Officer
Jay M. Fife, Treasurer
Charles Park, Chief Compliance Officer
Janey Ahn, Secretary
| (a) | For BGR, BOE, BGY, BCX and BUI. |
| (b) | For BME. |
| TRUSTEE AND OFFICER INFORMATION | 139 |
Fund Certification
The Trusts are listed for trading on the NYSE and have filed with the NYSE their annual chief executive officer certification regarding compliance with the NYSE’s listing standards. The Trusts filed with the SEC the certification of its chief executive officer and chief financial officer required by section 302 of the Sarbanes-Oxley Act.
General Information
The Trusts, other than BME, do not make available copies of their Statements of Additional Information because the Trusts’ shares, except for BME, are not continuously offered, which means that the Statements of Additional Information of each Trust, other than BME, have not been updated after completion of the respective Trust’s offerings and the information contained in each such Trust’s Statement of Additional Information may have become outdated.
BME’s Statement of Additional Information includes additional information about its Board and is available, without charge upon request by calling 800-882-0052.
During the period there were no material changes in the Trusts’ investment objectives or policies or to the Trusts’ charters or by-laws that would delay or prevent a change of control of the Trusts that were not approved by the shareholders or in the principal risk factors associated with investment in the Trusts. There have been no changes in the persons who are primarily responsible for the day-to-day management of the Trusts’ portfolios.
In accordance with Section 23(c) of the Investment Company Act of 1940, each Trust may from time to time purchase shares of its common stock in the open market or in private transactions.
Quarterly performance, semi-annual and annual reports, current net asset value and other information regarding the Trusts may be found on BlackRock’s website, which can be accessed at http://www.blackrock.com. Any reference to BlackRock’s website in this report is intended to allow investors public access to information regarding the Trusts and does not, and is not intended to, incorporate BlackRock’s website in this report.
Electronic Delivery
Shareholders can sign up for e-mail notifications of quarterly statements, annual and semi-annual shareholder reports by enrolling in the electronic delivery program. Electronic copies of shareholder reports are available on BlackRock’s website.
To enroll in electronic delivery:
Shareholders Who Hold Accounts with Investment Advisers, Banks or Brokerages:
Please contact your financial advisor. Please note that not all investment advisers, banks or brokerages may offer this service.
Householding
The Trusts will mail only one copy of shareholder documents, annual and semi-annual reports and proxy statements, to shareholders with multiple accounts at the same address. This practice is commonly called “householding” and is intended to reduce expenses and eliminate duplicate mailings of shareholder documents. Mailings of your shareholder documents may be householded indefinitely unless you instruct us otherwise. If you do not want the mailing of these documents to be combined with those for other members of your household, please call the Trusts (800) 882-0052.
Availability of Quarterly Schedule of Investments
The Trusts file their complete schedule of portfolio holdings with the SEC for the first and third quarters of each fiscal year as an exhibit to its reports on Form N-PORT, and for reporting periods ended prior to March 31, 2019, filed such information on Form N-Q, as applicable. The Trusts’ Forms N-PORT and N-Q, as applicable, are available on the SEC’s website at http://www.sec.gov. The Trusts’ Forms N-PORT and N-Q, as applicable, may also be obtained upon request and without charge by calling (800) 882-0052.
Availability of Proxy Voting Policies and Procedures
A description of the policies and procedures that the Trusts use to determine how to vote proxies relating to portfolio securities is available upon request and without charge (1) by calling (800) 882-0052; (2) at http://www.blackrock.com; and (3) on the SEC’s website at http://www.sec.gov.
Availability of Proxy Voting Record
Information about how the Trusts voted proxies relating to securities held in the Trusts’ portfolio during the most recent 12-month period ended June 30 is available upon request and without charge (1) at http://www.blackrock.com or by calling (800) 882-0052 and (2) on the SEC’s website at http://www.sec.gov.
| 140 | 2019 BLACKROCK SEMI-ANNUAL REPORT TO SHAREHOLDERS |
Additional Information (continued)
Availability of Trust Updates
BlackRock will update performance and certain other data for the Trusts on a monthly basis on its website in the “Closed-end Funds” section of http://www.blackrock.com as well as certain other material information as necessary from time to time. Investors and others are advised to check the website for updated performance information and the release of other material information about the Trusts. This reference to BlackRock’s website is intended to allow investors public access to information regarding the Trusts and does not, and is not intended to, incorporate BlackRock’s website in this report.
Shelf Offering Program
From time-to-time, each Trust may seek to raise additional equity capital through an equity shelf program (a “Shelf Offering”). In a Shelf Offering, a Trust may, subject to market conditions, raise additional equity capital by issuing new Common Shares from time to time in varying amounts at a net price at or above the Trust’s net asset value (“NAV”) per Common Share (calculated within 48 hours of pricing). While any such Shelf Offering may allow a Trust to pursue additional investment opportunities without the need to sell existing portfolio investments, it could also entail risks — including that the issuance of additional Common Shares may limit the extent to which the Common Shares are able to trade at a premium to NAV in the secondary market.
None of the Trusts, other than BME, have filed a registration statement with respect to any current Shelf Offerings. This report is not an offer to sell these Trusts” Common Shares and is not a solicitation of an offer to buy these Trusts” Common Shares. If any of the Trusts other than BME file a registration statement with respect to any current Shelf Offering, the prospectus contained therein will contain more complete information about such Trusts and should be read carefully before investing.
BME has filed a final prospectus with the SEC in connection with its Shelf Offering. This report and the prospectus of BME are not offers to sell BME Common Shares or solicitations of an offer to buy BME Common Shares in any jurisdiction where such offers or sales are not permitted. The prospectus of BME contains important information about the Trust, including its investment objective, risks, charges and expenses. Investors are urged to read the prospectus of BME carefully and in its entirety before investing. Copies of the final prospectus for BME can be obtained from BlackRock at http://www.blackrock.com.
Dividend Policy
Each Trust’s dividend policy is to distribute all or a portion of its net investment income to its shareholders on a monthly basis. In order to provide shareholders with a more stable level of dividend distributions, the distributions paid by the Trusts for any particular month may be more or less than the amount of net investment income earned by the Trusts during such month. The portion of distributions that exceeds a Trust’s current and accumulated earnings and profits, which are measured on a tax basis, will constitute a nontaxable return of capital. Distributions in excess of a Trust’s taxable income and net capital gains, but not in excess of a Trust’s earnings and profits, will be taxable to shareholders as ordinary income and will not constitute a nontaxable return of capital. The Trusts’ current accumulated but undistributed net investment income, if any, is disclosed in the Statements of Assets and Liabilities, which comprises part of the financial information included in this report.
BlackRock Privacy Principles
BlackRock is committed to maintaining the privacy of its current and former fund investors and individual clients (collectively, “Clients”) and to safeguarding their non-public personal information. The following information is provided to help you understand what personal information BlackRock collects, how we protect that information and why in certain cases we share such information with select parties.
If you are located in a jurisdiction where specific laws, rules or regulations require BlackRock to provide you with additional or different privacy-related rights beyond what is set forth below, then BlackRock will comply with those specific laws, rules or regulations.
BlackRock obtains or verifies personal non-public information from and about you from different sources, including the following: (i) information we receive from you or, if applicable, your financial intermediary, on applications, forms or other documents; (ii) information about your transactions with us, our affiliates, or others; (iii) information we receive from a consumer reporting agency; and (iv) from visits to our websites.
BlackRock does not sell or disclose to non-affiliated third parties any non-public personal information about its Clients, except as permitted by law or as is necessary to respond to regulatory requests or to service Client accounts. These non-affiliated third parties are required to protect the confidentiality and security of this information and to use it only for its intended purpose.
We may share information with our affiliates to service your account or to provide you with information about other BlackRock products or services that may be of interest to you. In addition, BlackRock restricts access to non-public personal information about its Clients to those BlackRock employees with a legitimate business need for the information. BlackRock maintains physical, electronic and procedural safeguards that are designed to protect the non-public personal information of its Clients, including procedures relating to the proper storage and disposal of such information.
| ADDITIONAL INFORMATION | 141 |
Glossary of Terms Used in this Report
| 142 | 2019 BLACKROCK SEMI-ANNUAL REPORT TO SHAREHOLDERS |
This report is intended for current holders. It is not a prospectus. Past performance results shown in this report should not be considered a representation of future performance. Statements and other information herein are as dated and are subject to change.

| CEF-BK9-6/19-SAR |

|
| Item 2 – | Code of Ethics – Not Applicable to this semi-annual report |
| Item 3 – | Audit Committee Financial Expert – Not Applicable to this semi-annual report |
| Item 4 – | Principal Accountant Fees and Services – Not Applicable to this semi-annual report |
| Item 5 – | Audit Committee of Listed Registrants – Not Applicable to this semi-annual report |
| Item 6 – | Investments |
(a) The registrant’s Schedule of Investments is included as part of the Report to Stockholders filed under Item 1 of this Form.
(b) Not Applicable due to no such divestments during the semi-annual period covered since the previous Form N-CSR filing.
| Item 7 – | Disclosure of Proxy Voting Policies and Procedures for Closed-End Management Investment Companies – Not Applicable to this semi-annual report |
| Item 8 – | Portfolio Managers of Closed-End Management Investment Companies |
(a) Not Applicable to this semi-annual report
| (b) | As of the date of this filing, there have been no changes in any of the portfolio managers identified in the most recent annual report on Form N-CSR. |
| Item 9 – | Purchases of Equity Securities by Closed-End Management Investment Company and Affiliated Purchasers |
| Period | (a) Total Number of Shares Purchased |
(b) Average Price Paid per Share |
(c) Total Number of Shares Purchased as Part of Publicly Announced Plans or Programs |
(d) Maximum Number of Shares that May Yet Be Purchased Under the Plans or Programs1 | ||||
| January 1 - 31, 2019 |
0 | 0 | 0 | 489,256 | ||||
| February 1 – 28, 2019 |
0 | 0 | 0 | 489,256 | ||||
| March 1 – 31, 2019 |
0 | 0 | 0 | 489,256 | ||||
| April 1 – 30, 2019 |
0 | 0 | 0 | 489,256 | ||||
| May 1 – 31, 2019 |
0 | 0 | 0 | 489,256 | ||||
| June 1 - 30, 2019 |
0 | 0 | 0 | 489,256 | ||||
| Total: |
0 | 0 | 0 | 489,256 |
1On September 7, 2018, the Fund announced a further continuation of its open market share repurchase program. Commencing on December 1, 2018, the Fund may repurchase through November 30, 2019, up to 5% of its common shares outstanding as of the close of business on November 30, 2018, subject to certain conditions.
| Item 10 – | Submission of Matters to a Vote of Security Holders – There have been no material changes to these procedures. |
| Item 11 – | Controls and Procedures |
(a) The registrant’s principal executive and principal financial officers, or persons performing similar functions, have concluded that the registrant’s disclosure controls and procedures (as defined in Rule 30a-3(c) under the Investment Company Act of 1940, as amended (the “1940 Act”)) are effective as of a date
2
within 90 days of the filing of this report based on the evaluation of these controls and procedures required by Rule 30a-3(b) under the 1940 Act and Rule 13a-15(b) under the Securities Exchange Act of 1934, as amended.
(b) There were no changes in the registrant’s internal control over financial reporting (as defined in Rule 30a-3(d) under the 1940 Act) that occurred during the period covered by this report that have materially affected, or are reasonably likely to materially affect, the registrant’s internal control over financial reporting.
| Item 12 – | Disclosure of Securities Lending Activities for Closed-End Management Investment Companies – Not applicable to this semi-annual report |
| Item 13 – | Exhibits attached hereto |
(a)(1) – Code of Ethics – Not Applicable to this semi-annual report
(a)(2) – Certifications – Attached hereto
(a)(3) – Not Applicable
(a)(4) – Not Applicable
(b) – Certifications – Attached hereto
(c) – Notices to the registrant’s common shareholders in accordance with the order under Section 6(c) of the 1940 Act granting an exemption from Section 19(b) of the 1940 Act and Rule 19b-1 under the 1940 Act, dated May 9, 20091
|
| ||
| 1 The Fund has received exemptive relief from the Securities and Exchange Commission permitting it to make periodic distributions of long-term capital gains with respect to its outstanding common stock as frequently as twelve times each year, and as frequently as distributions are specified by or in accordance with the terms of its outstanding preferred stock. This relief is conditioned, in part, on an undertaking by the Fund to make the disclosures to the holders of the Fund’s common shares, in addition to the information required by Section 19(a) of the 1940 Act and Rule 19a-1 thereunder. The Fund is likewise obligated to file with the SEC the information contained in any such notice to shareholders and, in that regard, has attached hereto copies of each such notice made during the period. |
3
Pursuant to the requirements of the Securities Exchange Act of 1934 and the Investment Company Act of 1940, the registrant has duly caused this report to be signed on its behalf by the undersigned, thereunto duly authorized.
BlackRock Health Sciences Trust
| By: | /s/ John M. Perlowski | |||
| John M. Perlowski | ||||
| Chief Executive Officer (principal executive officer) of | ||||
| BlackRock Health Sciences Trust |
Date: September 3, 2019
Pursuant to the requirements of the Securities Exchange Act of 1934 and the Investment Company Act of 1940, this report has been signed below by the following persons on behalf of the registrant and in the capacities and on the dates indicated.
| By: | /s/ John M. Perlowski | |||
| John M. Perlowski | ||||
| Chief Executive Officer (principal executive officer) of | ||||
| BlackRock Health Sciences Trust |
Date: September 3, 2019
| By: | /s/ Neal J. Andrews | |||
| Neal J. Andrews | ||||
| Chief Financial Officer (principal financial officer) of | ||||
| BlackRock Health Sciences Trust |
Date: September 3, 2019
4