UNITED STATES SECURITIES AND EXCHANGE COMMISSION
Washington, D.C. 20549
Form 20-F
ANNUAL REPORT PURSUANT TO SECTION 13 OR 15(d)
OF THE SECURITIES EXCHANGE ACT OF 1934
For the fiscal year ended December 31, 2019
Commission file number 001-32575
Royal Dutch Shell plc
(Exact name of registrant as specified in its charter)
England and Wales
(Jurisdiction of incorporation or organization)
Carel van Bylandtlaan 30, 2596 HR, The Hague, The Netherlands
Tel. no: 011 31 70 377 9111
royaldutchshell.shareholders@shell.com
(Address of principal executive offices)
Securities registered pursuant to Section 12(b) of the Act
Title of Each Class | Trading Symbols | Name of Each Exchange on Which Registered |
American Depositary Shares representing two A ordinary shares of the issuer with a nominal value of €0.07 each | RDS.A | New York Stock Exchange |
American Depositary Shares representing two B ordinary shares of the issuer with a nominal value of €0.07 each | RDS.B | New York Stock Exchange |
2.125% Guaranteed Notes due 2020 | RDS/20A | New York Stock Exchange |
2.25% Guaranteed Notes due 2020 | RDS.A/20 | New York Stock Exchange |
4.375% Guaranteed Notes due 2020 | RDS/20 | New York Stock Exchange |
Floating Rate Guaranteed Notes due 2020 | RDS/20B | New York Stock Exchange |
1.75% Guaranteed Notes due 2021 | RDS/21 | New York Stock Exchange |
1.875% Guaranteed Notes due 2021 | RDS.A/21 | New York Stock Exchange |
2.375% Guaranteed Notes due 2022 | RDS/22 | New York Stock Exchange |
2.25% Guaranteed Notes due 2023 | RDS/23 | New York Stock Exchange |
3.4% Guaranteed Notes due 2023 | RDS/223A | New York Stock Exchange |
3.5% Guaranteed Notes due 2023 | RDS.A/23 | New York Stock Exchange |
Floating Rate Guaranteed Notes due 2023 | RDS.A/23A | New York Stock Exchange |
2% Guaranteed Notes due 2024 | RDS.A/24 | New York Stock Exchange |
3.25% Guaranteed Notes due 2025 | RDS/25 | New York Stock Exchange |
2.5% Guaranteed Notes due 2026 | RDS/26 | New York Stock Exchange |
2.875% Guaranteed Notes due 2026 | RDS.A/26 | New York Stock Exchange |
3.875% Guaranteed Notes due 2028 | RDS.A/28 | New York Stock Exchange |
2.375% Guaranteed Notes due 2029 | RDS.A/29 | New York Stock Exchange |
4.125% Guaranteed Notes due 2035 | RDS/35 | New York Stock Exchange |
6.375% Guaranteed Notes due 2038 | RDS.A/38 | New York Stock Exchange |
5.5% Guaranteed Notes due 2040 | RDS/40 | New York Stock Exchange |
3.625% Guaranteed Notes due 2042 | RDS/42 | New York Stock Exchange |
4.55% Guaranteed Notes due 2043 | RDS/43 | New York Stock Exchange |
4.375% Guaranteed Notes due 2045 | RDS/45 | New York Stock Exchange |
3.75% Guaranteed Notes due 2046 | RDS/46 | New York Stock Exchange |
4.00% Guaranteed Notes due 2046 | RDS.A/46 | New York Stock Exchange |
3.125% Guaranteed Notes due 2049 | RDS.A/49 | New York Stock Exchange |
Securities registered pursuant to Section 12(g) of the Act: none
Securities for which there is a reporting obligation pursuant to Section 15(d) of the Act: none
Indicate the number of outstanding shares of each of the issuer’s classes of capital or common stock as of the close of the period covered by the annual report.
Outstanding as of December 31, 2019:
4,151,787,517 A ordinary shares with a nominal value of €0.07 each.
3,729,407,107 B ordinary shares with a nominal value of €0.07 each.
Indicate by check mark if the registrant is a well-known seasoned issuer, as defined in Rule 405 of the Securities Act. | þ | Yes | ☐ | No |
If this report is an annual or transition report, indicate by check mark if the registrant is not required to file reports pursuant to Section 13 or 15(d) of the Securities Exchange Act of 1934. | ☐ | Yes | þ | No |
Indicate by check mark whether the registrant (1) has filed all reports required to be filed by Section 13 or 15(d) of the Securities Exchange Act of 1934 during the preceding 12 months (or for such shorter period that the registrant was required to file such reports), and (2) has been subject to such filing requirements for the past 90 days. | þ | Yes | ☐ | No |
Indicate by check mark whether the registrant has submitted electronically every Interactive Data File required to be submitted pursuant to Rule 405 of Regulation S-T (§232.405 of this chapter) during the preceding 12 months (or for such shorter period that the registrant was required to submit such files). | þ | Yes | ☐ | No |
Indicate by check mark whether the registrant is a large accelerated filer, an accelerated filer, a non-accelerated filer, or an emerging growth company.
See definition of “large accelerated filer,” “accelerated filer,” and “emerging growth company” in Rule 12b-2 of the Exchange Act.
Large accelerated filer | þ | Accelerated filer | ☐ | Non-accelerated filer | ☐ | ||
Emerging growth company | ☐ | ||||||
If an emerging growth company that prepares its financial statements in accordance with U.S. GAAP, indicate by check mark if the registrant has elected not to use the extended transition period for complying with any new or revised financial accounting standards† provided pursuant to Section 13(a) of the Exchange Act. | ☐ | ||||||
† The term “new or revised financial accounting standards” refers to any update issued by the Financial Accounting Standards Board to its Accounting Standards Codification after April 5, 2012.
Indicate by check mark which basis of accounting the registrant has used to prepare the financial statements included in this filing: | U.S. GAAP | ☐ | ||||
International Financial Reporting Standards as issued by the International Accounting Standards Board. | þ | Other | ☐ | |||
If “Other” has been checked in response to the previous question, indicate by check mark which financial statement item the registrant has elected to follow. | Item 17 | ☐ | Item 18 | ☐ | ||
If this is an annual report, indicate by check mark whether the registrant is a shell company (as defined in Rule 12b-2 of the Exchange Act). | ☐ | Yes | þ | No | ||
Copies of notices and communications from the Securities and Exchange Commission should be sent to:
Royal Dutch Shell plc
Carel van Bylandtlaan 30
2596 HR, The Hague, The Netherlands
Attn: Linda M. Coulter
INTENTIONALLY LEFT BLANK
INTENTIONALLY LEFT BLANK
INTENTIONALLY LEFT BLANK
Cross reference to Form 20-F | |
Part I | Pages | |||
Item 1. | Identity of Directors, Senior Management and Advisers | N/A | ||
Item 2. | Offer Statistics and Expected Timetable | N/A | ||
Item 3. | Key Information | |||
A. | Selected financial data | 8, 214-215 | ||
B. | Capitalization and indebtedness | N/A | ||
C. | Reasons for the offer and use of proceeds | N/A | ||
D. | Risk factors | 11-15 | ||
Item 4. | Information on the Company | |||
A. | History and development of the company | 6, 7, 9, 10, 18-19, 22-33, 43-46, 50-54, 213, 219-220 | ||
B. | Business overview | 7-19, 22-50, 55-58, 189-206, 218 | ||
C. | Organizational structure | 9-10, Exhibit 8.1 | ||
D. | Property, plants and equipment | 9-10, 11-15, 18-19, 22-50, 55-58, 189-206 | ||
Item 4A. | Unresolved Staff Comments | N/A | ||
Item 5. | Operating and Financial Review and Prospects | |||
A. | Operating results | 11-15, 18-50, 176-181 | ||
B. | Liquidity and capital resources | 10, 11, 18-19, 22-23, 28-29, 43-44, 50-54, 153-156, 166-170, 173-181 | ||
C. | Research and development, patents and licences, etc. | 10 | ||
D. | Trend information | 10, 11-15, 16-21, 22-25, 28-33, 43-46, 50-65, | ||
E. | Off-balance sheet arrangements | 53 | ||
F. | Tabular disclosure of contractual obligations | 53 | ||
G. | Safe harbor | 5-6 | ||
Item 6. | Directors, Senior Management and Employees | |||
A. | Directors and senior management | 68-74, 127-130 | ||
B. | Compensation | 102-115, 187 | ||
C. | Board practices | 68-74, 75-115, 119-123, 126-129, 130-131 | ||
D. | Employees | 66, 187 | ||
E. | Share ownership | 67, 98-123, 130, 182-183, 213 | ||
Item 7. | Major Shareholders and Related Party Transactions | |||
A. | Major shareholders | 214 | ||
B. | Related party transactions | 126-127, 152, 165, 187, 213 | ||
C. | Interests of experts and counsel | N/A | ||
Item 8. | Financial Information | |||
A. | Consolidated Statements and Other Financial Information | 51-54, 138-188, 207-212 | ||
B. | Significant Changes | 127, 188 | ||
Item 9. | The Offer and Listing | |||
A. | Offer and listing details | 213 | ||
B. | Plan of distribution | N/A | ||
C. | Markets | 213 | ||
D. | Selling shareholders | N/A | ||
E. | Dilution | N/A | ||
F. | Expenses of the issue | N/A | ||
Item 10. | Additional Information | |||
A. | Share capital | N/A | ||
B. | Memorandum and articles of association | 131-136 | ||
C. | Material contracts | N/A | ||
D. | Exchange controls | 216 | ||
E. | Taxation | 216-217 | ||
F. | Dividends and paying agents | N/A | ||
G. | Statement by experts | N/A | ||
INTRODUCTION SHELL FORM 20-F 2019 | 02 | |
H. | Documents on display | 6 | ||
I. | Subsidiary Information | N/A | ||
Item 11. | Quantitative and Qualitative Disclosures About Market Risk | 51, 166, 177-181 | ||
Item 12. | Description of Securities Other than Equity Securities | |||
A. | Debt Securities | Exhibit 2.3 | ||
B. | Warrants and Rights | N/A | ||
C. | Other Securities | N/A | ||
D. | American Depositary Shares | 213, 215-216, Exhibit 2.3 | ||
Part II | ||||
Item 13. | Defaults, Dividend Arrearages and Delinquencies | N/A | ||
Item 14. | Material Modifications to the Rights of Security Holders and Use of Proceeds | N/A | ||
Item 15. | Controls and Procedures | 128-130, 141, 207-208, Exhibits 12.1 & 12.2 | ||
Item 16. | [Reserved] | |||
Item 16A. | Audit committee financial expert | 92, 130 | ||
Item 16B. | Code of Ethics | 127 | ||
Item 16C. | Principal Accountant Fees and Services | 96, 188, 212 | ||
Item 16D. | Exemptions from the Listing Standards for Audit Committees | 130 | ||
Item 16E. | Purchases of Equity Securities by the Issuer and Affiliated Purchasers | 53, 126 | ||
Item 16F. | Change in Registrant’s Certifying Accountant | N/A | ||
Item 16G. | Corporate Governance | 127, 130-131 | ||
Item 16H. | Mine Safety Disclosure | N/A | ||
Part III | ||||
Item 17. | Financial Statements | N/A | ||
Item 18. | Financial Statements | 138-188, 207-212 | ||
Item 19. | Exhibits | 221 | ||
INTRODUCTION SHELL FORM 20-F 2019 | 03 | |
Terms and abbreviations | |
Currencies | |
$ | US dollar |
€ | euro |
£ | sterling |
Units of measurement | |
acre | approximately 0.004 square kilometres |
b(/d) | barrels (per day) |
boe(/d) | barrels of oil equivalent (per day); natural gas volumes are converted into oil equivalent using a factor of 5,800 scf per barrel |
kboe(/d) | thousand barrels of oil equivalent (per day); natural gas volumes are converted into oil equivalent using a factor of 5,800 scf per barrel |
MMBtu | million British thermal units |
megajoule | a unit of energy equal to one million joules |
mtpa | million tonnes per annum |
per day | volumes are converted into a daily basis using a calendar year |
scf(/d) | standard cubic feet (per day) |
Products | |
GTL | gas to liquids |
LNG | liquefied natural gas |
LPG | liquefied petroleum gas |
NGL | natural gas liquids |
Miscellaneous | |
ADS | American Depositary Share |
AGM | Annual General Meeting |
API | American Petroleum Institute |
CCS | carbon capture and storage |
CCS earnings | earnings on a current cost of supplies basis |
CO2 | carbon dioxide |
EMTN | Euro medium-term note |
EPS | earnings per share |
FCF | free cash flow |
FID | final investment decision |
GAAP | generally accepted accounting principles |
GHG | greenhouse gas |
HSSE | health, safety, security and environment |
IAS | International Accounting Standard |
IEA | International Energy Agency |
IFRS | International Financial Reporting Standard(s) |
IOGP | International Association of Oil & Gas Producers |
IPIECA | International Petroleum Industry Environmental Conservation Association (global oil and gas industry association for environmental and social issues) |
LTIP | Long-term Incentive Plan |
OECD | Organisation for Economic Co-operation and Development |
OML | oil mining lease |
OPEC | Organization of the Petroleum Exporting Countries |
OPL | oil prospecting licence |
PSC | production-sharing contract |
PSP | Performance Share Plan |
REMCO | Remuneration Committee |
SEC | US Securities and Exchange Commission |
TRCF | total recordable case frequency |
TSR | total shareholder return |
WTI | West Texas Intermediate |
INTRODUCTION SHELL FORM 20-F 2019 | 04 | |
About this Report | |
This Form 20-F as filed with the US Securities and Exchange Commission for the year ended December 31, 2019 (this Report) presents the Consolidated Financial Statements of Royal Dutch Shell plc (the Company) and its subsidiaries (collectively referred to as Shell) (pages 142-189) and the Financial Statements of the Royal Dutch Shell Dividend Access Trust (pages 209-211). Except for these Financial Statements, the numbers presented throughout this Report may not sum precisely to the totals provided and percentages may not precisely reflect the absolute figures due to rounding. Cross references to Form 20-F are set out on pages 2-3 of this Report.
The financial statements contained in this Report have been prepared in accordance with International Financial Reporting Standards (IFRS) as issued by the IASB. IFRS as defined above includes interpretations issued by the IFRS Interpretations Committee. Financial reporting terms used in this Report are in accordance with IFRS.
This Report contains certain following forward-looking non-GAAP measures such as cash capital expenditure and divestments. We are unable to provide a reconciliation of these forward-looking Non-GAAP measures to the most comparable GAAP financial measures because certain information needed to reconcile those Non-GAAP measures to the most comparable GAAP financial measures is dependent on future events some of which are outside the control of the company, such as oil and gas prices, interest rates and exchange rates. Moreover, estimating such GAAP measures with the required precision necessary to provide a meaningful reconciliation is extremely difficult and could not be accomplished without unreasonable effort. Non-GAAP measures in respect of future periods which cannot be reconciled to the most comparable GAAP financial measure are calculated in a manner which is consistent with the accounting policies applied in Royal Dutch Shell plc’s financial statements.
The companies in which Royal Dutch Shell plc directly or indirectly own investments are separate legal entities. In addition to the term “Shell”, in this Report “Shell Group”, “we”, “us” and “our” are also used to refer to the Company and its subsidiaries in general or to those who work for them. These terms are also used where no useful purpose is served by identifying the particular entity or entities. “Subsidiaries” and “Shell subsidiaries” refer to those entities over which the Company has control, either directly or indirectly. Entities and unincorporated arrangements over which Shell has joint control are generally referred to as “joint ventures” and “joint operations”, respectively. “Joint ventures” and “joint operations” are collectively referred to as “joint arrangements”. Entities over which Shell has significant influence but neither control nor joint control are referred to as “associates”. The term “Shell interest” is used for convenience to indicate the direct and/or indirect ownership interest held by Shell in an entity or unincorporated joint arrangement, after exclusion of all third party interest. Shell subsidiaries’ data include their interests in joint operations.
It is important to note that Shell’s existing portfolio has been decades in development. While we believe our portfolio is resilient under a wide range of outlooks, including the IEA’s 450 scenario (World Energy Outlook 2016), it includes assets across a spectrum of energy intensities including some with above-average intensity. While we seek to enhance our operations’ average energy intensity through both the development of new projects and divestments, we have no immediate plans to move to a net-zero emissions portfolio over our investment horizon of 10-20 years. Although we have no immediate plans to move to a net-zero emissions portfolio, in November of 2017, we announced our ambition to reduce our Net Carbon Footprint in step with society’s progress towards the Paris Agreement’s goal of holding the rise in global average temperatures this century to well below 2°C above pre‑industrial levels. Accordingly, assuming society aligns itself with the Paris Agreement’s goals, we aim to reduce our Net Carbon Footprint, which includes not only our direct and indirect carbon emissions, associated with producing the energy products which we sell, but also our customers’ emissions from their use of the energy products that we sell, by around 20% in 2035 and by around 50% in 2050.
Shell’s “Net Carbon Footprint” referred to in this Report includes Shell’s carbon emissions from the production of our energy products, our suppliers’
carbon emissions in supplying energy for that production, and our customers’ carbon emissions associated with their use of the energy products we sell. Shell only controls its own emissions but, to support society in achieving the Paris Agreement goals, we aim to help such suppliers and consumers to likewise lower their emissions. The use of the term Net Carbon Footprint” is for convenience only and not intended to suggest these emissions are those of Shell or its subsidiaries.
Except where indicated, the figures shown in the tables in this Report are in respect of subsidiaries only, without deduction of any non-controlling interest. However, the term “Shell share” is used for convenience to refer to the volumes of hydrocarbons that are produced, processed or sold through subsidiaries, joint ventures and associates. All of a subsidiary’s production, processing or sales volumes (including the share of joint operations) are included in the Shell share, even if Shell owns less than 100% of the subsidiary. In the case of joint ventures and associates, however, Shell-share figures are limited only to Shell’s entitlement. In all cases, royalty payments in kind are deducted from the Shell share.
Except where indicated, the figures shown in this Report are stated in US dollars. As used herein all references to “dollars” or “$” are to the US currency.
This Report contains forward-looking statements (within the meaning of the US Private Securities Litigation Reform Act of 1995) concerning the financial condition, results of operations and businesses of Shell. All statements other than statements of historical fact are, or may be deemed to be, forward-looking statements. Forward-looking statements are statements of future expectations that are based on management’s current expectations and assumptions and involve known and unknown risks and uncertainties that could cause actual results, performance or events to differ materially from those expressed or implied in these statements. Forward-looking statements include, among other things, statements concerning the potential exposure of Shell to market risks and statements expressing management’s expectations, beliefs, estimates, forecasts, projections and assumptions. These forward-looking statements are identified by their use of terms and phrases such as “aim”, “ambition”, “anticipate”, “believe”, “could”, “estimate”, “expect”, “goals”, “intend”, “may”, “objectives”, “outlook”, “plan”, “probably”, “project”, “risks”, “schedule”, “seek”, “should”, “target”, “will” and similar terms and phrases. There are a number of factors that could affect the future operations of Shell and could cause those results to differ materially from those expressed in the forward-looking statements included in this Report, including (without limitation): (a) price fluctuations in crude oil and natural gas; (b) changes in demand for Shell’s products; (c) currency fluctuations; (d) drilling and production results; (e) reserves estimates; (f) loss of market share and industry competition; (g) environmental and physical risks; (h) risks associated with the identification of suitable potential acquisition properties and targets, and successful negotiation and completion of such transactions; (i) the risk of doing business in developing countries and countries subject to international sanctions; (j) legislative, fiscal and regulatory developments including regulatory measures addressing climate change; (k) economic and financial market conditions in various countries and regions; (l) political risks, including the risks of expropriation and renegotiation of the terms of contracts with governmental entities, delays or advancements in the approval of projects and delays in the reimbursement for shared costs; and (m) changes in trading conditions. Also see “Risk factors” on pages 11-15 for additional risks and further discussion. No assurance is provided that future dividend payments will match or exceed previous dividend payments. All forward-looking statements contained in this Report are expressly qualified in their entirety by the cautionary statements contained or referred to in this section. Readers should not place undue reliance on forward-looking statements. Each forward-looking statement speaks only as of the date of this Report. Neither the Company nor any of its subsidiaries undertake any obligation to publicly update or revise any forward-looking statement as a result of new information, future events or other information. In light of these risks, results could differ materially from those stated, implied or inferred from the forward-looking statements contained in this Report.
INTRODUCTION SHELL FORM 20-F 2019 | 05 | |
This Report contains references to Shell’s website, the Shell Sustainability Report, Tax Contribution Report, Shell Industry Association Report and our report on Payments to Governments. These references are for the readers’ convenience only. Shell is not incorporating by reference any information posted on www.shell.com or in the Shell Sustainability Report, Tax Contribution Report, Shell Industry Association Report and our report on Payments to Government.
Shell V-Power and Shell LiveWire are Shell trademarks.
DOCUMENTS ON DISPLAY
The SEC maintains an Internet site that contains reports, proxy and information statements, and other information regarding issuers that file electronically with the SEC. All of the SEC filings made electronically by Shell are available to the public on the SEC website at www.sec.gov (commission file number 001-32575).
This Report is also available, free of charge, at www.shell.com/investors/financial-reporting/sec-filings or at the offices of Shell in The Hague, the Netherlands and London, United Kingdom. Copies of this Report also may be obtained, free of charge, by mail.
INTRODUCTION SHELL FORM 20-F 2019 | 06 | |
Strategic Report
Strategy and outlook | |
STRATEGY
Shell’s purpose is to power progress together by providing more and cleaner energy solutions. Our strategy is to strengthen our position as a leading energy company by providing oil, gas and low-carbon energy products and services as the world’s energy system transforms. Safety and social responsibility are fundamental to our business approach. Shell will only succeed by working collaboratively with customers, governments, investors, business partners and other stakeholders.
Our strategy is founded on our outlook for the energy sector and the chance to grasp the opportunities arising from the substantial changes in the world around us. The rising standard of living of a growing global population is likely to continue to drive demand for energy for years to come. The world will need to find a way to meet this growing demand, while transitioning to a lower-carbon energy system to counter climate change. While liquid and gaseous fuels, including biofuels and hydrogen, will continue to be an important part of the energy mix, over time electricity needs to play a bigger part in the world if it is to meet the goals of the Paris Agreement. Technological advances and the need to tackle climate change mean there is a transition under way to a lower-carbon, multi-source energy system with increasing customer choice. We recognise that the pace and the path forward are uncertain and so require agile decision-making.
STRATEGIC AMBITIONS
Against this backdrop, we have the following strategic ambitions to guide us in pursuing our purpose:
▪ | to thrive in the energy transition by responding to society’s desire for more and cleaner, convenient and competitive energy; |
▪ | to provide a world-class investment case. This involves growing organic free cash flow and increasing returns, all built upon a strong financial framework and resilient portfolio; and |
▪ | to sustain a strong societal licence to operate and make a positive contribution to society through our activities. |
The execution of our strategy is founded on becoming a more customer-centric and simpler, more streamlined organisation, focused on growing returns and organic free cash flow. By investing in competitive projects, delivering increases in cash flow from operations, and driving down costs, we are continually reshaping our portfolio to become a more resilient and focused company.
Our ability to achieve our strategic ambitions depends on how we respond to competitive forces. We continually assess the external environment - the markets and the underlying economic, political, social and environmental drivers that shape them - to evaluate changes in competitive forces and business models. We use multiple future scenarios to assess the resilience of our strategy. We regularly review the markets we operate in, assessing our competitive position by analysing trends and uncertainties, and the strengths and weaknesses of our traditional and non-traditional competitors. We maintain business strategies and plans that focus on actions and capabilities to create and sustain competitive advantage. We maintain a risk management framework that regularly assesses our response to, and risk appetite for, identified risk factors (see “Risk factors” on page 11).
Our Executive Directors’ remuneration is linked to the successful delivery of our strategy and based on performance indicators that are aligned with shareholder interests. Long-term incentives form the majority of the Executive Directors’ remuneration for above-target performance. In 2019, the Long-term Incentive Plan (LTIP) included cash generation, capital discipline, value created for shareholders, and a measure focused on Shell’s strategic ambition to thrive in the energy transition. (See the “Directors’ Remuneration Report” on page 98.
OUTLOOK FOR 2020 AND BEYOND
We continually seek to improve our operating performance and maximise sustainable organic free cash flow, with an emphasis on health, safety, security, environment and asset performance, and our ethics and compliance principles. To do this, we are committed to attracting, developing and retaining a diverse, talented and motivated workforce.
We launched our $25 billion share buyback programme in 2018, and we have completed about $15 billion of buybacks as of February 20, 2020. Our intention to complete the $25 billion share buyback programme remains unchanged, but the pace remains subject to macro conditions and further debt reduction.
Our cash capital expenditure is expected to be at the lower end of the $24 billion to $29 billion range in 2020. Following the successful delivery of our $30 billion divestment programme during 2016-18, divestments are expected to amount to more than $10 billion over the 2019-2020 period.
We fully support the Paris Agreement’s goal to keep the rise in global average temperature this century to well below two degrees Celsius above pre-industrial levels and to pursue efforts to limit temperature increase even further to 1.5 degrees Celsius. We have set a long-term ambition to reduce the Net Carbon Footprint of our energy products in pace with society, measured in grams of carbon-dioxide equivalent per megajoule consumed, by around 20% by 2035 and by around 50% by 2050 compared to 2016. While our ambition is long term, we believe we must act today if we are to help society progress more quickly. In early 2019 we set a three-year target to reduce our Net Carbon Footprint by 2-3% compared with 2016. For the 2020 award, the target range is a 3-4% reduction in our Net Carbon Footprint against the 2016 baseline. It is intended that this target setting will be done annually, with each year's target covering either a three-year or five-year period. Further details are in the "Climate Change and Energy Transition" section on pages 59-65.
Since the start of 2020 there has been a developing outbreak of the COVID-19 (coronavirus). To date, we have not seen a material impact on our operations. As a result of COVID-19, we have seen macro-economic uncertainty with regards to prices and demand for oil, gas and products. Furthermore, recent global developments and uncertainty in oil supply in March have caused further volatility in commodity markets. The scale and duration of these developments remain uncertain but could impact our earnings, cash flow and financial condition.
The statements in this “Strategy and outlook” section, including those related to our growth strategies and our expected or potential future cash flow from operations, organic free cash flow, share buybacks, capital investment, divestments, production and Net Carbon Footprint are based on management’s current expectations and certain material assumptions and, accordingly, involve risks and uncertainties that could cause actual results, performance or events to differ materially from those expressed or implied herein. See “About this Report” on pages 5-6 and “Risk factors” on pages 11-15.
INTRODUCTION SHELL FORM 20-F 2019 | 07 | |
Selected financial data | |
The selected financial data set out below are derived, in part, from the “Consolidated Financial Statements”. These data should be read in conjunction with the “Consolidated Financial Statements” and related Notes, as well as with this Strategic Report.
Consolidated Statement of Income and of Comprehensive Income data | $ million | |||||||||
2019 | 2018 | 2017 | 2016 | 2015 | ||||||
Revenue | 344,877 | 388,379 | 305,179 | 233,591 | 264,960 | |||||
Income for the period | 16,432 | 23,906 | 13,435 | 4,777 | 2,200 | |||||
Income attributable to non-controlling interest | 590 | 554 | 458 | 202 | 261 | |||||
Income attributable to Royal Dutch Shell plc shareholders | 15,842 | 23,352 | 12,977 | 4,575 | 1,939 | |||||
Comprehensive income/(loss) attributable to Royal Dutch Shell plc shareholders | 13,773 | 24,475 | 18,828 | (1,374 | ) | (811 | ) | |||
Consolidated Balance Sheet data | $ million | |||||||||
2019 | 2018 | 2017 | 2016 | 2015 | ||||||
Total assets | 404,336 | 399,194 | 407,097 | 411,275 | 340,157 | |||||
Total debt | 96,424 | 76,824 | 85,665 | 92,476 | 58,379 | |||||
Share capital | 657 | 685 | 696 | 683 | 546 | |||||
Equity attributable to Royal Dutch Shell plc shareholders | 186,476 | 198,646 | 194,356 | 186,646 | 162,876 | |||||
Non-controlling interest | 3,987 | 3,888 | 3,456 | 1,865 | 1,245 | |||||
Consolidated Statement of Cash Flows data | $ million | |||||||||
2019 | 2018 | 2017 | 2016 | 2015 | ||||||
Cash flow from operating activities | 42,178 | 53,085 | 35,650 | 20,615 | 29,810 | |||||
Capital expenditure | 22,971 | 23,011 | 20,845 | 22,116 | 26,131 | |||||
Cash flow from investing activities | 15,779 | 13,659 | 8,029 | 30,963 | 22,407 | |||||
Cash dividends paid to Royal Dutch Shell plc shareholders | 15,198 | 15,675 | 10,877 | 9,677 | 9,370 | |||||
Repurchases of shares | 10,188 | 3,947 | — | — | 409 | |||||
Earnings per share | $ | |||||||||
2019 | 2018 | 2017 | 2016 | 2015 | ||||||
Basic earnings per €0.07 ordinary share | 1.97 | 2.82 | 1.58 | 0.58 | 0.31 | |||||
Diluted earnings per €0.07 ordinary share | 1.95 | 2.80 | 1.56 | 0.58 | 0.30 | |||||
Dividend per share | $ | |||||||||
2019 | 2018 | 2017 | 2016 | 2015 | ||||||
Dividend per share | 1.88 | 1.88 | 1.88 | 1.88 | 1.88 | |||||
Shares | Million | |||||||||
2019 | 2018 | 2017 | 2016 | 2015 | ||||||
Basic weighted average number of A and B shares | 8,058.3 | 8,282.8 | 8,223.4 | 7,833.7 | 6,320.3 | |||||
Diluted weighted average number of A and B shares | 8,112.5 | 8,348.7 | 8,299.0 | 7,891.7 | 6,393.8 | |||||
STRATEGIC REPORT SHELL FORM 20-F 2019 | 8 | |
Shell story | |

Organisation
We describe below how our activities are organised.
Integrated Gas (including New Energies)
Our Integrated Gas organisation manages LNG activities and the conversion of natural gas into GTL fuels and other products. It includes natural gas exploration and extraction, and the operation of upstream and midstream infrastructure necessary to deliver gas to market. It markets and trades natural gas, LNG, electricity and carbon-emission rights and also markets and sells LNG as a fuel for heavy-duty vehicles and marine vessels.
In New Energies, we are exploring emerging opportunities and investing in those where we believe sufficient commercial value is available. We focus on new fuels for transport, such as advanced biofuels, hydrogen and charging for battery-electric vehicles; and power, including from natural gas and low-carbon sources such as wind and solar.
Upstream
Our Upstream organisation manages the exploration for and extraction of crude oil, natural gas and natural gas liquids. It also markets and transports oil and gas, and operates infrastructure necessary to deliver them to market.
STRATEGIC REPORT SHELL FORM 20-F 2019 | 9 | |
Downstream
Our Downstream organisation manages different Oil Products and Chemicals activities as part of an integrated value chain, that trades and refines crude oil, and other feedstocks into a range of products which are moved and marketed around the world for domestic, industrial and transport use. The products we sell include gasoline, diesel, heating oil, aviation fuel, marine fuel, biofuel, lubricants, bitumen and sulphur. We also produce and sell petrochemicals for industrial use worldwide. Our Downstream organisation also manages Oil Sands activities (the extraction of bitumen from mined oil sands and its conversion into synthetic crude oil).
Projects & Technology
Our Projects & Technology organisation manages the delivery of our major projects and drives research and innovation to develop new technology solutions. It provides technical services and technology capability for our Integrated Gas, Upstream and Downstream activities. It is also responsible for providing functional leadership across Shell in the areas of safety and environment, contracting and procurement, wells activities and greenhouse gas management.
Our future hydrocarbon production depends on the delivery of large and integrated projects (see “Risk factors” on pages 11-15). Systematic management of life-cycle technical and non-technical risks is in place for each opportunity, with assurance and control activities embedded throughout the project life cycle. We focus on the cost-effective delivery of projects through commercial agreements, supply-chain management, and construction and engineering productivity through effective planning and simplification of delivery processes. Development of our employees’ project management competencies is underpinned by project principles, standards and processes. A dedicated competence framework, training, standards and processes exist for various technical disciplines. We also provide governance support for our non-Shell-operated ventures or projects.
Segmental reporting
Our reporting segments are Integrated Gas, Upstream, Downstream and Corporate. Upstream combines the operating segments Upstream (managed by our Upstream organisation) and Oil Sands (managed by our Downstream organisation), which have similar economic characteristics. Integrated Gas, Upstream and Downstream include their respective elements of our Projects & Technology organisation. The Corporate segment comprises our holdings and treasury organisation, self-insurance activities, and headquarters and central functions. See Note 4 to the “Consolidated Financial Statements” on pages 158-161.
With effect from 2020, our reporting segments were amended with the change in the way the CEO reviews and assesses performance of the group and consist of Integrated Gas, Upstream, Oil Products, Chemicals and Corporate.
Revenue by business segment (including inter-segment sales) | $ million | |||||
2019 | 2018 | 2017 | ||||
Integrated Gas | ||||||
Third parties | 41,322 | 43,764 | 32,674 | |||
Inter-segment | 4,280 | 5,031 | 4,096 | |||
Total | 45,602 | 48,795 | 36,770 | |||
Upstream | ||||||
Third parties | 9,965 | 9,892 | 7,723 | |||
Inter-segment | 36,448 | 37,841 | 32,469 | |||
Total | 46,413 | 47,733 | 40,192 | |||
Downstream | ||||||
Third parties | 293,545 | 334,680 | 264,731 | |||
Inter-segment | 1,132 | 917 | 1,090 | |||
Total | 294,677 | 335,597 | 265,821 | |||
Corporate | ||||||
Third parties | 45 | 43 | 51 | |||
Total | 45 | 43 | 51 | |||
Revenue by geographical area (excluding inter-segment sales) | $ million | |||||
2019 | 2018 | 2017 | ||||
Europe | 98,455 | 118,960 | 100,609 | |||
Asia, Oceania, Africa | 139,916 | 153,716 | 114,683 | |||
USA | 83,212 | 89,876 | 66,854 | |||
Other Americas | 23,294 | 25,827 | 23,033 | |||
Total | 344,877 | 388,379 | 305,179 | |||
Technology and innovation
Technology and innovation are essential to our efforts to meet the world’s energy needs in a competitive way. If we do not develop the right technology, do not have access to it or do not deploy it effectively, this could have a material adverse effect on the delivery of our strategy and our licence to operate (see “Risk factors” on pages 11-15). We continuously look for technologies and innovations of potential relevance to our business. Our Chief Technology Officer oversees the development and deployment of new and differentiating technologies and innovations across Shell, seeking to align business and technology requirements throughout our technology maturation process.
In 2019, research and development expenses were $962 million, compared with $986 million in 2018, and $922 million in 2017. Our main technology centres are in India, the Netherlands and the USA, with other centres in Brazil, China, Germany, Oman, and Qatar. A strong patent portfolio underlies the technology that we employ in our various businesses. In total, we have around 9,449 granted patents and pending patent applications.
STRATEGIC REPORT SHELL FORM 20-F 2019 | 10 | |
Risk factors | |
The risks discussed below could have a material adverse effect separately, or in combination, on our earnings, cash flows and financial condition. Accordingly, investors should carefully consider these risks.
Further background and measures that we use when assessing various risks are set out in the relevant sections of this Report, indicated by way of cross references under each risk factor.
The Board’s responsibility for identifying, evaluating and managing our significant risks is discussed in “Other Regulatory and Statutory Information” on pages 128-130.
We are exposed to macroeconomic risks including fluctuating prices of crude oil, natural gas, oil products and chemicals.
The prices of crude oil, natural gas, oil products and chemicals are affected by supply and demand, both globally and regionally. Furthermore, macroeconomic risks can affect demand for our products. Government actions may also affect the prices of crude oil, natural gas, oil products and chemicals. This could happen, for example, by promoting the sale of lower-carbon electric vehicles or even through the future prohibition of sales of new diesel or gasoline vehicles, such as the prohibition in the United Kingdom (UK) beginning in 2035. Prices for oil and gas can also move independently of each other. Factors that influence supply and demand include operational issues, natural disasters, weather, pandemics, such as the COVID-19 (coronavirus) outbreak, political instability, conflicts, economic conditions and actions by major oil and gas producing countries. In a low oil and gas price environment, we would generate less revenue from our Upstream and Integrated Gas businesses, and, as a result, parts of those businesses could become less profitable, or could incur losses. Low oil and gas prices have also resulted and could continue to result in the debooking of proved oil or gas reserves, if they become uneconomic in this type of price environment. Prolonged periods of low oil and gas prices, or rising costs, have resulted and could continue to result in projects being delayed or cancelled. Assets have also been impaired in the past, and there could be impairments in the future. Low oil and gas prices could also affect our ability to maintain our long-term capital investment programme and dividend payments. Prolonged periods of low oil and gas prices could adversely affect the financial, fiscal, legal, political and social stability of countries that rely significantly on oil and gas revenue. In a high oil and gas price environment, we could experience sharp increases in costs, and, under some production-sharing contracts, our entitlement to proved reserves would be reduced. Higher prices could also reduce demand for our products, which could result in lower profitability, particularly in our Downstream business. Also, higher prices can result in more capacity being built which results in an oversupply of products that can negatively impact our LNG and Chemicals business. Accordingly, price fluctuations could have a material adverse effect on our earnings, cash flows and financial condition.
See “Market overview” on page 16.
Our ability to deliver competitive returns and pursue commercial opportunities depends in part on the accuracy of our price assumptions.
We use a range of oil and gas price assumptions, which we review on a periodic basis, to evaluate projects and commercial opportunities. If our assumptions prove to be incorrect, it could have a material adverse effect on our earnings, cash flows and financial condition.
See “Market overview” on page 17.
Our ability to achieve our strategic objectives depends on how we react to competitive forces.
We face competition in each of our businesses. We seek to differentiate our products; however, many of them are competing in commodity-type markets. Accordingly, failure to manage our costs as well as our operational performance could result in a material adverse effect on our earnings, cash flows and financial condition. We also compete with state-owned oil and gas
entities with access to vast financial resources. State-owned entities could be motivated by political or other factors in making their business decisions. Accordingly, when bidding on new leases or projects, we could find ourselves at a competitive disadvantage as these state-owned entities may not require a competitive return. If we are unable to obtain competitive returns when bidding on new leases or projects, it could have a material adverse effect on our earnings, cash flows and financial condition.
See “Strategy and outlook” on page 7.
We seek to execute divestments in the pursuit of our strategy. We may not be able to successfully divest these assets in line with our strategy.
We may not be able to successfully divest assets at acceptable prices or within the timeline envisaged due to market conditions or credit risk. This would result in increased pressure on our cash position and potential impairments. In some cases, we have also retained certain liabilities following a divestment. Even in cases where we have not expressly retained certain liabilities, we may still be held liable for past acts, failures to act or liabilities that are different from those foreseen. We may also face liabilities if a purchaser fails to honour their commitments. Accordingly, if we are unable to divest assets at acceptable prices or within our envisaged timeframe, this could have a material adverse effect on our earnings, cash flows and financial condition.
See “Strategy and outlook” on page 7.
Our future hydrocarbon production depends on the delivery of large and integrated projects, as well as on our ability to replace proved oil and gas reserves.
We face numerous challenges in developing capital projects, especially those which are large and integrated. Challenges include: uncertain geology; frontier conditions; the existence and availability of necessary technology and engineering resources; the availability of skilled labour; the existence of transportation infrastructure; project delays; the expiration of licences; potential cost overruns; and technical, fiscal, regulatory, political and other conditions. These challenges are particularly relevant in certain developing and emerging-market countries, in frontier areas and in deep-water fields, such as off the coast of Brazil. We may fail to assess or manage these and other risks properly. Such potential obstacles could impair our delivery of these projects, our ability to fulfil the value potential determined at the time of the project investment approval, and/or our ability to fulfil related contractual commitments. These could lead to impairments and could have a material adverse effect on our earnings, cash flows and financial condition.
Future oil and gas production will depend on our access to new proved reserves through exploration, negotiations with governments and other owners of proved reserves and acquisitions, as well as on developing and applying new technologies and recovery processes to existing fields. Failure to replace proved reserves could result in lower future production, potentially having a material adverse effect on our earnings, cash flows and financial condition.
See “Shell Story” on page 10.
Oil and gas production available for sale | Million boe [A] | |||||
2019 | 2018 | 2017 | ||||
Shell subsidiaries | 1,182 | 1,179 | 1,168 | |||
Shell share of joint ventures and associates | 156 | 159 | 170 | |||
Total | 1,338 | 1,338 | 1,338 | |||
[A] Natural gas volumes are converted into oil equivalent using a factor of 5,800 scf per barrel..
STRATEGIC REPORT SHELL FORM 20-F 2019 | 11 | |
Proved developed and undeveloped oil and gas reserves [A][B] (at December 31) | Million boe [C] | |||||
2019 | 2018 | 2017 | ||||
Shell subsidiaries | 9,980 | 10,294 | 10,177 | |||
Shell share of joint ventures and associates | 1,116 | 1,285 | 2,056 | |||
Total | 11,096 | 11,578 | 12,233 | |||
Attributable to non-controlling interest in Shell subsidiaries | 304 | 331 | 325 | |||
[A] We manage our total proved reserves base without distinguishing between proved reserves from subsidiaries and those from joint ventures and associates.
[B] Includes proved reserves associated with future production that will be consumed in operations.
[C] Natural gas volumes are converted into oil equivalent using a factor of 5,800 scf per barrel.
The estimation of proved oil and gas reserves involves subjective judgements based on available information and the application of complex rules; therefore, subsequent downward adjustments are possible.
The estimation of proved oil and gas reserves involves subjective judgements and determinations based on available geological, technical, contractual and economic information. Estimates could change because of new information from production or drilling activities, or changes in economic factors, including changes in the price of oil or gas and changes in the regulatory policies of host governments, or other events. Estimates could also be altered by acquisitions and divestments, new discoveries, and extensions of existing fields and mines, as well as the application of improved recovery techniques. Published proved oil and gas reserves estimates could also be subject to correction due to errors in the application of published rules and changes in guidance. Downward adjustments could indicate lower future production volumes and could also lead to impairment of assets. This could have a material adverse effect on our earnings, cash flows and financial condition.
See “Supplementary information - oil and gas (unaudited)” on page 189.
Rising climate change concerns have led and could lead to additional legal and/or regulatory measures which could result in project delays or cancellations, a decrease in demand for fossil fuels, potential litigation and additional compliance obligations.
In December 2015, 195 nations adopted the Paris Agreement, which we fully support. The Paris Agreement aims to limit increases in global temperatures to well below two degrees Celsius above pre-industrial levels and to pursue efforts to limit the temperature increase even further to 1.5 degrees Celsius. As a result, we expect continued and increased attention to climate change from all sectors of society. This attention has led, and we expect it to continue to lead, to additional regulations designed to reduce greenhouse gas (GHG) emissions.
We expect that a growing share of our GHG emissions will be subject to regulation, resulting in increased compliance costs and operational restrictions. If our GHG emissions rise alongside our ambitions to increase the scale of our business, our regulatory burden will increase proportionally. We also expect that GHG regulation, as well as emission reduction actions by customers, will continue to result in suppression of demand for fossil fuels, either through taxes, fees and/or incentives to promote the sale of lower-carbon electric vehicles or even through the future prohibition of sales of new diesel or gasoline vehicles, such as the prohibition in the United Kingdom (UK) beginning in 2035. This could result in lower revenue and, in the long term, potential impairment of certain assets.
In addition, the physical effects of climate change such as, but not limited to, rise in temperature, sea-level rise and fluctuations in water levels could adversely impact both our operations and supply chains.
In some countries, governments, regulators, organisations and individuals have filed lawsuits seeking to hold fossil fuel companies liable for costs associated with climate change. While we believe these lawsuits to be without merit, losing any of these lawsuits could have a material adverse effect on our earnings, cash flows and financial condition.
Additionally, some groups are pressuring certain investors to divest their investments in fossil fuel companies. If this were to continue, it could have a material adverse effect on the price of our securities and our ability to access capital markets. Additionally, some groups are pressuring commercial and investment banks from financing fossil fuel companies. Furthermore, according to press reports, some financial institutions also appear to be considering limiting their exposure to certain fossil fuel projects. Accordingly, our ability to use financing for future projects may be adversely impacted. This could also adversely impact our potential partners’ ability to finance their portion of costs, either through equity or debt.
If we are unable to find economically viable, as well as publicly acceptable, solutions that reduce our GHG emissions and/or GHG intensity for new and existing projects or for the products we sell, we could experience additional costs or financial penalties, delayed or cancelled projects, and/or reduced production and reduced demand for hydrocarbons. This could have a material adverse effect on our earnings, cash flows and financial condition.
If we are unable to keep pace with society’s energy transition or we are unable to provide the desired low-GHG-emissions products needed to facilitate society’s energy transition, it could have a material adverse effect on our earnings, cash flows and financial condition.
See “Climate change and energy transition” on pages 60.
Our business exposes us to risks of social instability, criminality, civil unrest, terrorism, piracy, cyber-disruption, acts of war and pandemic diseases, such as the COVID-19 (coronavirus) outbreak, that could have a material adverse effect on our operations.
As seen in recent years, these risks can manifest themselves in the countries in which we operate and elsewhere. These risks affect people and assets. Potential risks include: acts of terrorism; acts of criminality including maritime piracy; cyber-espionage or disruptive cyber-attacks; conflicts including war, civil unrest and environmental and climate activism (including disruptions by non-governmental and political organisations); and pandemic diseases, such as the COVID-19 (coronavirus) outbreak.
The above risks can threaten the safe operation of our facilities and transport of our products, cause disruption of operational activities, environmental harm, loss of life, injuries and impact the well-being of our people.
These risks could have a material adverse effect on our earnings, cash flows and financial condition.
See “Environment and society” on pages 55.
We operate in more than 70 countries that have differing degrees of political, legal and fiscal stability. This exposes us to a wide range of political developments that could result in changes to contractual terms, laws and regulations. In addition, we and our joint arrangements and associates face the risk of litigation and disputes worldwide.
Developments in politics, laws and regulations can and do affect our operations. Potential impacts include: forced divestment of assets; expropriation of property; cancellation or forced renegotiation of contract rights; additional taxes including windfall taxes, restrictions on deductions and retroactive tax claims; antitrust claims; changes to trade compliance regulations; price controls; local content requirements; foreign exchange controls; changes to environmental regulations; changes to regulatory interpretations and enforcement; and changes to disclosure requirements. Any of these, individually or in aggregate, could have a material adverse effect on our earnings, cash flows and financial condition.
In addition to the above risks, the UK left the European Union (EU) on January 31, 2020 and enters into a period of transition which ends on December 31, 2020. The UK has stated that it will not extend the period of transition, and has confirmed plans to introduce import controls on EU goods at the border after the period of transition ends. Whatever the outcome of negotiations, we may experience delays in moving our products and employees between the UK and EU. Also, additional tariffs and taxes could impact the demand for some of our products. This potential delay and
STRATEGIC REPORT SHELL FORM 20-F 2019 | 12 | |
reduced demand for our products, combined with the potential adverse changes in macroeconomic conditions in both the EU and UK, could have a material adverse effect on our earnings and cash flows.
From time to time, social and political factors play a role in unprecedented and unanticipated judicial outcomes that could adversely affect Shell. Non‑compliance with policies and regulations could result in regulatory investigations, litigation and, ultimately, sanctions. Certain governments and regulatory bodies have, in Shell’s opinion, exceeded their constitutional authority by: attempting unilaterally to amend or cancel existing agreements or arrangements; failing to honour existing contractual commitments; and seeking to adjudicate disputes between private litigants. Additionally, certain governments have adopted laws and regulations that could potentially conflict with other countries’ laws and regulations, potentially subjecting us to both criminal and civil sanctions. Such developments and outcomes could have a material adverse effect on our earnings, cash flows and financial condition.
See “Other Regulatory and Statutory Information” on page 129.
The nature of our operations exposes us, and the communities in which we work, to a wide range of health, safety, security and environment risks.
The health, safety, security and environment (HSSE) risks to which we, and the communities in which we work, are potentially exposed cover a wide spectrum, given the geographic range, operational diversity and technical complexity of our operations. These risks include the effects of natural disasters (including weather events), earthquakes, social unrest, personal health and safety lapses, and crime. If a major risk materialises, such as an explosion or hydrocarbon spill, this could result in injuries, loss of life, environmental harm, disruption of business activities, and loss or suspension of our licence to operate or ability to bid on mineral rights. Accordingly, this could have a material adverse effect on our earnings, cash flows and financial condition.
Our operations are subject to extensive HSSE regulatory requirements that often change and are likely to become more stringent over time. Governments could require operators to adjust their future production plans, as has been done in the Netherlands, affecting production and costs. We could incur significant additional costs in the future due to compliance with these requirements or as a result of violations of, or liabilities under, laws and regulations, such as fines, penalties, clean-up costs and third-party claims. Therefore, HSSE risks, should they materialise, could have a material adverse effect on our earnings, cash flows and financial condition.
See “Environment and society” on page 55.
A further erosion of the business and operating environment in Nigeria could have a material adverse effect on us.
In our Nigerian operations, we face various risks and adverse conditions. These include: security issues surrounding the safety of our people, host communities and operations; sabotage and theft; our ability to enforce existing contractual rights; litigation; limited infrastructure; potential legislation that could increase our taxes or costs of operations; the effect of lower oil and gas prices on the government budget; and regional instability created by militant activities. These risks or adverse conditions could have a material adverse effect on our earnings, cash flows and financial condition.
See “Upstream” on page 32.
Production from the Groningen field in the Netherlands causes earthquakes that affect local communities.
Shell and ExxonMobil are 50:50 shareholders in Nederlandse Aardolie Maatschappij B.V. (NAM). An important part of NAM’s gas production comes from the onshore Groningen gas field, in which EBN, a Dutch government entity, has a 40% interest and NAM a 60% interest. The gas field is in the process of being closed down due to gas-production-induced earthquakes. Some of these earthquakes have caused damage to houses and other structures in the region, resulting in complaints and lawsuits from the local community. The Government has announced their intent for accelerated
close-down to reduce Groningen production to zero by mid-2022. The exact date is still to be decided. While we are hopeful the closing down of the Groningen gas field will reduce the number and strength of earthquakes in the region, any additional earthquakes and lawsuits could have further adverse impacts on our earnings, cash flows and financial condition.
See “Upstream” on page 30.
Our future performance depends on the successful development and deployment of new technologies and new products.
Technology and innovation are essential to our efforts to meet the world’s energy demands in a competitive way. If we do not continue to develop or deploy technology and new products, or fully leverage our data effectively in a timely and cost-effective manner, there could be a material adverse effect on the delivery of our strategy and our licence to operate. We operate in environments where advanced technologies are utilised. In developing new technologies and new products, unknown or unforeseeable technological failures or environmental and health effects could harm our reputation and licence to operate or expose us to litigation or sanctions. The associated costs of new technology are sometimes underestimated, or delays occur. If we are unable to develop the right technology and products in a timely and cost-effective manner, or if we develop technologies and products that adversely impact the environment or health of individuals, there could be a material adverse effect on our earnings, cash flows and financial condition.
See “Shell Story” on page 10.
We are exposed to treasury and trading risks, including liquidity risk, interest rate risk, foreign exchange risk and credit risk. We are affected by the global macroeconomic environment as well as financial and commodity market conditions.
Our subsidiaries, joint arrangements and associates are subject to differing economic and financial market conditions around the world. Political or economic instability affects such markets.
We use debt instruments, such as bonds and commercial paper, to raise significant amounts of capital. Should our access to debt markets become more difficult, the potential impact on our liquidity could have a material adverse effect on our operations. Our financing costs could also be affected by interest rate fluctuations or any credit rating deterioration.
We are exposed to changes in currency values and to exchange controls as a result of our substantial international operations. Our reporting currency is the US dollar. However, to a material extent, we hold assets and are exposed to liabilities in other currencies. While we undertake some foreign exchange hedging, we do not do so for all our activities. Furthermore, even where hedging is in place, it may not function as expected.
We are exposed to credit risk; our counterparties could fail or could be unable to meet their payment and/or performance obligations under contractual arrangements. Although we do not have significant direct exposure to sovereign debt, it is possible that our partners and customers may have exposure which could impair their ability to meet their obligations. In addition, our pension plans invest in government bonds, and therefore could be affected by a sovereign debt downgrade or other default.
If any of the risks set out above materialise, they could have a material adverse effect on our earnings, cash flows and financial condition.
See “Liquidity and capital resources” on page 51 and Note 19 to the “Consolidated Financial Statements” on pages 177-181.
We are exposed to commodity trading risks, including market and operational risks.
Commodity trading is an important component of our Upstream, Integrated Gas and Downstream businesses and is integrated with our supply business. Processing, managing and monitoring a large number of trading transactions across the world, some of which are complex, exposes us to operational and market risks, including commodity price risks. We use derivative instruments such as futures and contracts for differences to hedge market risks. However,
STRATEGIC REPORT SHELL FORM 20-F 2019 | 13 | |
we do not hedge all our activities and where hedging is in place, it may not function as expected. The risk of ineffective controls and oversight of trading activities and the risk that traders, individually or as a group, could act intentionally outside of the limits and controls, could have material adverse effect on our earnings, cash flows and financial condition.
See “Liquidity and capital resources” on page 51 and Note 19 to the “Consolidated Financial Statements” on pages 177-181
We have substantial pension commitments, funding of which is subject to capital market risks and other factors.
Liabilities associated with defined benefit pension plans are significant, as can be the cash funding requirement of such plans; both depend on various assumptions. Volatility in capital markets or government policies, and the resulting consequences for investment performance and interest rates, as well as changes in assumptions for mortality, retirement age or pensionable remuneration at retirement, could result in significant changes to the funding level of future liabilities. We operate a number of defined benefit pension plans and, in case of a shortfall, we could be required to make substantial cash contributions (depending on the applicable local regulations) resulting in a material adverse effect on our earnings, cash flows and financial condition.
See “Liquidity and capital resources” on page 51.
We mainly self-insure our risk exposure. We could incur significant losses from different types of risks that are not covered by insurance from third-party insurers.
Our insurance subsidiaries provide hazard insurance coverage to other Shell entities and only reinsure a portion of their risk exposures. Such reinsurance would not provide any material coverage in the event of a large-scale safety and environmental incident. Accordingly, in the event of a material incident, there would not be any material proceeds available from third-party insurance companies to meet our obligations. Therefore, we may incur significant losses from different types of risks that are not covered by insurance from third-party insurers, potentially resulting in a material adverse effect on our earnings, cash flows and financial condition.
See “Corporate” on page 50.
An erosion of our business reputation could have a material adverse effect on our brand, our ability to secure new resources or access capital markets, and on our licence to operate.
Our reputation is an important asset. The Shell General Business Principles (Principles) govern how Shell and its individual companies conduct their affairs, and the Shell Code of Conduct instructs employees and contract staff on how to behave in line with the Principles. Our challenge is to ensure that all employees and contract staff, more than 100,000 in total, comply with the Principles and the Code of Conduct. Real or perceived failures of governance or regulatory compliance or a perceived lack of understanding of how our operations affect surrounding communities could harm our reputation.
Societal expectations of businesses are increasing, with a focus on business ethics, quality of products, contribution to society, minimising environmental impacts, and safety. There is increasing focus on the role of oil and gas in the context of climate change and energy transition.
This could negatively affect our brand, reputation and licence to operate, which could impact our ability to deliver our strategy, consumer demand for our branded and non-branded products, harm our ability to secure new resources and contracts, and limit our ability to access capital markets or attract staff. Many other factors, including the materialisation of the risks discussed in several of the other risk factors, could negatively impact our reputation and could have a material adverse effect on our earnings, cash flows and financial condition.
See “Other Regulatory and Statutory Information” on page 124 and "Our people" on page 66.
Many of our major projects and operations are conducted in joint arrangements or with associates. This could reduce our degree of control, as well as our ability to identify and manage risks.
In cases where we are not the operator, we have limited influence over, and control of, the behaviour, performance and costs of operation of such joint arrangements or associates. Despite not having control, we could still be exposed to the risks associated with these operations, including reputational, litigation (where joint and several liability could apply) and government sanction risks. For example, our partners or members of a joint arrangement or an associate (particularly local partners in developing countries) may not be able to meet their financial or other obligations to the projects, threatening the viability of a given project. Where we are the operator of a joint arrangement, the other partner(s) could still be able to veto or block certain decisions, which could be to our overall detriment. Accordingly, where we have limited influence, we are exposed to operational risks that could have a material adverse effect on our earnings, cash flows and financial condition.
See “Other Regulatory and Statutory Information” on page 127.
We rely heavily on information technology systems in our operations.
The operation of many of our business processes depends on reliable information technology (IT) systems. Our IT systems are increasingly concentrated in terms of geography, number of systems, and dependent on key contractors supporting the delivery of IT services. Shell is the target of attempts to gain unauthorised access to our IT systems and our data through various channels, including more sophisticated and coordinated attempts often referred to as advanced persistent threats. Breaches have occurred, including to our UK LiveWIRE application where approximately 196,000 accounts and personal data were compromised. Where systems, customers’ accounts and data have been compromised, we undertake to notify all relevant regulators and impacted customers, in accordance with countries' laws and regulations, including privacy requirements. Timely detection is becoming increasingly complex, but we seek to detect and investigate all such security incidents, aiming to prevent their recurrence. Disruption of critical IT services, or breaches of information security, could harm our reputation and have a material adverse effect on our earnings, cash flows and financial condition.
See “Corporate” on page 50.
Violations of antitrust and competition laws carry fines and expose us and/or our employees to criminal sanctions and civil suits.
Antitrust and competition laws apply to Shell and its joint ventures and associates in the vast majority of countries where we do business. Shell and its joint ventures and associates have been fined for violations of antitrust and competition laws in the past. These include a number of fines by the European Commission Directorate-General for Competition (DG COMP). Due to DG COMP’s fining guidelines, any future conviction of Shell or any of its joint ventures or associates for violation of EU competition law could result in significantly larger fines and have a material adverse effect on us. Violation of antitrust laws is a criminal offence in many countries, and individuals can be imprisoned or fined. In certain circumstances, directors may receive director disqualification orders. It is also now common for persons or corporations allegedly injured by antitrust violations to sue for damages. Any violation of these laws can harm our reputation and could have a material adverse effect on our earnings, cash flows and financial condition.
See “Other Regulatory and Statutory Information” on pages 124.
Violations of anti-bribery, tax-evasion and anti-money laundering laws carry fines and expose us and/or our employees to criminal sanctions, civil suits and ancillary consequences (such as debarment and the revocation of licences).
Anti-bribery, tax-evasion and anti-money laundering laws apply to Shell, its joint ventures and associates in all countries where we do business. Shell and its joint ventures and associates have in the past settled with the US Securities and Exchange Commission regarding violations of the US Foreign
STRATEGIC REPORT SHELL FORM 20-F 2019 | 14 | |
Corrupt Practices Act. Any violation of anti-bribery, tax-evasion or anti-money laundering laws, including those potential violations associated with Shell Nigeria Exploration and Production Company Limited's investment in Nigerian oil block OPL 245 and the 2011 settlement of litigation pertaining to that block, could have a material adverse effect on our earnings, cash flows and financial condition.
See “Our people” on pages 66, “Other Regulatory and Statutory Information” on page 127 and Note 25 to the “Consolidated Financial Statements” on pages 185-188.
Violations of data protection laws carry fines and expose us and/or our employees to criminal sanctions and civil suits.
Data protection laws apply to Shell and its joint ventures and associates in the vast majority of countries where we do business. Most of the countries we operate in have data protection laws and regulations. Additionally, the EU General Data Protection Regulation (GDPR) came into effect in May 2018, which increased penalties up to a maximum of 4% of global annual turnover for breach of the regulation. The GDPR requires mandatory breach notification, the standard for which is also followed outside the EU (particularly in Asia). Non-compliance with data protection laws could expose us to regulatory investigations, which could result in fines and penalties and harm our reputation. In the past we have breached the GDPR and some investigations are still ongoing with European regulators. To date no material fines have been imposed, however, no assurance can be provided that future breaches would have similar outcomes. In addition to imposing fines, regulators may also issue orders to stop processing personal data, which could disrupt operations. We could also be subject to litigation from persons or entities allegedly affected by data protection violations. Violation of data protection laws is a criminal offence in some countries, and individuals can be imprisoned or fined. Any violation of these laws or harm to our reputation could have a material adverse effect on our earnings, cash flows and financial condition.
See “Other Regulatory and Statutory Information” on page 127.
Violations of trade compliance laws and regulations, including sanctions, carry fines and expose us and our employees to criminal sanctions and civil suits.
We use “trade compliance” as an umbrella term for various national and international laws designed to regulate the movement of items across national boundaries and restrict or prohibit trade and other dealings with certain parties. The number and breadth of such laws continue to expand. For example, the EU and the USA continue to impose restrictions and prohibitions on certain transactions involving countries such as Syria, Venezuela, Russia and Cuba. In addition, the USA continues to have comprehensive sanctions in place against Iran, while the EU and other nations continue to maintain targeted sanctions. Additional restrictions and controls directed at defined oil and gas activities in Russia, which were imposed by the EU and the USA in 2014, remain in force. Further restrictions regarding Russia were introduced by the USA in 2017 and expanded in 2018. Both the EU and the USA introduced sectoral sanctions against Venezuela in 2017, which the USA expanded in 2018 and 2019. The US sanctions primarily target the government of Venezuela and the oil industry. Many other nations are also adopting trade-control programmes similar to those administered by the EU and the USA. This expansion of sanctions, including the frequent additions of prohibited parties, combined with the number of markets in which we operate and the large number of transactions we process, make compliance with all sanctions complex and at times challenging. Shell has voluntarily self-disclosed potential violations of sanctions in the past. Any violation of one or more of these regimes could lead to loss of import or export privileges, significant penalties on or prosecution of Shell or its employees and could harm our reputation and have a material adverse effect on our earnings, cash flows and financial condition.
See “Other Regulatory and Statutory Information” on page 127.
Investors should also consider the following, which could limit shareholder remedies.
The Company’s Articles of Association determine the jurisdiction for shareholder disputes. This could limit shareholder remedies.
Our Articles of Association generally require that all disputes between our shareholders in such capacity and the Company or our subsidiaries (or our Directors or former Directors), or between the Company and our Directors or former Directors, be exclusively resolved by arbitration in The Hague, the Netherlands, under the Rules of Arbitration of the International Chamber of Commerce. Our Articles of Association also provide that, if this provision is to be determined invalid or unenforceable for any reason, the dispute could only be brought before the courts of England and Wales. Accordingly, the ability of shareholders to obtain monetary or other relief, including in respect of securities law claims, could be determined in accordance with these provisions.
STRATEGIC REPORT SHELL FORM 20-F 2019 | 15 | |
Market overview | |
We maintain a large business portfolio across an integrated value chain and are exposed to crude oil, natural gas, oil product and chemical prices (see “Risk factors” on page 11). This diversified portfolio helps us mitigate the impact of price volatility. Our annual planning cycle and periodic portfolio reviews aim to ensure that our levels of capital investment and operating expenses are appropriate in the context of a volatile price environment. We test the resilience of our projects and other opportunities against a range of crude oil, natural gas, oil product and chemical prices and costs. We also aim to maintain a strong balance sheet to provide resilience against weak market prices.
GLOBAL ECONOMIC GROWTH
Economic activity is one of the key drivers of demand for oil, natural gas and oil products. Widespread economic and geopolitical uncertainty meant the global business environment remained challenging in 2019. According to the World Economic Outlook released by the International Monetary Fund (IMF) in January 2020, global economic growth for 2019 is estimated to have fallen to 2.9% from 3.6% in 2018.
A common feature in the weakening of many countries’ GDP was a slowdown in industrial output. According to the IMF, this slowdown was caused by weak business confidence amid growing trade-related tensions between the USA and China. Industrial production also slowed due to changes in technology and emissions standards leading to a fall in car production and many potential vehicle buyers delaying their purchase in favour of a wait-and-see attitude.
The IMF also noted a slowdown in economic growth in China and other large Asian economies, driven by China’s regulatory efforts to limit its debt, and exacerbated by increased trade tensions with the USA.
With lingering trade policy and geopolitical uncertainties, the global economic outlook for 2020 remains precarious. A key uncertainty for the global economy will be the impact of the COVID-19 (coronavirus) outbreak in China and elsewhere.
GLOBAL PRICES, DEMAND AND SUPPLY
The following table provides an overview of the main crude oil and natural gas price markers that we are exposed to:
Oil and gas average industry prices [A] | ||||||
2019 | 2018 | 2017 | ||||
Brent ($/b) | 64 | 71 | 54 | |||
West Texas Intermediate ($/b) | 57 | 65 | 51 | |||
Henry Hub ($/MMBtu) | 2.5 | 3.1 | 3.0 | |||
UK National Balancing Point (pence/therm) | 35 | 60 | 45 | |||
Japan Customs-cleared Crude ($/b) | 67 | 73 | 54 | |||
[A] Yearly average prices are based on daily spot prices. The 2019 average price for Japan Customs-cleared Crude excludes December data.
CRUDE OIL
Brent crude oil, an international benchmark, traded between $53 per barrel (/b) and $75/b in 2019, ending the year at $67/b. Brent crude oil prices averaged $64/b for the year, 10% (or $7/b ) lower than in 2018.
At the beginning of 2019, global oil demand for the year was expected to grow by 1.4 million barrels per day (b/d). However, as the global economic environment weakened throughout 2019, global oil demand growth projections for the full year were adjusted downwards. Year averaged global oil demand grew by 1.0 million b/d, or 1.0%, to 100.3 million b/d, according to the International Energy Agency’s (IEA) Oil Market Report published in January 2020. This growth was lower than the historical average of 1.3 million b/d per year since 2000. Oil demand growth was driven by non-OECD economies, where demand grew by 1.1 million b/d, while oil demand contracted by 0.1 million b/d in OECD. Oil demand
growth in 2019 was 0.1 million b/d lower than in 2018, when it rose by 1.1 million b/d.
Oil supply in 2019 is estimated in the Oil Market Report at 100.3 million b/d, unchanged compared to 2018. Because oil supply and oil demand were in balance, we estimate that elevated industry-controlled crude oil and oil products stocks remained unchanged from 2018. This limited price increases. Average commercial inventory levels for OECD countries in November 2019 were estimated at 2,912 million barrels in the Oil Market Report. This was around 52 million barrels higher than in November 2018, and about 211 million barrels more than the average for 2014, when Brent crude oil prices were around $100/b for most of the year.
Non-OPEC supply growth, mostly in the USA, was balanced by lower OPEC production. The US Energy Information Administration reported another year of supply growth. US production is estimated to have averaged 12.3 million b/d in 2019, 1.5 million b/d higher than in 2018, and 3 million b/d higher than 2017. Supply growth was supported by continued efficiency gains, and occurred despite lower drilling activity reflected by a 23% fall in the onshore oil rig count during the year. Production from other non-OPEC countries increased by 0.5 million b/d in 2019 and averaged 58.1 million b/d.
For most of 2019, OPEC members and co-operating non-OPEC resource holders, most notably Russia, continued to cap their overall production at 2018 levels. In December 2019, they decided to further cap production by 0.5 million b/d becoming effective in 2020. OPEC’s production fell from 31.9 million b/d in 2018 to 29.9 million b/d in 2019, in part due to sanctions causing production to fall in Iran and Venezuela. Furthermore, supply from Venezuela was also affected by a deteriorating production environment.
On a yearly average basis, West Texas Intermediate (WTI) crude oil traded at a $7/b discount to Brent crude oil in 2019, compared with $6/b in 2018. The discount remained broadly unchanged from 2018, reflecting continued constrained pipeline capacity from the landlocked Cushing storage hub to the US Gulf Coast, against a backdrop of growing supply to the hub. According to the US Energy Information Administration, US crude oil exports increased further to a yearly average of about 3 million b/d in 2019, up by 1 million b/d from 2018, and peaked above 4 million b/d by the end of the year. This helped to limit further widening of the price differential between Brent and WTI.
Looking ahead, the IMF’s global economic outlook indicates some increase in global economic growth, which should support oil demand growth. According to the IEA, near-term global oil demand growth is projected at around 1.3 million b/d per annum. To keep supply and demand in balance, demand growth and natural production decline from existing operations is to be met by supply growth. If OPEC members and co-operating non-OPEC resource holders continue implementing their current production agreement successfully, then supply growth would have to be delivered by non-OPEC countries, most notably the USA. Markets could tighten and prices could rise if US supply growth slows. The fall in US drilling activity in 2019 could be a first indicator of moderating US supply growth. A lack of industry-wide investment in new supply projects could lead to further market tightening in the next few years, given the long lead time of many of these projects.
On the other hand, we believe the price environment could weaken if the impact of the coronavirus grows or recession fears materialise, and/or OPEC and the non-OPEC resource holders relax their production agreement. The price environment could also weaken if other non-OPEC producers, such as US shale producers, effectively deliver more and cheaper oil to the market.
NATURAL GAS
We estimate global gas demand to have grown by about 2.4% in 2019, in line with the annual growth rate of 2.5% observed since the start of the century. Robust demand growth in power generation and industry was driven by attractive regional spot gas prices that encouraged switching from competing fuels such as coal and oil. In the key regional markets of North America, Europe, and Asia-Pacific, attractive prices have been caused mainly by ample gas supply growth.
STRATEGIC REPORT SHELL FORM 20-F 2019 | 16 | |
In 2019, global liquefied natural gas (LNG) imports grew by 40 million tonnes, or 13% of the total LNG market. LNG supply growth, mainly in Australia, the USA and Russia, outpaced demand growth. In 2019, inventory levels were higher in Asia following mild winter conditions. LNG imports were down in Japan and South Korea due to milder weather and higher nuclear utilisation than in 2018. However, more LNG supply flowed into the European markets.
Natural gas prices can vary from region to region.
In the USA, the natural gas price at the Henry Hub averaged $2.5 per million British thermal units (MMBtu) in 2019, 19% lower than in 2018. It traded in a range of $2.0 to 4.1/MMBtu. There was downward pressure on prices due to a strong gas supply growth of about 8 billion cubic feet per day, which averaged 10% higher than in 2018. Gas supply growth was, in part, driven by a growth of associated gas from oil fields, helped by oil prices above $50/b, and by new gas pipeline capacity. Gas prices found support from demand growth driven by below-normal storage inventory levels; an increase in usage of power for cooling due to warmer than normal weather in the second half of the year; completion of LNG liquefaction projects; increased exports to Mexico by pipeline; and US industrial growth.
In Europe, the average price at the UK National Balancing Point (NBP) was 43% lower in 2019 compared to 2018. At the main continental gas trading hubs - in the Netherlands, Belgium and Germany - prices were also lower, as reflected by weaker Dutch Title Transfer Facility (TTF) prices. European gas prices were lower due to: the rise in LNG volume diverted from the Asia-Pacific region caused by weaker Asia-Pacific demand growth; robust supply of pipeline gas, particularly from Russia; well-filled gas storage inventories; competition with renewables in power generation; and mild weather.
We also produce and sell natural gas in regions where supply, demand and regulatory circumstances differ markedly from those in the USA or Europe. Long-term contracted LNG prices in 2019 in the Asia-Pacific region were broadly comparable to 2018 prices as they are predominantly indexed to oil prices, particularly to the Japan Customs-cleared Crude (JCC) index which has been generally stable year-on-year. Meanwhile, delivered North Asia spot prices, reflected by the Japan Korea Marker, declined by 43% versus 2018 as a result of the oversupply in the global LNG market.
Looking ahead, we expect gas markets in North America, Europe and Asia-Pacific to be well supplied over the next few years, despite our expectation of LNG demand growth in Asia. Price developments are very uncertain and dependent on many factors.
In the USA, Henry Hub gas prices may increase over the next few years due to: increasing demand from LNG exports; exports to Mexico by pipeline; and residential and industrial users. On the other hand, increasing availability of low-cost natural gas and oil, combined with technological improvements, could continue to place pressure on natural gas prices. In Europe, we believe gas prices will be increasingly influenced by the cost of LNG imports from the USA. In the Asia-Pacific region, long-term gas prices are expected to continue to be strongly influenced by oil prices and spot prices increasingly by gas supply and demand fundamentals.
CRUDE OIL AND NATURAL GAS PRICE ASSUMPTIONS
Our ability to deliver competitive returns and pursue commercial opportunities ultimately depends on the accuracy of our price assumptions (see “Risk factors” on page 11). We determine the range of possible future crude oil and natural gas prices to be used in project and portfolio evaluations after a rigorous assessment of short, medium and long-term market drivers. We consider historical analyses, trends and statistical volatility, and market fundamentals such as possible future economic conditions, geopolitics, actions by OPEC and other major resource holders, production costs, and the balance of supply and demand. We use sensitivity analyses to test the impact of low-price drivers like economic weakness, and the effect of high-price drivers, such as strong economic growth and low investment in new production capacity. See also Note 8 to the “Consolidated Financial Statements” on pages 163-165.
REFINING MARGINS
Refining marker average industry gross margins | $/b | |||||
2019 | 2018 | 2017 | ||||
US West Coast | 13.5 | 11.5 | 14.0 | |||
US Gulf Coast Coking | 4.9 | 7.0 | 9.9 | |||
Rotterdam Complex | 2.3 | 2.5 | 4.3 | |||
Singapore | (0.6 | ) | 1.4 | 3.6 | ||
Industry gross refining margins were lower on average in 2019 than in 2018 in three of the four key refining hubs of Europe, Singapore and the US Gulf Coast. Only in the US West Coast did gross margins improve due to, in-part, unplanned outages in the region, which supported product prices. Globally, year-on-year growth in demand for oil products has slowed in line with slowing global economic growth. Refinery capacity additions, especially in the Middle East and Asia, combined with lower demand growth have led to generally lower refinery utilisations, which weakened margins. Refinery activity continued to be low in Latin America amid the ongoing geopolitical uncertainty and poor investment climate.
On January 1, 2020, the new International Maritime Organization low-sulphur shipping fuel specification came into effect. The refining industry started to transition to the new specification in the second half of 2019 by building a significant inventory of low-sulphur fuels. The full effects of the implementation are expected to materialise in 2020.
Refinery margins could weaken in 2020 if the coronavirus materially impacts global demand for oil products.
PETROCHEMICAL MARGINS
Cracker industry margins [A] | $/tonne | |||||
2019 | 2018 | 2017 | ||||
North East/South East Asia naphtha | 302 | 594 | 688 | |||
Western Europe naphtha | 531 | 562 | 727 | |||
US ethane | 445 | 412 | 471 | |||
[A] ICIS data is quoted. Cracker industry margins have been revised from Q1 2018 onwards due to updated cracker margin calculation methodology by ICIS. Further revisions based on available market information to external industry data provider up to the end of the period.
In 2019, Chinese GDP growth slowed and there was continued uncertainty regarding trade and tariffs between the USA and China. Demand growth in several chemicals end-consumption markets slowed and, in the automotive sector, demand even contracted. Cracker industry margins in Asia halved. Cracker margins in Western Europe and the USA were relatively unchanged versus 2018. West European margins were supported by a high level of maintenance outages in the first half of 2019, while in the USA margins were supported by low ethane prices.
The outlook for petrochemical margins in 2020 and beyond depends on supply and demand balances and feedstock costs. Demand for petrochemicals is closely linked to economic and trade growth. Product prices reflect prices of raw materials, which are closely linked to crude oil and natural gas prices. The balance of these factors will drive margins.
The statements in this “Market overview” section, including those related to our price forecasts, are forward-looking statements based on management’s current expectations and certain material assumptions and, accordingly, involve risks and uncertainties that could cause actual results, performance or events to differ materially from those expressed or implied herein. See “About this Report” on pages 5-6 and “Risk factors” on pages 11-15.
STRATEGIC REPORT SHELL FORM 20-F 2019 | 17 | |
Summary of results | |
Key statistics | $ million, except where indicated | |||||
2019 | 2018 | 2017 | ||||
Income for the period | 16,432 | 23,906 | 13,435 | |||
Current cost of supplies adjustment | (605 | ) | 458 | (964 | ) | |
Total segment earnings [A][B], of which: | 15,827 | 24,364 | 12,471 | |||
Integrated Gas | 8,628 | 11,444 | 5,078 | |||
Upstream | 4,195 | 6,798 | 1,551 | |||
Downstream | 6,277 | 7,601 | 8,258 | |||
Corporate | (3,273 | ) | (1,479 | ) | (2,416 | ) |
Capital expenditure | 22,971 | 23,011 | 20,845 | |||
Cash capital expenditure [B] | 23,919 | 24,078 | 21,533 | |||
Capital investment [B] | 28,788 | 24,878 | 23,655 | |||
Operating expenses [B] | 37,893 | 39,316 | 38,083 | |||
Return on average capital employed [B] | 6.7 | % | 9.4 | % | 5.8 | % |
Gearing at December 31 [C] | 29.3 | % | 20.3 | % | 25.0 | % |
Oil and gas production (thousand boe/d) | 3,665 | 3,666 | 3,664 | |||
Proved oil and gas reserves at December 31 (million boe) | 11,096 | 11,578 | 12,233 | |||
[A] Segment earnings are presented on a current cost of supplies basis. See Note 4 to the “Consolidated Financial Statements” on pages 158-161.
[B] See “Non-GAAP measures reconciliations” on pages 219-220.
[C] Gearing at end of 2019 on IAS 17 basis was 25%.
EARNINGS 2019-2018
Income for the period was $16,432 million in 2019, compared with $23,906 million in 2018. After current cost of supplies adjustment, total segment earnings were $15,827 million in 2019, compared with $24,364 million in 2018.
Earnings on a current cost of supplies basis (CCS earnings) exclude the effect of changes in the oil price on inventory carrying amounts, after making allowance for the tax effect. The purchase price of volumes sold in the period is based on the current cost of supplies during the same period, rather than on the historic cost calculated on a first-in, first-out (FIFO) basis. Therefore, when oil prices are decreasing, CCS earnings are likely to be higher than earnings calculated on a FIFO basis and, when prices are increasing, CCS earnings are likely to be lower than earnings calculated on a FIFO basis.
Integrated Gas earnings in 2019 were $8,628 million, compared with $11,444 million in 2018. The decrease was mainly driven by lower gains on sale of assets, lower realised oil, LNG and gas prices, higher impairments, higher operating expenses, negative movements in deferred tax positions and lower liquids production volumes. These effects were partly offset by stronger contributions from LNG trading and optimisation, and gains related to the fair value accounting of commodity derivatives. See “Integrated Gas” on pages 22-27.
Upstream earnings in 2019 were $4,195 million, compared with $6,798 million in 2018. The decrease is mainly driven by higher impairments, lower realised oil and gas prices, higher depreciation and higher well write-offs. This was partly offset by increased gains on sale of assets and higher volumes. See “Upstream” on pages 28-33.
Downstream earnings in 2019 were $6,277 million, compared with $7,601 million in 2018. The decrease was mainly driven by lower realised chemicals, refining and trading margins, legal provisions and lower gains related to fair value accounting of commodity derivatives. This was partly offset by higher marketing margins, benefit from foreign exchange, introduction of IFRS 16 and lower operating costs. See “Downstream” on pages 43-49.
Corporate earnings in 2019 were a loss of $3,273 million, compared with a loss of $1,479 million in 2018. The higher loss was mainly driven by the introduction of IFRS 16 and reduced capitalised interest. This was partly offset by reduced tax credits from financing and one-off charges. See “Corporate” on page 50.
EARNINGS 2018-2017
Income for the period was $23,906 million in 2018, compared with $13,435 million in 2017. After current cost of supplies adjustment, total segment earnings were $24,364 million in 2018, compared with $12,471 million in 2017.
Integrated Gas earnings in 2018 were $11,444 million, compared with $5,078 million in 2017. The increase was mainly driven by higher realised oil, gas, and LNG prices, higher gains on divestments, increased contributions from LNG trading, the impact of fair value accounting of commodity derivatives, and higher production. These effects were partly offset by the absence of a gain from the strengthening Australian dollar on a deferred tax position in 2017 and by higher operating expenses. See “Integrated Gas” on pages 22-27.
Upstream earnings in 2018 were $6,798 million, compared with $1,551 million in 2017. The increase was mainly driven by higher realised oil and gas prices, lower impairment charges, the absence of a charge as a result of US tax reform legislation in 2017, and lower well write-offs. This was partly offset by the movements in deferred tax positions, lower gains on divestments, lower production, and a charge related to the impact of the weakening Brazilian real on a deferred tax position. See “Upstream” on pages 28-33.
Downstream earnings in 2018 were $7,601 million, compared with $8,258 million in 2017. The decrease was mainly driven by higher operating expenses, unfavourable exchange rate effects, and lower realised base chemicals and refining margins. This was partly offset by higher realised marketing margins, lower charges related to provisions, the impact of fair value accounting of commodity derivatives and higher gains on divestments. There was also a charge in 2017 as a result of US tax reform legislation. See “Downstream” on pages 43-49.
Corporate earnings in 2018 were a loss of $1,479 million, compared with a loss of $2,416 million in 2017. The lower loss was mainly driven by lower net foreign exchange losses and net interest expense, partially offset by higher costs. There was also a charge in 2017 as a result of US tax reform legislation. See “Corporate” on page 50.
PRODUCTION AVAILABLE FOR SALE
Oil and gas production available for sale in 2019 was 1,338 million barrels of oil equivalent (boe), or 3,665 thousand boe per day (boe/d), compared
STRATEGIC REPORT SHELL FORM 20-F 2019 | 18 | |
with 1,338 million boe, or 3,666 thousand boe/d, in 2018. In 2019, lower production was due to the impact of divestments and field decline, partly offset by field ramp-ups in North America, Brazil, Australia and Trinidad and Tobago.
Oil and gas production available for sale [A] | Thousand boe/d | |||||
2019 | 2018 | 2017 | ||||
Crude oil and natural gas liquids | 1,823 | 1,749 | 1,730 | |||
Synthetic crude oil | 52 | 53 | 91 | |||
Bitumen | — | — | 4 | |||
Natural gas [B] | 1,790 | 1,863 | 1,839 | |||
Total | 3,665 | 3,666 | 3,664 | |||
Of which: | ||||||
Integrated Gas | 922 | 957 | 887 | |||
Upstream | 2,743 | 2,709 | 2,777 | |||
[A] See “Oil and gas information” on pages 34-42.
[B] Natural gas volumes are converted into oil equivalent using a factor of 5,800 scf per barrel.
PROVED RESERVES
The proved oil and gas reserves of Shell subsidiaries and the Shell share of the proved oil and gas reserves of joint ventures and associates are summarised in “Oil and gas information” on pages 34-42 and set out in more detail in “Supplementary information - oil and gas (unaudited)” on pages 189-206.
Before taking production into account, our proved reserves increased by 906 million boe in 2019. This comprised increases of 912 million boe from Shell subsidiaries and decreases of 6 million boe from the Shell share of joint ventures and associates. The increase from Shell subsidiaries included a net increase of 785 million boe from revisions and reclassifications, an increase of 5 million boe from improved recovery, an increase of 276 million from extensions and discoveries and a net decrease of 154 million boe related to purchases and sales of minerals in place. The decrease of 6 million boe from the Shell share of joint ventures and associates comprises a net decrease of 13 million boe from revisions and reclassifications, an increase
of 3 million from extensions and discoveries and an increase of 4 million from improved recovery.
In 2019, total oil and gas production was 1,388 million boe, of which 1,338 million boe was available for sale and 50 million boe was consumed in operations. Production available for sale from subsidiaries was 1,182 million boe and 43 million boe was consumed in operations. The Shell share of the production available for sale of joint ventures and associates was 156 million boe and 7 million boe was consumed in operations.
Accordingly, after taking production into account, our proved reserves decreased by 482 million boe in 2019, to 11,096 million boe at December 31, 2019, with a decrease of 314 million boe from subsidiaries and a decrease of 169 million boe from the Shell share of joint ventures and associates.
CASH CAPITAL EXPENDITURE AND OTHER INFORMATION
Cash capital expenditure was $23.9 billion in 2019, compared with $24.1 billion in 2018. Capital investment was $28.8 billion in 2019, compared with $24.9 billion in 2018.
Operating expenses reduced by $1.4 billion in 2019, to $37.9 billion.
Our ROACE decreased to 6.7%, compared with 9.4% in 2018, mainly driven by a lower income in 2019.
Gearing was 29.3% at the end of 2019, compared with 20.3% at the end of 2018, driven by IFRS 16 and a lower cash balance in 2019. Gearing at the end of 2019 on an IAS 17 basis was 25.0%.
SIGNIFICANT ACCOUNTING ESTIMATES AND JUDGEMENTS
See Note 2 to the “Consolidated Financial Statements” on pages 148-156.
LEGAL PROCEEDINGS
See Note 25 to the “Consolidated Financial Statements” on pages 185-187.
STRATEGIC REPORT SHELL FORM 20-F 2019 | 19 | |
Performance indicators | |
These indicators enable management to evaluate Shell’s performance against our strategy and operating plans. Those that are used in the determination of the Executive Directors’ remuneration are asterisked below and on the following page. See “Directors’ Remuneration Report” on pages 98-123.
FINANCIAL
Total shareholder return (%) | * | |||||
2019 | 0.5 | 2018 | (4.2) | |||
Total shareholder return (TSR) is the difference between the share price at the beginning of the year and the share price at the end of the year (each averaged over 90 days), plus gross dividends delivered during the calendar year (reinvested quarterly), expressed as a percentage of the share price at the beginning of the year (averaged over 90 days). The data used are a weighted average in dollars for A and B shares. The TSRs of major publicly-traded oil and gas companies can be compared directly, thereby providing a way to determine how we are performing relative to our industry peers.
Cash flow from operating activities ($ million) | * | |||||
2019 | 42,178 | 2018 | 53,085 | |||
Cash flow from operating activities is the total of all the cash receipts and payments associated with our sales of oil, gas, chemicals and other products. The components that provide a reconciliation from income for the period are listed in the “Consolidated Statement of Cash Flows”. This indicator reflects our ability to generate cash to service and reduce our debt and for distributions to shareholders and investments. See “Liquidity and capital resources” on pages 51-54.
Free cash flow ($ million) | * | |||||
2019 | 26,399 | 2018 | 39,426 | |||
Free cash flow is the sum of "Cash flow from operating activities" and "Cash flow from investing activities", which are listed in the “Consolidated Statement of Cash Flows”. This indicator is used to evaluate the cash available for financing activities, including dividend payments, after investment in maintaining and growing our business. See “Non-GAAP measures reconciliations” on pages 219-220.
Organic free cash flow ($ million) | |||||
2019 | 20,116 | 2018 | 31,183 | ||
Organic free cash flow is defined as free cash flow excluding the cash flows from acquisition and divestment activities. It is a measure used by management to evaluate the generation of cash flow without these activities. See “Non-GAAP measures reconciliations” on page 219-220.
Return on average capital employed (%) | * | |||||
2019 | 6.7 | 2018 | 9.4 | |||
ROACE is defined as income for the period, adjusted for after-tax interest expense, as a percentage of the average capital employed during the year. Capital employed is the sum of total equity and total debt. ROACE measures the efficiency of our utilisation of the capital that we employ and is a common measure of business performance. See “Summary of results” on page 18-19 and “Non-GAAP measures reconciliations” on page 219-220.
Earnings on a current cost of supplies basis ($ million) | |||||
2019 | 15,827 | 2018 | 24,364 | ||
Earnings per share on a current cost of supplies basis ($) | |||||
2019 | 1.88 | 2018 | 2.85 | ||
Earnings on a CCS basis is the income for the period, adjusted for the after-tax effect of oil-price changes on inventory. Segment earnings presented on a CCS basis is the earnings measure used by the Chief Executive Officer for the purposes of making decisions about allocating resources and assessing performance. See “Summary of results” on pages 18-19 and “Non-GAAP measures reconciliations” on pages 219-220.
CCS earnings per share, which is on a diluted basis above, is calculated by dividing the CCS earnings attributable to shareholders (see “Non-GAAP measures reconciliations” on pages 219-220) by the average number of shares outstanding over the year, increased by the average number of dilutive shares related to share-based compensation plans.
Capital investment ($ million) | |||||
2019 | 28,788 | 2018 | 24,878 | ||
Capital investment is the sum of capital expenditure, investments in joint ventures and associates, investments in equity securities, as reported in the “Consolidated Statement of Cash Flows”, plus exploration expenses excluding wells written off and leases recognised in the period and other adjustments. Capital investment is a measure used to make decisions about allocating resources and assessing performance. See “Liquidity and capital resources” on pages 51-54 and “Non-GAAP measures reconciliations” on pages 219-220.
Cash capital expenditure ($ million) | |||||
2019 | 23,919 | 2018 | 24,078 | ||
Cash capital expenditure is the sum of capital expenditure, investments in joint ventures and associates, and investments in equity securities, as reported in the "Consolidated Statement of Cash flows". It is used to monitor investing activities on a cash basis, excluding items such as lease additions that do not necessarily result in cash outflows in the period. See “Non-GAAP measures reconciliations” on pages 219-220.
Gearing (%) | |||||
2019 | 29.3 | 2018 | 20.3 | ||
Gearing is defined as net debt (total debt less cash and cash equivalents) as a percentage of total capital (net debt plus total equity) at December 31. Gearing at the end of 2019 on an IAS 17 basis was 25.0%. The net debt calculation includes the fair value of derivative financial instruments used to hedge foreign exchange, interest rate risks relating to debt and associated collateral balances. The inclusion of these debt-related derivative balances reduces the volatility of net debt caused by fluctuations in foreign exchange and interest rates, and eliminates the potential impact of related collateral payments or receipts. Gearing is a measure of the degree to which our operations are financed by debt. See “Liquidity and capital resources” on page 51-54.
OPERATIONAL
Production available for sale (thousand boe/d) | * | |||||
2019 | 3,665 | 2018 | 3,666 | |||
Production is the sum of all the average daily volumes of unrefined oil and natural gas produced for sale by Shell subsidiaries and Shell’s share of those produced for sale by joint ventures and associates. The unrefined oil comprises crude oil, NGLs, synthetic crude oil and bitumen. The gas volume is converted into equivalent barrels of oil to make the summation possible. See “Summary of results” on pages 18-19.
LNG liquefaction volumes (million tonnes) | * | |||||
2019 | 35.6 | 2018 | 34.3 | |||
LNG liquefaction volumes is a measure of the operational performance of our Integrated Gas business and LNG market demand. See “Integrated Gas” on pages 22-27.
Refinery and chemical plant availability (%) | * | |||||
2019 | 90.8 | 2018 | 91.9 | |||
Refinery and chemical plant availability is the weighted average of the actual uptime of plants as a percentage of their maximum possible uptime. The weighting is based on the capital employed, adjusted for cash and non-current liabilities. This indicator is a measure of the operational excellence of our Downstream manufacturing facilities. See “Downstream” on pages 43-49.
STRATEGIC REPORT SHELL FORM 20-F 2019 | 20 | |
Project delivery on schedule (%) | * | |||||
2019 | 90 | 2018 | 75 | |||
Project delivery on budget (%) | * | |||||
2019 | 99 | 2018 | 97 | |||
Project delivery reflects our capability to complete major projects on time and within budget on the basis of the targets set in our annual Business Plan. Project delivery on schedule measures the percentage of projects delivered on schedule. Project delivery on budget reflects the aggregate cost against the aggregate budget for those projects.
Proved oil and gas reserves (million boe) | |||||
2019 | 11,096 | 2018 | 11,578 | ||
Proved oil and gas reserves are the total estimated quantities of oil and gas from Shell subsidiaries and Shell’s share from joint ventures and associates that geoscience and engineering data demonstrate, with reasonable certainty, to be recoverable in future years from known reservoirs, at December 31, under existing economic conditions, operating methods and government regulations. Gas volumes are converted into boe using a factor of 5,800 scf/b. Reserves are crucial to an oil and gas company, as they constitute the source of future production. Reserves estimates are subject to change owing to a wide variety of factors, some of which are unpredictable. See “Risk factors” on pages 11-15, “Summary of results” on pages 18-19, “Oil and gas information” on pages 34-42 and “Supplementary information – oil and gas (unaudited)” on pages 189-206.
SAFETY AND ENVIRONMENT
Total recordable case frequency (injuries per million working hours) | * | |||||
2019 | 0.9 | 2018 | 0.9 | |||
Total recordable case frequency (TRCF) is the number of employees and contract staff injuries requiring medical treatment or time off for every million hours worked. It is a standard measure of occupational safety. See “Environment and society” on pages 55-58.
Number of operational Tier 1 and 2 process safety events | * | |||||
2019 | 130 | 2018 | 121 | |||
A Tier 1 process safety event is an unplanned or uncontrolled release of any material, including non-toxic and non-flammable materials, from a process with the greatest actual consequence resulting in harm to employees, contract staff, or a neighbouring community, damage to equipment, or exceeding a threshold quantity, as defined by the API Recommended Practice 754 and IOGP Standard 456. A Tier 2 process safety event is a release of lesser consequence. See “Environment and society” on pages 55-58.
Upstream and Integrated Gas GHG intensity (tonnes of CO2 equivalent/tonne of hydrocarbon production available for sale) | * | |||||
2019 | 0.17 | 2018 | 0.16 | |||
Upstream/midstream GHG intensity is a measure of GHG emissions (direct and indirect GHG emissions associated with imported energy, excluding emissions from exported energy), expressed in metric tonnes of CO2 equivalent, emitted into the atmosphere per metric tonne of hydrocarbon production available for sale. See “Climate change and energy transition” on pages 59-65.
Refining GHG intensity (tonnes of CO2 equivalent/UEDCTM) | * | |||||
2019 | 1.06 | 2018 | 1.05 | |||
Refining GHG intensity is a measure of GHG emissions (direct and indirect GHG emissions associated with imported energy, excluding emissions from exported energy), expressed in metric tonnes of CO2 equivalent, emitted into the atmosphere per unit of Utilised Equivalent Distillation Capacity (UEDCTM). UEDCTM is a proprietary metric of Solomon Associates. It is a complexity-weighted normalisation parameter that reflects the operating cost intensity of a refinery based on the size and configuration of its particular mix of process and non-process facilities. See “Climate change and energy transition” on pages 59-65.
Chemicals GHG intensity (tonnes of CO2 equivalent/tonne petrochemicals produced) | * | |||||
2019 | 1.04 | 2018 | 0.96 | |||
Chemicals GHG intensity is a measure of GHG emissions (direct and indirect GHG emissions associated with imported energy, excluding emissions from exported energy), expressed in metric tonnes of CO2 equivalent, emitted into the atmosphere per metric tonne of steam cracker, high-value petrochemicals production. See “Climate change and energy transition” on pages 59-65.
Number of operational spills of more than 100 kg | |||||
2019 | 70 | 2018 | 93 | ||
The operational spills indicator is the number of incidents in respect of activities where we are the operator in which 100 kg or more of oil or oil products were spilled as a result of those activities and reached the environment. See “Environment and society” on page 55.
Direct GHG emissions (million tonnes of CO2 equivalent) | |||||
2019 | 70 | 2018 | 71 | ||
Direct GHG emissions from facilities operated by Shell, expressed in CO2 equivalent. See “Climate change and energy transition” on pages 59-65.
Net Carbon Footprint (grams of CO2 equivalent per megajoule) | * | |||||
2019 | 78 | 2018 | 79 | |||
Net Carbon Footprint is a comprehensive measure of the lifecycle carbon intensity of the energy products we sell. It is a weighted average of the lifecycle CO2 intensities of different energy products, normalised to the same point relative to their final end-use. It includes emissions from the extraction, transportation and processing of crude oil or gas or other feedstocks, transport of products, and our customers’ emissions from the use of products we sell. Also included are emissions from elements of this life-cycle not owned by Shell, such as oil and gas processed by Shell but not produced by Shell; or from oil products and electricity marketed by Shell that have not been processed or generated at a Shell facility. Emissions compensated through various measures are also included, such as emissions mitigated by nature-based solutions and carbon capture and storage technology. See “Climate change and energy transition” on pages 59-65.
STRATEGIC REPORT SHELL FORM 20-F 2019 | 21 | |
Integrated Gas | |
Key statistics | $ million, except where indicated | |||||
2019 | 2018 | 2017 | ||||
Segment earnings | 8,628 | 11,444 | 5,078 | |||
Including: | ||||||
Revenue (including inter-segment sales) | 45,602 | 48,795 | 36,770 | |||
Share of profit of joint ventures and associates | 1,791 | 2,273 | 1,714 | |||
Interest and other income | 263 | 2,230 | 687 | |||
Operating expenses [A] | 6,667 | 6,014 | 5,471 | |||
Exploration | 281 | 208 | 141 | |||
Depreciation, depletion and amortisation | 6,238 | 4,850 | 4,965 | |||
Taxation charge | 2,242 | 2,795 | 790 | |||
Capital expenditure | 3,851 | 3,262 | 3,515 | |||
Cash capital expenditure [A] | 4,299 | 3,819 | 3,616 | |||
Capital investment [A] | 6,706 | 4,259 | 3,921 | |||
Oil and gas production available for sale (thousand boe/d) | 922 | 957 | 887 | |||
LNG liquefaction volumes (million tonnes) | 35.6 | 34.3 | 33.2 | |||
[A] See “Non-GAAP measures reconciliations” on pages 219-220.
OVERVIEW
Our Integrated Gas business manages liquefied natural gas (LNG) activities and the conversion of natural gas into gas-to-liquids (GTL) fuels and other products, as well as our New Energies portfolio. It includes natural gas and liquids exploration and extraction, and the operation of upstream and midstream infrastructure that delivers gas and liquids to market. It markets and trades natural gas, LNG, electricity and carbon-emission rights, and markets and sells LNG as a fuel for heavy-duty vehicles and marine vessels.
BUSINESS CONDITIONS
Global gas demand is estimated to have grown by about 2.4% in 2019 which is in line with the annual growth rate of 2.5% observed since the start of the century.
Global LNG imports grew by 40 million tonnes in 2019. Significant LNG supply growth came mainly from Australia, the USA and Russia. In 2019, inventory levels were higher in Asia following mild winter conditions. LNG imports were down in Japan and South Korea due to milder weather and higher nuclear utilisation than in 2018. However, more LNG supply flowed into the European markets.
Natural gas prices can vary from region to region.
In the USA, the natural gas price at the Henry Hub averaged $2.5 per million British thermal units (MMBtu) in 2019, 19% lower than in 2018 and traded in a range of $2.0 to 4.1/MMBtu.
In Europe, natural gas prices were lower than in 2018. The average price at the UK National Balancing Point (NBP) was 35 pence/therm, 43% lower than in 2018. At the main continental gas trading hubs - in the Netherlands, Belgium and Germany - prices were also lower, as reflected by weaker Dutch Title Transfer Facility (TTF) prices.
Long-term contracted LNG prices in the Asia-Pacific region are broadly comparable to 2018 prices as they are predominantly indexed to oil prices, particularly to the Japan Customs-cleared Crude (JCC) index which has been generally stable year-on-year. Meanwhile, North Asia spot prices, reflected by the Japan Korea Marker (JKM) were $5.55/mmbtu, 43% lower than 2018 as a result of unprecedented additional supply of LNG coming on stream.
See “Market overview” on pages 16-17.
PRODUCTION AVAILABLE FOR SALE
In 2019, production was 336 million barrels of oil equivalent (boe), or 922 thousand boe per day (boe/d), compared with 349 million boe, or 957 thousand boe/d in 2018. Natural gas production increased by 3% compared with 2018, mainly due to field ramp-ups in Australia and Trinidad and Tobago combined with higher availability at Pearl GTL in Qatar in 2019, partially offset by divestments. Liquids production decreased 27%, mainly due to the transfer of the Salym asset in Russia into the Upstream segment.
LNG LIQUEFACTION VOLUMES
LNG liquefaction volumes of 35.6 million tonnes in 2019 were 4% higher than in 2018, driven by additional volumes from increased feedgas availability, mainly from ventures, and new LNG capacity from the Prelude floating LNG facility in Australia and Elba LNG in USA, partly offset by the divestment of Malaysia LNG.
LNG sales volumes of 74.45 million tonnes in 2019 were 5% higher than in 2018, driven by our increased LNG purchases from third parties and by higher LNG liquefaction volumes.
EARNINGS 2019-2018
Segment earnings in 2019 were $8,628 million, which included a net charge of $326 million. The net charge mainly reflected impairment charges of $890 million mostly in Australia, negative movements in deferred tax positions of $292 million and write-offs of $131 million in Australia and Trinidad and Tobago, respectively. These were partly offset by a gain of $787 million related to the fair value accounting of commodity derivatives and a gain of $203 million on a sale of assets in Australia.
Segment earnings in 2018 were $11,444 million, which included a net gain of $2,045 million. The net gain primarily reflected gains of $1,937 million on sale of assets, mainly related to the divestment of assets in Thailand, New Zealand and India. It also comprised a gain of $481 million related to the fair value accounting of commodity derivatives and impairment charges of $371 million related to investments in Trinidad and Tobago and Shell’s investment in a joint venture.
Excluding the net charge described above, segment earnings were $8,955 million in 2019 compared with $9,399 million in 2018. Earnings were negatively impacted by lower realised oil, LNG and gas prices, higher operating expenses (of which about 50% relates to New Energies reflecting underlying business growth), and lower liquids production volumes, partly offset by significantly stronger contributions from LNG trading and optimisation.
STRATEGIC REPORT SHELL FORM 20-F 2019 | 22 | |
EARNINGS 2018-2017
Segment earnings in 2018 were $11,444 million, which included a net gain of $2,045 million as described above.
Segment earnings in 2017 were $5,078 million, which included a net charge of $190 million. The net charge mainly reflected a charge of $445 million on fair value accounting of commodity derivatives and a charge of $412 million as a result of US tax reform legislation, partly offset by a gain of $636 million from the strengthening Australian dollar on a deferred tax position.
Excluding the net gain above, segment earnings were $9,399 million in 2018 compared with $5,268 million in 2017. Earnings were positively impacted by increased contributions from trading and higher realised oil, gas and LNG prices (around $4,200 million), increased LNG volumes from various assets across the portfolio (around $615 million). Earnings were negatively impacted by higher operating expenses (around $502 million of which $246 million relates to growth of New Energies activities) and lower dividends due to divestments (around $274 million).
In 2018, the impact of exchange rate movements of the Australian dollar on deferred tax balances was significantly reduced, as a result of the change in the fiscal functional currency of a number of Shell entities in Australia to the US dollar with effect from January 1, 2018.
CASH CAPITAL EXPENDITURE AND CAPITAL INVESTMENT
Cash capital expenditure in 2019 was $4.3 billion, compared with $3.8 billion in 2018. Capital investment in 2019 was $6.7 billion, compared with $4.3 billion in 2018.
PORTFOLIO AND BUSINESS DEVELOPMENT
Key portfolio events in 2019 included the following:
▪ | In December 2018, we formed two joint ventures: with EDF Renewables to build wind farms off the New Jersey coast; and with EDP Renewables (EDPR) to build wind farms off Massachusetts, in the USA. Leases were granted by the authorities for JV with EDF in December 2018 and with EDPR in February 2019. In November, Massachusetts state authorities selected our JV with EDPR (Shell interest 50%) to develop and supply 804 MW of clean, renewable energy from offshore wind to the electricity customers in the state. |
▪ | In February, we acquired sonnen, a provider of smart energy storage systems. |
▪ | In November, we acquired ERM Power, one of Australia's leading commercial and industrial electricity retailers |
The following major milestones were reached in 2019:
▪ | In June, the first shipment of LNG sailed from our Prelude Floating Liquefied Natural Gas facility (Shell interest 67.5%). |
▪ | In September, the first of 10 Moveable Modular Liquefaction System (MMLS) Units started up at Elba Island in Savannah, Georgia, USA. |
▪ | In November, FID was taken for the Barracuda Project (Shell interest 100%), a subsea tie-back of two gas wells to an existing platform on the East Coast of Trinidad. |
We continued to divest selected assets during 2019, including:
▪ | In Timor-Leste (East Timor), we sold our 26.6% interest in the undeveloped Sunrise gas field to the Timor-Leste government. |
▪ | In India, we sold our 10% interest in Mahanagar Gas Limited. |
BUSINESS AND PROPERTY
LNG AND GTL
Australia
We have interests in offshore production, LNG liquefaction and exploration licences in the North West Shelf (NWS) and Greater Gorgon areas of the Carnarvon Basin and in the Browse Basin. Woodside is the operator on
behalf of the NWS joint venture (Shell interest 16.7%), which produced more than 480 thousand boe/d of gas and condensates in 2019. We have a 25% interest in the Gorgon LNG joint venture, which is operated by Chevron. The venture started operating in 2016, producing from the offshore Gorgon and Jansz-Io fields via a three-train LNG plant on Barrow Island.
We are also a partner in the Browse joint arrangement (Shell interest 27%) covering the Brecknock, Calliance and Torosa gas fields, which is operated by Woodside.
We are the operator of Prelude FLNG (67.5% Shell interest). During 2019, the facility progressed through the start-up ramp-up phase, with the first condensate offtake in March 2019, followed by the first LNG offtake in June 2019 and the first NGL offtake in July 2019. Our other interests in the basin include a joint arrangement, with Shell as the operator, for the Crux gas and condensate field (Shell interest 82%) and other backfill and contingent resources.
A significant discovery was made at the Bratwurst prospect in Browse basin, Australia near the Prelude FLNG facility which presents an opportunity for a future tie-back to Prelude, currently under evaluation, to maximise the FLNG value.
The sale of Shell’s interest in the undeveloped Sunrise gas field in the Timor Sea (Shell interest 26.6%) to the government of Timor-Leste was completed in 2019.
We are a partner in both Shell-operated and other exploration joint arrangements in multiple basins, including Browse, Exmouth Plateau, and Greater Gorgon.
We have a 50% interest in Arrow, a Queensland-based joint venture with CNPC. Arrow owns coal-bed methane assets and a domestic power business.
We have a 50% interest in train one and a 97.5% interest in train two of the Shell-operated Queensland Curtis LNG (QCLNG) venture. The two-train liquefaction plant has an installed capacity of 8.5 mtpa. We also operate the venture’s natural gas operations, which include wells, compression stations and processing plants, in Queensland’s Surat Basin. We have interests ranging from 44% to 74% in 24 field compression stations and six central processing plants. Our production of natural gas from the onshore Surat Basin supplies the liquefaction plant and the domestic gas market.
A gas sales agreement between Arrow and QCLNG has been signed, under which gas from Arrow’s Surat Basin fields would flow to the QCLNG venture, which would then sell gas to local customers and export it through its gas plant on Curtis Island.
Brunei
We have a 25% interest in Brunei LNG Sendirian Berhad.
Canada
In 2018, we took FID on LNG Canada, a liquefied natural gas project in Kitimat, British Columbia, in which we hold a 40% interest. Construction started in October 2018 and first LNG is expected before the middle of this decade.
Egypt
We have interests of 35.5% in train one and 38% in train two of the Egyptian LNG (ELNG) plant. In January 2014, force majeure notices were issued under the LNG agreements as a result of domestic gas diversions severely restricting volumes available to ELNG. These notices remain in place. See “Oil and gas information” on pages 34-42.
Gibraltar
We have a 51% interest in the first LNG regasification facility in Gibraltar.
India
We hold a 100% interest in Shell Energy India Pvt Ltd, which operates a regasification terminal, and Hazira Port Pvt Ltd, which manages a cargo port at Hazira, both of which are located in the state of Gujarat on the west coast.
Indonesia
STRATEGIC REPORT SHELL FORM 20-F 2019 | 23 | |
We have a 35% interest in the INPEX Masela Ltd joint venture which owns and operates the offshore Masela block. In June 2019, the joint venture received the official approval of Plan of Development (POD) for the Abadi LNG Project from the Indonesian government authorities. The government also granted a 20-year extension to the Masela block PSC in October 2019.
Malaysia
We operate a GTL plant, Shell MDS (Shell interest 72%). Using Shell technology, the plant converts gas into high-quality middle distillates, drilling fluids, waxes and specialty products.
Netherlands
We have access to import and storage capacity at the GATE LNG terminal in the Port of Rotterdam, Netherlands (Shell capacity rights 1.4 million tonnes per annum (mtpa). We are also using the terminal to supply LNG to our growing truck-refuelling network in the Netherlands.
Nigeria
We have a 25.6% interest in Nigeria LNG Ltd, which operates six LNG trains located on Bonny Island.
Norway
Gasnor AS (Shell interest 100%) provides LNG fuel for ships and industrial customers and has a natural gas pipeline network.
Oman
We have a 30% interest in Oman LNG LLC. We also have an 11% indirect interest in Qalhat LNG.
In February 2019, we signed an Interim Upstream agreement that detailed a funding and a work programme for 2019 for the development of gas resources destined for integrated projects to help meet the Sultanate of Oman’s growing need for energy. The other signatories were Petroleum Development Oman (PDO), Oman Oil Company (OOC) and Total. The project covers investments in gas exploration and production. The aim is to integrate the Shell and OOC share of the upstream project with the development of a GTL plant currently under discussion, which would be developed and operated by Shell in partnership with OOC.
Peru
We have a 20% interest in the Peru LNG liquefaction plant.
Qatar
We operate the Pearl GTL plant (Shell interest 100%) in Qatar under a development and PSC with the government. The fully-integrated facility has capacity for production, processing and transportation of 1.6 billion standard cubic feet per day (scf/d) of gas from Qatar’s North Field. It has an installed capacity of about 140 thousand boe/d of high-quality liquid hydrocarbon products and 120 thousand boe/d of natural gas liquids (NGL) and ethane.
We have a 30% interest in Qatargas 4, which comprises integrated facilities to produce about 1.4 billion scf/d of gas from Qatar’s North Field, an onshore gas-processing facility and one LNG train with a collective production capacity of 7.8 mtpa of LNG and 70 thousand boe/d of condensate and NGL.
Russia
We have a 27.5% interest in Sakhalin-2, the joint venture with Gazprom, an integrated oil and gas project located on Sakhalin island.
Singapore
We have a 50% interest in a joint venture with KS Investments (the investment arm of Keppel Group) that holds a licence to supply LNG fuel for vessels in the Port of Singapore. We have aggregator licences to import LNG into Singapore and market the gas to power plants and other customers.
Tanzania
We have a 60% interest in, and are the operator of, Blocks 1 and 4 offshore southern Tanzania. The blocks cover approximately 4,000 square kilometres of the Mafia Deep Offshore Basin and the northern part of the Rovuma Basin. We continue to develop a potential LNG project with partners in Block 2, in line with the Block 1 and 4 appraisal programme agreed with the
Tanzanian government. We are engaging with the government to extend the Block 4 licence. The government has confirmed that the Block 4 licence, which had initially been due to expire on October 31, 2017, remains in full force pending the grant of the licence extension.
Trinidad and Tobago
We have interests in three concessions with producing fields - Central Block, East Coast Marine Area (ECMA) and North Coast Marine Area (NCMA) blocks. We have a 65% interest in Central Block, 100% interest in ECMA and 80.5% interest in NCMA. We also own 90% interest in block 22 and 80% in NCMA 4 which include three undeveloped discoveries. Our interests range from 35% to 100% in exploration activities in blocks 5(c), 5(d), 6(d), and Atlantic Area blocks 3, 5, and 6.
We are the largest shareholder in all four trains at Atlantic LNG.
UK
We have a 50% interest in the Dragon LNG regasification terminal, with long-term arrangements in place governing the use of capacity rights.
USA
We have offtake rights via a lease to 100% of the capacity (2.5 mtpa) of the Kinder Morgan-operated Elba Island liquefaction plant, which consists of 10 MMLS units. The first three of these units started up in 2019. We also lease regasification capacity on Elba Island with contracted capacity of 11.6 mtpa.
We have 13.1 mtpa of contracted capacity in the Lake Charles regasification terminal in Louisiana. We are also evaluating a project to convert the existing regasification facility owned by Energy Transfer into a liquefaction plant in which we would have capacity rights. In March 2019, we signed a project framework agreement with Energy Transfer to advance the proposed Lake Charles LNG export project towards a potential FID. The Lake Charles LNG export project, is planned to have liquefaction capacity of 16.45 million tons per annum and is a 50:50 venture between the two parties.
Trading and Supply
Through our Shell Energy organisation, we market a portion of our share of equity production of LNG and trade LNG volumes around the world through our hubs in the UK, Dubai and Singapore. We also sell trucked LNG in China, Singapore and Europe.
OTHER GAS AND POWER ACTIVITIES
Bolivia
We hold a 37.5% participating interest in the Caipipendi block, where we mainly produce from the Margarita and Huacaya gas-condensate fields. We are also exploring further in the Caipipendi block. We also have a 25% interest in the Petrobras-operated Tarija XX West block where we produce from the Itaú field. We have the rights to explore and further develop the onshore Huacareta block (Shell interest 100% during exploration), and we are currently exploring there. In August 2019, we acquired a 15% participating interest in the Repsol-operated Iniguazu exploration Block. In May 2019, we relinquished the La Vertiente Block to the government.
China
We jointly develop and produce from the onshore Changbei tight-gas field under a PSC with China National Petroleum Corporation (CNPC). In 2016, we completed the Changbei I development programme under the PSC and subsequently handed over the production operatorship to CNPC. In December 2017, we took the FID on the Changbei II Phase 1 project. We started drilling activity in early 2019, and remain the operator of Changbei II.
India
We had a 30% interest in the producing oil and gas field Panna/Mukta and a 30% interest in the Mid Tapti and South Tapti fields. Both licences expired in December 2019 and operatorship was transferred to Oil & Natural Gas Corporation Limited (ONGC).
In 2019, we divested our 10% interest in Mahanagar Gas Limited, a natural gas distribution company in Mumbai.
Trading and Supply
STRATEGIC REPORT SHELL FORM 20-F 2019 | 24 | |
Trading and Supply also markets and trades natural gas, power and carbon-emission rights in multiple markets in North and South America, Europe, Asia and Australia, of which a portion includes equity volumes from our upstream operations.
We have set up a power marketing and trading business in Japan which began trading in 2019.
In November 2019, we acquired ERM Power, one of Australia's leading commercial and industrial electricity retailers, which builds on Shell Energy Australia's existing gas marketing and trading capability.
Other
We have a 17.9% share in the West African Gas Pipeline Company Limited which owns and operates a 678-kilometre pipeline transporting gas from Nigeria to Ghana, Benin and Togo.
We have a 40% interest in a gas pipeline connecting Uruguay to Argentina.
We have a 35% interest in Cyprus block 12, holding the Aphrodite discovery which is currently under appraisal, a 60% interest in two deep-water blocks in Colombia, interests in offshore blocks in Myanmar and one exploration block licence in Namibia.
We also have interests in Gabon and Morocco.
NEW ENERGIES
Our New Energies business explores emerging opportunities linked to the energy transition and invests in those where we see sufficient value. We focus on power, from generation to electric-vehicle charging to integration with Trading, as well as on new fuels for transport, including advanced biofuels and hydrogen.
The New Energies portfolio is being built through organic growth and acquisitions. Most of these opportunities are in sectors that are different from Shell’s existing oil and gas businesses, but have some similarities and/or adjacencies to our Downstream and gas and power trading businesses. Shell-controlled New Energies companies are subject to the Shell Control Framework. Some are not yet in full compliance with the Shell Control Framework and we are working to bring them into compliance with this framework in a fit-for-purpose manner.
Power
We began supplying residential customers in the UK for the first time when we acquired First Utility in 2018. We rebranded First Utility to Shell Energy Retail in 2019. In November 2019, Shell Energy Retail completed the acquisition of Hudson Energy Supply UK Limited, which trades as Green Star Energy for consumers and Hudson Energy for businesses. Shell Energy Retail supplies 100% renewable electricity via purchase of certificates, as well as natural gas and smart home technology to more than 900 thousand homes in the UK.
We own a majority interest in GI Energy, a US company that focuses on the integration of distributed energy resources. We refer to distributed energy when customers begin to generate their own power through solar panels or wind turbines, store it and redistribute it back into the grid.
In 2019, we acquired German company sonnen, which provides battery storage systems to homes with solar panels. In 2019, we also acquired
energy technology firm Limejump which provides energy storage to smaller renewable energy generators, allowing them to sell clean power in real-time to the National Grid.
In the Netherlands, we are part of the Blauwwind consortium (Shell interest 20%) which is developing the Borssele III and IV offshore wind farms that are designed to have a total installed capacity of 731.5 MW, enough to power about 825,000 Dutch homes. We have a 50% interest in the NoordzeeWind joint venture, an offshore wind power project in the Netherlands with total installed capacity of 108 MW.
In the USA, we have developed and become co-owners of four onshore wind projects, from California to Texas. In December 2018, we formed two 50:50 joint ventures: with EDF Renewables to build wind farms off the New Jersey coast; and with EDPR to build wind farms off Massachusetts. In November 2019, Massachusetts state authorities selected our JV with EDPR to develop and supply 804 MW of clean, renewable energy from offshore wind to electricity customers in the state.
We own a 43.1% interest in Silicon Ranch Corporation, a developer, owner and operator of solar energy assets in the USA.
In 2019, we acquired a 49% interest in Cleantech Solar, which provides solar power to commercial and industrial customers across South-East Asia and India. In 2019, we also acquired a 49% interest in ESCO Pacific, a utility-scale solar developer and long-term asset management company in Australia.
In 2019, we completed the acquisition of EOLFI, a French renewable energies developer specialising in floating offshore wind projects.
Through our NewMotion subsidiary, Shell is developing other flexible solutions for EV drivers to charge their vehicles at home or at work. NewMotion operates around 50 thousand private electric charge points for homes and businesses in the Netherlands, Germany, France and the UK.
In 2019, we acquired Greenlots, a California-based company that provides EV charging posts, charging network software and grid services across the USA and has growing business in Canada, Thailand, Malaysia and Singapore.
New fuels for transport
In Bangalore, India, we have built a demonstration plant that is designed to turn waste into petrol or diesel that can power cars.
In Oregon, USA, we are developing a facility to produce renewable natural gas (RNG) from organic waste through a process called anaerobic digestion.
We are part of joint ventures and alliances that have built hydrogen filling stations for passenger cars in the USA (California), Canada, Germany and the UK and announced plans to build several stations in the Netherlands. In California, Shell is also developing filling stations for hydrogen trucks, in co-operation with Toyota, Kenworth and the Port of Los Angeles.
STRATEGIC REPORT SHELL FORM 20-F 2019 | 25 | |
INTEGRATED GAS DATA TABLE
LNG liquefaction volumes | Million tonnes | |||||||
2019 | 2018 | 2017 | ||||||
Australia | 12.5 | 12.1 | 11.1 | [A] | ||||
Brunei | 1.6 | 1.6 | 1.6 | |||||
Egypt | 0.4 | 0.3 | 0.2 | |||||
Malaysia | - | 0.6 | [B] | 1.3 | [B] | |||
Nigeria | 5.3 | 5.1 | 5.2 | |||||
Norway | 0.1 | 0.1 | 0.1 | |||||
Oman | 2.6 | 2.4 | 2.0 | |||||
Peru | 0.9 | 0.8 | 0.9 | |||||
Qatar | 2.5 | 2.3 | 2.4 | |||||
Russia | 3.0 | 3.1 | 3.1 | |||||
Trinidad and Tobago | 6.7 | 5.8 | 5.3 | |||||
United States | 0.1 | — | — | |||||
Total | 35.6 | 34.3 | 33.2 | |||||
[A] Includes LNG liquefaction volumes related to our share in equity securities of Woodside, that were disposed of in 2017.
[B] Includes LNG liquefaction volumes related to our share in equity securities of Malaysia LNG Tiga, that were disposed of in 2018.
LNG AND GTL PLANTS AT DECEMBER 31, 2019
LNG liquefaction plants in operation | |||||||
Asset | Location | Shell interest (%) | 100% capacity (mtpa) [A] | ||||
Europe | |||||||
Norway | Gasnor | Bergen | 100.0 | 0.3 | |||
Asia | |||||||
Brunei | Brunei LNG | Lumut | 25.0 | 7.6 | |||
Oman | Oman LNG | Sur | 30.0 | 7.1 | |||
Qalhat LNG | Sur | 11.0 | [B] | 3.7 | |||
Qatar | Qatargas 4 | Ras Laffan | 30.0 | 7.8 | |||
Russia | Sakhalin LNG | Prigorodnoye | 27.5 | 9.6 | |||
Oceania | |||||||
Australia | Australia North West Shelf | Karratha | 16.7 | 16.9 | |||
Gorgon LNG | Barrow Island | 25.0 | 15.6 | ||||
Prelude | Browse Basin | 67.5 | 3.6 | ||||
Queensland Curtis LNG T1 | Curtis Island | 50.0 | 4.3 | ||||
Queensland Curtis LNG T2 | Curtis Island | 97.5 | 4.3 | ||||
Africa | |||||||
Egypt | Egyptian LNG T1 | Idku | 35.5 | 3.6 | |||
Egyptian LNG T2 | Idku | 38.0 | 3.6 | ||||
Nigeria | Nigeria LNG | Bonny | 25.6 | 24.1 | |||
South America | |||||||
Peru | Peru LNG | Pampa Melchorita | 20.0 | 4.5 | |||
Trinidad and Tobago | Atlantic LNG T1 | Point Fortin | 46.0 | 3.0 | |||
Atlantic LNG T2/T3 | Point Fortin | 57.5 | 6.6 | ||||
Atlantic LNG T4 | Point Fortin | 51.1 | 5.2 | ||||
[A] As reported by the operator.
[B] Interest, or part of the interest, is held via indirect shareholding.
LNG liquefaction plants under construction | |||||
Asset | Location | Shell interest (%) | 100% capacity (mtpa) | ||
North America | |||||
Canada | LNG Canada T1-2 | Kitimat | 40.0 | 14.0 | |
STRATEGIC REPORT SHELL FORM 20-F 2019 | 26 | |
GTL plants in operation | ||||||
Asset | Location | Shell interest (%) | 100% capacity (b/d) | |||
Asia | ||||||
Malaysia | Shell MDS | Bintulu | 72.0 | 14,700 | ||
Qatar | Pearl | Ras Laffan | 100.0 | 140,000 | ||
STRATEGIC REPORT SHELL FORM 20-F 2019 | 27 | |
Upstream | |
Key statistics | $ million, except where indicated | |||||
2019 | 2018 | 2017 | ||||
Segment earnings | 4,195 | 6,798 | 1,551 | |||
Including: | ||||||
Revenue (including inter-segment sales) | 46,413 | 47,733 | 40,192 | |||
Share of profit of joint ventures and associates | 379 | 285 | 623 | |||
Interest and other income | 2,180 | 600 | 1,188 | |||
Operating expenses [A] | 12,043 | 12,157 | 12,656 | |||
Exploration | 2,073 | 1,132 | 1,804 | |||
Depreciation, depletion and amortisation | 17,003 | 13,006 | 17,303 | |||
Taxation charge/(credit) | 5,954 | 8,791 | 2,409 | |||
Capital expenditure | 10,074 | 12,447 | 11,389 | |||
Cash capital expenditure [A] | 10,277 | 12,582 | 11,670 | |||
Capital investment [A] | 11,075 | 12,785 | 13,160 | |||
Oil and gas production available for sale (thousand boe/d) | 2,743 | 2,709 | 2,777 | |||
[A] See “Non-GAAP measures reconciliations” on pages 219-220.
OVERVIEW
Our Upstream business explores for and extracts crude oil, natural gas and natural gas liquids. It also markets and transports oil and gas, and operates infrastructure necessary to deliver them to market. We are also involved in the extraction of bitumen from mined oil sands and its conversion into synthetic crude oil.
BUSINESS CONDITIONS
Global oil demand grew by 1.0 million barrels per day (b/d), or 1.0%, to 100.3 million b/d in 2019, according to the International Energy Agency’s Oil Market Report published in January 2020. Brent crude oil, an international benchmark, traded between $53 per barrel (/b) and $75/b in 2019, ending the year at the lower price of $67/b. It averaged $64/b for the year, $7/b lower than in 2018.
On a yearly average basis, West Texas Intermediate crude oil traded at a $7/b discount to Brent in 2019, compared with $6/b in 2018. The discount remained broadly unchanged from 2018, reflecting continued constrained pipeline capacity from the landlocked Cushing storage hub to the US Gulf Coast, against a backdrop of growing supply to the hub. US crude oil exports increased further to about 3 million b/d in 2019, up by 1 million b/d from 2018. This helped to limit widening of the price differential between Brent and WTI.
Global gas demand is estimated to have grown by about 2.4% in 2019, which is in line with the annual growth rate of 2.5% observed since the start of the century. Robust demand growth in power generation and industry was driven by attractive regional spot gas prices that incentivised switching away from competing fuels such as coal and oil. In the key regional markets of North America, Europe, and Asia-Pacific, attractive prices have been caused mainly by ample gas supply growth.
In the USA, the natural gas price at the Henry Hub averaged $2.5 per million British thermal units (MMBtu) in 2019, 19% lower than in 2018, and traded in a range of $2.0-4.1/MMBtu. There was some downward pressure on prices due to strong gas supply growth of about 8 billion cubic feet per day (cf/d), which averaged 10% higher than 2018. Gas supply growth was, in part, driven by a growth of associated gas from oil fields, helped by oil prices above $50/b, and by new gas pipeline capacity. Gas prices found support from: demand growth driven by below-normal storage inventory levels; an increase in usage of power for cooling due to warmer than normal weather in the second half of the year; completion of LNG liquefaction projects; increased exports to Mexico by pipeline; and US industrial growth.
In Europe, natural gas prices were lower than in 2018. The average price at the UK National Balancing Point (NBP) was 43% lower in 2019. At the main continental gas trading hubs - in the Netherlands, Belgium and
Germany - prices were also lower, as reflected by weaker Dutch Title Transfer Facility (TTF) prices. European gas prices were lower due to: the rise in LNG volume diverted from the Asia-Pacific region caused by weaker Asia-Pacific demand growth; robust supply of pipeline gas, particularly from Russia; well-filled gas storage inventories; competition with renewables in power generation; and mild weather.
See “Market overview” on pages 16-17.
PRODUCTION AVAILABLE FOR SALE
In 2019, production was 1,001 million boe, or 2,743 thousand boe/d, compared with 989 million boe, or 2,709 thousand boe/d in 2018. Liquids production increased by 8% and natural gas production decreased by 9% compared with 2018.
Increases were mainly from new field start-ups and the continuing ramp-up of existing fields (around 190 thousand boe/d), in particular in the Permian Basin in the USA, in the US Gulf of Mexico (Appomattox, Stones and Ursa) and in Brazil (Lula and Berbigao). Further increases from moving Salym from IG to Upstream (around 60 thousand boe/d). Decreases were mainly from divestments (around 90 thousand boe/d), field declines and performance maintenance (around 100 thousand boe/d).
EARNINGS 2019-2018
Segment earnings in 2019 were $4,195 million, which included a net charge of $1,930 million related to impairments, primarily in the US Appalachia unconventional gas assets and a drilling rig joint venture, partly offset by a gain of $1,609 million on sale of assets, mainly in Denmark and the US Gulf of Mexico.
Segment earnings in 2018 were $6,798 million, which included a net gain of $23 million. This included a net gain of $886 million on sale of assets, mainly related to our divestments in Iraq, Malaysia, Oman and Ireland, and a gain of $149 million related to the fair value accounting of commodity derivatives. These gains were partly offset by a charge of $561 million related to the impact of the weakening Brazilian real on a deferred tax position, a net impairment charge of $350 million mainly related to assets in North America and deep-water rig joint ventures, and a charge of $90 million related to the release of historic currency differences.
Excluding the net charge described above, segment earnings in 2019 were $4,744 million, compared with $6,775 million in 2018. Earnings excluding the net charge were adversely impacted by lower realised oil and gas prices, higher depreciation as well as higher well write-offs mainly in Albania and Kazakhstan, partly offset by higher sales volumes associated with the timing of liftings.
STRATEGIC REPORT SHELL FORM 20-F 2019 | 28 | |
EARNINGS 2018-2017
Segment earnings in 2018 were $6,798 million, which included a net gain of $23 million as described above.
Segment earnings in 2017 were $1,551 million, which included a net charge of $1,540 million. This net charge included impairment charges of $2,557 million, mainly related to divestments of our oil sands interests in Canada, onshore assets in Gabon and our interest in the Corrib gas project in Ireland. The net charge also involved $1,089 million related to US tax reform legislation, and redundancy and restructuring charges of $163 million. These charges were partly offset by gains on divestments of $1,463 million, mainly related to a package of UK North Sea assets, a credit of $772 million mainly reflecting the release of tax liabilities, and other items with a net positive impact of $34 million.
Excluding the net charges described above, segment earnings in 2018 were $6,775 million compared with $3,091 million in 2017. Earnings benefited from higher realised oil and gas prices (around $4,770 million) and lower well write-offs (around $400 million). These impacts were partly offset by the impact of movements in deferred tax positions (around $1,520 million) and lower production volumes (around $510 million).
CASH CAPITAL EXPENDITURE AND CAPITAL INVESTMENT
Cash capital expenditure in 2019 was $10.3 billion, compared with $12.6 billion in 2018. Capital investment in 2019 was $11.1 billion, compared with $12.8 billion in 2018.
The lower cash capital expenditure and capital investments in 2019 reflected our continuing efforts to improve capital efficiency by pursuing lower cost development solutions, the completion of the Appomattox project, IFRS16 implementation effects and the 2018 impacts of relative higher spend for lease renewals in Nigeria and additional investments in exploration acreage.
PORTFOLIO AND BUSINESS DEVELOPMENT
We took the following key portfolio decisions during 2019:
In Argentina we won two exploration blocks in the deep-water bid round (Shell interest 60%).
▪ | Also in Argentina, we agreed a 50:50 partnering with Equinor to jointly acquire Schlumberger’s 49% interest in the Bandurria Sur block located in the Vaca Muerta basin (Shell interest 24.5%). |
▪ | In Brazil, we announced the Final Investment Decision (FID) to contract the Mero 2 floating production, storage and offloading (FPSO) vessel to be deployed at the Mero field offshore Santos Basin in Brazil. |
▪ | In Brunei, we acquired the deep-water exploration Block CA-1 (Shell interest 86.95%). The deal is expected to complete in 2020. |
▪ | In Egypt, we announced the intention to sell our onshore upstream assets in the country. |
▪ | Also in Egypt, we were awarded onshore concessions with 100% Shell interest (West El Fayum, South East Horus, South Abu Sennan) and one producing concession extension (Bed 2-17). |
▪ | Also in Egypt, we were awarded two concessions in the Red Sea bid round: Block 4 (Shell interest 70%) and Block 3 as the sole operator. This is awaiting ratification. |
▪ | In Kazakhstan, we decided not to progress the Kalamkas-Khazar projects. These projects were not deemed competitive compared to other opportunities in our global portfolio. |
▪ | In Malaysia, we took FID on the second phase of the Malikai deep water development (Shell interest 35%). |
▪ | In Nigeria, we announced the release of Invitation to Tender (ITT) to contractors for the development of the Bonga South West Aparo (BSWA) oil field. |
▪ | In Oman, our partnership with Oman Oil Company Exploration production to explore for oil and gas in Block 42 was ratified (Shell interest 50%). |
▪ | Also in Oman, we signed an Exploration & Production Sharing Agreement for Block 55 in the southeast of the Sultanate (Shell interest 100%). This agreement is awaiting ratification via Royal Decree. |
▪ | In São Tomé and Príncipe, in the Gulf of Guinea, we acquired interests in Block 6 (Shell interest 20%) and Block 11 (Shell interest 30%) exploration licences. |
▪ | In South Africa, we entered the frontier deep-water Cape Basin (Shell interest 40%) and a second block adjacent to our existing acreage in the Namibian Orange Basin (Shell interest 45%). |
▪ | In the UK, we announced FID to export gas and oil from the Pierce field, which is located 165 miles east of Aberdeen (Shell interest 92.5%). |
▪ | In the US Gulf of Mexico, we announced FID to develop the PowerNap field (Shell interest 100%). |
▪ | Also in the US Gulf of Mexico, we acquired 77 blocks across multiple plays in the Gulf of Mexico Lease Sale 252. |
▪ | In the USA, we made a significant discovery at the Blacktip prospect in the deep-water US Gulf of Mexico (Shell interest 52.4%). Blacktip is our second significant discovery in the Perdido Corridor and is part of a continuing exploration strategy to add competitive deep-water options to extend our heartlands. |
In the Netherlands, the Dutch government decided to halt Groningen production by 2022, eight years earlier than initially planned.
We achieved the following operational milestones in 2019:
▪ | In deep water off Brazil, we announced first production from two of our FPSOs: P-67, in Lula North (Shell interest 23%, post-unitisation); and P-68, in Berbigão (Shell interest 25%, subject to unitisation). |
▪ | In Italy, the Tempa Rossa oil field started up in December 2019 (Shell interest 25%). |
▪ | In Malaysia, we completed phase 2 of the Gumusut-Kakap deep-water project, drilling four additional subsea wells (Shell interest 29%). |
▪ | In Malaysia offshore Sarawak, we produced first oil and gas from the E6 field in SK308 PSC (Shell interest 50%). We also produced first gas from the Larak field in the SK408 PSC (Shell interest 30%). |
▪ | In the US Gulf of Mexico, we announced first production from Appomattox (Shell interest 79%). It is the first commercial discovery brought into production in the deep-water Norphlet formation in the US Gulf of Mexico. |
We continued to divest selected assets during 2019, including:
▪ | In Canada, we sold our Foothills sour gas plants and the gas fields which feed them. |
▪ | In Denmark, we completed the sale of our 36.8% non-operating interest in our joint venture the Danish Underground Consortium, for $1.9 billion. |
▪ | In Norway, we sold 10% of our 12% interest in Nyhamna gas plant. |
▪ | In the US Gulf of Mexico, we sold our 22.45% non-operating interest in the Caesar Tonga asset. |
▪ | Also in the USA, we sold our non-Shell operated interest in the Haynesville shale gas formation in Northern Louisiana. |
▪ | Also in the USA, we sold our Norphlet deep-water gathering pipeline system in the US Gulf of Mexico. |
BUSINESS AND PROPERTY
Our subsidiaries, joint ventures and associates are involved in all aspects of upstream activities, including matters such as land tenure, entitlement to produced hydrocarbons, production rates, royalties, pricing, environmental protection, social impact, exports, taxes and foreign exchange.
The conditions of the leases, licences and contracts under which oil and gas interests are held vary from country to country. In almost all cases outside North America, the legal agreements are generally granted by, or entered into with, a government, state-owned company, government-run oil and gas company or agency, and the exploration risk usually rests with the independent oil and gas company. In North America, these agreements may also be with private parties that own mineral rights. Of these agreements, the following are most relevant to our interests:
STRATEGIC REPORT SHELL FORM 20-F 2019 | 29 | |
▪ | Licences (or concessions), which entitle the holder to explore for hydrocarbons and exploit any commercial discoveries. Under a licence, the holder bears the risk of exploration, development and production activities, and is responsible for financing these activities. In principle, the licence holder is entitled to the totality of production less any royalties in kind. The government, state-owned company or government-run oil and gas company may sometimes enter into a joint arrangement as a participant, sharing the rights and obligations of the licence but usually without sharing the exploration risk. In a few cases, the state-owned company, government-run oil and gas company or agency has an option to purchase a certain share of production. |
▪ | Lease agreements, which are typically used in North America and are usually governed by terms similar to licences. Participants may include governments or private entities. Royalties are either paid in cash or in kind. |
▪ | PSCs entered into with a government, state-owned company or government-run oil and gas company. PSCs generally oblige the independent oil and gas company, as contractor, to provide all the financing and bear the risk of exploration, development and production activities in exchange for a share of the production. Usually, this share consists of a fixed or variable part that is reserved for the recovery of the contractor’s cost (cost oil). The remaining production is split with the government, state-owned company or government-run oil and gas company on a fixed or volume/revenue-dependent basis. In some cases, the government, state-owned company or government-run oil and gas company will participate in the rights and obligations of the contractor and will share in the costs of development and production. Such participation can be across the venture or on a field-by-field basis. Additionally, as the price of oil or gas increases above certain predetermined levels, the independent oil and gas company’s entitlement share of production normally decreases, and vice versa. Accordingly, its interest in a project may not be the same as its entitlement. |
EUROPE
Italy
We have a 39% interest in the Val d’Agri producing concession, operated by ENI.
We also have a 25% interest in the Tempa Rossa producing concession operated by Total.
Netherlands
Shell and ExxonMobil are 50:50 shareholders in Nederlandse Aardolie Maatschappij B.V. (NAM). An important part of NAM’s gas production comes from the onshore Groningen gas field, in which NAM holds a 60% interest. The remaining 40% interest is held by EBN, a Dutch government entity.
Production from the Groningen field induces earthquakes that cause damage to houses and other buildings and structures in the region. This has led to complaints and claims for compensation for damage from the local community. NAM is working with the Dutch government and other stakeholders to fulfil its obligations to the residents of the area, which includes compensation for damage caused by above-mentioned earthquakes.
Since 2013, the Dutch Minister of Economic Affairs and Climate (the Minister) has set an annual production level for the Groningen field taking into account all interests, including safety of the residents, security of supply in the domestic gas market as well as supply commitments in EU member states. Production in the gas year 2018-2019 (ending October 1, 2019) was capped at 19.4 billion cubic metres; actual production in this period was 17.5 billion cubic metres.
In June 2018, NAM’s shareholders and the Dutch government signed a Heads of Agreement (HoA) to reduce production from Groningen and to ensure the financial robustness of NAM to fulfil its obligations. In the HoA, NAM’s shareholders have agreed not to declare dividends for 2018 and 2019. Dividend payments in 2020 and beyond will only be done if a solvency ratio of 25% is reached. In September 2018, detailed agreements were signed to further implement the HoA. As part of these agreements, Shell guarantees NAM’s payment obligations vis-à-vis the Dutch government in relation to earthquake-related damages and costs of
strengthening houses, up to a maximum of 30%. This maximum equates to Shell’s indirect interest in the Groningen production system.
In September 2019, the government issued an update announcing that it was able to reduce Groningen production faster, stopping production in 2022, eight years earlier than initially planned. Negotiations are ongoing between the government and the NAM shareholders to discuss the compensation payable by the government to NAM in order to restore the balance of the package of arrangements laid down in the 2018 HoA.
NAM also has a 60% interest in the Schoonebeek oil field and operates 25 other hydrocarbon production licences onshore and offshore in the North Sea.
Norway
We are a partner in 34 production licences on the Norwegian continental shelf. We are the operator in 14 of these, of which two are producing: the Knarr field (Shell interest 45%), and the Ormen Lange gas field (Shell interest 17.8%). We have interests in the producing fields Troll, Kvitebjørn, Sindre and Valemon, where we are not the operator.
UK
We operate a significant number of our interests on the UK continental shelf under a 50:50 joint-venture agreement with ExxonMobil. In addition to our oil and gas production from North Sea fields, we have various interests in the Atlantic Margin area where we are not the operator, principally in the West of Shetland area (Clair, Shell interest 28%), and Schiehallion (Shell interest approximately 45%).
In June 2019 the “Pioneering Spirit” vessel safely completed the single-lift removal of the 25,000-tonne Brent Bravo topside from the North Sea. Brent Bravo is the second of four platforms, after Brent Delta, to be decommissioned and removed from the Brent oil and gas field. The UK Government initiated consultation with the other signatories of the OSPAR Convention on whether to issue derogations for leaving in-situ the footings of the Brent Alpha steel jacket and each of the gravity-based concrete installations of Brent Bravo, Brent Charlie and Brent Delta.
In October 2019, we announced FID on a project to enable the export of gas and oil from the Pierce field, which lies 165 miles east of Aberdeen. It is a joint venture between Shell (92.52%) and Ithaca (7.48%). The project includes modifying the FPSO vessel, the Haewene Brim, owned and operated by Bluewater. Development is expected to take place between 2020 and 2021 and has Oil and Gas Authority (OGA) approval.
Rest of Europe
We also have interests in Albania, Bulgaria and Germany.
ASIA (INCLUDING THE MIDDLE EAST AND RUSSIA)
Brunei
Shell and the Brunei government are 50:50 shareholders in Brunei Shell Petroleum Company Sendirian Berhad (BSP). BSP has long-term oil and gas concession rights onshore and offshore Brunei, and sells most of its gas production to Brunei LNG Sendirian Berhad (see “Integrated Gas” on pages 22-27), with the remainder (12% in 2019) sold in the domestic market.
In addition to our interest in BSP, we have a 35% non-operating interest in the Block B concession, where gas and condensate are produced from the Maharaja Lela field.
We also have non-operating interest in the deep-water exploration Block CA-2 (Shell interest 12.5%), under PSC.
A sale and purchase agreement was signed in October 2019 for the acquisition of Total E&P Deep Offshore Borneo B.V. and all of its interests in the deep-water exploration Block CA-1 (interest 86.95%), under PSC. The deal is expected to complete in 2020.
Over the course of 2019, we have relinquished our interests in the Block A concession (Shell interest 53.9%) following the drilling of the Rapong exploration well. Linked to the relinquishment of Block A, we have also relinquished our interests the adjacent Block N (Shell interest 50%).
Iraq
STRATEGIC REPORT SHELL FORM 20-F 2019 | 30 | |
We have a 44% interest in the Basrah Gas Company, which gathers, treats and processes associated gas that was previously being flared from the Rumaila, West Qurna 1 and Zubair fields. The processed gas and associated products, such as condensate and LPG, are sold to the domestic market. Any surplus condensate and LPG is exported. In 2019, Basrah Gas Company processed on average around 850 million scf/d of associated gas into dry gas, condensate and LPG.
Kazakhstan
We are the joint operator of the onshore Karachaganak oil and condensate field (Shell interest 29.3%), where we have a licence to the end of 2037.
We have an interest in the North Caspian Sea Production Sharing Agreement (Shell interest 16.8%) which includes the Kashagan field in the Kazakh sector of the Caspian Sea. The North Caspian Operating Company is the operator. This shallow-water field covers an area of around 3,400 square kilometres. Phase 1 development of the field is expected to lead to plateau oil production capacity of about 63 thousand boe/d by 2020 (Shell interest), with the possibility of increases with additional phases of development.
We have a 7.4% interest in Caspian Pipeline Consortium, which owns and operates an oil pipeline running from the Caspian Sea to the Black Sea across parts of Kazakhstan and Russia.
In 2019 we made the decision not to progress the Kalamkas-Khazar projects. These projects were not competitive enough compared to other opportunities in Shell's global portfolio.
Malaysia
We explore for and produce oil and gas offshore Sabah and Sarawak under 16 PSCs, in which our interests range from 20% to 85%.
Offshore Sabah, we operate two producing oil fields. These include the Gumusut-Kakap deep-water field (Shell interest 29%), and the Malikai deep-water field (Shell interest 35%). In August 2019, phase 2 development of the Gumusut-Kakap field successfully achieved first oil and is expected to add 50 thousand boe/d of extra capacity (Shell interest). In December 2019, we also took FID on phase 2 of the Malikai project. The project involves the drilling of two additional oil producing wells and four water injection wells to enhance Malikai's expected recoverable oil volumes. We also have a 21% interest in the Siakap North-Petai deep-water field and a 30% interest in the Kebabangan field, both operated by third parties. Additionally, we have exploration interests in Blocks SB-J, SB-G, SB-N, SB-3G, ND-6 and ND-7 PSCs.
Offshore Sarawak, we are the operator of eight producing gas fields (Shell interest 50%). In June 2019, the Block SK8 PSC expired (Shell equity 37.5%). In 2019, the abandonment of depleted wells for Serai field (Shell interest 37.5%) and Saderi field (Shell interest 37.5%) were completed. In December 2019, we signed a binding Heads of Agreement (HOA) for the extension of the MLNG PSC. Under the terms of the HOA, Shell will continue to be the PSC operator for F6 and F23 hubs and retains the operatorship of E8, F13 East and F13 West fields. Shell will also be the operator for the new exploration acreage and new fields (F22, F27, Selasih), which will now be part of the MLNG Extension PSC. The key terms in the HOA will be further detailed in the definitive agreements expected to be signed in 2020. Nearly all the gas produced offshore Sarawak is supplied to Malaysia LNG and to our gas-to-liquids plant in Bintulu. See “Integrated Gas” on pages 22-27.
In May 2019, first oil and gas were successfully achieved from the E6 field in SK308 PSC (Shell interest 50%) where the field is the first carbonate thin oil-rim and gas development in Malaysia. First gas was also successfully achieved from the Larak field in the SK408 PSC (Shell interest 30%) in December 2019.
We also have interests in the Amended 2011 Baram Delta EOR PSC (Shell interest 40%) and in Block SK-307 PSC (Shell interest 50%), and exploration interests in Blocks SK318, SK320, SK408 and SK319.
Oman
We have a 34% interest in Petroleum Development Oman (PDO); the Omani government has a 60% interest. PDO is the operator of more than 200 oil
fields, mainly located in central and southern Oman, over an area of 90,874 square kilometres. The concession expires in 2044.
In October, we signed an Exploration & Production Sharing Agreement for Block 55 in the southeast of the Sultanate. Oman Shell now has a 100% working interest and operatorship of Block 55 with a total area of 7,564 square kilometres. The agreement includes a work programme of regional studies, seismic acquisition and other potential exploration activities. This agreement is awaiting ratification via Royal Decree.
Russia
We have a 50% interest in Salym Petroleum Development N.V., the joint venture with Gazprom Neft, developing the Salym fields in western Siberia, Khanty Mansiysk Autonomous District.
We and Gazprom Neft each have a 50% interest in Khanty-Mansiysk Petroleum Alliance VOF partnership through which Shell is a holder of 50% of shares in JSC Khanty-Mansiysk Petroleum Alliance.
In June 2019, we signed an agreement with Gazprom Neft on the future sales and purchase of the 50% participation interest in LLC Meretoyahaneftegaz. This transaction is expected to be completed in 2020.
With effect from January 1, 2019, Salym and Khanty-Mansiysk Petroleum Alliance VOF partnership is reported in the Upstream segment. Comparative information has not been restated.
As a result of European Union and US sanctions prohibiting certain defined oil and gas activities in Russia, we suspended our support to Salym and Khanty-Mansiysk Petroleum Alliance VOF partnership in relation to shale oil activities since 2014. Also, Salym and Khanty-Mansiysk Petroleum Alliance VOF partnership also suspended any of their shale oil-related activities since 2014 as well.
United Arab Emirates
In Abu Dhabi, we have a 15% interest in the licence of ADNOC Gas Processing, which expires in 2028. ADNOC Gas Processing exports propane, butane and heavier-liquid hydrocarbons, which it extracts from the wet gas associated with the oil produced by ADNOC Onshore.
Rest of Asia
We also have interests in Jordan, Kuwait, the Philippines and Turkey.
AFRICA
Egypt
We have a 50% interest in the Badr Petroleum Company (BAPETCO), a self-operated joint venture between Shell and the Egyptian General Petroleum Corporation (EGPC). BAPETCO onshore operations are in the Western Desert where we have an interest in ten oil and gas producing concessions, as well as two exploration concessions (North East Obaiyed, North Matruh). In October 2019, we announced our intention to sell our onshore upstream assets in Egypt. In December 2019, we were awarded onshore concessions with 100% Shell interest (West El Fayum, South East Horus, South Abu Sennan) and one producing concession extension (Bed 2-17).
We have a 25% interest in the Burullus Gas Company (Burullus), a self-operated joint venture between Shell, EGPC and PETRONAS. Burullus operates the West Delta Deep Marine concession (Shell interest 50%), which supplies gas to both the domestic market and the Egyptian LNG plant (see “Integrated Gas” on pages 22-27).
We have a 60% interest in the development rights over the Harmattan Deep discovery and in the Notus discovery offshore the Nile Delta.
We have interests in two gas-producing areas offshore the Nile Delta. We have a 40% interest in the Rashid Petroleum Company, a self-operated joint venture between Shell, EGPC and Edison, which operates the Rosetta concession (Shell interest 80%).
STRATEGIC REPORT SHELL FORM 20-F 2019 | 31 | |
With effect from January 1, 2020, our interest in the offshore Nile Delta will be reported in the Integrated Gas segment. Comparative information will not be restated.
Nigeria
Our share of production, onshore and offshore, in Nigeria was 266 thousand boe/d in 2019, compared with 255 thousand boe/d in 2018. Security issues, sabotage and crude oil theft in the Niger Delta remained significant challenges in 2019.
Onshore
The Shell Petroleum Development Company of Nigeria Limited (SPDC) is the operator of a joint venture (Shell interest 30%) that has 17 Niger Delta onshore oil mining leases (OML).
SPDC commenced litigation against the Federal Government (FGN), in the domestic court to challenge the non-renewal of OML 11. In August 2019, the Court ruled in favour of SPDC affirming that the SPDC JV has fulfilled its obligations under the law for the renewal of OML 11 and ordered the FGN to renew OML 11 for 20 years. In December 2019, the court further refused to grant an application by the FGN to suspend the implementation of the judgement. Though the FGN has appealed the decision of the Court, SPDC continues to operate the block supported by the judgement in its favour which remains in force and unimpaired.
SPDC supplies gas to Nigeria LNG Ltd (see “Integrated Gas” on pages 22-27) mainly through its Gbaran-Ubie and Soku projects.
In 2019, we took the FID on Soku NAG Compressor 2 and Gbaran Single Wells Hookup (Shell interest 30%).
Offshore
Our main offshore deep-water activities are carried out by Shell Nigeria Exploration and Production Company Limited (SNEPCO, Shell interest 100%). SNEPCO has interests in four deep-water blocks, three of which are under PSC terms: Bonga and Erha. SNEPCO operates OMLs 118 (including the Bonga field FPSO, Shell interest 55%) and 135 (Bolia and Doro, Shell interest 55%) and has a 43.8% non-operating interest in OML133 (including the Erha FPSO). Separately, SNEPCO holds a 50% non-operating interest in oil prospecting licence (OPL) 245 (Zabazaba, Etan) under a production sharing agreement (PSA).
Authorities in various countries are investigating our investment in Nigerian oil block OPL 245 and the 2011 settlement of litigation pertaining to that block. See Note 25 to the “Consolidated Financial Statements” on pages 185-187.
SPDC also has three shallow-water licences (OMLs 74, 77 and 79) and a 40% interest in the non-Shell-operated Sunlink joint venture that has one shallow-water licence (OML 144); all four OMLs expire in 2034.
In our Nigerian operations, we face various risks and adverse conditions which could have a significant adverse effect on our operational performance, earnings, cash flows and financial condition (see “Risk factors” on pages 11-15). There are limitations to the extent to which we can mitigate these risks. We carry out regular portfolio assessments to remain a competitive player in Nigeria for the long term. We support the Nigerian government’s efforts to improve the efficiency, functionality and domestic benefits of Nigeria’s oil and gas industry, and we monitor legislative developments. We monitor the security situation and liaise with host communities, governmental and non-governmental organisations to help promote peace and safe operations. We continue to provide transparency in spills management and reporting, along with our deployment of oil-spill response capability and technology. We execute a maintenance strategy to support sustainable equipment reliability and have implemented a multi-year programme to reduce routine flaring of associated gas. See “Climate change and energy transition” on pages 59-65.
Rest of Africa
We also have interests in Algeria, Mauritania, Namibia, São Tomé and Principe, South Africa and Tunisia.
NORTH AMERICA
Canada
We have mineral leases mainly in Alberta and British Columbia. We produce and market natural gas, natural gas liquids, synthetic crude oil and bitumen.
Shales
We have approximately 1.4 million net mineral acres. Our position is primarily in the Duvernay play in Alberta and the Montney play in British Columbia. Activity includes drill-to-fill of our existing infrastructure and an investment focus on our liquid-rich shale acreage. Our Groundbirch asset has the potential to be an integral part of the LNG Canada value chain.
In 2019, we drilled and brought 30 wells onstream. We have interests in 748 productive wells. In October 2019, we sold our Foothills assets comprising approximately 400 thousand net acres at Waterton, Jumping Pound, West Central and Caroline, with associated gas processing facilities.
After selling our Foothills assets, we operate one natural gas processing facility in Alberta and four natural gas processing facilities in British Columbia.
Bitumen and synthetic crude oil
Synthetic crude oil is produced by mining bitumen-saturated sands, extracting the bitumen from the sands and transporting it to a processing facility where hydrogen is added to produce a wide range of feedstocks for refineries. We have a 50% interest in 1745844 Alberta Ltd. (formerly known as Marathon Oil Canada Corporation), which holds a 20% interest in the Athabasca Oil Sands Project. With effect from January 1, 2020, our interest in the Bitumen and synthetic crude oil will be reported in the Oil Products segment. Comparative information will not be restated.
Carbon capture and storage (CCS)
We operate the Quest CCS project (Shell interest 10%), which captured and safely stored more than 1.1 million tonnes of carbon dioxide in 2019.
USA
We produce oil and gas in deep water in the Gulf of Mexico, heavy oil in California and oil and gas from shale in Pennsylvania and Texas. The majority of our oil and gas production interests are acquired under leases granted by the owner of the minerals underlying the relevant acreage, including many leases for federal onshore and offshore tracts. Such leases usually run on an initial fixed term that is automatically extended by the establishment of production for as long as production continues, subject to compliance with the terms of the lease (including, in the case of federal leases, extensive regulations imposed by federal law). Our share of production in the USA was in total 653 thousand boe/d in 2019.
In December 2019, we recognised an impairment, mainly associated with the US Appalachia unconventional gas assets. We will continue to regularly review the economic attractiveness of our Shales investments in light of the macroeconomic environment, which could result in changes to development plans in the future. See Note 8 Property, plant and equipment on pagess 163.
Gulf of Mexico
The Gulf of Mexico is our major production area in the USA and accounts for around 54% of our oil and gas production in the country. We have an interest in approximately 320 federal offshore leases and our share of production averaged 359 thousand boe/d in 2019.
In May 2019, we signed an agreement to sell our 22.45% non-operated interest in the Caesar-Tonga asset in the US Gulf of Mexico to Equinor. The total consideration for this deal was $965 million in cash. This was completed on July 1, 2019.
In April 2019, we announced a significant discovery at the Blacktip prospect in the deep-water US Gulf of Mexico. Blacktip is a Wilcox discovery in the Perdido thrust belt and was discovered in the Alaminos Canyon Block 380, approximately 30 miles from the Perdido platform and Whale discovery. Evaluation is ongoing and appraisal planning is underway to further delineate the discovery and define development options.
In May 2019, production started at the Shell-operated Appomattox floating production system months ahead of schedule. Appomattox (Shell interest
STRATEGIC REPORT SHELL FORM 20-F 2019 | 32 | |
79%) currently has an expected peak production of 175 thousand boe/d and is the first commercial discovery now brought into production in the deep-water Gulf of Mexico Norphlet formation. In August 2019, we took the FID for the PowerNap deep-water project in the US Gulf of Mexico. PowerNap (Shell interest 100%), discovered in 2014, is a subsea tie-back to the Shell-operated Olympus production hub. The project is expected to start production in late 2021 and expected to produce up to 35 thousand boe/d at peak rates. In August 2019, the Whale project moved into the Define phase. The project is 60% Shell and 40% Chevron, with the exception of the AC815 lease area which is 40% Shell and 60% Chevron.
We are the operator of eight production hubs - Mars A, Mars B, Auger, Perdido, Ursa, Enchilada/Salsa, Appomattox and Stones - as well as the West Delta 143 Processing Facilities (Shell interests ranging from 38% to 100%). We also have non-operating interests in Nakika (Shell interest 50%) and we continue to produce from Coulomb (Shell interest 100%) which ties into the Nakika non-operated platform. Our production in the US Gulf of Mexico assets was adversely impacted by operational constraints.
Shales
We have approximately 1.0 million net mineral acres. Our activity is focused in the Permian Basin in West Texas and the Marcellus and Utica plays in Pennsylvania.
In 2019, we drilled and brought 271 wells onstream. We have interests in more than 1,952 productive wells and operate seven central processing facilities. The USA represents 61% of our shales proved reserves and 80% of our shales liquids proved reserves. In the Permian Basin, we increased our production in 2019 by around 40% compared with 2018. In December 2019, the first integrated iShale® facilities came on stream in East Slash Ranch of our Permian asset. Comprising two pads with eight wells in total and a central processing facility, this shale ’field of the future’ brings together more than a dozen iShale technologies, including full wireless surveillance and controls, low greenhouse gas emissions technology, multiphase metering, artificial intelligence technologies and solar-powered facilities.
In February 2019, we sold approximately 27 thousand non-core net acres, with 61 wells and associated facilities in the Marshlands area of Pennsylvania.
In February 2019, we also sold 695 non-producing non-core net acres in the Permian Basin.
In December 2019, we sold our non-Shell-operated interest in the Haynesville shale gas formation in Northern Louisiana.
California
We have a 51.8% interest in Aera Energy LLC which operates around 15,000 wells in the San Joaquin Valley in California, mostly producing heavy oil and associated gas.
Alaska
Shell retains two exploration acreage positions in the long-established North Slope area of Alaska. One is a non-operating interest of 50% in 13 federal leases, operated by ENI. An exploratory drilling operation for this joint venture is under way after being permitted by ENI. We continue to evaluate our 18 state leases at nearby Western Harrison Bay, which have geologic affinity with recent discoveries announced by other North Slope operators.
Rest of North America
We also have interests in Mexico.
SOUTH AMERICA
Argentina
Shales
We have more than 162 thousand net mineral acres in the Vaca Muerta basin, a liquids and gas-rich play located in the Neuquén Province. The operated acreage includes blocks in Cruz de Lorena and Sierras Blancas (Shell interest 90%), Coiron Amargo Sur Oeste (Shell interest 80%), and Bajada de Añelo (Shell interest 50%). We have a 45% non-Shell-operated interest in the Rincon La Ceniza and La Escalonada blocks. In 2019, we drilled and brought 15 wells onstream. We have interests in 47 producing wells. We
have a 90% interest in our operated Sierras Blancas/Cruz de Lorena central processing facility.
In December 2019, we agreed a 50:50 partnering with Equinor to jointly acquire Schlumberger’s 49% interest in the Bandurria Sur block located in the Vaca Muerta basin (Shell interest 24.5%).
Offshore
In April 2019, we won two frontier exploration blocks in the deep-water bid round offshore of Argentina. For both blocks, Shell is to be operator holding 60% of the participating interest, with Qatar Petroleum holding the remaining 40%.
Brazil
Our share of production in Brazil was in total 383 thousand boe/d in 2019.
We operate the Bijupirá and Salema (Shell interest 80%) and BC-10 fields (Shell interest 50%) in the Campos Basin, offshore Brazil. Our operated portfolio also includes the Gato do Mato field in the Santos Basin and the adjacent Sul de Gato do Mato area (Shell interest 80%), for which development options are being evaluated. Our operated portfolio also includes 10 offshore exploration concessions in the Barreirinhas Basin (Shell interests ranging from 50% to 100%), pre-salt PSCs for Alto Cabo Frio Oeste (Shell interest 55% as operator) and Saturno (Shell interest 45% as operator) in the Santos Basin, C-M-791 exploration block (Shell Interest 40%) in the Campos Basis, and one block in the Potiguar Basin (Shell interest 100%). We have entered into an agreement with Ecopetrol for the sale of 30% interest in the Gato do Mato field and Sul de Gato do Mato area, which is still subject to regulatory approvals.
In October 2019, during the sixteenth deep-water bid round organised by the Brazilian National Petroleum Agency (ANP), we were granted exploration and production rights as operator with respect to two exploration blocks, C-M-659 and C-M-713, in the Campos Basin (Shell Interest 40%). This is awaiting ratification.
In our non-operated portfolio, we have interests in several fields in the offshore Santos Basin, consisting of 30% interests in BM-S-9, Entorno de Sapinhoá and BM-S-9A blocks Sapinhoá and Lapa fields. In the Santos Basin we also have BMS-11A concession with 25% interest in the Berbigão and Sururu fields, which are accumulations subject to ongoing unitisation agreements and 4% in the Atapu unit, which has already been subject to unitisation in effect from September 2019. The non-operated portfolio in the Santos Basis also includes the BMS-11 concession with the Lula field, which is partly subject to unitisation that has been in effect since April 2019 (Shell interest 23% in the unit). The Iracema area of the Lula field (Shell interest of 25%) is not subject to unitisation. Additionally, we also hold a 20% interest in BM-S-50 offshore exploration block, where the Sagitário prospect was discovered and we hold a 20% interest in the Libra block where the commerciality of the Mero field was declared. FPSO Pioneiro de Libra has been performing extended well tests and operating early production systems since 2017, and exploration is ongoing in the Central and South East areas. The Mero field is also subject to unitisation with adjoining area, for which a unitisation agreement is still subject to government approval. We announced the final investment decision to contract the Mero 2 floating production, storage and offloading (FPSO) vessel to be deployed at the Mero field offshore Santos Basin in Brazil. The FPSO has the capacity to process up to 180 thousand boe/d (Shell interest 20%). We also hold one deep-water exploration block in the Potiguar Basin (Shell interest 40%) and a PSC to explore the Tres Marias block in the Santos Basin (Shell interest 40%).
The activities of operated and non-operated fields are currently supported by 16 producing deep-water FPSOs, of which the fifteenth (P-67) delivered first oil in February 2019 and the sixteenth (P-68) in November 2019. Two additional FPSOs are expected to be brought online over the period 2020-2021 (Atapu I (P-70) and Mero1).
Rest of South America
We also have interests in Colombia and Uruguay.
TRADING AND SUPPLY
We market and trade crude oil from most of our Upstream operations.
STRATEGIC REPORT SHELL FORM 20-F 2019 | 33 | |
Oil and gas information | |
Proved developed and undeveloped reserves of Shell subsidiaries and Shell share of joint ventures and associates | ||||||||||
Crude oil and natural gas liquids (million barrels) | Natural gas (thousand million scf) | Synthetic crude oil (million barrels) | Bitumen (million barrels) | Total (million boe) [A] | ||||||
Shell subsidiaries | ||||||||||
Increase/(decrease) in 2019: | ||||||||||
Revisions and reclassifications | 444 | 2,180 | (34 | ) | — | 785 | ||||
Improved recovery | 4 | 3 | — | — | 5 | |||||
Extensions and discoveries | 158 | 684 | — | — | 276 | |||||
Purchases and sales of minerals in place | (91 | ) | (367 | ) | — | — | (154 | ) | ||
Total before taking production into account | 515 | 2,500 | (34 | ) | — | 912 | ||||
Production [B] | (627 | ) | (3,355 | ) | (20 | ) | — | (1,226 | ) | |
Total | (112 | ) | (855 | ) | (54 | ) | — | (314 | ) | |
At January 1, 2019 | 4,486 | 29,847 | 661 | — | 10,294 | |||||
At December 31, 2019 | 4,374 | 28,992 | 607 | — | 9,980 | |||||
Shell share of joint ventures and associates | ||||||||||
Increase/(decrease) in 2019: | ||||||||||
Revisions and reclassifications | 25 | (224 | ) | — | — | (13 | ) | |||
Improved recovery | 4 | 1 | — | — | 4 | |||||
Extensions and discoveries | 2 | 5 | — | — | 3 | |||||
Purchases and sales of minerals in place | — | — | — | — | — | |||||
Total before taking production into account | 31 | (218 | ) | — | — | (6 | ) | |||
Production [C] | (38 | ) | (721 | ) | — | — | (163 | ) | ||
Total | (7 | ) | (939 | ) | — | — | (169 | ) | ||
At January 1, 2019 | 290 | 5,768 | — | — | 1,285 | |||||
At December 31, 2019 | 283 | 4,829 | — | — | 1,116 | |||||
Total | ||||||||||
Increase/(decrease) before taking production into account | 546 | 2,282 | (34 | ) | — | 906 | ||||
Production | (665 | ) | (4,076 | ) | (20 | ) | — | (1,388 | ) | |
Increase/(decrease) | (119 | ) | (1,794 | ) | (54 | ) | — | (482 | ) | |
At January 1, 2019 | 4,776 | 35,615 | 661 | — | 11,578 | |||||
At December 31, 2019 | 4,657 | 33,821 | 607 | — | 11,096 | |||||
Reserves attributable to non-controlling interest in Shell subsidiaries at December 31, 2019 | — | — | 304 | — | 304 | |||||
[A] Natural gas volumes are converted into oil equivalent using a factor of 5,800 standard cubic feet (scf) per barrel.
[B] Included 43 million barrels of oil equivalent (boe) consumed in operations (natural gas: 247 thousand million scf; synthetic crude oil: 1 million barrels).
[C] Included 7 million boe consumed in operations (natural gas: 42 thousand million scf).
PROVED RESERVES
The proved oil and gas reserves of Shell subsidiaries and the Shell share of the proved oil and gas reserves of joint ventures and associates are set out in more detail in “Supplementary Information - Oil and Gas (unaudited)” on pages 189-206.
Before taking production into account, our proved reserves increased by 906 million boe in 2019. This comprised of increases of 912 million boe from Shell subsidiaries and of decreases of 6 million boe from the Shell share of joint ventures and associates
After taking production into account, our proved reserves decreased by 482 million boe in 2019 to 11,096 million boe at December 31, 2019
SHELL SUBSIDIARIES
Before taking production into account, Shell subsidiaries’ proved reserves increased by 912 million boe in 2019. This comprised of increases of 515 million barrels of crude oil and natural gas liquids, 431 million boe (2,500 thousand million scf) of natural gas and decrease of 34 million barrels of synthetic crude oil. The 912 million boe increase is the net effect of a net
increase of 785 million boe from revisions and reclassifications, an increase of 5 million boe from improved recovery, an increase of 276 million boe from extensions and discoveries, and a net decrease of 154 million boe related to purchases and sales of minerals in place.
After taking into account production of 1,226 million boe (of which 43 million boe were consumed in operations), Shell subsidiaries’ proved reserves decreased by 314 million boe in 2019 to 9,980 million boe. In 2019, Shell subsidiaries’ proved developed reserves (PD) decreased by 204 million boe to 7,849 million boe, and proved undeveloped reserves (PUD) decreased by 110 million boe to 2,131 million boe.
SHELL SHARE OF JOINT VENTURES AND ASSOCIATES
Before taking production into account, the Shell share of joint ventures and associates’ proved reserves decreased by 6 million boe in 2019. This comprised an increase of 31 million barrels of crude oil and natural gas liquids and a decrease of 37 million boe (218 thousand million scf) of natural gas. The 6 million boe decrease comprises a net decrease of 13 million boe from revisions and reclassifications and an increase of 3
STRATEGIC REPORT SHELL FORM 20-F 2019 | 34 | |
million boe from extensions and discoveries and an increase of 4 million boe from improved recovery.
After taking into account production of 163 million boe (of which 7 million boe were consumed in operations), the Shell share of joint ventures and associates’ proved reserves decreased by 169 million boe to 1,116 million boe at December 31, 2019.
The Shell share of joint ventures and associates’ PD decreased by 178 million boe to 960 million boe, and PUD increased by 9 million boe to 156 million boe.
For further information, see "Supplementary Information - oil and gas (unaudited)" on pages 189-206.
PROVED UNDEVELOPED RESERVES
In 2019, Shell subsidiaries and the Shell share of joint ventures and associates’ PUD decreased by 98 million boe to 2,287 million boe. There were decreases of 462 million boe due to maturation to PD, mainly 90 million boe in Lula (Brazil), 65 million boe in Appomattox (USA), and 307 million boe spread across other fields. These were offset by increases of 119 million boe due to revisions and net increases of 279 million boe due to extensions and discoveries - mainly in the Permian Basin (69 million boe), Mero (60 million boe) and Groundbirch (52 million boe) - and decreases of 43 million boe due to sales of minerals in place and increases of 9 million boe due to improved recovery spread across other fields.
In addition to the maturation of 462 million boe from PUD to PD, 178 million boe was matured to PD from contingent resources through PUD as a result of project execution during the year.
PUD held for five years or more (PUD5+) at December 31, 2019, amounted to 258 million boe, a decrease of 14 million boe compared with the end of 2018. These PUD5+ remain undeveloped because development either requires the installation of compression equipment and the drilling of additional wells, which will be executed when required to support existing gas delivery commitments (Russia), or will take longer than five years because of the complexity and scale of the project (Australia and the UK).
The decrease in PUD5+ during 2019 was driven mainly by changes in Clair (UK), Champion (Brunei), and Forcados-Yokri (Nigeria).
The fields with the largest PUD5+ at December 31, 2019, were Jansz-Io and Gorgon (Australia), Lunskoye (Russia) and Clair (UK).
During 2019, we spent $6.9 billion on development activities related to PUD maturation.
DELIVERY COMMITMENTS
We sell crude oil and natural gas from our producing operations under a variety of contractual obligations. Most contracts generally commit us to sell quantities based on production from specified properties, although some natural gas sales contracts specify delivery of fixed and determinable quantities, as discussed below.
In the past three years, we met our contractual delivery commitments, with the notable exceptions of Egypt, Trinidad and Tobago, and Malaysia. In the period 2020-2022, we are contractually committed to deliver to third parties, joint ventures and associates a total of 7,735 billion scf of natural gas from our subsidiaries, joint ventures and associates. The sales contracts contain a mixture of fixed and variable pricing formulae that are generally referenced to the prevailing market price for crude oil, natural gas or other petroleum products at the time of delivery.
In the period 2020-2022, we expect to meet our delivery commitments for almost all the areas in which they are carried, with an estimated 75.6% coming from PD, 5.4% through the delivery of gas that comes available to us from paying royalties in cash, and 19% from the development of PUD as well as other new projects and purchases.
The key exceptions are:
▪ | BG Egypt Development NOV: The government decision to divert gas from the offshore West Delta Deep Marine fields to domestic use has caused a tangible shortfall of 806 billion scf (87% of the promised gas delivery), expected to continue in the near future leaving LNG gas commitment mostly under force majeure; |
▪ | Trinidad and Tobago (East Coast Marine Area and North Coast Marine Area), where PD for all fields fail the economic test at the yearly average price for natural gas. However, we expect to cover 83% of our delivery commitments from existing developed resource volumes and new projects, resulting in an expected true shortfall of some 119 billion scf; and |
▪ | In Malaysia, one of the third-party gas supply lines is under repair during 2020. Force majeure has been declared, and no penalties have been incurred. |
STRATEGIC REPORT SHELL FORM 20-F 2019 | 35 | |
Summary of proved oil and gas reserves of Shell subsidiaries and Shell share of joint ventures and associates (at December 31, 2019) | ||||||||
Based on average prices for 2019 | ||||||||
Crude oil and natural gas liquids (million barrels) | Natural gas (thousand million scf) | Synthetic crude oil (million barrels) | Total (million boe) [A] | |||||
Proved developed | ||||||||
Europe | 167 | 2,615 | — | 618 | ||||
Asia | 1,643 | 13,610 | — | 3,989 | ||||
Oceania | 106 | 5,805 | — | 1,107 | ||||
Africa | 314 | 1,523 | — | 577 | ||||
North America | ||||||||
USA | 641 | 1,615 | — | 920 | ||||
Canada | 15 | 781 | 607 | 757 | ||||
South America | 675 | 968 | — | 841 | ||||
Total proved developed | 3,561 | 26,917 | 607 | 8,809 | ||||
Proved undeveloped | ||||||||
Europe | 119 | 976 | — | 287 | ||||
Asia | 180 | 1,208 | — | 388 | ||||
Oceania | 15 | 2,591 | — | 462 | ||||
Africa | 80 | 1,085 | — | 267 | ||||
North America | ||||||||
USA | 341 | 254 | — | 385 | ||||
Canada | 3 | 499 | — | 89 | ||||
South America | 358 | 291 | — | 409 | ||||
Total proved undeveloped | 1,096 | 6,904 | — | 2,287 | ||||
Total proved developed and undeveloped | ||||||||
Europe | 286 | 3,591 | — | 905 | ||||
Asia | 1,823 | 14,818 | — | 4,377 | ||||
Oceania | 121 | 8,396 | — | 1,569 | ||||
Africa | 394 | 2,608 | — | 844 | ||||
North America | ||||||||
USA | 982 | 1,869 | — | 1,305 | ||||
Canada | 18 | 1,280 | 607 | 846 | ||||
South America | 1,033 | 1,259 | — | 1,250 | ||||
Total | 4,657 | 33,821 | 607 | 11,096 | ||||
Reserves attributable to non-controlling interest in Shell subsidiaries | — | — | 304 | 304 | ||||
[A] Natural gas volumes are converted into oil equivalent using a factor of 5,800 scf per barrel.
EXPLORATION
In 2019, we made notable discoveries in the US Gulf of Mexico and Australia. In April 2019, we announced a significant discovery at the Blacktip prospect in the Perdido Corridor within the deep-water US Gulf of Mexico (Shell interest 52.4% as operator). This and other drilling successes in the US Gulf of Mexico highlight the potential of this area. Further exploration is planned in 2020.
We also announced a significant gas discovery at the Bratwurst prospect in the Browse Basin.
We continue to strengthen our portfolio in the US Gulf of Mexico, Brunei, Oman, Brazil and Egypt, while opening up new positions in Argentina, Colombia, São Tomé and Príncipe and South Africa.
In 2018, Shell entered into a partnership with Oman Oil Company Exploration production (Shell interest 50%) to explore for oil and gas in Block 42, a vast under-explored area of 31,068 square kilometres in the Al Sharqiyah Governate, Sultanate of Oman. This was ratified by Royal Decree on January 23, 2019.
In March 2019, the dilution and transfer of operatorship was completed for two exploration blocks in deep-water Colombia, following these
blocks' conversion from Technical Evaluation Agreements to Exploration & Production contracts. For both blocks, Noble Energy becomes the operator with 40% working interest, with the remaining 60% held by Shell. The gross area of the COL-3 block is around 4,000 square kilometres, and the gross area of the GUA OFF-3 block is around 4,800 square kilometres.
In US Gulf of Mexico Lease Sale 252 in March 2019 we acquired 77 blocks across multiple plays in the US Gulf of Mexico. This acquisition included significant acquisitions close to the 2019 Blacktip discovery (Shell interest 52.4%), in the underexplored areas of Garden Banks and in Desoto Canyon south east of the Appomattox production facility.
In April 2019, we won two exploration blocks in the deep-water bid round in Argentina. These frontier exploration blocks are at the edge of the continental shelf and have approximate areas of 7,875 square kilometres and 8,340 square kilometres. For both blocks, we are the operator, holding 60% of the participating interest, with Qatar Petroleum holding the remaining 40%.
In South Africa in April 2019, we entered the frontier deep-water Cape Basin (Shell interest 40%) and a second block next to our existing acreage in the Namibian Orange Basin (Shell interest 45%).
STRATEGIC REPORT SHELL FORM 20-F 2019 | 36 | |
In October 2019, during the sixteenth deep-water bid round organised by the Brazilian National Petroleum Agency (ANP), we were granted exploration and production rights with respect to two exploration blocks, C-M-659 and C-M-713, as operator in the Campos Basin (Shell Interest 40%). This is awaiting ratification.
Also in October, we signed an Exploration & Production Sharing Agreement for Block 55 in the southeast of the Sultanate. Oman Shell now has a 100% working interest and operatorship of Block 55 with a total area of 7,564 square kilometres. The agreement includes a work programme of regional studies, seismic acquisition and other potential exploration activities. This agreement is awaiting ratification via Royal Decree.
In November 2019, we completed a farm-in transaction with Kosmos Energy, acquiring participating interests in Block 6 (Shell interest 20%) and Block 11 (Shell interest 30%) exploration licences (together approximately 14,000 square kilometres) offshore of São Tomé and Príncipe, representing a new country entry for Shell. Partners in the blocks are Kosmos Energy (Operator of Block 11), Galp Energia (Operator of Block 6) and ANP-STP, the national oil company.
In December 2019, we were awarded two concessions in the Red Sea bid round. The two blocks cover more than 6,000 square kilometres in an underexplored region of Egypt, south of the Gulf of Suez hydrocarbon province. Block 4 (Shell interest 70%) is in partnership with Mubadala Petroleum and Block 3 as the sole operator, with initial exploration plans being 3D seismic and petroleum system studies. This is awaiting ratification.
In total, the net undeveloped acreage in our exploration portfolio increased by around 9 million acres in 2019. The largest contributions were licence entries in South Africa, Oman, Argentina, Egypt and Colombia, offset by relinquishments and divestments in Australia, Myanmar and Gabon.
For further information, see "Supplementary Information - oil and gas (unaudited)" on pages 189-206.
STRATEGIC REPORT SHELL FORM 20-F 2019 | 37 | |
LOCATION OF OIL AND GAS EXPLORATION AND PRODUCTION ACTIVITIES | |||
Location of oil and gas exploration and production activities [A] (at December 31, 2019) | |||
Exploration | Development and/or production | Shell operator[B] | |
Europe | |||
Albania | ● | ● | |
Bulgaria | ● | ● | |
Cyprus | ● | ||
Germany | ● | ● | |
Italy | ● | ● | ● |
Netherlands | ● | ● | ● |
Norway | ● | ● | ● |
UK | ● | ● | ● |
Asia | |||
Brunei | ● | ● | ● |
China | ● | ● | |
Indonesia | ● | ||
Kazakhstan | ● | ● | |
Malaysia | ● | ● | ● |
Myanmar | ● | ||
Oman | ● | ● | ● |
Philippines | ● | ● | ● |
Qatar | ● | ● | |
Russia | ● | ● | |
Turkey | ● | ● | |
Oceania | |||
Australia | ● | ● | ● |
Africa | |||
Egypt | ● | ● | ● |
Mauritania | ● | ● | |
Morocco | ● | ||
Namibia | ● | ● | |
Nigeria | ● | ● | ● |
São Tomé and Príncipe | ● | ||
South Africa | ● | ● | |
Tanzania | ● | ● | |
Tunisia | ● | ● | |
North America | |||
Canada | ● | ● | ● |
Mexico | ● | ● | |
USA | ● | ● | ● |
South America | |||
Argentina | ● | ● | ● |
Bolivia | ● | ● | ● |
Brazil | ● | ● | ● |
Colombia | ● | ● | |
Trinidad and Tobago | ● | ● | ● |
Uruguay | ● | ||
[A] Includes joint ventures and associates. Where a joint venture or an associate has properties outside its base country, those properties are not shown in this table.
[B] In several countries where “Shell operator” is indicated, Shell is the operator of some but not all exploration and/or production ventures.
STRATEGIC REPORT SHELL FORM 20-F 2019 | 38 | |
OIL AND GAS PRODUCTION AVAILABLE FOR SALE | ||||||||||||||
Crude oil and natural gas liquids [A] | Thousand barrels | |||||||||||||
2019 | 2018 | 2017 | ||||||||||||
Shell subsidiaries | Shell share of joint ventures and associates | Shell subsidiaries | Shell share of joint ventures and associates | Shell subsidiaries | Shell share of joint ventures and associates | |||||||||
Europe | ||||||||||||||
Denmark | 7,490 | — | 13,036 | — | 15,467 | — | ||||||||
Italy | 9,747 | — | 10,921 | — | 8,733 | — | ||||||||
Norway | 7,025 | — | 13,528 | — | 19,529 | — | ||||||||
UK | 30,677 | — | 31,431 | — | 45,020 | — | ||||||||
Other [B] | 723 | 1,135 | 795 | 1,417 | 860 | 1,272 | ||||||||
Total Europe | 55,662 | 1,135 | 69,711 | 1,417 | 89,609 | 1,272 | ||||||||
Asia | ||||||||||||||
Brunei | 196 | 20,002 | 283 | 18,738 | 1,138 | 15,831 | ||||||||
Kazakhstan | 34,269 | — | 32,432 | — | 29,491 | — | ||||||||
Malaysia | 21,993 | — | 24,650 | — | 26,574 | — | ||||||||
Oman | 76,493 | — | 76,847 | — | 77,687 | — | ||||||||
Russia | 22,442 | 9,413 | 22,003 | 10,403 | 22,049 | 10,899 | ||||||||
Other [B] | 28,796 | 7,709 | 28,769 | 7,768 | 30,180 | 7,859 | ||||||||
Total Asia | 184,189 | 37,124 | 184,984 | 36,909 | 187,119 | 34,589 | ||||||||
Total Oceania [B] | 10,058 | — | 8,883 | — | 9,098 | — | ||||||||
Africa | ||||||||||||||
Gabon | — | — | — | — | 9,750 | — | ||||||||
Nigeria | 56,589 | — | 53,102 | — | 56,337 | — | ||||||||
Other [B] | 7,802 | — | 8,265 | — | 9,003 | — | ||||||||
Total Africa | 64,391 | — | 61,367 | — | 75,090 | — | ||||||||
North America | ||||||||||||||
USA | 171,204 | — | 140,035 | — | 109,430 | — | ||||||||
Canada | 11,506 | — | 13,111 | — | 10,775 | — | ||||||||
Total North America | 182,710 | — | 153,146 | — | 120,205 | — | ||||||||
South America | ||||||||||||||
Brazil | 126,366 | — | 118,681 | — | 111,093 | — | ||||||||
Other [B] | 3,900 | — | 3,414 | — | 3,325 | — | ||||||||
Total South America | 130,266 | — | 122,095 | — | 114,418 | — | ||||||||
Total | 627,276 | 38,259 | 600,186 | 38,326 | 595,539 | 35,861 | ||||||||
[A] Reflects 100% of production of subsidiaries except in respect of production-sharing contracts (PSCs), where the figures shown represent the entitlement of the subsidiaries concerned under those contracts.
[B] Comprises countries where 2019 production was lower than 10,100 thousand barrels or where specific disclosures are prohibited.
Synthetic crude oil | Thousand barrels | ||||||||||
2019 | 2018 | 2017 | |||||||||
Shell subsidiaries | Shell subsidiaries | Shell subsidiaries | |||||||||
North America - Canada | 19,076 | 19,514 | 33,183 | ||||||||
Bitumen | Thousand barrels | ||||||||||
2019 | 2018 | 2017 | |||||||||
Shell subsidiaries | Shell subsidiaries | Shell subsidiaries | |||||||||
North America - Canada | — | — | 1,681 | ||||||||
STRATEGIC REPORT SHELL FORM 20-F 2019 | 39 | |
Natural gas [A] | Million standard cubic feet | |||||||||||||
2019 | 2018 | 2017 | ||||||||||||
Shell subsidiaries | Shell share of joint ventures and associates | Shell subsidiaries | Shell share of joint ventures and associates | Shell subsidiaries | Shell share of joint ventures and associates | |||||||||
Europe | ||||||||||||||
Denmark | 24,433 | — | 45,027 | — | 52,105 | — | ||||||||
Germany | 41,846 | — | 40,368 | — | 48,002 | — | ||||||||
Ireland | — | — | 44,833 | — | 52,515 | — | ||||||||
Netherlands | — | 244,286 | — | 271,303 | — | 343,126 | ||||||||
Norway | 182,683 | — | 239,253 | — | 243,352 | — | ||||||||
UK | 62,174 | — | 82,695 | — | 174,478 | — | ||||||||
Other [B] | 15,062 | — | 16,422 | — | 13,125 | — | ||||||||
Total Europe | 326,198 | 244,286 | 468,598 | 271,303 | 583,577 | 343,126 | ||||||||
Asia | ||||||||||||||
Brunei | 22,185 | 160,648 | 21,205 | 157,476 | 29,880 | 158,877 | ||||||||
China | 44,510 | — | 42,419 | — | 43,899 | — | ||||||||
Kazakhstan | 84,499 | — | 78,575 | — | 80,623 | — | ||||||||
Malaysia | 226,277 | — | 237,102 | — | 221,590 | — | ||||||||
Philippines | 44,374 | — | 44,017 | — | 42,958 | — | ||||||||
Russia | 4,563 | 134,807 | 4,044 | 136,652 | 4,052 | 137,890 | ||||||||
Thailand | — | — | 25,973 | — | 60,742 | — | ||||||||
Other [B] | 407,899 | 118,253 | 378,785 | 117,976 | 288,728 | 118,352 | ||||||||
Total Asia | 834,307 | 413,708 | 832,120 | 412,104 | 772,472 | 415,119 | ||||||||
Oceania | ||||||||||||||
Australia | 686,956 | 20,840 | 648,735 | 18,923 | 591,860 | 18,708 | ||||||||
New Zealand | — | — | 40,153 | — | 51,943 | — | ||||||||
Total Oceania | 686,956 | 20,840 | 688,888 | 18,923 | 643,803 | 18,708 | ||||||||
Africa | ||||||||||||||
Egypt | 92,169 | — | 148,721 | — | 122,439 | — | ||||||||
Nigeria | 234,332 | — | 232,899 | — | 236,370 | — | ||||||||
Other [B] | 30,266 | — | 30,669 | — | 36,187 | — | ||||||||
Total Africa | 356,767 | — | 412,289 | — | 394,996 | — | ||||||||
North America | ||||||||||||||
USA | 389,130 | — | 355,075 | — | 286,529 | — | ||||||||
Canada | 220,005 | — | 247,890 | — | 224,529 | — | ||||||||
Total North America | 609,135 | — | 602,965 | — | 511,058 | — | ||||||||
South America | ||||||||||||||
Bolivia | 48,501 | — | 55,480 | — | 59,673 | — | ||||||||
Brazil | 78,526 | — | 68,865 | — | 70,100 | — | ||||||||
Trinidad and Tobago | 159,698 | — | 104,454 | — | 73,000 | — | ||||||||
Other [B] | 8,662 | — | 8,062 | — | 8,370 | — | ||||||||
Total South America | 295,387 | — | 236,861 | — | 211,143 | — | ||||||||
Total | 3,108,750 | 678,834 | 3,241,721 | 702,330 | 3,117,049 | 776,953 | ||||||||
[A] Reflects 100% of production of subsidiaries except in respect of PSCs, where the figures shown represent the entitlement of the subsidiaries concerned under those contracts.
[B] Comprises countries where 2019 production was lower than 41,795 million scf or where specific disclosures are prohibited.
STRATEGIC REPORT SHELL FORM 20-F 2019 | 40 | |
AVERAGE REALISED PRICE BY GEOGRAPHICAL AREA | ||||||||||||||
Crude oil and natural gas liquids | $/barrel | |||||||||||||
2019 | 2018 | 2017 | ||||||||||||
Shell subsidiaries | Shell share of joint ventures and associates | Shell subsidiaries | Shell share of joint ventures and associates | Shell subsidiaries | Shell share of joint ventures and associates | |||||||||
Europe | 65.11 | 58.08 | 68.23 | 64.24 | 50.52 | 46.88 | ||||||||
Asia | 58.16 | 65.25 | 64.06 | 70.66 | 49.08 | 53.44 | ||||||||
Oceania | 51.51 | — | 61.63 | — | 45.64 | — | ||||||||
Africa | 65.39 | — | 71.02 | — | 53.39 | — | ||||||||
North America - USA | 54.56 | — | 61.87 | — | 47.23 | — | ||||||||
North America - Canada | 36.61 | — | 43.72 | — | 36.00 | — | ||||||||
South America | 56.68 | — | 62.67 | — | 48.10 | — | ||||||||
Total | 57.56 | 65.05 | 63.96 | 70.43 | 49.00 | 53.23 | ||||||||
Synthetic crude oil | $/barrel | ||||||||||
2019 | 2018 | 2017 | |||||||||
Shell subsidiaries | Shell subsidiaries | Shell subsidiaries | |||||||||
North America - Canada | 50.27 | 48.90 | 45.90 | ||||||||
Bitumen | $/barrel | ||||||||||
2019 | 2018 | 2017 | |||||||||
Shell subsidiaries | Shell subsidiaries | Shell subsidiaries | |||||||||
North America - Canada | — | — | 34.46 | ||||||||
Natural gas | $/thousand scf | |||||||||||||||
2019 | 2018 | 2017 | ||||||||||||||
Shell subsidiaries | Shell share of joint ventures and associates | Shell subsidiaries | Shell share of joint ventures and associates | Shell subsidiaries | Shell share of joint ventures and associates | |||||||||||
Europe | 5.59 | 4.95 | 7.08 | [A] | 4.06 | 5.48 | 4.77 | |||||||||
Asia | 2.66 | 6.34 | 2.99 | 7.06 | 2.84 | 5.45 | ||||||||||
Oceania | 8.22 | 3.91 | 8.66 | [A] | 4.15 | 6.21 | 3.11 | |||||||||
Africa | 2.92 | — | 3.02 | — | 2.44 | — | ||||||||||
North America - USA | 2.27 | — | 3.12 | — | 3.00 | — | ||||||||||
North America - Canada | 1.37 | — | 1.35 | — | 1.85 | — | ||||||||||
South America | 2.33 | — | 3.50 | — | 2.93 | [A] | — | |||||||||
Total | 3.95 | 5.80 | 4.63 | [A] | 5.74 | 3.90 | [A] | 5.11 | ||||||||
[A] As revised, following a reassessment.
AVERAGE PRODUCTION COST BY GEOGRAPHICAL AREA | ||||||||||||||
Crude oil, natural gas liquids and natural gas [A] | $/boe | |||||||||||||
2019 | 2018 | 2017 | ||||||||||||
Shell subsidiaries | Shell share of joint ventures and associates | Shell subsidiaries | Shell share of joint ventures and associates | Shell subsidiaries | Shell share of joint ventures and associates | |||||||||
Europe | 14.14 | 5.76 | 15.03 | 6.37 | 13.19 | 5.58 | ||||||||
Asia | 6.30 | 6.17 | 6.52 | 6.24 | 7.71 | 6.87 | ||||||||
Oceania | 9.17 | 24.49 | 8.41 | 32.18 | 9.24 | 28.83 | ||||||||
Africa | 8.44 | — | 8.25 | — | 9.53 | — | ||||||||
North America - USA | 11.78 | — | 12.78 | — | 16.11 | — | ||||||||
North America - Canada | 11.88 | — | 11.58 | — | 14.53 | — | ||||||||
South America | 6.26 | — | 8.60 | — | 8.08 | — | ||||||||
Total | 8.95 | 6.48 | 9.66 | 6.81 | 10.55 | 6.82 | ||||||||
[A] Natural gas volumes are converted into oil equivalent using a factor of 5,800 scf per barrel.
STRATEGIC REPORT SHELL FORM 20-F 2019 | 41 | |
Synthetic crude oil | $/barrel | ||||||||||
2019 | 2018 | 2017 | |||||||||
Shell subsidiaries | Shell subsidiaries | Shell subsidiaries | |||||||||
North America - Canada | 19.29 | 20.15 | 23.77 | ||||||||
Bitumen | $/barrel | ||||||||||
2019 | 2018 | 2017 | |||||||||
Shell subsidiaries | Shell subsidiaries | Shell subsidiaries | |||||||||
North America - Canada | — | — | 16.19 | ||||||||
STRATEGIC REPORT SHELL FORM 20-F 2019 | 42 | |
Downstream | |
Key statistics | $ million, except where indicated | |||||
2019 | 2018 | 2017 | ||||
Segment earnings [A] | 6,277 | 7,601 | 8,258 | |||
Including: | ||||||
Revenue (including inter-segment sales) | 294,677 | 335,597 | 265,821 | |||
Share of profit of joint ventures and associates [A] | 1,725 | 1,785 | 1,956 | |||
Interest and other income | 266 | 345 | 154 | |||
Operating expenses [B] | 18,697 | 20,743 | 19,583 | |||
Depreciation, depletion and amortisation | 5,413 | 4,064 | 3,877 | |||
Taxation charge [A] | 1,241 | 1,515 | 1,783 | |||
Capital expenditure | 8,650 | 7,083 | 5,826 | |||
Cash capital expenditure [B] | 8,926 | 7,408 | 6,090 | |||
Capital investment [B] | 10,542 | 7,565 | 6,418 | |||
Refinery availability (%) [C] | 91 | 91 | 91 | |||
Chemical plant availability (%) [C] | 89 | 93 | 92 | |||
Refinery processing intake (thousand b/d) | 2,564 | 2,648 | 2,572 | |||
Oil products sales volumes (thousand b/d) | 6,561 | 6,783 | 6,599 | |||
Chemicals sales volumes (thousand tonnes) | 15,223 | 17,644 | 18,239 | |||
[A] See Note 4 to the “Consolidated Financial Statements” on pages 158-161. Segment earnings are presented on a current cost of supplies basis.
[B] See “Non-GAAP measures reconciliations” on pages 219-220
[C] The basis of calculation differs from that used for the “Refinery and chemical plant availability” measure in “Performance indicators” on pages 20-21, which excludes downtime due to uncontrollable factors and, in 2017, excludes assets which were not part of Shell’s operational performance metrics because of portfolio activity (Fredericia and former Motiva sites).
OVERVIEW
Our Downstream business consists of Oil Products and Chemicals activities. They form part of an integrated value chain that trades and refines crude oil and other feedstocks into products that are moved and marketed around the world for domestic, industrial and transport use. The products we sell include gasoline, diesel, heating oil, aviation fuel, marine fuel, biofuel, lubricants, bitumen and sulphur. We also produce and sell petrochemicals for industrial use worldwide.
Our Oil Products activities comprise Refining and Trading, and Marketing. These are referred to as classes of business. Marketing includes Retail, Lubricants, Business-to-Business (B2B), Pipelines and Biofuels. Chemicals has major manufacturing plants, which are located close to refineries, and its own marketing network. In Trading and Supply, we trade crude oil, oil products and petrochemicals to optimise feedstocks for Refining and Chemicals, to supply our Marketing businesses and third parties, and for our own profit.
BUSINESS CONDITIONS
Global oil demand grew by 1.0 million barrels per day (b/d), or 1.0%, to 100.3 million b/d, according to the International Energy Agency’s (IEA) Oil Market Report published in January 2020. Oil demand growth in 2019 was 0.1 million b/d lower than in 2018.
Industry gross refining margins were lower on average in 2019 than in 2018 in three of the four key refining hubs in Europe, Singapore and the US Gulf Coast. In the US West Coast gross margins improved, partly due to product prices being supported by unplanned outages in the region. Globally, year-on-year growth in demand for oil products has slowed in line with slowing global economic growth. Refinery capacity additions, especially in the Middle East and Asia, combined with lower demand growth have led to generally lower refinery utilisations, which weakened margins. Refinery activity continued to be low in Latin America amid the ongoing geopolitical uncertainty and poor investment climate. On January 1, 2020, the new International Maritime Organization low-sulphur shipping fuel specification came into effect. The industry has started preparations but the full effect of the implementation is expected later in the year.
Cracker industry margins in Asia halved. Cracker margins in Western Europe and the USA were relatively unchanged versus 2018. West European
margins were supported by a high level of maintenance outages in the first half of 2019, while in the USA margins were supported by low ethane prices.
See “Market overview” on pages 16-17.
REFINERY AND CHEMICAL PLANT AVAILABILITY
Refinery availability was 91% in 2019, unchanged from 2018.
Chemicals plant availability was 89% in 2019, compared with 93% in 2018, due to higher planned downtime in Asia and Europe and the impact of strike action in the Netherlands.
OIL PRODUCTS AND CHEMICALS SALES
Oil products sales volumes decreased by 3% in 2019 compared with 2018, reflecting lower trading volumes primarily in Asia and Europe and, to a lesser extent, impact on marketing volumes due to the sale of the Downstream Argentina business to Raízen (volumes reported at 50% Shell share).
Chemicals sales volumes decreased by 14% in 2019 compared with 2018, mainly due to lower downstream demand and higher downtime at some sites.
EARNINGS 2019-2018
Segment earnings in 2019 of $6,277 million are presented on a current cost of supplies basis (see “Summary of results” on pages 18-19). Segment earnings on a first-in, first-out basis were $6,883 million, which were $606 million higher than on a current cost of supplies basis (2018 first-in, first-out segment earnings were $458 million lower than the current cost of supplies basis). See “Non-GAAP measures reconciliations” on pages 219-220.
Segment earnings in 2019 of $6,277 million were 17% lower than in 2018. Earnings in 2019 included a net charge of $403 million, compared with a net gain in 2018 of $34 million, which is described at the end of this section.
Excluding the impact of these items, earnings in 2019 were $6,680 million, compared with $7,567 million in 2018. Refining and Trading accounted for 19% of these 2019 earnings, Marketing for 70% and Chemicals for 11%.
The decrease in Downstream earnings, excluding the net charges, of $887 million (12%) compared with 2018 was driven by lower Refining and
STRATEGIC REPORT SHELL FORM 20-F 2019 | 43 | |
Trading margins (around $400 million) and lower Chemicals margins (around $1,500 million). This was partly offset by higher Marketing margins (around $500 million), benefit from foreign exchange (around $250 million), lower operating costs (around $130 million) and change in accounting policy IFRS 16 (around $150 million).
The decrease in earnings of $887 million analysed by class of business was as follows:
▪ | Refining and Trading earnings were $279 million lower than in 2018, principally due to lower realised Refining margins due to adverse price variance across all regions driven by lower global demand growth and increase in worldwide refining capacity; and higher maintenance costs. Partly offsetting this were higher earnings from oil products trading and optimisation, mainly fuel oil. |
▪ | Marketing earnings were $727 million higher than in 2018. This was due to stronger unit margins and lower operating expenses in Retail and Lubricants, better revenue from Retail ventures, and lower pension costs. Partly offsetting these were lower earnings from Raízen, the joint venture (Shell interest 50%) in Brazil, due to adverse foreign exchange and lower fuel margins. |
▪ | Chemicals earnings were $1,334 million lower than in 2018. Results were impacted by lower realised base chemicals and intermediate margins and higher maintenance activities in Asia and Europe, including the impact of strike action in the Netherlands, partly offset by lower operating expenses. |
Segment earnings in 2019 included a net charge of $403 million.
Offsetting items included:
• | impairment charges of $341 million (mainly expenditure at Bukom and other assets); |
• | costs related to restructuring of $88 million (various initiatives across Downstream); |
• | other net charges of $273 million (mainly legal provision in Chemicals); and |
• | net charge from fair value accounting of commodity derivatives of $68 million. |
The effects of offsetting items were partially countered by:
• | net gains from disposal of assets of $318 million; and |
• | gain from one-off tax items of $49 million (tax rate changes in Alberta, Canada). |
Segment earnings in 2018 included a net gain of $34 million.
Offsetting items included:
• | net gains from fair value accounting of commodity derivatives of $233 million; |
• | gains from disposal of assets of $225 million (mainly our Downstream assets in Argentina and other smaller disposals); |
• | gains from one-off tax items of $118 million (mainly corporation tax rate changes in the Netherlands and the USA). |
The effect of offsetting items was countered by:
• | impairment charge of $386 million (mainly expenditure at Bukom and on assets at Stanlow); |
• | costs related to restructuring of $109 million (various of initiatives across Downstream); and |
• | other net charges of $47 million, which included a one-off gain from the Ontario cap-and-trade scheme and onerous contracts related to decommissioning of the Stanlow site. |
EARNINGS 2018-2017
Segment earnings which were presented on a current cost of supplies basis were $458 million higher in 2018 than on a first-in, first-out basis (2017: $964 million lower).
Segment earnings in 2018 of $7,601 million were 8% lower than in 2017. Earnings in 2018 included a net gain of $34 million described above.
Earnings in 2017 included a net charge of $824 million, reflecting impairment charges of $315 million, redundancy and restructuring charges of $200 million, charges of $142 million related to US tax reform legislation and a tax rate change in France, and other net charges of $231 million (related to onerous contract provision and a legal provision). These were partly offset by divestment gains of $39 million and net gain of $25 million from fair value accounting of commodity derivatives.
Excluding the impact of these items, earnings in 2018 were $7,567 million, compared with $9,082 million in 2017. Refining and Trading accounted for 20% of these 2018 earnings, Marketing for 53% and Chemicals for 27%.
The decrease in Downstream earnings, excluding the net charges, of $1,515 million (17%) compared with 2017 was driven by higher operating costs (around $700 million), adverse foreign exchange effects (around $530 million), lower base Chemicals margins (around $370 million), lower refining margins (around $150 million) and other impacts resulting in a net charge of around $120 million. This was partly offset by higher marketing margins (around $360 million). Operating costs were higher due to higher maintenance costs (Chemicals and Refining assets) and higher costs for marketing growth opportunities. Chemicals margins were impacted by higher feedstock costs globally, higher utility costs and new cracker start-ups in the USA, and operational issues in Europe. Marketing margins benefited from favourable market conditions at the end of the year. The other net negative impacts were mainly portfolio effects.
CASH CAPITAL EXPENDITURE AND CAPITAL INVESTMENT
Cash capital expenditure (cash capex) was $8.9 billion in 2019, compared with $7.4 billion in 2018. Capital investment was $10.5 billion in 2019 compared to $7.6 billion in 2018.
Cash capex in Refining was in line with 2018 at $2.4 billion. In Chemicals, cash capex increased by $0.9 billion to $4.1 billion (increase mainly from investment in our new cracker facilities in Pennsylvania). In Marketing, cash capex increased by $0.4 billion to $2.2 billion (increase mainly from investment in a US Pipeline project).
Increase in capital investment on account of leases was $1.4 billion ($1.6 billion in 2019 compared with $0.2 billion in 2018) due to accounting policy change (IFRS 16) implemented in 2019.
PORTFOLIO AND BUSINESS DEVELOPMENTS
We continued to high-grade our portfolio in 2019, including:
▪ | In the Kingdom of Saudi Arabia, we completed the sale of our 50% interest in Shell Saudi Arabia (Refining) Limited (SASREF), a joint venture in Jubail Industrial City, to Saudi Arabian Oil Company (Saudi Aramco) for $631 million. |
▪ | In the USA, our subsidiary Equilon Enterprises LLC, doing business as Shell Oil Products US, announced in June 2019 that we have reached an agreement for the sale of Martinez Refinery in California to PBF Holding Company LLC for a $1.0 billion consideration. The sale was concluded in February 2020 in exchange for $1.2 billion which includes the refinery and inventory. |
▪ | Also in the USA, in March 2020, we announced our intention to sell the Puget Sound refinery in Washington and Mobile site in Alabama. |
BUSINESS AND PROPERTY
REFINING AND TRADING
Refining
We have interests in 15 refineries worldwide, (after the completion of sale of Martinez refinery in February 2020), with the capacity to process a total of 2.5 million barrels of crude oil per day (Shell share). Our refining capacity is 42% in Europe and Africa, 41% in the Americas and 17% in Asia and Oceania.
In 2019, we concluded the sale of our 50% share of the SASREF joint venture in Jubail Industrial City, the Kingdom of Saudi Arabia, to Saudi Aramco.
STRATEGIC REPORT SHELL FORM 20-F 2019 | 44 | |
Trading and Supply
Through our main trading offices in London, Houston, Singapore, Dubai and Rotterdam, we trade crude oil, natural gas, LNG, electricity, refined products, chemical feedstocks and environmental products. Trading and Supply trades in physical and financial contracts, lease storage and transportation capacities, and manages shipping and wholesale commercial fuel activities globally. This includes supplying feedstocks for our refineries and chemical plants and finished products such as gasoline, diesel and aviation fuel to our Marketing businesses and customers.
Operating in around 30 countries, with more than 125 Shell and joint-venture terminals, we believe our supply and distribution infrastructure is well positioned to make deliveries around the world.
Through its Shipping and Maritime business, Trading and Supply has an interest in around 2,000 Shell-associated vessels and other floating facilities on any given day, and manages one of the world’s largest fleets of LNG carriers. Shipping and Maritime enables the Shell Trading and Supply organisation to deliver safely on its contracts. This includes supplying feedstocks for our refineries and chemical plants, and finished products such as gasoline, diesel and aviation fuel to our Marketing businesses and customers.
Shell Wholesale Commercial Fuels provides fuels for transport, industry and heating. Our range of products, from reliable main-grade fuels to premium products, is designed to provide tangible vehicle and business benefits.
MARKETING
Retail
Shell is the world’s largest mobility retailer, by number of sites, with 45,000 service stations operating in close to 80 countries at the end of 2019. We operate different models across these markets, from full ownership of retail sites through to brand licensing agreements.
Every day, more than 30 million customers visit these sites to buy fuel, convenience items, including beverages and fresh food, and services, such as lubricant changes and car washes. We offer our business customers Shell Fleet Solutions, a ‘one-stop-shop’ for their mobility and energy transition needs, providing items including fuel cards, road services and carbon-neutral offers.
We have more than 100 years’ experience in fuel development. Aided by our innovative partnership with Scuderia Ferrari, we have concentrated on developing fuels with special formulations designed to clean engines and improve performance. We sold such fuels under the Shell V-Power brand in 62 countries as at the end of 2019.
In a growing number of markets, we are offering customers lower-emission solutions, including biofuels, electric vehicle fast-charging, hydrogen and various gaseous fuels such as LNG. During 2019, we introduced carbon-neutral driving in the Netherlands and the UK, through which we offset customers' emissions by purchasing carbon credits generated from projects that plant and protect nature like forests, wetlands and other natural ecosystems.
Lubricants
Across more than 150 markets, we produce, market and sell technically advanced lubricants for passenger cars, motorcycles, trucks, coaches, and machinery used in manufacturing, mining, power generation, agriculture and construction sectors.
We also manufacture premium lubricants from natural gas using GTL base oils produced at our Pearl GTL plant in Qatar (see “Integrated Gas” on pages 22-27).
We have a global lubricants supply chain with a network of four base oil manufacturing plants, 29 lubricant blending plants, nine grease plants and four GTL base oil storage hubs.
Through our marine activities, we primarily provide lubricants, but also fuels and related technical services, to the shipping and maritime sectors. We
supply around 210 grades of lubricants and six types of fuel to vessels worldwide, ranging from large ocean-going tankers to small fishing boats.
Business-to-Business
Our Business-to-Business (B2B) activities encompass the sale of fuels and specialty products and services to a broad range of commercial customers.
Shell Aviation provides fuel and lubricants across more than 60 countries and supplies fuel at about 900 airports.
Shell Bitumen supplies customers across 52 markets and provides enough bitumen to resurface 500 kilometres of road lanes every day. It also invests in technology research and development to create innovative products.
Shell Sulphur Solutions is a business that manages the complete value chain of sulphur, from refining to marketing. The business provides sulphur for use in applications such as fertiliser, mining and chemicals and also develops new technologies for sulphur that benefit sectors such as agriculture.
Pipelines
Shell Pipeline Company LP (Shell interest 100%) owns and operates 10 tank farms across the USA. It transports more than 2 billion barrels of crude oil and refined products a year through about 6,000 kilometres of pipelines in the Gulf of Mexico and five US states. Our various non-Shell-operated ownership interests provide about a further 14,000 pipeline kilometres.
We carry more than 40 types of crude oil and more than 20 grades of gasoline, as well as diesel, aviation fuel, chemicals and ethylene.
Shell Midstream Partners, L.P., a midstream master limited partnership, owns, operates, develops and acquires pipelines and other midstream assets in the USA. Its assets consist of interests in entities that own crude oil and refined products pipelines and terminals that serve as key infrastructure to transport onshore and offshore crude oil production to Gulf Coast and Midwest refining markets. It also delivers refined products from those markets to major demand centres. Its assets also include interests in entities that own natural gas and refinery gas pipelines that transport offshore natural gas to market hubs and deliver refinery gas from refineries and plants to chemical sites along the Gulf Coast. Shell controls the general partner.
See "Governance - Related Party Transactions" on page 126 for information on transactions between Shell and Shell Midstream Partners, L.P.
Biofuels
Raízen, our joint venture in Brazil (Shell interest 50%), produces ethanol from sugar cane, with an annual production capacity of more than 2.5 billion litres; exports sugar, with an annual production of about 3.8 million tonnes; and manages a retail network. In 2015, Raízen opened its first cellulosic ethanol plant at its Costa Pinto mill in Brazil, which produced almost 19.5 million litres in 2019. When fully operational, the mill is expected to produce around 40 million litres a year of advanced biofuels from sugar-cane residues.
CHEMICALS
Manufacturing
Our plants produce a range of base chemicals, including ethylene, propylene and aromatics, and intermediate chemicals such as styrene monomer, propylene oxide, solvents, detergent alcohols, ethylene oxide and ethylene glycol. We have the capacity to produce around 6.5 million tonnes of ethylene a year.
Marketing
In 2019, we supplied more than 15 million tonnes of petrochemicals to around 1,000 industrial customers worldwide. Our products are used to make numerous everyday items, from clothing and cars to detergents and bicycle helmets.
DOWNSTREAM BUSINESS ACTIVITIES WITH SUDAN AND SYRIA
SUDAN
We ceased all operational activities in Sudan in 2008.
STRATEGIC REPORT SHELL FORM 20-F 2019 | 45 | |
SYRIA
We ceased supplying polyols, via a Netherlands-based distributor, to private sector customers in Syria in 2018. Polyols are commonly used for the production of foam in mattresses and soft furnishings.
DOWNSTREAM DATA TABLES
The tables below reflect Shell subsidiaries and instances where Shell owns the crude oil or feedstocks processed by a refinery. In addition, the tables include the Al Jubail refinery on a 50% basis until the date of divestment. Other joint ventures and associates are only included where explicitly stated.
Oil products - cost of crude oil processed or consumed [A] | $/barrel | |||||
2019 | 2018 | 2017 | ||||
Total | 54.97 | 59.94 | 46.78 | |||
[A] Includes Upstream and Integrated Gas margins on crude oil supplied by Shell subsidiaries, joint ventures and associates.
Crude distillation capacity [A] | Thousand b/calendar day [B] | |||||
2019 | 2018 | 2017 | ||||
Europe | 970 | 970 | 970 | |||
Asia | 704 | 704 | 704 | |||
Oceania | — | — | — | |||
Africa | 83 | 82 | 82 | |||
Americas | 1,075 | 1,157 | 1,176 | |||
Total | 2,832 | 2,913 | 2,932 | |||
[A] Average operating capacity for the year, excluding mothballed capacity.
[B] Calendar day capacity is the maximum sustainable capacity adjusted for normal unit downtime.
Ethylene capacity [A] | Thousand tonnes/year | |||||
2019 | 2018 | 2017 | ||||
Europe | 1,701 | 1,701 | 1,702 | |||
Asia | 2,530 | 2,529 | 1,904 | |||
Oceania | — | — | — | |||
Africa | — | — | — | |||
Americas | 2,268 | 2,268 | 2,267 | |||
Total | 6,499 | 6,498 | 5,873 | |||
[A] Includes the Shell share of capacity entitlement (offtake rights) of joint ventures and associates, which may be different from nominal equity interest. Nominal capacity is quoted at December 31.
Oil products - crude oil processed [A] | Thousand b/d | |||||
2019 | 2018 | 2017 | ||||
Europe | 829 | 897 | 892 | |||
Asia | 498 | 545 | 528 | |||
Oceania | — | — | — | |||
Africa | 55 | 66 | 54 | |||
Americas | 1,004 | 1,041 | 997 | |||
Total | 2,386 | 2,549 | 2,471 | |||
[A] Includes natural gas liquids, share of joint ventures and associates and processing for others.
Refinery processing intake [A] | Thousand b/d | |||||
2019 | 2018 | 2017 | ||||
Crude oil | 2,342 | 2,434 | 2,364 | |||
Feedstocks | 222 | 214 | 208 | |||
Total | 2,564 | 2,648 | 2,572 | |||
Europe | 875 | 896 | 892 | |||
Asia | 517 | 543 | 539 | |||
Oceania | — | — | — | |||
Africa | 55 | 66 | 54 | |||
Americas | 1,117 | 1,143 | 1,087 | |||
Total | 2,564 | 2,648 | 2,572 | |||
[A] Includes crude oil, natural gas liquids and feedstocks processed in crude distillation units and in secondary conversion units.
Refinery processing outturn [A] | Thousand b/d | |||||
2019 | 2018 | 2017 | ||||
Gasolines | 952 | 966 | 955 | |||
Kerosines | 417 | 321 | 290 | |||
Gas/Diesel oils | 818 | 965 | 925 | |||
Fuel oil | 223 | 284 | 265 | |||
Other | 282 | 321 | 334 | |||
Total | 2,692 | 2,858 | 2,769 | |||
[A] Excludes own use and products acquired for blending purposes.
STRATEGIC REPORT SHELL FORM 20-F 2019 | 46 | |
Oil product sales volumes [A][B] | Thousand b/d | |||||
2019 | 2018 | 2017 | ||||
Europe | ||||||
Gasolines | 334 | 323 | 317 | |||
Kerosines | 317 | 294 | 272 | |||
Gas/Diesel oils | 720 | 745 | 758 | |||
Fuel oil | 138 | 178 | 170 | |||
Other products | 278 | 314 | 362 | |||
Total | 1,787 | 1,854 | 1,879 | |||
Asia | ||||||
Gasolines | 408 | 373 | 399 | |||
Kerosines | 208 | 210 | 216 | |||
Gas/Diesel oils | 535 | 543 | 516 | |||
Fuel oil | 330 | 407 | 349 | |||
Other products | 518 | 620 | 536 | |||
Total | 2,000 | 2,153 | 2,016 | |||
Oceania | ||||||
Gasolines | — | — | — | |||
Kerosines | — | — | 23 | |||
Gas/Diesel oils | — | — | — | |||
Fuel oil | — | — | — | |||
Other products | — | — | — | |||
Total | — | — | 23 | |||
Africa | ||||||
Gasolines | 46 | 42 | 43 | |||
Kerosines | 13 | 10 | 13 | |||
Gas/Diesel oils | 70 | 74 | 78 | |||
Fuel oil | 2 | 2 | 2 | |||
Other products | 6 | 6 | 6 | |||
Total | 137 | 134 | 142 | |||
Americas | ||||||
Gasolines | 1,419 | 1,446 | 1,415 | |||
Kerosines | 239 | 236 | 212 | |||
Gas/Diesel oils | 582 | 567 | 545 | |||
Fuel oil | 120 | 117 | 92 | |||
Other products | 277 | 276 | 275 | |||
Total | 2,637 | 2,642 | 2,539 | |||
Total product sales [C][D] | ||||||
Gasolines | 2,207 | 2,184 | 2,174 | |||
Kerosines | 777 | 750 | 736 | |||
Gas/Diesel oils | 1,907 | 1,929 | 1,897 | |||
Fuel oil | 590 | 704 | 613 | |||
Other products | 1,079 | 1,216 | 1,179 | |||
Total | 6,561 | 6,783 | 6,599 | |||
[A] Excludes deliveries to other companies under reciprocal sale and purchase arrangements, that are in the nature of exchanges. Sales of condensate and natural gas liquids are included.
[B] Includes the Shell share of Raízen’s sales volumes.
[C] Certain contracts are held for trading purposes and reported net rather than gross. The effect in 2019 was a reduction in oil product sales of approximately 546,000 b/d (2018: 458,000 b/d; 2017: 596,000 b/d).
[D] Reported volumes in 2019 include the Shell joint ventures sales volumes from key countries.
Chemicals sales volumes [A] | Thousand tonnes | |||||
2019 | 2018 | 2017 | ||||
Europe | ||||||
Base chemicals | 3,666 | 4,069 | 4,059 | |||
Intermediates and others | 1,872 | 1,994 | 2,056 | |||
Total | 5,538 | 6,063 | 6,115 | |||
Asia | ||||||
Base chemicals | 1,057 | 2,140 | 2,515 | |||
Intermediates and others | 2,848 | 3,082 | 3,243 | |||
Total | 3,905 | 5,222 | 5,758 | |||
Oceania | ||||||
Base chemicals | — | — | — | |||
Intermediates and others | — | — | — | |||
Total | — | — | — | |||
Africa | ||||||
Base chemicals | — | — | — | |||
Intermediates and others | — | — | — | |||
Total | — | — | — | |||
Americas | ||||||
Base chemicals | 3,261 | 3,842 | 3,839 | |||
Intermediates and others | 2,519 | 2,517 | 2,527 | |||
Total | 5,780 | 6,359 | 6,366 | |||
Total product sales | ||||||
Base chemicals | 7,984 | 10,051 | 10,413 | |||
Intermediates and others | 7,239 | 7,593 | 7,826 | |||
Total | 15,223 | 17,644 | 18,239 | |||
STRATEGIC REPORT SHELL FORM 20-F 2019 | 47 | |
MANUFACTURING PLANTS AT DECEMBER 31, 2019
Refineries in operation | ||||||||||||
Thousand barrels/calendar day, 100% capacity [B] | ||||||||||||
Location | Asset class | Shell interest (%) [A] | Crude distillation capacity | Thermal cracking/ visbreaking/ coking | Catalytic cracking | Hydro- cracking | ||||||
Europe | ||||||||||||
Denmark | Fredericia | • | 100 | 68 | 39 | — | — | |||||
Germany | Miro [C] | 32 | 287 | 36 | 87 | — | ||||||
Rheinland | ■• | 100 | 325 | 44 | — | 80 | ||||||
Schwedt [C] | 38 | 214 | 40 | 53 | — | |||||||
Netherlands | Pernis | ■• | 100 | 405 | 23 | 48 | 82 | |||||
Asia | ||||||||||||
Philippines | Tabangao | 55 | 95 | 31 | — | — | ||||||
Singapore | Pulau Bukom | ■• | 100 | 463 | 72 | 34 | 54 | |||||
Africa | ||||||||||||
South Africa | Durban [C] | ◆ | 36 | 165 | 22 | 33 | — | |||||
Americas | ||||||||||||
Argentina | Buenos Aires [C] | •◆ | 50 | 99 | 18 | 20 | — | |||||
Canada | ||||||||||||
Alberta | Scotford | ◆ | 100 | 92 | — | — | 74 | |||||
Ontario | Sarnia | ◆ | 100 | 78 | 4 | 19 | 9 | |||||
USA | ||||||||||||
California | Martinez [D] | • | 100 | 144 | 43 | 65 | 37 | |||||
Louisiana | Convent | ◆ | 100 | 239 | — | 83 | 49 | |||||
Norco | ■ | 100 | 229 | 26 | 108 | 39 | ||||||
Texas | Deer Park | ■• | 50 | 312 | 82 | 68 | 53 | |||||
Washington | Puget Sound | •◆ | 100 | 137 | 22 | 52 | — | |||||
[A] Shell interest is rounded to the nearest whole percentage point; Shell share of production capacity may differ.
[B] Calendar day capacity is the maximum sustainable capacity adjusted for normal unit downtime.
[C] Not operated by Shell.
[D] The sale of the Martinez refinery was concluded on February 1, 2020.
■ Integrated refinery and chemical complex.
• Refinery complex with cogeneration capacity.
◆ Refinery complex with chemical unit(s).
Major chemical plants in operation [A] | |||||||||||
Thousand tonnes/year, Shell share capacity [B] | |||||||||||
Location | Ethylene | Styrene monomer | Ethylene glycol | Higher olefins [C] | Additional products | ||||||
Europe | |||||||||||
Germany | Rheinland | 315 | — | — | — | A | |||||
Netherlands | Moerdijk | 971 | 815 | 153 | — | A, I | |||||
UK | Mossmorran [D] | 415 | — | — | — | — | |||||
Asia | |||||||||||
China | Nanhai [D] | 1,100 | 650 | 415 | — | A, I, P | |||||
Singapore | Jurong Island | 281 | 1,069 | 1,159 | — | A, I, P, O | |||||
Pulau Bukom | 1,149 | — | — | — | A, I | ||||||
Americas | |||||||||||
Canada | Scotford | — | 475 | 548 | — | A, I | |||||
USA | Deer Park | 836 | — | — | — | A, I | |||||
Geismar | — | — | 400 | 1,390 | I | ||||||
Norco | 1,432 | — | — | — | A | ||||||
Total | 6,499 | 3,009 | 2,675 | 1,390 | |||||||
[A] Major chemical plants are large integrated chemical facilities, typically producing a range of chemical products from an array of feedstocks, and are a core part of our global Chemicals business.
[B] Shell share of capacity of subsidiaries, joint arrangements and associates (Shell and non-Shell-operated), excluding capacity of the Infineum additives joint ventures.
[C] Higher olefins are linear alpha and internal olefins (products range from C4 to C2024).
[D] Not operated by Shell.
STRATEGIC REPORT SHELL FORM 20-F 2019 | 48 | |
A Aromatics, lower olefins.
I Intermediates.
P Polyethylene, polypropylene.
O Other.
Other chemical locations [A] | ||
Location | Products | |
Europe | ||
Germany | Karlsruhe | A |
Schwedt | A | |
Netherlands | Pernis | A, I, O |
Americas | ||
Argentina | Buenos Aires | I |
Canada | Sarnia | A, I |
USA | Martinez | O |
Mobile | A | |
Puget Sound | I | |
[A] Other chemical locations reflect locations with smaller chemical units, typically serving more local markets.
A Aromatics, lower olefins.
I Intermediates.
O Other.
STRATEGIC REPORT SHELL FORM 20-F 2019 | 49 | |
Corporate | |
Earnings | $ million | |||||
2019 | 2018 | 2017 | ||||
Segment earnings | (3,273 | ) | (1,479 | ) | (2,416 | ) |
Comprising: | ||||||
Net interest and investment expense [A] | (3,425 | ) | (2,192 | ) | (2,413 | ) |
Net foreign exchange losses [B] | (67 | ) | (67 | ) | (292 | ) |
Taxation and other [C] | 219 | 780 | 289 | |||
[A] Mainly Shell’s interest expense (excluding accretion expense) and interest income, together with the Shell share of joint ventures and associates’ net interest expense, and net gains on sales from Shell insurance entities’ portfolio of debt securities.
[B] On Shell’s financing activities, together with the Shell share of joint ventures and associates’ net foreign exchange gains/(losses) on financing activities.
[C] Other earnings mainly comprise headquarters and central functions’ costs not recovered from business segments, and net gains on sale of properties.
OVERVIEW
The Corporate segment covers the non-operating activities supporting Shell. It comprises Shell’s holdings and treasury organisation, its self-insurance activities and its headquarters and central functions. All finance expense and income as well as related taxes are included in the Corporate segment earnings rather than in the earnings of the business segments.
The holdings and treasury organisation manages many of the Corporate entities and is the point of contact between Shell and external capital markets. It conducts a broad range of transactions, from raising debt instruments to transacting foreign exchange. Treasury centres in London and Singapore support these activities.
Headquarters and central functions provide business support in the areas of communications, finance, health, human resources, information technology, legal services, real estate and security. They also provide support for the shareholder-related activities of the Company. The central functions are supported by business service centres located around the world, which process transactions, manage data and produce statutory returns, among other services. The majority of the headquarters and central-function costs are recovered from the business segments. Those costs that are not recovered are retained in Corporate.
EARNINGS 2019-2017
Segment earnings in 2019 were a loss of $3,273 million, compared with a loss of $1,479 million in 2018 and a $2,416 million loss in 2017.
Net interest and investment expense increased by $1,233 million compared with 2018. This was primarily due to the introduction of IFRS 16 (Pages 148-156, Note 2) and reduced capitalised interest. In 2018, net interest and investment expense decreased by $221 million compared with 2017. This was due to a decrease in interest expense due to higher capitalised interest, coupled with higher interest income from increases to both cash levels and higher interest rates.
The Corporate segment includes net foreign exchange gains/(losses) from financing positions. Net foreign exchange gains/(losses) generally relate to the impact of changes in exchange rates on non-functional currency loans and cash balances in operating companies. In 2019 and 2018, unfavourable exchange rate movements resulted in a net foreign exchange loss.
Taxation and other earnings decreased by $561 million in 2019, compared with 2018, due to reduced tax credits from financing and one-off charges. In 2018, taxation and other earnings increased by $491 million compared with 2017, due to increased tax credits from foreign exchange losses, which were partially offset by increased corporate expenses and depreciation charges.
SELF-INSURANCE
We mainly self-insure our risk exposure, and capital is set aside to meet self-insurance obligations (see “Risk factors” on page 14). We seek to ensure that the capital held to support the self-insurance obligations is at a level at least equivalent to what would be held in the third-party insurance market. Periodically, surveys of key assets are undertaken that provide risk-engineering knowledge and best practices to Shell subsidiaries with the aim
of reducing their exposure to hazard risks. Actions identified during these surveys are monitored to completion.
INFORMATION TECHNOLOGY AND CYBER-SECURITY
Given our digitalisation efforts and increasing reliance on information technology (IT) systems for our operations, we continuously monitor external developments and actively share information on threats and security incidents. Shell employees and contract staff are subject to mandatory courses and regular awareness campaigns aimed at protecting us against cyber threats. We periodically test and adapt cyber-security response processes and seek to enhance our security monitoring capability.
Given our dependence on IT systems for our operations and the increasing role of digital technologies across our business, we are aware that cyber-security attacks could cause significant harm to Shell in the form of loss of productivity, loss of intellectual property, regulatory fines and/or reputational damage. As a result, we continuously measure and, where required, further improve our cyber-security capabilities to reduce the likelihood of successful cyberattacks. Our cyber-security capabilities are embedded into our IT systems and our IT landscape is protected by various detective and protective technologies. The identification and assessment capabilities are built into our support processes and adhere to industry best practices. The security of IT services, operated by external IT companies, is managed through contractual clauses and additionally through formal supplier assurance reports for critical IT services.
Shell is frequently subject to cyberattacks. In 2019, none of these events led to breaches of our business-critical IT landscape and, as such, did not result in any material business impact. When significant incidents occur, they are followed up with a thorough root-cause analysis and, if needed, will result in appropriate follow-up actions.
See “Risk factors” on page 14.
BRAND VALUE
According to the Brand Finance Global 500 2020 - the annual report on the world's most valuable and strongest brands published by leading brand valuation consultancy Brand Finance at the World Economic Forum in Davos this January, Shell’s brand value was estimated at $47.5 billion, up 12% compared to the previous year and 55% versus 2015. The report also shows Shell’s brand rating strengthening from AAA- to AAA.
STRATEGIC REPORT SHELL FORM 20-F 2019 | 50 | |
Liquidity and capital resources | |
We manage our businesses to deliver strong cash flows to fund investment for profitable growth. Our aim is that, across the business cycle, “cash in” (including cash from operations and divestments) at least equals “cash out” (including capital expenditure, interest and dividends), while maintaining a strong balance sheet. In 2020, our priorities for applying our cash are expected to be the servicing and reduction of debt commitments, payment of dividends, followed by a balance of capital investment and share buybacks.
FINANCIAL CONDITION AND LIQUIDITY
Despite weaker commodity prices over the course of 2019, the Shell Group generated cash flow from operations of $42.2 billion and free cash flow of $26.4 billion, supporting continued progress of the share buyback programme which commenced in 2018. $10.2 billion share buybacks were completed in 2019. Gearing increased to 29.3% at December 31, 2019, comparable with 25.0% on an IAS 17 basis (2018: 20.3%). Gearing is a key measure of Shell’s capital structure and across the business cycle, we aim to return to a gearing level within a range of 15-25%. Note 14 to the “Consolidated Financial Statements” on page 167-170 provides information on our debt arrangements, including gearing and net debt definitions.
LIQUIDITY
We satisfy our funding and working capital requirements from the cash generated from our operations, the issuance of debt and divestments. In 2019, access to the international debt capital markets remained strong, with our debt principally financed from these markets through central debt programmes consisting of:
■ a $10 billion global commercial paper (CP) programme, with maturities not exceeding 270 days;
■ a $10 billion US CP programme, with maturities not exceeding 397 days;
■ an unlimited Euro medium-term note (EMTN) programme (also referred to as the Multi-Currency Debt Securities Programme); and
■ an unlimited US universal shelf (US shelf) registration.
All these CP, EMTN and US shelf issuances are issued by Shell International Finance B.V., the issuance company for Shell, with its debt being guaranteed by Royal Dutch Shell plc (the Company).
We also maintain committed credit facilities, which were increased and extended in December 2019 with $2 billion now expiring in 2020 and $8 billion in 2024. Each facility includes two one-year extension options at the discretion of each lender. Both remained undrawn at December 31, 2019. These facilities and internally available liquidity provide back-up coverage for our CP programmes. Other than certain borrowing by local subsidiaries, we do not have any other committed credit facilities.
Our total debt increased by $19.6 billion, of which $15.7 billion was due to the impact of IFRS16, to $96.4 billion at December 31, 2019. The total debt excluding leases will mature as follows: 15% in 2020; 8% in 2021; 7% in 2022; 7% in 2023; and 63% in 2024 and beyond. The portion of debt maturing in 2020 is expected to be repaid from a combination of cash balances, cash generated from operations, divestments and the issuance of new debt.
In 2019, we issued $4 billion of bonds under our US shelf registration and €3 billion under our EMTN programme. Periodically, for working capital purposes, we issued CP. We believe our working capital is sufficient for current requirements.
While our subsidiaries are subject to restrictions, such as foreign withholding taxes on the transfer of funds in the form of cash dividends, loans or advances, such restrictions are not expected to have a material impact on our ability to meet our cash obligations.
MARKET RISK AND CREDIT RISK
We are affected by the global macroeconomic environment as well as financial and commodity market conditions. This exposes us to treasury and
trading risks, including liquidity risk, market risk (interest rate risk, foreign exchange risk and commodity price risk) and credit risk. See “Risk factors” on pages 11-15 and Note 19 to the “Consolidated Financial Statements” on pages 176-182. The size and scope of our businesses require a robust financial control framework and effective management of our various risk exposures.
We utilise various financial instruments for managing exposure to commodity price, foreign exchange and interest rate movements. Our treasury and trading operations are highly centralised and seek to manage credit exposures associated with our substantial cash, commodity, foreign exchange and interest rate positions. Our portfolio of cash investments is diversified to avoid concentrating risk in any one instrument, country or counterparty. Other than in exceptional cases, the use of external derivative instruments is confined to specialist trading and central treasury organisations that have appropriate skills, experience, supervision, control and reporting systems. Credit risk policies are in place to ensure that sales of products are made to customers with appropriate creditworthiness, and include detailed credit analysis and monitoring of customers against counterparty credit limits. Where appropriate, netting arrangements, credit insurance, prepayments and collateral are used to manage credit risk. We maintain a committed credit facility. Management believes it has access to sufficient debt funding sources (capital markets) and to undrawn committed borrowing facilities to meet foreseeable requirements.
PENSION COMMITMENTS
We have substantial pension commitments, the funding of which is subject to capital market risks (see “Risk factors” on page 14). We address key pension risks in a number of ways. Principal among these is the Pensions Forum, chaired by the Chief Financial Officer, which oversees Shell’s input to pension strategy, policy and operation. A risk committee supports the forum in reviewing the results of assurance processes in respect to pensions risks. In general, local trustees manage the funded defined benefit pension plans, with contributions paid based on independent actuarial valuations in accordance with local regulations. Our total employer contributions to funded and unfunded defined benefit pension plans were $1.5 billion in 2019 and are estimated to be $0.7 billion in 2020. See Note 17 to the Consolidated Financial Statements at pages 173-175.
Capitalisation table | $ million | |||
December 31, 2019 | December 31, 2018 | |||
Equity attributable to Royal Dutch Shell plc shareholders | 186,476 | 198,646 | ||
Current debt | 15,064 | 10,134 | ||
Non-current debt | 81,360 | 66,690 | ||
Total debt [A] | 96,424 | 76,824 | ||
Total capitalisation | 282,900 | 275,470 | ||
[A] Of total debt, $65.7billion (2018: $62.7 billion) was unsecured and $30.7 billion (2018: $14.1 billion) was secured. See Note 14 to the “Consolidated Financial Statements” on pages 167‑170 for further disclosure on debt.
STATEMENT OF CASH FLOWS
Cash flow from operating activities in 2019 was an inflow of $42.2 billion, compared with $53.1 billion in 2018, mainly due to lower earnings and an unfavourable working capital impact. The increase in cash flow from operating activities in 2018, compared with $35.7 billion in 2017, was mainly due to higher earnings and a favourable working capital impact.
Cash flow from investing activities in 2019 was an outflow of $15.8 billion, compared with an outflow of $13.7 billion in 2018. The increased cash outflow was mainly due to lower proceeds from the sale of equity securities, partly offset by higher proceeds from sale of assets in 2019. The increased cash outflow in 2018 compared with $8.0 billion in 2017 was mainly due to lower proceeds from the sale of assets and securities in 2018.
STRATEGIC REPORT SHELL FORM 20-F 2019 | 51 | |
Cash flow from financing activities in 2019 was an outflow of $35.2 billion, compared with outflows of $32.5 billion in 2018 and $27.1 billion in 2017. In 2019, this included payment of dividends to Royal Dutch Shell plc shareholders of $15.2 billion (2018: $15.7 billion; 2017: $10.9 billion), net repayment of debt of $3.4 billion (2018: $8.3 billion ; 2017: $11.8 billion), repurchases of shares of $10.2 billion (2018: $3.9 billion) and interest paid of $4.6 billion (2018: $3.6 billion; 2017: $3.6 billion).
Cash and cash equivalents were $18.1 billion at December 31, 2019 (2018: $26.7 billion; 2017: $20.3 billion).
CASH FLOW FROM OPERATING ACTIVITIES
The most significant factors affecting our cash flow from operating activities are earnings, which are mainly impacted by: realised prices for crude oil, natural gas and LNG; production levels of crude oil, natural gas and LNG; refining and marketing margins; and movements in working capital.
The impact on earnings from changes in market prices depends on: the extent to which contractual arrangements are tied to market prices; the dynamics of production-sharing contracts; the existence of agreements with governments or state-owned oil and gas companies that have limited sensitivity to crude oil and natural gas prices; tax impacts; and the extent to which changes in commodity prices flow through into operating costs. Changes in benchmark prices of crude oil and natural gas in any particular period therefore provide only a broad indicator of changes in our Integrated Gas and Upstream earnings in that period. In the longer term, replacement of proved oil and gas reserves will affect our ability to maintain or increase production levels, which in turn will affect our earnings and cash flows. Changes in any one of a range of factors, derived from either within the industry or the broader economic environment, can influence refining and marketing margins. The precise impact of any such changes depends on how the oil markets respond to them. The market response is affected by factors such as: whether the change affects all crude oil types or only a specific grade; regional and global crude oil and refined products inventories; and the collective speed of response of refiners and product marketers in adjusting their operations. As a result, margins fluctuate from region to region and from period to period.
CAPITAL INVESTMENT AND CASH CAPITAL EXPENDITURE
The level of capital investment in 2019 and 2018 reflects our discipline, focus and capital efficiency.
Capital investment [A] | $ million | ||
2019 | 2018 | 2017 | |
Integrated Gas | 6,706 | 4,259 | 3,921 |
Upstream | 11,075 | 12,785 | 13,160 |
Downstream | 10,542 | 7,565 | 6,418 |
Corporate | 465 | 269 | 157 |
Total capital investment | 28,788 | 24,878 | 26,655 |
[A] 2018 and 2017 as revised. See “Non-GAAP measures reconciliations” on pages 219-220.
With effect from January 1, 2019, cash capital expenditure was introduced to monitor investing activities on a cash basis, excluding items such as lease additions which do not necessarily result in cash outflows in the period. The capital discipline demonstrated in 2019 allowed us to maintain our cash capital expenditure in line with the $24-29 billion range.
Cash capital expenditure | $ million | |||||
2019 | 2018 | 2017 | ||||
Integrated Gas | 4,299 | 3,819 | 3,616 | |||
Upstream | 10,277 | 12,582 | 11,670 | |||
Downstream | 8,926 | 7,408 | 6,090 | |||
Corporate | 418 | 269 | 157 | |||
Total cash capital expenditure | 23,919 | 24,078 | 21,533 | |||
Cash flow information [A] | $ billion | |||||||
2019 | 2018 | 2017 | ||||||
Cash flow from operating activities excluding working capital movements | ||||||||
Integrated Gas | 14.8 | 16.3 | 8.7 | |||||
Upstream | 20.5 | 21.9 | 16.3 | |||||
Downstream | 11.9 | 10.8 | 12.6 | |||||
Corporate | (0.3 | ) | 0.7 | 0.3 | ||||
Total | 47.0 | 49.7 | 37.9 | |||||
(Increase)/decrease in inventories | (2.6 | ) | 2.8 | (2.1 | ) | |||
(Increase)/decrease in current receivables | (0.9 | ) | 2.0 | (2.6 | ) | |||
Increase/(decrease) in current payables | (1.2 | ) | (1.3 | ) | 2.4 | |||
(Increase)/decrease in working capital | (4.8 | ) | 3.4 | (2.3 | ) | |||
Cash flow from operating activities | 42.2 | 53.1 | 35.7 | |||||
Cash flow from investing activities | (15.8 | ) | (13.7 | ) | (8.0 | ) | ||
Cash flow from financing activities | (35.2 | ) | (32.5 | ) | (27.1 | ) | ||
Currency translation differences relating to cash and cash equivalents | 0.1 | (0.4 | ) | 0.6 | ||||
Increase/(decrease) in cash and cash equivalents | (8.7 | ) | 6.4 | 1.2 | ||||
Cash and cash equivalents at the beginning of the year | 26.7 | 20.3 | 19.1 | |||||
Cash and cash equivalents at the end of the year | 18.1 | 26.7 | 20.3 | |||||
[A] See the “Consolidated Statement of Cash Flows” on page 147.
DIVIDENDS
Our policy is to grow the dollar dividend per share through time, in line with our view of our underlying earnings and cash flow. When setting the dividend, the Board of Directors looks at a range of factors, including the macroeconomic environment, the current balance sheet, future investment plans and existing commitments. We returned $15.2 billion to our shareholders through dividends in 2019.
The fourth quarter 2019 interim dividend of $0.47 per share will be payable to shareholders on the register at February 14, 2020. See Note 23 to the “Consolidated Financial Statements” on page 185. The Board expects that the first quarter 2020 interim dividend will be $0.47 per share, equal to the US dollar dividend per share for the same quarter in 2019.
STRATEGIC REPORT SHELL FORM 20-F 2019 | 52 | |
PURCHASES OF SECURITIES
On July 26, 2018, the Company announced the commencement of a share buyback programme of at least $25 billion, subject to further progress with debt reduction and oil price conditions. This was in accordance with the authority granted by shareholders at the 2018 Annual General Meeting (AGM) for the Company to repurchase up to a maximum of 10% of its issued ordinary shares, excluding treasury shares (834 million ordinary shares). At the 2019 AGM, shareholders granted a renewal of this authority, to repurchase up to a maximum of 815 million ordinary shares, such authority to expire at the earlier of the close of business on August 21, 2020 and the end of the 2020 AGM. As at December 31, 2019, 445 million A shares with a nominal value of €31 million ($38 million) and 16 million B shares with a nominal value of €1 million ($1 million) (5.85% of the Company’s total issued share capital at December 31, 2019) had been cumulatively purchased and cancelled since the beginning of this programme, for a total cost of $14.1 billion including expenses, at an average price of $30.67 per share. As at December 31, 2019, 647 million ordinary shares could still be repurchased under the current AGM authority.
The purpose of the share repurchases in 2018 and 2019, and in the period ended January 24, 2020, was to reduce the issued share capital of the Company. A new resolution will be proposed at the 2020 AGM to renew the authority for the Company to purchase its own share capital, up to specified limits, for a further year. This proposal will be described in more detail in the 2020 Notice of Annual General Meeting.
Shares are also purchased by the employee share ownership trusts and trust-like entities (see the “Introduction from the Chair” on page 75) to meet delivery commitments under employee share plans. All share purchases are made in open-market transactions.
The table below provides information on purchases of shares in 2019, and in the period ended January 24, 2020, by the Company and affiliated purchasers. Purchases in euros and sterling are converted into dollars using the exchange rate on each transaction date.
Purchases of equity securities by issuer and affiliated purchasers in 2019 [A] | |||||||||||||||||
A shares | B shares | A ADSs [B] | |||||||||||||||
Purchase period | Number purchased for employee share plans | Number purchased for cancellation [C] | Weighted average price ($)[D] | Number purchased for employee share plans | Number purchased for cancellation [C] | Weighted average price ($)[D] | Number purchased for employee share plans | Weighted average price ($)[D] | |||||||||
January | — | 19,086,716 | 30.10 | — | — | — | 1,854,168 | 59.21 | |||||||||
February | — | 25,651,490 | 31.60 | — | — | — | — | — | |||||||||
March | — | 27,792,913 | 31.38 | — | — | — | 83,349 | 63.45 | |||||||||
April | 231,910 | 16,918,437 | 32.24 | 95,430 | — | 31.48 | — | — | |||||||||
May | — | 29,386,861 | 31.86 | — | — | — | — | — | |||||||||
June | — | 20,578,030 | 31.97 | 20,830 | — | 33.49 | 30,178 | 65.95 | |||||||||
July | 141,555 | 29,200,419 | 32.31 | — | — | — | — | — | |||||||||
August | — | 26,663,906 | 28.47 | — | 9,701,283 | 28.02 | — | — | |||||||||
September | 1,650,000 | 31,947,755 | 28.63 | 709,388 | 1,787,000 | 27.70 | 402,032 | 58.16 | |||||||||
October | 4,413,134 | 26,563,443 | 29.09 | 1,933,105 | — | 29.06 | 913,430 | 57.98 | |||||||||
November | 4,067,133 | 35,836,732 | 29.67 | 1,628,144 | — | 29.48 | 1,314,922 | 59.21 | |||||||||
December | 1,119,733 | 30,475,077 | 29.00 | 979,363 | 4,591,341 | 28.30 | 200,047 | 57.83 | |||||||||
Total 2019 | 11,623,465 | 320,101,779 | 30.37 | 5,366,260 | 16,079,624 | 28.28 | 4,798,126 | 58.95 | |||||||||
January | — | 23,206,521 | [E] | 29.63 | — | — | — | 1,003,452 | 59.76 | ||||||||
Total 2020 | — | 23,206,521 | 29.63 | — | — | — | 1,003,452 | 59.76 | |||||||||
[A] Reported as at settlement date.
[B] American Depository Shares.
[C] Under the share buyback programme.
[D] Includes stamp duty and brokers’ commission.
[E] As at January 24, 2020, the end of the sixth tranche of the share buyback programme.
CONTRACTUAL OBLIGATIONS
The table below summarises our principal contractual obligations at December 31, 2019, by expected settlement period. The amounts presented have not been offset by any committed third-party revenue in relation to these obligations.
Contractual obligations | $ billion | |||||||||
Less than 1 year | Between 1 and 3 years | Between 3 and 5 years | 5 years and later | Total | ||||||
Debt [A] | 10.1 | 9.9 | 6.5 | 38.7 | 65.2 | |||||
Leases | 7.3 | 9.9 | 7.6 | 21.3 | 46.1 | |||||
Purchase obligations [B] | 24.6 | 25.1 | 18.3 | 48.6 | 116.6 | |||||
Other long-term contractual liabilities [C] | — | 0.4 | — | 0.7 | 1.1 | |||||
Total | 42.0 | 45.3 | 32.4 | 109.3 | 229.0 | |||||
[A] See Note 14 to the “Consolidated Financial Statements”on pages 167-170. Debt contractual obligations exclude interest, which is estimated to be $1.7 billion payable in less than one year, $3.0 billion between one and three years, $2.6 billion between three and five years, and $14.6 billion in five years and later. For this purpose, we assume that interest rates with respect to variable interest rate debt remain constant at the rates in effect at December 31, 2019, and that there is no change in the aggregate principal amount of debt other than repayment at scheduled maturity as reflected in the table. Leases definition follows IFRS 16, which was implemented January 1, 2019. Lease contractual obligations include interest.
[B] Purchase obligations disclosed in the above table exclude commodity purchase obligations that are not fixed or determinable and are principally intended to be resold in a short period of time through sale agreements with third parties. Examples include long-term non-cancellable LNG and natural gas purchase commitments and commitments to purchase refined products or crude oil at market prices. Inclusion of such commitments would not be meaningful in measuring liquidity and cash flow, as the cash outflows generated by these purchases will generally be offset in the same periods by cash received from the related sales transactions.
[C] Includes all obligations included in “Trade and other payables” in “Non-current liabilities” in the “Consolidated Balance Sheet” that are contractually fixed as to timing and amount. In addition to these amounts, Shell has certain obligations that are not contractually fixed as to timing and amount, including contributions to defined benefit pension plans (see Note 17 to the “Consolidated Financial Statements” on pages 173-175 ) and obligations associated with decommissioning and restoration (see Note 18 to the “Consolidated Financial Statements” on page 176).
GUARANTEES AND OTHER OFF-BALANCE SHEET ARRANGEMENTS
There were no guarantees and other off-balance sheet arrangements at December 31, 2019, or 2018, that were reasonably likely to have a material effect on Shell.
STRATEGIC REPORT SHELL FORM 20-F 2019 | 53 | |
FINANCIAL INFORMATION RELATING TO THE ROYAL DUTCH SHELL DIVIDEND ACCESS TRUST
The results of operations and financial position of the Royal Dutch Shell Dividend Access Trust (the Trust) are included in the consolidated results of operations and financial position of Shell. Certain condensed financial information in respect of the Trust is given below. See “Royal Dutch Shell Dividend Access Trust Financial Statements” on pages 210-212.
The Shell Transport and Trading Company Limited and BG Group Limited have each issued a dividend access share to Computershare Trustees (Jersey) Limited (the Trustee). For the years 2019, 2018 and 2017, the Trust recorded income before tax of £5,484 million, £5,328 million, and £4,567 million respectively. In each period, this reflected the amount of dividends received on the dividend access shares.
At December 31, 2019, the Trust had total equity of £nil (2018: £nil; 2017: £nil), reflecting cash of £3 million (2018: £3 million; 2017: £2 million) and unclaimed dividends of £3 million (2018: £3 million; 2017: £2 million). The Trust only records a liability for an unclaimed dividend, and a corresponding amount of cash, to the extent that dividend cheque payments have not been presented within 12 months, have expired or have been returned unpresented.
STRATEGIC REPORT SHELL FORM 20-F 2019 | 54 | |
Environment and society | |
Our success in business depends on our ability to meet a range of environmental and social challenges. We must operate safely and manage the effect our activities can have on neighbouring communities and wider society. If we fail to do this, we may incur liabilities or sanctions, lose business opportunities, harm our reputation, or our licence to operate may be impacted (see “Risk factors” on page 11).
Data in this section are reported on a 100% basis in respect of activities where we are the operator. Reporting on this operational control basis differs from that applied for financial reporting purposes in the “Consolidated Financial Statements” on pages 142-189. Detailed data and information on our 2019 environmental and social performance is expected to be published in the Shell Sustainability Report in April 2020.
CONTROL FRAMEWORK
The Shell General Business Principles set out our responsibilities to shareholders, customers, employees, business partners and society. They set the standards for the way we conduct business, with integrity, care and respect for people, the protection of the environment and mutually beneficial relationships with communities. All ventures that we operate must conduct their activities in line with our business principles.
We aim to minimise the environmental impact of new projects and existing operations, and we engage with local communities and non-governmental organisations to understand and respond to their concerns. Shell conducts an environmental, social and health impact assessment for every major project. The definition of major projects considers two categories: capacity, including consequences from potential incidents; and cost. This helps us to understand and manage the effects our projects could have on the surrounding environment and local communities. We have standards and a clear governance structure in place to help manage potential impacts. We are committed to the safety of our people and contractors. The standards for Health, Safety, Security, Environment and Social Performance (HSSE & SP) and the scope for application of each of these standards is specified in the Shell HSSE & SP Control Framework (CF). The CF is made up of a series of mandatory manuals, which are in line with the Shell Commitment and Policy on HSSE & SP and the Shell Code of Conduct. They are supported by a number of guidance documents and complemented by assurance protocols. The CF applies to every Shell entity, including all employees and contract staff, and to Shell-operated ventures. The CF defines standards and accountabilities at each level of the organisation and sets out the procedures and processes people are required to follow. We require that all significant HSSE & SP risks associated with our business activities are assessed and managed to as low as reasonably practicable. Our HSSE & SP functions provide expert advice and support for the business. The Process Safety and HSSE & SP Assurance team provides assurance on the effectiveness of HSSE & SP controls to the Board.
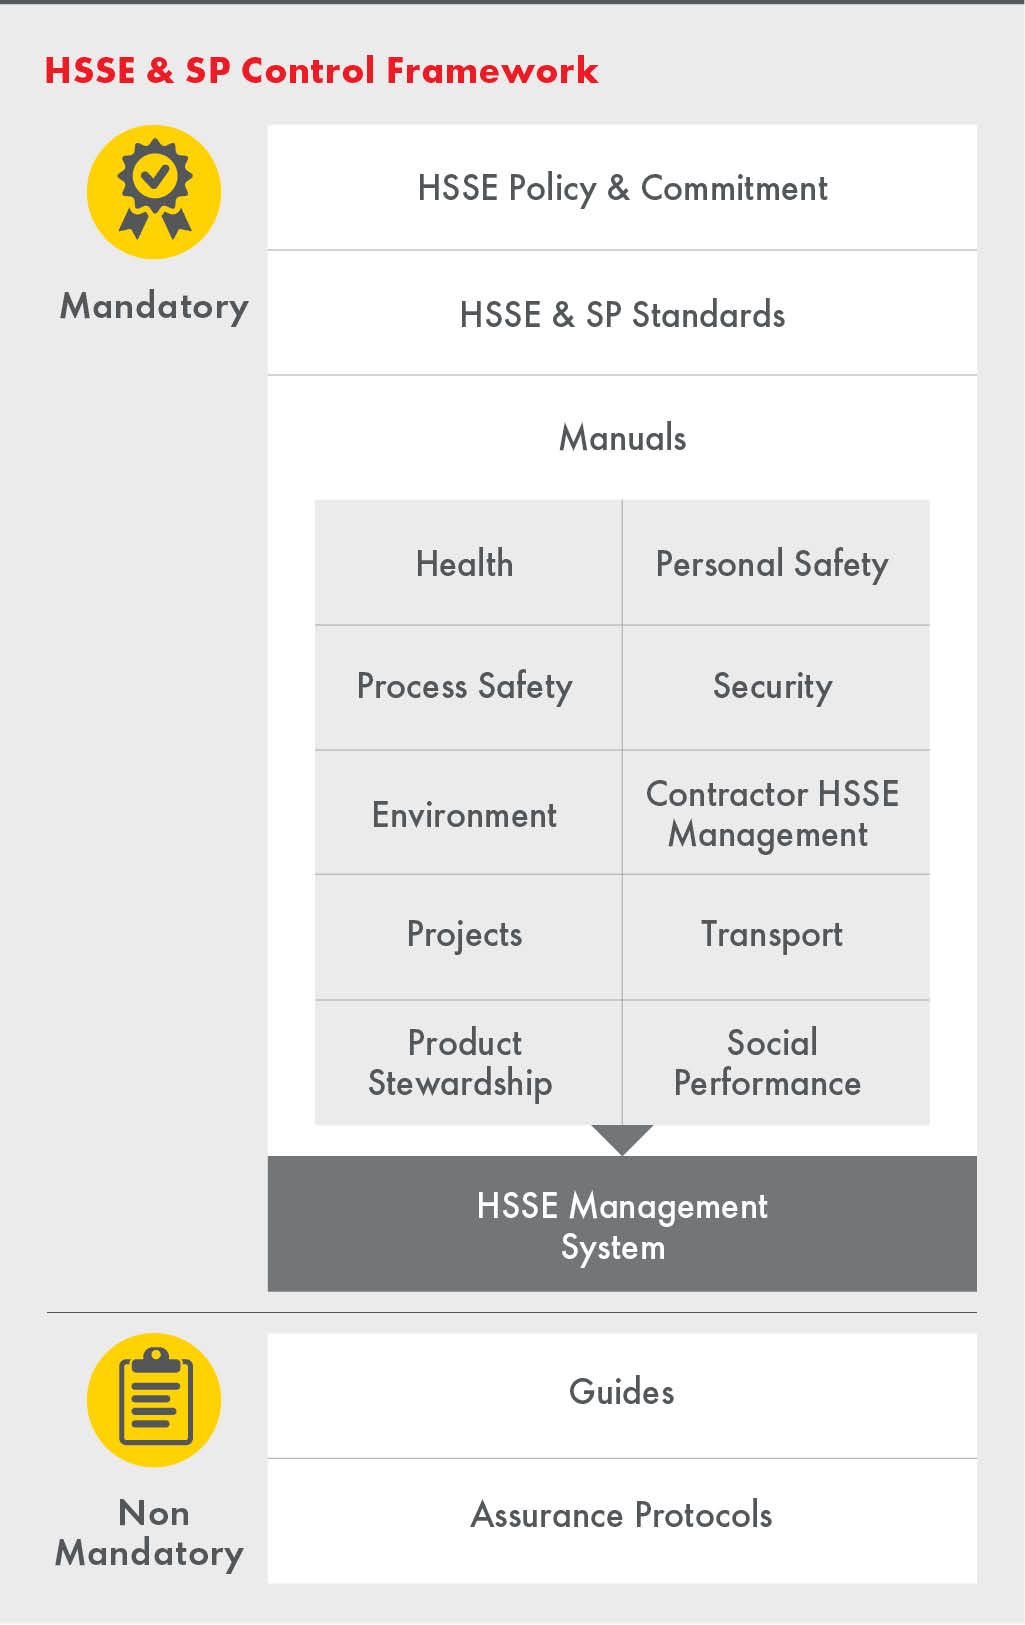
We expect joint ventures not operated by Shell to apply standards and principles similar to our own. We support these joint ventures in their implementation of our HSSE & SP Control Framework, or of a similar framework, and offer to review the effectiveness of their implementation. Even if such a review is not carried out, we periodically evaluate HSSE & SP risks faced by the ventures which we do not operate. If one of these joint ventures does not meet our expectations, we work to put remedial action plans in place, in agreement with our partners, to improve performance.
Shell aims to work with suppliers that behave in a safe, economically, environmentally and socially responsible manner. Our approach to suppliers is set out in our Shell General Business Principles and Shell Supplier Principles. These principles cover expectations in areas such as business integrity, health and safety, environment, and human rights. Working with suppliers in this way is central to maintaining a strong societal support for our operations.
SAFETY
Safety is central to the responsible delivery of energy. We develop and operate our facilities with the aim of preventing any incidents that may harm our employees, contract staff or nearby communities, or cause damage to our assets or adversely impact the environment. We strive to help improve safety performance throughout the energy industry by sharing our safety experience and standards with other operators, contractors and professional organisations, including the International Association of Oil & Gas Producers (IOGP) and the Energy Institute. Shell´s Safety, Environment and Sustainability Committee (SESCo) reviews and advises the Board on our safety strategy, policies and performance. Safety performance is included in
STRATEGIC REPORT SHELL FORM 20-F 2019 | 55 | |
our annual bonus scorecard for all our employees. See also “Directors’ Remuneration Report” on page 98-123.
How we mitigate
We manage safety risks across our businesses through clear standards, controls and compliance systems, combined with a safety-focused culture. We strive to reduce risks and to minimise the potential impact of any incident. Our standards also apply to any joint ventures we operate. We focus on the three areas of safety with the highest risks associated with our activities: personal, process, and transport. We ensure that people responsible for tasks involving a significant safety hazard have the necessary training, skills and competencies. We employ a large number of contractors and we work with them to ensure they understand our safety requirements. Together we build skills and expertise to improve safety performance. We expect everyone working for us to comply with our 12 mandatory Life-Saving Rules. If employees break these rules, they face disciplinary action up to and including termination of employment. If contract staff break the Life-Saving Rules, they can be removed from the worksite. See also “Control Framework” on page 55.
Personal and process safety
We continue to strengthen the safety culture and leadership among our employees and contract staff, with the focus on caring for people. Our safety goal is to achieve no harm and no leaks across all our operations. We refer to this as our Goal Zero ambition.
We expect everyone working for us to intervene and stop work that may appear to be unsafe. In addition to our ongoing safety awareness programmes, we hold an annual global safety day to give employees and contract staff time to reflect on how to prevent incidents.
Process safety management is about keeping hazardous substances inside pipes, tanks and vessels so they do not cause any harm to people or the environment. It starts at the design and construction stage of our projects and is implemented throughout the life cycle of these facilities to ensure they are safely operated, well-maintained and regularly inspected. Our global standards and operating procedures define the controls and physical barriers we require to prevent incidents. For example, our offshore wells are designed with at least two independent barriers in the direction of flow to mitigate the risk of an uncontrolled release of hydrocarbons. We regularly inspect, test and maintain these barriers to ensure they meet our standards. In the event of a loss of containment such as a spill or a leak, we employ independent recovery measures to prevent the release from becoming catastrophic. This system of barriers and recovery measures is known as a “bow-tie”, a model that visually represents a system where personal and process safety hazards are managed through prevention and response barriers. Since 2016, we have been working on strengthening barriers that involve critical safety tasks carried out by frontline staff. We have embedded a set of process safety fundamentals, which provide clear guidelines for good operating practice to prevent unplanned releases.
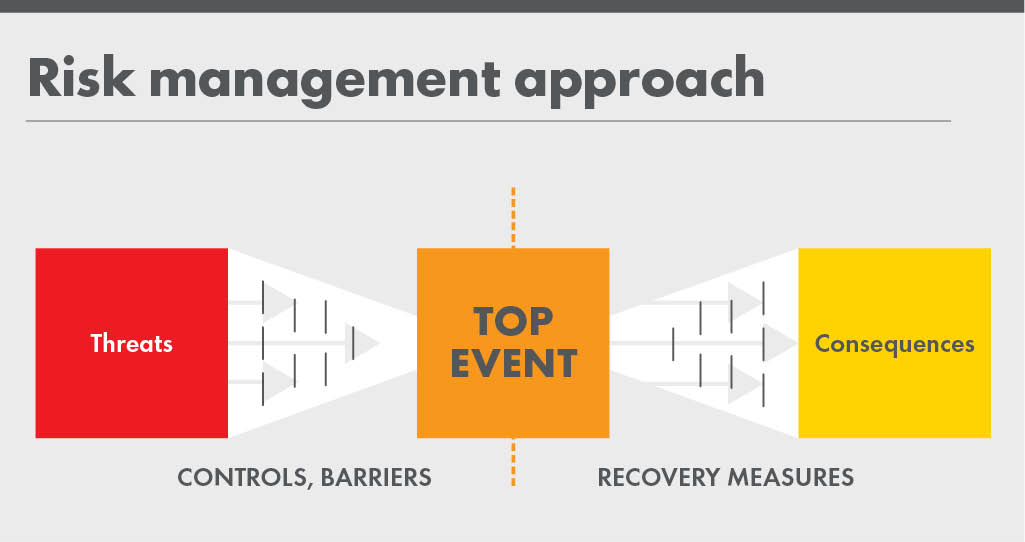
We also routinely prepare and practise our emergency response to potential incidents such as a spill or a fire. This involves working closely with local services and regulatory agencies to jointly test our plans and procedures. These tests continually improve our readiness to respond. If an incident does
occur, we have procedures in place to reduce the impact on people and the environment.
As set out in “Performance indicators” on pages 20-21, our total recordable case frequency (injuries per million working hours) was 0.9 in 2019, compared with 0.9 in 2018, and there were 130 operational Tier 1 and 2 process safety events in 2019, compared with 121 in 2018. Detailed information on our 2019 safety performance is expected to be published in the Shell Sustainability Report in April 2020.
ENVIRONMENT
We are committed to protecting the environment. For us, being responsible means understanding the impact Shell can have on the environment and the communities we share it with - before, during and at the end of our operations. We aim to make a positive contribution to the local environments in which we operate and seek to reduce any potential negative environmental impacts. This is why we set ourselves high internal environmental standards. These match and, in some cases exceed, local regulatory requirements. We aim to continually improve our performance, and to prepare to respond to future challenges and opportunities. We adhere to external standards and guidelines, such as those developed by the World Bank and International Finance Corporation, to inform our approach. For us, protecting the environment also means working to transform our product mix over time, for example, by expanding the choice of lower-carbon products we offer customers. Shell´s Safety, Environment and Sustainability Committee (SESCo) reviews and advises the Board on our environment strategy, policies and performance.
In 2019, our intake of fresh water was 192 million cubic metres, compared to 199 in 2018. Around 90% of our fresh water intake was used for manufacturing oil products and chemicals, with the rest mainly used for oil and gas production. Around 40% of freshwater intake was from public utilities, such as municipal water supplies, with the remainder taken from surface water such as rivers and lakes (around 51%) and groundwater (around 9%).
Detailed information on our 2019 environmental performance is expected to be published in the Shell Sustainability Report in April 2020.
See “Climate change and energy transition” on page 59 for more information on how we manage our GHG emissions.
SPILLS
Large spills of crude oil, oil products and chemicals associated with our operations can adversely impact the environment and wildlife, and result in major clean-up costs as well as fines and other damages. They can also affect our licence to operate and harm our reputation.
We have requirements and procedures designed to prevent spills. We aim to design, operate and maintain our facilities so that we avoid spills. To further reduce the risk of spills, Shell has routine programmes to maintain and improve the reliability of facilities and pipelines. Our business units are responsible for organising and executing oil-spill responses in line with Shell guidelines and relevant legal and regulatory requirements. All our offshore installations have plans in place to respond to spills. These plans detail response strategies and techniques, available equipment, and trained personnel and contracts. We are able to call upon site-managed resources such as containment booms. We are also able to draw upon the contracted services of oil-spill response organisations, their containment booms, collection vessels, aircraft or other equipment if required for large spills. We conduct regular exercises that seek to ensure these plans remain effective.
We have further developed our ability to respond to spills to water, and we maintain a Global Response Support Network of trained staff to support our worldwide response capability. This is also supported by our global Oil Spill Expertise Centre, which tests local capability and maintains our ability globally to respond to a significant spill into a marine environment.
We also maintain site-specific emergency response plans in the event of an onshore spill. Like the offshore response plans, these are designed to meet Shell guidelines as well as relevant local legal and regulatory requirements. They also provide for the initial assessment of incidents and the mobilisation of resources needed to manage them. In the event of spills on land,
STRATEGIC REPORT SHELL FORM 20-F 2019 | 56 | |
businesses are supported by our global Soil & Groundwater Team whose role is to review and implement appropriate remedies such as sustainable remediation. The global Soil & Groundwater Team is engaged throughout the lifecycle of our assets. For example, during acquisition and divestment of assets, they conduct due diligence to identify land contamination liabilities. Through research and development initiatives, the Soil & Groundwater Team collaborates with regulators in developing, modifying, and applying sustainable remediation techniques.
Spills still occur for reasons such as operational failure, accidents or unusual corrosion. In 2019, the number of operational spills of more than 100 kilograms decreased to 70 from 93 in 2018 (see “Performance indicators” on pages 20-21). The weight of operational spills of oil and oil products in 2019 was 0.2 thousand tonnes, a decrease from 0.9 thousand tonnes in 2018. At the time of publication of this report, there was one spill under investigation in Nigeria that may result in adjustments.
Spills in Nigeria
Most oil spills in the Niger Delta region of Nigeria continue to be caused by crude oil theft or sabotage of oil and gas production facilities, and illegal oil refining, including the distribution of illegally refined products. In 2019, about 95% of 164 oil spills of more than 100 kilograms from the Shell Petroleum Development Company of Nigeria Limited (SPDC) joint venture's facilities were due to illegal activities by third parties. In 2019, the volume of crude oil spills of more than 100 kilograms caused by sabotage was 2.0 thousand tonnes (157 incidents), compared to 1.6 thousand tonnes (111 incidents) in 2018. However, there are instances where spills occur due to operational reasons. In 2019, SPDC managed to reduce the volume of operational spills of more than 100 kilograms to about 0.03 thousand tonnes of crude oil (seven incidents) compared to about 0.4 thousand tonnes of crude oil (15 incidents) in 2018. This represents a reduction of about 93% in operational spills weight year-on-year.
Irrespective of the cause, SPDC works to clean up and remediate areas impacted by spills originating from its facilities. SPDC succeeded in cutting the average time to complete recovery of free and/or residual oil from about 13 days in 2016 to about seven days in 2019. This entails the average time it takes to safely access an impacted site to commence Joint Investigation Visits (JIV) with diverse stakeholders including NGOs and communities, and clean up oil not mixed with water or soil. Clean-up activities include bio-remediation which stimulates microorganisms that naturally break down and use carbon-rich oil contamination as a source of food and energy, ultimately leading to its removal. Once clean-up and remediation operations are completed, the work is inspected and, if satisfactory, approved and certified by the Nigerian regulators. In case of operational spills, SPDC also pays compensation to people and communities impacted.
To reduce the number of operational spills, SPDC is focused on implementing its ongoing work programme to appraise, maintain and replace key sections of pipelines and flow lines. Over the last eight years, about 1,330 kilometres of pipelines and flow lines have been replaced. This is managed through a pipeline and flow line integrity management system that proactively manages pipeline integrity, puts barriers in place where necessary, and recommends when and where pipeline sections should be replaced to prevent failures. In 2018, this integrity management system was enhanced to manage threats arising from frequent pipeline sabotage or vandalism.
SPDC continues to undertake integrated focused initiatives to prevent and minimise spills caused by theft and sabotage of its facilities in the Niger Delta. In 2019, SPDC continued on-ground surveillance of the SPDC joint venture’s areas of operation, including its pipeline network, to mitigate third-party interference and ensure that spills are detected and responded to as quickly as possible. There are also daily overflights of the most vulnerable segments of the pipeline network to identify any new spill incidents or illegal activities. SPDC has also implemented anti-theft protection mechanisms on key infrastructure, such as wellheads and manifolds. The programme to protect well-heads with steel cages continues to help deter theft. By end of 2019, 301 cages had been installed and another 86 units are planned for installation in 2020, including enhanced CCTV for all installed cages. Only three breaches out of about 300 registered attempts were successful.
Since 2012, SPDC has worked with the International Union for Conservation of Nature (IUCN) to enhance remediation techniques and to protect biodiversity at sites affected by oil spills in SPDC’s areas of operation in the Niger Delta. Based on this collaboration, SPDC has launched further improvement initiatives to help strengthen its remediation and restoration efforts. In 2019, SPDC and IUCN worked together on the Niger Delta Biodiversity Technical Advisory Group which also includes representatives from the Nigerian Conservation Foundation and Wetlands International, to continue to monitor biodiversity recovery of remediated sites.
SPDC also works with a range of stakeholders in the Niger Delta to build greater trust in spill response and clean-up processes. Local communities take part in the remediation work for operational spills.
In certain instances, some non-governmental organisations have also participated in joint investigation visits along with government regulators, SPDC and members of impacted communities, to establish the cause and volume of oil spilled.
SPDC has also implemented several initiatives and programmes to raise awareness of the negative impact of crude oil theft and illegal oil refining. Examples include community-based pipeline surveillance and the promotion of alternative livelihoods through Shell’s flagship youth entrepreneurship programme, Shell LiveWIRE.
In 2015, SPDC, on behalf of the SPDC joint venture and the Bodo community, signed a memorandum of understanding (MOU) granting access to SPDC to begin the clean-up of areas affected by two operational spills in 2008. The MOU also provided for the selection of two international contractors to conduct the clean-up and to be overseen by an independent project director. The clean-up project suffered a delay in 2016 and most of 2017 due to access challenges from the community. After engagement with the Bodo community and other stakeholders over two years, beginning in September 2015, and managed by the Bodo Mediation Initiative, the first phase of clean-up and remediation activities started in September 2017. The clean-up consists of three phases: 1) removal of free-phase surface oil, 2) remediation of soil, and 3) planting of mangroves and monitoring. The first phase was completed in August 2018 and the contract procurement process for phase two was finalised in 2019 with four remediation contractors having international technical partners and two consultancy contractors selected. Mobilisation is expected to effectively start in 2020. Prior to engagement on the project, 800 community workers were medically checked, tested for swimming ability, and trained to International Maritime Organization (IMO) Oil Spill Response Levels 1 and 2. Field remediation activities commenced in November 2019. Should activities continue uninterrupted, phase two (soil remediation) is expected to take around 18 months. However, for it to be successful, there must be no re-contamination of cleaned-up sites from illegal third-party activities, such as crude oil theft and illegal refining.
SPDC remains committed to the implementation of the 2011 United Nations Environmental Programme (UNEP) Report on Ogoniland. Over the last eight years, SPDC has taken action on all, and completed most, of the UNEP recommendations addressed specifically to it as operator of the joint venture. The UNEP report recommended the creation of an Ogoni Trust Fund (OTF) with $1 billion capital, to be co-funded by the Nigerian government, the SPDC joint venture and other operators in the area. The SPDC joint venture remains fully committed to contributing $900 million as its share over five years to the Fund. SPDC JV partners contributed the first instalment of $180 million for the clean-up by July 2018 and released the second instalment of $180 million in 2019. SPDC assigned a senior engineer with project management, contracting, and procurement experience to support and enhance the capability within the Hydrocarbon Pollution Remediation Project (HYPREP). In November 2018, HYPREP awarded contracts for the first set of remediation projects. In March 2019, 21 contractors started operations on 21 lots which add up to 12 of the 67 polluted sites recorded in the UNEP report. At the same time, medical outreach and livelihood programmes started. The process to select contractors to work on nine additional polluted sites was completed in January 2020. Although remediation works continue to progress, challenges remain. These include re-pollution, lack of contractor funding, land disputes and security issues in Ogoniland. The UNEP continues to monitor the success of the clean-up exercise via its observer status at both the Governing Council and the Ogoni
STRATEGIC REPORT SHELL FORM 20-F 2019 | 57 | |
Trust Fund. Its agencies such as UNDP, UNITAR and UNOPS provide services to HYPREP in the area of livelihood programmes, training and project services.
SEISMICITY
As oil and gas fields mature, seismic activity may increase in certain circumstances based on the unique geology of individual fields. For example, production from the onshore Groningen gas field in the Netherlands is in the process of being closed down due to earthquakes induced by the gas production. Some of these earthquakes have caused damage to houses and other structures in the region, resulting in complaints, claims and lawsuits from local house owners and residents. A range of actions have been taken to improve safety, liveability and economic prospects in the region. The gas field is operated by the Nederlandse Aardolie Maatschappij B.V. (NAM, Shell interest 50%). NAM is working with the Dutch government and other stakeholders to fulfil its obligations to residents of the area, which include compensation for damage caused by the earthquakes. (see "Upstream" on page 28).
ENVIRONMENTAL COSTS
We are subject to a variety of environmental laws, regulations and reporting requirements in the countries where we operate. Infringing any of these laws, regulations and requirements could harm our reputation and ability to do business, and result in significant costs, including clean-up costs, fines, sanctions and third-party claims.
Our ongoing operating expenses include the costs of avoiding unauthorised discharges into the air and water, and the safe disposal and handling of waste.
We place a premium on developing effective technologies that are also safe for the environment. However, when operating at the forefront of technology, there is always the possibility that a new technology has environmental impacts that were not assessed, foreseen or determined to be harmful when originally implemented. While we believe we take reasonable precautions to limit these risks, we are subject to additional remedial environmental and litigation costs as a result of our operations’ unknown and unforeseen impacts on the environment. Although these costs have so far not been material to us, no assurance can be given that this will always be the case.
SECURITY
Our operations expose us to criminality, civil unrest, activism, terrorism, cyber disruption and acts of war that could have a material adverse effect on our business (see “Risk factors” on pages 11-15). We seek to obtain the best possible information to enable us to assess threats and risks. This includes building strong and open relationships with government security agencies. Mitigation thereafter includes the strengthening of the security of sites, reduction of our exposure as appropriate, journey management, information risk management as well as crisis management and business continuity measures. We conduct training and awareness campaigns for staff, and provide travel advice and 24/7 assistance while travelling. The identities of our employees and contract staff and their access to our sites and activities, both physical and logistical, are consistently verified and controlled. We manage and exercise crisis response and management plans.
STRATEGIC REPORT SHELL FORM 20-F 2019 | 58 | |
Climate change and energy transition | |
Shell has long recognised that greenhouse gas (GHG) emissions from the use of fossil fuels are contributing to the warming of the climate system. In December 2015, 195 nations adopted the Paris Agreement. We welcomed the efforts made by governments to reach this global climate agreement, which came into force in November 2016. We fully support the Paris Agreement’s goal to keep the rise in global average temperature this century to well below two degrees Celsius (2°C) above pre-industrial levels and to pursue efforts to limit the temperature increase even further to 1.5°C. In pursuit of this goal, we also support the vision of a transition towards a net-zero emissions energy system. Shell agrees with the Intergovernmental Panel on Climate Change (IPCC) 1.5°C special report, which states that in order to limit warming to 1.5°C above pre-industrial levels, the world economy would need to transform in a number of complex and connected ways. Meeting this challenge would require an even more rapid escalation in the scale and pace of change in the coming decades than was foreseen in the Paris Agreement.
Society faces a dual challenge: how to transition to a low-carbon energy future to manage the risks of climate change, while also extending the economic and social benefits of energy to everyone on the planet. This is an ambition that requires, among other things, changes in the way energy is produced, stored, used and made accessible to more people while drastically cutting emissions.
We believe that the need to reduce GHG emissions will continue to be an important driver in transforming the energy system in this century. This transformation will generate both challenges and opportunities for our existing and future portfolio.
We welcome and support efforts, such as those led by the Task Force on Climate-related Financial Disclosures (TCFD), to increase transparency and to promote investors’ understanding of companies’ strategies to respond to the risks and opportunities presented by climate change. We believe that companies should be clear about how they plan to be resilient in the energy transition. In 2017, we joined the Oil and Gas Preparer Forum, initiated by the TCFD and convened by the World Business Council for Sustainable Development. The forum´s objectives are to review the current state of climate-related financial disclosures, to identify examples of effective disclosure practices and make proposals on how disclosures may evolve over time. These examples were summarised and published in a report, including reflections from investors, in 2018. The Shell Energy Transition Report (SET report), also published in 2018, described the energy transition and considered Shell’s resilience against future scenarios. The 2018 SET report followed our discussions with the TCFD about increasing transparency to help investors understand climate-related risks and opportunities. Our approach to the energy transition as described in the 2018 SET report, in combination with the Shell Sustainability Report (expected to be published in April 2020) and the Industry Associations Climate Review, aims to provide additional information to this Report in responding to TCFD recommendations, including discussing the energy transition and Shell´s portfolio resilience. In 2019, Shell publicly supported the EU Commission´s proposal for the EU to achieve net-zero emissions by 2050, the UK government´s target of net-zero emissions by 2050, and the Climate Accord in the Netherlands.
OUR GOVERNANCE AND MANAGEMENT OF CLIMATE CHANGE RISKS AND OPPORTUNITIES
Climate change and risks resulting from GHG emissions have been identified as a significant risk factor for Shell and are managed in accordance with other significant risks through the Board and Executive Committee. See “Other regulatory and statutory information” on pages 124-137.
Shell has a climate change risk management structure in place which is supported by standards, policies and controls.
This includes the work of the Board, which discussed a number of matters over the year including environmental topics and investments in new business areas in, for example, New Energies. In addition, some of the Non-executive Directors received dedicated updates from management and
external experts on the various business models, opportunities and risks of having positions along the power value chain, and the opportunities for Shell in the New Energies area. During the annual dedicated strategy meeting, the Board reviewed Shell´s Integrated Power strategy from first principles, set against the context of the energy transition and the external environment, and to see how power can create value for Shell.
The Board committees play an important role in assisting the Board with regard to governance and management of climate change risks and opportunities, as described in "Governance" on page 68.
The role of the Safety, Environment and Sustainability Committee (SESCo) (formerly the Corporate and Social Responsibility Committee (CSRC)) is to review and advise the Board on Shell’s strategy, policies and performance in the areas of safety, environment, ethics and reputation against the Shell General Business Principles, the Shell Code of Conduct, and the HSSE & SP Control Framework. During 2019, the Committee reviewed its purpose and updated its terms of reference to ensure it focuses on areas of most strategic importance to Shell. This resulted in a name change effective from December 2019. The SESCo´s duties comprise, for example, to review progress towards meeting Shell´s ambitions regarding climate change, the energy transition and its Net Carbon Footprint. The Committee also has a duty to advise the Remuneration Committee on metrics relating to sustainable development and energy transition. In 2019, the SESCo balanced its time between a number of topics, with discussion in depth including the energy transition and climate change, Shell´s Net Carbon Footprint ambition, and the Company´s environmental and societal licence to operate. The SESCo conducted one major site visit in Singapore, where the agenda included reviewing Shell´s developing New Energies businesses in the country. In 2020, the Committee's focus will be on safety, Shell's policies and commitments related to climate change, environmental performance - for example, in Nigeria and our Canada LNG project - and on specific issues such as plastics, methane, and nature-based solutions. We will continue to advise the Remuneration Committee on metrics concerning sustainability and energy transition.
The Remuneration Committee (REMCO) is responsible for determining the Directors’ Remuneration Policy in alignment with our business strategy. In 2019, following recommendations by SESCo, REMCO continued to include GHG intensity metrics in annual bonus performance measures and targets. In December 2018, Shell announced plans to link executive remuneration to short-term targets to reduce the Net Carbon Footprint of the energy products we sell, including our customers’ emissions from their use of our energy products. In 2019, following discussions with major shareholders and based on recommendations from SESCo, REMCO decided to add an energy transition condition to the 2019 Long-Term Incentive Plan (LTIP) award. This condition included our first three-year target aligned with the trajectory of our long-term Net Carbon Footprint ambition. It also featured other measures linked to our strategic ambitions, including the growth of Shell’s power business, the commercialisation of advanced biofuel technology, and the development of sinks to capture and store carbon. See “Directors’ Remuneration Report” on pages 98-123. The Shell employee scorecard structure for determining employees’ annual bonus in 2019 was consistent with the Executive Directors’ scorecard. The energy transition condition in the 2019 LTIP awards applies to around 150 Senior Executives as well as the Executive Directors. The energy transition condition was included again in the 2020 LTIP awards for Executive Directors and Senior Executives, and will be extended to approximately 16,500 employees across the Group who receive Performance Share Plan awards. For the 2020 award, the target range is a 3-4% reduction in NCF against the 2016 baseline NCF (79 grams of CO2 equivalent per megajoule). This target range is aligned with the trajectory of our NCF ambition as set out in November 2017. The targets for the other leading energy transition measures are commercially sensitive, and will be disclosed retrospectively. Annual updates on our progress in relation to measures will be provided.
The Audit Committee has key responsibilities in assisting the Board in fulfilling its oversight responsibilities in relation to areas such as the effectiveness of the system of risk management and internal control. Any concerns regarding improvement needed are promptly reported to the Board.
STRATEGIC REPORT SHELL FORM 20-F 2019 | 59 | |
The CEO is the most senior individual with accountability for climate change risk. We have set up several dedicated climate change and GHG-related forums at different levels of the organisation where climate change issues are addressed, monitored and reviewed. Each Shell entity and each Shell-operated venture are responsible for implementing climate change policies and strategies.
The Executive Vice President Safety & Environment, a senior manager who reports directly to the Projects & Technology Director, is accountable for the oversight of GHG issues. This manager´s department includes the dedicated Group Carbon team, which is accountable for monitoring and examining the strategic implications of climate change for Shell, and the impact of developments in governmental policy and regulation. The Group Carbon team is responsible for preparing proposed policy positions based on analysis within Shell and external input. The team also provides advice to Shell companies to ensure consistency in the application of our core principles and policy tasks in interactions with policymakers.
Group Carbon also has oversight of Shell’s GHG management programme and supports the different lines of business in embedding GHG management strategies. The team includes project managers who advise the projects on the risks and opportunities of GHG-related issues. Risk management at an asset or project level is a structured process of identifying and assessing risks; planning and implementing responses; and monitoring, improving and closing out action items that have an impact on projects´ and assets’ objectives and performance. Shell policy requires these projects to obtain approval on abatement plans and targets from the Executive Vice President Safety & Environment at defined project phases.
Reporting to the same manager is the HSSE & SP Assurance and Reporting team, which is accountable for the delivery of Shell’s non-financial reporting and for auditing the businesses´ performance against our HSSE & SP Control Framework requirements, which include climate change risk management. See “Environment and society” on page 55-58.
Further support for embedding GHG management is provided by a global risk support team for GHG and energy management. This team is a network of subject-matter experts in GHG topics working globally across our lines of business. Team members are experts in their relevant disciplines, defining improvement areas and sharing good practices and experience.
The above-mentioned teams and experts have provided their input to shape a set of mandatory manuals and complementary guidance documents which are ultimately based on our HSSE & SP Control Framework. These documents provide guidance on how to monitor, communicate and report changes in the risk environment, and how to review the effectiveness of actions taken to manage the identified risks, including ways to:
▪ | ensure consistent assessment of climate risk across Shell; |
▪ | clarify expectations for risk management and reporting, including roles and responsibilities; |
▪ | strengthen decision-making through better visibility and understanding of the climate risk by line of business; and |
▪ | enable integration of Shell’s reporting. |
For more detail on our definition of risk categories and their relationship to different time horizons, see page 62.

This structured approach supports the prioritisation of risks and opportunities. We actively monitor the GHG emissions of all our assets, as well as the lifecycle of our products, to quantify future regulatory costs related to GHG or other climate-related policies. This allows us to effectively prioritise areas of greater concern and assess mitigation options and the most viable responses. Climate-related risks are analysed in context of other identified material risks. See “Risk factors” on pages 11-15.
We review our portfolio annually to identify emerging risks from changing GHG regulatory regimes and physical conditions. As described in our Shell Energy Transition Report (2018), we tested the resilience of our portfolio against externally published future pathways, including a low-emissions pathway. In 2017, we announced a long-term ambition to reduce the Net Carbon Footprint of the energy products we sell, in step with society´s drive to reduce GHG emissions as it moves towards the goal of the Paris Agreement. We aim to reduce the Net Carbon Footprint of the energy products we sell - expressed in grams of CO2 equivalent per megajoule consumed - by around half by 2050, and as an interim step, by 2035, we aim for a reduction of around 20% compared with our 2016 level, both predicated on societal progress. This was followed by an announcement, in 2018, of our intention to set short-term targets in line with that ambition.
Meeting the Net Carbon Footprint ambition requires evolving our portfolio over the medium to longer term, to reduce the carbon intensity of the products that we sell. We plan for this by developing ideas about how we would like to shape our future portfolio to meet our ambition. These ideas then guide investment decisions. Within the selected portfolio mixes, we develop individual projects and aim to make them as resilient as possible to the future scenarios.
To assess the resilience of new projects, we consider the potential costs associated with operational GHG emissions. In 2018, to help us stay in step with society’s progress toward the goals of the Paris Agreement, we switched from using a flat project screening value (PSV) of $40/tonne of GHG emissions, to country-specific estimates of future carbon costs. By 2050, our carbon cost estimates for all countries increase to $85/tonne of GHG emissions. These estimates were developed using the current Nationally Determined Contributions (NDCs) submitted by countries as part
STRATEGIC REPORT SHELL FORM 20-F 2019 | 60 | |
of the Paris Agreement. They are the first NDCs under the Paris Agreement and are scheduled to be revised every five years. Therefore, as countries update their NDCs, we expect to update our estimates too. Accordingly, we believe they are a more accurate reflection of society’s current implementation of the Paris Agreement. The UN believes the current NDCs are consistent with limiting the average global temperature rise to around three degrees Celsius above pre-industrial levels. In coming decades, we expect countries to tighten these NDCs to meet the goals of the Paris Agreement. We further test the robustness of our high-emitting projects by using long-term carbon cost estimates that are consistent with limiting the average global temperature rise to well below two degrees Celsius.
Projects under development that are expected to have a material GHG footprint must meet carbon performance standards or industry benchmarks to allow them to compete and prosper in a more GHG-constrained future. These assessments can lead to projects being stopped, designs being changed, and potential GHG mitigation investments being identified, in preparation for when regulation would make these investments commercially compelling. Our approach continues to evolve with the shifting policy landscape and the differing pace of energy transitions in different regions.
While monitoring emerging climate change plans, we considered the robustness of our activities against a range of scenarios, as referenced in our 2018 SET report. We believe our business strategy is resilient to the implementation of the Paris Agreement, which is now progressing through countries developing their individual NDCs. The emissions from customers using Shell energy products are largely covered by these NDCs. The Paris Agreement acknowledges that emissions will continue and even grow in some parts of the world. It does not stipulate that emissions must fall in all sectors or countries simultaneously, or that all actors within the system will reduce their emissions at the same time or to the same degree. What is important is that overall emissions fall.
OUR PORTFOLIO AND CLIMATE CHANGE
We are seeking cost-effective ways to manage GHG emissions in line with our NCF ambition, and we intend to enable customers to make lower-carbon-intensity choices by bringing lower-carbon-intensity products to the market aligned with demand. We seek to contribute to reducing global GHG emissions in a number of ways:
▪ | supplying more natural gas to replace coal for power generation; |
▪ | developing carbon capture and storage (CCS); |
▪ | implementing energy-efficiency measures in our operations where reasonably practicable; |
▪ | developing new fuels for transport such as advanced biofuels and hydrogen; |
▪ | maintaining a focus on using natural gas and renewable electricity to generate power; and |
▪ | working with nature-based solutions. |
To support this, we continue to advocate the introduction of effective government-led carbon pricing mechanisms.
We are committed to reducing our GHG intensity, but with energy demand increasing and the number of easily accessible oil and gas reservoirs declining, we may develop resources that require more energy and advanced technologies to produce. If our production becomes more energy intensive, this could result in an associated increase in direct GHG emissions from our upstream facilities. We continue to invest in long-range research and carbon-abatement technologies to provide technical solutions to address these challenges.
Some governments have introduced carbon pricing mechanisms, which we believe can be an effective measure to reduce GHG emissions across the economy at lowest overall cost to society. We expect more governments to follow. However, we believe measures taken by governments to control national energy transitions may also have unintended consequences. For example, the prohibition of one technology may encourage other substitute technologies that result in an increase in overall GHG emissions.
See “Risk factors” on page 12.
NATURAL GAS
According to the IEA, more than 40% of global CO2 emissions in 2015 came from electricity and heat generation. For many countries, using gas instead of coal in power generation can make a large contribution, at lower cost, to meeting GHG emission reduction objectives. We expect that, in combination with renewables and the use of CCS, natural gas will be essential in significantly lowering GHG emissions. Natural gas made up more than half of Shell’s proved reserves at the end of 2019. As a leader in liquefied natural gas (LNG), and with our conventional gas assets and technologies for recovering gas from tight-rock formations, we can supply natural gas to replace coal for power generation. Natural gas can also act as a partner for intermittent renewable energy, such as solar and wind, to maintain a steady supply of electricity, because gas-fired plants can start and stop relatively quickly.
Methane is a potent greenhouse gas. When released into the atmosphere, it has a much higher global warming impact than CO2. Natural gas consists mainly of methane. Efforts to address climate change therefore require the industry to reduce both deliberate and unintended methane emissions from the gas value chain, from production to the final consumer.
The IEA estimates that natural gas operations have an average methane leakage rate of 1.7%. At this rate, natural gas emits between 45% and 55% less GHG emissions than coal when burnt at a power plant. Higher levels of methane emissions, however, would reduce this benefit, and we recognise the importance of assessing, and where possible, reducing methane emissions. Methane from the flaring and venting of gas (including equipment venting) in our upstream oil and gas operations was the largest contributor to our reported methane emissions in 2019. We are working to reduce methane emissions from these sources by reducing the overall level of flaring and venting. We also continue to implement leak detection and repair programmes across our sites to identify unintended losses and high-emission equipment, such as high-bleed pneumatic devices, so they can be replaced or repaired. We continue to work on confirming that we have identified all potential methane sources and that we have reported our emissions from these sources in line with regulations and industry standards. In 2017, we joined the Climate and Clean Air Coalition Oil & Gas Methane Partnership. It brings together industry, governments and non-governmental organisations to improve quantification of methane emissions globally and work towards reducing them. Also in 2017, Shell led the development of a set of non-binding Methane Guiding Principles for reducing methane emissions across the natural gas value chain. The principles focus on: continually reducing methane emissions; advancing strong performance across gas value chains; improving accuracy of methane emissions data; advocating sound policies and regulations on methane emissions; and increasing transparency. Shell has been involved in the development of all actions associated with the guiding principles, including the development of a major global outreach programme. The objective is to address a gap in knowledge on managing methane emissions, and thereby provide high-quality educational material and courses on methane science, methane reduction strategies and planning, measurement techniques, technology, policy, and where to get guidance and support. The publicly accessible programme consists of two courses: an executive course targeting senior managers and executives, and masterclasses for managers of frontline staff.
Shell is also a member of the Oil and Gas Climate Initiative (OGCI), a CEO-led effort to lead the industry’s response to climate change. One of OGCI’s focus areas is methane management. In 2018, OGCI announced a target to reduce the collective average methane intensity of its members’ aggregated upstream gas and oil operations by one fifth, to below 0.25% by 2025, with an ambition to achieve 0.2%, corresponding to a reduction of one third.
In 2018, Shell announced a target to maintain its methane emissions intensity below 0.2% by 2025. This target covers all Shell-operated Upstream and Integrated Gas oil and gas facilities. The baseline and target intensities are expressed as percentage figures, representing estimated methane emissions from Shell-operated gas and oil facilities as a percentage of the total amount of gas marketed, or the quantity of marketed oil and condensate where facilities have no marketed gas (e.g. those that re-inject produced gas). Methane emissions include those from unintentional leaks, venting and incomplete combustion, for example, in flares and turbines. In
STRATEGIC REPORT SHELL FORM 20-F 2019 | 61 | |
2019, our overall methane intensity was 0.08% for facilities with marketed gas and 0.01% for facilities without marketed gas. Intensities at facility level ranged from below 0.01% to 1.3%. We believe our methane emissions are calculated using the best methods currently available: a combination of industry standard emission factors (established emission rates per throughput or per piece of equipment), engineering calculations and some actual measurements. There are uncertainties associated with methane emissions quantification. To reduce these uncertainties, our Upstream and Integrated Gas businesses are rolling out methane improvement programmes to further enhance data quality and reporting, continue implementation of leak detection and repair programmes, and make use of methane abatement opportunities. By 2025, all Shell-operated facilities are expected to have implemented more robust quantification methodologies. Externally, we continue to work on new technologies and improved quantification methods through partnerships and several other initiatives.
Detailed information on our approach to managing methane emissions and performance is expected to be published in the Shell Sustainability Report in April 2020.
NEW ENERGIES
Our New Energies business explores emerging opportunities linked to the energy transition, and invests in those where we believe sufficient value is available. New Energies expects to invest on average $1-2 billion a year until 2020 in different services and products from a range of cleaner sources. We focus on new fuels for transport, such as advanced biofuels, hydrogen and charging for battery-electric vehicles; and power, including from low-carbon sources such as wind and solar as well as natural gas. Between 2021 and 2025, our investments in power could grow to $2-3 billion a year on average, if certain financial conditions are met. Alongside our work in new fuels and power, we are exploring how digital technologies can best support our activities and customers. See “Integrated Gas” on page 25.
New fuels
We invest in a range of low-carbon technologies and fuels, including biofuels, hydrogen and battery-electric vehicle charging. We believe that hydrogen has the potential to be an important low-carbon transport fuel. We are involved in several initiatives to encourage the adoption of hydrogen-electric energy. See “Integrated Gas” on page 25.
Biofuels
We believe that biofuels can play a valuable role in reducing CO2 emissions from the transport sector over the decades ahead.
In 2019, we used around 10.1 billion litres of biofuel in our gasoline and diesel blends worldwide to comply with applicable mandates and targets in the markets where we operate. Through our own long-established sustainability clauses in supply contracts, we request that the biofuels we buy are produced in a way that is environmentally and socially responsible throughout the production chain. Currently, most available biofuels are produced from cereals, vegetable oils and sugar cane. From cultivation to use, some biofuels can emit significantly less CO2 compared with conventional gasoline. But this depends on several factors, such as how the feedstock is cultivated and the way biofuels are produced. Other challenges include concerns over labour rights, the amount of water used in the production process, and the competing demands for land use between biofuels and food crops.
Over three-quarters of the biofuels we buy are from North American or European feedstock producers. In both regions, regulations for agricultural practices are in place, including considerations for sustainability.
We continue to support the adoption of international sustainability standards, including the Round Table on Responsible Soy (RTRS), the Roundtable for Sustainable Palm Oil (RSPO) and Bonsucro, an organisation for the certification of sugar cane. We also support the Roundtable for Sustainable Biomaterials and the International Sustainability and Carbon Certification (ISCC) scheme for feedstocks. We aim to increase the percentage of certified volumes against these robust multi-stakeholder standards.
Currently, more than 99% of our purchased volumes of biofuels are either covered by our supplier-agreed contract sustainability clauses or certified as
sustainable by an independent auditor. We aim to increase the percentage of certified volumes against robust multi-stakeholder standards.
Our Raízen joint venture (Shell interest 50%, not operated) in Brazil has produced low-carbon biofuel from sugar cane since 2011. Through our Raízen joint venture, we produce one of the lowest CO2 biofuels available today. Raízen produces approximately 2 billion litres of ethanol from sugar cane annually. Brazilian sugar-cane ethanol can reduce CO2 emissions by around 70% when compared with conventional gasoline, from cultivation of the sugar cane to using the ethanol as fuel.
In 2015, Raízen opened its first advanced biofuels plant at the Costa Pinto mill in Brazil. The technology was first developed from our funding of the Iogen Energy venture, which was subsequently transferred to Raízen. In 2019, the plant produced about 19.5 million litres of cellulosic ethanol from sugar-cane residues. It is expected to produce about 40 million litres a year once fully operational.
Outside Brazil, we continue to invest in new ways of producing biofuels from sustainable feedstocks, such as biofuels made from waste products or cellulosic biomass. In 2017, we completed construction of a demonstration plant at the Shell Technology Centre Bangalore, India. The plant demonstrates a technology called IH2® that turns waste feedstock into transport fuel. The plant can process around five tonnes per day of feedstock, such as agricultural waste, and aims to demonstrate the technology for possible scaling up and commercialisation.
We continue to look for opportunities to invest in third-party technologies and to collaborate in scaling these up for commercialisation. In February 2019, Shell became an equal equity partner in a commercial-scale waste-to-chemicals project called W2C Rotterdam - in partnership with Air Liquide, Enerkem, Nouryon and the Port of Rotterdam. The partners plan to build Europe’s first commercial-scale facility for producing chemicals and biofuels from waste materials which cannot otherwise be recycled. The facility in the Botlek area of the Port of Rotterdam in the Netherlands will use Enerkem’s proprietary technology.
Also in 2019, Shell signed an equity investment agreement with PRESPL, an Indian company specialising in biomass aggregation and processing for energy production.
In line with our strategy of developing more sustainable feedstocks for transport, we are also investing in renewable natural gas (RNG) for use in natural-gas-fuelled vehicles, in the USA and Europe. RNG is produced from biogas collected from landfill sites, or via anaerobic digestion of food waste or manure and then processed until it is fully interchangeable with conventional natural gas. The use of RNG in natural-gas vehicles, either in the form of compressed natural gas (CNG) or LNG, offers customers using these vehicles an attractive way of lowering their CO2 footprint.
In the USA, in May 2018, we acquired the JC Biomethane plant in Junction City, Oregon. We aim to start production after completing an expansion of the facility in 2020. This will increase the facility’s capacity to produce RNG.
Power
Power is the fastest-growing segment of the energy system. We expect that people and companies around the world will use more electricity to power transport and industry, instead of coal and oil, as part of the drive to lower carbon emissions. To help meet this demand, Shell aims to become an integrated power player and grow, over time, a material new business. We are working to deliver more electricity generated by renewable energy, from developing wind and solar projects to selling electricity generated by renewable sources. See “Integrated Gas” on page 25.
OUR STRATEGY ON CLIMATE CHANGE
Our strategy to assess and manage risks and opportunities resulting from climate change includes consideration of different time horizons and specific risks:
▪ | commercial risk: the potential for structural shifts in demand profiles for industry products; |
STRATEGIC REPORT SHELL FORM 20-F 2019 | 62 | |
▪ | regulatory risk: the potential for strengthening of existing and introduction of new regulations; |
▪ | physical risk: the potential impact on our facilities and the communities in which we operate due to changing physical conditions; and |
▪ | societal risk: the potential for a deteriorating relationship with the public, other companies, and governments in countries where Shell operates. |
This is how we describe the different time horizons and the relevance for the identification of risks and business planning:
▪ | Short term (up to three years): detailed financial projections are developed and used to manage performance and expectations on a three-year cycle. This three-year plan is shared with the Board; |
▪ | Medium term (three years up to around 10 years): the majority of production and earnings expected to be generated in this period come from our existing assets; and |
▪ | Long term (beyond around 10 years): for this period, it is expected for the current Shell portfolio to go through changes and evolution with the energy transition. Decision-making and risk identification on the thematic structure of the future portfolio are guided by the pace of progress of society and in step with society as it moves towards the goals of the Paris Agreement. |
Shell has a rigorous approach to understanding, managing and mitigating climate risks to its facilities. Shell also requires each business and function to monitor, communicate and report changes in the risk environment and the effectiveness of actions taken to manage identified risks on an ongoing basis. This is outlined in a toolkit for risk management including our Risk Management Manual and complementary guidance documents covering specific aspects such as climate risk. The potential, timing, and severity of the impact of the risks highlighted above are largely dependent on the geographical location and the asset type.
Each Shell business unit needs to consider the adequate management of climate-related risks in their portfolios. To ensure informed judgements are made, businesses´ senior managers present their current assessments of how likely climate risks are to happen, what their potential impact would be, and what is being done to mitigate the risk. Each risk is then categorised as either
adequately managed or needing improved mitigation and this aims to guide their ongoing operations and maintenance schedules and response planning. In some instances, Shell may also deploy a risk assessment approach which includes the work of a team of experts to analyse, for example, the physical impact of weather and climatic-related issues and the associated adaptation aspects.
We aim to reduce the GHG intensity of our portfolio and we continue to work on improving the energy efficiency of our existing operations. As discussed above, and as a better way to inform and drive our investment choices and adapt our business over time, in 2017, we announced our Net Carbon Footprint ambition. Our approach to calculating the Net Carbon Footprint covers emissions directly from Shell operations (including from the extraction, transportation and processing of raw materials, and transportation of products), those generated by third parties who supply energy to us for production, and our customers’ emissions from their use of our energy products. Also included are emissions from elements of this life cycle not owned by Shell, such as oil and gas processed by Shell but not produced by Shell, or from oil products and electricity marketed by Shell that have not been processed or generated at a Shell facility. The calculation also includes biofuels, as well as emissions that we offset by using CCS or natural carbon sinks, such as forests and wetlands. Chemicals and lubricants products, which are not used to produce energy, are excluded from the scope of this ambition.
When selecting our Net Carbon Footprint ambition, we have deliberately chosen a wide and meaningful frame against which to manage our performance. The emissions from our operations are important but those of our customers from their use of the energy products are much larger in proportion. More information on our Net Carbon Footprint ambition is available on our webpage.
The diagram below illustrates the scope of the Net Carbon Footprint calculation:
STRATEGIC REPORT SHELL FORM 20-F 2019 | 63 | |
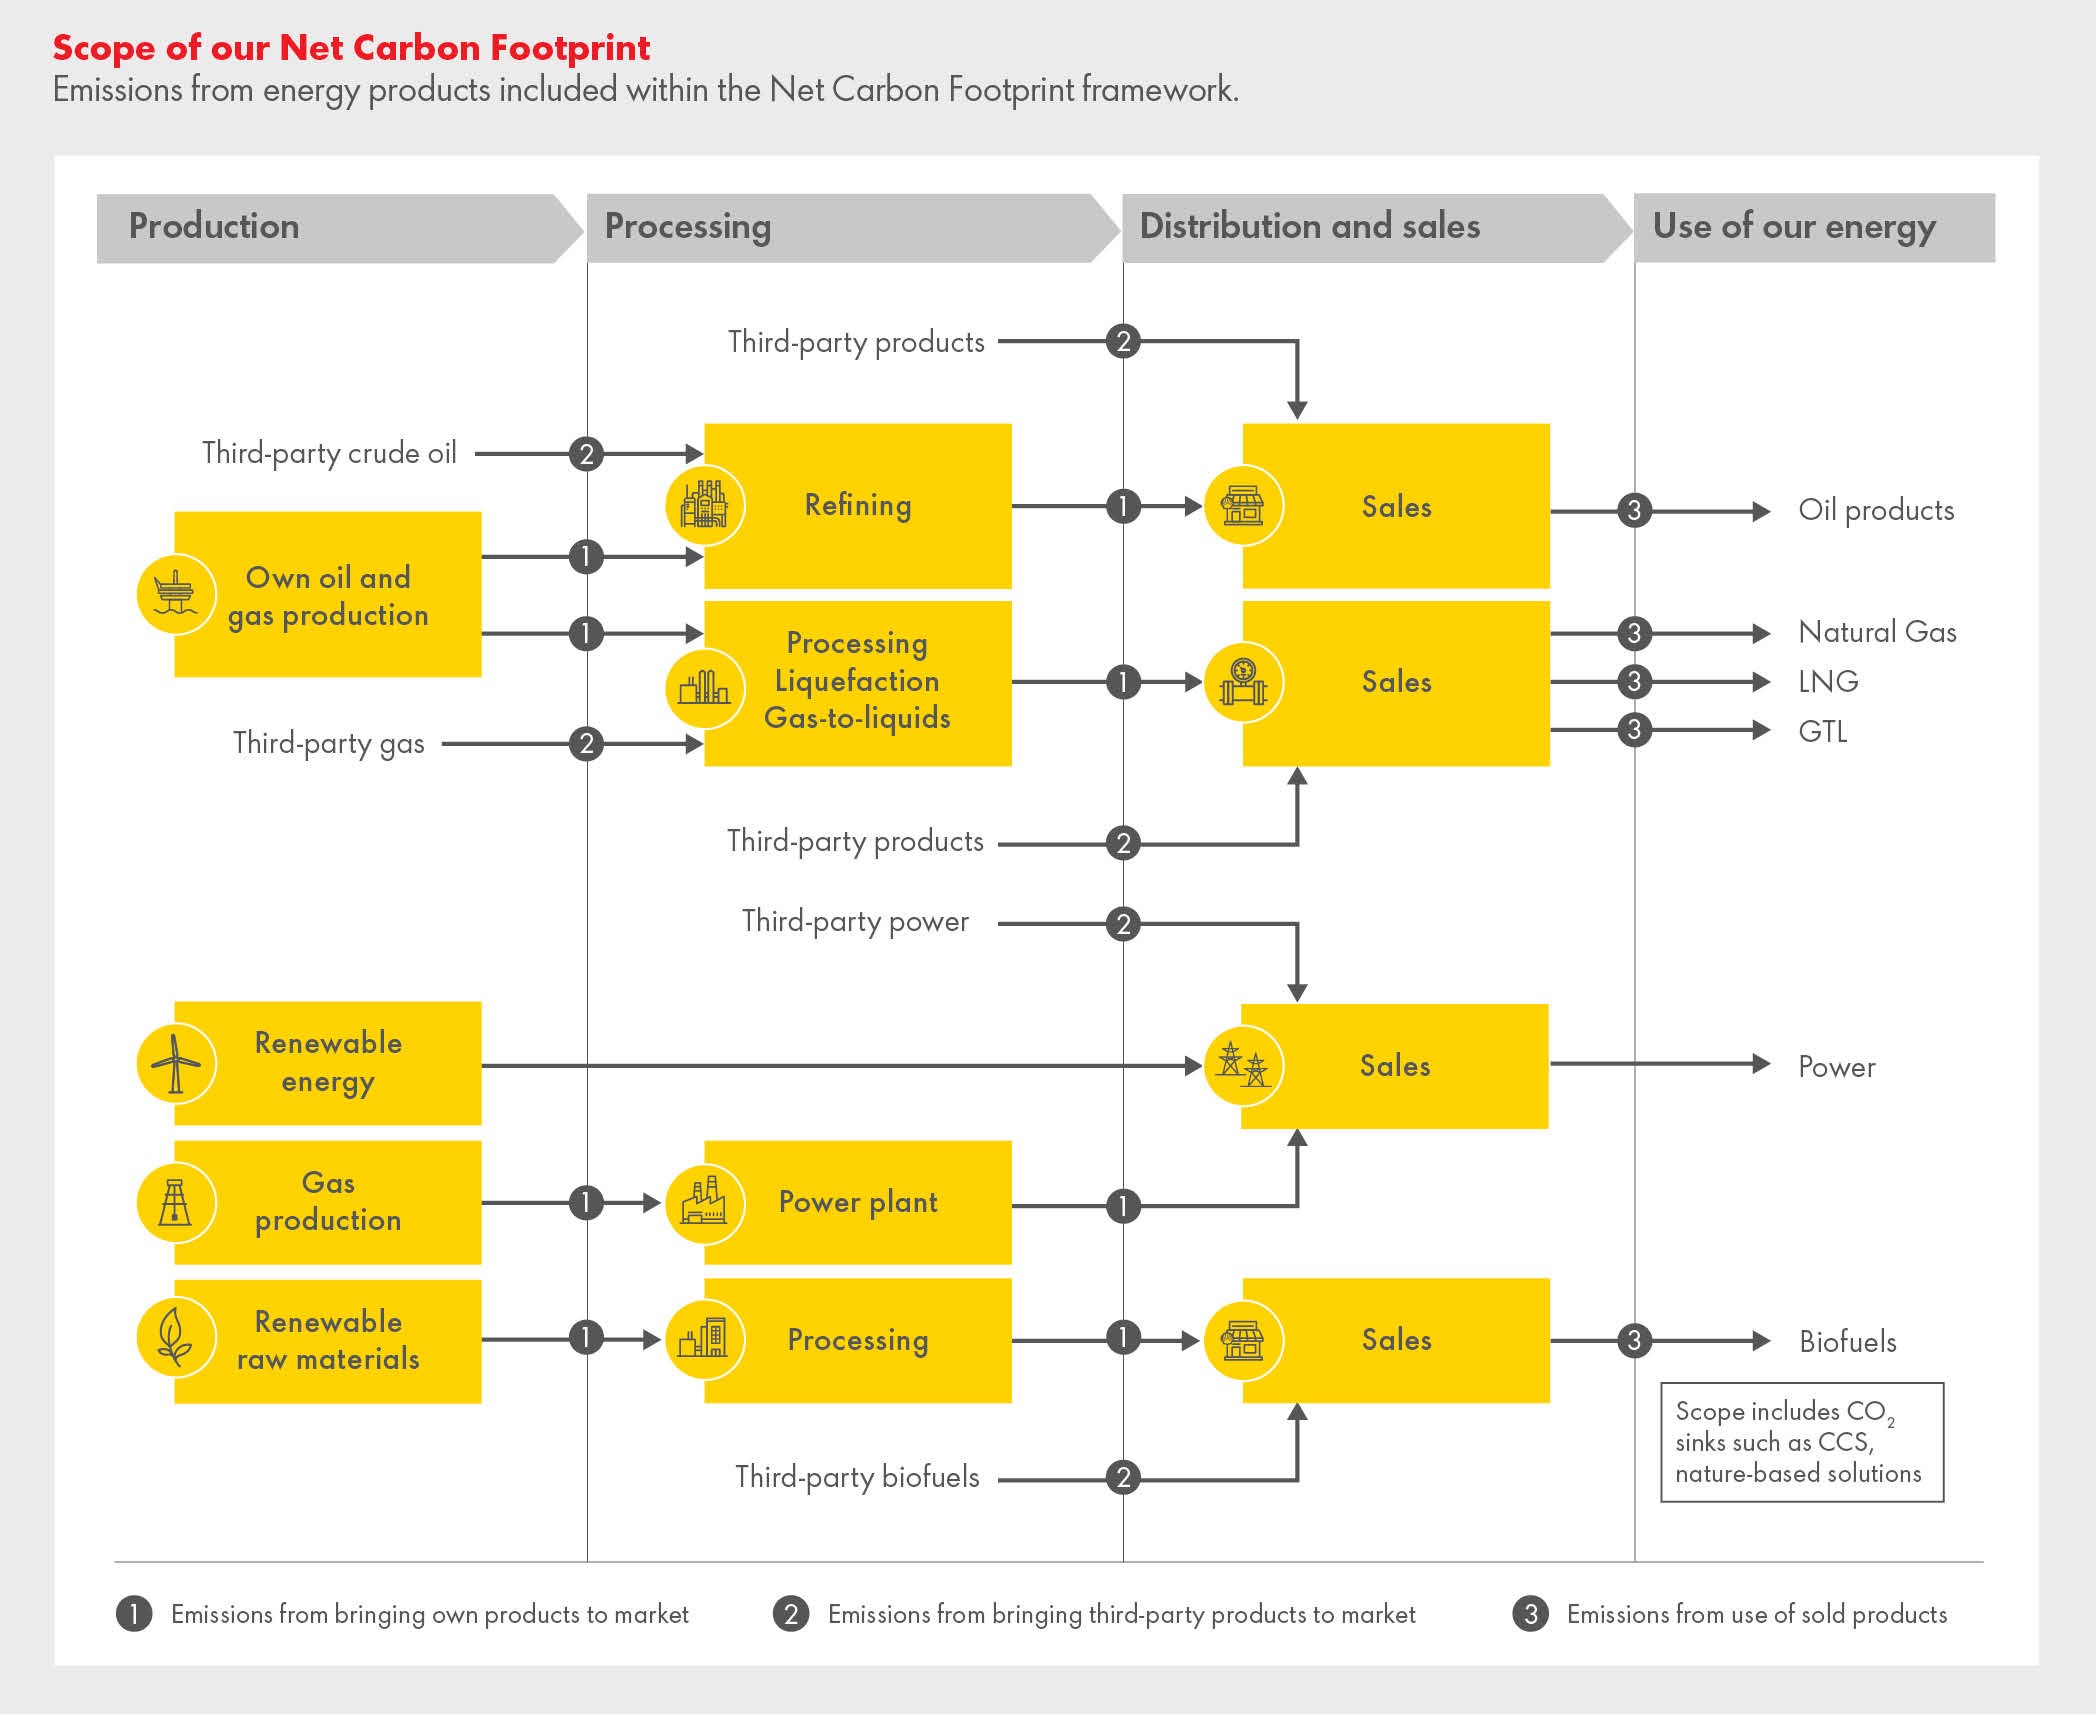
To meet the decarbonisation goals of the Paris Agreement, society needs an increasing supply of energy products that produce lower or zero GHG emissions over their full life cycle, to use those products more efficiently and to store emissions that cannot be avoided in sinks. Within this framework, our strategy is to keep increasing the share of such low-carbon energy products in our portfolio, while also developing carbon sinks. By broadening our focus to the full life-cycle emissions from the energy products that we sell to our customers, instead of solely on our operational emissions, we believe we will be better aligned with societal need and growing customer demand for more energy with lower life-cycle GHG emissions. Therefore, our strategy is to reduce our Net Carbon Footprint, mainly by increasing the proportion of lower-carbon products such as natural gas, biofuels, electricity and hydrogen in the mix of products we sell.
We will publish annual updates on our progress towards lowering the Net Carbon Footprint of our energy products. See the Shell Sustainability Report to be published in April 2020 for more information.
Our long-term ambition is to reduce the Net Carbon Footprint of our energy products to be in line with that of society as a whole by 2050. This is a stretching aspiration that aims to ensure that Shell continues to develop a resilient and relevant portfolio over the coming decades. While this is a long-term aspiration that will need periodic recalibration in line with the pace of change in broader society and the wider energy system, it is intended to help ensure that we remain relevant and are competitively positioned in the energy transition. This means supplying energy products and services that our customers need, now and in the future, and developing a resilient portfolio in line with our purpose of providing more and cleaner energy to society.
In the period to 2035, we believe that all forms of GHG reduction measures must be accelerated and increased in scale by society. Major improvements in energy efficiency and new sources of energy, such as renewables, combined with the use of cleaner fossil fuels, such as replacing coal with natural gas, are needed to meet the growing global population’s energy needs while reducing GHG emissions. In addition, the world will need significant growth in CCS and sustained improvements in efficiency. Massive reforestation is also needed to limit temperature rises to 1.5°C. The management of GHG emissions is increasingly important to our shareholders as concerns over climate change lead to tighter environmental regulations. Policies and regulations designed to limit the increase in global temperatures to well below 2°C could have a material adverse effect on Shell - through higher operating costs and reduced demand for some of our products. We actively monitor and assess these potential developments and believe we are best able to manage them when local policies provide a stable and predictable regulatory foundation for our future investments. At this stage, industry is still facing significant uncertainty about how local regulatory policies and consumer behaviour will shape the evolution of the energy system and which technologies and business models will thrive.
In December 2018, we announced our intention to set short-term Net Carbon Footprint targets. In early 2020, it was decided to set a Net Carbon Footprint target for 2022 of 3-4% lower than our 2016 Net Carbon Footprint of 79 grams of CO2 equivalent per megajoule. We have received third-party limited assurance on our Net Carbon Footprint for the years 2016 to 2019. For 2019, our Net Carbon Footprint was 78 grams of CO2 equivalent per megajoule. The reduction in our Net Carbon Footprint was due to an increase in sales of electricity in markets with declining grid carbon
STRATEGIC REPORT SHELL FORM 20-F 2019 | 64 | |
intensity, and growth in customer demand for carbon-neutral product offerings.
OUR PERFORMANCE
Data in this section are reported on a 100% basis in respect of activities where we are the operator. Reporting on this operational control basis differs from that applied for financial reporting purposes in the “Consolidated Financial Statements” on pages 142-189. Detailed data and information on our 2019 environmental and social performance is expected to be published in the Shell Sustainability Report in April 2020.
Our direct GHG emissions decreased from 71 million tonnes of CO2 equivalent in 2018 to 70 million tonnes of CO2 equivalent in 2019. The main contributors to this decrease were divestments (for example in Argentina, Canada, Norway, Iraq, Malaysia and the UK). The level of flaring in our Upstream and Integrated Gas businesses combined increased by around 15%, compared to 2018, primarily as a result of the start-up of our Prelude floating liquefied natural gas installation in Australia and higher levels of flaring in Nigeria, partially offset by our Majnoon divestment in Iraq (mid-2018).
In 2015, we signed up to the World Bank’s Zero Routine Flaring by 2030 initiative. This is an important initiative to ensure that all stakeholders, including governments and companies, work together to address routine flaring. Flaring, or burning off, of gas in our Upstream and Integrated Gas businesses contributed around 8% of our overall direct GHG emissions in 2019. Around 25% of this flaring took place at facilities where there was no infrastructure to capture the gas produced with oil, known as associated gas.
Around 35% of flaring in our Upstream and Integrated Gas facilities in 2019 took place in assets operated by The Shell Petroleum Development Company of Nigeria Limited (SPDC). Flaring from SPDC-operated facilities fell by around 20% between 2015 and 2019. Flaring intensity levels in SPDC in 2019 increased by around 10% compared to 2018. SPDC continues to make progress in close collaboration with its joint-venture partners and the Federal Government of Nigeria towards the objective of ending the continuous flaring of associated gas. Two new gas-gathering projects (Adibawa and Otumara) came on stream at the end of 2017, followed by two more (the Forcados Yokri Integrated Project and Southern Swamp Associated Gas Gathering Solutions) in 2019.
GHG emissions data are provided below in accordance with UK regulations. GHG emissions comprise CO2, methane, nitrous oxide, hydrofluorocarbons, perfluorocarbons, sulphur hexafluoride and nitrogen trifluoride. The data are calculated using locally regulated methods where they exist. Where there is no locally regulated method, the data are calculated using the 2009 API Compendium, which is the recognised industry standard under the GHG Protocol Corporate Accounting and Reporting Standard. There are inherent limitations to the accuracy of such data. Oil and gas industry guidelines (IPIECA/API/IOGP) indicate that a number of sources of uncertainty can contribute to the overall uncertainty of a corporate emissions inventory.
Greenhouse gas emissions | ||||
2019 | 2018 | |||
Emissions (million tonnes of CO2 equivalent) | ||||
Direct [A] | 70 | 71 | ||
Energy indirect [B] | 10 | 11 | ||
Intensity ratio (tonne/tonne) | ||||
All facilities [C] | 0.24 | 0.24 | ||
[A] Emissions from the combustion of fuel and the operation of facilities, calculated using global warming potentials from the IPCC’s Fourth Assessment Report.
[B] Emissions from the purchase of electricity, heat, steam and cooling for our own use, calculated using a market-based method as defined by the GHG Protocol Corporate Accounting and Reporting Standard.
[C] In tonnes of total direct and energy indirect GHG emissions per tonne of crude oil and feedstocks processed and petrochemicals produced in Downstream manufacturing, oil and gas available for sale, LNG and GTL production in Integrated Gas and Upstream. Additional information by segment will be published on our webpage.
Detailed information on our 2019 GHG emissions is expected to be published in the Shell Sustainability Report in April 2020 and on our webpage.
The statements in this “Climate change and energy transition” section, including those related to Net Carbon Footprint, are forward-looking statements based on management’s current expectations and certain material assumptions and, accordingly, involve risks and uncertainties that could cause actual results, performance or events to differ materially from those expressed or implied herein. See “About this Report” on pages 5-6 and “Risk factors” on pages 11-15.
STRATEGIC REPORT SHELL FORM 20-F 2019 | 65 | |
Our people | |
Performing competitively in the evolving energy landscape requires competent and empowered people working safely together across Shell. We recruit, train and recompense people according to a strategy that aims to organise our businesses effectively. Our people are essential to the successful delivery of the Shell strategy and to sustaining business performance over the long term. We accelerate development of our people; grow and strengthen our leadership capabilities; and enhance employee performance through strong engagement.
EMPLOYEE OVERVIEW
The employee numbers presented here are the full-time equivalent number of people employed by Shell on a full- or part-time basis, working in Shell subsidiaries, Shell-operated joint operations, seconded to non-Shell-operated joint operations, or joint ventures and associates.
At December 31, 2019, there were 83,000 employees in Shell and an additional 4,000 in certain New Energies and Downstream companies, compared with 81,000 at December 31, 2018, and 83,000 at December 31, 2017. The net increase in 2019 was driven by accelerated growth of the Information Technology hub in Bangalore, increased project activity in Projects & Technology, growth in Lubricants Asia, and growth in Customer Operations in Downstream Global Commercial. These changes were partly offset by reductions in Upstream and Integrated Gas which were driven by portfolio activities and our continued effort to improve operational efficiency and to reduce costs.
Further statements about employees in this section and data presented in the tables excludes the 4,000 employees in certain New Energies and Downstream companies. Table below shows actual number of employees by geographical area. Note 26 to the “Consolidated Financial Statements” on page 187 provides the average number of employees by business segment.
Actual number of employees by geographical area | Thousand | |||||||
2019 | 2018 | [A] | 2017 | [A] | ||||
Europe | 24 | 24 | 24 | |||||
Asia | 30 | 28 | 28 | |||||
Oceania | 2 | 2 | 2 | |||||
Africa | 4 | 4 | 5 | |||||
North America | 21 | 21 | 21 | |||||
South America | 2 | 2 | 3 | |||||
Total | 83 | 81 | 83 | |||||
[A] As revised, numbers have been changed from average number to actual number to align with current year definition. These numbers exclude the 4,000 employees in certain New Energies and Downstream companies.
In 2019, a total of 373,000 formal training days were provided for employees and joint-venture partners, compared with 315,000 in 2018. We continue to invest in people and capabilities, and in our continued focus on safety and personal development.
EMPLOYEE COMMUNICATION AND INVOLVEMENT
We strive to maintain a healthy employee and industrial relations environment in which dialogue between management and our employees - both directly and, where appropriate, through employee representative bodies - is embedded in our work practices. On a regular basis, management engages with our employees through a range of formal and informal channels, including all-staff messages from the Chief Executive Officer, webcasts, townhalls, team meetings, face-to-face gatherings, breakfast briefings, interviews with senior management and online publications via our intranet.
We promote safe reporting of views about our processes and practices. In addition to local channels, the Shell Global Helpline enables our people and third parties to report potential breaches of the Shell General Business Principles and Shell Code of Conduct, confidentially and anonymously, in a
variety of languages. In 2018, there were 1,584 reported cases via the Shell Global Helpline: 1,232 allegations and 352 inquiries. In 2019, there were 1,686 reported cases via the Shell Global Helpline: 1,278 allegations and 408 inquiries. Shell Internal Audit (SIA) is the custodian of the Shell Global Helpline process in Shell, which is managed by an independent third party. SIA is accountable for ensuring that the Shell Global Helpline functions as intended and that all allegations of Code of Conduct breaches (including bribery and corruption) are investigated and followed up appropriately. The Board has formally delegated the responsibility for reviewing the functioning of the Shell Global Helpline, and the reports arising from its operation, to the Audit Committee. The Audit Committee is also authorised to establish and monitor the implementation of procedures for the receipt, retention, proportionate and independent investigation and follow-up action of reported matters.
CODE OF CONDUCT
In line with the UN Global Compact Principle 10 (Businesses should work against corruption in all its forms, including extortion and bribery), we maintain a global anti-bribery and corruption/anti-money laundering (ABC/AML) programme designed to prevent or detect, and remediate and learn from, potential violations. The programme is underpinned by our commitment to prohibit bribery, money laundering and tax evasion, and to conduct business in line with our Shell General Business Principles and Code of Conduct.
We do not tolerate the direct or indirect offer, payment, solicitation or acceptance of bribes in any form. Facilitation payments are also bribes and are prohibited. The Shell Code of Conduct includes specific guidance for Shell staff (which comprises employees and contract staff) on requirements to avoid or declare actual, potential or perceived conflicts of interest, and on offering or accepting gifts and hospitality.
Supporting the Code of Conduct, we have mandatory risk-based procedures and controls that address a range of compliance risks and ensure we focus resources, reporting and attention appropriately. By making a commitment to our core values - honesty, integrity and respect - and following the Code of Conduct, we protect Shell’s reputation.
In 2019, we continued mandatory ethical leadership workshops for senior executives across our global operations, to reinforce and explore the level of commitment to ethics and compliance expected of leaders at this level. The workshops focus on values, behaviours, business pressures and leadership practices. The workshops are part of our wider work to cultivate a strong corporate culture where impeccable ethics are a matter of personal pride for every employee, rather than only a compliance issue.
As part of our commitment to ethics and compliance, we ensure that our policies, standards and procedures are communicated to Shell employees and contract staff and, where necessary and appropriate, to agents and business partners. Particular areas of focus with third parties include our due diligence procedures, and clearly articulated requirements (for example, through the use of standard contract clauses). In addition, we publish our Ethics and Compliance Manual on shell.com to demonstrate our commitment in this area.
The Shell Ethics and Compliance Office assists the businesses and functions with the ABC/AML and other programme implementation, and monitors and reports on progress. Legal counsel provides legal advice globally and supports the programme’s implementation. The Shell Ethics and Compliance Office regularly reviews and revises all ethics and compliance programmes to ensure they remain up to date with applicable laws, regulations and best practices. This includes incorporating results from relevant internal audits, reviews and investigations as well as periodically commissioning external reviews.
We have a duty to investigate all good faith allegations of breaches of the Code of Conduct, however they are raised. We are committed to ensuring all such incidents are investigated by specialists in accordance with our Investigation Principles. Violation of the Code of Conduct or its policies can
STRATEGIC REPORT SHELL FORM 20-F 2019 | 66 | |
result in disciplinary action, up to and including contract termination or dismissal. In some cases, we may report a violation to the relevant authorities, which could lead to legal action, fines or imprisonment.
EMPLOYEE SHARE PLANS
We have a number of share plans designed to align employees’ interests with our performance through share ownership. For information on the share-based compensation plans for Executive Directors, see the “Directors’ Remuneration Report” on pages 98-101.
PERFORMANCE SHARE PLAN, LONG-TERM INCENTIVE PLAN AND EXCHANGED AWARDS UNDER THE BG LONG-TERM INCENTIVE PLAN
Under the PSP, 50% of the award is linked to certain indicators described in “Performance indicators” on pages 20-21, averaged over the performance period. From 2017 to 2019, 12.5% of the award is linked to free cash flow (FCF) and the remaining 37.5% is linked to a comparative performance condition which involves a comparison with four of our main competitors over the performance period, based on three performance measures. Under the LTIP, awards made in 2017 and 2018, 25% of the award is linked to the FCF measure and the remaining 75% is linked to the comparative performance conditions mentioned above. From 2019 onwards, 22.5% of the award is linked to the FCF measure and 10% is linked to an energy transition measure. The remaining 67.5% is linked to the comparative performance condition mentioned above.
Separately, following the BG acquisition, certain employee share awards made in 2015 under BG’s Long-Term Incentive Plan were automatically exchanged for equivalent awards over shares in the Company. The outstanding awards take the form of either conditional awards or nil-cost options.
Under all plans, all shares that vest are increased by an amount equal to the notional dividends accrued on those shares during the period from the award date to the vesting date. In certain circumstances, awards may be adjusted before delivery or reclaimed after delivery. None of the awards result in beneficial ownership until the shares vest.
See Note 21 to the “Consolidated Financial Statements” on page 182.
RESTRICTED SHARE PLAN
Under the Restricted Share Plan, awards are made on a highly selective basis to senior staff. Shares are awarded subject to a three-year retention period. All shares that vest are increased by an amount equal to the notional dividends accrued on those shares during the period from the award date to the vesting date. In certain circumstances, awards may be adjusted before delivery or reclaimed after delivery.
GLOBAL EMPLOYEE SHARE PURCHASE PLAN
Eligible employees in participating countries may participate in the Global Employee Share Purchase Plan. This plan enables them to make contributions from net pay towards the purchase of the Company’s shares at a 15% discount to the market price, either at the start or at the end of an annual cycle, whichever date offers the lower market price.
UK SHELL ALL EMPLOYEE SHARE OWNERSHIP PLAN
Eligible employees of participating Shell companies in the UK may participate in the Shell All Employee Share Ownership Plan, under which monthly contributions from gross pay are made towards the purchase of the Company’s shares. For every six shares purchased by the employee, one matching share is provided at no cost to the employee.
UK SHARESAVE SCHEME
Eligible employees of participating Shell companies in the UK have been able to participate in the UK Sharesave Scheme. Options have been granted over the Company’s shares at market value on the invitation date. These options are normally exercisable after completion of a three-year or five-year contractual savings period. From 2017 no further grants were made under this plan.
Separately, following the acquisition of BG, certain participants in the BG Sharesave Scheme chose to roll over their outstanding BG share options into
options over the Company’s shares. The BG option price (at a discount of 20% to market value) was converted into an equivalent Company option price at a ratio agreed with Her Majesty’s Revenue and Customs. These options are normally exercisable after completion of a three-year contractual savings period.
STRATEGIC REPORT SHELL FORM 20-F 2019 | 67 | |
Governance
The Board of Royal Dutch Shell plc | |
CHARLES O. HOLLIDAY
Chair
Tenure
Chair - 4 years and 9 months (appointed Chair May 19, 2015)
On Board - 9 years and 6 months (appointed September 1, 2010)
(see page 75 for further information)
Board Committee membership
Chair of the Nomination and Succession Committee
Outside interests/commitments
Presiding Director of HCA Holdings, Inc. Director of Deere & Company. Member of the Critical Resource’s Senior Advisory Panel. Member of the Royal Academy of Engineering (UK).
Age
72
Nationality
US citizen
Career
Charles (Chad) Holliday was appointed Chair of the Board of Royal Dutch Shell plc with effect from May 19, 2015.
He was Chief Executive Officer of DuPont from 1998 to 2009, and Chairman from 1999 to 2009. He joined DuPont in 1970 after receiving a BS in industrial engineering from the University of Tennessee and held various manufacturing and business assignments, including a six-year Tokyo-based posting as President of DuPont Asia/Pacific.
He has previously served as Chairman of the Bank of America Corporation, The Business Council, Catalyst, the National Academy of Engineering, the Society of Chemical Industry (American Section) and the World Business Council for Sustainable Development. He is a founding member of the International Business Council.
Relevant skills and experience
Chad has a distinguished track record as an international businessman. He was originally appointed to the Board as a Non-executive Director in September 2010 and, prior to his May 2015 appointment as Chair of the Board, served as Chair of the Safety, Environment and Sustainability Committee and Member of the Remuneration Committee.
He has a deep understanding of international strategic, commercial and environmental issues, and gained extensive experience in the areas of safety and risk management during his time with DuPont. In his role as Chair, Chad is committed to developing and maintaining a strong dialogue with investors and other key stakeholders and ensures that their views are considered during Board discussions and decision-making. He has also demonstrated a strong commitment to ensuring that the highest standards of corporate governance, safety, ethics and compliance are maintained. Chad is a particularly avid advocate of greater diversity, which is reflected in the Board’s current diversity mix and increased diversity goals across the Shell Group.
Chad’s performance was evaluated by the other Directors, led by Gerard Kleisterlee, Deputy Chair and Senior Independent Director, in 2019. More information on the external board evaluation process can be found on pages 75-76
GERARD KLEISTERLEE
Deputy Chair and Senior Independent Director
Tenure
9 years and 4 months (appointed November 1 2010). On January 29, 2020, the Board announced that Gerard Kleisterlee would not be seeking re-election at the 2020 Annual General Meeting.
Board Committee membership
Chair of the Remuneration Committee and member of the Nomination and Succession Committee
Outside interests/commitments
Chairman of Vodafone Group plc, Chairman of the Supervisory Board of ASML Holding N.V.
Age
73
Nationality
Dutch
Career
Gerard was President/Chief Executive Officer and Chairman of the Board of Management of Koninklijke Philips N.V. from 2001 to 2011. Having joined Philips in 1974, he held several positions before being appointed as Chief Executive Officer of Philips’ Components division in 1999 and Executive Vice President of Philips in 2000.
He was a member of the Board of Directors of Dell Inc. from 2010 to 2013 and a member of the Supervisory Board of Daimler AG from 2009 to 2014. From 2014 to 2016, he was a Non-executive Director of IBEX Global Solutions plc.
Relevant skills and experience
Gerard is a Dutch businessman with a distinguished career with one of the largest electronics companies in the world. Through a variety of senior roles, he was responsible for operations in places such as China, Europe, Hong Kong, Taiwan. Gerard is also currently Chair of Vodafone, one of the UK’s largest global companies, which provides services to more than 500 million customers.
Gerard’s business experience provides him with a broad and deep understanding of the geopolitical, strategic and commercial challenges faced by an evolving business. His experience - gained at Philips, Dell and Vodafone, businesses that have seen significant changes in technology and consumer behaviour - has been a great asset to the Board as Shell transitions to a lower-carbon energy system.
Gerard is a skilled leader, making him ideally suited to his position as our Senior Independent Director, Deputy Chair and Chair of our Remuneration Committee. He raises the bar on the level of Board debate, with his insightful, concise and direct questions.
BEN VAN BEURDEN
Chief Executive Officer
Tenure
6 years and 2 months (appointed January 1, 2014)
Board Committee membership
N/A
Outside interests/commitments
No external appointments
Age
61
GOVERNANCE SHELL FORM 20-F 2019 | 68 | |
Nationality
Dutch
Career
Ben was Downstream Director from January to September 2013. Before that, he was Executive Vice President Chemicals from 2006 to 2012. In this period, he also served on the boards of a number of leading industry associations, including the International Council of Chemicals Associations and the European Chemical Industry Council. Prior to this, he held a number of operational and commercial roles in both Upstream and Downstream, including Vice President Manufacturing Excellence. He joined Shell in 1983, after graduating with a master’s degree in chemical engineering from Delft University of Technology, the Netherlands.
Relevant skills and experience
Ben has more than 35 years of Shell experience and has built a deep industry understanding and proven management experience across the technical and commercial roles which he has undertaken over his career.
Since 2016, Ben has led Shell to deliver strong financial results, total shareholder returns and earnings per share. He also led Shell through ending the scrip dividend and the start of a $25 billion share buyback programme. Under his leadership Shell New Energies has been established and Shell has announced industry-leading initiatives in response to the global challenge of the energy transition to a lower-carbon future, including the introduction of Shell’s Net Carbon Footprint ambition. Shell is now at the forefront of a cross-industry push to reduce the greenhouse gas impact of natural gas with the Methane Guiding Principles.
Ben led the Company through the acquisition and integration of BG Group, executed an impressive reshaping of our portfolio and completed a divestment programme of $30 billion of non-core assets, making the Shell Group simpler.
JESSICA UHL
Chief Financial Officer
Tenure
3 years (appointed March 9, 2017)
Board Committee membership
N/A
Outside interests/commitments
No external appointments
Age
52
Nationality
US citizen
Career
Jessica was Executive Vice President Finance for the Integrated Gas business from January 2016 to March 2017. Previously, she was Executive Vice President Finance for Upstream Americas from 2014 to 2015, Vice President Finance for Upstream Americas Unconventionals from 2013 to 2014, Vice President Controller for Upstream and Projects & Technology from 2010 to 2012, Vice President Finance for the global Lubricants business from 2009 to 2010, and Head of External Reporting from 2007 to 2009. She joined Shell in 2004 in finance and business development, supporting the Renewables business.
Prior to joining Shell, Jessica worked for Enron in the USA and Panama from 1997 to 2003 and for Citibank in San Francisco, USA, from 1990 to 1996. She obtained a BA from UC Berkeley in 1989 and an MBA at INSEAD in 1997.
Relevant skills and experience
Jessica is a highly regarded executive with a track record of delivering key business objectives, from cost leadership in complex operations to mergers
and acquisitions delivery. Jessica’s extensive experience combines an external perspective with more than 15 years of Shell experience: she has held finance leadership roles in Europe and the USA, in Shell’s Upstream, Integrated Gas and Downstream businesses, as well as in Projects & Technology and Corporate.
Jessica’s tenure as CFO has also been impressive. She was appointed not long after the BG acquisition, when Shell’s debt, gearing and development costs were high and when the oil price was still recovering from the lower levels in 2016.
In these challenging conditions, but with great enthusiasm, clarity and discipline, Jessica has overseen Shell’s delivery of industry-leading cash flow from operating activities (for the 14th consecutive quarter at the end of 2019) and shareholder distributions ($25bn in 2019). Jessica has also been a leading force for transparency in the energy industry, including on taxes and climate change. Under her tenure, Shell has continued to expand and enhance disclosures related to climate change in line with the Task Force on Climate-Related Financial Disclosures principles. Most recently, under her guidance, Shell published the Tax Contribution Report, which includes country-by-country report data, a standard set by the Organisation for Economic Co-operation and Development (OECD).
NEIL CARSON OBE
Independent Non-executive Director
Tenure
9 months (appointed June 1, 2019)
Board Committee membership
Member of the Safety, Environment and Sustainability Committee and member of the Remuneration Committee [A]
Outside interests /commitments
Non-executive Chairman of Oxford Instruments plc and TT Electronics plc [B]
Age
62
Nationality
British
Career
Neil is a former FTSE 100 chief executive. After completing an engineering degree, Neil joined Johnston Matthey in 1980 where he held several senior management positions in both the UK and the US, before being appointed Chief Executive Officer in 2004. Since retiring from Johnston Matthey in 2014, Neil has focused his time on his non-executive roles.
Relevant skills and experience
Neil is highly experienced, has a broad industrial outlook and a highly commercial approach with a practical perspective on businesses. He brings a track record of strong operational exposure, familiarity with capital-intensive business and a first-class international perspective on driving value in complex environments. Neil was awarded an OBE for services to the chemical industry in 2016. Neil has leveraged upon his current and past experience in non-executive positions and, despite being new to the Shell Board, he has already made significant contributions to Board discussions. He has also provided valuable insight based on his former executive position and operational experience.
[A]: On January 29, 2020, the Board appointed Neil Carson as Chair of the Remuneration Committee with effect from May 20, 2020. Neil has been a member of this Committee since June 1, 2019 and has previously served on a Remuneration Committee before joining the Shell Board.
[B] On December 9, 2019 TTE plc announced Neil’s intention to step down as Non-executive Director and Chair of TTE plc, once his successor has been found.
GOVERNANCE SHELL FORM 20-F 2019 | 69 | |
ANN GODBEHERE
Independent Non-executive Director
Tenure
1 year and 9 months (appointed May 23, 2018)
Board Committee membership
Chair of the Audit Committee
Outside interests/commitments
Fellow of the Institute of Chartered Professional Accountants and a Fellow of the Certified General Accountants Association of Canada.
Age
64
Nationality
Canadian and British
Career
Ann started her career with Sun Life of Canada in 1976 in Montreal, Canada, and joined M&G Group in 1981, where she served as Senior Vice President and Controller for life and health, and property and casualty businesses throughout North America. She joined Swiss Re in 1996, after it acquired the M&G Group, and served as Chief Financial Officer from 2003 to 2007. From 2008 to 2009, she was interim Chief Financial Officer and an Executive Director of Northern Rock bank in the initial period following its nationalisation.
Ann has also held several non-executive director positions at Prudential plc, British American Tobacco plc, UBS AG, and UBS Group AG. Most recently, and until May 2019, Ann served as a Non-executive Director of Rio Tinto plc and Rio Tinto Limited. She was also Senior Independent Director of Rio Tinto plc.
Relevant skills and experience
Ann is a former CFO, a Fellow at the Institute of Chartered Professional Accountants, and has more than 25 years of experience in the financial services sector. She has worked her entire career in international business and has lived in or served on boards in nine countries. Ann makes significant contributions and adds exceptional value by bringing both her extensive experience and a new perspective to Board discussions.
Ann's long international business career brings with it an invaluable global perspective and understanding, which is reflected in the insights and constructive challenges she brings to the boardroom. Ann was appointed Chair of the Audit Committee on July 1, 2019, and has made significant contributions in this role. Her highly relevant skills, particularly in investment appraisal and financial risk management, have been a welcome addition to our Board and Audit Committee.
EULEEN GOH
Independent Non-executive Director
Tenure
5 years and 6 months (appointed September 1, 2014)
Board Committee membership
Member of the Nomination and Succession Committee [A]
Outside interests/commitments
Chairman of SATS Ltd. Non-executive Director of DBS Bank Ltd and DBS Group Holdings Limited. Trustee of the Singapore Institute of International Affairs Endowment Fund. Chairman of the Governing Council of the Singapore Institute of Management and Non-executive Director of Singapore Health Services Pte Ltd, both of which are not-for-profit organisations.
Age
64
Nationality
Singaporean
Career
Euleen is an Associate of the Institute of Chartered Accountants in England and Wales, a Fellow of the Singapore Institute of Chartered Accountants and has professional qualifications in banking and taxation. She has held various senior management positions within Standard Chartered Bank and was Chief Executive Officer of Standard Chartered Bank, Singapore, from 2001 until 2006.
She has also held non-executive appointments on various boards including Aviva plc, MediaCorp Pte Ltd, Singapore Airlines Ltd, Singapore Exchange Ltd, Standard Chartered Bank Malaysia Berhad, Standard Chartered Bank Thai plc, CapitaLand Ltd and Temasek Trustees Pte Ltd. She was previously Non-executive Chairman of the Singapore International Foundation, and Chairman of International Enterprise Singapore and the Accounting Standards Council, Singapore. She is also a fellow of the Singapore Institute of Directors.
Relevant skills and experience
Euleen’s current roles as Chair of the Board of Directors of various international companies provide significant experience in the area of strategy development and international businesses. She is a champion of diversity and constructively challenges the Board and management to continue to progress in this area.
Based in Singapore and as Chair of the Risk Committee of the largest bank in south-east Asia, Euleen is close to key emerging/growth markets for our business. Euleen’s risk management expertise has elevated the Board’s deep deliberations around risk governance. Her extensive travel around the world, through her various executive and non-executive roles, has equipped her with broad geopolitical insight and significant knowledge of operating in the Asian region.
Euleen uses her financial acumen to pose probing and insightful questions, both in and beyond the boardroom. This contributes to well-rounded and incisive Board discussions.
[A] On January 29, 2020, the Board appointed Euleen Goh as Deputy Chair and Senior Independent Director with effect from May 20, 2020.
CATHERINE J. HUGHES
Independent Non-executive Director
Tenure
2 years and 9 months (appointed June 1, 2017)
Board Committee membership
Member of the Safety, Environment and Sustainabiltiy Committee and member of the Remuneration Committee
Outside interests/commitments
Non-executive Director of SNC-Lavalin Group Inc.
Age
57
Nationality
Canadian and French
Career
Catherine was Executive Vice President International at Nexen Inc., from January 2012 until her retirement in April 2013, where she was responsible for all oil and gas activities including exploration, production, development and project activities outside Canada. She joined Nexen in 2009 as Vice President Operational Services, Technology and Human Resources.
Prior to joining Nexen Inc., she was Vice President Oil Sands at Husky Oil from 2007 to 2009 and Vice President Exploration & Production Services, from 2005 to 2007. She started her career with Schlumberger in 1986 and held key positions in various countries, including France, Italy, Nigeria, the UK and the USA, and was President of Schlumberger Canada Ltd for five years. She was a Non-executive Director of Statoil from 2013 to 2015.
GOVERNANCE SHELL FORM 20-F 2019 | 70 | |
Relevant skills and experience
Catherine contributes her industry knowledge and ease of engagement with other Directors and managers in the boardroom. With her 30 years of oil and gas sector experience, she brings a geopolitical outlook and deep understanding of the industry. An engineer by training, she has also spent a significant part of her career working in senior human resources roles. The Board highly regards her perspectives on our industry and our most important asset, our people.
Catherine has a strong track record of executing operational discipline with a focus on performance metrics and a continual drive for excellence. Her knowledge of the technology underpinning oil and gas operations, logistics, procurement and supply chains benefits the Board greatly as it considers various projects and investment or divestment proposals.
She also uses her industry knowledge - combined with her commitment to the highest standards of corporate governance and safety, ethics and compliance - in her membership of our Safety, Environment and Sustainability Committee, while using her human resources experience in her membership of the Remuneration Committee.
ROBERTO SETUBAL
Independent Non-executive Director
Tenure
2 years and 5 months(appointed October 1, 2017). On March 11, 2020, the Board announced that Roberto Setubal would not be seeking re-election at the 2020 Annual General Meeting.
Board Committee membership
Member of the Audit Committee
Outside interests/commitments
Member of the board of the International Monetary Conference (IMC), the Economic and Social Development Council of the Presidency of Brazil, and the International Business Council of the World Economic Forum. He is also President of the Fundação Itaú Social and a member of the Executive Committee of the Instituto Itaú Cultural.
Age
65
Nationality
Brazilian
Career
Roberto was Chief Executive Officer and Vice Chairman of the Board of Directors of Itaú Unibanco Holding S.A. in Sao Paulo, Brazil, until April 2017. At that time, he retired as Chief Executive Officer and currently serves as Co-Chairman of the Board of Directors. Following a brief period with Citibank in New York, he joined Banco Itaú in 1984 where he held a variety of senior roles in investment banking, consumer credit operations and retail banking before being appointed Chief Executive Officer in 1994. After the merger of Banco Itaú and Unibanco, he was appointed to the position of President and Chief Executive Officer of Itaú Unibanco Holding S.A. Previously, he was a Non-executive Director of Petrobas S.A., President of the IMC and Vice-Chairman of the Institute of International Finance.
Relevant skills and experience
Roberto brings significant experience in capital markets and financial services to the Board and has a deep understanding of international strategic management, commercial operations and risk management. He was instrumental in designing and then executing a strategy that led to Itaú becoming the largest bank in Brazil
His deep financial knowledge enables him to make robust, demanding and constructive challenges to our investment considerations and helps to ensure that projects are aligned with our strategic intent.
Despite spending most of his life in Brazil, Roberto has a strong understanding of global business. Naturally, he also brings an invaluable perspective and insight into operating in his native country, a key growth market for Shell. His contributions also demonstrate his strong advocacy for
the highest standards of corporate governance, ethics and compliance. This, combined with his experience of operating in challenging markets, helps to deepen the Board’s analyses of difficult matters with multi-faceted risks.
SIR NIGEL SHEINWALD GCMG
Independent Non-executive Director
Tenure
7 years and 8 months (appointed July 1, 2012)
Board Committee membership
Chair of the Safety, Environment and Sustainability Committee and member of the Remuneration Committee
Outside interests/commitments
Non-executive Director of Invesco Limited and Raytheon UK. Senior Adviser to Tanium Inc. and to the Universal Music Group. Visiting Professor and Council Member of King’s College, London.
Age
66
Nationality
British
Career
Sir Nigel was a senior British diplomat who served as British Ambassador to the USA from 2007 to 2012, before retiring from the Diplomatic Service. Prior to this, he served as Foreign Policy and Defence Adviser to the Prime Minister and as British Ambassador and Permanent Representative to the European Union in Brussels. He joined the Diplomatic Service in 1976 and served in Brussels, Moscow, Washington and in a wide range of policy roles in London. Since 2012, he has taken on a number of international business roles, and has supported organisations involved in higher education and international affairs.
Relevant skills and experience
Sir Nigel’s distinguished track record including three of the most senior international roles in British public service has given him broad geopolitical and public policy experience, as well as knowledge of regulatory issues, communications and stakeholder management. He has a global and strategic outlook which enables him to identify emerging issues that could present geopolitical or reputational challenges.
Sir Nigel brings a unique government policy perspective to our strategic discussions particularly on topics such as the energy transition, that are strongly influenced by the views of governments and a complex range of interested parties. His many contributions to the Board on this and other strategic and operational topics often reflect the interconnections between geopolitics, business and external stakeholder engagement.
He is used to operating in challenging environments and is committed to active external engagement. This, and his understanding of public policy and regulatory issues through his career in government service and membership of think tank and university boards, makes him well suited to the role of Chair of our Safety, Environment and Sustainability Committee.
LINDA G. STUNTZ
Independent Non-executive Director
Tenure
8 years and 9 months (appointed June 1, 2011). On January 29, 2020, the Board announced that Linda G. Stuntz would not be seeking re-election at the 2020 Annual General Meeting.
Board Committee membership
Member of the Safety, Environment and Sustainability Committee and member of the Nomination and Succession Committee
Outside interests/commitments
Director of Edison International.
Age
65
GOVERNANCE SHELL FORM 20-F 2019 | 71 | |
Nationality
US citizen
Career
Linda retired from her position as founding partner of the law firm of Stuntz, Davis & Staffier, P.C. in January 2019. She was a member of the US Secretary of Energy Advisory Board from 2015 to 2017. She chaired the Electricity Advisory Council of the US Department of Energy from 2008 to 2009. Linda was a member of the board of Directors of Schlumberger Ltd from 1993 to 2010 and of Raytheon Company from 2004 to 2015.
From 1989 to 1993, she held senior policy positions at the US Department of Energy, including Deputy Secretary.
Relevant skills and experience
Linda’s Harvard legal training and deep practical legal experience bring unique and valuable expertise in energy-industry and environmental law, as well as extensive public policy experience, to our Board. This is conveyed through her in-depth knowledge of the gas and power industries and her work on issues related to climate change and energy-related measures to minimise greenhouse gas emissions.
As a board director of publicly traded companies for more than 25 years, Linda has provided strategic and legal advice to many energy companies and has substantial experience in overseeing and working with businesses with operations around the world. She has a broad understanding of technology and its development/commercialisation within our industry, from her work with the US government and on the Schlumberger board. She has significant knowledge and understanding of cyber risks as a result of her Raytheon and Edison International board service.
Linda’s unique background, coupled with her exceptional ability to frame clear questions that tackle the key points of complex issues, helps deepen the Board’s constructive challenges and considerations of critical industry-related matters, particularly those related to the energy transition.
GERRIT ZALM
Independent Non-executive Director
Tenure
7 years and 2 months (appointed January 1, 2013)
Board Committee membership
Member of the Audit Committee and member of the Remuneration Committee
Outside interests/commitments
Director of Moody’s Corporation inc and Danske Bank A/S
Age
67
Nationality
Dutch
Career
Gerrit was an adviser to PricewaterhouseCoopers during 2007, Chairman of the Trustees of the International Accounting Standards Board from 2007 to 2010, and an adviser to Permira from 2007 to 2008. He was Chief Economist of DSB Bank from July 2007 to January 2008, Chief Financial Officer from January 2008 to December 2008, and Chairman of the Managing Board of ABN AMRO Bank N.V. from 2010 to 2016. He was Minister of Finance of the Netherlands, twice, from 1994 to 2002 and from 2003 to 2007. In between, he was Chairman of the parliamentary party of the VVD.
Prior to 1994, he was head of the Netherlands Bureau for Economic Policy Analysis, a professor at Vrije Universiteit Amsterdam, and held various positions at the Ministry of Finance and the Ministry of Economic Affairs. He studied general economics at the Vrije Universiteit Amsterdam, from where he also received an honorary doctorate in economics.
Relevant skills and experience
An economist by background, Gerrit’s distinguished 12 year service as the Minister of Finance to the Netherlands, coupled with his experience gained from his time with ABN AMRO Bank, brings a deep and valuable understanding of Dutch politics and financial markets to the Board. His international financial management expertise and strategic development experience also benefits the Audit Committee.
A highly regarded and seasoned leader in both the public and private spheres, his significant experience in analysing financial commitments from a wider public stakeholder and a global business standpoint serves the Board well, particularly when considering investment proposals. Gerrit consistently and concisely articulates the logic and reasoning behind his views, benefiting the Board and management. His questions often trigger other analytical questions from fellow Directors, which serves to deepen and widen Board discussions.
In addition to that provided above, the following individuals will be proposed to shareholders at the 2020 AGM, to be appointed as Non-executive Directors of the Company. Andrew Mackenzie, previously CEO of BHP Group plc; Dick Boer, previously President and Chief Executive Officer of Ahold Delhaize and Martina Hund-Mejean, previously Chief Finance Officer of Mastercard Inc.
LINDA M. COULTER
Company Secretary
Tenure
3 years and 2 months (appointed January 1, 2017)
Age
52
Nationality
US citizen
Career
Linda was General Counsel of the Upstream Americas business and Head of Legal US, based in the USA, from 2014 to 2016. Previously, she was Group Chief Ethics & Compliance Officer based in the Netherlands from 2011 to 2014. Since joining Shell in 1995, she has also held a variety of legal positions in the Shell Oil Company in the USA, including Chemicals Legal Managing Counsel and other senior roles in employment, litigation, and commercial practice.
Relevant skills and experience
Linda is our Company Secretary and plays an important role as Shell’s General Counsel Corporate, overseeing corporate legal teams in Belgium, Canada, the Netherlands, Switzerland, the UK and the USA.
The various legal roles Linda has undertaken at our headquarters, and in supporting both the Upstream and Downstream businesses, have provided her with a strong understanding of our global operations and people. Her experience of engaging with the Board in previous roles, coupled with her broad understanding and engagement across Shell’s businesses and functions, helps to ensure that the right matters come to the Board at the right time.
GOVERNANCE SHELL FORM 20-F 2019 | 72 | |

GOVERNANCE SHELL FORM 20-F 2019 | 73 | |
Senior Management | |
The Senior Management of the Company comprises the Executive Directors, Ben van Beurden and Jessica Uhl, and those listed below. All are members of the Executive Committee (see “Directors' report” on page 79).
HARRY BREKELMANS
Projects & Technology Director
Tenure
5 years and 5 months (appointed October 2014)
Age
54
Nationality
Dutch
Career
Harry was previously Executive Vice President for Upstream International Operated based in the Netherlands. He joined Shell in 1990 and has held various management positions in Exploration and Production, Internal Audit, and Group Strategy and Planning. From 2011 to 2013, he was Country Chair Russia and Executive Vice President for Russia and the Caspian region.
RONAN CASSIDY
Chief Human Resources & Corporate Officer
Tenure
4 years and 2 months (appointed January 2016)
Age
53
Nationality
British
Career
Ronan was previously Executive Vice President Human Resources, Upstream International. He joined Shell in 1988 and has held various human resources positions in Upstream and Downstream.
DONNY CHING
Legal Director
Tenure
6 years and 1 month (appointed February 2014)
Age
55
Nationality
Malaysian
Career
Donny was previously General Counsel for Projects & Technology based in the Netherlands. He joined Shell in 1988 based in Australia and then moved to Hong Kong and later to London. In 2008, he was appointed Head of Legal at Shell Singapore, having served as Associate General Counsel for Gas & Power in Asia-Pacific.
WAEL SAWAN
Upstream Director
Tenure
7 months (appointed July 2019)
Age
45
Nationality
Lebanese and Canadian
Career
On July 1, 2019, Wael succeeded Andy Brown as Upstream Director and was appointed to the Executive Committee.
Wael was previously the Executive Vice President, Deep Water and a member of the Upstream Leadership Team. He joined Shell in 1997 and has worked in a variety of roles in each of Shell’s core business units: Upstream, Integrated Gas and Downstream.
HUIBERT VIGEVENO
Downstream Director
Tenure
2 months (appointed January 2020)
Age
50
Nationality
Dutch
Career
On January 1, 2020, Huibert succeeded John Abbott as Downstream Director and was appointed to the Executive Committee.
Huibert was previously Executive Vice President Global Commercial. He joined Shell in 1995 and led many Downstream businesses across Shell in Europe, Africa, North and South America, and Asia. This included acting as Executive Chairman of Shell in China, and in 2016 leading the integration of BG Group.
MAARTEN WETSELAAR
Integrated Gas and New Energies Director
Tenure
4 years and 2 months (appointed January 2016)
Age
51
Nationality
Dutch
Career
Maarten was previously Executive Vice President of Integrated Gas based in Singapore. He joined Shell in 1995 and has held various financial, commercial and general management roles in Downstream, Trading and Upstream.
GOVERNANCE SHELL FORM 20-F 2019 | 74 | |
Introduction from the Chair | |

CHAD HOLLIDAY
Chair
As reflected in the reported results, 2019 was not an easy year for the sector in which we operate. The year provided a tough macroenvironment, lower Liquified Natural Gas (LNG) and gas prices, as well as weaker realised refining and chemicals margins. As we look forward, we see continued risk from the difficult-to-predict outcomes of the trade conflicts in some regions, uncertainties within Europe over post-Brexit arrangements, the slowdown and vulnerability of some markets and regional geopolitical tensions. However, we also see robust economic growth in some regions and stronger than expected cyclical recoveries.
Society is also changing, which we welcome, accelerating its perspective on what companies should be doing, increasing the pressure and encouraging us to rise to the challenges ahead as the world moves to an environment supported by lower-carbon energy products. Shell agrees with the importance attached by its stakeholders to the issue of climate change and Shell’s future success depends on effectively navigating the risks, opportunities and uncertainties presented by the energy transition. All businesses, governments, and even individuals must work together and have a role to play in shifting demand away from carbon-intensive resources. However, oil and gas will not only be needed by some parts of society for many decades to come, they are key cash generators that support our investment through the energy transition and underpin delivering our ambitions aligned to the goals of the Paris Agreement while providing a world-class investment case to Shell’s investors.
BOARD LEADERSHIP AND SHELL’S PURPOSE
The UK Corporate Goverance Code (the “Code”) provides that the Board should promote the long-term sustainable success of Shell, generating value for shareholders and contributing to wider society. The Board believes that Shell’s efforts give it an effective framework to play its part in the energy transition as a growing, successful, commercial organisation. In the Board’s view, this framework will allow Shell to provide the energy solutions that consumers will want and buy through this period of uncertain change. The Board also thinks that Shell will be able to reduce the carbon intensity of the energy products it supplies.
The key themes of the Code are used in this Report to form the framework for articulating our narrative and we have sought to provide a genuine understanding of how governance supports and protects the business and our stakeholders.
The impact of the Code on Shell’s existing governance processes and reporting practices, as well as certain implementation recommendations, were reviewed and considered by the Nomination and Succession Committee, at the end of 2018 and over the course of 2019. Its findings were then discussed and agreed with the Board. Overall, it was considered that while Shell was already applying the principles and the spirit of the Code, the Board recognises that enhanced reporting in this area could help
make this clearer for stakeholders. The Board’s approach to certain provisions (as explained in further detail below) is considered appropriate, when taking into account circumstances based on a range of factors that are particular to Shell, including its global nature, size, complexity and history. To provide greater insight into our current governance practices, we have highlighted some provisions on page 77, signpost where more information can be found in the Report and, where possible, explain how we see our practices evolving over time.
The importance of stakeholder engagement has received greater external focus in recent years. Given the nature of our business, engagement is considered key to our operations and has been a key focus for some time. How and why we engage with our stakeholders is also provided on page 83. The Board’s discharge of its duty in relation to key stakeholder interests, including those of our workforce, and an explanation of how it considered these when making principal decisions is set out on page 83 in the Strategic Report. Additionally, on page 81, we provide information on our Board activities and highlight which stakeholders we considered during our discussions. We have also enhanced our reporting on our workforce engagement methods. We believe that constructive relationships built on mutual respect and transparency help Shell attract and retain employees while supporting greater productivity and operational efficiency. Ensuring that the employee voice is heard in the boardroom in practical ways is key to understanding the broader impact of business decisions including with respect to company culture.
The Board clearly recognises the importance of culture and its link to delivering Shell’s purpose and strategy. Given our culture's importance it requires long-term commitment. The Board believes that our people and safety culture is strong, something we take pride in. Moreover, our culture reflects the values of the business - honesty, integrity and respect for people - which underpin all the work we do and are embedded within our Strategy and Purpose.
DIVISION OF RESPONSIBILITIES
How the Board and its Committees support the business operations is provided on page 79 with more detail within the Terms of Reference for each Committee, which are provided on our website. Each year the Board Committees’ Terms of Reference are reviewed and updated, as required. This year we have also changed the name of our Corporate Social Responsibility Committee to the Safety, Environment and Sustainability Committee (SESCo), reflecting the Committee’s focus on safety and environmental matters, including climate change and sustainability. The updates have been made in consideration of external developments.
The importance of independent judgement on the Board is a fundamental governance principle and one supported by the Board. The Code provides circumstances that it considers are likely to impair, or could appear to impair, a Non-executive Director’s independence, and tenure is one of these. At the time of the 2020 Annual General Meeting (AGM), Gerard Kleisterlee, Senior Independent Director, will reach a tenure of nine years since his appointment to the Board by shareholders. However, as he was appointed to the Board by the Directors some seven months ahead of his first election by shareholders, his independence for the period of October 2019 to the 2020 AGM requires deeper evaluation under a new Code provision. Within our statement of compliance with the Code on page 89 we provide the questions the Board considered when testing Gerard’s independence.
COMPOSITION, SUCCESSION AND EVALUATION
The Director biographies in this Report provide insight into our Directors’ careers, skills and experience. Further, our Board diversity reporting extends past gender and nationality, and outlines the varying sector experience across the Board.
At the 2019 AGM , Neil Carson was elected to the Board by shareholders. An overview of his induction programme is provided on page 81. At the end of the 2020 AGM, both Gerard Kleisterlee, Senior Independent Director, and Linda Stuntz, Independent Non-executive Director, will retire from the
GOVERNANCE SHELL FORM 20-F 2019 | 75 | |
Board after nine years of service. They both leave strong leadership track records, and the Board is deeply grateful for their many years of dedicated commitment to the business. As we announced on January 29, 2020, Euleen Goh will become Deputy Chair and Senior Independent Director when Gerard retires and Neil Carson will become Chair of our Remuneration Committee.
The Board completed its annual performance evaluation in December 2019, which was facilitated externally. The process again proved to be a valuable exercise, generating reflective discussions and planned actions. The process was led by me and undertaken by Independent Board Evaluation. On pages 81-82 we have sought to provide insight into the process, the outcome and some of the areas we plan to enhance.
One of the Code provisions introduces a recommended nine-year limit to the tenure of the Board Chair. As this is a provision directly relating to me, our Senior Independent Director, Gerard Kleisterlee, provides an explanation on page 77 of how the Board considered this provision and when the Board proposes that my tenure concludes.
AUDIT, RISK MANAGEMENT AND INTERNAL CONTROL
The Audit Committee assists the Board in maintaining a sound system of risk management and internal control and oversight over Shell’s financial reporting. A variety of standing matters and more specific topics are discussed by the Audit Committee throughout the year. As part of the year-end reporting process, the Audit Committee advises the Board on the adequacy of the system of risk management and internal control in place, the appropriateness of the viability statement and going concern basis of accounting. The Audit Committee also advises on whether this Report, taken as a whole, is fair, balanced and understandable and provides the information necessary for stakeholders to assess Shell’s position and performance, business model and strategy. More information on the Audit Committee’s activities, highlights and priorities can be found in its report on page 91.
REMUNERATION
In 2020, shareholders will vote on our revised Directors’ Remuneration Policy. Under the new Policy, we have focused on simplifying remuneration structures to improve clarity and transparency while maintaining the existing connection with our business strategy. In keeping with recent governance developments and societal views, we are placing increasing emphasis on the discretionary management of pay to ensure reward outcomes are appropriate. We will also be asking shareholders to vote on the energy transition metric which links reward with our ambitions to reduce our Net Carbon Footprint. Further information can be found on page 108.
Finally, we hope that this new format of document provides a clearer format for our reporting and enhances the understanding of our governance processes for our stakeholders. I would also again like to thank my fellow Directors, my colleagues and our workforce around the world for their continued and considerable efforts to the success of the Company.
CHAD HOLLIDAY
Chair
March 11, 2020
CHANGES TO OUR REPORTING
To assist with providing stakeholders greater insight into Board operations and the governance activities that support the business, we have chosen to split the UK-governed Annual Report from the US-governed Form 20-F. The key strategic messages continue to be provided within both documents. We are now at the start of a journey with the Annual Report and are seeking to adopt a practical approach that is more responsive to the requests of our readers. To avoid duplication, and excessive cross referencing, the Directors’ Report now spans the governance section of this report from paides the necessary governance assurances and confirmations, and focuses on the factors that we believe will be of most interest to readers and important to the long-term prospects of Shell.
As society changes we are committed to changing the business to support it and, with this, become more transparent in our operations and the information that we share, especially when working to earn and maintain trust. Building on our disclosures from 2019, such as our Industry
Associations Report, the enhancement of our quarterly
financial disclosures and our Tax Contribution Report (available on the Shell website), we have also sought to share more information in this Report on Shell’s ways of working and how the Board operates.
GOVERNANCE SHELL FORM 20-F 2019 | 76 | |
Statement of compliance with the UK Corporate Governance Code | |
The Board confirms that, throughout the year, the Company has applied the Principles, both in spirit and in form, and complied with the provisions set out in the UK Corporate Governance Code issued by the Financial Reporting Council (FRC) in July 2018 and (”the Code”). A copy of the Code can be found on the FRC’s website: www.frc.org.uk.
Shell’s governance arrangements have been considered alongside the Code and the information set out in the Directors’ Report, including the Board Committee Reports on (pages 88-97) is intended to provide an explanation of how the Principles of the Code were applied practically throughout the year. We have also chosen to provide information below where we believe stakeholders may benefit from a more specific explanation on particular Code provisions.
Chair Tenure (Provision 19)
Note: The text relating to Chair tenure is provided by Gerard Kleisterlee, Senior Independent Director.
Charles O. Holliday (Chad) was appointed as Chair in 2015 after four and a half years on the Board as a Non-executive Director. In September 2019, he reached a tenure of more than nine years.
The provisions of the Code address Chair tenure and provide a limit of nine years from the date of first appointment to the Board. However, the Code pragmatically acknowledges that this period can be extended for a limited time to facilitate orderly, effective succession planning and the development of a diverse board. In the 2018 Annual Report and Form 20-F we highlighted that Chad's tenure had been discussed in numerous shareholder engagements and it was disclosed that shareholders were supportive of the extension of his tenure to the 2021 AGM. This meets the Code’s limited exception, particularly as the Chair was an existing Non-executive Director on appointment. The Board also takes comfort from the support for Chad’s re-election at the 2019 AGM (96% votes in favour) and ongoing support from shareholders.
The Board continues to believe that retaining Chad on the Board and in the position of Chair until the 2021 AGM is right for the business. The Board is confident that this facilitates more-effective phasing of his succession. As stated last year, and agreed by shareholders, an earlier departure would be disruptive and could leave a significant deficiency in Shell’s corporate knowledge when taking into account the forthcoming departures of other long-serving Directors: both myself and Linda Stuntz.
The Board believes that Chad remains an effective Chair, which was strongly recognised in the independent evaluation of the Board. Although the Board will continue to assess his objectivity, the Board is assured that Chad will continue to exercise objective judgment, despite his tenure surpassing nine years. The Board finds that the continuity of his corporate knowledge and experience is essential to complement and support the new skills and experience of its Director appointments of the last few years, as well as those that we will need to make in the coming year.
Chad’s innate understanding and knowledge of the Shell Group, coupled with the strong Shell relationships he has established, are appreciated and highly valued by the Board. His skills enable him to effectively challenge management and coach other, particularly new Non-executive Directors on the intricacies and nuances of the business, thereby better equipping them to effectively challenge management and enhance overall governance. The Board has also achieved increased diversity under Chad’s leadership as Chair. Chad's leadership of the Board though 2021 is critical to the Board's effective succession planning through the short term.
Director Independence (Provision 10)
As referenced in the Chair’s statement, Gerard Kleisterlee has served on the Board for more than nine years, having joined in November 2010. The Board acknowledges the potential impairment of his independence owing to his length of tenure, as outlined in a Code provision. In the Board’s view, there has been no notable negative change in Gerard’s performance as a Director and in his various Board roles in recent years. The Board continues to regard him as an independent Non-executive Director and undertook a
rigorous evaluation to reach this conclusion. Gerard did not participate in his own assessment.
The result of this assessment was positive and given that Gerard’s independence is only questioned by one of the seven parameters outlined in the Code, the Board has determined that he remains independent. The Directors have also observed that Gerard continues to be independent of mind and will. He regularly leverages his deep understanding and knowledge of the Shell Group and insightful perspectives based on his corporate memory, coupled with his external background and knowledge to enrich Board discussions while also providing objective judgement and effective challenge to management and the wider Board. Gerard’s fellow Directors have also noted, during the evaluation, that he uses his skills and experience to assist the Chair in driving productive discussions and offers considered advice based on objective judgement. The continuity of his Board tenure, corporate knowledge and experience has complemented and supported the skills and experience of relatively newer director appointments over the years, including those of the Chief Executive and Chief Financial Officers.
ASSESSING DIRECTOR INDEPENDENCE
The following questions were used to assess Gerard's independence:
• | Was the Director’s re-election supported at the last AGM? Did the level of support, or communication from investors ahead of the AGM indicate concern about the Director’s independence? |
• | Have the conferred interests of other Directors or management unduly influenced behaviour or approach to decision-making? |
• | How has any potential influence - as a result of familiarity amongst Directors and between Directors and management who have served together for more than the nine years - been avoided? |
• | How proactive is the Director? Have they stood themselves apart from, or avoided, any potential influence when making decisions? |
• | Where good working relationships with fellow Directors and management have been developed, are these strictly professional and limited to work-related matters only? Are there any known situations where they have attended the same events in a non-Shell- related capacity and in what context? |
• | Has the Director previously been involved in the industry in which the Company operates? Is there a network of contacts that could reduce the ability to be objective or contaminate their views? |
• | Are the views and opinions of Directors and management challenged appropriately and at what frequency? |
• | Have there been circumstances when the Board is reaching consensus, but the Director has not been afraid to speak up or offer an alternative view? |
• | Are boardroom behaviours indicative of a strong culture of collaboration, but with robust debate, and in a way that means no one Director dominates discussions? |
• | How is the Board satisfied that there is no reliance on one or certain viewpoints and that there is inclusive, diverse-thinking boardroom culture? |
• | How has performance as a Director and, where relevant, performance in a particular role or duty changed over recent years, and since reaching more than nine years of service? |
Workforce engagement (Provision 5)
Our people are essential to the successful delivery of the Shell strategy, and the Board recognises the importance of understanding their views through engagement. However, the size and diversity of our employee base as well as that of our wider workforce complicates the feasibility of implementing any of the three specific workforce engagement methods recommended in the Code. Given the required coverage needed for a global organisation such as ours, the Board believes that its current approach to workforce engagement continues to be pragmatic and effective.
However, the Board has also decided that in 2020 it will increase its direct engagements when the Board, Committees and individual Directors visit our sites across the world and its indirect engagements through enhanced
GOVERNANCE SHELL FORM 20-F 2019 | 77 | |
stakeholder engagement information in relevant management reports. The Board also agreed to keep under review the effectiveness of the engagements. More information on the current approach and a description of the channels used by the Board, its Committees, and the Executive Committee are outlined in “Workforce engagement” on pages 86.
Appointment of independent Non-executive Director as Senior Independent Director (Provision 12)
Information on the independence of the appointed Senior Independent Director, at the date of publication, is explained under the "Director Independence" heading above and on page 130. As provided earlier in this report, Euleen Goh will succeed Gerard in this role following the 2020 AGM, subject to her reappointment by shareholders. Details on succession planning and the work of the Nomination and Succession Committee is contained on page 88.
Composition of the Remuneration Committee (Provision 32, independence)
The Remuneration Committee has five Non-executive Directors making up its membership, four of which are deemed to be independent under the parameters of the Code, and the fifth (Gerard Kleisterlee) is considered to be independent by the Shell Board for the reasons provided in its explanation. Remuneration Committee members have served this Committee for periods
ranging from over two years to just over five years, the exception being Neil Carson, who joined the Board and Remuneration Committee on June 1, 2019. As announced on January 29, 2020, Neil Carson will succeed Gerard in the role of Committee Chair following the 2020 AGM, subject to his reappointment by shareholders. Neil has been a member of this C ommittee since June 1, 2019 and has previously served on a Remuneration Committee before joining the Shell Board. Having Gerard remain as Committee Chair beyond his nine-year tenure to the natural conclusion of his tenure at the 2020 AGM was a practical step promoting smooth succession. Further details on the composition of the Remuneration Committee are provided on page 102 of the Remuneration Committee Report.
Corporate governance requirements outside the UK
In addition to complying with applicable corporate governance requirements in the UK, the Company complies with the rules of Euronext Amsterdam as well as Dutch securities laws because of its listing on that exchange. The Company likewise adheres to US securities laws and the New York Stock Exchange (NYSE) rules and regulations because its securities are registered in the USA and listed on the NYSE.
GOVERNANCE SHELL FORM 20-F 2019 | 78 | |
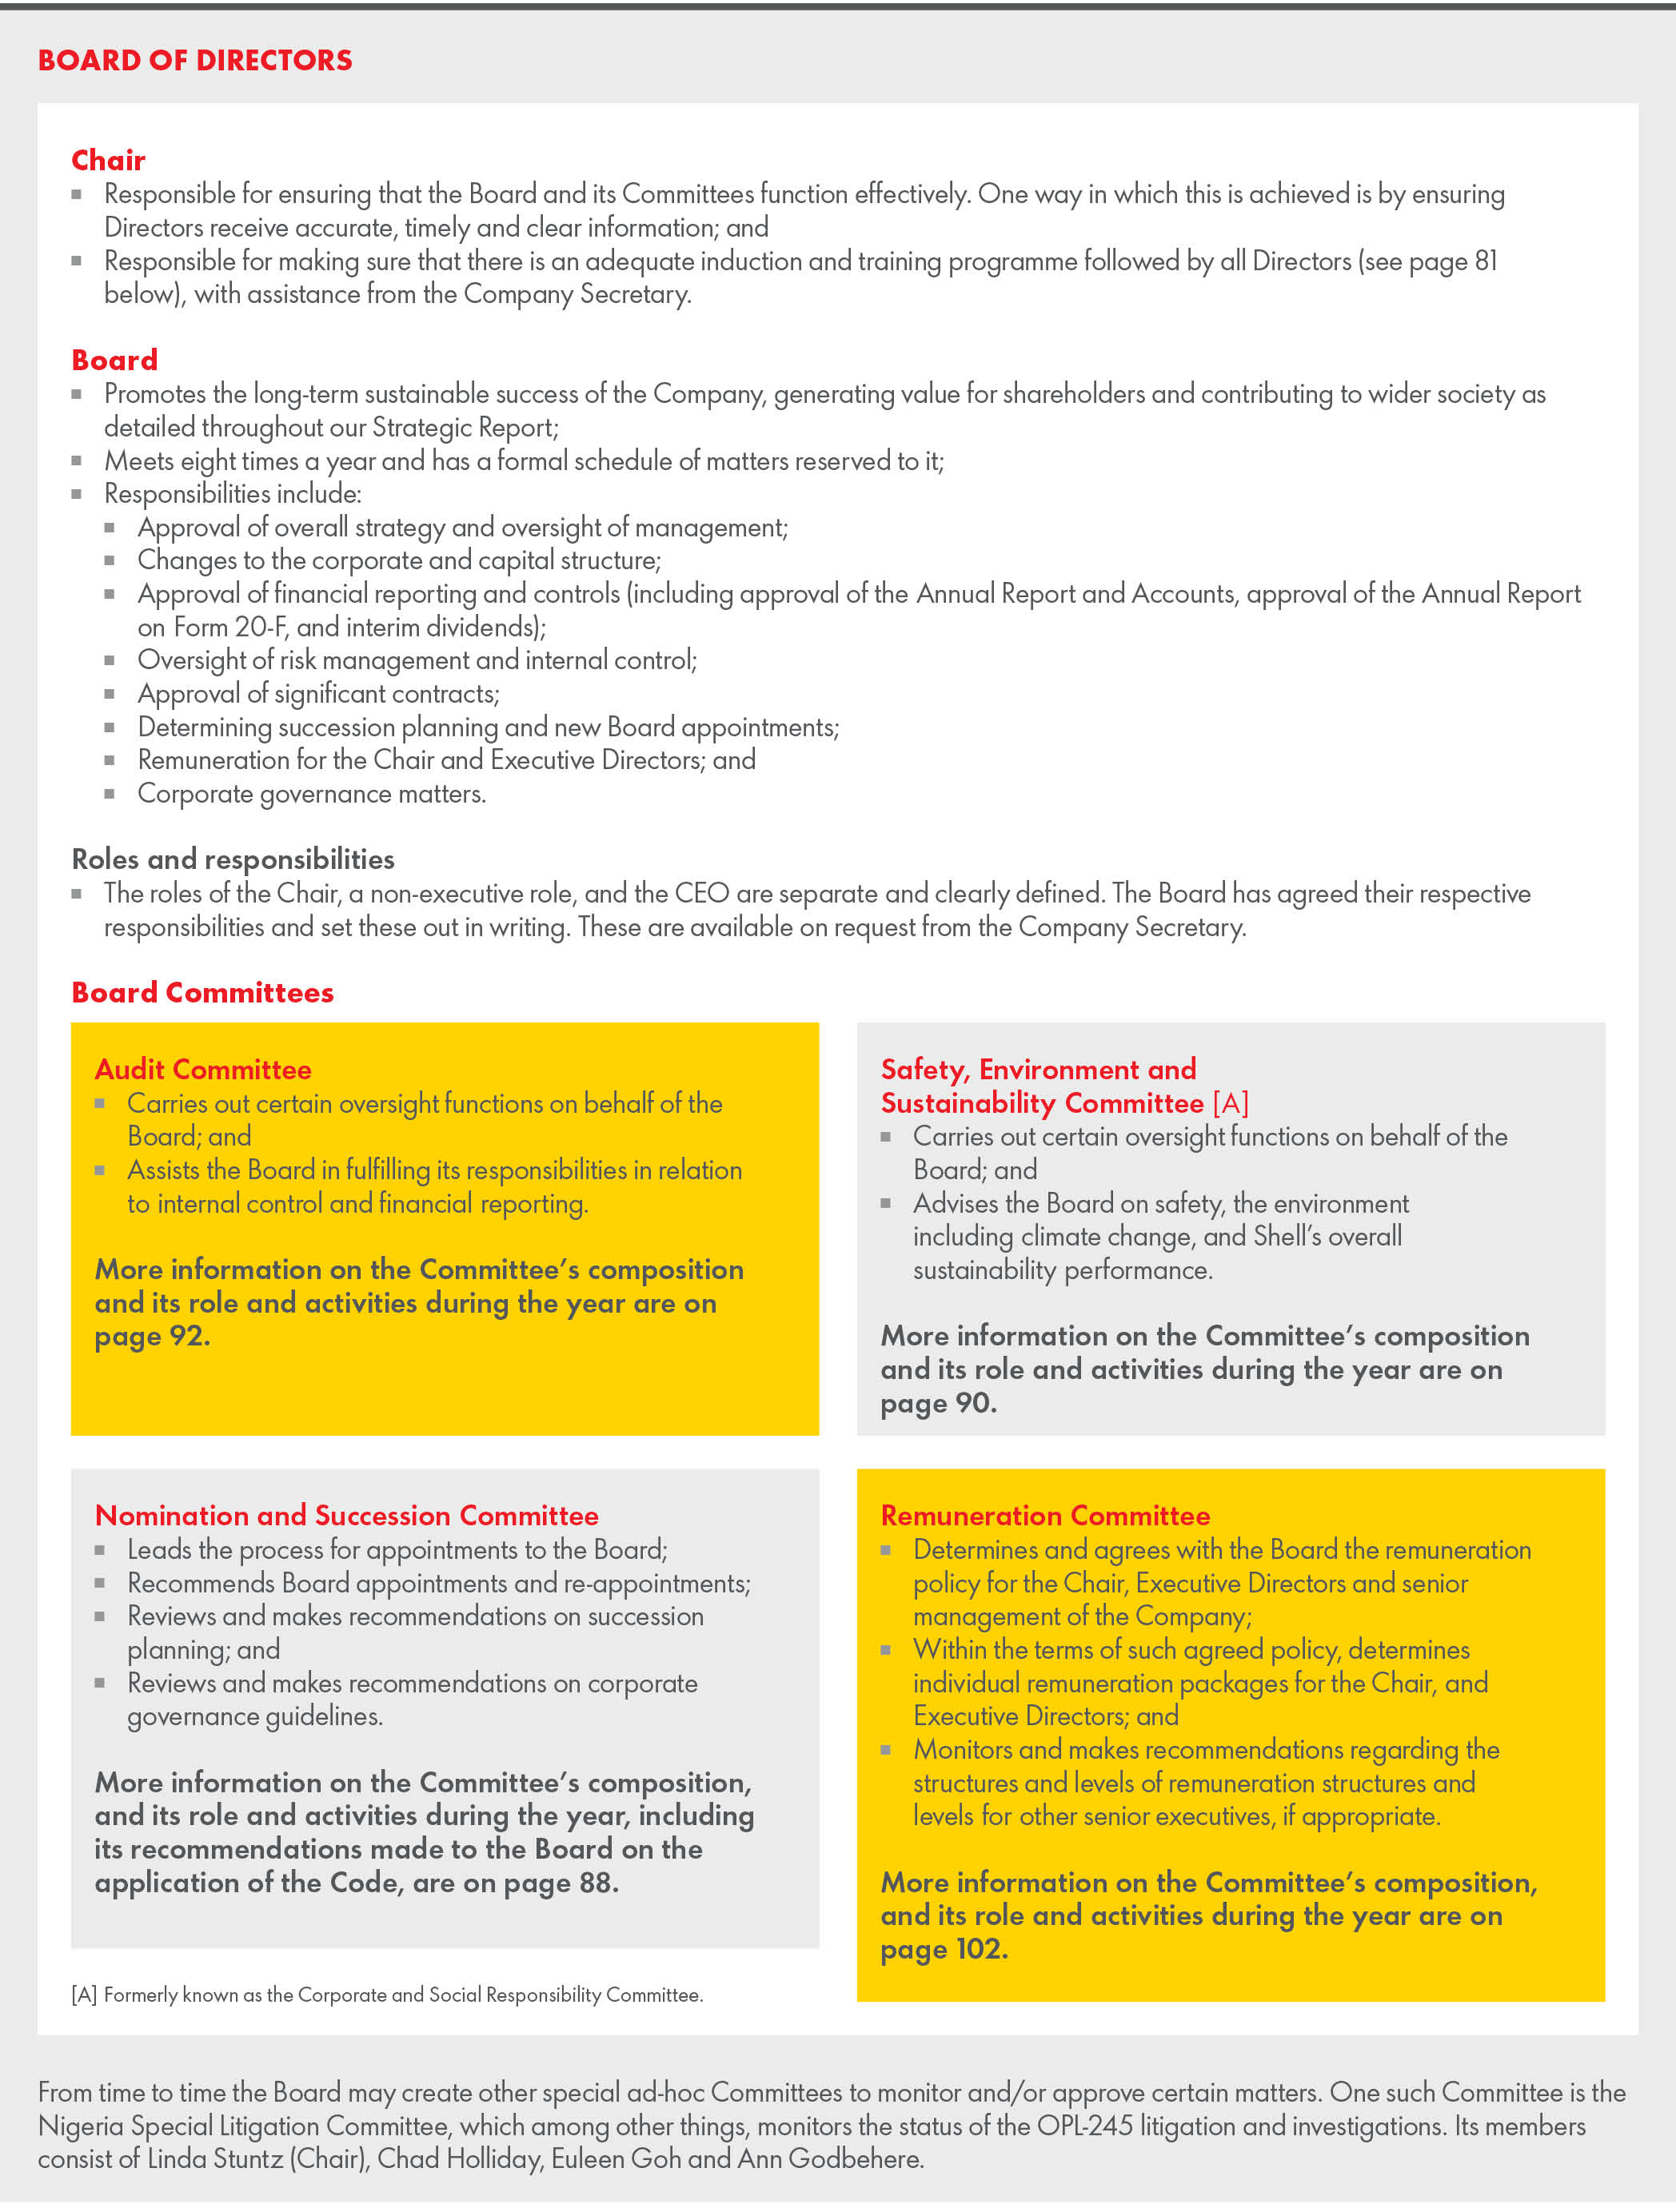
GOVERNANCE SHELL FORM 20-F 2019 | 79 | |

GOVERNANCE SHELL FORM 20-F 2019 | 80 | |
Board evaluation and activities | |
BOARD EVALUATION
The evaluation of the Board was conducted according to the guidance in the Code and was facilitated by Ffion Hague at Independent
Board Evaluation. [A]
[A] Ffion Hague and Independent Board Evaluation have no connection or relationship to the Company or to any director.
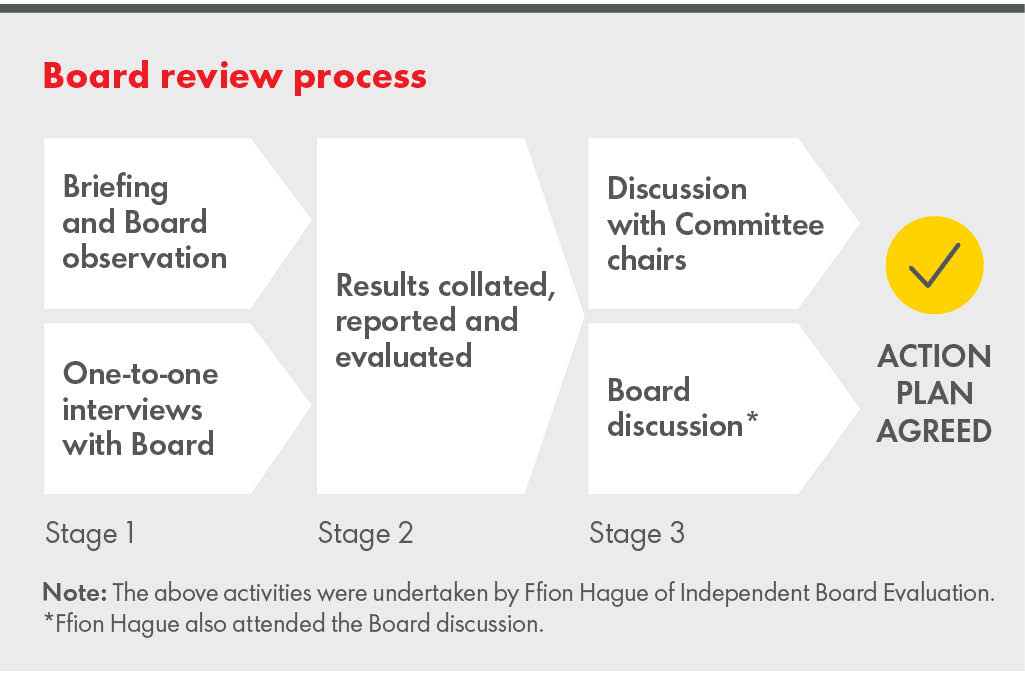
Discussion and observation (Stage 1)
A comprehensive brief was given to the assessment team by the Chair in September 2019. The evaluation team also observed Board and Committee meetings in October 2019. Copies of all pre-read materials were provided to the evaluation team, for briefing purposes, ahead of the meeting.
In October and November 2019, detailed interviews were conducted with every Director. All participants were interviewed by Ffion according to a set agenda tailored for the Board. Ffion was supported by her colleague for each interview. In addition, Ffion interviewed each Executive Committee member and the Company Secretary.
Analysis (Stage 2)
A report was compiled by the evaluation team based on the information and views supplied by the Board and other interviewees. All views or comments quoted in the report were made by participants during interviews. All recommendations were based on best practice as described in the Code and other current corporate governance guidelines.
Conclusions (Stage 3)
Draft conclusions were discussed with the Chair and subsequently discussed with the whole Board at a meeting in December 2019 with Ffion present. The conclusions of that discussion were recorded in the minutes of the meeting. Following the Board meeting, Ffion gave feedback to Committee Chair’s on the performance of each Committee and discussed the report on the Chair’s performance with Gerard Kleisterlee, the Senior Independent Director. In addition, the Chair received a report on individual directors and provided individual feedback to every Director on their contributions. In January 2020, Gerard led a separate discussion in relation to the performance of the Chair (in the absence of the Chair).
Insight
The feedback from Board Directors was positive throughout, with particular praise for the culture of the Board and the leadership provided by both the Chair and the Chief Executive Officer. Although areas of Board work were identified for improvement, the Evaluation Report clarified that such improvements were to fine-tune versus radically overhaul the Board’s performance.
Feedback themes included noting the strength of the relationship between the Board and management team, the Board process and the Board’s confidence in the Management.
Accountability - Board Directors are aware of their accountability to a range of stakeholders including shareholders, employees, communities and society at large; and conscious of the societal scrutiny to which Shell is subject.
Strategy - The strategy process is highly regarded, and Directors appreciate the efforts made to keep them updated on key items, for example, on the science behind climate change, via deep dives into various new energies, and through the Board’s engagement with external experts. While the Board appropriately challenges management on strategic issues, Directors agree that strategy is a key focus for the business and the Directors feel well informed and engaged on strategic issues. Going forward, the Board noted the need to further consider the prioritisation of the approved strategic ambitions and to ensure that Board time spent on strategic and operational matters was appropriately balanced.
Governance - Directors note that Shell’s identification and follow-up of governance and compliance concerns, including with regard to substance and processes, are dealt with well and thoroughly.
Succession - Succession planning and talent management were identified by Directors as a clear area of strength. Directors particularly noted the attention to talent development within the business, evident in the quality of emerging talent for various roles.
Culture - Board culture was another area of strength highlighted by directors, crediting the Chair for setting a strong lead in this respect. The Board’s values are felt to blend well with the Company’s own values and Directors actively enjoy their engagement with their fellow Directors and the business.
Planned enhancements include
Board Papers - Board papers contain high-quality, data-rich analysis but could benefit from being shortened and less technical. We will therefore continue to enhance the information provided to the Board to ensure the right information is provided in a digestible format while outlining the necessary facts of a given proposal.
Ongoing training - Induction sessions that combine new and existing Directors proved valuable. The same applied for visits to key sites, which also led to increased quality acquaintance time among Directors, time-efficiency for the management team and further opportunities for Non-executive Director workforce engagement.
We will look to build on our current processes with the development of a calendar of Board travel, that all Directors can opt into, aligned to the Board calendar of forthcoming topics. In addition, details of other induction sessions, Committee trips and Chair visits will be shared with directors enabling them to also attend as appropriate
Chair
Ongoing performance evaluation - Directors strongly commend the Chair’s diligence, openness, Board preparation, knowledge of the business and positive relationship with the Chief Executive Officer. They also highlight his skill in strengthening individual Director performance through coaching and feedback, which he provides in real-time via his regular contact with all Directors between meetings rather than awaiting the formal annual process, which many found profiled him as the best Chair of their Non-executive Director careers. On the improvement side, Directors relayed to the Chair the organisational feedback they had received regarding the Chair’s suggestions or questions to the business sometimes being misinterpreted as instruction requiring specifically responsive extra work versus simply provoking thought or deepening Board understanding which was recognised as the likely actual intention. A few Directors also queried whether deliberations on certain Board decisions could have been brought forward where feasible. The Chair fully accepted the feedback and agreed to reflect and act upon it.
BOARD ACTIVITIES
A rolling Board agenda is reviewed at Board meetings, providing effective forward management of meetings and focused discussions. The agenda for each Board meeting includes a number of regular and important items, including reports from the Chief Executive Officer, the Chief Financial
GOVERNANCE SHELL FORM 20-F 2019 | 81 | |
Officer, other Executive Committee members and from each Board Committees. Further updates are provided from the various business functions and other key functions, including Investor Relations: Health and Safety, Security and Environment; HR; and Legal, as well as the Company Secretary. The Board also considers and approves the quarterly, half-year and full-year financial results and dividend announcements and, at most meetings, considers investment, divestment and/or financing proposals.
To enable purposeful debates and/or focus on particular aspects of agenda topics, including the impact on key stakeholders, Directors have an opportunity to specify information they require to be provided in advance of Board meetings.
As in previous years, certain Board Committees and Non-executive Directors conducted site visits of various Shell operations and overseas offices. These visits were designed to provide Directors with first-hand insights into certain key portfolio positions. Directors also held various workforce engagements in these locations, as well as external stakeholder engagements, where feasible.
Some of the activities and areas of Board focus from the year, and where not described in further detail elsewhere in this Report, are summarised in the table below.
Topic | Discussion/Activity/Updates included | Examples of Outcome/Progress | Stakeholders considered |
Strategy and management | |||
Management day | Review and discuss the communications for 2019 Management Day; Reviewed and discussed messaging to clarify Shell’s Net Carbon Footprint ambition; and Considered trading, capital efficiency and supply chain management. | Considered feedback from the investor community regarding progress towards a world-class investment case Feedback from investors on sustainability of medium-term growth potential. | A E F |
External business environment | Frequent updates on activity occurring within industries and political environments in which Shell operates. | Consider potential risks and mitigation, where possible. | A B D E |
Risk management and internal controls | |||
Safety and Environment | In addition to regular updates from Management on health, safety, security and the environment, each Board meeting begins with a reflection or anecdote from a Director or Executive Committee member on the topic of values and/or safety. | In Board meetings, Directors use learnings gained outside Shell to provide perspective and diversity of thought to Board discussions. At times, the Executive Directors have also provided practical commentary and examples of how safety has permeated Shells culture. | B D |
Risk management and internal control | Review Risk Report, covering external trends, proposed changes to the Group’s strategic and operational risks and deeper analysis of the Conduct Risk Register. | Proposed changes. | B C D |
Board membership and other appointments | |||
Board membership and other appointments | Directors' tenure, external commitments, conflicts of interests and succession planning. | Policy for approving external commitments. NED appointments and changes to committee membership | A E F |
Talent overview and senior succession review | RDS Senior Succession and Resourcing Review covering Executive Director and Executive Committee (EC) succession, EC direct reports and the senior executive group. | Enhance insight of Shell talent and future leaders. Assurance of robust succession and contingency plans. | D |
Remuneration Committee updates | |||
Remuneration and reward matters | Reporting and society opinions on executive pay, implementation of UK Shareholder Rights Directive, AGM reflections, Remuneration Policy. | The Remuneration Committee accelerated a planned 2020 policy change which would withdraw an element of CEO and CFO bonuses, making these effective from 2019, following consideration of the views of proxy voting firms and other key stakeholders. | A D E |
Corporate governance matters | |||
Distributions to shareholders | Reviewed dividend payment process in conjunction with strategic ambition of world-class investment case. Discussed the dividend payments that had remained unclaimed by shareholders for a period of more than twelve years. | Streamlining the dividend payment process by introducing a US dollar option and moving to fully electronic statements in US dollars, euros and sterling. Agreed that the payments discussed should be forfeited (as per the Articles), and donated to The Shell Foundation. | A B E |
Governance | Ethics and compliance, including how to continue to build a strong corporate culture. Senior management succession and corporate governance developments. Modern Slavery Statement and assurance. The Code, changes to process and reporting. Other regulatory and legislative requirements. Review and assessment of Shell's governance practices against the new Code. | HR strategy on senior succession and regulatory/legislative disclosures approved. New requirements outlined in the Code were discussed and agreed. | B C D |
A-Investor Community; B - Employees/Workforce/Pensioners; C-Regulators/Governments/NGOs; D - Communities; E - Customers; F - Suppliers/Strategic Partners
GOVERNANCE SHELL FORM 20-F 2019 | 82 | |
Understanding and engaging with our stakeholders | |
Shell’s commitment to public collaboration and stakeholder engagement is inherent in our three strategic ambitions, most notably in our ambitions to thrive through the energy transition and sustain a strong societal licence to operate. Understanding the views and interests of our key stakeholders is important to the Board, and the Directors have taken steps to consider stakeholders' views in Board discussions and decision-making, as described on page 84. In addition to direct Board engagement, significant levels of engagement are undertaken by the broader business ahead of many of Shell projects or activities. This engagement is often governed by formulated policies, control frameworks, regulation, legislation and may differ by region.
We have categorised our key stakeholders into six groups. Where appropriate, each group is considered to include both current and potential stakeholders. Shell stakeholders include: Investor Community, Employee/Workforce/Pensioners, Regulators/Governments/NGOs, Communities, Customers and Suppliers/Strategic Partners.
Site visits
The Chair, certain Board Committees and Non-executive Directors conduct site visits of various Shell operations and overseas offices. These visits are designed to provide Directors with first-hand insights into portfolio positions. Directors also held various workforce engagements in these locations, as well as external stakeholder engagements.
New Energies, the Energy Transition and the Shell Power Strategy
During 2019, the Board visited the USA (Colorado and California) and SESCo visited operations in Singapore to gain a better understanding of Shell businesses in these countries and elements of the energy transition. The visits included engagements with different internal and external stakeholders and interest groups which provided the Directors with multiple perspectives and considerations on the energy transition including the impact on communities, companies and Shell itself.
Shareholders
The Board recognises the importance of two-way communication with the Company’s shareholders. The Chair, the Deputy Chair and Senior Independent Director, the Chief Executive Officer, the Chief Financial Officer and the Executive Vice President Investor Relations each meet regularly with major shareholders and report the views of such shareholders to the Board. Committee Chairs also seek engagement with shareholders on significant matters related to their areas of responsibility. Over the year, the Chair met with 76 major shareholders including at roadshows. The Deputy Chair, Senior Independent Director and Remuneration Chair met with 70 shareholders over the course of the year. A variety of topics were discussed.
Shareholders can also contact the Company directly via a dedicated email address or via dedicated shareholder telephone numbers provided on the inside back cover of this report. Shell’s website also contains information for institutional and retail shareholders alike.
The Company’s registrar operates an internet access facility for registered shareholders, providing details of their shareholdings. Facilities are also provided for shareholders to lodge proxy appointments electronically. The Corporate Nominee service, facilitated by Equiniti, provides a facility for investors to hold their shares in the Company in paperless form.
Board Governance Event
In the past, the Board has held a governance event, “Board Engagement Day” that is attended by Directors including the Chair, Senior Independent Director, Audit Committee Chair and SESCo Chair. This is a biennial event providing investors with an overview of the Board’s roles, activities and its key focus areas including stakeholder engagement. The last event was in December 2018. The event covered topics relevant to the Code including stakeholder engagement expectations, Chair tenure and diversity and Inclusion on the Board and in the senior management talent pipeline. Attendees could also provide feedback to Directors via a question and
answer session, and also informally over refreshments after the event. The next event is scheduled for the latter part of 2020.
The table below further demonstrates examples of various ways in which the Board or others (providing feedback to the Board) engaged with stakeholders during 2019. Further insight on our engagement with stakeholders can be found within our Sustainability Report and our report on payments to governments, scheduled for publication in April 2020.
GOVERNANCE SHELL FORM 20-F 2019 | 83 | |
Engagement before event | Event / Activity | Engagement following event |
Annual General Meeting in the Netherlands and Annual shareholder presentation in London [A] | ||
Directors engaged with investors ahead of the event on a number of matters, including those being voted on at the AGM. | As well as the Company giving a balanced report of results and progress at each AGM, all shareholders had an opportunity to ask questions in person. Shareholders also engaged with Directors prior to and after the formal business of the AGM and informally over refreshments. A separate engagement not part of the AGM was provided in the UK. Shareholders (predominently retail investors) hear about the Company’s progress and ask questions in person. | A number of additional engagements including follow-up meetings and answering of queries. |
The Responsible Investment Annual Briefing [B] | ||
Directors engaged with investors ahead of the event on a number of matters, including the agenda which was based on topics of interest. Additional speakers from outside Shell, NGOs and charities also invited. | The addition of non-Shell speakers added an interestingperspective and dimension to the presentations and discussions which covered our three strategic ambitions in the context of sustainable development. The speakers included representatives from the Human Rights & Business Initiative, the International Union for the Conservation of Nature, and the World Business Council of Sustainable Development. This event also served as an excellent opportunity to hear from investors and other stakeholders on Environmental, Social and Governance issues which is gaining prominence as a topic amongst the stakeholder community. | Following the event, there were a number of additional engagements including follow-up meetings and presentations with stakeholders. |
Engagement with three leading climate scientists | ||
The Board continued to commit time to this topic throughout the year. The Chair engaged with presenters in preparation for the Board engagement. | This engagement increased the Board’s and the Executive Committee’s understanding of the underlying science of climate change and helped provide a clearer understanding of this key driver of the energy transition. The engagement included presentations from the scientists and the discussions/presentations: • were valuable to leaders that are not deep into the science but are charged with navigating the energy transition;• built further foundations for future updates as the world’s understanding of the science advances and suggests the best sources of ongoing information;• described key scientific discovery that is underway that could impact actions by governments, business and the population overall; and• included subjects that often do not make the popular press coverage but could be important to the organisation. | The Board recognises the significance and importance of this topic to all stakeholders and Shell’s business operations, both now and in the future. The Board reflected on and used learnings from the session as background considering short-term and future investment/ divestment decisions, financial and operational plans. |
MD19 [C] | ||
The Board reviewed and approved the Management Day 2019 (MD19) material and outlook and provided feedback to the CEO and CFO. | Engaged with investors on the progress of delivery of Shell’s 2020 outlook and plans for positioning the Company for the future of energy, into the next year and further. The session also included presentations by business Directors and a high-level “question and answer” session. Investors were also provided with opportunities to pose detailed business-specific questions in “business breakout panels”. | Roadshows with Executive Committee Members were held in London and the US. |
Remuneration Committee Chair address | ||
A number of calls with proxy voting agencies and investors to engage on potential Remuneration Policy changes. | The Chair of the Remuneration Committee/Senior Independent Director provided an update on remuneration and the Company’s policy via a video published on the Shell website. He had met and engaged with major investors during a roadshow conducted on November 2019, around choices to be made as part of the 2020 Remuneration Policy update including proposed changes, use of discretionary measures and energy transition in remuneration. | Investors were able to liaise with the Board and discuss their views and opinions; these views were shared with the REMCO, Board and the Chief HR and Corporate Officer to further formulate the policy. |
Chair Roadshow | ||
A number of preparation meetings were held to provide insight into key topics of interest to the investor community. | The Chair of the Board provided an update on the governance of Shell and key investors had opportunities to ask questions to the Chair. Key topics included governance, remuneration, energy transition and business outlook. | Investors were able to engage with the Chair and there was also subsequent dialogue with Investor Relations. |
Board visits to Colorado and California | ||
The Board provided guidance to the planning team ahead of the visit to formulate the agenda and ensure that key areas of interest were covered. | In addition to engagements with various different stakeholders and external experts, the Board met with academics, policy and business leader members of the External Advisory Board, which was established to provide the business with external perspectives in Power and Mobility domains. The Board also visited the National Renewable Energy Laboratory to witness the science and engineering of energy efficiency, sustainable transportation and renewable power technologies. Directors also met with employees and local stakeholders including government representatives, partners and start-ups which Shell has invested in. | |
GOVERNANCE SHELL FORM 20-F 2019 | 84 | |
Audit Committee visit to the finance operations centre in Chennai and the IT Hub in Bangalore | ||
Discussions were held with Audit Committee members ahead of the visit to formulate the agenda and ensure that key areas of interest were covered. | Chennai and Bangalore - Engagements covered presentations from a number of individuals from various parts of the business, on matters such as data analytics and engineering, market risk, reporting and analysis and centres of excellence, digitalisation, and the context of the IT hub, local collaboration with Shell retail operations, process automation and how the business contributes to Shell’s overall strategy on digitalisation. Further, the Committee received an overview of the Shell India Diversity and Inclusion Network, and spent time with the women’s network, senior leaders and local employees. | The Committee gained an understanding of the operations and met with the local teams in both regions, gaining a deeper understanding of the different processes and challenges the business and its workforce faces. |
SESCo visit to Singapore | ||
Discussions were held with the SESCo Committee members ahead of the visit to formulate the agenda and ensure that key areas of interest were covered. | The Committee met and engaged with a range of representatives from the contractor workforce, communities and social investment partners. Other engagements were held with Shell’s partners in the energy transition, a women’s network, government and the World Business Council for Sustainable Development. The Directors also had lunch with frontline staff and extended leadership team members. Over the course of these various engagements, a range of topics were considered and discussed including process safety and the environment and societal expectations. | This visit provided Directors with many insights, including Shell’s broad and growing capability in developing cleaner energy solutions and the energy transition journey in Singapore. |
Director Visits included | ||
Discussions were held with the respective Directors ahead of the visit to formulate the agenda and ensure that key areas of interest were covered. | Shell QGC Midstream operations in Queensland, Australia The visit included a site tour of the Control room, the LNG plant and the maintenance centre, providing opportunity to engage with the workforce in each location. The Director also spent time with the local leadership team, graduates, engineers and others from the broader functions. Houston The Director attended the Engagement with Emerging Leaders meeting. This is a formal programme established to develop US based Senior Executive potential talent. The group meets quarterly with the US Country Coordination Team and is led by the US Country Chair. These meetings provide an opportunity for cross-business collaboration and networking. The Director also toured the remote drilling centre and received an update on how technology has been instrumental in delivering continuous improvement, optimisation and standardisation for the drilling of wells. Further, they received an overview of the lubricants business and spent time with global brand managers, marketing and commercial teams. Permian Basin The Directors received updates from senior leaders, a tour of the central processing facility, drilling rig and other operations. Shell Energy During their visit, Directors met with Shell Energy CEO and the Executive Team. In addition, Directors toured the offices meeting several teams, including leaders from customer services, customer experience, continuous improvement, and telecommunications where they were able to learn more about recent changes to a customer-centric operating model and growth plans for broadband operations. | The visits provided Directors further opportunity to engage with the workforce, and gain a deeper understanding of the business and its operations. |
[A] The London shareholder meeting was attended by the Chair, CEO and CFO
[B] Attended by the CEO and Chair of SESCo, along with the Senior Independent Director
[C] Attended by CEO and CFO
ff
GOVERNANCE SHELL FORM 20-F 2019 | 85 | |
Workforce engagement | |
The publication of the new UK Corporate Governance Code (the “Code”), and The Companies (Miscellaneous Reporting) Regulations 2018, now require companies to report on their engagement with their employees and wider workforce. The Code outlines three suggested workforce engagement approaches. Following an analysis of Shell’s application of the Code in late 2018 and over the course of 2019, the Nomination and Succession Committee (NOMCO) and Board reviewed, considered and discussed the Shell Group’s and Board’s existing workforce engagement. Although the Board and NOMCO recognised merit in each of the Code’s workforce engagement mechanism proposals, it noted that boards must consider the size and structure of their business, including its international workforce scope, and select an approach within that context that most practically delivers the underlying spirit and ambition of the Code even if it is not one of the three prescribed approaches. The Code is also supportive of alternate methods where an explanation is provided.
The Code states that its use of the term ‘workforce’ is not meant to align with legal definitions of workforce, employee, worker or similar terms. However, for a global organisation bound by the laws of more than 70 countries, blurring clearly prescribed legal definitions that impact complex issues (such as local HSSE requirements, work contract terms, legal accountability, employment rights) or merging two definitions of the same term could have notable impact on the business, its operation and its stakeholder relationships (including with suppliers). Therefore, Shell considers its workforce to be employees of companies in the Shell Group. However, the Board also engages with others outside of this group (for example, on site visits), and some of this engagement is shared on page 83.
Although our reporting and formal engagement focuses predominantly on our employees, all individuals working on Shell sites (including Shell
offices) are required to undertake certain Shell training (for example, HSSE and Code of Conduct-related training). Adhering to the Life Saving Rules (HSSE) and the Code of Conduct compliance obligations is included within our contracts with suppliers, and the Shell Global Helpline is available for all workers to report matters of concern.
For many years Shell has recognised the importance of engaging with its workforce. Engagement is especially important in maintaining strong business delivery in volatile times of change. We therefore strive to maintain a dialogue between management and our workforce – both directly and where appropriate, through representative bodies. Management regularly engages with the workforce through a range of formal and informal channels, including via emails from the Chief Executive Officer and other senior executives, webcasts, townhalls, team meetings, face-to-face gatherings, breakfast briefings, interviews with senior management and online publications via our intranet.
The Board considers effective engagement a key element of its understanding of the Company’s ability to create value as it recognises that our people are our greatest asset. Workforce views can help inform the Board on matters such as operational effectiveness, Shell culture, risk identification and strategy development and delivery.
The Board considers the current workforce engagement approach effective. The information provided below exemplifies various methods of Board engagement.
Board’s Direct Engagements with the Workforce
Informal Engagement
Chair lunches are held from time to time with a select cross-section of employees in various regions. The Board has also held an informal drinks/discussion with select cross-section of employees; for example, to meet future leaders and listen to current issues, challenges, concerns and opportunities.
Nomination and Succession Committee members meet with various senior leaders and high-potential individuals throughout the year. [B] [E]
The Chair has commented that his meetings provide great insight into the Shell culture and our capacity to deliver on our strategy and purpose. He
notes that such direct engagement provides snapshots of employee perspectives across the various countries and cultures within which Shell operates. Further, he considers this a helpful method of engaging with high potential talent individuals in an informal environment.
Off-Site Visits
People engagements during Board and/or Committee off-sites. [B] [A] [S] [N]
Meeting talent/leadership teams [B] [E]
Townhall discussions [B] [E]
Company Chair engaging with various individuals by attending team meetings
Country visits (China, India, Japan, Kazakhstan, Kuwait, Malaysia, the Netherlands, Poland, Singapore, UK and USA). [B] [A] [S] [N]
Through these more formal engagements, the Chair and other Non-executive Directors (either individually or with their Committees) are able to deepen their understanding of how the Company’s purpose, strategy and values are embedded in particular sites and countries. The benefits are mutual as the Board obtains direct insight into local business operations and projects as well as local strengths and challenges while our people have an opportunity to better understand the Board and provide direct feedback on topics of importance to them, their business or function and/or their location.
Employee Network and Related Sessions
Conducted by Directors with for example, female Directors engaging with Shell women’s networks. [B]
Shell female employees who have engaged with female Directors informally (via dinners or through women networks) credit those engagements for not only providing them Board exposure but also in affording them the opportunity to communicate about gender-specific topics and to learn from established female leaders. Directors involved in these engagements likewise note the opportunity to enrich their understanding of the female perspective within Shell as well as the depth of Shell talent and effectiveness of Shell’s Diversity and Inclusion initiatives. Committee Engagement
Committee Engagement Key: [B] BOARD; [A] AUDIT; [S] SESCo; [N] NOMCO; [E] EXEC DIRECTORS
Formal reports and information updates to the Board
Shell People Survey (anonymous survey facilitated externally)
Annual Board discussion to keep it fully apprised of employee engagement levels and quality of leadership across Shell’s workforce, as well as a broad range of subjects including collaboration, working conditions, the job, people development, reputation, benefits and rewards, diversity and inclusion, operational excellence, and responsible business. [B] [E]
The Board considers the Shell People Survey one of its principal tools used to measure employee engagement, motivation, affiliation and commitment to Shell. It provides insights into employee views and has a consistently high response rate. In 2019, the response rate was 85.5%, which was an increase of 3.5% compared to 2018. The average employee engagement score was 78 points out of 100, an increase of one point compared to 2018, and among leading results across a range of industries.
The Board also utilises this engagement to, for example, understand how Shell is leveraging the survey outcomes in: i) data analytics, for example, to identify potential correlative relationships between employee engagement and safety or ethics & compliance incidents; and ii) strengthening Company culture and values.
Senior Succession Resourcing Review
The annual Senior Succession and Resourcing Review focused on the strength of senior leadership and plans for its development and succession, while highlighting the breadth, depth and diversity of its pipeline, the developing profile of the leadership cadre, and recruitment and attrition levels. [B] [N]
GOVERNANCE SHELL FORM 20-F 2019 | 86 | |
The Nomination and Succession Committee noted the disciplined approach to succession planning and execution, the holistic view taken of leadership and the high levels of information and transparency underpinning it. It particularly noted improved focus on performance and on the talent pipeline of high potential individuals beyond just senior management levels. Along with the results of the annual Shell People Survey, it provided a deeper understanding of culture, leadership talent and the strong levels of employee engagement across the business.
Assessment of key trends and material incidents
Presented by Chief Ethics & Compliance Officer. This is based on the established channels for staff and others to file complaints or report on suspected breaches in relation to the Shell General Business Principles (SGBP), the Code of Conduct or any breaches of law or regulations, including accounting control and auditing concerns. [A] [S] [E]
The update covers Shell employees and our wider stakeholder base. The Board (including via the Audit Committee and SESCo) obtains insight into incidents and on reporting levels and remediation which provide indicators of conduct risks and, together with the related Board reports noted below, of the strength of embedding and awareness of the Code of Conduct and SGBP obligations and employees’ comfort levels in raising incidents.
The Shell Control Framework
Significant HSSE, Ethics and Compliance, and more broadly, business control incidents are brought to the attention of senior management and Board through regular reporting. [A] [B] [S] [E]
The Board discussed how the organisation could learn more from incidents and how the business could drive safety performance to the next level. The Board requested additional information on incidents from both Shell operated and non-operated ventures and a greater visibility of incidents and investigations.
Conduct Risk Dashboard
Provides a consolidated quarterly overview of statistics on Code of Conduct violations. Risk indicators in the Dashboard are potentially linked to organisational culture. Examples that the Dashboard measures are: the number of terminations as a result of formally investigated Code of Conduct violations, and the number of overdues on mandatory Ethics & Compliance training. [B] [E]
A further update on positive culture and identity leadership is scheduled to be provided, along with an update on conduct risk, to the Board and relevant Board Committees in 2020.
Speaking Up in Shell
Data and insights are provided from the Global Helpline, Shell Ethics & Compliance Organisation and the Shell People Survey. The SESCo endorsed the recommendations with focus on how Speaking Up supports a caring organisation and encourages staff to come forward to raise a concern in good faith. [B] [S] [E]
The Audit Committee is kept updated when matters highlighted through the Global Helpline are investigated, and on the associated remediations. For more information please see page 94 within the Audit Committee report.
Assurance activities
Assurance activities, including items raised by Businesses and Functions (through the Group Assurance Letters Process) and independent assurance (from Internal Audit, HSSE, Ethics and Compliance, Reserves Assurance and Reporting), provide additional comfort to the Board of the commitment to high standards of risk management and internal control. The assurance activities ensure that work can be done safely, within regulatory frameworks. [B] [A] [E]
The information provided within these reports further support the Board’s annual review of the effectiveness of the Group’s system of risk management and internal control and feed into the Group Scorecard, which staff bonuses are calculated against.
Other
The Board receives updates on other specific topics. For example, to inform the Board’s focus on enhancing ethical leadership and assuring ethical decision-making in the organisation, it received updates on the roll out of the Ethical Leadership Expectations Programme (ELEP). [B] [E]
To better understand the success of the ELEP as reported to the Board, the Chair and the SESCo Chair attended a three-hour ELEP session themselves alongside Shell senior executives. The Chair and SESCo Chair shared feedback from the session in the January 2019 Board meeting with each commending the programme for authentically promoting open and meaningful dialogue and shared learnings on the Company’s values and leadership behaviours as well as on the practical dilemmas and business pressures confronting Shell leadership within those topics.
Committee Engagement Key: [B] BOARD; [A] AUDIT; [S] SESCo; [N] NOMCO; [E] EXEC DIRECTORS
GOVERNANCE SHELL FORM 20-F 2019 | 87 | |
Nomination and succession committee | |

CHAD HOLLIDAY
Chair of the Nomination and Succession Committee
HIGHLIGHTS OF 2019
• | Appointment of two new Executive Committee members |
• | Appointment of a new Non-executive Director, and continued discussions on Non Executive Director Succession |
PRIORITIES FOR 2020
• | Appointment and onboarding of new Non-executive Directors |
• | Continued discussions on Non-executive Director, and Executive Committee, succession |
Committee Member | Member since | Maximum possible meetings | Number of meetings attended | % of meetings attended | |||
Chad Holliday (Chair of the Committee) | May 19, 2015 | 5 | 5 | 100 | % | ||
Euleen Goh | July 1, 2019 | 3 | 3 | 100 | % | ||
Gerard Kleisterlee | May 23, 2018 | 5 | 5 | 100 | % | ||
Linda Stuntz | June 1, 2016 | 5 | 5 | 100 | % | ||
“We know we play a crucial role today in selecting those who make the future of Shell. The recognition of that responsibility not only humbles us but also drives our passion to entrust that future into the hands and hearts of those that will safeguard and grow it.”
CHAD HOLLIDAY
Chair
PURPOSE
The Nomination and Succession Committee (the “Committee”) leads the process for appointments to the Board and Senior Management [A] positions, ensures plans are in place for orderly, well planned succession, and oversees the development of a diverse succession pipeline of candidates. Further, it reviews the Company’s policy and strategy on diversity and inclusion, and monitors the effectiveness of diversity initiatives. It makes recommendations to the Board on corporate governance guidelines, as referred to in the Chair’s statement.
[A] "Senior management” refers to the Executive Committee and the Company Secretary.
TALENT MANAGEMENT AND SUCCESSION
The Committee manages Board and Senior Management succession against clear and agreed selection principles. For Non-executive Director succession, the Committee adopted in January 2019 a set of revised Principles for the Strategic Composition of the Board. The principles include both quantitative and qualitative principles, considering both: (i) the overall Board composition and diversity of gender, nationality, background experience and skillsets desired that align with the Company’s strategy and purpose; and (ii) the values, attitudes, and behaviours expected. For Senior Management succession, the principles include process-specific principles, including the identification and development of succession candidates and the long-term nature of the succession planning process. Each Committee meeting includes both sets of principles and, utilising those, the Committee executes changes through a well-defined and diligent process with overall Board engagement. The Committee agrees candidate profiles and meets prospective candidates well ahead of any selection decision being necessary. It also engages the Board early in the process to ensure all Directors have an opportunity to meet and assess prospective candidates. Consequently, some of the leaders whom the Committee and Board have engaged with extensively in the past are now members of the Board or the Executive Committee.
The Committee maintains short, medium and long-term succession plans, and thus an overview of potential candidates multiple years ahead. It oversees a continuous and proactive process of planning, review, engagement and assessment, taking into account the strategic priorities and main factors affecting the long-term success and future of the Company and the associated diversity, skillsets and breadth of perspectives needed to help achieve that in the evolving business environment.
The Committee is fully engaged with the broader senior succession and resourcing across Shell, and with the overall end-to-end approach to talent management that is adopted. This ranges from recruitment to leadership identification and from leadership development to leadership appointment, all of which are underpinned by talent priorities and a commitment to advancing Diversity and Inclusion.
DIVERSITY OF LEADERSHIP
Female representation has steadily improved in recent years. Amongst overall recruitment, Shell companies consistently recruit 40% females, and amongst graduates this is approaching 50%. Female representation in the top 1,400 roles ("Senior Leadership" positions) has been raised by 2.4 percentage points during 2019 to 26.4%, and further improvement is actively pursued. Nationality diversity, such as Asian and American talent, continues to advance in a manner reflective of the business outlook. Senior Leadership is a Shell measure and different from that which we are required to report under the Code, being female representation in Senior Management and their direct reports, where the percentage is 28.9%.
The Committee recognises that improving diversity at each level across the Shell Group is crucial, and therefore takes an active role in reviewing diversity objectives and strategies for the group as a whole, and monitoring the impact of diversity and inclusion initiatives.
Committee Activity
In addition to its considerations regarding succession, the Committee made recommendations on corporate governance guidelines, monitored compliance with corporate governance requirements and made
GOVERNANCE SHELL FORM 20-F 2019 | 88 | |
recommendations on disclosures connected with corporate governance. The Committee continues to monitor and review this area, as well as consider whether and how current Company governance matters should be strengthened. Further insight on some of the Committee's areas of consideration in 2019 is provided below.
Succession [A] | Topic of discussion/Example of Board activity |
Recommendation | Appointment of Neil Carson to the Board. Changes to the composition of the Board committees. |
Review and oversight | Royal Dutch Shell Senior Succession Resourcing Review. |
Oversight | Appointment of Wael Sawan as Upstream Director (replacing Andrew Brown). Appointment of Huibert Vigeveno as Downstream Director (replacing John Abbott). |
Governance | Topic of discussion/ Example of Board activity |
Governing the Board and its committees | Reviewed its Principles for the Strategic Composition of the Board. Updated its Terms of Reference, and reviewed changes proposed to the Terms of Reference for other Committees and the Matters Reserved for the Board. |
Regulation, legislation and other governance related guidance | Alignment to the recommendations within the 2018 UK Corporate Governance Code. Key governance matters impacting the Company’s external reporting. Other governance and regulatory changes agreed or proposed and their impact or potential impact on the Company, its processes and its reporting. |
RDS matters | Considered any potential conflicts of interest and the independence of the Non-executive Directors. Determined who would undertake the 2019 External Board Evaluation. Reviewed the proposed changes to the Company’s Articles of Association, subsequently approved by shareholders at the 2019 AGM. Reveiwed changes proposed to the dividend payment process (announced December 2019). |
[A] The Committee was assisted during the year by Russell Reynolds Associates (“Russell Reynolds”), an external global search company whose main role was to propose suitable candidates. Russell Reynolds does not have any connection with the Company other than that of search consultants. The Chair does not participate in discussions regarding his own succession. Russell Reynolds is a signatory to The Voluntary Code of Conduct for Executive Search Firms which aims to improve board diversity.
Director Induction and Training
Following Board appointment, Directors receive a comprehensive induction tailored to their individual needs. This includes site visits and meetings with senior management to enable them to build up a detailed understanding of Shell’s business and strategy, and the key risks and issues that Shell faces.
As part of the Board evaluation, director induction was a discussion topic. Directors commented positively on the induction programme and reported that it is comprehensive, well-organised and fully in line with their expectations. Directors shared that they have been able not only to benefit from a comprehensive programme of meetings but also to steer the programme towards their own personal interests and information needs.
Some of the areas Neil Carson’s induction has covered are provided below:
Company Operations and Strategy, including:
Strategy & Portfolio; Integrated Gas and New Energies; Downstream, including Chemicals, Retail and Global Commercial; Upstream; and Projects and Technology. Time was spent with the EC members managing these operations and senior leaders from the operations. Further, updates were provided with regard to the internal governance process, the Shell Control Framework, the Board’s calendar, minutes from earlier meetings, Company performance, operating plans and key business relationships. Neil also met with the Chief Internal Auditor.
The environment in which we operate, including:
Engagements were held with the Chief Ethics and Compliance Officer, Safety and Environment and senior leaders from the Sustainability Strategy team, and the Global Business Environment team, which is best known for developing forward-looking scenarios to support strategic thinking and direction-setting. Time was also spent with senior leaders from Investor Relations and Group Reporting and the Chief Human Resources and Corporate Director, the Legal Director and the Company Secretary.
Feedback on Board induction
“Given the complexity of the business, I believe that Director induction takes at least a year. The sessions with people in the business benefit from being gradually phased and aid the absorption of information. Site visits are incredibly helpful and can be utilised to a greater extent in the early stages of the programme."
NEIL CARSON
Non-executive Director
GOVERNANCE SHELL FORM 20-F 2019 | 89 | |
Safety, environment and sustainability committee | |

SIR NIGEL SHEINWALD GCMG
Chair of the Safety, Environment and Sustainability Committee
Committee Member | Member since | Maximum possible meetings | Number of meetings attended | % of meetings attended | |||
Sir Nigel Sheinwald (Chair of the Committee) | July 1, 2012 | 8 | 8 | 100 | % | ||
Neil Carson [A] | June 1, 2019 | 4 | 3 | 75 | % | ||
Catherine J. Hughes | November 1, 2017 | 8 | 8 | 100 | % | ||
Linda Stuntz | May 23, 2018 | 8 | 8 | 100 | % | ||
[A] Neil Carson was unable to attend the Committee meeting in October 2019 due to an immovable commitment which was scheduled prior to him joining the Shell Board.
HIGHLIGHTS OF 2019
During 2019, we reviewed the purpose of the Committee and transitioned from the Corporate and Social Responsibility Committee to become the Safety, Environment and Sustainability Committee (the “Committee”). This sharpened focus will allow the Committee to play a more influential role in overseeing the practices and performance of the Company with respect to safety, environment including climate change, and broader sustainability issues.
FOCUS FOR 2020
In 2020, the Committee will continue with the sharpened focus areas established last year. The Committee will use site visits to examine Shell’s approach and performance across these focus areas. The Committee will also review Shell’s response to developments regarding climate change and the energy transition.
PURPOSE
The Committee assists the Board in reviewing the practices and performance of the Shell Group of companies, primarily with respect to Safety, Environment including Climate Change, and Sustainability.
OVERVIEW
The Committee assesses Shell's overall sustainability performance and provides input into Shell's annual reporting and disclosures on sustainability. It also advises the Remuneration Committee on metrics relating to
sustainable development and energy transition that apply to the Executive Committee scorecard and incentive programme.
The Committee also endorses Shell’s annual HSSE&SP assurance plan and reviews execution of the plan and audit outcomes.
In addition, it reviews and considers external stakeholder perspectives in relation to Shell’s business, and reviews how Shell addresses issues of public concern that could affect it’s reputation and licence to operate. Examples include plastic waste, human rights, and ethical conduct and culture.
In line with the strategic importance of the Committees agenda, the Chair and the Chief Executive Officer regularly attend the Committee meetings for discussions on specific topics. The Committee appreciated the assistance throughout the year from the Projects & Technology Business Director, Harry Brekelmans, who continues to be a strong champion for sustainability within Shell.
The overall accountability for sustainability within Shell is with the Chief Executive Officer and the Executive Committee. They are assisted by the HSSE&SP executive team.
ACTIVITIES
During 2019 the Committee reviewed its purpose and updated its terms of reference to ensure it focuses on the areas of most strategic importance to Shell.
It met regularly to review and discuss a range of prioritised topics. These included the safe and responsible operation of Shell’s facilities, environmental protection and greenhouse gas emissions, major incidents that impact safety and environmental performance, progress towards meeting Shell’s Net Carbon Footprint Ambition and short-term targets, and climate change and the energy transition.
The topics discussed in greater depth included personal and process safety, Shell’s Net Carbon Footprint Ambition and the energy transition, and Shell’s ethics programme. The Committee also reviewed Shell companies’ operations and the challenges faced in Nigeria.
SITE VISITS
One major site visit was conducted in 2019, which was to Singapore. Over three days the Committee met with Shell employees, staff, contractors, Government officials, local community leaders, and representatives from local non-governmental organisations to gain a deeper understanding of Shell’s business in Singapore. The Committee visited refinery operations at Palau Bukom and chemicals operations at Jurong Island, and reviewed Shell’s developing New Energies businesses in the country.
GOVERNANCE SHELL FORM 20-F 2019 | 90 | |
Audit Committee Report | |

ANN GODBEHERE
Chair of the Audit Committee
"The primary role of the AC is to assist the Board in fulfilling its oversight responsibilities in areas such as the integrity of financial reporting, the effectiveness of the risk management framework and internal control system as well as consideration of compliance matters."
Focus areas for 2019
• | First-year application of IFRS 16 Leases |
• | Shell’s Trading and Supply Control Framework |
• | Net Carbon Footprint Assurance and Reporting Framework |
• | Oil and Gas Reserves Control Framework |
Priorities for 2020
• | Decommissioning |
• | Integrated Risk Management |
• | New Business Models and Ventures |
• | Pensions |
Dear Shareholders,
I am pleased to present our Audit Committee Report for 2019, having assumed chairmanship of the Audit Committee (AC) when Euleen Goh stepped down in June of last year.
The primary role of the AC is to assist the Board in fulfilling its oversight responsibilities in areas such as the integrity of financial reporting, the effectiveness of the risk management framework and internal control system as well as consideration of compliance matters. We are also responsible for assessing the quality of the audit performed by and the
independence and objectivity of the external auditor, and making a recommendation to the Board on the appointment or reappointment of the external auditor. Further, we oversee the work and quality of the internal audit function.
I meet regularly with the Chief Financial Officer, EVP Taxation and Controller, Chief Internal Auditor and the external auditor. Further, these same individuals attend every AC meeting as well as any other members of Shell’s management, as necessary, to provide in-depth analysis on specific topics or on more detailed technical matters that may arise.
Over the course of a year, the AC has a rolling agenda covering a variety of standing matters such as the control framework for the reporting of Shell’s oil and gas reserves; information risk management; tax matters; and briefings from the Chief Internal Auditor on the effectiveness of Shell’s risk management and internal control system and on outcomes of significant audits and notable control matters. Specific attention is given to topics that we consider particularly significant, including issues and judgements relating to Shell’s Consolidated Financial Statements, as discussed in more detail later in this report. In 2019 in addition to standing matters, the AC addressed a number of areas of special focus including evaluating the first year of application of the new accounting standard IFRS 16 Leases; Shell’s Trading and Supply control framework; and the control framework for the reporting of Shell’s Net Carbon Footprint ambition. The AC visited Shell’s advanced security operations in the Netherlands, the finance operations centre in Chennai and the IT Hub in Bangalore. With these site visits we deepen our understanding of the operations in the respective locations and how they interface with Shell’s business functions. The visits also provide the AC with an opportunity to engage with a cross-section of Shell staff in each location.
In closing I would like to take this opportunity to thank Euleen for her excellent chairmanship of the AC since 2016 and for the valuable insights she provided as both a member since September 2014 and as the Chair.
Ann Godbehere
Chair of the Audit Committee
March 11, 2020
COMPOSITION AND MEETINGS OF THE AUDIT COMMITTEE
During 2019, the members and meeting attendance of the AC were as follows:
Committee Member | Member since | Maximum possible meetings | Number of meetings attended | % of meetings attended | ||
Ann Godbehere (Chair) | May 23, 2018 | 6 | 6 | 100% | ||
Euleen Goh [A] | September 1, 2014 | 3 | 3 | 100% | ||
Roberto Setubal | October 1, 2017 | 6 | 6 | 100% | ||
Gerrit Zalm | March 8, 2017 | 6 | 6 | 100% | ||
[A] Euleen Goh stood down as Chair and a member of the AC on June 30, 2019.
GOVERNANCE SHELL FORM 20-F 2019 | 91 | |
All members of the AC are financially literate, independent Non-executive Directors. In respect of the year ended December 31, 2019, for the purposes of the UK Corporate Governance Code, Ann Godbehere qualifies as: a person with “recent and relevant financial experience” and competence in accounting; and, for the purposes of US securities laws, is an “audit committee financial expert”.
The experience of the AC members outlined on page 70-72 demonstrates that the AC as a whole has competence relevant to the sector in which Shell operates, as well as the necessary commercial, regulatory, financial and audit expertise required to fulfil its responsibilities. The AC members have gained further knowledge and experience of the sector as a result of their Board membership and through various site visits since their respective appointments.
The AC covers a variety of topics in its meetings. These include both standing items that the AC considers as a matter of course, typically in relation to the quarterly financial reporting, control matters, accounting policies and judgements and reporting matters, and a range of topics relevant to Shell’s control framework.
The AC invites the Chief Financial Officer, the Legal Director, the Chief Internal Auditor, the Executive Vice President Taxation and Controller, the Vice President Accounting and Reporting and the external auditor to attend each meeting. The Chief Executive Officer attends each meeting where the quarterly, half-year and year-end results are discussed. The Chair of the Board also regularly attends the meetings. Other members of management attend when requested. The AC regularly holds private sessions separately with the external auditor and the Chief Internal Auditor without members of management, except for the Legal Director, being present.
RESPONSIBILITIES
The roles and responsibilities of the AC as set out in its Terms of Reference are reviewed annually, taking into account relevant regulatory changes and recommended best practice. The key responsibilities of the AC include, but are not limited to:
Evaluating the effectiveness of the system of risk management and internal control;
• | Reviewing the integrity of the financial statements, including annual reports, half-year reports, and quarterly financial statements; |
• | Reviewing and discussing with management the appropriateness of judgements involving the application of accounting principles and disclosure rules; |
• | Advising the Board whether the Annual Report is fair, balanced and understandable and provides the information necessary for shareholders to assess Shell’s position and performance, business model and strategy; |
• | Reviewing the functioning of the Shell Global Helpline and reports arising from its operations; |
• | Overseeing compliance with applicable legal and regulatory requirements, including monitoring ethics and compliance risks; |
• | Monitoring the qualifications, expertise, resources and independence of both the internal and external auditor; |
• | Assessing the internal and external auditor’s performance and effectiveness each year; and |
• | Recommending to the Board the appointment or reappointment of the external auditor. |
The AC keeps the Board informed of its activities and recommendations and the Chair of the AC provides an update to the Board after every AC meeting. The AC promptly reports concerns to the Board if it is not satisfied with or believes that action or improvement is required concerning any aspect of financial reporting, risk management and internal control, compliance or audit-related activities.
A copy of the AC’s Terms of Reference can be found at www.shell.com.
ACTIVITIES
During 2019, the AC received comprehensive reports from management and the external auditor on a variety of topics related to management controls and accounting policies, practices and reporting. The AC also reviewed whistleblowing reports and internal audit reports and considered management’s responses and conclusions to the various findings in these reports.
In addition to the items discussed under significant issues on page 95, the AC also dedicated time to the following matters during 2019:
• | Trading and Supply’s Control Framework. Following its 2018 visit to the Trading and Supply office in London and given the growth in this area, the AC continued to focus on key control matters and improvements in processes underway within Trading and Supply. The AC was briefed on various actions which management is undertaking to further strengthen controls, including system controls and new hires in the areas of compliance and risk management. |
• | Shell’s Net Carbon Footprint Control Framework. Following Shell’s announcement to link a Net Carbon Footprint target and other measures to executive remuneration starting in 2019, the AC reviewed the processes and procedures governing the annual preparation and assurance of Shell’s Net Carbon Footprint value. The AC considered the methodology, key aspects of the Net Carbon Footprint model, important control points, assurance mechanisms to validate the integrity of the data and disclosure, and the process for managing and verifying any changes to the model. |
• | Tax risks. In addition to the regular review of Shell’s tax position, the AC discussed with management the key tax risks stemming from the evolving tax landscape, including intensified audit scrutiny and increasing demands for transparency. The AC also discussed measures underway in response to these trends and developments, including for example Shell’s publication of its first Tax Contribution Report in 2019. |
• | Information Risk Management. The Chief Information Officer briefed the AC on the activities undertaken in 2019 with respect to information risk management, information security controls, security improvement initiatives and Shell’s cyber monitoring and defence capabilities and controls. The AC discussed with the Chief Information Officer the evolving digital landscape and the steps management is taking to manage change, including planned activities for 2020. |
Oil and Gas Reserves Control Framework. The AC was briefed on the framework in place to ensure accurate reserve information is reported in an efficient manner. The AC considered the processes and controls in place to assure compliance with reporting requirements and annual updates to maintain a robust framework.
The AC also reviewed: the year-end reported proved oil and gas reserves, including management judgements and adjustments made to reflect changes in geological, technical, contractual and economic information, the Brent crude oil and Henry Hub natural gas long-term price assumptions; estimated refining margins; discount rates used for financial reporting, particularly with respect to impairment testing and decommissioning and other provisions (see Note 2 to the “Consolidated Financial Statements” on pages 148-156 for further information); and the effectiveness of financial controls.
The AC discussed with the Chief Ethics and Compliance Officer his report on compliance matters, including an overview of the effectiveness of the Shell ethics and compliance programme in managing ethics and compliance risk in Shell’s business activities, regulatory developments and compliance risks. The AC also discussed investigations of cases involving ethics and compliance concerns. The AC discussed management’s findings in such cases to satisfy itself that a rigorous process had been followed,
GOVERNANCE SHELL FORM 20-F 2019 | 92 | |
and, where appropriate, learnings had been embedded by management into the systems and controls of the organisation.
The AC was briefed on litigation matters (see “Governance” on page 79 and Note 25 to the “Consolidated Financial Statements” on pages 185-187); new regulatory requirements, including the UK Financial Reporting Council’s (FRC’s) 2018 UK Corporate Governance Code, and various market studies and proposals into the external audit market. The AC was also briefed on corporate governance developments, including the EU Sustainable Finance initiatives and related legislative proposals.
In March 2019, the AC visited the advanced security operations in the Netherlands and in May 2019, the finance operations centre in Chennai and the IT Hub in Bangalore. These visits provided the opportunity for the AC to gain a deeper understanding of the various activities undertaken in each location including new technologies and digital opportunities, and how they support Shell’s business activities. Topics discussed during the site visits included: threat intelligence; incident management; vulnerability management and forensics; use of data analytics; bots; data engineering; market risk analyses; impairment analysis process; digitalisation; new applications/solutions development process; process automation; and Information Technology general controls. The AC was provided with information on the external environment and the relevant regulations within each location’s operations. During the visits to the Chennai and Bangalore sites, the AC was also briefed on Shell’s operations in India.
In 2019, the AC updated its Terms of Reference to reflect applicable provisions from the 2018 UK Corporate Governance Code published by the FRC, including the Chair’s engagement with the Company’s Shareholders on significant matters related to the AC’s responsibilities and the AC’s oversight of the audit tender process. The Terms of Reference were also updated to reflect the AC’s responsibilities regarding Shell’s Global Helpline as well as ethics and compliance risks.
As part of a review of Shell’s external reporting, the decision was taken to produce a separate Annual Report and Form 20-F beginning with fiscal year 2019. The AC provided its input on the merits of this initiative and considered the control framework which has been put in place to ensure the disclosures in both reports comply with relevant requirements.
The AC discussed the audited financial statements with management and the external auditor. The AC advised the Board that in its view the 2019 Form 20-F including the financial statements for the year ended December
31, 2019, taken as a whole, provides the information necessary for shareholders to assess Shell’s position and performance, business model and strategy and the inclusion of the audited financial statements in the 2019 Form 20-F is appropriate. To arrive at this conclusion, the AC critically assessed drafts of the 2019 Form 20-F including the financial statements and discussed with management the process undertaken to ensure compliance with applicable requirements. This process included: verifying that the contents of the 2019 Form 20-F are consistent with the information shared with the Board and management during the year to support their assessment of Shell’s position and performance; ensuring that consistent materiality thresholds are applied for favourable and unfavourable items; considering comments from the external auditor; and receiving assurance from the Executive Committee (EC). The AC further reviewed and considered the Directors’ half-year and full-year statements with respect to the going concern basis of accounting. Further, the AC discussed with the external auditor matters regarding the audit and the quality of the accounting principles employed by management.
The AC considered and approved the internal audit function’s annual audit plan, including focus areas for 2019 comprising of management controls of IT systems and infrastructure, information and data, operational assets and businesses, contracting and procurement, resource and project delivery, and ethics and compliance. The AC also considered and approved proposed updates to the Shell Internal Audit Charter which take into account the revised UK Corporate Governance Code and other regulatory changes. The AC assessed the performance of the internal audit function under the new Chief Internal Auditor, who was appointed with effect from September 2018, as effective. The AC also assessed the performance of the Chief Internal Auditor. With respect to the external auditor, the AC considered the annual external audit plan (including assessing whether the planned materiality levels and proposed resources to execute the audit plan were consistent with the audit scope) and approved related remuneration to ensure that the level of fees would allow an effective and high-quality audit to be conducted by the external auditor.
SYSTEM OF RISK MANAGEMENT AND INTERNAL CONTROL
The AC reviewed reports on risks, controls and assurance, including the annual assessment of the system of risk management and internal control, in order to monitor the effectiveness of the procedures for internal control over financial reporting, compliance and operational matters. This included the Company’s evaluation of the internal control over financial reporting as required under Section 404 of the Sarbanes-Oxley Act.
GOVERNANCE SHELL FORM 20-F 2019 | 93 | |
Activities performed | Frequency |
Reporting | |
Reviewed Shell’s accounting policies and practices, including compliance with accounting and reporting standards | Q |
Reviewed the appropriateness of material judgements and the interpretation and application of accounting principles | Q |
Considered the integrity of the year-end financial statements and recommended to the Board whether the audited financial statements should be included in the Annual and statutory reports | A |
Considered the integrity of the half-yearly report and quarterly financial statements | Q |
Reviewed management’s assessment of going concern and longer-term viability and endorsed the annual viability statement | P |
Reviewed Shell’s policies with respect to earnings releases; financial performance information and earnings guidance; oil and gas reserves accounting and reporting; and significant financial reporting issues | Q |
Reviewed the internal controls in relation to financial reporting | P |
Advised the Board of the AC’s view on whether taken as a whole, the Annual Report is fair, balanced and understandable and provides the information necessary for shareholders to assess Shell’s position and performance, business model and strategy. | A |
Assessed management’s response to significant audit findings and recommendations | P |
Risk Management and Internal Control | |
Monitored the effectiveness of the Shell’s risk management and internal control system | P |
Received briefings on regulatory developments | P |
Reviewed management's SOX 404 assessment | A |
Discussed the control framework related to Shell’s Net Carbon Footprint | P |
Considered the control framework related to oil and gas reserves | P |
Discussed significant matters arising from the internal audit with the Chief Internal Auditor, management and Ernst & Young LLP (EY) | Q |
Evaluated the quality, efficiency and effectiveness of the internal audit function including the competence, qualifications, expertise, compensation and budget | A |
Reviewed and approved the internal audit function’s remit, charter and audit plan | A |
Assessed the performance of the Chief Internal Auditor | A |
Reviewed significant legal matters with Shell’s Legal Director | Q |
Discussed and reviewed Finance Group's succession planning | A |
Reviewed the Chief Financial Officer’s significant business and investment transactions for potential conflicts or related party transactions | A |
Assessed the Chief Financial Officer’s performance | A |
Reviewed Shell’s information risk management | P |
Reviewed Shell’s tax function, key tax risks and discussed evolving area of tax transparency | P |
Received briefings regarding Shell’s Trading and Supply control framework | P |
Reviewed and discussed Shell Finance’s IT strategy | P |
External Auditor | |
Considered the independence of EY | A |
Reviewed and approved the engagement letter for EY's annual audit of the Company's consolidated and parent company financial statements | A |
Approved the renumeration for audit and non-audit services, including pre-approval of permissible non-audit service | Q |
Considered the annual external audit plan and monitored the execution and results of the audit | P |
Monitored the qualifications, expertise, resources and independence and objectivity of EY | A |
Reviewed the Company’s representation letter prior to signing by management | A |
Assessed the performance and effectiveness of EY, the audit process, the quality of the audit, the handling of key judgements by EY, and EY’s response to questions from the AC | P |
Recommended to the Board for the re-appointment of EY to be put to the Company’s shareholders for approval at the Annual General Meeting (AGM) | A |
Compliance and Governance | |
Monitored the receipt, retention, investigation and follow-up actions of complaints received, including those from the Shell Global Helpline | P |
Reviewed with the Chief Ethics and Compliance Officer the implementation and effectiveness of the Ethics and Compliance programme and function | A |
Discussed compliance with applicable external legal and regulatory requirements | P |
Performed an evaluation of the AC’s performance and effectiveness | A |
Reviewed and updated the AC’s Terms of Reference | P |
A = Annually, Q = Quarterly, P = Periodically
SIGNIFICANT ISSUES
GOVERNANCE SHELL FORM 20-F 2019 | 94 | |
The AC assessed the following significant issues, including those related to Shell’s 2019 Consolidated Financial Statements. The AC was satisfied with how each of the issues below was addressed. As part of this assessment, the AC received reports, requested and received clarifications from management, and sought assurance and received input from the internal and external auditors.
Significant issues | ||
Subject | Issue | How the AC addressed the issue |
DISPOSALS See Notes 5 and 8 to the “Consolidated Financial Statements” on pages 161 and 163-165. | Several significant disposals were completed in 2019. Prior to disposal, judgement is required in determining whether a sale is highly probable. If it is, the asset should be classified as held for sale, which is a trigger for impairment testing. Judgement may also be required when accounting for the disposal, for example in estimating the amount of any liabilities retained by Shell. . | The AC considered the application of the held-for-sale classification, as well as the accounting for any ensuing disposals, including the divestment of Upstream assets in Denmark and US Gulf of Mexico, as well as Downstream assets in the US and Saudi Arabia. Particular attention was given to the assessments of any impairment indicators, as well as the accounting for any retained obligations, together with the assumptions used in determining any resulting charges and the tax treatment thereof. |
IMPAIRMENTS See Notes 2A, 2B and 8 to the “Consolidated Financial Statements” on pages 148-156 and 163-165. | The carrying amount of an asset should be tested for impairment when there is an indication of possible change in carrying value such as a reduction in performance, other than short term, or being classified as held for sale. | The AC challenged whether there were indicators of impairment or reversals of previously recorded impairments and carefully considered the impairment assessments that were performed. In so doing, the AC reviewed the oil and gas price and refining margin outlooks against market developments and benchmarks. The potential impact of certain price sensitivities was also considered, together with the relevant discount rates applied. The AC also reviewed other significant inputs to impairment assessments, including proved oil and gas reserves. The AC also considered the potential impact of climate change and energy transition. The AC satisfied itself with the appropriateness of the impairment testing performed and the impairment charges or reversals recognised in relation to certain Integrated Gas and Upstream assets. These charges or reversals were mainly triggered by market changes and asset performance. |
TAXATION See Notes 2A, 2B and 16 to the “Consolidated Financial Statements” on pages 148-156 and 170-173. | The determination of tax assets and liabilities requires the application of judgement as to the ultimate outcome, which can change over time depending on facts and circumstances. In particular, the recognition of deferred tax assets requires management to make assumptions regarding future profitability and is therefore inherently uncertain. | The AC considered tax exposures, including those associated with 2019 disposals. The AC also evaluated the appropriateness of the recognition of deferred tax assets. The AC deemed the resulting assessments of uncertain tax exposures and the recognition of deferred tax assets to be reasonable. |
FIRST-YEAR APPLICATION OF IFRS 16 See Note 3 to the “Consolidated Financial Statements” on page 156. | With effect from January 1, 2019, IFRS 16 Leases replaced IAS 17 Leases. Under the new standard, all lease contracts, with limited exceptions, are recognised in the financial statements by way of right-of-use assets and corresponding lease liabilities. Shell applied the modified retrospective transition approach without restating comparative information. In March 2019, the IFRS Interpretation Committee (IFRIC) decision on recognition of lease liabilities in unincorporated joint operations was concluded. During Q2 and Q3 2019 potential exposures were assessed to determine where Shell, as operator, has primary responsibility for the lease liability and would therefore be required to recognise these leases. | In 2018, the AC appraised and approved accounting policy changes resulting from the implementation of IFRS 16. In 2019, the AC reviewed management’s analysis of the first-year application of IFRS 16, including key judgements, and concurred with their recommendations. The AC also reviewed the impact of the application of IFRS 16 on the relevant Alternative Performance Measures (APM). The AC assessed management’s application of the IFRIC’s decision regarding the recognition of lease liabilities by a joint operator in relation to its interest in an unincorporated joint operation. |
DISCOUNT RATE FOR PROVISIONS | A review was carried out to consider the discount rate applied for provisions due to a lower rate for 30-year US Treasury bonds. Based on management's review the discount rate for provisions was lowered from 4% to 3% in 2019. This was applied to provision balances at December 31, 2019. | The AC considered the impact that this change will have in relation to increasing provisions. There was specific discussion on the impact to decommissioning and restoration provisions and corresponding decommissioning and restoration assets. |
INTERNAL AUDIT
The internal audit function is an independent and objective assurance function which supports Shell in improving its overall control framework. The internal audit function contributes to the maintenance of a systematic and disciplined approach to evaluate and improve the design and effectiveness of Shell’s risk management, control and governance processes. The primary role of the internal audit function, through its
assurance and investigation activities, is to safeguard value by protecting Shell’s assets, reputation and sustainability in relation to the organisation's defined goals and objectives.
The AC defines the responsibility and scope of the internal audit function and approves its annual plan. The Chief Internal Auditor reports functionally to the Chair of the AC and administratively to the Chief
GOVERNANCE SHELL FORM 20-F 2019 | 95 | |
Financial Officer. The Chair of the AC approves, in consultation with the Chief Financial Officer, all decisions regarding the performance evaluation, appointment or removal of the Chief Internal Auditor.
The Chief Internal Auditor periodically assesses whether the purpose, authority, and responsibilities of the internal audit function continue to enable it to accomplish its objectives. The results of this periodic assessment are communicated to the EC and AC. The Chief Internal Auditor maintains an internal quality assurance and improvement programme covering all aspects of the internal audit activities, to evaluate the conformance of these activities with the Chartered Institute of Internal Auditors' standards. The programme also assesses the efficiency and effectiveness of the internal audit activities and identifies opportunities for improvement. The results of this annual assessment are communicated to the EC and AC and include a reconfirmation to the AC of the continued validity of the charter of the internal audit function, or proposals for an update. At least every five years, the effectiveness and quality of the internal audit function are assessed externally and the report shared with the AC. An independent assessment of internal audit was conducted in 2018 and the next such external assessment is planned to take place in 2023.
EXTERNAL AUDITOR
The AC is responsible for considering whether, in order to ensure continuing auditor quality and/or independence, there should be a rotation of the independent registered public accounting firm, including consideration of the advisability and potential impact of selecting a different independent public accounting firm. The Company’s current external auditor, EY, was first appointed at the AGM in May 2016 following the conclusion of a competitive tender process. The Company has complied with The Statutory Audit Services for Large Companies Market Investigation (Mandatory Use of Competitive Tender Processes and Audit Committee Responsibilities) Order 2014 for the 2019 financial year.
At the AGM in May 2019, a resolution to reappoint EY as external auditor until the conclusion of the next AGM was approved by shareholders. There are no current plans to retender the appointment. The current external audit partner is Allister Wilson, who has held this position since EY’s initial appointment as external auditor in 2016 and will therefore be rotating off the Shell audit following the 2020 audit engagement. As part of its annual assessment of EY, the AC discussed the upcoming partner rotation and measures EY has taken for an orderly transition.
The AC evaluated the objectivity and independence of EY and the quality and effectiveness of the external audit process. As part of its evaluation, the AC, considered: (i) the results of Shell management’s internal survey relating to EY’s performance over the financial year 2019; (ii) views and recommendations from management and the Chief Internal Auditor; (iii) EY's audit quality priorities and actions by EY as part of its sustainable audit quality programme; and (iv) the AC’s own experiences, including interactions throughout the year with the external auditor. Key criteria of the evaluation included: professionalism in areas including competence, integrity and objectivity; constructive challenge of management and key judgements; efficiency, covering aspects such as service level and innovation in the audit process; thought leadership and value added; and compliance with relevant legislative, regulatory and professional requirements. Taking into account the above, the AC is satisfied that EY has continued to provide a high-quality and effective audit in its fourth year as auditor and maintained its independence and objectivity.
During 2019, there was no review of EY’s audits of Shell’s Consolidated Financial Statements by the Audit Quality Review (AQR) team of the FRC.
Following due consideration, the AC has recommended to the Board to propose at the 2020 AGM that EY be reappointed as the external auditor of the Company for the year ending December 31, 2020. There are no contractual obligations that restrict the AC’s ability to make such a recommendation.
As required under UK and US auditing standards, the AC received a letter from EY confirming its independence.
NON-AUDIT SERVICES
The AC maintains an independence policy in respect of the provision of services by the external auditor. The AC regularly reviews this policy for necessary changes in response to changes in related standards and regulatory requirements. Following the issuance of the Revised Ethical Standards by the FRC in December 2019, the AC updated its independence policy to reflect these new standards.
This policy, designed to safeguard auditor objectivity and independence, includes rules relating to the provision of audit services, audit-related services and other non-audit services, and stipulates which services require specific prior approval by the AC.
The policy also defines prohibited services that are not to be provided by the auditor as these represent a risk to external auditor independence. Prohibited services are any that relate to management decision-taking or any other service that would compromise auditor independence or the perception thereof. These prohibited services include all services listed as prohibited in the UK and US auditor independence rules.
For certain services that are not prohibited, because of the knowledge and experience of the external auditor and/or for reasons of confidentiality, it can be more efficient or prudent to engage the external auditor rather than another party. This is particularly the case in relation to audit-related assurance services that are closely connected to the audit function where the external auditor has the benefit of knowledge gained from work already performed as part of the audit.
Under the policy, the AC will only approve services to be carried out by the external auditor or its affiliates where such services do not present a conflict of interest risk in fact or in appearance. The AC reviews quarterly reports from management on the audit and non-audit services reported in accordance with the policy or for which specific prior approval from the AC is being sought. To the extent that the fee value of an additional audit service contract does not individually exceed $500,000, then no prior approval of the AC is required. All non-audit services where the fee for an individual contract exceeds $50,000 (as from March 15, 2020, $100,000), including audit-related services, require individual prior approval by the AC. In each case where the audit or non-audit service contract does not exceed the relevant threshold, the matter is subsequently reported at the next quarterly AC meeting.
FEES
The total auditor’s remuneration of $54 million (2018: $53 million, 2017: $53 million) is categorised as follows: audit $52 million (2018: $50 million, 2017: $50 million), audit-related $1 million (2018: $2 million, 2017 $2 million), and all other fees $1 million (2018: $1 million, 2017: $1 million).
AC EVALUATION
The AC undertakes an annual evaluation of its performance and effectiveness. Consistent with the Board’s annual performance evaluation for 2019, the AC’s performance evaluation was facilitated by Independent Board Evaluation, an independent consulting firm. Each AC member was interviewed for their views covering topics relating to: the management of the AC in areas such as the annual cycle of work, agenda for meetings, and time and input in meetings; rating the quality of the information provided to the AC; the effectiveness of the AC’s oversight in areas such as the work of internal and external audit, the Group’s financial reporting, the system of internal controls and the risk management policies and practices; rating the AC’s performance in reviewing and assessing significant accounting and reporting issues; and generally how to improve the AC’s performance. When assessing progress against 2018, the AC concluded that 2019 priorities identified in the 2018 evaluation (including a visit to the finance operations in Chennai and discussions related to the first-year application of IFRS 16, regulatory developments, information risk management and the Net Carbon Footprint control framework) had all been undertaken by the AC in 2019. The AC discussed the outcome of this review as part of its annual evaluation. The AC concluded that its performance in 2019 had been effective and that it fulfilled its role in accordance with its Terms of Reference.
GOVERNANCE SHELL FORM 20-F 2019 | 96 | |
In preparing its workplan for 2020 the AC has agreed the following focus areas in addition to the standing items: Trading and Supply, regulatory developments, decommissioning, integrated risk management, new business models and ventures, pensions and visits to Shell’s operations in Singapore, Kuala Lumpur, Malaysia, and the finance operations centre in Krakow, Poland.
GOVERNANCE SHELL FORM 20-F 2019 | 97 | |
Directors’ Remuneration Report | |

GERARD KLEISTERLEE
Chair of the Remuneration Committee
“Listening to shareholders has been critical for the REMCO in shaping our decisions for 2019 and the proposed 2020 remuneration policy”
2019 outcomes |
Annual bonus: below-target award, with downward discretion applied for fatalities. |
LTIP: above-target vesting, based on long-term performance. |
2020 policy features |
Alignment to strategy: formalisation of energy transition LTIP condition. |
Quantum: reduce CEO LTIP grant and increased focus on the REMCO’s use of discretion to manage Single Figure outcomes. |
Simplification: removed individual performance factor and reduced CEO target bonus. |
THIS REPORT
This Directors’ Remuneration Report for 2019 has been prepared in accordance with relevant UK corporate governance and legal requirements, in particular Schedule 8 of The Large and Medium-sized Companies and Groups (Accounts and Reports) Regulations 2008 (as amended). The Board has approved this report.
This report consists of two further sections:
• | the Annual Report on Remuneration (describing 2019 remuneration as well as the planned implementation of the Directors’ Remuneration Policy in 2020) which will be subject to an advisory vote at the 2020 AGM; and |
• | the Directors’ Remuneration Policy which will be subject to a binding shareholder vote at the 2020 AGM. |
Dear Shareholders,
I am pleased to present the 2019 Directors’ Remuneration Report. This includes my last letter as Chair of the Remuneration Committee (REMCO), our Annual Report on Remuneration and the proposed Directors’ Remuneration Policy for 2020 onwards.
It has been another busy year for the REMCO and we have appreciated the ongoing support and engagement of our shareholders as we finalised our proposals on a revised policy and navigated the requirements of the new UK Corporate Governance Code.
In preparing the Annual Report on Remuneration for the year ended December 31, 2018, the REMCO paid particular attention to enhancing disclosures and explaining its decision making, and it was pleased with the level of support (89.93%) received in favour.
The outstanding performance, which underpinned the 2018 pay outcomes, the strong link between pay and performance and the REMCO’s prudence in managing pay outcomes over the long term was recognised by many shareholders. Notwithstanding this, a number of shareholders raised concerns over the absolute quantum of the CEO’s 2018 remuneration. The REMCO has reflected long and hard on this and quantum has been a matter of careful consideration both in our decisions for the 2019 remuneration outcome as well as in our proposals for the 2020 policy update, as I hope you will appreciate.
So let me now turn to 2019 performance and the remuneration outcomes.
2019 PERFORMANCE AND REMUNERATION OUTCOMES
Annual Bonus
During 2019 the ambition to thrive in the energy transition was progressed; the optimisation and marketing capabilities of the Integrated Gas and Downstream businesses helped deliver above-plan earnings, and project delivery was strong, reflecting the focus on capital discipline. However, assessed against the 2019 scorecard targets, a poor outcome on safety, a difficult macroeconomic environment and areas of operational challenge meant overall performance was below target.
It is worth reiterating that the REMCO has long had a policy of not adjusting remuneration measures to take into account changes in oil and gas prices and currency fluctuations. This means Senior Management also experience the ups and downs of the macroeconomic environment impacting our business and shareholders. In our engagements with our largest shareholders, many have appreciated the transparency this brings.
Financial performance
Cashflow from operations was below the minimum threshold set for 2019. This was driven by challenging macroeconomic conditions, with lower than anticipated oil and gas prices and very difficult market conditions for Shell’s Refining and Chemicals businesses. This was exacerbated by operational issues in parts of the Upstream and Integrated Gas businesses.
Operational performance
▪ | Production volumes were below target by 2.53%. This was driven by a number of operational issues and delays bringing projects on-stream |
▪ | LNG liquefaction volumes were below target by 2.20%, mainly due to delayed project start-ups and slower ramp-ups; |
▪ | The combined Refinery and Chemicals Availability outcome was above target by 0.44%, with higher downtime from unplanned events being more than compensated by lower downtime from planned events. |
▪ | Combined Project Delivery, which provides an indication of our ability to deliver projects within budget and schedule, was strong, with 90% of projects on-time and with aggregated costs below budget, reflecting the focus on capital discipline and project execution. |
GOVERNANCE SHELL FORM 20-F 2019 | 98 | |
Sustainable Development
Shell has made significant progress on safety performance over a long period of time. This is reflected on the scorecard where the targets have been made more challenging over time, and although the total recordable case frequency (TRCF) threshold was not met in 2019, the outcome remains the joint second best on Shell’s record, following the record low in 2017. However, the seven fatalities that occurred under Shell’s operational control in 2019 are not acceptable and further work on safety is needed.
Performance on the other sustainability metrics was mixed. The process safety measure in 2019 was below target. Greenhouse gas emissions were at target for Upstream and Integrated Gas, and Refining. Chemicals emissions were below target due to a strike at Moerdijk and reliability issues at Deer Park.
Summary of Scorecard Performance
The mathematical outcome of the annual bonus scorecard was 0.48 and the REMCO determined to reduce the outcome to 0.43 for Senior Management. This downward discretion was applied as a result of the increased number of fatalities in 2019. Safety is, and must remain, Shell’s number one priority. This reduction is based on the REMCO’s judgment and was not a formulaic adjustment.
Reflecting the collective responsibility of senior executives in the safe operation of Shell, internally it was decided to apply the downward discretion to around 150 senior leaders.
This brings the ten-year average scorecard outcome to 1.17. The detailed bonus scorecard breakdown and further commentary on performance are on page 105.
Annual Bonus Outcomes
For 2019, to simplify the annual bonus structure following shareholder feedback, the individual performance multiplier was removed from the bonus calculation formula for the Executive Directors. Annual bonuses are determined based solely on business performance. The CEO's target bonus was also reduced from 150% to 125%.
Based on the scorecard outcome of 0.43, the annual bonus outcome for the CEO was €800,000 and for the CFO was €500,000. This represents 41% of target (21% of maximum) and is a 73% reduction from 2018 for the CEO and a 68% reduction for the CFO.
The annual bonus for the Executive Directors is paid 50% in cash and 50% in shares subject to a three-year holding period, which applies beyond an Executive Director's tenure.
Long-term incentive plan (LTIP)
While performance in 2019 assessed against our annual bonus scorecard metrics was below target, on the LTIP we continue to see the impact of the longer-term efforts to transform Shell to deliver increased shareholder value and better performance against the comparator companies.
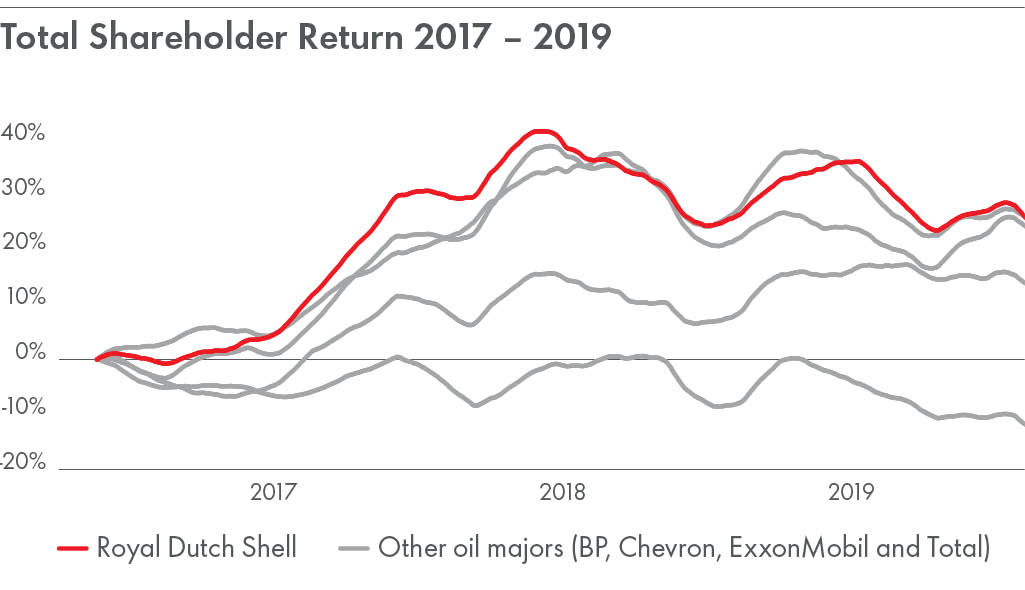
Shell made $61 billion of distributions to shareholders over the performance period, including dividend payments and share buybacks. Shell was second on total shareholder return (TSR), by less than 0.4%, during a period which has recently been challenging for the sector. Relative CFFO growth was
third in the comparator group. Shell generated $131 billion over the period, ranking first in absolute terms. ROACE of 5.6% was also improved, with growth ranking first in the comparator group, reflecting our work to high-grade and reshape the portfolio [A].
On free cash flow (FCF), Shell exceeded the three-year cumulative target of $85 billion with total FCF over the period of $93.4 billion.
These outcomes continue to reflect the success of Shell’s strategy since 2016 and the progress made in building a world-class investment case. Over the 2017-2019 performance period, Shell has delivered on commitments to strengthen the financial framework; cancelling the Scrip Dividend Programme and starting the $25 billion share buyback programme ($14.75 billion completed as at January 22, 2020).
[A] For comparability purposes we calculate ROACE for LTIP purposes on disclosed net income which is not adjusted for the after-tax interest expense, it therefore differs from disclosed ROACE.
After taking account of the outcome of the performance metrics, as well as considering the wider performance of Shell over the performance period, the final vesting outcome of the 2017 LTIP award was approved at 147%.
This brings the ten-year average vesting outcome to 104%. This is broadly aligned with our target grant, although there have been a number of high and low-vesting outcomes over the past 10 years. The REMCO believes this illustrates the fundamental effectiveness of the LTIP and the close alignment between pay and performance the current LTIP structure has provided over a long period of time.
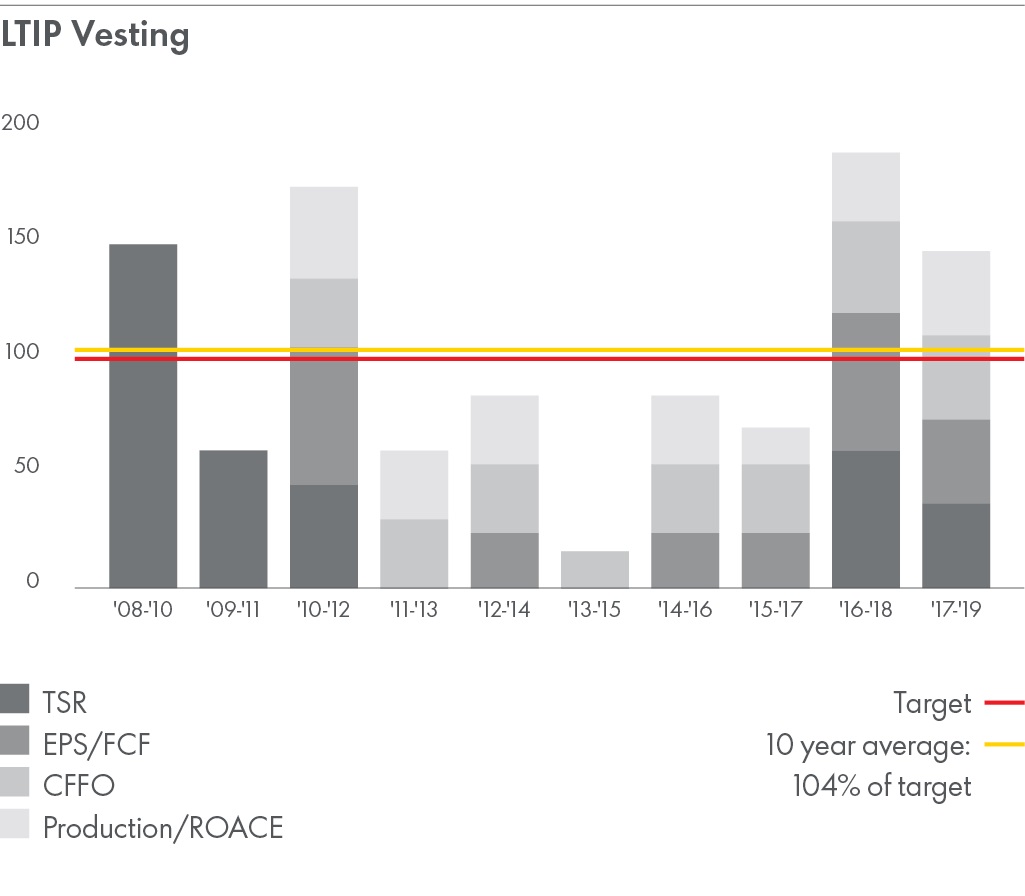
CEO Single Figure Outcomes
The REMCO considered the quantum of the Single Figure outcome (€9,963,670 for the CEO) and in finalising their remuneration decisions for 2019, considered a range of factors, further details of which are provided on page 107. These included both Shell’s and personal performance in 2019, in the period 2017-2019 and the internal relativity of remuneration compared to the variable pay outcomes for employees.
The REMCO noted that it had already reduced the CEO’s target bonus for 2019 from 150% to 125% and the quantum of award was further adjusted downwards on a discretionary basis given the seven fatalities in the year. It recognised the strong competitive results from 2017-2019, but also reflected on the challenging 2019 performance, partly driven by difficult macroeconomic conditions, related to lower cash flow, operational challenges and safety. The REMCO also noted the reductions in annual bonus and LTIP outcomes and that the CEO’s overall remuneration was 51% lower than in 2018, and was satisfied that the Single Figure represented an appropriate and competitive level of remuneration within the bounds of the shareholder-approved policy.
GOVERNANCE SHELL FORM 20-F 2019 | 99 | |

PAY IN A WIDER CONTEXT
The REMCO believes that there should be alignment between pay structures for the Executive Directors and employees. This is important, both to reinforce a common commitment to Shell’s strategic goals and to give employees the opportunity to share in Shell’s success. The majority of Shell’s employees share the same scorecard as the Executive Directors. In addition, around 16,500 of Shell’s employees are granted performance share awards on terms that are broadly similar to the conditions that also apply to the Executive Directors through the LTIP.
The ratio of the CEO’s pay to the median UK worker is 87. The global pay ratio, calculated by comparing the CEO single figure to the average employee headcount cost, is 75. These numbers have significantly decreased from 2018, where the average pay ratio was 143 compared to the UK median ratio and 149 in comparison to the global employee ratio. The principal reasons for the changes are the decrease in the CEO’s single figure from 2018, balanced by the reduction in the variable pay outcomes for all employees, and the acquisition of First Utility (now Shell Energy Retail).
The REMCO noted that even with the exceptional CEO pay outcome in 2018 based on strong company performance, our pay ratio was consistent with the pay ratios seen in other major FTSE 30 companies. The REMCO is cautious about drawing any direct conclusions from the comparison of ratios, given the differences in industry and employee profile between companies.
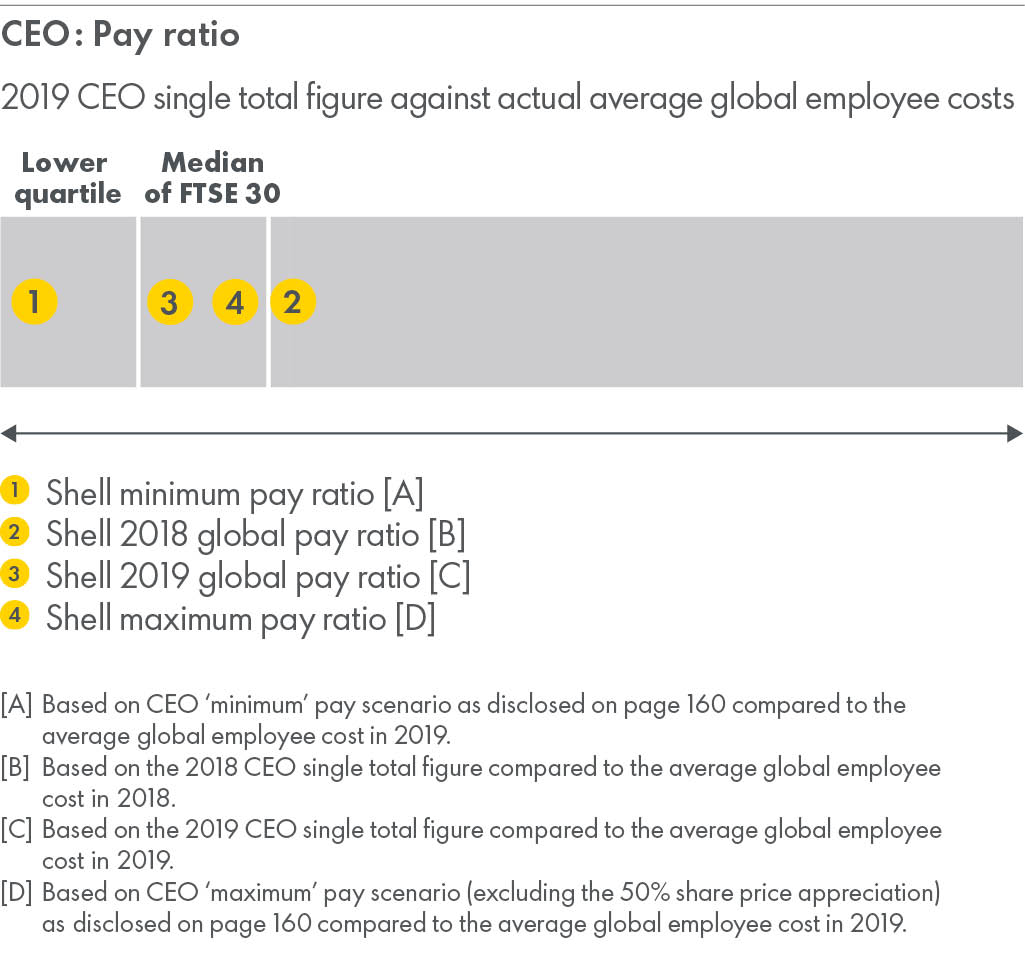
Shell’s gender pay gap for 2019, published in accordance with the reporting
required under the UK Equality Act 2010 (Gender Pay Gap Information) Regulations, increased slightly from 18.6% to 18.7%. This increase is
primarily due to the effect of including employees from Shell’s acquisition of First Utility, in the calculation for the first time. On a like-for-like basis, it would have been 15.1%, an improvement of 3.5 percentage points. Shell’s goal is to ensure the equal participation of women and men in all areas of work, at all levels and locations ensuring equal access to the same recognition, reward and career progression opportunities. As 2019 illustrates, these changes will be influenced by changes in our business and may be non-linear. However, the REMCO has confidence in the policies Shell has to increase the representation of women at all levels in the organisation.
2020 REMUNERATION POLICY
I would now like to turn to the remuneration policy that will be voted on
at the 2020 AGM.
The REMCO has spent time considering the alignment of remuneration policies to Shell’s strategic goals, listening to shareholder views, gathering input on executive pay market developments, and reflecting on wider societal trends in developing the revised policy. I have had the opportunity to meet with many shareholders personally during this process and want to thank them for expressing their point of view. The various perspectives they have provided have helped shape a number of key decisions. Notably, this feedback has been critical in shaping our development of the Energy Transition metric and our intended response to managing the issue of quantum.
In our policy deliberations, we have been guided by three objectives:
Strategy should be set first, and then the remuneration policies designed to support the achievement of those strategic goals. This is our overriding imperative: the decisions we make as the REMCO must be tightly and inextricably linked to Shell’s strategy.
Second, we must maintain a package that is externally competitive and ensures the business can attract and retain the management talent capable of ensuring the ongoing success of Shell and delivering a high level of returns for shareholders while navigating through the complexity of the energy transition.
Finally, there must be internal proportionality. The policies we enact for the Executive Directors should be, as far as possible, consistent and aligned with the approach to managing remuneration across the Shell Group.
The REMCO believes the existing structures remain robust and consistent with these objectives. The annual bonus and the LTIP are closely aligned with Shell’s strategy: incentivising outperformance of our closest competitors on a number of key financial metrics; the delivery of the annual operational business plan; and progressing the ambition to thrive in the energy transition. While variable pay outcomes have fluctuated over time, the 10-year average vesting outcomes are close to target, demonstrating the effectiveness of these structures in delivering pay for performance over the long term. In discussions with shareholders there was a clear preference for maintaining a strong and direct link between reward and performance. Structures which potentially reduced this link, such as restricted shares, received limited support from shareholders in consultation.
Quantum
There is good support for target reward levels, but some shareholders raised concerns regarding pay quantum at the extremes of performance and this has been a key issue for the REMCO when considering the 2020 policy. In 2019, we reviewed a range of alternative reward structures that might moderate high pay outcomes while keeping target pay competitive. Following extensive consultation with shareholders, we concluded that changing reward design is not the best way to address quantum if it means making compromises on the alignment between pay and performance in the delivery of strategy. This also allows for alignment between reward structures for Executive Directors and employees. The REMCO also considered whether a cap on remuneration levels was appropriate. The REMCO believes it is important to maintain flexibility in order to respond to changing business requirements and/or governance developments if required. The introduction of an arbitrarily defined cap may adversely affect that flexibility and, given the good alignment between pay and performance, would be an unnecessary policy feature. Also some shareholders are of the view that strong performance should be rewarded with strong variable pay outcomes.
GOVERNANCE SHELL FORM 20-F 2019 | 100 | |
Accordingly, we have sought ways to manage quantum outcomes within the existing tried and tested performance framework.
Proposals
Under the proposed policy, we are:
- reducing the CEO’s target bonus from 150% to 125% (a change already implemented in 2019);
- reducing the maximum LTIP opportunity from 800% of base salary to 600%. In doing so we will reduce the 2020 target LTIP grant level for the CEO from 340% to 300%; and
- introducing a greater emphasis on discretionary management of remuneration outcomes for the CEO. From now on the REMCO will, based on the formulaic Single Figure outcome, undertake a further and final review of the CEO’s and company’s overall performance and be prepared to adjust the Single Figure in order to ensure that the highest variable pay outcomes are only achieved for the highest quality of performance across all significant areas of activity. It is not expected that this discretion would be applied upwards, and any discretion would be disclosed and explained to shareholders.
As you know, in a first for our industry and following extensive collaboration with shareholders, we incorporated an energy transition measure to our LTIP from 2019, again adopting early a change originally intended for the 2020 policy. That condition continues to feature in the policy, and it remains the REMCO’s intent to increase its weighting over time.
The REMCO reflected carefully on the matter of pensions. It is already a long-standing remuneration policy that pensions for Shell’s Executive Directors are aligned with those of employees in their home country and we are proposing to continue this policy.
The CEO participates in the mainstream Shell Netherlands pension arrangements on the same terms as all other members. It is a feature of Netherlands pension schemes that the contribution rate increases with age and this is a requirement of Dutch pension legislation. As the CEO is near the top of the ladder based on age, his contribution rate is 27%. The REMCO is aware that this may appear high by UK standards of pension contribution. However, this is the standard contribution rate applicable to all employees of his age in this plan, and we believe that this is aligned with the spirt of recent developments in corporate governance regarding pension provision. Jessica Uhl also participates in the pension arrangements applicable to employees in her home country (USA). The only difference in her arrangements in comparison to other employees is that her bonus is non-pensionable. This is in accordance with UK corporate governance best practice. Further information on pensions is provided on page 107.
We are proposing a number of other changes to simplify the policy and to ensure it remains aligned with shareholder interests and developing corporate governance best practice. These changes include increasing the CFO’s shareholding requirement, introducing a post-employment shareholding requirement and extending our malus and clawback provisions.
A summary of the changes from the existing policy are set out on page 116. Having consulted with shareholders on these changes through the course of the last two years, I am confident of your support.
LOOKING AHEAD
The 2020 AGM will be my last as the REMCO Chairman, as I will be stepping down from the RDS Board following the meeting. It has been a privilege to chair the REMCO over a period which has seen a great deal of change, both for Shell and in the executive remuneration landscape. I believe that the proposed 2020 remuneration policy will provide strong support in achieving Shell’s strategic ambitions and I wish my successor, Neil Carson, every success for the future.
GERARD KLEISTERLEE
Chair of the REMCO
March 11, 2020
GOVERNANCE SHELL FORM 20-F 2019 | 101 | |
Annual Report on Remuneration | |
The Annual Report on Remuneration sets out
- The REMCO’s responsibilities and activities, page 102;
- Remuneration at a glance, page 103;
- Directors’ remuneration for 2019, page 104; and
- the statement of the planned implementation of policy
in 2020, page 113.
The base currency in this Annual Report on Remuneration is the euro, as this is the currency of the base salary of the Executive Directors. Where amounts are shown in other currencies, an average exchange rate for the relevant year is used, unless a specific date is stated, in which case the average exchange rate for the specific date is used.
REMUNERATION COMMITTEE
Biographies are given on pages 68-73; and REMCO meeting attendance is set out below:
Committee Member | Member since | Maximum possible meetings | Number of meetings attended | % of meetings attended |
Mr. Gerard Kleisterlee (Chair) | 21 May 2014 | 5 | 5 | 100% |
Mr. Neil Carson [A] | 01 June 2019 | 3 | 2 | 67% |
Mrs. Catherine Hughes | 26 July 2017 | 5 | 5 | 100% |
Sir Nigel Sheinwald | 24 May 2017 | 5 | 5 | 100% |
Mr. Gerrit Zalm | 21 May 2014 | 5 | 5 | 100% |
[A] Neil Carson was unable to attend the meeting in October due to an immovable commitment, which was scheduled prior to his appointment to the Shell Board.
The REMCO’s key responsibilities include determining:
Senior Management | |||
Executive Directors | Executive Committee | Company Secretary | |
Performance Framework | ü | û | û |
Remuneration policy | ü | ü | û |
Actual remuneration and benefits | ü | ü | ü |
Annual Bonus and Long-Term Incentive Measures and Targets | ü | ü | ü |
In addition, the REMCO has the responsibility for determining the Chair of the Board’s remuneration. The REMCO monitors the level and structure of remuneration for senior executives below Senior Management and makes recommendations if appropriate to ensure consistency and alignment with Shell’s remuneration objectives. The REMCO reviews workforce remuneration and related policies and the alignment of incentives and rewards with culture, taking these into account when setting the policy for Executive Director remuneration.
In exercising its responsibilities, the REMCO takes into account a variety of stakeholder considerations.
The REMCO operates within its Terms of Reference, which are reviewed annually. They were last updated on March 13, 2019 and are available at www.shell.com.
Advice from within Shell was provided by:
▪ | Ben van Beurden, CEO; |
▪ | Ronan Cassidy, Chief Human Resources and Corporate Officer and Secretary to the REMCO; and |
▪ | Stephanie Boyde, Executive Vice President Remuneration and HR Operations. |
The Chair of the Board was consulted on remuneration proposals affecting the CEO, and the CEO was consulted on proposals relating to the CFO and Senior Management.
During 2019, the REMCO met five times and its activities included:
▪ | setting annual bonus and long-term incentive plan performance measures and targets, including considering the energy transition in the context of long-term remuneration; |
▪ | deciding on 2018 annual bonus outcomes, 2019 base salaries, 2019 target bonuses and 2019 LTIP awards for Senior Management; |
▪ | determining vesting of the 2016 LTIP award for Senior Management; |
▪ | approving the 2018 Directors’ Remuneration Report; |
▪ | carefully deliberating on quantum for the CEO; |
▪ | preparing for shareholder consultation; |
▪ | developing the Directors’ Remuneration Policy in preparation for the 2020 AGM vote; and |
• | monitoring external developments and assessing their impact on Shell’s Remuneration Policy. |
In 2019, PWC provided an update to advice first provided in 2018 regarding market practice in relation to remuneration developments and Shell’s remuneration structures. PWC were appointed by the REMCO to provide this advice on the basis of their credentials for assessing the risk profile of renumeration policies and their knowledge of shareholder expectations and international market practice in the oil industry and longterm businesses. PWC is a member of the Remuneration Consultants Group and operates under the group’s Code of Conduct when providing advice. PWC provides other consultancy and accountancy services to Shell. However, the REMCO is satisfied that the advice provided on executive remuneration matters was objective and independent. The total fees paid to PWC in relation to this advice were £10,000 (excluding VAT).
PRINCIPLES
The principles that underpin the REMCO’s approach to executive remuneration are set out on page 116.
The REMCO considered the provisions of the new UK Corporate Governance code, and has sought to reflect the principles of clarity,simplicity, risk management, predictability, proportionality and alignment to culture in deciding 2019 pay outcomes and developing 2020 policy.
Shell has a consistent global reward and performance philosophy that sets clear expectations of employees. Through the annual bonus scorecard and the LTIP, remuneration is clearly aligned to Shell’s operating plan and strategic ambitions and the same measures apply to Senior Management and to a significantly broader employee base. This provides alignment throughout the organisation to Shell’s culture and strategy. The annual operating plan translates into targets on the annual bonus scorecard and a quarterly update on performance against scorecard targets is provided to employees. Similarly the LTIP is largely based on outperforming the competition and regular updates on Shell’s performance against competitors is provided to employees. In reviewing the Directors’ Remuneration Policy, the REMCO sought to make changes that help to simplify remuneration structures (for example, removing the individual performance factor for Executive Directors) and giving more transparent outcomes (for example, removing the bonus asymmetry from the CEO’s remuneration structure). To assist in the mitigation of reputational risk and ensure proportionality, the
GOVERNANCE SHELL FORM 20-F 2019 | 102 | |
powers of the REMCO to apply malus and clawback and make discretionary adjustments to variable pay outcomes have been expanded, with the
intention that the REMCO will use discretion to ensure the highest pay outcomes are delivered only for outstanding performance.
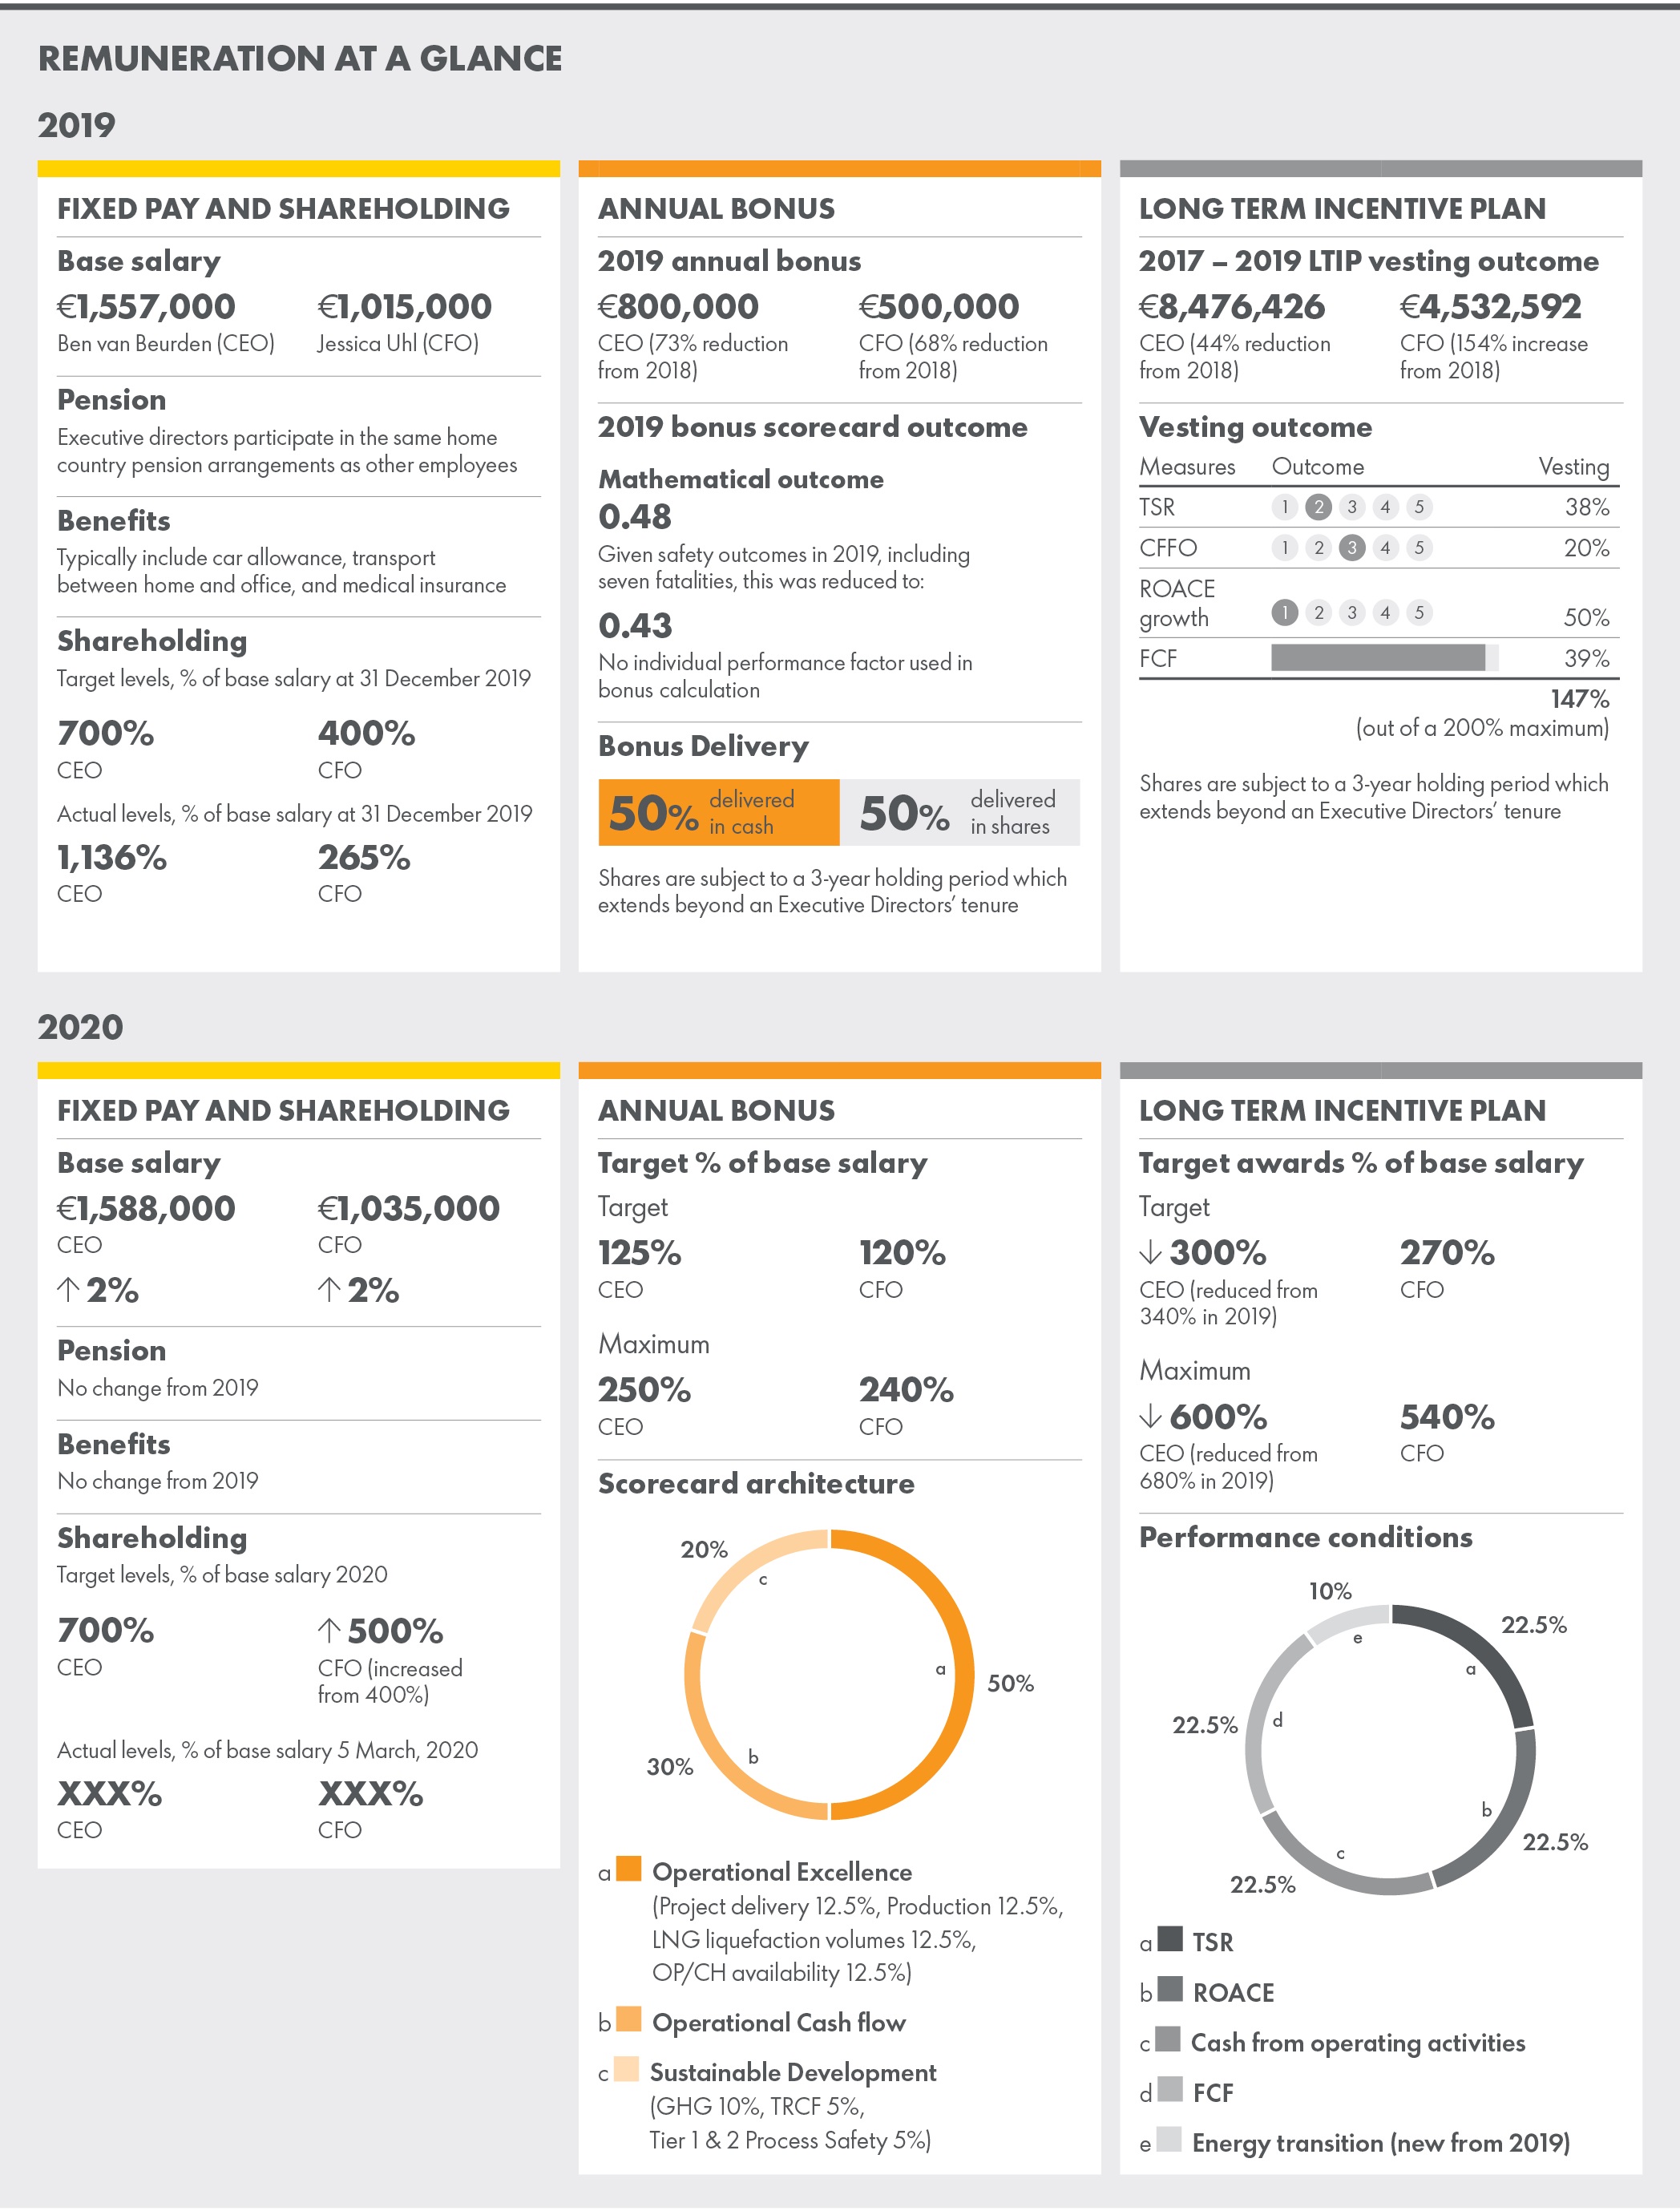
GOVERNANCE SHELL FORM 20-F 2019 | 103 | |
DIRECTORS’ REMUNERATION FOR 2019
Single total figure of remuneration for Non-executive Directors (audited) | € thousand | |||||||||||
Fees | Taxable benefits [A] | Total | ||||||||||
2019 | 2018 | 2019 | 2018 | 2019 | 2018 | |||||||
Neil Carson [B] | 99 | N/A | — | N/A | 99 | N/A | ||||||
Ann Godbehere [C] | 178 | 97 | — | — | 178 | 97 | ||||||
Euleen Goh | 201 | 220 | — | — | 201 | 220 | ||||||
Charles O. Holliday | 850 | 850 | 71 | 75 | 921 | 925 | ||||||
Catherine J. Hughes | 200 | 199 | — | 7 | 200 | 206 | ||||||
Gerard Kleisterlee | 242 | 216 | — | 7 | 242 | 223 | ||||||
Roberto Setubal | 190 | 190 | 2 | — | 192 | 190 | ||||||
Sir Nigel Sheinwald | 187 | 180 | — | 6 | 187 | 186 | ||||||
Linda G. Stuntz | 189 | 197 | 8 | 13 | 197 | 210 | ||||||
Gerrit Zalm | 177 | 177 | — | — | 177 | 177 | ||||||
[A]UK regulations require the inclusion of benefits where these would be taxable in the UK, on the assumption that Directors are tax residents in the UK. On this premise, the taxable benefits include the cost of Non-executive Director’s occasional business-required partner travel. Shell also pays for travel between home and the head office in The Hague, where Board and committee meetings are typically held, as well as related hotel and subsistence costs. For consistency, these business expenses are not reported as taxable benefits as for most Non-executive Directors this is international travel and hence would not be taxable in the UK.
[B]Appointed as a Director with effect from June 1, 2019.
[C]Appointed as Director with effect from May 23, 2018.
[D]Including the use of a Shell provided apartment whilst in the Hague (2019: €70,624; 2018: €70,015).
Single total figure of remuneration for Executive Directors (audited) | € thousand | |||||||
Ben van Beurden | Jessica Uhl | |||||||
2019 | 2018 | 2019 | 2018 | |||||
Salaries [A] | 1,557 | 1,527 | 1,015 | 995 | ||||
Taxable benefits [B] | 20 | 32 | 51 | 49 | ||||
Total fixed remuneration | 1,577 | 1,559 | 1,066 | 1,044 | ||||
Annual bonus [C] | 800 | 3,000 | 500 | 1,550 | ||||
LTIP [D] | 7,191 | 15,209 | 3,903 | 1,783 | ||||
Total variable remuneration | 7,991 | 18,209 | 4,403 | 3,333 | ||||
Total direct remuneration | 9,568 | 19,768 | 5,469 | 4,376 | ||||
Pension [E] | 395 | 369 | 261 | 196 | ||||
Tax equalisation [F] | — | — | 275 | 289 | ||||
Total remuneration including pension and tax equalisation | 9,963 | 20,138 | 6,005 | 4,862 | ||||
in dollars | 11,155 | 23,790 | 6,724 | 5,744 | ||||
in sterling | 8,746 | 17,817 | 5,271 | 4,302 | ||||
[A] | As disclosed in the 2018 Directors’ Remuneration Report, the REMCO set Ben van Beurden’s base salary for 2019 at €1,557,000 (+2.0% compared with 2018) effective from January 1, 2019, and Jessica Uhl’s base salary at €1,015,000 (+2.0% compared with 2018) effective from January 1, 2019. |
[B] | Executive Directors received car allowances, transport between home and office, occasional business-required partner travel, as well as employer contributions to life and medical insurance plans. |
[C] | The full value of the bonus, comprising both the 50% delivered in cash and 50% bonus delivered in shares. For 2019, the market price of A shares on February 21, 2020 (€22.735), was used to determine the number of shares delivered, resulting in 9,521 A shares for Ben van Beurden and 5.951 A shares for Jessica Uhl. For 2018, 50% of the bonus was delivered in shares and the market price of A shares on February 21, 2019 (€27.745), was used to determine the number of shares delivered, resulting in 28,045 A shares for Ben van Beurden and 14,490 A shares for Jessica Uhl. |
[D] | Remuneration for performance periods of more than one year, comprising the value of released LTIP awards. The amounts reported for 2019 relate to the 2017 LTIP award, which vested on March 4, 2020, at the market price of €19.986 and $45.21 for A shares and A ADSs respectively. The value in respect of the LTIP is calculated as the product of: the number of shares of the original award multiplied by the vesting percentage; plus accrued dividend shares; and the market price of A shares or A ADSs at the vesting date. The market price of A ADSs is converted into euros using the exchange rate on the respective date. Ben van Beurden also received a release of 57,980 RDS A shares under the 2017 Deferred Bonus Plan (DBP) on March 4, 2020. The original deferred bonus share awards, which are those represented by the deferred bonus and dividend shares accrued on these shares are not considered as long-term remuneration as they relate to the 2016 short-term annual bonus value. Share price appreciation accounted for -€1,603,428 on the LTIP and -€317,962 on the DBP for Ben van Beurden and -$521,010 on the LTIP for Jessica Uhl. |
[E] | For Ben van Beurden, the amount reported for pension consists of a net pay defined contribution amount of €395,060. The amount to be reported for his defined benefit pension accrual is 0 calculated in accordance with UK reporting requirements. For Jessica Uhl, the amount reported for pension consists of a defined contribution amount of €102,709 and a defined benefit pension accrual €158,012. |
[F] | Includes tax equalisation of pension contributions to foreign pension plan(s), when they are taxable above a certain pensionable salary threshold or once a double tax treaty exemption ceases, under Dutch law. Tax equalisation is applied for the loss of pension relief for members of a foreign pension plan(s) in their host country. |
Notes to the single total figure of remuneration for executive directors table (audited)
Annual bonus
The Annual bonus operated in line with the policy as disclosed on page 117.
Determination of the 2019 annual bonus
The table below summarises the 2019 annual bonus scorecard measures including their weightings, targets and outcomes. The mathematical scorecard outcome for 2019 was 0.48. Please refer to pages 98-99 for a commentary on the scorecard outcome. After reviewing the mathematical
scorecard outcome, and considering the context of wider company performance for the year, the REMCO exercised discretion to adjust the scorecard result downwards to 0.43. This downwards adjustment was to reflect the seven fatalities under Shell operational control during the year.
Accordingly, the REMCO determined a final bonus outcome of €800,000 for the CEO which is 41% of target and 21% of maximum. This is a 73% reduction from 2018. The REMCO determined a final bonus outcome of €500,000 for the CFO which is 41% of target and 21% of maximum. This is
GOVERNANCE SHELL FORM 20-F 2019 | 104 | |
a 68% reduction from 2018.
2019 annual bonus outcome (audited) [A][B] | ||||||||||||
Measures | Weighted (% of scorecard) | Threshold | Target set | Outstanding | Result achieved | Score (0-2) | ||||||
Cash flow from operating activities ($ billion) | 30 | % | 44 | 50 | 56 | 42 | 0 | |||||
Operational excellence | 50 | % | 0.72 | |||||||||
Production (kboe/d) | 12.5 | % | 3,647 | 3,760 | 3,873 | 3,665 | 0.16 | |||||
LNG liquefaction volumes (mtpa) | 12.5 | % | 35.3 | 36.4 | 37.4 | 35.6 | 0.23 | |||||
Refinery and chemical plant availability (%) | 12.5 | % | 88.4 | 90.4 | 92.4 | 90.8 | 1.20 | |||||
Project delivery on schedule (%) | 6.25 | % | 60 | 80 | 100 | 90 | 1.50 | |||||
Project delivery on budget (%) | 6.25 | % | 105 | 100 | 95 | 99 | 1.10 | |||||
Sustainable development | 20 | % | 0.59 | |||||||||
Total recordable case frequency (injuries/million hours) | 5 | % | 0.9 | 0.7 | 0.5 | 0.9 | - | |||||
Operational Tier 1 and 2 process safety events (number) | 5 | % | 145 | 115 | 85 | 130 | 0.5 | |||||
Upstream and Integrated Gas GHG intensity (tonnes of CO2 equivalent/tonne of hydrocarbon production available for sale) | 4 | % | 0.176 | 0.168 | 0.160 | 0.168 | 1.00 | |||||
Refining GHG intensity (tonnes CO2 equivalent per Solomon’s Utilized Equivalent Distillation Capacity (UEDC™)) | 4 | % | 1.11 | 1.06 | 1.01 | 1.06 | 1.00 | |||||
Chemicals GHG intensity (tonnes CO2 equivalent/tonne of petrochemicals production) | 2 | % | 1.10 | 1.00 | 0.90 | 1.04 | 0.60 | |||||
100% | ||||||||||||
Mathematical scorecard outcome | 0.48 | |||||||||||
Adjusted scorecard outcome | 0.43 | |||||||||||
[A] These metrics measure the effectiveness with which we operate our assets and portfolio base, assessed against our operational business plan. Shell’s longer-term strategic ambitions are measured in the LTIP metrics. Scorecard targets are based on Shell’s annual operating plan, and may increase or decrease year-on-year to reflect planned business activity as well as changes to our portfolio.
[B] Scorecard targets are based on Shell’s annual operating plan and increase or decrease year-on-year. In 2019, target refinery and chemical plant availability was lower and target GHG emission intensities higher than 2018, due to planned business activities, reflecting scheduled maintenance and expected market conditions, and portfolio developments.
[C] In external disclosure, we may use an alternative performance measure, i.e. CFFO excluding Working Capital, to describe the cash flow generation from our operations without the effect of working capital changes.

LTIP Vesting
In 2017, Ben van Beurden was granted a conditional LTIP award of 340% (max 680%) of base salary and Jessica Uhl an award of 270% (max 540%) excluding share price movement and dividends.
In making the vesting decision, the REMCO considered Shell’s performance over the three-year vesting period. The REMCO noted the strong performance of Shell relative to both the other oil majors and the wider oil and gas sector in generating shareholder returns, in particular the $61 billion distributed to shareholders in the form of dividends and share buybacks. This strong relative performance lead to a very close TSR outcome, with Shell ranking second by a difference of less than 0.4%. Cash performance was also
strong with CFFO leading the comparator group on absolute CFFO generated, and FCF was well above the cumulative target set for the three-year performance cycle. ROACE has also improved, reflecting the focus on capital discipline. The REMCO also took account of the fact that Shell’s competitors are some of the strongest companies in the industry and achieving relative outperformance is challenging.
The REMCO also took account of share price at grant (€25.47 for the CEO and $51.74 for the CFO) and at vest when making the vesting decision. As the share price at grant was only 2% higher from the three-month average share price leading up to grant, the REMCO was comfortable that there were no notable windfall gains arising from the LTIP vesting.
GOVERNANCE SHELL FORM 20-F 2019 | 105 | |
Accordingly, the REMCO determined that the LTIP should vest without discretionary adjustment at 147%. This is illustrated opposite.
The CEO’s and CFO’s vested awards are subject to a further three-year holding period which extends beyond executive director tenure.
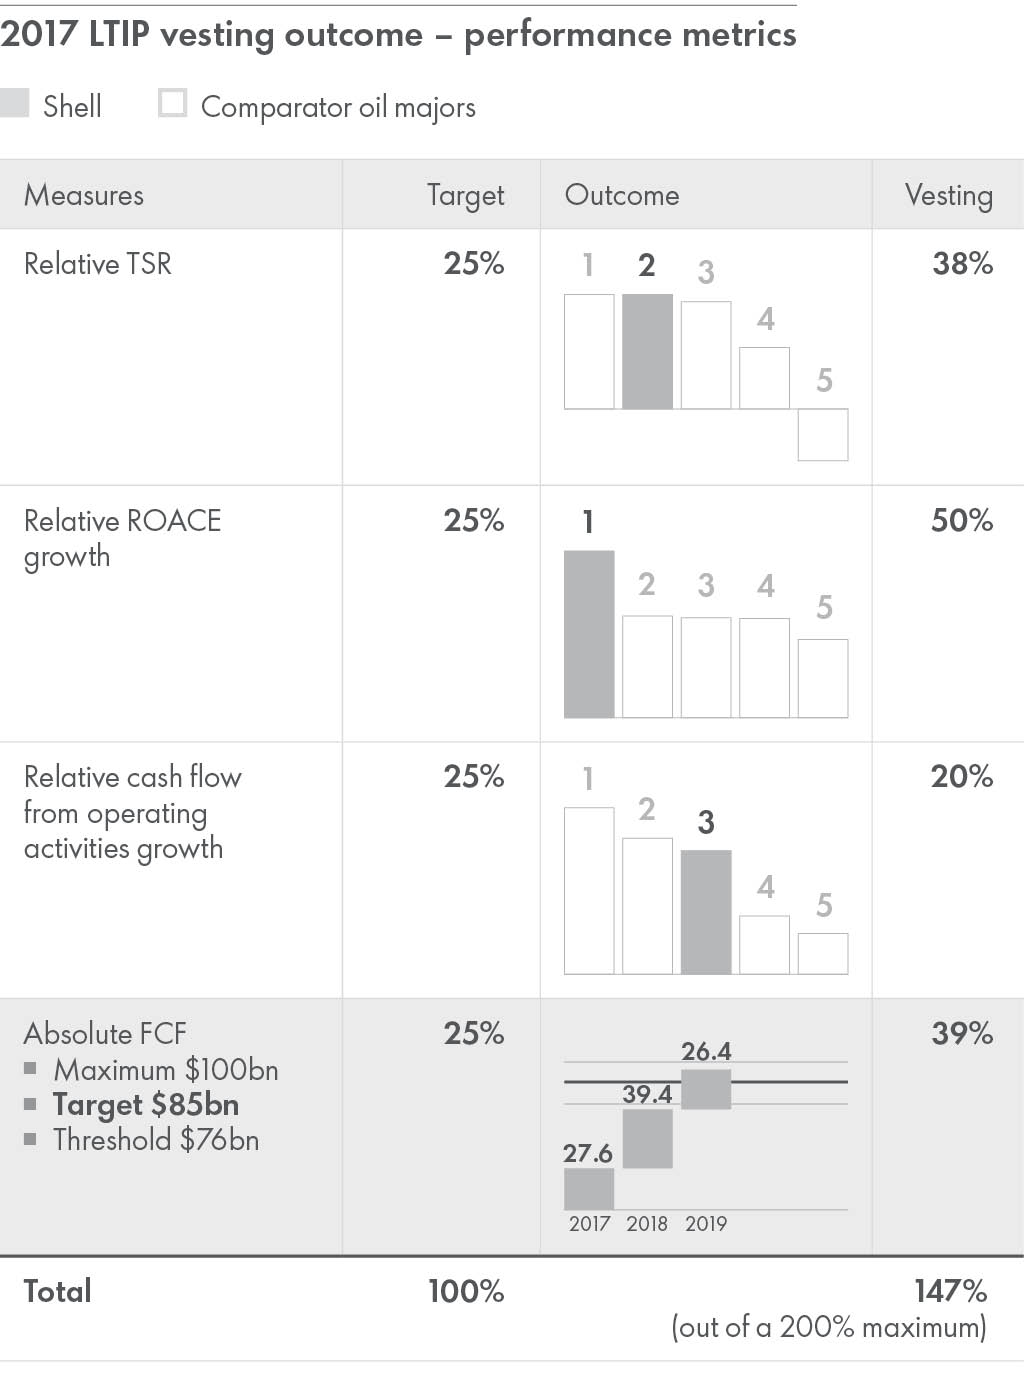

Overall pay outcome
In determining the final pay outcomes, the REMCO also considered the personal performance of the Executive Directors.
GOVERNANCE SHELL FORM 20-F 2019 | 106 | |
Personal performance 2017 – 2019 | ||
Key Goals | Ben van Beurden | Jessica Uhl |
Deliver a world-class investment case | Under the CEO’s leadership, Shell continues to transform, with a clear purpose and well-defined strategic intents that balance societal progress with performance, to deliver higher returns. Over the 2017 – 2019 performance period, financial performance was strong: CFFO was $131 billion, FCF was $93 billion billion, an all-cash dividend was paid, and the share buyback programme was started ($14.75 billion completed as at January 22, 2020). The $30 billion divestment programme was also completed (in 2018) and investments have been made in a disciplined manner. In terms of broader company performance, the REMCO recognised the strategic clarity the CEO has provided around the purpose and direction of Shell. Shell has delivered on its commitments to shareholders to date and remains committed to its intent to achieve 2020 targets. Albeit this timeframe is less certain given prevailing weak macroeconomic conditions and challenging outlook. | The CFO demonstrated strong cost and capital discipline leadership. This was enabled by a consistent focus on the strategic management of Shell’s Financial Framework, which has been a key contribution to the health and success of Shell in the period under review. Key milestones included: the cancellation of the scrip dividend and start of the share buyback programme, sustained investment discipline, reduced costs and a strengthened balance sheet with AA equivalent credit metrics. The introduction of publication of a quarterly update enhances disclosures and increases transparency. In terms of broader company performance, the REMCO recognised the strategic insight the CFO has provided in terms of effective capital allocation, portfolio and investment decisions that further Shell’s world-class investment case. |
Thrive in the energy transition | The CEO continued to lead Shell’s NCF ambition through driving internal plans and targets, integrating business and world-class investment decisions with thriving in the energy transition, and by preparing the organisation for changing investor and customer preferences as the transition unfolds. The CEO continues to lead the way in the energy transition debate externally, for example, through the first joint statement with institutional shareholders, encouraging other companies to adopt the NCF methodology, and shaping the debate on energy transition. He has been instrumental in galvanising coalitions to start action on sectoral decarbonisation. His personal role, for example in the Aviation Clean Skies Initiative, is recognised by both customers and external stakeholders. His interventions have helped in shifting the climate agenda towards the practical measures that will be needed for creating sustained demand for lower carbon products. Shell set and disclosed NCF reduction targets. The CEO extended this measure to the remuneration of 16,500 Shell employees through the Performance Share Plan (PSP). | The CFO further matured the internal management systems relating to carbon dioxide (CO2) in portfolio, planning and resource allocation decisions. The CFO led the publication of the Shell Energy Transition Report, which is aligned with the Task Force on Climaterelated Financial Disclosures (TCFD) recommendations and sets out how Shell plans to be resilient to expected changes in the energy system and how its strategy helps it to thrive as the world transitions to lower-carbon energy. |
Strengthen licence to operate | In terms of HSSE leadership, performance was mixed, which shows further improvement is required. The 2019 personal injury rate was flat to 2018, following the lowest ever injury rate on record in 2017. The fatalities in Shell-operated ventures in 2019 are unacceptable and provide a stark reminder of the need for an ongoing focus on safety. In 2018, there was a notable improvement in operational process safety, with a reduction in the number of both Tier 1 and Tier 2 events. This, however, deteriorated in 2019. In 2019, Shell published the Industry Associations Climate Review, which assesses alignment with 19 industry associations on climate-related policy and decided not to renew Shell’s membership of one association as a result. | The CFO maintained a strong financial disclosure, reporting and control framework. The CFO played a key role in Shell’s endorsement of the responsible tax principles set out by the non-profit organisation, The B Team. In 2019, Shell published its inaugural Tax Contribution Report marking an important step towards greater transparency around Shell’s approach to paying taxes to governments. |
The REMCO considered the quantum of the Single Figure outcomes, and, noting that the CEO’s overall remuneration was 51% lower than in 2018, was satisfied that they represent a fair level of remuneration, taking into account the strong competitive performance from 2017 to 2019 and the significant bonus reduction in 2019 reflecting the number of fatalities and safety challenges as well as the lower cash flow and operational challenges.
In finalising its remuneration decisions for 2019, the REMCO considered
a range of factors, including:
= Shell’s performance in 2019 and over the LTIP performance period 2017-2019;
= potential risk adjustment considerations, including safety, ethics and compliance and feedback from the Audit and Safety, Environment and Sustainability Committees;
= the final scorecard outcome including the downwards discretion applied to the final vesting outcome;
= the final LTIP vesting outcome;
- the internal relativity of remuneration compared to the variable pay outcomes for the general workforce based on the group scorecard and Performance Share Plan; and
- the personal performance of the executive directors.
After reflecting on the above factors, the REMCO was satisfied that the remuneration policies had operated as intended.
Pension
Ben van Beurden’s pension arrangements comprise a defined benefit plan with a maximum pensionable salary of €96,729; and a net pay defined contribution pension plan with a 2019 employer contribution of 27% of salary in excess of €96,729. He has the option to take cash as an alternative to pension contributions (in either case subject to income tax) and elected to take his benefit in the form of contributions throughout 2019.
The employer contribution levels are in line with those applicable to other Netherlands-based employees. Under the Dutch pension regulations applicable to the pension arrangement in which he participates, the contribution rate increases with age and is shown below.
At December 31, 2019 the average contribution rate for NL employees who participate in the net pay defined contribution pension arrangement on the same terms as Ben van Beurden was 22%. For reference, in the UK, the average employer contribution rate to the Shell UK defined contribution plan is 20%.
GOVERNANCE SHELL FORM 20-F 2019 | 107 | |

Jessica Uhl is a member of the Shell US retirement benefit arrangements, which include the Shell Pension Plan (a defined benefit plan), and a defined contribution plan where she receives an employer contribution of 10% of salary. This is the same as the average employer contribution rate for US employees at December 31, 2019, which was also 10%. As for all other pre-2013 members of the Shell Pension Plan, she has an annual choice of two accrual formulas with different forms of benefits, one in the form of a lifetime annuity and the other allowing for a lump-sum payment. She elected to accrue benefits for 2019 under the former. Approximately 10,000 out of 17,000 Shell US employees have the option of choosing between the two formulas. These arrangements are the same for all employees who joined Shell US at the same time as Jessica Uhl. The difference in pension provision for Jessica Uhl, compared to employees who joined pre-2013, is that her bonus is not pensionable as an Executive Director while for other relevant US employees the bonus is pensionable. She also has a deferred Dutch defined benefit pension plan, as a result of a prior Shell assignment on local Dutch terms and conditions.
The REMCO believe these arrangements are aligned with the recent corporate governance developments in the UK which emphasise Executive Directors’ pension arrangements being the same for the general employee population.
Scheme interests awarded in 2019 | ||||||
Scheme interests awarded to Executive Directors in 2019 (audited) | ||||||
Potential amount vesting | ||||||
Scheme interest type | Type of interest awarded | End of performance period | Target award [A] | Minimum performance (% of shares awarded) [B] | Maximum performance (% of shares of the target award [A]) | |
LTIP | Performance shares | December 31, 2021 | Ben van Beurden: 194,625 A shares, equivalent to 3.4 x base salary or €5,293,800. Jessica Uhl: 49,927 A ADS shares, equivalent to 2.7 x base salary or €2,740,500. | 0 | % | Maximum number of shares vesting is 200% of the shares awarded, before dividends. |
[A] The award for Ben van Beurden was based on the closing market price on February 1, 2019, for A shares of €27.20. The award for Jessica Uhl was based on the closing market price on February
1, 2019, for A ADSs of $62.84.
[B] Minimum performance relates to the lowest level of achievement, for which no reward is given.
The measures and weightings applying to LTIP awards made in 2019 were: energy transition (10%), FCF (22.5%), TSR (22.5%), ROACE growth (22.5%) and cashflow from operating activities growth (22.5%).
Absolute measures
Energy Transition
The energy transition condition is focused on Shell’s strategic ambition to thrive in the energy transition and supports delivery of Shell’s Net Carbon Footprint (NCF) ambition.
This measure was introduced to the LTIP in 2019 under the existing remuneration policy, in advance of the 2020 policy vote. The condition consists of a mix of leading and lagging measures that set the foundations to contribute to Shell’s strategic ambitions in the longer term. These will comprise:
Lagging measure – a measure of our progress in meeting our ambition
-Net Carbon Footprint: a target for reducing the NCF of the energy products Shell sells (a carbon intensity measure that takes into account their full life-cycle emissions, including customers’ emissions associated with using them).
Leading measures – the levers we will use to drive future NCF reduction
-The growth of our power business: growth in the use of electricity and continuing decarbonisation of electricity by shifting to renewables and gas-fired power generation is recognised as a key lever in all decarbonisation scenarios. Our ambition to grow the power business is based on selective investments in generation, and in business models based on reselling power generated by others;
- Advanced biofuels technology: biofuels are expected to play a valuable role in the changing energy mix and are likely to be the key decarbonisation levers for sectors that need to continue to use liquid fuels in the foreseeable future, such as some segments of transport and industry. For society and for Shell, commercialisation of advanced biofuel technology is one of the most important steps in energy transition; and
-the development of systems to capture and absorb carbon: carbon capture and storage (CCS) and carbon sinks, such as nature-based solutions are required as part of the global response to climate change.
Targets have been set for each element. Progress in the energy transition is not expected to be linear as it will reflect the pace of change of society as a whole and the speed at which Shell progresses its strategic business objectives. Therefore, most of the targets have been set as ranges. Energy transition targets, with the exception of the NCF target, are considered to be commercially sensitive and will therefore be disclosed retrospectively. Annual updates on our progress in relation to the measures will be provided. The first update on progress is provided at page 109.
The vesting outcome for the part of the award weighted to the energy transition condition ranges from 0% to 200% of grant. The REMCO, at its sole discretion, will determine vesting outcomes after taking into account
achievement against the target ranges and feedback from the Safety, Environment and Sustainability Committee (SESCo). In doing so, the REMCO will take into account, in relation to each element, progress over the performance period relative to nearer-term aims in pursuit of the long-term ambition announced by Shell to reduce the NCF of energy products sold by around half by 2050, and by around 20% by 2035, in step with society’s drive to meet the goals of the Paris Agreement. The starting point for determining the vesting outcome will be scoring how many of the targets have been met for each of the four areas. One out of four will equal 40%, two will equal 100%, three will equal 150% and 200% will be achieved for scoring four out of four. However, it is important to note that performance against these elements will serve simply as a starting point for the REMCO, which will also take into account any other considerations it deems appropriate, including (without limitation) the relative importance of these elements in meeting the long-term ambition announced by Shell. For example, the REMCO may decide to allocate a greater emphasis to overall performance in relation to the NCF than the other three elements. The REMCO believes this approach is appropriate to reflect the uncertainties around the speed and direction of progress in the energy transition. The
GOVERNANCE SHELL FORM 20-F 2019 | 108 | |
application of any discretion will be fully disclosed and explained by the REMCO.

FCF
The FCF performance condition supports our strategic ambition of being
a world-class investment case, and the delivery of our cash flow priorities, namely: to service and reduce debt, pay dividends, buy back shares and make future capital investments.
The target for FCF, along with the ranges for threshold and outstanding performance, will be set by reference to Shell’s annual operating plans, being the aggregate of our plan FCF targets over the three-year performance period. Given FCF is heavily influenced by the volatility of oil and gas prices, the annual operating plans are updated each year to set an annual target to reflect a changing oil price premise. As a result, FCF targets are set annually for each annual operating plan and will only be disclosed in aggregate retrospectively after the three-year period. While consideration has been given to setting a three-year target at the outset, the REMCO has determined that such an approach would require adjustments for oil and gas price premise and other matters at the end of the period, given the unpredictability and volatility in oil and gas prices. The REMCO has a long-standing ‘no adjustments’ policy and therefore believes a more appropriate target-setting approach is to set the target based on the aggregation of the annual operating plans.
The amounts payable under this measure will range from 20% of the available maximum, for threshold performance, to full vesting for outstanding performance. A straight-line vesting schedule will apply for performance between threshold and outstanding.
Relative measures
The relative measures support our strategic ambition of being a worldclass investment by measuring our performance on a number of key financial metrics against the other oil majors.
For relative measures, we measure and rank growth based on the data points at the end of the performance period compared with those at the beginning of the period, using publicly reported data.
- TSR, calculated in dollars using a 90-day averaging period around the start and end of the performance period;
- ROACE growth. For this purpose, in order to facilitate the comparison, the calculation of ROACE differs from that described in “Performance
indicators” on page 20 as there is no adjustment for after-tax interest expense; and
- cash flow from operating activities growth.
Each relative measure can vest independently with the amounts payable ranging from 0% to 200%, in accordance with the following vesting schedule:
- Ranking first equals 200% vesting for the element of the LTIP weightedto that metric;
- Ranking second equals 150% vesting for the element of the LTIP weighted to that metric;
- Ranking third equals 80% vesting for the element of the LTIP weighted to that metric; and
- 0% vesting for the element weighted to that metric for ranking fourth or fifth.
If the TSR ranking is fourth or fifth, the level of the award that can vest on the basis of the other measures will be capped at 50% of the maximum.
Performance update on absolute measures
FCF progress to date on outstanding 2018 LTIP award
At December 31, 2019, FCF performance is above target, with an above-target outcome for 2018 of $39 billion (target $29 billion) and below target for 2019 of $26.4 billion (target $35 billion). As one year of FCF performance remains, and 75% of the award is subject to relative performance conditions, this does not reflect the potential vesting of the award.
FCF progress to date on outstanding 2019 LTIP award
At December 31, 2019, FCF performance, $26.4 billion for 2019, is below target ($35 billion). As two years of FCF performance remain, and 77.5% of the award is subject to relative and the energy transition performance conditions, this does not reflect the potential vesting of the award.
Energy Transition progress to date on outstanding 2019 LTIP award
The target for the 2019 LTIP grant was a 2-3% reduction from 2016 NCF (79 grams of CO2 equivalent per megajoule). We have received third-party limited assurance on our Net Carbon Footprint for the years 2016 to 2019.
GOVERNANCE SHELL FORM 20-F 2019 | 109 | |
For 2019, our Net Carbon Footprint was 78 grams of CO2 equivalent per megajoule.
The targets for the other energy transition metrics are considered commercially sensitive and will not be disclosed until the end of the performance period. Examples of initiatives to progress our ambitions in the energy transition which the REMCO will take into account in determining the vesting outcome of the 2019 LTIP award, include: the acquisition of ERM Power Ltd (a large Australian business utility), and the WeForest and Forestry and Land Scotland NBS projects.
Statement of Directors’ shareholding and share interests (audited)
Shareholding guidelines
The REMCO believes that Executive Directors should align their interests with those of shareholders by holding shares in Royal Dutch Shell plc (the Company). The CEO is expected to build a shareholding with a value of 700% of base salary, and the CFO 400% of base salary (increased to 500% from 2020).
Only unfettered shares count. Unvested shares held under the DBP and any shares delivered but subject to holding requirements, also count towards the guidelines. As at March 5, 2020, Ben van Beurden held shares worth 1,090% of his base salary. At March 5, 2020, Jessica Uhl held 467% of her base salary and has until March 2022 to meet her current shareholding target and January 2024 to meet her revised shareholding target. Non-executive Directors are encouraged to hold shares with a value equivalent to 100% of their fixed annual fee and maintain that holding during their tenure.
For 2020 the shareholding requirement will be extended to apply post-employment such that the Executive Director will be required to maintain their shareholding requirement, or the number of shares actually held if this is less than the shareholding requirement, for a period of two years post-employment.
Executive Directors’ shareholding (audited) | ||
Shareholding guideline (% of base salary) | Value of shares counting towards guideline (% of base salary at December 31,2019 [A]) | |
Ben van Beurden | 700% | 1,136% |
Jessica Uhl | 400% | 265% |
[A] Representing the value of share interests and the estimated after-tax value of DBP shares
(not subject to performance conditions).
Directors’ share interests
The interests (in shares of the Company or calculated equivalents) of the Directors in office during 2019, including any interests of their connected persons, are set out in the table below.
Directors’ share interests [C] (audited) | ||||||||
January 1, 2019 | December 31, 2019 | |||||||
A shares | B shares | A shares | B shares | |||||
Executive directors [A] | ||||||||
Ben van Beurden | 281,524 | 647,426 | — | |||||
Jessica Uhl | 61,097 [B] | — | 116,168 [C] | — | ||||
Non-executive directors | ||||||||
Neil Carson | — | — | 16,000 | — | ||||
Ann Godbehere | — | 4,700 [D] | — | 4,700 [D] | ||||
Euleen Goh | — | 12,895 | — | 12,895 | ||||
Charles O. Holliday | — | 50,000[E] | — | 50,000[E] | ||||
Catherine J. Hughes | 4,080 | 46,904 | 4,080 | 51,904 [F] | ||||
Gerard Kleisterlee | 5,254 | — | 5,254 | — | ||||
Roberto Setubal | 15,400 [G] | — | 15,400 [G] | — | ||||
Sir Nigel Sheinwald | — | 1,124 | — | 1,124 | ||||
Linda G. Stuntz | - | 12,400 [H] | — | 12,400 [H] | ||||
Gerrit Zalm | 2,026 | — | 2,026 | — | ||||
[A] Includes vested LTIP awards subject to holding conditions. Excludes unvested interests
in shares awarded under the LTIP and DBP.
[B] Held as 10,941 RDS A shares and 25,078 ADS (RDS.A ADS). Each RDS.A represents two A shares.
[C] Held as 26,590 RDS A shares and 44,789 ADS (RDS.A ADS). Each RDS.A represents two A shares.
[D] Held as 2,350 ADSs (RDS.B ADS). Each RDS.B represents two B shares.
[E] Held as 25,000 ADSs (RDS.B ADS). Each RDS.B represents two B shares.
[F] Held as 46,904 RDS B shares and 2,500 ADS (RDS.B. ADS). Each RDS.B represents two B shares.
[G] Held as 7,700 ADSs (RDS.A ADS). Each RDS.A represents two A shares.
[H] Held as 6,200 ADSs (RDS.B ADS). Each RDS.B represents two B shares.
Following the vesting of the 2017 LTIP and DBP awards, and delivery of the 2019 bonus in shares, Ben van Beurden’s share interests increased by 233,519 RDS A shares, and Jessica Uhl’s by 5,951 RDS A shares and 58,456 RDS.A ADS.
In addition, Ben van Beurden sold 14,510 RDS A shares on January 31, 2020. He also pledged 105,000 RDSA shares as collateral against a mortgage provided by Van Lanschot N.V. who adjusted their risk premium associated with the mortgage.
The value of shares counting towards the shareholding guideline (as a percentage of base salary) for the CEO and CFO, were 1,090% and 467% respectively, at March 5, 2020.
At March 5, 2020, the Directors and Senior Management (pages 68-74) of the Company beneficially owned, individually and in aggregate (including shares under option), less than 1% of the total shares of each class of the Company shares. These shareholdings are not considered sufficient to affect the independence of the Directors.
Directors’ scheme interests
The table below shows the aggregate position for Directors’ interests under share schemes at December 31. These are A shares for Ben van Beurden and A ADSs for Jessica Uhl. During the period from December 31, 2019, to March 5, 2020, scheme interests have changed as a result of the vesting of the 2017 LTIP and DBP awards on March 4, 2020, and the 2020 LTIP awards made on January 31, 2020, as described on pages 105 and 107-109 respectively.
Directors’ scheme interests (audited) | ||||||||||||
Share plan interests [A] | ||||||||||||
LTIP/PSP subject to performance conditions [B] | DBP not subject to performance conditions [C] | Total | ||||||||||
2019 | 2018 | 2019 | 2018 | 2019 | 2018 | |||||||
Ben van Beurden | 660,814 | 715,591 | 56,783 | 159,617 | 717,597 | 875,208 | ||||||
Jessica Uhl | 173,509 | 130,180 | — | — | 173,509 | 130,180 | ||||||
[A] Includes unvested long-term incentive awards and notional dividend shares accrued at December 31. Interests are shown on the basis of the original awards. The shares subject to performance conditions can vest at between 0% and 200%. Dividend shares accumulate each year on an assumed notional LTIP/DBP award. Such dividend shares are disclosed and recorded on the basis of the number of shares conditionally awarded but, when an award vests, dividend shares will be awarded only in relation to vested shares as if the vested shares were held from the award date. Shares released during the year are included in the “Directors’ share interests” table.
[B] Total number of unvested LTIP shares at December 31, including dividend shares accrued on the original LTIP award.
[C] The number of shares deferred from the bonus (original DBP award) and the dividend shares accrued on these at December 31. Delivery of the original DBP award and the related accrued dividend shares is not subject to performance conditions.
Dilution
In any 10-year period, no more than 5% of the issued ordinary share capital of the Company may be issued or issuable under executive (discretionary) share plans adopted by the Company, or 10% when aggregated with awards under any other employee share plan operated by the Company. To date, no shareholder dilution has resulted from these plans, although it is permitted under the rules of the plans subject to these limits.
Payments to past Directors (audited)
Simon Henry left the Company on June 30, 2017. On March 4, 2020, Simon Henry’s 2017 DBP award vested and he received a total of 31,140 RDS B shares, with a value at vesting of £539,158. While the original award of 25,339 RDS B shares was reported in the 2017 Directors’ Remuneration Report, it is included again here in the interest of transparency. The
GOVERNANCE SHELL FORM 20-F 2019 | 110 | |
remaining 5,801 RDS B shares represent accrued dividends paid in accordance with the plan and the value of these at vesting was £100,439.
Payments below €5,000 are not reported as they are considered de minimis.
TSR performance and CEO pay
Performance graphs
The graphs compare the TSR performance of Royal Dutch Shell plc over the past ten financial years with that of the companies comprising the Euronext
100 and the FTSE 100 share indices. The Board regards these indices as appropriate broad market equity indices for comparison, as they are the leading market indices in Royal Dutch Shell plc’s home markets.
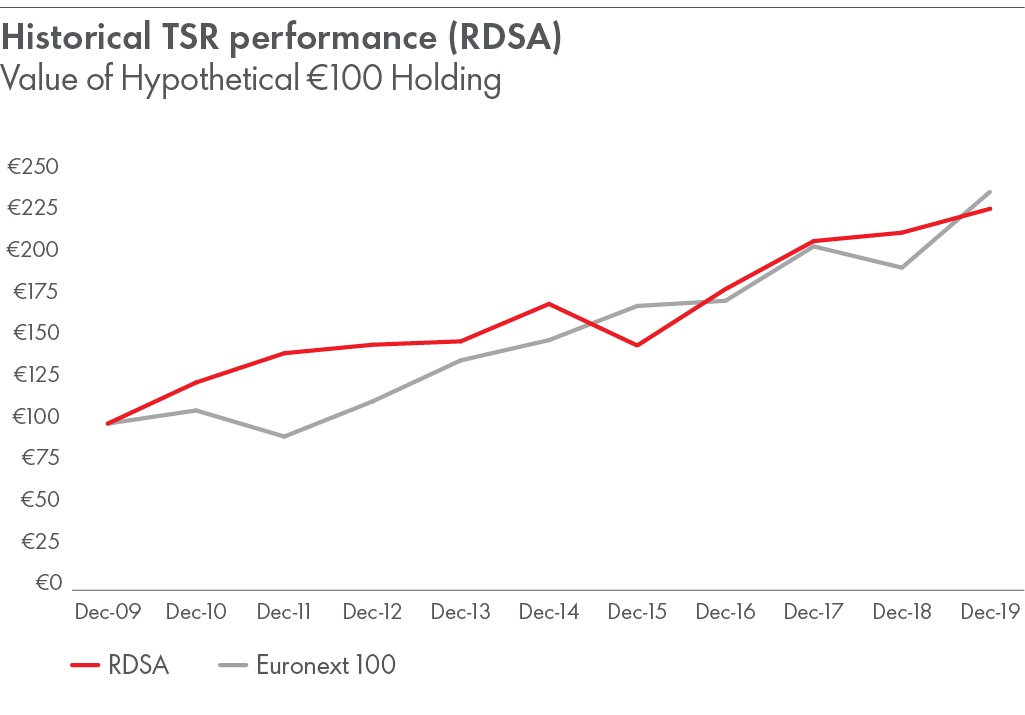
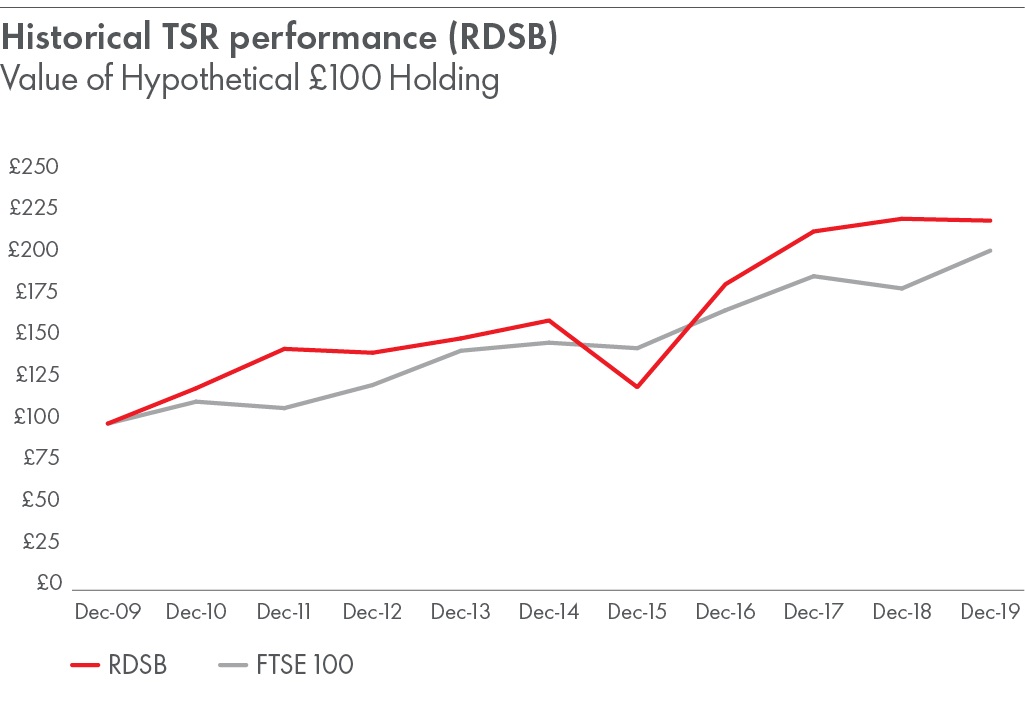
CEO pay outcomes
The following table sets out the single total figure of remuneration, and the annual bonus payout and long-term incentive (LTI) vesting rates compared
with the respective maximum opportunity, for the CEO for the last ten years.
CEO pay outcomes | |||||||
Year | CEO | Single total figure of remuneration (€000) | Annual bonus payout against maximum opportunity | LTI vesting rates against maximum opportunity | |||
2019 | Ben van Beurden | 9,963 | 21 | % | 74 | % | |
2018 | Ben van Beurden | 20,138 | 79 | % | 95 | % | |
2017 | Ben van Beurden | 8,909 | 81 | % | 35 | % | |
2016 | Ben van Beurden | 8,593 | 66 | % | 42 | % | |
2015 | Ben van Beurden | 5,576 | 98 | % | 8 | % | |
2014 | Ben van Beurden [A] | 24,198 | 94 | % | 49 | % | |
2013 | Peter Voser | 8,456 | 44 | % | 30 | % | |
2012 | Peter Voser | 18,246 | 83 | % | 88 | % | |
2011 | Peter Voser | 9,941 | 90 | % | 30 | % | |
2010 | Peter Voser | 10,611 | 100 | % | 75 | % | |
[A] Ben van Beurden’s single figure for 2014 was impacted by the increase in pension accrual (€10.695 million) calculated under the UK reporting regulations and tax equalisation (€7.905 million)
as a result of his promotion and prior assignment to the UK.
Change in remuneration of Directors and employees from 2018 to 2019
As Royal Dutch Shell plc does not have any direct employees, the table below compares the remuneration of the Directors of Royal Dutch Shell plc with an employee comparator group consisting of local employees in the Netherlands, the UK and the USA. The local employee population of these countries is considered to be a suitable employee comparator group because: these are countries with a significant Shell employee base; a large proportion of senior managers come from these countries; and the REMCO considers remuneration levels in these countries when setting base salaries for Executive Directors. For the purposes of comparison, the change in
employee remuneration is calculated by reference to the change in salary scale, benefits and annual bonus for a notional employee in each of the base countries not by reference to the actual change in pay for a group of employees.
Taxable benefits are those that align with the definition of taxable benefits applying in the respective country. In line with the “Single total figure of remuneration for Executive Directors” table, the annual bonus is included in the year in which it was earned.
GOVERNANCE SHELL FORM 20-F 2019 | 111 | |
Change in remuneration of directors and employees | |||||||||||||
Executive Directors | Non-executive directors | ||||||||||||
RDS employees | UK, US & NL employees | CEO | CFO | NS | AG | CH | GK | LS | CJH | RS | GZ | NC | |
Salaries | N/A | 3.3% | 2.0% | 2.0% | 3.9% | 82.6% | 0.0% | 12.2% | -4.1% | 0.0% | 0.0% | 0.0% | — |
Taxable benefits[A] | N/A | -8.0% | -36.4% | 4.9% | -94.7% | 0.0% | -6.3% | -100.0% | -39.0% | -100.0% | 100.0% | 0.0% | — |
Annual bonus | N/A | -62.2% | -73.3% | -67.7% | — | — | — | — | — | — | — | — | — |
[A] The reduction in taxable benefits for employees is principally due to the buyout of a medical insurance allowance paid to Netherlands employees who received a one-off payment of €4,935 in 2018, which was not received in 2019. For the CEO, benefits are lower in 2019 due to the medical allowance, which he also received, and lower commuting and business required partner travel costs.
Relative importance of spend on pay
Distributions to shareholders by way of dividends and share buybacks and remuneration paid to or receivable by employees for the last five years are set out below, together with annual percentage changes.
Relative importance of spend on pay | ||||||||
Dividends and share buybacks [A] | Spend on pay (all employees) [B] | |||||||
Year | $ billion | Annual change | $ billion | Annual change | ||||
2019 | 25.4 | 26 | % | 13.2 | -1.3 | % | ||
2018 | 20.2 | 29 | % | 13.4 | -6 | % | ||
2017 | 15.6 | 4 | % | 14.3 | -9 | % | ||
2016 | 15.0 | 25 | % | 15.7 | -8 | % | ||
2015 | 12.0 | -18 | % | 17.1 | 5 | % | ||
[A] Dividends paid, which includes the dividends settled in shares via our Scrip Dividend
Programme, and repurchases of shares as reported in the “Consolidated Statement of
Changes in Equity”.
[B] Employee costs, excluding redundancy costs, as reported in Note 26 to the “Consolidated
Financial Statements”.
Spend on pay can be compared with the major costs associated with generating income by referring to the “Consolidated Statement of Income”. Over the last five years, the average spend on pay was 5% of the major costs of generating income. These costs are considered to be the sum of: purchases; production and manufacturing expenses; selling, distribution and administrative expenses; research and development; exploration; and depreciation, depletion and amortisation.
Total pension entitlements (audited)
During 2019, Ben van Beurden and Jessica Uhl accrued retirement benefits under defined benefit plans. The pension accrued under these plans at December 31, 2019, is set out below. The exchange rates used for conversion into euros and dollars are at December 31, 2019.
Accrued pension (audited) | |||
Thousand | Local | € | $ |
Ben van Beurden [A] | €1,285 | €1,285 | $1,441 |
Jessica Uhl [B] | $1,247 | €1,112 | $1,247 |
[A] The accrued benefits are disclosed on a per annum basis.
[B] Jessica Uhl has an annual choice of two accrual formulas with different forms of benefits, one in the form of a lifetime annuity and the other allows for a lump-sum payment. She elected to accrue benefits up to 2018 under the former and the eventual lump sum benefit is shown. In 2019, she elected to accrue benefits as a lifetime annuity, the value of this accrued benefit at December 31, 2019 was €3,932 per annum plus a lump sum of $98,281. She also has a deferred Dutch defined benefit pension plan, as a result of a prior Shell assignment on local Dutch terms and conditions. The age at which Jessica Uhl can receive any pension benefit without an actuarial reduction under this plan is 60. The value of the deferred pension benefit is €3,369 per annum.
The age at which Ben van Beurden can receive any pension benefit without actuarial reduction is 68 and for Jessica Uhl this is age 65. Any pension benefits on early retirement are reduced using actuarial factors to reflect early payment. No payments were made in 2019 regarding early retirement or in lieu of retirement benefits.
Please refer to page 107 for further details. (Pension)
External appointments
The Executive Directors held no external appointments in 2019.
Statement of voting at 2019 AGM
Shell’s 2019 AGM was held on May 21, 2019, in the Netherlands. The result of the poll in respect of Directors’ remuneration was as follows:
Approval of Directors’ Remuneration Report | ||||
Votes | Number | Percentage | ||
For | 4,357,260,297 | 89.93 | % | |
Against | 488,139,305 | 10.07 | % | |
Total cast | 4,845,399,602 [A] | 100.00 | % | |
Withheld [B] | 130,596,261 | |||
[A] Representing 59.71% of issued share capital.
[B] A vote “withheld” is not a vote under English law and is not counted in the calculation of
the proportion of the votes “for” and “against” a resolution.
The result of the poll in respect of the Directors’ Remuneration Policy approved at the 2017 AGM was as follows:
Approval of Directors’ Remuneration Policy | ||||
Votes | Number | Percentage | ||
For | 4,064,279,529 | 92.34 | % | |
Against | 337,361,835 | 7.66 | % | |
Total cast | 4,401,641,364 [A] | 100 | % | |
Withheld [B] | 37,303,341 | |||
[A] Representing 53.53% of issued share capital.
[B] A vote “withheld” is not a vote under English law and is not counted in the calculation of the
proportion of the votes “for” and “against” a resolution.
Directors’ employment arrangements and letters of appointment
Executive Directors are employed for an indefinite period. Non-executive Directors, including the Chair, have letters of appointment. Details of Executive Directors’ employment arrangements can be found in the Directors’ Remuneration Policy on page 121.
Further details of Non-executive Directors’ terms of appointment can be found in the “Directors’ Report” on page 131 and the “Other Regulatory and Statutory Information” report on pages 124-137.
Compensation of directors and senior management
During the year ended December 31, 2019, Shell paid and/or accrued compensation totalling $38 million (2018: $43 million) to Directors and Senior Management for services in all capacities while serving as a Director or member of Senior Management, including $3 million (2018: $3 million) accrued to provide pension, retirement and similar benefits. The amounts stated are those recognised in Shell’s income on an IFRS basis. See Note 27 to the “Consolidated Financial Statements”. Personal loans or guarantees were not provided to Directors or Senior Management.
CEO pay ratio
Shell has chosen to use option A to calculate the CEO pay ratio in accordance with guidance from the UK government that this is the
GOVERNANCE SHELL FORM 20-F 2019 | 112 | |
preferred approach and provides the statistically most accurate method for identifying the ratios. Under option A, a comparable single figure for all UK employees has been calculated in order to identify the employee whose pay and benefits are at the 25th, 50th and 75th percentiles for comparison with the CEO. Employee pay has been calculated based on the total pay and benefits paid in respect of 2019 for all employees who were employed on 31 December 2019. For part-time workers and joiners in the year, pay and benefits has been annualised based on the proportion of their working time in the UK during the year. This is calculated with an approach consistent with the methodology for determining those employees' 2019 annual bonuses. The REMCO believes that this provides a fair and reasonable calculation of the pay ratios for Shell employees in the UK.
Year | Option | 25th Percentile pay ratio | Median pay ratio | 75th pay ratio |
2019 | A | 147:1 | 87:1 | 54:1 |
Total pay and benefits: | £59,419 | £100,755 | £161,717 | |
Salary: | £40,417 | £56,721 | £79,991 | |
2018 | A | 202:1 | 143:1 | 92:1 |
The ratio has changed for 2019 compared to 2018 principally due to the decrease in the Single Figure of remuneration for the CEO. This decrease is due to the lower bonus and LTIP vesting outcomes for 2019 compared to the outcomes in 2018. The pay and benefits for the 25th, 50th and 75th percentile employees have also reduced in relation to 2018. Please refer to page 99 for a discussion of the reasons behind the changes in employee pay and benefits. The REMCO believes these changes are consistent with the Group's approach to managing pay as well as strategic developments in Shell’s business portfolio.
Workforce engagement
The REMCO took a wide perspective in making the remuneration decisions for 2019 and determining the 2020 policy. As examples, in 2019 the REMCO noted:
- the alignment between Shell’s culture and workforce policies, and incentives and rewards as part of the 2020 remuneration policy review;
- the planned general employee salary increases in the UK, US and NL when determining 2020 base salaries;
- the scorecard and Performance Share Plan (PSP) outcomes for employees in determining the 2019 variable pay outcomes for Executive Directors; and
- the CEO pay ratio, which Shell has been voluntarily disclosing in advance of the regulatory requirement to do so, and gender pay gap reporting.
Executive remuneration structures in Shell are strongly aligned to the broader Shell pay policy:
- in recent years the Group Scorecard architecture has been identical to the Executive Committee and Senior Executive Scorecard in terms of measures, weightings and targets;
- Executive Directors and Executive Committee members participate in the Long-Term Incentive Plan. Around 150 Senior Executives participate in the same plan. The measures and metrics for that plan also apply to 50% of the PSP awarded to around 16,500 employees; and
- all employees in the Group participate in the relevant pension plan for their country based on their date of joining. Shell does not operate separate executive pension arrangements.
This consistency means that less explanation of executive remuneration structures is required than in companies where alignment is not the default.
STATEMENT OF 2020 PLANNED IMPLEMENTATION OF POLICY
The proposed Directors’ Remuneration Policy as outlined on pages 116-123 will, subject to shareholder approval, take effect from May 19, 2020 and will be effective until the 2023 AGM, unless a further policy is proposed by Shell and approved by shareholders in the meantime. This section describes elements that apply for 2020, within the boundaries of the policy.
Executive Directors
Salaries
Effective from January 1, 2020, the base salaries were set at €1,588,000 (+2.0%) for Ben van Beurden and at €1,035,000 (+2.0%) for Jessica Uhl, in accordance with the proposed 2020 remuneration policy as set out on page 116. These increases are consistent with planned salary increases in the US, UK and NL for the general employee population which range from 1.7% – 3.4%.
Annual bonus
There are no changes to the scorecard measures and weightings for 2020. Performance measures are comprised of cash flow from operating activities, operational excellence and sustainable development measures. These measures and weightings were reviewed by the REMCO as part of the 2020 policy review, with the REMCO determining that these remain well-aligned with our strategic and operational priorities and consistent with the performance indicators set out on pages 20-21.
The performance measures, weightings and link to strategy for the 2020 performance year are set out below:
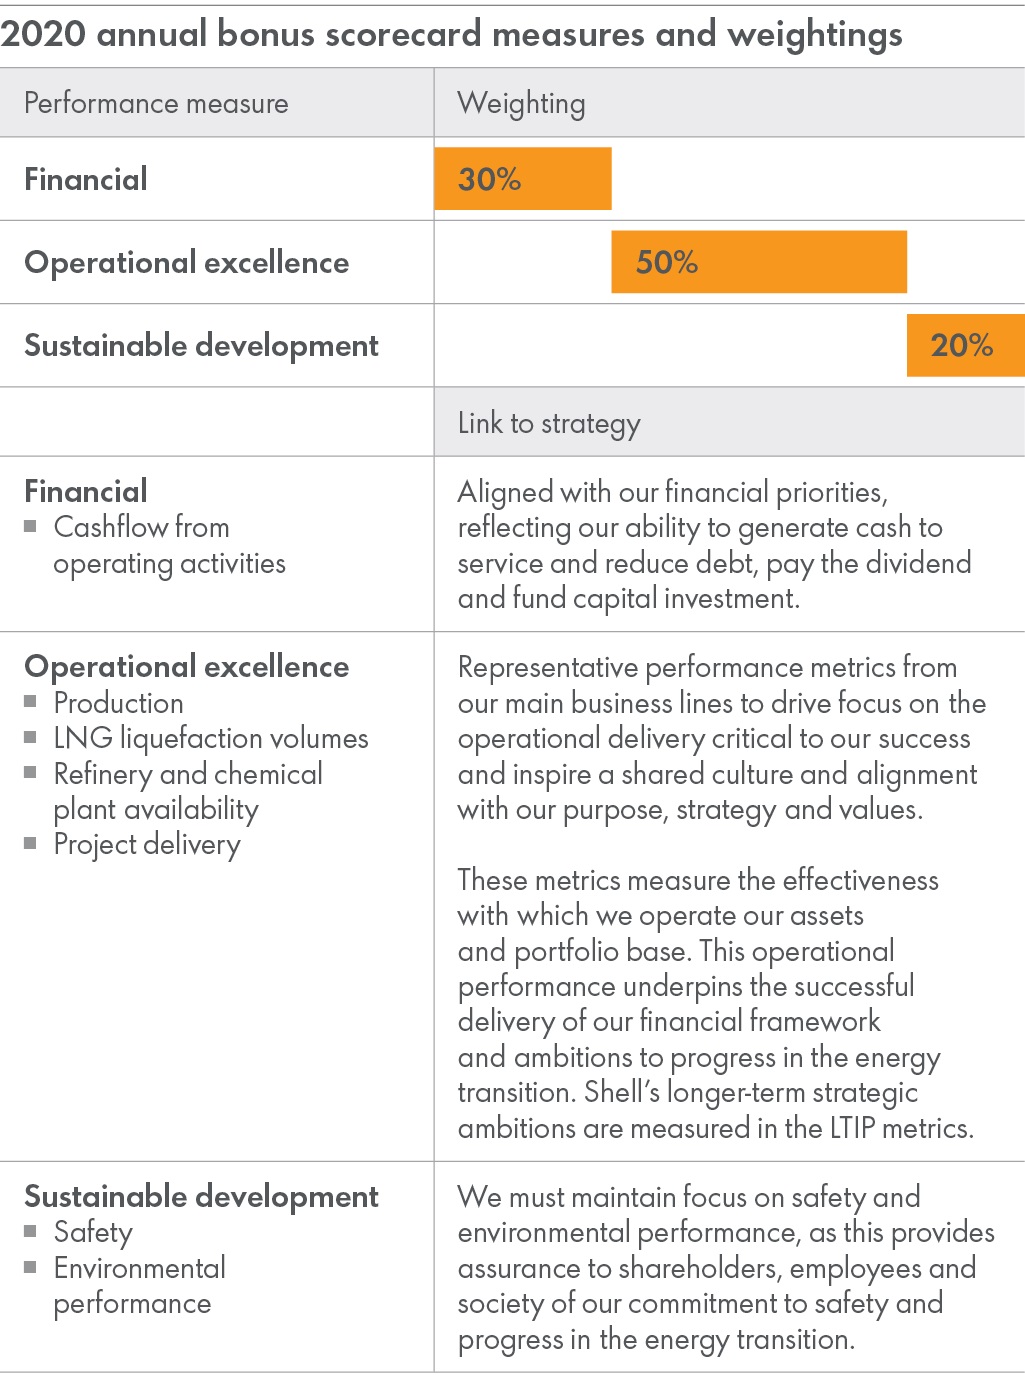
Annual bonus scorecard targets are not disclosed prospectively because to do so in a meaningful manner would require the disclosure of commercially sensitive information. As in previous years, scorecard targets will be disclosed in the subsequent Directors’ Remuneration Report when they are no longer deemed to be commercially sensitive.
Long-term Incentive Plan
On January 31, 2020, a conditional award of performance shares under the LTIP was made to the Executive Directors resulting in 200,589 Royal Dutch Shell plc A shares (A shares) being conditionally awarded to Ben van Beurden and 59,062 Royal Dutch Shell plc A American Depositary Shares (A ADSs) to Jessica Uhl. The award had a face value of 300% (maximum performance outcome 600%) of the base salary for the CEO and 270% (maximum performance outcome 540%) of the base salary for the CFO, excluding potential share price appreciation and dividends. In making these awards, the REMCO considered the Company’s share price and determined that there was no significant share price volatility that would require an adjustment to the size of the awards.
GOVERNANCE SHELL FORM 20-F 2019 | 113 | |
The award for the CEO has been reduced from a face value award of 340% (maximum vesting outcome 680%) in prior years. This reduction is part of the REMCOs response to addressing quantum and further details are provided on pages 99-100.
For LTIP awards made in 2020, performance will be assessed over a three-year period based on four financial measures and an energy transition condition.
The target for the FCF metric is the aggregate of our annual operational business plan FCF targets over the three-year performance period. These are considered to be commercially sensitive and will be disclosed retrospectively, with annual updates on progress provided.
The NCF target range for the 2020 – 2022 LTIP grant is set as a 3-4% reduction from the 2016 NCF of 79g CO2e/MJ. This target is aligned with the trajectory of our NCF ambition set out in November 2017. There is no change to the other energy transition measures other than the advanced biofuel technology measure is extended to include a measure of alternative fuel development. The targets for the other leading energy transition measures are commercially sensitive, and will be disclosed retrospectively.
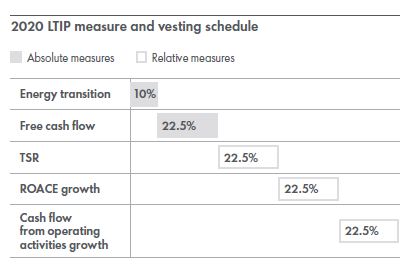
Link to strategy | Vesting schedule (% of initial LTIP award) |
Energy transition Focused on Shell’s strategy to thrive in the energy transition and support delivery of our NCF ambition. | Vesting based on how many targets are achieved: 1/4 = 40% 2/4 = 100% 3/4 = 150% 4/4 = 200% REMCO may take into account other appropriate considerations |
Free cash flow Recognition of the importance of generating cash after net capital expenditure to service and reduce debt, pay dividends, buy back shares and make future capital investments. | Maximum – 200% Target – 100% Threshold – 40% Below threshold – 0% |
TSR Assessment of actual wealth created for shareholders. | 1st – 200% 2nd – 150% 3rd – 80% 4th or 5th – nil |
ROACE growth Indicator of capital discipline. | |
Cash flow from operating activities growth Source of capital expenditure commitments which support sustainable growth based on portfolio and cost management. | |
TSR underpin If TSR is in fourth or fifth, vesting on the other measures is capped at 50% of maximum. | |
Holding period 3-years post-vesting which remains in force post-tenure. | |
Discretion, adjustment (malus) and recovery (clawback)
Variable pay elements are subject to adjustment (malus) and recovery (clawback) provisions, which may apply in case of direct responsibility or supervisory accountability. The REMCO may adjust an award, for example by lapsing part or all of it, reducing the number of shares which would otherwise vest, by imposing additional conditions on it, or imposing a new holding period or applying clawback.
Please refer to the policy section on pages 118 and 119 for a full description of the circumstances under which discretion, malus and clawback might be applied to a variable pay award.
Pension
Ben van Beurden’s pension arrangements comprise a defined benefit plan for which the maximum pensionable salary has increased to €98,993 for 2020 and a net pay defined contribution pension plan with an employer contribution of 27% of salary in excess of this amount.
Jessica Uhl’s US retirement benefit arrangements include the Shell Pension Plan, a defined benefit plan, and a defined contribution plan with an employer contribution of 10% of salary. She also has a deferred Dutch defined benefit pension plan, as a result of a prior Shell assignment on local Dutch terms and conditions.
Further details of Executive Director pension arrangements can be found on page 118.
GOVERNANCE SHELL FORM 20-F 2019 | 114 | |
Non-executive Directors’ fees | |||
Non-executive Directors’ fees 2020 | |||
€ | Other fees | ||
Chair of the Board | 850,000 | Non-executive Directors receive an additional fee of €5,000 for any Board meeting involving intercontinental travel – except for one meeting a year held in a location other than The Hague. | |
Non-executive Director | 135,000 | ||
Senior Independent Director | 55,000 | ||
Audit Committee | |||
Chair [A] | 60,000 | ||
Member | 25,000 | ||
Safety, Environment and Sustainability Committee [B] | |||
Chair [A] | 35,000 | ||
Member | 17,250 | ||
Nomination and Succession Committee | |||
Chair [A] | 25,000 | ||
Member | 12,000 | ||
Remuneration Committee | |||
Chair [A] | 40,000 | ||
Member | 17,250 | ||
[A] The chair of a committee does not receive an additional fee for membership of that committee.
[B] Formerly the Corporate and Social Responsibility Committee.
The Chair’s fee is determined by the REMCO and the annual fee for Charles O. Holliday was set at €850,000 upon appointment in 2015 and will remain unchanged for 2020. The Chair of the Board does not receive any additional fee for chairing the Nomination and Succession Committee or attending any other Board committee meeting.
The Non-executive Directors receive a basic fee. There are additional fees for the Senior Independent Director, a Board committee chair or a Board committee member for each committee. Non-executive Directors receive an additional fee of €5,000 for any Board meeting involving intercontinental travel, except for one meeting a year held in a location other than The Hague. Business expenses (including transport between home and office and occasional business-required spouse travel) and associated tax are paid or reimbursed by Shell. The Chair has use of a Shell provided apartment while in The Hague.
The Board reviews Non-executive Directors’ fees periodically to ensure that they are aligned with those of other major listed companies using the FTSE 30 and the Europe Comparator group as the primary points of reference. The last general review was carried out in 2018 with a review of the Nomination and Succession Committee fees in 2019 and fees will remain unchanged for 2020.
GOVERNANCE SHELL FORM 20-F 2019 | 115 | |
Directors’ Remuneration Policy | |
The Directors’ Remuneration Policy sets out - Summary of proposed changes to the Directors’ Remuneration Policy, page 116; - Executive Directors’ Remuneration Policy, page 117; and - Non-executive Directors’ Remuneration Policy, page 122. |
The principles underpinning the REMCO’s approach to executive remuneration are the foundation for everything we do, and are:
- Alignment with Shell’s strategy: the Executive Directors’ compensation package should be strongly linked to the achievement of stretching targets that are seen as indicators of the execution of Shell’s strategy;
- Pay for performance: the majority of the Executive Directors’ compensation (excluding benefits and pensions) should be linked directly to Shell’s performance through variable pay instruments;
- Competitiveness: remuneration levels should be determined by reference internally against Shell’s Senior Management and externally against companies of comparable size, complexity and global scope;
- Long-term creation of shareholder value: Executive Directors should align their interests with those of shareholders by holding shares in Shell;
- Consistency: the remuneration structure for Executive Directors should generally be consistent with the remuneration structure for Shell’s senior management. This consistency builds a culture of alignment with Shell’s purpose and a common approach to sharing in Shell’s success;
- Compliance: decisions should be made in the context of the Shell General Business Principles and Code of Conduct. The REMCO also seeks to ensure compliance with applicable laws and corporate governance requirements when designing and implementing policies and plans; and
- Risk assessment: the remuneration structures and rewards should
meet risk-assessment tests to ensure that shareholder’s interests are safeguarded and that inappropriate actions are avoided.
The Executive Directors’ remuneration structure is made up of a fixed element of basic pay and two variable elements: the annual bonus (50% delivered in shares) and the Long-term Incentive Plan (LTIP). Variable pay outcomes are conditional on the successful execution of the operating plan in the short term and the delivery of strategic goals and financial outperformance over the longer term. The award of shares under the bonus and LTIP, along with significant shareholding requirements, is intended to ensure executives have a sizeable shareholding in Royal Dutch Shell plc (the Company) and experience the same outcomes as shareholders.
During 2018 and 2019, the REMCO reviewed the Remuneration Policy to
ensure that the Policy continues to be aligned with Shell’s strategy, including delivery of shareholder returns. REMCO determined that while the current policy remains appropriate in many respects, certain changes will support the REMCO to simplify remuneration structures and address the management of quantum. For each area of the policy, the REMCO has considered market practice, the corporate governance environment and feedback from shareholders. The Safety, Environment and Sustainability Committee (SESCo) has provided input to the development of the sustainable development and energy transition metrics. Any potential conflict of interest is mitigated by the independence of the REMCO members and the REMCO Terms of Reference.
A summary of the main proposed changes to the Policy for the Executive Directors is outlined below. No significant changes are proposed to the Policy for Non-executive Directors.
Remuneration element | Proposed Changes to Policy | Rationale for the change |
Annual Bonus | – Reduction of the CEO’s target bonus from 150% to 125%; and – Removal of the individual performance factor for Executive Directors. | –– Simplification: The asymmetry in the CEO’s bonus structure and the inclusion of individual performance factors was creating undue complexity; and –– Transparency: The annual bonus is now solely linked to the performance of Shell to support clarity and transparency of outcomes. |
Long-Term Incentive Plan | ––Reduction of the target LTIP grant from 400% to 300% of base salary; and –– Inclusion of an energy transition metric. | ––Management of Quantum: To moderate the quantum of pay and assist the REMCO in managing the range of outcomes; and ––Alignment to Strategy: Inclusion of the energy transition metric strengthens the LTIP’s alignment to the strategy and purpose. |
Discretion, Malus & Clawback | ––After reviewing the single figure outcomes for the year, the REMCO will consider an adjustment for the purposes of managing remuneration quantum, taking into account performance, the operation of the remuneration structures and any other relevant considerations. An explanation of any discretionary adjustment would be set out in the relevant Director’s Remuneration Report; ––Alignment of malus and clawback provisions so that these are the same. Inclusion of corporate failure as an adjustment event; and ––Amendment of provisions in the share plan such that for future grants, awards may be adjusted for any reason. | ––Corporate Governance: Assist the REMCO in managing the risks from behavioural-based incentive schemes; and ––Management of Quantum: To assist the REMCO in managing the range of outcomes. |
Pension | ––New Executive Directors who are members of a defined benefit pension arrangement will have their pensionable salary capped at the salary applicable immediately prior to appointment, with the exception of existing US base country participants who will have the bonus removed from the definition of pensionable base salary instead. The Executive Director will join a defined contribution scheme in their base country for contributions made in respect of salary above the defined benefit pensionable salary, or in exceptional circumstances, receive a cash allowance equivalent to the contribution above the cap; and –– For recruitment: Explicit confirmation that new appointees, whether internally promoted or newly hired, will be provided with a pension in line with the wider workforce in their base country. | ––Management of Quantum: To moderate the quantum of pay and assist the REMCO in managing the range of outcomes; and ––Corporate Governance: To adopt best practice in line with external guidelines. |
Shareholding Requirement | ––CFO requirement increased to 500% of base salary; and –– Extended to apply for a period of two years post-employment (at the lower of the shareholding requirement or the number of shares held at departure). | ––Alignment with Shareholders: Further aligns executives with the long-term interests of shareholders. |
GOVERNANCE SHELL FORM 20-F 2019 | 116 | |
EXECUTIVE DIRECTORS | ||
Executive Directors’ remuneration policy table | ||
Purpose and link to strategy | Maximum opportunity | Operation and performance management |
Salary and pensionable base salary | ||
Provides a fixed level of earnings to attract and retain Executive Directors. | €2,000,000 | Reviewed annually with adjustments effective from January 1. In making salary determinations, the REMCO will consider: –– the market positioning of the compensation packages; –– comparison with Senior Management salaries; –– the employee context, and planned average salary increase for other employees across the Netherlands, the UK and the USA; –– the experience, skills and performance of the Executive Director, or any change in the scope and responsibility of their role; ––general economic conditions, Shell’s financial performance, and governance trends; and –– the impact of salary increases on pension benefits and other elements of the package. For Executive Directors employed outside their base country, euro base salaries are translated into their home currency for pension purposes. Pensionable base salaries are maintained in line with euro base salaries taking into account exchange rate fluctuations and other factors as determined by the REMCO. |
Benefits | ||
Provides benefits, in line with those applicable to the wider workforce, in order to attract and retain Executive Directors. | The maximum opportunity is the cost of providing the benefit under Shell’s standard policy. These costs can vary. For certain benefits, for example, relocation and tax equalisation, the maximum opportunity will be the grossed-up cost of meeting the specific Executive Director’s costs. | Typical benefits include car allowances and home-to-office transport, risk benefits (for example ill-health, disability or death-in-service), security provision, and employer contributions to insurance plans (such as medical). Precise benefits will depend on the Executive Director’s specific circumstances. Post-retirement benefits such as healthcare and ongoing security provision may be applicable. Shell’s mobility policies may apply, such as for relocation and tax return preparation support, as may tax equalisation related to expatriate employment prior to Board appointment, or in other limited circumstances to offset double taxation. The REMCO may adjust the range and scope of the benefits offered in the context of developments for other employees in relevant countries. Personal loans or guarantees are not provided to Executive Directors. |
Annual bonus | ||
Rewards the delivery of short-term operational targets as derived from Shell’s operating plan. To reinforce alignment with shareholder interests, 50% is delivered in cash and 50% is delivered in shares. The shares are subject to a three-year holding period, which applies beyond an Executive Director’s tenure. | Maximum bonus (as a percentage of base salary): – Chief Executive Officer (CEO): 250% – Chief Financial Officer (CFO): 240% Target levels (as a percentage of base salary): – CEO: 125% – CFO : 120% | – The bonus is determined by reference to performance from January 1 to December 31 each year; – Annual bonus = base salary x target bonus % x scorecard result (0–2); – Taking the Shell operating plan into consideration, REMCO sets stretching scorecard targets and weightings which support the delivery of the strategy. Measures are related to financial performance, operational excellence and sustainable development. Indicative weightings are 30%, 50% and 20% respectively. This balance ensures that the achievement of short-term financial performance does not undermine future shareholder value creation; – Scorecard targets will be disclosed in a subsequent Directors’ Remuneration Report when they are no longer deemed to be commercially sensitive; – There are no prescribed thresholds or minimum levels of performance that equate to a prescribed payment under the Policy and this structure can result in no bonus being awarded; – The annual bonus is subject to malus provisions before it is delivered and to clawback provisions thereafter; – The REMCO retains the ability to adjust performance measure targets and weightings year-by-year within the overall target and maximum payouts approved in the Policy; and – In the event that another Executive Director joins the Board the REMCO will determine their target and maximum bonus, which will not exceed the target and maximum for the CEO |
GOVERNANCE SHELL FORM 20-F 2019 | 117 | |
Executive Directors’ remuneration policy table continued | ||
Purpose and link to strategy | Maximum opportunity | Operation and performance management |
Long-Term Incentive Plan (LTIP) | ||
Rewards longer-term value creation linked to Shell’s strategy. The measures predominantly focus on financial growth and increases in value compared with the other oil majors, supported by measures focused on the achievement of Shell’s ambitions in the energy transition. To reinforce alignment with shareholder interests, shares delivered from vested LTIP awards are subject to a three-year holding period, which applies beyond an Executive Director’s tenure. | Target award of 300% base salary. Awards may vest at up to 200% of the shares originally awarded, plus dividends. | – Award levels are determined annually by the REMCO within the approved policy maximum; – Awards may vest between 0% and 200% of the initial award depending on Shell’s performance assessed on either an absolute basis against strategic targets, or on a relative basis against the other oil majors; – Performance metrics and targets are set by the REMCO at the beginning of the relevant performance period. When setting performance targets, the REMCO allocates weightings to each metric as it considers appropriate taking into account strategic priorities; – For 2020, performance is assessed over three years based 90% on financial metrics (TSR, ROACE, FCF and CFFO) which support our strategic ambition to be a world-class investment case and 10% on a measure focused on thriving in the energy transition; – Additional shares are released representing the value of dividends payable on the vested shares, as if these had been owned from the award date; – LTIP awards (net of tax) must be held for a further three years to align with Shell’s longer-term time horizon and strategy; – The LTIP award is subject to malus provisions before it is delivered and to clawback provisions thereafter; – The REMCO may adjust or change the LTIP measures, targets and weightings to ensure continued alignment with Shell’s strategy; and – In the event that another Executive Director joins the Board the REMCO will determine their award level. |
Discretion, Malus and Clawback | ||
Enables the management of risks from behavioural-based incentive schemes and the REMCO to manage the range of pay outcomes. | Adjustment events exist for the purposes of applying malus and clawback. The REMCO retains discretion to adjust pay outcomes. | The REMCO retains the discretion to adjust mathematical outcomes of the annual bonus scorecard and / or LTIP vesting for any Executive Director if and to the extent that it considers this appropriate at their sole discretion. The use of any discretion will be disclosed and explained. The REMCO may adjust pay outcomes for the purposes of managing quantum. This would be done at the REMCO’s discretion after considering single figure outcome for the year, taking into account Shell’s performance, the operation of the remuneration structures and any other relevant considerations. Please refer to page 119 for a summary of the defined adjustment events. |
Pension | ||
Provides a competitive retirement provision under the individual’s base country benefits policy, to attract and retain Executive Directors. | Determined by the rules of the base country pension plan of which the Executive Director is a member. | Executive Directors’ retirement benefits are maintained in line with those of the wider workforce in their base country. Only base salary is pensionable, unless country plan regulations specify otherwise and cannot legally be disapplied. The rules of the relevant plans detail the pension benefits which members can receive. The REMCO retains the right to amend the form of any Executive Director’s pension arrangements where appropriate, for example in response to changes in legislation to ensure the original objective of this element of remuneration is preserved. New Executive Directors, whether internal appointees or external hires, will be provided with a retirement benefit in line with the wider workforce in their base country. For individuals who are members of a defined benefit pension arrangement: – The pensionable salary will be capped at the salary applicable immediately prior to appointment, with the exception of existing US base country participants who will have the bonus removed from the definition of pensionable base salary instead; and – The Executive Director will join a defined contribution scheme in their base country for contributions made in respect of salary above the defined benefit pensionable salary, or in exceptional circumstances, receive a cash allowance equivalent to the contribution above the cap. |
Shareholding requirement | ||
Aligns interests of Executive Directors with those of shareholders by creating a connection between individual wealth and Shell’s long-term performance. | Shareholding (% of base salary): - CEO: 700% - CFO: 500% | Executive Directors are expected to build up their shareholding to the required level over a period of five years from appointment and, once reached, to maintain this level for the full period of their appointment. The intention is for the shareholding guideline to be reached through retention of vested shares from share plans. The REMCO will monitor individual progress and retains the ability to adjust the guideline in special circumstances on an individual basis. The Executive Director will be required to maintain their shareholding requirement (or existing shareholding if lower) for a period of two years from the date they cease to be an employee. In the event that another Executive Director joins the Board the REMCO will determine their Shareholding requirement level, which will not be less than 200% in line with corporate governance best practice. |
NOTES TO THE EXECUTIVE DIRECTORS’ REMUNERATION POLICY TABLE
Comparator group
The benchmarking comparator group consists of the other oil majors (BP, Chevron, ExxonMobil, and Total) and a selection of major Europe-based companies.
The comparator companies are reviewed by the REMCO as part of the Remuneration Policy review every three years. The last review took place in 2019 in preparation for the 2020 Directors’ Remuneration Policy vote. No changes to the comparator group are proposed.
The other oil majors are included in the comparator group as these
represent our closest direct competitors operating in similar market conditions. The Europe-based companies are selected based on their size, complexity and global reach. The REMCO uses benchmark data from these companies only as a guide to the competitiveness of the remuneration packages. We do not seek to position our remuneration at any defined point against the benchmarked positions.
The REMCO retains the right to alter the comparator group as it sees fit in order to ensure it remains an appropriate and relevant benchmark.
GOVERNANCE SHELL FORM 20-F 2019 | 118 | |
European comparator group | ||
Allianz | Daimler | Rio Tinto |
AstraZeneca | Diageo | Roche |
BAT | GlaxoSmithKline | Siemens |
Bayer | Nestle | Unilever |
BHP Billiton | Novartis | Vodafone |
Benefits
Benefits for Executive Directors deemed taxable in the UK are included as taxable benefits in the single total figure of remuneration table. These elements may include transport to and from home and office, the provision of home security, and occasional business-required partner travel, which are generally considered legitimate business expenses rather than components of remuneration.
Annual bonus
For the 2020 performance year, the scorecard framework will consist of cash flow from operating activities (30% weight), operational excellence (50% weight) and sustainable development (20% weight). Targets are derived from the annual business plan. These measures are designed to drive focus on the financial and operational performance critical to our success as a world-class investment case and to maintain a strong licence to operate, underpinned by our commitment to safety and journey to thrive in the energy transition. The REMCO believes it is important for annual variable pay to remain balanced, with operational and environmental components, complementing the LTIP’s focus on longer-term financial and strategic outcomes. The same annual bonus scorecard applies to the majority of group employees supporting consistency of remuneration and alignment of objective across employees, and senior management.
For future years, the specific measures and weightings for the annual bonus scorecard will be reviewed annually by the REMCO and adjusted accordingly to evolve with Shell’s strategy and circumstances. The annual review will also consider the scorecard target and outcome history over a decade to ensure that the targets set remain stretching but realistic. The REMCO retains the right to exercise its judgement to adjust the mathematical bonus scorecard outcome to ensure that the bonus scorecard outcome for Executive Directors reflects other aspects of Shell’s performance which the REMCO deems appropriate for the reported year.
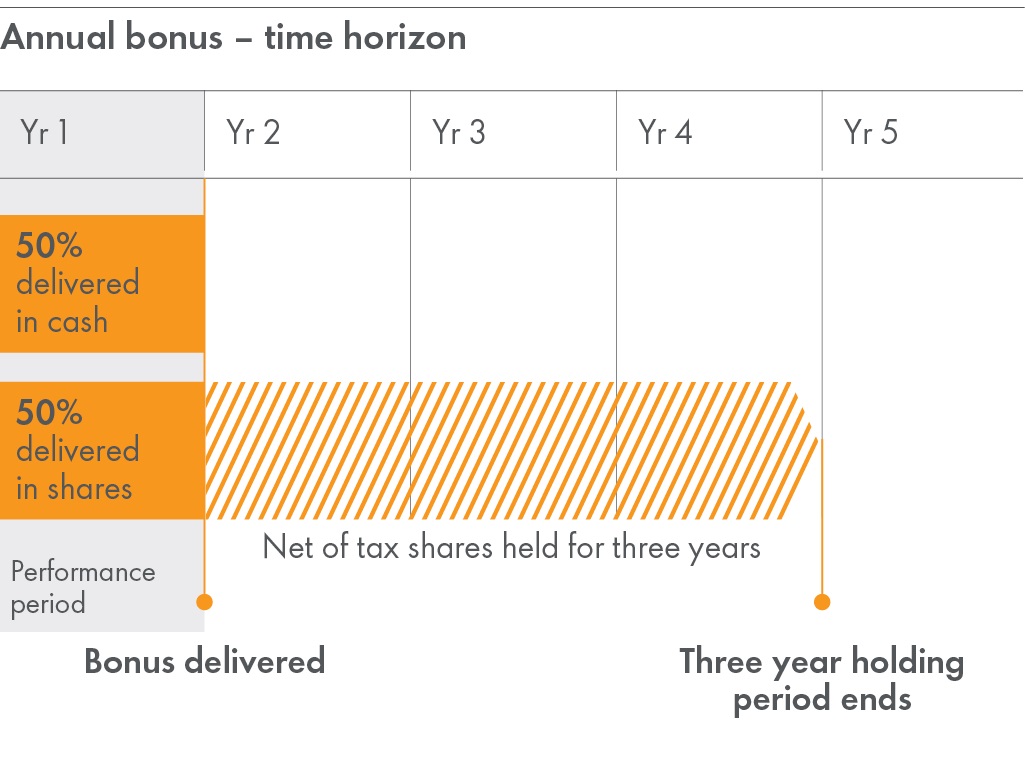
Long-term Incentive Plan
The LTIP rewards longer-term performance linked to Shell’s strategy, which includes cash generation, capital discipline, value created for shareholders as well as progress towards meeting our ambition to thrive in the energy transition.
For 2020, the absolute measures will be FCF and energy transition, and relative growth compared with our peers will be based on: TSR, ROACE and CFFO. The relative measures, which focus on outperforming our closest competitors on key financial metrics, are supported by the absolute FCF metric which provides cash to service and repay debt, make shareholder distributions and fund capital investment. These are aligned with our
strategic ambition to be a world-class investment case, and are supported by an energy transition measure focused on thriving in the energy transition and delivering our NCF target.
For the relative measures, 200% vests for first position, 150% for second, 80% for third and 0% for ranking fourth or fifth. The comparator group consists of four of the strongest companies in our industry (BP, Chevron, ExxonMobil and Total). Outperforming Shell’s closest competitors on key financial metrics is challenging. A vesting outcome of 80% for median performance (40% of maximum) in a small comparator group is considered appropriate by the REMCO. The REMCO is aware that vesting for median performance is generally set at a limit of 25% of maximum for other UK companies. However, these are typically applied against a larger comparator group.
The REMCO will regularly review the measures, weightings and comparator group, and retains the right to adjust these to ensure that the LTIP continues to serve its intended purpose with a stretching level of challenge. If the REMCO was to propose any material changes to the LTIP performance metrics, it would consult with major shareholders.
TSR underpin
If the TSR ranking is fourth or fifth, the level of the award that can vest on the basis of the other measures will be capped at 50% of the maximum payout for the LTIP.
The detailed weightings and metrics applicable to the 2020 bonus scorecard are set out on page 113. The detailed weightings and metrics applicable to the 2020 grant are set out on page 114. |
Performance Period
LTIP performance is assessed over a three-year period. Vested shares from the LTIP are subject to a further three-year holding period post-vesting. This holding period commences on the date of vesting and remains in force beyond an Executive Director’s tenure. This time horizon is deemed to be suitable for incentive purposes but is recognised as short relative to some of Shell’s operations. However, the REMCO believes that it provides for broad alignment with shareholder interests when coupled with significant hareholding requirements.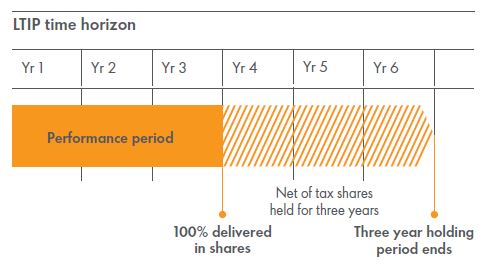
Discretion, malus and clawback
Variable pay awards may be made subject to adjustment events. At the discretion of REMCO, such an award may be adjusted before delivery (malus) or reclaimed after delivery (clawback) if an adjustment event occurs.
Adjustment events will be specified in award documentation and it is intended that they will, for example, relate to restatement of financial statements due to material non-compliance with a financial reporting requirement; misconduct by an Executive Director or misconduct through their direction or non-direction; any material breach of health and safety or environment regulations; serious reputational damage to Shell; material failure of risk management; corporate failure; or other exceptional events as determined at the discretion of the REMCO. The REMCO retains the right to alter the list of adjustment events in respect of future awards. In addition, the REMCO retains the discretion to adjust mathematical outcomes if and to the extent that it considers this appropriate. This power to adjust the
GOVERNANCE SHELL FORM 20-F 2019 | 119 | |
outcomes is broad and includes adjusting the outcomes to zero. For example, an adjustment might be made if the REMCO considers:
–The mathematical outcomes do not reflect the wider financial or non financial performance of RDS or the participant over the performance period;
– The LTIP vesting percentage is not appropriate in the context of circumstances that were unexpected or unforeseen at award; and
– There is any other reason why an adjustment is appropriate.
It is not anticipated that discretion would be used for upwards adjustment. If, in exceptional circumstances, it was considered, this would be done only after consultation with major shareholders.
Performance outcomes and/or share price appreciation make it difficult to predict the final amounts delivered under the LTIP at the time of award. In years where the vesting outcome makes the total remuneration inappropriate for any Executive Director, the REMCO will consider an adjustment to the annual bonus outcome or the LTIP vesting outcome for the purposes of managing remuneration quantum. In making any adjustment to the annual bonus or LTIP vesting outcome for this purpose REMCO will consider the overall level of remuneration for the Executive Director, the operation of the annual bonus, the operation of the LTIP, the wider performance of Shell over the performance periods, as well as the internal context for other employees.
An explanation of any discretionary adjustment would be set out in the relevant Directors' Remuneration Report.
Treatment of outstanding awards
Awards granted prior to the approval and implementation of this Policy and/or prior to an individual becoming an Executive Director will continue to vest and be delivered in accordance with the terms of the original award even if this is not consistent with the terms of this Policy.
As at March 10 2020, this applies to Executive Directors Ben van Beurden and Jessica Uhl who each have outstanding awards under the LTIP.
Shareholding
The REMCO believes significant shareholding by Executive Directors is an important way of ensuring that shareholders and Executive Directors share the same priorities. Shareholding is one of Shell’s core remuneration principles as it creates a balanced connection between individual wealth and Shell’s long-term performance. This will support effective governance and an ownership mindset. Significant shareholding requirements reflect the performance timescales of Shell and are aligned with absolute shareholder return.
The CEO is expected to build up a shareholding of seven times their base salary over five years from appointment. The CFO is expected to build up a shareholding of five times their base salary over the same period. In the event of an increase to the guideline multiple of salary, for every additional multiple of salary required, the director will have one extra year to reach the increased guideline, subject to a maximum of five years from the date of the change.
Executive Directors will be required to maintain their shareholding requirement (or their existing shareholding if less than the guideline) for a period of two years post-employment.
The holding periods for LTIP vested shares and shares delivered as part of the annual bonus continue to apply after Executive Directors leave employment.
Differences for Executive Directors from other employees
The remuneration structure and approach to setting remuneration levels is consistent across Shell, with consideration given to location, seniority and responsibilities. However, a higher proportion of total remuneration is tied to variable pay for Executive Directors and members of Senior Management.
The salary for each Executive Director is determined based on the indicators in the “Executive Directors’ remuneration policy table”, which reflect the international nature of the Executive Directors’ labour market. The salary for other employees is normally set on a country basis. Executive Directors are eligible to receive the standard benefits and allowances provided to other
employees. The provisions which are not generally available for other employees are described in “Benefits”.
The methodology used for determining the annual bonus for Executive Directors is broadly consistent with the approach for Shell employees generally. However, bonuses for the majority of Shell employees are determined taking into account individual and business performance, whereas bonuses for Executive Directors are based solely on business performance. Although the makeup and weightings scorecard used for the majority of Shell employees is currently aligned with the scorecard, these scorecards may differ if required to support the achievement of business objectives. All Executive Directors and Executive Committee members receive 50% of their annual bonus in shares, which are subject to a three-year holding period.
Executive Directors are not eligible to receive new awards under employee share plans other than the LTIP, although awards previously granted will continue to vest in accordance with the terms of the original award. Selected employees participate in the Performance Share Plan (PSP). The operation of the PSP is similar to the LTIP, but currently differs, for example, in some performance measures and their relative weightings. As at March 2020, around 51,000 employees participate in one or more of Shell’s global share plans and/or incentive plans, further supporting alignment with shareholder interests.
Executive Directors’ retirement benefits are maintained in line with those of the wider workforce in their base country.
Illustration of potential remuneration outcomes
The charts on this page represent estimates under four performance scenarios (“Minimum”, “On-target”, “Maximum” and “Maximum, assuming a 50% share price appreciation between award and vest”) of the potential remuneration outcomes for each Executive Director resulting from the application of 2020 base salaries to awards made in accordance with the proposed Policy. The majority of Executive Directors’ remuneration is delivered through variable pay elements, which are conditional on the achievement of stretching targets.
The REMCO will review the formulaic Single Figure outcome relative to the quality of performance outcomes and adjust these, taking into account Shell’s performance, shareholder experience, the operation of the remuneration structures and any other relevant factors, to ensure that the highest variable pay outcomes are only achieved in years with the highest
quality performance.
The scenario charts are based on future Policy award levels and are combined with projected single total figures of remuneration. The pay scenarios are forward-looking and only serve to illustrate the future Policy. For simplicity, the minimum, on-target and maximum scenarios assume no share price movement and exclude dividend accrual, for the portion of the bonus paid in shares and the LTIP, although dividend accrual during the performance and holding period applies. The scenarios are based on the current CEO (Ben van Beurden) and CFO (Jessica Uhl) roles.
Performance scenarios | |||
Minimum | Target | Maximum[A] | |
Base salary (2020) | ü | ü | ü |
Benefits (2019 actual) | ü | ü | ü |
Pension (2020 estimate) | ü | ü | ü |
Bonus | NIL | 125% CEO | 250% CEO |
120% CFO | 240% CFO | ||
LTIP | NIL | 300% CEO | 600% CEO |
270% CFO | 540% CFO | ||
GOVERNANCE SHELL FORM 20-F 2019 | 120 | |
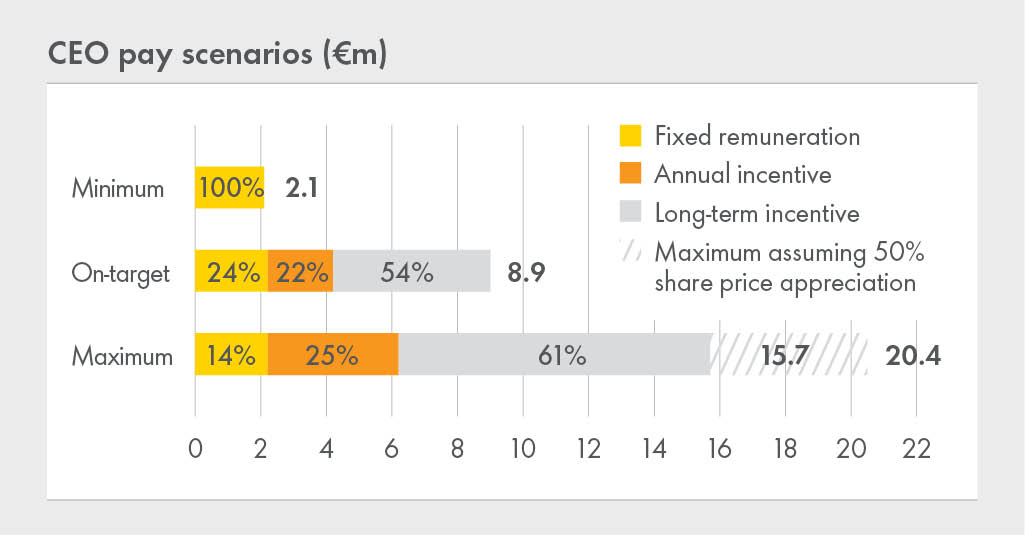
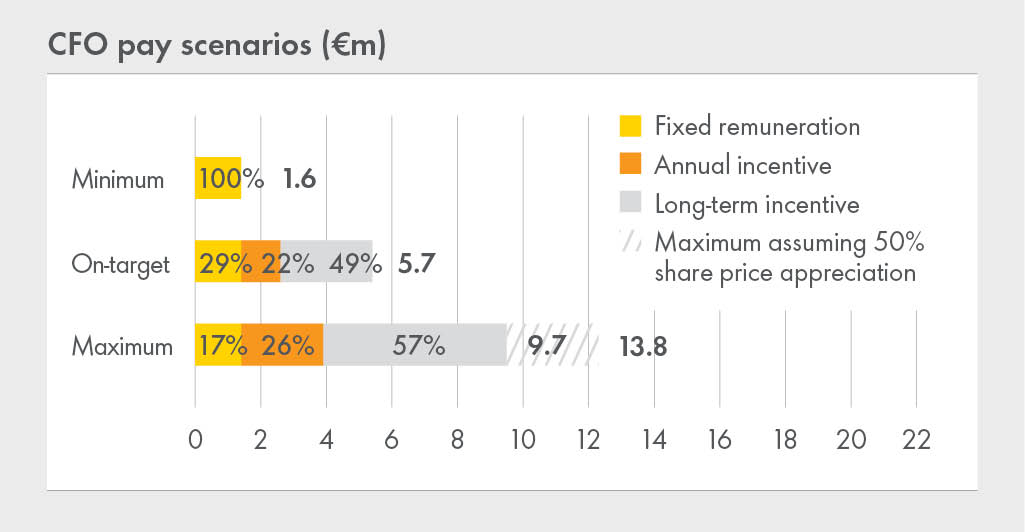
Recruitment
The REMCO determines the remuneration package for new Executive Director appointments. These appointments may involve external or internal recruitment or reflect a change in role of a current Executive Director.
When determining remuneration packages for new Executive Directors, the REMCO will seek a balanced outcome which allows Shell to:
- attract and motivate candidates of the right quality;
- take into account the individual’s current remuneration package and other contractual entitlements;
- seek a competitive pay position relative to our comparator group, without overpaying;
- encourage relocation if required; and
- honour entitlements (for example, variable remuneration) of internal candidates before their promotion to the Board. The REMCO will follow the approach set out in the table below when determining the remuneration package for a new Executive Director.
Recruitment – Remuneration package | ||
Component | Approach | Maximum |
Ongoing remuneration | The salary, benefits, annual bonus, long-term incentives and pension benefits will be positioned and delivered within the framework of the Executive Directors’ remuneration policy. | As stated in the “Executive Directors’ remuneration policy table”. |
Compensation for the forfeiture of any awards under variable remuneration arrangements | To facilitate external recruitment, one-off compensation in consideration for forfeited awards under variable remuneration arrangements entered into with a previous employer may be required. The REMCO will use its judgement to determine the appropriate level of compensation by matching the value of any lost awards under variable remuneration arrangements with the candidate’s previous employer. This compensation may take the form of a one-off cash payment or an additional award under the LTIP. The compensation can alternatively be based on a newly created long-term incentive plan arrangement where the only participant is the new director. The intention is that any such compensation would, as far as possible, align to the duration and structure of the award being forfeited. | An amount equal to the value of the forfeited variable remuneration awards, as assessed by the REMCO. Consideration will be given to appropriate performance conditions, performance periods and clawback arrangements. |
Replacement of forfeited entitlements other than any awards under variable remuneration arrangements | There may also be a need to compensate a new Executive Director in respect of forfeited entitlements other than any awards under variable remuneration arrangements. This could include, for example, pension or contractual entitlements, or other benefits. On recruitment, these entitlements may be replicated within the Executive Directors’ remuneration policy or valued by the REMCO and compensated in cash. In cases of internal promotion to the Board, any commitments made which cannot be effectively replaced within the Executive Directors’ remuneration policy may, at the REMCO’s discretion, continue to be honoured. | An amount equal to the value of the forfeited entitlements, as assessed by the REMCO. |
Exceptional recruitment incentive | Apart from the ongoing annual remuneration package and any compensation in respect of the replacement of forfeited entitlements, there may be circumstances in which the REMCO needs to offer a one-off recruitment incentive in the form of cash or shares to ensure the right external candidate is attracted (e.g. to the industry). The REMCO recognises the importance of internal succession planning but it must also have the ability to compete for talent with other global companies. The necessity and level of this incentive will depend on the individual’s circumstances. The intention will be that this is only used in genuinely exceptional circumstances. | Subject to the limits set out in the “Executive Directors’ remuneration policy table”. |
Pension | New appointees will be provided with a pension in line with the wider workforce in their base country. For defined benefit members: – The pensionable salary is capped at executive committee level pay for defined benefit purposes (with the exception of participants in the US plan where the bonus is removed from the definition of pensionable pay; and – The member joins an appropriate base country defined contribution mechanism in excess of the cap, or exceptionally a pension cash allowance equivalent to the defined contribution level is payable in excess of the cap | In accordance with the pension provision applicable to the wider workforce in the base country. |
Executive Directors’ employment arrangements
and letters of appointment
The Dutch Executive Directors are employed for an indefinite period. Executive Directors with the Netherlands as their base country will be employed on the basis of a contract of employment governed by Dutch employment law. For Executive Directors with a base country other than the Netherlands, REMCO will determine their employment arrangements based on a number of considerations, including Dutch immigration requirements and base country retirement benefits. Executive Directors’ employment arrangements are available for inspection at the AGM or on request. For further details on appointment and re-appointment of Directors, see the “Governance Framework” on page 79 and "Other Regulatory and Statutory Information" on page 124.
End of employment
Notice period
Employment arrangements of Executive Directors can generally end by either the employee or the employer providing one month’s notice, or the applicable statutory notice period. For example, under Dutch law, the statutory notice period for the employer will vary in line with the length of service, with the maximum being four months’ notice. Under Dutch law, termination payments are not linked to the contract’s notice period.
The Netherlands statutory end-of-employment compensation
With effect from July 1, 2015, employment legislation in the Netherlands introduced statutory end-of-employment compensation. Under this legislation, every termination (other than following retirement or for cause) of a Dutch employment contract that has continued for a minimum of two
GOVERNANCE SHELL FORM 20-F 2019 | 121 | |
years will give rise to an obligation to pay the departing employee transition compensation (“transitievergoeding”). The statutory compensation is capped at one times the annual salary, which is deemed to include variable pay such as the annual bonus. Executive Directors are expected not to claim transition compensation or any other applicable statutory compensation over and above the agreed compensation for loss of office as set out in the “End of employment” table below.
Outstanding entitlements
In cases of resignation or dismissal for cause, fixed remuneration (base salary, benefits, and employer pension contributions) will cease on the last
day of employment, variable remuneration elements will generally lapse and the Executive Director is not eligible for compensation for loss of office.
The information below generally applies to termination of employment by Shell giving notice, by mutual agreement, or in situations where the employment terminates because of retirement with Shell consent at a date other than the normal retirement date, redundancy or in other similar circumstances at the REMCO’s discretion.
End of employment | |
Provision | Policy |
Compensation for loss of office | For Executive Directors appointed between January 1, 2011 and December 31, 2016, employment contracts include a cap on termination payments of one times annual pay (base salary plus target bonus). Delivery of compensation is mitigated by a contractual obligation for the Executive Director to seek alternative employment and Shell’s ability to implement phased payment terms. For Executive Directors appointed on or after January 1, 2017, the REMCO may offer a termination payment of up to one times base salary (target bonus will not be included). However, REMCO may be obligated to pay statutory compensation over and above the compensation for loss of office to a departing Executive Director who asserts a statutory claim thereto. Delivery of compensation is mitigated by a contractual obligation for the Executive Director to seek alternative employment and Shell’s ability to implement phased payment terms. The provision of standard end-of-employment benefits such as repatriation costs, security provision and outplacement support may also be included, as deemed reasonable by the REMCO. The REMCO may adjust the termination payment for any situation where a full payment is inappropriate, taking into consideration applicable law, corporate governance provisions, the applicability of any statutory compensation and the best interests of Shell and shareholders as a whole. |
Annual bonus | Any annual bonus in the year of departure is prorated based on service. Depending on the timing of the departure, the REMCO may consider the latest scorecard position or defer payment until the full-year scorecard result is known. Bonuses delivered in shares represent the bonus which a participant has already earned and carry no further performance conditions; therefore, these shares will be unrestricted at the conclusion of the normal deferral or holding period respectively and no proration will apply. |
LTIP | Outstanding awards are prorated on a monthly basis, by reference to the Executive Director’s service within the performance period. They will generally survive the end of employment and will remain subject to the same vesting performance conditions, and malus and clawback provisions, as if the Executive Director had remained in employment. The three-year holding period will also remain in force for any awards made on or after January 1, 2017. If the participant dies before the end of the performance period, the award will vest at the target level on the date of death. In case of death after the end of the performance period, the award will vest as described in this Policy. |
NON-EXECUTIVE DIRECTORS | ||
Non-executive Directors’ remuneration policy table | ||
Fee structure | Approach to setting fees | Other remuneration |
Non-executive Directors (NEDs) receive a fixed annual fee for their directorship. The size of the fee will differ based on the position on the Board: Chair of the Board fee or standard Non-executive Director fee. Additional annual fee(s) are payable to any Director who serves as Senior Independent Director, a Board committee chair, or a Board committee member. A NED receives either a chair or member fee for each committee. This means that a chair of a committee does not receive both fees. NEDs receive an additional fee for any Board meeting involving intercontinental travel – except for one meeting a year held in a location other than The Hague. | The Chair’s fee is determined by the REMCO. The Board determines the fees payable to NEDs. The maximum aggregate annual fees will be within the limit specified by the Articles of Association and in accordance with the NEDs’ responsibilities and time commitments. The Board reviews NED fees periodically to ensure that they are aligned with those of other major listed companies. | Business expenses incurred in respect of the performance of their duties as a NED will be paid or reimbursed by Shell. Such expenses could include transport between home and office and occasional business-required partner travel. NEDs may receive a token of recognition on retirement from the board. The maximum value for this is €300. Where required, the Chair is offered Shell-provided accommodation in The Hague. The REMCO has the discretion to offer other benefits to the Chair as appropriate to their circumstances. Where business expenses or benefits create a personal tax liability to the Director, Shell may cover the associated tax. The Chair and the other NEDs cannot receive awards under any incentive or performance-based remuneration plans, and personal loans or guarantees are not granted to them. NEDs do not accrue any retirement benefits as a result of their non-executive directorships with Shell. NEDs are encouraged to hold shares with a value equivalent to 100% of their fixed annual fee and maintain that holding during their tenure. |
Non-executive Directors’ letters of appointment
NEDs, including the Chair, have letters of appointment. NEDs’ letters of appointment are available for inspection at the AGM or on request. For further details on appointment and re-appointment of Directors, see the “Governance Framework” on page 79 and “Other Regulatory and Statutory Information” on page 124.
Non-executive Director recruitment
The REMCO’s approach to setting the remuneration package for NEDs is to offer fee levels and specific benefits (where appropriate) in line with the “Non-executive Directors’ remuneration policy table” and subject to the Articles of Association. NEDs are not offered variable remuneration or retention awards.
When determining the benefits for a new Chair, the individual circumstances of the future Chair will be taken into account.
Non-executive Director termination of office
No payments for loss of office will be made to NEDs.
Consideration of overall pay and employment conditions
When setting the Policy, no specific employee groups were consulted. However, Shell seeks to promote and maintain good relations with employee representative bodies as part of its employee engagement strategy, and
consults on matters affecting employees and business performance as required.
When determining Executive Directors’ remuneration structure and outcomes, the REMCO reviews a set of information, including relevant reference points and trends, which includes internal data on employee remuneration (for example, employee relations matters in respect of remuneration and average salary increases applying in the Netherlands, UK and the USA). During the Policy review, pay and employment conditions of the wider Shell employee population were taken into account by adhering to the same performance, rewards and benefits philosophy for the Executive Directors, as well as overall benchmarking principles. Furthermore, any potential differences from other employees (see “Differences for Executive Directors from other employees”) were taken into account when providing the REMCO with advice in the formation of this Policy.
Dialogue between management and employees is important, with the annual Shell People Survey being one of the principal means of gathering employee views on a range of matters. The Shell People Survey includes questions inviting employees’ views on their pay and benefit arrangements. Shell also encourages share ownership among employees, and many are shareholders who are able to participate in the vote on the Policy at the AGM.
GOVERNANCE SHELL FORM 20-F 2019 | 122 | |
The REMCO is kept informed by the CEO, the Chief Human Resources & Corporate Officer and the Executive Vice President Remuneration and HR Operations on the bonus scorecard and any relevant remuneration matters affecting other senior executives, extending to multiple levels below the Board and Executive Committee.
Consideration of shareholder views
The REMCO engages with major shareholders on a regular basis throughout the year and this allows it to hear views on Shell’s remuneration approach and test proposals when developing or evolving the Policy. Recent examples of the REMCO responding to shareholder views include: considering the quantum of executive pay and the use of alternative reward structures; introducing the Energy Transition metric to the LTIP in line with our strategic ambitions; removing the individual performance modifier from the calculation of annual bonus outcomes to make remuneration structures simpler and more transparent to shareholders; reducing the CEO’s target bonus from 150% to 125%; reducing the CEO’s LTIP grant; and enabling the broader use of discretion to manage remuneration outcomes.
The REMCO will review the Policy regularly to ensure it continues to reinforce Shell’s long-term strategy and remains closely aligned with shareholders’ interests.
Additional policy statement
The REMCO reserves the right to make payments outside the Policy in limited exceptional circumstances, such as for regulatory, tax or administrative purposes or to take account of a change in legislation or exchange controls, and only where the REMCO considers such payments are necessary to give effect to the intent of the Policy.
LINDA M. COULTER
Company Secretary
March 11, 2020
GOVERNANCE SHELL FORM 20-F 2019 | 123 | |
Other regulatory and statutory information | |
Management Report | This Directors’ Report, together with the Strategic Report, serves as the Management Report for the purpose of Disclosure Guidance and Transparency Rule 4.1.8R. Both the Directors’ Report and Strategic Report have been presented in accordance with and reliance on English law, and the liabilities of the Directors in connection with those reports shall be subject to the limitations and restrictions provided by such law. | Directors' Report: pages 75-90 Strategic Report: page 7 |
Corporate governance | The Company’s statement on corporate governance, as required by DTR7.2.3R, is incorporated in this Directors’ Report by way of reference. | Directors' Report: pages 75-90 |
Business relationships [A] | A statement, summarising the Directors’ business relationships with suppliers, customers and others. | Strategic Report: page 7 |
Employee engagement | Information on how Directors have engaged with employees. | |
Directors' interests [B] | The interests (in shares of the Company or calculated equivalents) of the directors in office at the end of the year, including any interests of a “connected person”. Changes in Directors’ share interests during the period from December 31, 2019, to March 11, 2020. | Annual Report on Remuneration: pages 102-115 |
Likely future developments | Information relating to likely future developments. | Provided throughout the Strategic Report: page 7 |
Research and development | Information relating to Shell’s research and development, including expenditure. | Shell Story: pages 9-10 |
Employee communication and involvement | Information concerning employee communication and involvement. | Our people: pages 66-67 |
Corporate social responsibility | A summary of Shell’s approach to corporate social responsibility. Further details will be available in the Shell Sustainability Report 2019. | Environment and society: 55-58 Our people: 66-67 |
Branches | A list of our subsidiaries, joint ventures and associates. Our activities and interests are operated through subsidiaries, branches of subsidiaries, joint ventures and associates which are subject to the laws and regulations of many different jurisdictions. | Additional Information, Exhibit 8.1 |
Greenhouse gas emissions | Information relating to greenhouse gas emissions. | Climate change and energy transition: pages 59-65 |
Risk management | Detail on risk factors Information on emerging risks | Pages 11-15 of the Strategic Report Other regulatory and statutory information: Pages 124-137 |
Financial risk management, objectives and policies | Descriptions of the use of financial instruments and Shell’s financial risk management objectives and policies, and exposure to market risk (including price risk), credit risk and liquidity risk. | Consolidated Financial Statements: Note 19, pages 176-182 |
Listing rule information [C] | Information relating concerning the amount of interest capitalised by Shell. | Consolidated Financial Statements: Note 20, pages 181-182 |
Listing rule information [C] | The Remuneration Committee Report | Directors' Remuneration Report: pages 98-101 |
Listing rule information [C] | Details of the Company’s long-term incentive schemes as required by LR 9.4.3R | Directors' Remuneration Report: pages 98-101 |
Significant shareholdings | Information concerning significant shareholdings. | Additional information: Note 20, page 181-182 |
[A] | This meets the purposes of Schedule 7 to The Companies (Miscellaneous Reporting) Regulations 2018. |
[B] | “Connected person” has the meaning given to “person closely associated” within the Market Abuse Regulation. |
[C] | [This information is given in accordance with Listing Rule 9.8.4R. Further information in connection with Listing Rule 9.8.4R is contained in the remainder of “Other Statutory Information” which follows on 125-137. |
GOVERNANCE SHELL FORM 20-F 2019 | 124 | |
DISCLOSURE OF INFORMATION TO AUDITORS
In accordance with section 418 of the Act, each of the persons who is a Director at the date of approval of this Report confirms that, so far as the Director is aware, there is no relevant audit information of which the Company’s auditor is unaware. The director has taken all steps that he or she ought to have taken as a director in order to make himself or herself aware of any relevant audit information and to establish that the Company’s auditor is aware of that information.
FINANCIAL STATEMENTS, DIVIDENDS AND DIVIDEND POLICY
The “Consolidated Statement of Income” and “Consolidated Balance Sheet” can be found on pages 143 and 145 respectively.
The Board aims to grow the dividend per share through time in line with its view of the underlying business earnings and cash flow of the Shell group. When setting dividends, the Board looks at a range of factors, including the macro-environment and the Company’s current balance sheet, future investment plans and existing commitments. In addition, the Board could choose to return cash through share buybacks, subject to the capital requirements of the Shell group.
The Board is aware of a consultation undertaken in 2019 by the Investment Association on behalf of BEIS to review the practice of shareholder distributions being made that have not been voted on by shareholders. The Board will consider the outcome of this review once it is published.
Interim dividends are currently declared by the Board and paid on a
quarterly basis. Shell does not currently pay a “final” dividend, which would need to be voted on by shareholders, requiring the introduction of a resolution at the AGM. This would delay the payment of the fourth quarter dividend (currently paid in late March) until after the AGM, towards the end of May, a delay of around seven weeks. Our approach to dividend payments is not uncommon for companies distributing returns to shareholders on a quarterly basis.
On December 18, 2019, Shell announced the introduction of US dollar as additional currency election for the payment of dividends, alongside euro and sterling, and highlighted that its dividend will be settled with its shareholders fully electronically either in CREST or via interbank transfers.
The Directors have announced a fourth-quarter interim dividend as set out in the table below, payable on March 23, 2020, to shareholders on the Register of Members at close of business on February 14, 2020. The closing date for dividend currency elections was February 28, 2020 [A] and the euro and sterling equivalents announcement date was March 9, 2020.
[A] A different dividend currency election date may apply to shareholders holding shares in a securities account with a bank or financial institution ultimately through Euroclear Nederland. This may also apply to other shareholders who do not hold their shares either directly on the Register of Members or in the corporate sponsored nominee arrangement. Such shareholders can contact their broker, financial intermediary, bank or financial institution for the election deadline that applies.
Dividends | 2019 | ||||||||||||||||||
A shares | B shares[A] | A ADSs | B ADSs | ||||||||||||||||
$ | € | pence | $ | pence | € | $ | $ | ||||||||||||
Q1 | 0.47 | 0.42 | 36.97 | 0.47 | 36.97 | 0.42 | 0.94 | 0.94 | |||||||||||
Q2 | 0.47 | 0.43 | 38.01 | 0.47 | 38.01 | 0.43 | 0.94 | 0.94 | |||||||||||
Q3 | 0.47 | 0.42 | 35.73 | 0.47 | 35.73 | 0.42 | 0.94 | 0.94 | |||||||||||
Q4 [A] | 0.47 | 0.42 | 36.40 | 0.47 | 36.40 | 0.42 | 0.94 | 0.94 | |||||||||||
Total announced in respect of the year | 1.88 | 1.68 | 147.11 | 1.88 | 147.11 | 1.68 | 3.76 | 3.76 | |||||||||||
Amount paid during the year | 1.88 | 1.68 | 146.65 | 1.88 | 146.65 | 1.68 | 3.76 | 3.76 | |||||||||||
[A] It is expected that holders of B shares will receive dividends through the dividend access mechanism applicable to such shares. The dividend access mechanism is described more fully on page 209.
VIABILITY STATEMENT
The “Strategic Report” includes information about Shell’s strategy, financial condition, cash flows and liquidity, as well as the factors, including the principal risks, likely to affect Shell’s future development. “Business overview” describes Shell’s business model, including competitive advantages and key strengths. The Directors assess Shell’s prospects at both an operating and strategic level, each involving different time horizons. To this end, the Directors assess Shell’s portfolio and strategy against a wide range of outlooks, including assessing the potential impacts of various possible energy transition pathways and scenarios for changes in societal expectations in relation to climate change. Shell recognises in its strategy that the world is transitioning to a lower-carbon energy system (see “Climate change and energy transition”). The Risk Factors section provides an overview of the principal risks Shell is exposed to in its operations.
On an annual basis, the Directors approve a detailed three-year operating plan, which forecasts Shell’s cash flows and ability to service financing requirements, pay dividends and fund investing activities during the period. Shell’s three-year operating plan includes assumptions in relation to internal and external parameters. Some of the key assumptions include the impact of commodity prices, exchange rates, future carbon costs, agreements like LNG contract renewals, and schedules of growth programmes. Considering the degree of change possible in these parameters, Shell has deemed a three-year period of assessment appropriate for the longer-term viability statement.
In making the viability assessment, the Directors have also considered the financial impact of each of the following severe but possible scenarios that could threaten Shell’s viability. In reviewing these stress tests, the Directors have considered possible mitigation steps and have made certain assumptions regarding the availability of future funding options, including credit lines and debt facilities, possible assets disposals, and the ability to flex the levels of shareholder returns and to raise future financing in line with the operating plan window.
GOVERNANCE SHELL FORM 20-F 2019 | 125 | |
Scenario | Link to principal risks |
A significant HSSE event | [A] |
A low oil and gas price environment with $40/bbl Brent (nominal price) over the three year planning period | [B] |
A significant HSSE event in a low oil and gas price environment | [A] and [B] |
Sustained impact from politically adverse developments, lower growth in developing countries, as well as lower growth in Europe | [B] and [C] |
Unplanned shut down of a major cash generating asset for a year | [A] |
[A] The nature of our operations exposes us, and the communities in which we work, to a wide range of health, safety, (cyber) security and environment risks. [B] We are exposed to macro-economic risks including, fluctuating prices of crude oil, natural gas, oil products and chemicals. [C] We are exposed to treasury and trading risks, including liquidity risk, interest rate risk, foreign exchange risk and credit risk. We are affected by the global macroeconomic environment as well as financial and commodity market conditions. | |
Taking account of Shell’s position and principal risks at December 31, 2019, the Directors have a reasonable expectation that Shell will be able to continue in operation and meet its liabilities as they fall due over its three-year operating plan period.
NON-FINANCIAL INFORMATION STATEMENT
Non-Financial Information Statement | ||
Reporting requirement | Where to read more in this report | Page |
Business Model | Business overview | 9 |
Non-financial KPIs | Performance indicators | 20-21 |
Environmental matters | Environment and society, Climate change and energy transition | 55-65 |
Employees | Our people and Directors Report | 66-67, 75-90 |
Social matters | Environment and society | 55-58 |
Respect for human rights | Environment and society | 58 |
Anti-corruption and anti-bribery matters | Our people | 66-67 |
REPURCHASES OF SHARES
The Group announced, on July 26, 2018, the start of a share buyback programme of at least $25 billion by the end of 2020 subject to further progress with debt reduction and oil price conditions. At the 2019 AGM, shareholders granted an authority for the Company to repurchase up to a maximum of 815 million of its shares (excluding purchases for employee share plans). This authority expires on the earlier of the close of business on August 21, 2020, or the end of the 2020 AGM.
During 2019, 320.1 million A shares, and 16.1 million B shares, with nominal values of €23.6 million ($28.4 million) respectively (4.27% of the Company’s total issued share capital at December 31, 2019) were purchased and cancelled for a total cost of $10.2 billion including expenses, at an average price of $30.25 per share. The purpose of the shares repurchased in 2019 under the share buyback programme is to reduce the issued share capital of the Company. This is to offset the number of shares issued under the Scrip Dividend Programme and to significantly reduce the equity issued in connection with the Company’s combination with BG Group. The Scrip Dividend Programme was cancelled with effect from the fourth quarter 2017 interim dividend. More information can be found at www.shell.com/scrip. From January 1, 2020, to January 24, 2020, the end of the sixth tranche of the share buyback programme, a further 23.2 million A shares (0.29% of the Company’s total issued share capital at December 31, 2019) were purchased for
cancellation for a total cost of $0.7 billion including expenses, at an average price of $29.63 per share. This means that 624 million shares could still be repurchased under the current AGM authority.
The Board continues to regard the ability to repurchase issued shares in suitable circumstances as an important part of Shell’s financial management. A resolution will be proposed at the 2020 AGM to renew the authority for the Company to purchase its own share capital, up to specified limits, for a further year. This proposal will be described in more detail in the Notice of Annual General Meeting.
BOARD OF DIRECTORS
The names of the Directors that held office during the year can be found on pages 68-73. Information on the Directors who are seeking appointment or reappointment is included in the Notice of Annual General Meeting.
QUALIFYING THIRD-PARTY INDEMNITIES
The Company has entered into a Deed of Indemnity (Deed) with each Director of the Company who served during the year. The terms of each of these Deeds are identical and they reflect the statutory provisions on indemnities contained in the Companies Act 2006 (CA 2006). Under the terms of each Deed, the Company has agreed to indemnify the Director, to the widest extent permitted by the CA 2006, against any loss, liability or damage, howsoever caused (including in respect of a Director’s own negligence), suffered or incurred by a Director in respect of their acts or omissions while or in the course of acting as a Director or employee of the Company, any associated company or affiliate (within the meaning of the CA 2006). In addition, the Company shall lend funds to Directors as required to meet reasonable costs and expenses incurred or to be incurred by them in defending any criminal or civil proceedings brought against them in their capacity as a Director or employee of the Company, associated company or affiliate, or, in connection with certain applications brought under the CA 2006. The provisions in the Company’s Articles relating to arbitration and exclusive jurisdiction are incorporated, mutatis mutandis, into the Deeds entered into by each Director and the Company.
RELATED PARTY TRANSACTIONS
In addition to the disclosures given in Notes 9,27 and 29 to the “Consolidated Financial Statements” on pages 165-189, there were the following related party transactions or proposed transactions.
Sale of Assets and GP/IDR Restructuring
On February 27, 2020, Shell entered into a Purchase and Sale Agreement to sell 79% of the issued and outstanding membership interests in Mattox Pipeline Company LLC and certain logistics assets at the Shell Norco Manufacturing Complex to Shell Midstream Partners, L.P. (the “Partnership”) (“Asset Sale”).
On February 27, 2020, Shell entered into a Partnership Interests Restructuring Agreement with the Partnership to eliminate the general partner’s incentive distribution rights, cancel the general partner’s 4,761,012 units and convert the general partner’s two percent general partner interest in the Partnership into a non-economic general partner interest in the Partnership (the “GP/IDR Restructuring”). Simultaneously with the closing of the GP/IDR Restructuring, the general partner, which Shell controls, will amend and restate the First Amended and Restated Agreement of Limited Partnership of the Partnership, dated as of November 3, 2014, as amended, to reflect the GP/IDR Restructuring and the establishment of the Series A Preferred Units.
As consideration for the two transaction described above, the Partnership will issue $1.2 billion of Series A perpetual convertible preferred units at a price of $23.63 per unit, plus 160 million newly issued common units representing limited partner interests in the Partnership. Pursuant to the Partnership Interests Restructuring Agreement, the general partner has agreed to waive a portion of the distributions that would otherwise be payable on the Common Units issued to the general partner as part of the GP/IDR Restructuring in an amount of $20 million per quarter for each of the four consecutive fiscal quarters following the closing of both transactions.
GOVERNANCE SHELL FORM 20-F 2019 | 126 | |
Both the Purchase and Sale Agreement and Partnership Interests Restructuring Agreement contain customary representations, warranties and covenants. As part of the Asset Sale, Shell and the Partnership have agreed to indemnify each other and their respective affiliates, officers, directors and other representatives against certain losses resulting from any breach of their representations, warranties or covenants contained in the Purchase and Sale Agreement, subject to certain limitations and survival periods.
Both transactions are expected to close during the second quarter of 2020 and are subject to regulatory approvals, including under the Hart-Scott-Rodino Antitrust Improvements Act of 1976, and other customary closing conditions, as well as the closing of each transaction.
Ten Year Fixed Facility
On June 4, 2019, the Partnership, as borrower, and Shell, as lender, entered into a ten-year fixed rate credit facility with a borrowing capacity of $600 million (the “Ten Year Fixed Facility”). The Ten Year Fixed Facility bears an interest rate of 4.18% per annum and matures on June 4, 2029. The Ten Year Fixed Facility contains customary representations, warranties, covenants and events of default, the occurrence of which would permit Shell to accelerate the maturity date of amounts borrowed under the Ten Year Fixed Facility. The Ten Year Fixed Facility was fully drawn on December 31, 2019.
Contribution Agreement
On May 10, 2019, the Partnership entered into a Contribution Agreement (the “Contribution Agreement”) with Shell to acquire an additional 10.125% interest in Colonial Pipeline Company and an additional 25.97% interest in Explorer Pipeline Company for $800 million, which consisted of $600 million in cash consideration from borrowings under the Ten Year Fixed Facility (discussed above) and non-cash equity consideration valued at $200 million. The Contribution Agreement contains customary representations, warranties and covenants and the Partnership and Shell have agreed to indemnify each other and their respective affiliates, officers, directors and other representatives against certain losses resulting from any breach of their representations, warranties or covenants contained in the Contribution Agreement, subject to certain limitations and survival periods. This transaction was completed on June 6, 2019.
POLITICAL CONTRIBUTIONS
No donations were made by the Company or any of its subsidiaries to political parties or organisations during the year. Shell Oil Company administers the non-partisan Shell Oil Company Employees’ Political Awareness Committee (SEPAC), a political action committee registered with the US Federal Election Commission. Eligible employees may make voluntary personal contributions to the SEPAC.
RECENT DEVELOPMENTS AND POST-BALANCE SHEET EVENTS
See Note 29 to the “Consolidated Financial Statements” on page 189.
SHARE CAPITAL
The Company’s issued share capital at December 31, 2019, is set out in Note 20 to the “Parent Company Financial Statements” on page 181. The percentage of the total issued share capital represented by each class of share is given below.
Share capital percentage | ||
Share class | % | |
A | 52.68 | |
B | 47.32 | |
Sterling deferred | de minimis | |
TRANSFER OF SECURITIES
There are no restrictions on transfer or limitations on the holding of the ordinary shares other than under the Articles, under restrictions imposed by law or regulation (for example, insider trading laws) or pursuant to the
Company’s Share Dealing Code.
SHARE OWNERSHIP TRUSTS AND TRUST-LIKE ENTITIES
Shell has three primary employee share ownership trusts and trust-like entities: a Dutch foundation (stichting) and two US Rabbi Trusts. The shares held by the Dutch foundation are voted by its Board and the shares in the US Rabbi Trusts are voted by the Voting Trustee, Newport Trust Company. Both the Board of the Dutch foundation and the Voting Trustee are independent of Shell.
The UK Shell All Employee Share Ownership Plan has a separate related share ownership trust. Shares held by the trust are voted by its trustee, Computershare Trustees Limited, as directed by the participants.
AUDITOR
A resolution relating to the appointment of Ernst & Young LLP as auditor for the financial year 2020 will be proposed at the 2020 AGM.
ANNUAL GENERAL MEETING
The AGM will be held on May 19, 2020, at the Circustheater, Circusstraat 4, 2586 CW, The Hague, the Netherlands. The Notice of Annual General Meeting will include details of the business to be put to shareholders at the AGM.
CONFLICTS OF INTEREST
In accordance with the Act and the Articles of the Board may authorise any matter that otherwise may involve any Directors breaching their duty to avoid conflicts of interest. The Board has adopted a procedure to address these requirements. Detailed conflict of interest questionnaires are reviewed by the Board and, if considered appropriate, authorised. Conflicts of interest as well as any gifts and hospitality received by and provided by Directors are kept under review by the Board. Further information relating to conflicts of interest can be found in the Articles, available on the website.
SIGNIFICANT COMMITMENTS OF THE CHAIR
The Chair's other significant commitments are given in his biography on page 68.
SHELL GENERAL BUSINESS PRINCIPLES
The Shell General Business Principles define how Shell subsidiaries are expected to conduct their affairs and are underpinned by the Shell core values of honesty, integrity and respect for people. These principles include, among other things, Shell’s commitment to support fundamental human rights in line with the legitimate role of business and to contribute to sustainable development. They are designed to mitigate the risk of damage to our business reputation and to prevent violations of local and international legislation. They can be found at www.shell.com/sgbp. See “Risk factors” on pages 11-15.
SHELL CODE OF CONDUCT
Directors, officers, employees and contract staff are required to comply with the Shell Code of Conduct, which instructs them on how to behave in line with the Shell General Business Principles. This Code clarifies the basic rules and standards they are expected to follow and the behaviour expected of them. These individuals must also complete mandatory Code of Conduct training.
Designated individuals are required to complete additional mandatory training on antitrust and competition laws, anti-bribery, anti-corruption and anti-money laundering laws, financial crime, data protection laws and trade compliance requirements (see “Risk factors” on page 14). The Shell Code of Conduct can be found at www.shell.com/codeofconduct
CODE OF ETHICS
Executive Directors and Senior Financial Officers of Shell must also comply with the Code of Ethics. This Code is specifically intended to meet the requirements of Section 406 of the Sarbanes-Oxley Act. It can be found at www.shell.com/codeofethics.
INDEPENDENT PROFESSIONAL ADVICE
All Directors may seek independent professional advice in connection with their role as a Director. All Directors have access to the advice and
GOVERNANCE SHELL FORM 20-F 2019 | 127 | |
services of the Company Secretary. The Company has provided both indemnities and Directors’ and officers’ insurance to the directors in connection with the performance of their responsibilities. Copies of these indemnities and the directors’ and officers’ insurance policies are open to inspection. A copy of the form of these indemnities has been previously filed with the Securities and Exchange Commission.
RESULTS PRESENTATIONS AND ANALYSTS’ MEETINGS
The planned dates of the quarterly, half-yearly and annual results presentations, as well as all major analysts’ meetings, are announced in advance on the Shell website and through a regulatory release.
Generally, presentations are broadcast live via webcast and teleconference. Other meetings with analysts or investors are not normally announced in advance, nor can they be followed remotely by webcast or any other means. Procedures are in place to ensure that discussions in such meetings are always limited to non-material information or information already in the public domain.
Results and meeting presentations can be found at www.shell.com/ investor. This is in line with the requirement to ensure that all shareholders and other parties in the financial market have equal and simultaneous access to information that may influence the price of the Company’s securities.
CONTROLS AND PROCEDURES
The Board is responsible for maintaining a sound system of risk management and internal control, and for regularly reviewing its effectiveness. It has delegated authority to the Audit Committee to assist it in fulfilling its responsibilities in relation to internal control and financial reporting (see “Audit Committee Report” on pages 91-97).
A single overall control framework is in place for the Company and its subsidiaries that is designed to manage rather than eliminate the risk of failure to achieve business objectives. It therefore only provides a reasonable and not an absolute assurance against material misstatement or loss.
The diagram below illustrates the Control Framework’s key components: “Foundations”, “Management processes” and “Structural”. “Foundations” comprises the objectives, principles and rules that underpin and establish boundaries for Shell activities. “Management processes” refers to the more significant management processes, including how strategy, planning and appraisal are used to improve performance and how risks are to be managed through effective controls and assurance. The “Structural”component defines how Businesses and Functions facilitate achievement of the Shell group’s overall business objectives.
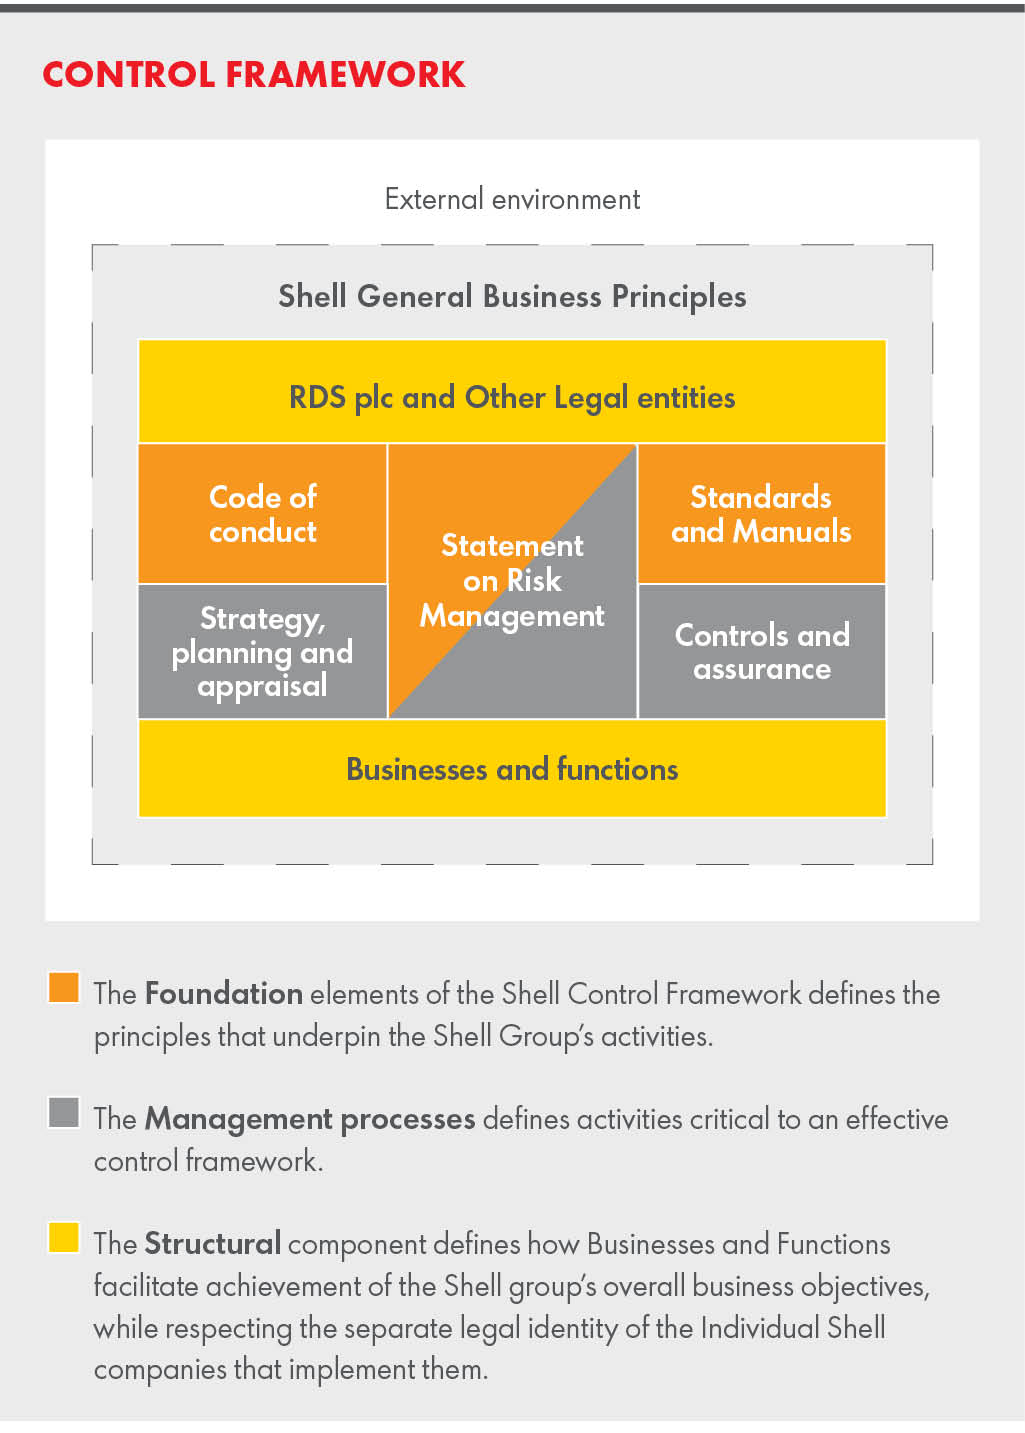
The Audit Committee met six times this year and received regular reports from the Chief Internal Auditor on notable internal audits and those with a significant impact on control effectiveness. The Audit Committee also reviewed significant financial, business and compliance control incidents and received regular reports on business integrity issues. The Audit Committee also requested updates on specific financial, operational and compliance control issues throughout the year. The Audit Committee Chair provided an update to the Board after every Audit Committee meeting.
During and after such reports, the Board has an opportunity to request
further information and/or ask clarifying questions, which it does to
varying degrees depending on the issue. Similarly, the Chairs of the
Safety, Environment and Sustainability Committee (SESCo) and the
Nigeria Special Litigation Committee, an ad hoc Board Committee, also provide regular updates after
each of their respective meetings covering, among other matters, the
respective aspects of controls that they monitor pursuant to their Terms of Reference. The Audit Committee and SESCo minutes, once approved, are further provided to the Board and incorporated into Board minutes to ensure full access to and review by all Directors. These aspects, together with the 2019 Reports respectively submitted to the Board by the Chief Internal Auditor, the External Auditors, the Disclosure Committee Chairman and the Chief Ethics & Compliance Officer, as well as summaries of the Annual Proved Reserves Disclosure and the Full Year HSSE & Social Performance Assurance Report, enable the Board’s ongoing monitoring and annual review of material controls.
An annual review of the effectiveness of risk management and internal control was carried out by both the Executive Committee and the Audit Committee. This was based on their own insights and experience throughout the year as well as outcomes from the Group Assurance Letter process, a structured internal assessment of compliance with legal and ethical requirements and the Shell Control Framework carried out by each Executive Director. As part of their annual review, the Executive Committee and Audit Committee also considered annual reports from the Chief Internal Auditor, Chief Ethics & Compliance Officer and the
GOVERNANCE SHELL FORM 20-F 2019 | 128 | |
External Auditor. The insights and conclusions from this annual assessment were reviewed and discussed by the Board.
The system of risk management and internal control over financial reporting is an integral part of the Control Framework. Regular reviews are performed to identify the significant risks to financial reporting and the key controls designed to address them. These controls are documented, responsibility is assigned, and they are monitored for design and operating effectiveness. Controls found to be ineffective are remediated. The principal risks faced by Shell are set out in “Risk factors” on pages 11-15.
Shell has a variety of processes for obtaining assurance on the adequacy of risk management and internal control. Emerging risks are identified through (among others) the monitoring of external developments, risk indicators, learnings from incidents and assurance findings, and through the appraisal of Shell’s forward-looking plans. A broad array of measures are used to manage Shell’s various risks which are set out in the relevant sections of this Report. There are also risks that Shell accepts or does not seek to fully mitigate. The Executive Committee and the Board regularly consider group-level risks and associated control mechanisms.
Shell has developed a risk appetite framework that considers three distinct factors: Strategic Risk Appetite, Operational Risk Appetite and Conduct Risk Appetite. These three factors aim to capture the range and variety of risks affecting Shell, with specific risk appetite parameters identified and monitored for each one.
Strategic Risk Appetite is about current and future portfolio considerations, examining parameters such as country concentration or exposure to higher-risk countries. It also considers “long-range” developments in order to test key assumptions or beliefs in relation to energy markets.
Operational Risk Appetite is about material operational exposures, and promotes a more granular assessment of key risks facing the organisation. Conduct Risk Appetite brings together leading and lagging risk indicators to provide an overall view of the culture of the organisation.
The Financial Framework sets certain boundary conditions in the consideration of risk appetite, as the financial resilience of Shell should logically inform the aggregate level of risk appetite that could be sustained.
Shell has a climate change risk management structure which is supported by standards, policies and controls (see “Risk factors” on page 12 and “Climate change and energy transition” on pages 59-65).
Climate change and risks resulting from greenhouse gas emissions have been identified as significant risk factors for Shell and are managed in accordance with other significant risks through the Board and Executive Committee.
Many of our major projects and operations are conducted in joint arrangements or associates, which may reduce the degree of control and ability to identify and manage risks (see “Risk factors” on pages 11-15). In each case, Shell appoints a representative to manage its interests who seeks to ensure that such projects operate under equivalent standards to Shell.
We operate in more than 70 countries that have differing degrees of political, legal and fiscal stability. This exposes us to a wide range of political developments that could result in changes to contractual terms, laws and regulations. In addition, we and our joint arrangements and associates face the risk of litigation and disputes worldwide (see “Risk factors” on pages 11-15). We continuously monitor geopolitical developments and societal issues relevant to our interests. Employees who engage with government officials are subject to specific training programmes, procedures and regular communications, in addition to Shell General Business Principles and Shell Code of Conduct compliance. We are prepared to exit a country if we believe we can no longer operate in that country in accordance with our standards and applicable law, and we have done so in the past.
The Board confirms that there is a robust process for identifying, evaluating and managing the principal risks. Further, the Board confirms it carries out a robust assessment of Shell’s emerging risks, the procedures in place to identify the emerging risks, and how the risks are being managed or mitigated to the achievement of Shell’s objectives. This has been in place throughout 2019 and up to the date of this Report and is regularly reviewed by the Board and accords with the FRC Guidance on Risk Management, Internal Control and Related Financial and Business Reporting.
The Board has conducted its annual review of the effectiveness of Shell’s system of risk management and internal control in respect of 2019, such review covering all material controls, including financial, operational and compliance controls.
MANAGEMENT’S EVALUATION OF DISCLOSURE CONTROLS AND PROCEDURES OF SHELL
Shell’s CEO and CFO have evaluated the effectiveness of Shell’s disclosure controls and procedures at December 31, 2019. Based on that evaluation, they concluded that Shell’s disclosure controls and procedures are effective.
MANAGEMENT’S REPORT ON INTERNAL CONTROL OVER FINANCIAL REPORTING OF SHELL
Management, including the CEO and CFO, is responsible for establishing and maintaining adequate internal control over Shell’s financial reporting and the preparation of the “Consolidated Financial Statements”. It conducted an evaluation of the effectiveness of Shell’s internal control over financial reporting and the preparation of the “Consolidated Financial Statements” based on the Internal Control - Integrated Framework (2013) issued by the Committee of Sponsoring Organizations of the Treadway Commission (COSO). On the basis of this evaluation, management concluded that, at December 31, 2019, the Company’s internal control over financial reporting and the preparation of the “Consolidated Financial Statements” was effective.
Ernst & Young LLP, the independent registered public accounting firm that audited the “Consolidated Financial Statements”, has issued an attestation report on the Company’s internal control over financial reporting, as stated in its report on pages 138-141.
THE TRUSTEE’S AND MANAGEMENT’S EVALUATION OF DISCLOSURE CONTROLS AND PROCEDURES FOR THE ROYAL DUTCH SHELL DIVIDEND ACCESS TRUST
The Trustee of the Royal Dutch Shell Dividend Access Trust (the Trustee) and Shell’s CEO and CFO have evaluated the effectiveness of the disclosure controls and procedures in respect of the Dividend Access Trust (the Trust) at December 31, 2019. On the basis of this evaluation, these officers have concluded that the disclosure controls and procedures of the Trust are effective.
THE TRUSTEE’S AND MANAGEMENT’S REPORT ON INTERNAL CONTROL OVER FINANCIAL REPORTING OF THE ROYAL DUTCH SHELL DIVIDEND ACCESS TRUST
The Trustee and the Company’s management are responsible for establishing and maintaining adequate internal control over the Trust’s financial reporting. The Trustee and the Company’s management conducted an evaluation of the effectiveness of internal control over financial reporting based on the Internal Control - Integrated Framework (2013) issued by COSO. On the basis of this evaluation, the Trustee and management concluded that, at December 31, 2019, the Trust’s internal control over financial reporting was effective.
Ernst & Young LLP, the independent registered public accounting firm that audited the Trust’s financial statements, has issued an attestation report on the Trustee’s and management’s internal control over financial reporting, as stated in its report on pages 138-141.
CHANGES IN INTERNAL CONTROL OVER FINANCIAL REPORTING
There has not been any change in the internal control over financial reporting of Shell or the Trust that occurred during the period covered by this Report that has materially affected, or is reasonably likely to
GOVERNANCE SHELL FORM 20-F 2019 | 129 | |
materially affect, the internal control over financial reporting of Shell or the Trust. Material financial information of the Trust is included in the “Consolidated Financial Statements” and is therefore subject to the same disclosure controls and procedures as Shell. See the “Royal Dutch Shell Dividend Access Trust Financial Statements” on pages 210-212 for additional information.
ARTICLES OF ASSOCIATION
The Company’s Articles of Association (Articles) were adopted at the 2019 AGM. The Articles may only be amended by a special resolution of the shareholders in a general meeting. A full version of the Company’s Articles can be found at www.shell.com/investors.
MANAGEMENT AND DIRECTORS
The Company has a single-tier Board of Directors headed by a Chair, with management led by a CEO. See “Board structure and composition” on page 73.
DIRECTORS’ SHAREHOLDING QUALIFICATION
The Directors are not required to hold any shares in the Company .While the Articles do not require Directors to hold shares in the Company, the Remuneration Committee believes that Executive Directors should align their interests with those of shareholders by holding shares in the Company. The CEO is expected to build up a shareholding of seven times his base salary over five years from appointment and, from 2020, the CFO is expected to build up a shareholding of five times their base salary over the same period. In the event that another Executive Director joins the Board, the Remuneration Committee will determine their shareholding requirement, which will not be less than 200% of their base salary. Executive Directors will be required to maintain their requirement (or existing shareholding if less than the guideline) for a period of two years post-employment. Non-executive Directors are encouraged to hold shares with a value equivalent to 100% of their fixed annual fee and maintain that holding during their tenure. All Directors hold shares and such interests can be found in the “Directors’ Remuneration Report" on pages 98-101.
RIGHTS ATTACHING TO SHARES
The full rights attaching to shares are set out in the Company’s Articles of Association. The Company can issue shares with any rights or restrictions attached to them as long as this is not restricted by any rights attached to existing shares. These rights or restrictions can be decided either by an ordinary resolution passed by the shareholders or by the Board as long as there is no conflict with any resolution passed by the shareholders.
VOTING
Currently, only the A and B shares have voting rights. The voting rights of each A share and each B share are equal and carry one vote at a general meeting of the Company.
The sterling deferred shares are not ordinary shares and therefore have different rights and restrictions attached to them.
CHANGE OF CONTROL
There are no provisions in the Articles that would delay, defer or prevent a change of control.
NYSE GOVERNANCE STANDARDS
In accordance with the NYSE rules for foreign private issuers, the Company follows home-country practice in relation to corporate governance. However, foreign private issuers are required to have an audit committee that satisfies the requirements of the US Exchange Act Rule 10A-3. The Company’s Audit Committee satisfies such requirements. The NYSE also requires a foreign private issuer to provide certain written affirmations and notices to the NYSE, as well as a summary of the significant ways in which its corporate governance practices differ from those followed by domestic US companies under NYSE listing standards (see Section 303A.11 of the NYSE Listed Company Manual). The Company’s summary of its corporate governance differences is given below and can be found at www.shell.com/investor.
NON-EXECUTIVE DIRECTOR INDEPENDENCE
The Board follows the provisions of the Code in determining Non-executive Director independence, which states that at least half of the Board, excluding the Chair, should comprise Non-executive Directors determined by the Board to be independent. In the case of the Company, the Board has determined that all the Non-executive Directors at the end of 2019 are independent.
NOMINATING/CORPORATE GOVERNANCE COMMITTEE AND COMPENSATION COMMITTEE
The NYSE listing standards require that a listed company maintain a nominating/corporate governance committee and a compensation committee, both composed entirely of independent directors and with certain specific responsibilities. The Company’s Nomination and Succession Committee and Remuneration Committee both comply with these requirements, except that the terms of reference of the Nomination and Succession Committee require only a majority of the committee members to be independent.
AUDIT COMMITTEE
As required by NYSE listing standards, the Company maintains an Audit Committee for the purpose of assisting the Board’s oversight of its financial statements, its internal audit function and its independent auditors. The Company’s Audit Committee is in full compliance with US Exchange Act Rule 10A-3 and Section 303A.06 of the NYSE Listed Company Manual.
The Company’s Audit Committee is not directly responsible for the appointment of independent auditors. However, the Company’s Audit Committee makes recommendations to the Board for it to put to shareholders for approval in Annual General Meetings. UK legislation provides that it is for shareholders to agree the appointment, reappointment and removal of the Company’s independent auditors.
SHAREHOLDER APPROVAL OF SHARE-BASED COMPENSATION PLANS
The Company complies with the Listing Rules published by the Financial Conduct Authority (FCA), which require shareholder approval for the adoption of share-based compensation plans which are either long-term incentive plans in which one or more Directors can participate or plans which involve or may involve the issue of new shares or the transfer of treasury shares. Under the FCA rules, such plans cannot be changed to the advantage of participants without shareholder approval, except for certain minor amendments, for example to benefit the administration of the plan or to take account of tax benefits. The rules on the requirements to seek shareholder approval for share-based compensation plans, including those in respect of material revisions to such plans, may deviate from the NYSE listing standards.
EXECUTIVE COMMITTEE
The current composition of the Executive Committee is as follows:
Executive Committee | |
Ben van Beurden | CEO [A] [B] |
Jessica Uhl | CFO [A] [B] |
Harry Brekelmans | Projects & Technology Director [B] |
Ronan Cassidy | Chief Human Resources & Corporate Officer [B] |
Donny Ching | Legal Director [B] |
Wael Sawan | Upstream Director [B] [C] |
Huibert Vigeveno | Downstream Director [B] [D] |
Maarten Wetselaar | Integrated Gas and New Energies Director [B] |
[A] Director of the Company.
[B] Designated an Executive Officer pursuant to US Exchange Act Rule 3b-7. Beneficially owns less than 1% of outstanding classes of securities.
GOVERNANCE SHELL FORM 20-F 2019 | 130 | |
[C] Wael Sawan took up the role of Upstream Director and became a member of the Executive Committee on July 1, 2019, tookover from Andrew Brown.
[D] Huibert Vigeveno assumed the role of Downstream Director and became a member of the Executive Committee on January 1, 2020, taking over from John Abbott.
APPOINTMENT AND RETIREMENT OF DIRECTORS
The Company’s Articles, the Corporate Governance Code and the Companies Act 2006 govern the appointment and retirement of Directors. Board membership and biographical details of the Directors are provided on pages 68 and 69. However, Directors follow the direction laid out in the Code and stand for re-election annually.
During the year, Neil Carson was appointed to the Board on June 1, 2019.
Details of the Executive Directors’ contracts can be found on page 74 and copies are available for inspection from the Company Secretary. Furthermore, a copy of the form of these contracts has been filed with the US Securities and Exchange Commission and incorporated by reference as an exhibit to this Report.
The terms and conditions of appointment of Non-executive Directors are set out in their letters of appointment with the Company which, in accordance with the Code, are available for inspection from the Company Secretary. A copy of the form of these letters of appointment has also been filed with the US Securities and Exchange Commission and incorporated by reference as an exhibit to this Report.
MANAGEMENT’S EVALUATION OF DISCLOSURE CONTROLS AND PROCEDURES OF SHELL
As indicated in the certifications in Exhibits 12.1 and 12.2 of this Report, Shell’s CEO and CFO have evaluated the effectiveness of Shell’s disclosure controls and procedures at December 31, 2019. Based on that evaluation, they concluded that Shell’s disclosure controls and procedures are effective.
ARTICLES OF ASSOCIATION
The following summarises certain provisions of the Articles [A] and of the applicable corporate legislation, including the Act (the legislation). This summary is qualified in its entirety by reference to the Articles and the Act. The information provided under this section is applicable to the Articles, which were in effect during the 2019 financial year to which this Report relates.
[A] A copy of the Articles has been previously filed with the SEC and is incorporated by reference as an exhibit to this Report. It can also be found at www.shell.com.
Number of Directors
The Articles provide that the Company must have a minimum of three and can have a maximum of 20 Directors (disregarding alternate directors), but these restrictions can be changed by the Board.
Appointment of Directors
The Company can, by passing an ordinary resolution, appoint any willing person to be a Director. The Board can appoint any willing person to be a Director. Any Director appointed in this way must retire from office at the first AGM after his appointment. A Director who retires in this way is then eligible for reappointment. At the general meeting at which a Director retires, shareholders can pass an ordinary resolution to reappoint the Director or to appoint some other eligible person in their place.
The only people who can be appointed as Directors at a general meeting are the following: (i) Directors retiring at the meeting; (ii) anyone recommended by a resolution of the Board; and (iii) anyone nominated by a shareholder (not being a person to be nominated), where the shareholder is entitled to vote at the meeting and delivers to the Company’s registered
office, not less than six but not more than 21 days before the day of the meeting, a letter stating that he intends to nominate another person for appointment as a Director and written confirmation from that person that he is willing to be appointed.
Retirement of Directors
At every AGM, the following Directors shall retire from office: (i) any Director who has been appointed by the Board since the last AGM; (ii) any Director who held office at the time of the two preceding AGMs and
who did not retire at either of them; and (iii) any Director who has been in office, other than as a Director holding an executive position, for a continuous period of nine years or more at the date of the meeting.
Notwithstanding the Articles, the Company complies with the Code which contains, among other matters, provisions regarding the composition of the Board and re-election of the Directors. As a result, the Company’s current policy is that Directors are subject to annual re-election by shareholders. Any Director who retires at an AGM may offer themselves for reappointment by the shareholders.
Removal of Directors
In addition to any power to remove Directors conferred by the legislation, the Company can pass a special resolution to remove a Director from office, even though his time in office has not ended, and can (subject to the Articles) appoint a person to replace a Director who has been removed in this way by passing an ordinary resolution.
Vacation of office by Directors
Any Director automatically stops being a Director if: (i) he gives the Company a written notice of resignation; (ii) he gives the Company a written notice in which he offers to resign and the Board decides to accept this offer; (iii) all of the other Directors (who must comprise at least three people) pass a resolution or sign a written notice requiring the Director to resign; (iv) he is or has been suffering from mental or physical ill-health and the Board passes a resolution removing the Director from office; (v) he has missed Directors’ meetings (whether or not an alternate director appointed by him attends those meetings) for a continuous period of six months without permission from the Board and the Board passes a resolution removing the Director from office; (vi) a bankruptcy order is made against him or he makes any arrangement or composition with his creditors generally; (vii) he is prohibited from being a Director under the legislation; or (viii) he ceases to be a Director under the legislation or he is removed from office under the Articles. If a Director stops being a Director for any reason, he will also automatically cease to be a member of any committee or sub-committee of the Board.
Alternate directors
Any Director can appoint any person (including another Director) to act in his place as an alternate director. That appointment requires the approval of the Board, unless previously approved by the Board or unless the appointee is another Director.
Proceedings of the Board
Meetings of the Board will usually be held in the Netherlands but the Board may decide in each case when and where to have meetings and how they will be conducted. The Board can also adjourn its meetings. If no other quorum is fixed by the Board, two Directors are a quorum. A Directors’ meeting at which a quorum is present can exercise all the powers and discretions of the Board.
All or any of the Directors can take part in a meeting of the Directors by way of a conference telephone or any communication equipment which
allows everybody to take part in the meeting by being able to hear each of the other people at the meeting and by being able to speak to all of them at the same time. A person taking part in this way will be treated as being present at the meeting and will be entitled to vote and be counted in the quorum. Any such meeting will be deemed to take place where the largest
group of Directors participating is assembled or, if there is no such group, where the Chair of the meeting then is located.
The Board can appoint any Director as Chair or as deputy Chair and can remove him from that office at any time. Matters to be decided at a Directors’ meeting will be decided by a majority vote. If votes are equal, the Chair of the meeting has a second, casting vote.
The Board will manage the Company’s business. It can use all the Company’s powers, except where the Articles or the legislation say that powers can only be used by shareholders voting to do so at a general meeting. The Board is, however, subject to the provisions of the legislation, the requirements of the Articles and any regulations laid down by the shareholders by passing a special resolution at a general meeting.
GOVERNANCE SHELL FORM 20-F 2019 | 131 | |
The Board can exercise the Company’s powers: (i) to borrow money; (ii) to guarantee; (iii) to indemnify; (iv) to mortgage or charge all or any of the Company’s undertaking, property and assets (present and future) and uncalled capital; (v) to issue debentures and other securities; and (vi) to give security, either outright or as collateral security, for any debt, liability or obligation of the Company or of any third party. The Board must limit the borrowings of the Company and exercise all voting and other rights or powers of control exercisable by the Company in relation to its subsidiary undertakings so as to ensure that no money is borrowed if the total amount of the group’s borrowings (as defined in the Articles) then exceeds, or would as a result of such borrowing exceed, two times the Company’s adjusted capital and reserves (as defined in the Articles). Shareholders may pass an ordinary resolution allowing borrowings to exceed such limit.
The Board can delegate any of its powers or discretions to committees of one or more persons. Any committee must comply with any regulations laid down by the Board. These regulations can require or allow people who are not Directors to be members of the committee, and can give voting rights to such people but there must be more Directors on a committee than persons who are not Directors and a resolution of the committee is only effective if a majority of the members of the committee present at the time of the resolution were Directors.
Fees
The total fees paid to all of the Directors (excluding any payments made under any other provision of the Articles) must not exceed €4,000,000 a year or any higher sum decided on by an ordinary resolution at a general meeting. It is for the Board to decide how much to pay each Director by way of fees. The Board, or any committee authorised by the Board, can award extra fees to any Director who, in its view, performs any special or extra services for the Company. The extra fees can take the form of salary, commission, profit-sharing or other benefits (and can be paid partly in one way and partly in another).
The Company can pay the reasonable travel, hotel and incidental expenses of each Director incurred in attending and returning from general meetings, meetings of the Board or committees of the Board or any other meetings which, as a Director, he is entitled to attend. The Company will pay all other expenses properly and reasonably incurred by each Director in connection with the Company’s business or in the performance of his duties as a Director. The Company can also fund a Director’s or former Director’s expenditure and that of a Director or former Director of any holding company of the Company for the purposes permitted by the legislation and can do anything to enable a Director or former Director of the Company or any holding company of the Company to avoid incurring such expenditure all as provided in the legislation.
Pensions and gratuities
The Board or any committee authorised by the Board can decide whether to provide pensions, annual payments or other benefits to any Director or former Director, or any relation or dependant of, or person connected to, such a person. The Board can also decide to contribute to a scheme or fund or to pay premiums to a third party for these purposes. The Company can only provide pensions and other benefits to people who are or were Directors but who have not been employed by or held an office or executive position in the Company or any of its subsidiary undertakings or former subsidiary undertakings or any predecessor in business of the
Company or any such other company or to relations or dependants of, or persons connected to, these Directors or former Directors if the shareholders approve this by passing an ordinary resolution.
Directors’ interests
Conflicts of interest requiring authorisation by Directors
The Board may, subject to the relevant quorum and voting requirements, authorise any matter which would otherwise involve a Director breaching his duty under the legislation to avoid conflicts of interest. A Director seeking authorisation in respect of such a conflict of interest must tell the Board the nature and extent of his interest in the conflict of interest as soon as possible.
The Director must give the Board sufficient details of the relevant matter to enable it to decide how to address the conflict of interest, together with
any additional information which it may request. Any Director (including the relevant Director) may propose that the relevant Director be authorised in relation to any matter which is the subject of such a conflict of interest. Such proposal and any authority given by the Board shall be effected in the same way as any other matter may be proposed to and resolved upon by the Board except that: (i) the relevant Director and any other Director with a similar interest will not count in the quorum and will not vote on a resolution giving such authority; and (ii) the conflicted Director and any other Director with a similar interest may, if the other members of the Board so decide, be excluded from any meeting of the Board while the conflict of interest is under consideration.
Where the Board gives authority in relation to a conflict of interest or where any of the situations described in (i) to (v) of “Other conflicts of interest” below applies in relation to a Director: (i) the Board may (whether at the relevant time or subsequently) (a) require that the relevant Director is excluded from the receipt of information, the participation in discussion and/or the making of decisions related to the conflict or the situation and (b) impose upon the relevant Director such other terms for the purpose of dealing with the conflict or situation as they think fit; (ii) the relevant Director will be obliged to conduct himself in accordance with any terms imposed by the Board in relation to the conflict or situation; (iii) the Board may also provide that, where the relevant Director obtains (other than through his position as a Director of the Company) information that is confidential to a third party, the Director will not be obliged to disclose that information to the Company, or to use or apply the information in relation to the Company’s affairs, where to do so would amount to a breach of that confidence; (iv) the terms of the authority shall be recorded in writing (but the authority shall be effective whether or not the terms are so recorded); and (v) the Board may revoke or vary such authority at any time but this will not affect anything done by the relevant Director prior to such revocation in accordance with the terms of such authority.
Other conflicts of interest
If a Director knows that he is in any way directly or indirectly interested in a proposed contract with the Company or a contract that has been entered into by the Company, he must tell the other Directors of the nature and extent of that interest in accordance with the legislation. If he has so disclosed the nature and extent of his interest, a Director can do one or more of the following: (i) have any kind of interest in a contract with or involving the Company or another company in which the Company has an interest; (ii) hold any other office or place of profit with the Company (except that of auditor) in conjunction with his office of Director for such period and upon such terms, including as to remuneration, as the Board may decide; (iii) alone, or through a firm with which he is associated, do paid professional work for the Company or another company in which the Company has an interest (other than as auditor); (iv) be or become a Director or other officer of, or employed by a party to a transaction or (iv) arrangement with, or otherwise be interested in, any holding company or subsidiary company of the Company or any other company in which the Company has an interest; and (v) be or become a Director of any other company in which the Company does not have an interest and which cannot reasonably be regarded as giving rise to a conflict of interest at the time of his appointment as a Director of that other company.
Benefits
A Director does not have to hand over to the Company or its shareholders any benefit he receives or profit that he makes as a result of any matter which would otherwise involve a direct breach of his duty under the legislation to avoid conflicts of interest but which has been authorised or anything allowed under (i) to (v) of “Other conflicts of interest” above, nor is any type of contract so authorised or so allowed liable to be avoided.
Quorum and voting requirements
Subject to certain exceptions, a Director cannot vote or be counted in the quorum on a resolution of the Board relating to appointing that Director to a position with the Company or a company in which the Company has an interest or the terms or the termination of the appointment and a Director cannot vote or be counted in the quorum on a resolution of the
GOVERNANCE SHELL FORM 20-F 2019 | 132 | |
Board about a contract in which he has an interest and, if he does vote, his vote will not be counted.
The Company can, by ordinary resolution, suspend or relax the provisions of the relevant article in the Articles to any extent or ratify any contract which has not been properly authorised in accordance with that relevant article.
Directors’ indemnities
As far as the legislation allows this, the Company can indemnify any Director or former Director of the Company, of any associated company or of any affiliate against any liability and can purchase and maintain insurance against any liability for any Director or former Director of the Company, of any associated company or of any affiliate. A Director or former Director of the Company, of any associated company or of any affiliate will not be accountable to the Company or the shareholders for any benefit so provided. Anyone receiving such a benefit will not be disqualified from being or becoming a Director of the Company.
RIGHTS ATTACHING TO SHARES
The Company can issue shares with any rights or restrictions attached to them as long as this is not restricted by any rights attached to existing shares. These rights or restrictions can be decided either by an ordinary resolution passed by the shareholders or by the Board as long as there is no conflict with any resolution passed by the shareholders.
Dividends
Currently, only A shares and B shares are entitled to a dividend.
Under the legislation, dividends are payable only out of profits available for distribution, as determined in accordance with the Act and under IFRS. Subject to the Act, if the Directors consider that the Company’s financial position justifies the payment of a dividend, the Company can pay a fixed or other dividend on any class of shares on the dates prescribed for the payments of those dividends and pay interim dividends on shares of any class of any amounts and on any dates and for any periods which it decides. Shareholders can declare dividends in accordance with the rights of shareholders by passing an ordinary resolution, although such dividends cannot exceed the amount recommended by the Board.
Dividends are payable to persons registered as the holder(s) of shares, or to anyone entitled in any other way, at a particular time on a particular day selected by the Board. All dividends will be declared and paid in proportions based on the amounts paid up on the relevant shares during any period for which that dividend is paid.
Any dividend or other money payable in cash relating to a share can be paid: (i) by inter-bank transfer or by other electronic means (including payment through CREST) directly to an account with a bank or other financial institution (or other organisations operating deposit accounts if allowed by the Company) named in a written instruction from the persons entitled to receive the payment under the Articles, such an account must be an account in the UK, unless the share on which the payment is to be made is held by Euroclear Nederland and the Dutch Securities Giro Act (“Wet giraal effectenverkeer”) applies to such share; (ii) by sending a cheque, warrant or similar financial instrument payable to the shareholder who is entitled to it by post addressed to his registered address; (iii) by sending a cheque, warrant or similar financial instrument payable to someone else named in a written instruction from the shareholder (or all joint shareholders) and sent by post to the address specified in that instruction; or (iv) in some other way if requested in writing by the shareholder (or all joint shareholders) and agreed with the Company. In respect of the payment of any dividend or other money, the directors can decide and notify shareholders that: (i) one or more of the payment means described in paragraph above will be used for payment and, where more than one means will be used, a shareholder (or all joint shareholders) may elect to receive payment by one of the means so notified in the manner prescribed by the directors; (ii)one or more of such means will be used for the payment unless a shareholder (or all joint shareholders) elects for another means of payment in the manner prescribed by the directors; or (iii)one or more of such means will be used for the payment and that
shareholders will not be able to elect to receive the payment by any other means.
And for these purposes the directors can decide that different means of payment will apply to different shareholders or groups of shareholders. If: (i) a shareholder (or all joint shareholders) does not specify an address, or does not (i) specify an account of a type prescribed by the directors, or does not specify other details, and in each case that information is necessary in order to make a payment of a dividend or other money in the way in which under this Article the directors have decided that the payment is to be made or by which the shareholder (or all joint shareholders) has validly elected to receive the payment; or (ii) payment cannot be made by the company using the information provided by the shareholder (or all joint shareholders), then the dividend or other money will be treated as unclaimed for the purposes of these articles.
The Company will not be responsible for a payment which is lost or delayed. Unless the rights attached to any shares, the terms of any shares or the Articles say otherwise, a dividend or any other money payable in respect of a share can be declared and paid in whatever currency or currencies the Board decides using an exchange rate or exchange rates selected by the Board for any currency conversions required. The Board can also decide how any costs relating to the choice of currency will be met. The Board can offer shareholders the choice to receive dividends and other money payable in respect of their shares in alternative currencies on such terms and conditions as the Board may prescribe from time to time. Where any dividends or other amounts payable on a share have not been claimed, the Board can invest them or use them in any other way for the Company’s benefit until they are claimed. The Company will not be a trustee of the money and will not be liable to pay interest on it. If a dividend or other money has not been claimed for 12 years after being declared or becoming due for payment, it will be forfeited and go back to the Company, unless the Board decides otherwise.
The Company expects that dividends in respect of B shares will be paid under the dividend access mechanism described below. Currently, the Articles provide that if any amount paid by way of dividend by a subsidiary of the Company is received by the dividend access trustee on behalf of any holder of B shares and paid by the dividend access trustee to such holder, the entitlement of such holder of B shares to be paid any dividend declared pursuant to the Articles will be reduced by the corresponding amount that has been paid by the dividend access trustee to such holder. If a dividend is declared pursuant to the Articles and the entitlement of any holder of B shares to be paid his pro rata share of such dividend is not fully extinguished on the relevant payment date by virtue of a payment made by the dividend access trustee, the Company has a full and unconditional obligation to make payment in respect of the outstanding part of such dividend entitlement immediately. Where amounts are paid by the dividend access trustee in one currency and a dividend is declared by the Company in another currency, the amounts so paid by the dividend access trustee will, for the purposes of the comparison required by the two immediately preceding sentences, be converted into the currency in which the Company has declared the dividend at such rate as the Board shall consider appropriate. For the purposes of the provisions referred to in this paragraph, the amount that the dividend access trustee has paid to any holder of B shares in respect of any particular dividend paid by a subsidiary of the Company (a “specified dividend”) will be deemed to include: (i) any amount that the dividend access trustee may be compelled by law to withhold; (ii) a pro rata share of any tax that the subsidiary paying the specified dividend is obliged to withhold or to deduct from the same; and (iii) a pro rata share of any tax that is payable by the dividend access trustee in respect of the specified dividend. The Board can offer shareholders of ordinary shares (excluding any shareholder holding shares as treasury shares) the right to choose to receive extra ordinary shares, which are credited as fully paid up, instead of some or all of their cash dividend. Before the Board can do this, shareholders must have passed an ordinary resolution authorising the Board to make this offer.
Dividend access mechanism for B shares
General
GOVERNANCE SHELL FORM 20-F 2019 | 133 | |
A and B shares are identical, except for the dividend access mechanism, which will only apply to B shares. Dividends paid on A shares have a Dutch source for tax purposes and are subject to Dutch withholding tax.
It is the expectation and the intention, although there can be no certainty, that holders of B shares will receive dividends through the dividend access mechanism. Any dividends paid on the dividend access shares will have a UK source for UK and Dutch tax purposes. There will be no Dutch withholding tax on such dividends. For further details regarding the tax treatment of dividends paid on the A and B shares and American Depositary Shares (ADSs), refer to “Shareholder information” on pages 213-217.
Description of dividend access mechanism
The “Shell” Transport and Trading Company, p.l.c., now The Shell Transport and Trading Company Limited (Shell Transport), and BG Group plc, now BG Group Limited (BG), have each issued a dividend access share to Computershare Trustees (Jersey) Limited as Trustee. Pursuant to a declaration of trust, the Trustee will hold any dividends paid in respect of the dividend access shares on trust for the holders of B shares and will arrange for prompt disbursement of such dividends to holders of B shares. Interest and other income earned on unclaimed dividends will be for the account of Shell Transport and BG and any dividends which are unclaimed after 12 years will revert to Shell Transport and BG, as appropriate. Holders of B shares will not have any interest in either dividend access share and will not have any rights against Shell Transport and BG as issuers of the dividend access shares. The only assets held on trust for the benefit of the holders of B shares will be dividends paid to the Trustee in respect of the dividend access shares.
The declaration and payment of dividends on the dividend access shares will require board action by Shell Transport and BG (as applicable) and will be subject to any applicable limitations in law or in the Shell Transport or BG (as appropriate) articles of association in effect. In no event will the aggregate amount of the dividend paid by Shell Transport and BG under the dividend access mechanism for a particular period exceed the aggregate of the dividend announced by the Board of the Company on B shares in respect of the same period (after giving effect to currency conversions).
In particular, under their respective articles of association, Shell Transport and BG are each only able to pay a dividend on their respective dividend access share which represents a proportional amount of the aggregate of any dividend announced by the Company on the B shares in respect of the relevant period, where such proportions are calculated by reference to, in the case of Shell Transport, the number of B shares in existence prior to completion of the Company’s acquisition of BG (the Acquisition) and, in the case of BG, the number of B shares issued as part of the Acquisition, in each case as against the total number of B shares in issue immediately following completion of the Acquisition.
Operation of the dividend access mechanism
If, in connection with the announcement of a dividend by the Company on B shares, the Board of Shell Transport and/or the Board of BG elects to declare and pay a dividend on their respective dividend access shares to the Trustee, the holders of B shares will be beneficially entitled to receive their share of those dividends pursuant to the declaration of trust (and
arrangements will be made to ensure that the dividend is paid in the same currency in which they would have received a dividend from the Company).
If any amount is paid by Shell Transport or BG by way of a dividend on the dividend access shares and paid by the Trustee to any holder of B shares, the dividend which the Company would otherwise pay on B shares will be reduced by an amount equal to the amount paid to such holders of B shares by the Trustee.
The Company will have a full and unconditional obligation, in the event that the Trustee does not pay an amount to holders of B shares on a cash dividend payment date (even if that amount has been paid to the Trustee), to pay immediately the dividend announced on B shares. The right of holders of B shares to receive distributions from the Trustee will be reduced by an amount equal to the amount of any payment actually made
by the Company on account of any dividend on B shares. If for any reason no dividend is paid on the dividend access shares, holders of B shares will only receive dividends from the Company directly. Any payment by the Company will be subject to Dutch withholding tax (unless an exemption is obtained under Dutch law or under the provisions of an
applicable tax treaty).
The Dutch tax treatment of dividends paid under the dividend access mechanism has been confirmed by the Dutch Revenue Service in an agreement (“vaststellingsovereenkomst”) with the Company and N.V. Koninklijke Nederlandsche Petroleum Maatschappij (Royal Dutch Petroleum Company) dated October 26, 2004, as supplemented and amended by an agreement between the same parties dated April 25, 2005, and a final settlement agreement in connection with the Acquisition dated November 9, 2015. The agreements state, among other things, that dividend distributions on the dividend access shares by Shell Transport and/or BG will not be subject to Dutch withholding tax provided that the dividend access mechanism is structured and operated substantially as set out above.
The Company may not extend the dividend access mechanism to any future issuances of B shares without prior consultation with the Dutch Revenue Service.
Accordingly, the Company would not expect to issue additional B shares unless confirmation from the Dutch Revenue Service was obtained or the Company were to determine that the continued operation of the dividend access mechanism was unnecessary. Any further issue of B shares is subject to advance consultation with the Dutch Revenue Service.
The dividend access mechanism may be suspended or terminated at any time by the Company’s Directors or the Directors of Shell Transport or BG, for any reason and without financial recompense. This might, for instance, occur in response to changes in relevant tax legislation.
The daily operations of the Trust are administered on behalf of the Company by the Trustee. Material financial information of the Trust is included in the “Consolidated Financial Statements” and is therefore subject to the same disclosure controls and procedures as Shell.
Pre-emption rights
Subject to the Act and the Listing Rules published by the UK‘s Financial Conduct Authority (FCA), any equity securities allotted by the Company for cash must first be offered to shareholders in proportion to their holdings. The Act and the Listing Rules allow for the disapplication of pre-emption rights which may be waived by a special resolution of the shareholders, either generally or specifically.
Voting
Currently, only the A and B shares have voting rights.
Changing the rights attached to the shares
The Act provides that the Articles can be amended by a special resolution.
The Articles provide that, if the legislation allows this, the rights attached to any class of shares can be changed if this is approved either in writing by shareholders holding at least three-quarters of the issued shares of that class by amount (excluding any shares of that class held as treasury shares) or by a special resolution passed at a separate meeting of the relevant shareholders. At each such separate meeting, all of the provisions of the Articles relating to proceedings at a general meeting apply, except that: (i) a quorum will be present if at least one shareholder who is entitled to vote is present in person or by proxy who owns at least one-third in amount of the issued shares of the relevant class; (ii) any shareholder who is present in person or by proxy and entitled to vote can demand a poll; and (iii) at an adjourned meeting, one person entitled to vote and who holds shares of the class, or his proxy, will be a quorum. These provisions are not more restrictive than required by law in England.
If new shares are created or issued which rank equally with any other existing shares, or if the company purchases or redeems any of its own shares, the rights of the existing shares will not be regarded as changed or abrogated unless the terms of the existing shares expressly say otherwise.
GOVERNANCE SHELL FORM 20-F 2019 | 134 | |
Redemption provisions
The Company’s shares are not subject to any redemption provisions.
Rights attaching to the sterling deferred shares
The sterling deferred shares are (unlike the A and B shares) not ordinary shares and, therefore, they have different rights and restrictions. The sterling deferred shares have the following rights and restrictions: (i) on a distribution of assets of the Company among its shareholders on a winding-up, the holders of the sterling deferred shares will be entitled (such entitlement ranking in priority to the rights of holders of ordinary shares) to receive an amount equal to the aggregate of the capital paid up or credited as paid up on each sterling deferred share; (ii) save as provided in (i), the holders of the sterling deferred shares will not be entitled to any participation in the profits or assets of the Company; (iii) the holders of sterling deferred shares will not be entitled to receive notice of or to attend and/or speak or vote (whether on a show of hands or on a poll) at general meetings of the Company; (iv) the written consent of the holders of three quarters in nominal value of the issued sterling deferred shares or the sanction of a special resolution passed at a separate general meeting of the holders of the sterling deferred shares is required if the special rights and privileges attaching to the sterling deferred shares are to be abrogated, or adversely varied or otherwise directly adversely affected in any way (the creation, allotment or issue of shares or securities which rank in priority to or equally with the sterling deferred shares, or of any right to call for the allotment or issue of such shares or securities, is for these purposes deemed not to be an abrogation or variation or to have an effect on the rights and privileges attaching to sterling deferred shares); (v) all provisions of the Articles relating to general meetings of the Company will apply, with necessary modifications, to every general meeting of the holders of the sterling deferred shares; (vi) subject to the legislation, the Company will have the right at any time to redeem any such sterling deferred shares (provided that it is credited as fully paid) at a price not exceeding £1 for all the sterling deferred shares redeemed at any one time (to be paid on such date as the Board shall select as the date of redemption to such one of the holders, if more than one, as may be selected by lot) without the requirement to give notice to the holder(s) of the sterling deferred shares; (vii) if any holder of a sterling deferred share to be redeemed fails or refuses to surrender the share certificate(s) or indemnity for such sterling deferred share or if the holder selected by lot to receive the redemption monies fails or refuses to accept the redemption monies payable in respect of it, such sterling deferred share will, notwithstanding the foregoing, be redeemed and cancelled by the Company and, in the event of a failure or refusal to accept the redemption monies, the Company will retain such money and hold it on trust for the selected holder without interest, and, in each case, the Company will have no further obligation whatsoever to the holder of such sterling deferred share; and (viii) no sterling deferred share will be redeemed otherwise than out of distributable profits or the proceeds of a fresh issue of shares made for the purposes of the redemption or out of capital to the extent permitted by the legislation.
Calls on shares
The Board can call on shareholders to pay any money which has not yet been paid to the Company for their shares. This includes the nominal value of the shares and any premium which may be payable on those shares. The Board can also make calls on people who are entitled to shares by law.
Winding-up of the Company
If the Company is voluntarily wound up, the liquidator can distribute to shareholders any assets remaining after the liquidator’s fees and expenses have been paid and all sums due to prior-ranking creditors (as defined under the laws of England) have been paid.
Sinking fund provisions
The shares are not subject to any sinking fund provision under the Articles or as a matter of the laws of England.
Discriminating provisions
There are no provisions in the Articles discriminating against a shareholder because of his ownership of a particular number of shares.
Limitations on rights to own shares
There are no limitations imposed by the Articles or the legislation on the rights to own shares, including the right of non-residents or foreign persons to hold or vote shares, other than limitations that would generally apply to all shareholders.
Transfer of shares
There are no significant restrictions on the transfer of shares.
Except as set out below, any shareholder can transfer some or all of his certificated shares to another person. A transfer of certificated shares must be made in writing and either in the usual standard form or in any other form approved by the Board. Except as set out below, any shareholder can transfer some or all of his CREST shares to another person. A transfer of CREST shares must be made through CREST and must comply with the uncertificated securities rules.
The Board can refuse to register the transfer of any shares which are not fully paid. Further rights to decline registration are as follows:
Certificated shares
A share transfer form cannot be used to transfer more than one class of share. Each class needs a separate form. Transfers cannot be in favour of more than four joint holders. The share transfer form must be properly stamped to show payment of any applicable stamp duty or certified or otherwise shown to the satisfaction of the Board to be exempt from stamp duty and must be delivered to the Company’s registered office, or any other place decided on by the Board. The transfer form must be accompanied by the share certificate relating to the share being transferred, unless the transfer is being made by a person to whom the Company was not required to, and did not send, a certificate. The Board can also ask (acting reasonably) for any other evidence to show that the person wishing to transfer the share is entitled to do so and, if the share transfer form is signed by another person on behalf of the person making the transfer, evidence of the authority of that person to do so.
CREST shares
Registration of a transfer of CREST shares can be refused in the
circumstances set out in the uncertificated securities rules. Transfers cannot be in favour of more than four joint holders. Where a share has not yet been entered on the register, the Board can recognise a renunciation by that person of his right to the share in favour of some other person. Such renunciation will be treated as a transfer and the Board has the same powers of refusing to give effect to such a renunciation as if it were a transfer.
Partly paid shares
If a shareholder fails to pay the Company any amount due on his partly paid shares, the Board can enforce the Company’s lien by selling all or any of the partly paid shares in any way they decide (subject to certain conditions).
Capital changes
The conditions imposed by the Articles for changes in capital are not more stringent than those required by the applicable laws of England.
Disputes between a shareholder or ADS holder and Royal Dutch Shell plc, any subsidiary, Director or professional service provider The Articles generally require that, except as noted below, all disputes: (i) between a shareholder in such capacity and the Company and/or its Directors, arising out of or in connection with the Articles or otherwise; (ii) so far as permitted by law, between the Company and any of its Directors in their capacities as such or as the Company’s employees, including all claims made by the Company or on behalf of the Company against any or all of its Directors; (iii) between a shareholder in such capacity and the Company’s professional service providers (which could include the Company’s auditors, legal counsel, bankers and ADS depositaries); and/or (iv) between the Company and its professional service providers arising in connection with any claim within the scope of (iii) above, shall be exclusively and finally resolved by arbitration under the Rules of Arbitration of the International Chamber of Commerce (ICC), as amended from time to time. This would include all disputes arising under
GOVERNANCE SHELL FORM 20-F 2019 | 135 | |
UK, Dutch or US law (including securities laws), or under any other law, between parties covered by the arbitration provision.
Accordingly, the ability of shareholders to obtain monetary or other relief, including in respect of securities law claims, may be determined in accordance with these provisions, and the ability of shareholders to obtain monetary or other relief may therefore be limited and their cost of seeking and obtaining recoveries in a dispute may be higher than otherwise would be the case.
The tribunal shall consist of three arbitrators to be appointed in accordance with the ICC rules. The chairman of the tribunal must have at least 20 years’ experience as a lawyer qualified to practise in a common-law jurisdiction which is within the Commonwealth (as constituted on May 12, 2005) and each other arbitrator must have at least 20 years’ experience as a qualified lawyer. The place of arbitration must be The Hague, the Netherlands; and the language of the arbitration must be English.
Pursuant to the exclusive jurisdiction provision in the Articles, if a court or other competent authority in any jurisdiction determines that the arbitration requirement described above is invalid or unenforceable in relation to any particular dispute in that jurisdiction, then that dispute may only be brought in the courts of England and Wales, as is the case with any derivative claim brought under the Act. The governing law of the Articles is the substantive law of England.
Disputes relating to the Company’s failure or alleged failure to pay all or part of a dividend which has been announced and which has fallen due for payment will not be subject to the arbitration and exclusive jurisdiction provisions of the Articles. Any derivative claim brought under the Act will not be subject to the arbitration provisions of the Articles.
Pursuant to the relevant depositary agreement, each holder of ADSs is bound by the arbitration and exclusive jurisdiction provisions of the Articles as described in this section as if that holder were a shareholder.
GENERAL MEETINGS
Under the applicable laws of England, the Company is required in each year to hold an AGM of shareholders in addition to any other meeting of shareholders that may be held. Each AGM must be held in the period six months from the date following the Company’s accounting reference date.
Additionally, shareholders may submit resolutions in accordance with Section 338 of the Act.
Directors have the power to convene a general meeting of shareholders at any time. In addition, Directors are required to call a general meeting once requests to do so have been received by the Company from shareholders representing at least 5% of such paid-up capital of the Company as carries voting rights at general meetings of the Company (excluding any paid-up capital held as treasury shares) pursuant to Section 303 of the Act. A request for a general meeting must state the general nature of the business to be dealt with at the meeting and must be authenticated by the requesting shareholders. If Directors fail to call such a meeting within 21 days from receipt of such requests, and on a date not more than 28 days after the date of the notice convening the meeting, the shareholders that requested the general meeting, or any of them representing more than half of the total voting rights of all shareholders that requested the meeting, may themselves convene a general meeting which must be called for a date not more than three months after the date upon which the Directors became subject to the requirement to call a general meeting. Any such meeting must be convened in the same manner, as nearly as possible, as that in which meetings are required to be convened by the Directors of the Company.
Under the Act, the Company is required to give at least 21 clear days’ notice of any AGM or, except where the conditions in Section 307A of the Act apply, any other general meeting of the Company. In addition, the Company complies with the Code which currently states that notices of AGMs should be sent to shareholders at least 20 working days before the meeting.
The Articles require that, in addition to any requirements under the legislation, the notice for any general meeting must state where the
meeting is to be held (the principal meeting place) and the location of any satellite meeting place, which shall be identified as such in the notice as well as details of any arrangements made for those persons not entitled to attend a general meeting to be able to view and hear the proceedings (making it clear that participation in those arrangements will not amount to attendance at the meeting to which the notice relates). At the same time that notice is given for any general meeting, an announcement of the date, time and place of that meeting will, if practical, be published in a national newspaper in the Netherlands.
A shareholder is entitled to appoint a proxy (who is not required to be another shareholder) to represent and vote on behalf of the shareholder at any general meeting of shareholders, including the AGM, if a duly completed form of proxy has been received by the Company within the relevant deadlines (in general, where a poll is not demanded, 48 hours (or such shorter time as the Board decides) before the meeting).
Before a general meeting starts to do business, there must be a quorum present. Save as in relation to adjourned meetings, a quorum for all purposes is two people who are entitled to vote. They can be shareholders who are personally present, proxies for shareholders, or a combination of both. If a quorum is not present, a chairman of the meeting can still be chosen and this will not be treated as part of the business of the meeting. If a quorum is not present within five minutes of the time fixed for a general meeting to start or within any longer period not exceeding one hour which the chairman of the meeting can decide, or if a quorum ceases to be present during a general meeting: (i) if the meeting was called by shareholders, it will be cancelled; (ii) any other meeting will be adjourned to a day (being not less than 10 days later, excluding the day on which it is adjourned and the day for which it is reconvened) with the time and place decided upon by the chairman of the meeting; and (iii) one shareholder present in person or by proxy and entitled to vote will constitute a quorum at any such adjourned general meeting and any notice of such adjourned meeting will say this.
DEEMED DELIVERY OF DOCUMENTS
Under the Articles, if any notice, document or other information is given, sent or supplied by the Company by inland post, it is treated as being received the day after it was posted if first class post (or a service similar to first class post) was used, or 72 hours after it was posted if first class post (or a service similar to first class post) was not used. If a notice or document is sent by the Company by airmail, it is treated as being received 72 hours after it was posted. Any notice, document or other information left at a shareholder’s registered address or a postal address notified to the Company in accordance with the Articles by a shareholder or a person entitled to a share by law is treated as being received on the day on which it was left.
THRESHOLD FOR DISCLOSURE OF SHARE OWNERSHIP
The Articles provide that, when a person receives a statutory notice, he has 14 days to comply with it. If he does not do so or if he makes a statement in response to the notice which is false or inadequate in some important way, the Company can decide to restrict the rights relating to the identified shares and send out a further notice to the shareholder, known as a restriction notice, which will take effect when delivered. The restriction notice will state that the identified shares no longer give the shareholder any right to attend or vote either personally or by proxy at a shareholders’ meeting or to exercise any right in relation to shareholders’ meetings. Where the identified shares make up 0.25% or more (in amount or in number) of the existing shares of a class at the date of delivery of the restriction notice, the restriction notice can also contain the following further restrictions: (i) the Board can withhold any dividend or part of a dividend (including scrip dividend) or other money which would otherwise be payable in respect of the identified shares without any liability to pay interest when such money is finally paid to the shareholder; and (ii) the Board can refuse to register a transfer of any of the identified shares which are certificated shares unless the Board is satisfied that they have been sold outright to an independent third party (as specified in the Articles). Once a restriction notice has been given, the Board is free to cancel it or exclude any shares from it at any time the Board thinks fit. In addition, the Board must cancel the restriction notice within seven days of being satisfied that all of the information requested in the statutory notice has been given. Also, where any of the identified
GOVERNANCE SHELL FORM 20-F 2019 | 136 | |
shares are sold and the Board is satisfied that they were sold outright to an independent third party, it must cancel the restriction notice within seven days of receipt of notification of the sale. The Articles do not restrict in any way the provision of the legislation which applies to failures to comply with notices under the legislation.
The UK City Code on Takeovers and Mergers (the Takeover Code) imposes disclosure obligations on parties subject to the Takeover Code’s disclosure regime. The Takeover Code requires that an opening position disclosure be made by: (i) an offeror company after the announcement that first identifies it as an offeror and after the announcement that first identifies a competing securities exchange offeror; and (ii) an offeree company after the commencement of an offer period and, if later, after the announcement that first identifies any securities exchange offeror. An opening position disclosure must be made by any person that is interested in 1% or more of any class of relevant securities of the offeree company or any securities exchange offeror. The Takeover Code also requires any person who is, or becomes, interested in 1% or more of any class of relevant securities of an offeree company or any securities exchange offeror to make a dealing disclosure if the person deals in any relevant securities of the offeree company or any securities exchange offeror during an offer period. Where two or more persons act together pursuant to an agreement or understanding, whether formal or informal, to acquire or control an interest in relevant securities, they will normally be deemed to be a single person for the purpose of the relevant provisions of the Takeover Code.
Rule 13d-1 of the US Securities Exchange Act of 1934 requires that a person or group that acquires beneficial ownership of more than 5% of equity securities registered under the US Securities Exchange Act, and that is not eligible to file a short-form report, disclose such information to the SEC within 10 days after the acquisition.
DIRECTORS’ RESPONSIBILITIES IN RESPECT OF THE
PREPARATION OF THE ANNUAL REPORT AND ACCOUNTS
The Directors are responsible for preparing the Annual Report, including the financial statements, in accordance with applicable laws and regulations. These require the Directors to prepare financial statements for each financial year. As such, the Directors have prepared the Consolidated and Parent Company Financial Statements in accordance with International Financial Reporting Standards (IFRS) as adopted by the European Union (EU). In preparing these financial statements, the Directors have also elected to comply with IFRS as issued by the International Accounting Standards Board (IASB). The Directors must not approve the financial statements unless they are satisfied that they give a true and fair view of the state of affairs of Shell and the Company and of the profit or loss of Shell and the Company for that period. In preparing these financial statements, the Directors are required to:
• | adopt the going concern basis unless it is inappropriate to do so; |
• | select suitable accounting policies and then apply them consistently; |
• | make judgements and accounting estimates that are reasonable and prudent; and |
• | state whether IFRS as adopted by the EU and IFRS as issued by the IASB have been followed. |
The Directors are responsible for keeping adequate accounting records
that are sufficient to show and explain the transactions of Shell and the Company and disclose with reasonable accuracy, at any time, the financial position of Shell and the Company and to enable them to ensure that the financial statements comply with the Companies Act 2006 (the Act) and, as regards the Consolidated Financial Statements, with Article 4 of the IAS Regulation and therefore are in accordance with IFRS as adopted by the EU. The Directors are also responsible for safeguarding the assets of Shell and the Company and hence for taking reasonable steps for the prevention and detection of fraud and other irregularities.
Each of the Directors, whose names and functions can be found on
pages 68-69, confirms that, to the best of their knowledge:
• | the financial statements, which have been prepared in accordance |
with IFRS as adopted by the EU and with IFRS as issued by the IASB give a true and fair view of the assets, liabilities, financial position and profit of Shell and the Company; and
• | the Management Report includes a fair review of the development and performance of the business and the position of Shell, together with a description of the principal risks and uncertainties that it faces. |
Furthermore, so far as each of the Directors is aware, there is no relevant audit information of which the auditors are unaware, and each of the Directors has taken all the steps that ought to have been taken in order to become aware of any relevant audit information and to establish that the auditors are aware of that information.
The Directors consider that the Annual Report, including the financial statements, taken as a whole, is fair, balanced and understandable and provides the information necessary for shareholders to assess Shell’s position and performance, business model and strategy.
The Directors consider it appropriate to continue to adopt the going concern basis of accounting in preparing the financial statements.
The Directors are responsible for the maintenance and integrity of the Shell website (www.shell.com). Legislation in the UK governing the preparation and dissemination of financial statements may differ from legislation in other jurisdictions.
LINDA M. COULTER
Company Secretary
March 11, 2020
GOVERNANCE SHELL FORM 20-F 2019 | 137 | |
Financial Statements and Supplements
Report of Independent Registered Public Accounting Firm | |
TO THE SHAREHOLDERS AND BOARD OF DIRECTORS OF ROYAL DUTCH SHELL PLC
Opinion on the Consolidated Financial Statements
We have audited the accompanying consolidated balance sheets of Royal Dutch Shell plc (Shell or the Company) as of December 31, 2019 and 2018, the related consolidated statements of income, comprehensive income, changes in equity and cash flows for each of the three years in the period ended December 31, 2019, and the related notes (collectively referred to as the Consolidated Financial Statements). In our opinion, the Consolidated Financial Statements present fairly, in all material respects, the consolidated financial position of the Company at December 31, 2019 and 2018, and the results of its operations and its cash flows for each of the three years in the period ended December 31, 2019, in conformity with International Financial Reporting Standards (IFRS) as issued by the International Accounting Standards Board (IASB) and in conformity with IFRS as adopted by the European Union.
We also have audited, in accordance with the standards of the Public Company Accounting Oversight Board (United States) (PCAOB), the Company's internal control over financial reporting as of December 31, 2019, based on criteria established in Internal Control-Integrated Framework issued by the Committee of Sponsoring Organizations of the Treadway Commission (2013 framework), and our report dated March 11, 2020, expressed an unqualified opinion thereon.
Adoption of New Accounting Standard
As discussed in Note 3 to the Consolidated Financial Statements, the Company changed its method of accounting for leases in 2019 due to the adoption of IFRS 16 Leases.
Basis for Opinion
These Consolidated Financial Statements are the responsibility of the Company's management. Our responsibility is to express an opinion on the Company’s Consolidated Financial Statements based on our audits. We are a public accounting firm registered with the PCAOB and are required to be independent with respect to the Company in accordance with the U.S. federal securities laws and the applicable rules and regulations of the Securities and Exchange Commission (SEC) and the PCAOB.
We conducted our audits in accordance with the standards of the PCAOB. Those standards require that we plan and perform the audit to obtain reasonable assurance about whether the Consolidated Financial Statements are free of material misstatement, whether due to error or fraud. Our audits included performing procedures to assess the risks of material misstatement of the Consolidated Financial Statements, whether due to error or fraud, and performing procedures that respond to those risks. Such procedures included examining, on a test basis, evidence regarding the amounts and disclosures in the Consolidated Financial Statements. Our audits also included evaluating the accounting principles used and significant estimates made by management, as well as evaluating the overall presentation of the Consolidated Financial Statements. We believe that our audits provide a reasonable basis for our opinion.
Critical audit matters
The critical audit matters communicated below are matters arising from the current period audit of the Consolidated Financial Statements that were communicated or required to be communicated to the Audit Committee and that: (1) relate to accounts or disclosures that are material to the Consolidated Financial Statements and (2) involved our especially challenging, subjective, or complex judgements. The communication of critical audit matters does not alter in any way our opinion on the Consolidated Financial Statements, taken as a whole, and we are not, by communicating the critical audit matters below, providing separate opinions on the critical audit matters or on the accounts or disclosures to which they relate.
FINANCIAL STATEMENTS AND SUPPLEMENTS SHELL FORM 20-F 2019 | 138 | |
THE ESTIMATION OF OIL AND GAS RESERVES, INCLUDING RESERVES USED IN THE CALCULATION OF DEPRECIATION, DEPLETION AND AMORTISATION (DD&A), IMPAIRMENT TESTING TO EVALUATE THE RECOVERABLE AMOUNTS OF PRODUCTION ASSETS AND THE ESTIMATION OF DECOMMISSIONING AND RESTORATION (D&R) PROVISIONS | |
Description of the matter | As described in Note 8 to the Consolidated Financial Statements, at December 31, 2019, production assets amounted to $150 billion, and have an associated DD&A charge of $19 billion. As described in Note 8, impairment charges of $4 billion were recorded during the year. As described in Note 18 D&R provisions amounted to $19 billion. The accounting for these financial statement amounts relies on management’s estimation of oil and gas reserves each year. At December 31, 2019, Shell reported 11 billion barrels of oil equivalent of proved developed and undeveloped reserves. In-year movements consist of revisions of previous estimates resulting from reclassifications, improved recovery assumptions, extensions and discoveries and purchases and sales of reserves in place. Revisions generally arise from new information, for example additional drilling results, changes in production patterns and changes to development plans. Auditing the estimation of proved oil and gas reserves is complex, as there is significant estimation uncertainty in assessing the quantities of Shell’s reserves and resources. The estimates are based on a central group of experts' assessments of petroleum initially in place and inputs selected by management, including forecast production volumes and future capital and operating cost assumptions. |
How we addressed the matter in our audit | We obtained an understanding of the controls over Shell’s oil and gas reserves estimation process. We then evaluated the design of these controls and tested their operating effectiveness. For example, we tested management’s controls over completeness and accuracy of the financial data used in estimating proved oil and gas reserves and the determination of key assumptions detailed above. We involved professionals with substantial oil and gas reserves and valuation experience and relevant qualifications in energy economics to assist us in evaluating management’s estimates. Our procedures included testing that significant additions or reductions in proved reserves have been made in the period in which the new information became available. We also evaluated management’s estimation of the point at which the operating cash flow from a project becomes negative, as this has a direct impact on DD&A and impairment. We evaluated the professional qualifications and objectivity of Shell’s management who performed the detailed preparation of the reserve estimates. We also evaluated the completeness and accuracy of the inputs used by management in estimating the proved oil and gas reserves by agreeing the inputs to source documentation and by comparing actual results to prior year forecasts and assessing consistency of the development projections with Shell’s drilling, development and capital expenditure plans. We evaluated management’s development plan for compliance with SEC rules that undrilled locations must be scheduled to be drilled in five years, unless specific circumstances justify a longer period of time. |
THE RECOVERABLE AMOUNTS OF EXPLORATION AND PRODUCTION ASSETS, AND INVESTMENTS IN JOINT VENTURES AND ASSOCIATES | |
Description of the matter | As described in Note 8 to the Consolidated Financial Statements, at December 31, 2019, Shell recognised $165 billion of exploration and production assets within property, plant and equipment (PP&E). As described in Note 9, Shell also recognised investments in joint ventures and associates of $23 billion. Assets’ operational performance and external factors have a significant impact on the estimate of the recoverable amounts of Shell’s Upstream and Integrated Gas assets. Auditing the recoverable amounts of assets and investments is complex and subjective due to the significant amount of judgement involved. As described in Note 2A, the critical assumptions in forecasting future cash flows include management’s assessment of the long-term oil and gas price outlook, future expected production volumes, potential costs associated with operational greenhouse gas (GHG) emissions and discount rates. Estimating long-term oil and gas prices and future production volumes is inherently difficult, as it requires forecasts that reflect developments in demand such as global economic growth, technology efficiency, policy measures and, in supply, consideration of investment and resource potential, cost of development of new supply and behaviour of major resource holders. |
How we addressed the matter in our audit | We obtained an understanding of the controls over Shell’s asset impairment process. We then evaluated the design of these controls and tested their operating effectiveness. For example, we tested controls over management’s identification of indicators of impairment and reversals of impairment and the approval of key inputs to impairment assessments, including oil and gas prices, discount rates, and future production volumes considering oil and gas reserves. We evaluated Shell’s asset impairment methodology for both exploration and production assets within PP&E and investments in joint ventures and associates. Where impairment assessments were carried out, we tested the mathematical accuracy and completeness of the models used and we performed sensitivity analyses of the models using different price, production and expenditure level scenarios and discount rates taking into account the nature of the asset, its location, its stage of development and associated risks. For those assets or investments impaired previously, our procedures included evaluating the actual results versus the assumptions made and evaluating management’s determination of whether reversals were required. We assessed the basis for adjusting the cash flows to reflect the risks of each individual asset. In so doing, we considered the stage of the life of the asset, country risk, potential costs associated with operational GHG emissions and compared the consistency of management's assumptions across similar fields. To test price assumptions, we compared future short and long-term commodity prices to consensus analysts’ forecasts and those adopted by other international oil companies. We evaluated whether prices were used consistently across Shell, including pricing differentials, and evaluated whether Shell’s long-term price assumptions incorporated the potential impact of climate change and energy transition by comparing the assumptions to the International Energy Agency price outlook in the Energy Outlook scenarios. To test the discount rate used for impairment testing, we involved our oil and gas valuations specialists to assist in evaluating, amongst other things, the methodology applied and assumptions made. We also tested the underlying data used to support the discount rate calculation. We reconciled reserves volumes in the impairment models and tested that the life-of-field assumptions were consistent with those applied in the decommissioning and restoration provision models. |
FINANCIAL STATEMENTS AND SUPPLEMENTS SHELL FORM 20-F 2019 | 139 | |
THE ESTIMATION OF FUTURE REFINING MARGINS TO EVALUATE THE RECOVERABILITY OF MANUFACTURING, SUPPLY AND DISTRIBUTION ASSETS | |
Description of the matter | As described in Note 8 to the Consolidated Financial Statements, at December 31, 2019, manufacturing, supply and distribution assets amounted to $56 billion. As described in Note 2A, forecasted refining margins are a key input to assessing whether or not refining assets might be impaired. Auditing future refining margins is inherently complex as the selection of the methodology to forecast refining margins is judgemental, margins are forward looking, and influenced by regional factors and limited external data is available. Shell’s approach to estimating long-term refining margins focuses on the concept of mean reversion of markets, unless a fundamental shift in markets has been identified, over an asset’s life. Refining margins have a significant effect on management’s valuation of Manufacturing, Supply and Distribution assets. |
How we addressed the matter in our audit | We obtained an understanding of the controls over Shell’s process for the estimation of refining margins. We then evaluated the design of, and tested the operating effectiveness of, controls over the estimation and approval of refining margins. We involved our oil and gas valuation specialists to assist us to assess the reasonableness of Shell’s refining margin estimation methodology, particularly in light of the expected impacts of a lower carbon economy, by performing an independent research exercise based on third party information to identify the long-term outlook for refining margins. Our procedures also included, amongst others, inquiring of management responsible for the analysis of the Company’s methodology, assessing the methodology through the performance of statistical tests over different time spans to examine possible mean-reverting behaviour over the long-term as well as the short-term and comparing to independently calculated future refining margins. To test the uncertainty related to how oil demand and refining capacity may evolve in the future, our procedures included, amongst others, developing different scenarios that are consistent with differing rates of renewable energy adoption and comparing these to management’s refining margin forecast estimated through mean reversion. In evaluating the refining margins, we also read third-party research papers that examine the behaviour of refining margins from a statistical perspective. In addition, we used external broker reports to support our expectations with respect to future refining margins and compared management’s projections to our independent analysis. |
THE RECOGNITION AND MEASUREMENT OF DEFERRED TAX ASSETS (DTAs) | |
Description of the matter | As described in Note 16 to the Consolidated Financial Statements, at December 31, 2019, Shell recognised gross DTAs totalling $28 billion, which are recognised within two balance sheet line items, deferred tax assets and as an offset against deferred tax liabilities, depending on the overall tax position in a particular jurisdiction. A significant proportion of DTA balances is supported by forecasted future taxable profits. Auditing the recognition and measurement of DTA balances is complex because the estimation requires significant judgement, including the timing of reversals of deferred tax liabilities (DTL) and the availability of future profits against which tax deductions represented by the DTA can be offset. |
How we addressed the matter in our audit | We obtained an understanding of the controls over Shell’s process for the estimation of the realisability of deferred tax assets. We then evaluated the design of these controls and tested their operating effectiveness. For example, we tested controls over projected sources of taxable income and the deferred tax calculations that support the recognition of DTAs. Amongst other procedures, we considered management’s determination of the expected timing of utilisation of the DTAs, including the relevant country tax laws that apply to the utilisation of tax losses. We involved our tax professionals to evaluate the application of relevant tax laws, Shell’s assessment of its ability to carry forward or backward losses, the scheduling of the reversal of existing temporary taxable differences and carry forward amounts, and the evaluation of the carry forward lives of its deferred tax assets. We tested management’s forecasted timing of the reversal of taxable temporary differences by evaluating the projected sources of taxable income and considering the nature of the temporary differences and the relevant tax law. We performed sensitivity analyses over the commodity price and other key assumptions that underpin Shell’s assessment of forecasted probable taxable profits. Our testing also included evaluating the extent to which sufficient probable taxable profits would arise in the period within which the related losses would be available for utilisation, considering, for example, limits on the length of time that losses can be carried forward, if applicable, or if losses are ring-fenced for tax purposes, and we considered whether the tax balances were calculated using substantively enacted tax laws and rates. |
REVENUE RECOGNITION: THE RISK OF UNREALISED TRADING GAINS AND LOSSES BEING RECOGNISED AS A RESULT OF ERRORS, UNAUTHORISED TRADING ACTIVITY OR DELIBERATE MISSTATEMENT OF SHELL’S TRADING POSITION | |
Description of the matter | As described in Note 4 to the Consolidated Financial Statements, at December 31, 2019, Shell recognised $345 billion of revenue. As described in Note 19, Shell recognised derivative financial instrument assets of $8 billion and $7 billion of derivative financial instrument liabilities. The recognition of unrealised trading gains and losses is a complex audit area. Shell’s trading and supply function is integrated within the Downstream, Integrated Gas and Upstream segments and is spread across multiple regions. The trading and supply function is inherently complex due to, amongst other things, the fact that trading is not always carried out in active markets where prices are readily available. There is also an inherently higher risk of error of unauthorised trading activity or of deliberate misstatement of the group’s overall trading position. Auditing unrealised trading gains and losses is complex because of the significant judgement used in determining the key assumptions used in valuing the trades. Identifying unauthorised trading activity or deliberate misstatement of Shell’s trading positions is complex due to the significant volume of transactions entered into by Shell and the number of IT systems involved. These factors could result in understated trading losses or overstated trading profits. |
How we addressed the matter in our audit | We obtained an understanding of the controls over Shell’s process for the recognition of revenue relating to unrealised trading gains and losses. We then evaluated the design of these controls and tested their operating effectiveness. For example, we tested controls within the front-to-end deal lifecycle across the trading and supply function and controls around the review of valuation models. We involved professionals with significant experience auditing both large commodity trading organisations and financial institutions. Amongst other procedures, we obtained external confirmation of a sample of open trading positions with brokers and counterparties. Where confirmations were not received, we tested the existence of the deal by agreement to signed contracts. We compared the price curves used to value the trading positions to independent market quotes. We also performed independent testing of valuation models, evaluating contract terms and key assumptions. We also tested the completeness of the amounts recorded in the Consolidated Financial Statements through procedures to search for unrecorded liabilities by comparing sales and trade receivables and purchases and trade payables that occurred near the end of the financial year to evaluate if transactions were recorded in the correct period. |
FINANCIAL STATEMENTS AND SUPPLEMENTS SHELL FORM 20-F 2019 | 140 | |
/s/ Ernst & Young LLP
We have served as the Company’s auditor since 2016.
London, United Kingdom
March 11, 2020
TO THE SHAREHOLDERS AND BOARD OF DIRECTORS OF ROYAL DUTCH SHELL PLC
OPINION ON INTERNAL CONTROL OVER FINANCIAL REPORTING
We have audited Royal Dutch Shell plc’s (the Company) internal control over financial reporting as of December 31, 2019, based on criteria established in Internal Control-Integrated Framework issued by the Committee of Sponsoring Organizations of the Treadway Commission (2013 framework) (the COSO criteria). In our opinion, the Company maintained, in all material respects, effective internal control over financial reporting as of December 31, 2019, based on the COSO criteria.
We also have audited, in accordance with the standards of the Public Company Accounting Oversight Board (United States) (PCAOB), the Consolidated Financial Statements of the Company, and our report dated March 11, 2020, expressed an unqualified opinion thereon.
Basis for Opinion
The Company’s management is responsible for maintaining effective internal control over financial reporting and for its assessment of the effectiveness of internal control over financial reporting included in the accompanying Management’s Report on Internal Control over Financial Reporting as set out on page 129. Our responsibility is to express an opinion on the Company’s internal control over financial reporting based on our audit. We are a public accounting firm registered with the PCAOB and are required to be independent with respect to the Company in accordance with the U.S. federal securities laws and the applicable rules and regulations of the Securities and Exchange Commission and the PCAOB.
We conducted our audit in accordance with the standards of the PCAOB. Those standards require that we plan and perform the audit to obtain reasonable assurance about whether effective internal control over financial reporting was maintained in all material respects. Our audit included obtaining an understanding of internal control over financial reporting, assessing the risk that a material weakness exists, testing and evaluating the design and operating effectiveness of internal control based on the assessed risk, and performing such other procedures as we considered necessary in the circumstances. We believe that our audit provides a reasonable basis for our opinion.
Definition and Limitations of Internal Control over Financial Reporting
A company’s internal control over financial reporting is a process designed to provide reasonable assurance regarding the reliability of financial reporting and the preparation of financial statements for external purposes in accordance with generally accepted accounting principles. A company’s internal control over financial reporting includes those policies and procedures that (1) pertain to the maintenance of records that, in reasonable detail, accurately and fairly reflect the transactions and dispositions of the assets of the company; (2) provide reasonable assurance that transactions are recorded as necessary to permit preparation of financial statements in accordance with generally accepted accounting principles, and that receipts and expenditures of the company are being made only in accordance with authorisations of management and directors of the company; and (3) provide reasonable assurance regarding prevention or timely detection of unauthorised acquisition, use, or disposition of the company’s assets that could have a material effect on the financial statements.
Because of its inherent limitations, internal control over financial reporting may not prevent or detect misstatements. Also, projections of any evaluation of effectiveness to future periods are subject to the risk that controls may become inadequate because of changes in conditions, or that the degree of compliance with the policies or procedures may deteriorate.
/s/ Ernst & Young LLP
London, United Kingdom March 11, 2020
FINANCIAL STATEMENTS AND SUPPLEMENTS SHELL FORM 20-F 2019 | 141 | |
Consolidated Financial Statements | |
Consolidated Statement of Income | |
Consolidated Statement of Comprehensive Income | |
Consolidated Balance Sheet | |
Consolidated Statement of Changes in Equity | |
Consolidated Statement of Cash Flows | |
Notes to the Consolidated Financial Statements | |
Note 1 Basis of preparation | |
Note 2A Significant accounting policies, judgements and estimates | |
Note 2B Changes to IFRS not yet adopted | |
Note 3 Adoption of IFRS 16 Leases | |
Note 4 Segment information | |
Note 5 Interest and other income | |
Note 6 Interest expense | |
Note 7 Intangible assets | |
Note 8 Property, plant and equipment | |
Note 9 Joint ventures and associates | |
Note 10 Investments in securities | |
Note 11 Trade and other receivables | |
Note 12 Inventories | |
Note 13 Cash and cash equivalents | |
Note 14 Debt and lease arrangements | |
Note 15 Trade and other payables | |
Note 16 Taxation | |
Note 17 Retirement benefits | |
Note 18 Decommissioning and other provisions | |
Note 19 Financial instruments | |
Note 20 Share capital | |
Note 21 Share-based compensation plans and shares held in trust | |
Note 22 Other reserves | |
Note 23 Dividends | |
Note 24 Earnings per share | |
Note 25 Legal proceedings and other contingencies | |
Note 26 Employees | |
Note 27 Directors and Senior Management | |
Note 28 Auditor’s remuneration | |
Note 29 Post-balance sheet events | |
FINANCIAL STATEMENTS AND SUPPLEMENTS SHELL FORM 20-F 2019 | 142 | |
Consolidated Statement of Income | $ million | ||||||
Notes | 2019 | 2018 | 2017 | ||||
Revenue | 4 | ||||||
Share of profit of joint ventures and associates | 9 | ||||||
Interest and other income | 5 | ||||||
Total revenue and other income | |||||||
Purchases | |||||||
Production and manufacturing expenses | 4 | ||||||
Selling, distribution and administrative expenses | 4 | ||||||
Research and development | 4 | ||||||
Exploration | 4 | ||||||
Depreciation, depletion and amortisation | 4 | ||||||
Interest expense | 6 | ||||||
Total expenditure | |||||||
Income before taxation | |||||||
Taxation charge | 16 | ||||||
Income for the period | 4 | ||||||
Income attributable to non-controlling interest | |||||||
Income attributable to Royal Dutch Shell plc shareholders | |||||||
Basic earnings per share ($) | 24 | ||||||
Diluted earnings per share ($) | 24 | ||||||
FINANCIAL STATEMENTS AND SUPPLEMENTS SHELL FORM 20-F 2019 | 143 | |
Consolidated Statement of Comprehensive Income | $ million | ||||||
Notes | 2019 | 2018 | 2017 | ||||
Income for the period | 4 | ||||||
Other comprehensive income, net of tax | |||||||
Items that may be reclassified to income in later periods: | |||||||
Currency translation differences | 22 | ( | ) | ||||
Unrealised gains on securities [A] | |||||||
Debt instruments remeasurements [A] | 22 | ( | ) | ||||
Cash flow and net investment hedging (losses)/gains | 22 | ( | ) | ( | ) | ||
Deferred cost of hedging [A] | 22 | ( | ) | ||||
Share of other comprehensive (loss)/income of joint ventures and associates | 9 | ( | ) | ( | ) | ||
Total | ( | ) | |||||
Items that are not reclassified to income in later periods: | |||||||
Retirement benefits remeasurements | 22 | ( | ) | ||||
Equity instruments remeasurements [A] | 22 | ( | ) | ( | ) | ||
Share of other comprehensive income of joint ventures and associates [A] | 9 | ||||||
Total | ( | ) | |||||
Other comprehensive (loss)/income for the period | 22 | ( | ) | ||||
Comprehensive income for the period | |||||||
Comprehensive income attributable to non-controlling interest | |||||||
Comprehensive income attributable to Royal Dutch Shell plc shareholders | |||||||
[A] Changes in line items from 2018 onwards compared with 2017 are the result of the implementation of IFRS 9 Financial Instruments, effective from January 1, 2018.
FINANCIAL STATEMENTS AND SUPPLEMENTS SHELL FORM 20-F 2019 | 144 | |
Consolidated Balance Sheet | $ million | ||||
Notes | Dec 31, 2019 | Dec 31, 2018 | |||
Assets | |||||
Non-current assets | |||||
Intangible assets | 7 | ||||
Property, plant and equipment | 8 | ||||
Joint ventures and associates | 9 | ||||
Investments in securities | 10 | ||||
Deferred tax | 16 | ||||
Retirement benefits | 17 | ||||
Trade and other receivables | 11 | ||||
Derivative financial instruments | 19 | ||||
Current assets | |||||
Inventories | 12 | ||||
Trade and other receivables | 11 | ||||
Derivative financial instruments | 19 | ||||
Cash and cash equivalents | 13 | ||||
Total assets | |||||
Liabilities | |||||
Non-current liabilities | |||||
Debt | 14 | ||||
Trade and other payables | 15 | ||||
Derivative financial instruments | 19 | ||||
Deferred tax | 16 | ||||
Retirement benefits | 17 | ||||
Decommissioning and other provisions | 18 | ||||
Current liabilities | |||||
Debt | 14 | ||||
Trade and other payables | 15 | ||||
Derivative financial instruments | 19 | ||||
Taxes payable | 16 | ||||
Retirement benefits | 17 | ||||
Decommissioning and other provisions | 18 | ||||
Total liabilities | |||||
Equity | |||||
Share capital | 20 | ||||
Shares held in trust | ( | ) | ( | ) | |
Other reserves | 22 | ||||
Retained earnings | |||||
Equity attributable to Royal Dutch Shell plc shareholders | |||||
Non-controlling interest | |||||
Total equity | |||||
Total liabilities and equity | |||||
Signed on behalf of the Board |
/s/ Jessica Uhl |
Jessica Uhl Chief Financial Officer March 11, 2020 |
FINANCIAL STATEMENTS AND SUPPLEMENTS SHELL FORM 20-F 2019 | 145 | |
Consolidated Statement of Changes in Equity | $ million | |||||||||||||
Equity attributable to Royal Dutch Shell plc shareholders | ||||||||||||||
Share capital (see Note 20) | Shares held in trust | Other reserves (see Note 22) | Retained earnings | Total | Non- controlling interest | Total equity | ||||||||
At January 1, 2019 (as previously published) | ( | ) | ||||||||||||
Impact of IFRS 16 [A] | ||||||||||||||
At January 1, 2019 (as revised) | ( | ) | ||||||||||||
Comprehensive income/(loss) for the period | ( | ) | ||||||||||||
Transfer from other comprehensive income | ( | ) | ||||||||||||
Dividends (see Note 23) | ( | ) | ( | ) | ( | ) | ( | ) | ||||||
Repurchases of shares [B] | ( | ) | ( | ) | ( | ) | ( | ) | ||||||
Share-based compensation | ( | ) | ( | ) | ( | ) | ( | ) | ||||||
Other changes in non-controlling interest | ||||||||||||||
At December 31, 2019 | ( | ) | ||||||||||||
At January 1, 2018 (as previously published) | ( | ) | ||||||||||||
Impact of IFRS 9 | ( | ) | ( | ) | ( | ) | ||||||||
At January 1, 2018 (as revised) | ( | ) | ||||||||||||
Comprehensive income for the period | ||||||||||||||
Transfer from other comprehensive income | ( | ) | ||||||||||||
Dividends (see Note 23) | ( | ) | ( | ) | ( | ) | ( | ) | ||||||
Repurchases of shares [B] | ( | ) | ( | ) | ( | ) | ( | ) | ||||||
Share-based compensation [C] | ( | ) | ( | ) | ||||||||||
Other changes in non-controlling interest | ||||||||||||||
At December 31, 2018 | ( | ) | ||||||||||||
At January 1, 2017 | ( | ) | ||||||||||||
Comprehensive income for the period | ||||||||||||||
Dividends (see Note 23) | ( | ) | ( | ) | ( | ) | ( | ) | ||||||
Scrip dividends | ( | ) | ||||||||||||
Share-based compensation | ( | ) | ( | ) | ( | ) | ( | ) | ( | ) | ||||
Other changes in non-controlling interest | ||||||||||||||
At December 31, 2017 | ( | ) | ||||||||||||
[A] See Note 3.
[B] The repurchase of shares recognised through retained earnings includes the aggregate maximum consideration to which Shell is contractually bound to under the current tranche of the buyback programme, plus associated stamp duty (see Note 20).
[C] The amendments to IFRS 2 Share-based payment became effective January 1, 2018. Following adoption of the amendments, components of share-based payments (related to tax) that were previously classified as cash-settled are classified as equity-settled from 2018 onwards.
FINANCIAL STATEMENTS AND SUPPLEMENTS SHELL FORM 20-F 2019 | 146 | |
Consolidated Statement of Cash Flows | $ million | ||||||||
Notes | 2019 | 2018 | 2017 | ||||||
Income before taxation for the period [A] | 4 | ||||||||
Adjustment for: | |||||||||
Interest expense (net) | |||||||||
Depreciation, depletion and amortisation | 8 | ||||||||
Exploration well write-offs | 8 | ||||||||
Net gains on sale and revaluation of non-current assets and businesses | ( | ) | ( | ) | ( | ) | |||
Share of profit of joint ventures and associates | ( | ) | ( | ) | ( | ) | |||
Dividends received from joint ventures and associates | |||||||||
(Increase)/decrease in inventories | ( | ) | ( | ) | |||||
(Increase)/decrease in current receivables | ( | ) | ( | ) | |||||
(Decrease)/increase in current payables | ( | ) | ( | ) | |||||
Derivative financial instruments | ( | ) | ( | ) | |||||
Retirement benefits [A] | ( | ) | ( | ) | |||||
Decommissioning and other provisions [A] | ( | ) | ( | ) | ( | ) | |||
Other [A] | ( | ) | ( | ) | |||||
Tax paid | ( | ) | ( | ) | ( | ) | |||
Cash flow from operating activities | |||||||||
Capital expenditure | ( | ) | ( | ) | ( | ) | |||
Investments in joint ventures and associates | ( | ) | ( | ) | ( | ) | |||
Investment in equity securities [A] | ( | ) | ( | ) | ( | ) | |||
Proceeds from sale of property, plant and equipment and businesses | |||||||||
Proceeds from sale of joint ventures and associates | |||||||||
Proceeds from sale of equity securities [A] | |||||||||
Interest received | |||||||||
Other investing cash inflows [A] | |||||||||
Other investing cash outflows [A] | ( | ) | ( | ) | ( | ) | |||
Cash flow from investing activities | ( | ) | ( | ) | ( | ) | |||
Net decrease in debt with maturity period within three months | ( | ) | ( | ) | ( | ) | |||
Other debt: | |||||||||
New borrowings | |||||||||
Repayments | ( | ) | ( | ) | ( | ) | |||
Interest paid | ( | ) | ( | ) | ( | ) | |||
Derivative financial instruments [B] | ( | ) | |||||||
Change in non-controlling interest | |||||||||
Cash dividends paid to: | |||||||||
Royal Dutch Shell plc shareholders | 23 | ( | ) | ( | ) | ( | ) | ||
Non-controlling interest | ( | ) | ( | ) | ( | ) | |||
Repurchases of shares | ( | ) | ( | ) | |||||
Shares held in trust: net purchases and dividends received | ( | ) | ( | ) | ( | ) | |||
Cash flow from financing activities | ( | ) | ( | ) | ( | ) | |||
Currency translation differences relating to cash and cash equivalents | ( | ) | |||||||
(Decrease)/increase in cash and cash equivalents | ( | ) | |||||||
Cash and cash equivalents at beginning of year | |||||||||
Cash and cash equivalents at end of year | 13 | ||||||||
[A] With effect from 2019, the starting point for the Consolidated Statement of Cash Flows is ‘Income before taxation’ (previously 'Income'). Furthermore, to improve transparency, 'Retirement benefits' and 'Decommissioning and other provisions' have been separately disclosed. The 'Other' component of cash flow from investing activities has been expanded to distinguish between cash inflows and outflows. Prior period comparatives for these line items have been revised to conform with current year presentation. Overall, the revisions do not have an impact on cash flow from operating activities, cash flow from investing activities or cash flow from financing activities, as previously published.
[B] As from 2019, a new line item 'Derivative financial instruments' has been introduced for derivatives related to debt.
FINANCIAL STATEMENTS AND SUPPLEMENTS SHELL FORM 20-F 2019 | 147 | |
Notes to the Consolidated Financial Statements | |
1 - BASIS OF PREPARATION
The Consolidated Financial Statements of Royal Dutch Shell plc (the "Company") and its subsidiaries (collectively referred to as "Shell") have been prepared in accordance with the provisions of the Companies Act 2006 (the "Act") and Article 4 of the IAS Regulation, and therefore in accordance with International Financial Reporting Standards ("IFRS") as adopted by the European Union. As applied to Shell, there are no material differences from IFRS as issued by the International Accounting Standards Board ("IASB"); therefore, the Consolidated Financial Statements have been prepared in accordance with IFRS as issued by the IASB.
As described in the accounting policies in Note 2A, the Consolidated Financial Statements have been prepared under the historical cost convention except for certain items measured at fair value. Those accounting policies have been applied consistently in all periods, except for those accounting standards that were adopted from January 1, 2019 (see Note 3 below).
2A - SIGNIFICANT ACCOUNTING POLICIES, JUDGEMENTS AND ESTIMATES
This Note describes Shell’s significant accounting policies, which are those relevant to an understanding of the Consolidated Financial Statements. It includes the measurement bases used in preparing the Consolidated Financial Statements. It allows an understanding as to how transactions, other events and conditions are reported. It also describes: (a) judgements, apart from those involving estimations, that management makes in applying the policies that have the most significant effect on the amounts recognised in the Consolidated Financial Statements; and (b) estimations, including assumptions about the future, that management makes in applying the policies. The sources of estimation uncertainty that have a significant risk of a material adjustment to the carrying amounts of assets and liabilities within the next financial year are specifically identified as a significant estimate.
The accounting policies applied are consistent with those of the previous financial years except for the adoption as from January 1, 2019 of IFRS 16 Leases ("IFRS 16"), amendments to IAS 19 Employee Benefits ("IAS 19") and the Annual Improvement Cycle 2015-2017.
Mandatory
The impact of the transition to the accounting pronouncements as listed below have an immaterial impact other than for IFRS 16.
IFRS 16 Leases
Under IFRS 16, all lease contracts, with limited exceptions, are recognised in the financial statements by way of right-of-use assets and corresponding lease liabilities. Shell applied the modified retrospective transition method, and consequently comparative information is not restated. As a practical expedient, no reassessment was performed of contracts that were previously identified as leases and contracts that were not previously identified as containing a lease applying IAS 17 Leases ("IAS 17") and IFRIC 4 Determining whether an Arrangement contains a Lease. At the adoption date, additional lease liabilities were recognised for leases previously classified as operating leases applying IAS 17 (see Note 3). These lease liabilities were measured at the present value of the remaining lease payments and discounted using entity-specific incremental borrowing rates at January 1, 2019. In general, a corresponding right-of-use asset was recognised for an amount equal to each lease liability, adjusted by the amount of any prepaid or accrued lease payment relating to the specific lease contract, as recognised on the balance sheet at December 31, 2018. Provisions for onerous lease contracts at December 31, 2018 were adjusted to the respective right-of-use assets recognised at January 1, 2019.
The adoption of the new standard had an accumulated impact of $4 million in equity following the recognition of lease liabilities of $16.0 billion and additional right-of-use assets of $15.6 billion and reclassifications mainly related to pre-paid leases and onerous contracts previously recognised (see Note 3).
IAS 19 Employee Benefits
IAS 19 specifies how a company accounts for a defined benefit plan. When a plan event (i.e., a plan amendment, curtailment or settlement) occurs, IAS 19 requires a company to update its assumptions and remeasure its net defined benefit liability or asset. The IAS 19 amendments that are adopted clarify that after a plan event, entities would use these updated assumptions to measure current service cost and net interest for the remainder of the reporting period after the plan event. These amendments had no impact on Shell.
Annual Improvement Cycle 2015-2017
The Annual Improvements to IFRS Standards 2015-2017 Cycle includes minor amendments affecting IFRS 3 Business combinations, IFRS 11 Joint arrangements, IAS 12 Income taxes, and IAS 23 Borrowing costs. None of the amendments had a material impact on Shell.
IFRIC 23 Uncertainty over income tax treatments ("IFRIC 23")
IFRIC 23 clarifies the recognition and measurement for income tax when it is unclear whether a taxation authority will accept the tax treatment claimed. An uncertain tax position arises where there is more than one possible interpretation of how tax regulations apply to a given transaction or event. The interpretation requires the Company to determine whether uncertain tax treatments are assessed separately or as a group. The interpretation also requires an assumption that a taxation authority has full knowledge of all relevant information. Where it is not probable that a taxation authority will accept an uncertain tax treatment, it requires the Company to reflect the effect of the uncertainty in the accounting tax position. Finally, reassessment should be performed on a yearly basis in the event of changes in facts and circumstances.
Based on the assessment performed, this interpretation had no material impact on Shell's uncertain income tax accounting positions recognised.
NATURE OF THE CONSOLIDATED FINANCIAL STATEMENTS
The Consolidated Financial Statements are presented in US dollars (dollars) and comprise the financial statements of the Company and its subsidiaries, being those entities over which the Company has control, either directly or indirectly, through exposure or rights to their variable returns and the ability to affect those returns through its power over the entities. Information about subsidiaries at December 31, 2019, can be found in Exhibit 8.
FINANCIAL STATEMENTS AND SUPPLEMENTS SHELL ANNUAL REPORT AND FORM 20-F 2019 | 148 | |
Subsidiaries are consolidated from the date on which control is obtained until the date that such control ceases, using consistent accounting policies. All inter-company balances and transactions, including unrealised profits arising from such transactions, are eliminated. Unrealised losses are also eliminated unless the transaction provides evidence of an impairment of the asset transferred. Non-controlling interest represents the proportion of income, other comprehensive income and net assets in subsidiaries that is not attributable to the Company’s shareholders.
CURRENCY TRANSLATION
On consolidation, assets and liabilities of non-dollar entities are translated to dollars at year-end rates of exchange, while their statements of income, other comprehensive income and cash flows are translated at quarterly average rates. The resulting translation differences are recognised as currency translation differences within other comprehensive income. Upon sale of all or part of an interest in, or upon liquidation of, an entity, the appropriate portion of cumulative currency translation differences related to that entity are generally recognised in income.
REVENUE RECOGNITION (from January 1, 2018)
Revenue from sales of oil, natural gas, chemicals and other products is recognised at the transaction price to which Shell expects to be entitled, after deducting sales taxes, excise duties and similar levies. For contracts that contain separate performance obligations, the transaction price is allocated to those separate performance obligations by reference to their relative standalone selling prices.
Revenue is recognised when control of the products has been transferred to the customer. For sales by Integrated Gas and Upstream operations, this generally occurs when the product is physically transferred into a vessel, pipe or other delivery mechanism; for sales by refining operations, it is either when the product is placed onboard a vessel or offloaded from the vessel, depending on the contractually agreed terms; and for sales of oil products and chemicals, it is either at the point of delivery or the point of receipt, depending on contractual conditions.
Revenue resulting from hydrocarbon production from properties in which Shell has an interest with partners in joint arrangements is recognised on the basis of Shell’s volumes lifted and sold. Revenue resulting from the production of oil and natural gas under production-sharing contracts ("PSCs") is recognised for those amounts relating to Shell’s cost recoveries and Shell’s share of the remaining production. Gains and losses on derivative contracts and the revenue and costs associated with other contracts that are classified as held primarily for the purpose of being traded are reported on a net basis in the Consolidated Statement of Income. Purchases and sales of hydrocarbons under exchange contracts that are necessary to obtain or reposition feedstocks for refinery operations are presented net in the Consolidated Statement of Income.
Revenue resulting from arrangements that are not considered contracts with customers is presented as revenue from other sources.
REVENUE RECOGNITION (prior to January 1, 2018)
Revenue from sales of oil, natural gas, chemicals and other products is recognised at the fair value of consideration received or receivable, after deducting sales taxes, excise duties and similar levies, when the significant risks and rewards of ownership have been transferred, which is when title passes to the customer. For sales by Integrated Gas and Upstream operations, this generally occurs when product is physically transferred into a vessel, pipe or other delivery mechanism; for sales by refining operations, it is either when product is placed onboard a vessel or offloaded from the vessel, depending on the contractually agreed terms; and for sales of oil products and chemicals, it is either at the point of delivery or the point of receipt, depending on contractual conditions.
Revenue resulting from hydrocarbon production from properties in which Shell has an interest with partners in joint arrangements is recognised on the basis of Shell’s working interest (entitlement method). Revenue resulting from the production of oil and natural gas under PSCs is recognised for those amounts relating to Shell’s cost recoveries and Shell’s share of the remaining production. Gains and losses on derivative contracts and the revenue and costs associated with other contracts that are classified as held for trading purposes are reported on a net basis in the Consolidated Statement of Income. Purchases and sales of hydrocarbons under exchange contracts that are necessary to obtain or reposition feedstocks for refinery operations are presented net in the Consolidated Statement of Income.
RESEARCH AND DEVELOPMENT
Development costs that are expected to generate probable future economic benefits are capitalised as intangible assets. All other research and development expenditure is recognised in income as incurred.
EXPLORATION COSTS
PROPERTY, PLANT AND EQUIPMENT AND INTANGIBLE ASSETS
Recognition
Property, plant and equipment comprise assets owned by Shell, assets held by Shell under lease contracts, and assets operated by Shell as contractor in PSCs. They include rights and concessions in respect of properties with proved reserves ("proved properties") and with no proved reserves ("unproved properties"). Property, plant and equipment, including expenditure on major inspections, and intangible assets are initially recognised in the Consolidated Balance Sheet at cost where it is probable that they will generate future economic benefits. This includes capitalisation of decommissioning and restoration costs associated with provisions for asset retirement (see 'Provisions'), certain development costs (see 'Research and development') and the effects of associated cash flow hedges (see 'Financial instruments (from January 1, 2018)') as applicable. The accounting for exploration costs is described separately (see 'Exploration costs'). Intangible assets include goodwill, liquefied natural gas ("LNG") off-take and sales contracts obtained through acquisition, software costs and trademarks. Interest is capitalised as an increase in property, plant and equipment, on major capital projects during construction.
FINANCIAL STATEMENTS AND SUPPLEMENTS SHELL ANNUAL REPORT AND FORM 20-F 2019 | 149 | |
Property, plant and equipment and intangible assets are subsequently carried at cost less accumulated depreciation, depletion and amortisation (including any impairment). Gains and losses on sale are determined by comparing the proceeds with the carrying amounts of assets sold and are recognised in income, within interest and other income.
An asset is classified as held for sale if its carrying amount will be recovered principally through sale rather than through continuing use, which is when the sale is highly probable, and it is available for immediate sale. Assets classified as held for sale are measured at the lower of the carrying amount upon classification and the fair value less costs to sell.
Depreciation, depletion and amortisation
Property, plant and equipment related to hydrocarbon production activities are in principle depreciated on a unit-of-production basis over the proved developed reserves of the field concerned, other than assets whose useful lives differ from the lifetime of the field which are depreciated applying the straight-line method. However, for certain Upstream assets, the use for this purpose of proved developed reserves, which are determined using the SEC-mandated yearly average oil and gas prices, would result in depreciation charges for these assets which do not reflect the pattern in which their future economic benefits are expected to be consumed as, for example, it may result in assets with long-term expected lives being depreciated in full within one year. Therefore, in these instances, other approaches are applied to determine the reserves base for the purpose of calculating depreciation, such as using management’s expectations of future oil and gas prices rather than yearly average prices, to provide a phasing of periodic depreciation charges that more appropriately reflects the expected utilisation of the assets concerned.
Rights and concessions in respect of proved properties are depleted on the unit-of-production basis over the total proved reserves of the relevant area. Where individually insignificant, unproved properties may be grouped and depreciated based on factors such as the average concession term and past experience of recognising proved reserves.
Property, plant and equipment held under leases contracts and capitalised LNG off-take and sales contracts are depreciated or amortised over the term of the respective contract. Other property, plant and equipment and intangible assets are depreciated or amortised on a straight-line basis over their estimated useful lives, except for goodwill, which is not amortised. They include refineries and chemical plants (for which the useful life is generally 20 years), retail service stations (15 years), upgraders (30 years) and major inspection costs, which are depreciated over the estimated period before the next planned major inspection (three to five years ).
On classification of an asset as held for sale, depreciation ceases.
Estimates of the useful lives and residual values of property, plant and equipment and intangible assets are reviewed annually and adjusted if appropriate.
Impairment
The carrying amount of goodwill is tested for impairment annually; in addition, assets other than unproved properties (see 'Exploration costs') are tested for impairment whenever events or changes in circumstances indicate that the carrying amounts for those assets may not be recoverable. On classification as held for sale, the carrying amounts of property, plant and equipment and intangible assets are also reviewed. If assets are determined to be impaired, the carrying amounts of those assets are written down to their recoverable amount, which is the higher of fair value less costs to sell (see 'Fair value measurements') and value in use.
Value in use is determined as the amount of estimated risk-adjusted discounted future cash flows. For this purpose, assets are grouped into cash-generating units based on separately identifiable and largely independent cash inflows. Estimates of future cash flows used in the evaluation of impairment of assets are made using management’s forecasts of commodity prices, market supply and demand, potential costs associated with operational GHG emissions, and forecast product and refining margins. In addition, management takes into consideration the expected useful lives of the refineries, and exploration and production assets, and expected production volumes. The latter takes into account assessments of field and reservoir performance and includes expectations about both proved reserves and volumes that are expected to constitute proved reserves in the future (unproved volumes), which are risk-weighted utilising geological, production, recovery and economic projections. Cash flow estimates are risk-adjusted to reflect local conditions as appropriate and discounted at a rate based on Shell’s marginal cost of debt.
Impairments, except those related to goodwill, are reversed as applicable to the extent that the events or circumstances that triggered the original impairment have changed.
Impairment losses and reversals are reported within depreciation, depletion and amortisation.
Judgements and estimates
Proved oil and gas reserves
Unit-of-production depreciation, depletion and amortisation charges are principally measured based on management’s estimates of proved developed oil and gas reserves. Also, exploration drilling costs are capitalised pending the results of further exploration or appraisal activity, which may take several years to complete and before any related proved reserves can be booked.
Proved reserves are estimated by a central group of reserves experts. The estimated proved reserves are made by reference to available geological and engineering data and only include volumes for which access to market is assured with reasonable certainty. Yearly average oil and gas prices are applied in the determination of proved reserves. Estimates of proved reserves are inherently imprecise, require the application of judgement and are subject to regular revision, either upward or downward, based on new information such as from the drilling of additional wells, observation of long-term reservoir performance under producing conditions and changes in economic factors, including product prices, contract terms, legislation or development plans.
Changes to estimates of proved developed reserves affect prospectively the amounts of depreciation, depletion and amortisation charged and, consequently, the carrying amounts of exploration and production assets. It is expected, however, that in the normal course of business the diversity of the asset portfolio will limit the effect of such revisions. The outcome of, or assessment of plans for, exploration or appraisal activity may result in the related capitalised exploration drilling costs being recognised in income in that period.
Judgement is involved in determining when to use an alternative reserves base in order to appropriately reflect the expected utilisation of the assets concerned (see 'Depreciation, depletion and amortisation').
FINANCIAL STATEMENTS AND SUPPLEMENTS SHELL ANNUAL REPORT AND FORM 20-F 2019 | 150 | |
Information about the carrying amounts of exploration and production assets and the amounts charged to income, including depreciation, depletion and amortisation and the quantitative impact of the use of an alternative reserve base, is presented in Note 8.
Impairment
For the purposes of determining whether impairment of assets has occurred, and the extent of any impairment loss or its reversal, the key assumptions management uses in estimating risk-adjusted future cash flows for value-in-use measures are future oil and gas prices, potential costs associated with operational GHG emissions, expected production volumes and refining margins appropriate to the local circumstances and environment. These assumptions and the judgements of management that are based on them are subject to change as new information becomes available. Changes in economic conditions can affect the rate used to discount future cash flow estimates or the risk-adjustment in the future cash flows.
Estimation is involved with respect to the expected life of refineries and chemicals sites, and also including management’s view on the future development of refining margins.
The determination of cash-generating units requires judgement. Changes in this determination could impact the calculation of value in use and therefore the conclusion on the recoverability of assets’ carrying amounts when performing an impairment test.
Judgement, which is subject to change as new information becomes available, can be required in determining when an asset is classified as held for sale. A change in that judgement could result in impairment charges affecting income, depending on whether classification requires a write down of the asset to its fair value less costs to sell.
Significant estimates
Future commodity price assumptions, presented in Note 8, tend to be stable because management does not consider short-term increases or decreases in prices as being indicative of long-term levels, but they are nonetheless subject to change. Expected production volumes, which comprise proved reserves and unproved volumes, are used for impairment testing because management believes this to be the most appropriate indicator of expected future cash flows. As discussed in 'Proved oil and gas reserves' above, reserves estimates are inherently imprecise. Furthermore, projections about unproved volumes are based on information that is necessarily less robust than that available for mature reservoirs. Due to the nature and geographical spread of the business activity in which those assets are used, it is typically not practicable to estimate the likelihood or extent of impairments under different sets of assumptions for Shell overall.
Changes in assumptions could affect the carrying amounts of assets, and any impairment losses and reversals will affect income.
Forecast refining margins are a key input for impairment testing in Downstream. Management's estimate of longer-term refining margins is based on the mean reversion of markets, unless a fundamental shift in markets has been identified, over the life of the refineries. Under this approach, that is consistently applied, it is assumed that refining margins will revert to historical averages over time.
Changes in assumptions could affect the carrying amounts of assets and estimation of environmental provisions. Any impairment losses and reversals will affect income.
Information about the carrying amounts of assets and impairments is presented in Notes 7 and 8.
LEASES (from January 1, 2019)
A contract or parts of contract, that conveys the right to control the use of an identified asset for a period of time in exchange for payments to be made to the owners (lessors) are accounted for as leases. Contracts are assessed to determine whether a contract is, or contains, a lease at the inception of a contract or when the terms and conditions of a contract are significantly changed. The lease term is the non-cancellable period of a lease, together with contractual options to extend or to terminate the lease early, where it is reasonably certain that an extension option will be exercised or a termination option will not be exercised.
At the commencement of a lease contract, a right-of-use asset and a corresponding lease liability are recognised, unless the lease term is 12 months or less. The commencement date of a lease is the date the underlying asset is made available for use. The lease liability is measured at an amount equal to the present value of the lease payments during the lease term that are not paid at that date. The lease liability includes contingent rentals and variable lease payments that depend on an index, rate, or where they are fixed payments in substance. The lease liability is remeasured when the contractual cash flows of variable lease payments change due to a change in an index or rate when the lease term changes following a reassessment.
Lease payments are discounted using the interest rate implicit in the lease. If that rate is not readily available, the incremental borrowing rate is applied. The incremental borrowing rate reflects the rate of interest that the lessee would have to pay to borrow over a similar term, with a similar security, the funds necessary to obtain an asset of a similar nature and value to the right-of-use asset in a similar economic environment.
In general, a corresponding right-of-use asset is recognised for an amount equal to each lease liability, adjusted by the amount of any pre-paid lease payment relating to the specific lease contract. The depreciation on right-of-use assets is recognised in income unless capitalised as exploration drilling cost (see 'Exploration cost') or capitalised when the right-of-use asset is used to construct another asset.
Where Shell is the lessor in a lease arrangement at inception, the lease arrangement will be classified as a finance lease or an operating lease. Classification is based on the extent to which the risks and rewards incidental to ownership of the underlying asset lie with the lessor or the lessee.
Where Shell, usually in its capacity as operator, has entered into a lease contract on behalf of a joint arrangement, a lease liability is recognised to the extent that Shell has primary responsibility for the lease liability. A finance sub-lease is subsequently recognised if the related right-of-use asset is subleased to the joint arrangement. This is usually the case when the joint arrangement has the right to direct the use of the asset.
Impairment of the right-of-use asset
Right-of-use assets are subject to existing impairment requirements as set out in 'Property, plant and equipment' (see Note 8).
Judgements and estimates
A lease term includes optional lease periods where it is reasonably certain to exercise the option to extend or not to exercise the option to terminate the lease. Determination of the lease term is subject to judgement and has an impact on the measurement of the lease liability and related right-of-use asset.
FINANCIAL STATEMENTS AND SUPPLEMENTS SHELL ANNUAL REPORT AND FORM 20-F 2019 | 151 | |
Where the rate implicit in the lease is not readily available, an incremental borrowing rate is applied. This incremental borrowing rate reflects the rate of interest that the lessee would have to pay to borrow over a similar term, with a similar security, the funds necessary to obtain an asset of a similar nature and value to the right-of-use asset in a similar economic environment. Determination of the incremental borrowing rate requires estimation. The incremental borrowing rate is determined using the risk-free rate over a matched term, adjusted for factors such as the credit rating of the lessee and the borrowing currency.
Significant estimate
The operating leases that were recognised on the balance sheet following the adoption of IFRS 16 (see Note 3) were measured applying an incremental borrowing rate at transition date to the future payments under these lease contracts. To determine the incremental borrowing rate for each lease contract, a risk-free rate at transition date was applied, adjusted for other factors such as the credit rating of the entity that entered into the lease contract, a country risk premium, the impact of currency, an asset specific element and the term of the lease contract. All factors are subject to estimation. If a higher or lower incremental borrowing rate had been applied, the lease liability and corresponding right-of-use asset would respectively have been lower or higher. The incremental borrowing rate will not be revised each period and will not result in a material adjustment to the carrying amount of lease liability and right-of-use asset in the future years.
LEASES (prior to January 1, 2019)
Agreements under which payments are made to owners in return for the right to use an asset for a period are accounted for as leases. Leases that transfer substantially all the risks and rewards of ownership are recognised at the commencement of the lease term as finance leases within property, plant and equipment and debt at the fair value of the leased asset or, if lower, at the present value of the minimum lease payments. Finance lease payments are apportioned between interest expense and repayments of debt. All other leases are classified as operating leases and the cost is recognised in income on a straight-line basis, except where capitalised as exploration drilling costs (see 'Exploration costs').
JOINT ARRANGEMENTS AND ASSOCIATES
Arrangements under which Shell has contractually agreed to share control (see 'Nature of the Consolidated Financial Statements' for the definition of control) with another party or parties are joint ventures where the parties have rights to the net assets of the arrangement, or joint operations where the parties have rights to the assets and obligations for the liabilities relating to the arrangement. Investments in entities over which Shell has the right to exercise significant influence but neither control nor joint control are classified as associates. Information about incorporated joint arrangements and associates at December 31, 2019, can be found in Exhibit 8.
Investments in joint ventures and associates are accounted for using the equity method, under which the investment is initially recognised at cost and subsequently adjusted for the Shell share of post-acquisition income less dividends received and the Shell share of other comprehensive income and other movements in equity, together with any loans of a long-term investment nature. Where necessary, adjustments are made to the financial statements of joint ventures and associates to bring the accounting policies used into line with those of Shell. In an exchange of assets and liabilities for an interest in a joint venture, the non-Shell share of any excess of the fair value of the assets and liabilities transferred over the pre-exchange carrying amounts is recognised in income. Unrealised gains on other transactions between Shell and its joint ventures and associates are eliminated to the extent of Shell’s interest in them; unrealised losses are treated similarly but may also result in an assessment of whether the asset transferred is impaired.
INVENTORIES
TAXATION
The charge for current tax is calculated based on the income reported by the Company and its subsidiaries, as adjusted for items that are non-taxable or disallowed and using rates that have been enacted or substantively enacted by the balance sheet date.
Deferred tax is determined, using the liability method, on temporary differences arising between the tax bases of assets and liabilities and their carrying amounts in the Consolidated Balance Sheet and on unused tax losses and credits carried forward.
Deferred tax assets and liabilities are calculated using the enacted or substantively enacted rates that are expected to apply when an asset is realised or a liability is settled. They are not recognised where they arise on the initial recognition of goodwill or of an asset or liability in a transaction (other than in a business combination) that, at the time of the transaction, affects neither accounting nor taxable profit, or in respect of taxable temporary differences associated with subsidiaries, joint ventures and associates where the reversal of the respective temporary difference can be controlled by Shell and it is probable that it will not reverse in the foreseeable future.
Deferred tax assets are recognised to the extent that it is probable that future taxable profits will be available against which the deductible temporary differences, unused tax losses and credits carried forward can be utilised.
Income tax receivables and payables as well as deferred tax assets and liabilities include provisions for uncertain income tax positions/treatments.
Income taxes are recognised in income except when they relate to items recognised in other comprehensive income, in which case the tax is recognised in other comprehensive income. Income tax assets and liabilities are presented separately in the Consolidated Balance Sheet except where there is a right of offset within fiscal jurisdictions and an intention to settle such balances on a net basis.
Judgements and estimates
Tax liabilities are recognised when it is considered probable that there will be a future outflow of funds to a taxing authority. In such cases, provision is made for the amount that is expected to be settled, where this can be reasonably estimated. Provisions for uncertain income tax positions/treatments are measured at the most likely amount or the expected value, whichever method is more appropriate. Generally, uncertain tax treatments are assessed on an individual basis, except where they are expected to be settled collectively. It is assumed that taxing authorities will examine positions taken if they have the right to do so and that they have full knowledge of the relevant information. A change in estimate of the likelihood of a future outflow and/or in the expected amount to be settled
FINANCIAL STATEMENTS AND SUPPLEMENTS SHELL ANNUAL REPORT AND FORM 20-F 2019 | 152 | |
would be recognised in income in the period in which the change occurs. This requires the application of judgement as to the ultimate outcome, which can change over time depending on facts and circumstances. Judgements mainly relate to transfer pricing, including inter-company financing, interpretation of PSCs, expenditure deductible for tax purposes and taxation arising on disposal.
Deferred tax assets are recognised only to the extent it is considered probable that those assets will be recoverable. This involves an assessment of when those assets are likely to reverse, and a judgement as to whether or not there will be sufficient taxable profits available to offset the assets when they do reverse. This requires assumptions regarding future profitability and is therefore inherently uncertain. To the extent assumptions regarding future profitability change, there can be an increase or decrease in the amounts recognised in respect of deferred tax assets as well as in the amounts recognised in income in the period in which the change occurs.
Taxation information, including charges and deferred tax assets and liabilities, is presented in Note 16. Income taxes include taxes at higher rates levied on income from certain Integrated Gas and Upstream activities.
RETIREMENT BENEFITS
Benefits in the form of retirement pensions and healthcare and life insurance are provided to certain employees and retirees under defined benefit and defined contribution plans.
Obligations under defined benefit plans are calculated annually by independent actuaries using the projected unit credit method, which takes into account employees’ years of service and, for pensions, average or final pensionable remuneration, and are discounted to their present value using interest rates of high-quality corporate bonds denominated in the currency in which the benefits will be paid and of a duration consistent with the plan obligations. Where plans are funded, payments are made to independently managed trusts; assets held by those trusts are measured at fair value. Defined benefit plan surpluses are recognised as assets to the extent that they are considered recoverable, which is generally by way of a refund or lower future employer contributions.
The amounts recognised in income in respect of defined benefit plans mainly comprise service cost and net interest. Service cost comprises principally the increase in the present value of the obligation for benefits resulting from employee service during the period (current service cost) and also amounts relating to past service and settlements or amendments of plans. Plan amendments are changes to benefits and are generally recognised when all legal and regulatory approvals have been received and the effects have been communicated to members. Net interest is calculated using the net defined benefit liability or asset matched against the discount rate yield curve at the beginning of each year for each plan. Remeasurements of the net defined benefit liability or asset resulting from actuarial gains and losses, and the return on plan assets excluding the amount recognised in income, are recognised in other comprehensive income.
For defined contribution plans, pension expense represents the amount of employer contributions payable for the period.
Significant judgements and estimates
Defined benefit obligations and plan assets, and the resulting liabilities and assets that are recognised, are subject to significant volatility as actuarial assumptions regarding future outcomes and market values change. Substantial judgement is required in determining the actuarial assumptions, which vary for the different plans to reflect local conditions but are determined under a common process in consultation with independent actuaries. The assumptions applied in respect of each plan are reviewed annually and adjusted where necessary to reflect changes in experience and actuarial recommendations.
Information about the amounts reported in respect of defined benefit pension plans, assumptions applicable to the principal plans and their sensitivity to changes are presented in Note 17.
PROVISIONS
Provisions are recognised at the balance sheet date at management’s best estimate of the expenditure required to settle the present obligation. Non-current amounts are discounted at a rate intended to reflect the time value of money. The carrying amounts of provisions are regularly reviewed and adjusted for new facts or changes in law or technology.
Provisions for decommissioning and restoration costs, which arise principally in connection with hydrocarbon production facilities and pipelines, are measured on the basis of current requirements, technology and price levels; the present value is calculated using amounts discounted over the useful economic life of the assets. The liability is recognised (together with a corresponding amount as part of the related property, plant and equipment) once an obligation crystallises in the period when a reasonable estimate can be made. The effects of changes resulting from revisions to the timing or the amount of the original estimate of the provision are reflected on a prospective basis, generally by adjustment to the carrying amount of the related property, plant and equipment. However, where there is no related asset, or the change reduces the carrying amount to nil, the effect, or the amount in excess of the reduction in the related asset to nil, is recognised in income.
Redundancy provisions are recognised when a detailed formal plan identifies the business or part of the business concerned, the location and number of employees affected, a detailed estimate of the associated costs and an appropriate timeline, and the employees affected have been notified of the plan's main features.
Other provisions are recognised in income in the period in which an obligation arises and the amount can be reasonably estimated. Provisions are measured based on current legal requirements and existing technology where applicable. Recognition of any joint and several liability is based on management’s best estimate of the final pro rata share of the liability. Provisions are determined independently of expected insurance recoveries. Recoveries are recognised when virtually certain of realisation.
Significant estimates
Estimates of provisions for future decommissioning and restoration costs are recognised and based on current legal and constructive requirements, technology and price levels. Because actual outflows can differ from estimates due to changes in laws, regulations, public expectations, technology, prices and conditions, and can take place many years in the future, the carrying amounts of provisions are regularly reviewed and adjusted to take account of such changes. The discount rate applied is reviewed annually.
Information about decommissioning and restoration provisions is presented in Note 18.
FINANCIAL INSTRUMENTS (from January 1, 2018)
FINANCIAL STATEMENTS AND SUPPLEMENTS SHELL ANNUAL REPORT AND FORM 20-F 2019 | 153 | |
Financial assets and liabilities are presented separately in the Consolidated Balance Sheet except where there is a legally enforceable right of offset and Shell has the intention to settle on a net basis or realise the asset and settle the liability simultaneously.
Financial Assets
Financial assets are classified at initial recognition and subsequently measured at amortised cost, fair value through other comprehensive income or fair value through profit or loss. The classification of financial assets is determined by the contractual cash flows and where applicable the business model for managing the financial assets.
A financial asset is measured at amortised cost, if the objective of the business model is to hold the financial asset in order to collect contractual cash flows and the contractual terms give rise to cash flows that are solely payments of principal and interest. It is initially recognised at fair value plus or minus transaction costs that are directly attributable to the acquisition or issue of the financial asset. Subsequently the financial asset is measured using the effective interest method less any impairment. Gains and losses are recognised in profit or loss when the asset is derecognised, modified or impaired.
All equity instruments and other debt instruments are recognised at fair value. For equity instruments, on initial recognition, an irrevocable election (on an instrument-by-instrument basis) can be made to designate these as at fair value through other comprehensive income instead of fair value through profit and loss. Dividends received on equity instruments are recognised as other income in profit or loss when the right of payment has been established, except when Shell benefits from such proceeds as a recovery of part of the cost of the financial asset, in which case, such gains are recorded in other comprehensive income.
Investments in securities
Investments in securities (“securities”) comprise equity and debt securities. Equity securities are carried at fair value. Generally, unrealised holding gains and losses are recognised in other comprehensive income. On sale, net gains and losses previously accumulated in other comprehensive income are transferred to retained earnings. Debt securities are generally carried at fair value with unrealised holding gains and losses recognised in other comprehensive income. On sale, net gains and losses previously accumulated in other comprehensive income are recognised in income.
Impairment of financial assets
The expected credit loss model is applied for recognition and measurement of impairments in financial assets measured at amortised cost or at fair value through other comprehensive income. The expected credit loss model is also applied for financial guarantee contracts to which IFRS 9 applies and are not accounted for at fair value through profit or loss. The loss allowance for the financial asset is measured at an amount equal to the 12-month expected credit losses. If the credit risk on the financial asset has increased significantly since initial recognition, the loss allowance for the financial asset is measured at an amount equal to the lifetime expected credit losses. Changes in loss allowances are recognised in profit and loss. For trade receivables, a simplified impairment approach is applied recognising expected lifetime losses from initial recognition.
Financial Liabilities
Financial liabilities are measured at amortised cost, unless they are required to be measured at fair value through profit or loss, such as instruments held for trading, or Shell has opted to measure them at fair value through profit or loss. Debt and trade payables are recognised initially at fair value based on amounts exchanged, net of transaction costs, and subsequently at amortised cost except for fixed rate debt subject to fair value hedging which is remeasured for the hedged risk (see below). Interest expense on debt is accounted for using the effective interest method, and other than interest capitalised, is recognised in income. For financial liabilities that are measured under the fair value option, the change in the fair value related to own credit risk is recognised in other comprehensive income. The remaining fair value change is recognised to fair value through profit and loss.
Derivative contracts and hedges
Derivative contracts are used in the management of interest rate risk, foreign exchange risk, commodity price risk, and foreign currency cash balances. Derivatives that are not closely related to the host contract in terms of economic characteristics and risks of which the host contract is not a financial asset, are separated from their host contract and recognised at fair value with the associated gains and losses recognised in income.
Certain derivative contracts qualify and are designated either as a “fair value” hedge of the change in fair value of a recognised asset or liability or an unrecognised firm commitment or as a “cash flow” hedge for the change in cash flows to be received or paid relating to a recognised asset or liability or a highly probable forecast transaction.
A change in the fair value of a fair value hedge is recognised in income, together with the consequential adjustment to the carrying amount of the hedged item. The effective portion of a change in fair value of a derivative contract designated as a cash flow hedge is recognised in other comprehensive income until the hedged transaction occurs; any ineffective portion is recognised in income. Where the hedged item is a non-financial asset or liability, the amount in accumulated other comprehensive income is transferred to the initial carrying amount of the asset or liability (reclassified to the balance sheet); for other hedged items, the amount in accumulated other comprehensive income is reclassified to income when the hedged transaction affects income.
The effective portion of a change due to retranslation at quarter-end exchange rates in the carrying amount of debt and the principal amount of derivative contracts used to hedge net investments in foreign operations is recognised in other comprehensive income until the related investment is sold or liquidated; any ineffective portion is recognised in income.
All relationships between hedging instruments and hedged items are documented, as well as risk management objectives and strategies for undertaking hedge transactions. The effectiveness of hedges is also continually assessed and hedge accounting is discontinued when there is a change in the risk management strategy.
Unless designated as hedging instruments, contracts to sell or purchase non-financial items that can be settled net as if the contracts were financial instruments and that do not meet expected own use requirements (typically, forward sale and purchase contracts for commodities in trading operations), and contracts that are or contain written options, are recognised at fair value; associated gains and losses are recognised in income.
Derivatives that are held primarily for the purpose of trading are presented as current in the Consolidated Balance Sheet.
FINANCIAL INSTRUMENTS (prior to January 1, 2018)
Financial assets and liabilities are presented separately in the Consolidated Balance Sheet except where there is a legally enforceable right of offset and Shell has the intention to settle on a net basis or realise the asset and settle the liability simultaneously.
Financial assets
FINANCIAL STATEMENTS AND SUPPLEMENTS SHELL ANNUAL REPORT AND FORM 20-F 2019 | 154 | |
Investments in securities
Investments in securities (also referred to as “securities”) comprise equity and debt securities classified on initial recognition as available-for-sale and are carried at fair value, except where their fair value cannot be measured reliably, in which case they are carried at cost, less any impairment. Unrealised holding gains and losses other than impairments are recognised in other comprehensive income, except for translation differences arising on foreign currency debt securities, which are recognised in income. On maturity or sale, net gains and losses previously deferred in accumulated other comprehensive income are recognised in income.
Interest income on debt securities is recognised in income using the effective interest method. Dividends on equity securities are recognised in income when receivable.
Cash and cash equivalents
Cash and cash equivalents comprise cash at bank and in hand, including offsetting bank overdrafts, short-term bank deposits, money market funds, reverse repos and similar instruments that have a maturity of three months or less at the date of purchase.
Trade receivables
Trade receivables are recognised initially at fair value based on amounts exchanged and subsequently at amortised cost less any impairment.
Financial liabilities
Debt and trade payables are recognised initially at fair value based on amounts exchanged, net of transaction costs, and subsequently at amortised cost except for fixed rate debt subject to fair value hedging which is remeasured for the hedged risk (see below). Interest expense on debt is accounted for using the effective interest method and, other than interest capitalised, is recognised in income.
Derivative contracts and hedges
Derivative contracts are used in the management of interest rate risk, foreign exchange risk and commodity price risk, and in the management of foreign currency cash balances. These contracts are recognised at fair value.
Certain derivative contracts qualify and are designated either as a “fair value” hedge of the change in fair value of a recognised asset or liability or an unrecognised firm commitment or as a “cash flow” hedge of the change in cash flows to be received or paid relating to a recognised asset or liability or a highly probable forecast transaction.
A change in the fair value of a hedging instrument designated as a fair value hedge is recognised in income, together with the consequential adjustment to the carrying amount of the hedged item. The effective portion of a change in fair value of a derivative contract designated as a cash flow hedge is recognised in other comprehensive income until the hedged transaction occurs; any ineffective portion is recognised in income. Where the hedged item is a non-financial asset or liability, the amount in accumulated other comprehensive income is transferred to the initial carrying amount of the asset or liability (reclassified to the balance sheet); for other hedged items, the amount in accumulated other comprehensive income is reclassified to income when the hedged transaction affects income.
The effective portion of a change due to retranslation at quarter-end exchange rates in the carrying amount of debt and the principal amount of derivative contracts used to hedge net investments in foreign operations is recognised in other comprehensive income until the related investment is sold or liquidated; any ineffective portion is recognised in income.
All relationships between hedging instruments and hedged items are documented, as well as risk management objectives and strategies for undertaking hedge transactions. The effectiveness of hedges is also continually assessed and hedge accounting is discontinued when a hedge ceases to be highly effective.
Gains and losses on derivative contracts not qualifying and designated as hedges, including forward sale and purchase contracts for commodities in trading operations that may be settled by the physical delivery or receipt of the commodity, are recognised in income.
Unless designated as hedging instruments, contracts to sell or purchase non-financial items that can be settled net as if the contracts were financial instruments and that do not meet expected own use requirements (typically, forward sale and purchase contracts for commodities in trading operations), and contracts that are or contain written options, are recognised at fair value; associated gains and losses are recognised in income.
Derivatives embedded within contracts that are not already required to be recognised at fair value, and that are not closely related to the host contract in terms of economic characteristics and risks, are separated from their host contract and recognised at fair value; associated gains and losses are recognised in income.
FAIR VALUE MEASUREMENTS
Fair value measurements are estimates of the amounts for which assets or liabilities could be transferred at the measurement date, based on the assumption that such transfers take place between participants in principal markets and, where applicable, taking highest and best use into account.
Judgements and estimates
SHARE-BASED COMPENSATION PLANS
The fair value of share-based compensation expense arising from the Performance Share Plan ("PSP") and the Long-term Incentive Plan ("LTIP") - Shell’s main equity-settled plans - is estimated using a Monte Carlo option pricing model and is recognised in income from the date of grant over the vesting period with a corresponding increase directly in equity. The model projects and averages the results for a range of potential outcomes for the vesting conditions, the principal assumptions for which are the share price volatility and dividend yields for Shell and four of its main competitors over the last three years and the last 10 years. Prior to the adoption of the IFRS 2 amendments in 2018, changes in the fair value of share-based compensation for cash-settled plans were recognised in income with a corresponding change in liabilities.
FINANCIAL STATEMENTS AND SUPPLEMENTS SHELL ANNUAL REPORT AND FORM 20-F 2019 | 155 | |
SHARES HELD IN TRUST
Shares in the Company, which are held by employee share ownership trusts and trust-like entities, are not included in assets but are reflected at cost as a deduction from equity as shares held in trust.
ACQUISITIONS AND SALES OF INTERESTS IN A BUSINESS
CONSOLIDATED STATEMENT OF INCOME PRESENTATION
2B - CHANGES TO IFRS NOT YET ADOPTED
Inter-Bank Offered Rate ("IBOR") Reform - Phase 1
Amendments to IFRS 9 Financial Instruments ("IFRS 9") and IFRS 7 Financial Instruments: Disclosures ("IFRS 7") were issued in September 2019. The amendments contain a temporary exception from applying specific hedge accounting requirements pre-IBOR reform (Phase 1). Further amendments to IFRS standards (Phase 2) are expected to address potential financial reporting implications when an existing interest rate benchmark is replaced with an alternative.
Shell’s fixed rate debt hedged to floating rate will be affected by the market-wide replacement of London Inter-Bank Offered Rate ("LIBOR") to alternative risk-free reference rates, most significantly by reform of dollar LIBOR.
The majority of Shell's debt related interest rate and currency swaps were designated in fair value hedge relationships at December 31, 2019. In relation to the required prospective assessment of the existence of an economic relationship between the hedged items and hedging instruments for these hedge relationships, Shell will apply the temporary exception in IFRS 9 on hedge relationships directly affected by the IBOR reform. By applying the exception, Shell anticipates that the interest rate benchmark on which the hedged risk is based is not altered as a result of the IBOR reform.
The notional amount of hedging instruments designated in hedge relationships affected by the reform, at December 31, 2019, was $31,823 million.
A Group-wide project is in progress to manage the transition to alternative benchmark rates.
IFRS 17 Insurance contracts ("IFRS 17")
3 - ADOPTION OF IFRS 16 LEASES
IFRS 16 was adopted as from January 1, 2019. All operating lease contracts, with limited exceptions, were recognised on the balance sheet by recognising right-of-use assets and corresponding lease liabilities at the transition date. Shell applied the modified retrospective transition method, and consequently comparative information is not restated. As a practical expedient, no reassessment was performed of contracts that were previously identified as leases and contracts that were not previously identified as containing a lease applying IAS 17 Leases ("IAS 17") and IFRIC 4 Determining whether an Arrangement contains a Lease. At the adoption date, additional lease liabilities were recognised for leases previously classified as operating leases applying IAS 17. These lease liabilities were measured at the present value of the remaining lease payments and discounted using entity-specific incremental borrowing rates at January 1, 2019. In general, a corresponding right-of-use asset was recognised for an amount equal to each lease liability, adjusted by the amount of any prepaid or accrued lease payments relating to the specific lease contract, as recognised on the balance sheet at December 31, 2018. Provisions for onerous lease contracts at December 31, 2018 were adjusted to the respective right-of-use assets recognised at January 1, 2019. As a practical expedient the recognition exemption for leases with a remaining term of less than 12 months from the adoption date was applied upon adoption.
At the transition date, the remaining lease payments were discounted, as required under the transition approach chosen, using the incremental borrowing rate as per the transition date of January 1, 2019. To determine the incremental borrowing rate for each lease contract, a risk-free rate at transition date was applied, adjusted for other factors such as the credit rating of the entity that entered into the lease contract, a country risk premium, the impact of currency, an asset specific element and the term the the lease contract. The weighted average incremental borrowing rate applied upon transition was 7.2 %.
Compared with the previous accounting for operating leases under IAS 17, the application of the new standard has a significant impact on the classification of expenditures and cash flows. It also impacts the timing of expenses recognised in the statement of income. With effect from 2019, expenses related to leases previously classified as operating leases are presented under 'Depreciation, depletion and amortisation' and 'Interest expense'. Before 2019, these were mainly included in 'Purchases, Production and manufacturing expenses', and 'Selling, distribution and administrative expenses'. Payments related to leases previously classified as operating leases are presented under 'Cash flow from financing activities' (before 2019 these were included in 'Cash flow from operating activities' and 'Cash flow from investing activities').
FINANCIAL STATEMENTS AND SUPPLEMENTS SHELL ANNUAL REPORT AND FORM 20-F 2019 | 156 | |
The adoption of the new standard had an accumulated impact at January 1, 2019 of $4 million on equity following the recognition of lease liabilities of $16.0 billion and additional right-of-use assets of $15.6 billion and reclassifications mainly related to pre-paid leases and onerous contracts previously recognised.
The reconciliation of differences between the operating lease commitments disclosed under the prior standard and the additional lease liabilities recognised on the balance sheet at January 1, 2019 is as follows:
Lease liabilities reconciliation | $ million | |||
Undiscounted future minimum lease payments under operating leases at December 31, 2018 | ||||
Impact of discounting | ( | ) | ||
Leases not yet commenced at January 1, 2019 | ( | ) | ||
Short-term leases | ( | ) | ||
Long-term leases expiring before December 31, 2019 | ( | ) | ||
Other reconciling items (net) | ||||
Additional lease liability at January 1, 2019 | ||||
Finance lease liability at December 31, 2018 | ||||
Total lease liability at January 1, 2019 | ||||
FINANCIAL STATEMENTS AND SUPPLEMENTS SHELL ANNUAL REPORT AND FORM 20-F 2019 | 157 | |
The detailed impact on the balance sheet at January 1, 2019, is as follows:
Consolidated Balance Sheet | $ million | ||||||||||||||
Dec 31, 2018 | IFRS 16 impact | Jan 1, 2019 | |||||||||||||
Assets | |||||||||||||||
Non-current assets | |||||||||||||||
Intangible assets | |||||||||||||||
Property, plant and equipment | |||||||||||||||
Joint ventures and associates | |||||||||||||||
Investments in securities | |||||||||||||||
Deferred tax | |||||||||||||||
Retirement benefits | |||||||||||||||
Trade and other receivables [A] | ( | ) | |||||||||||||
Derivative financial instruments | |||||||||||||||
Current assets | |||||||||||||||
Inventories | |||||||||||||||
Trade and other receivables | |||||||||||||||
Derivative financial instruments | |||||||||||||||
Cash and cash equivalents | |||||||||||||||
Total assets | |||||||||||||||
Liabilities | |||||||||||||||
Non-current liabilities | |||||||||||||||
Debt | |||||||||||||||
Trade and other payables [B] | ( | ) | |||||||||||||
Derivative financial instruments | |||||||||||||||
Deferred tax | |||||||||||||||
Retirement benefits | |||||||||||||||
Decommissioning and other provisions [C] | ( | ) | |||||||||||||
Current liabilities | |||||||||||||||
Debt | |||||||||||||||
Trade and other payables | ( | ) | |||||||||||||
Derivative financial instruments | |||||||||||||||
Taxes payable | |||||||||||||||
Retirement benefits | |||||||||||||||
Decommissioning and other provisions [C] | ( | ) | |||||||||||||
Total liabilities | |||||||||||||||
Equity | |||||||||||||||
Share capital | |||||||||||||||
Shares held in trust | ( | ) | ( | ) | |||||||||||
Other reserves | |||||||||||||||
Retained earnings | |||||||||||||||
Equity attributable to Royal Dutch Shell plc shareholders | |||||||||||||||
Non-controlling interest | |||||||||||||||
Total equity | |||||||||||||||
Total liabilities and equity | |||||||||||||||
[A] Mainly in respect of pre-paid leases.
[B] Mainly related to operating lease contracts that were measured at fair value under IFRS 3 Business Combinations following the acquisition of BG in 2016.
4 - SEGMENT INFORMATION
FINANCIAL STATEMENTS AND SUPPLEMENTS SHELL ANNUAL REPORT AND FORM 20-F 2019 | 158 | |
General Information
Shell is an international energy company engaged in the principal aspects of the oil and gas industry and reports its business through the segments: Integrated Gas, Upstream, Downstream, and Corporate.
The Integrated Gas segment covers liquefied natural gas ("LNG") activities and the conversion of natural gas into gas-to-liquids fuels and other products, as well as the New Energies portfolio. It includes natural gas exploration and extraction and the operation of the upstream and midstream infrastructure necessary to deliver gas to market. It markets and trades natural gas, LNG, electricity and carbon-emission rights and also markets and sells LNG as a fuel for heavy-duty vehicles and marine vessels.
Upstream combines the following two operating segments: 1) Upstream, which is engaged in the exploration for and extraction of crude oil, natural gas and natural gas liquids, and the marketing and transportation of oil and gas, and 2) Oil Sands, which is engaged in the extraction of bitumen from mined oil sands and conversion into synthetic crude oil. These operating segments have similar economic characteristics because their earnings are significantly dependent on crude oil and natural gas prices and production volumes.
The Downstream segment is engaged in oil products and chemicals manufacturing, marketing and trading activities, that turn crude oil and other feedstocks into a range of products which are moved and marketed around the world for domestic, industrial and transport use.
The Corporate segment covers the non-operating activities supporting Shell, comprising Shell’s holdings and treasury organisation, its self-insurance activities and its headquarters and central functions.
Basis of Segmental Reporting
Sales between segments are based on prices generally equivalent to commercially available prices. Third-party revenue and non-current assets information by geographical area are based on the country of operation of the group subsidiaries that report this information. Separate disclosure is provided for the UK as this is the Company’s country of domicile.
Segment earnings are presented on a current cost of supplies basis ("CCS earnings"), which is the earnings measure used by the Chief Executive Officer for the purposes of making decisions about allocating resources and assessing performance. On this basis, the purchase price of volumes sold during the period is based on the current cost of supplies during the same period after making allowance for the tax effect. CCS earnings therefore exclude the effect of changes in the oil price on inventory carrying amounts.
With the adoption of IFRS 16, the interest expense on leases, formerly classified as operating leases, is reported under the Corporate segment, while depreciation related to the respective right-of-use assets is reported in the segment making use of the assets. This treatment is consistent with how formerly classified finance leases were treated.
Information by segment on a current cost of supplies basis is as follows:
2019 | $ million | ||||||||||
Integrated Gas | Upstream | Downstream | Corporate | Total | |||||||
Revenue: | |||||||||||
Third-party | [A][B] | ||||||||||
Inter-segment | |||||||||||
Share of profit/(loss) of joint ventures and associates (CCS basis) | ( | ) | |||||||||
Interest and other income, of which: | |||||||||||
Interest income | |||||||||||
Net gains on sale and revaluation of non-current assets and businesses | |||||||||||
Other | ( | ) | ( | ) | ( | ) | |||||
Third-party and inter-segment purchases (CCS basis) | ( | ) | |||||||||
Production and manufacturing expenses | |||||||||||
Selling, distribution and administrative expenses | |||||||||||
Research and development expenses | |||||||||||
Exploration expenses | |||||||||||
Depreciation, depletion and amortisation charge, of which: | |||||||||||
Impairment losses | [C] | ||||||||||
Impairment reversals | ( | ) | ( | ) | [D] | ||||||
Interest expense | |||||||||||
Taxation charge/(credit) (CCS basis) | ( | ) | |||||||||
CCS earnings | ( | ) | |||||||||
[A] Includes $3,760 million of revenue from sources other than from contracts with customers, which mainly comprises the impact of fair value accounting of commodity derivatives.
[B] In March 2019, the IFRS Interpretation Committee ("IFRIC") finalised an agenda decision regarding 'Physical settlement of contracts to buy or sell a non-financial item (IFRS 9)'. This agenda decision has been analysed and will be prospectively implemented from January 1, 2020. The impact will be limited to a reclassification within total revenue.
[C] Impairment losses comprise Property, plant and equipment ($3,639 million) and Intangible assets ($143 million).
[D] See Note 8.
FINANCIAL STATEMENTS AND SUPPLEMENTS SHELL ANNUAL REPORT AND FORM 20-F 2019 | 159 | |
2018 | $ million | ||||||||||
Integrated Gas | Upstream | Downstream | Corporate | Total | |||||||
Revenue: | |||||||||||
Third-party | [A] | ||||||||||
Inter-segment | [B] | ||||||||||
Share of profit/(loss) of joint ventures and associates (CCS basis) | ( | ) | |||||||||
Interest and other income, of which: | |||||||||||
Interest income | |||||||||||
Net gains on sale and revaluation of non-current assets and businesses | |||||||||||
Other | ( | ) | ( | ) | |||||||
Third-party and inter-segment purchases (CCS basis) | |||||||||||
Production and manufacturing expenses | ( | ) | |||||||||
Selling, distribution and administrative expenses | |||||||||||
Research and development expenses | |||||||||||
Exploration expenses | |||||||||||
Depreciation, depletion and amortisation charge, of which: | |||||||||||
Impairment losses | [C] | ||||||||||
Impairment reversals | ( | ) | ( | ) | [D] | ||||||
Interest expense | [E] | ||||||||||
Taxation charge/(credit) (CCS basis) | ( | ) | |||||||||
CCS earnings | ( | ) | |||||||||
[A] Includes $3,348 million of revenue from sources other than from contracts with customers, which mainly comprises the impact of fair value accounting of commodity derivatives.
[B] Inter-segment revenue has been revised to amend for transactions within segments that were previously reported as inter-segment revenue, and vice versa.
[C] Impairment losses comprise Property, plant and equipment ($1,515 million) and Intangible assets ($181 million).
[D] See Note 8.
[E] Interest expense has been reclassified between segments compared with prior year.
2017 | $ million | ||||||||||
Integrated Gas | Upstream | Downstream | Corporate | Total | |||||||
Revenue: | |||||||||||
Third-party | |||||||||||
Inter-segment | [A] | ||||||||||
Share of profit/(loss) of joint ventures and associates (CCS basis) | ( | ) | |||||||||
Interest and other income, of which: | |||||||||||
Interest income | |||||||||||
Net gains on sale and revaluation of non-current assets and businesses | |||||||||||
Other | ( | ) | ( | ) | |||||||
Third-party and inter-segment purchases (CCS basis) | |||||||||||
Production and manufacturing expenses | ( | ) | |||||||||
Selling, distribution and administrative expenses | |||||||||||
Research and development expenses | |||||||||||
Exploration expenses | |||||||||||
Depreciation, depletion and amortisation charge, of which: | |||||||||||
Impairment losses | [B] | ||||||||||
Impairment reversals | ( | ) | ( | ) | ( | ) | [C] | ||||
Interest expense | |||||||||||
Taxation charge/(credit) (CCS basis) | ( | ) | |||||||||
CCS earnings | ( | ) | |||||||||
[A] Inter-segment revenue has been revised to amend for transactions within segments that were previously reported as inter-segment revenue, and vice versa.
[B] Impairment losses comprise Property, plant and equipment ($4,572 million) and Intangible assets ($233 million).
[C] See Note 8.
FINANCIAL STATEMENTS AND SUPPLEMENTS SHELL ANNUAL REPORT AND FORM 20-F 2019 | 160 | |
Reconciliation of CCS earnings to income for the period | $ million | |||||
2019 | 2018 | 2017 | ||||
CCS earnings | ||||||
Current cost of supplies adjustment: | ||||||
Purchases | ( | ) | ||||
Taxation | ( | ) | ( | ) | ||
Share of profit of joint ventures and associates | ( | ) | ||||
( | ) | |||||
Income for the period | ||||||
Information by geographical area is as follows:
2019 | $ million | |||||||||||
Europe | Asia, Oceania, Africa | USA | Other Americas | Total | ||||||||
Third-party revenue, by origin | [A] | [B] | ||||||||||
Intangible assets, property, plant and equipment, joint ventures and associates at December 31 | [C] | |||||||||||
[A] Includes $41,094 million that originated from the UK.
[B] Includes $84,282 million that originated from Singapore.
[C] Includes $24,696 million located in the UK.
2018 | $ million | ||||||||||||
Europe | Asia, Oceania, Africa | USA | Other Americas | Total | |||||||||
Third-party revenue, by origin | [A] | [B] | |||||||||||
Intangible assets, property, plant and equipment, joint ventures and associates at December 31 | [C] | ||||||||||||
[A] Includes $54,659 million that originated from the UK.
[B] Includes $89,811 million that originated from Singapore.
[C] Includes $21,863 million located in the UK.
2017 | $ million | ||||||||||||
Europe | Asia, Oceania, Africa | USA | Other Americas | Total | |||||||||
Third-party revenue, by origin | [A] | [B] | |||||||||||
Intangible assets, property, plant and equipment, joint ventures and associates at December 31 | [C] | ||||||||||||
[A] Includes $49,370 million that originated from the UK.
[B] Includes $62,046 million that originated from Singapore.
5 - INTEREST AND OTHER INCOME
$ million | ||||||
2019 | 2018 | 2017 | ||||
Interest income | ||||||
Dividend income (from investments in equity securities) | ||||||
Net gains on sale and revaluation of non-current assets and businesses | ||||||
Net foreign exchange gains/(losses) on financing activities | ( | ) | ( | ) | ||
Other | ||||||
Total | ||||||
In 2019, net gains on sale of non-current assets and businesses arose mainly in respect of gains on the sale of Upstream assets in the USA and Denmark, as well as Downstream assets in Saudi Arabia and China and Integrated Gas assets in Australia.
In 2018, net gains on sale of non-current assets and businesses arose mainly in respect of gains on the sale of Integrated Gas assets in Thailand, Malaysia, Oman and New Zealand, as well as Upstream assets in Iraq and Malaysia and a Downstream divestment in Argentina, partly offset by a charge related to the disposal of our Upstream assets in Ireland.
FINANCIAL STATEMENTS AND SUPPLEMENTS SHELL ANNUAL REPORT AND FORM 20-F 2019 | 161 | |
In 2017, net gains on sale of non-current assets and businesses arose mainly in respect of gains on the sale of Upstream assets in the UK and the USA as well as Downstream assets in Australia and Saudi Arabia, partly offset by a loss on the Motiva transaction. Net foreign exchange losses on financing activities in 2017 includes a charge of $545 million from the release of cumulative currency translation differences following the restructuring of funding for our North America businesses.
6 - INTEREST EXPENSE
$ million | |||||||
2019 | 2018 | 2017 | |||||
Interest incurred and similar charges | [A] | ||||||
Less: interest capitalised | ( | ) | ( | ) | ( | ) | |
Other net losses on fair value hedges of debt | |||||||
Accretion expense | |||||||
Total | |||||||
[A] Includes $2,186 million of interest expenses related to leases of which $1,137 million related to those leases which formerly would have been classified as operating leases (see Note 3).
The rate applied in determining the amount of interest capitalised in 2019 was 4.5 % (2018: 4.0 %; 2017: 3.0 %). The rate increase in 2019 was mainly driven by the weighted average rate for leases recognised upon the adoption of IFRS 16 Leases (see Note 3).
7 - INTANGIBLE ASSETS
2019 | $ million | |||||||
Goodwill | LNG off-take and sales contracts | Other | Total | |||||
Cost | ||||||||
At January 1 | ||||||||
Additions | ||||||||
Sales, retirements and other movements | ( | ) | ( | ) | ( | ) | ( | ) |
Currency translation differences | ||||||||
At December 31 | ||||||||
Depreciation, depletion and amortisation, including impairments | ||||||||
At January 1 | ||||||||
Charge for the year | ||||||||
Sales, retirements and other movements | ( | ) | ( | ) | ( | ) | ( | ) |
Currency translation differences | ||||||||
At December 31 | ||||||||
Carrying amount at December 31 | ||||||||
2018 | $ million | |||||||
Goodwill | LNG off-take and sales contracts | Other | Total | |||||
Cost | ||||||||
At January 1 | ||||||||
Additions | ||||||||
Sales, retirements and other movements | ( | ) | ( | ) | ( | ) | ( | ) |
Currency translation differences | ( | ) | ( | ) | ( | ) | ||
At December 31 | ||||||||
Depreciation, depletion and amortisation, including impairments | ||||||||
At January 1 | ||||||||
Charge for the year | ||||||||
Sales, retirements and other movements | ( | ) | ( | ) | ( | ) | ( | ) |
Currency translation differences | ( | ) | ( | ) | ( | ) | ||
At December 31 | ||||||||
Carrying amount at December 31 | ||||||||
Goodwill at December 31, 2019, principally related to the acquisition of BG Group plc in 2016, allocated to Integrated Gas ($4,897 million) and Upstream ($5,967 million) at the operating segment level, and to Pennzoil-Quaker State Company ($1,609 million), a lubricants business in the Downstream segment based largely in North America. Information on annual impairment testing is included in Note 8.
FINANCIAL STATEMENTS AND SUPPLEMENTS SHELL ANNUAL REPORT AND FORM 20-F 2019 | 162 | |
8 - PROPERTY, PLANT AND EQUIPMENT
2019 | $ million | ||||||||||
Exploration and production | |||||||||||
Exploration and evaluation | Production | Manufacturing, supply and distribution | Other | Total | |||||||
Cost | |||||||||||
At January 1 (as previously published) | |||||||||||
Impact of IFRS 16 [A] | |||||||||||
At January 1 (as revised) | |||||||||||
Additions | |||||||||||
Sales, retirements and other movements | ( | ) | ( | ) | ( | ) | ( | ) | ( | ) | |
Currency translation differences | ( | ) | |||||||||
At December 31 | |||||||||||
Depreciation, depletion and amortisation, including impairments | |||||||||||
At January 1 | |||||||||||
Charge for the year | |||||||||||
Sales, retirements and other movements | ( | ) | ( | ) | ( | ) | ( | ) | ( | ) | |
Currency translation differences | ( | ) | |||||||||
At December 31 | |||||||||||
Carrying amount at December 31 | |||||||||||
[A] See Note 3.
2018 | $ million | ||||||||||
Exploration and production | |||||||||||
Exploration and evaluation | Production | Manufacturing, supply and distribution | Other | Total | |||||||
Cost | |||||||||||
At January 1 | |||||||||||
Additions | |||||||||||
Sales, retirements and other movements | ( | ) | ( | ) | ( | ) | ( | ) | ( | ) | |
Currency translation differences | ( | ) | ( | ) | ( | ) | ( | ) | ( | ) | |
At December 31 | |||||||||||
Depreciation, depletion and amortisation, including impairments | |||||||||||
At January 1 | |||||||||||
Charge for the year | ( | ) | |||||||||
Sales, retirements and other movements | ( | ) | ( | ) | ( | ) | ( | ) | ( | ) | |
Currency translation differences | ( | ) | ( | ) | ( | ) | ( | ) | ( | ) | |
At December 31 | |||||||||||
Carrying amount at December 31 | |||||||||||
The carrying amount of property, plant and equipment at December 31, 2019, included $27,779 million (2018: $33,451 million) of assets under construction. This amount excludes exploration and evaluation assets. The carrying amount at December 31, 2019, also included $1,401 million of assets classified as held for sale (2018: $705 million).
The carrying amount of exploration and production assets at December 31, 2019, included rights and concessions in respect of proved and unproved properties of $14,355 million (2018: $15,860 million). Exploration and evaluation assets principally comprise rights and concessions in respect of unproved properties and capitalised exploration drilling costs.
The carrying amount of assets at December 31, 2019, for which an alternative reserves base was applied in the calculation of the depreciation charge (see Note 2A), was $173 million (2018: $5,838 million). If no alternative reserves base had been used, the pre-tax depreciation charge for the year ended December 31, 2019, would have been $77 million higher (2018: $1,003 million, 2017: $5,558 million).
Contractual commitments for the purchase and lease of property, plant and equipment at December 31, 2019, amounted to $5,519 million. In 2018, the contractual commitments for the purchase of property, plant and equipment amounted to $4,783 million).
FINANCIAL STATEMENTS AND SUPPLEMENTS SHELL ANNUAL REPORT AND FORM 20-F 2019 | 163 | |
Within property, plant and equipment the following amounts relate to leases:
Right-of-use assets | $ million | |||||||||
Exploration and production | ||||||||||
Exploration and evaluation | Production | Manufacturing, supply and distribution | Other | Total | ||||||
Cost | ||||||||||
At January 1 (as previously published) | ||||||||||
Impact of IFRS 16 [A] | ||||||||||
At January 1 (as revised) | ||||||||||
Additions | ||||||||||
Sales, retirements and other movements | ( | ) | ( | ) | ( | ) | ( | ) | ||
Currency translation differences | ( | ) | ||||||||
At December 31 | ||||||||||
Depreciation, depletion and amortisation, including impairments | ||||||||||
At January 1 | ||||||||||
Charge for the year | ||||||||||
Sales, retirements and other movements | ( | ) | ( | ) | ( | ) | ( | ) | ||
Currency translation differences | ||||||||||
At December 31 | ||||||||||
Carrying amount at December 31 | ||||||||||
[A] Up to and including 2018 Shell recognised lease assets and liabilities that were classified as finance leases under IAS 17 Leases (see Note 3).
Impairments | $ million | |||||
2019 | 2018 | 2017 | ||||
Impairment losses [A] | ||||||
Exploration and production | ||||||
Manufacturing, supply and distribution | ||||||
Other | ||||||
Total | ||||||
Impairment reversals [A] | ||||||
Exploration and production | ||||||
Manufacturing, supply and distribution | ||||||
Total | ||||||
[A] See Note 4.
Impairment losses in 2019 were mainly triggered by the revision to Shell's long-term oil and gas price outlook and change to future capital expenditure plans. The impairment losses related primarily to Upstream shale and deep-water properties in North and South America, in Integrated Gas to properties in Australia and in Downstream to the refining portfolio. Impairment losses in 2018 were mainly in Upstream, and principally related to the disposal of Shell’s interests in Norway and Ireland and related to assets in the Gulf of Mexico. Impairment reversals in 2018 were mainly related to assets in North America. Impairment losses in 2017 were mainly in Upstream, and principally related to the disposal of interests in Canada and interests in Ireland classified as held for sale.
For impairment testing purposes, the respective carrying amounts of property, plant and equipment and intangible assets were compared with their value in use. Cash flow projections used in the determination of value in use were made using management’s forecasts of commodity prices, market supply and demand, potential costs associated with operational GHG emissions, product margins including forecast refining margins and expected production volumes (see Note 2A). These cash flows were adjusted for the risks specific to the assets, and therefore these risks were not included in the determination of the discount rate applied. The nominal pre-tax rate applied in 2019 was 6 % (2018: 6 %; 2017: 6 %).
Oil and gas price assumptions applied for impairment testing are reviewed and, where necessary, adjusted on a periodic basis. Reviews include comparison with available market data and forecasts that reflect developments in demand such as global economic growth, technology efficiency, policy measures and, in supply, consideration of investment and resource potential, cost of development of new supply, and behaviour of major resource holders. The near-term commodity price assumptions applied in impairment testing in 2019 were as follows:
Commodity price assumptions [A] | ||||||
2020 | 2021 | 2022 | ||||
Brent crude oil ($/b) | ||||||
Henry Hub natural gas ($/MMBtu) | ||||||
[A] Money of the day.
FINANCIAL STATEMENTS AND SUPPLEMENTS SHELL ANNUAL REPORT AND FORM 20-F 2019 | 164 | |
For periods after 2022, the real terms long-term price assumptions applied were $60 per barrel (/b) (2018: $70 /b after 2021) for Brent crude oil and $3.00 per million British thermal units (/MMBtu) (2018: $3.50 /MMBtu after 2021) for Henry Hub natural gas.
Capitalised exploration drilling costs | $ million | |||||
2019 | 2018 | 2017 | ||||
At January 1 | ||||||
Additions pending determination of proved reserves | ||||||
Amounts charged to expense | ( | ) | ( | ) | ( | ) |
Reclassifications to productive wells on determination of proved reserves | ( | ) | ( | ) | ( | ) |
Other movements | ( | ) | ( | ) | ||
At December 31 | ||||||
Projects | Wells | ||||||
Number | $ million | Number | $ million | ||||
Between 1 and 5 years | |||||||
Between 6 and 10 years | |||||||
Between 11 and 15 years | |||||||
Between 16 and 20 years | |||||||
Total | |||||||
Exploration drilling costs capitalised for periods greater than one year at December 31, 2019, analysed according to the most recent year of activity, are presented in the table above. They comprise $284 million relating to five projects where drilling activities were under way or firmly planned for the future, and $4,109 million relating to 55 projects awaiting development concepts.
9 - JOINT VENTURES AND ASSOCIATES
Shell share of comprehensive income of joint ventures and associates | $ million | |||||||||||||||||||
2019 | 2018 | 2017 | ||||||||||||||||||
Joint ventures | Associates | Total | Joint ventures | Associates | Total | Joint ventures | Associates | Total | ||||||||||||
Income for the period | ||||||||||||||||||||
Other comprehensive (loss)/income for the period | ( | ) | ( | ) | ||||||||||||||||
Comprehensive income for the period | ||||||||||||||||||||
Carrying amount of interests in joint ventures and associates | $ million | ||||||||||||
Dec 31, 2019 | Dec 31, 2018 | ||||||||||||
Joint ventures | Associates | Total | Joint ventures | Associates | Total | ||||||||
Net assets | |||||||||||||
Transactions with joint ventures and associates | $ million | |||||
2019 | 2018 | 2017 | ||||
Sales and charges to joint ventures and associates | ||||||
Purchases and charges from joint ventures and associates | ||||||
These transactions principally comprise sales and purchases of goods and services in the ordinary course of business. Related balances outstanding at December 31, 2019, and 2018, are presented in Notes 11 and 15.
Other arrangements in respect of joint ventures and associates | $ million | |||
Dec 31, 2019 | Dec 31, 2018 | |||
Commitments to make purchases from joint ventures and associates [A] | [B] | |||
Commitments to provide debt or equity funding to joint ventures and associates | ||||
[A] Commitments to make purchases from joint ventures and associates mainly relate to contracts associated with LNG processing fees and transportation capacity. Shell has other purchase obligations related to joint ventures and associates that are not fixed or determinable and are principally intended to be resold in a short period of time through sales agreements with third parties. These include long-term LNG and natural gas purchase commitments and commitments to purchase refined products or crude oil at market prices.
[B] As revised to include commitments of $569 million.
FINANCIAL STATEMENTS AND SUPPLEMENTS SHELL ANNUAL REPORT AND FORM 20-F 2019 | 165 | |
10 - INVESTMENTS IN SECURITIES
Investment in securities | $ million | |||
Dec 31, 2019 | Dec 31, 2018 | |||
Equity securities: | ||||
Equity securities at fair value through other comprehensive income | ||||
Debt securities: | ||||
Debt securities at amortised cost | ||||
Debt securities at fair value through other comprehensive income | ||||
Debt securities at fair value through profit and loss | ||||
Total | ||||
At fair value | ||||
Measured by reference to prices in active markets for identical assets | ||||
Measured using predominantly unobservable inputs | ||||
Total | ||||
At cost | ||||
Total | ||||
Equity securities at December 31, 2019, principally comprised interests below 5 %, in various investments. Debt securities principally comprised a portfolio required to be held by the Company’s internal insurance entities as security for their activities.
Investments in securities measured using predominantly unobservable inputs [A] | $ million | |||
2019 | 2018 | |||
At January 1 | ||||
(Losses)/Gains recognised in other comprehensive income | ( | ) | ||
Other movements | ( | ) | ||
At December 31 | ||||
11 - TRADE AND OTHER RECEIVABLES
$ million | |||||||||
Dec 31, 2019 | Dec 31, 2018 | ||||||||
Current | Non-current | Current | Non-current | ||||||
Trade receivables | — | — | |||||||
Lease receivables [A] | |||||||||
Other receivables [A] | |||||||||
Amounts due from joint ventures and associates | |||||||||
Prepayments and deferred charges | |||||||||
Total | |||||||||
[A] In 2018 'Lease receivables' were included in 'Other receivables'.
The fair value of financial assets included above approximates the carrying amount and was determined from predominantly unobservable inputs.
Other receivables at December 31, 2019, include receivables from certain governments in their capacity as joint arrangement partners, of $1,209 million (2018: $1,449 million), after provisions for impairments, that are overdue in part or in full. Recoverability and timing thereof is subject to uncertainty, however, the ultimate risk of default on the carrying amount is considered to be low. Other receivables also include income tax and other tax receivables (see Note 16).
Provisions for impairments deducted from trade and other receivables amounted to $649 million at December 31, 2019 (2018: $790 million).
Shell uses a provision matrix to calculate expected credit losses ("ECLs") for trade receivables. The provision matrix is initially based on Shell’s historical observed default rates. Shell calculates the ECL to adjust the historical credit loss experienced with forward-looking information. The ECL at December 31, 2019 is $83 million (2018: $23 million) which represents 0.08 %-0.27 % of all trade receivables.
A loss allowance provision of $193 million (2018: $243 million) was established, in addition to all other impairments to trade receivables as at December 31, 2019, that are outside of the provision matrix calculations.
Lease receivables
Lease contracts where Shell is the lessor are classified as finance lease or operating lease. Receivables for lease contracts classified as finance leases are as follows:
166 | ||
Finance lease | $ million | ||||
Dec 31, 2019 | |||||
Less than one year | |||||
Between 1 and 5 years | |||||
5 years and later | |||||
Total undiscounted lease payments receivable | |||||
Unearned finance income | |||||
Net investment in the lease | |||||
In addition at December 31, 2019, Shell is entitled to contractual payments under operating leases of $344 million.
12 - INVENTORIES
$ million | ||||
Dec 31, 2019 | Dec 31, 2018 | |||
Oil, gas and chemicals | ||||
Materials | ||||
Total | ||||
13 - CASH AND CASH EQUIVALENTS
$ million | ||||
Dec 31, 2019 | Dec 31, 2018 | |||
Cash | ||||
Short-term bank deposits | ||||
Money market funds, reverse repos and other cash equivalents | ||||
Total | ||||
Included in cash and cash equivalents at December 31, 2019, were amounts totalling $431 million (2018: $443 million as revised) subject to currency controls or other legal restrictions. Information about credit risk is presented in Note 19.
14 - DEBT AND LEASE ARRANGEMENTS
DEBT | ||||||||||||
Debt | $ million | |||||||||||
Dec 31, 2019 | Dec 31, 2018 | |||||||||||
Debt (excluding lease liabilities) | Lease liabilities [A] | Total | Debt (excluding lease liabilities) | Finance lease liabilities | Total | |||||||
Short-term debt | ||||||||||||
Long-term debt due within 1 year | ||||||||||||
Current debt | ||||||||||||
Non-current debt | ||||||||||||
Total | ||||||||||||
[A] See Note 3.
FINANCIAL STATEMENTS AND SUPPLEMENTS SHELL ANNUAL REPORT AND FORM 20-F 2019 | 167 | |
Net debt | $ million | |||||||||
Current debt | Non-current debt | Derivative financial instruments | Cash and cash equivalents (see Note 13) | Net debt | ||||||
At January 1, 2019 (as previously published) | ( | ) | ( | ) | ( | ) | ( | ) | ||
Impact of IFRS 16 [A] | ( | ) | ( | ) | ( | ) | ||||
At January 1, 2019 (as revised) | ( | ) | ( | ) | ( | ) | ( | ) | ||
Cash flow | ( | ) | ( | ) | ( | ) | ||||
Lease additions | ( | ) | ( | ) | ( | ) | ||||
Other movements [B] | ( | ) | ( | ) | ||||||
Currency translation differences and foreign exchange gains/(losses) | ( | ) | ||||||||
At December 31, 2019 | ( | ) | ( | ) | ( | ) | ( | ) | ||
At January 1, 2018 | ( | ) | ( | ) | ( | ) | ( | ) | ||
Cash flow | ( | ) | ||||||||
Finance lease additions | ( | ) | ( | ) | ( | ) | ||||
Other movements | ( | ) | ( | ) | ||||||
Currency translation differences and foreign exchange gains/(losses) | ( | ) | ( | ) | ( | ) | ||||
At December 31, 2018 | ( | ) | ( | ) | ( | ) | ( | ) | ||
[A] See Note 3
[B] 'Other movements' includes $1,618 million relating to existing leases entered into on behalf of certain joint operations.
Management’s financial strategy is to manage Shell’s assets and liabilities with the aim that, across the business cycle, 'cash in' at least equals 'cash out' while maintaining a strong balance sheet.
Gearing is a key measure of Shell’s capital structure and is defined as net debt as a percentage of total capital. Net debt is defined as the sum of current and non-current debt, less cash and cash equivalents, adjusted for the fair value of derivative financial instruments used to hedge foreign exchange and interest rate risks relating to debt, and associated collateral balances. Across the business cycle, management aims to return to a gearing level within a range of 15 %-25 %.
Gearing | $ million, except where indicated | |||||
Dec 31, 2019 | Dec 31, 2018 [A] | |||||
Net debt | ||||||
Total equity | ||||||
Total capital | ||||||
Gearing | % | [B] | % | |||
[A] Shell used the modified retrospective transition method for implementing IFRS 16 Leases (see Note 3). Comparative information was not restated, and continues to be presented as previously reported under IAS 17 Leases.
[B] Gearing increased to 29.3 %, at December 31, 2019, comparable with 25.0 % on an IAS 17 basis (2018: 20.3 %).
Management’s priorities for applying Shell’s cash are the servicing and reduction of debt commitments, payment of dividends, followed by a balance of capital investment and share buybacks. Management’s policy is to grow the dollar dividend through time, in line with its view of Shell’s underlying earnings and cash flow.
Shell has access to international debt capital markets via two commercial paper ("CP") programmes, a Euro medium-term note ("EMTN") programme and a US universal shelf ("US shelf") registration. Issuances under the CP programmes are supported by a committed credit facility and cash.
Borrowing facilities and amounts undrawn | $ million | ||||||||
Facility | Amount undrawn | ||||||||
Dec 31, 2019 | Dec 31, 2018 | Dec 31, 2019 | Dec 31, 2018 | ||||||
CP programmes | |||||||||
EMTN programme | unlimited | unlimited | N/A | N/A | |||||
US shelf registration | unlimited | unlimited | N/A | N/A | |||||
Committed credit facilities | |||||||||
Under the CP programmes, Shell can issue debt of up to $10 billion with maturities not exceeding 270 days and $10 billion with maturities not exceeding 397 days. The EMTN programme is updated each year, most recently in July 2019. In 2019, debt issued under this programme amounted to $3 billion (2018: $nil ). The US shelf registration provides Shell with the flexibility to issue debt securities, ordinary shares, preferred shares and warrants. The registration is updated every three years and was last updated in December 2017. During 2019, debt totalling $4 billion (2018: $3 billion) was issued under the registration. On December 13, 2019, Shell entered into $10 billion revolving credit facilities, which in anticipation of the LIBOR reform (see Note 2B), were linked to the new Secured Overnight Financing Rate ("SOFR"). Under the terms of the facilities, the LIBOR interest rate will be replaced by SOFR as early as the first
FINANCIAL STATEMENTS AND SUPPLEMENTS SHELL ANNUAL REPORT AND FORM 20-F 2019 | 168 | |
anniversary of the signing date of these revolving credit facilities. The committed credit facilities are available at pre-agreed margins, with $2 billion expiring in 2020 and $8 billion expiring in 2024. Each facility includes two one-year extension options at the discretion of each lender. The terms and availability are not conditional on Shell’s financial ratios nor its financial credit ratings. The interest and fees paid on both facilities are linked to Shell’s progress towards reaching its short-term Net Carbon Footprint intensity target.
In addition, other subsidiaries have access to undrawn short-term bank facilities totalling $2,784 million at December 31, 2019 (2018: $3,035 million).
The following tables compare contractual cash flows for debt excluding lease liabilities at December 31, with the carrying amount in the Consolidated Balance Sheet. Contractual amounts reflect the effects of changes in foreign exchange rates; differences from carrying amounts reflect the effects of discounting, premiums and, where fair value hedge accounting is applied, fair value adjustments. Interest is estimated assuming interest rates applicable to variable rate debt remain constant and there is no change in aggregate principal amounts of debt other than repayment at scheduled maturity, as reflected in the table.
2019 | $ million | |||||||||||||||||
Contractual payments | ||||||||||||||||||
Less than 1 year | Between 1 and 2 years | Between 2 and 3 | Between 3 and 4 years | Between 4 and 5 years | 5 years and later | Total | Difference from carrying amount | Carrying amount | ||||||||||
Commercial paper | ( | ) | ||||||||||||||||
Bonds | ||||||||||||||||||
Bank and other borrowings | ||||||||||||||||||
Total (excluding interest) | ||||||||||||||||||
Interest | ||||||||||||||||||
2018 | $ million | |||||||||||||||||
Contractual payments | ||||||||||||||||||
Less than 1 year | Between 1 and 2 years | Between 2 and 3 | Between 3 and 4 years | Between 4 and 5 years | 5 years and later | Total | Difference from carrying amount | Carrying amount | ||||||||||
Bonds | ||||||||||||||||||
Bank and other borrowings | ||||||||||||||||||
Total (excluding interest) | ||||||||||||||||||
Interest | ||||||||||||||||||
Interest rate swaps have been entered into against certain fixed rate debt affecting the effective interest rate on these balances (see Note 19).
The fair value of debt excluding lease liabilities at December 31, 2019, was $71,163 million (2018: $64,708 million), mainly determined from the prices quoted for those securities.
LEASE ARRANGEMENTS
From January 1, 2019, leases are recognised as a right-of-use asset (see Note 8) and a corresponding liability at the date which the lease asset is available for the use by Shell (see Note 3). Lease liabilities are secured on the leased assets. Shell has lease contracts in Upstream and Integrated Gas for floating production storage and offloading units, subsea equipment, power generation for drilling and ancillary equipment, service vessels, LNG vessels and land and buildings; in Downstream, principally for tankers, storage capacity and retail sites; and in Corporate, principally for land and buildings.
Lease expenses not included in the measurement of lease liability | $ million | ||||
2019 | |||||
Expense relating to short-term leases | |||||
Expense relating to variable lease payments not included in the lease liabilities | |||||
The total cash outflow in respect of leases representing repayment of principal and payment of interest in 2019 was $7,866 million, recognised in the Consolidated Statement of Cash Flows from financing activities.
The future lease payments under lease contracts and the present value of future lease payments at December 31, by payment date are as follows:
FINANCIAL STATEMENTS AND SUPPLEMENTS SHELL ANNUAL REPORT AND FORM 20-F 2019 | 169 | |
2019 | $ million | |||||||
Contractual lease payments | Interest | Lease liabilities [A] | ||||||
Less than 1 year | ||||||||
Between 1 and 5 years | ||||||||
5 years and later | ||||||||
Total | [B] | |||||||
[A] See Note 3.
[B] Future cash outflows in respect of leases may differ from lease liabilities recognised due to future decisions that may be taken by Shell in respect of the use of leased assets. These decisions may result in variable lease payments to be made. In addition, Shell may reconsider whether it will exercise extension options or termination options, where future reconsideration is not reflected in the lease liabilities. There is no exposure to these potential additional payments in excess of the recognised lease liabilities until these decisions have been taken by Shell.
2018 | $ million | ||||||||
Finance leases [A] | Operating leases [A] | ||||||||
Future minimum lease payments | Interest | Present value of future minimum lease payments | Future minimum lease payments | ||||||
Less than 1 year | |||||||||
Between 1 and 5 years | |||||||||
5 years and later | |||||||||
Total | |||||||||
[A] Shell used the modified retrospective transition method for the adoption of IFRS 16 Leases (see Note 3). Comparative information is not restated and continues to be presented as previously reported under IAS 17 Leases.
15 - TRADE AND OTHER PAYABLES
$ million | ||||||||
Dec 31, 2019 | Dec 31, 2018 | |||||||
Current | Non-current | Current | Non-current | |||||
Trade payables | ||||||||
Other payables | ||||||||
Amounts due to joint ventures and associates | ||||||||
Accruals and deferred income | ||||||||
Total | ||||||||
The fair value of financial liabilities included above approximates the carrying amount and was determined from predominantly unobservable inputs.
Other payables include amounts due to joint arrangement partners and in respect of other project-related items.
Information about offsetting, collateral and liquidity risk is presented in Note 19.
16 - TAXATION
Taxation charge | $ million | ||||||
2019 | 2018 | 2017 | |||||
Current tax: | |||||||
Charge in respect of current period | |||||||
Adjustments in respect of prior periods | ( | ) | ( | ) | |||
Total | |||||||
Deferred tax: | |||||||
Relating to the origination and reversal of temporary differences, tax losses and credits | ( | ) | |||||
Relating to changes in tax rates and legislation | ( | ) | ( | ) | [A] | ||
Adjustments in respect of prior periods | ( | ) | |||||
Total | ( | ) | |||||
Total taxation charge | |||||||
[A] Mainly in respect of the US Tax Cuts and Jobs Act.
FINANCIAL STATEMENTS AND SUPPLEMENTS SHELL ANNUAL REPORT AND FORM 20-F 2019 | 170 | |
Adjustments in respect of prior periods relate to events in the current period and reflect the effects of changes in rules, facts or other factors compared with those used in establishing the current tax position or deferred tax balance in prior periods.
Reconciliation of applicable tax charge at statutory tax rates to taxation charge | $ million | |||||
2019 | 2018 | 2017 | ||||
Income before taxation | ||||||
Less: share of profit of joint ventures and associates | ( | ) | ( | ) | ( | ) |
Income before taxation and share of profit of joint ventures and associates | ||||||
Applicable tax charge at standard statutory tax rates [A] | ||||||
Adjustments in respect of prior periods | ( | ) | ||||
Tax effects of: [B] | ||||||
Expenses not deductible for tax purposes | ||||||
Derecognition/(recognition) of deferred tax assets | ( | ) | ( | ) | ||
Incentives for investment and development [A] | ( | ) | ( | ) | ( | ) |
Disposals | ( | ) | ( | ) | ( | ) |
Income not subject to tax at standard statutory rates | ( | ) | ( | ) | ||
Changes in tax rates and legislation | ( | ) | ( | ) | ||
Exchange rate differences | ( | ) | ||||
Other reconciling items | ( | ) | ||||
Taxation charge | ||||||
[A] Incentives for investment and development include conditional preferential tax rates to attract investment, uplift on carried forward losses and capital expenditure, investment tax allowances and credits for research and development. Up to and including 2018, preferential tax rates were reported within the applicable tax charge at standard statutory tax rates. Comparative numbers for 2018 and 2017 were reclassified to conform with the current year presentation.
[B] The tax effect categories have changed to provide better insights. Comparative numbers for 2018 and 2017 were reclassified to conform with the current year presentation.
The weighted average of statutory tax rates was 33 % in 2019 (2018: 37 % as revised; 2017: 34 % as revised). Compared with 2018, the decrease in the rate reflects a higher proportion of earnings in the Downstream and Integrated Gas segments, subject to relatively lower tax rates than earnings in the Upstream segment. In addition, a higher proportion of Integrated Gas income was earned in countries with relatively lower statutory tax rates.
Taxes payable | $ million | |||
Dec 31, 2019 | Dec 31, 2018 | |||
Income taxes | ||||
Sales taxes, excise duties and similar levies | ||||
Total | ||||
Included in other receivables at December 31, 2019 was income tax receivable of $1,328 million (2018: $1,042 million) (see Note 11).
FINANCIAL STATEMENTS AND SUPPLEMENTS SHELL ANNUAL REPORT AND FORM 20-F 2019 | 171 | |
2019 - Deferred tax | $ million | |||||||||||
Deferred tax asset | Decommissioning and other provisions | Property, plant and equipment | Tax losses and credits carried forward | Retirement benefits | Other | Total | ||||||
At January 1, 2019 (as previously published) | ||||||||||||
Impact of IFRS 16 | ( | ) | ||||||||||
At January 1, 2019 (as revised) | ||||||||||||
(Charge)/credit to income | ( | ) | ( | ) | ( | ) | ( | ) | ||||
Currency translation differences | ( | ) | ( | ) | ||||||||
Other | ( | ) | ( | ) | ( | ) | ||||||
At December 31, 2019 | ||||||||||||
Deferred tax liability | ||||||||||||
At January 1, 2019 (as previously published) | ( | ) | ( | ) | ( | ) | ( | ) | ||||
Impact of IFRS 16 | ( | ) | ||||||||||
At January 1, 2019 (as revised) | ( | ) | ( | ) | ( | ) | ( | ) | ||||
(Charge)/credit to income | ( | ) | ( | ) | ( | ) | ||||||
Currency translation differences | ( | ) | ( | ) | ( | ) | ( | ) | ||||
Other | ( | ) | ( | ) | ||||||||
At December 31, 2019 | ( | ) | ( | ) | ( | ) | ( | ) | ||||
Net deferred tax liability at December 31, 2019 | ( | ) | ||||||||||
Deferred tax asset/liability as presented in the balance sheet at December 31, 2019 | ||||||||||||
Deferred tax asset | ||||||||||||
Deferred tax liability | ( | ) | ||||||||||
2018 - Deferred tax | $ million | |||||||||||
Deferred tax asset | Decommissioning and other provisions | Property, plant and equipment | Tax losses and credits carried forward | Retirement benefits | Other | Total | ||||||
At January 1, 2018 | ||||||||||||
(Charge)/credit to income | ( | ) | ||||||||||
Currency translation differences | ( | ) | ( | ) | ( | ) | ( | ) | ( | ) | ( | ) |
Other | ( | ) | ( | ) | ( | ) | ( | ) | ||||
At December 31, 2018 | ||||||||||||
Deferred tax liability | ||||||||||||
At January 1, 2018 | ( | ) | ( | ) | ( | ) | ( | ) | ||||
(Charge)/credit to income | ( | ) | ( | ) | ||||||||
Currency translation differences | ||||||||||||
Other | ( | ) | ( | ) | ( | ) | ||||||
At December 31, 2018 | ( | ) | ( | ) | ( | ) | ( | ) | ||||
Net deferred tax liability at December 31, 2018 | ( | ) | ||||||||||
Deferred tax asset/liability as presented in the balance sheet at December 31, 2018 | ||||||||||||
Deferred tax asset | ||||||||||||
Deferred tax liability | ( | ) | ||||||||||
The presentation in the balance sheet takes into consideration the offsetting of deferred tax assets and deferred tax liabilities within the same tax jurisdiction, where this is permitted. The overall deferred tax position in a particular tax jurisdiction determines if a deferred tax balance related to that jurisdiction is presented within deferred tax assets or deferred tax liabilities.
Other movements in deferred tax assets and liabilities principally relate to acquisitions, sales of non-current assets and businesses, and amounts recognised in other comprehensive income.
The deferred tax category 'Other' primarily includes deferred tax positions in respect of leases, financial assets and liabilities, inventories, intangible assets and investments in subsidiaries, joint ventures and associates.
FINANCIAL STATEMENTS AND SUPPLEMENTS SHELL ANNUAL REPORT AND FORM 20-F 2019 | 172 | |
The amount of deferred tax assets dependent on future taxable profits not arising from the reversal of existing deferred tax liabilities, and which relate to tax jurisdictions where Shell has suffered a loss in the current or preceding year, was $8,773 million at December 31, 2019 (2018: $9,979 million). It is considered probable based on business forecasts that such profits will be available.
Unrecognised taxable temporary differences associated with undistributed retained earnings of investments in subsidiaries, joint ventures and associates amounted to $6,356 million at December 31, 2019 (2018: $3,951 million). These retained earnings are subject to withholding tax upon distribution. The increase of the amount compared with 2018 is related to a change in the withholding tax legislation, as a result of which a larger part of the undistributed retained earnings will be subject to withholding tax.
Unrecognised deductible temporary differences, unused tax losses and credits carried forward amounted to $33,068 million at December 31, 2019 (2018: $30,010 million as revised) including amounts of $24,295 million (2018: $22,704 million as revised) that are subject to time limits for utilisation of five years or later, or are not time limited.
Futhermore, there are unrecognised losses for Petroleum Resource Rent Tax ("PRRT") in Australia, amounting to $36,905 million as at the end of the most recent PRRT fiscal year (June 30, 2019). In 2018, a portion of the PRRT losses amounting to $4,900 million was included in the amount of the unrecognised deductible temporary differences, unused tax losses and credits carried forward. Based on business forecasts at existing commodity price levels, and the annual augmentation of the unused PRRT losses, this amount is expected to increase in the near future.
17 - RETIREMENT BENEFITS
Retirement benefits are provided through a number of funded and unfunded defined benefit plans and defined contribution plans, the most significant of which are in the Netherlands, UK and USA. Benefits comprise principally pensions; retirement healthcare and life insurance are also provided in certain countries.
Retirement benefit expense | $ million | |||||
2019 | 2018 | 2017 | ||||
Defined benefit plans: | ||||||
Current service cost, net of plan participants’ contributions | ||||||
Interest expense on obligations | ||||||
Interest income on plan assets | ( | ) | ( | ) | ( | ) |
Other | ( | ) | ( | ) | ||
Total | ||||||
Defined contribution plans | ||||||
Total retirement benefit expense | ||||||
Retirement benefit expense is presented principally within production and manufacturing expenses and selling, distribution and administrative expenses in the Consolidated Statement of Income. Interest income on plan assets is calculated using the same rate as that applied to the related defined benefit obligations for each plan to determine interest expense.
Remeasurements | $ million | |||||
2019 | 2018 | 2017 | ||||
Actuarial gains/(losses) on obligations: | ||||||
Due to changes in financial assumptions [A] | ( | ) | ( | ) | ||
Due to experience adjustments [B] | ( | ) | ||||
Due to changes in demographic assumptions [C] | ( | ) | ( | ) | ||
Total | ( | ) | ( | ) | ||
Return on plan assets in excess/(shortage) of interest income | ( | ) | ||||
Other movements | ( | ) | ||||
Total remeasurements | ( | ) | ||||
[A] Primarily relates to changes in the discount rate assumptions.
[B] Experience adjustments arise from differences between the actuarial assumptions made in respect of the year and actual outcomes.
[C] Primarily relates to updates in mortality assumptions.
Defined benefit plans | $ million | |||
December 31, 2019 | December 31, 2018 | |||
Obligations | ( | ) | ( | ) |
Plan assets | ||||
Net liability | ( | ) | ( | ) |
Retirement benefits in the Consolidated Balance Sheet: | ||||
Non-current assets | ||||
Non-current liabilities | ( | ) | ( | ) |
Current liabilities | ( | ) | ( | ) |
Total | ( | ) | ( | ) |
FINANCIAL STATEMENTS AND SUPPLEMENTS SHELL ANNUAL REPORT AND FORM 20-F 2019 | 173 | |
Defined benefit plan obligations | $ million, except where indicated | |||
2019 | 2018 | |||
At January 1 | ||||
Current service cost | ||||
Interest expense | ||||
Actuarial losses/(gains) | ( | ) | ||
Benefit payments | ( | ) | ( | ) |
Other movements | ( | ) | ||
Currency translation differences | ( | ) | ||
At December 31 | ||||
Comprising: | ||||
Funded pension plans | ||||
Weighted average duration | ||||
Unfunded pension plans | ||||
Weighted average duration | ||||
Other unfunded plans | ||||
Weighted average duration | ||||
Defined benefit plan assets | $ million, except where indicated | |||
2019 | 2018 | |||
At January 1 | ||||
Return on plan assets in excess/(shortage) of interest income | ( | ) | ||
Interest income | ||||
Employer contributions | ||||
Plan participants’ contributions | ||||
Benefit payments | ( | ) | ( | ) |
Other movements | ( | ) | ||
Currency translation differences | ( | ) | ||
At December 31 | ||||
Comprising: | ||||
Quoted in active markets: | ||||
Equities | % | % | ||
Debt securities | % | % | ||
Real estate | % | % | ||
Other | % | % | ||
Other: | ||||
Equities | % | % | ||
Debt securities | % | % | ||
Real estate | % | % | ||
Investment funds | % | % | ||
Cash | % | % | ||
Long-term investment strategies of plans are generally determined by the relevant pension plan trustees using a structured asset/liability modelling approach to define the asset mix that best meets the objectives of optimising returns within agreed risk levels while maintaining adequate funding levels.
Employer contributions to defined benefit pension plans are based on actuarial valuations in accordance with local regulations and are estimated to be $0.7 billion in 2020.
Significant funding requirements:
• | Additional contributions to the Netherlands defined benefit pension plan would be required if the 12-month rolling average local funding percentage falls below |
• | There are no set minimum statutory funding requirements for the UK plans. Under an agreement with the trustee of the main UK defined benefit plan, Shell will provide additional contributions if the funding position falls below a certain level, although this is currently not anticipated; and |
• | Under the Pension Protection Act, US pension plans are subject to minimum required contribution levels based on the funding position. No contributions are required based on the most recent funding valuation. |
The principal assumptions applied in determining the present value of defined benefit obligations and their bases were as follows:
• | rates of increase in pensionable remuneration, pensions in payment and healthcare costs: historical experience and management’s long-term expectation; |
• | discount rates: prevailing long-term AA corporate bond yields, chosen to match the currency and duration of the relevant obligation; and |
• | mortality rates: published standard mortality tables for the individual countries concerned adjusted for Shell experience where statistically significant. |
The weighted averages for those assumptions and related sensitivity information at December 31 are presented below. Sensitivity information indicates by how much the defined benefit obligations would increase or decrease if a given assumption were to increase or decrease with no change in other assumptions.
FINANCIAL STATEMENTS AND SUPPLEMENTS SHELL ANNUAL REPORT AND FORM 20-F 2019 | 174 | |
$ million, except where indicated | |||||||||||||||
Effect of using alternative assumptions | |||||||||||||||
Assumptions used | Increase/(decrease) in defined benefit obligations | ||||||||||||||
2019 | 2018 | Range of assumptions | 2019 | 2018 | |||||||||||
Rate of increase in pensionable remuneration | % | % | -1% to +1% | ( | ) | to | ( | ) | to | ||||||
Rate of increase in pensions in payment | % | % | -1% to +1% | ( | ) | to | ( | ) | to | ||||||
Rate of increase in healthcare costs | % | % | -1% to +1% | ( | ) | to | ( | ) | to | ||||||
Discount rate for pension plans | % | % | -1% to +1% | to | ( | ) | to | ( | ) | ||||||
Discount rate for healthcare plans | % | % | -1% to +1% | to | ( | ) | to | ( | ) | ||||||
Expected age at death for persons aged 60: | |||||||||||||||
Men | -1 year to +1 year | ( | ) | to | ( | ) | to | ||||||||
Women | -1 year to +1 year | ( | ) | to | ( | ) | to | ||||||||
FINANCIAL STATEMENTS AND SUPPLEMENTS SHELL ANNUAL REPORT AND FORM 20-F 2019 | 175 | |
18 - DECOMMISSIONING AND OTHER PROVISIONS
$ million | ||||||||||||||
Decommissioning and restoration | Legal | Environmental | Redundancy | Other | Total | |||||||||
At January 1, 2019 | ||||||||||||||
Current (as previously published) | ||||||||||||||
Impact of IFRS 16 [A] | ( | ) | ( | ) | ( | ) | ||||||||
Current (as revised) | ||||||||||||||
Non-current (as previously published) | ||||||||||||||
Impact of IFRS 16 [A] | ( | ) | ( | ) | ( | ) | ||||||||
Non-current (as revised) | ||||||||||||||
Additions | ||||||||||||||
Amounts charged against provisions | ( | ) | ( | ) | ( | ) | ( | ) | ( | ) | ( | ) | ||
Accretion expense | ||||||||||||||
Disposals | ( | ) | [B] | ( | ) | ( | ) | ( | ) | |||||
Remeasurements and other movements | ( | ) | ( | ) | ( | ) | ( | ) | [C] | |||||
Currency translation differences | ( | ) | ( | ) | ( | ) | ||||||||
( | ) | ( | ) | ( | ) | |||||||||
At December 31, 2019 | ||||||||||||||
Current | ||||||||||||||
Non-current | ||||||||||||||
At January 1, 2018 | ||||||||||||||
Current | ||||||||||||||
Non-current | ||||||||||||||
Additions | ||||||||||||||
Amounts charged against provisions | ( | ) | ( | ) | ( | ) | ( | ) | ( | ) | ( | ) | ||
Accretion expense | ||||||||||||||
Disposals | ( | ) | ( | ) | ( | ) | ( | ) | ( | ) | ( | ) | ||
Remeasurements and other movements | ( | ) | ( | ) | ( | ) | ( | ) | ( | ) | ( | ) | ||
Currency translation differences | ( | ) | ( | ) | ( | ) | ( | ) | ( | ) | ( | ) | ||
( | ) | ( | ) | ( | ) | ( | ) | ( | ) | ( | ) | |||
At December 31, 2018 | ||||||||||||||
Current | ||||||||||||||
Non-current | ||||||||||||||
[A] Following the implementation of IFRS 16 Leases (see Note 3) provisions related to onerous operating lease contracts at December 31, 2018 were derecognised and related right-of-use assets were adjusted accordingly. Certain operating lease contracts, mainly related to office buildings became onerous following restructuring and these onerous operating lease contracts were included in the provision for redundancy.
[B] Mainly related to the disposal of interests in Denmark and Canada.
[C] Mainly related to reclassifications to Trade and other payables.
The amount and timing of settlement in respect of these provisions are uncertain and dependent on various factors that are not always within management’s control. Reviews of estimated future decommissioning and restoration costs and the discount rate applied are carried out annually. The discount rate applied at December 31, 2019 was 3 % (December 31, 2018: 4 %). This decrease resulted from the decrease in capital markets rates in 2019.
In 2019, there was an increase of $2,241 million (2018:$nil ) in the decommissioning and restoration provision as a result of the change in the discount rate, partly offset by a decrease in the provision resulting from changes in cost estimates of $545 million (2018: $982 million), reported within re-measurements and other movements.
Of the decommissioning and restoration provision at December 31, 2019, an estimated $2,869 million is expected to be utilised within one to five years, $2,432 million within six to 10 years, and the remainder in later periods.
Other provisions include amounts recognised in respect of employee benefits.
FINANCIAL STATEMENTS AND SUPPLEMENTS SHELL ANNUAL REPORT AND FORM 20-F 2019 | 176 | |
19 - FINANCIAL INSTRUMENTS
Financial instruments in the Consolidated Balance Sheet include investments in securities (see Note 10), cash and cash equivalents (see Note 13), debt (see Note 14) and derivative contracts.
RISKS
In the normal course of business, financial instruments of various kinds are used for the purposes of managing exposure to interest rate, foreign exchange and commodity price movements.
Treasury standards are applicable to all subsidiaries and each subsidiary is required to adopt a treasury policy consistent with these standards. These policies cover: financing structure; interest rate and foreign exchange risk management; insurance; counterparty risk management; and use of derivative contracts. Wherever possible, treasury operations are carried out through specialist regional organisations without removing from each subsidiary the responsibility to formulate and implement appropriate treasury policies.
Apart from forward foreign exchange contracts to meet known commitments, the use of derivative contracts by most subsidiaries is not permitted by their treasury policy.
Other than in exceptional cases, the use of external derivative contracts is confined to specialist trading and central treasury organisations that have appropriate skills, experience, supervision, control and reporting systems.
Shell’s operations expose it to market, credit and liquidity risk, as described below.
Market risk
Market risk is the possibility that changes in interest rates, foreign exchange rates or the prices of crude oil, natural gas, LNG, refined products, chemical feedstocks, power and carbon-emission rights will adversely affect the value of assets, liabilities or expected future cash flows.
Interest rate risk
Most debt is raised from central borrowing programmes. Shell’s policy continues to be to have debt principally denominated in dollars and to maintain a largely floating interest rate exposure profile; however, Shell has issued a significant amount of fixed rate debt in recent years, taking advantage of historically low interest rates available in debt markets. As a result, a substantial portion of the debt portfolio at December 31, 2019, is at fixed rates and this reduces Shell’s exposure to the dollar LIBOR interest rate (see Note 2B).
The financing of most subsidiaries is structured on a floating-rate basis, and any further interest rate risk management is only applied under exceptional circumstances.
On the basis of the floating-rate net debt position at December 31, 2019 (both issued and hedged), and assuming other factors (principally foreign exchange rates and commodity prices) remained constant and that no further interest rate management action was taken, an increase in interest rates of 1 % would have decreased 2019 income before taxation by $98 million (2018: $37 million, based on the floating rate position at December 31, 2018).
The carrying amounts and maturities of debt and borrowing facilities are presented in Note 14. Interest expense is presented in Note 6.
Foreign exchange risk
Many of the markets in which Shell operates are priced, directly or indirectly, in dollars. As a result, the functional currency of most Integrated Gas and Upstream entities and those with significant cross-border business is the dollar. For Downstream entities, the functional currency is typically the local currency. Consequently, Shell is exposed to varying levels of foreign exchange risk when an entity enters into transactions that are not denominated in its functional currency, when foreign currency monetary assets and liabilities are translated at the balance sheet date and as a result of holding net investments in operations that are not dollar-functional. Each entity is required to adopt treasury policies that are designed to measure and manage its foreign exchange exposures by reference to its functional currency.
Foreign exchange gains and losses arise in the normal course of business from the recognition of receivables and payables and other monetary items in currencies other than an entity’s functional currency. Foreign exchange risk may also arise in connection with capital expenditure. For major projects, an assessment is made at the final investment decision stage whether to hedge any resulting exposure.
Assuming other factors (principally interest rates and commodity prices) remained constant and that no further foreign exchange risk management action were taken, a 10 % appreciation against the dollar at December 31 of the main currencies to which Shell is exposed would have the following effects:
$ million | |||||||||
Increase/(decrease) in income before taxation | Increase in net assets | ||||||||
2019 | 2018 | 2019 | 2018 | ||||||
10% appreciation against the dollar of: | |||||||||
Canadian dollar | ( | ) | ( | ) | |||||
Euro | |||||||||
Australian dollar | ( | ) | ( | ) | |||||
Sterling | ( | ) | ( | ) | |||||
The above sensitivity information was calculated by reference to carrying amounts of assets and liabilities at December 31 only. The effect on income before taxation arises in connection with monetary balances denominated in currencies other than an entity’s functional currency; the effect on net assets arises principally from the translation of assets and liabilities of entities that are not dollar-functional.
Foreign exchange gains and losses included in income are presented in Note 5.
FINANCIAL STATEMENTS AND SUPPLEMENTS SHELL ANNUAL REPORT AND FORM 20-F 2019 | 177 | |
Commodity price risk
Certain subsidiaries have a mandate to trade crude oil, natural gas, LNG, refined products, chemical feedstocks, power and carbon-emission rights, and to use commodity derivative contracts (forwards, futures, swaps and options) as a means of managing price and timing risks arising from this trading activity. In effecting these transactions, the entities concerned operate within procedures and policies designed to ensure that risks, including those relating to the default of counterparties, are managed within authorised limits.
Value-at-risk ("VAR") techniques based on variance/covariance or Monte Carlo simulation models are used to make a statistical assessment of the market risk arising from possible future changes in market values over a 1-day holding period and within a 95 % confidence level. The calculation of potential changes in fair value takes into account positions, the history of price movements and the correlation of these price movements. Models are regularly reviewed against actual fair value movements to ensure integrity is maintained. The VAR year-end positions in respect of commodities traded in active markets, which are presented in the table below, are calculated on a diversified basis in order to reflect the effect of offsetting risk within combined portfolios.
Value-at-risk (pre-tax) | $ million | |||
December 31, 2019 | December 31, 2018 | |||
Global oil | ||||
North America gas and power | ||||
Europe gas and power | ||||
Carbon-emission rights | ||||
Credit risk
Policies are in place to ensure that sales of products are made to customers with appropriate creditworthiness. These policies include detailed credit analysis and monitoring of trading partners against counterparty credit limits. Credit information is regularly shared between business and finance functions, with dedicated teams in place to quickly identify and respond to cases of credit deterioration. Mitigation measures are defined and implemented for high-risk business partners and customers, and include shortened payment terms, collateral or other security posting and vigorous collections. In addition, policies limit the amount of credit exposure to any individual financial institution. There are no material concentrations of credit risk, with individual customers or geographically, and there has been no significant level of counterparty default in recent years.
Surplus cash is invested in a range of short-dated, secure and liquid instruments including short-term bank deposits, money market funds, reverse repos and similar instruments. The portfolio of these investments is diversified to avoid concentrating risk in any one instrument, country or counterparty. Management monitors the investments regularly and adjusts the investment portfolio in light of new market information where necessary to ensure credit risk is effectively diversified.
In commodity trading, counterparty credit risk is managed within a framework of credit limits with utilisation being regularly reviewed. Credit risk exposure is monitored and the acceptable level is determined by a credit committee. Credit checks are performed by a department independent of traders, and are undertaken before contractual commitment. Where appropriate, netting arrangements, credit insurance, prepayments and collateral are used to manage specific risks.
Shell routinely enters into offsetting, master netting and similar arrangements with trading and other counterparties to manage credit risk. Where there is a legally enforceable right of offset under such arrangements and Shell has the intention to settle on a net basis or realise the asset and settle the liability simultaneously, the net asset or liability is recognised in the Consolidated Balance Sheet, otherwise assets and liabilities are presented gross. These amounts, as presented net and gross within trade and other receivables, trade and other payables and derivative financial instruments in the Consolidated Balance Sheet at December 31, were as follows:
2019 | $ million | |||||||||||
Amounts offset | Amounts not offset | |||||||||||
Gross amounts before offset | Amounts offset | Net amounts as presented | Cash collateral received/pledged | Other offsetting instruments | Net amounts | |||||||
Assets: | ||||||||||||
Within trade receivables | ||||||||||||
Within derivative financial instruments | ||||||||||||
Liabilities: | ||||||||||||
Within trade payables | ||||||||||||
Within derivative financial instruments | ||||||||||||
FINANCIAL STATEMENTS AND SUPPLEMENTS SHELL ANNUAL REPORT AND FORM 20-F 2019 | 178 | |
2018 | $ million | |||||||||||
Amounts offset | Amounts not offset | |||||||||||
Gross amounts before offset | Amounts offset | Net amounts as presented | Cash collateral received/pledged | Other offsetting instruments | Net amounts | |||||||
Assets: | ||||||||||||
Within trade receivables | ||||||||||||
Within derivative financial instruments | ||||||||||||
Liabilities: | ||||||||||||
Within trade payables | ||||||||||||
Within derivative financial instruments | ||||||||||||
Amounts not offset principally relate to contracts where the intention to settle on a net basis was not clearly established at December 31.
The carrying amount of financial assets pledged as collateral for liabilities or contingent liabilities at December 31, 2019, presented within trade and other receivables, was $1,948 million (2018: $3,094 million). The carrying amount of collateral held at December 31, 2019, presented within trade and other payables, was $718 million (2018: $535 million). Collateral mainly relates to initial margins held with commodity exchanges and over-the-counter counterparty variation margins. Some derivative contracts are fully cash collateralised, thereby eliminating both counterparty risk and the Group’s own non-performance risk.
Liquidity risk
Liquidity risk is the risk that suitable sources of funding for Shell’s business activities may not be available. Management believes that it has access to sufficient debt funding sources (capital markets), and to undrawn committed borrowing facilities to meet foreseeable requirements. Information about borrowing facilities is presented in Note 14.
DERIVATIVE CONTRACTS AND HEDGES
Derivative contracts are used principally as hedging instruments, however, because hedge accounting is not always applied, movements in the carrying amounts of derivative contracts that are recognised in income are not always matched in the same period by the recognition of the income effects of the related hedged items.
Carrying amounts, maturities and hedges
The carrying amounts of derivative contracts at December 31, designated and not designated as hedging instruments for hedge accounting purposes, were as follows:
2019 | $ million | |||||||||||||
Assets | Liabilities | |||||||||||||
Designated | Not designated | Total | Designated | Not designated | Total | Net | ||||||||
Interest rate swaps | ||||||||||||||
Forward foreign exchange contracts | ( | ) | ||||||||||||
Currency swaps and options | ( | ) | ||||||||||||
Commodity derivatives | ||||||||||||||
Other contracts | ||||||||||||||
Total | ||||||||||||||
2018 | $ million | |||||||||||||
Assets | Liabilities | |||||||||||||
Designated | Not designated | Total | Designated | Not designated | Total | Net | ||||||||
Interest rate swaps | ( | ) | ||||||||||||
Forward foreign exchange contracts | ||||||||||||||
Currency swaps and options | ( | ) | ||||||||||||
Commodity derivatives | ||||||||||||||
Other contracts | ||||||||||||||
Total | ( | ) | ||||||||||||
Net losses before tax on derivative contracts, excluding realised commodity contracts and those accounted for as hedges, were $2,004 million in 2019 (2018: $1,818 million losses; 2017: $1,321 million losses).
Certain contracts, mainly to hedge price risk relating to forecast commodity transactions which mature in 2020-2021, were designated in cash flow hedging relationships. The net carrying amount of commodity derivative contracts designated as cash flow hedging instruments at December 31, 2019, was a liability of $101 million (2018: $120 million asset) (see Note 22), and was presented after the offset of related margin balances maintained with exchanges.
FINANCIAL STATEMENTS AND SUPPLEMENTS SHELL ANNUAL REPORT AND FORM 20-F 2019 | 179 | |
Certain interest rate and currency swaps were designated in fair value hedges, principally in respect of debt for which the net carrying amount of the related derivative contracts, net of accrued interest, at December 31, 2019, was a liability of $518 million (2018: $1,242 million).
In the course of trading operations, certain contracts are entered into for delivery of commodities that are accounted for as derivatives. The resulting price exposures are managed by entering into related derivative contracts. These contracts are managed on a fair value basis and the maximum exposure to liquidity risk is the undiscounted fair value of derivative liabilities.
For a minority of commodity derivative contracts, carrying amounts cannot be derived from quoted market prices or other observable inputs, in which case fair value is estimated using valuation techniques such as Black-Scholes, option spread models and extrapolation using quoted spreads with assumptions developed internally based on observable market activity.
Other contracts include certain contracts that are held to sell or purchase commodities and others containing embedded derivatives, which are required to be recognised at fair value because of pricing or delivery conditions, even though they were entered into to meet operational requirements. These contracts are expected to mature in 2020-2025, with certain contracts having early termination rights (for either party). Valuations are derived from quoted market prices.
The contractual maturities of derivative liabilities at December 31 compare with their carrying amounts in the Consolidated Balance Sheet as follows:
2019 | $ million | |||||||||||||||||
Contractual maturities | ||||||||||||||||||
Less than 1 year | Between 1 and 2 years | Between 2 and 3 years | Between 3 and 4 years | Between 4 and 5 years | 5 years and later | Total | Difference from carrying amount [A] | Carrying amount | ||||||||||
Interest rate swap | ( | ) | ||||||||||||||||
Forward foreign exchange contracts | ( | ) | ||||||||||||||||
Currency swaps and options | ( | ) | ||||||||||||||||
Commodity derivatives | ( | ) | ||||||||||||||||
Total | ( | ) | ||||||||||||||||
[A] Mainly related to the effect of discounting.
2018 | $ million | |||||||||||||||||
Contractual maturities | ||||||||||||||||||
Less than 1 year | Between 1 and 2 years | Between 2 and 3 years | Between 3 and 4 years | Between 4 and 5 years | 5 years and later | Total | Difference from carrying amount [A] | Carrying amount | ||||||||||
Interest rate swap | ( | ) | ||||||||||||||||
Forward foreign exchange contracts | ( | ) | ( | ) | ( | ) | ( | ) | ||||||||||
Currency swaps and options | ( | ) | ||||||||||||||||
Commodity derivatives | ( | ) | ||||||||||||||||
Other contracts | ( | ) | ||||||||||||||||
Total | ( | ) | ||||||||||||||||
[A] Mainly related to the effect of discounting.
FINANCIAL STATEMENTS AND SUPPLEMENTS SHELL ANNUAL REPORT AND FORM 20-F 2019 | 180 | |
Fair value measurements
The net carrying amounts of derivative contracts held at December 31, categorised according to the predominant source and nature of inputs used in determining the fair value of each contract, were as follows:
2019 | $ million | |||||||
Prices in active markets for identical assets/liabilities | Other observable inputs | Unobservable inputs | Total | |||||
Interest rate swaps | ||||||||
Forward foreign exchange contracts | ( | ) | ( | ) | ||||
Currency swaps and options | ( | ) | ( | ) | ||||
Commodity derivatives | ( | ) | ||||||
Other contracts | ||||||||
Total | ||||||||
2018 | $ million | |||||||
Prices in active markets for identical assets/liabilities | Other observable inputs | Unobservable inputs | Total | |||||
Interest rate swaps | ( | ) | ( | ) | ||||
Forward foreign exchange contracts | ||||||||
Currency swaps and options | ( | ) | ( | ) | ||||
Commodity derivatives | ( | ) | ( | ) | ||||
Other contracts | ||||||||
Total | ( | ) | ( | ) | ( | ) | ( | ) |
Net carrying amounts of derivative contracts measured using predominantly unobservable inputs | $ million | |||
2019 | 2018 | |||
At January 1 | ( | ) | ||
Net gains/(losses) recognised in revenue | ( | ) | ||
Purchases | ||||
Sales | ( | ) | ( | ) |
Recategorisations (net) | ( | ) | ||
Currency translation differences | ( | ) | ||
At December 31 | ( | ) | ||
Included in net gains recognised in revenue in 2019 were unrealised net gains totalling $612 million relating to assets and liabilities held at December 31, 2019 (2018: $36 million losses).
20 - SHARE CAPITAL
Issued and fully paid ordinary shares of €0.07 each [A] | ||||||||||
Number of shares | Nominal value ($ million) | |||||||||
A | B | A | B | Total | ||||||
At January 1, 2019 | ||||||||||
Repurchases of shares | ( | ) | ( | ) | ( | ) | ( | ) | ( | ) |
At December 31, 2019 | ||||||||||
At January 1, 2018 | ||||||||||
Repurchases of shares | ( | ) | ( | ) | ( | ) | ||||
At December 31, 2018 | ||||||||||
[A] Share capital at December 31, 2019, and 2018, also included 50,000 issued and fully paid sterling deferred shares of £1 each.
At the Company’s Annual General Meeting ("AGM") on May 21, 2019, the Board was authorised to allot ordinary shares in the Company, and to grant rights to subscribe for or to convert any security into ordinary shares in the Company, up to an aggregate nominal amount of €190.3 million (representing 2,720 million ordinary shares of €0.07 each), and to list such shares or rights on any stock exchange. This authority expires at the earlier of the close of business on August 21, 2020, and the end of the AGM to be held in 2020, unless previously renewed, revoked or varied by the Company in a general meeting.
At the May 21, 2019 AGM, shareholders granted the Company the authority to repurchase up to 815 million ordinary shares (excluding any treasury shares), renewing the authority granted by the shareholders at previous AGMs. The authority will expire at the earlier of the close of business on August 21, 2020, and the end of the AGM of the Company to be held in 2020. Ordinary shares purchased by the Company pursuant to this authority will either be cancelled or held in treasury. Treasury shares are shares in the Company which are owned by the Company itself. The minimum price, exclusive of expenses, which may be paid for an ordinary share is €0.07 . The maximum price, exclusive of expenses, which may be paid for an ordinary share is the higher of: (i) an amount equal to 5 %
FINANCIAL STATEMENTS AND SUPPLEMENTS SHELL ANNUAL REPORT AND FORM 20-F 2019 | 181 | |
above the average market value for an ordinary share for the five business days immediately preceding the date of the purchase; and (ii) the higher of the price of the last independent trade and the highest current independent bid on the trading venues where the purchase is carried out.
21 - SHARE-BASED COMPENSATION PLANS AND SHARES HELD IN TRUST
Share-based compensation expense | $ million | |||||
2019 | 2018 | 2017 | ||||
Equity-settled | ||||||
Cash-settled [A] | ||||||
Total | ||||||
[A] As from 2018 onwards, components of share-based payments (related to tax) that were previously classified as cash-settled are classified as equity-settled. On an incidental basis awards may be cash settled, where an equity settlement is not possible under local regulations.
The principal share-based employee compensation plans are the PSP and LTIP. Awards of shares and American Depository Shares ("ADSs") of the Company under the PSP and LTIP are granted upon certain conditions to eligible employees. The actual amount of shares that may vest ranges from 0 % to 200 % of the awards, depending on the outcomes of prescribed performance conditions over a three-year period beginning on January 1 of the award year. Shares and ADSs vest for nil consideration.
Share awards under the PSP and LTIP | |||||||
Number of A shares (million) | Number of B shares (million) | Number of A ADSs (million) | Weighted Average remaining contractual life (years) | ||||
At January 1, 2019 | |||||||
Granted | |||||||
Vested | ( | ) | ( | ) | ( | ) | |
Forfeited | ( | ) | |||||
At December 31, 2019 | |||||||
At January 1, 2018 | |||||||
Granted | |||||||
Vested | ( | ) | ( | ) | ( | ) | |
Forfeited | ( | ) | |||||
At December 31, 2018 | |||||||
Other plans offer eligible employees opportunities to acquire shares and ADSs of the Company or receive cash benefits measured by reference to the Company’s share price.
Shell employee share ownership trusts and trust-like entities purchase the Company’s shares in the open market to meet delivery commitments under employee share plans. At December 31, 2019, they held 17.4 million A shares (2018: 19.6 million), 6.5 million B shares (2018: 7.1 million) and 5.3 million A ADSs (2018: 5.9 million).
FINANCIAL STATEMENTS AND SUPPLEMENTS SHELL ANNUAL REPORT AND FORM 20-F 2019 | 182 | |
22 - OTHER RESERVES
Other reserves attributable to Royal Dutch Shell plc shareholders | $ million | |||||||||||
Merger reserve | Share premium reserve | Capital redemption reserve | Share plan reserve | Accumulated other comprehensive income | Total | |||||||
At January 1, 2019 | ( | ) | ||||||||||
Other comprehensive loss attributable to Royal Dutch Shell plc shareholders | ( | ) | ( | ) | ||||||||
Transfer from other comprehensive income | ( | ) | ( | ) | ||||||||
Repurchases of shares | ||||||||||||
Share-based compensation | ( | ) | ( | ) | ||||||||
At December 31, 2019 | ( | ) | ||||||||||
At January 1, 2018 (as previously published) | ( | ) | ||||||||||
Impact of IFRS 9 | ( | ) | ( | ) | ||||||||
At January 1, 2018 (as revised) | ( | ) | ||||||||||
Other comprehensive income attributable to Royal Dutch Shell plc shareholders | ||||||||||||
Transfer from other comprehensive income | ( | ) | ( | ) | ||||||||
Repurchases of shares | ||||||||||||
Share-based compensation | ( | ) | ( | ) | ||||||||
At December 31, 2018 | ( | ) | ||||||||||
At January 1, 2017 | ( | ) | ||||||||||
Other comprehensive loss attributable to Royal Dutch Shell plc shareholders | ||||||||||||
Scrip dividends | ( | ) | ( | ) | ||||||||
Share-based compensation | ( | ) | ( | ) | ||||||||
At December 31, 2017 | ( | ) | ||||||||||
The merger reserve and share premium reserve were established as a consequence of the Company becoming the single parent company of Royal Dutch Petroleum Company and The “Shell” Transport and Trading Company, plc, now The Shell Transport and Trading Company Limited, in 2005. The capital redemption reserve was established in connection with repurchases of shares of the Company. The share plan reserve is in respect of equity-settled share-based compensation plans (see Note 21). The movement represents the net of the charge for the year and the release as a result of vested awards and is after deduction of tax of $45 million in 2019 (2018: $71 million; 2017: $11 million).
FINANCIAL STATEMENTS AND SUPPLEMENTS SHELL ANNUAL REPORT AND FORM 20-F 2019 | 183 | |
Accumulated other comprehensive income comprises the following:
FINANCIAL STATEMENTS AND SUPPLEMENTS SHELL ANNUAL REPORT AND FORM 20-F 2019 | 184 | |
Accumulated other comprehensive income attributable to Royal Dutch Shell plc shareholders | $ million | |||||||||||||||
Currency translation differences | Unrealised gains/(losses) on securities | Debt instruments remeasurements | Cash flow and net investment hedging gains/(losses) | Deferred cost of hedging | Retirement benefits remeasurements | Equity instrument remeasurements | Total | |||||||||
At January 1, 2019 | ( | ) | ( | ) | ( | ) | ( | ) | ( | ) | ||||||
Recognised in other comprehensive income | ( | ) | ( | ) | ( | ) | ( | ) | ||||||||
Reclassified to income | ||||||||||||||||
Reclassified to the balance sheet | ||||||||||||||||
Reclassified to retained earnings | ( | ) | ( | ) | ||||||||||||
Tax on amounts recognised/reclassified | ( | ) | ( | ) | ||||||||||||
Total, net of tax | ( | ) | ( | ) | ( | ) | ( | ) | ||||||||
Share of joint ventures and associates | ( | ) | ( | ) | ( | ) | ||||||||||
Other comprehensive income/(loss) for the period | ( | ) | ( | ) | ( | ) | ( | ) | ||||||||
Less: non-controlling interest | ( | ) | ( | ) | ||||||||||||
Attributable to Royal Dutch Shell plc shareholders | ( | ) | ( | ) | ( | ) | ( | ) | ||||||||
At December 31, 2019 | ( | ) | ( | ) | ( | ) | ( | ) | ( | ) | ||||||
At January 1, 2018 (as previously published) | ( | ) | ( | ) | ( | ) | ( | ) | ||||||||
Impact of IFRS 9 | ( | ) | ( | ) | ( | ) | ( | ) | ||||||||
At January 1, 2018 (as revised) | ( | ) | ( | ) | ( | ) | ( | ) | ( | ) | ( | ) | ||||
Recognised in other comprehensive income | ( | ) | ( | ) | ( | ) | ( | ) | ||||||||
Reclassified to income | ||||||||||||||||
Reclassified to the balance sheet | ( | ) | ( | ) | ||||||||||||
Reclassified to retained earnings | ( | ) | ( | ) | ||||||||||||
Tax on amounts recognised/reclassified | ( | ) | ( | ) | ( | ) | ( | ) | ( | ) | ||||||
Total, net of tax | ( | ) | ( | ) | ( | ) | ( | ) | ( | ) | ||||||
Share of joint ventures and associates | ( | ) | ||||||||||||||
Other comprehensive loss for the period | ( | ) | ( | ) | ( | ) | ( | ) | ( | ) | ||||||
Less: non-controlling interest | ( | ) | ( | ) | ||||||||||||
Attributable to Royal Dutch Shell plc shareholders | ( | ) | ( | ) | ( | ) | ( | ) | ||||||||
At December 31, 2018 | ( | ) | ( | ) | ( | ) | ( | ) | ( | ) | ||||||
At January 1, 2017 | ( | ) | ( | ) | ( | ) | ( | ) | ||||||||
Recognised in other comprehensive income | ( | ) | ||||||||||||||
Reclassified to income | ( | ) | ( | ) | ||||||||||||
Reclassified to the balance sheet | ( | ) | ( | ) | ||||||||||||
Tax on amounts recognised/reclassified | ( | ) | ( | ) | ||||||||||||
Total, net of tax | ( | ) | ||||||||||||||
Share of joint ventures and associates | ( | ) | ||||||||||||||
Other comprehensive income/(loss) for the period | ( | ) | ||||||||||||||
Less: non-controlling interest | ( | ) | ( | ) | ( | ) | ||||||||||
Attributable to Royal Dutch Shell plc shareholders | ( | ) | ||||||||||||||
At December 31, 2017 | ( | ) | ( | ) | ( | ) | ( | ) | ||||||||
FINANCIAL STATEMENTS AND SUPPLEMENTS SHELL ANNUAL REPORT AND FORM 20-F 2019 | 185 | |
23 - DIVIDENDS
Interim dividends | $ million | |||||
2019 | 2018 | 2017 | ||||
A shares: | ||||||
Cash: $1.88 per share (2018: $1.88; 2017: $1.88) | ||||||
Scrip: none (2018: none; 2017: $1.88 per share) | ||||||
Total - A shares | ||||||
B shares: | ||||||
Cash: $1.88 per share (2018: $1.88; 2017: $1.88) | ||||||
Scrip: none (2018: none; 2017: $1.88 per share) | ||||||
Total - B shares | ||||||
Total | ||||||
In addition, on January 30, 2020, the Directors announced a further interim dividend in respect of 2019 of $0.47 per A share and $0.47 per B share. The total dividend is estimated to be $3,691 million and is payable on March 23, 2020, to shareholders on the register at February 14, 2020. The Scrip Dividend Programme has been cancelled with effect from the fourth quarter 2017 interim dividend.
Dividends on A shares are by default paid in euros, although holders may elect to receive dividends in US dollars or in sterling. Dividends on B shares are by default paid in sterling, although holders may elect to receive dividends in US dollars or in euros. Dividends on ADSs are paid in dollars.
24 - EARNINGS PER SHARE
2019 | 2018 | 2017 | ||||
Income attributable to Royal Dutch Shell plc shareholders ($ million) | ||||||
Weighted average number of A and B shares used as the basis for determining: | ||||||
Basic earnings per share (million) | ||||||
Diluted earnings per share (million) | ||||||
Basic earnings per share are calculated by dividing the income attributable to Royal Dutch Shell plc shareholders for the year by the weighted average number of A and B shares outstanding during the year. The weighted average number of shares outstanding excludes shares held in trust.
Diluted earnings per share are based on the same income figures. The weighted average number of shares outstanding during the year is increased by dilutive shares related to share-based compensation plans.
25 - LEGAL PROCEEDINGS AND OTHER CONTINGENCIES
GENERAL
In the ordinary course of business, Shell subsidiaries are subject to a number of contingencies arising from litigation and claims brought by governmental, including tax authorities, and private parties. The operations and earnings of Shell subsidiaries continue, from time to time, to be affected to varying degrees by political, legislative, fiscal and regulatory developments, including those relating to the protection of the environment and indigenous groups in the countries in which they operate. The industries in which Shell subsidiaries are engaged are also subject to physical risks of various types.
The amounts claimed in relation to such events and, if such claims against Shell were successful, the costs of implementing the remedies sought in the various cases could be substantial. Based on information available to date and taking into account that in some cases it is not practicable to estimate the possible magnitude or timing of any resultant payments, management believes that the foregoing are not expected to have a material adverse impact on Shell’s Consolidated Financial Statements. However, there remains a high degree of uncertainty around these contingencies, as well as their potential effect on future operations, earnings, cash flows and Shell’s financial condition.
In certain divestment transactions, liabilities related to dismantling and restoration are de-recognised upon transfer of these obligations to the buyer. For certain of these obligations Shell has issued guarantees to third parties and continues to be liable in case that the primary obligator is not able to meet its obligation. These potential obligations arising from issuance of these guarantees are assessed to be remote.
PESTICIDE LITIGATION
Shell Oil Company ("SOC"), along with another agricultural chemical pesticide manufacturer and several distributors, has been sued by public and quasi-public water purveyors alleging responsibility for groundwater contamination caused by applications of chemical pesticides. There are approximately 36 such cases currently pending. These suits assert various theories of strict liability and negligence, and seek to recover actual damages, including drinking well treatment and remediation costs. Most assert claims for punitive damages. While the Company continues to vigorously defend these lawsuits, a new environmental regulatory standard became effective in the State of California, where a majority of the suits are pending. The new standard requires public water systems state wide to perform quarterly or monthly sampling of their drinking water sources for a chemical contained in certain pesticides, beginning in January 2018. Water systems deemed out of compliance with the new five parts per trillion regulatory standard must take corrective action to resolve the exceedance or take the potable water source out of service. In response to this new regulatory standard, the Company is monitoring the sampling results to determine the number of wells potentially impacted. Based on the claims asserted and SOC’s track record, with regard to amounts paid to resolve varying claims, management does not expect the outcome of these lawsuits pending at December 31, 2019, to have a material adverse impact on Shell. However, there remains a high degree of uncertainty regarding the potential outcome of some of these pending lawsuits, as well as their potential effect on future operations, earnings, cash flows and Shell’s financial condition.
FINANCIAL STATEMENTS AND SUPPLEMENTS SHELL ANNUAL REPORT AND FORM 20-F 2019 | 186 | |
CLIMATE CHANGE LITIGATION
In the USA, 12 lawsuits have been filed by several municipalities and one state against oil and gas companies, including Royal Dutch Shell plc. The plaintiffs seek damages for claimed harm to their public and private infrastructure from rising sea levels allegedly due to climate change caused by the defendants’ fossil fuel products. A similar suit has been filed by a crab fishing industry group claiming harm to their fisheries as a result of alleged ocean-related impacts of climate change. In the Netherlands a case has been filed against Shell by a group of environmental non-governmental organisations ("eNGOs") and individual claimants seeking a court order that Shell reduce by (net) 100 % by 2050 the emissions associated with its business activities and products. Management believes the outcome of these matters should be resolved in a manner favourable to Shell, however, there remains a high degree of uncertainty regarding the ultimate outcome of these lawsuits, as well as their potential effect on future operations, earnings, cash flows and Shell’s financial condition.
BRAZIL TAX
Pursuant to Law 7.183/2015 issued by the State of Rio de Janeiro (RJ State) and effective March 2016, a value-added levy has been imposed on oil extraction in the RJ State. The Company understands that the obligations arising from this law are not legally sustainable and Shell obtained favourable injunctions suspending the enforcement of the law in two separate lawsuits, one filed to cover year 2016 and the other covering year 2017 onwards. The injunctions remain in effect and Shell received favourable decisions on the subject matter from the RJ State Court. The RJ State has appealed against both decisions and one is pending confirmation by the State Court while the other is pending final decisions by the Brazilian Superior and Supreme Courts. In addition, and as this is an industry-wide issue, the Brazilian Association of Oil and Gas Exploration and Production Companies, of which Shell is a member, filed a suit in February 2016 before the Brazilian Supreme Court, challenging the constitutionality of the law. This matter is currently pending with the Supreme Court. Should Shell be required to pay such a levy, it could result in a potential total liability of approximately $5,275 million as of end 2019.
LOUISIANA COAST LITIGATION
The State of Louisiana and multiple local governments have initiated 43 lawsuits against 200 + Oil and Gas companies claiming historical oil and gas operations caused or contributed to wide-spread contamination, land loss and the erosion of the Louisiana coastline. Shell entities are named in 14 of the suits. The amounts claimed are unspecified. The cases are of first impression, arise out of an untested 1980 Louisiana statute and represent a novel attempt to render illegal operations that federal and state agencies permitted and authorized at the time. Management believes the outcome of these matters should be resolved in a manner favourable to Shell; there remains a high degree of uncertainty, however, concerning the scope of the claims and the ultimate outcome, as well as their potential effect on future operations, earnings, cash flows and Shell’s financial condition.
NIGERIAN LITIGATION
Shell subsidiaries and associates operating in Nigeria are parties to various environmental and contractual disputes brought in the courts of Nigeria, England and the Netherlands. These disputes are at different stages in litigation, including at the appellate stage, where judgements have been rendered against Shell entities. If taken at face value, the aggregate amount of these judgements could be seen as material. Management, however, believes that the outcomes of these matters will ultimately be resolved in a manner favourable to Shell. However, there remains a high degree of uncertainty regarding these cases, as well as their potential effect on future operations, earnings, cash flows and Shell’s financial condition.
The authorities in various countries are investigating Shell Nigeria Exploration and Production Company Ltd.’s ("SNEPCO’s") investment in Nigerian oil block OPL 245 and the 2011 settlement of litigation pertaining to that block with regard to potential anti-bribery, anti-corruption and anti-money laundering laws.
On January 27, 2017, the Nigeria Federal High Court issued an Interim Order of Attachment for Oil Prospecting Licence 245 ("OPL 245"), pending the conclusion of the investigation. SNEPCO applied for and was granted a discharge of this order on constitutional and procedural grounds. Also in Nigeria, in March 2017 criminal charges alleging official corruption and conspiracy to commit official corruption were filed against SNEPCO, one current Shell employee and third parties including ENI SpA and one of its subsidiaries. Those proceedings are ongoing. In January 2020, criminal charges alleging disobeying direction of law were filed in Nigeria against Shell Nigeria Ultra Deep Ltd., SNEPCO, and third parties including Nigeria Agip Exploration Limited. Those proceedings are ongoing. In March 2017, parties alleging to be shareholders of Malabu Oil and Gas Company Ltd. (Malabu) filed two actions to challenge the 2011 settlement and the award of OPL 245 to SNEPCO and an ENI SpA subsidiary by the Federal Government of Nigeria. Those proceedings are also ongoing. On May 8, 2018, Human Environmental Development Agenda ("HEDA") sought permission from the Federal High Court of Nigeria to apply for an order to direct the Attorney General of the Federation to revoke OPL 245 on grounds that the entire Malabu transaction in relation to the OPL is unconstitutional, illegal and void as it was obtained through fraudulent and corrupt practice. On October 4, 2018, SNEPCO was joined as a defendant in the HEDA action. Those proceedings are ongoing. On December 12, 2018, the Federal Republic of Nigeria issued a claim form in the UK against Shell and six subsidiaries, ENI SpA and two of its subsidiaries, Malabu as well as two other entities for the amount of $1,092 million plus damages for having participated in a fraudulent and corrupt scheme leading to the acquisition by Shell and ENI corporate defendants in 2011 of OPL 245. The Shell entities were served in April and May 2019. The Shell entities and other defendants have challenged the jurisdiction of the English courts to try the claims and a hearing is scheduled for April 2020. On February 14, 2017, Royal Dutch Shell plc received a notice of request for indictment from the Milan public prosecutor with respect to this matter. On December 20, 2017, Royal Dutch Shell plc along with four former Shell employees including one former executive were remanded to trial in Milan. On May 14, 2018, a trial commenced in the Court of Milan. On September 18, 2018, Shell was joined to the proceedings as the civilly responsible party (responsabile civile) for the damages caused by the alleged illegal acts of the four former Shell employees. Three other Shell entities (Shell UK Ltd, Shell Petroleum Development Company of Nigeria Ltd. and Shell Exporation and Production Africa Ltd. ) also joined the proceedings but were denied status as responsabile civile for their respective former employees at that phase of the proceedings. The trial is ongoing with closing arguments scheduled to begin on March 25, 2020. Based on Shell’s review of the Prosecutor of Milan's file and all the information and facts currently available to Shell, management does not believe that there is a basis to convict Shell in Milan. Furthermore, management is not aware of any evidence to convict any former or current Shell employee in Milan.
On September 20, 2018, a guilty judgement was filed by the Milan Judge of the Preliminary Hearing in a separate OPL 245 fast track trial of two individuals, neither of whom worked on behalf of Shell. That decision is under appeal.
In February 2019, we were informed by the Dutch Public Prosecutor’s Office ("DPP") that they were nearing the conclusion of their investigation and preparing to prosecute Royal Dutch Shell plc for criminal charges directly or indirectly related to the 2011 settlement of disputes over OPL 245 in Nigeria. On October 2, 2019 the U.S. Department of Justice ("DOJ") informed Shell that it was closing its inquiry into Shell in relation to OPL 245. We understand that the decision was based on the facts available to the DOJ, including ongoing legal proceedings in Europe.
There remains a high degree of uncertainty around the OPL 245 matters and contingencies discussed above, as well as their potential effect on future operations, earnings, cash flows and Shell’s financial condition. Accordingly, at this time, it is not practicable to estimate the magnitude and timing of any
FINANCIAL STATEMENTS AND SUPPLEMENTS SHELL ANNUAL REPORT AND FORM 20-F 2019 | 187 | |
26 - EMPLOYEES
Employee costs | $ million | |||||
2019 | 2018 | 2017 | ||||
Remuneration | ||||||
Social security contributions | ||||||
Retirement benefits (see Note 17) | ||||||
Share-based compensation (see Note 21) | ||||||
Total [A] | ||||||
Average employee numbers | Thousand | |||||
2019 | 2018 | 2017 | ||||
Integrated Gas | ||||||
Upstream | ||||||
Downstream | ||||||
Corporate [A] | ||||||
Total [B] | ||||||
[A] Includes all employees working in business service centres irrespective of the segment they support.
27 - DIRECTORS AND SENIOR MANAGEMENT
Remuneration of Directors of the Company | $ million | |||||
2019 | 2018 | 2017 | ||||
Emoluments | ||||||
Value of released awards under long-term incentive plans | ||||||
Employer contributions to pension plans | ||||||
Emoluments comprise salaries and fees, annual bonuses (for the period for which performance is assessed) and other benefits. The value of released awards under long-term incentive plans for the period is in respect of the performance period ending in that year. In 2019, retirement benefits were accrued in respect of qualifying services under defined benefit plans by two Directors.
Further information on the remuneration of the Directors can be found in the Directors’ Remuneration Report on pages 98-101.
Directors and Senior Management expense | $ million | |||||
2019 | 2018 | 2017 | ||||
Short-term benefits | ||||||
Retirement benefits | ||||||
Share-based compensation | ||||||
Termination and related amounts | ||||||
Total | ||||||
Directors and Senior Management comprise members of the Executive Committee and the Non-executive Directors of the Company.
FINANCIAL STATEMENTS AND SUPPLEMENTS SHELL ANNUAL REPORT AND FORM 20-F 2019 | 188 | |
28 - AUDITOR’S REMUNERATION
$ million | ||||||
2019 | 2018 | 2017 | ||||
Fees in respect of the audit of the Consolidated and Parent Company Financial Statements, including audit of consolidation returns | ||||||
Other audit fees, principally in respect of audits of accounts of subsidiaries | ||||||
Total audit fees | ||||||
Audit-related fees | ||||||
Fees in respect of other non-audit services | ||||||
Total | ||||||
In addition, the auditor provided audit services to retirement benefit plans for employees of subsidiaries. Remuneration paid by those benefit plans amounted to $1 million in 2019 (2018: $1 million; 2017: $1 million).
29 - POST-BALANCE SHEET EVENTS
On February 27, 2020 the fully-consolidated Shell Midstream Partners, L.P. (“SHLX”) signed an agreement with its Shell-controlled general partner to eliminate all incentive distribution rights and economic general partner interest in SHLX and convert the general partner’s two per cent general partner interest in SHLX into a non-economic general partner interest in SHLX. SHLX has also entered into a Purchase and Sale Agreement with Shell affiliates to acquire our 79 % interest in the Mattox Pipeline Company LLC, which owns the Mattox Pipeline, and certain logistics assets at the Shell Norco Manufacturing Complex. As consideration for the assets and the elimination of incentive distribution rights, Shell will receive 160 million newly issued SHLX common units, plus $1.2 billion of Series A perpetual convertible preferred units at a price of $23.63 per unit. The transaction is expected to close in the second quarter of 2020 and is subject to regulatory approvals and other customary closing conditions.
After the balance sheet date, we have seen macro-economic uncertainty with regards to prices and demand for oil, gas and products as a result of the COVID-19 (coronavirus) outbreak. Furthermore, recent global developments and uncertainty in oil supply in March have caused further abnormally large volatility in commodity markets. The scale and duration of these developments remain uncertain but could impact our earnings, cash flow and financial condition.
FINANCIAL STATEMENTS AND SUPPLEMENTS SHELL ANNUAL REPORT AND FORM 20-F 2019 | 189 | |
Supplementary information – oil and gas (unaudited) | |
The information set out on pages 189-206 is referred to as “unaudited” as a means of clarifying that it is not covered by the audit opinion of the independent registered public accounting firm that has audited and reported on the Consolidated Financial Statements.
PROVED RESERVES
Proved reserves estimates are calculated pursuant to the US Securities and Exchange Commission ("SEC") Rules and the Financial Accounting Standard Board’s Topic 932. Proved reserves can be either developed or undeveloped. The definitions used are in accordance with the SEC Rule 4–10 (a) of Regulation S-X. We include proved reserves associated with future production that will be consumed in operations.
Proved reserves shown are net of any quantities of crude oil or natural gas that are expected to be (or could be) taken as royalties in kind. Proved reserves outside North America include quantities that will be settled as royalties in cash. Proved reserves include certain quantities of crude oil or natural gas that will be produced under arrangements that involve Shell subsidiaries, joint ventures and associates in risks and rewards but do not transfer title of the product to those entities.
Subsidiaries’ proved reserves at December 31, 2019, were divided into 79% developed and 21% undeveloped on a barrel of oil equivalent basis. For the Shell share of joint ventures and associates, the proved reserves at December 31, 2019, were divided into 86% developed and 14% undeveloped on a barrel of oil equivalent basis.
Proved reserves are recognised under various forms of contractual agreements. Shell’s proved reserves volumes at December 31, 2019, present in agreements such as production-sharing contracts ("PSC"), tax/variable royalty contracts or other forms of economic entitlement contracts, where the Shell share of reserves can vary with commodity prices, were 2,170 million barrels of crude oil and natural gas liquids, and 13,433 thousand million standard cubic feet (scf) of natural gas.
Proved reserves cannot be measured exactly because estimation of reserves involves subjective judgement (see “Risk factors” on page 11 and our “Proved reserves assurance process” below). These estimates remain subject to revision and are unaudited supplementary information.
PROVED RESERVES ASSURANCE PROCESS
A central group of reserves experts, who on average have around 28 years’ experience in the oil and gas industry, undertake the primary assurance of the proved reserves bookings. This group of experts is part of the Resources Assurance and Reporting ("RAR") organisation within Shell. A Vice President with 34 years’ experience in the oil and gas industry currently heads the RAR organisation. He is a member of the Society of Petroleum Engineers, Society of Petroleum Evaluation Engineers and holds a BA in mathematics from Oxford University and an MEng in Petroleum Engineering from Heriot Watt University. The RAR organisation reports directly to an Executive Vice President of Finance, who is a member of the Upstream Reserves Committee ("URC"). The URC is a multidisciplinary committee consisting of senior representatives from the Finance, Legal, Projects & Technology and Upstream organisations. The URC reviews and endorses all major (larger than 20 million barrels of oil equivalent) proved reserves bookings and de-bookings and endorses the total aggregated proved reserves. Final approval of all proved reserves bookings remains with Shell’s Executive Committee, and all proved reserves bookings are reviewed by Shell’s Audit Committee. The Internal Audit function also provides secondary assurance through audits of the control framework.
CRUDE OIL, NATURAL GAS LIQUIDS, SYNTHETIC CRUDE OIL AND BITUMEN
Shell subsidiaries’ proved reserves of crude oil, natural gas liquids ("NGLs"), synthetic crude oil and bitumen at the end of the year; their share of the proved reserves of joint ventures and associates at the end of the year; and the changes in such reserves during the year are set out on pages 190-193. Significant changes in these proved reserves are discussed below, where ‘revisions and reclassifications’ are changes based on new information that resulted from development drilling, production history, and changes in economic factors.
PROVED RESERVES 2019–2018
Shell subsidiaries
Europe
The net decrease of 65 million barrels in sales and purchases resulted from divestments carried out in Denmark.
Asia
The net increase of 226 million barrels in revisions and reclassifications was mainly in Oman and Kazakhstan.
USA
The increase of 86 million barrels in revisions and reclassifications mainly resulted from field performance studies and development activities in the Permian Basin and in Mars and Ursa field in the Gulf of Mexico. The increase of 74 million barrels in extensions and discoveries was in the Permian Basin and PowerNap.
South America
The increase of 72 million barrels in revisions and reclassifications mainly resulted from field performance studies and development activities in Lula and Lapa Field (Brazil). The net increase of 60 million barrels in extensions and discoveries was mainly in Mero (Brazil).
PROVED RESERVES 2018–2017
Shell subsidiaries
Europe
The net increase of 94 million barrels in revisions and reclassifications was mainly in the UK and Denmark.
FINANCIAL STATEMENTS AND SUPPLEMENTS SHELL ANNUAL REPORT AND FORM 20-F 2019 | 190 | |
Asia
The net increase of 227 million barrels in revisions and reclassifications was mainly in Oman and Kazakhstan. The sale of minerals in place of 52 million barrels occurred in Iraq (West Qurna) and Oman (Mukhaizna).
USA
The net increase of 81 million barrels in revisions and reclassifications was mainly in the Mars and Ursa fields in the Gulf of Mexico. The increase of 179 million barrels in extensions and discoveries was mainly in the Vito field in the Gulf of Mexico and in the Permian Basin.
South America
The net increase of 139 million barrels in extensions and discoveries was in Mero (Brazil) and Vaca Muerta (Argentina).
Proved developed and undeveloped reserves 2019 | Million barrels | |||||||||||||||||||||||||
North America | ||||||||||||||||||||||||||
Europe | Asia | Oceania | Africa | USA | Canada | South America | Total | |||||||||||||||||||
Oil and NGL | Oil and NGL | Oil and NGL | Oil and NGL | Oil and NGL | Oil and NGL | Synthetic crude oil | Bitumen | Oil and NGL | Oil and NGL | Synthetic crude oil | Bitumen | All products | ||||||||||||||
Shell subsidiaries | ||||||||||||||||||||||||||
At January 1 | 368 | 1,502 | 129 | 420 | 1,017 | 23 | 661 | — | 1,027 | 4,486 | 661 | — | 5,147 | |||||||||||||
Revisions and reclassifications | 27 | 226 | 2 | 33 | 86 | (2 | ) | (34 | ) | — | 72 | 444 | (34 | ) | — | 410 | ||||||||||
Improved recovery | — | — | — | — | — | — | — | — | 4 | 4 | — | — | 4 | |||||||||||||
Extensions and discoveries | — | 7 | — | 6 | 74 | 11 | — | — | 60 | 158 | — | — | 158 | |||||||||||||
Purchases of minerals in place | — | — | — | — | 5 | — | — | — | — | 5 | — | — | 5 | |||||||||||||
Sales of minerals in place | (65 | ) | — | — | — | (29 | ) | (2 | ) | — | — | — | (96 | ) | — | — | (96 | ) | ||||||||
Production [A] | (56 | ) | (184 | ) | (10 | ) | (64 | ) | (171 | ) | (12 | ) | (20 | ) | — | (130 | ) | (627 | ) | (20 | ) | — | (647 | ) | ||
At December 31 | 274 | 1,551 | 121 | 395 | 982 | 18 | 607 | — | 1,033 | 4,374 | 607 | — | 4,981 | |||||||||||||
Shell share of joint ventures and associates | ||||||||||||||||||||||||||
At January 1 | 9 | 281 | — | — | — | — | — | — | — | 290 | — | — | 290 | |||||||||||||
Revisions and reclassifications | 4 | 21 | — | — | — | — | — | — | — | 25 | — | — | 25 | |||||||||||||
Improved recovery | — | 4 | — | — | — | — | — | — | — | 4 | — | — | 4 | |||||||||||||
Extensions and discoveries | — | 2 | — | — | — | — | — | — | — | 2 | — | — | 2 | |||||||||||||
Purchases of minerals in place | — | — | — | — | — | — | — | — | — | — | — | — | — | |||||||||||||
Sales of minerals in place | — | — | — | — | — | — | — | — | — | — | — | — | — | |||||||||||||
Production | (1 | ) | (37 | ) | — | — | — | — | — | — | — | (38 | ) | — | — | (38 | ) | |||||||||
At December 31 | 12 | 271 | — | — | — | — | — | — | — | 283 | — | — | 283 | |||||||||||||
Total | 286 | 1,822 | 121 | 395 | 982 | 18 | 607 | — | 1,033 | 4,657 | 607 | — | 5,264 | |||||||||||||
Reserves attributable to non-controlling interest in Shell subsidiaries at December 31 | — | — | — | — | — | — | 304 | — | — | — | 304 | — | 304 | |||||||||||||
[A] Includes 1 million barrels consumed in operations for synthetic crude oil.
Proved developed reserves 2019 | Million barrels | |||||||||||||||||||||||||
North America | ||||||||||||||||||||||||||
Europe | Asia | Oceania | Africa | USA | Canada | South America | Total | |||||||||||||||||||
Oil and NGL | Oil and NGL | Oil and NGL | Oil and NGL | Oil and NGL | Oil and NGL | Synthetic crude oil | Bitumen | Oil and NGL | Oil and NGL | Synthetic crude oil | Bitumen | All products | ||||||||||||||
Shell subsidiaries | ||||||||||||||||||||||||||
At January 1 | 243 | 1,318 | 108 | 335 | 629 | 21 | 661 | — | 634 | 3,288 | 661 | — | 3,949 | |||||||||||||
At December 31 | 156 | 1,403 | 106 | 314 | 641 | 15 | 607 | — | 675 | 3,310 | 607 | — | 3,917 | |||||||||||||
Shell share of joint ventures and associates | ||||||||||||||||||||||||||
At January 1 | 8 | 251 | — | — | — | — | — | — | — | 259 | — | — | 259 | |||||||||||||
At December 31 | 11 | 240 | — | — | — | — | — | — | — | 251 | — | — | 251 | |||||||||||||
FINANCIAL STATEMENTS AND SUPPLEMENTS SHELL ANNUAL REPORT AND FORM 20-F 2019 | 191 | |
Proved undeveloped reserves 2019 | Million barrels | |||||||||||||||||||||||||
North America | ||||||||||||||||||||||||||
Europe | Asia | Oceania | Africa | USA | Canada | South America | Total | |||||||||||||||||||
Oil and NGL | Oil and NGL | Oil and NGL | Oil and NGL | Oil and NGL | Oil and NGL | Synthetic crude oil | Bitumen | Oil and NGL | Oil and NGL | Synthetic crude oil | Bitumen | All products | ||||||||||||||
Shell subsidiaries | ||||||||||||||||||||||||||
At January 1 | 124 | 185 | 21 | 85 | 388 | 2 | — | — | 394 | 1,199 | — | — | 1,199 | |||||||||||||
At December 31 | 118 | 149 | 15 | 80 | 341 | 3 | — | — | 358 | 1,064 | — | — | 1,064 | |||||||||||||
Shell share of joint ventures and associates | ||||||||||||||||||||||||||
At January 1 | 1 | 30 | — | — | — | — | — | — | — | 31 | — | — | 31 | |||||||||||||
At December 31 | 1 | 31 | — | — | — | — | — | — | — | 32 | — | — | 32 | |||||||||||||
Proved developed and undeveloped reserves 2018 | Million barrels | |||||||||||||||||||||||||
North America | ||||||||||||||||||||||||||
Europe | Asia | Oceania | Africa | USA | Canada | South America | Total | |||||||||||||||||||
Oil and NGL | Oil and NGL | Oil and NGL | Oil and NGL | Oil and NGL | Oil and NGL | Synthetic crude oil | Bitumen | Oil and NGL | Oil and NGL | Synthetic crude oil | Bitumen | All products | ||||||||||||||
Shell subsidiaries | ||||||||||||||||||||||||||
At January 1 | 356 | 1,482 | 132 | 463 | 899 | 22 | 649 | — | 946 | 4,300 | 649 | — | 4,949 | |||||||||||||
Revisions and reclassifications | 94 | 227 | 14 | 18 | 81 | 7 | 32 | — | 48 | 489 | 32 | — | 521 | |||||||||||||
Improved recovery | — | 27 | — | — | — | — | — | — | 14 | 41 | — | — | 41 | |||||||||||||
Extensions and discoveries | 2 | 3 | — | — | 179 | 6 | — | — | 139 | 329 | — | — | 329 | |||||||||||||
Purchases of minerals in place | — | — | — | — | — | — | — | — | 3 | 3 | — | — | 3 | |||||||||||||
Sales of minerals in place | (14 | ) | (52 | ) | (8 | ) | — | (2 | ) | — | — | — | — | (76 | ) | — | — | (76 | ) | |||||||
Production [A] | (70 | ) | (185 | ) | (9 | ) | (61 | ) | (140 | ) | (13 | ) | (20 | ) | — | (122 | ) | (600 | ) | (20 | ) | — | (620 | ) | ||
At December 31 | 368 | 1,502 | 129 | 420 | 1,017 | 23 | 661 | — | 1,027 | 4,486 | 661 | — | 5,147 | |||||||||||||
Shell share of joint ventures and associates | ||||||||||||||||||||||||||
At January 1 | 12 | 301 | — | — | — | — | — | — | — | 313 | — | — | 313 | |||||||||||||
Revisions and reclassifications | (2 | ) | (2 | ) | — | — | — | — | — | — | — | (4 | ) | — | — | (4 | ) | |||||||||
Improved recovery | — | — | — | — | — | — | — | — | — | — | — | — | — | |||||||||||||
Extensions and discoveries | — | 18 | — | — | — | — | — | — | — | 18 | — | — | 18 | |||||||||||||
Purchases of minerals in place | — | — | — | — | — | — | — | — | — | — | — | — | — | |||||||||||||
Sales of minerals in place | — | — | — | — | — | — | — | — | — | — | — | — | — | |||||||||||||
Production | (1 | ) | (37 | ) | — | — | — | — | — | — | — | (38 | ) | — | — | (38 | ) | |||||||||
At December 31 | 9 | 281 | — | — | — | — | — | — | — | 290 | — | — | 290 | |||||||||||||
Total | 377 | 1,783 | 129 | 420 | 1,017 | 23 | 661 | — | 1,027 | 4,776 | 661 | — | 5,437 | |||||||||||||
Reserves attributable to non-controlling interest in Shell subsidiaries at December 31 | — | — | — | — | — | — | 331 | — | — | — | 331 | — | 331 | |||||||||||||
[A] Includes 1 million barrels consumed in operations for synthetic crude oil.
Proved developed reserves 2018 | Million barrels | |||||||||||||||||||||||||
North America | ||||||||||||||||||||||||||
Europe | Asia | Oceania | Africa | USA | Canada | South America | Total | |||||||||||||||||||
Oil and NGL | Oil and NGL | Oil and NGL | Oil and NGL | Oil and NGL | Oil and NGL | Synthetic crude oil | Bitumen | Oil and NGL | Oil and NGL | Synthetic crude oil | Bitumen | All products | ||||||||||||||
Shell subsidiaries | ||||||||||||||||||||||||||
At January 1 | 250 | 1,364 | 46 | 373 | 569 | 21 | 649 | — | 651 | 3,274 | 649 | — | 3,923 | |||||||||||||
At December 31 | 243 | 1,318 | 108 | 335 | 629 | 21 | 661 | — | 634 | 3,288 | 661 | — | 3,949 | |||||||||||||
Shell share of joint ventures and associates | ||||||||||||||||||||||||||
At January 1 | 11 | 253 | — | — | — | — | — | — | — | 264 | — | — | 264 | |||||||||||||
At December 31 | 8 | 251 | — | — | — | — | — | — | — | 259 | — | — | 259 | |||||||||||||
FINANCIAL STATEMENTS AND SUPPLEMENTS SHELL ANNUAL REPORT AND FORM 20-F 2019 | 192 | |
Proved undeveloped reserves 2018 | Million barrels | |||||||||||||||||||||||||
North America | ||||||||||||||||||||||||||
Europe | Asia | Oceania | Africa | USA | Canada | South America | Total | |||||||||||||||||||
Oil and NGL | Oil and NGL | Oil and NGL | Oil and NGL | Oil and NGL | Oil and NGL | Synthetic crude oil | Bitumen | Oil and NGL | Oil and NGL | Synthetic crude oil | Bitumen | All products | ||||||||||||||
Shell subsidiaries | ||||||||||||||||||||||||||
At January 1 | 106 | 118 | 86 | 90 | 330 | 1 | — | — | 295 | 1,026 | — | — | 1,026 | |||||||||||||
At December 31 | 124 | 185 | 21 | 85 | 388 | 2 | — | — | 394 | 1,199 | — | — | 1,199 | |||||||||||||
Shell share of joint ventures and associates | ||||||||||||||||||||||||||
At January 1 | 1 | 48 | — | — | — | — | — | — | — | 49 | — | — | 49 | |||||||||||||
At December 31 | 1 | 30 | — | — | — | — | — | — | — | 31 | — | — | 31 | |||||||||||||
Proved developed and undeveloped reserves 2017 | Million barrels | |||||||||||||||||||||||||
North America | ||||||||||||||||||||||||||
Europe | Asia | Oceania | Africa | USA | Canada | South America | Total | |||||||||||||||||||
Oil and NGL | Oil and NGL | Oil and NGL | Oil and NGL | Oil and NGL | Oil and NGL | Synthetic crude oil | Bitumen | Oil and NGL | Oil and NGL | Synthetic crude oil | Bitumen | All products | ||||||||||||||
Shell subsidiaries | ||||||||||||||||||||||||||
At January 1 | 435 | 1,386 | 128 | 529 | 491 | 18 | 2,014 | 2 | 992 | 3,979 | 2,014 | 2 | 5,995 | |||||||||||||
Revisions and reclassifications | 61 | 153 | 13 | 23 | 235 | 8 | (3 | ) | 2 | 38 | 531 | (3 | ) | 2 | 530 | |||||||||||
Improved recovery | — | 35 | — | — | 38 | — | — | — | — | 73 | — | — | 73 | |||||||||||||
Extensions and discoveries | — | 95 | — | — | 242 | 7 | — | — | 30 | 374 | — | — | 374 | |||||||||||||
Purchases of minerals in place | — | — | — | — | 2 | — | 664 | — | — | 2 | 664 | — | 666 | |||||||||||||
Sales of minerals in place | (50 | ) | — | — | (14 | ) | — | — | (1,992 | ) | (2 | ) | — | (64 | ) | (1,992 | ) | (2 | ) | (2,058 | ) | |||||
Production [A] | (90 | ) | (187 | ) | (9 | ) | (75 | ) | (109 | ) | (11 | ) | (34 | ) | (2 | ) | (114 | ) | (595 | ) | (34 | ) | (2 | ) | (631 | ) |
At December 31 | 356 | 1,482 | 132 | 463 | 899 | 22 | 649 | — | 946 | 4,300 | 649 | — | 4,949 | |||||||||||||
Shell share of joint ventures and associates | ||||||||||||||||||||||||||
At January 1 | 7 | 256 | — | — | — | — | — | — | — | 263 | — | — | 263 | |||||||||||||
Revisions and reclassifications | 6 | 76 | — | — | — | — | — | — | — | 82 | — | — | 82 | |||||||||||||
Improved recovery | — | 3 | — | — | — | — | — | — | — | 3 | — | — | 3 | |||||||||||||
Extensions and discoveries | — | 1 | — | — | — | — | — | — | — | 1 | — | — | 1 | |||||||||||||
Purchases of minerals in place | — | — | — | — | — | — | — | — | — | — | — | — | — | |||||||||||||
Sales of minerals in place | — | — | — | — | — | — | — | — | — | — | — | — | — | |||||||||||||
Production | (1 | ) | (35 | ) | — | — | — | — | — | — | — | (36 | ) | — | — | (36 | ) | |||||||||
At December 31 | 12 | 301 | — | — | — | — | — | — | — | 313 | — | — | 313 | |||||||||||||
Total | 368 | 1,783 | 132 | 463 | 899 | 22 | 649 | — | 946 | 4,613 | 649 | — | 5,262 | |||||||||||||
Reserves attributable to non-controlling interest in Shell subsidiaries at December 31 | — | — | — | — | — | — | 325 | — | — | — | 325 | — | 325 | |||||||||||||
[A] Includes 1 million barrels consumed in operations for synthetic crude oil.
Proved developed reserves 2017 | Million barrels | |||||||||||||||||||||||||
North America | ||||||||||||||||||||||||||
Europe | Asia | Oceania | Africa | USA | Canada | South America | Total | |||||||||||||||||||
Oil and NGL | Oil and NGL | Oil and NGL | Oil and NGL | Oil and NGL | Oil and NGL | Synthetic crude oil | Bitumen | Oil and NGL | Oil and NGL | Synthetic crude oil | Bitumen | All products | ||||||||||||||
Shell subsidiaries | ||||||||||||||||||||||||||
At January 1 | 257 | 1,184 | 36 | 461 | 437 | 14 | 1,387 | 2 | 543 | 2,932 | 1,387 | 2 | 4,321 | |||||||||||||
At December 31 | 250 | 1,364 | 46 | 373 | 569 | 21 | 649 | — | 651 | 3,274 | 649 | — | 3,923 | |||||||||||||
Shell share of joint ventures and associates | ||||||||||||||||||||||||||
At January 1 | 4 | 215 | — | — | — | — | — | — | — | 219 | — | — | 219 | |||||||||||||
At December 31 | 11 | 253 | — | — | — | — | — | — | — | 264 | — | — | 264 | |||||||||||||
FINANCIAL STATEMENTS AND SUPPLEMENTS SHELL ANNUAL REPORT AND FORM 20-F 2019 | 193 | |
Proved undeveloped reserves 2017 | Million barrels | |||||||||||||||||||||||||
North America | ||||||||||||||||||||||||||
Europe | Asia | Oceania | Africa | USA | Canada | South America | Total | |||||||||||||||||||
Oil and NGL | Oil and NGL | Oil and NGL | Oil and NGL | Oil and NGL | Oil and NGL | Synthetic crude oil | Bitumen | Oil and NGL | Oil and NGL | Synthetic crude oil | Bitumen | All products | ||||||||||||||
Shell subsidiaries | ||||||||||||||||||||||||||
At January 1 | 178 | 202 | 92 | 68 | 54 | 4 | 627 | — | 449 | 1,047 | 627 | — | 1,674 | |||||||||||||
At December 31 | 106 | 118 | 86 | 90 | 330 | 1 | — | — | 295 | 1,026 | — | — | 1,026 | |||||||||||||
Shell share of joint ventures and associates | ||||||||||||||||||||||||||
At January 1 | 3 | 41 | — | — | — | — | — | — | — | 44 | — | — | 44 | |||||||||||||
At December 31 | 1 | 48 | — | — | — | — | — | — | — | 49 | — | — | 49 | |||||||||||||
NATURAL GAS
Shell subsidiaries’ proved reserves of natural gas at the end of the year, their share of the proved reserves of joint ventures and associates at the end of the year, and the changes in such reserves during the years are set out on pages 194-197. Significant changes in these proved reserves are discussed below. Volumes are not adjusted to standard heat content. Apart from integrated projects, volumes of gas are reported on an “as-sold” basis. The price used to calculate future revenue and cash flows from proved gas reserves is the contract price or the 12-month average on “as-sold” volumes. Volumes associated with integrated projects are those measured at a designated transfer point between the upstream and downstream portions of the integrated project. Natural gas volumes are converted into oil equivalent using a factor of 5,800 scf per barrel.
PROVED RESERVES 2019–2018
Shell subsidiaries
Asia
The net increase of 859 thousand million scf in revisions and reclassifications was mainly in Qatar and Malaysia (Sabah and Sarawak).
Oceania
The net increase of 699 thousand million scf in revisions and reclassifications was mainly in Surat, Gorgon and Jansz-lo.
Africa
The net increase of 290 thousand million scf in revisions and reclassifications was mainly in Bonny and Gbaran (Nigeria).
Canada
The net increase of 317 thousand million scf in extensions and discoveries was mainly in Groundbirch.
Shell share of joint ventures and associates
Europe
The net decrease of 322 thousand million scf in revisions and reclassifications was mainly in Groningen (Netherlands).
PROVED RESERVES 2018–2017
Shell subsidiaries
Europe
The net increase of 1,183 thousand million scf in revisions and reclassifications was mainly in Norway, the UK, Denmark and Germany.
Asia
The net decrease of 483 thousand million scf in revisions and reclassifications was mainly in Qatar, Malaysia and Kazakhstan. The increase of 354 thousand million scf in extensions and discoveries was in Malaysia.
Oceania
The net increase of 1,438 thousand million scf in revisions and reclassifications was mainly in the Surat Basin, Jansz-lo and Gorgon (all Australia).
Africa
The net increase of 896 thousand million scf in revisions and reclassifications was mainly in Gbaran, Assa North, Forcaddos-Yokri (Nigeria) and Sapphire (Egypt).
USA
The net decrease of 296 thousand million scf in revisions and reclassifications was mainly in Tioga. The increase of 283 thousand million scf in extensions and discoveries was mainly in the Permian Basin.
Shell share of joint ventures and associates
Europe
The net decrease of 3,653 thousand million scf in revisions and reclassifications was mainly in Groningen (the Netherlands). Groningen: The decrease of 3,673 thousand million scf is as a result of the Dutch cabinet’s announcement on March 29, 2018, about its aspiration to end Groningen production by 2030, and an
FINANCIAL STATEMENTS AND SUPPLEMENTS SHELL ANNUAL REPORT AND FORM 20-F 2019 | 194 | |
agreement signed by Shell, ExxonMobil and the Dutch government in June 2018. The proved reserves are aligned with the new regulatory framework and the updated production outlook issued in November 2018 by the Dutch Ministry of Economic Affairs.
Proved developed and undeveloped reserves 2019 | Thousand million standard cubic feet | |||||||||||||||
North America | South America | |||||||||||||||
Europe | Asia | Oceania | Africa | USA | Canada | Total | ||||||||||
Shell subsidiaries | ||||||||||||||||
At January 1 | 3,600 | 10,631 | 8,427 | 2,544 | 2,147 | 989 | 1,509 | 29,847 | ||||||||
Revisions and reclassifications | (46 | ) | 859 | 699 | 290 | 114 | 235 | 29 | 2,180 | |||||||
Improved recovery | — | — | — | — | — | — | 3 | 3 | ||||||||
Extensions and discoveries | — | 36 | — | 152 | 142 | 317 | 37 | 684 | ||||||||
Purchases of minerals in place | — | — | — | — | 5 | — | — | 5 | ||||||||
Sales of minerals in place | (210 | ) | — | — | — | (132 | ) | (30 | ) | — | (372 | ) | ||||
Production [A] | (346 | ) | (908 | ) | (766 | ) | (378 | ) | (408 | ) | (230 | ) | (319 | ) | (3,355 | ) |
At December 31 | 2,998 | 10,618 | 8,360 | 2,608 | 1,868 | 1,281 | 1,259 | 28,992 | ||||||||
Shell share of joint ventures and associates | ||||||||||||||||
At January 1 | 1,163 | 4,581 | 24 | — | — | — | — | 5,768 | ||||||||
Revisions and reclassifications | (322 | ) | 64 | 34 | — | — | — | — | (224 | ) | ||||||
Improved recovery | — | 1 | — | — | — | — | — | 1 | ||||||||
Extensions and discoveries | — | 5 | — | — | — | — | — | 5 | ||||||||
Purchases of minerals in place | — | — | — | — | — | — | — | — | ||||||||
Sales of minerals in place | — | — | — | — | — | — | — | — | ||||||||
Production [B] | (246 | ) | (453 | ) | (22 | ) | — | — | — | — | (721 | ) | ||||
At December 31 | 595 | 4,198 | 36 | — | — | — | — | 4,829 | ||||||||
Total | 3,593 | 14,816 | 8,396 | 2,608 | 1,868 | 1,281 | 1,259 | 33,821 | ||||||||
Reserves attributable to non-controlling interest in shell subsidiaries at December 31 | — | — | — | — | — | — | — | — | ||||||||
[A] Includes 247 thousand million standard cubic feet consumed in operations.
[B] Includes 42 thousand million standard cubic feet consumed in operations.
Proved developed reserves 2019 | Thousand million standard cubic feet | |||||||||||||||
North America | South America | |||||||||||||||
Europe | Asia | Oceania | Africa | USA | Canada | Total | ||||||||||
Shell subsidiaries | ||||||||||||||||
At January 1 | 2,658 | 10,092 | 5,820 | 1,573 | 1,706 | 721 | 1,238 | 23,808 | ||||||||
At December 31 | 2,060 | 10,091 | 5,769 | 1,523 | 1,615 | 781 | 968 | 22,807 | ||||||||
Shell share of joint ventures and associates | ||||||||||||||||
At January 1 | 1,136 | 3,938 | 24 | — | — | — | — | 5,099 | ||||||||
At December 31 | 555 | 3,519 | 36 | — | — | — | — | 4,110 | ||||||||
Proved undeveloped reserves 2019 | Thousand million standard cubic feet | |||||||||||||||
North America | South America | |||||||||||||||
Europe | Asia | Oceania | Africa | USA | Canada | Total | ||||||||||
Shell subsidiaries | ||||||||||||||||
At January 1 | 942 | 539 | 2,607 | 971 | 441 | 268 | 271 | 6,039 | ||||||||
At December 31 | 937 | 528 | 2,591 | 1,085 | 254 | 499 | 291 | 6,185 | ||||||||
Shell share of joint ventures and associates | ||||||||||||||||
At January 1 | 27 | 643 | — | — | — | — | — | 670 | ||||||||
At December 31 | 39 | 680 | — | — | — | — | — | 719 | ||||||||
FINANCIAL STATEMENTS AND SUPPLEMENTS SHELL ANNUAL REPORT AND FORM 20-F 2019 | 195 | |
Proved developed and undeveloped reserves 2018 | Thousand million standard cubic feet | |||||||||||||||
North America | South America | |||||||||||||||
Europe | Asia | Oceania | Africa | USA | Canada | Total | ||||||||||
Shell subsidiaries | ||||||||||||||||
At January 1 | 3,100 | 11,822 | 7,978 | 2,082 | 2,569 | 1,272 | 1,501 | 30,324 | ||||||||
Revisions and reclassifications | 1,183 | (483 | ) | 1,438 | 896 | (296 | ) | (153 | ) | 181 | 2,766 | |||||
Improved recovery | — | — | — | — | — | — | 7 | 7 | ||||||||
Extensions and discoveries | 3 | 354 | — | — | 283 | 131 | 65 | 836 | ||||||||
Purchases of minerals in place | — | — | — | — | — | — | 14 | 14 | ||||||||
Sales of minerals in place | (192 | ) | (157 | ) | (232 | ) | — | (32 | ) | — | — | (613 | ) | |||
Production [A] | (494 | ) | (906 | ) | (757 | ) | (434 | ) | (377 | ) | (261 | ) | (258 | ) | (3,487 | ) |
At December 31 | 3,600 | 10,631 | 8,427 | 2,544 | 2,147 | 989 | 1,509 | 29,847 | ||||||||
Shell share of joint ventures and associates | ||||||||||||||||
At January 1 | 5,125 | 4,964 | 19 | — | — | — | — | 10,108 | ||||||||
Revisions and reclassifications | (3,653 | ) | 62 | 25 | — | — | — | — | (3,566 | ) | ||||||
Improved recovery | — | — | — | — | — | — | — | — | ||||||||
Extensions and discoveries | — | 5 | — | — | — | — | — | 5 | ||||||||
Purchases of minerals in place | — | — | — | — | — | — | — | — | ||||||||
Sales of minerals in place | (37 | ) | — | — | — | — | — | — | (37 | ) | ||||||
Production [B] | (273 | ) | (450 | ) | (20 | ) | — | — | — | — | (743 | ) | ||||
At December 31 | 1,163 | 4,581 | 24 | — | — | — | — | 5,768 | ||||||||
Total | 4,763 | 15,212 | 8,451 | 2,544 | 2,147 | 989 | 1,509 | 35,615 | ||||||||
Reserves attributable to non-controlling interest in Shell subsidiaries at December 31 | — | — | — | — | — | — | — | — | ||||||||
[A] Includes 245 thousand million standard cubic feet consumed in operations.
[B] Includes 41 thousand million standard cubic feet consumed in operations.
Proved developed reserves 2018 | Thousand million standard cubic feet | |||||||||||||||
North America | South America | |||||||||||||||
Europe | Asia | Oceania | Africa | USA | Canada | Total | ||||||||||
Shell subsidiaries | ||||||||||||||||
At January 1 | 2,978 | 11,460 | 5,026 | 1,493 | 1,652 | 859 | 1,225 | 24,693 | ||||||||
At December 31 | 2,658 | 10,092 | 5,820 | 1,573 | 1,706 | 721 | 1,238 | 23,808 | ||||||||
Shell share of joint ventures and associates | ||||||||||||||||
At January 1 | 5,055 | 4,275 | 19 | — | — | — | — | 9,349 | ||||||||
At December 31 | 1,136 | 3,938 | 24 | — | — | — | — | 5,099 | ||||||||
Proved undeveloped reserves 2018 | Thousand million standard cubic feet | |||||||||||||||
North America | South America | |||||||||||||||
Europe | Asia | Oceania | Africa | USA | Canada | Total | ||||||||||
Shell subsidiaries | ||||||||||||||||
At January 1 | 122 | 362 | 2,952 | 589 | 917 | 413 | 276 | 5,631 | ||||||||
At December 31 | 942 | 539 | 2,607 | 971 | 441 | 268 | 271 | 6,039 | ||||||||
Shell share of joint ventures and associates | ||||||||||||||||
At January 1 | 70 | 689 | — | — | — | — | — | 759 | ||||||||
At December 31 | 27 | 643 | — | — | — | — | — | 670 | ||||||||
FINANCIAL STATEMENTS AND SUPPLEMENTS SHELL ANNUAL REPORT AND FORM 20-F 2019 | 196 | |
Proved developed and undeveloped reserves 2017 | Thousand million standard cubic feet | |||||||||||||||
North America | South America | |||||||||||||||
Europe | Asia | Oceania | Africa | USA | Canada | Total | ||||||||||
Shell subsidiaries | ||||||||||||||||
At January 1 | 3,741 | 11,073 | 9,051 | 2,225 | 675 | 844 | 1,650 | 29,259 | ||||||||
Revisions and reclassifications | 197 | 979 | (574 | ) | 287 | 958 | 412 | 45 | 2,304 | |||||||
Improved recovery | — | 66 | — | — | 74 | — | — | 140 | ||||||||
Extensions and discoveries | 2 | 549 | — | — | 1,163 | 205 | 6 | 1,925 | ||||||||
Purchases of minerals in place | — | — | 204 | — | 3 | 43 | 27 | 277 | ||||||||
Sales of minerals in place | (224 | ) | — | — | (7 | ) | (11 | ) | (6 | ) | — | (248 | ) | |||
Production [A] | (616 | ) | (845 | ) | (703 | ) | (423 | ) | (293 | ) | (226 | ) | (227 | ) | (3,333 | ) |
At December 31 | 3,100 | 11,822 | 7,978 | 2,082 | 2,569 | 1,272 | 1,501 | 30,324 | ||||||||
Shell share of joint ventures and associates | ||||||||||||||||
At January 1 | 6,497 | 4,754 | 31 | — | — | — | — | 11,282 | ||||||||
Revisions and reclassifications | (1,027 | ) | 652 | 9 | — | — | — | — | (366 | ) | ||||||
Improved recovery | — | 1 | — | — | — | — | — | 1 | ||||||||
Extensions and discoveries | — | 11 | — | — | — | — | — | 11 | ||||||||
Purchases of minerals in place | — | — | — | — | — | — | — | — | ||||||||
Sales of minerals in place | — | — | — | — | — | — | — | — | ||||||||
Production [B] | (345 | ) | (454 | ) | (21 | ) | — | — | — | — | (820 | ) | ||||
At December 31 | 5,125 | 4,964 | 19 | — | — | — | — | 10,108 | ||||||||
Total | 8,225 | 16,786 | 7,997 | 2,082 | 2,569 | 1,272 | 1,501 | 40,432 | ||||||||
Reserves attributable to non-controlling interest in Shell subsidiaries at December 31 | — | 2 | — | — | — | — | — | 2 | ||||||||
[A] Includes 215 thousand million standard cubic feet consumed in operations.
[B] Includes 41 thousand million standard cubic feet consumed in operations.
Proved developed reserves 2017 | Thousand million standard cubic feet | |||||||||||||||
North America | South America | |||||||||||||||
Europe | Asia | Oceania | Africa | USA | Canada | Total | ||||||||||
Shell subsidiaries | ||||||||||||||||
At January 1 | 3,437 | 10,569 | 3,966 | 1,618 | 563 | 458 | 1,172 | 21,783 | ||||||||
At December 31 | 2,978 | 11,460 | 5,026 | 1,493 | 1,652 | 859 | 1,225 | 24,693 | ||||||||
Shell share of joint ventures and associates | ||||||||||||||||
At January 1 | 5,240 | 4,110 | 31 | — | — | — | — | 9,381 | ||||||||
At December 31 | 5,055 | 4,275 | 19 | — | — | — | — | 9,349 | ||||||||
Proved undeveloped reserves 2017 | Thousand million standard cubic feet | |||||||||||||||
North America | South America | |||||||||||||||
Europe | Asia | Oceania | Africa | USA | Canada | Total | ||||||||||
Shell subsidiaries | ||||||||||||||||
At January 1 | 304 | 504 | 5,085 | 607 | 112 | 386 | 478 | 7,476 | ||||||||
At December 31 | 122 | 362 | 2,952 | 589 | 917 | 413 | 276 | 5,631 | ||||||||
Shell share of joint ventures and associates | ||||||||||||||||
At January 1 | 1,257 | 644 | — | — | — | — | — | 1,901 | ||||||||
At December 31 | 70 | 689 | — | — | — | — | — | 759 | ||||||||
STANDARDISED MEASURE OF DISCOUNTED FUTURE CASH FLOWS
The SEC Form 20-F requires the disclosure of a standardised measure of discounted future net cash flows, relating to proved reserves quantities and based on a 12-month unweighted arithmetic average sales price, calculated on a first-day-of-the-month basis, with cost factors based on those at the end of each year, currently enacted tax rates and a 10% annual discount factor. In our view, the information so calculated does not provide a reliable measure of future cash flows
FINANCIAL STATEMENTS AND SUPPLEMENTS SHELL ANNUAL REPORT AND FORM 20-F 2019 | 197 | |
from proved reserves, nor does it permit a realistic comparison to be made of one entity with another because the assumptions used cannot reflect the varying circumstances within each entity. In addition, a substantial but unknown proportion of future real cash flows from oil and gas production activities is expected to derive from reserves which have already been discovered, but which cannot yet be regarded as proved.
STANDARDISED MEASURE OF DISCOUNTED FUTURE CASH FLOWS RELATING TO PROVED RESERVES AT DECEMBER 31
2019 - Shell subsidiaries | $ million | |||||||||||||||
North America | South America | |||||||||||||||
Europe | Asia | Oceania | Africa | USA | Canada | Total | ||||||||||
Future cash inflows | 33,762 | 111,802 | 71,775 | 31,046 | 55,800 | 31,522 | 64,957 | 400,664 | ||||||||
Future production costs | 11,818 | 32,581 | 21,589 | 12,158 | 30,139 | 16,651 | 32,362 | 157,298 | ||||||||
Future development costs | 6,047 | 13,449 | 10,103 | 4,081 | 11,137 | 4,603 | 13,219 | 62,639 | ||||||||
Future tax expenses | 9,285 | 25,938 | 7,016 | 10,542 | 2,397 | 2,313 | 5,429 | 62,920 | ||||||||
Future net cash flows | 6,612 | 39,834 | 33,067 | 4,265 | 12,127 | 7,955 | 13,947 | 117,807 | ||||||||
Effect of discounting cash flows at 10% | 1,917 | 17,851 | 13,328 | 377 | 1,815 | 5,571 | 4,094 | 44,953 | ||||||||
Standardised measure of discounted future net cash flows | 4,695 | 21,983 | 19,739 | 3,888 | 10,312 | 2,384 | 9,853 | 72,854 | ||||||||
Non-controlling interest included | — | — | — | — | — | 1,371 | — | 1,371 | ||||||||
2019 - Shell share of joint ventures and associates | $ million | ||||||||||||||||
North America | South America | ||||||||||||||||
Europe | Asia | Oceania | Africa | USA | Canada | Total | |||||||||||
Future cash inflows | 3,615 | 38,099 | 122 | — | — | — | — | 41,836 | |||||||||
Future production costs | 2,810 | 18,336 | 81 | — | — | — | — | 21,227 | |||||||||
Future development costs | 935 | 6,946 | 36 | — | — | — | — | 7,917 | |||||||||
Future tax expenses | 718 | 6,160 | 4 | — | — | — | — | 6,882 | |||||||||
Future net cash flows | (848 | ) | 6,657 | 1 | — | — | — | — | 5,812 | ||||||||
Effect of discounting cash flows at 10% | (266 | ) | 1,190 | (7 | ) | — | — | — | — | 917 | |||||||
Standardised measure of discounted future net cash flows | (582 | ) | [A] | 5,467 | 8 | — | — | — | — | 4,893 | |||||||
[A] While proved reserves are economically producible at the 2019 yearly average price, the standardised measure of discounted future net cash flows was negative for those proved reserves at December 31, 2019, due to addition of overhead, tax and abandonment costs and ongoing commitments post production of proved reserves.
2018 - Shell subsidiaries | South America | $ million | ||||||||||||||
North America | ||||||||||||||||
Europe | Asia | Oceania | Africa | USA | Canada | Total | ||||||||||
Future cash inflows | 50,392 | 122,037 | 72,355 | 36,080 | 68,546 | 34,719 | 74,417 | 458,545 | ||||||||
Future production costs | 18,400 | 32,773 | 22,219 | 13,237 | 32,533 | 17,378 | 42,301 | 178,842 | ||||||||
Future development costs | 8,649 | 12,301 | 11,598 | 4,672 | 11,486 | 4,674 | 6,991 | 60,370 | ||||||||
Future tax expenses | 12,603 | 30,994 | 5,899 | 12,805 | 1,948 | 3,257 | 7,764 | 75,271 | ||||||||
Future net cash flows | 10,739 | 45,969 | 32,639 | 5,366 | 22,578 | 9,411 | 17,360 | 144,062 | ||||||||
Effect of discounting cash flows at 10% | 3,024 | 20,957 | 12,130 | 572 | 5,039 | 6,446 | 6,048 | 54,217 | ||||||||
Standardised measure of discounted future net cash flows | 7,715 | 25,012 | 20,509 | 4,794 | 17,539 | 2,964 | 11,312 | 89,845 | ||||||||
Non-controlling interest included | — | 1 | — | — | — | 1,638 | — | 1,639 | ||||||||
FINANCIAL STATEMENTS AND SUPPLEMENTS SHELL ANNUAL REPORT AND FORM 20-F 2019 | 198 | |
2018 - Shell share of joint ventures and associates | $ million | ||||||||||||||||
North America | South America | ||||||||||||||||
Europe | Asia | Oceania | Africa | USA | Canada | Total | |||||||||||
Future cash inflows | 5,260 | 44,327 | 104 | — | — | — | — | 49,691 | |||||||||
Future production costs | 2,712 | 20,886 | 80 | — | — | — | — | 23,677 | |||||||||
Future development costs | 1,083 | 6,726 | 36 | — | — | — | — | 7,844 | |||||||||
Future tax expenses | 1,136 | 7,128 | 1 | — | — | — | — | 8,265 | |||||||||
Future net cash flows | 329 | 9,588 | (13 | ) | — | — | — | — | 9,904 | ||||||||
Effect of discounting cash flows at 10% | (76 | ) | 2,759 | (8 | ) | — | — | — | — | 2,675 | |||||||
Standardised measure of discounted future net cash flows | 405 | 6,829 | (5 | ) | [A] | — | — | — | — | 7,229 | |||||||
[A] While proved reserves are economically producible at the 2018 yearly average price, the standardised measure of discounted future net cash flows was negative for those proved reserves at December 31, 2018, due to addition of overhead, tax and abandonment costs and ongoing commitments post production of proved reserves.
2017 - Shell subsidiaries | $ million | |||||||||||||||||
North America | South America | |||||||||||||||||
Europe | Asia | Oceania | Africa | USA | Canada | Total | ||||||||||||
Future cash inflows | 34,902 | 94,535 | 51,052 | 29,276 | 49,389 | 32,576 | 50,620 | 342,350 | ||||||||||
Future production costs | 15,672 | 30,894 | 18,264 | 11,496 | 29,505 | 20,242 | 30,924 | 156,997 | ||||||||||
Future development costs | 7,852 | 12,558 | 14,062 | 4,920 | 14,200 | 5,115 | 6,210 | 64,917 | ||||||||||
Future tax expenses | 5,747 | 18,048 | 1,169 | 9,064 | 2,177 | 2,509 | 4,888 | 43,602 | ||||||||||
Future net cash flows | 5,631 | 33,035 | 17,557 | 3,796 | 3,507 | 4,710 | 8,598 | 76,834 | ||||||||||
Effect of discounting cash flows at 10% | 825 | 15,115 | 5,773 | (9 | ) | (796 | ) | 3,077 | 2,325 | 26,310 | ||||||||
Standardised measure of discounted future net cash flows | 4,806 | 17,920 | 11,784 | 3,805 | 4,303 | 1,633 | 6,273 | 50,524 | ||||||||||
Non-controlling interest included | — | 1 | — | — | — | 870 | — | 871 | ||||||||||
2017 - Shell share of joint ventures and associates | $ million | ||||||||||||||||
North America | South America | ||||||||||||||||
Europe | Asia | Oceania | Africa | USA | Canada | Total | |||||||||||
Future cash inflows | 22,725 | 37,954 | 69 | — | — | — | — | 60,748 | |||||||||
Future production costs | 17,442 | 17,592 | 54 | — | — | — | — | 35,088 | |||||||||
Future development costs | 1,051 | 7,605 | 64 | — | — | — | — | 8,720 | |||||||||
Future tax expenses | 1,803 | 5,172 | — | — | — | — | — | 6,975 | |||||||||
Future net cash flows | 2,429 | 7,585 | (49 | ) | — | — | — | — | 9,965 | ||||||||
Effect of discounting cash flows at 10% | 1,008 | 1,862 | (14 | ) | — | — | — | — | 2,856 | ||||||||
Standardised measure of discounted future net cash flows | 1,421 | 5,723 | (35 | ) | [A] | — | — | — | — | 7,109 | |||||||
[A] While proved reserves are economically producible at the 2017 yearly average price, the standardised measure of discounted future net cash flows was negative for those proved reserves at December 31, 2017, due to addition of overhead, tax and abandonment costs and ongoing commitments post production of proved reserves.
FINANCIAL STATEMENTS AND SUPPLEMENTS SHELL ANNUAL REPORT AND FORM 20-F 2019 | 199 | |
CHANGE IN STANDARDISED MEASURE OF DISCOUNTED FUTURE NET CASH FLOWS RELATING TO PROVED RESERVES
2019 | $ million | |||||
Shell subsidiaries | Shell share of joint ventures and associates | Total | ||||
At January 1 | 89,845 | 7,229 | 97,074 | |||
Net changes in prices and production costs | (18,759 | ) | (1,017 | ) | (19,776 | ) |
Revisions of previous reserves estimates | 13,777 | (293 | ) | 13,484 | ||
Extensions, discoveries and improved recovery | 5,193 | 93 | 5,286 | |||
Purchases and sales of minerals in place | (2,831 | ) | — | (2,831 | ) | |
Development cost related to future production | (9,417 | ) | (2 | ) | (9,419 | ) |
Sales and transfers of oil and gas, net of production costs | (33,319 | ) | (3,918 | ) | (37,237 | ) |
Development cost incurred during the year | 10,430 | 702 | 11,132 | |||
Accretion of discount | 12,004 | 1,133 | 13,137 | |||
Net change in income tax | 5,931 | 966 | 6,897 | |||
At December 31 | 72,854 | 4,893 | 77,747 | |||
2018 | $ million | |||||
Shell subsidiaries | Shell share of joint ventures and associates | Total | ||||
At January 1 | 50,524 | 7,109 | 57,633 | |||
Net changes in prices and production costs | 58,128 | 6,156 | 64,284 | |||
Revisions of previous reserves estimates | 15,265 | (1,447 | ) | 13,818 | ||
Extensions, discoveries and improved recovery | 8,936 | 532 | 9,468 | |||
Purchases and sales of minerals in place | (3,401 | ) | (20 | ) | (3,421 | ) |
Development cost related to future production | (3,876 | ) | (308 | ) | (4,184 | ) |
Sales and transfers of oil and gas, net of production costs | (38,014 | ) | (4,858 | ) | (42,872 | ) |
Development cost incurred during the year | 10,724 | 666 | 11,390 | |||
Accretion of discount | 7,060 | 994 | 8,054 | |||
Net change in income tax | (15,501 | ) | (1,595 | ) | (17,096 | ) |
At December 31 | 89,845 | 7,229 | 97,074 | |||
2017 | $ million | |||||
Shell subsidiaries | Shell share of joint ventures and associates | Total | ||||
At January 1 | 27,718 | 4,176 | 31,894 | |||
Net changes in prices and production costs | 34,190 | 3,952 | 38,142 | |||
Revisions of previous reserves estimates | 13,769 | 1,931 | 15,700 | |||
Extensions, discoveries and improved recovery | 3,901 | 79 | 3,980 | |||
Purchases and sales of minerals in place | (2,068 | ) | — | (2,068 | ) | |
Development cost related to future production | (4,823 | ) | 461 | (4,362 | ) | |
Sales and transfers of oil and gas, net of production costs | (27,544 | ) | (3,652 | ) | (31,196 | ) |
Development cost incurred during the year | 14,262 | 536 | 14,798 | |||
Accretion of discount | 3,844 | 630 | 4,474 | |||
Net change in income tax | (12,725 | ) | (1,004 | ) | (13,729 | ) |
At December 31 | 50,524 | 7,109 | 57,633 | |||
OIL AND GAS EXPLORATION AND PRODUCTION ACTIVITIES CAPITALISED COSTS
The aggregate amount of property, plant and equipment and intangible assets, excluding goodwill, relating to oil and gas exploration and production activities, and the aggregate amount of the related depreciation, depletion and amortisation at December 31, are shown in the tables below.
FINANCIAL STATEMENTS AND SUPPLEMENTS SHELL ANNUAL REPORT AND FORM 20-F 2019 | 200 | |
SHELL SUBSIDIARIES
$ million | |||||
2019 | 2018 | ||||
Cost | |||||
Proved properties [A] | 265,700 | 265,489 | |||
Unproved properties | 18,669 | 21,256 | |||
Support equipment and facilities | 11,043 | 6,404 | |||
295,412 | 293,149 | ||||
Depreciation, depletion and amortisation | |||||
Proved properties [A] | 129,809 | 126,641 | |||
Unproved properties | 4,089 | 3,362 | |||
Support equipment and facilities | 4,078 | 3,424 | |||
137,976 | 133,427 | ||||
Net capitalised costs | 157,436 | 159,722 | |||
[A] Includes capitalised asset decommissioning and restoration costs and related depreciation.
SHELL SHARE OF JOINT VENTURES AND ASSOCIATES
$ million | |||||
2019 | 2018 | ||||
Cost | |||||
Proved properties [A] | 46,895 | 44,331 | |||
Unproved properties | 2,428 | 2,591 | |||
Support equipment and facilities | 4,882 | 4,399 | |||
54,205 | 51,321 | ||||
Depreciation, depletion and amortisation | |||||
Proved properties [A] | 34,120 | 31,702 | |||
Unproved properties | — | — | |||
Support equipment and facilities | 2,817 | 2,586 | |||
36,937 | 34,288 | ||||
Net capitalised costs | 17,268 | 17,033 | |||
[A] Includes capitalised asset decommissioning and restoration costs and related depreciation.
OIL AND GAS EXPLORATION AND PRODUCTION ACTIVITIES COSTS INCURRED
Costs incurred during the year in oil and gas property acquisition, exploration and development activities, whether capitalised or charged to income currently, are shown in the tables below. As a result of the adoption of IFRS16 Leases as of January 1, 2019, leases are included in year 2019. Development costs include capitalised asset decommissioning and restoration costs (including increases or decreases arising from changes to cost estimates or to the discount rate applied to the obligations) and exclude costs of acquiring support equipment and facilities, but include depreciation thereon.
SHELL SUBSIDIARIES
2019 | $ million | ||||||||||||||||
North America | South | ||||||||||||||||
Europe | Asia | Oceania | Africa | USA | Other[A] | America | Total | ||||||||||
Acquisition of properties | |||||||||||||||||
Proved | 3 | 105 | — | 10 | — | — | — | 118 | |||||||||
Unproved | — | 11 | — | 67 | 118 | 5 | 3 | 204 | |||||||||
Exploration | 428 | 165 | 117 | 253 | 1,723 | 402 | 500 | 3,588 | [B] | ||||||||
Development | 2,054 | 1,434 | 1,225 | 1,480 | 4,455 | 287 | 2,418 | 13,353 | |||||||||
[A] Comprises Canada and Mexico.
[B] Includes $1,195 million of Shales-related exploration activities. In 2019, we participated in 231 Shales productive exploratory wells with proved reserves allocated (Shell share: 117 wells).
FINANCIAL STATEMENTS AND SUPPLEMENTS SHELL ANNUAL REPORT AND FORM 20-F 2019 | 201 | |
2018 | $ million | ||||||||||||||||
North America | South | ||||||||||||||||
Europe | Asia | Oceania | Africa | USA | Other[A] | America | Total | ||||||||||
Acquisition of properties | |||||||||||||||||
Proved | 3 | 3 | — | 596 | 44 | — | — | 646 | |||||||||
Unproved | 2 | 6 | — | 76 | 44 | 310 | 486 | 924 | |||||||||
Exploration | 384 | 182 | 49 | 188 | 1,912 | 251 | 502 | 3,468 | [B] | ||||||||
Development | 1,452 | 1,102 | 1,632 | 962 | 4,052 | 505 | 2,095 | 11,800 | |||||||||
[A] Comprises Canada, Honduras and Mexico.
[B] Includes $1,581 million of Shales-related exploration activities. In 2018, we participated in 234 Shales productive exploratory wells with proved reserves allocated (Shell share: 118 wells).
2017 | $ million | |||||||||||||||
North America | South | |||||||||||||||
Europe | Asia | Oceania | Africa | USA | Other[A] | America | Total | |||||||||
Acquisition of properties | ||||||||||||||||
Proved | — | — | — | 10 | — | 2,246 | 19 | 2,275 | ||||||||
Unproved | — | 12 | — | 18 | 141 | 320 | 57 | 548 | ||||||||
Exploration | 329 | 135 | 38 | 138 | 1,354 | 235 | 600 | 2,829 | ||||||||
Development | 776 | 840 | 2,493 | 371 | 4,123 | 722 | 1,671 | 10,996 | ||||||||
SHELL SHARE OF JOINT VENTURES AND ASSOCIATES
Joint ventures and associates did not incur costs in the acquisition of oil and gas properties in 2019, 2018 or 2017.
2019 | $ million | |||||||||||||||
North America | South | |||||||||||||||
Europe | Asia | Oceania | Africa | USA | Canada | America | Total | |||||||||
Exploration | 1 | 116 | 12 | — | — | — | — | 129 | ||||||||
Development | 94 | 1,400 | 65 | — | — | — | — | 1,559 | ||||||||
2018 | $ million | |||||||||||||||
North America | South | |||||||||||||||
Europe | Asia | Oceania | Africa | USA | Canada | America | Total | |||||||||
Exploration | — | 90 | 14 | — | — | — | — | 104 | ||||||||
Development | 229 | 1,026 | 79 | — | — | — | — | 1,334 | ||||||||
2017 | $ million | ||||||||||||||||
North America | South America | ||||||||||||||||
Europe | Asia | Oceania | Africa | USA | Canada | Total | |||||||||||
Exploration | 3 | 82 | 8 | — | — | — | — | 93 | |||||||||
Development | (22 | ) | [A] | 660 | 58 | — | — | — | — | 696 | |||||||
[A] Includes a revision of decommissioning and restoration provisions.
OIL AND GAS EXPLORATION AND PRODUCTION ACTIVITIES EARNINGS
The results of operations for oil and gas producing activities are shown in the tables below. Taxes other than income tax include cash-paid royalties to governments outside North America.
FINANCIAL STATEMENTS AND SUPPLEMENTS SHELL ANNUAL REPORT AND FORM 20-F 2019 | 202 | |
SHELL SUBSIDIARIES
2019 | $ million | |||||||||||||||
North America | South America | |||||||||||||||
Europe | Asia | Oceania | Africa | USA | Other[A] | Total | ||||||||||
Revenue | ||||||||||||||||
Third parties | 1,257 | 3,065 | 931 | 1,936 | 2,638 | 632 | 844 | 11,303 | ||||||||
Sales between businesses | 4,911 | 10,526 | 4,719 | 3,289 | 7,786 | 1,936 | 7,647 | 40,814 | ||||||||
Total | 6,168 | 13,591 | 5,650 | 5,225 | 10,424 | 2,568 | 8,491 | 52,117 | ||||||||
Production costs excluding taxes | 1,582 | 2,065 | 1,178 | 1,062 | 2,807 | 983 | 1,135 | 10,812 | ||||||||
Taxes other than income tax | 94 | 749 | 136 | 370 | 103 | — | 2,613 | 4,065 | ||||||||
Exploration | 619 | 583 | 107 | 187 | 411 | 159 | 288 | 2,354 | ||||||||
Depreciation, depletion and amortisation | 2,604 | 2,130 | 1,957 | 1,354 | 6,932 | 858 | 3,929 | 19,764 | ||||||||
Other costs/(income) | (20 | ) | 1,599 | (105 | ) | 121 | (575 | ) | 818 | 1,379 | 3,217 | |||||
Earnings before taxation | 1,289 | 6,465 | 2,377 | 2,131 | 746 | (250 | ) | (853 | ) | 11,905 | ||||||
Taxation charge/(credit) | 848 | 4,013 | 1,094 | 1,431 | 154 | (110 | ) | (78 | ) | 7,352 | ||||||
Earnings after taxation | 441 | 2,452 | 1,283 | 700 | 592 | (140 | ) | (775 | ) | 4,553 | ||||||
[A] Comprises Canada and Mexico.
2018 | $ million | |||||||||||||||
North America | South America | |||||||||||||||
Europe | Asia | Oceania | Africa | USA | Other[A] | Total | ||||||||||
Revenue | ||||||||||||||||
Third parties | 1,875 | 3,364 | 1,389 | 2,401 | 2,165 | 507 | 1,023 | 12,724 | ||||||||
Sales between businesses | 6,705 | 11,284 | 4,683 | 3,586 | 7,716 | 1,946 | 7,154 | 43,074 | ||||||||
Total | 8,580 | 14,648 | 6,072 | 5,987 | 9,881 | 2,453 | 8,177 | 55,798 | ||||||||
Production costs excluding taxes | 2,262 | 2,143 | 1,073 | 1,093 | 2,573 | 1,069 | 1,401 | 11,614 | ||||||||
Taxes other than income tax | 122 | 841 | 199 | 328 | 83 | — | 2,767 | 4,340 | ||||||||
Exploration | 277 | 149 | 78 | 144 | 341 | 114 | 237 | 1,340 | ||||||||
Depreciation, depletion and amortisation | 2,684 | 2,301 | 1,571 | 1,394 | 4,543 | (346 | ) | 3,271 | 15,418 | |||||||
Other costs/(income) | 947 | (180 | ) | (514 | ) | 609 | 447 | 667 | 849 | 2,825 | ||||||
Earnings before taxation | 2,288 | 9,394 | 3,665 | 2,419 | 1,894 | 949 | (348 | ) | 20,261 | |||||||
Taxation (credit)/charge | 2,047 | 4,851 | 893 | 902 | 550 | 236 | 1,162 | 10,641 | ||||||||
Earnings after taxation | 241 | 4,543 | 2,772 | 1,517 | 1,344 | 713 | (1,510 | ) | 9,620 | |||||||
[A] Comprises Canada, Honduras and Mexico.
2017 | $ million | |||||||||||||||
North America | South America | |||||||||||||||
Europe | Asia | Oceania | Africa | USA | Other[A] | Total | ||||||||||
Revenue | ||||||||||||||||
Third parties | 1,193 | 2,708 | 1,414 | 1,872 | 1,080 | 339 | 689 | 9,295 | ||||||||
Sales between businesses | 7,120 | 9,061 | 2,400 | 3,218 | 5,119 | 2,938 | 5,245 | 35,101 | ||||||||
Total | 8,313 | 11,769 | 3,814 | 5,090 | 6,199 | 3,277 | 5,934 | 44,396 | ||||||||
Production costs excluding taxes | 2,509 | 2,469 | 1,110 | 1,365 | 2,558 | 1,571 | 1,218 | 12,800 | ||||||||
Taxes other than income tax | 89 | 556 | 119 | 287 | 98 | 1 | 1,691 | 2,841 | ||||||||
Exploration | 243 | 245 | 42 | 129 | 868 | 142 | 276 | 1,945 | ||||||||
Depreciation, depletion and amortisation | 2,560 | 2,892 | 1,777 | 1,863 | 3,410 | 3,886 | 3,374 | 19,762 | ||||||||
Other costs/(income) | (157 | ) | 1,073 | (382 | ) | 145 | 114 | 1,050 | 469 | 2,312 | ||||||
Earnings before taxation | 3,069 | 4,534 | 1,148 | 1,301 | (849 | ) | (3,373 | ) | (1,094 | ) | 4,736 | |||||
Taxation charge/(credit) | 1,689 | 2,969 | (202 | ) | (361 | ) | 363 | (1,486 | ) | (294 | ) | 2,678 | ||||
Earnings after taxation | 1,380 | 1,565 | 1,350 | 1,662 | (1,212 | ) | (1,887 | ) | (800 | ) | 2,058 | |||||
[A] Comprises Canada, Honduras and Mexico.
FINANCIAL STATEMENTS AND SUPPLEMENTS SHELL ANNUAL REPORT AND FORM 20-F 2019 | 203 | |
SHELL SHARE OF JOINT VENTURES AND ASSOCIATES
2019 | $ million | |||||||||||||||
North America | South America | |||||||||||||||
Europe | Asia | Oceania | Africa | USA | Canada | Total | ||||||||||
Third-party revenue | 1,233 | 5,475 | 81 | — | — | — | — | 6,789 | ||||||||
Total | 1,233 | 5,475 | 81 | — | — | — | — | 6,789 | ||||||||
Production costs excluding taxes | 249 | 669 | 88 | — | — | — | — | 1,006 | ||||||||
Taxes other than income tax | 75 | 1,037 | 6 | — | — | — | — | 1,118 | ||||||||
Exploration | 4 | 51 | — | — | — | — | — | 55 | ||||||||
Depreciation, depletion and amortisation | 217 | 949 | 415 | — | — | — | — | 1,581 | ||||||||
Other costs/(income) | 547 | 622 | (18 | ) | — | 1 | 1 | — | 1,153 | |||||||
Earnings before taxation | 141 | 2,147 | (410 | ) | — | (1 | ) | (1 | ) | — | 1,876 | |||||
Taxation charge | 39 | 957 | — | — | — | — | — | 996 | ||||||||
Earnings after taxation | 102 | 1,190 | (410 | ) | — | (1 | ) | (1 | ) | — | 880 | |||||
2018 | $ million | |||||||||||||||
North America | South America | |||||||||||||||
Europe | Asia | Oceania | Africa | USA | Canada | Total | ||||||||||
Third-party revenue | 1,395 | 5,884 | 79 | — | — | — | — | 7,358 | ||||||||
Total | 1,395 | 5,884 | 79 | — | — | — | — | 7,358 | ||||||||
Production costs excluding taxes | 307 | 674 | 105 | — | — | — | — | 1,086 | ||||||||
Taxes other than income tax | 82 | 1,259 | 4 | — | — | — | — | 1,345 | ||||||||
Exploration | 5 | 45 | — | — | — | — | — | 50 | ||||||||
Depreciation, depletion and amortisation | 318 | 1,016 | 163 | — | — | — | — | 1,497 | ||||||||
Other costs/(income) | 595 | 615 | (26 | ) | — | — | — | — | 1,184 | |||||||
Earnings before taxation | 88 | 2,275 | (167 | ) | — | — | — | — | 2,196 | |||||||
Taxation charge | 7 | 975 | — | — | — | — | — | 982 | ||||||||
Earnings after taxation | 81 | 1,300 | (167 | ) | — | — | — | — | 1,214 | |||||||
2017 | $ million | |||||||||||||||
North America | South America | |||||||||||||||
Europe | Asia | Oceania | Africa | USA | Canada | Total | ||||||||||
Third-party revenue | 1,646 | 4,503 | 58 | — | — | — | — | 6,207 | ||||||||
Total | 1,646 | 4,503 | 58 | — | — | — | — | 6,207 | ||||||||
Production costs excluding taxes | 337 | 729 | 93 | — | — | — | — | 1,159 | ||||||||
Taxes other than income tax | 631 | 705 | 4 | — | — | — | — | 1,340 | ||||||||
Exploration | 7 | 57 | 4 | — | — | — | — | 68 | ||||||||
Depreciation, depletion and amortisation | 188 | 1,654 | 40 | — | — | — | — | 1,882 | ||||||||
Other costs/(income) | (83 | ) | 511 | (60 | ) | — | — | — | — | 368 | ||||||
Earnings before taxation | 566 | 847 | (23 | ) | — | — | — | — | 1,390 | |||||||
Taxation charge | 173 | 197 | — | — | — | — | — | 370 | ||||||||
Earnings after taxation | 393 | 650 | (23 | ) | — | — | — | — | 1,020 | |||||||
ACREAGE AND WELLS
The tables below reflect acreage and wells of Shell subsidiaries, joint ventures and associates. The term “gross” refers to the total activity in which Shell subsidiaries, joint ventures and associates have an interest. The term “net” refers to the sum of the fractional interests owned by Shell subsidiaries plus the Shell share of joint ventures and associates’ fractional interests. Data below are rounded to the nearest whole number.
FINANCIAL STATEMENTS AND SUPPLEMENTS SHELL ANNUAL REPORT AND FORM 20-F 2019 | 204 | |
Oil and gas acreage (at December 31) | Thousand acres | ||||||||||||||||||||||
2019 | 2018 | 2017 | |||||||||||||||||||||
Developed | Undeveloped | Developed | Undeveloped | Developed | Undeveloped | ||||||||||||||||||
Gross | Net | Gross | Net | Gross | Net | Gross | Net | Gross | Net | Gross | Net | ||||||||||||
Europe [A] | 6,289 | 1,915 | 13,864 | 6,082 | 6,022 | [B] | 1,954 | [B] | 14,385 | [C] | 6,540 | [C] | 6,214 | [D] | 2,051 | [D] | 13,079 | [E] | 5,823 | [E] | |||
Asia | 21,387 | 7,672 | 31,486 | 14,880 | 22,087 | 7,885 | 31,676 | 15,433 | 25,975 | 9,139 | 35,305 | 18,730 | |||||||||||
Oceania | 3,025 | 1,215 | 11,720 | 6,260 | 3,202 | 1,220 | 15,319 | [F] | 10,095 | [F] | 3,296 | 1,255 | 22,295 | [G] | 13,985 | ||||||||
Africa | 4,663 | 1,938 | 62,965 | 32,564 | 4,666 | 1,940 | 38,874 | 22,732 | 4,663 | 1,938 | 33,453 | 20,811 | |||||||||||
North America - USA | 1,333 | 877 | 2,489 | 1,917 | 1,541 | 952 | 2,133 | 1,635 | 1,936 | 1,134 | 2,718 | 1,937 | |||||||||||
North America - Mexico | — | — | 5,178 | 3,291 | — | — | 5,178 | 3,885 | — | — | — | — | |||||||||||
North America - Canada | 483 | 329 | 1,783 | 1,265 | 1,108 | 752 | 1,681 | 1,193 | 953 | 651 | 15,818 | 14,468 | |||||||||||
South America | 1,393 | 595 | 16,446 | 10,214 | 1,490 | 710 | 10,352 | 6,725 | 1,302 | 606 | 9,338 | 6,196 | |||||||||||
Total | 38,573 | 14,541 | 145,931 | 76,473 | 40,116 | 15,413 | 119,598 | 68,238 | 44,339 | 16,774 | 132,006 | 81,950 | |||||||||||
[A] Includes Greenland for 2018 and 2017.
[B]Corrected from 6,228 (1,958 net).
[C] Corrected from 15,443 (6,913 net).
[D] Corrected from 6,463 (2,071 net).
[E] Corrected from 14,119 (6,187 net).
[F] Corrected from 15,662 (10,298 net).
[G] Corrected from 22,406.
Number of productive wells [A] (at December 31) | |||||||||||||||||||||||||||||||
2019 | 2018 | 2017 | |||||||||||||||||||||||||||||
Oil | Gas | Oil | Gas | Oil | Gas | ||||||||||||||||||||||||||
Gross | Net | Gross | Net | Gross | Net | Gross | Net | Gross | Net | Gross | Net | ||||||||||||||||||||
Europe | 893 | 217 | 1,091 | 345 | 1,077 | 277 | 1,201 | 379 | 1,138 | [B] | 299 | [B] | 1,255 | [C] | 396 | [C] | |||||||||||||||
Asia | 7,767 | 2,841 | 336 | 193 | 7,455 | [D] | 2,728 | [D] | 331 | 189 | 9,279 | 3,067 | 682 | 269 | |||||||||||||||||
Oceania | — | — | 3,352 | 1,896 | — | — | 3,411 | 1,924 | — | — | 3,499 | 1,926 | |||||||||||||||||||
Africa | 514 | 206 | 202 | 139 | 478 | 189 | 195 | 132 | 380 | 155 | 180 | 122 | |||||||||||||||||||
North America – USA | 14,935 | 7,638 | 822 | 516 | 15,224 | 7,745 | 1,479 | 672 | 15,408 | 7,817 | 1,636 | 717 | |||||||||||||||||||
North America – Canada | — | — | 748 | 676 | 1 | 1 | 936 | 846 | — | — | 892 | 794 | |||||||||||||||||||
South America | 137 | 63 | 58 | 36 | 117 | [E] | 52 | [E] | 63 | [F] | 41 | 111 | 47 | 55 | 32 | ||||||||||||||||
Total | 24,246 | 10,965 | 6,609 | 3,801 | 24,352 | 10,992 | 7,616 | 4,183 | 26,316 | 11,385 | 8,199 | 4,256 | |||||||||||||||||||
[A] The number of productive wells with multiple completions at December 31, 2019, was 955 gross (418 net); December 31, 2018: 1,061 gross (454 net), corrected from 1,132 Gross (489 Net); December 31, 2017: 1,696 gross (636 net).
[B] Corrected from 1,156 (303 net).
[C] Corrected from 1,235 (392 net).
[D] Corrected from 7,498 (2750 net).
[E] Corrected from 119 (53 net).
[F] Corrected from 62.
FINANCIAL STATEMENTS AND SUPPLEMENTS SHELL ANNUAL REPORT AND FORM 20-F 2019 | 205 | |
Number of net productive wells and dry holes drilled | |||||||||||||||||
2019 | 2018 | 2017 | |||||||||||||||
Productive | Dry | Productive | Dry | Productive | Dry | ||||||||||||
Exploratory [A] | |||||||||||||||||
Europe | — | 4 | 1 | 2 | — | 1 | |||||||||||
Asia | 25 | 17 | 22 | [B] | 11 | [C] | 18 | [D] | 5 | ||||||||
Oceania | — | 2 | — | — | 2 | — | |||||||||||
Africa | 8 | 8 | 6 | 6 | 2 | 3 | |||||||||||
North America - USA | 89 | 9 | 104 | 4 | 9 | 6 | |||||||||||
North America - Canada | 24 | — | 14 | 30 | 5 | ||||||||||||
South America | 8 | 1 | 6 | 7 | 6 | — | |||||||||||
Total | 154 | 41 | 153 | 30 | 67 | 20 | |||||||||||
Development | |||||||||||||||||
Europe | 4 | 1 | 4 | — | 5 | — | |||||||||||
Asia | 182 | — | 198 | [E] | — | 291 | [F] | 4 | |||||||||
Oceania | 16 | — | 54 | [G] | — | 63 | — | ||||||||||
Africa | 34 | — | 24 | 1 | 24 | 3 | |||||||||||
North America - USA | 280 | 5 | 276 | — | 237 | — | |||||||||||
North America - Canada | 6 | — | 53 | — | 56 | 1 | |||||||||||
South America | 10 | 1 | 5 | — | 1 | — | |||||||||||
Total | 532 | 7 | 614 | 1 | 677 | 8 | |||||||||||
[A] Productive wells are wells with proved reserves allocated. Wells in the process of drilling are excluded and presented separately below.
[B] Corrected from 9
[C] Corrected from 10
[D] Corrected from 3
[E] Corrected from 222
[F] Corrected from 312
[G] Corrected from 41
Number of wells in the process of exploratory drilling [A] | ||||||||||||||||||||||||||
At January 1 | Wells in the process of drilling at January 1 and allocated proved reserves during the year | Wells in the process of drilling at January 1 and determined as dry during the year | New wells in the process of drilling at December 31 | At December 31 | ||||||||||||||||||||||
Gross | Net | Gross | Net | Gross | Net | Gross | Net | Gross | Net | |||||||||||||||||
Europe | 19 | 10 | (1 | ) | — | (5 | ) | (3 | ) | 2 | 1 | 15 | 8 | |||||||||||||
Asia | 75 | [B] | 28 | [B] | (21 | ) | (8 | ) | (21 | ) | (8 | ) | 20 | 8 | 53 | 20 | ||||||||||
Oceania | 42 | [C] | 15 | — | — | (3 | ) | (1 | ) | 1 | 1 | 40 | 15 | |||||||||||||
Africa | 47 | 31 | (3 | ) | (3 | ) | (6 | ) | (6 | ) | 7 | 6 | 45 | 28 | ||||||||||||
North America – USA | 239 | [D] | 158 | [D] | (126 | ) | (60 | ) | (13 | ) | (9 | ) | 97 | 37 | 197 | 126 | ||||||||||
North America – Canada | 5 | [E] | 5 | [E] | (5 | ) | (5 | ) | — | — | 21 | 21 | 21 | 21 | ||||||||||||
South America | 37 | [F] | 19 | (10 | ) | (7 | ) | (1 | ) | — | 7 | 4 | 33 | 16 | ||||||||||||
Total | 464 | 266 | (166 | ) | (83 | ) | (49 | ) | (27 | ) | 155 | 78 | 404 | 234 | ||||||||||||
[A] Wells in the process of exploratory drilling includes wells pending further evaluation.
[B] Corrected from 68 (25 net).
[C] Corrected from 45.
[D] Corrected from 151 (96 net).
[E] Corrected from 0 (0 net)
FINANCIAL STATEMENTS AND SUPPLEMENTS SHELL ANNUAL REPORT AND FORM 20-F 2019 | 206 | |
[F] Corrected from 36
Number of wells in the process of development drilling | 2019 | ||||||||||
At January 1 | At December 31 | ||||||||||
Gross | Net | Gross | Net | ||||||||
Europe | 5 | 2 | 11 | 3 | |||||||
Asia | 41 | [A] | 16 | [A] | 53 | 21 | |||||
Oceania | 19 | [B] | 8 | [B] | 123 | 71 | |||||
Africa | 5 | 5 | 5 | 2 | |||||||
North America - USA | 40 | [C] | 20 | [C] | 41 | 34 | |||||
North America - Canada | 12 | [D] | 12 | [D] | — | — | |||||
South America | 9 | 4 | 12 | 8 | |||||||
Total | 131 | 67 | 245 | 139 | |||||||
[A] Corrected from 36 (14 net).
[B] Corrected from 3 (1 net).
[C] Corrected from 64 (33 net).
[D] Corrected from 17 (17 net).
In addition to the present activities mentioned above, the following recovery methods are operational in the following countries: water flooding (Brazil (including water alternating gas), Brunei, Egypt, Malaysia, Nigeria, Norway, Oman, Russia, the UK and the USA); gas injection (Brunei, Kazakhstan, Malaysia, Nigeria and Oman); steam injection (the Netherlands, Oman and the USA), and polymer flooding (Oman).
FINANCIAL STATEMENTS AND SUPPLEMENTS SHELL ANNUAL REPORT AND FORM 20-F 2019 | 207 | |
Report of Independent Registered Public Accounting Firm | |
TO COMPUTERSHARE TRUSTEES (JERSEY) LIMITED AS TRUSTEE OF ROYAL DUTCH SHELL DIVIDEND ACCESS TRUST AND THE BOARD OF DIRECTORS AND SHAREHOLDERS OF ROYAL DUTCH SHELL PLC
Opinion on the Financial Statements
We have audited the accompanying balance sheets of Royal Dutch Shell Dividend Access Trust (the Trust) as of December 31, 2019 and 2018, the related statements of income, comprehensive income, changes in equity and cash flows for each of the three years in the period ended December 31, 2019, and the related notes (collectively referred to as the “Financial Statements”). In our opinion, the Financial Statements present fairly, in all material respects, the financial position of the Trust at December 31, 2019 and 2018, and the results of its operations and its cash flows for each of the three years in the period ended December 31, 2019, in conformity with International Financial Reporting Standards (IFRS) as issued by the International Accounting Standards Board and in conformity with IFRS as adopted by the European Union.
We also have audited, in accordance with the standards of the Public Company Accounting Oversight Board (United States) (PCAOB), the Trust’s internal control over financial reporting as of December 31, 2019, based on criteria established in Internal Control-Integrated Framework issued by the Committee of Sponsoring Organizations of the Treadway Commission (2013 framework), and our report dated March 11, 2020 expressed an unqualified opinion thereon.
Basis for Opinion
These financial statements are the responsibility of the trustee of the Trust (the Trustee) and the management of Royal Dutch Shell plc (the management). Our responsibility is to express an opinion on the Trust’s financial statements based on our audits. We are a public accounting firm registered with the PCAOB and are required to be independent with respect to the Trust in accordance with the U.S. federal securities laws and the applicable rules and regulations of the Securities and Exchange Commission and the PCAOB.
We conducted our audits in accordance with the standards of the PCAOB. Those standards require that we plan and perform the audit to obtain reasonable assurance about whether the financial statements are free of material misstatement, whether due to error or fraud. Our audits included performing procedures to assess the risks of material misstatement of the financial statements, whether due to error or fraud, and performing procedures that respond to those risks. Such procedures included examining, on a test basis, evidence regarding the amounts and disclosures in the financial statements. Our audits also included evaluating the accounting principles used and significant estimates made by management, as well as evaluating the overall presentation of the financial statements. We believe that our audits provide a reasonable basis for our opinion.
Critical Audit Matters
Critical audit matters are matters arising from the current period audit of the financial statements that were communicated or required to be communicated to the audit committee and that: (1) relate to accounts or disclosures that are material to the financial statements and (2) involved our especially challenging, subjective, or complex judgements. We determined that there are no critical audit matters.
/s/ Ernst & Young LLP
We have served as the Trust’s auditor since 2016.
London, United Kingdom
March 11, 2020
TO COMPUTERSHARE TRUSTEES (JERSEY) LIMITED AS TRUSTEE OF ROYAL DUTCH SHELL DIVIDEND ACCESS TRUST AND THE BOARD OF DIRECTORS AND SHAREHOLDERS OF ROYAL DUTCH SHELL PLC
Opinion on Internal Control over Financial Reporting
We have audited Royal Dutch Shell Dividend Access Trust’s (the Trust) internal control over financial reporting as of December 31, 2019, based on criteria established in Internal Control- Integrated Framework issued by the Committee of Sponsoring Organizations of the Treadway Commission (2013 framework) (the COSO criteria). In our opinion, the Trust maintained, in all material respects, effective internal control over financial reporting as of December 31, 2019, based on the COSO criteria.
We also have audited, in accordance with the standards of the Public Company Accounting Oversight Board (United States) (PCAOB), the Financial Statements of the Trust, and our report dated March 11, 2020, expressed an unqualified opinion thereon.
Basis for Opinion
The trustee of the Trust (the Trustee) and the management of Royal Dutch Shell plc (the Management) are responsible for maintaining effective internal control over financial reporting and for their assessment of the effectiveness of internal control over financial reporting included in the accompanying Trustee’s and Management’s Report on Internal Control over Financial Reporting set out on page 129. Our responsibility is to express an opinion on the Trust’s internal control over financial reporting based on our audit. We are a public accounting firm registered with the PCAOB and are required to be independent with respect to the Trust in accordance with the U.S. federal securities laws and the applicable rules and regulations of the Securities and Exchange Commission and the PCAOB.
We conducted our audit in accordance with the standards of the PCAOB. Those standards require that we plan and perform the audit to obtain reasonable assurance about whether effective internal control over financial reporting was maintained in all material respects. Our audit included obtaining an understanding of internal control over financial reporting, assessing the risk that a material weakness exists, testing and evaluating the design and operating
FINANCIAL STATEMENTS AND SUPPLEMENTS SHELL ANNUAL REPORT AND FORM 20-F 2019 | 208 | |
effectiveness of internal control based on the assessed risk, and performing such other procedures as we considered necessary in the circumstances. We believe that our audit provides a reasonable basis for our opinion.
Definition and Limitations of Internal Control over Financial Reporting
A company’s internal control over financial reporting is a process designed to provide reasonable assurance regarding the reliability of financial reporting and the preparation of financial statements for external purposes in accordance with generally accepted accounting principles. A company’s internal control over financial reporting includes those policies and procedures that (1) pertain to the maintenance of records that, in reasonable detail, accurately and fairly reflect the transactions and dispositions of the assets of the company; (2) provide reasonable assurance that transactions are recorded as necessary to permit preparation of financial statements in accordance with generally accepted accounting principles, and that receipts and expenditures of the company are being made only in accordance with authorizations of management and directors of the company; and (3) provide reasonable assurance regarding prevention or timely detection of unauthorized acquisition, use, or disposition of the company’s assets that could have a material effect on the financial statements.
Because of its inherent limitations, internal control over financial reporting may not prevent or detect misstatements. Also, projections of any evaluation of effectiveness to future periods are subject to the risk that controls may become inadequate because of changes in conditions, or that the degree of compliance with the policies or procedures may deteriorate.
/s/ Ernst & Young LLP
London, United Kingdom
March 11, 2020
FINANCIAL STATEMENTS AND SUPPLEMENTS SHELL ANNUAL REPORT AND FORM 20-F 2019 | 209 | |
Royal Dutch Shell Dividend Access Trust Financial Statements | |
FINANCIAL STATEMENTS AND SUPPLEMENTS SHELL ANNUAL REPORT AND FORM 20-F 2019 | 210 | |
Statement of Income | £ million | |||||
2019 | 2018 | 2017 | ||||
Dividend income | 5,484 | 5,328 | 4,567 | |||
Income before taxation and for the period | 5,484 | 5,328 | 4,567 | |||
Statement of Comprehensive Income | £ million | |||||
2019 | 2018 | 2017 | ||||
Income for the period | 5,484 | 5,328 | 4,567 | |||
Comprehensive income for the period | 5,484 | 5,328 | 4,567 | |||
Balance Sheet | £ million | |||||
Notes | Dec 31, 2019 | Dec 31, 2018 | ||||
Assets | ||||||
Current assets | — | — | ||||
Cash and cash equivalents | 3 | 3 | ||||
Total assets | 3 | 3 | ||||
Liabilities | ||||||
Current liabilities | — | — | ||||
Unclaimed dividends | 4 | 3 | 3 | |||
Total liabilities | 3 | 3 | ||||
Equity | ||||||
Capital account | 5 | — | — | |||
Revenue account | — | — | ||||
Total equity | — | — | ||||
Total liabilities and equity | 3 | 3 | ||||
Signed on behalf of Computershare Trustees (Jersey) Limited as Trustee of the Royal Dutch Shell Dividend Access Trust | ||
/s/ Karen Kurys | /s/ Martin Fish | |
Karen Kurys | Martin Fish | |
March 11, 2020 | ||
Statement of Changes in Equity | £ million | |||||||
Notes | Capital account | Revenue account | Total equity | |||||
At January 1, 2019 | — | — | — | |||||
Comprehensive income for the period | — | 5,484 | 5,484 | |||||
Distributions made | 6 | — | (5,484 | ) | (5,484 | ) | ||
At December 31, 2019 | — | — | — | |||||
At January 1, 2018 | — | — | — | |||||
Comprehensive income for the period | — | 5,328 | 5,328 | |||||
Distributions made | 6 | — | (5,328 | ) | (5,328 | ) | ||
At December 31, 2018 | — | — | — | |||||
At January 1, 2017 | — | — | — | |||||
Comprehensive income for the period | — | 4,567 | 4,567 | |||||
Distributions made | 6 | — | (4,567 | ) | (4,567 | ) | ||
At December 31, 2017 | — | — | — | |||||
FINANCIAL STATEMENTS AND SUPPLEMENTS SHELL ANNUAL REPORT AND FORM 20-F 2019 | 211 | |
Statement of Cash Flows | £ million | |||||
2019 | 2018 | 2017 | ||||
Income for the period | 5,484 | 5,328 | 4,567 | |||
Adjustment for: | ||||||
Dividends received | (5,484 | ) | (5,328 | ) | (4,567 | ) |
Cash flow from operating activities | — | — | — | |||
Dividends received | 5,484 | 5,328 | 4,567 | |||
Cash flow from investing activities | 5,484 | 5,328 | 4,567 | |||
Cash distributions made | (5,484 | ) | (5,327 | ) | (4,567 | ) |
Cash flow from financing activities | (5,484 | ) | (5,327 | ) | (4,567 | ) |
Change in cash and cash equivalents | — | 1 | — | |||
Cash and cash equivalents at January 1 | 3 | 2 | 2 | |||
Cash and cash equivalents at December 31 | 3 | 3 | 2 | |||
FINANCIAL STATEMENTS AND SUPPLEMENTS SHELL ANNUAL REPORT AND FORM 20-F 2019 | 212 | |
Notes to the Royal Dutch Shell Dividend Access Trust Financial Statements | ||||
1 THE TRUST
The Royal Dutch Shell Dividend Access Trust (the "Trust") was established on May 19, 2005, by The “Shell” Transport and Trading Company, plc, now The Shell Transport and Trading Company Limited ("Shell Transport"), and Royal Dutch Shell plc (the "Company"). The Trust is governed by the applicable laws of England and Wales and is resident and domiciled in Jersey. The Trust is not subject to taxation. The Trustee of the Trust is Computershare Trustees ("Jersey") Limited, registration number 92182 (the "Trustee"), Queensway House, Hilgrove Street, St Helier, Jersey, JE1 1ES. The Trust was established as part of a dividend access mechanism.
Shell Transport and BG Group Limited ("BG"), have each issued a dividend access share to the Trustee. Following the announcement of a dividend by the Company on the B shares, Shell Transport and BG may declare a dividend on their dividend access shares.
The primary purposes of the Trust are to receive, on behalf of the B shareholders of the Company and in accordance with their respective holdings of B shares in the Company, any amounts paid by way of dividend on the dividend access shares and to pay such amounts to the B shareholders on the same pro rata basis. The Trust is not subject to significant market risk, credit risk or liquidity risk.
The Trust shall not endure for a period in excess of 80 years from May 19, 2005, being the date on which the Trust Deed was executed.
2 THE BASIS OF PREPARATION
The Financial Statements of the Trust have been prepared in accordance with International Financial Reporting Standards ("IFRS") as adopted by the European Union. As applied to the Trust, there are no material differences from IFRS as issued by the International Accounting Standards Board ("IASB"); therefore, the Financial Statements have been prepared in accordance with IFRS as issued by the IASB.
The Financial Statements have been prepared under the historical cost convention. The accounting policies described in Note 3 have been applied consistently in all periods presented.
The Financial Statements were approved and authorised for issue by the Trustee on March 11, 2020.
The financial results of the Trust are included in the Consolidated on pages 142-188.
3 SIGNIFICANT ACCOUNTING POLICIES
The Trust’s accounting policies follow those of Shell as set out in Note 2A of the Consolidated Financial Statements (see page 148-156). The following are Trust-specific policies.
PRESENTATION AND FUNCTIONAL CURRENCY
The Trust’s presentation and functional currency is sterling. The Trust’s dividend income and dividends paid are principally in sterling.
DIVIDEND INCOME
Dividends on the dividend access shares are recognised on a paid basis unless the dividend has been confirmed by a general meeting of Shell Transport or BG, in which case income is recognised on the date on which receipt is deemed virtually certain.
DISTRIBUTIONS MADE
Amounts are recorded as distributed once a wire transfer or cheque is issued. To the extent that cheques expire or are returned unpresented, the Trust records a liability for unclaimed dividends and a corresponding amount of cash.
4 UNCLAIMED DIVIDENDS
Unclaimed dividends of £3,456,974 (2018: £2,816,655) include any dividend cheque payments that have not been presented within 12 months, have expired or have been returned unpresented. Dividends which are unclaimed after 12 years will revert to Shell Transport and BG once forfeited.
5 CAPITAL ACCOUNT
The capital account is represented by the dividend access share of 25 pence settled in the Trust by Shell Transport and the dividend access share of 10 pence settled in the Trust by BG. There have been no changes in the capital account in the current or prior year.
6 DISTRIBUTIONS MADE
Distributions are made to the B shareholders of the Company in accordance with the Trust Deed. See Note 23 of the Consolidated Financial Statements (see page 185) for information about dividends per share. Any wire transfers that are not completed are replaced by cheques.
7 RELATED PARTIES
The Trust received dividend income of £3,573 million (2018: £3,470 million; 2017: £2,970 million) in respect of the dividend access share from Shell Transport and £1,911 million (2018: £1,858 million; 2017: £1,597 million) in respect of the dividend access share from BG. The Trust made distributions of £5,484 million (2018: £5,328 million; 2017: £4,567 million) to the B shareholders of the Company.
The Company pays the general and administrative expenses of the Trust, including the auditor’s remuneration.
8 AUDITOR’S REMUNERATION
Auditor’s remuneration for 2019 audit services was £33,750 (2018: £33,750; 2017: £33,750).
FINANCIAL STATEMENTS AND SUPPLEMENTS SHELL ANNUAL REPORT AND FORM 20-F 2019 | 213 | |
Additional Information
Shareholder information | |
Royal Dutch Shell plc (the Company) was incorporated in England and Wales on February 5, 2002, as a private company under the Companies Act 1985, as amended. On October 27, 2004, the Company was re-registered as a public company limited by shares and changed its name from Forthdeal Limited to Royal Dutch Shell plc. The Company is registered at Companies House, Cardiff, under company number 4366849, and at the Chamber of Commerce, The Hague, under company number 34179503. The Legal Entity Identifier (LEI) issued by the London Stock Exchange is 21380068P1DRHMJ8KU70. The business address for the Directors and Senior Management is Carel van Bylandtlaan 30, 2596 HR, The Hague, The Netherlands.
The Company is resident in the Netherlands for Dutch and UK tax purposes and its primary objective is to carry on the business of a holding company. It is not directly or indirectly owned or controlled by another corporation or by any government and does not know of any arrangements that may result in a change of control of the Company.
NATURE OF TRADING MARKET
The Company has two classes of ordinary shares: A and B shares. The principal trading market for A shares is Euronext Amsterdam and the principal trading market for B shares is the London Stock Exchange. Ordinary shares are traded in registered form.
A and B American Depositary Shares (ADSs) are listed on the New York Stock Exchange [A]. A depositary receipt is a certificate that evidences ADSs. Depositary receipts are issued, cancelled and exchanged at the office of JP Morgan Chase Bank, N.A., 383 Madison Avenue, New York, New York 10179, USA, as depositary (the Depositary), under a deposit agreement between the Company, the Depositary and the holders of ADSs. Each ADS represents two €0.07 shares of Royal Dutch Shell plc deposited under the agreement. More information relating to ADSs is given on pages 213-217.
[A] At February 14, 2020, 395,595,127 A ADSs and 322,677,233 B ADSs were outstanding, representing 5.04% and 4.11% of the respective share capital class, held by 5,003 and 912 holders of record with an address in the USA, respectively. In addition to holders of ADSs, at February 14, 2020, 21,380 A shares and 920,170 B shares of €0.07 each were outstanding, representing 0.0003% and 0.0117% of the respective share capital class, held by 299 and 3,061 holders of record registered with an address in the USA, respectively.
Listing information | ||||
A shares | B shares | |||
Ticker symbol London | RDSA | RDSB | ||
Ticker symbol Amsterdam | RDSA | RDSB | ||
Ticker symbol New York (ADS [A]) | RDS.A | RDS.B | ||
ISIN Code | GB00B03MLX29 | GB00B03MM408 | ||
CUSIP | G7690A100 | G7690A118 | ||
SEDOL Number London | B03MLX2 | B03MM40 | ||
SEDOL Number Euronext | B09CBL4 | B09CBN6 | ||
Weighting on FTSE at 31/12/19 | 4.97 | % | 4.44 | % |
Weighting on AEX at 31/12/19 | 11.9 | % | not included | |
SHARE CAPITAL
The issued and fully paid share capital of the Company at February 14, 2020, was as follows:
Share capital | |||
Issued and fully paid | |||
Number | Nominal value | ||
Ordinary shares of €0.07 each | |||
A shares | 4,125,109,180 | €288,757,643 | |
B shares | 3,727,267,215 | €260,908,705 | |
Sterling deferred shares of £1 each | 50,000 | £50,000 | |
The Directors may only allot new ordinary shares if they have authority from shareholders to do so. The Company seeks to renew this authority annually at its AGM. Under the resolution passed at the Company’s 2019 AGM, the Directors were granted authority to allot ordinary shares up to an aggregate nominal amount equivalent to approximately one-third of the issued ordinary share capital of the Company (in line with the guidelines issued by institutional investors).
The following is a summary of the material terms of the Company’s ordinary shares, including brief descriptions of the provisions contained in the Articles of Association (the Articles) and applicable laws of England and Wales in effect on the date of this document. This summary does not purport to include complete statements of these provisions:
▪ | upon issuance, A and B shares are fully paid and free from all liens, equities, charges, encumbrances and other interest of the Company and not subject to calls of any kind; |
▪ | all A and B shares rank equally for all dividends and distributions on ordinary share capital; and |
▪ | A and B shares are admitted to the Official List of the UK Financial Conduct Authority and to trading on the market for listed securities of the London Stock Exchange. A and B shares are also admitted to trading on Euronext Amsterdam. A and B ADSs are listed on the New York Stock Exchange. |
At December 31, 2019, trusts and trust-like entities holding shares for the benefit of employee share plans of Shell held (directly and indirectly) 35 million shares of the Company with an aggregate market value of $1,021 million and an aggregate nominal value of €3 million.
ADDITIONAL INFORMATION SHELL FORM 20-F 2019 | 214 | |
SIGNIFICANT SHAREHOLDINGS
SIGNIFICANT DIRECT SHAREHOLDINGS
Direct holdings of 3% or more of A and B shares combined held by registered members representing the interests of underlying investors at February 14, 2020 are given below.
Direct shareholdings | |||||||||||
A shares | B shares | Total | |||||||||
Number | % | Number | % | Number | % | ||||||
Nederlands Centraal Instituut Voor Giraal Effectenverkeer Bv | 1,648,160,815 | 39.95 | 15,631,116 | 0.42 | 1,663,791,931 | 21.19 | |||||
Guaranty Nominees Limited | 780,888,066 | 18.93 | 635,107,032 | 17.04 | 1,415,995,098 | 18.03 | |||||
State Street Nominees Limited | 153,192,955 | 3.71 | 176,114,622 | 4.73 | 329,307,577 | 4.19 | |||||
Chase Nominees Limited | 39,792,354 | 0.96 | 223,049,935 | 5.98 | 262,842,289 | 3.35 | |||||
SIGNIFICANT INDIRECT SHAREHOLDINGS
Interests of investors with 3% or more of A and B shares combined at February 14, 2020 are given below.
Indirect shareholdings | |||||||||||
A shares | B shares | Total | |||||||||
Number | % | Number | % | Number | % | ||||||
The Capital Group [A] | 42,482,002 | 0.54 | 349,161,475 | 4.45 | 391,643,477 | 4.99 | |||||
The Vanguard Group | 197,154,328 | 4.75 | 141,041,343 | 3.78 | 338,195,671 | 4.29 | |||||
BlackRock Inc | 304,037,938 | 7.32 | 259,041,285 | 6.95 | 563,079,223 | 7.14 | |||||
[A] Information presented as at February 24, 2020.
DIVIDENDS
The following tables show the dividends on each class of share and each class of ADS for the years 2015 - 2019.
A and B shares | $ | |||||||||
2019 | 2018 | 2017 | 2016 | 2015 | ||||||
Q1 | 0.47 | 0.47 | 0.47 | 0.47 | 0.47 | |||||
Q2 | 0.47 | 0.47 | 0.47 | 0.47 | 0.47 | |||||
Q3 | 0.47 | 0.47 | 0.47 | 0.47 | 0.47 | |||||
Q4 | 0.47 | 0.47 | 0.47 | 0.47 | 0.47 | |||||
Total announced in respect of the year | 1.88 | 1.88 | 1.88 | 1.88 | 1.88 | |||||
A shares | € [A] | |||||||||
2019 | 2018 | 2017 | 2016 | 2015 | ||||||
Q1 | 0.42 | 0.40 | 0.42 | 0.42 | 0.42 | |||||
Q2 | 0.43 | 0.40 | 0.39 | 0.42 | 0.42 | |||||
Q3 | 0.42 | 0.41 | 0.40 | 0.44 | 0.43 | |||||
Q4 | 0.42 | 0.42 | 0.38 | 0.44 | 0.42 | |||||
Total announced in respect of the year | 1.68 | 1.64 | 1.59 | 1.72 | 1.69 | |||||
Amount paid during the year | 1.68 | 1.60 | 1.65 | 1.70 | 1.71 | |||||
[A] Euro equivalent, rounded to the nearest euro cent.
B shares | Pence [A] | |||||||||
2019 | 2018 | 2017 | 2016 | 2015 | ||||||
Q1 | 36.97 | 35.18 | 37.12 | 32.98 | 30.75 | |||||
Q2 | 38.01 | 36.50 | 36.28 | 35.27 | 30.92 | |||||
Q3 | 35.73 | 36.77 | 35.02 | 37.16 | 31.07 | |||||
Q4 | 36.40 | 35.94 | 33.91 | 38.64 | 32.78 | |||||
Total announced in respect of the year | 147.11 | 144.39 | 142.33 | 144.05 | 125.52 | |||||
Amount paid during the year | 146.65 | 142.36 | 147.06 | 138.19 | 123.94 | |||||
[A] Sterling equivalent.
ADDITIONAL INFORMATION SHELL FORM 20-F 2019 | 215 | |
A and B ADSs | $ | |||||||||
2019 | 2018 | 2017 | 2016 | 2015 | ||||||
Q1 | 0.94 | 0.94 | 0.94 | 0.94 | 0.94 | |||||
Q2 | 0.94 | 0.94 | 0.94 | 0.94 | 0.94 | |||||
Q3 | 0.94 | 0.94 | 0.94 | 0.94 | 0.94 | |||||
Q4 | 0.94 | 0.94 | 0.94 | 0.94 | 0.94 | |||||
Total announced in respect of the year | 3.76 | 3.76 | 3.76 | 3.76 | 3.76 | |||||
Amount paid during the year | 3.76 | 3.76 | 3.76 | 3.76 | 3.76 | |||||
METHOD OF HOLDING SHARES OR AN INTEREST IN SHARES
There are several ways in which Royal Dutch Shell plc registered shares or an interest in these shares can be held, including:
▪ | directly as registered shares either in uncertificated form or in certificated form in a shareholder’s own name; |
▪ | indirectly through Euroclear Nederland (in respect of which the Dutch Securities Giro Act (“Wet giraal effectenverkeer”) is applicable); |
▪ | through the Royal Dutch Shell Corporate Nominee Service; |
▪ | through another third-party nominee or intermediary company; and |
▪ | as a direct or indirect holder of either an A or a B ADS with the Depositary. |
AMERICAN DEPOSITARY SHARES
The Depositary is the registered shareholder of the shares underlying the A or B ADSs and enjoys the rights of a shareholder under the Articles. Holders of ADSs will not have shareholder rights. The rights of the holder of an A or a B ADS are specified in the Deposit Agreement with the Depositary and are summarised below.
The Depositary will receive all cash dividends and other cash distributions made on the deposited shares underlying the ADSs and, where possible and on a reasonable basis, will distribute such dividends and distributions to holders of ADSs. Rights to purchase additional shares will also be made available to the Depositary who may make such rights available to holders of ADSs. All other distributions made on the Company’s shares will be distributed by the Depositary in any means that the Depositary thinks is equitable and practical. The Depositary may deduct its fees and expenses and the amount of any taxes owed from any payments to holders and it may sell a holder’s deposited shares to pay any taxes owed. The Depositary is not responsible if it decides that it is unlawful or impractical to make a distribution available to holders of ADSs.
The Depositary will notify holders of ADSs of shareholders’ meetings of the Company and will arrange to deliver voting materials to such holders of ADSs if requested by the Company. Upon request by a holder, the Depositary will endeavour to appoint such holder as proxy in respect of such holder’s deposited shares entitling such holder to attend and vote at shareholders’ meetings. Holders of ADSs may also instruct the Depositary to vote their deposited securities and the Depositary will try, as far as practical and lawful, to vote deposited shares in accordance with such instructions. The Company cannot ensure that holders will receive voting materials or
otherwise learn of an upcoming shareholders’ meeting in time to ensure that holders can instruct the Depositary to vote their shares.
Upon payment of appropriate fees, expenses and taxes: (i) shareholders may deposit their shares with the Depositary and receive the corresponding class and amount of ADSs; and (ii) holders of ADSs may surrender their ADSs to the Depositary and have the corresponding class and amount of shares credited to their account.
Further, subject to certain limitations, holders may, at any time, cancel ADSs and withdraw their underlying shares or have the corresponding class and amount of shares credited to their account.
FEES PAID BY HOLDERS OF ADSs
The Depositary collects its fees for delivery and surrender of ADSs directly from investors depositing shares or surrendering ADSs for the purpose of withdrawal or from intermediaries acting for them. The Depositary collects fees for making distributions to investors by deducting those fees from the amounts distributed or by selling a portion of distributable property to pay the fees. The Depositary may generally refuse to provide fee-attracting services until its fees for those services are paid. See page 215.
PAYMENTS BY DEPOSITARY TO THE COMPANY
J.P. Morgan Chase Bank, N.A., as Depositary, has agreed to share with the Company portions of certain fees collected, less ADS programme expenses paid by the Depositary. For example, these expenses include the Depositary’s annual programme fees, transfer agency fees, custody fees, legal expenses, postage and envelopes for mailing annual and interim financial reports, printing and distributing dividend cheques, electronic filing of US federal tax information, mailing required tax forms, stationery, postage, facsimile and telephone calls and the standard out-of-pocket maintenance costs for the ADSs. From January 1, 2019, to February 14, 2020, the Company received $1,320,599 from the Depositary.
DIVIDEND REINVESTMENT PLAN
Equiniti Financial Services Limited, part of the same group of companies as the Company’s Registrar, Equiniti Limited, operates a Dividend Reinvestment Plan (“DRIP”) which enables RDS shareholders to elect to have their dividend payments used to purchase RDS shares of the same class as those already held by them. More information can be found at www.shareview.co.uk/info/drip or by contacting Equiniti.
ABN AMRO Bank N.V. and JP Morgan Chase Bank N.A. also operate dividend reinvestment options. More information can be found by contacting the relevant provider.
ADDITIONAL INFORMATION SHELL FORM 20-F 2019 | 216 | |
Persons depositing or withdrawing shares must pay: | For: |
$5.00 or less per 100 ADSs (or portion of 100 ADSs) | Issuance of ADSs, including those resulting from a distribution of shares, rights or other property; |
Cancellation of ADSs for the purpose of their withdrawal, including if the deposit agreement terminates; and | |
Distribution of securities to holders of deposited securities by the Depositary to ADS registered holders. | |
Registration and transfer fees | Registration and transfer of shares on the share register to or from the name of the Depositary or its agent when they deposit or withdraw shares. |
Expenses of the Depositary | Cable, telex and facsimile transmissions (when expressly provided in the deposit agreement); and Converting foreign currency into dollars. |
Taxes and other governmental charges the Depositary or the custodian has to pay on any ADS or share underlying an ADS, for example, share transfer taxes, stamp duty or withholding taxes | As necessary. |
In addition to the above, the Depositary may charge: (i) a dividend fee of $5.00 or less per 100 ADSs (or portion of 100 ADSs) for cash dividends or issuance of ADSs resulting from share dividends and (ii) an administrative fee of $5.00 or less per 100 ADSs (or portion of 100 ADSs) per calendar year. The Company and Depositary have agreed not to charge these fees at this time.
EXCHANGE CONTROLS AND OTHER LIMITATIONS AFFECTING SECURITY HOLDERS
Other than restrictions affecting those individuals, entities, government bodies, corporations or agencies that are subject to European Union (EU) sanctions for example, regarding Syria, and those sanctions adopted by the government of the UK, and the general EU prohibition to transfer funds to and from for example, North Korea, we are not aware of any other legislative or other legal provision currently in force in the UK, the Netherlands or arising under the Articles restricting remittances to holders of the Company’s ordinary shares who are non-residents of the UK, or affecting the import or export of capital.
TAXATION
GENERAL
The Company is incorporated in England and Wales and tax-resident in the Netherlands. As a tax resident of the Netherlands, it is generally required by Dutch law to withhold tax at a rate of 15% on dividends on its ordinary shares and ADSs, subject to the provisions of any applicable tax convention or domestic law. Depending on their particular circumstances, non-Dutch tax-resident holders may be entitled to a full or partial refund of Dutch withholding tax. The following sets forth the operation of other provisions on dividends on the Company’s various ordinary shares and ADSs to UK and US holders, as well as certain other tax rules pertinent to holders. Holders should consult their own tax adviser if they are uncertain as to the tax treatment of any dividend.
DIVIDENDS PAID ON THE DIVIDEND ACCESS SHARES
There is no Dutch withholding tax on dividends on B shares or B ADSs, provided that such dividends are paid on the dividend access shares pursuant to the dividend access mechanism (see “Dividend access mechanism for B shares” on page 108). Dividends paid on the dividend access shares are treated as UK-source for tax purposes and there is no UK withholding tax on them.
In 2019, all dividends with respect to B shares and B ADSs were paid on the dividend access shares pursuant to the dividend access mechanism.
DUTCH WITHHOLDING TAX
When Dutch withholding tax applies on dividends paid to a US holder (that is, dividends on A shares or A ADSs, or on B shares or B ADSs that are not paid on the dividend access shares pursuant to the dividend access mechanism), the US holder will be subject to Dutch withholding tax at the rate of 15%. A US holder who is entitled to the benefits of the 1992 Double Taxation Convention (the Convention) between the USA and the Netherlands as amended by the protocol signed on March 8, 2004, will be entitled to a reduction in the Dutch withholding tax, either by way of a full or a partial exemption at source or by way of a partial refund or a credit as follows:
▪ | if the US holder is an exempt pension trust as described in article 35 of the Convention, or an exempt organisation as described in article 36 thereof, the US holder will be exempt from Dutch withholding tax; or |
▪ | if the US holder is a company that holds directly at least 10% of the voting power in the Company, the US holder will be subject to Dutch withholding tax at a rate not exceeding 5%. |
In general, the entire dividend (including any amount withheld) will be dividend income to the US holder and the withholding tax will be treated as a foreign income tax that is eligible for credit against the US holder’s income tax liability or a deduction subject to certain limitations. A “US holder” includes, but is not limited to, a citizen or resident of the USA, or a corporation or other entity organised under the laws of the USA or any of its political subdivisions.
When Dutch withholding tax applies on dividends paid to UK tax-resident holders (that is, dividends on A shares or A ADSs, or on B shares or B ADSs that are not paid on the dividend access shares pursuant to the dividend access mechanism), the dividend will typically be subject to withholding tax at a rate of 15%. Such UK tax-resident holder may be entitled to a credit (not repayable) for withholding tax against their UK tax liability. However, certain corporate shareholders are, subject to conditions, exempt from UK tax on dividends. Withholding tax suffered cannot be offset against such exempt dividends. UK tax-resident holders should also be entitled to claim a refund of one-third of the Dutch withholding tax from the Dutch tax authorities in reliance on the tax convention between the Netherlands and the UK. Pension plans meeting certain defined criteria can, however, be entitled to claim a full refund or exemption at source of the dividend tax withheld. Also, UK tax-resident corporate shareholders holding at least a 5% shareholding and meeting other defined criteria are exempted at source from dividend tax.
For holders who are tax-resident in any other country, the availability of a whole or partial exemption or refund of Dutch withholding tax is governed by Dutch tax law and/or the tax convention, if any, between the Netherlands and the country of the holder’s residence.
There may be other grounds on which holders who are tax-resident in the UK, the USA or any other country can obtain a full or partial refund of the Dutch withholding tax, depending on their particular circumstances; see “Taxation: General” above.
DUTCH CAPITAL GAINS TAXATION
Capital gains on the sale of shares of a Dutch tax-resident company by a US holder are generally not subject to taxation by the Netherlands unless the US holder has a permanent establishment therein and the capital gain is derived from the sale of shares that are part of the business property of the permanent establishment.
DUTCH SUCCESSION DUTY AND GIFT TAXES
Shares of a Dutch tax-resident company held by an individual who is not a resident or a deemed resident of the Netherlands will generally not be subject to succession duty in the Netherlands on the individual’s death.
ADDITIONAL INFORMATION SHELL FORM 20-F 2019 | 217 | |
A gift of shares of a Dutch tax-resident company by an individual who is not a resident or a deemed resident of the Netherlands is generally not subject to Dutch gift tax.
UK STAMP DUTY AND STAMP DUTY RESERVE TAX
Sales or transfers of the Company’s ordinary shares within a clearance service (such as Euroclear Nederland) or of the Company’s ADSs within the ADS depositary receipts system will not give rise to a stamp duty reserve tax (SDRT) liability and should not in practice require the payment of UK stamp duty.
The transfer of the Company’s ordinary shares to a clearance service (such as Euroclear Nederland) or to an issuer of depositary shares (such as ADSs) will generally give rise to a UK stamp duty or SDRT liability at the rate of 1.5% of consideration given or, if none, of the value of the shares. A sale of the Company’s ordinary shares that are not held within a clearance service (for example, settled through the UK’s CREST system of paperless transfers) will generally be subject to UK stamp duty or SDRT at the rate of 0.5% of the amount of the consideration, normally paid by the purchaser.
CAPITAL GAINS TAX
For the purposes of UK capital gains tax, the market values [A] of the shares of the former public parent companies of the Royal Dutch/Shell Group at the relevant dates were:
£ | ||||
March 31, 1982 | July 20, 2005 | |||
Royal Dutch Petroleum Company (N.V. Koninklijke Nederlandsche Petroleum Maatschappij) which ceased to exist on December 21, 2005 | 1.1349 | 17.6625 | ||
The “Shell” Transport and Trading Company, p.l.c. which delisted on July 19, 2005 | 1.4502 | Not applicable | ||
[A] Restated where applicable to reflect all capitalisation issues since the relevant date. This includes the change in the capital structure in 2005, when Royal Dutch Shell plc became the single parent company of Royal Dutch Petroleum Company and of The “Shell” Transport and Trading Company, p.l.c., now The Shell Transport and Trading Company Limited, and one share in Royal Dutch Petroleum Company was exchanged for two Royal Dutch Shell plc A shares and one share in The “Shell” Transport and Trading Company, p.l.c. was exchanged for 0.287333066 Royal Dutch Shell plc B shares..
ADDITIONAL INFORMATION SHELL FORM 20-F 2019 | 218 | |
Section 13(r) of the US Securities Exchange Act of 1934 disclosure | |
In accordance with our General Business Principles and Code of Conduct, Shell seeks to comply with all applicable international trade laws including applicable sanctions and embargoes.
The activities listed below have been conducted outside the USA by non-US affiliates of Royal Dutch Shell plc. None of the payments disclosed below were made in US dollars, nor are any of the balances disclosed below held in US dollars; however, for disclosure purposes, all have been converted into US dollars at the appropriate exchange rate. We do not believe that any of the transactions or activities listed below violated US sanctions.
In 2019, we paid fees for trademark renewals to the Iranian Intellectual Property Office in the amount of $1,583 and paid agent fees in the amount of $4,357 to Dr. Alexander Aghayan and Associates Law Firm for trademark renewal and legal services. Additionally, we discovered that in 2018 we paid fees in the amount of $1,861 for trademark renewals to the Iranian Intellectual Property Office and paid agent fees in the amount of $438 to Abardad International Law Office for trademark renewal and legal services, and paid additional agent fees in the amount of $262 to Brandstock Services AG in relation to trademark renewals. These payments may continue in the future. There was no gross revenue or net profit associated with these transactions.
In 2019, we paid $31,868 for the clearance of overflight permits for Shell aircraft over Iranian airspace. There was no gross revenue or net profit associated with these transactions. On occasion, our aircraft may be routed over Iran and therefore these payments may continue in the future.
We maintain accounts with Karafarin Bank, where our cash deposits (balance of $5,116,266 at December 31, 2019) generated non-taxable interest income of $223,391 in 2019, and we paid $5 in bank charges.
ADDITIONAL INFORMATION SHELL FORM 20-F 2019 | 219 | |
Non-GAAP measures reconciliations | |
These non-GAAP measures, also known as alternative performance measures, are financial measures other than those defined in International Financial Reporting Standards, which Shell considers provide useful information.
EARNINGS ON A CURRENT COST OF SUPPLIES BASIS
Segment earnings are presented on a current cost of supplies basis (CCS earnings), which is the earnings measure used by the Chief Executive Officer for the purposes of making decisions about allocating resources and assessing performance. On this basis, the purchase price of volumes sold during the period is based on the current cost of supplies during the same period after making allowance for the tax effect. CCS earnings therefore exclude the effect of changes in the oil price on inventory carrying amounts. The current cost of supplies adjustment does not impact cash flow from operating activities in the “Consolidated Statement of Cash Flows”.
Reconciliation of CCS earnings to income for the period | $ million | |||||
2019 | 2018 | 2017 | ||||
Earnings on a current cost of supplies basis (CCS earnings) | 15,827 | 24,364 | 12,471 | |||
Attributable to non-controlling interest | (557 | ) | (531 | ) | (390 | ) |
Earnings on a current cost of supplies basis attributable to Royal Dutch Shell plc shareholders | 15,270 | 23,833 | 12,081 | |||
Current cost of supplies adjustment | 605 | (458 | ) | 964 | ||
Non-controlling interest | (33 | ) | (23 | ) | (68 | ) |
Income attributable to Royal Dutch Shell plc shareholders | 15,842 | 23,352 | 12,977 | |||
Non-controlling interest | 590 | 554 | 458 | |||
Income for the period | 16,432 | 23,906 | 13,435 | |||
CASH CAPITAL EXPENDITURE AND CAPITAL INVESTMENT
Capital investment is a measure used to make decisions about allocating resources and assessing performance. It comprises Capital expenditure, Investments in joint ventures and associates and Investments in equity securities, exploration expense excluding well write-offs, leases recognised in the period and other adjustments.
The definition reflects two changes with effect from January 1, 2019, for simplicity reasons. Firstly, “Investments in equity securities” now includes investments under the Corporate segment and is aligned with the line introduced in the Consolidated Statement of Cash Flows from January 1, 2019. Secondly, the adjustments previously made to bring the Capital investment measure onto an accruals basis no longer apply. Comparative information has been revised.
Cash capital expenditure is introduced with effect from January 1, 2019, to monitor investing activities on a cash basis, excluding items such as lease additions which do not necessarily result in cash outflows in the period. The measure comprises the following lines from the Consolidated Statement of Cash flows: Capital expenditure, Investments in joint ventures and associates and Investments in equity securities. Information for prior periods are stated to enable comparison.
The reconciliation of “Capital expenditure” to “Cash capital expenditure” and “Capital investment” is as follows.
Cash capital expenditure and Capital investment reconciliation | $ million | |||||
2019 | 2018 | 2017 | ||||
Capital expenditure [A] | 22,971 | 23,011 | 20,845 | |||
Investments in joint ventures and associates [A] | 743 | 880 | 595 | |||
Investments in equity securities [A] | 205 | 187 | 93 | |||
Cash capital expenditure | 23,919 | 24,078 | 21,533 | |||
Of which: | ||||||
Integrated Gas | 4,299 | 3,819 | 3,616 | |||
Upstream | 10,277 | 12,582 | 11,670 | |||
Downstream | 8,926 | 7,408 | 6,090 | |||
Corporate | 418 | 269 | 157 | |||
Exploration expense, excluding exploration wells written off | 1,137 | 889 | 1,048 | |||
Leases recognised in the period | 4,494 | 452 | 1,074 | |||
Other adjustments | (762 | ) | (541 | ) | — | |
Capital investment | 28,788 | 24,878 | 23,655 | |||
Of which: | ||||||
Integrated Gas | 6,706 | 4,259 | 3,921 | |||
Upstream | 11,075 | 12,785 | 13,160 | |||
Downstream | 10,542 | 7,565 | 6,418 | |||
Corporate | 465 | 269 | 157 | |||
[A] Included within Cash flow from investing activities in the “Consolidated Statement of Cash Flows”.
OPERATING EXPENSES
Operating expenses is a measure of Shell’s cost management performance, comprising items from the “Consolidated Statement of Income” as follows.
Operating expenses | $ million | |||||
2019 | 2018 | 2017 | ||||
Production and manufacturing expenses | 26,438 | 26,970 | 26,652 | |||
Selling, distribution and administrative expenses | 10,493 | 11,360 | 10,509 | |||
Research and development | 962 | 986 | 922 | |||
Total | 37,893 | 39,316 | 38,083 | |||
Of which | ||||||
Integrated Gas | 6,667 | 6,014 | 5,471 | |||
Upstream | 12,043 | 12,157 | 12,656 | |||
Downstream | 18,697 | 20,743 | 19,583 | |||
Corporate | 486 | 402 | 373 | |||
RETURN ON AVERAGE CAPITAL EMPLOYED
Return on average capital employed (ROACE) measures the efficiency of our utilisation of the capital that we employ. In this calculation, ROACE is defined as income for the period, adjusted for after-tax interest expense, as a percentage of the average capital employed for the period. Capital employed consists of total equity, current debt and non-current debt.
ADDITIONAL INFORMATION SHELL FORM 20-F 2019 | 220 | |
Calculation of return on average capital employed | $ million | |||||
2019 | 2018 | 2017 | ||||
Income for the period | 16,432 | 23,906 | 13,435 | |||
Interest expense after tax | 3,024 | 2,513 | 2,995 | |||
Income before interest expense | 19,456 | 26,419 | 16,430 | |||
Capital employed - opening | 295,398 | 283,477 | 280,988 | |||
Capital employed - closing | 286,887 | 279,358 | 283,477 | |||
Capital employed - average | 291,142 | 281,417 | 282,233 | |||
ROACE | 6.7 | % | 9.4 | % | 5.8 | % |
FREE CASH FLOW AND ORGANIC FREE CASH FLOW
Free cash flow is used to evaluate cash available for financing activities, including dividend payments, after investment in maintaining and growing our business.
Organic free cash flow is introduced in 2019, and it is defined as Free cash flow excluding the cash flows from acquisition and divestment activities. It is a measure used by management to evaluate generation of cash flow without these activities. Information for 2018 is stated to enable comparison.
Free cash flow and Organic free cash flow | $ million | |||||
2019 | 2018 | 2017 | ||||
Cash flow from operating activities | 42,178 | 53,085 | 35,650 | |||
Cash flow from investing activities | (15,779 | ) | (13,659 | ) | (8,029 | ) |
Free cash flow | 26,399 | 39,426 | 27,621 | |||
Less: Cash inflows related to divestments [A] | 7,871 | 10,465 | ||||
Add: Tax paid on divestments | 187 | 482 | ||||
Add: Cash outflows related to inorganic capital expenditure [B] | 1,400 | 1,740 | ||||
Organic free cash flow | 20,116 | 31,183 | ||||
[A] Cash inflows related to divestments includes Proceeds from sale of property, plant and equipment and businesses, Proceeds from sale of joint ventures and associates, and Proceeds from sale of equity securities as reported in the "Consolidated Statement of Cash Flows".
[B] Cash outflows related to inorganic capital expenditure includes portfolio actions which expand Shell's activities through acquisitions and restructuring activities as reported in capital expenditure lines in the "Consolidated Statement of Cash Flows".
SHAREHOLDER DISTRIBUTION
Shareholder distribution is used to evaluate the level of cash distribution to shareholders. It is defined as the sum of Cash dividends paid to Royal Dutch Shell plc shareholders and Repurchases of shares, both of which are reported in the Consolidated Statement of Cash Flows.
Calculation of shareholder distribution | $ million | |||||
2019 | 2018 | 2017 | ||||
Cash dividends paid to Royal Dutch Shell plc shareholders | 15,198 | 15,675 | 10,877 | |||
Repurchases of shares | 10,188 | 3,947 | — | |||
Shareholder distribution | 25,386 | 19,622 | 10,877 | |||
DIVESTMENTS
Following the completion of the $30 billion divestment programme for 2016-18, the Divestments measure was discontinued with effect from January 1, 2019.
ADDITIONAL INFORMATION SHELL FORM 20-F 2019 | 221 | |
Index to the Exhibits | |
Exhibit No. | Description | ||
1.1 | |||
1.2 | |||
2.1 | |||
2.2 | |||
2.3 | |||
4.1 | |||
4.2 | |||
4.3 | |||
4.4 | |||
7.1 | Calculation of Return on Average Capital Employed (ROACE) (incorporated by reference to page 219-220 herein). | ||
7.2 | Calculation of gearing (incorporated by reference to page 18 and Note 14 to the Consolidated Financial Statements on page 167 herein). | ||
8.1 | |||
12.1 | |||
12.2 | |||
13.1 | |||
99.1 | |||
99.2 | |||
101 | Interactive data files. | ||
ADDITIONAL INFORMATION SHELL FORM 20-F 2019 | 222 | |
Signatures | |
The registrant hereby certifies that it meets all of the requirements for filing on Form 20-F and that it has duly caused and authorised the undersigned to sign the Form 20-F on its behalf.
Royal Dutch Shell plc
/s/ Ben van Beurden | |
Ben van Beurden | |
Chief Executive Officer | |
March 11, 2020 | |
ADDITIONAL INFORMATION SHELL FORM 20-F 2019 | 223 | |
INTENTIONALLY LEFT BLANK
ADDITIONAL INFORMATION SHELL FORM 20-F 2019 | 224 | |
INTENTIONALLY LEFT BLANK
ADDITIONAL INFORMATION SHELL FORM 20-F 2019 | 225 | |
FINANCIAL CALENDAR IN 2020
The Annual General Meeting will be held on May 19, 2020.
2019 Fourth quarter [A] | 2020 First quarter [B] | 2020 Second quarter [B] | 2020 Second quarter [B] | |
Results announcements | January 30 | April 30 | July 30 | October 29 |
Interim dividend timetable | ||||
Announcement date | January 30 [C] | April 30 | July 30 | October 29 |
Ex-dividend date [D] | February 13 | May 14 | August 13 | November 12 |
Record date | February 14 | May 15 | August 14 | November 13 |
Closing of currency election date [E] | February 28 | June 2 | August 28 | November 27 |
Pounds sterling and euro equivalents announcement date | March 9 | June 8 | September 8 | December 3 |
Payment date | March 23 | June 22 | September 21 | December 16 |
[A] In respect of the financial year ended December 31, 2019.
[B] In respect of the financial year ended December 31, 2020.
[C] The Directors do not propose to recommend any further distribution in respect of 2019.
[D] The New York Stock Exchange (NYSE), with effect from September 5, 2017, reduced the standard settlement cycle in accordance with the SEC amendments to Exchange Act Rule 15c6-1(a).
Under these rules, regular settlement will occur on a T+2 basis for trades occurring on or after the SEC’fs implementation date of September 5, 2017. As a result RDS A ADSs and RDS B ADSs
traded on the NYSE markets will now settle in line with RDS A shares and RDS B shares traded on European markets, who moved to a T+2 settlement basis for trades in 2014, resulting in the
same ex-dividend date for RDS A shares, RDS B shares, RDS A ADSs and RDS B ADSs. Record dates will not change. The timings of these are detailed above.
[E] A different currency election date may apply to shareholders holding shares in a securities account with a bank or financial institution ultimately through Euroclear Nederland. This may also apply
to other shareholders who do not hold their shares either directly on the Register of Members or in the corporate sponsored nominee arrangement. Shareholders can contact their broker, financial intermediary, bank or financial institution for the election deadline that applies.
REGISTERED OFFICE Royal Dutch Shell plc Shell Centre London SE1 7NA United Kingdom Registered in England and Wales Company number 4366849 Registered with the Dutch Trade Register under number 34179503 HEADQUARTERS Royal Dutch Shell plc Carel van Bylandtlaan 30 2596 HR The Hague The Netherlands | SHAREHOLDER RELATIONS Royal Dutch Shell plc Carel van Bylandtlaan 30 2596 HR The Hague The Netherlands +31 (0)70 377 1272 or Royal Dutch Shell plc Shell Centre London SE1 7NA United Kingdom +44 (0)20 7934 3363 royaldutchshell.shareholders@shell.com www.shell.com/shareholder | INVESTOR RELATIONS Royal Dutch Shell plc PO Box 162 2501 AN The Hague The Netherlands +31 (0)70 377 4540 or Shell Oil Company Investor Relations 150 N Dairy Ashford Houston, TX 77079 USA +1 832 337 2034 ir-europe@shell.com ir-usa@shell.com www.shell.com/investor | ||
SHARE REGISTRATION Equiniti Aspect House Spencer Road Lancing West Sussex BN99 6DA United Kingdom 0800 169 1679 (UK) +44 (0)121 415 7073 For online information about your holding and to change the way you receive your company documents: www.shareview.co.uk | AMERICAN DEPOSITARY SHARES (ADSS) JPMorgan Chase Bank, N.A. P.O. Box 64504 St. Paul, MN 55164-0504 USA Overnight correspondence to: JPMorgan Chase Bank, N.A. 1110 Centre Pointe Curve, Suite 101 Mendota Heights, MN 55120-4100 USA +1 888 737 2377 (USA only) +1 651 453 2128 (International) jpmorgan.adr@eq-us.com www.adr.com/shareholder | REPORT ORDERING www.shell.com/order Annual Report/20-F service for US residents +1 888 301 0504 | ||