UNITED STATES
SECURITIES AND EXCHANGE COMMISSION
Washington, D.C. 20549
FORM 10-K
(Mark One)
x ANNUAL REPORT PURSUANT TO SECTION 13 OR 15(d) OF THE SECURITIES EXCHANGE ACT OF 1934
For the fiscal year ended December 31, 2012
or
o TRANSITION REPORT PURSUANT TO SECTION 13 OR 15(d) OF THE SECURITIES EXCHANGE ACT OF 1934
For the transition period from to
000-50974
(Commission File Number)
Bridge Capital Holdings
(Exact name of registrant as specified in its charter)
|
California |
|
80-0123855 |
|
(State or other jurisdiction of |
|
(I.R.S. Employer Identification Number) |
|
incorporation or organization) |
|
|
55 Almaden Boulevard, San Jose, CA 95113
(Address of principal executive offices, Zip Code)
Registrant’s telephone number, including area code: (408) 423-8500
Securities registered pursuant to Section 12 (b) of the Act:
|
|
|
Name of each exchange |
|
Title of each class |
|
on which registered |
|
Common Stock, no par value |
|
Nasdaq Capital Market |
Securities registered pursuant to Section 12 (g) of the Act: None
Indicate by check mark if the registrant is a well-known seasoned issuer, as defined in Rule 405 of the Securities Act. Yes o No x
Indicate by check mark if the registrant is not required to file reports pursuant to Section 13 or Section 15(d) of the Act. Yes o No x
Bridge Capital Holdings (1) has filed all reports required to be filed by section 13 or 15(d) of the Securities Exchange Act of 1934 during the preceding 12 months and (2) has been subject to such filing requirements for the past 90 days. Yes x No o
Indicate be check mark whether the registrant has submitted electronically and posted on its corporate website, if any, every Interactive Data File required to be submitted and posted pursuant to Rule 405 of Regulation S-T (§ 232.405 of this chapter) during the preceding 12 months (or for such shorter period that the registrant was required to submit and post such files). Yes x No o
Indicate by checkmark if disclosure of delinquent filers pursuant to Item 405 of Regulation S-K is not contained herein, and will not be contained, to the best of registrant’s knowledge, in definitive proxy or information statements incorporated by reference in Part III of this Form 10-K or any amendment to this Form 10-K. o
Indicate by check mark whether the registrant is a large accelerated filer, an accelerated filer, a non-accelerated filer or a smaller reporting company. See the definitions of “large accelerated filer” and “accelerated filer” and “smaller reporting company” in Rule 12b-2 of the Exchange Act. (Check one):
|
Large accelerated filer o |
|
Accelerated filer x |
|
|
|
|
|
Non-accelerated filer o |
|
Smaller reporting company o |
|
(Do not check if a smaller reporting company) |
|
|
Indicate by check mark whether the registrant is a shell company (as defined in Rule 12b-2 of the Act). Yes o No x
The aggregate market value of the voting stock held by non-affiliates of Bridge Capital Holdings was $150,425,622 as of June 30, 2012.
As of February 27, 2013, Bridge Capital Holdings had 15,741,673 shares of common stock outstanding.
Documents incorporated by reference: The Company’s Proxy Statement for its 2013 Annual Meeting of Shareholders is incorporated herein by reference in Part III, Items 10 through 14.
Forward-looking Statements
IN ADDITION TO THE HISTORICAL INFORMATION, THIS ANNUAL REPORT CONTAINS CERTAIN FORWARD-LOOKING INFORMATION WITHIN THE MEANING OF SECTION 27A OF THE SECURITIES ACT OF 1933, AS AMENDED, AND SECTION 21E OF THE SECURITIES EXCHANGE ACT OF 1934, AS AMENDED, AND WHICH ARE SUBJECT TO THE “SAFE HARBOR” CREATED BY THOSE SECTIONS. THE READER OF THIS ANNUAL REPORT SHOULD UNDERSTAND THAT ALL SUCH FORWARD-LOOKING STATEMENTS ARE SUBJECT TO VARIOUS UNCERTAINTIES AND RISKS THAT COULD AFFECT THEIR OUTCOME. THE COMPANY’S ACTUAL RESULTS COULD DIFFER MATERIALLY FROM THOSE SUGGESTED BY SUCH FORWARD-LOOKING STATEMENTS. SUCH RISKS AND UNCERTAINTIES INCLUDE, AMONG OTHERS, (1) COMPETITIVE PRESSURE IN THE BANKING INDUSTRY INCREASES SIGNIFICANTLY; (2) CHANGES IN THE INTEREST RATE ENVIRONMENT REDUCES MARGINS; (3) GENERAL ECONOMIC CONDITIONS, EITHER NATIONALLY OR REGIONALLY, CONTINUE TO DETERIORATE OR FAIL TO IMPROVE, RESULTING IN, AMONG OTHER THINGS, FURTHER DETERIORATION IN CREDIT QUALITY; (4) CHANGES IN THE REGULATORY ENVIRONMENT; (5) CHANGES IN BUSINESS CONDITIONS AND INFLATION; (6) COSTS AND EXPENSES OF COMPLYING WITH THE INTERNAL CONTROL PROVISIONS OF THE SARBANES-OXLEY ACT AND OUR DEGREE OF SUCCESS IN ACHIEVING COMPLIANCE; (7) CHANGES IN SECURITIES MARKETS; (8) FUTURE CREDIT LOSS EXPERIENCE; (9) CIVIL DISTURBANCES OR TERRORIST THREATS OR ACTS, OR APPREHENSION ABOUT POSSIBLE FUTURE OCCURANCES OF ACTS OF THIS TYPE; (10) THE INVOLVEMENT OF THE UNITED STATES IN WAR OR OTHER HOSTILITIES; AND (11) THE MATTERS DISCUSSED IN THIS REPORT UNDER “ITEM 1A — RISK FACTORS” AND “ITEM 7 — MANAGEMENT’S DISCUSSION AND ANALYSIS OF FINANCIAL CONDITION AND RESULTS OF OPERATIONS — CRITICAL ACCOUNTING POLICIES. THEREFORE, THE INFORMATION IN THIS ANNUAL REPORT SHOULD BE CAREFULLY CONSIDERED AGAINST THESE UNCERTAINTIES AND RISKS WHEN EVALUATING THE BUSINESS PROSPECTS OF THE COMPANY.
FORWARD-LOOKING STATEMENTS ARE GENERALLY IDENTIFIABLE BY THE USE OF TERMS SUCH AS “BELIEVE,” “EXPECT,” “INTEND,” “ANTICIPATE,” “ESTIMATE,” “PROJECT,” “ASSUME,” “PLAN,” “PREDICT,” “FORECAST,” “IN MANAGEMENT’S OPINION,” “MANAGEMENT CONSIDERS” OR SIMILAR EXPRESSIONS. WHEREVER SUCH PHRASES ARE USED, SUCH STATEMENTS ARE AS OF AND BASED UPON THE KNOWLEDGE OF MANAGEMENT, AT THE TIME MADE AND ARE SUBJECT TO CHANGE BY THE PASSAGE OF TIME AND/OR SUBSEQUENT EVENTS, AND ACCORDINGLY SUCH STATEMENTS ARE SUBJECT TO THE SAME RISKS AND UNCERTAINTIES NOTED ABOVE WITH RESPECT TO FORWARD-LOOKING STATEMENTS. THE COMPANY DOES NOT UNDERTAKE, AND SPECIFICALLY DISCLAIMS ANY OBLIGATION, TO UPDATE ANY FORWARD-LOOKING STATEMENTS TO REFLECT OCCURRENCES OR UNANTICIPATED EVENTS OR CIRCUMSTANCES AFTER THE DATE OF SUCH STATEMENTS.
PART 1
Item 1. Business
General
Bridge Capital Holdings (the “Company”) is a bank holding company. The Company was incorporated in the State of California on April 6, 2004 for the purpose of becoming the holding company for its subsidiary, Bridge Bank, National Association (the “Bank”). As a bank holding company, the Company is supervised by the Board of Governors of the Federal Reserve System (the “FRB”).
The Company acquired 100% of the voting shares of the Bank effective October 1, 2004 following approval of the Bank’s shareholders on May 20, 2004. Prior to becoming a subsidiary of the Company, the common stock of the Bank had been registered with the Comptroller of the Currency (the “Comptroller”) under the Securities and Exchange Act of 1934, as amended. After becoming the Bank’s holding company, the Company’s common stock was registered with the Securities and Exchange Commission. Filings by Bridge Capital Holdings are made with the SEC rather than the Comptroller and are available on the SEC’s website, www.sec.gov as well as on the Company’s website, www.bridgecapitalholdings.com.
The Bank is a national banking association chartered by the Comptroller. The Bank was organized on December 6, 2000 and commenced operations on May 14, 2001. Its headquarters office is located at 55 Almaden Boulevard, San Jose, California, 95113. It maintains two branch offices in the Silicon Valley region, and five loan production offices located throughout the U.S.
The Bank’s lending solutions include working capital lines of credit, structured finance (asset-based lending and factoring), 7(a) and 504 Small Business Administration (SBA) loans, commercial real estate loans, sustainable energy project financing, growth capital loans, equipment financing, letters of credit, and corporate credit cards. The bank’s depository and corporate banking services include cash and treasury management solutions, interest-bearing term deposit accounts, checking accounts, ACH payment and wire solutions, fraud protection, remote deposit capture through its Smart Deposit Express, courier services, and online banking. Additionally, the Bank’s International Banking Division serves clients operating in the global marketplace through services including foreign exchange (FX payments and hedging), letters of credit, and import/export financing.
The Bank attracts the majority of its loan and deposit business from the numerous small and middle market companies located in the Silicon Valley, though with an increasingly larger portion of new business from its national loan production offices. The Bank reserves the right to change its business plan at any time, and no assurance can be given that, if the Bank’s proposed business plan is followed, it will prove successful.
The Bank does not offer trust services, but it will attempt to make such services available to the Bank’s customers through correspondent institutions. The deposits of the Bank are insured by the Federal Deposit Insurance Corporation (the “FDIC”) up to applicable limits, and the Bank is a member of the Federal Reserve System.
In 2002, the Bank opened a full-service branch office in Palo Alto, California. Also in 2002, it established a U.S. Small Business Administration Lending Group and launched Bridge Capital Finance Group, a factoring and asset-based lending group. In 2003, the Bank opened an office in downtown San Jose. In 2005, the Bank launched its Technology Banking Group and the International Banking Group. In 2011, it launched its Energy and Infrastructure Group. In addition, the Bank operates loan production offices in San Francisco and Pleasanton, California, Dallas, Texas, Reston, Virginia and Boston, Massachusetts.
Deposits
The Bank offers a wide range of deposit accounts designed to attract small and medium size commercial businesses as well as business professionals and retail customers, including a complete line of checking and savings products, such as passbook savings, “Money Market Deposit” accounts which require minimum balances and frequency of withdrawal limitations, NOW accounts, and bundled accounts.
Additional deposit services include a full complement of convenience oriented services, including remote deposit capture, direct payroll and social security deposit, post-paid bank-by-mail, and Internet banking, including on-line access to account information. However, at this time, the Bank does not open accounts through the Internet. Any plans to offer online account opening must be approved in advance by the Comptroller. No assurance can be given that, if applied for, such approval will be obtained.
As the Bank has no automated teller machines, the Bank may refund all or a portion of the transaction charges incurred by its customers for their use of another bank’s ATM. The majority of the Bank’s deposits are obtained from businesses located in the Bank’s primary service area.
Lending Activities
The Bank engages in a full range of lending products designed to meet the specialized needs of its customers, including commercial lines of credit and term loans, constructions loans, and equipment loans. Additionally, the Bank extends accounts receivable, factoring and inventory financing to qualified customers. Loans are also offered through the Small Business Administration guarantee 7(a) and 504 loan programs (described below under “Item 7. Management’s Discussion and Analysis of Financial Condition and Results of Operations—FINANCIAL CONDITION AND EARNING ASSETS—Loan Portfolio”).
The Bank finances real estate construction projects, primarily for the construction of owner occupied and 1 to 4 unit residential developments and commercial buildings.
The Bank directs its commercial lending principally toward businesses whose demands for credit fall within the Bank’s lending limit. In the event there are customers whose commercial loan demands exceed the Bank’s lending limits, the Bank seeks to arrange for such loans on a participation basis with other financial institutions.
The Bank also extends lines of credit to individual borrowers, and provides homeowner equity loans, home improvement loans, auto financing, credit and debit cards and overdraft/cash reserve accounts.
Business Hours
In order to attract loan and deposit business, the Bank maintains lobby hours currently between 9:00 a.m. and 5:00 p.m. Monday through Friday.
For additional information concerning the Bank, see Selected Financial Data under Item 6 on page 22.
Competition
The banking business in Santa Clara County, as it is elsewhere in California, is highly competitive, and each of the major branch banking institutions operating in California has one or more offices in the Bank’s service area. The Bank competes in the marketplace for deposits and loans, principally against these banks, independent community banks, savings and loan associations, thrift and loan companies, credit unions, mortgage banking companies, and non-bank institutions such as mutual fund companies and investment brokerage firms that claim a portion of the market.
Larger banks may have a competitive advantage because of higher lending limits and major advertising and marketing campaigns. They also perform services, such as trust services, discount brokerage and insurance services, which the Bank is not authorized or prepared to offer currently. The Bank has made arrangements with its correspondent banks and with others to provide such services for its customers. For borrowers requiring loans in excess of the Bank’s legal lending limit, the Bank has offered, and intends to offer in the future, such loans on a participating basis with its correspondent banks and with other independent banks, retaining the portion of such loans which is within its lending limit. As of December 31, 2012, the Bank’s unsecured legal lending limit to a single borrower and such borrower’s related parties was $22.6 million based on regulatory capital of $150.7 million.
The Bank’s business is concentrated in its service area, which primarily encompasses Santa Clara County, and also includes, to a lesser extent, the contiguous areas of Alameda, San Mateo and Santa Cruz counties. In certain lines of business the Bank has extended beyond its primary service area.
In order to compete with major financial institutions in its primary service area, the Bank uses to the fullest extent possible the flexibility that is accorded by its independent status. This includes an emphasis on specialized services, local promotional activity, and personal contacts by the Bank’s officers, directors and employees. The Bank also seeks to provide special services and programs for individuals in its primary service area who are employed in the agricultural, professional and business fields, such as loans for equipment, furniture, and tools of the trade or expansion of practices or businesses.
Banking is a business that depends on interest rate differentials. In general, the difference between the interest rate
paid by the Bank to obtain its deposits and its other borrowings and the interest rate received by the Bank on loans extended to its customers and on securities held in the Bank’s portfolio comprises the major portion of the Bank’s earnings.
Commercial banks compete with savings and loan associations, credit unions, other financial institutions and other entities for funds. For instance, yields on corporate and government debt securities and other commercial paper affect the ability of commercial banks to attract and hold deposits. Commercial banks also compete for loans with savings and loan associations, credit unions, consumer finance companies, mortgage companies and other lending institutions.
The interest rate differentials of the Bank, and therefore its earnings, are affected not only by general economic conditions, both domestic and foreign, but also by the monetary and fiscal policies of the United States as set by statutes and as implemented by federal agencies, particularly the Federal Reserve Board. This agency can and does implement national monetary policy, such as seeking to curb inflation and combat recession, by its open market operations in United States government securities, adjustments in the amount of interest free reserves that banks and other financial institutions are required to maintain, and adjustments to the discount rates applicable to borrowing by banks from the Federal Reserve Board (FRB). These activities influence the growth of bank loans, investments and deposits and also affect interest rates charged on loans and paid on deposits.
Supervision and Regulation
General
The Company and the Bank are subject to extensive regulation under both federal and state law. This regulation is intended primarily for the protection of depositors, the deposit insurance fund, and the banking system as a whole, and not the protection of shareholders of the Company. Set forth below is a summary description of some of the significant laws and regulations applicable to the Company and the Bank. The description is qualified in its entirety by reference to the applicable laws and regulations.
Dodd-Frank Wall Street Reform and Consumer Protection Act
On July 21, 2010, the Dodd-Frank Wall Street Reform and Consumer Protection Act (the “Dodd-Frank Act”) was enacted. The Dodd-Frank Act is intended to effect a fundamental restructuring of federal banking regulation. The Dodd-Frank Act is expected to have a significant impact on the Company’s business operations as its provisions take effect. The numerous rules and regulations that have been adopted and are yet to be adopted under Dodd-Frank are likely to significantly impact the Company’s operations and compliance costs, such as changes in FDIC assessments, the permitted payment of interest on demand deposits and projected enhanced consumer compliance requirements. Among the provisions of Dodd-Frank that could affect us are the following:
· The creation of a Financial Services Oversight Counsel to identify emerging systemic risks and improve interagency cooperation;
· The establishment of strengthened capital and liquidity requirements for banks and bank holding companies, including minimum leverage and risk-based capital requirements no less than the strictest requirements in effect for depository institutions as of the date of enactment. Under these standards, trust preferred securities will be excluded from Tier 1 capital unless such securities were issued prior to May 19, 2010 by a bank holding company with less than $15 billion in assets;
· The requirement that bank holding companies serve as a source of financial strength for their depository institution subsidiaries;
· Enhanced regulation of financial markets, including the derivative and securitization markets, and the elimination of certain proprietary trading activities by banks (the “Volcker Rule”);
· A permanent increase of the previously implemented temporary increase of FDIC deposit insurance to $250,000;
· Authorization for financial institutions to pay interest on business checking accounts;
· Changes in the calculation of FDIC deposit insurance assessments, such that the assessment base will no longer be the institution’s deposit base, but instead will be its average consolidated total assets less its average tangible equity;
· The elimination of remaining barriers to de novo interstate branching by banks;
· Expanded restrictions on transactions with affiliates and insiders under Section 23A and 23B of the Federal Reserve Act and lending limits for derivative transactions, repurchase agreements, and securities lending and borrowing transactions;
· Provisions that affect corporate governance and executive compensation at most United States publicly traded companies, including (i) stockholder advisory votes on executive compensation, (ii) executive compensation “clawback” requirements for companies listed on national securities exchanges in the event of materially inaccurate statements of earnings, revenues, gains or other criteria, (iii) enhanced independence requirements for compensation committee members, and (iv) giving the SEC authority to adopt proxy access rules which would permit stockholders of publicly traded companies to nominate candidates for election as director and have those nominees included in a company’s proxy statement; and
· The creation of a Bureau of Consumer Financial Protection, which is authorized to promulgate and enforce consumer protection regulations relating to bank and non-bank financial products and which and which may examine and enforce its regulations on banks with more than $10 billion in assets.
Emergency Economic Stabilization Act and American Recovery and Reinvestment Act
On October 3, 2008, Congress adopted the Emergency Economic Stabilization Act (“EESA”), including a Troubled Asset Relief Program (“TARP”). TARP gave the United States Treasury Department (“Treasury”) authority to deploy up to $700 billion into the financial system for the purpose of improving liquidity in capital markets. On October 14, 2008, Treasury announced plans to direct $250 billion of this authority into preferred stock investments in banks and bank holding companies through a Capital Purchase Program (“CPP”).
In December of 2008, the Company elected to participate in the CPP by issuing to Treasury $23,864,000 in preferred stock and a warrant to purchase 396,412 shares of common stock at an exercise price of $9.03 per share. Treasury’s preferred stock earned cumulative dividends at the rate of 5% for the first five years and 9% thereafter. On March 16, 2011, the Company completed its redemption of the preferred stock in its entirety. On April 20, 2011, the Company announced that it had repurchased the warrant issued to Treasury.
Bank Holding Company Act
The Company is registered as a bank holding company under the Bank Holding Company Act of 1956, as amended (the “BHCA”). As a bank holding company, the Company is subject to examination and supervision by the FRB and is subject to limitations on the kinds of businesses in which it can engage directly or through subsidiaries. While the Company may manage or control banks, it is generally prohibited from acquiring direct or indirect ownership or control of more than five percent of any class of voting shares of an entity engaged in non-banking activities, unless the FRB finds such activities to be “so closely related to banking” as to be deemed “a proper incident thereto” within the meaning of the BHCA. As a bank holding company, the Company may not acquire more than five percent of the voting shares of any domestic bank without the prior approval of (or, for “well managed” companies, prior written notice to) the FRB.
The BHCA includes minimum capital requirements for bank holding companies. See the section titled “Regulation and Supervision — Regulatory Capital Requirements”. Under certain conditions, the FRB may conclude that certain actions of a bank holding company, such as the payment of a cash dividend, would constitute an unsafe and unsound banking practice.
Change in Bank Control
The BHCA and the Change in Bank Control Act of 1978, as amended, together with regulations of the FRB and the Comptroller, require that, depending on the particular circumstances, either FRB approval must be obtained or notice must be furnished to the Comptroller and not disapproved prior to any person or company acquiring “control” of a company that controls a bank, such as the Company, or a national bank, such as the Bank, subject to exemptions for some transactions. Control is conclusively presumed to exist if an individual or company (i) acquires 25% or more of any class of voting securities of the bank or (ii) has the direct or indirect power to direct or cause the direction of the management and policies of the Bank, whether through ownership of voting securities, by contract or otherwise; provided that no individual will be deemed to control the bank solely on account of being director, officer or employee of the Bank. Control is presumed to exist if a person acquires 10% or more but less than 25% of any class of voting securities and either the company has registered securities under Section 12 of the Exchange Act or no other person will own a greater percentage of that class of voting securities immediately after the transaction.
Securities Exchange Act of 1934
The Company’s common stock is registered under the Securities Exchange Act of 1934, as amended (“Exchange Act”). This registration requires ongoing compliance with the Exchange Act and its periodic filing requirements, as well as a wide range of federal and state securities laws. Under the Exchange Act and the SEC’s rules, the Company must electronically file periodic and current reports as well as proxy statements with the SEC. The Company electronically files the following reports with the SEC: Form 10-K (Annual Report), Form 10-Q (Quarterly Report), Form 8-K (Current Report), and Schedule 14A (Information Required in Proxy Statement). The Company may prepare additional filings as required. The SEC maintains an Internet site, http://www.sec.gov, at which all forms filed electronically may be accessed. Our SEC filings are also available on our website at http://www.bridgebank.com.
Sarbanes-Oxley Act
The Sarbanes-Oxley Act of 2002 implemented legislative reforms intended to address corporate and accounting fraud. In addition to the establishment of an accounting oversight board to enforce auditing, quality control and independence standards, the law restricts provision of both auditing and consulting services by accounting firms. To ensure auditor independence, any non-audit services being provided to an audit client require pre-approval by the company’s audit committee members. In addition, the audit partners assigned to the company must be rotated every five years. The act requires chief executive officers and chief financial officers, or their equivalent, to certify to the accuracy of periodic reports filed with the SEC, subject to civil and criminal penalties if they knowingly or willfully violate the certification requirement. Under the act legal counsel are required to report evidence of a material violation of the securities laws or a breach of fiduciary duty by a company to its chief executive officer or its chief legal officer, and, if such officer does not appropriately respond, to report such evidence to the audit committee or other similar committee of the board of directors or the board itself.
The act also prohibits any officer or director of a company or any other person acting under their direction from taking any action to fraudulently influence, coerce, manipulate or mislead any independent public or certified accountant engaged in the audit of the company’s financial statements for the purpose of rendering the financial statement’s materially misleading. The act requires the SEC to prescribe rules requiring inclusion of an internal control report and assessment by both management and the external auditors in the annual report to stockholders. In addition, the act requires that each financial report required to be prepared in accordance with (or reconciled to) accounting principles generally accepted in the United States and filed with the SEC reflect all material correcting adjustments that are identified by a “registered public accounting firm” in accordance with accounting principles generally accepted in the United States and the rules and regulations of the SEC.
The Company’s chief executive officer and chief financial officer are each required to certify that the Company’s quarterly and annual reports do not contain any untrue statement of a material fact. The rules have several requirements, including having these officers certify that: they are responsible for establishing, maintaining and regularly evaluating the effectiveness of the Company’s internal controls; they have made certain disclosures to the Company’s auditors and the audit committee of the Board of Directors about the Company’s internal controls; and they have included information in the Company’s quarterly and annual reports about their evaluation and whether there have been significant changes in the Company’s internal controls or in other factors that could significantly affect internal controls subsequent to the evaluation.
Regulation of the Bank
The Bank is regulated and supervised by the Comptroller and is subject to periodic examination by the Comptroller. Deposits of the Bank’s customers are insured by the FDIC up to the maximum limit of $250,000. As an FDIC- insured bank, the Bank is subject to certain regulations of the FDIC. As a national bank, the Bank is a member of the Federal Reserve System and is also subject to the regulations of the FRB.
The regulations of the Comptroller, the FDIC and the FRB govern most aspects of the Bank’s business and operations, including but not limited to limiting the nature and amount of investments and loans which may be made, regulating the issuance of securities, restricting the payment of dividends and regulating bank expansion and bank activities. The Bank also is subject to the requirements and restrictions of various consumer laws and regulations.
Statutes, regulations and policies affecting the banking industry are frequently under review by Congress and by the federal bank regulatory agencies that are charged with supervisory and examination authority over banking institutions. Changes in the banking and financial services industry are likely to occur in the future. Some of the changes may create opportunities for the Bank to compete in financial markets with less regulation. However, these changes also may create new competitors in geographic and product markets which have historically been limited by law to insured depository institutions such as the Bank. Changes in the statutes, regulations, or policies that affect the
Bank cannot necessarily be predicted and may have a material effect on the Bank’s business and earnings. In addition, the regulatory agencies which have jurisdiction over the Bank have broad discretion in exercising their supervisory powers.
The Comptroller can pursue an enforcement action against the Bank for unsafe and unsound practices in conducting its business, or for violations of any law, rule or regulation or provision, any consent order with any agency, any condition imposed in writing by the agency, or any written agreement with the agency. During periods of economic stress, regulatory oversight can be expected to increase and regulatory agencies become more aggressive in responding to concerns and trends identified in examinations. One result of this heightened activity is an increase in the issuance of enforcement actions. Enforcement actions may include the imposition of a conservator or receiver, cease-and-desist orders and written agreements, the termination of insurance of deposits, the imposition of civil money penalties and removal and prohibition orders against institution-affiliated parties. See “Supervision and Regulation — Potential Enforcement Actions and Supervisory Agreements.”
In addition to the regulation and supervision outlined above, banks must be prepared for judicial scrutiny of their lending and collection practices. For example, some banks have been found liable for exercising remedies which their loan documents authorized upon the borrower’s default. This has occurred in cases where the exercise of those remedies was determined to be inconsistent with the previous course of dealing between the bank and the borrower. As a result, banks must exercise caution, incur expense and face exposure to liability when dealing with delinquent loans.
Capital Adequacy Requirements
Federal regulations establish guidelines for calculating “risk-adjusted” capital ratios. These guidelines, which apply to banks and bank holding companies, establish a systematic approach of assigning risk weights to bank assets and commitments, making capital requirements more sensitive to differences in risk profiles among banking organizations. For these purposes, “Tier 1” capital consists of common equity, non-cumulative perpetual preferred stock and minority interests in the equity accounts of consolidated subsidiaries and excludes goodwill. “Tier 2” capital consists of cumulative perpetual preferred stock, limited-life preferred stock, mandatory convertible securities, subordinated debt and (subject to a limit of 1.25% of risk-weighted assets) general loan loss reserves. In calculating the relevant ratio, a bank’s assets and off-balance sheet commitments are risk-weighted; thus, for example, generally loans are included at 100% of their book value while assets considered less risky are included at a percentage of their book value (20%, for example, for inter-bank obligations and Government Agency securities, and 0% for vault cash and U.S. Government securities). Under these regulations, to be considered adequately capitalized, banks and bank holding companies are required to maintain a risk-based capital ratio of 8%, with Tier 1 risk-based capital (primarily shareholders’ equity) constituting at least 50% of total qualifying capital or 4% of risk-weighted assets.
The risk-based capital ratio focuses principally on broad categories of credit risk, and may not take into account many other factors that can affect a bank’s financial condition. These factors include overall interest rate risk exposure; liquidity, funding and market risks; the quality and level of earnings; concentrations of credit risk; certain risks arising from nontraditional activities; the quality of loans and investments; the effectiveness of loan and investment policies; and management’s overall ability to monitor and control financial and operating risks, including the risk presented by concentrations of credit and nontraditional activities. The Comptroller has addressed many of these areas in related rule-making proposals. In addition to evaluating capital ratios, an overall assessment of capital adequacy must take account of each of these other factors including, in particular, the level and severity of problem and adversely classified assets. For this reason, the final supervisory judgment on a bank’s capital adequacy may differ significantly from the conclusions that might be drawn solely from the absolute level of the bank’s risk-based capital ratio. The Comptroller has stated that banks generally are expected to operate above the minimum risk-based capital ratio. Banks contemplating significant expansion plans, as well as those institutions with high or inordinate levels of risk, are required to hold capital consistent with the level and nature of the risks to which they are exposed.
Further, the banking agencies have adopted modifications to the risk-based capital regulations to include standards for interest rate risk exposures. Interest rate risk is the exposure of a bank’s current and future earnings and equity capital arising from movements in interest rates. While interest rate risk is inherent in a bank’s role as a financial intermediary, it introduces volatility to bank earnings and to the economic value of the bank. The banking agencies have addressed this problem by implementing changes to the capital standards to include a bank’s exposure to declines in the economic value of its capital due to changes in interest rates as a factor that the banking agencies consider in evaluating an institution’s capital adequacy. Bank examiners consider a bank’s historical financial performance and its earnings exposure to interest rate movements as well as qualitative factors such as the adequacy of a bank’s internal interest rate risk management.
Under certain circumstances, the Comptroller may determine that the capital ratios for a national bank must be maintained at levels that are higher than the minimum levels required by the guidelines. A national bank that does not achieve and maintain required capital levels may be subject to supervisory action by the Comptroller through the issuance of a capital directive to ensure the maintenance of required capital levels.
The federal banking agencies, including the Comptroller, have adopted regulations implementing a system of prompt corrective action under the Federal Deposit Insurance Corporation Improvement Act (“FDICIA”). The regulations establish five capital categories with the following characteristics: (1) “Well capitalized,” consisting of institutions with a total risk-based capital ratio of 10.0% or greater, a Tier 1 risk-based capital ratio of 6.0% or greater and a leverage ratio of 5.0% or greater and which are not operating under an order, written agreement, capital directive or prompt corrective action directive; (2) “Adequately capitalized,” consisting of institutions with a total risk-based capital ratio of 8.0% or greater, a Tier 1 risk-based capital of 4.0% or greater and a leverage ratio of 4.0% or greater and which do not meet the definition of a “well capitalized” institution; (3) “Undercapitalized,” consisting of institutions with a total risk-based capital ratio of less than 8.0%, a Tier 1 risk-based capital ratio of less than 4.0%, or a leverage ratio of less than 4.0%; (4) “Significantly undercapitalized,” consisting of institutions with a total risk-based capital ratio of less than 6.0%, a Tier 1 risk-based capital ratio of less than 3.0%, or a leverage ratio of less than 3.0%; and (5) “Critically undercapitalized,” consisting of institutions with a ratio of tangible equity to total assets that is equal to or less than 2.0%.
The regulations establish procedures for the classification of financial institutions within the capital categories, for filing and reviewing capital restoration plans required under the regulations, and for the issuance of directives by the appropriate regulatory agency, among other matters. See “Supervision and Regulation — Prompt Corrective Action” for additional discussion regarding regulations.
An institution that is less than well-capitalized cannot accept brokered deposits without the consent of the FDIC. The appropriate federal banking agency, after notice and an opportunity for a hearing, is authorized to treat a well capitalized, adequately capitalized or undercapitalized insured depository institution as if it had a lower capital-based classification if it is in an unsafe and unsound condition or engaging in an unsafe and unsound practice. Thus, an adequately capitalized institution can be subjected to the restrictions (described below) that are imposed on undercapitalized institutions (provided that a capital restoration plan cannot be required of the institution), and an undercapitalized institution can be subjected to the restrictions (also described below) applicable to significantly undercapitalized institutions. See “Supervision and Regulation — Prompt Corrective Action” for additional discussion regarding federal banking agency supervision.
An insured depository institution cannot make a capital distribution (as broadly defined to include, among other things, dividends, redemptions and other repurchases of stock), or pay management fees to any person or persons that control the institution, if it would be undercapitalized following the distribution. However, a federal banking agency may (after consultation with the FDIC) permit an insured depository institution to repurchase, redeem, retire or otherwise acquire its shares if (i) the action is taken in connection with the issuance of additional shares or obligations in at least an equivalent amount and (ii) the action will reduce the institution’s financial obligations or otherwise improve its financial condition. An undercapitalized institution is generally prohibited from increasing its average total assets, and is also generally prohibited from making acquisitions, establishing new branches, or engaging in any new line of business except under an accepted capital restoration plan or with the approval of the FDIC. In addition, a federal banking agency has authority with respect to undercapitalized depository institutions to take any of the actions it is required to or may take with respect to a significantly undercapitalized institution (as described below) if it determines “that those actions are necessary to carry out the purpose” of FDICIA.
The federal banking agencies have adopted a joint agency policy statement indicating that the adequacy and effectiveness of a bank’s interest rate risk management process and the level of its interest rate exposures are critical factors in the agencies’ evaluation of the bank’s capital adequacy.
At December 31, 2012, the Company and the Bank have capital ratios that place them in the “well capitalized” category. See Footnote 16 to the Bank’s Financial Statements included under Item 8 of this Annual Report.
Basel Accords
The current risk-based capital guidelines that apply to the Company and the Bank are based upon the 1988 capital accord (referred to as “Basel I”) of the International Basel Committee on Banking Supervision (the “Basel Committee”), a committee of central banks and bank supervisors and regulators from the major industrialized countries. The Basel Committee develops broad policy guidelines for use by each country’s supervisors in determining the supervisory policies they apply.
A new framework and accord, referred to as Basel II, evolved from 2004 to 2006 out of the efforts to revise capital adequacy standards for internationally active banks. Basel II emphasized internal assessment of credit, market and operational risk and supervisory assessment and market discipline. The Company was not required to comply with Basel II and elected not to apply the Basel II standards.
In 2010 and 2011, the Basel Committee finalized proposed reforms on capital and liquidity, generally referred to as Basel III, to reconsider regulatory capital standards, supervisory and risk-management requirements and additional disclosures to further strengthen the Basel II framework in response to the worldwide economic downturn. Basel III provides for increases in the minimum Tier 1 common equity ratio and the minimum requirement for the Tier 1 capital ratio. Basel III additionally includes a “capital conservation buffer” on top of the minimum requirement designed to absorb losses in periods of financial and economic distress; and an additional required countercyclical buffer percentage to be implemented according to a particular nation’s circumstances. These capital requirements are further supplemented under Basel III by a non-risk-based leverage ratio. Basel III also reaffirms the Basel Committee’s intention to introduce higher capital requirements on securitization and trading activities.
Implementation of Basel III in the United States will require regulations and guidelines by United States banking regulators, which may differ in significant ways from the recommendations published by the Basel Committee. The new Basel III capital standards were scheduled to be phased in from January 1, 2013 until January 1, 2019 but United States banking regulators have delayed the adoption of final rules implementing these standards. It is unclear how smaller banking organizations in the United States will be subject to these regulations and guidelines. The Basel III standards, if adopted, could lead to significantly higher capital requirements, higher capital charges and more restrictive leverage and liquidity ratios. The standards would, among other things:
· Impose more restrictive eligibility requirements for Tier 1 and Tier 2 capital;
· Increase the minimum Tier 1 common equity ratio to 4.5%, net of regulatory deductions, and introduce a capital conservation buffer of an additional 2.5% of common equity to risk-weighted assets, raising the target minimum common equity ratio to 7.0%;
· Increase the minimum Tier 1 capital ratio to 8.5% inclusive of the capital conservation buffer;
· Increase the minimum total capital ratio to 10.5% inclusive of the capital conservation buffer;
· Introduce a countercyclical capital buffer of up to 2.5% of common equity or other fully loss absorbing capital for periods of excess credit growth; and
· Introduces a non-risk adjusted Tier 1 leverage ratio of 3.0%, based on a measure of total exposure rather than total assets, and new liquidity standards.
Deposit Insurance Coverage and Premiums
The Bank is a member of the Deposit Insurance Fund (the “DIF”), which is administered by the FDIC. Deposits at the Bank are insured by the FDIC up to applicable limits.
The FDIC assesses deposit insurance premiums on each FDIC-insured institution quarterly based on annualized rates. A depository institutions’ FDIC insurance premium assessment rate is adjusted for risk and is based on its capital, supervisory ratings and other factors. Under FDIC regulations, the assessment base against which deposit insurance premiums are calculated is the depository institution’s average total consolidated assets less the institution’s average tangible equity. Assessment rates on this assessment base initially range from 5 to 35 basis points. After potential adjustment for certain risk elements, the assessments rates range from 2.5 to 45 basis points.
The Dodd-Frank Act increased the minimum reserve ratio (the ratio of the net worth of the DIF to estimated insured deposits) from 1.15% of estimated deposits to 1.35% of estimated deposits (or a comparable percentage of the asset-based assessment base described above). The Dodd-Frank Act requires the FDIC to offset the effect of the increase in the minimum reserve ratio when setting assessments for insured depository institutions with less than $10 billion in total consolidated assets, including the Bank. The FDIC has until September 30, 2020 to achieve the new minimum reserve ratio of 1.35%.
FDIC insured institutions are required to pay a Financing Corporation assessment, in order to fund the interest on bonds issued to resolve thrift failures in the 1980s. For the quarterly period ended December 31, 2009, the Financing Corporation assessment equaled 1.02 basis points for each $100 in domestic deposits. These assessments, which may be revised based upon the level of deposits, will continue until the bonds mature in the years 2017 through 2019.
The FDIC may terminate the deposit insurance of any insured depository institution, including the Bank, if it determines after a hearing that the institution has engaged in unsafe or unsound practices, is in an unsafe or unsound condition to continue operations or has violated any applicable law, regulation, rule, order or condition imposed by the FDIC. It also may suspend deposit insurance temporarily during the hearing process for the permanent termination of insurance, if the institution has no tangible capital.
Prompt Corrective Action
The federal banking agencies, including the Comptroller, have adopted regulations implementing a system of prompt corrective action under FDICIA. The regulations establish five capital categories: (1) ”well capitalized,”; (2) ”adequately capitalized,”; (3) ”undercapitalized,” ; (4) ”significantly undercapitalized,”; and (5) ”critically undercapitalized,” See “Capital Adequacy Requirements” above for a discussion of the features of each capital category.
The FDIC has authority: (a) to request that an institution’s primary regulatory agency (in the case of the Bank, the Comptroller) take enforcement action against it based upon an examination by the FDIC or the agency, (b) if no action is taken within 60 days and the FDIC determines that the institution is in an unsafe and unsound condition or that failure to take the action will result in continuance of unsafe and unsound practices, to order that action be taken against the institution, and (c) to exercise this enforcement authority under “exigent circumstances” merely upon notification to the institution’s primary regulatory agency. This authority gives the FDIC the same enforcement powers with respect to any institution and its subsidiaries and affiliates as the primary regulatory agency has with respect to those entities.
An undercapitalized institution is required to submit an acceptable capital restoration plan to its primary federal bank regulatory agency. The banking agency may not accept a capital restoration plan unless the agency determines, among other things, that the plan “is based on realistic assumptions, and is likely to succeed in restoring the institution’s capital” and “would not appreciably increase the risk . . . to which the institution is exposed.”
FDICIA provides that the appropriate federal regulatory agency must require an insured depository institution that is significantly undercapitalized, or that is undercapitalized and either fails to submit an acceptable capital restoration plan within the time period allowed by regulation or fails in any material respect to implement a capital restoration plan accepted by the appropriate federal banking agency, to take one or more of the following actions: (a) sell enough shares, including voting shares, to become adequately capitalized; (b) merge with (or be sold to) another institution (or holding company), but only if grounds exist for appointing a conservator or receiver; (c) restrict specified transactions with banking affiliates as if the “sister bank” exception to the requirements of Section 23A of the Federal Reserve Act did not exist; (d) otherwise restrict transactions with bank or non-bank affiliates; (e) restrict interest rates that the institution pays on deposits to “prevailing rates” in the institution’s “region”; (f) restrict asset growth or reduce total assets; (g) alter, reduce or terminate activities; (h) hold a new election of directors; (i) dismiss any director or senior executive officer who held office for more than 180 days immediately before the institution became undercapitalized, provided that in requiring dismissal of a director or senior executive officer, the agency must comply with procedural requirements, including the opportunity for an appeal in which the director or officer will have the burden of proving his or her value to the institution; (j) employ “qualified” senior executive officers; (k) cease accepting deposits from correspondent depository institutions; (l) divest non-depository affiliates which pose a danger to the institution; (m) be divested by a parent holding company; and (n) take any other action which the agency determines would better carry out the purposes of the prompt corrective action provisions.
In addition to the foregoing sanctions, without the prior approval of the appropriate federal banking agency, a significantly undercapitalized institution may not pay any bonus to any senior executive officer or increase the rate of compensation for a senior executive officer without regulatory approval. If an undercapitalized institution has failed to submit or implement an acceptable capital restoration plan the appropriate federal banking agency is not permitted to approve the payment of a bonus to a senior executive officer.
Not later than 90 days after an institution becomes critically undercapitalized, the institution’s primary federal bank regulatory agency must appoint a receiver or a conservator, unless the agency, with the concurrence of the FDIC, determines that the purposes of the prompt corrective action provisions would be better served by another course of
action. Any alternative determination must be documented by the agency and reassessed on a periodic basis. Notwithstanding the foregoing, a receiver must be appointed after 270 days unless the FDIC determines that the institution has positive net worth, is in compliance with a capital plan, is profitable or has a sustainable upward trend in earnings, and is reducing its ratio of non-performing loans to total loans, and unless the head of the appropriate federal banking agency and the chairperson of the FDIC certify that the institution is viable and not expected to fail.
The FDIC is required, by regulation or order, to restrict the activities of critically undercapitalized institutions. The restrictions must include prohibitions on the institution’s doing any of the following without prior FDIC approval: entering into any material transactions not in the usual course of business, extending credit for any highly leveraged transaction; engaging in any “covered transaction” (as defined in Section 23A of the Federal Reserve Act) with an affiliate; paying “excessive compensation or bonuses”; and paying interest on “new or renewed liabilities” that would increase the institution’s average cost of funds to a level significantly exceeding prevailing rates in the market.
Potential Enforcement Actions and Supervisory Agreements
Under federal law, national banks and their institution-affiliated parties may be the subject of potential enforcement actions by the Comptroller for unsafe and unsound practices in conducting their businesses, or for violations of any law, rule or regulation or provision, any consent order with any agency, any condition imposed in writing by the agency or any written agreement with the agency. During periods of economic stress, regulatory oversight can be expected to increase and regulatory agencies become more aggressive in responding to concerns and trends identified in examinations. One result of this heightened activity is an increase in the issuance of enforcement actions. Enforcement actions may include the imposition of a conservator or receiver, cease-and-desist orders and written agreements, the termination of insurance of deposits, the imposition of civil money penalties and removal and prohibition orders against institution-affiliated parties.
Payment of Dividends
The Company - Historically the Company has not paid dividends but has retained earnings to support growth. The ability of the Company to make dividend payments is subject to statutory and regulatory restrictions. Under California law, a California corporation such as the Company may make a distribution to its shareholders if the corporation’s retained earnings equal at least the amount of the proposed distribution. In the event sufficient retained earnings are not available for the proposed distribution, a California corporation may nevertheless make a distribution to its shareholders if, giving effect to the distribution, the value of the corporation’s assets would equal or exceed the value of its liabilities plus the amount of shareholder preferences, if any.
The primary source of funds for payment of any dividends by the Company to its shareholders will be the receipt of dividends and management fees from the Bank. FDIC policies generally allow cash dividends to be paid only from net operating income, and do not permit dividends to be paid until an appropriate allowance for loans and lease losses has been established and overall capital is adequate. See “Supervision and Regulation — Capital Adequacy Requirements” for additional discussion regarding capital adequacy.
The Bank - The Board of Directors of a national bank may declare the payment of dividends depending upon the earnings, financial condition and cash needs of the bank and general business conditions. A national bank may not pay dividends from its capital. All dividends must be paid out of net profits then on hand, after deducting losses and bad debts. The approval of the Comptroller is required for the payment of dividends if the total of all dividends declared by the bank in any calendar year would exceed the total of its net profits of that year combined with its retained net profits of the two preceding years, less any required transfers to surplus or a fund for the retirement of any preferred stock.
In addition to the above requirements, guidelines adopted by the Comptroller set forth factors which are to be considered by a national bank in determining the payment of dividends. A national bank, in assessing the payment of dividends, is to evaluate the bank’s capital position, its maintenance of an adequate allowance for loan and lease losses, and the need to revise or develop a comprehensive capital plan.
The Comptroller also has broad authority to prohibit a national bank from engaging in banking practices which it considers to be unsafe or unsound. It is possible, depending upon the financial condition of the national bank in question and other factors, that the Comptroller may assert that the payment of dividends or other payments by a bank is considered an unsafe or unsound banking practice and therefore, implement corrective action to address such a practice.
Accordingly, the future payment of cash dividends by the Company will not only depend upon the Bank’s earnings during any fiscal period but will also depend upon the assessment of its Board of Directors of capital requirements and other factors, including dividend guidelines and the maintenance of an adequate allowance for loan and lease losses.
Community Reinvestment Act
Pursuant to the Community Reinvestment Act (the “CRA”) of 1977, the federal regulatory agencies that oversee the banking industry are required to use their authority to encourage financial institutions to help meet the credit needs of the local communities in which such institutions are chartered, consistent with safe and sound banking practices. When conducting an examination of a financial institution such as the Bank, the agencies assess the institution’s record of meeting the credit needs of its entire community, including low- and moderate- income neighborhoods. This record is taken into account in an agency’s evaluation of an application for creation or relocation of domestic branches or for merger with another institution. Failure to address the credit needs of a bank’s community may also result in the imposition of certain other regulatory sanctions, including a requirement that corrective action be taken.
Transactions with Affiliates
Sections 23A and 23B of the Federal Reserve Act and the FRB’s Regulation W limit transactions between a bank and its affiliates and limit a bank’s ability to transfer to its affiliates the benefits arising from the bank’s access to insured deposits, the payment system and the discount window and other benefits of the Federal Reserve system. The statute and regulation impose quantitative and qualitative limits on the ability of a bank to extend credit to, or engage in certain other transactions with, an affiliate (and a non-affiliate if an affiliate benefits from the transaction). However, certain transactions that generally do not expose a bank to undue risk or abuse the safety net are exempted from coverage under Regulation W.
Tying Arrangements and Transactions with Affiliated Persons
A bank is prohibited from tie-in arrangements in connection with any extension of credit, sale or lease of property or furnishing of services. For example, with some exceptions, a bank may not condition an extension of credit on a promise by its customer to obtain other services provided by it, its holding company or other subsidiaries (if any), or on a promise by its customer not to obtain other services from a competitor.
Directors, officers and principal shareholders of the Bank, and the companies with which they are associated, may have banking transactions with the Bank in the ordinary course of business. Any loans and commitments to loan included in these transactions must be made in compliance with the requirements of applicable law, on substantially the same terms, including interest rates and collateral, as those prevailing at the time for comparable transactions with other persons of similar creditworthiness, and on terms not involving more than the normal risk of collectability or presenting other unfavorable features.
USA PATRIOT Act
Pursuant to USA PATRIOT Act, financial institutions are subject to prohibitions against specified financial transactions and account relationships as well as enhanced due diligence and “know your customer” standards in their dealings with foreign financial institutions and foreign customers. For example, the enhanced due diligence policies, procedures, and controls generally require financial institutions to establish anti-money laundering programs and sets forth minimum standards for these programs. The Bank has adopted comprehensive policies and procedures to address the requirements of the USA PATRIOT Act, and management believes that the Bank is currently in compliance with the Act.
Consumer Laws and Regulations
The Bank must also comply with consumer laws and regulations that are designed to protect consumers in transactions with banks. While the list is not exhaustive, these laws and regulations include the Truth in Lending Act, the Truth in Savings Act, the Electronic Funds Transfer Act, the Expedited Funds Availability Act, the Equal Credit Opportunity Act, the Fair Housing Act and the Fair Credit Reporting Act among others. These laws and regulations mandate disclosure requirements and regulate the manner in which financial institutions must deal with customers when taking deposits or making loans. The Bank must comply with the applicable provisions of these consumer protection laws and regulations as part of its ongoing regulatory compliance and customer relations efforts.
Exposure to and Management of Risk
The federal banking agencies examine banks and bank holding companies with respect to their exposure to and management of different categories of risk. Categories of risk identified by the agencies include legal risk, operational risk, market risk, credit risk, interest rate risk, price risk, foreign exchange risk, transaction risk, compliance risk, strategic risk, credit risk, liquidity risk, and reputation risk. This examination approach causes bank regulators to focus on risk management procedures, rather than simply examining every asset and transaction. This approach supplements rather than replaces existing rating systems based on the evaluation of an institution’s capital, assets, management, earnings and liquidity.
Safety and Soundness Standards
Federal banking regulators have adopted guidelines prescribing standards for safety and soundness. The guidelines create standards for a wide range of operational and managerial matters including (a) internal controls, information systems, and internal audit systems; (b) loan documentation; (c) credit underwriting; (d) interest rate exposure; (e) asset growth; (f) compensation and benefits; and (g) asset quality and earnings. Although meant to be flexible, an institution that falls short of the guidelines’ standards may be requested to submit a compliance plan or be subjected to regulatory enforcement actions.
Impact of Government Monetary Policy
The earnings of the Bank are and will be affected by the policies of regulatory authorities, including the Federal Reserve. An important function of the Federal Reserve is to regulate the national supply of bank credit. Among the instruments used to implement these objectives are open market operations in U.S. Government securities, changes in reserve requirements against bank deposits, and changes in the discount rate which banks pay on advances from the Federal Reserve System. These instruments are used in varying combinations to influence overall growth and distribution of bank loans, investments and deposits, and their use may also affect interest rates on loans or interest rates paid for deposits. The monetary policies of the FRB have had a significant effect on the operating results of commercial banks in the past and are expected to continue to do so in the future. The effect, if any, of such policies upon the future business earnings of the Bank cannot be predicted.
Legislation and Proposed Changes
From time to time, legislation is enacted which has the effect of increasing the cost of doing business, limiting or expanding permissible activities or affecting the competitive balance between banks and other financial institutions. Proposals to change the laws and regulations governing the operations and taxation of banks, bank holding companies and other financial institutions are frequently made in Congress and before various bank regulatory agencies. For example, certain proposals to substantially revise the structure of regulation of financial services are under consideration. No prediction can be made as to the likelihood of any major changes or the impact that new laws or regulations might have on the Company or the Bank.
Conclusion
It is impossible to predict with any certainty the competitive impact the laws and regulations described above will have on commercial banking in general and on the business of the Company in particular, or to predict whether or when any of the proposed legislation and regulations described above will be adopted. It is anticipated that banking will continue to be a highly regulated industry. Additionally, there has been a continued lessening of the historical distinction between the services offered by financial institutions and other businesses offering financial services, and the trend toward nationwide interstate banking is expected to continue. As a result of these factors, it is anticipated banks will experience increased competition for deposits and loans and, possibly, further increases in their cost of doing business.
Item 1A. Risk Factors
RISK FACTORS
Readers and prospective investors in our securities should carefully consider the following risk factors as well as the other information contained or incorporated by reference in this report.
The risks and uncertainties described below are not the only ones facing us. Additional risks and uncertainties that management is not aware of or focused on or that management currently deems immaterial may also impair our business operations. This report is qualified in its entirety by these risk factors.
If any of the following risks actually occur, the Company’s financial condition and results of operations could be materially and adversely affected. If this were to happen, the value of the Company’s securities could decline significantly, and you could lose all or part of your investment.
General Business Risks
Continued or worsening general economic or business conditions, particularly in California where our business is concentrated, could have an adverse effect on our business, results of operations and financial condition.
Our operations, loans and the collateral securing our loan portfolio are concentrated in the State of California. Our success depends upon the business activity, population, income levels, deposits and real estate activity in this market. As a result, we may be particularly susceptible to the adverse economic conditions in California, and the San Bay Area of Northern California in particular.
Since late 2007, the United States and the State of California in particular have experienced difficult economic conditions. Weak economic conditions are characterized by, among other indicators, deflation, increased levels of unemployment, fluctuations in debt and equity capital markets, increased delinquencies on mortgage, commercial and consumer loans, residential and commercial real estate price declines and lower home sales and commercial activity. All of those factors are generally detrimental to our business.
In addition, our ability to assess the creditworthiness of customers and to estimate the losses inherent in our credit exposure is made more complex by these difficult market and economic conditions. Adverse economic conditions could reduce our growth rate, affect the ability of our customers to repay their loans and generally affect our financial condition and results of operations.
While some economic trends have shown signs of improving in recent months, we cannot be certain that market and economic conditions will substantially improve in the near future. Recent and ongoing events at the state, national and international levels continue to create uncertainty in the economy and financial markets and could adversely impact economic conditions in our market area. A worsening of these conditions would likely exacerbate the adverse effects of the recent market and economic conditions on us and our customers. As a result, we may experience additional increases in foreclosures, delinquencies and customer bankruptcies as well as more restricted access to funds. Any such negative events may have an adverse effect on our business, financial condition, results of operations and stock price. Moreover, because of our geographic concentration, we are less able to diversify our credit risks across multiple markets to the same extent as regional or national financial institutions.
Poor economic conditions in the Northern California real estate market may cause us to suffer higher default rates on our loans and decreased value of the assets we hold as collateral.
The majority of our assets and deposits were generated in Northern California. At December 31, 2012, approximately 30% of our loan portfolio was secured by real property in Northern California. During 2012, the real estate market in Northern California showed signs of stabilization and some improvement, as evidenced by increasing prices and increased transaction volume, and decreased foreclosure rates. These improvements follow an extended period of deterioration and there is no certainty that improvements will continue, or that we not might return to further deterioration in the real estate market. Further deterioration may result in an increase in the level of our nonperforming loans, particularly commercial real estate loans. When real estate prices decline, the value of real estate collateral securing our loans is reduced. As a result, we may experience greater charge-offs and, similarly, our ability to recover on defaulted loans by foreclosing and selling the real estate collateral may be diminished and, as a result, we are more likely to suffer losses on defaulted loans. If this real estate trend in our market areas continues or worsens, the result could be reduced income, increased expenses, and less cash available for lending and other activities, which could
have a material and adverse effect on our financial condition and results of operations.
We may suffer losses in our loan portfolio despite strict adherence to underwriting practices.
We attempt to mitigate the risks inherent in extending credit by adhering to specific underwriting practices, managed by credit professionals. Although we believe that our underwriting criteria is appropriate for the various kinds of loans we fund, we may incur losses on loans that meet our underwriting criteria, and these losses may exceed the amounts set aside as reserves in the Bank’s allowance for loan losses. If our underwriting practices prove to be ineffective, we may incur losses in our loan portfolio, which could have a material and adverse effect on our financial condition and results of operations.
Bank regulatory agencies, as an integral part of their examination process, review our loans and allowance for loan losses. While we believe that our allowance for loan losses is currently adequate to cover potential losses, we cannot guarantee that future increases to the allowance for loan losses may not be required by regulators or other third party loan review or financial audits. Any of these occurrences could materially and adversely affect our financial condition and results of operations.
We are dependent on key personnel and the loss of one or more of those key personnel may materially and adversely affect our prospects.
Competition for qualified employees in the banking industry is intense, and there are limited numbers of qualified persons with knowledge of, and experience in, the California community banking industry. The process of recruiting personnel with the combination of skills and attributes required to carry out our strategies is often lengthy. Our success depends to a significant degree upon our ability to attract and retain qualified management, loan origination, finance, administrative, marketing and business development and technical personnel, and upon the continued contributions of our management and personnel. If we fail to attract and retain the necessary personnel, our financial condition and results of operations may be materially and adversely affected.
We face limits on our ability to lend and the limitation may increase.
Our legal lending limit as of December 31, 2012 was approximately $22.6 million. Accordingly, the size of the loans which we can offer to potential customers is less than the size of loans which many of our competitors with larger lending limits can offer. Our lending limit affects our ability to seek relationships with the area’s larger and more established businesses. We cannot be assured of any success in attracting or retaining customers seeking larger loans or that we can engage in participations of those loans on terms favorable to us. Moreover, to the extent that we incur losses and do not obtain additional capital, our lending limit, which depends upon the amount of our capital, will decrease, which could have a material and adverse effect on our financial condition and results of operations.
Market and Interest Rate Risks
Changes in interest rates could reduce income and cash flow
The Company’s income and cash flow depend to a great extent on the difference between the interest earned on loans and investment securities, and the interest paid on deposits and other borrowings (the “interest rate spread”). We cannot control or prevent changes in the level of interest rates. They fluctuate in response to general economic conditions and the policies of various governmental and regulatory agencies, in particular, the FRB. Changes in monetary policy, including changes in interest rates, will influence the origination of loans, the purchase of investments, the generation of deposits and the rates received on loans and investment securities and paid on deposits and other liabilities. See “Item 7a Quantitative and Qualitative Disclosures About Market Risk” is incorporated by reference in this paragraph.
Recent decreases in market interest rates have caused the Company’s interest rate spread to decline significantly, which reduces revenue and net income. Sustained low levels of market interest rates will likely continue to put pressure on our profitability. Any material reduction in interest rate spread could have a material adverse effect on our business, profitability and financial position.
Liquidity risk could impair our ability to fund operations and jeopardize our financial condition
Liquidity is essential to our business. An inability to raise funds through deposits, borrowings, capital offerings and other sources could have a substantial negative effect on our liquidity. Our access to funding sources in amounts adequate to finance our activities, or on terms attractive to us, could be impaired by factors that impact us specifically or the financial services industry in general. Factors that could detrimentally impact our access to liquidity sources
include a reduction in the level of business activity due to a market downturn or adverse regulatory action against us, or a decrease in depositor or investor confidence in us. Further, as a business bank, a significant portion of our deposits are raised from companies in amounts that exceed levels covered by FDIC insurance. In addition, our ability to borrow could also be impaired by factors that are not specific to us, such as the severe disruption of the financial markets or negative views and expectations about the prospects for the financial services industry as a whole as the recent turmoil faced by banking in the domestic and worldwide credit markets deteriorates.
Risks Related to the nature and geographical location of Bridge Capital Holdings’ business
Bridge Capital Holdings’ invests in loans that contain inherent credit risks that may cause us to incur losses
In our business as a lender, we face the risk that borrowers may fail to pay their loans when due. If borrower defaults cause large aggregate losses, it could have a material adverse impact on our business, profitability and financial condition. We closely monitor the markets in which we conduct our lending operations and attempt to adjust our strategy to control exposure to loans with higher credit risk. Asset reviews are performed using grading standards and criteria similar to those employed by bank regulatory agencies. We have established an evaluation process designed to determine the adequacy of our allowance for loan losses. While this process uses historical and other objective information, the classification of loans and the forecasts and establishment of loan losses are dependent to a great extent on our subjective assessment based upon our experience and judgment. During 2008 and 2009, the rapid deterioration of real estate values prompted us to take substantial charges and provisions to the allowance for loan losses. We can provide no assurance that the credit quality of our loans will not deteriorate in the future and that such deterioration will not adversely affect the Company and that our allowance for loan losses will be adequate to absorb actual losses in the future.
Bridge Capital Holdings’ operations are concentrated geographically in California, and poor economic conditions in California may cause us to incur losses.
Substantially all of Bridge Capital Holdings’ business is located in California. Bridge Capital Holdings’ financial condition and operating results will be subject to changes in economic conditions in California. A significant and prolonged downturn in the California economy could adversely affect financial institutions doing business in California, such as the Company. Economic conditions in California are subject to various uncertainties at this time, including the decline in the technology sector, the California state government’s budgetary difficulties and continuing fiscal difficulties. The Company will be subject to changes in economic conditions. We can provide no assurance that conditions in the California economy will not deteriorate in the future and that such deterioration will not adversely affect Bridge Capital Holdings.
The markets in which Bridge Capital Holdings operates are subject to the risk of earthquakes and other natural disasters
Most of the properties of Bridge Capital Holdings are located in California. Also, most of the real and personal properties which currently secure the Company’s loans are located in California. California is a state which is prone to earthquakes, brush fires, flooding and other natural disasters. In addition to possibly sustaining damage to its own properties, if there is a major earthquake, flood or other natural disaster, Bridge Capital Holdings faces the risk that many of its borrowers may experience uninsured property losses, or sustained job interruption and/or loss which may materially impair their ability to meet the terms of their loan obligations. A major earthquake, flood or other natural disaster in California could have a material adverse effect on Bridge Capital Holdings’ business, financial condition, results of operations and cash flows.
Substantial competition in the California banking market could adversely affect us
Banking is a highly competitive business. We compete actively for loan, deposit, and other financial services business primarily in California. Our competitors include a large number of state and national banks, thrift institutions and credit unions, as well as many financial and non-financial firms that offer services similar to those offered by us. Other competitors include large financial institutions that have substantial capital, technology and marketing resources. Such large financial institutions may have greater access to capital at a lower cost than us, which may adversely affect our ability to compete effectively.
Regulatory Risks
Restrictions on dividends and other distributions could limit amounts payable to us
Various statutory provisions restrict the amount of dividends our subsidiaries can pay to us without regulatory approval. In addition, if any subsidiary of ours were to liquidate, that subsidiary’s creditors will be entitled to receive distributions from the assets of that subsidiary to satisfy their claims against it before we, as a holder of an equity interest in the subsidiary, will be entitled to receive any of the assets of the subsidiary.
Adverse effects of, or changes in, banking or other laws and regulations or governmental fiscal or monetary policies could adversely affect us
We are subject to significant federal and state regulation and supervision, which is primarily for the benefit and protection of our customers and not for the benefit of investors. In the past, our business has been materially affected by these regulations. This trend is likely to continue in the future. Laws, regulations or policies, including accounting standards and interpretations currently affecting us and our subsidiaries, may change at any time. Regulatory authorities may also change their interpretation of these statutes and regulations. During periods of economic stress, regulatory oversight can be expected to increase and regulatory agencies become more aggressive in responding to concerns and trends identified in examinations. Such a regulatory response may effect, among other things, growth rates, business mix, capital levels and payment of dividends Therefore, our business may be adversely affected by any future changes in laws, regulations, policies or interpretations or regulatory approaches to compliance and enforcement, including legislative and regulatory reactions to the current credit crisis, the terrorist attack on September 11, 2001 and future acts of terrorism, and major U.S. corporate bankruptcies and reports of accounting irregularities at U.S. public companies.
As noted above, on October 3, 2008, President Bush signed into law the EESA, which evolved from the U.S. Treasury’s initial proposal in response to the financial crises affecting the banking system and financial markets and going concern threats to investment banks and other financial institutions. This was followed by the ARRA on February 17, 2009 and the Dodd-Frank Act on July 21, 2010. Each of these laws mandate significantly increased supervisory activities and many new studies and regulations. We can give no assurance as to what form additional regulations, particularly those required by the Dodd-Frank Act, might take or whether and when they could become effective.
Additionally, our business is affected significantly by the fiscal and monetary policies of the federal government and its agencies. We are particularly affected by the policies of the Federal Reserve Board, which regulates the supply of money and credit in the U.S. Under long-standing policy of the Federal Reserve Board and the Dodd-Frank Act, a bank holding company is required to act as a source of financial strength for its subsidiary banks. As a result of that requirement, we may be required to commit financial and other resources to our subsidiary bank in circumstances where we might not otherwise do so. Among the instruments of monetary policy available to the Federal Reserve Board are (a) conducting open market operations in U.S. government securities, (b) changing the discount rates of borrowings by depository institutions, and (c) imposing or changing reserve requirements against certain borrowings by banks and their affiliates. These methods are used in varying degrees and combinations to directly affect the availability of bank loans and deposits, as well as the interest rates charged on loans and paid on deposits. The policies of the Federal Reserve Board may have a material effect on our business, results of operations and financial condition.
See “Supervision and Regulation — Legislation and Proposed Changes” for additional discussion regarding adverse effects of, or changes in, banking or other laws and regulations and governmental fiscal or monetary policies.
Systems, Accounting and Internal Control Risks
The accuracy of the Company’s judgments and estimates about financial and accounting matters will impact operating results and financial condition
The Company makes certain estimates and judgments in preparing its financial statements. The quality and accuracy of those estimates and judgments will have an impact on the Company’s operating results and financial condition. See “Critical Accounting Policies and Estimates” in this report and the information referred to in that discussion.
The Company’s information systems may experience an interruption or breach in security
The Company relies heavily on communications and information systems to conduct its business. Any failure, interruption or breach in security of these systems could result in failures or disruptions in the Company’s customer relationship management and systems. There can be no assurance that any such failures, interruptions or security
breaches will not occur or, if they do occur, that they will be adequately corrected by the Company. The occurrence of any such failures, interruptions or security breaches could damage the Company’s reputation, result in a loss of customer business, subject the Company to additional regulatory scrutiny, or expose the Company to litigation and possible financial liability, any of which could have a material adverse effect on the Company’s financial condition and results of operations.
The Company’s controls and procedures may fail or be circumvented
Management regularly reviews and updates the Company’s internal control over financial reporting, disclosure controls and procedures, and corporate governance policies and procedures. Any system of controls and procedures, however well designed and operated, is based in part on certain assumptions and can provide only reasonable, not absolute, assurances that the objectives of the system are met. Any failure or circumvention of the Company’s controls and procedures or failure to comply with regulations related to controls and procedures could have a material adverse effect on the Company’s business, results of operations and financial condition.
Item 1B. Unresolved Staff Comments
None.
Item 2. Properties
The Company’s principal executive office and a full service banking office are located at 55 Almaden Boulevard, City of San Jose, County of Santa Clara, State of California. The office consists of approximately 42,337 square feet on three floors of an eight-story office building. 24,767 square feet of the space was originally sublet from a prior tenant in a sublease which commenced December 26, 2003 and terminated December 31, 2006. The sublease provided for an initial base rent of $28,730 with annual escalations to $45,819 in the final year of the sublease. The Bank has entered into a direct lease with the landlord, which commenced immediately following the expiration of the sublease term on January 1, 2007 for 120 months ending on December 31, 2016. The direct lease provides for an initial twelve-month period of reduced rent followed by a base rent of $47,305 beginning on January 1, 2008 and increasing 3.0% on each anniversary date thereafter. The Bank has also entered into an additional direct lease with the landlord to occupy 17,570 square feet, which commenced November 1, 2006 and terminates on December 31, 2016. The direct lease provides for an initial twelve-month period with no rent followed by an initial base rent of $36,897 with annual escalations to $48,142 in the final year of the lease. The foregoing description is qualified by reference to the lease agreement dated November 1, 2006 Exhibit 10.3 to this Report.
An additional full service banking office is located at 525 University Avenue, City of Palo Alto, County of Santa Clara, State of California. The office consists of approximately 6,495 square feet located in Suite 31 in the building known as the Palo Alto Office Center. The Lease is an amendment to a lease which ended November 30, 2006 and is for a term of 86 months commencing on February 1, 2007 and ending on January 31, 2014. The Lease provides for a base rent of $29,228 through the first anniversary of the lease date. Effective with the first anniversary date the lease payments will be adjusted by a factor that is tied to the Consumer Price Index. The foregoing description is qualified by reference to the lease agreement dated October 15, 2001 attached as exhibit 10.2 to this Report and the amendment to this lease agreement dated March 9, 2006 exhibit 10.5 to this Report.
In addition, the Bank operates loan production offices in San Francisco and Pleasanton, California, Dallas, Texas, Reston, Virginia and Boston, Massachusetts.
Item 3. Legal Proceedings
The Company is not a defendant in any material pending legal proceedings and no such proceedings are known to be contemplated. No director, officer, affiliate, more than 5.0% shareholder of the Company or any associate of these persons is a party adverse to the Company or has a material interest adverse to the Company in any material legal proceeding.
Item 4. Mine Safety Disclosures
Not applicable.
PART II
Item 5. Market for Registrant’s Common Equity, Related Stockholder Matters and Issuer Purchases of Equity Securities
The Company’s Common Stock trades on the Nasdaq Capital Market under the symbol “BBNK”. The following table summarizes those trades of which the Company has knowledge, setting forth the high and low sales prices for the periods indicated.
|
|
|
Sales Price of |
| ||||
|
|
|
Common Stock (1) |
| ||||
|
Three Months Ended |
|
Low |
|
High |
| ||
|
|
|
|
|
|
| ||
|
March 31, 2011 |
|
$ |
8.60 |
|
$ |
9.42 |
|
|
June 30, 2011 |
|
$ |
9.34 |
|
$ |
11.75 |
|
|
September 30, 2011 |
|
$ |
9.18 |
|
$ |
11.99 |
|
|
December 31, 2011 |
|
$ |
9.11 |
|
$ |
11.40 |
|
|
|
|
|
|
|
| ||
|
March 31, 2012 |
|
$ |
10.39 |
|
$ |
13.46 |
|
|
June 30, 2012 |
|
$ |
13.30 |
|
$ |
16.20 |
|
|
September 30, 2012 |
|
$ |
14.85 |
|
$ |
16.29 |
|
|
December 31, 2012 |
|
$ |
13.75 |
|
$ |
15.88 |
|
(1) Prices represent the actual trading history on the Nasdaq Capital Market. Additionally, since trading in the Company’s common stock is limited, the range of prices stated is not necessarily representative of prices which would result from a more active market.
The Company had 1,204 common shareholders of record as of December 31, 2012.
The Company’s shareholders are entitled to receive dividends, when and as declared by its Board of Directors, out of funds legally available, subject to statutory, regulatory, and contractual restrictions. See “Supervision and Regulation — Payment of Dividends” for additional discussion regarding dividends. A California corporation such as Bridge Capital Holdings generally may make a distribution to its shareholders if the corporation’s retained earnings equal at least the amount of the proposed distribution, or, alternatively, to the extent that its assets exceed its liabilities plus Shareholder preferences, if any.
In a policy statement, the FRB has advised bank holding companies that it believes that payment of cash dividends in excess of current earnings from operations is inappropriate and may be cause for supervisory action. Additionally, the Dodd-Frank requirement that holding companies are expected to provide a source of managerial and financial strength to their subsidiary banks potentially restricts a bank holding company’s ability to pay dividends.
The Company has not declared dividends on its common stock since inception of the Bank’s existence. In the future, the Company may consider cash and stock dividends, subject to the restrictions on the payment of cash dividends as described above, depending upon the level of earnings, management’s assessment of future capital needs and other factors considered by the Board of Directors.
The following chart reflects the total return performance of the Company’s common stock for the years ended December 31, 2012, 2011, 2010, 2009, and 2008.
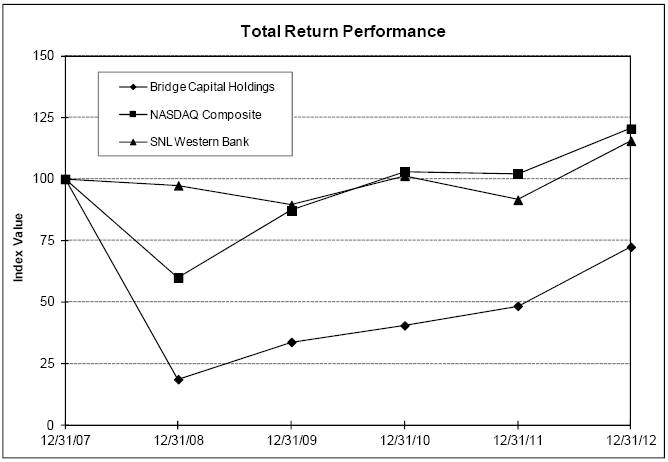
|
|
|
Period Ending |
| ||||||||||
|
Index |
|
12/31/07 |
|
12/31/08 |
|
12/31/09 |
|
12/31/10 |
|
12/31/11 |
|
12/31/12 |
|
|
Bridge Capital Holdings |
|
100.00 |
|
18.62 |
|
33.75 |
|
40.50 |
|
48.42 |
|
72.44 |
|
|
NASDAQ Composite |
|
100.00 |
|
60.02 |
|
87.24 |
|
103.08 |
|
102.26 |
|
120.42 |
|
|
SNL Western Bank |
|
100.00 |
|
97.37 |
|
89.41 |
|
101.31 |
|
91.53 |
|
115.50 |
|
Item 6. Selected Financial Data
The following table presents certain consolidated financial information concerning the business of the Company. This information should be read in conjunction with the Financial Statements and the notes thereto, and Management’s Discussion and Analysis of Financial Condition and Results of Operations contained elsewhere herein.
|
|
|
As of and for the year ended |
| |||||||||||||
|
|
|
December 31, |
| |||||||||||||
|
(dollars in thousands, except per share data) |
|
2012 |
|
2011 |
|
2010 |
|
2009 |
|
2008 |
| |||||
|
Statement of Operations Data: |
|
|
|
|
|
|
|
|
|
|
| |||||
|
Interest income |
|
$ |
62,787 |
|
$ |
50,694 |
|
$ |
45,188 |
|
$ |
44,572 |
|
$ |
58,692 |
|
|
Interest expense |
|
2,195 |
|
2,256 |
|
3,071 |
|
6,763 |
|
13,827 |
| |||||
|
Net interest income |
|
60,592 |
|
48,438 |
|
42,117 |
|
37,809 |
|
44,865 |
| |||||
|
Provision for credit losses |
|
3,950 |
|
2,600 |
|
4,700 |
|
9,200 |
|
31,520 |
| |||||
|
Net interest income after provision for credit losses |
|
56,642 |
|
45,838 |
|
37,417 |
|
28,609 |
|
13,345 |
| |||||
|
Other income |
|
12,984 |
|
9,930 |
|
6,849 |
|
10,312 |
|
9,971 |
| |||||
|
Other expenses |
|
46,212 |
|
42,424 |
|
39,720 |
|
38,071 |
|
36,318 |
| |||||
|
Income before income taxes |
|
23,414 |
|
13,344 |
|
4,546 |
|
850 |
|
(13,002 |
) | |||||
|
Income taxes |
|
9,610 |
|
5,497 |
|
1,955 |
|
(585 |
) |
(5,661 |
) | |||||
|
Net income (loss) |
|
$ |
13,804 |
|
$ |
7,847 |
|
$ |
2,591 |
|
$ |
1,435 |
|
$ |
(7,341 |
) |
|
Preferred Dividends |
|
— |
|
200 |
|
1,955 |
|
4,203 |
|
152 |
| |||||
|
Net income (loss) available to common shareholders |
|
$ |
13,804 |
|
$ |
7,647 |
|
$ |
636 |
|
$ |
(2,768 |
) |
$ |
(7,493 |
) |
|
|
|
|
|
|
|
|
|
|
|
|
| |||||
|
Per Share Data: |
|
|
|
|
|
|
|
|
|
|
| |||||
|
Basic earnings (loss) per share |
|
$ |
0.96 |
|
$ |
0.54 |
|
$ |
0.06 |
|
$ |
(0.42 |
) |
$ |
(1.15 |
) |
|
Diluted earnings (loss) per share |
|
0.92 |
|
0.52 |
|
0.06 |
|
(0.42 |
) |
(1.15 |
) | |||||
|
Book value per common share |
|
9.32 |
|
8.55 |
|
8.16 |
|
7.81 |
|
8.51 |
| |||||
|
|
|
|
|
|
|
|
|
|
|
|
| |||||
|
Balance Sheet Data: |
|
|
|
|
|
|
|
|
|
|
| |||||
|
Balance sheet totals: |
|
|
|
|
|
|
|
|
|
|
| |||||
|
Assets |
|
$ |
1,343,585 |
|
$ |
1,161,033 |
|
$ |
1,029,731 |
|
$ |
844,067 |
|
$ |
947,596 |
|
|
Loans, net |
|
885,575 |
|
740,696 |
|
634,557 |
|
558,977 |
|
679,451 |
| |||||
|
Deposits |
|
1,162,548 |
|
998,675 |
|
847,946 |
|
705,046 |
|
777,245 |
| |||||
|
Shareholders’ equity |
|
146,747 |
|
129,513 |
|
142,303 |
|
109,314 |
|
112,490 |
| |||||
|
|
|
|
|
|
|
|
|
|
|
|
| |||||
|
Average balance sheet amounts: |
|
|
|
|
|
|
|
|
|
|
| |||||
|
Assets |
|
$ |
1,206,691 |
|
$ |
1,047,141 |
|
$ |
897,140 |
|
$ |
868,166 |
|
$ |
831,958 |
|
|
Loans, net |
|
805,560 |
|
641,894 |
|
573,173 |
|
593,352 |
|
671,065 |
| |||||
|
Deposits |
|
1,023,625 |
|
884,683 |
|
751,119 |
|
719,001 |
|
725,952 |
| |||||
|
Shareholders’ equity |
|
138,366 |
|
128,128 |
|
114,624 |
|
110,447 |
|
67,551 |
| |||||
|
|
|
|
|
|
|
|
|
|
|
|
| |||||
|
Selected Ratios: |
|
|
|
|
|
|
|
|
|
|
| |||||
|
Return on average equity |
|
9.98 |
% |
6.12 |
% |
2.26 |
% |
1.30 |
% |
-10.87 |
% | |||||
|
Return on average assets |
|
1.14 |
% |
0.75 |
% |
0.29 |
% |
0.17 |
% |
-0.88 |
% | |||||
|
Efficiency ratio |
|
62.81 |
% |
72.68 |
% |
81.12 |
% |
79.12 |
% |
66.23 |
% | |||||
|
Total risk based capital ratio |
|
15.23 |
% |
16.06 |
% |
20.87 |
% |
19.45 |
% |
16.90 |
% | |||||
|
Net chargeoffs (recoveries) to average gross loans |
|
0.31 |
% |
-0.06 |
% |
0.85 |
% |
1.92 |
% |
3.14 |
% | |||||
|
Allowance for loan losses to total gross loans |
|
2.20 |
% |
2.43 |
% |
2.39 |
% |
2.78 |
% |
2.65 |
% | |||||
|
Average equity to average assets |
|
11.47 |
% |
12.24 |
% |
12.78 |
% |
12.72 |
% |
8.12 |
% | |||||
Item 7. Management’s Discussion and Analysis of Financial Condition and Results of Operations
In addition to the historical information, this annual report contains certain forward-looking information within the meaning of Section 27A of the Securities Act of 1933, as amended, and section 21E of the Securities Exchange Act of 1934, as amended, and which are subject to the “Safe Harbor” created by those sections. The reader of this annual report should understand that all such forward-looking statements are subject to various uncertainties and risks that could affect their outcome. The Company’s actual results could differ materially from those suggested by such forward-looking statements. Such risks and uncertainties include, among others, (1) competitive pressure in the banking industry increases significantly; (2) changes in interest rate environment reduces margin; (3) general economic conditions, either nationally or regionally are less favorable than expected, resulting in, among other things, a deterioration in credit quality; (4) changes in the regulatory environment; (5) changes in business conditions and inflation; (6) costs and expenses of complying with the internal control provisions of the Sarbanes-Oxley Act and our degree of success in achieving compliance; (7) changes in securities markets; (8) future credit loss experience; (9) civil disturbances of terrorist threats or acts, or apprehension about possible future occurrences of acts of this type; and (10) the involvement of the United States in war or other hostilities. Therefore, the information in this annual report should be carefully considered when evaluating the business prospects of the Company.
Critical Accounting Policies
Our accounting policies are integral to understanding the results reported. Accounting policies are described in detail in Note 1 to the Consolidated Financial Statements. Our most complex accounting policies require management’s judgment to ascertain the valuation of assets, liabilities, commitments and contingencies. We have established detailed policies and procedures that are intended to ensure valuation methods are well controlled and applied consistently from period to period. In addition, the policies and procedures are intended to ensure that the process for changing methodologies occurs in an appropriate manner. The following is a brief description of our current accounting policies involving significant management valuation judgments.
Allowance for Loan Losses
The allowance for loan losses is a valuation allowance for probable incurred loan losses. Loan losses are charged against the allowance when management believes the uncollectibility of a loan balance is confirmed. Subsequent recoveries, if any, are credited to the allowance. Management estimates the allowance balance required using past loan loss experience, the nature and volume of the portfolio, information about specific borrower situations and estimated collateral values, economic conditions, and other factors. Allocations of the allowance may be made for specific loans, but the entire allowance is available for any loan that, in management’s judgment, should be charged off.
The allowance generally consists of specific and general reserves. Specific reserves generally relate to loans that are individually classified as impaired, but may also relate to loans that in management’s opinion exhibit negative credit characteristics or trends suggesting potential future loss exposure greater than historical loss experience would suggest. It is currently the Bank’s practice to immediately charge-off any identified financial loss pertaining to impaired loans when management believes the uncollectibility of the loan is confirmed, therefore specific reserves are uncommon. A loan is impaired when, based on current information and events, it is probable that the Bank will be unable to collect all amounts due according to the contractual terms of the loan agreement. Loans, for which the terms have been modified resulting in a concession, and for which the borrower is experiencing financial difficulties, are generally considered troubled debt restructurings and classified as impaired.
Commercial and real estate loans are individually evaluated for impairment. Generally Accepted Accounting Principles specify that if a loan is impaired, a portion of the allowance is allocated so that the loan is reported, net, at the present value of estimated future cash flows using the loan’s existing rate or at the fair value of collateral if repayment is expected solely from the collateral. Large groups of smaller balance homogeneous loans, such as consumer and residential real estate loans, are collectively evaluated for impairment, and accordingly, they are not separately identified for impairment disclosures. However, it is currently the Bank’s practice to immediately charge-off any identified financial loss pertaining to impaired loans when management believes the uncollectibility of the loans has been confirmed.
Substandard loans are individually evaluated for impairment. Generally Accepted Accounting Principles specify that if a loan is impaired, a portion of the allowance is allocated so that the loan is reported, net, at the present value of estimated future cash flows using an appropriate discount rate or at the fair value of collateral if repayment is expected solely from the collateral. Large groups of smaller balance homogeneous loans, such as consumer and residential real estate loans, are collectively evaluated for impairment, and accordingly, they are not separately identified for impairment disclosures. See Note 4 to the consolidated financial statements for additional information on substandard loans.
Troubled debt restructurings are separately identified for impairment disclosures and are measured at the present value of estimated future cash flows using an appropriate discount rate at inception. If a troubled debt restructuring is considered to be a collateral dependent loan, the loan is reported, net, at the fair value of the collateral. For troubled debt restructurings that subsequently default, the Bank determines the amount of reserve in accordance with the accounting policy for the allowance for loan losses. See Note 4 to the financial statements for additional information on troubled debt restructurings.
General reserves cover non-impaired loans and are based on historical loss rates for each portfolio segment, adjusted for the effects of qualitative or environmental factors that are likely to cause estimated loan losses as of the evaluation date to differ from the portfolio segment’s historical loss experience. Qualitative factors include consideration of the following: changes in lending policies and procedures; changes in economic conditions, changes in the nature and volume of the portfolio; changes in the experience, ability and depth of lending management and other relevant staff; changes in the volume and severity of past due, nonaccrual and other adversely graded loans; changes in the loan review system; changes in the value of the underlying collateral for collateral-dependent loans; concentrations of credit and the effect of other external factors such as competition and legal and regulatory requirements.
Portfolio segments identified by the Bank include commercial, real estate construction, land, real estate other, factoring and asset-based lending, SBA, and consumer loans. Relevant risk characteristics for these portfolio segments generally include debt service coverage, loan-to-value ratios and financial performance on non-consumer loans and credit scores, debt-to income, collateral type and loan-to-value ratios for consumer loans.
Sale of SBA Loans
The Company has the ability and the intent to sell all or a portion of certain SBA loans in the loan portfolio and, as such, carries the saleable portion of these loans at the lower of aggregate cost or fair value. At December 31, 2012 and December 31, 2011, the fair value of SBA loans exceeded aggregate cost and therefore, SBA loans were carried at aggregate cost.
In calculating gain on the sale of SBA loans, the Bank performs an allocation based on the relative fair values of the sold portion and retained portions of the loan. The Company assumptions are validated by reference to external market information.
Investment Securities
Our securities are classified as either available-for-sale or held-to-maturity. The fair value of most securities classified as available-for-sale is based on quoted market prices. If quoted market prices are not available, fair values are extrapolated from the quoted prices of similar instruments. Held-to maturity securities are recorded at amortized cost, adjusted for the amortization or accretion of premiums or discounts.
Supplemental Employee Retirement Plan
The Company has entered into supplemental employee retirement agreements with certain executive and senior officers. The measurement of the liability under these agreements includes estimates involving life expectancy, length of time before retirement, and expected benefit levels. Should these estimates prove materially wrong, we could incur additional or reduced expense to provide the benefits.
Deferred Tax Assets
Our deferred tax assets are explained in Note 8 to the Consolidated Financial Statements. The Company has sufficient taxable income from current and prior periods to support our position that the benefit of our deferred tax assets will be realized. As such, we have provided no valuation allowance against our deferred tax assets.
Operating Results
The Company reported net operating income of $13.8 million for the year ended December 31, 2012 representing an increase of $6.0 million, compared to net income of $7.8 million for the same period one year ago. For the year ended December 31, 2012, the Company reported earnings per diluted share of $0.92 compared to $0.52 for the year ended December 31, 2011, which included preferred dividend payments of $200,000. The Company retired the preferred stock issued under TARP in March of 2011 and, as a result, no longer has any preferred dividend payments. For the year ended December 31, 2010, the Company reported net operating income of $2.6 million. Net income available to common shareholders was reduced by preferred dividends of $2.0 million resulting in earnings per diluted share of $0.06 for the year ended December 31, 2010.
The increase in earnings during 2012 compared to 2011 resulted primarily from an increase in interest income related to loans and investment securities, warrant income and other non-interest income, offset in part by an increase in non-interest expense related to supporting growth and investments in new initiatives. The increase in earnings during 2011 compared to 2010 resulted primarily from an increase in interest income related to loans and investment securities, and a decrease in provision for loan losses, an increase in non-interest income related to international fee income and a gain on sale of SBA loans, offset in part by an increase in non-interest expense related to supporting growth and investments in new initiatives. See the specific sections below for details regarding these changes.
Net Interest Income and Margin
Net interest income is the principal source of the Company’s operating earnings. Net interest income is affected by changes in the nature and volume of earning assets held during the year, the rates earned on such assets and the rates paid on interest-bearing liabilities. The following table shows the composition of average earning assets and average funding sources, average yields and rates, and the net interest margin for the three years ended December 31, 2012, 2011 and 2010.
|
|
|
Year Ended December 31, |
| ||||||||||||||||||||||
|
|
|
2012 |
|
2011 |
|
2010 |
| ||||||||||||||||||
|
|
|
|
|
Interest |
|
|
|
|
|
Interest |
|
|
|
|
|
Interest |
|
|
| ||||||
|
|
|
Average |
|
Income/ |
|
Yields/ |
|
Average |
|
Income/ |
|
Yields/ |
|
Average |
|
Income/ |
|
Yields/ |
| ||||||
|
(dollars in thousands) |
|
Balance |
|
Expense |
|
Rates |
|
Balance |
|
Expense |
|
Rates |
|
Balance |
|
Expense |
|
Rates |
| ||||||
|
Assets |
|
|
|
|
|
|
|
|
|
|
|
|
|
|
|
|
|
|
| ||||||
|
Interest earning assets (2): |
|
|
|
|
|
|
|
|
|
|
|
|
|
|
|
|
|
|
| ||||||
|
Loans (1) |
|
$ |
827,691 |
|
$ |
56,122 |
|
6.8 |
% |
$ |
660,614 |
|
$ |
45,352 |
|
6.9 |
% |
$ |
590,334 |
|
$ |
42,071 |
|
7.1 |
% |
|
Investment securities |
|
235,892 |
|
6,461 |
|
2.7 |
% |
216,870 |
|
5,068 |
|
2.3 |
% |
134,349 |
|
2,733 |
|
2.0 |
% | ||||||
|
Federal funds sold |
|
86,735 |
|
203 |
|
0.2 |
% |
109,134 |
|
255 |
|
0.2 |
% |
112,940 |
|
263 |
|
0.2 |
% | ||||||
|
Interest bearing deposits |
|
331 |
|
1 |
|
0.3 |
% |
998 |
|
19 |
|
1.9 |
% |
5,775 |
|
121 |
|
2.1 |
% | ||||||
|
Total earning assets |
|
1,150,649 |
|
62,787 |
|
5.5 |
% |
987,616 |
|
50,694 |
|
5.1 |
% |
843,398 |
|
45,188 |
|
5.4 |
% | ||||||
|
|
|
|
|
|
|
|
|
|
|
|
|
|
|
|
|
|
|
|
| ||||||
|
Noninterest earning assets: |
|
|
|
|
|
|
|
|
|
|
|
|
|
|
|
|
|
|
| ||||||
|
Cash and due from banks |
|
22,946 |
|
|
|
|
|
22,392 |
|
|
|
|
|
18,792 |
|
|
|
|
| ||||||
|
All other assets (3) |
|
33,096 |
|
|
|
|
|
37,133 |
|
|
|
|
|
34,950 |
|
|
|
|
| ||||||
|
TOTAL |
|
$ |
1,206,691 |
|
|
|
|
|
$ |
1,047,141 |
|
|
|
|
|
$ |
897,140 |
|
|
|
|
| |||
|
|
|
|
|
|
|
|
|
|
|
|
|
|
|
|
|
|
|
|
| ||||||
|
Liabilities and shareholders’ equity |
|
|
|
|
|
|
|
|
|
|
|
|
|
|
|
|
|
|
| ||||||
|
Interest-bearing liabilities: |
|
|
|
|
|
|
|
|
|
|
|
|
|
|
|
|
|
|
| ||||||
|
Deposits: |
|
|
|
|
|
|
|
|
|
|
|
|
|
|
|
|
|
|
| ||||||
|
Demand |
|
$ |
5,834 |
|
2 |
|
0.0 |
% |
$ |
6,205 |
|
4 |
|
0.1 |
% |
$ |
6,079 |
|
6 |
|
0.1 |
% | |||
|
Savings |
|
311,712 |
|
900 |
|
0.3 |
% |
326,546 |
|
884 |
|
0.3 |
% |
306,461 |
|
1,223 |
|
0.4 |
% | ||||||
|
Time |
|
38,933 |
|
187 |
|
0.5 |
% |
36,876 |
|
208 |
|
0.6 |
% |
58,285 |
|
736 |
|
1.3 |
% | ||||||
|
Other |
|
29,057 |
|
1,106 |
|
3.8 |
% |
20,217 |
|
1,160 |
|
5.7 |
% |
17,622 |
|
1,106 |
|
6.3 |
% | ||||||
|
Total interest-bearing Liabilities |
|
385,536 |
|
2,195 |
|
0.6 |
% |
389,844 |
|
2,256 |
|
0.6 |
% |
388,447 |
|
3,071 |
|
0.8 |
% | ||||||
|
|
|
|
|
|
|
|
|
|
|
|
|
|
|
|
|
|
|
|
| ||||||
|
Noninterest-bearing liabilities: |
|
|
|
|
|
|
|
|
|
|
|
|
|
|
|
|
|
|
| ||||||
|
Demand deposits |
|
667,146 |
|
|
|
|
|
515,056 |
|
|
|
|
|
380,295 |
|
|
|
|
| ||||||
|
Accrued expenses and other liabilities |
|
15,643 |
|
|
|
|
|
14,113 |
|
|
|
|
|
13,775 |
|
|
|
|
| ||||||
|
Shareholders’ equity |
|
138,366 |
|
|
|
|
|
128,128 |
|
|
|
|
|
114,623 |
|
|
|
|
| ||||||
|
TOTAL |
|
$ |
1,206,691 |
|
|
|
|
|
$ |
1,047,141 |
|
|
|
|
|
$ |
897,140 |
|
|
|
|
| |||
|
|
|
|
|
|
|
|
|
|
|
|
|
|
|
|
|
|
|
|
| ||||||
|
Net interest income and margin |
|
|
|
$ |
60,592 |
|
5.3 |
% |
|
|
$ |
48,438 |
|
4.9 |
% |
|
|
$ |
42,117 |
|
5.0 |
% | |||
1) Includes amortization of loan fees of $9.4 million for 2012, $5.7 million for 2011 and $4.1 million for 2010. Nonperforming loans have been included in average loan balances.
2) Interest income is reflected on an actual basis, not on a fully taxable equivalent basis. Yields are based on amortized cost.
3) Net of average allowance for loan losses of $19.2 million and average deferred loan fees of $2.9 million for 2012, average allowance for loan losses of $16.9 million and average deferred loan fees of $1.8 million for 2011, and average allowance for loan losses of $15.6 million and $1.5 million for 2010, respectively.
Interest differential is affected by changes in volume, changes in rates and a combination of changes in volume and rates. Volume changes are caused by changes in the levels of average earning assets and average interest bearing deposits and borrowings. Rate changes result from changes in yields earned on assets and rates paid on liabilities. Changes not solely attributable to volume or rates have been allocated to the rate component.
The following table shows the effect on the interest differential of volume and rate changes for the years ended December 31, 2012, 2011 and 2010:
|
|
|
Year Ended December 31, |
| ||||||||||||||||
|
|
|
2012 vs. 2011 |
|
2011 vs. 2010 |
| ||||||||||||||
|
|
|
Increase (decrease) |
|
Increase (decrease) |
| ||||||||||||||
|
|
|
due to change in |
|
due to change in |
| ||||||||||||||
|
|
|
Average |
|
Average |
|
Total |
|
Average |
|
Average |
|
Total |
| ||||||
|
(dollars in thousands) |
|
Volume |
|
Rate |
|
Change |
|
Volume |
|
Rate |
|
Change |
| ||||||
|
Interest income: |
|
|
|
|
|
|
|
|
|
|
|
|
| ||||||
|
Loans |
|
$ |
11,329 |
|
$ |
(559 |
) |
$ |
10,770 |
|
$ |
4,825 |
|
$ |
(1,544 |
) |
$ |
3,281 |
|
|
Investment securities |
|
521 |
|
872 |
|
1,393 |
|
1,928 |
|
407 |
|
2,335 |
| ||||||
|
Federal funds sold |
|
(52 |
) |
0 |
|
(52 |
) |
(9 |
) |
1 |
|
(8 |
) | ||||||
|
Other |
|
(2 |
) |
(16 |
) |
(18 |
) |
(91 |
) |
(11 |
) |
(102 |
) | ||||||
|
Total interest income |
|
11,795 |
|
298 |
|
12,093 |
|
6,654 |
|
(1,148 |
) |
5,506 |
| ||||||
|
|
|
|
|
|
|
|
|
|
|
|
|
|
| ||||||
|
Interest expense: |
|
|
|
|
|
|
|
|
|
|
|
|
| ||||||
|
Demand |
|
(0 |
) |
(2 |
) |
(2 |
) |
0 |
|
(2 |
) |
(2 |
) | ||||||
|
Savings |
|
(43 |
) |
59 |
|
16 |
|
55 |
|
(394 |
) |
(339 |
) | ||||||
|
Time |
|
10 |
|
(31 |
) |
(21 |
) |
(121 |
) |
(407 |
) |
(528 |
) | ||||||
|
Other |
|
336 |
|
(390 |
) |
(54 |
) |
149 |
|
(95 |
) |
54 |
| ||||||
|
Total interest expense |
|
303 |
|
(364 |
) |
(61 |
) |
84 |
|
(898 |
) |
(815 |
) | ||||||
|
|
|
|
|
|
|
|
|
|
|
|
|
|
| ||||||
|
Change in net interest income |
|
$ |
11,492 |
|
$ |
662 |
|
$ |
12,154 |
|
$ |
6,570 |
|
$ |
(250 |
) |
$ |
6,321 |
|
Net interest income was $60.6 million in 2012, comprised of $62.8 million in interest income and $2.2 million in interest expense. Net interest income was $48.4 million in 2011, comprised of $50.7 million in interest income and $2.3 million in interest expense. The increase of $12.2 million in net interest income in 2012, comprised of an increase in interest income of $12.1 million combined with a decrease of $61,000 in interest expense, was primarily attributable to an increase in average earning assets as a result of loan growth.
Net interest income was $42.1 million in 2010, comprised of $45.2 million in interest income and $3.1 million in interest expense. The increase of $6.3 million in net interest income in 2011, comprised of an increase in interest income of $5.5 million combined with a decrease of $815,000 in interest expense, was primarily attributable to an increase in average earning assets combined with a decrease in average non-performing loans and a lower cost of funds.
The net interest margin (net interest income divided by average earning assets) was 5.27% for the year ended December 31, 2012, as compared to 4.90% for the year ended December 31, 2011 and 4.99% for 2010. The increase in net interest margin in 2012 was primarily due to increased balance sheet leverage, a more favorable mix in average earning assets, and increased recurring loan fees related to overall growth of the loan portfolio. The positive impact on the net interest margin from increased loan fees for the twelve months ended December 31, 2012 compared to the same period one year ago was 24 basis points. The Company’s loan-to-deposit ratio, a measure of leverage, averaged 80.9% during the twelve months ended December 31, 2012, which represented an increase compared to an average of 74.7% for the same period in 2011.
The decrease in net interest margin in 2011 was primarily due to decreased balance sheet leverage and a less favorable mix in average earning assets, partially offset by increased loan fees related to growth in the factoring and asset-based lending portfolio. The positive impact on the net interest margin from increased loan fees for the twelve months ended December 31, 2011 compared to the same period in 2010 was 9 basis points. The Company’s loan-to-deposit ratio averaged 74.7% during the twelve months ended December 31, 2011 compared to 78.6% for the same period in 2010.
Interest Income
For the year ended December 31, 2012, the Company reported interest income of $62.8 million, an increase of $12.1 million or 23.9% over $50.7 million reported in 2011. The increase in interest income primarily reflects an increase in average earning assets in addition to an increase in the average yield on investment securities. Average earning assets were $1.151 billion for the year ended December 31, 2012, an increase of $163.0 million, or 16.5%, over $987.6 million for the year ended December 31, 2011. The increase in average earning assets reflects an increase in the average loan portfolio of $167.1 million over $660.6 million in 2011, and an increase in the average securities portfolio
of $19.0 million from $216.9 million in 2011. The average yield on earning assets was 5.46% for the year ended December 31, 2012 compared to 5.13% for the year ended December 31, 2011 primarily due to a higher rate of interest earned on investment securities during 2012, more favorable mix of average earning assets, as well as a higher yield on investment securities. This was partially offset by lower rates of interest earned on all other earning assets.
For the year ended December 31, 2011, the Company reported interest income of $50.7 million, an increase of $5.5 million or 12.2% over $45.2 million reported in 2010. The increase in interest income primarily reflects an increase in average earning assets. Average earning assets were $987.6 million for the year ended December 31, 2011 an increase of $144.2 million, or 17.1%, over $843.4 million for the year ended December 31, 2010. The increase in average earning assets reflects an increase in the average loan portfolio of $70.3 million over $590.3 million in 2010, and an increase in the average securities portfolio of $82.5 million from $134.3 million in 2010. The average yield on earning assets was 5.13% for the year ended December 31, 2011 compared to 5.36% for the year ended December 31, 2010 due to a higher rate of interest earned on securities instruments during 2011, and a decrease in the rate of interest earned on the loan portfolio during 2011. The decrease in the rate of interest earned on the loan portfolio was partially offset by a decrease in average non-performing loans during the year, as well as increased loan fees related to loan recoveries and growth in the factoring and asset based lending portfolio.
Interest Expense
Interest expense was $2.2 million for the year ended December 31, 2012, which represented a decrease of $61,000 or 2.7% compared to $2.3 million for the year ended December 31, 2011. The decrease in interest expense primarily reflects a lower level of interest bearing liabilities combined with a lower interest rates paid on deposits in 2012 compared to 2011. The average yield on interest-bearing liabilities was 0.57% for the period ended December 31, 2012 compared to 0.58% for the period ended December 31, 2011. Average interest-bearing liabilities were $385.5 million for the year ended December 31, 2012, a decrease of $4.3 million or 1.1% from $389.8 million for the year ended December 31, 2011.
Average interest bearing deposits were $356.5 million for the year ended December 31, 2012, which represented 34.8% of total average deposits and was a decrease of $13.1 million, or 3.6%, from $369.6 million at December 31, 2011, representing 41.8% of total average deposits for the year.
Other (non-deposit) interest bearing liabilities are primarily comprised of junior subordinated debt securities issued by the Company and other borrowings. The junior subordinated debt is intended to supplement capital requirements of the Company at a rate of interest that is fixed for five years. Other borrowings during the year was comprised of short borrowings. Other interest bearing liabilities averaged $29.1 million and $20.2 million in the years ended December 31, 2012 and 2011, respectively.
Interest expense was $2.3 million for the year ended December 31, 2011, which represented a decrease of $815,000 or 26.5% compared to $3.1 million for the year ended December 31, 2010. The decrease in interest expense primarily reflects the lower interest rates paid on deposits in 2011 compared to 2010. The average yield on interest-bearing liabilities was 0.58% for the period ended December 31, 2011 compared to 0.78% for the period ended December 31, 2010. Average interest-bearing liabilities were $389.8 million for the year ended December 31, 2011, an increase of $1.4 million or 0.4% from $388.4 million for the year ended December 31, 2010.
Average interest bearing deposits were $369.6 million for the year ended December 31, 2011, which represented 41.8% of total average deposits and was a decrease of $1.2 million, or 0.3%, from $370.8 million at December 31, 2010, representing 49.4% of total average deposits for the year.
Other (non-deposit) interest bearing liabilities are primarily comprised of junior subordinated debt securities issued by the Company and other borrowings. The junior subordinated debt is intended to supplement capital requirements of the Company at a rate of interest that is fixed for five years. Other interest bearing liabilities averaged $20.2 million and $17.6 million in the years ended December 31, 2011 and 2010, respectively.
Credit Risk and Provision for Loan losses
The Company maintains an allowance for loan losses which is based, in part, on the Company’s loss experience, the impact of economic conditions within the Company’s market area and, as applicable, the State of California and/or national macroeconomic conditions, the value of underlying collateral, loan performance, and inherent risks in the loan portfolio. The allowance is reduced by charge-offs and increased by provisions for loan losses charged to operating expense and recoveries of previously charged-off loans. Based on management’s evaluation of such risks, the Company provided $4.0 million, $2.6 million, and $4.7 million to the allowance for loan losses in 2012, 2011 and 2010,
respectively. During 2012, the Bank had $3.1 million in charge offs, and had recoveries of $0.6 million as compared to $2.9 million in charge offs and recoveries of $3.3 million in 2011. During 2010, the Bank had $8.2 million in charge offs and $3.0 million in recoveries. The allowance for loan losses was $19.9 million representing 2.20% of total loans at December 31, 2012, as compared to $18.5 million representing 2.43% of total loans at December 31, 2011, and $15.5 million representing 2.39% of total loans at December 31, 2010.
Management is of the opinion that the allowance for loan losses is maintained at a level adequate for known and unidentified losses inherent in the portfolio. However, although the Company is seeing a lower incidence of new problem assets, as well as a consistent reduction of carrying values through continued payments by borrowers on loans that have been placed on non-accrual, should circumstances change and management determines that the collectibility of any of these credits becomes unlikely, there could be an adverse effect on the level of the allowance for loan losses and the Company’s future profitability.
See “Allowance for Loan Losses” for additional discussion regarding the allowance for loan losses and nonperforming assets.
Non-interest Income
The following table sets forth the components of other income and the percentage distribution of such income for the years ended December 31, 2012, 2011 and 2010:
|
|
|
Year Ended December 31, |
| |||||||||||||
|
|
|
2012 |
|
2011 |
|
2010 |
| |||||||||
|
(dollars in thousands) |
|
Amount |
|
Percent |
|
Amount |
|
Percent |
|
Amount |
|
Percent |
| |||
|
|
|
|
|
|
|
|
|
|
|
|
|
|
| |||
|
Service charges on deposit accounts |
|
$ |
3,354 |
|
25.8 |
% |
$ |
2,876 |
|
29.0 |
% |
$ |
2,417 |
|
35.3 |
% |
|
International fee income |
|
2,646 |
|
20.4 |
% |
2,488 |
|
25.1 |
% |
1,785 |
|
26.1 |
% | |||
|
Gain on sale of SBA loans |
|
1,850 |
|
14.2 |
% |
1,743 |
|
17.6 |
% |
— |
|
0.0 |
% | |||
|
Warrant income |
|
1,422 |
|
11.0 |
% |
392 |
|
3.9 |
% |
36 |
|
0.5 |
% | |||
|
Net gain on sale of OREO |
|
1,056 |
|
8.1 |
% |
421 |
|
4.2 |
% |
1,011 |
|
14.8 |
% | |||
|
SBA loan servicing fee income |
|
514 |
|
4.0 |
% |
411 |
|
4.1 |
% |
380 |
|
5.5 |
% | |||
|
Increase in value-bank owned life insurance |
|
422 |
|
3.3 |
% |
388 |
|
3.9 |
% |
392 |
|
5.7 |
% | |||
|
Net gain on sale of securities |
|
323 |
|
2.5 |
% |
438 |
|
4.4 |
% |
165 |
|
2.4 |
% | |||
|
Other non-interest income |
|
1,397 |
|
10.7 |
% |
773 |
|
7.9 |
% |
663 |
|
9.8 |
% | |||
|
|
|
|
|
|
|
|
|
|
|
|
|
|
| |||
|
|
|
$ |
12,984 |
|
100.0 |
% |
$ |
9,930 |
|
100.0 |
% |
$ |
6,849 |
|
100.0 |
% |
Non-interest income totaled $13.0 million in 2012, an increase of $3.1 million or 30.8% over $9.9 million in 2011. Non-interest income of $9.9 million in 2011 represented an increase of $3.1 million or 45.0% over $6.8 million in 2010. Non-interest income generally consists primarily of service charge income on deposit accounts, international fee income, gain on sales of OREO and gains recognized on sales of SBA loans. The increase in non-interest income during the year ending December 31, 2012 was primarily attributable to an increase in warrant income. Additionally, non-interest income benefited during 2012 by increased gains on sale of OREO and service charges on deposit account.
The increase in non-interest income during the year ending December 31, 2011 was primarily attributable to an increase in gains on sales of SBA loans of $1.7 million during 2011. The company did not sell any SBA loans in 2010. Additionally, non-interest income benefited during 2011 by increased service charges on deposit accounts and increased international fee income.
For the year ended December 31, 2012 service charge income on deposit accounts was $3.4 million, representing an increase of $478,000, or 16.6%, compared to $2.9 million for the same period one year ago. The service charge income on deposit accounts for 2011 compared to $2.4 million in 2010, representing an increase of $459,000 or 19.0%. The increase in 2012 and 2011 was attributable to an increase in deposit accounts and deposit related analysis charges.
The Company generates international fee income on spot contracts (binding agreements for the purchase or sale of currency for immediate delivery and settlement) and forward contracts (a contractual commitment for a fixed amount of foreign currency on a future date at an agreed upon exchange rate) in connection with client’s cross-border activities. The transactions incurred are during the ordinary course of business and are not speculative in nature. The Company recognizes income on a cash basis at the time of contract settlement in an amount equal to the spread created by the exchange rate charged to the client versus the actual exchange rate negotiated by the Company in the open market. During 2012, the Company recognized $2.6 million in international fee income, representing an increase of $158,000, or 6.4%, compared to $2.5 million for the same period one year ago. The international fee income for 2011 compared to $1.8 million in 2010, representing an increase of $703,000, or 39.4%. The increase in international fee income in both 2012 and 2011 was primarily caused by an increase in client demand for international services as a result of the recovering economic environment.
Revenue from sales of SBA loans is dependent on the Company’s decision to sell versus retain loans as well as consistent origination and funding of new loan volumes, the timing of which may be impacted by (1) increased competition from other lenders; (2) the relative attractiveness of SBA borrowing to other financing options; (3) adjustments to programs by the SBA; (4) changes in activities of secondary market participants and; (5) other factors. During 2012, the Company recognized $1.9 million in gains on sale of SBA loans, representing an increase of $107,000 or 6.1% over the prior year. The Company recognized $1.7 million in gains on sales of SBA loans in 2011 compared to 2010 where the company did not recognize any gains on sales of SBA loans.
During 2012, the Company recognized $1.4 million in warrant income. This represented an increase of $1.0 million or 262.8% over $392,000 in 2011. Income from warrants is inherently event-driven and the contributions from warrants largely reflect the economic environment of IPOs and M&A activity. Compared to $36,000 in 2010, the increase in 2011 represents $356,000 or 988.9%.
During 2012, 2011, and 2010, the Company recognized $1.1 million, $421,000, and $1.0 million, respectively, in gains on the sale of OREO properties. During the year ending December 31, 2012, the Company recognized $1.6 million as a result of the successful resolution of “other real estate owned” properties and legacy problem loans that were originated prior to the economic downturn.
The Company earns a servicing fee on all SBA loans sold. During 2012, $514,000 in SBA loan servicing income was recognized compared to $411,000 for the prior year, reflecting an increase of $103,000 or 25.1%. The $411,000 recognized in 2011 also represents an increase of $31,000 or 8.2% over $380,000 in 2010.
The Company recognized gains on the sale of securities of $323,000 during the twelve months ended December 31, 2012 which represents a decrease of $115,000 or 26.3% compared to $438,000 during 2011. During 2010 the Company recognized $165,000 in gain on the sale of securities. Compared to 2010, the increase in gains on the sale of securities in 2011 represented $273,000 or 165.5%.
Non-interest Expenses
The components of other expense as a percentage of average assets are set forth in the following table for the years ended December 31, 2012, 2011 and 2010:
|
|
|
Year Ended December 31, |
| |||||||||||||
|
|
|
2012 |
|
2011 |
|
2010 |
| |||||||||
|
(dollars in thousands) |
|
Amount |
|
Percent |
|
Amount |
|
Percent |
|
Amount |
|
Percent |
| |||
|
|
|
|
|
|
|
|
|
|
|
|
|
|
| |||
|
Salaries and benefits |
|
$ |
30,308 |
|
2.5 |
% |
$ |
24,606 |
|
2.3 |
% |
$ |
21,292 |
|
2.4 |
% |
|
Occupancy |
|
3,441 |
|
0.3 |
% |
3,296 |
|
0.3 |
% |
3,343 |
|
0.4 |
% | |||
|
Data processing |
|
3,257 |
|
0.3 |
% |
3,046 |
|
0.3 |
% |
2,913 |
|
0.3 |
% | |||
|
Marketing |
|
2,060 |
|
0.2 |
% |
1,571 |
|
0.2 |
% |
1,012 |
|
0.1 |
% | |||
|
Director/Shareholder expenses |
|
1,277 |
|
0.1 |
% |
1,158 |
|
0.1 |
% |
1,273 |
|
0.1 |
% | |||
|
Professional services |
|
1,206 |
|
0.1 |
% |
2,667 |
|
0.3 |
% |
2,106 |
|
0.2 |
% | |||
|
Deposit services/supplies |
|
989 |
|
0.1 |
% |
954 |
|
0.1 |
% |
909 |
|
0.1 |
% | |||
|
OREO expense |
|
174 |
|
0.0 |
% |
1,140 |
|
0.1 |
% |
1,975 |
|
0.2 |
% | |||
|
Assessments |
|
879 |
|
0.1 |
% |
1,717 |
|
0.2 |
% |
2,500 |
|
0.3 |
% | |||
|
Furniture and equipment |
|
552 |
|
0.0 |
% |
505 |
|
0.0 |
% |
699 |
|
0.1 |
% | |||
|
Other |
|
2,069 |
|
0.2 |
% |
1,764 |
|
0.2 |
% |
1,698 |
|
0.2 |
% | |||
|
|
|
|
|
|
|
|
|
|
|
|
|
|
| |||
|
|
|
$ |
46,212 |
|
3.8 |
% |
$ |
42,424 |
|
4.1 |
% |
$ |
39,720 |
|
4.4 |
% |
Non-interest expenses were $46.2 million in 2012 as compared to $42.4 million in 2011 and $39.7 million in 2010. Non-interest expense increased approximately $3.8 million in 2012 compared to 2011. This increase was primarily attributable to increased salaries and benefits, marketing costs and data processing expense. Overall, trends in non-interest expenses in 2012 reflect a lower level of expense related to problem asset valuation and resolution and higher expenses related to supporting growth and investments in new initiatives.
Non-interest expense increased approximately $2.7 million in 2011 compared to 2010. This increase was primarily attributable to increased salaries and benefits, marketing costs and professional services. Non-interest expenses measured as a percentage of average assets were 3.8% in 2012, 4.1% in 2011 and 4.4% in 2010.
Salaries and related benefits was the largest component of the Bank’s non-interest expense. Salaries and benefits were $30.3 million for the year ended December 31, 2012 as compared to $24.6 million and $21.3 million for the years ended December 31, 2011 and 2010, respectively. The Bank had 207 full time equivalent employees (FTE) at December 31, 2012 as compared to 193 FTE at December 31, 2011 and 170 FTE at December 31, 2010. The increase in salaries and related benefits in 2012 compared to 2011 and 2010 was primarily attributable to the increase in headcount to support growth and new initiatives, increased stock based compensation due to long term retention awards granted in the third quarter of 2012, and an increase in commissions and incentive compensation directly related to increased loan and deposit production.
Occupancy expense for the year ended December 31, 2012 was $3.4 million and compared to $3.3 million during 2011, which represents an increase of $145,000 or 4.4%. Occupancy expense for the year ended December 31, 2011 represented a decrease of approximately $47,000 over $3.3 million from 2010.
The Company contracts with third-party vendors for most data processing needs and to support technical infrastructure. Data processing expense in 2012 was $3.3 million which represented an increase of approximately $211,000 over $3.0 million one year earlier. Data processing expense in 2011 represented an increase of approximately $133,000 over $2.9 million one year earlier. The increase in data processing in both years was primarily due to an increase in deposit transaction volumes.
Legal and professional expenses were $1.2 million for the year ended December 31, 2012, which represents a $1.5 million decrease compared to $2.7 million one year earlier. Legal and professional expenses were $2.1 million for the year ended December 31, 2010. The decrease in legal fees in 2012 was primarily a result of reduced non-performing assets. The increase in legal and professional expenses in 2011 was primarily due to the early redemption of Series C preferred shares and repurchase of the related warrant, as well as legal fees associated with the active management of one non-real estate credit exposure. The elevated legal and professional expenses in 2010 was primarily attributed to legal fees associated with a $30.0 million private placement of common stock as well as legal fees resulting from elevated levels of non-performing assets.
Regulatory assessments related to participation in the Transaction Guarantee Program as well as FDIC insurance pertaining to deposit balances, totaled $879,000 for the year ended December 31, 2012, compared to $1.7 million for the year ended December 31, 2011 and $2.5 million in 2010.
Other real estate owned (OREO) expense for the year ended December 31, 2012 was $174,000, which represents a decrease of $966,000 compared to $1.1 million for the same period one year earlier. December 31, 2011 OREO expense reflects a decrease of $835,000 from $2.0 million in 2010. The decrease in 2012 and 2011 reflects the consistent decline in non-performing assets since 2010.
The Company’s efficiency ratio, the ratio of non-interest expenses to revenues, was 62.81% for the twelve months ended December 31, 2012, compared to 72.68% and 81.12% for the twelve months ended December 31, 2011 and December 31, 2010, respectively. As pressure continues on net interest margins and net asset growth, management of operating expenses will continue to be a priority.
Income Taxes
The Company’s effective tax rate was 41.0% for the year ended December 31, 2012, 41.2% for the year ended December 31, 2011 and 43.0% for the year ended December 31, 2010. See Note 8 to the consolidated financial statements for additional information on income taxes.
Quarterly Income
The unaudited income statement data of the Company, in the opinion of management, includes all normal and recurring adjustments necessary to state fairly the information set forth herein. The results of operations are not necessarily indicative of results for any future period. The following table shows the Company’s unaudited quarterly income statement data for the years 2012, 2011, and 2010.
|
|
|
Three Months Ended |
| ||||||||||
|
(dollars in thousands, except share amounts) |
|
March 31 |
|
June 30 |
|
September 30 |
|
December 31 |
| ||||
|
Year Ended December 31, 2012: |
|
|
|
|
|
|
|
|
| ||||
|
Interest income |
|
$ |
15,325 |
|
$ |
15,090 |
|
$ |
15,970 |
|
$ |
16,402 |
|
|
Interest expense |
|
479 |
|
549 |
|
573 |
|
594 |
| ||||
|
Net interest income |
|
14,846 |
|
14,541 |
|
15,397 |
|
15,808 |
| ||||
|
Provision for credit losses |
|
1,750 |
|
500 |
|
200 |
|
1,500 |
| ||||
|
Other income |
|
2,542 |
|
2,972 |
|
3,785 |
|
3,685 |
| ||||
|
Other expense |
|
11,077 |
|
11,358 |
|
11,584 |
|
12,193 |
| ||||
|
Income before income taxes |
|
4,561 |
|
5,655 |
|
7,398 |
|
5,800 |
| ||||
|
Income taxes |
|
1,854 |
|
2,346 |
|
3,034 |
|
2,376 |
| ||||
|
Net income |
|
$ |
2,707 |
|
$ |
3,309 |
|
$ |
4,364 |
|
$ |
3,424 |
|
|
Preferred dividends |
|
— |
|
— |
|
— |
|
— |
| ||||
|
Net income available to common shareholders |
|
$ |
2,707 |
|
$ |
3,309 |
|
$ |
4,364 |
|
$ |
3,424 |
|
|
|
|
|
|
|
|
|
|
|
| ||||
|
Earnings per share - basic |
|
$ |
0.19 |
|
$ |
0.23 |
|
$ |
0.30 |
|
$ |
0.24 |
|
|
Earnings per share - diluted |
|
$ |
0.18 |
|
$ |
0.22 |
|
$ |
0.29 |
|
$ |
0.23 |
|
|
|
|
|
|
|
|
|
|
|
| ||||
|
Year Ended December 31, 2011: |
|
|
|
|
|
|
|
|
| ||||
|
Interest income |
|
$ |
11,710 |
|
$ |
12,301 |
|
$ |
13,180 |
|
$ |
13,503 |
|
|
Interest expense |
|
652 |
|
535 |
|
529 |
|
540 |
| ||||
|
Net interest income |
|
11,058 |
|
11,766 |
|
12,651 |
|
12,963 |
| ||||
|
Provision for credit losses |
|
750 |
|
0 |
|
1,250 |
|
600 |
| ||||
|
Other income |
|
2,546 |
|
1,511 |
|
3,257 |
|
2,616 |
| ||||
|
Other expense |
|
10,237 |
|
10,205 |
|
10,923 |
|
11,059 |
| ||||
|
Income before income taxes |
|
2,617 |
|
3,072 |
|
3,735 |
|
3,920 |
| ||||
|
Income taxes |
|
1,047 |
|
1,286 |
|
1,532 |
|
1,633 |
| ||||
|
Net income |
|
$ |
1,570 |
|
$ |
1,786 |
|
$ |
2,203 |
|
$ |
2,287 |
|
|
Preferred dividends |
|
200 |
|
0 |
|
0 |
|
0 |
| ||||
|
Net income available to common shareholders |
|
$ |
1,370 |
|
$ |
1,786 |
|
$ |
2,203 |
|
$ |
2,287 |
|
|
|
|
|
|
|
|
|
|
|
| ||||
|
Earnings per share - basic |
|
$ |
0.10 |
|
$ |
0.13 |
|
$ |
0.15 |
|
$ |
0.16 |
|
|
Earnings per share - diluted |
|
$ |
0.09 |
|
$ |
0.12 |
|
$ |
0.15 |
|
$ |
0.16 |
|
FINANCIAL CONDITION AND EARNING ASSETS
As of December 31, 2012, total assets were $1.3 billion, gross loans were $908.6 million and deposits were $1.2 billion. Assets increased $182.6 million, or 15.7%, from $1.2 billion at December 31, 2011. Gross loans increased $146.6 million, or 19.2%, from $762.0 million at December 31, 2011. Deposits increased $163.9 million, or 16.4%, from $998.7 million at December 31, 2011.
As of December 31, 2011, total assets were $1.2 billion, gross loans were $762.0 million and deposits were $998.7 million. Assets increased $131.3 million, or 12.8%, from $1.0 billion at December 31, 2010. Gross loans increased $110.5 million, or 17.0% from $651.5 million at December 31, 2010. Deposits increased $150.7 million, or 17.8%, from $847.9 million at December 31, 2010.
Federal Funds Sold
Federal funds sold were $113.8 million at December 31, 2012 as compared to $106.7 million at December 31, 2011. The Company’s investment in federal funds sold reflects the Company’s current strategy of deploying other earning assets primarily in federal funds sold to address the potential volatility of deposit balances and to accommodate projected loan growth.
The average balance of federal funds sold was $86.7 million in 2012 and $109.1 million in 2011. These balances represented 8.5% and 12.3% of average deposits for 2012 and 2011, respectively. They are maintained primarily for the short-term liquidity needs of the Bank.
Securities
Investment securities are classified as either available for sale or held to maturity. Any unrealized gain or loss on investment securities available for sale is reflected in the carrying value of the security and reported net of income taxes in the equity section of the balance sheet. Held-to maturity securities are recorded at amortized cost, adjusted for the amortization or accretion of premiums or discounts. The pre-tax unrealized gain on securities available for sale at December 31, 2012 and 2011 was $2.9 million and $1.6 million, respectively.
The following table shows the composition of the securities portfolio at December 31, 2012 and 2011.
|
|
|
As of December 31, |
| ||||||||||
|
|
|
2012 |
|
2011 |
| ||||||||
|
|
|
Amortized |
|
Fair |
|
Amortized |
|
Fair |
| ||||
|
(dollars in thousands) |
|
Cost |
|
Value |
|
Cost |
|
Value |
| ||||
|
Securities available for sale |
|
|
|
|
|
|
|
|
| ||||
|
Debt securities: |
|
|
|
|
|
|
|
|
| ||||
|
U.S. government agency securities |
|
$ |
12,976 |
|
$ |
13,112 |
|
$ |
14,873 |
|
$ |
15,014 |
|
|
Mortgage backed securities |
|
208,058 |
|
210,919 |
|
181,226 |
|
183,138 |
| ||||
|
Corporate Bonds |
|
25,559 |
|
25,674 |
|
26,294 |
|
25,859 |
| ||||
|
Municipal Bonds |
|
2,436 |
|
2,262 |
|
— |
|
— |
| ||||
|
Total debt securities |
|
249,029 |
|
251,967 |
|
222,393 |
|
224,011 |
| ||||
|
|
|
|
|
|
|
|
|
|
| ||||
|
Total securities available for sale |
|
$ |
249,029 |
|
$ |
251,967 |
|
$ |
222,393 |
|
$ |
224,011 |
|
|
|
|
|
|
|
|
|
|
|
| ||||
|
Securities held to maturity |
|
|
|
|
|
|
|
|
| ||||
|
Debt securities: |
|
|
|
|
|
|
|
|
| ||||
|
Mortgage backed securities |
|
15,237 |
|
15,606 |
|
16,256 |
|
16,604 |
| ||||
|
Total debt securities |
|
15,237 |
|
15,606 |
|
16,256 |
|
16,604 |
| ||||
|
|
|
|
|
|
|
|
|
|
| ||||
|
Total securities held to maturity |
|
$ |
15,237 |
|
$ |
15,606 |
|
$ |
16,256 |
|
$ |
16,604 |
|
|
|
|
|
|
|
|
|
|
|
| ||||
|
Total investment securities |
|
$ |
264,266 |
|
$ |
267,573 |
|
$ |
238,649 |
|
$ |
240,615 |
|
The maturities and yields of the debt securities included in the investment portfolio at December 31, 2012 and December 31, 2011 are shown in the table below. There were no equity securities in 2012 and 2011.
Loan Portfolio
The following table shows the Company’s loans by type and their percentage distribution at December 31, 2012, 2011, 2010, 2009, and 2008.
|
|
|
As of December 31, |
| |||||||||||||
|
(dollars in thousands) |
|
2012 |
|
2011 |
|
2010 |
|
2009 |
|
2008 |
| |||||
|
|
|
|
|
|
|
|
|
|
|
|
| |||||
|
Commercial |
|
$ |
436,293 |
|
$ |
330,348 |
|
$ |
269,034 |
|
$ |
253,776 |
|
$ |
301,024 |
|
|
Real estate construction |
|
35,501 |
|
47,213 |
|
40,705 |
|
20,601 |
|
98,105 |
| |||||
|
Land loans |
|
8,973 |
|
6,772 |
|
9,072 |
|
12,763 |
|
23,535 |
| |||||
|
Real estate other |
|
139,931 |
|
157,446 |
|
138,633 |
|
149,617 |
|
134,767 |
| |||||
|
Factoring and asset based |
|
195,343 |
|
142,482 |
|
122,542 |
|
66,660 |
|
55,761 |
| |||||
|
SBA |
|
87,375 |
|
73,336 |
|
67,538 |
|
67,629 |
|
77,043 |
| |||||
|
Other |
|
5,163 |
|
4,431 |
|
4,023 |
|
5,395 |
|
9,371 |
| |||||
|
Total gross loans |
|
908,579 |
|
762,028 |
|
651,547 |
|
576,441 |
|
699,606 |
| |||||
|
Unearned fee income |
|
(3,056 |
) |
(2,792 |
) |
(1,444 |
) |
(1,452 |
) |
(1,601 |
) | |||||
|
Total loan portfolio |
|
$ |
905,523 |
|
$ |
759,236 |
|
$ |
650,103 |
|
$ |
574,989 |
|
$ |
698,005 |
|
|
|
|
|
|
|
|
|
|
|
|
|
| |||||
|
Commercial |
|
48.0 |
% |
43.4 |
% |
41.3 |
% |
44.0 |
% |
43.0 |
% | |||||
|
Real estate construction |
|
3.9 |
% |
6.2 |
% |
6.2 |
% |
3.6 |
% |
14.0 |
% | |||||
|
Land loans |
|
1.0 |
% |
0.9 |
% |
1.4 |
% |
2.2 |
% |
3.4 |
% | |||||
|
Real estate other |
|
15.4 |
% |
20.7 |
% |
21.3 |
% |
26.0 |
% |
19.3 |
% | |||||
|
Factoring and asset based |
|
21.5 |
% |
18.7 |
% |
18.8 |
% |
11.6 |
% |
8.0 |
% | |||||
|
SBA |
|
9.6 |
% |
9.6 |
% |
10.4 |
% |
11.7 |
% |
11.0 |
% | |||||
|
Other |
|
0.6 |
% |
0.6 |
% |
0.6 |
% |
0.9 |
% |
1.3 |
% | |||||
|
Total gross loans |
|
100.0 |
% |
100.0 |
% |
100.0 |
% |
100.0 |
% |
100.0 |
% | |||||
Gross loan balances increased to $908.6 million at December 31, 2012, which represented an increase of $146.6 million or 19.2% as compared to $762.0 million at December 31, 2011. The increase in total gross loans was broad-based throughout the portfolio, with the most significant growth reflected in the commercial lending, factoring, and asset-based lending portfolios, and was a result of a concerted effort to prudently grow the balance of loans in our portfolio while managing risk. Gross loan balances of $762.0 million at December 31, 2011, represented an increase of $110.5 million or 17.0% as compared to $651.5 million at December 31, 2010. The increase in loans was primarily attributable to growth in the commercial, real estate and factoring/asset based lending portfolio.
The Company’s commercial loan portfolio represents loans to small and middle-market businesses primarily in the Santa Clara county region as well as loans to technology-based emerging growth companies. Commercial loans were $436.3 million at December 31, 2012, which represented an increase of $105.9 million or 32.1% over $330.3 million at December 31, 2011. At December 31, 2012, commercial loans comprised 48.0% of total loans outstanding as compared to 43.4% at December 31, 2011. Commercial loans were $330.3 million at December 31, 2011, which represented an increase of $61.3 million or 22.8% versus $269.0 million at December 31, 2010. At December 31, 2011, commercial loans comprised 43.4% of total loans outstanding as compared to 41.3% at December 31, 2010.
Approximately 43% of the Company’s construction loan portfolio consists of loans to finance individual single-family residential homes in markets in the Peninsula and South Bay region of Silicon Valley. The remainder is comprised of commercial and multi-family development projects. Construction loans decreased $11.7 million, or 24.8%, to $35.5 million at December 31, 2012 as compared to $47.2 million at December 31, 2011. Construction loan balances at December 31, 2012 comprised 3.9% of total loans compared to 6.2% at December 31, 2011. Construction loans increased $6.5 million, or 16.0%, to $47.2 million at December 31, 2011 as compared to $40.7 million at December 31, 2010. Construction loan balances at December 31, 2011 and 2010 comprised 6.2% of total loans.
The Company’s land loan portfolio consists of land and land development loans related to future construction credits. Land loans increased $2.2 million or 32.5% to $9.0 million at December 31, 2012 as compared to $6.8 million at December 31, 2011. Land loan balances at December 31, 2012 comprised 1.0% of total loans as compared to 0.9% at December 31, 2011. Land loans decreased $2.3 million to $6.8 million at December 31, 2011 compared to $9.1 million at December 31, 2010. Land loan balances at December 31, 2011 comprised 0.9% of total loans as compared to 1.4% at December 31, 2010.
Other real estate loans consist of commercial real estate and home equity lines of credit. Other real estate loans decreased $17.5 million, or 11.1%, to $139.9 million at December 31, 2012 as compared to $157.4 million at December 31, 2011. The decrease was primarily attributable to other real estate term loans. The decrease in other real estate loans was primarily in owner occupied real estate term loans. At December 31, 2012, other real estate term loans were primarily comprised of office and industrial investment properties which represented approximately 44% of the total and approximately 42% were to finance buildings occupied by clients of the bank. Approximately 17% of term real estate loans at December 31, 2012 were to finance retail properties. Other real estate loans increased $18.8 million or 13.6% to $157.4 million at December 31, 2011 as compared to $138.6 million at December 31, 2010. The increase was primarily attributable to other real estate term loans. At December 31, 2011, other real estate term loans were primarily comprised of office and industrial investment properties which represented approximately 32% of the total and approximately 42% were to finance buildings occupied by clients of the bank. Less than 20% of term real estate loans at December 31, 2011 were to finance retail properties.
Factoring and asset-based lending represents purchased accounts receivable (factoring) and a structured accounts receivable lending program where the Company receives client specific payment for client invoices. Under the factoring program, the Company purchases accounts receivable invoices from its clients and then receives payment directly from the party obligated for the receivable. In most cases the Company purchases the receivables subject to recourse from the Company’s factoring client. The asset-based lending program requires a security interest in all of a client’s accounts receivable. At December 31, 2012, factoring and asset based loans totaled $195.3 million or 21.5% of total loans as compared to $142.5 million or 18.7% of total loans at December 31, 2011. This compares to $122.5 million or 18.8% of total loans at December 31, 2010.
While the bulk of our outstanding balances are in Santa Clara County, 2012 has seen a considerable amount of funding outside of Santa Clara county. The Company, as a Preferred Lender, originates SBA loans and participates in the SBA 7A and 504 lending programs. Under the 7A program, a loan is made for commercial or real estate purposes. The SBA guarantees these loans and the guarantee may range from 75% to 85% of the total loan. In addition, the loan could be collateralized by a deed of trust on real estate.
Under the 504 program, the Company lends directly to the borrower and takes a first deed of trust to the subject property. In addition the SBA, through a Community Development Company makes an additional loan to the borrower and takes a deed of trust subject to the Company’s position. The Company’s position in relation to the real estate loan can range from 50% to 70% loan to value.
At December 31, 2012, SBA loans comprised $87.4 million or 9.6% of total loans as compared to $73.3 million or 9.6% of total loans at December 31, 2011. The Company has the intent to sell all or a portion of the SBA loans and, as such, carries the saleable portion of SBA loans at the lower of aggregate cost or fair value. At December 31, 2012 and 2011, the fair value of SBA loans exceeded aggregate cost and therefore, SBA loans were carried at aggregate cost.
Other loans consist primarily of loans to individuals for personal uses, such as installment purchases, overdraft protection loans and a variety of other consumer purposes. At December 31, 2012, other loans totaled $5.2 million as compared to $4.4 million at December 31, 2011. At December 31, 2010, other loans totaled $4.0 million.
Allowance for Loan Losses
A consequence of lending activities is the potential for loss. The amount of such losses will vary from time to time depending upon the risk characteristics of the loan portfolio as affected by economic conditions, rising interest rates and the financial experience of the borrowers. The allowance for loan losses, which provides for the risk of losses inherent in the credit extension process, is increased by the provision for loan losses charged to expense and decreased by the amount of charge-offs net of recoveries. There is no precise method of estimating specific losses or amounts that ultimately may be charged off on particular segments of the loan portfolio. Similarly, the adequacy of the allowance for loan losses and the level of the related provision for loan losses are determined in management’s judgment based on consideration of:
· Economic conditions
· Borrowers’ financial condition
· Loan impairment
· Evaluation of industry trends
· Historic losses, migrations and delinquency trends
· Industry and other concentrations
· Loans which are contractually current as to payment terms but demonstrate a higher degree of risk as identified by management
· Continuing evaluation of the performing loan portfolio
· Periodic review and evaluation of problem loans
· Off balance sheet risks
· Assessments by regulators and other third parties
In addition to the internal assessment of the loan portfolio, the Company also retains a consultant who performs credit reviews on a regular basis and then provides an assessment of the adequacy of the allowance for loan losses. The federal banking regulators also conduct examinations of the loan portfolio periodically.
The following table summarizes the activity in the allowance for loan losses for the years ended December 31, 2012, 2011, 2010, 2009 and 2008.
|
|
|
Year ended December 31, |
| |||||||||||||
|
(dollars in thousands) |
|
2012 |
|
2011 |
|
2010 |
|
2009 |
|
2008 |
| |||||
|
|
|
|
|
|
|
|
|
|
|
|
| |||||
|
Balance, beginning of period |
|
$ |
18,540 |
|
$ |
15,546 |
|
$ |
16,012 |
|
$ |
18,554 |
|
$ |
8,608 |
|
|
Loans charged off by category: |
|
|
|
|
|
|
|
|
|
|
| |||||
|
Commercial |
|
311 |
|
756 |
|
1,406 |
|
3,108 |
|
1,995 |
| |||||
|
Real estate construction |
|
— |
|
— |
|
1,274 |
|
4,561 |
|
5,536 |
| |||||
|
Land loans |
|
17 |
|
340 |
|
748 |
|
2,674 |
|
13,518 |
| |||||
|
Real estate other |
|
— |
|
1,395 |
|
4,013 |
|
2,452 |
|
645 |
| |||||
|
Factoring and asset based |
|
2,250 |
|
— |
|
132 |
|
— |
|
— |
| |||||
|
SBA |
|
567 |
|
415 |
|
|
|
|
|
|
| |||||
|
Other |
|
— |
|
— |
|
606 |
|
— |
|
— |
| |||||
|
Total charge-offs |
|
3,145 |
|
2,906 |
|
8,179 |
|
12,795 |
|
21,694 |
| |||||
|
|
|
|
|
|
|
|
|
|
|
|
| |||||
|
Recoveries by category: |
|
|
|
|
|
|
|
|
|
|
| |||||
|
Commercial |
|
461 |
|
628 |
|
1,100 |
|
739 |
|
83 |
| |||||
|
Real estate construction |
|
11 |
|
712 |
|
799 |
|
206 |
|
37 |
| |||||
|
Land loans |
|
6 |
|
1,960 |
|
134 |
|
— |
|
— |
| |||||
|
Real estate other |
|
2 |
|
— |
|
686 |
|
108 |
|
— |
| |||||
|
Factoring and asset based |
|
— |
|
— |
|
43 |
|
— |
|
— |
| |||||
|
SBA |
|
123 |
|
— |
|
|
|
|
|
|
| |||||
|
Other |
|
— |
|
— |
|
251 |
|
— |
|
— |
| |||||
|
Total recoveries |
|
603 |
|
3,300 |
|
3,013 |
|
1,053 |
|
120 |
| |||||
|
|
|
|
|
|
|
|
|
|
|
|
| |||||
|
Net charge-offs (recoveries) |
|
2,542 |
|
(394 |
) |
5,166 |
|
11,742 |
|
21,574 |
| |||||
|
|
|
|
|
|
|
|
|
|
|
|
| |||||
|
Provision charged to expense by category: |
|
|
|
|
|
|
|
|
|
|
| |||||
|
Commercial |
|
700 |
|
1,056 |
|
(1,391 |
) |
2,503 |
|
8,091 |
| |||||
|
Real estate construction |
|
(5,449 |
) |
41 |
|
660 |
|
7,033 |
|
7,994 |
| |||||
|
Land loans |
|
(876 |
) |
(2,028 |
) |
866 |
|
(1,147 |
) |
18,715 |
| |||||
|
Real estate other |
|
4,563 |
|
1,386 |
|
3,185 |
|
1,516 |
|
2,237 |
| |||||
|
Factoring and asset based |
|
4,220 |
|
807 |
|
603 |
|
(161 |
) |
1,222 |
| |||||
|
SBA |
|
782 |
|
1,312 |
|
495 |
|
(498 |
) |
1,673 |
| |||||
|
Other |
|
10 |
|
26 |
|
282 |
|
(46 |
) |
196 |
| |||||
|
Total provision charged to expense |
|
3,950 |
|
2,600 |
|
4,700 |
|
9,200 |
|
40,128 |
| |||||
|
|
|
|
|
|
|
|
|
|
|
|
| |||||
|
Balance, end of year |
|
$ |
19,948 |
|
$ |
18,540 |
|
$ |
15,546 |
|
$ |
16,012 |
|
$ |
27,162 |
|
The increase in the allowance for loan losses of $1.4 million from December 31, 2011 to $19.9 million at December 31, 2012 is primarily attributable to the growth of the loan portfolio. The provision for loan losses for the twelve months ending December 31, 2012 and December 31, 2011 was $4.0 million and $2.6 million, respectively. The increase in the provision for loan losses for the year ending December 31, 2012 compared to the same period one year ago reflects the growth of the loan portfolio, combined with higher charge-offs and decreased recoveries experienced during the current year.
Based on an evaluation of individual credits, historical credit loss experience by loan type, economic conditions, and the Company’s reassessment of risks, management has allocated the allowance for loan losses as a percentage of total gross loans at December 31 of the previous five years as follows:
|
|
|
As of December 31, |
| |||||||||||||
|
(dollars in thousands) |
|
2012 |
|
2011 |
|
2010 |
|
2009 |
|
2008 |
| |||||
|
|
|
|
|
|
|
|
|
|
|
|
| |||||
|
Commercial |
|
$ |
6,394 |
|
$ |
5,544 |
|
$ |
4,616 |
|
$ |
6,313 |
|
$ |
6,179 |
|
|
Real estate construction |
|
673 |
|
6,111 |
|
5,358 |
|
5,173 |
|
2,495 |
| |||||
|
Land loans |
|
333 |
|
1,220 |
|
1,628 |
|
1,376 |
|
5,197 |
| |||||
|
Real estate other |
|
5,178 |
|
613 |
|
622 |
|
764 |
|
1,592 |
| |||||
|
Factoring and asset based |
|
4,352 |
|
2,382 |
|
1,575 |
|
1,061 |
|
1,222 |
| |||||
|
SBA |
|
2,905 |
|
2,567 |
|
1,670 |
|
1,175 |
|
1,673 |
| |||||
|
Other |
|
113 |
|
103 |
|
77 |
|
150 |
|
196 |
| |||||
|
|
|
$ |
19,948 |
|
$ |
18,540 |
|
$ |
15,546 |
|
$ |
16,012 |
|
$ |
18,554 |
|
|
|
|
|
|
|
|
|
|
|
|
|
| |||||
|
Commercial |
|
0.7 |
% |
0.7 |
% |
0.7 |
% |
1.1 |
% |
0.9 |
% | |||||
|
Real estate construction |
|
0.1 |
% |
0.8 |
% |
0.8 |
% |
0.9 |
% |
0.4 |
% | |||||
|
Land loans |
|
0.0 |
% |
0.2 |
% |
0.2 |
% |
0.2 |
% |
0.7 |
% | |||||
|
Real estate other |
|
0.6 |
% |
0.1 |
% |
0.1 |
% |
0.1 |
% |
0.2 |
% | |||||
|
Factoring and asset based |
|
0.5 |
% |
0.3 |
% |
0.2 |
% |
0.2 |
% |
0.2 |
% | |||||
|
SBA |
|
0.3 |
% |
0.3 |
% |
0.3 |
% |
0.2 |
% |
0.2 |
% | |||||
|
Other |
|
0.0 |
% |
0.0 |
% |
0.0 |
% |
0.0 |
% |
0.0 |
% | |||||
|
|
|
2.20 |
% |
2.43 |
% |
2.39 |
% |
2.78 |
% |
2.65 |
% | |||||
Beginning in the second quarter of 2008, deterioration in economic conditions within the Company’s market area and, as applicable, the State of California and/or national macroeconomic conditions resulted in increased stress to the loan portfolio, specifically construction and land development loans outside of the Company’s primary market of Santa Clara County and contiguous portions of San Mateo and Alameda counties.
In response to the deteriorating market conditions, the Company undertook steps to aggressively reduce the exposure to construction and land development loans with particular emphasis on reducting loans outside of its primary market area. Management curtailed new loan origination, thoroughly reviewed collateral values of projects approaching maturity and conservatively evaluated the market prospects of collateral for indications of impairments.
At December 31, 2012, the Company’s land development portfolio was $9.0 million with just $600,000 remaining exposure outside of the primary market area. Further, approximately 42% of the loans in this category are underwritten to amortizing term structures supported by cash flow from liquidity of the borrowers.
Construction loans at December 31, 2012 were $35.5 million with $400,000 remaining on projects outside of the primary market area. In addition, at that date $20.4 million, or 57%, were loans to finance commercial projects. There were no construction loans to finance residential projects of five or more units.
The aggressive management of credits in this category resulted in elevated levels of nonperforming assets as loans are placed on nonaccrual through the marketing phase of the underlying project. In addition, loans placed on nonaccrual have been reduced to the level of indicated impairments. This resulted in an elevated level of charge-offs. Management believes that this practice results in a recorded level of nonperforming assets that generally has been reduced to a net liquidation value, and as these assets are liquidated do not expect to incur additional significant losses in 2008, 2009 and, to a lesser extent, 2010. Nonperforming loans at December 31, 2012, on average, have been reduced by approximately 27% of the remaining contractual balance, which was taken as a charge-off against the allowance for loan losses. Additionally, non-performing loans at December 31, 2012, on average, have been reduced by approximately 9% for payment received in non-accrual interest.
Due to positive trends in overall loan classifications during 2011 and 2012, reflecting the improving condition of the loan portfolio combined with new loan production, the Company has been able to lower the level of reserves to 2.20% of total loans at December 31, 2012. The coverage ratio, the ratio of allowance for loan losses to nonperforming loans was 200.14% at December 31, 2012. Management believes that the coverage ratio reflects the conservative charge-off practice and that the allowance is adequate for losses not specifically identified in impairment analyses.
At December 31, 2012 nonperforming assets of $10.1 million, or 0.75% of total assets reflects a substantial decrease compared to $16.0 million, or 1.38% of total assets on December 31, 2011. The following summarizes nonperforming assets and loans restructured and in compliance with modified terms at December 31, 2012, 2011, 2010, 2009, and 2008.
|
|
|
As of December 31, |
| |||||||||||||
|
(dollars in thousands) |
|
2012 |
|
2011 |
|
2010 |
|
2009 |
|
2008 |
| |||||
|
|
|
|
|
|
|
|
|
|
|
|
| |||||
|
Loans accounted for on a non-accrual basis |
|
$ |
9,967 |
|
$ |
11,840 |
|
$ |
16,696 |
|
$ |
17,009 |
|
$ |
15,772 |
|
|
Loans with principal or interest contractually past due 90 days or more, and accruing |
|
— |
|
— |
|
— |
|
— |
|
— |
| |||||
|
Nonperforming loans |
|
9,967 |
|
11,840 |
|
16,696 |
|
17,009 |
|
15,772 |
| |||||
|
Other real estate owned |
|
144 |
|
4,126 |
|
6,645 |
|
6,509 |
|
1,096 |
| |||||
|
|
|
$ |
10,111 |
|
$ |
15,966 |
|
$ |
23,341 |
|
$ |
23,518 |
|
$ |
16,868 |
|
|
|
|
|
|
|
|
|
|
|
|
|
| |||||
|
Loans restructured and in compliance with modified terms |
|
9,402 |
|
10,677 |
|
4,494 |
|
16,834 |
|
— |
| |||||
|
|
|
|
|
|
|
|
|
|
|
|
| |||||
|
Nonperforming assets and restructured loans |
|
$ |
19,513 |
|
$ |
26,643 |
|
$ |
27,835 |
|
$ |
40,352 |
|
$ |
16,868 |
|
The nonperforming assets at December 31, 2012 consisted of sixteen loans on nonaccrual or 90 days or more past due and still accruing totaling $10.8 million, and other real estate owned valued at $144,000. Nonperforming loans at December 31, 2012 were comprised of loans with legal contractual balances totaling approximately $15.5 million reduced by $1.4 million received in nonaccrual interest and impairment charges of $4.1 million which have been charged against the allowance for loan losses. As a result, there no longer was an indicated potential loss exposure pertaining to nonperforming loans and no impairment reserves were required to be included in the allowance for loan losses. There were seventeen non-accrual loans totaling $11.8 million at December 31, 2011 and fifteen non-accrual loans totaling $16.7 million at December 31, 2010.
The accrual of interest on loans is discontinued and any accrued and unpaid interest is reversed when, in the opinion of Management, there is significant doubt as to the collectability of interest or principal or when the payment of principal or interest is ninety days past due, unless the amount is well-secured and in the process of collection.
The following table sets forth the components of nonperforming loans as of December 31, 2012:
(dollars in thousands)
|
December 31, 2012 | ||||||
|
Classification |
|
Amount |
|
Collateral |
| |
|
|
|
|
|
|
| |
|
Real estate other |
|
5,783 |
|
Special purpose facility in Santa Cruz County |
| |
|
|
|
5,783 |
|
|
| |
|
|
|
|
|
|
| |
|
SBA |
|
862 |
|
Special purpose facility in Alameda County |
| |
|
SBA |
|
354 |
|
Special purpose facilities in San Diego County |
| |
|
SBA |
|
344 |
|
Mixed used building in Santa Clara County |
| |
|
SBA |
|
226 |
|
Special purpose facilities in Orange County |
| |
|
SBA |
|
58 |
|
Lot for single family homes in Contra Costa County |
| |
|
SBA |
|
166 |
|
Single family residences in Orange and LA Counties |
| |
|
SBA |
|
24 |
|
Commercial building in San Diego County |
| |
|
SBA |
|
7 |
|
Light industrial warehouse space in Stanislaus County |
| |
|
SBA |
|
6 |
|
Single family residence in Santa Clara County |
| |
|
|
|
2,047 |
|
|
| |
|
|
|
|
|
|
| |
|
Factoring/asset based lending |
|
1,450 |
|
Business assets |
| |
|
|
|
1,450 |
|
|
| |
|
|
|
|
|
|
| |
|
Commercial |
|
676 |
|
Business assets |
| |
|
|
|
676 |
|
|
| |
|
|
|
|
|
|
| |
|
Land |
|
11 |
|
Lot for commercial development in Calaveras County |
| |
|
|
|
11 |
|
|
| |
|
|
|
|
|
|
| |
|
Total nonperforming loans |
|
$ |
9,967 |
|
|
|
Included in nonperforming loans at December 31, 2012 are loans totaling $6.5 million that have been modified in trouble debt restructurings, where concessions have been granted to borrowers experiencing financial difficulties. These concessions could include a reduction in the interest rate on a loan, payment extensions, forgiveness of principal, or other actions intended to maximize collection. In order for these loans to return to accrual status, the borrower must demonstrate a sustained period of timely payments. As of December 31, 2012, previously modified loans totaling $9.4 million were considered performing due to a sustained period of timely payments and therefore were accounted for on an accrual basis.
Management undertakes significant processes in order to identify potential problem loans in a timely manner. In addition to regular interaction with the Company’s borrowers, the relationship managers review the credit ratings for each loan on a monthly basis and identify any potential downgrades. For commercial and factoring/asset-based loans, the Company receives quarterly financial statements and other pertinent reporting, such as borrowing bases for asset-based facilities, so as to identify any deteriorating financial trends. Covenant compliance for these loans is also monitored on a quarterly basis. For real estate construction and land loans, the development, construction and lease up or sell out status of each project is monitored on a monthly basis. For SBA loans and loans secured by standing commercial or residential property, the Company receives updated rent rolls, operating statements, and/or tax returns on an annual basis. In addition, home equity loans are reviewed annually for deterioration in either the underlying property value or the borrower’s payment history. Management also engages a third party loan review firm that reviews the loan portfolio periodically to further identify potential problem loans. The loan review includes assessment of underwriting, quality of legal documents, management of the loan relationship, and adherence to the credit policy along with acceptable risk mitigation and rationale for exceptions to the policy.
As part of the loan approval process, management identifies the nature and type of underlying collateral supporting individual loans. Prior to or at the time of initial advances, any required lien positions are verified using UCC lien searches for personal property collateral, or title insurance for real property collateral. The Company engages a third party loan review firm to conduct an annual review of its loan documentation and the related policies and procedures regarding the loan documentation process.
The Company primarily relies on fair market appraisals to determine the value of underlying real estate collateral. Appraisals are required for real property secured loans of $250,000 or more, including increases to existing loans of $250,000 or more. In the event there is evidence of deterioration in values, an evaluation of the collateral value and/or a full new appraisal is required for an extension of the loan maturity. Potential problem loans are typically reappraised every 12 months depending size, nature, current economic conditions and the borrower’s current financial performance and repayment history. The appraisals are performed by Board approved appraisers that have appropriate licensing and experience. Generally, when a prospective loan amount exceeds $3.0 million, the completed appraisal is further reviewed by a qualified third party review appraiser. To determine the value of underlying collateral for formula lines of credit that are predicated on a borrowing base of eligible assets, the Company typically requires a pre loan funding field audit of the borrower’s financial records to verify the accounts receivable, their eligibility for inclusion in the borrowing base, performance of the collateral and any asset concentrations.
On a monthly basis, relationship managers assess the collateral position of individual loans and identify any potential collateral shortfalls which, if left uncorrected, could result in deterioration of the repayment prospects for the loan at some future date. Any potential collateral shortfalls are incorporated into a written corrective action plan. The status of the corrective action plans are reviewed by executive management. Review of ability to acquire additional collateral and the related timeframes are addressed on an individual loan basis.
At the time a loan is classified as substandard (which includes any loan on non-accrual), the Company performs an impairment analysis of the collateral based on appraisals, field audits, other market value indicators, and Management’s judgment. Any shortfall between the collateral’s realization value and the loan balance is charged-off at that time when management believes the uncollectibility of the loan is confirmed. Impairment analyses are updated on a monthly basis. Additionally, as underlying collateral is reappraised the value of the collateral is reassessed and any additional charge-off is taken at that time. A similar practice is followed for downward adjustments to the Company’s OREO carrying value.
Management is of the opinion that the allowance for loan losses is maintained at a level adequate for known and unidentified losses inherent in the portfolio. However, although the Company is seeing a lower rate of inflow into problem assets generally, as well as a consistent reduction of carrying values through continued payments by borrowers on loans that have been placed on non-accrual, should circumstances change and management determines that the collectibility of any of these credits becomes unlikely, there could be an adverse effect on the level of the allowance for loan losses and the Company’s future profitability.
Funding
Deposits represent the Bank’s principal source of funds. Most of the Bank’s deposits are obtained from professionals, small- to medium sized businesses and individuals within the Bank’s market area. The Bank’s deposit base consists of non-interest and interest-bearing demand deposits, money market and savings accounts and certificates of deposit.
The following table summarizes the composition of deposits as of December 31, 2012, 2011 and 2010.
|
|
|
As of December 31, |
| |||||||||||||
|
|
|
2012 |
|
2011 |
|
2010 |
| |||||||||
|
(dollars in thousands) |
|
Amount |
|
Percent |
|
Amount |
|
Percent |
|
Amount |
|
Percent |
| |||
|
|
|
|
|
|
|
|
|
|
|
|
|
|
| |||
|
Noninterest-bearing demand |
|
$ |
723,517 |
|
62.24 |
% |
$ |
660,036 |
|
66.09 |
% |
$ |
443,806 |
|
52.34 |
% |
|
Interest bearing demand |
|
10,582 |
|
0.91 |
% |
4,272 |
|
0.43 |
% |
5,275 |
|
0.62 |
% | |||
|
Money market and savings |
|
380,949 |
|
32.77 |
% |
298,145 |
|
29.85 |
% |
355,772 |
|
41.96 |
% | |||
|
Certificates of deposit: |
|
|
|
|
|
|
|
|
|
|
|
|
| |||
|
Less than $100,000 |
|
3,167 |
|
0.27 |
% |
4,213 |
|
0.42 |
% |
9,212 |
|
1.09 |
% | |||
|
$100,000 and more |
|
44,333 |
|
3.81 |
% |
32,009 |
|
3.21 |
% |
33,881 |
|
4.00 |
% | |||
|
|
|
|
|
|
|
|
|
|
|
|
|
|
| |||
|
Total deposit portfolio |
|
$ |
1,162,548 |
|
100.00 |
% |
$ |
998,675 |
|
100.00 |
% |
$ |
847,946 |
|
100.00 |
% |
Deposits increased $163.9 million or 16.4% from $998.7 million at December 31, 2011 to $1.2 billion at December 31, 2012. The increase in deposits was predominately in core deposit production which was primarily used to fund new loans and increase the investment portfolio.
Leverage
Total gross loan balances at December 31, 2012 were $908.6 million. The resulting loan to deposit ratio was 78.15%. Other earning assets at December 31, 2012 were primarily comprised of investment securities, federal funds sold and interest-bearing deposits of $381.3 million. To date, the Company has deployed other earning assets primarily in federal funds sold to address the potential volatility of deposit balances and to accommodate projected loan funding, and in short term fixed rate investments to mitigate interest rate risk associated with the Company’s asset-sensitive balance sheet. When deploying other earning assets, the Company implements strategic decisions that may have a beneficial or adverse impact on net interest income and on the net interest margin to manage the business through a variety of economic cycles.
Capital Resources
The Company and the Bank are subject to the capital guidelines and regulations governing capital adequacy for bank holding companies and national banks. Additional capital requirements may be imposed on banks based on market risk. For discussion of capital requirements applicable to the Bank and the Company, see “Capital Adequacy Requirements” and “Prompt Corrective Action” above.
The Company’s capital resources consist of shareholders’ equity, trust preferred securities and (for regulatory purposes) the allowance for loan losses (subject to limitations). At December 31, 2012, the Company’s capital resources increased $16.0 million to $175.5 million from $159.5 million at December 31, 2011. Tier 1 capital increased $14.0 million to $161.1 million at December 31, 2012. The Company’s Tier 1 capital at December 31, 2012 was was comprised of $106.8 million of capital stock and surplus, $37.2 million in retained earnings and trust preferred securities up to the allowable limit of $17.0 million.
The Company’s Tier 1 capital at December 31, 2012 was $161.1 million, which was comprised of $106.8 million of capital stock and surplus, $37.2 million in retained earnings and trust preferred securities up to the allowable limit of $17.0 million.
The Company is subject to capital adequacy guidelines issued by the Board of Governors and the OCC. The Company is required to maintain total capital equal to at least 8.0% of assets and commitments to extend credit, weighted by risk, of which at least 4.0% must consist primarily of common equity including retained earnings (Tier 1 capital) and the remainder may consist of subordinated debt, cumulative preferred stock or a limited amount of allowance for loan losses. Certain assets and commitments to extend credit present less risk than others and will be assigned to lower risk-weighted categories requiring less capital allocation than the 8.0% total ratio. For example, cash and government securities are assigned to a 0.0% risk-weighted category, most home mortgage loans are assigned to a 50.0% risk-weighted category requiring a 4.0% capital allocation and commercial loans are assigned to a 100.0% risk-weighted category requiring an 8.0% capital allocation. As of December 31, 2012, the Company’s and the Bank’s total risk-based capital ratios were 15.23% and 13.08%, respectively (16.06% for the Company and 13.53% for the Bank at December 31, 2011).
The following table reflects the Company’s capital ratios for the period ended December 31, 2012 and 2011 as well as the minimum capital ratios required to be deemed “well capitalized” under the regulatory framework.
|
|
|
As of December 31, |
| ||||||||
|
|
|
2012 |
|
2011 |
| ||||||
|
(dollars in thousands) |
|
Amount |
|
Ratio |
|
Amount |
|
Ratio |
| ||
|
Company Capital Ratios |
|
|
|
|
|
|
|
|
| ||
|
Tier 1 Capital |
|
$ |
161,074 |
|
13.98 |
% |
$ |
147,043 |
|
14.80 |
% |
|
(to Risk Weighted Assets) |
|
|
|
|
|
|
|
|
| ||
|
Tier 1 capital minimum requirement |
|
$ |
69,149 |
|
6.00 |
% |
$ |
59,597 |
|
6.00 |
% |
|
|
|
|
|
|
|
|
|
|
| ||
|
Total Capital |
|
$ |
175,548 |
|
15.23 |
% |
$ |
159,540 |
|
16.06 |
% |
|
(to Risk Weighted Assets) |
|
|
|
|
|
|
|
|
| ||
|
Total capital minimum requirement |
|
$ |
115,248 |
|
10.00 |
% |
$ |
99,328 |
|
10.00 |
% |
|
|
|
|
|
|
|
|
|
|
| ||
|
Company leverage |
|
|
|
|
|
|
|
|
| ||
|
Tier 1 Capital |
|
$ |
161,074 |
|
12.50 |
% |
$ |
147,043 |
|
13.36 |
% |
|
(to Average Assets) |
|
|
|
|
|
|
|
|
| ||
|
Total capital minimum requirement |
|
$ |
64,433 |
|
5.00 |
% |
$ |
55,020 |
|
5.00 |
% |
|
|
|
|
|
|
|
|
|
|
| ||
|
Bank Risk Based Capital Ratios |
|
|
|
|
|
|
|
|
| ||
|
Tier 1 Capital |
|
$ |
136,227 |
|
11.82 |
% |
$ |
121,296 |
|
12.27 |
% |
|
(to Risk Weighted Assets) |
|
|
|
|
|
|
|
|
| ||
|
Tier 1 capital minimum requirement |
|
$ |
69,142 |
|
6.00 |
% |
$ |
59,298 |
|
6.00 |
% |
|
|
|
|
|
|
|
|
|
|
| ||
|
Total Capital |
|
$ |
150,700 |
|
13.08 |
% |
$ |
133,725 |
|
13.53 |
% |
|
(to Risk Weighted Assets) |
|
|
|
|
|
|
|
|
| ||
|
Total capital minimum requirement |
|
$ |
115,236 |
|
10.00 |
% |
$ |
98,830 |
|
10.00 |
% |
|
|
|
|
|
|
|
|
|
|
| ||
|
Bank leverage |
|
|
|
|
|
|
|
|
| ||
|
Tier 1 Capital |
|
$ |
136,227 |
|
10.59 |
% |
$ |
121,296 |
|
11.17 |
% |
|
(to Average Assets) |
|
|
|
|
|
|
|
|
| ||
|
Total capital minimum requirement |
|
$ |
64,326 |
|
5.00 |
% |
$ |
54,317 |
|
5.00 |
% |
The federal banking agencies, including the OCC, have adopted regulations implementing a system of prompt corrective action under FDICIA. The regulations establish five capital categories with the following characteristics: (1) “Well capitalized,” consisting of institutions with a total risk-based capital ratio of 10.0% or greater, a Tier 1 risk-based capital ratio of 6.0% or greater and a leverage ratio of 5.0% or greater and which are not operating under an order, written agreement, capital directive or prompt corrective action directive; (2) “Adequately capitalized,” consisting of institutions with a total risk-based capital ratio of 8.0% or greater, a Tier 1 risk-based capital of 4.0% or greater and a leverage ratio of 4.0% or greater and which do not meet the definition of a “well capitalized” institution; (3) “Undercapitalized,” consisting of institutions with a total risk-based capital ratio of less than 8.0%, a Tier 1 risk-based capital ratio of less than 4.0%, or a leverage ratio of less than 4.0%; (4) “Significantly undercapitalized,” consisting of institutions with a total risk-based capital ratio of less than 6.0%, a Tier 1 risk-based capital ratio of less than 3.0%, or a leverage ratio of less than 3.0%; and (5) “Critically undercapitalized,” consisting of institutions with a ratio of tangible equity to total assets that is equal to or less than 2.0%.
Financial institutions classified as undercapitalized or below are subject to various limitations including, among other matters, certain supervisory actions by bank regulatory authorities and restrictions related to (i) growth of assets, (ii) payment of interest on subordinated indebtedness, (iii) payment of dividends or other capital distributions, and (iv) payment of management fees to a parent holding company. The FDICIA requires the bank regulatory authorities to initiate corrective action regarding financial institutions that fail to meet minimum capital requirements. Such action may result in orders to, among other matters, augment capital and reduce total assets. Critically undercapitalized financial institutions may also be subject to appointment of a receiver or implementation of a capitalization plan.
In response to increasing risk perceived in the economic environment, during the fourth quarter of 2008 the Company raised $53.9 million of additional capital. Additionally, to support tangible common equity as a component of Tier 1 capital and to ensure resources for the eventual TARP repayment, the Company successfully completed the sale of $30.0 million in common stock to a group of institutional investors in a private placement transaction during the fourth quarter of 2010. The following is a summary of these issuances:
Private Placement (2010)
On November 23, 2010, investors purchased $30.0 million of the Company’s common stock in a private placement transaction. The investors in the private placement purchased 3,508,771 shares of common stock at a price per share of $8.55.
Under a Stock Purchase Agreement dated as of December 4, 2008 (see below), as amended, by and between the Company and Carpenter Fund Manager G.P., LLC, the Company granted certain participation rights to Carpenter Community BancFund, L.P., Carpenter Community BancFund-A, L.P. and Carpenter Community BancFund-CA, L.P. (collectively, the “Carpenter Funds”). As part of the November 23, 2010 private placement transaction, Carpenter Funds agreed to purchase an additional 1,103,275 common shares pursuant to the Stock Purchase Agreement. As a result, after the closing of this transaction, the Carpenter Funds held a total of 4,906,928 shares of the Company’s common stock or approximately 33.9% of the Company’s outstanding shares of common stock.
Private Placement (2008)
On December 4, 2008, the Carpenter Funds agreed to purchase $30.0 million of the Company’s Series B and B-1 Mandatorily Convertible Cumulative Perpetual Preferred Stock in a private placement, subject to the United States Department of the Treasury approving our participation in the TARP Capital Purchase Program (see discussion below).
On December 17, 2008, the Company completed the private placement sale of 131,901 shares of its Series B Mandatorily Convertible Cumulative Perpetual Preferred Stock and 168,099 shares of its Series B-1 Mandatorily Convertible Cumulative Perpetual Preferred Stock, for aggregate consideration of $30.0 million, which is $100 per share for both series of shares, to a private fund. The Series B and Series B-1 shares accrue dividends at a rate of 10% per annum, payable quarterly.
On March 31, 2010, the Company completed an early conversion of the Series B and B-1 preferred shares. As a result of the conversion, the Company issued a total of 3,710,289 shares of its common stock and convertible promissory notes in the aggregate principal amount of $789,860 (the “Notes”) upon conversion of the Preferred Stock and as payment of all accrued but unpaid dividends thereon through September 30, 2010 pursuant to an agreement dated as of March 23, 2010. The effective conversion price of the Series B and B-1 Preferred was $8.46 per share, which was the closing price of the common stock reported on the Nasdaq Global Select Market on the date of the agreement. As a result of the conversion, there are no shares of Series B and B-1 Preferred outstanding.
The principal amount of the Notes accrued interest at the rate of 10% per annum and was convertible to common stock at the price of $8.46 per share. On June 17, 2010, the Notes were converted into 93,364 shares of common stock. As a result of the conversion, the Notes ceased to be outstanding.
Troubled Assets Relief Program (TARP)
On November 13, 2008, the United States Department of the Treasury (the Treasury) approved the Company’s participation in the TARP Capital Purchase Program, subject to the Company raising additional equity in an amount satisfactory to the Treasury. On December 4, 2008, investors agreed to purchase $30.0 million of the Company’s Series B and B-1 Mandatorily Convertible Cumulative Perpetual Preferred Stock in a private placement (see discussion above), subject to the Treasury approving the Company’s participation in the TARP Capital Purchase Program and its ability to satisfy all legal requirements for selling equity securities to the Treasury under the program.
On December 23, 2008, the Company issued 23,864 shares of its Fixed Rate Cumulative Perpetual Series C Preferred Stock, having a liquidation value of $23.9 million, to the Treasury. Dividends accrue at the rate of 5% per annum for the first five years and then 9% per annum thereafter. In addition the Company issued a warrant to purchase up to 396,412 shares of the Company’s common stock at a purchase price of $9.03 per share, subject to certain adjustment provisions.
In connection with Treasury’s investment, the Company has agreed, so long as the Treasury holds any securities of the Company, to ensure that its compensation arrangements with respect to its senior executive officers comply with the applicable provisions of the Emergency Economic Stabilization Act of 2008 and the American Recovery and Reinvestment Act of 2009.
On March 16, 2011, the Company fully redeemed all of its Series C Preferred Stock under the TARP Capital Purchase Program for $23.9 million. The redemption was funded by the net proceeds from the $30.0 million private placement of the Company’s common stock completed in the fourth quarter of 2010. As a result of the early repayment, the Company recorded a $30,000 charge in the first quarter of 2011 to reflect the accelerated accretion of the remaining discount on the preferred stock.
On April 20, 2011, the Company negotiated and repurchased the Warrant held by the Treasury for $1.4 million, which was recorded as a reduction to shareholders’ equity.
Item 7a. Quantitative and Qualitative Disclosures about Market Risk
Liquidity/Interest Rate Sensitivity
The Company strives to manage its liquidity to provide adequate funds at an acceptable cost to support the borrowing requirements and deposit flows of its customers. Liquidity requirements are evaluated by taking into consideration factors such as deposit concentrations, seasonality and maturities, loan and lease demand, capital expenditures and prevailing and anticipated economic conditions. The Company’s business is generated primarily through customer referrals and employee business development efforts.
The Company is primarily a business and professional bank and, as such, its deposit base is more susceptible to economic fluctuations. The Company strives to maintain a balanced position of liquid assets to volatile and cyclical deposits. At December 31, 2012, liquid assets as a percentage of deposits were 33.0% as compared to 34.9% in 2011. In addition to cash and due from banks, liquid assets include interest-bearing deposits with other banks, federal funds sold, and unpledged securities available for sale. The Company has $47.0 million in Federal funds lines of credit available with correspondent banks to meet liquidity needs. At December 31, 2012, there were no balances outstanding on these lines. Additionally, as of December 31, 2012, the Company had a total borrowing capacity with the Federal Home Loan Bank of San Francisco of approximately $312.0 million for which the Company had collateral in place to borrow $212.0 million. As of December 31, 2012, $12.0 million of this borrowing capacity was pledged to secure a letter of credit.
The Company’s balance sheet position is asset-sensitive (based upon the significant amount of variable rate loans and the repricing characteristics of its deposit accounts). This balance sheet position generally provides a hedge against rising interest rates, but has a detrimental effect during times of interest rate decreases. Net interest income is generally negatively impacted in the short term by a decline in interest rates. Conversely, an increase in interest rates should have a short-term positive impact on net interest income.
Management regularly reviews general economic and financial conditions, both external and internal, and determines whether the positions taken with respect to liquidity and interest rate sensitivity continue to be appropriate. The Bank utilizes a monthly “Gap” report as well as a quarterly simulation model to identify interest rate sensitivity over the short- and long-term. Management considers the results of these analyses when implementing its interest rate risk management activities, including the utilization of certain interest rate hedges.
The following table sets forth the distribution of repricing opportunities, based on contractual terms, of the Company’s earning assets and interest-bearing liabilities at December 31, 2012, the interest rate sensitivity gap (i.e. interest rate sensitive assets less interest rate sensitive liabilities), the cumulative interest rate sensitivity gap, the interest rate sensitivity gap ratio (i.e. interest rate gap divided by interest rate sensitive assets) and the cumulative interest rate sensitivity gap ratio.
|
|
|
As of December 31, 2012 |
| ||||||||||||||||
|
|
|
|
|
After three |
|
After six |
|
After one |
|
|
|
|
| ||||||
|
|
|
Within |
|
months but |
|
months but |
|
year but |
|
After |
|
|
| ||||||
|
|
|
three |
|
within six |
|
within one |
|
within |
|
five |
|
|
| ||||||
|
(dollars in thousands) |
|
months |
|
months |
|
year |
|
five years |
|
years |
|
Total |
| ||||||
|
|
|
|
|
|
|
|
|
|
|
|
|
|
| ||||||
|
Federal funds sold |
|
$ |
113,790 |
|
$ |
— |
|
$ |
— |
|
$ |
— |
|
$ |
— |
|
$ |
113,790 |
|
|
Interest bearing deposits in other banks |
|
335 |
|
— |
|
— |
|
— |
|
— |
|
335 |
| ||||||
|
U.S. treasury and Investment securities |
|
— |
|
10,965 |
|
6,639 |
|
59,152 |
|
190,448 |
|
267,204 |
| ||||||
|
Loans |
|
256,942 |
|
102,417 |
|
131,559 |
|
300,997 |
|
116,664 |
|
908,579 |
| ||||||
|
Total earning assets |
|
$ |
371,067 |
|
$ |
113,382 |
|
$ |
138,198 |
|
$ |
360,149 |
|
$ |
307,112 |
|
$ |
1,289,908 |
|
|
|
|
|
|
|
|
|
|
|
|
|
|
|
| ||||||
|
Interest checking, money market and savings deposits |
|
391,531 |
|
— |
|
— |
|
— |
|
— |
|
391,531 |
| ||||||
|
Certificates of deposit: |
|
|
|
|
|
|
|
|
|
|
|
|
| ||||||
|
Less than $250,000 |
|
4,216 |
|
2,752 |
|
2,206 |
|
21,378 |
|
— |
|
30,552 |
| ||||||
|
$250,000 or more |
|
10,357 |
|
2,268 |
|
3,611 |
|
712 |
|
— |
|
16,948 |
| ||||||
|
Total interest-bearing liabilities |
|
406,104 |
|
5,020 |
|
5,817 |
|
22,090 |
|
— |
|
439,031 |
| ||||||
|
|
|
|
|
|
|
|
|
|
|
|
|
|
| ||||||
|
Interest rate gap |
|
$ |
(35,037 |
) |
$ |
108,362 |
|
$ |
132,382 |
|
$ |
338,059 |
|
$ |
307,112 |
|
$ |
850,877 |
|
|
Cumulative interest rate gap |
|
$ |
(35,037 |
) |
$ |
73,325 |
|
$ |
205,706 |
|
$ |
543,766 |
|
$ |
850,877 |
|
|
| |
|
|
|
|
|
|
|
|
|
|
|
|
|
|
| ||||||
|
Interest rate gap ratio |
|
$ |
(0.09 |
) |
$ |
0.96 |
|
$ |
0.96 |
|
$ |
0.94 |
|
$ |
1.00 |
|
|
| |
|
Cumulative interest rate gap ratio |
|
$ |
(0.09 |
) |
$ |
0.15 |
|
$ |
0.33 |
|
$ |
0.55 |
|
$ |
0.66 |
|
|
| |
Based on the contractual terms of its assets and liabilities, the Bank’s balance sheet at December 31, 2012 was asset sensitive in terms of its short-term exposure to interest rates. That is, at December 31, 2012 the volume of assets that might reprice within the next year exceeded the volume of liabilities that might reprice. This position provides a hedge against rising interest rates, but has a detrimental effect during times of rate decreases. Net interest income is negatively impacted by a decline in interest rates and positively impacted by an increase in interest rates. To partially mitigate the adverse impact of declining rates, the majority of variable rate loans made by the Bank have been written with a minimum “floor” rate.
The following table shows maturities of the loan portfolio at December 31, 2012 and 2011. At December 31, 2012, approximately 78.5% of the loan portfolio is priced with floating interest rates which limit the exposure to interest rate risk on long-term loans.
|
|
|
As of December 31, 2012 |
| ||||||||||
|
|
|
|
|
|
|
Due after one |
|
|
| ||||
|
|
|
|
|
Due one year |
|
year through |
|
Due after |
| ||||
|
(dollars in thousands) |
|
Amount |
|
or less |
|
five years |
|
five years |
| ||||
|
|
|
|
|
|
|
|
|
|
| ||||
|
Commercial |
|
$ |
436,293 |
|
$ |
199,822 |
|
$ |
215,759 |
|
$ |
20,712 |
|
|
Real estate construction |
|
35,501 |
|
15,272 |
|
4,247 |
|
15,982 |
| ||||
|
Real estate land |
|
8,973 |
|
4,584 |
|
4,389 |
|
— |
| ||||
|
Real estate other |
|
139,931 |
|
24,316 |
|
48,250 |
|
67,365 |
| ||||
|
Factoring and asset based |
|
195,343 |
|
145,003 |
|
50,340 |
|
— |
| ||||
|
SBA |
|
87,375 |
|
1,885 |
|
1,562 |
|
83,928 |
| ||||
|
Other |
|
5,163 |
|
4,881 |
|
282 |
|
— |
| ||||
|
Total loans |
|
$ |
908,579 |
|
$ |
395,763 |
|
$ |
324,829 |
|
$ |
187,987 |
|
|
|
|
|
|
|
|
|
|
|
| ||||
|
Variable rate loans |
|
$ |
797,663 |
|
$ |
365,553 |
|
$ |
270,255 |
|
$ |
161,855 |
|
|
Fixed rate loans |
|
110,916 |
|
30,210 |
|
54,574 |
|
26,132 |
| ||||
|
Total loans |
|
$ |
908,579 |
|
$ |
395,763 |
|
$ |
324,829 |
|
$ |
187,987 |
|
|
|
|
As of December 31, 2011 |
| ||||||||||
|
|
|
|
|
|
|
Due after one |
|
|
| ||||
|
|
|
|
|
Due one year |
|
year through |
|
Due after |
| ||||
|
|
|
Amount |
|
or less |
|
five years |
|
five years |
| ||||
|
|
|
|
|
|
|
|
|
|
| ||||
|
Commercial |
|
$ |
330,348 |
|
$ |
154,035 |
|
$ |
163,077 |
|
$ |
13,235 |
|
|
Real estate construction |
|
47,213 |
|
36,489 |
|
2,511 |
|
8,213 |
| ||||
|
Real estate land |
|
6,772 |
|
3,089 |
|
1,594 |
|
2,089 |
| ||||
|
Real estate other |
|
157,446 |
|
10,375 |
|
60,087 |
|
86,984 |
| ||||
|
Factoring and asset based |
|
142,482 |
|
101,289 |
|
41,193 |
|
— |
| ||||
|
SBA |
|
73,336 |
|
361 |
|
693 |
|
72,282 |
| ||||
|
Other |
|
4,431 |
|
4,098 |
|
334 |
|
— |
| ||||
|
Total loans |
|
$ |
762,028 |
|
$ |
309,735 |
|
$ |
269,489 |
|
$ |
182,804 |
|
|
|
|
|
|
|
|
|
|
|
| ||||
|
Variable rate loans |
|
$ |
668,191 |
|
$ |
292,721 |
|
$ |
214,006 |
|
$ |
161,464 |
|
|
Fixed rate loans |
|
93,837 |
|
17,014 |
|
55,483 |
|
21,340 |
| ||||
|
Total loans |
|
$ |
762,028 |
|
$ |
309,735 |
|
$ |
269,489 |
|
$ |
182,804 |
|
Off-Balance Sheet Arrangements and Aggregate Contractual Obligations
The definition of “off-balance sheet arrangements” includes any transaction, agreement or other contractual arrangement to which an entity is a party under which we have:
· Any obligation under a guarantee contract that has the characteristics as defined in accounting guidance related to Guarantor’s Accounting and Disclosure Requirements for Guarantee including Indirect Guarantee of Indebtedness to Others;
· A retained or contingent interest in assets transferred to an unconsolidated entity or similar arrangement that serves as credit, liquidity or market risk support to that entity for such assets, such as a subordinated retained interest in a pool of receivables transferred to an unconsolidated entity;
· Any obligation, including a contingent obligation, under a contract that would be accounted for as a derivative instrument, except that it is both indexed to the registrant’s own stock and classified in stockholders’ equity; or
· Any obligation, including contingent obligations, arising out of a material variable interest, as defined in accounting guidance, in an unconsolidated entity that provides financing, liquidity, market risk or credit risk support to the registrant, or engages in leasing, hedging or research and development services with the registrant.
In the ordinary course of business, we have issued certain guarantees which qualify as off-balance sheet arrangements. As of December 31, 2012 those guarantees include the following:
· Financial Letters of Credit in the amount of $24.6 million.
The table below summarizes the Bank’s off-balance sheet contractual obligations:
|
|
|
As of December 31, 2012 |
| |||||||||||||
|
|
|
Payments due by period |
| |||||||||||||
|
(dollars in thousands) |
|
|
|
Less Than |
|
1 - 3 |
|
3 - 5 |
|
More than |
| |||||
|
Contractural Obligations |
|
Total |
|
1 year |
|
years |
|
years |
|
5 years |
| |||||
|
|
|
|
|
|
|
|
|
|
|
|
| |||||
|
Long-term contracts |
|
$ |
2,726 |
|
$ |
696 |
|
$ |
1,392 |
|
$ |
638 |
|
$ |
— |
|
|
|
|
|
|
|
|
|
|
|
|
|
| |||||
|
Operating leases |
|
6,818 |
|
1,890 |
|
3,330 |
|
1,582 |
|
16 |
| |||||
|
|
|
|
|
|
|
|
|
|
|
|
| |||||
|
Total |
|
$ |
9,544 |
|
$ |
2,586 |
|
$ |
4,722 |
|
$ |
2,220 |
|
$ |
16 |
|
Item 8. Financial Statements and Supplementary Data
All schedules have been omitted since the required information is not present or not present in amounts sufficient to require submission of the schedule or because the information required is included in the Financial Statements or notes thereto.
* * * * *
Report of Independent Registered Public Accounting Firm
The Board of Directors and Shareholders
Bridge Capital Holdings
We have audited the accompanying consolidated balance sheets of Bridge Capital Holdings and Subsidiary as of December 31, 2012 and 2011, and the related consolidated statements of operations, comprehensive income, changes in shareholders’ equity, and cash flows for each of the years in the three year period ended December 31, 2012. These consolidated financial statements are the responsibility of the Company’s management. Our responsibility is to express an opinion on these consolidated financial statements based on our audits.
We conducted our audits in accordance with the standards of the Public Company Accounting Oversight Board (United States). Those standards require that we plan and perform the audits to obtain reasonable assurance about whether the consolidated financial statements are free of material misstatement. An audit includes examining, on a test basis, evidence supporting the amounts and disclosures in the consolidated financial statements. An audit also includes assessing the accounting principles used and significant estimates made by management, as well as evaluating the overall consolidated financial statement presentation. We believe that our audits provide a reasonable basis for our opinions.
In our opinion, the consolidated financial statements referred to above present fairly, in all material respects, the consolidated financial position of Bridge Capital Holdings and Subsidiary as of December 31, 2012 and 2011 and the consolidated results of their operations and their cash flows for each of the years in the three year period ended December 31, 2012, in conformity with U.S. generally accepted accounting principles.
We have also audited, in accordance with the standards of the Public Company Accounting Oversight Board (United States), Bridge Capital Holdings and Subsidiary’s internal control over financial reporting as of December 31, 2012, based on criteria established in Internal Control — Integrated Framework issued by the Committee of Sponsoring Organizations of the Treadway Commission (COSO), and our report dated March 12, 2013, expressed an unqualified opinion.

Rancho Cucamonga, California
March 12, 2013
Report of Independent Registered Public Accounting Firm
Board of Directors and Shareholders
Bridge Capital Holdings and Subsidiary
San Jose, California
We have audited Bridge Capital Holdings and Subsidiary’s (the Company) internal control over financial reporting as of December 31, 2012, based on criteria established in Internal Control — Integrated Framework issued by the Committee of Sponsoring Organizations of the Treadway Commission (COSO). The Company’s management is responsible for maintaining effective internal control over financial reporting and for its assessment of the effectiveness of internal control over financial reporting included in the accompanying managements report on internal control over financial reporting. Our responsibility is to express an opinion on the effectiveness of the Company’s internal control over financial reporting based on our audit.
We conducted our audit in accordance with the standards of the Public Company Accounting Oversight Board (United States). Those standards require that we plan and perform the audit to obtain reasonable assurance about whether effective internal control over financial reporting was maintained in all material respects. Our audit of internal control over financial reporting included obtaining an understanding of internal control over financial reporting, assessing the risk that a material weakness exists, and testing and evaluating the design and operating effectiveness of internal control based on the assessed risk. Our audit also included performing such other procedures as we considered necessary in the circumstances. We believe that our audit provides a reasonable basis for our opinion.
A company’s internal control over financial reporting is a process designed to provide reasonable assurance regarding the reliability of financial reporting and the preparation of financial statements for external purposes in conformity with U.S. generally accepted accounting principles. A company’s internal control over financial reporting includes those policies and procedures that (1) pertain to the maintenance of records that (1) in reasonable detail, accurately and fairly reflect the transactions and dispositions of the assets of the company; (2) provide reasonable assurance that transactions are recorded as necessary to permit preparation of financial statements in accordance with U.S. generally accepted accounting principles, and the receipts and expenditures of the company are being made only in accordance with authorizations of management and directors of the company; and (3) provide reasonable assurance regarding prevention or timely detection of unauthorized acquisition, use, or disposition of the company’s assets that could have a material effect on the financial statements.
Because of its inherent limitations, internal control over financial reporting may not prevent or detect misstatements. Also, projections of any evaluation of effectiveness to future periods are subject to the risk that controls may become inadequate because of changes in conditions, or that the degree of compliance with the policies or procedures may deteriorate.
In our opinion, the Company maintained, in all material respects, effective internal control over financial reporting as of December 31, 2012, based on criteria established in Internal Control — Integrated Framework issued by the Committee of Sponsoring Organizations of the Treadway Commission (COSO).
We have also audited, in accordance with the standards of the Public Company Accounting Oversight Board, the consolidated balance sheets of the Company as of December 31, 2012 and 2011 and the related consolidated statements of operations, comprehensive income, shareholders’ equity and cash flows for the three years in the period ended December 31, 2012, and our report dated March 12, 2013 expressed an unqualified opinion on those financial statements.
Rancho Cucamonga, California
March 12, 2013
Bridge Capital Holdings and Subsidiary
(dollars in thousands)
|
|
|
As of December 31, |
| ||||
|
|
|
2012 |
|
2011 |
| ||
|
Assets: |
|
|
|
|
| ||
|
Cash and due from banks |
|
$ |
17,251 |
|
$ |
17,135 |
|
|
Federal funds sold |
|
113,790 |
|
106,690 |
| ||
|
Total cash and equivalents |
|
131,041 |
|
123,825 |
| ||
|
|
|
|
|
|
| ||
|
Interest bearing deposits in other banks |
|
335 |
|
335 |
| ||
|
Investment securities |
|
267,204 |
|
240,268 |
| ||
|
Loans, net of allowance for credit losses of $19,948 at December 31, 2012 and $18,540 at December 31, 2011 |
|
885,575 |
|
740,696 |
| ||
|
Premises and equipment, net |
|
2,042 |
|
2,337 |
| ||
|
Other real estate owned |
|
144 |
|
4,126 |
| ||
|
Accrued interest receivable |
|
3,469 |
|
3,291 |
| ||
|
Other assets |
|
53,775 |
|
46,155 |
| ||
|
Total assets |
|
$ |
1,343,585 |
|
$ |
1,161,033 |
|
|
|
|
|
|
|
| ||
|
Liabilities and Shareholders’ Equity: |
|
|
|
|
| ||
|
Deposits: |
|
|
|
|
| ||
|
Demand noninterest-bearing |
|
$ |
723,517 |
|
$ |
660,036 |
|
|
Demand interest-bearing |
|
10,582 |
|
4,272 |
| ||
|
Money Market and savings |
|
380,949 |
|
298,145 |
| ||
|
Time |
|
47,500 |
|
36,222 |
| ||
|
Total deposits |
|
1,162,548 |
|
998,675 |
| ||
|
|
|
|
|
|
| ||
|
Junior subordinated debt securities |
|
17,527 |
|
17,527 |
| ||
|
Accrued interest payable |
|
11 |
|
9 |
| ||
|
Other liabilities |
|
16,752 |
|
15,309 |
| ||
|
Total liabilities |
|
1,196,838 |
|
1,031,520 |
| ||
|
|
|
|
|
|
| ||
|
Commitments and contingencies |
|
— |
|
— |
| ||
|
|
|
|
|
|
| ||
|
Shareholders’ Equity: |
|
|
|
|
| ||
|
Preferred stock, no par value; 10,000,000 shares authorized; no shares outstanding at December 31, 2012 and December 31, 2011 |
|
— |
|
— |
| ||
|
Common stock, no par value; 30,000,000 shares authorized; |
|
|
|
|
| ||
|
15,738,423 shares issued and outstanding at December 31, 2012; |
|
|
|
|
| ||
|
15,145,181 shares issued and outstanding at December 31, 2011; |
|
103,645 |
|
101,598 |
| ||
|
Additional paid in capital |
|
5,318 |
|
5,075 |
| ||
|
Retained earnings |
|
37,235 |
|
23,431 |
| ||
|
Accumulated other comprehensive income/(loss) |
|
549 |
|
(591 |
) | ||
|
Total shareholders’ equity |
|
146,747 |
|
129,513 |
| ||
|
Total liabilities and shareholders’ equity |
|
$ |
1,343,585 |
|
$ |
1,161,033 |
|
The accompanying notes are an integral part of the financial statements.
Bridge Capital Holdings and Subsidiary
Consolidated Statements of Operations
(dollars in thousands, except share data)
|
|
|
Year Ended December 31, |
| |||||||
|
|
|
2012 |
|
2011 |
|
2010 |
| |||
|
Interest Income: |
|
|
|
|
|
|
| |||
|
Loans |
|
$ |
56,122 |
|
$ |
45,352 |
|
$ |
42,071 |
|
|
Investment securities |
|
6,461 |
|
5,068 |
|
2,733 |
| |||
|
Federal funds sold |
|
203 |
|
255 |
|
263 |
| |||
|
Interest bearing deposits in other banks |
|
1 |
|
19 |
|
121 |
| |||
|
Total interest income |
|
62,787 |
|
50,694 |
|
45,188 |
| |||
|
|
|
|
|
|
|
|
| |||
|
Interest Expense: |
|
|
|
|
|
|
| |||
|
Deposits |
|
1,089 |
|
1,096 |
|
1,965 |
| |||
|
Other |
|
1,106 |
|
1,160 |
|
1,106 |
| |||
|
Total interest expense |
|
2,195 |
|
2,256 |
|
3,071 |
| |||
|
|
|
|
|
|
|
|
| |||
|
Net interest income |
|
60,592 |
|
48,438 |
|
42,117 |
| |||
|
Provision for credit losses |
|
3,950 |
|
2,600 |
|
4,700 |
| |||
|
Net interest income after provision for credit losses |
|
56,642 |
|
45,838 |
|
37,417 |
| |||
|
|
|
|
|
|
|
|
| |||
|
Non-Interest Income: |
|
|
|
|
|
|
| |||
|
Service charges on deposit accounts |
|
3,353 |
|
2,876 |
|
2,417 |
| |||
|
International fee income |
|
2,646 |
|
2,488 |
|
1,785 |
| |||
|
Gain on sale of SBA loans |
|
1,850 |
|
1,743 |
|
— |
| |||
|
Warrant Income |
|
1,422 |
|
392 |
|
36 |
| |||
|
Gain on sale - OREO |
|
1,056 |
|
421 |
|
1,011 |
| |||
|
SBA loan servicing fee income |
|
514 |
|
411 |
|
380 |
| |||
|
Gain on sale of securities |
|
323 |
|
438 |
|
165 |
| |||
|
Other non-interest income |
|
1,820 |
|
1,161 |
|
1,055 |
| |||
|
Total non-interest income |
|
12,984 |
|
9,930 |
|
6,849 |
| |||
|
|
|
|
|
|
|
|
| |||
|
Operating Expenses: |
|
|
|
|
|
|
| |||
|
Salaries and benefits |
|
30,308 |
|
24,606 |
|
21,292 |
| |||
|
Occupancy and equipment |
|
3,993 |
|
3,801 |
|
4,042 |
| |||
|
Data processing |
|
3,257 |
|
3,046 |
|
2,913 |
| |||
|
Marketing |
|
2,060 |
|
1,571 |
|
1,012 |
| |||
|
Director/Shareholder expenses |
|
1,277 |
|
1,158 |
|
1,273 |
| |||
|
Professional services |
|
1,206 |
|
2,667 |
|
2,106 |
| |||
|
Deposit services/supplies |
|
989 |
|
954 |
|
909 |
| |||
|
Assessments |
|
879 |
|
1,717 |
|
2,500 |
| |||
|
Loan Origination expense |
|
821 |
|
630 |
|
466 |
| |||
|
OREO expense |
|
134 |
|
1,140 |
|
1,975 |
| |||
|
Other |
|
1,288 |
|
1,134 |
|
1,232 |
| |||
|
Total operating expenses |
|
46,212 |
|
42,424 |
|
39,720 |
| |||
|
|
|
|
|
|
|
|
| |||
|
Income before income taxes |
|
23,414 |
|
13,344 |
|
4,546 |
| |||
|
Income taxes |
|
9,610 |
|
5,497 |
|
1,955 |
| |||
|
Net income |
|
$ |
13,804 |
|
$ |
7,847 |
|
$ |
2,591 |
|
|
|
|
|
|
|
|
|
| |||
|
Preferred dividends |
|
— |
|
200 |
|
1,955 |
| |||
|
Net income available to common shareholders |
|
$ |
13,804 |
|
$ |
7,647 |
|
$ |
636 |
|
|
|
|
|
|
|
|
|
| |||
|
Basic earnings per share |
|
$ |
0.96 |
|
$ |
0.54 |
|
$ |
0.06 |
|
|
Diluted earnings per share |
|
$ |
0.92 |
|
$ |
0.52 |
|
$ |
0.06 |
|
|
Average common shares outstanding |
|
14,385,629 |
|
14,247,853 |
|
9,820,755 |
| |||
|
Average common and equivalent shares outstanding |
|
14,927,837 |
|
14,642,260 |
|
10,234,535 |
| |||
The accompanying notes are an integral part of the financial statements.
BRIDGE CAPITAL HOLDINGS AND SUBSIDIARY
Consolidated Statement of Comprehensive Income
(dollars in thousands)
|
|
|
Year Ended December 31, |
| |||||||
|
|
|
2012 |
|
2011 |
|
2010 |
| |||
|
|
|
|
|
|
|
|
| |||
|
NET INCOME |
|
$ |
13,804 |
|
$ |
7,847 |
|
$ |
2,591 |
|
|
|
|
|
|
|
|
|
| |||
|
OTHER COMPREHENSIVE INCOME (LOSS): |
|
|
|
|
|
|
| |||
|
Unrealized gains on securities available-for-sale |
|
1,643 |
|
3,336 |
|
(859 |
) | |||
|
Reclassification adjustment for realized (gains) on securities |
|
(323 |
) |
(438 |
) |
(165 |
) | |||
|
Unrealized gains/(losses) on supplemental executive retirement plan |
|
250 |
|
176 |
|
(281 |
) | |||
|
Unrealized gains/(losses) on cash flow hedges |
|
352 |
|
(385 |
) |
(1,312 |
) | |||
|
Other comprehensive income (loss), before income taxes |
|
$ |
1,922 |
|
$ |
2,689 |
|
$ |
(2,617 |
) |
|
Income tax (expense) benefit |
|
(782 |
) |
(1,092 |
) |
1,046 |
| |||
|
Other comprehensive income (loss), net of tax |
|
$ |
1,140 |
|
$ |
1,597 |
|
$ |
(1,571 |
) |
|
|
|
|
|
|
|
|
| |||
|
COMPREHENSIVE INCOME |
|
$ |
14,944 |
|
$ |
9,444 |
|
$ |
1,020 |
|
The accompanying notes are an integral part of the financial statements.
Bridge Capital Holdings and Subsidiary
Consolidated Statement of Shareholders’ Equity
For the three Years Ended December 31, 2012
(dollars in thousands, except share data)
|
|
|
|
|
|
|
|
|
|
|
Accumulated |
|
Total |
| |||||
|
|
|
Common Stock and |
|
Preferred |
|
|
|
Other |
|
Share- |
| |||||||
|
|
|
Additional Paid in Capital |
|
Stock |
|
Retained |
|
Comprehensive |
|
holders’ |
| |||||||
|
|
|
Shares |
|
Amount |
|
Amount |
|
Earnings |
|
Income (loss) |
|
Equity |
| |||||
|
|
|
|
|
|
|
|
|
|
|
|
|
|
| |||||
|
Balance at December 31, 2009 |
|
7,098,164 |
|
$ |
40,919 |
|
$ |
53,864 |
|
$ |
15,148 |
|
$ |
(617 |
) |
$ |
109,314 |
|
|
|
|
|
|
|
|
|
|
|
|
|
|
|
| |||||
|
Restricted stock issued, net |
|
(2,040 |
) |
— |
|
— |
|
— |
|
— |
|
— |
| |||||
|
Stock options exercised and |
|
169,700 |
|
920 |
|
— |
|
— |
|
— |
|
920 |
| |||||
|
related tendered shares |
|
(67,869 |
) |
(550 |
) |
— |
|
— |
|
— |
|
(550 |
) | |||||
|
Common stock issued - conversion of preferred stock |
|
3,546,099 |
|
30,000 |
|
(30,000 |
) |
— |
|
— |
|
— |
| |||||
|
Common stock issued - dividends on preferred stock |
|
257,554 |
|
2,179 |
|
— |
|
— |
|
— |
|
2,179 |
| |||||
|
Common stock issued - private placement |
|
3,508,771 |
|
30,000 |
|
— |
|
— |
|
— |
|
30,000 |
| |||||
|
Stock issuance cost |
|
— |
|
(96 |
) |
— |
|
— |
|
— |
|
(96 |
) | |||||
|
Tax benefit from exercise/vesting of stock based awards |
|
— |
|
171 |
|
— |
|
— |
|
— |
|
171 |
| |||||
|
Cash dividends on preferred stock |
|
— |
|
— |
|
— |
|
(1,955 |
) |
— |
|
(1,955 |
) | |||||
|
Stock based compensation |
|
— |
|
1,300 |
|
— |
|
— |
|
— |
|
1,300 |
| |||||
|
Other comprehensive (loss) |
|
— |
|
— |
|
— |
|
— |
|
(1,571 |
) |
(1,571 |
) | |||||
|
Net income for the year |
|
— |
|
— |
|
— |
|
2,591 |
|
— |
|
2,591 |
| |||||
|
|
|
|
|
|
|
|
|
|
|
|
|
|
| |||||
|
Balance at December 31, 2010 |
|
14,510,379 |
|
$ |
104,843 |
|
$ |
23,864 |
|
$ |
15,784 |
|
$ |
(2,188 |
) |
$ |
142,303 |
|
|
|
|
|
|
|
|
|
|
|
|
|
|
|
| |||||
|
Restricted stock issued, net |
|
314,019 |
|
— |
|
— |
|
— |
|
— |
|
— |
| |||||
|
Stock options exercised and |
|
407,881 |
|
2,175 |
|
— |
|
— |
|
— |
|
2,175 |
| |||||
|
related tendered shares |
|
(80,353 |
) |
(716 |
) |
— |
|
— |
|
— |
|
(716 |
) | |||||
|
Redemption of preferred stock |
|
— |
|
— |
|
(23,864 |
) |
— |
|
— |
|
(23,864 |
) | |||||
|
Repurchase of TARP warrant |
|
— |
|
(1,395 |
) |
— |
|
— |
|
— |
|
(1,395 |
) | |||||
|
Restricted stock vesting - shares tendered for taxes |
|
(6,745 |
) |
(72 |
) |
— |
|
— |
|
— |
|
(72 |
) | |||||
|
Tax benefit from exercise/vesting of stock based awards |
|
— |
|
290 |
|
— |
|
— |
|
— |
|
290 |
| |||||
|
Cash dividends on preferred stock |
|
— |
|
— |
|
— |
|
(200 |
) |
— |
|
(200 |
) | |||||
|
Stock based compensation |
|
— |
|
1,548 |
|
— |
|
— |
|
— |
|
1,548 |
| |||||
|
Other comprehensive income |
|
— |
|
— |
|
— |
|
— |
|
1,597 |
|
1,597 |
| |||||
|
Net income for the year |
|
— |
|
— |
|
— |
|
7,847 |
|
— |
|
7,847 |
| |||||
|
|
|
|
|
|
|
|
|
|
|
|
|
|
| |||||
|
Balance at December 31, 2011 |
|
15,145,181 |
|
$ |
106,673 |
|
$ |
— |
|
$ |
23,431 |
|
$ |
(591 |
) |
$ |
129,513 |
|
|
|
|
|
|
|
|
|
|
|
|
|
|
|
| |||||
|
Restricted stock issued, net |
|
566,649 |
|
— |
|
— |
|
— |
|
— |
|
— |
| |||||
|
Stock options exercised and |
|
34,848 |
|
222 |
|
— |
|
— |
|
— |
|
222 |
| |||||
|
related tendered shares |
|
— |
|
— |
|
— |
|
— |
|
— |
|
— |
| |||||
|
Restricted stock vesting - shares tendered for taxes |
|
(8,255 |
) |
(125 |
) |
— |
|
— |
|
— |
|
(125 |
) | |||||
|
Tax benefit from exercise/vesting of stock based awards |
|
— |
|
33 |
|
— |
|
— |
|
— |
|
33 |
| |||||
|
Stock based compensation |
|
— |
|
2,160 |
|
— |
|
— |
|
— |
|
2,160 |
| |||||
|
Other comprehensive income |
|
— |
|
— |
|
— |
|
— |
|
1,140 |
|
1,140 |
| |||||
|
Net income for the year |
|
— |
|
— |
|
— |
|
13,804 |
|
— |
|
13,804 |
| |||||
|
|
|
|
|
|
|
|
|
|
|
|
|
|
| |||||
|
Balance at December 31, 2012 |
|
15,738,423 |
|
$ |
108,963 |
|
$ |
— |
|
$ |
37,235 |
|
$ |
549 |
|
$ |
146,747 |
|
The accompanying notes are an integral part of the financial statements.
Bridge Capital Holdings and Subsidiary
Consolidated Statements of Cash Flows
(dollars in thousands)
|
|
|
Year Ended December 31, |
| |||||||
|
|
|
2012 |
|
2011 |
|
2010 |
| |||
|
|
|
|
|
|
|
|
| |||
|
Cash Flows From Operating Activities: |
|
|
|
|
|
|
| |||
|
|
|
|
|
|
|
|
| |||
|
Net income |
|
$ |
13,804 |
|
$ |
7,847 |
|
$ |
2,591 |
|
|
Adjustments to reconcile net income to net cash provided by operating activities: |
|
|
|
|
|
|
| |||
|
Provision for credit losses |
|
3,950 |
|
2,600 |
|
4,700 |
| |||
|
Depreciation and amortization |
|
1,148 |
|
1,140 |
|
1,351 |
| |||
|
Net (gain) on sale of loans |
|
(1,850 |
) |
(1,743 |
) |
— |
| |||
|
Net (gain) on sale of other real estate owned |
|
(1,055 |
) |
(421 |
) |
(1,011 |
) | |||
|
Write down of other real estate owned |
|
39 |
|
— |
|
— |
| |||
|
Deferred income tax (credit) |
|
(2,108 |
) |
(4,452 |
) |
(167 |
) | |||
|
Stock based compensation |
|
2,160 |
|
1,548 |
|
1,300 |
| |||
|
Proceeds from loan sales |
|
39,191 |
|
26,601 |
|
145 |
| |||
|
Loans originated for sale |
|
(54,528 |
) |
(35,509 |
) |
(23,205 |
) | |||
|
Net (gain) on sale of securities |
|
(323 |
) |
(438 |
) |
(165 |
) | |||
|
Increase in accrued interest receivable and other assets |
|
(6,472 |
) |
(2,888 |
) |
(2,248 |
) | |||
|
Increase in accrued interest payable and other liabilities |
|
1,922 |
|
1,370 |
|
2,103 |
| |||
|
Net cash (used in) operating activities |
|
(4,122 |
) |
(4,345 |
) |
(14,606 |
) | |||
|
|
|
|
|
|
|
|
| |||
|
Cash Flows From Investing Activities: |
|
|
|
|
|
|
| |||
|
|
|
|
|
|
|
|
| |||
|
Proceeds from sale of securities available for sale |
|
22,743 |
|
43,383 |
|
21,471 |
| |||
|
Purchase of securities available for sale |
|
(109,479 |
) |
(184,165 |
) |
(222,406 |
) | |||
|
Proceeds from paydowns/maturities of securities available for sale |
|
61,442 |
|
121,155 |
|
88,802 |
| |||
|
Proceeds from sale of other real estate owned |
|
5,031 |
|
8,778 |
|
7,608 |
| |||
|
Proceeds from maturities of interest bearing deposits |
|
— |
|
2,204 |
|
7,441 |
| |||
|
Net (increase) decrease in loans |
|
(131,675 |
) |
(104,261 |
) |
(65,252 |
) | |||
|
Purchase of fixed assets |
|
(853 |
) |
(897 |
) |
(365 |
) | |||
|
Net cash used in investing activities |
|
(152,791 |
) |
(113,803 |
) |
(162,701 |
) | |||
|
|
|
|
|
|
|
|
| |||
|
Cash Flows From Financing Activities: |
|
|
|
|
|
|
| |||
|
|
|
|
|
|
|
|
| |||
|
Net increase in deposits |
|
163,873 |
|
150,729 |
|
142,900 |
| |||
|
Proceeds from issuance of common stock |
|
— |
|
1,459 |
|
30,370 |
| |||
|
Proceeds from sale of common stock |
|
256 |
|
— |
|
— |
| |||
|
Redemption of preferred stock |
|
— |
|
(23,864 |
) |
— |
| |||
|
Repurchase of TARP warrant |
|
— |
|
(1,395 |
) |
— |
| |||
|
Stock issuance cost |
|
— |
|
— |
|
(96 |
) | |||
|
Payment of cash dividends |
|
— |
|
(200 |
) |
(1,955 |
) | |||
|
Common stock issued - preferred dividends |
|
— |
|
— |
|
2,179 |
| |||
|
Increase (decrease) in other borrowings |
|
— |
|
(7,672 |
) |
7,672 |
| |||
|
Net cash provided by financing activities |
|
164,129 |
|
119,057 |
|
181,070 |
| |||
|
|
|
|
|
|
|
|
| |||
|
Net Increase in Cash and Equivalents: |
|
7,216 |
|
909 |
|
3,763 |
| |||
|
Cash and equivalents at beginning of period |
|
123,825 |
|
122,916 |
|
119,153 |
| |||
|
Cash and equivalents at end of period |
|
$ |
131,041 |
|
$ |
123,825 |
|
$ |
122,916 |
|
|
|
|
|
|
|
|
|
| |||
|
Other Cash Flow Information: |
|
|
|
|
|
|
| |||
|
Cash paid for interest |
|
$ |
2,196 |
|
$ |
2,089 |
|
$ |
1,825 |
|
|
Cash paid for income taxes |
|
$ |
10,920 |
|
$ |
4,074 |
|
$ |
3,207 |
|
|
Transfer of loans to OREO |
|
$ |
33 |
|
$ |
6,173 |
|
$ |
8,032 |
|
|
Conversion of preferred stock to common stock |
|
$ |
— |
|
$ |
— |
|
$ |
30,000 |
|
The accompanying notes are an integral part of the financial statements.
BRIDGE CAPITAL HOLDINGS
NOTES TO CONSOLIDATED FINANCIAL STATEMENTS
FOR THE YEARS ENDED DECEMBER 31, 2012, 2011 and 2010
1. SIGNIFICANT ACCOUNTING POLICIES
Business — Bridge Bank, N.A. commenced business in Santa Clara, California on May 14, 2001. Its main office is located at 55 Almaden Blvd, San Jose, California, 95113. The Bank conducts commercial and retail banking business, which includes accepting demand, savings and time deposits and making commercial, real estate and consumer loans. It also issues cashier’s checks, sells travelers checks and provides other customary banking services.
On October 1, 2004, the Bank announced completion of a bank holding company structure which was approved by shareholders at the Bank’s annual shareholders’ meeting held on May 20, 2004. The bank holding company, formed as a California corporation, is named Bridge Capital Holdings. Information in this report dated prior to September 30, 2004 is for Bridge Bank, N.A.
Bridge Capital Holdings (the “Company”) was formed for the purpose of serving as the holding company for Bridge Bank, N.A. and is supervised by the Board of Governors of the Federal Reserve System. Effective October 1, 2004, Bridge Capital Holdings acquired 100% of the voting shares of Bridge Bank, N.A.. As a result of the transaction, the former shareholders of Bridge Bank, N.A. received one share of common stock of Bridge Capital Holdings for every one share of common stock of Bridge Bank, N.A. owned.
Prior to the share exchange, the common stock of the Bank had been registered with the Office of Comptroller of the Currency. As a result of the share exchange, common stock of Bridge Capital Holdings is now registered with the Securities and Exchange Commission. Filings under the federal securities laws are made with the SEC rather than the Office of the Comptroller of the Currency and are available on the SEC’s website, http://www.sec.gov as well as on the Company’s website http://www.bridgebank.com.
Bridge Bank’s lending solutions include working capital lines of credit, structured finance (asset-based lending and factoring), 7(a) and 504 Small Business Administration (SBA) loans, commercial real estate loans, sustainable energy project financing, growth capital loans, equipment financing, letters of credit, and corporate credit cards. The bank’s depository and corporate banking services include cash and treasury management solutions, interest-bearing term deposit accounts, checking accounts, ACH payment and wire solutions, fraud protection, remote deposit capture through its Smart Deposit Express, courier services, and online banking. Additionally, Bridge Bank’s International Banking Division serves clients operating in the global marketplace through services including foreign exchange (FX payments and hedging), letters of credit, and import/export financing.
The Bank attracts the majority of its loan and deposit business from the numerous small and middle market companies located in the Silicon Valley, though with an increasingly larger portion of new business from its national loan production offices.
The Bank reserves the right to change its business plan at any time, and no assurance can be given that, if the Bank’s proposed business plan is followed, it will prove successful.
The Bank does not offer trust services, but it will attempt to make such services available to the Bank’s customers through correspondent institutions. The deposits of the Bank are insured by the Federal Deposit Insurance Corporation (the “FDIC”) up to applicable limits, and the Bank is a member of the Federal Reserve System.
Principles of Consolidation - The financial statements include the accounts of Bridge Capital Holdings and its subsidiary, Bridge Bank, N.A. (“the Bank”) collectively referred to herein as “the Company”.
Basis of Presentation — The accounting and reporting policies of Bridge Capital Holdings and Bridge Bank, N.A. conform to generally accepted accounting principles and prevailing practices within the banking industry.
Reclassifications - Certain reclassifications were made to prior years’ presentations to conform to the current year. These reclassifications had no effect on net income or earnings per share.
Use of Estimates - The preparation of financial statements in conformity with generally accepted accounting principles requires management to make estimates and assumptions that affect reported amounts of assets, liabilities, revenues and expenses, and disclosure of contingent assets and liabilities as of the dates and for the periods presented. A significant estimate included in the accompanying financial statements is the allowance for loan losses. Actual results could differ from those estimates.
Recent Accounting Pronouncements — During the current year, the Financial Accounting Standards Board (FASB) issued guidance regarding the following new accounting standards:
Financial Accounting Standards Board Accounting Standards Update (FASB ASU) 2011-03, Reconsideration of Effective Control for Repurchase Agreements (Topic 860), was issued April 2011. The guidance is intended to improve financial reporting of repurchase agreements and other agreements that both entitle and obligate a transferor to repurchase or redeem financial assets before their maturity. ASU 2011-03 removes from the assessment of effective control (i) the criterion requiring the transferor to have the ability to repurchase or redeem the financial assets on substantially the agreed terms, even in the event of default by the transferee, and (ii) the collateral maintenance guidance related to that criterion. This guidance is effective for the first interim or annual period beginning on or after December 15, 2011 and did not have a significant impact on the Company’s financial statements.
FASB ASU 2011-04, Amendments to Achieve Common Fair Value Measurements and Disclosure Requirements in U.S. GAAP and IFRSs (Topic 820), was issued May 2011. The guidance is intended to converge the fair value measurement guidance in U.S. generally accepted accounting principles and International Financial Reporting Standards. ASU 2011-04 clarifies the application of existing fair value measurement requirements, changes certain principles in Topic 820 and requires additional fair value disclosures. This guidance is effective for the first interim or annual period beginning on or after December 15, 2011, and did not have a significant impact on the Company’s financial statements.
FASB ASU 2011-05, Presentation of Comprehensive Income (Topic 220), was issued September 2011. The guidance requires that all non-owner changes in stockholders’ equity be presented in either a single continuous statement of comprehensive income or in two separate but consecutive statements. Additionally, ASU 2011-05 requires entities to present, on the face of the financial statements, reclassification adjustments for items that are reclassified from other comprehensive income to net income in the statement or statements where the components of net income and the components of other comprehensive income are presented. The option to present components of other comprehensive income as part of the statement of changes in stockholders’ equity was eliminated. FASB ASU 2011-12 deferred the implementation date of part of this ASU.
FASB ASU 2011-12, Deferral of the Effective Date for Amendments to the Presentation of Reclassifications of Items out of Accumulated Other Comprehensive Income in Accounting Standards Update No. 2011-05 (Topic 220), which defers the requirement within ASU No. 2011-05 to present the reclassification amounts from other comprehensive income to net income as a separate component on the income statement. The FASB has not yet established a new effective date for these provisions. The remaining requirements of the ASU No. 2011-05 were not deferred and were effective for the first interim or annual period beginning on or after December 15, 2011 and did not have a material impact on the Company’s financial statements.
Fair Value Measurement - Fair value is the exchange price that would be received for an asset or paid to transfer a liability (an exit price) in the principal or most advantageous market for the asset or liability in an orderly transaction between market participants on the measurement date. Current accounting guidance establishes a fair value hierarchy, which requires an entity to maximize the use of observable inputs and minimize the use of unobservable inputs when measuring fair value. See Note 13 to the financial statements for more information and disclosures relating to the Company’s fair value measurements.
Earnings Per Share - Basic earnings per share is computed by dividing net income applicable to common shareholders by the weighted average number of common shares outstanding during the period. Diluted earnings per share is determined using the weighted average number of common shares outstanding during the period, adjusted for the dilutive effect of common stock equivalents, consisting of shares that might be issued upon exercise of common stock options or warrants and vesting of restricted stock. Common stock equivalents are included in the diluted earnings per share calculation to the extent these shares are dilutive. See Note 2 to the financial statements for additional information on earnings per share.
Cash Equivalents — For purposes of reporting cash flows, cash and cash equivalents include cash on hand, amounts due from banks, Federal Funds sold and highly liquid debt instruments purchased with an original maturity of three
months or less. The Company is required to maintain non-interest earning cash reserves against certain of the deposit accounts. As of December 31, 2012, aggregate reserves (in the form of deposits with the Federal Reserve Bank) of $145,000 were maintained.
Securities - The Company classifies its investment securities into two categories, available for sale and held to maturity, at the time of purchase. Securities available for sale are reported at fair value with unrealized holding gains and/or losses, net of tax, recorded as a separate component of shareholders’ equity. Securities held to maturity are measured at amortized cost based on the Company’s positive intent and ability to hold the securities to maturity.
Premiums and discounts are amortized or accreted over the life of the related security as an adjustment to yield using the effective interest method. Dividend and interest income is recognized when earned. Gains and losses on sales of securities are computed on a specific identification basis.
Management evaluates securities for other-than-temporary impairment (“OTTI”) on at least a quarterly basis, and more frequently when economic or market conditions warrant such an evaluation. For securities in an unrealized loss position, management considers the extent and duration of the unrealized loss, and the financial condition and near-term prospects of the issuer. Management also assesses whether it intends to sell, or it is more likely than not that it will be required to sell, a security in an unrealized loss position before recovery of its amortized cost basis. If either of the criteria regarding intent or requirement to sell is met, the entire difference between amortized cost and fair value is recognized as impairment through earnings. For debt securities that do not meet the aforementioned criteria, the amount of impairment is split into two components as follows: OTTI related to credit loss, which must be recognized in the income statement and; OTTI related to other factors, which is recognized in other comprehensive income. The credit loss is defined as the difference between the present value of the cash flows expected to be collected and the amortized cost basis. For equity securities, the entire amount of impairment is recognized through earnings.
Loans - Loans are stated at the principal amount outstanding less the allowance for loan losses and net deferred loan fees. Interest on loans is credited to income as earned. Loans are generally placed on nonaccrual status and any accrued and unpaid interest is reversed when the payment of principal or interest is 90 days past due unless the loan is both well secured and in the process of collection. Interest accruals are resumed on such loans only when they are brought current with respect to interest and principal and when, in the judgment of management, the loans are estimated to be fully collectible as to both principal and interest.
Loan origination fees and costs are deferred and amortized to income at the instrument level using the effective interest method based on the contractual lives adjusted for prepayments.
Loans Held For Sale — The company has the ability and the intent to sell all or a portion of certain Small Business Administration (“SBA”) loans in the loan portfolio and, as such, carries the saleable portion of these loans at the lower of aggregate cost of fair value. At December 31, 2012 and December 31, 2011, the fair value of SBA loans exceeded aggregate cost and therefore, SBA loans were carried at aggregate cost.
In calculating gains on the sale of SBA loans, the Company performs an allocation based on the relative fair values of the sold portion and retained portion of the loan. The Company’s assumptions are validated by reference to the external market information.
Servicing Rights - Servicing rights are recognized separately when they are acquired through sales of loans. The Company has adopted guidance issued by the FASB that clarifies the accounting for servicing rights. Servicing rights are initially recorded at fair value with the income statement effect recorded in gain on sale of loans. Fair value is based on a valuation model that calculates the present value of estimated future cash flows from the servicing assets. The valuation model uses assumptions that market participants would use in estimating cash flows from servicing assets, such as the cost to service, discount rates and prepayment speeds. The Company compares the valuation model inputs and results to published industry data in order to validate the model results and assumptions. All classes of servicing assets are subsequently measured using the amortization method which requires servicing rights to be amortized into non-interest income in proportion to, and over the period of, the estimated future net servicing income of the underlying loans.
Servicing assets are evaluated for impairment based upon the fair value of the rights as compared to the carrying amount. Impairment is determined by stratifying rights into groupings based on predominant risk characteristics, such as interest rate, loan type and investor type. For purposes of measuring impairment, the Company has identified each servicing asset with the underlying loan being serviced. A valuation allowance is recorded where the fair value is below the carrying amount of the asset. If the Company later determines that all or a portion of the impairment no longer exists for a particular grouping, a reduction of the allowance may be recorded as an increase to income. The fair values of servicing rights are subject to significant fluctuations as a result of changes in estimated and actual
prepayment speeds and changes in the discount rates.
Servicing fee income which is reported on the income statement as servicing income is recorded for fees earned for servicing loans. The fees are based on a contractual percentage of the outstanding principal and recorded as income when earned. The amortization of servicing rights and changes in the valuation allowance are netted against loan servicing income.
As of December 31, 2012 and December 31, 2011, the amount of loans serviced for others was $91.5 million and $76.4 million, respectively.
Allowance for Loan losses - The allowance for loan losses is a valuation allowance for probable incurred loan losses. Loan losses are charged against the allowance when management believes the uncollectibility of a loan balance is confirmed. Subsequent recoveries, if any, are credited to the allowance. Management estimates the allowance balance required using past loan loss experience, the nature and volume of the portfolio, information about specific borrower situations and estimated collateral values, economic conditions, and other factors. Allocations of the allowance may be made for specific loans, but the entire allowance is available for any loan that, in management’s judgment, should be charged off.
The allowance generally consists of specific and general reserves. Specific reserves generally relate to loans that are individually classified as impaired, but may also relate to loans that in management’s opinion exhibit negative credit characteristics or trends suggesting potential future loss exposure greater than historical loss experience would suggest. It is currently the Bank’s practice to immediately charge-off any identified financial loss pertaining to impaired loans when management believes the uncollectibility of the loan is confirmed, therefore specific reserves are uncommon. A loan is impaired when, based on current information and events, it is probable that the Bank will be unable to collect all amounts due according to the contractual terms of the loan agreement. Loans, for which the terms have been modified resulting in a concession, and for which the borrower is experiencing financial difficulties, are generally considered troubled debt restructurings and classified as impaired.
Commercial and real estate loans are individually evaluated for impairment. Generally Accepted Accounting Principles specify that if a loan is impaired, a portion of the allowance is allocated so that the loan is reported, net, at the present value of estimated future cash flows using the loan’s existing rate or at the fair value of collateral if repayment is expected solely from the collateral. Large groups of smaller balance homogeneous loans, such as consumer and residential real estate loans, are collectively evaluated for impairment, and accordingly, they are not separately identified for impairment disclosures. However, it is currently the Bank’s practice to immediately charge-off any identified financial loss pertaining to impaired loans when management believes the uncollectibility of the loans has been confirmed.
Substandard loans are individually evaluated for impairment. Generally Accepted Accounting Principles specify that if a loan is impaired, a portion of the allowance is allocated so that the loan is reported, net, at the present value of estimated future cash flows using an appropriate discount rate or at the fair value of collateral if repayment is expected solely from the collateral. Large groups of smaller balance homogeneous loans, such as consumer and residential real estate loans, are collectively evaluated for impairment, and accordingly, they are not separately identified for impairment disclosures. See Note 4 to the financial statements for additional information on substandard loans.
Troubled debt restructurings are separately identified for impairment disclosures and are measured at the present value of estimated future cash flows using an appropriate discount rate at inception. If a troubled debt restructuring is considered to be a collateral dependent loan, the loan is reported, net, at the fair value of the collateral. For troubled debt restructurings that subsequently default, the Bank determines the amount of reserve in accordance with the accounting policy for the allowance for loan losses. See Note 4 to the financial statements for additional information on troubled debt restructurings.
General reserves cover non-impaired loans and are based on historical loss rates for each portfolio segment, adjusted for the effects of qualitative or environmental factors that are likely to cause estimated loan losses as of the evaluation date to differ from the portfolio segment’s historical loss experience. Qualitative factors include consideration of the following: changes in lending policies and procedures; changes in economic conditions, changes in the nature and volume of the portfolio; changes in the experience, ability and depth of lending management and other relevant staff; changes in the volume and severity of past due, nonaccrual and other adversely graded loans; changes in the loan review system; changes in the value of the underlying collateral for collateral-dependent loans; concentrations of credit and the effect of other external factors such as competition and legal and regulatory requirements.
Portfolio segments identified by the Bank include commercial, real estate construction, land, real estate other, factoring and asset-based lending, SBA, and consumer loans. Relevant risk characteristics for these portfolio segments generally include debt service coverage, loan-to-value ratios and financial performance on non-consumer loans and credit scores, debt-to income, collateral type and loan-to-value ratios for consumer loans.
Premises and Equipment - Premises and equipment are stated at cost less accumulated depreciation and amortization. Depreciation and amortization are computed on a straight-line basis over the shorter of the lease term or the estimated useful lives of the assets, which are generally three years for computer equipment, three to five years for furniture, fixtures and equipment and five to ten years for leasehold improvements.
Other Real Estate Owned - Other real estate owned (“OREO”) consist of properties acquired through foreclosure. The Company values these properties at fair value less estimated costs to sell at the time it acquires them, which establishes the new cost basis. The Company charges against the allowance for loan losses any losses arising at the time of acquisition of such properties. After it acquires them, the Company carries such properties at the lower of cost or fair value less estimated selling costs. If the Company records any write-downs or losses from disposition of such properties after acquiring them, it includes this amount in other non-interest expense. Development and improvement costs relating to OREO are capitalized (assuming they are recoverable). At December 31, 2012 there were two land development properties valued at $117,000 and one SBA real estate property valued at $27,000 owned by the Bank that were acquired through the foreclosure process. At December 31, 2011 there were two construction properties valued at $3.5 million, one other real estate property valued at $350,000, and four land development properties valued at $308,000 owned by the Bank that were acquired through the foreclosure process.
Income Taxes - Deferred income taxes are computed using the asset and liability method, which recognizes a liability or asset representing the tax effects, based on current tax law, of future deductible or taxable amounts attributable to events that have been recognized in the financial statements. A valuation allowance is established to reduce the deferred tax asset to the level at which it is “more likely than not” that the tax asset or benefits will be realized. Realization of tax benefits of deductible temporary differences and operating loss carry-forwards depends on having sufficient taxable income of an appropriate character within the carry-forward periods.
The Company has adopted guidance issued by the FASB that clarifies the accounting for uncertainty in tax positions taken or expected to be taken on a tax return and provides that the tax effects from an uncertain tax position can be recognized in the financial statements only if, based on its merits, the position is more likely than not to be sustained on audit by the taxing authorities. Interest and penalties related to uncertain tax positions are recorded as part of income tax expense.
Stock-Based Compensation — The Company has adopted guidance issued by the FASB that clarifies the accounting for stock-based payment transactions in which an enterprise receives employee services in exchange for (a) equity instruments of the enterprise or (b) liabilities that are based on the fair value of the enterprise’s equity instruments or that may be settled by the issuance of such equity instruments. The Company uses the Black-Scholes-Merton (“BSM”) option-pricing model to determine the fair-value of stock-based awards. The Company has recorded an incremental $2.2 million ($1.4 million net of tax), $1.5 million ($1.0 million net of tax), and $1.3 million ($882,000 net of tax) of stock-based compensation expense during the years ended December 31, 2012, 2011, and 2010, respectively as a result of the adoption of the guidance issued by the FASB.
No stock-based compensation costs were capitalized as part of the cost of an asset as of December 31, 2012. As of December 31, 2012, $11.5 million of total unrecognized compensation cost related to stock options and restricted stock units are expected to be recognized over a weighted-average period of 3.8 years.
Stock-based compensation expense reduced basic earnings per share by $0.10, $0.07, and $0.09 and diluted earnings per share by $0.03, $0.04, and $0.08 for the years ended December 31, 2012, 2011, and 2010, respectively.
Comprehensive Income — The Company has adopted accounting guidance issued by the FASB that requires all items recognized under accounting standards as components of comprehensive earnings be reported in an annual financial statement that is displayed with the same prominence as other annual financial statements. The guidance also requires that an entity classify items of other comprehensive earnings by their nature in an annual financial statement. Other comprehensive earnings include an adjustment to fully recognize the liability associated with the supplemental executive retirement plan, unrealized gains and losses, net of tax, on cash flow hedges, and unrealized gains and losses, net of tax, on marketable securities classified as available-for-sale. The Company had an accumulated other comprehensive income totaling $549,000, net of tax, at December 31, 2012, an accumulated other comprehensive loss totaling $(591,000), net of tax, at December 31, 2011 and an accumulated other comprehensive loss of $(2.2) million, net of tax, at December 31, 2010.
Segments of an Enterprise and Related Information — The Company has adopted guidance issued by the FASB that requires certain information about the operating segments of the Company. The objective of requiring disclosures
about segments of an enterprise and related information is to provide information about the different types of business activities in which an enterprise engages and the different economic environment in which it operates to help users of financial statements better understand its performance, better assess its prospects for future cash flows and make more informed judgments about the enterprise as a whole. The Company has determined that it has one segment, general commercial banking, and therefore it is appropriate to aggregate the Company’s operations into a single operating segment.
Derivative Instruments and Hedging Activities — The Company has adopted guidance issued by the FASB that clarifies the disclosure requirements for derivative instruments and hedging activities with the intent to provide users of financial statements with an enhanced understanding of: (a) how and why an entity uses derivative instruments, (b) how derivative instruments and related hedged items are accounted for, and (c) how derivative instruments and related hedged items affect an entity’s financial position, financial performance, and cash flows. The guidance requires qualitative disclosures about objectives and strategies for using derivatives, quantitative disclosures about the fair value of and gains and losses on derivative instruments, and disclosures about credit-risk-related contingent features in derivative instruments.
As required by the guidance, the Company records all derivatives on the balance sheet at fair value. The accounting for changes in the fair value of derivatives depends on the intended use of the derivative, whether the Company has elected to designate a derivative in a hedging relationship and apply hedge accounting and whether the hedging relationship has satisfied the criteria necessary to apply hedge accounting. Derivatives designated and qualified as a hedge of the exposure to changes in the fair value of an asset, liability, or firm commitment attributable to a particular risk, such as interest rate risk, are considered fair value hedges. Derivatives designated and that qualify as a hedge of the exposure to variability in expected future cash flows, or other types of forecasted transactions, are considered cash flow hedges. Hedge accounting generally provides for the matching of the timing of gain or loss recognition on the hedging instrument with the recognition of the changes in the fair value of the hedged asset or liability that are attributable to the hedged risk in a fair value hedge or the earnings effect of the hedged forecasted transactions in a cash flow hedge. The Company may enter into derivative contracts that are intended to economically hedge certain of its risks, even though hedge accounting does not apply or the Company elects not to apply hedge accounting under current accounting guidance. See Note 14 to the financial statements for additional information on derivative instruments and hedging activities.
2. EARNINGS PER SHARE
Basic earnings per share is computed by dividing net income applicable to common shareholders by the weighted average number of common shares outstanding during the period. Diluted earnings per share is determined using the weighted average number of common shares outstanding during the period, adjusted for the dilutive effect of common stock equivalents, consisting of shares that might be issued upon exercise of common stock options or warrants and vesting of restricted stock. Common stock equivalents are included in the diluted earnings per share calculation to the extent these shares are dilutive. A reconciliation of the numerator and denominator used in the calculation of basic and diluted earnings per share available to common shareholders is as follows (in thousands, except for per share amounts):
|
|
|
Year ended December 31, |
| |||||||
|
(dollars in thousands, except share data) |
|
2012 |
|
2011 |
|
2010 |
| |||
|
|
|
|
|
|
|
|
| |||
|
Net income |
|
$ |
13,804 |
|
$ |
7,847 |
|
$ |
2,591 |
|
|
Less: |
|
|
|
|
|
|
| |||
|
Dividends on preferred shares |
|
— |
|
(200 |
) |
(1,955 |
) | |||
|
Net income available to common shareholders |
|
$ |
13,804 |
|
$ |
7,647 |
|
$ |
636 |
|
|
|
|
|
|
|
|
|
| |||
|
Weighted average shares used in computing: |
|
|
|
|
|
|
| |||
|
Basic common shares |
|
14,385,629 |
|
14,247,853 |
|
9,820,755 |
| |||
|
Dilutive potential common shares related to stock options, restricted stock, warrants, and preferred shares using the treasury stock method |
|
542,208 |
|
394,407 |
|
413,780 |
| |||
|
Total average common shares and equivalents |
|
14,927,837 |
|
14,642,260 |
|
10,234,535 |
| |||
|
|
|
|
|
|
|
|
| |||
|
Basic earnings (loss) per share |
|
$ |
0.96 |
|
$ |
0.54 |
|
$ |
0.06 |
|
|
Diluted earnings (loss) per share |
|
$ |
0.92 |
|
$ |
0.52 |
|
$ |
0.06 |
|
There were 302,679 options to acquire common stock (including those issuable pursuant to contingent stock agreements) and 502,651 shares of issued and outstanding restricted common stock that could potentially dilute basic earnings per share in the future that were not included in the computation of diluted earnings per share because to do so would have been anti-dilutive for year ended December 31, 2012.
3. SECURITIES
As of December 31, 2012 and December 31, 2011, the Company had securities available for sale of $252.0 million and $224.0 million, respectively, and securities held to maturity of $15.2 million and $16.3 million, respectively. The securities classified as held to maturity were being held for purposes of the Community Reinvestment Act.
The amortized cost and estimated fair values of securities as of December 31, 2012 and December 31, 2011 are reflected in the following table.
|
|
|
As of December 31, 2012 |
| ||||||||||
|
|
|
Amortized |
|
Gross Unrealized |
|
Fair |
| ||||||
|
(dollars in thousands) |
|
Cost |
|
Gains |
|
Losses |
|
Value |
| ||||
|
|
|
|
|
|
|
|
|
|
| ||||
|
Securities available for sale |
|
|
|
|
|
|
|
|
| ||||
|
Debt securities: |
|
|
|
|
|
|
|
|
| ||||
|
U.S. government agency securities |
|
$ |
12,976 |
|
$ |
141 |
|
$ |
(5 |
) |
$ |
13,112 |
|
|
Mortgage backed securities |
|
208,058 |
|
3,136 |
|
(274 |
) |
210,919 |
| ||||
|
Corporate Bonds |
|
25,559 |
|
127 |
|
(12 |
) |
25,674 |
| ||||
|
Municipal Bonds |
|
2,436 |
|
— |
|
(174 |
) |
2,262 |
| ||||
|
Total debt securities |
|
249,029 |
|
3,404 |
|
(465 |
) |
251,967 |
| ||||
|
|
|
|
|
|
|
|
|
|
| ||||
|
Total securities available for sale |
|
$ |
249,029 |
|
$ |
3,404 |
|
$ |
(465 |
) |
$ |
251,967 |
|
|
|
|
|
|
|
|
|
|
|
| ||||
|
Securities held to maturity |
|
|
|
|
|
|
|
|
| ||||
|
Debt securities: |
|
|
|
|
|
|
|
|
| ||||
|
Mortgage backed securities |
|
$ |
15,237 |
|
$ |
369 |
|
$ |
— |
|
$ |
15,606 |
|
|
Total debt securities |
|
15,237 |
|
369 |
|
— |
|
15,606 |
| ||||
|
|
|
|
|
|
|
|
|
|
| ||||
|
Total securities held to maturity |
|
$ |
15,237 |
|
$ |
369 |
|
$ |
— |
|
$ |
15,606 |
|
|
|
|
|
|
|
|
|
|
|
| ||||
|
Total investment securities |
|
$ |
264,266 |
|
$ |
3,773 |
|
$ |
(465 |
) |
$ |
267,573 |
|
|
|
|
As of December 31, 2011 |
| ||||||||||
|
|
|
Amortized |
|
Gross Unrealized |
|
Fair |
| ||||||
|
(dollars in thousands) |
|
Cost |
|
Gains |
|
Losses |
|
Value |
| ||||
|
|
|
|
|
|
|
|
|
|
| ||||
|
Securities available for sale |
|
|
|
|
|
|
|
|
| ||||
|
Debt securities: |
|
|
|
|
|
|
|
|
| ||||
|
U.S. government agency securities |
|
$ |
14,873 |
|
$ |
141 |
|
$ |
— |
|
$ |
15,014 |
|
|
Mortgage backed securities |
|
181,226 |
|
1,972 |
|
(59 |
) |
183,138 |
| ||||
|
Corporate Bonds |
|
26,294 |
|
56 |
|
(491 |
) |
25,859 |
| ||||
|
Municipal Bonds |
|
— |
|
— |
|
— |
|
— |
| ||||
|
Total debt securities |
|
222,393 |
|
2,169 |
|
(550 |
) |
224,011 |
| ||||
|
|
|
|
|
|
|
|
|
|
| ||||
|
Total securities available for sale |
|
$ |
222,393 |
|
$ |
2,169 |
|
$ |
(550 |
) |
$ |
224,011 |
|
|
|
|
|
|
|
|
|
|
|
| ||||
|
Securities held to maturity |
|
|
|
|
|
|
|
|
| ||||
|
Debt securities: |
|
|
|
|
|
|
|
|
| ||||
|
Mortgage backed securities |
|
$ |
16,256 |
|
$ |
348 |
|
$ |
— |
|
$ |
16,604 |
|
|
Total debt securities |
|
16,256 |
|
348 |
|
— |
|
16,604 |
| ||||
|
|
|
|
|
|
|
|
|
|
| ||||
|
Total securities held to maturity |
|
$ |
16,256 |
|
$ |
348 |
|
$ |
— |
|
$ |
16,604 |
|
|
|
|
|
|
|
|
|
|
|
| ||||
|
Total investment securities |
|
$ |
238,649 |
|
$ |
2,517 |
|
$ |
(550 |
) |
$ |
240,615 |
|
The scheduled maturities of investment securities available for sale at December 31, 2012 were as follows:
|
|
|
December 31, 2012 |
| ||||
|
|
|
Amortized |
|
Fair |
| ||
|
(dollars in thousands) |
|
Cost |
|
Value |
| ||
|
|
|
|
|
|
| ||
|
Due in one year or less |
|
$ |
17,100 |
|
$ |
17,604 |
|
|
Due after one year through five years |
|
50,109 |
|
51,757 |
| ||
|
Due after five years through ten years |
|
70,662 |
|
71,307 |
| ||
|
Due after ten years |
|
111,158 |
|
111,299 |
| ||
|
Total securities available for sale |
|
249,029 |
|
251,967 |
| ||
|
|
|
|
|
|
| ||
|
Due in one year or less |
|
$ |
— |
|
$ |
— |
|
|
Due after one year through five years |
|
7,395 |
|
7,478 |
| ||
|
Due after five years through ten years |
|
— |
|
— |
| ||
|
Due after ten years |
|
7,842 |
|
8,128 |
| ||
|
Total securities held to maturity |
|
15,237 |
|
15,606 |
| ||
|
|
|
|
|
|
| ||
|
Total investment securities |
|
$ |
264,266 |
|
$ |
267,573 |
|
|
|
|
December 31, 2011 |
| ||||
|
|
|
Amortized |
|
Fair |
| ||
|
(dollars in thousands) |
|
Cost |
|
Value |
| ||
|
|
|
|
|
|
| ||
|
Due in one year or less |
|
$ |
7,127 |
|
$ |
7,184 |
|
|
Due after one year through five years |
|
63,412 |
|
64,228 |
| ||
|
Due after five years through ten years |
|
43,670 |
|
44,026 |
| ||
|
Due after ten years |
|
108,184 |
|
108,573 |
| ||
|
Total securities available for sale |
|
222,393 |
|
224,011 |
| ||
|
|
|
|
|
|
| ||
|
Due in one year or less |
|
$ |
— |
|
$ |
— |
|
|
Due after one year through five years |
|
7,733 |
|
7,797 |
| ||
|
Due after five years through ten years |
|
— |
|
— |
| ||
|
Due after ten years |
|
8,523 |
|
8,806 |
| ||
|
Total securities held to maturity |
|
16,256 |
|
16,604 |
| ||
|
|
|
|
|
|
| ||
|
Total investment securities |
|
$ |
238,649 |
|
$ |
240,615 |
|
As of December 31, 2012 and December 31, 2011, no investment securities were pledged as collateral. As of December 31, 2012, $332,000 in unrealized losses was attributable to 14 securities that had been in an unrealized loss position for less than 12 months. As of December 31, 2011, $530,000 million in unrealized losses was attributable to 20 securities that had been in an unrealized loss position for less than 12 months. Because the Bank had the ability to hold these investments until a recovery in fair value, which may be maturity, these investments were not considered to be other-than-temporarily impaired as of December 31, 2012 and December 31, 2011, respectively.
As of December 31, 2012, $133,000 in unrealized losses was attributable to twelve securities that had been in an unrealized loss position for greater than 12 months. As of December 31, 2011, $20,000 in unrealized losses was attributable to three securities that had been in an unrealized loss position for greater than 12 months. These unrealized losses, which had been in an unrealized loss position for one year or longer as of December 31, 2012 and December 31, 2011, were caused by market interest rate increases subsequent to the purchase of the securities. Because the Company had the ability to hold these investments until a recovery in fair value, which may be maturity, these investments was not considered to be other-than-temporarily impaired as of December 31, 2012 and December 31, 2011, respectively.
4. LOANS AND ALLOWANCES FOR LOAN LOSSES
The following summarizes the characteristics of the loan portfolio for the years ended December 31, 2012 and 2011:
|
|
|
As of December 31, |
| ||||
|
(dollars in thousands) |
|
2012 |
|
2011 |
| ||
|
|
|
|
|
|
| ||
|
Commercial |
|
$ |
436,293 |
|
$ |
330,348 |
|
|
Real estate construction |
|
35,501 |
|
47,213 |
| ||
|
Land loans |
|
8,973 |
|
6,772 |
| ||
|
Real estate other |
|
139,931 |
|
157,446 |
| ||
|
Factoring and asset based |
|
195,343 |
|
142,482 |
| ||
|
SBA |
|
87,375 |
|
73,336 |
| ||
|
Other |
|
5,163 |
|
4,431 |
| ||
|
Total gross loans |
|
908,579 |
|
762,028 |
| ||
|
Unearned fee income |
|
(3,056 |
) |
(2,792 |
) | ||
|
Total loan portfolio |
|
905,523 |
|
759,236 |
| ||
|
Less allowance for credit losses |
|
(19,948 |
) |
(18,540 |
) | ||
|
Total loan portfolio, net |
|
$ |
885,575 |
|
$ |
740,696 |
|
The Bank individually categorizes larger, non-homogenous loans into credit risk categories based on relevant information about the ability of borrowers to service their debt such as current financial information, historical payment experience, collateral adequacy, credit documentation, and current economic trends, among other factors. This analysis is performed on an ongoing basis as new information is obtained. The Bank uses the following definitions for loan risk ratings:
Pass — Loans classified as pass include larger non-homogenous loans not meeting the risk rating definitions below and smaller, homogeneous loans not assessed on an individual basis.
Special Mention — Loans classified as special mention have a potential weakness that deserves management’s close attention. If left uncorrected, these potential weaknesses may result in deterioration of the repayment prospects for the loan or of the institution’s credit position at some future date.
Substandard — Loans classified as substandard are inadequately protected by the current net worth and paying capacity of the obligor or of the collateral pledged, if any. Loans so classified have a well-defined weakness or weaknesses that jeopardize the liquidation of the debt by the borrower. They are characterized by the distinct possibility that the institution will sustain some loss if the deficiencies are not corrected. Substandard loans for which payments have ceased and are 90 days or more past due, or for which the likelihood of full collection of interest and principal is doubtful, are placed on nonaccrual. Loans that have been placed on nonaccrual status are also considered impaired.
The following table summarizes the credit quality of the loan portfolio, based upon internally assigned risk ratings, as of December 31, 2012 and December 31, 2011:
|
|
|
|
|
|
|
|
|
|
|
|
| |||||
|
|
|
As of December 31, 2012 |
| |||||||||||||
|
|
|
|
|
Special |
|
|
|
Substandard |
|
|
| |||||
|
(dollars in thousands) |
|
Pass |
|
Mention |
|
Substandard |
|
(Nonaccrual) |
|
Total |
| |||||
|
|
|
|
|
|
|
|
|
|
|
|
| |||||
|
Commercial |
|
$ |
429,754 |
|
$ |
4,877 |
|
$ |
986 |
|
$ |
676 |
|
$ |
436,293 |
|
|
Real estate construction |
|
35,501 |
|
— |
|
— |
|
— |
|
35,501 |
| |||||
|
Land loans |
|
8,722 |
|
— |
|
240 |
|
11 |
|
8,973 |
| |||||
|
Real estate other |
|
106,519 |
|
1,410 |
|
26,219 |
|
5,783 |
|
139,931 |
| |||||
|
Factoring and asset based |
|
192,798 |
|
803 |
|
292 |
|
1,450 |
|
195,343 |
| |||||
|
SBA |
|
77,028 |
|
437 |
|
7,863 |
|
2,047 |
|
87,375 |
| |||||
|
Other |
|
5,163 |
|
— |
|
— |
|
— |
|
5,163 |
| |||||
|
Total gross loans |
|
$ |
855,485 |
|
$ |
7,527 |
|
$ |
35,600 |
|
$ |
9,967 |
|
$ |
908,579 |
|
|
|
|
|
|
|
|
|
|
|
|
|
| |||||
|
|
|
As of December 31, 2011 |
| |||||||||||||
|
|
|
|
|
Special |
|
|
|
Substandard |
|
|
| |||||
|
(dollars in thousands) |
|
Pass |
|
Mention |
|
Substandard |
|
(Nonaccrual) |
|
Total |
| |||||
|
|
|
|
|
|
|
|
|
|
|
|
| |||||
|
Commercial |
|
$ |
317,923 |
|
$ |
991 |
|
$ |
10,636 |
|
$ |
798 |
|
$ |
330,348 |
|
|
Real estate construction |
|
45,283 |
|
— |
|
1,930 |
|
— |
|
47,213 |
| |||||
|
Land loans |
|
5,056 |
|
— |
|
1,176 |
|
540 |
|
6,772 |
| |||||
|
Real estate other |
|
117,318 |
|
7,746 |
|
26,198 |
|
6,184 |
|
157,446 |
| |||||
|
Factoring and asset based |
|
140,274 |
|
— |
|
— |
|
2,208 |
|
142,482 |
| |||||
|
SBA |
|
59,605 |
|
2,834 |
|
8,787 |
|
2,110 |
|
73,336 |
| |||||
|
Other |
|
4,431 |
|
— |
|
— |
|
— |
|
4,431 |
| |||||
|
Total gross loans |
|
$ |
689,890 |
|
$ |
11,571 |
|
$ |
48,727 |
|
$ |
11,840 |
|
$ |
762,028 |
|
For all loan classes, past due loans are reviewed on a monthly basis to identify loans for nonaccrual status. Loans are generally placed on non-accrual when payments have ceased and are 90 days or more past due, or when the likelihood of full collection of interest and principal is doubtful. However, if a loan is fully secured and in the process of collection and resolution of collection (generally within 90 days), then the loan will generally not be placed on nonaccrual, regardless of its delinquency status. Nonaccrual loans will not normally be returned to accrual status, although consideration will be given to situations where all past due principal and interest has been paid and the borrower has evidenced their ability to meet the contractual provisions of the note. When interest accruals are discontinued, all unpaid interest is reversed against current year income. The Bank’s method of income recognition for loans classified as nonaccrual is to apply cash received to principal when the ultimate collectability of principal is in doubt or recognize interest income on a cash basis.
The following table summarizes the payment status of the loan portfolio as December 31, 2012 and December 31, 2011.
|
|
|
As of December 31, 2012 |
| ||||||||||||||||
|
|
|
|
|
Still Accruing |
|
|
|
|
| ||||||||||
|
|
|
|
|
30-59 Days |
|
60-89 Days |
|
Over 90 Days |
|
|
|
|
| ||||||
|
(dollars in thousands) |
|
Current |
|
Past Due |
|
Past Due |
|
Past Due |
|
Nonaccrual |
|
Total |
| ||||||
|
|
|
|
|
|
|
|
|
|
|
|
|
|
| ||||||
|
Commercial |
|
$ |
435,543 |
|
$ |
74 |
|
$ |
— |
|
$ |
— |
|
$ |
676 |
|
$ |
436,293 |
|
|
Real estate construction |
|
35,501 |
|
— |
|
— |
|
— |
|
— |
|
35,501 |
| ||||||
|
Land loans |
|
8,962 |
|
— |
|
— |
|
— |
|
11 |
|
8,973 |
| ||||||
|
Real estate other |
|
134,148 |
|
— |
|
— |
|
— |
|
5,783 |
|
139,931 |
| ||||||
|
Factoring and asset based |
|
193,893 |
|
— |
|
— |
|
— |
|
1,450 |
|
195,343 |
| ||||||
|
SBA |
|
85,328 |
|
— |
|
— |
|
— |
|
2,047 |
|
87,375 |
| ||||||
|
Other |
|
5,119 |
|
42 |
|
2 |
|
— |
|
— |
|
5,163 |
| ||||||
|
Total gross loans |
|
$ |
898,494 |
|
$ |
116 |
|
$ |
2 |
|
$ |
— |
|
$ |
9,967 |
|
$ |
908,579 |
|
|
|
|
As of December 31, 2011 |
| ||||||||||||||||
|
|
|
|
|
Still Accruing |
|
|
|
|
| ||||||||||
|
|
|
|
|
30-59 Days |
|
60-89 Days |
|
Over 90 Days |
|
|
|
|
| ||||||
|
(dollars in thousands) |
|
Current |
|
Past Due |
|
Past Due |
|
Past Due |
|
Nonaccrual |
|
Total |
| ||||||
|
|
|
|
|
|
|
|
|
|
|
|
|
|
| ||||||
|
Commercial |
|
$ |
329,550 |
|
$ |
— |
|
$ |
— |
|
$ |
— |
|
$ |
798 |
|
$ |
330,348 |
|
|
Real estate construction |
|
47,213 |
|
— |
|
— |
|
— |
|
— |
|
47,213 |
| ||||||
|
Land loans |
|
6,232 |
|
— |
|
— |
|
— |
|
540 |
|
6,772 |
| ||||||
|
Real estate other |
|
151,262 |
|
— |
|
— |
|
— |
|
6,184 |
|
157,446 |
| ||||||
|
Factoring and asset based |
|
140,274 |
|
— |
|
— |
|
— |
|
2,208 |
|
142,482 |
| ||||||
|
SBA |
|
71,060 |
|
166 |
|
— |
|
— |
|
2,110 |
|
73,336 |
| ||||||
|
Other |
|
4,411 |
|
12 |
|
8 |
|
— |
|
— |
|
4,431 |
| ||||||
|
Total gross loans |
|
$ |
750,002 |
|
$ |
178 |
|
$ |
8 |
|
$ |
— |
|
$ |
11,840 |
|
$ |
762,028 |
|
A loan is categorized as a troubled debt restructuring if a significant concession is granted to provide for a reduction of either interest or principal due to deterioration in the financial condition of the borrower. Troubled debt restructurings can take the form of a reduction of the stated interest rate, splitting a loan into separate loans with market terms on one loan and concessionary terms on the other loan, receipts of assets from a debtor in partial or full satisfaction of a loan, the extension of the maturity date or dates at a stated interest rate lower than the current market rate for new debt with similar risk, the reduction of the face amount or maturity amount of the debt as stated in the instrument or other agreement, the reduction of accrued interest, or any other concessionary type of renegotiated debt. Depending on the payment history of the loan, a troubled debt restructuring can be considered performing and accruing interest or be placed on nonaccrual. However, all troubled debt restructurings are considered impaired.
As of December 30, 2012, the Company had twenty-five loans totaling $15.9 million classified as troubled debt restructurings. The twenty-five loans were comprised of two commercial loans, twenty-three other real estate loans, and three SBA loans. Troubled debt restructurings represented 1.8% of total gross loans as of December 31, 2012. As of December 31, 2011, the Company had twenty-nine loans totaling $17.1 million classified as troubled debt restructurings. The twenty-nine loans were comprised of two commercial loans, one construction loan, one land loan and twenty-two real estate other loans and three SBA loans.
As of December 31, 2012 and 2011, the Company had commitments of $111,000 and $138,000, respectively, to lend additional funds for other real estate loans classified as troubled debt restructurings.
During the year ended December 31, 2012, the Company modified $2.3 million in commercial loans, $0.9 million in other real estate loans, and $39,000 in SBA loans. During the year ended December 31, 2011, the Company modified $739,000 in commercial loans, $1.9 million in real estate construction loans, $217,000 in land loans, $3.1 million in other real estate loans, and $597,000 in SBA loans. The modification of the terms of such loans included extended amortization periods or extended maturity dates. Based on the impairment evaluation of these individual credits, a charge-off of $750,000 was deemed necessary during the year ended December 31, 2012. There were no charge-offs of loans modified during the year ended December 31, 2011.
A loan is considered to be in payment default when it is 90 days contractually past due under the modified terms. There were no loans modified within the last twelve months that defaulted during the year ended December 31, 2012.
The following table summarizes the loans categorized as troubled debt restructurings at December 31, 2012 and December 30, 2011. The troubled debt restructurings considered performing and nonaccrual are included in the “Substandard” and “Substandard (Nonaccrual)” categories, respectively, in the preceding credit quality table, and included in the “Current” and “Nonaccrual” categories, respectively, in the preceding payment status table.
|
|
|
As of December 31, 2012 |
| ||||||||||||||||
|
|
|
Performing |
|
Nonaccrual |
|
Total |
| ||||||||||||
|
|
|
Pre- |
|
Post- |
|
Pre- |
|
Post- |
|
Pre- |
|
Post- |
| ||||||
|
|
|
Modification |
|
Modification |
|
Modification |
|
Modification |
|
Modification |
|
Modification |
| ||||||
|
|
|
Recorded |
|
Recorded |
|
Recorded |
|
Recorded |
|
Recorded |
|
Recorded |
| ||||||
|
(dollars in thousands) |
|
Investment |
|
Investment |
|
Investment |
|
Investment |
|
Investment |
|
Investment |
| ||||||
|
|
|
|
|
|
|
|
|
|
|
|
|
|
| ||||||
|
Commercial |
|
$ |
— |
|
$ |
— |
|
$ |
2,598 |
|
$ |
676 |
|
$ |
2,598 |
|
$ |
676 |
|
|
Real estate construction |
|
— |
|
— |
|
— |
|
— |
|
— |
|
— |
| ||||||
|
Land loans |
|
— |
|
— |
|
— |
|
— |
|
— |
|
— |
| ||||||
|
Real estate other |
|
10,291 |
|
8,902 |
|
7,711 |
|
5,783 |
|
18,002 |
|
14,685 |
| ||||||
|
Factoring and asset based |
|
— |
|
— |
|
— |
|
— |
|
— |
|
— |
| ||||||
|
SBA |
|
480 |
|
500 |
|
— |
|
— |
|
480 |
|
500 |
| ||||||
|
Other |
|
— |
|
— |
|
— |
|
— |
|
— |
|
— |
| ||||||
|
Total gross loans |
|
$ |
10,771 |
|
$ |
9,402 |
|
$ |
10,309 |
|
$ |
6,459 |
|
$ |
21,080 |
|
$ |
15,861 |
|
|
|
|
As of December 31, 2011 |
| ||||||||||||||||
|
|
|
Performing |
|
Nonaccrual |
|
Total |
| ||||||||||||
|
|
|
Pre- |
|
Post- |
|
Pre- |
|
Post- |
|
Pre- |
|
Post- |
| ||||||
|
|
|
Modification |
|
Modification |
|
Modification |
|
Modification |
|
Modification |
|
Modification |
| ||||||
|
|
|
Recorded |
|
Recorded |
|
Recorded |
|
Recorded |
|
Recorded |
|
Recorded |
| ||||||
|
(dollars in thousands) |
|
Investment |
|
Investment |
|
Investment |
|
Investment |
|
Investment |
|
Investment |
| ||||||
|
|
|
|
|
|
|
|
|
|
|
|
|
|
| ||||||
|
Commercial |
|
$ |
497 |
|
$ |
487 |
|
$ |
294 |
|
$ |
224 |
|
$ |
791 |
|
$ |
711 |
|
|
Real estate construction |
|
1,990 |
|
1,930 |
|
— |
|
— |
|
1,990 |
|
1,930 |
| ||||||
|
Land loans |
|
217 |
|
202 |
|
|
|
|
|
217 |
|
202 |
| ||||||
|
Real estate other |
|
6,983 |
|
7,464 |
|
7,711 |
|
6,184 |
|
14,694 |
|
13,648 |
| ||||||
|
Factoring and asset based |
|
— |
|
— |
|
— |
|
— |
|
— |
|
— |
| ||||||
|
SBA |
|
601 |
|
594 |
|
— |
|
— |
|
601 |
|
594 |
| ||||||
|
Other |
|
— |
|
— |
|
— |
|
— |
|
— |
|
— |
| ||||||
|
Total gross loans |
|
$ |
10,288 |
|
$ |
10,677 |
|
$ |
8,005 |
|
$ |
6,408 |
|
$ |
18,293 |
|
$ |
17,085 |
|
Loans are designated as impaired, when, based on current information and events, it is probable that the Bank will be unable to collect all amounts due according to the contractual terms of the loan agreement. As of December 31, 2012 and December 31, 2011 loans designated as impaired consisted only of nonaccrual loans and troubled debt restructurings. There were no loans outstanding that were less than or greater than 90 days or more past due and accruing interest that were considered impaired at December 31, 2012 and December 31, 2011.
The following table summarizes the loans categorized as impaired at December 31, 2012 and December 31, 2011:
|
|
|
December 31, |
|
December 31, |
| ||
|
(dollars in thousands) |
|
2012 |
|
2011 |
| ||
|
|
|
|
|
|
| ||
|
Nonaccrual loans (1) |
|
$ |
9,967 |
|
$ |
11,840 |
|
|
Trouble debt restructurings - performing |
|
9,402 |
|
10,677 |
| ||
|
Loans past due 90 days or more and accruing interest |
|
— |
|
— |
| ||
|
Loans current or past due less than 90 days and accruing interest |
|
— |
|
— |
| ||
|
Total impaired loans |
|
$ |
19,369 |
|
$ |
22,517 |
|
(1) Nonaccrual loans include troubled debt restructurings of $6.5 million and $6.4 million at December 31, 2012 and December 31, 2011, respectively.
Impaired loans at December 31, 2012 were comprised of loans with legal contractual balances totaling approximately $24.9 million reduced by approximately $1.4 million received in non-accrual interest and impairment charges of $4.1 million which have been charged against the allowance for loan losses.
Impaired loans at December 31, 2011 were comprised of loans with legal contractual balances totaling approximately $27.6 million reduced by $1.4 million received in non-accrual interest and impairment charges of $3.7 million which have been charged against the allowance for loan losses.
The following summarizes the breakdown of impaired loans by category as of December 31, 2012 and December 31, 2011:
|
|
|
As of December 31, 2012 |
|
As of December 31, 2011 |
| ||||||||
|
|
|
Upaid |
|
|
|
Upaid |
|
|
| ||||
|
|
|
Principal |
|
Recorded |
|
Principal |
|
Recorded |
| ||||
|
(dollars in thousands) |
|
Balance |
|
Investment |
|
Balance |
|
Investment |
| ||||
|
|
|
|
|
|
|
|
|
|
| ||||
|
Commercial |
|
$ |
2,007 |
|
$ |
676 |
|
$ |
2,611 |
|
$ |
1,285 |
|
|
Real estate construction |
|
— |
|
— |
|
1,930 |
|
1,930 |
| ||||
|
Land loans |
|
37 |
|
11 |
|
833 |
|
742 |
| ||||
|
Real estate other |
|
16,491 |
|
14,685 |
|
16,274 |
|
13,648 |
| ||||
|
Factoring and asset based |
|
2,965 |
|
1,450 |
|
2,645 |
|
2,208 |
| ||||
|
SBA |
|
3,427 |
|
2,547 |
|
3,340 |
|
2,704 |
| ||||
|
Other |
|
— |
|
— |
|
— |
|
— |
| ||||
|
Total gross loans |
|
$ |
24,927 |
|
$ |
19,369 |
|
$ |
27,633 |
|
$ |
22,517 |
|
Consistent with the Bank’s method of income recognition for loans, interest on impaired loans, except those classified as nonaccrual, is recognized using the accrual method. The Bank did not record income from the receipt of cash payments related to nonaccrual loans during the years ended December 31, 2012 and 2011. Interest income recognized on impaired loans represents interest the Bank recognized on performing troubled debt restructurings and loans greater than 90 days past due and still accruing interest.
The following table summarizes the average recorded investment in impaired loans and related interest income recognized for the years ended December 31, 2012 and December 31, 2011:
|
|
|
As of December 31, |
| ||||||||||
|
|
|
2012 |
|
2011 |
| ||||||||
|
|
|
Average |
|
Interest |
|
Average |
|
Interest |
| ||||
|
|
|
Recorded |
|
Income |
|
Recorded |
|
Income |
| ||||
|
(dollars in thousands) |
|
Investment |
|
Recognized |
|
Investment |
|
Recognized |
| ||||
|
|
|
|
|
|
|
|
|
|
| ||||
|
Commercial |
|
$ |
981 |
|
$ |
199 |
|
$ |
1,208 |
|
$ |
29 |
|
|
Real estate construction |
|
965 |
|
— |
|
3,636 |
|
109 |
| ||||
|
Land loans |
|
377 |
|
2 |
|
1,959 |
|
13 |
| ||||
|
Real estate other |
|
14,167 |
|
379 |
|
12,388 |
|
384 |
| ||||
|
Factoring and asset based |
|
1,829 |
|
16 |
|
1,104 |
|
— |
| ||||
|
SBA |
|
2,626 |
|
97 |
|
1,466 |
|
58 |
| ||||
|
Other |
|
— |
|
— |
|
94 |
|
— |
| ||||
|
Total gross loans |
|
$ |
20,943 |
|
$ |
693 |
|
$ |
21,855 |
|
$ |
593 |
|
The allowance for loan losses is a valuation allowance for probable incurred loan losses. Loan losses are charged against the allowance when management believes the uncollectibility of a loan balance is confirmed. Subsequent recoveries, if any, are credited to the allowance. The entire allowance is available for any loan that, in management’s judgment should be charged-off.
The allowance generally consists of specific and general reserves. Specific reserves relate to loans that are individually classified as impaired or are otherwise exhibiting negative credit characteristics suggesting potential loss exposure greater than historical loss experience would suggest. Specific reserves are calculated by evaluating the present value of expected future cash flows pertaining to the loan, the fair value of the collateral supporting the loan, less selling costs, or the loan’s observable market price. It is currently the Bank’s practice to immediately charge-off any identified financial loss pertaining to impaired loans when management believes the uncollectibility of the loan is confirmed; Therefore, as seen in the table below, there are typically only a small number of individual loans for which a specific reserve exists. General reserves are based on historical loss rates for each portfolio segment, adjusted for the effects of qualitative or environmental factors that are likely to cause estimated loan losses as of the evaluation date to differ from the portfolio segment’s historical loss experience. Qualitative factors include consideration of the following: changes in lending policies and procedures; loan charge-off trends; changes in economic conditions, changes in business conditions; changes in the nature and volume of the portfolio; changes in the experience, ability and depth of lending management and other relevant staff; changes in the volume and severity of past due, nonaccrual and other adversely graded loans; changes in the loan review system; concentrations of credit and the effect of other external factors such as competition and legal and regulatory requirements.
The allowance for loan losses totaled $19.9 million and $18.5 million as of December 31, 2012 and December 31, 2011, respectively. The following table summarizes the loans individually and collectively evaluated for impairment and the corresponding allowance for loan losses as of December 31, 2012 and December 31, 2011.
|
|
|
As of December 31, 2012 |
| ||||||||||||||||
|
|
|
Individually Evaluated |
|
Collectively Evaluated |
|
Total Evaluated |
| ||||||||||||
|
|
|
For Impairment |
|
For Impairment |
|
For Impairment |
| ||||||||||||
|
(dollars in thousands) |
|
Loans |
|
Allowance |
|
Loans |
|
Allowance |
|
Loans |
|
Allowance |
| ||||||
|
|
|
|
|
|
|
|
|
|
|
|
|
|
| ||||||
|
Commercial |
|
$ |
676 |
|
$ |
— |
|
$ |
435,617 |
|
$ |
6,394 |
|
$ |
436,293 |
|
$ |
6,394 |
|
|
Real estate construction |
|
— |
|
|
|
35,501 |
|
673 |
|
35,501 |
|
673 |
| ||||||
|
Land loans |
|
11 |
|
— |
|
8,962 |
|
333 |
|
8,973 |
|
333 |
| ||||||
|
Real estate other |
|
14,685 |
|
1,408 |
|
125,246 |
|
3,770 |
|
139,931 |
|
5,178 |
| ||||||
|
Factoring and asset based |
|
1,450 |
|
|
|
193,893 |
|
4,352 |
|
195,343 |
|
4,352 |
| ||||||
|
SBA |
|
2,547 |
|
— |
|
84,828 |
|
2,905 |
|
87,375 |
|
2,905 |
| ||||||
|
Other |
|
— |
|
— |
|
5,163 |
|
113 |
|
5,163 |
|
113 |
| ||||||
|
Total |
|
$ |
19,369 |
|
$ |
1,408 |
|
$ |
889,210 |
|
$ |
18,540 |
|
$ |
908,579 |
|
$ |
19,948 |
|
|
|
|
As of December 31, 2011 |
| ||||||||||||||||
|
|
|
Individually Evaluated |
|
Collectively Evaluated |
|
Total Evaluated |
| ||||||||||||
|
|
|
For Impairment |
|
For Impairment |
|
For Impairment |
| ||||||||||||
|
(dollars in thousands) |
|
Loans |
|
Allowance |
|
Loans |
|
Allowance |
|
Loans |
|
Allowance |
| ||||||
|
|
|
|
|
|
|
|
|
|
|
|
|
|
| ||||||
|
Commercial |
|
$ |
1,285 |
|
$ |
— |
|
$ |
329,063 |
|
$ |
5,544 |
|
$ |
330,348 |
|
$ |
5,544 |
|
|
Real estate construction |
|
1,930 |
|
— |
|
45,283 |
|
1,220 |
|
47,213 |
|
1,220 |
| ||||||
|
Land loans |
|
742 |
|
— |
|
6,030 |
|
613 |
|
6,772 |
|
613 |
| ||||||
|
Real estate other |
|
13,648 |
|
— |
|
143,798 |
|
6,111 |
|
157,446 |
|
6,111 |
| ||||||
|
Factoring and asset based |
|
2,208 |
|
— |
|
140,274 |
|
2,382 |
|
142,482 |
|
2,382 |
| ||||||
|
SBA |
|
2,704 |
|
— |
|
70,632 |
|
2,567 |
|
73,336 |
|
2,567 |
| ||||||
|
Other |
|
— |
|
— |
|
4,431 |
|
103 |
|
4,431 |
|
103 |
| ||||||
|
Total |
|
$ |
22,517 |
|
$ |
— |
|
$ |
739,511 |
|
$ |
18,540 |
|
$ |
762,028 |
|
$ |
18,540 |
|
The following table summarizes the activity in the allowance for loan losses for the years ended December 31, 2012, 2011, and 2010.
|
|
|
|
|
Real |
|
|
|
Real |
|
Factoring |
|
|
|
|
|
|
| |||||||||
|
|
|
|
|
estate |
|
Land |
|
estate |
|
and asset |
|
|
|
|
|
|
| |||||||||
|
(dollars in thousands) |
|
Commercial |
|
construction |
|
loans |
|
other |
|
based |
|
SBA |
|
Other |
|
Total |
| |||||||||
|
|
|
|
|
|
|
|
|
|
|
|
|
|
|
|
|
|
| |||||||||
|
As of December 31, 2011 |
|
$ |
|
5,544 |
|
$ |
1,220 |
|
$ |
613 |
|
$ |
6,111 |
|
$ |
2,382 |
|
$ |
2,567 |
|
$ |
103 |
|
$ |
18,540 |
|
|
Provision charged to expense |
|
700 |
|
(558 |
) |
(269 |
) |
(935 |
) |
4,220 |
|
782 |
|
10 |
|
3,950 |
| |||||||||
|
Charge-offs |
|
(311 |
) |
— |
|
(17 |
) |
— |
|
(2,250 |
) |
(567 |
) |
— |
|
(3,145 |
) | |||||||||
|
Recoveries |
|
461 |
|
11 |
|
6 |
|
2 |
|
— |
|
123 |
|
— |
|
603 |
| |||||||||
|
As of December 31, 2012 |
|
$ |
|
6,394 |
|
$ |
673 |
|
$ |
333 |
|
$ |
5,178 |
|
$ |
4,352 |
|
$ |
2,905 |
|
$ |
113 |
|
$ |
19,948 |
|
|
|
|
|
|
Real |
|
|
|
Real |
|
Factoring |
|
|
|
|
|
|
| ||||||||
|
|
|
|
|
estate |
|
Land |
|
estate |
|
and asset |
|
|
|
|
|
|
| ||||||||
|
(dollars in thousands) |
|
Commercial |
|
construction |
|
loans |
|
other |
|
based |
|
SBA |
|
Other |
|
Total |
| ||||||||
|
|
|
|
|
|
|
|
|
|
|
|
|
|
|
|
|
|
| ||||||||
|
As of December 31, 2010 |
|
$ |
4,616 |
|
$ |
1,628 |
|
$ |
622 |
|
$ |
5,358 |
|
$ |
1,575 |
|
$ |
1,670 |
|
$ |
77 |
|
$ |
15,546 |
|
|
Provision charged to expense |
|
1,056 |
|
(1,120 |
) |
(1,629 |
) |
2,148 |
|
807 |
|
1,312 |
|
26 |
|
2,600 |
| ||||||||
|
Charge-offs |
|
(756 |
) |
— |
|
(340 |
) |
(1,395 |
) |
— |
|
(415 |
) |
— |
|
(2,906 |
) | ||||||||
|
Recoveries |
|
628 |
|
712 |
|
1,960 |
|
— |
|
— |
|
— |
|
— |
|
3,300 |
| ||||||||
|
As of December 31, 2011 |
|
$ |
5,544 |
|
$ |
1,220 |
|
$ |
613 |
|
$ |
6,111 |
|
$ |
2,382 |
|
$ |
2,567 |
|
$ |
103 |
|
$ |
18,540 |
|
|
|
|
|
|
Real |
|
|
|
Real |
|
Factoring |
|
|
|
|
|
|
| ||||||||
|
|
|
|
|
estate |
|
Land |
|
estate |
|
and asset |
|
|
|
|
|
|
| ||||||||
|
(dollars in thousands) |
|
Commercial |
|
construction |
|
loans |
|
other |
|
based |
|
SBA |
|
Other |
|
Total |
| ||||||||
|
|
|
|
|
|
|
|
|
|
|
|
|
|
|
|
|
|
| ||||||||
|
As of December 31, 2009 |
|
$ |
6,313 |
|
$ |
5,173 |
|
$ |
1,376 |
|
$ |
764 |
|
$ |
1,061 |
|
$ |
1,175 |
|
$ |
150 |
|
$ |
16,012 |
|
|
Provision charged to expense |
|
(1,391 |
) |
(3,070 |
) |
(140 |
) |
7,921 |
|
603 |
|
495 |
|
282 |
|
4,700 |
| ||||||||
|
Charge-offs |
|
(1,406 |
) |
(1,274 |
) |
(748 |
) |
(4,013 |
) |
(132 |
) |
— |
|
(606 |
) |
(8,179 |
) | ||||||||
|
Recoveries |
|
1,100 |
|
799 |
|
134 |
|
686 |
|
43 |
|
— |
|
251 |
|
3,013 |
| ||||||||
|
As of December 31, 2010 |
|
$ |
4,616 |
|
$ |
1,628 |
|
$ |
622 |
|
$ |
5,358 |
|
$ |
1,575 |
|
$ |
1,670 |
|
$ |
77 |
|
$ |
15,546 |
|
5. PREMISES AND EQUIPMENT
Premises and equipment are stated at cost less accumulated depreciation and amortization. Depreciation and amortization are computed on a straight-line basis over the shorter of the lease term, generally three to fifteen years, or the estimated useful lives of the assets, generally three to five years.
Premises and equipment at December 31, 2012 and December 31, 2011 are comprised of the following:
|
|
|
As of December 31, |
| ||||
|
(dollars in thousands) |
|
2012 |
|
2011 |
| ||
|
|
|
|
|
|
| ||
|
Leasehold improvements |
|
$ |
5,884 |
|
$ |
5,553 |
|
|
Furniture and equipment |
|
3,932 |
|
3,579 |
| ||
|
Capitalized software |
|
4,011 |
|
3,843 |
| ||
|
Premises and equipment |
|
13,827 |
|
12,975 |
| ||
|
Less accumulated depreciation and amortization |
|
(11,785 |
) |
(10,638 |
) | ||
|
Premises and equipment, net |
|
$ |
2,042 |
|
$ |
2,337 |
|
Depreciation and amortization amounted to $1.1 million, $1.1 million, and $1.4 million for the years ended December 31, 2012, 2011 and 2010, respectively, and has been included in occupancy and/or furniture and equipment expense, depending on the nature of the expense, in the accompanying statements of operations.
6. DEPOSITS
The Bank’s deposit base consists of non-interest and interest-bearing demand deposits, savings and money market
accounts and certificates of deposit. The following table summarizes the composition of deposits as of December 31, 2012, 2011 and 2010.
|
|
|
As of December 31, |
| ||||||||
|
|
|
2012 |
|
2011 |
| ||||||
|
(dollars in thousands) |
|
Amount |
|
Percent |
|
Amount |
|
Percent |
| ||
|
|
|
|
|
|
|
|
|
|
| ||
|
Noninterest-bearing demand |
|
$ |
723,517 |
|
62.24 |
% |
$ |
660,036 |
|
66.09 |
% |
|
Interest-bearing demand |
|
10,582 |
|
0.91 |
% |
4,272 |
|
0.43 |
% | ||
|
Money market and savings |
|
380,949 |
|
32.77 |
% |
298,145 |
|
29.85 |
% | ||
|
Certificates of depoosit: |
|
|
|
|
|
|
|
|
| ||
|
Less than $100 |
|
3,167 |
|
0.27 |
% |
4,213 |
|
0.42 |
% | ||
|
$100 and more |
|
44,333 |
|
3.81 |
% |
32,009 |
|
3.21 |
% | ||
|
|
|
|
|
|
|
|
|
|
| ||
|
Total deposit portfolio |
|
$ |
1,162,548 |
|
100.00 |
% |
$ |
998,675 |
|
100.00 |
% |
At December 31, 2012, time deposits of $100,000 or more have remaining maturities as follows:
|
(in thousands) |
|
|
| |
|
|
|
|
| |
|
3 months or less |
|
$ |
13,199 |
|
|
Over 3 months to 6 months |
|
4,102 |
| |
|
Over 6 months to 12 months |
|
5,099 |
| |
|
Over 1 year to 5 years |
|
21,933 |
| |
|
TOTAL |
|
$ |
44,333 |
|
At December 31, 2012, the scheduled maturities of all time deposits are as follows:
|
(in thousands) |
|
|
| |
|
|
|
|
| |
|
2013 |
|
$ |
25,410 |
|
|
2014 |
|
7,962 |
| |
|
2015 |
|
4,226 |
| |
|
2016 |
|
4,486 |
| |
|
2017 |
|
5,416 |
| |
|
|
|
$ |
47,500 |
|
7. JUNIOR SUBORDINATED DEBT SECURITIES AND OTHER BORROWINGS
Junior Subordinated Debt Securities
On December 21, 2004, the Company issued $12,372,000 of junior subordinated debt securities (the “debt securities”) to Bridge Capital Trust I, a statutory trust created under the laws of the State of Delaware. These debt securities are subordinated to effectively all borrowings of the Company and are due and payable in March 2035. Interest was payable quarterly on these debt securities at a fixed rate of 5.90% for the first five years, and thereafter interest accrues at LIBOR plus 1.98%. In April of 2008, the Company entered into an interest rate swap agreement to fix the variable cash outflows associated with the debt securities to Bridge Capital Trust I for an additional five years at 6.11%. See “Footnote 14. Derivative Instruments and Hedging Activities” for further discussion. The debt securities can be redeemed at par at the Company’s option beginning in March 2010; they can also be redeemed at par if certain events occur that impact the tax treatment or the capital treatment of the issuance.
The Company also purchased a 3% minority interest in the Trust. The balance of the equity of the Trust is comprised of mandatorily redeemable preferred securities.
On September 30, 2006 the Company issued $5,155,000 of junior subordinated debt securities (the “debt securities”) to Bridge Capital Trust II, a statutory trust created under the laws of the State of Delaware. These debt securities are subordinated to effectively all borrowings of the Company and are due and payable in March 2037. Interest was payable quarterly on these debt securities at a fixed rate of 6.60% for the first five years, and thereafter interest accrues at LIBOR plus 1.38%. In September of 2008, the Company entered into an interest rate swap agreement to fix the variable cash outflows associated with the debt securities to Bridge Capital Trust II for an additional five years at 6.09%. See “Footnote 14. Derivative Instruments and Hedging Activities” for further discussion. The debt securities can be redeemed at par at the Company’s option beginning in April 2011; they can also be redeemed at par if certain events occur that impact the tax treatment or the capital treatment of the issuance.
The Company also purchased a 3% minority interest in the Trust. The balance of the equity of the Trust is comprised of mandatorily redeemable preferred securities.
Based upon accounting guidance, these Trusts are not consolidated into the company’s financial statements. The Federal Reserve Board has ruled that subordinated notes payable to unconsolidated special purpose entities (“SPE’s”) such as these Trusts, net of the bank holding company’s investment in the SPE, qualify as Tier 1 Capital, subject to certain limits.
Other Borrowings
The Company had no other borrowings at December 31, 2012 and December 31, 2011.
As of December 31, 2012, the Company had a total borrowing capacity with the Federal Home Loan Bank of approximately $312.0 million for which the Company had collateral in place to borrow $212.0 million. As of December 31, 2012, $12.0 of this borrowing capacity was pledged to secure a letter of credit.
The Company also has unsecured borrowing lines with correspondent banks totaling $47.0 million. At December 31, 2012, there were no balances outstanding on these lines.
8. INCOME TAXES
Income tax expense (benefit) consists of the following for the years ended December 31, 2012, 2011 and 2010:
|
|
|
Year ended December 31, |
| |||||||
|
(dollars in thousands) |
|
2012 |
|
2011 |
|
2010 |
| |||
|
|
|
|
|
|
|
|
| |||
|
Current: |
|
|
|
|
|
|
| |||
|
Federal |
|
$ |
9,319 |
|
$ |
8,169 |
|
$ |
1,784 |
|
|
State |
|
2,399 |
|
1,780 |
|
338 |
| |||
|
Total current |
|
$ |
11,718 |
|
$ |
9,949 |
|
$ |
2,122 |
|
|
|
|
|
|
|
|
|
| |||
|
Deferred: |
|
|
|
|
|
|
| |||
|
Federal |
|
(2,158 |
) |
(3,497 |
) |
(121 |
) | |||
|
State |
|
50 |
|
(955 |
) |
(46 |
) | |||
|
Total deferred |
|
(2,108 |
) |
(4,452 |
) |
(167 |
) | |||
|
Income tax provision |
|
$ |
9,610 |
|
$ |
5,497 |
|
$ |
1,955 |
|
Deferred income taxes reflect the net tax effect of temporary differences between carrying amount of assets and liabilities for financial reporting purposes and the amount used for income tax purposes. The tax effects of temporary differences that gave rise to significant portions of deferred tax assets at December 31, 2012, 2010 and 2009 are as follows:
|
|
|
As of ended December 31, |
| |||||||
|
(dollars in thousands) |
|
2012 |
|
2011 |
|
2010 |
| |||
|
Deferred tax assets (liability): |
|
|
|
|
|
|
| |||
|
Deferred loan fee |
|
$ |
1,049 |
|
$ |
977 |
|
$ |
486 |
|
|
Allowance for credit losses |
|
6,994 |
|
6,613 |
|
5,441 |
| |||
|
State income taxes |
|
3,870 |
|
3,799 |
|
2,574 |
| |||
|
Fixed assets |
|
783 |
|
579 |
|
690 |
| |||
|
Accrued expenses |
|
5,990 |
|
4,507 |
|
271 |
| |||
|
Other |
|
88 |
|
192 |
|
2,753 |
| |||
|
Net deferred tax asset |
|
$ |
18,774 |
|
$ |
16,667 |
|
$ |
12,215 |
|
In addition to the above net deferred tax asset, the Company has additional deferred tax assets / (liabilities) arising from adjustments to other comprehensive income aggregating $(419,000), $362,000 and $1.5 million, as of December 31, 2012, 2011 and 2010, respectively.
Income tax returns for the years ended December 31, 2011, 2010 and 2009 are open to audit by the federal authorities and income tax returns for the years ended December 31, 2011, 2010, 2009 and 2008 are open to audit by California authorities.
As of December 31, 2012, the Company is under examination by income tax authorities in the state of California for income tax returns for the years ended December 31, 2009 and 2008, and has recorded an unrecognized tax benefit of $419,000. The interest and penalties included in the unrecognized tax benefits are not material. If the unrecognized tax benefit is recognized, there would not be a material impact on the annual effective tax rate. The unrecognized tax benefit relates is expected to be settled within the next twelve months.
The effective tax rate differs from the federal statutory rate as follows:
|
|
|
Year ended December 31, |
| ||||
|
|
|
2012 |
|
2011 |
|
2010 |
|
|
|
|
|
|
|
|
|
|
|
Federal statutory rate |
|
35.00 |
% |
35.00 |
% |
35.00 |
% |
|
State income tax, net of federal effect |
|
6.80 |
% |
4.02 |
% |
4.17 |
% |
|
BOLI income |
|
-0.63 |
% |
-1.02 |
% |
-3.02 |
% |
|
Low income housing credits |
|
-0.76 |
% |
-1.93 |
% |
-6.84 |
% |
|
Stock-based compensation |
|
0.19 |
% |
0.59 |
% |
2.53 |
% |
|
Other, net |
|
0.44 |
% |
4.54 |
% |
11.16 |
% |
|
Income taxes |
|
41.04 |
% |
41.20 |
% |
43.00 |
% |
9. STOCK BASED COMPENSATION
On May 18, 2006, the Company’s shareholders approved the 2006 Equity Incentive Plan (the “Plan”) which supersedes the Stock Option Plan that was established in 2001. The Plan provides for the following types of stock-based awards: incentive stock options; nonqualified stock options; stock appreciation rights; restricted stock awards; restricted stock units; performance units; and stock grants. As of December 31, 2012, the Company has issued incentive stock options, nonqualified stock options, and restricted stock awards under the Plan.
Options issued under the Plan may be granted to employees and non-employee directors and may be either incentive or nonqualified stock options as defined under current tax laws. The exercise price of each option must equal the market price of the Company’s stock on the date of the grant. The term of the option may not exceed 10 years and generally vests over a 4 year period.
Restricted stock awards issued under the Plan may be granted to employees and non-employee directors. The grant price of each award equals the market price of the Company’s stock on the date of the grant. The awards generally vest after a 5 year period. During the period of restriction, participants holding restricted stock awards have full voting and dividend rights on the shares.
The vesting of any award granted under the plan may be accelerated in the event of a merger or sale of the Company if the acquiring entity does not assume or replace the awards with comparable awards.
At the time the 2006 Equity Incentive Plan was adopted, the total authorized shares available for issuance under the 2001 Stock Option Plan was 1,813,225 shares and the number of shares available for future grant was 253,577 shares. As the 2006 Equity Incentive Plan supersedes the 2001 Stock Option Plan, no further grants may be made under the 2001 plan and as such, the 253,577 shares that were available for future grant under the 2001 plan may no longer be awarded. The total shares that are authorized for issuance under the 2006 Equity Incentive Plan is 2,103,283 shares.
As of December 31, 2012, there were 2,164,186 shares underlying outstanding stock option and restricted stock awards under the Company’s stock-based compensation plans and 173,319 shares available for future grants under the 2006 Equity Incentive Plan.
A summary of the Company’s non-vested shares of restricted stock awards as of December 31, 2012 and changes during the period ended on that date is presented below:
|
|
|
Non-Vested Restricted Stock Awards |
| |||
|
|
|
|
|
Weighted |
| |
|
|
|
Number |
|
Average Grant |
| |
|
|
|
of Shares |
|
Date Fair Value |
| |
|
|
|
|
|
|
| |
|
Balances, December 31, 2011 |
|
792,414 |
|
$ |
7.49 |
|
|
|
|
|
|
|
| |
|
Granted |
|
611,519 |
|
15.22 |
| |
|
Vested |
|
(27,099 |
) |
21.50 |
| |
|
Forfeited |
|
(44,870 |
) |
9.19 |
| |
|
|
|
|
|
|
| |
|
Balances, December 31, 2012 |
|
1,331,964 |
|
$ |
10.70 |
|
|
|
|
|
|
|
| |
|
Balances, December 31, 2010 |
|
500,055 |
|
$ |
7.00 |
|
|
|
|
|
|
|
| |
|
Granted |
|
330,939 |
|
9.15 |
| |
|
Vested |
|
(21,660 |
) |
22.39 |
| |
|
Forfeited |
|
(16,920 |
) |
6.28 |
| |
|
|
|
|
|
|
| |
|
Balances, December 31, 2011 |
|
792,414 |
|
$ |
7.49 |
|
|
|
|
|
|
|
| |
|
Balances, December 31, 2009 |
|
526,095 |
|
$ |
6.99 |
|
|
|
|
|
|
|
| |
|
Granted |
|
8,200 |
|
7.31 |
| |
|
Vested |
|
(24,000 |
) |
4.56 |
| |
|
Forfeited |
|
(10,240 |
) |
12.06 |
| |
|
|
|
|
|
|
| |
|
Balances, December 31, 2010 |
|
500,055 |
|
$ |
7.00 |
|
A summary of the Company’s stock option awards as of December 31, 2012 and changes during the period ended on that date are presented below:
|
|
|
Stock Option Awards Outstanding |
| |||
|
|
|
|
|
Weighted |
| |
|
|
|
Number |
|
Average |
| |
|
|
|
of Shares |
|
Exercise Price |
| |
|
|
|
|
|
|
| |
|
Balances, December 31, 2011 |
|
815,980 |
|
$ |
12.45 |
|
|
|
|
|
|
|
| |
|
Granted |
|
78,879 |
|
13.87 |
| |
|
Exercised (aggregate intrinsic value of $236,081) |
|
(34,848 |
) |
6.39 |
| |
|
Cancelled |
|
(25,977 |
) |
10.87 |
| |
|
Expired |
|
(1,812 |
) |
12.86 |
| |
|
|
|
|
|
|
| |
|
Balances, December 31, 2012 |
|
832,222 |
|
$ |
12.89 |
|
|
|
|
Stock Option Awards Outstanding |
| |||
|
|
|
|
|
Weighted |
| |
|
|
|
Number |
|
Average |
| |
|
|
|
of Shares |
|
Exercise Price |
| |
|
|
|
|
|
|
| |
|
Balances, December 31, 2010 |
|
1,216,260 |
|
$ |
11.81 |
|
|
|
|
|
|
|
| |
|
Granted |
|
295,586 |
|
10.60 |
| |
|
Exercised (aggregate intrinsic value of $1,656,656) |
|
(407,881 |
) |
5.33 |
| |
|
Cancelled |
|
(211,700 |
) |
17.60 |
| |
|
Expired |
|
(76,285 |
) |
18.84 |
| |
|
|
|
|
|
|
| |
|
Balances, December 31, 2011 |
|
815,980 |
|
$ |
12.45 |
|
|
|
|
|
|
|
| |
|
Balances, December 31, 2009 |
|
1,336,029 |
|
$ |
11.42 |
|
|
|
|
|
|
|
| |
|
Granted |
|
91,000 |
|
8.14 |
| |
|
Exercised (aggregate intrinsic value of $515,891) |
|
(169,700 |
) |
5.42 |
| |
|
Cancelled |
|
(6,675 |
) |
17.47 |
| |
|
Expired |
|
(34,394 |
) |
17.52 |
| |
|
|
|
|
|
|
| |
|
Balances, December 31, 2010 |
|
1,216,260 |
|
$ |
11.81 |
|
The following table summarizes information about stock options outstanding at December 31, 2012. Of the stock option awards outstanding as of December 31, 2012, 491,332 shares were fully vested with a weighted average exercise price of $14.42.
|
|
|
Stock Option Awards Outstanding |
|
Stock Option Awards Exercisable |
| |||||||||||||||
|
|
|
|
|
Weighted |
|
Weighted |
|
|
|
Weighted |
|
Weighted |
| |||||||
|
|
|
|
|
Remaining |
|
Exercise |
|
|
|
Remaining |
|
Exercise |
| |||||||
|
Exercise Price range |
|
Shares |
|
Life (Years) |
|
Price |
|
Shares |
|
Life (Years) |
|
Price |
| |||||||
|
$ |
4.40 |
- |
$ |
6.71 |
|
|
73,983 |
|
6.4 |
|
$ |
5.58 |
|
47,983 |
|
6.4 |
|
$ |
5.67 |
|
|
$ |
7.05 |
- |
$ |
10.65 |
|
|
171,523 |
|
7.4 |
|
8.86 |
|
72,267 |
|
6.1 |
|
8.48 |
| ||
|
$ |
10.66 |
- |
$ |
17.34 |
|
|
442,216 |
|
6.2 |
|
12.60 |
|
226,582 |
|
3.6 |
|
13.13 |
| ||
|
$ |
18.18 |
- |
$ |
22.66 |
|
|
144,500 |
|
4.3 |
|
22.30 |
|
144,500 |
|
4.3 |
|
22.30 |
| ||
|
|
|
|
|
|
|
|
|
|
|
|
|
|
| |||||||
|
|
|
832,222 |
|
6.1 |
|
$ |
12.89 |
|
491,332 |
|
4.5 |
|
$ |
14.42 |
| |||||
The aggregate intrinsic value of stock option awards outstanding and stock option awards exercisable at December 31, 2012 was $3.2 million and $1.5 million, respectively. The aggregate intrinsic value of stock option awards outstanding and stock option awards exercisable at December 31, 2011 was $777,000 and $321,000, respectively. At December 31, 2010, the aggregate intrinsic value of stock option awards outstanding and stock option awards exercisable was $1.8 million and $1.5 million, respectively.
The Company has elected to use the BSM option-pricing model, which incorporates various assumptions including volatility, expected life, and interest rates. The expected volatility is based on the historical volatility of the Company’s common stock over the most recent period commensurate with the estimated expected life of the Company’s stock options, adjusted for the impact of unusual fluctuations not reasonably expected to recur and other relevant factors including implied volatility in market traded options on the Company’s common stock. The expected life of an award is based on historical experience and on the terms and conditions of the stock awards granted to employees. The interest rate used is a risk free rate represented by the US Treasury Rate Yield Curve associated with the expected life of the award.
The weighted average assumptions used for 2012, 2011, and 2010 and the resulting estimates of weighted-average fair value per share of stock options granted during those periods are as follows:
|
|
|
Year ended December 31, |
| |||||||
|
|
|
2012 |
|
2011 |
|
2010 |
| |||
|
|
|
|
|
|
|
|
| |||
|
Expected life |
|
75 months |
|
75 months |
|
75 months |
| |||
|
|
|
|
|
|
|
|
| |||
|
Stock volatility |
|
40.0 |
% |
35.0 |
% |
45.0 |
% | |||
|
|
|
|
|
|
|
|
| |||
|
Risk free interest rate |
|
1.1 |
% |
1.7 |
% |
2.7 |
% | |||
|
|
|
|
|
|
|
|
| |||
|
Dividend yield |
|
0.0 |
% |
0.0 |
% |
0.0 |
% | |||
|
|
|
|
|
|
|
|
| |||
|
Fair value per share |
|
$ |
5.60 |
|
$ |
2.17 |
|
$ |
3.80 |
|
10. PENSION BENEFIT PLANS
Effective August 1, 2004, the Bank established the Supplemental Executive Retirement Plan (SERP), an unfunded noncontributory defined benefit pension plan. The SERP provides retirement benefits to a select group of key executives and senior officers based on years of service and final average salary. The Bank uses a December 31st measurement date for this plan.
The following table reflects the accumulated benefit obligation and funded status of the SERP for the years ended December 31, 2012, 2011 and 2010:
|
|
|
Year ended December 31, |
| |||||||
|
(dollars in thousands) |
|
2012 |
|
2011 |
|
2010 |
| |||
|
Change in benefit obligation |
|
|
|
|
|
|
| |||
|
Benefit obligation at beginning of year |
|
$ |
4,808 |
|
$ |
4,288 |
|
$ |
3,469 |
|
|
Service cost |
|
590 |
|
446 |
|
340 |
| |||
|
Interest cost |
|
264 |
|
233 |
|
213 |
| |||
|
Plan participants’ contributions |
|
|
|
|
|
|
| |||
|
Amendments |
|
— |
|
126 |
|
— |
| |||
|
Actuarial (gains)/losses |
|
(184 |
) |
(226 |
) |
325 |
| |||
|
Acquisitions/(divestitures) |
|
— |
|
— |
|
— |
| |||
|
Expected benefits paid |
|
(67 |
) |
(59 |
) |
(59 |
) | |||
|
Projected benefit obligation at end of year |
|
$ |
5,411 |
|
$ |
4,808 |
|
$ |
4,288 |
|
|
Unfunded projected/accumulated benefit obligation |
|
(5,411 |
) |
(4,808 |
) |
(4,288 |
) | |||
|
Additional liability |
|
$ |
— |
|
$ |
— |
|
$ |
— |
|
|
|
|
|
|
|
|
|
| |||
|
Weighted average assumptions to determine benefit obligation as of December 31: |
|
|
|
|
|
|
| |||
|
Discount rate |
|
5.75 |
% |
5.75 |
% |
5.75 |
% | |||
|
Rate of compensation increase |
|
5.00 |
% |
5.00 |
% |
5.00 |
% | |||
The components of net periodic benefit cost recognized for the years ended December 31, 2012 and 2011 and the amounts in accumulated other comprehensive income expected to be recognized as components of net periodic benefit cost during the year ended December 31, 2013 are as follows:
|
|
|
Year ended December 31, |
| |||||||
|
(dollars in thousands) |
|
2013 |
|
2012 |
|
2011 |
| |||
|
Components of net periodic benefit cost |
|
|
|
|
|
|
| |||
|
Service cost |
|
$ |
624 |
|
$ |
590 |
|
$ |
446 |
|
|
Interest cost |
|
309 |
|
264 |
|
233 |
| |||
|
Expected return on plan assets |
|
— |
|
— |
|
— |
| |||
|
Amortization of transition obligation (asset) |
|
— |
|
— |
|
— |
| |||
|
Amortization of prior service cost |
|
95 |
|
95 |
|
86 |
| |||
|
Amortization of actuarial (gains)/losses |
|
(50 |
) |
(33 |
) |
(14 |
) | |||
|
Net periodic benefit cost |
|
$ |
978 |
|
$ |
916 |
|
$ |
751 |
|
|
|
|
|
|
|
|
|
| |||
|
Other comprehensive income (cost) |
|
$ |
(45 |
) |
$ |
(62 |
) |
$ |
(72 |
) |
11. RELATED PARTY TRANSACTIONS
There are no existing or proposed material interests or transactions between the Bank and/or any of its officers or directors outside the ordinary course of the Bank’s business.
12. COMMITMENTS AND CONTINGENT LIABILITIES
Lease Commitments
The Bank’s San Jose and Palo Alto locations are leased under non-cancelable operating leases that expire in 2016 and 2014, respectively. The Bank has renewal options with adjustments to the lease payments based on changes in the consumer price index.
Future minimum annual lease payments are as follows (dollars in thousands):
|
Future lease payments |
|
|
| |
|
For years ended December 31, |
|
|
| |
|
|
|
|
| |
|
2013 |
|
$ |
1,890 |
|
|
2014 |
|
1,658 |
| |
|
2015 |
|
1,672 |
| |
|
2016 |
|
1,582 |
| |
|
2017 |
|
16 |
| |
|
|
|
$ |
6,818 |
|
Rental expense under operating leases was $2.0 million in 2012, $1.9 million in 2011 and $2.0 million in 2010.
Other Commitments
In the normal course of business, there are outstanding commitments to extend credit, which are not reflected in the consolidated financial statements. These commitments involve, to varying degrees, credit risk in excess of the amount recognized as either an asset or a liability in the balance sheet. The Bank controls the credit risk through its credit approval process. The same credit policies are used when entering into such commitments.
The Bank is party to financial instruments with off-balance-sheet risk in the normal course of business to meet the financing needs of its customers. These financial instruments include loan commitments of $457.1 million, $429.4
million and $286.8 million at December 31, 2012, 2011 and 2010, respectively. The Bank’s exposure to credit loss is limited to amounts funded or drawn; however, at December 31, 2012, no losses are anticipated as a result of these commitments. We have also issued certain guarantees which include financial letters of credit in the amounts of $24.6 million, $18.8 million, and $16.8 at December 31, 2012, 2011 and 2010, respectively.
Loan commitments are typically contingent upon the borrowers meeting certain financial and other covenants and such commitments typically have fixed expiration dates and require payment of a fee. As many of these commitments are expected to expire without being drawn upon, the total commitments do not necessarily represent future cash requirements. The Bank evaluates each potential borrower and the necessary collateral on an individual basis. Collateral varies, and may include real property, bank deposits, or business or personal assets.
Undisbursed loan commitments were comprised of the following at December 31, 2012 (dollars in thousands):
|
Loan Category |
|
Amount |
| |
|
|
|
|
| |
|
Commercial |
|
$ |
337,783 |
|
|
SBA |
|
— |
| |
|
Real estate construction |
|
33,547 |
| |
|
Land loans |
|
— |
| |
|
Real estate other |
|
14,786 |
| |
|
Factoring/ABL |
|
59,306 |
| |
|
Other |
|
11,685 |
| |
|
Total |
|
$ |
457,107 |
|
13. DISCLOSURE OF FAIR VALUE OF FINANCIAL INSTRUMENTS
In accordance with accounting guidance, the Company groups its financial assets and financial liabilities measured at fair value in three levels, based on the markets in which the assets and liabilities are traded and the reliability of the assumptions used to determine fair value. These levels are:
Level 1 — Valuations for assets and liabilities traded in active exchange markets, such as the New York Stock Exchange. Level 1 also includes U.S. Treasury, other U.S. government and agency mortgage-backed securities that are traded by dealers or brokers in active markets. Valuations are obtained from readily available pricing sources for market transactions involving identical assets or liabilities.
Level 2 — Valuations for assets and liabilities traded in less active dealer or broker markets. Valuations are obtained from third party pricing services for identical or comparable assets or liabilities.
Level 3 — Valuations for assets and liabilities that are derived from other valuation methodologies, including option pricing models, discounted cash flow models and similar techniques, and not based on market exchange, dealer, or broker traded transactions. Level 3 valuations incorporate certain assumptions and projections in determining the fair value assigned to such assets or liabilities.
The balances of assets and liabilities measured at fair value on a recurring basis are as follows:
|
|
|
As of December 31, 2012 |
| ||||||||||
|
(dollars in thousands) |
|
Total |
|
Level 1 |
|
Level 2 |
|
Level 3 |
| ||||
|
|
|
|
|
|
|
|
|
|
| ||||
|
Securities available for sale |
|
$ |
251,967 |
|
$ |
248,511 |
|
$ |
3,456 |
|
$ |
— |
|
|
Cash flow hedge |
|
(1,784 |
) |
— |
|
(1,784 |
) |
— |
| ||||
|
Warrant portfolio |
|
418 |
|
— |
|
— |
|
418 |
| ||||
|
|
|
|
|
|
|
|
|
|
| ||||
|
Total |
|
$ |
250,601 |
|
$ |
248,511 |
|
$ |
1,672 |
|
$ |
418 |
|
|
|
|
As of December 31, 2011 |
| ||||||||||
|
|
|
Total |
|
Level 1 |
|
Level 2 |
|
Level 3 |
| ||||
|
|
|
|
|
|
|
|
|
|
| ||||
|
Securities available for sale |
|
$ |
224,011 |
|
$ |
216,437 |
|
$ |
7,574 |
|
$ |
— |
|
|
Cash flow hedge |
|
(2,135 |
) |
— |
|
(2,135 |
) |
— |
| ||||
|
Warrant portfolio |
|
563 |
|
— |
|
— |
|
563 |
| ||||
|
|
|
|
|
|
|
|
|
|
| ||||
|
Total |
|
$ |
222,439 |
|
$ |
216,437 |
|
$ |
5,439 |
|
$ |
563 |
|
There were no transfers between Level 1 and Level 2 during the period for assets and liabilities measured at fair value on a recurring basis.
The changes in Level 3 assets and liabilities measured at fair value on a recurring basis were not material for the year ended December 31, 2012.
The Company may be required, from time to time, to measure certain other financial assets at fair value on a non-recurring basis in accordance with GAAP. These adjustments to fair value usually result from application of lower-of-cost-or-market accounting or write-downs of individual assets. The assets measured at fair value on a non-recurring basis for the years ended December 31, 2012 and 2011 included OREO of $144,000 and $4.1 million, respectively. The fair value of OREO was determined using Level 2 assumptions. The Company charged-off $39,000 and $335,000 during the years ended December 31, 2012 and 2011, respectively, as a result of declines in the OREO property values. The assets measured at fair value on a non-recurring basis for the years ended December 31, 2012 and 2011 also included impaired loans of $19.4 million and $22.5 million, respectively. The fair value of impaired loans was determined using Level 3 assumptions. The Company charged-off $3.1 million and $2.9 million during the years ended December 31, 2012 and 2011, respectively, as a result of impaired loans. The fair value of impaired loans was determined using Level 3 assumptions. In determining the net realizable value of the underlying collateral for impaired loans, the Company primarily relied on third party appraisals which were then discounted from 15% to 25% (with additional discounts depending on the age of the appraisal) to cover both market price fluctuations and selling costs the Company expected would be incurred in the event of foreclosure. In addition to the discounts taken, the Company’s calculation of net realizable value considered any other senior liens in place on the underlying collateral.
The following estimated fair value amounts have been determined by using available market information and appropriate valuation methodologies. However, considerable judgment is required to interpret market data to develop the estimates of fair value. Accordingly, the estimates presented are not necessarily indicative of the amounts that could be realized in a current market exchange. The use of different market assumptions and/or estimation techniques may have a material effect on the estimated fair value amounts.
The following table presents the carrying amount and estimated fair value of certain assets and liabilities of the Company at December 31, 2012 and 2011:
|
|
|
Year ended December 31, |
| ||||||||||
|
|
|
2012 |
|
2011 |
| ||||||||
|
|
|
Carrying |
|
Fair |
|
Carrying |
|
Fair |
| ||||
|
(dollars in thousands) |
|
Value |
|
Value |
|
Value |
|
Value |
| ||||
|
|
|
|
|
|
|
|
|
|
| ||||
|
Financial assets: |
|
|
|
|
|
|
|
|
| ||||
|
Cash and due from banks |
|
$ |
17,251 |
|
$ |
17,251 |
|
$ |
17,135 |
|
$ |
17,135 |
|
|
Federal funds sold |
|
113,790 |
|
113,790 |
|
106,690 |
|
106,690 |
| ||||
|
Interest bearing Deposits in other Banks |
|
335 |
|
335 |
|
335 |
|
335 |
| ||||
|
Investments securities |
|
267,204 |
|
267,574 |
|
240,268 |
|
240,615 |
| ||||
|
Loans and leases, net of unearned fees |
|
905,523 |
|
906,228 |
|
759,236 |
|
760,884 |
| ||||
|
Bank owned life insurance |
|
15,954 |
|
15,954 |
|
10,782 |
|
10,782 |
| ||||
|
|
|
|
|
|
|
|
|
|
| ||||
|
Financial liabilities: |
|
|
|
|
|
|
|
|
| ||||
|
Deposits |
|
1,162,548 |
|
1,158,518 |
|
998,675 |
|
996,659 |
| ||||
|
Trust preferred securities |
|
17,527 |
|
17,588 |
|
17,527 |
|
17,600 |
| ||||
|
Other borrowings |
|
— |
|
— |
|
— |
|
— |
| ||||
|
Cash flow hedge |
|
1,784 |
|
1,784 |
|
2,135 |
|
2,135 |
| ||||
Because no market exists for a significant portion of the Company’s financial instruments, fair value estimates are based on judgments regarding current economic conditions, risk characteristics of various financial instruments and other factors. These estimates are subjective in nature and involve uncertainties and matters of significant judgment and therefore cannot be determined with precision. Changes in assumptions could significantly affect the fair values presented. The following methods and assumptions were used by the Company to estimate the fair values of its financial instruments at Decmber 31, 2012 and 2011:
Cash and Cash Equivalents
The carrying amount of cash and cash equivalents approximate the fair value and are classified as Level 1 in the fair value hierarchy.
Investment Securities
For investment securities, fair values are based on quoted market prices, where available, and are classified as Level 1. If quoted market prices are not available, fair values are estimated using quoted market prices for similar securities and indications of value provided by brokers and are classified as Level 2.
For the year ended December 31, 2012, there were two mortgage backed securities, available for sale, classified as Level 2 with a fair value of $3.5 million. All other securities were classified as Level 1. For the year ended December 31, 2011, there were three mortage backed securities, available for sale, classified as Level 2 with a fair value of $7.6 million. All other securities were classified as Level 1.
Loans
The fair value of variable rate loans that reprice frequently and with no significant change in credit risk is based on the carrying value and results in a classification of Level 3 within the fair value hierarchy. Fair value for other loans are estimated using discounted cash flow analysis using interest rates currently being offered for loans with similar terms to borrowers of similar credit quality resulting in a Level 3 classification in the fair value hierarchy. The methods used to estimate the fair value of loans do not necessarily represent an exit price.
Trust preferred securities
The fair value of the trust preferred securities approximates the pricing of a preferred security at current market prices.
Deposits
The fair value of demand deposits (e.g. interest and non-interest bearing, savings and certain types of money market accounts) are, by definition , equal to the amount payable in demand at the reporting date (i.e. carrying value) resulting in a Level 2 classification in the fair value hierarchy. The carrying amounts of variable rate, fixed-term money market accounts and certificate of deposits approximates their fair value at the reporting date in a Level 2 classification in the fair value hierarchy. Fair values for fixed rate certificate of deposits are estimated using a discounted cash flow calculation that applies interest rates currently being offered on certificates to a schedule of aggregated expected monthly maturities on time deposits resulting in a Level 2 classification.
Cash Flow Hedge
Although the Company has determined that the majority of the inputs used to value its derivatives fall within Level 2 of the fair value hierarchy, the credit valuation adjustments associated with its derivatives utilize Level 3 inputs — model-derived credit spreads. The level in the fair value hierarchy within which the fair value measurement in their entirety fall shall be determined based on the lowest level input that is significant to the fair value measurement in its entirety. Because the inputs used to measure the fair value of the Company’s derivatives fall into different levels of the fair value hierarchy, as of December 31, 2012 and December 31, 2011, the Company has assessed the significance of the impact of the credit valuations adjustment on the overall valuation of its derivative positions and has determined that the credit valuation adjustment is not significant to the overall valuation of its derivative portfolios. As a result, the Company classifies its derivative valuations in Level 2 of the fair value hierarchy.
14. DERIVATIVE INSTRUMENTS AND HEDGING ACTIVITIES
The Company is exposed to certain risks arising from both its business operations and economic conditions. The Company principally manages its exposures to a wide variety of business and operational risks through management of its core business activities. The Company manages economic risks, including interest rate, liquidity, and credit risk, primarily by managing the amount, sources, and duration of its assets and liabilities and through the use of derivative financial instruments. Specifically, the Company enters into derivative financial instruments to manage exposures that arise from business activities that result in the receipt or payment of future known and uncertain cash amounts, the value of which are determined by interest rates. The Company’s derivative financial instruments are used to manage differences in the amount, timing, and duration of the Company’s known or expected cash receipts and its known or expected cash payments principally related to certain variable rate loan assets and variable rate borrowings. The Company does not use derivatives for trading or speculative purposes and currently does not have any derivatives that are not designated in qualifying hedging relationships.
Fair Values of Derivative Instruments on the Balance Sheet
The table below presents the fair value of the Company’s derivative instruments that were liabilities, as well as their classification on the balance sheet, as of December 31, 2012 and December 31, 2011. The Company did not have any derivative instruments that were assets as of December 31, 2012 and December 31, 2011:
|
|
|
|
|
Fair Value |
| ||||
|
Derivatives Designated as Hedging |
|
Balance Sheet |
|
December 31, |
|
December 31, |
| ||
|
Instruments Under SFAS 133 |
|
Location |
|
2012 |
|
2011 |
| ||
|
|
|
|
|
|
|
|
| ||
|
Interest rate contracts |
|
Other assets |
|
$ |
— |
|
$ |
— |
|
|
Interest rate contracts |
|
Other liabilities |
|
1,784 |
|
2,135 |
| ||
|
|
|
|
|
|
|
|
| ||
|
Total hedged derivatives |
|
|
|
$ |
1,784 |
|
$ |
2,135 |
|
Cash Flow Hedges of Interest Rate Risk
The Company’s objectives in using interest rate derivatives are to add stability to interest income and expense and to manage its exposure to interest rate movements. To accomplish this objective, the Company primarily uses interest rate swaps as part of its interest rate risk management strategy. For hedges of the Company’s variable-rate loan assets, interest rate swaps designated as cash flow hedges involve the receipt of fixed-rate amounts from a counterparty in exchange for the Company making variable-rate payments over the life of the agreements without exchange of the underlying notional amount. For hedges of the Company’s variable-rate borrowings, interest rate swaps designated as cash flow hedges involve the receipt of variable-rate amounts from a counterparty in exchange for the Company making fixed-rate payments. As of December 31, 2012, the Company had two interest rate swaps with an aggregate notional amount of $17.5 million that were designated as cash flow hedges of interest rate risk associated with the Company’s variable-rate borrowings.
The effective portion of changes in the fair value of derivatives designated and that qualify as cash flow hedges is recorded in Accumulated Other Comprehensive Income (“AOCI”) and is subsequently reclassified into earnings in the period that the hedged forecasted transaction affects earnings. The ineffective portion of the change in fair value of the derivatives is recognized directly in earnings. No hedge ineffectiveness was recognized during the years ended December 31, 2012 and 2011.
During the years ended December 31, 2012 and 2011, such derivatives were used to hedge the forecasted variable cash outflows associated with subordinated debt related to trust preferred securities. During the years ended December 31, 2012 and 2011, the amount of pre-tax gain/(loss) recorded in AOCI due to the effective portion of changes in fair value of derivatives designated as cash flow hedges was $(333,000) and $(981,000), respectively.
Amounts reported in AOCI related to derivatives will be reclassified to interest income or expense, as applicable, as interest payments are received/made on the Company’s variable-rate assets/liabilities. During the next twelve months, the Company estimates that $705,885 will be reclassified as an increase to interest expense.
The table below summarizes the impact of the Company’s derivative financial instruments (interest rate contracts) on earnings for the years ended December 31, 2012 and 2011. All derivative income or expense recognized during these periods was a result of the effective portion of cash flow
hedges. There was no ineffective portion of cash flow hedges during the years ended December 31, 2012 and 2011, and as such there were no amounts included in derivative income or expense during these periods:
|
|
|
Amount of gain/(loss) reclassified from AOCI |
| ||||
|
|
|
into earnings - effective portion |
| ||||
|
|
|
Year ended December 31, |
| ||||
|
(dollars in thousands) |
|
2012 |
|
2011 |
| ||
|
|
|
|
|
|
| ||
|
Net interest income |
|
$ |
(684 |
) |
$ |
(591 |
) |
|
Non-interest income |
|
— |
|
— |
| ||
|
|
|
|
|
|
| ||
|
Total derivative income |
|
$ |
(684 |
) |
$ |
(591 |
) |
Credit Risk Related Contingent Features
The Company has an agreement with one of its derivative counterparties that contains a provision where if the Company defaults on any of its indebtedness, including default where repayment of the indebtedness has not been accelerated by the lender, then the Company could also be declared in default on its derivative obligations.
The Company also has agreements with certain of its derivative counterparties that contains a provision where if the Company fails to maintain its status as a well / adequate capitalized institution, then the counterparty could terminate the derivative positions and the Company would be required to settle its obligations under the agreements.
As of December 31, 2012, the fair value of derivatives in a net liability position, which includes accrued interest but excludes any adjustment for nonperformance risk, related to these agreements was $1.8 million. As of December 31, 2012, the Company has minimum collateral posting thresholds with certain of its derivative counterparties and has posted collateral of $2.4 million against its obligations under these agreements. If the Company had breached any of these provisions at December 31, 2012, it could have been required to settle its obligations under the agreements at the termination value.
15. BRIDGE CAPITAL HOLDINGS
The following are the financial statements of Bridge Capital Holdings (parent company only):
BALANCE SHEETS
|
|
|
As of December 31, |
| ||||
|
(dollars in thousands) |
|
2012 |
|
2011 |
| ||
|
Assets: |
|
|
|
|
| ||
|
Cash and due from banks |
|
$ |
5,659 |
|
$ |
4,806 |
|
|
Investments |
|
— |
|
— |
| ||
|
Investment in bank & subsidiaries |
|
158,802 |
|
142,028 |
| ||
|
Other assets |
|
1,681 |
|
2,402 |
| ||
|
Total Assets |
|
$ |
166,142 |
|
$ |
149,236 |
|
|
|
|
|
|
|
| ||
|
Liabilities: |
|
|
|
|
| ||
|
Junior Subordinated Debt |
|
$ |
17,527 |
|
$ |
17,527 |
|
|
Other liabilities |
|
1,869 |
|
2,196 |
| ||
|
Total Liabilities |
|
19,396 |
|
19,723 |
| ||
|
|
|
|
|
|
| ||
|
Capital: |
|
|
|
|
| ||
|
Common stock |
|
108,963 |
|
106,673 |
| ||
|
Preferred stock |
|
— |
|
— |
| ||
|
Retained earnings |
|
23,430 |
|
15,584 |
| ||
|
Current year net income |
|
13,804 |
|
7,847 |
| ||
|
Other Comprehensive income |
|
549 |
|
(591 |
) | ||
|
Total Capital |
|
146,746 |
|
129,513 |
| ||
|
Total Liabilities and Capital |
|
$ |
166,142 |
|
$ |
149,236 |
|
STATEMENTS OF OPERATIONS
|
|
|
Year ended December 31, |
| |||||||
|
(dollars in thousands) |
|
2012 |
|
2011 |
|
2010 |
| |||
|
|
|
|
|
|
|
|
| |||
|
Interest income |
|
$ |
7 |
|
$ |
12 |
|
$ |
32 |
|
|
Interest expense |
|
1,076 |
|
1,084 |
|
1,086 |
| |||
|
Noninterest income |
|
1,422 |
|
392 |
|
36 |
| |||
|
Noninterest expense |
|
1,143 |
|
790 |
|
647 |
| |||
|
|
|
|
|
|
|
|
| |||
|
Loss before income taxes |
|
(790 |
) |
(1,470 |
) |
(1,665 |
) | |||
|
Income tax benefit |
|
327 |
|
712 |
|
— |
| |||
|
Loss before undistributed income of the bank |
|
(463 |
) |
(758 |
) |
(1,665 |
) | |||
|
Equity in undistributed income of the bank |
|
14,267 |
|
8,605 |
|
4,256 |
| |||
|
Net income |
|
$ |
13,804 |
|
$ |
7,847 |
|
$ |
2,591 |
|
STATEMENTS OF COMPREHENSIVE INCOME
|
|
|
Year Ended December 31, |
| |||||||
|
(dollars in thousands) |
|
2012 |
|
2011 |
|
2010 |
| |||
|
|
|
|
|
|
|
|
| |||
|
Net Income |
|
$ |
13,804 |
|
$ |
7,847 |
|
$ |
2,591 |
|
|
|
|
|
|
|
|
|
| |||
|
Other Comprehensive Income (Loss): |
|
|
|
|
|
|
| |||
|
Unrealized gains/(losses) on cash flow hedges |
|
351 |
|
(384 |
) |
(956 |
) | |||
|
Other comprehensive income (loss), before income taxes |
|
$ |
351 |
|
$ |
(384 |
) |
$ |
(956 |
) |
|
Income tax (expense) benefit |
|
(140 |
) |
154 |
|
223 |
| |||
|
Other comprehensive income (loss), net of tax |
|
$ |
211 |
|
$ |
(230 |
) |
$ |
(733 |
) |
|
|
|
|
|
|
|
|
| |||
|
Comprehensive Income |
|
$ |
14,015 |
|
$ |
7,617 |
|
$ |
1,858 |
|
STATEMENTS OF CASH FLOWS
|
|
|
Year ended December 31, |
| |||||||
|
(dollars in thousands) |
|
2012 |
|
2011 |
|
2010 |
| |||
|
|
|
|
|
|
|
|
| |||
|
Cash Flow From Operating Activities: |
|
|
|
|
|
|
| |||
|
Net income |
|
$ |
13,804 |
|
$ |
7,847 |
|
$ |
2,591 |
|
|
Adjustments to reconcile net income to net cash provided by operating activities: |
|
|
|
|
|
|
| |||
|
Equity in undistributed earnings (loss) of subsidiaries |
|
(14,267 |
) |
(8,605 |
) |
(4,256 |
) | |||
|
Additional paid in capital stock option expense |
|
2,160 |
|
— |
|
— |
| |||
|
Net change in other assets |
|
(781 |
) |
(700 |
) |
(230 |
) | |||
|
Net change in other liabilities |
|
(329 |
) |
277 |
|
(480 |
) | |||
|
Net cash (used in) provided by operating activities |
|
586 |
|
(1,181 |
) |
(2,375 |
) | |||
|
|
|
|
|
|
|
|
| |||
|
Cash Flow From Investing Activities: |
|
|
|
|
|
|
| |||
|
Purchase and sale of investments available for sale |
|
— |
|
40,153 |
|
(40,153 |
) | |||
|
Investment in subsidiary |
|
— |
|
(15,460 |
) |
— |
| |||
|
Net cash provided by (used in) financing activities |
|
— |
|
24,693 |
|
(40,153 |
) | |||
|
|
|
|
|
|
|
|
| |||
|
Cash Flow From Financing Activities: |
|
|
|
|
|
|
| |||
|
Proceeds from sale of Common stock |
|
267 |
|
1,459 |
|
30,370 |
| |||
|
Repurchase of Preferred stock and related warrant |
|
— |
|
(25,259 |
) |
— |
| |||
|
Common stock issued - preferred dividends |
|
— |
|
— |
|
2,179 |
| |||
|
Payment of cash dividends |
|
— |
|
(200 |
) |
(1,955 |
) | |||
|
Net cash (used in) provided by financing activities |
|
267 |
|
(24,000 |
) |
30,594 |
| |||
|
|
|
|
|
|
|
|
| |||
|
Net decrease in cash and equivalents |
|
853 |
|
(488 |
) |
(11,934 |
) | |||
|
Cash and equivalents at beginning of period |
|
4,806 |
|
5,294 |
|
17,228 |
| |||
|
Cash and equivalents at end of period |
|
$ |
5,659 |
|
$ |
4,806 |
|
$ |
5,294 |
|
16. REGULATORY MATTERS
The Bank and the Holding Company are subject to various regulatory capital requirements administered by federal banking agencies. Failure to meet minimum capital requirements can initiate certain mandatory, and possibly additional, discretionary actions by regulators that, if undertaken, could have a direct material effect on the Company’s financial statements. Under capital adequacy guidelines and the regulatory framework for prompt corrective action, the Company must meet specific capital guidelines that involve quantitative measures of the Company’s assets, liabilities, and certain off-balance-sheet items as calculated under regulatory accounting practices. The Company’s capital amounts and classification are also subject to qualitative judgments by the regulators about components, risk weightings, and other factors.
Quantitative measures established by regulation to ensure capital adequacy require the Bank and the Company to maintain minimum amounts and ratios (set forth in the table below) of total and Tier 1 capital (as defined in the regulations) to risk-weighted assets (as defined in the regulations), and of Tier I capital (as defined in the regulations) to average assets (as defined in the regulations). Management believes, as of December 31, 2012, that the Bank and the Company meets all capital adequacy requirements to which they are subject.
The following table shows the Company’s capital ratios at December 31, 2012 and 2011 as well as the minimum capital ratios required to be deemed “well capitalized” under the regulatory framework.
|
|
|
As of December 31, |
| ||||||||
|
|
|
2012 |
|
2011 |
| ||||||
|
(dollars in thousands) |
|
Amount |
|
Ratio |
|
Amount |
|
Ratio |
| ||
|
Company Capital Ratios |
|
|
|
|
|
|
|
|
| ||
|
Tier 1 Capital |
|
$ |
161,074 |
|
13.98 |
% |
$ |
147,043 |
|
14.80 |
% |
|
(to Risk Weighted Assets) |
|
|
|
|
|
|
|
|
| ||
|
Tier 1 capital minimum requirement |
|
$ |
69,149 |
|
6.00 |
% |
$ |
59,597 |
|
6.00 |
% |
|
|
|
|
|
|
|
|
|
|
| ||
|
Total Capital |
|
$ |
175,548 |
|
15.23 |
% |
$ |
159,540 |
|
16.06 |
% |
|
(to Risk Weighted Assets) |
|
|
|
|
|
|
|
|
| ||
|
Total capital minimum requirement |
|
$ |
115,248 |
|
10.00 |
% |
$ |
99,328 |
|
10.00 |
% |
|
|
|
|
|
|
|
|
|
|
| ||
|
Company leverage |
|
|
|
|
|
|
|
|
| ||
|
Tier 1 Capital |
|
$ |
161,074 |
|
12.50 |
% |
$ |
147,043 |
|
13.36 |
% |
|
(to Average Assets) |
|
|
|
|
|
|
|
|
| ||
|
Total capital minimum requirement |
|
$ |
64,433 |
|
5.00 |
% |
$ |
55,020 |
|
5.00 |
% |
|
|
|
|
|
|
|
|
|
|
| ||
|
Bank Risk Based Capital Ratios |
|
|
|
|
|
|
|
|
| ||
|
Tier 1 Capital |
|
$ |
136,227 |
|
11.82 |
% |
$ |
121,296 |
|
12.27 |
% |
|
(to Risk Weighted Assets) |
|
|
|
|
|
|
|
|
| ||
|
Tier 1 capital minimum requirement |
|
$ |
69,142 |
|
6.00 |
% |
$ |
59,298 |
|
6.00 |
% |
|
|
|
|
|
|
|
|
|
|
| ||
|
Total Capital |
|
$ |
150,700 |
|
13.08 |
% |
$ |
133,725 |
|
13.53 |
% |
|
(to Risk Weighted Assets) |
|
|
|
|
|
|
|
|
| ||
|
Total capital minimum requirement |
|
$ |
115,236 |
|
10.00 |
% |
$ |
98,830 |
|
10.00 |
% |
|
|
|
|
|
|
|
|
|
|
| ||
|
Bank leverage |
|
|
|
|
|
|
|
|
| ||
|
Tier 1 Capital |
|
$ |
136,227 |
|
10.59 |
% |
$ |
121,296 |
|
11.17 |
% |
|
(to Average Assets) |
|
|
|
|
|
|
|
|
| ||
|
Total capital minimum requirement |
|
$ |
64,326 |
|
5.00 |
% |
$ |
54,317 |
|
5.00 |
% |
17. Preferred Stock and Warrant under the TARP Capital Purchase Program
On December 23, 2008, the Company issued 23,864 shares of Series C Preferred Stock (Preferred Stock) and a 10-year Warrant to purchase up to 396,412 shares of the Company’s common stock at an exercise price of $9.03 per share. The Company sold the Preferred Stock and Warrant to the U.S. Treasury under the TARP Capital Purchase Program for an aggregate amount of $23.9 million. The Company has paid a cash dividend on the Preferred Stock of 5% per annum since the issuance.
The Company recorded the issuance of the Preferred Stock and Warrant as an increase in shareholders’ equity. The net proceeds from the transaction were allocated between Preferred Stock and the Warrant based on their respective fair values at the date of the issuance. Utilizing the results of a Black-Sholes model, the Company allocated approximately $70,000 to the Warrant (i.e. the discount on the Preferred Stock) to be amortized over a five year period.
On March 16, 2011, the Company fully redeemed all of its Preferred Stock under the TARP Capital Purchase Program for $23.9 million. The redemption was funded by the net proceeds from a $30.0 million private placement of the Company’s common stock completed in the fourth quarter of 2010. As a result of the early repayment, the Company recorded a $30,000 charge in the first quarter of 2011 to reflect the accelerated accretion of the remaining discount on the preferred stock.
On April 20, 2011, the Company negotiated and repurchased the Warrant held by the U.S. Treasury for $1.4 million, which was recorded as a reduction to shareholders’ equity.
See “Management’s Discussion and Analysis of Financial Condition and Results of Operations — Capital Resources” for additional preferred and common stock discussion.
Item 9. Changes in and Disagreements with Accountants on Accounting and Financial Disclosure
There are no current or anticipated changes in, or disagreements with, accountants on any matter of accounting principles or practices, financial statement disclosure or auditing scope or procedure.
Item 9a. Controls and Procedures
Disclosure Controls and Procedures
As required by SEC rules, the Company’s management evaluated the effectiveness, as of December 31, 2012, of the Company’s disclosure controls and procedures. The Company’s chief executive officer and chief financial officer participated in the evaluation. Based on this evaluation, the Company’s chief executive officer and chief financial officer concluded that the Company’s disclosure controls and procedures were effective as of December 31, 2012 to ensure that information required to be disclosed by the Company in the reports that it files or submits under the Securities Exchange Act of 1934 is recorded, processed, summarized and reported, within the time periods specified in the Commission’s rules and that information required to be disclosed by the Company in the reports that it files or submits under the Act is accumulated and communicated to its management, including its principal executive and principal officers, or persons performing similar functions, as appropriate to allow timely decisions regarding required disclosures.
Internal Control over Financial Reporting
Internal control over financial reporting is defined in Rule 13a-15(f) promulgated under the Securities Exchange Act of 1934 as a process designed by, or under the supervision of, the company’s principal executive and principal financial officers and effected by the company’s board of directors, management and other personnel, to provide reasonable assurance regarding the reliability of financial reporting and the preparation of financial statements for external purposes in accordance with generally accepted accounting principles and includes those policies and procedures that:
· pertain to the maintenance of records that in reasonable detail accurately and fairly reflect the transactions and dispositions of assets of the company;
· provide reasonable assurance that transactions are recorded as necessary to permit preparation of financial statements in accordance with generally accepted accounting principles, and that receipts and expenditures of
the company are being made only in accordance with authorizations of management and directors of the company; and
· provide reasonable assurance regarding prevention or timely detection of unauthorized acquisition, use or disposition of the company’s assets that could have a material effect on the financial statements.
Because of its inherent limitations, internal control over financial reporting may not prevent or detect misstatements. Projections of any evaluation of effectiveness to future periods are subject to the risk that controls may become inadequate because of changes in conditions, or that the degree of compliance with the policies or procedures may deteriorate. No change occurred during the fourth quarter of 2012 that has materially affected, or is reasonably likely to materially affect, the Company’s internal control over financial reporting. Management’s report on internal control over financial reporting is set forth below, and should be read with these limitations in mind.
Management’s Report on Internal Control over Financial Reporting
The Company’s management is responsible for establishing and maintaining adequate internal control over financial reporting for the Company. Management assessed the effectiveness of the Company’s internal control over financial reporting as of December 31, 2012, using the criteria set forth by the Committee of Sponsoring Organizations of the Treadway Commission (COSO) in Internal Control — Integrated Framework. Based on this assessment, management concluded that as of December 31, 2012, the Company’s internal control over financial reporting was effective.
Vavrinek, Trine, Day & Co., LLP, the independent registered public accounting firm that audited the Company’s financial statements included in the Annual Report, issued an audit report on the Company’s internal control over financial reporting as of, and for the year ended December 31, 2012. Vavrinek, Trine, Day & Co., LLP’s audit report appears on Page 51.
Item 9b. Other Information
Not applicable
PART III
Item 10. Directors, Executive Officers and Corporate Governance
The information required hereunder is incorporated by reference from the Company’s definitive proxy statement for the Company’s 2013 Annual Meeting of Shareholders (to be filed pursuant to Regulation 14A).
Item 11. Executive Compensation
The information required hereunder is incorporated by reference from the Company’s definitive proxy statement for the Company’s 2013 Annual Meeting of Shareholders (to be filed pursuant to Regulation 14A).
Item 12. Security Ownership of Certain Beneficial Owners and Management and Related Stockholder Matters
The following chart provides information as of December 31, 2012 concerning the Company’s equity compensation plans:
|
|
|
(A) |
|
(B) |
|
(C) |
| |
|
|
|
|
|
|
|
Number of Securities |
| |
|
|
|
Number of Securities |
|
|
|
Remaining Available |
| |
|
|
|
To Be Issued Upon |
|
Weighted Average |
|
For Future Issuance |
| |
|
|
|
Exercise of |
|
Grant Price of |
|
Under Equity |
| |
|
|
|
Outstanding Options, |
|
Outstanding Options, |
|
Compensation Plans |
| |
|
|
|
Restricted Stock, |
|
Restricted Stock, |
|
(Excluding Securities |
| |
|
|
|
Warrants, and Rights |
|
Warrants, and Rights |
|
Reflected in Column (A) |
| |
|
|
|
|
|
|
|
|
| |
|
Equity compensation plans approved by security holders |
|
2,164,186 |
|
$ |
11.54 |
|
173,319 |
|
|
|
|
|
|
|
|
|
| |
|
Equity compensation plans not approved by security holders |
|
— |
|
— |
|
— |
| |
|
|
|
|
|
|
|
|
| |
|
Total |
|
2,164,186 |
|
$ |
11.54 |
|
173,319 |
|
The additional information required hereunder is incorporated by reference from the Company’s definitive proxy statement for the Company’s 2013 Annual Meeting of Shareholders (to be filed pursuant to Regulation 14A).
Item 13. Certain Relationships and Related Transactions, and Director Independence
The information required hereunder is incorporated by reference from the Company’s definitive proxy statement for the Company’s 2013 Annual Meeting of Shareholders (to be filed pursuant to Regulation 14A).
Item 14. Principal Accounting Fees and Services
The information required hereunder is incorporated by reference from the Company’s definitive proxy statement for the Company’s 2013 Annual Meeting of Shareholders (to be filed pursuant to Regulation 14A).
PART IV
Item 15. Exhibits, Financial Statement Schedules
(a) (1) Financial Statements. This information is included in Part II, Item 8.
(a) (2) Financial Statement Schedules. All schedules have been omitted since the required information is not present or is not present in amounts sufficient to require submission of the schedule or because the information required is included in Consolidated Financial Statements or notes thereto.
(a) (3) Exhibits. The exhibit list required by this item is incorporated by reference to the accompanying Exhibit Index filed as part of this report.
(b) See (a) (3).
(c) See (a) (2).
SIGNATURES
Pursuant to the requirements of Section 13 or 15(d) of the Securities Exchange Act of 1934, the registrant has duly caused this report to be signed on its behalf by the undersigned, thereunto duly authorized.
BRIDGE CAPITAL HOLDINGS
|
Date: |
March 12, 2013 |
|
By: |
/s/ Daniel P. Myers |
|
|
|
Daniel P. Myers, President | ||
|
|
|
(Principal Executive Officer) | ||
Pursuant to the requirements of the Securities Exchange Act of 1934, this report has been signed below by the following persons on behalf of the registrant and in the capacities and on the dates indicated.
|
Name |
|
Title |
|
Date |
|
|
|
|
|
|
|
/s/Lawrence Owen Brown |
|
Director |
|
March 12, 2013 |
|
Lawrence Owen Brown |
|
|
|
|
|
|
|
|
|
|
|
/s/Howard N. Gould |
|
Director |
|
March 12, 2013 |
|
Howard Gould |
|
|
|
|
|
|
|
|
|
|
|
/s/Dr. Francis J. Harvey |
|
Director |
|
March 12, 2013 |
|
Dr. Francis J. Harvey |
|
|
|
|
|
|
|
|
|
|
|
|
|
Chairman |
|
|
|
/s/Allan C. Kramer, M.D. |
|
Director |
|
March 12, 2013 |
|
Allan C. Kramer, M.D. |
|
|
|
|
|
|
|
|
|
|
|
/s/Robert P. Latta |
|
Director |
|
March 12, 2013 |
|
Robert Latta |
|
|
|
|
|
|
|
|
|
|
|
|
|
Vice Chairman |
|
|
|
/s/Thomas M. Quigg |
|
Director |
|
March 12, 2013 |
|
Thomas M. Quigg |
|
|
|
|
|
|
|
|
|
|
|
|
|
President |
|
|
|
|
|
Chief Executive Officer |
|
|
|
/s/Daniel P. Myers |
|
Director |
|
March 12, 2013 |
|
Daniel P. Myers |
|
(Principal Executive Officer) |
|
|
|
|
|
|
|
|
|
/s/Christopher B. Paisley |
|
Director |
|
March 12, 2013 |
|
Christopher B. Paisley |
|
|
|
|
|
|
|
|
|
|
|
/s/Terry S. Schwakopf |
|
Director |
|
March 12, 2013 |
|
Terry S. Schwakopf |
|
|
|
|
|
|
|
|
|
|
|
/s/Barry A. Turkus |
|
Director |
|
March 12, 2013 |
|
Barry A. Turkus |
|
|
|
|
|
|
|
|
|
|
|
|
|
Executive Vice President |
|
|
|
|
|
Chief Financial Officer |
|
|
|
/s/Thomas A. Sa |
|
Director |
|
March 12, 2013 |
|
Thomas A. Sa |
|
(Principal Financial |
|
|
|
|
|
and Accounting Officer) |
|
|
INDEX TO EXHIBITS
|
Exhibit |
|
|
|
Number |
|
Description of Exhibit |
|
|
|
|
|
(3.1) |
|
Articles of Incorporation of the Company (incorporated by reference to Exhibit 3(i)(a) to the Company’s Current Report on Form 8-K dated 10/1/04) |
|
|
|
|
|
(3.2) |
|
Amendment to the Company’s Articles of Incorporation dated August 27, 2004 (incorporated by reference to Exhibit 3(i)(b) to the Company’s Current Report on Form 8-K dated 10/1/04) |
|
|
|
|
|
(3.3) |
|
Certificate of Determination specifying the terms of the Series A Junior Participating Preferred Stock (incorporated herein by reference to Exhibit 3.1 of the Company’s Current Report on Form 8-K, filed with the Securities Exchange Commission on August 22, 2008. |
|
|
|
|
|
(3.4) |
|
Certificate of Determination of Preferences and Rights of Series B Mandatorily Convertible Cumulative Perpetual Preferred Stock and Series B-1 Mandatorily Convertible Cumulative Perpetual Preferred Stock (incorporated by reference to Exhibit 3.1 of the Company’s Current Report on Form 8-K dated 12/19/08) |
|
|
|
|
|
(3.5) |
|
Certificates of Amendment of Certificates of Determination filed with the California Secretary of State on December 18, 2008 (incorporated by reference to Exhibits 3.2 and 3.3 of the Company’s Current Report on Form 8-K dated 12/24/08) |
|
|
|
|
|
(3.6) |
|
The Company’s Certificate of Determination of Preferences and Rights of Fixed Rate Cumulative Perpetual Preferred Stock, Series C, (incorporated by reference to Exhibit 3.2 of the Company’s Current Report on Form 8-K dated 12/19/08) |
|
|
|
|
|
(3.7) |
|
Bylaws as amended through December 18, 2008 (incorporated by reference to Exhibit 3.4 of the Company’s Amendment No. 1 to Form S-3 dated February 19, 2009) |
|
|
|
|
|
(4.1) |
|
Indenture dated as of December 21, 2004 between Bridge Capital Holdings and JP Morgan Chase Bank as Trustee (incorporated by reference to Exhibit 4.1 to the Company’s Annual Report on Form 10-K dated 12/31/04) |
|
|
|
|
|
(4.2) |
|
Amended and Restated Declaration of trust of Bridge Capital Holdings Trust I dated December 21, 2004 Trustee (incorporated by reference to Exhibit 4.2 to the Company’s Annual Report on Form 10-K dated 12/31/04) |
|
|
|
|
|
(4.3) |
|
Rights Agreement between the Company and American Stock Transfer & Trust Company, LLC dated as of August 21, 2008, which includes as Exhibit A the form of Certificate of Determination for the Series A Junior Participating Preferred Stock, as Exhibit B the Form of Rights Certificate and as Exhibit C a Summary of Rights to Purchase Shares of Preferred Stock (incorporated herein by reference to Exhibit 4.1 of the Company’s Current Report on Form 8-K, filed with the Securities and Exchange Commission on August 22, 2008) |
|
|
|
|
|
(10.1) |
|
Lease for banking office located at 6601 Koll Center Parkway, City of Pleasanton, County of Alameda, State of California (incorporated by reference to Exhibit 10.10 to the Quarterly Report on Form 10-Q for the quarter ended September 30, 2006) |
|
|
|
|
|
(10.2) |
|
Lease for banking office located at 525 University Avenue, City of Palo Alto, County of Santa Clara, State of California (incorporated by reference to Exhibit 10.6 to the Company’s Annual Report on Form 10-K dated 12/31/04) |
|
|
|
|
|
(10.3) |
|
Lease for Principal Executive Office and full service banking office located at 55 Almaden Boulevard, Suite 200, City of San Jose, County of Santa Clara, State of California (incorporated by reference to Exhibit 10.16 to the Company’s Annual Report on Form 10-K dated 12/31/03) |
|
(10.4) |
|
Lease for additional space (fourth floor) at the Principal Executive Office located at 55 Almaden Boulevard, Suite 200, City of San Jose, State of California (incorporated by reference to Exhibit 10.16 to the Company’s Annual Report on Form 10-K dated 12/31/06) |
|
|
|
|
|
(10.5) |
|
Amendment to lease for banking office located at 525 University Avenue, City of Palo Alto, County of Santa Clara, State of California (incorporated by reference to Exhibit 10.17 to the Company’s Annual Report on Form 10-K dated 12/31/07) |
|
|
|
|
|
(10.6) |
|
Wire Transfer Service Agreement with BankServ, Inc dated 6/25/02 California (incorporated by reference to Exhibit 10.8 to the Company’s Annual Report on Form 10-K dated 12/31/04) |
|
|
|
|
|
(10.7) |
|
Bridge Bank Amended and Restated 2001 Stock Option Plan (incorporated by reference to Exhibit 10.1 to the Company’s Annual Report on Form 10-K dated 12/31/04)** |
|
|
|
|
|
(10.8) |
|
Bridge Bank, National Association Supplemental Executive Retirement Plan (incorporated by reference to Exhibit 10.2 to the Company’s Annual Report on Form 10-K dated 12/31/04)** |
|
|
|
|
|
(10.9) |
|
Bridge Capital Holdings 2006 Equity Incentive Plan (incorporated by reference to Annex A to the Company’s Proxy Statement dated 04/07/06)** |
|
|
|
|
|
(10.10) |
|
Information Technology Services Agreement between Fidelity National Information Services and Bridge Bank, N.A. dated November 17, 2006 and the schedules thereto (incorporated by reference to Exhibit 10 to the Company’s Current Report on Form 8-K, Amendment No. 1, filed 02/16/07) |
|
|
|
|
|
(10.11) |
|
Form of Restricted Stock Purchase Award Agreement under the Bridge Capital Holdings 2006 Equity Incentive Plan (incorporated by reference to Exhibit 10.1 to the Company’s Current Report on Form 8-K dated 11/16/06)** |
|
|
|
|
|
(10.12) |
|
Form of Stock Option Award Agreement under the Bridge Capital Holdings 2006 Equity Incentive Plan (incorporated by reference to Exhibit 10.2 to the Company’s Current Report on Form 8-K dated 11/16/06)** |
|
|
|
|
|
(10.13) |
|
Amendment to the Company’s 2001 Stock Option Plan to permit the net exercise of nonstatutory options (incorporated by reference to Exhibit 10.3 to the Company’s Current Report on Form 8-K dated 11/16/06)** |
|
|
|
|
|
(10.14) |
|
Employment Agreement between Daniel P. Myers, Bridge Capital Holdings and Bridge Bank, National Association dated June 15, 2010 (incorporated by reference to Exhibit 10.1 to the Company’s Current Report on Form 8-K filed June 21, 2010)** |
|
|
|
|
|
(10.15) |
|
Employment Agreement between Thomas A. Sa, Bridge Capital Holdings and Bridge Bank, National Association dated June 15, 2010 (incorporated by reference to Exhibit 10.2 to the Company’s Current Report on Form 8-K filed June 21, 2010)** |
|
|
|
|
|
(10.16) |
|
Employment Agreement between Timothy W. Boothe, Bridge Capital Holdings and Bridge Bank, National Association dated June 15, 2010 (incorporated by reference to Exhibit 10.3to the Company’s Current Report on Form 8-K filed June 21, 2010)** |
|
|
|
|
|
(10.17) |
|
Employment Agreement between Margaret M. Bradshaw, Bridge Capital Holdings and Bridge Bank, National Association dated June 15, 2010 (incorporated by reference to Exhibit 10.4 to the Company’s Current Report on Form 8-K filed June 21, 2010)** |
|
|
|
|
|
(10.18) |
|
Employment Agreement between Allen G. Williams, Bridge Capital Holdings and Bridge Bank, National Association dated June 15, 2010 (incorporated by reference to Exhibit 10.5to the Company’s Current Report on Form 8-K filed June 21, 2010) ** |
|
|
|
|
|
(10.19) |
|
Bridge Bank Deferred Compensation Plan dated June 15, 2010 (incorporated by reference to Exhibit 10.8 to the Company’s Current Report on Form 8-K filed June 21, 2010)** |
|
(10.20) |
|
Form of Deferred Compensation Non-elective Employer Contribution Participation Agreement dated June 15 2010 with Margaret M. Bradshaw and Allen G. Williams (incorporated by reference to Exhibit 10.7 to the Company’s Current Report on Form 8-K filed June 21, 2010)** |
|
|
|
|
|
(10.23) |
|
Stock Purchase Agreement dated December 4, 2008 between the Company and Carpenter Fund Manager GP, LLC on behalf of Carpenter Community BancFund, L.P., Carpenter Community BancFund-A, L.P. and Carpenter Community BancFund-CA, L.P. (incorporated by reference to Exhibit 10.1 of the Company’s Current Report on Form 8-K dated 12/05/08) |
|
|
|
|
|
(10.24) |
|
Amendment No. 1 to Stock Purchase Agreement dated December 17, 2008 between the Company and Carpenter Fund Manager GP, LLC on behalf of Carpenter Community BancFund, L.P., Carpenter Community BancFund-A, L.P. and Carpenter Community BancFund-CA, L.P. (incorporated by reference to Exhibit 10.2 of the Company’s Current Report on Form 8-K dated 12/19/08) |
|
|
|
|
|
(10.25) |
|
Management Rights Letter dated as of December 17, 2008 by and between the Company and Carpenter Fund Manager GP, LLC. (incorporated by reference to Exhibit 10.3 of the Company’s Current Report on Form 8-K dated 12/19/08) |
|
|
|
|
|
(10.26) |
|
Registration Rights Agreement dated as of December 17, 2008 by and between the Company and Carpenter Fund Manager GP, LLC on behalf of Carpenter Community BancFund, L.P., Carpenter Community BancFund-A, L.P. and Carpenter Community BancFund-CA, L.P. (incorporated by reference to Exhibit 10.4 of the Company’s Current Report on Form 8-K dated 12/19/08) |
|
|
|
|
|
(10.27) |
|
Registration Rights Agreement dated November 18, 2011 by and among the Company and the investors party thereto (incorporated by reference to Exhibit 10.2 to the Company’s Current Report on Form 8-K dated 11/23/10) |
|
|
|
|
|
(21) |
|
Subsidiaries |
|
|
|
|
|
(23.1) |
|
Consent of Independent Registered Public Accounting Firm — Vavrinek, Trine, Day & Co., LLP |
|
|
|
|
|
(31.1) |
|
Certification of Principal Executive Officer pursuant to Section 302 of the Sarbanes-Oxley Act of 2002 |
|
|
|
|
|
(31.2) |
|
Certification of Principal Financial Officer pursuant to Section 302 of the Sarbanes-Oxley Act of 2002 |
|
|
|
|
|
(32.1) |
|
Certification of Principal Executive Officer pursuant to 18 U.S.C. Section 1350 |
|
|
|
|
|
(32.2) |
|
Certification of Principal Financial Officer pursuant to 18 U.S.C. Section 1350 |
|
|
|
|
|
(101) |
|
The following financial information from Bridge Capital Holdings Annual Report on Form 10-K for the period ended December 31, 2012, filed with the SEC on March 12, 2013, formatted in Extensible Business Reporting Language (XBRL): (i) the Consolidated Balance Sheet at December 31, 2012, (ii) the Consolidated Statement of Income for the period ended December 31, 2012, (iii) the Consolidated Statement of Cash Flow for the period ended December 31, 2012, and (iv) Notes to Consolidated Financial Statements. |
**Management contract or compensatory plan or arrangement