Exhibit 99.1

Consolidated Communications Reports Positive Broadband Net Adds for 2022 and Announces Fourth Quarter and Full Year 2022 Results
| ● | Consumer fiber broadband net add growth for FY 2022 was 2.6x FY 2021 growth1 |
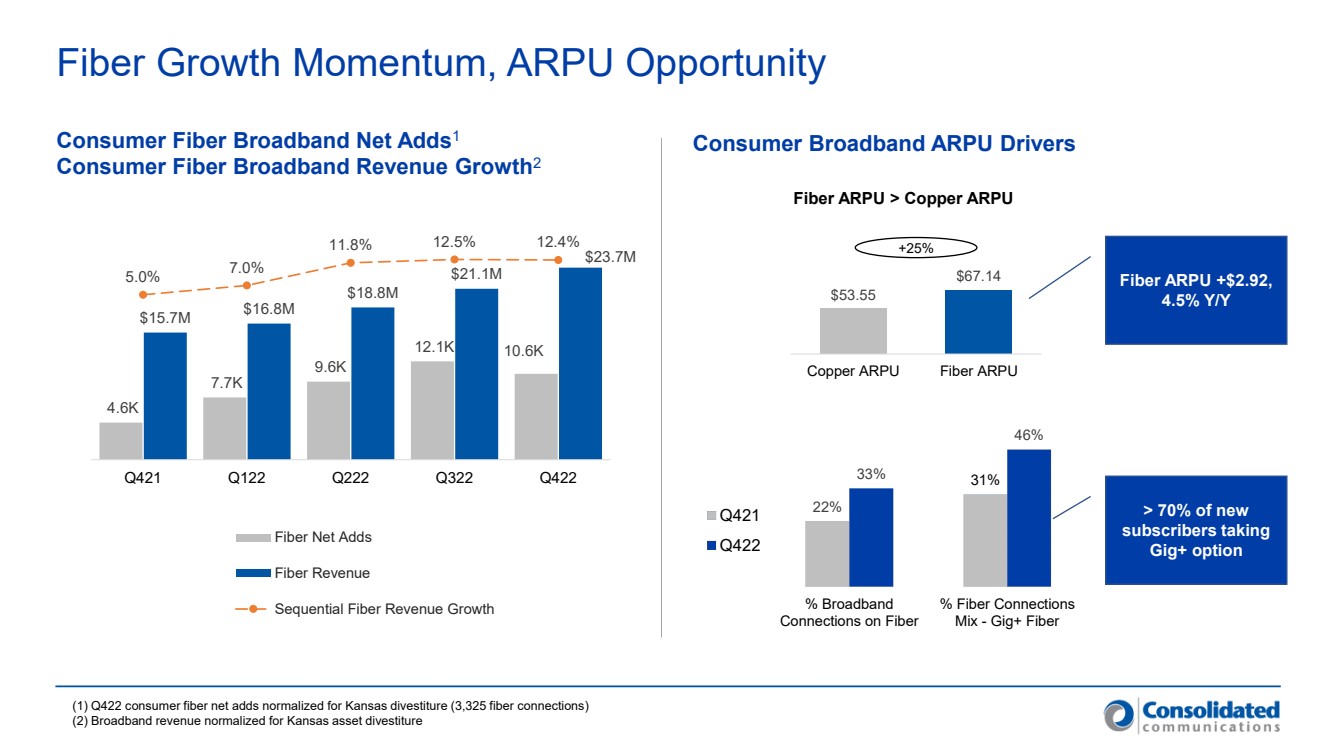
| ● | Consumer fiber broadband revenue grew 37%1 in FY 2022 driven by fiber net adds and increased ARPU |
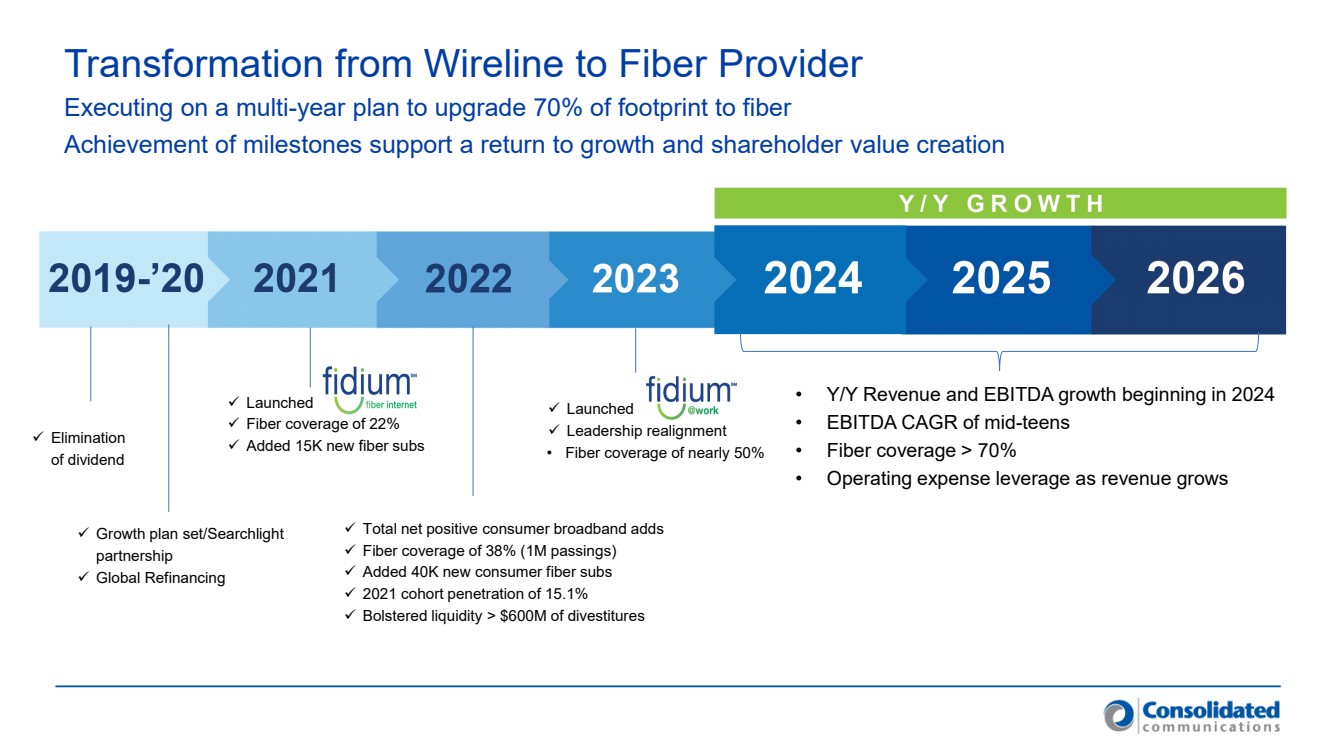
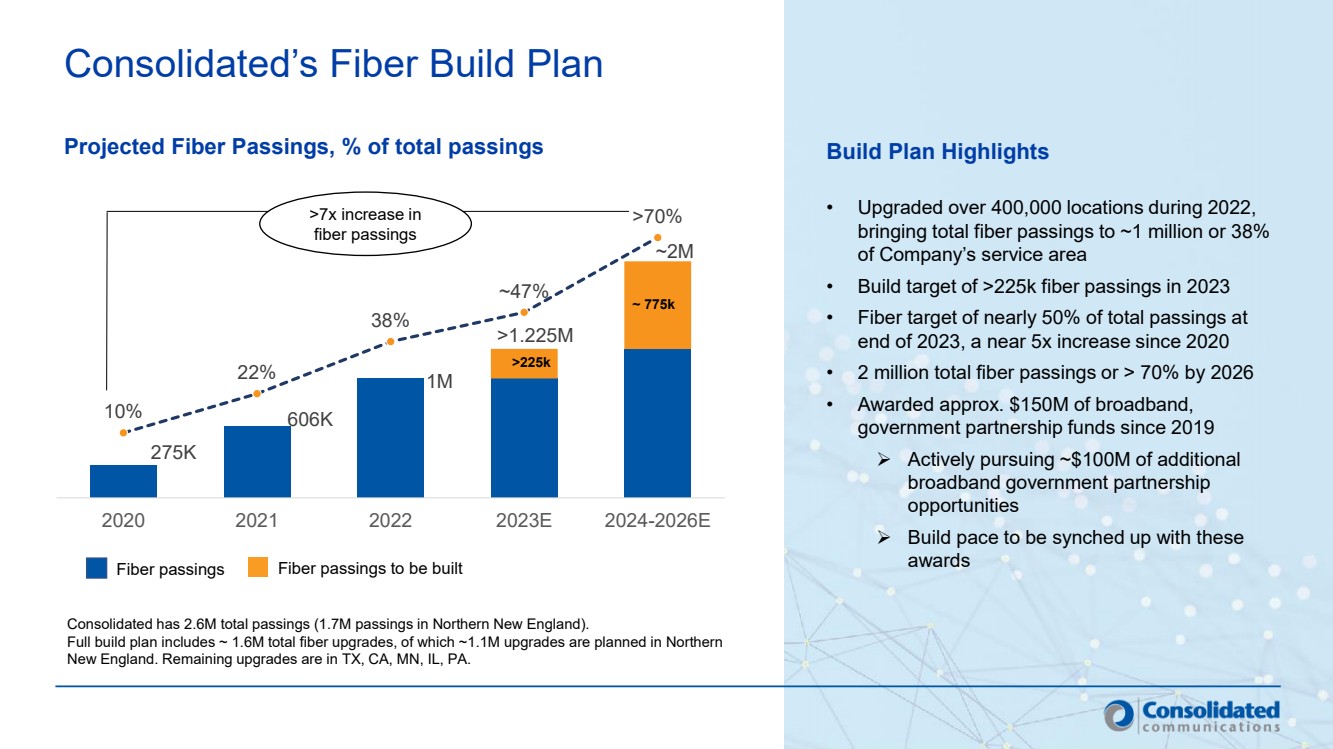
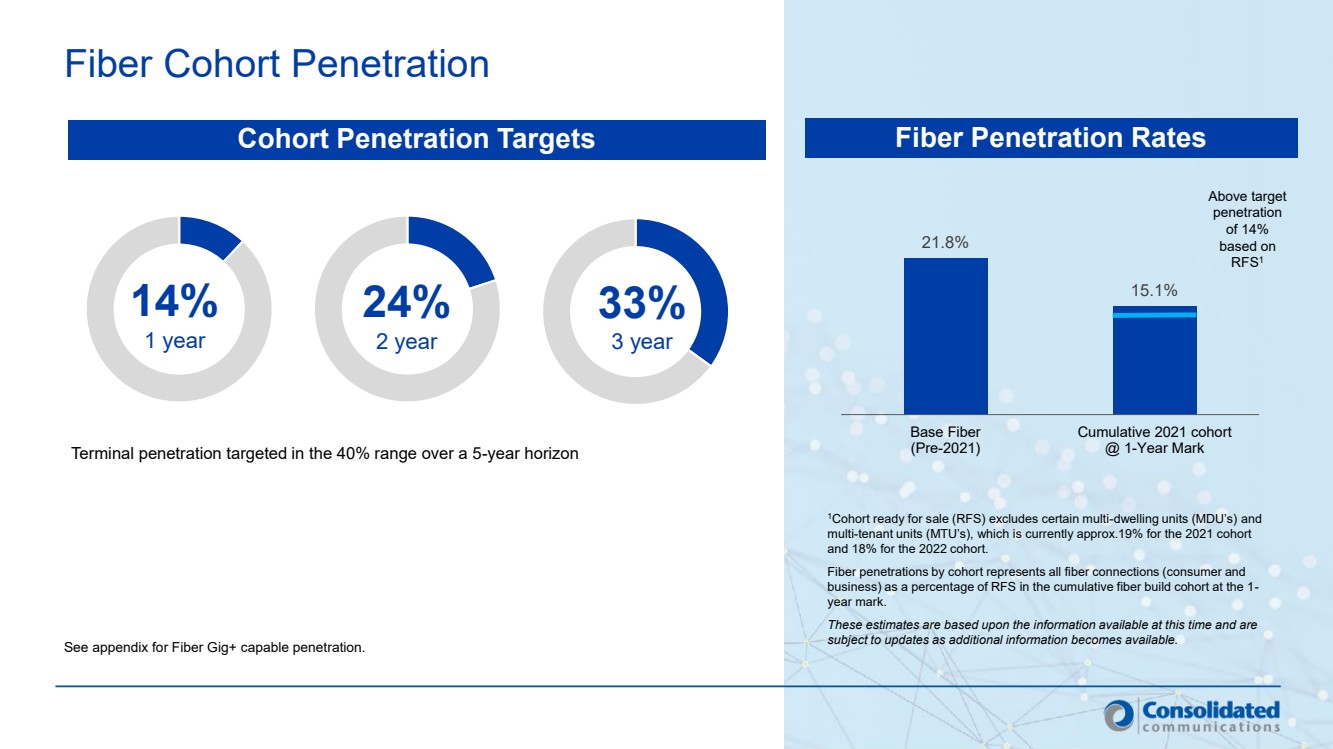
| ● | Completed more than 400,000 Gigabit+ fiber upgrades for FY 2022 resulting in 1 million total Gig+ fiber locations or approximately 38% of the Company’s network |
| ● | Closed on sale of Kansas assets for $82 million in Q4 resulting in net proceeds from strategic asset sales of over $600 million during 2022 |
| ● | Key leadership additions bring extensive fiber network and subscription based go-to-market expertise |
MATTOON, Ill. – Feb. 28, 2023 – Consolidated Communications Holdings, Inc. (Nasdaq: CNSL) (the “Company” or “Consolidated”), a top 10 fiber provider in the U.S., today reported results for the fourth quarter and full year 2022.
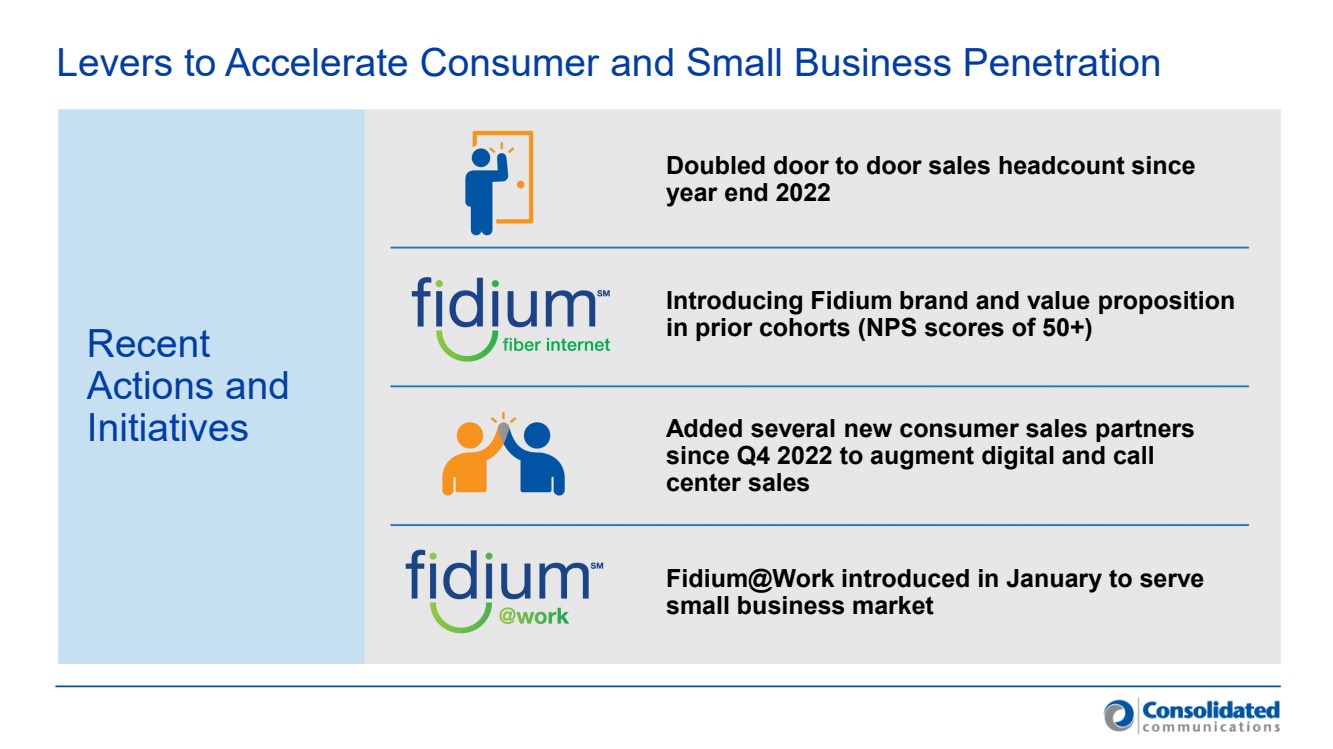
“We gained strong momentum with our Fidium consumer broadband services during 2022 as we added 40,100 fiber subscribers1, more than double the prior year, and grew consumer fiber broadband revenue 37%1,” said Bob Udell, chief executive officer at Consolidated Communications. “Our team delivered another big build year with more than 400,000 fiber upgrades and the achievement of 1 million total fiber locations.”
“We will continue to drive penetrations and refine our go-to-market strategy as we deliver a superior fiber service and an industry-leading customer experience. With a newly aligned leadership team and fiber reaching almost 40% of our base, we are accelerating our growth plans across consumer, commercial and carrier during 2023, setting the Company up for year over year revenue and EBITDA growth in 2024.”
1 Normalized for the divestitures of the Company’s Ohio and Kansas assets, where applicable, which closed on Jan. 31, 2022 and Nov. 30, 2022, respectively. Refer to the tables contained in this press release for a reconciliation of all non-GAAP measures.
Page 1 of 18
Fourth Quarter 2022 Results (compared to fourth quarter 2021 where applicable)
| ● | Revenue totaled $296.0 million, down 7.1%. |
| ● | Revenue normalized totaled $288.3 million, down 5.2%1; Consumer fiber revenue was $24.0 million, up approximately 49%, up 51% normalized1, driven by strong operating metrics including 10,600 consumer fiber net adds1 and increased ARPU of 4.5%. |
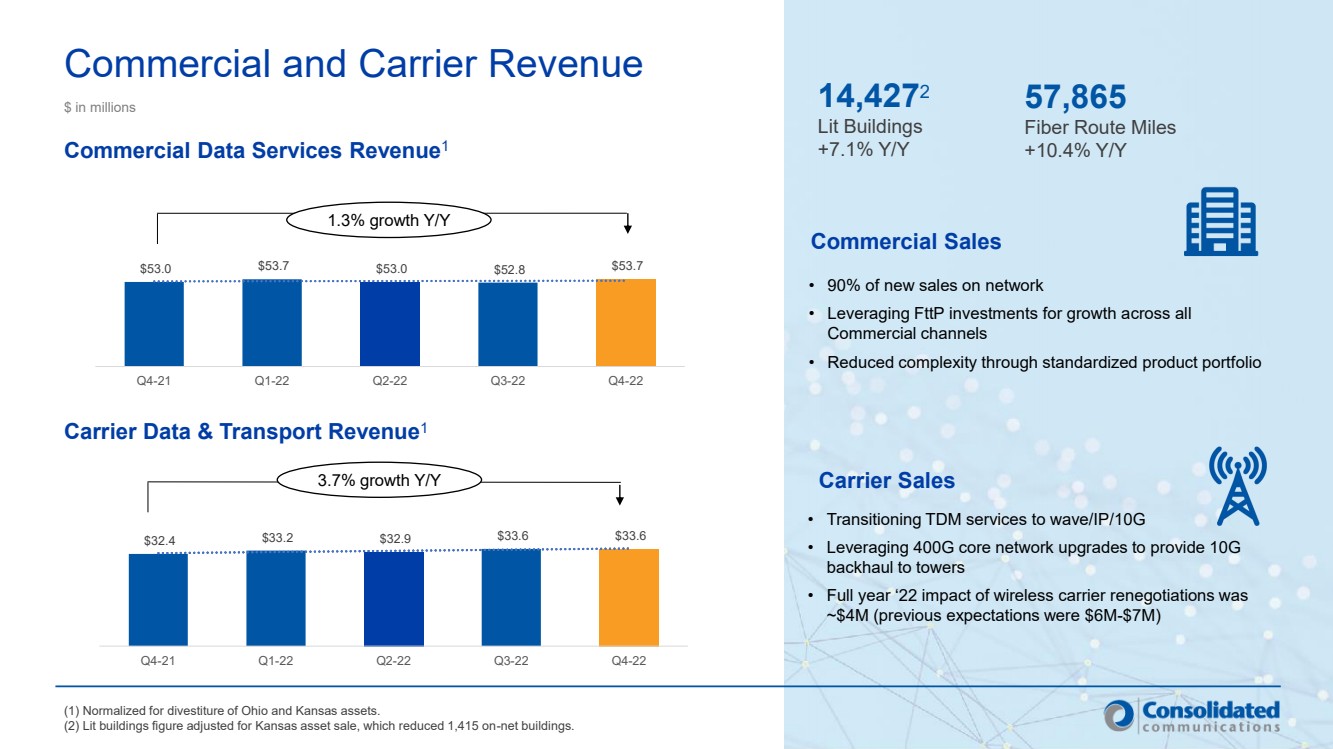
| ● | Commercial data services revenue was $56.7 million, down 1.4%; up 1.3% normalized1. |
| ● | Carrier data-transport revenue was $33.8 million, up 3.3%; up 3.7% normalized1. |
| ● | Subsidy revenue was $13.1 million, a decrease of $4.6 million, primarily reflecting CAF II step down and transition to the Rural Digital Opportunity Fund (“RDOF”) partly offset by the recognition of Texas High Cost Fund settlements related to prior years. |
| ● | Other products and services revenue was $2.0 million, a decrease of $5.8 million, largely due to lower recognition of public private partnership construction projects. |
| ● | Adjusted EBITDA was $101.7 million. |
| ● | Total committed capital expenditures were $124.3 million driven by 60,700 fiber passings added and the timing of construction and CPE inventory purchases. |
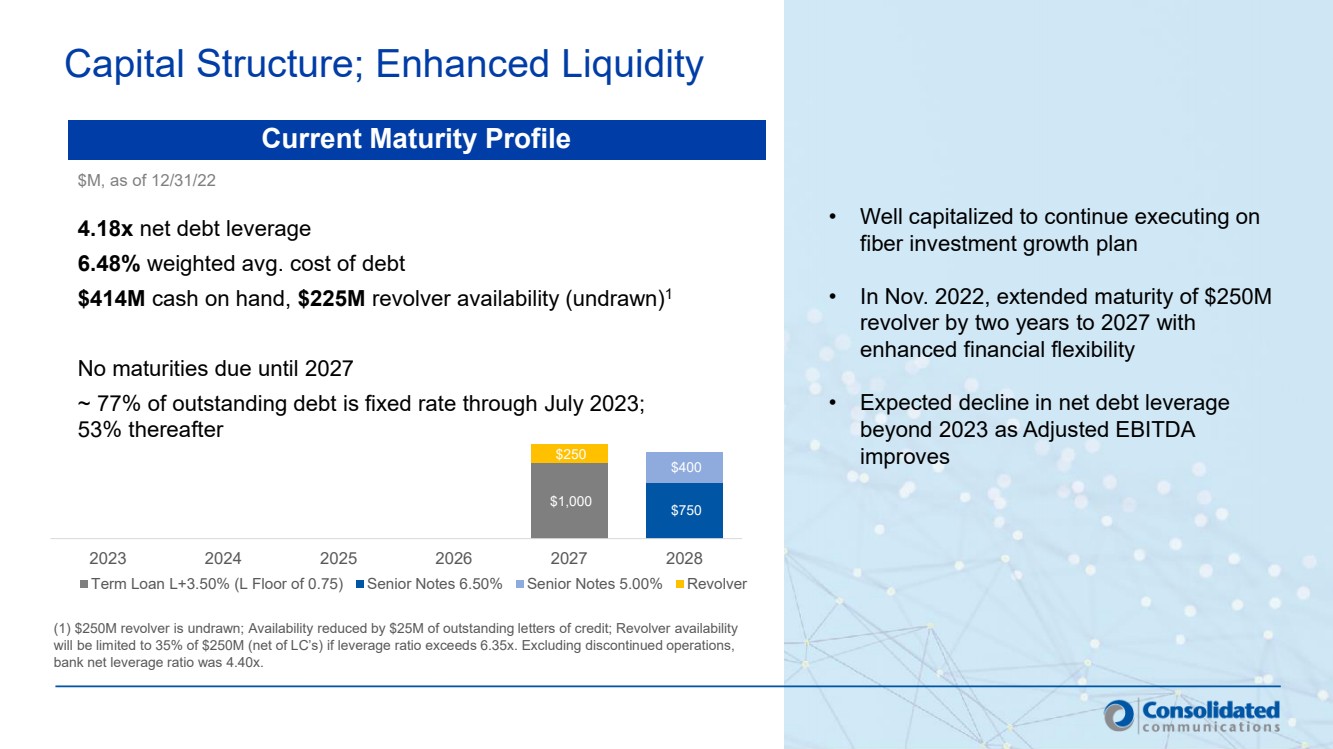
| ● | Extended the maturity of $250 million revolving credit facility from 2025 to 2027, subject to springing maturity, and enhanced financial flexibility under the revolver. |
Operating expenses increased $4.7 million versus the prior year primarily due to marketing and advertising expenses related to higher professional fees for customer service and process improvement initiatives, as well as severance costs. These higher expenses were partly offset by lower video programming expenses and the divestiture of the Kansas City operations on Nov. 30.
Net interest expense was $33.2 million, a decrease of $4.9 million versus the prior year, primarily as a result of non-cash interest of $7.3 million in 2021 on the Searchlight note, which was converted to perpetual preferred stock in conjunction with the second stage closing of its investment in December 2021, partly offset by higher interest on the term loan. Notwithstanding the heightened interest rate environment, the Company is well positioned with 77% of its total debt at a fixed rate through July 2023, and 53% fixed thereafter. As of Dec. 31, 2022, the weighted average cost of debt was 6.48%.
Cash distributions from the Company’s wireless partnerships totaled $4.1 million in the fourth quarter of 2022, compared to $9.9 million in the fourth quarter of 2021, primarily due to timing of the close of the sale of the partnerships, coupled with Verizon’s accelerated capital investments which impacted the Company’s fourth quarter distributions.
Loss from continuing operations was ($40.8 million) in the fourth quarter of 2022 compared to income from continuing operations of $7.4 million in the fourth quarter of 2021. Net loss per share from continuing operations was ($0.46) in the fourth quarter of 2022 as compared to income per share from continuing operations of $0.05 in the fourth quarter of 2021. Adjusted diluted net income (loss) per share excludes certain items as outlined in the table provided in this release. Adjusted diluted net income (loss) per share from continuing operations was ($0.17) compared to $0.06 in the fourth quarter of 2021.
Full-Year 2022 Results (compared to full-year 2021 where applicable)
| ● | Revenue totaled $1.19 billion, down 7.1%. |
| ● | Revenue normalized totaled $1.15 billion, down 6.3%. |
| ● | Consumer fiber revenue was $82.0 million, up approximately 35%, up 37% normalized1, driven by strong operating metrics, including 40,100 consumer fiber net adds1 and increased ARPU of 2.1%. |
| ● | Commercial data services revenue was $228.5 million, down 0.2%; up 1.4% normalized1. |
| ● | Carrier data-transport revenue was $137.4 million, up 3.0%; up 0.7% normalized1. |
| ● | Subsidy revenue was $33.4 million, a decrease of $36.4 million, primarily reflecting the previously discussed CAF II step down and transition to RDOF, partly offset by the recognition of Texas High Cost Fund settlements related to prior years. |
Page 2 of 18
| ● | Adjusted EBITDA was $413.6 million. |
| ● | Total committed capital expenditures were $601.1 million. |
Executive Management Team Realignment
The Company recently added three highly talented industry executives, including: Gaurav Juneja, president of consumer; Dan Stoll, president of commercial and carrier; and Fred Graffam, CFO. They collectively have decades of telecom experience at major service providers, as well as substantial experience leveraging fiber investments and driving market penetration which will help advance the Company’s strategy and return to growth.
Asset and Investment Sales
On Nov. 30, 2022, Consolidated completed the sale of its Kansas City assets for gross cash proceeds of $82 million, which will be invested in the business and used to support the Company’s FttP broadband growth plan. During the fourth quarter of 2022, the Company recognized an additional loss on sale of $16.8 million as a result of purchase price adjustments and an increase in net assets held for sale and estimated selling costs during the period.
The Company continues to actively review its portfolio for further monetization opportunities in support of its growth plan. Collectively during 2022, the Company closed on asset sales in excess of $600 million.
Capital Structure
On Nov. 22, 2022, the Company extended the maturity of its $250 million revolving credit facility (the “Revolver”) from 2025 to 2027, subject to springing maturity, and enhanced its financial flexibility under the Revolver. As a result, the Company has no maturities until 2027.
As of Dec. 31, 2022, the Company maintained liquidity with cash and short-term investments of approximately $414 million and $225 million of available borrowing capacity on the revolving credit facility, subject to certain covenants. The net leverage ratio for the trailing 12 months ended Dec. 31, 2022, was 4.18x.
2023 Outlook
The Company’s 2023 outlook includes another inflection point with nearly half of its service area being FttP by year end, which provides a significant addressable market opportunity to drive revenue and EBITDA growth in 2024.
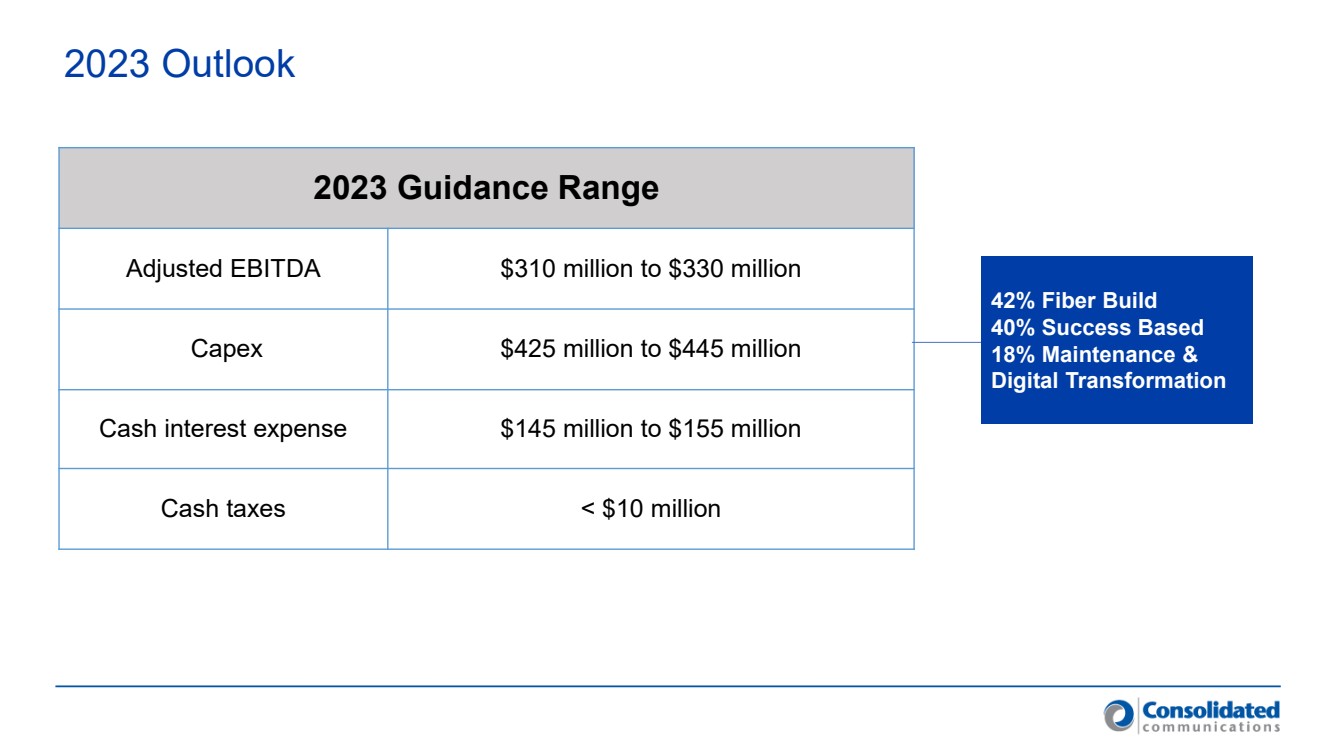
Consolidated Communications is providing the following outlook for the full-year 2023.
| ● | Adjusted EBITDA is expected to be in a range of $310 million to $330 million. |
| ● | Capital expenditures are expected to be in a range of $425 million to $445 million. |
| ● | Cash interest expense is expected to be in a range of $145 million to $155 million. |
| ● | Cash income taxes are expected to be below $10 million. |
The Company’s Adjusted EBITDA guidance as compared to 2022 includes the impact of approximately $50 million resulting from 2022 asset sales including Kansas and the wireless partnerships, an expected $20 million reduction in legacy voice, approximately $10 million for fiber-to-the- tower contract pricing step downs in the carrier business, as well as increased marketing and sales expenses.
Fred Graffam, chief financial officer, commented, “With over $400 million of cash on our balance sheet at year end, coupled with availability under our $250 million Revolver, we are well positioned to continued executing on our fiber expansion and growth plan.”
Page 3 of 18
Conference Call Information
Consolidated’s fourth quarter earnings conference call will be webcast today at 8:30 am ET. The webcast and materials will be available on Consolidated’s Investor Relations website at http://ir.consolidated.com. The live conference call dial-in number for analysts and investors is 888-440-5977, conference ID 8956400. A replay of the webcast, together with a transcript thereof, will be available on the website following the earnings conference call.
About Consolidated Communications
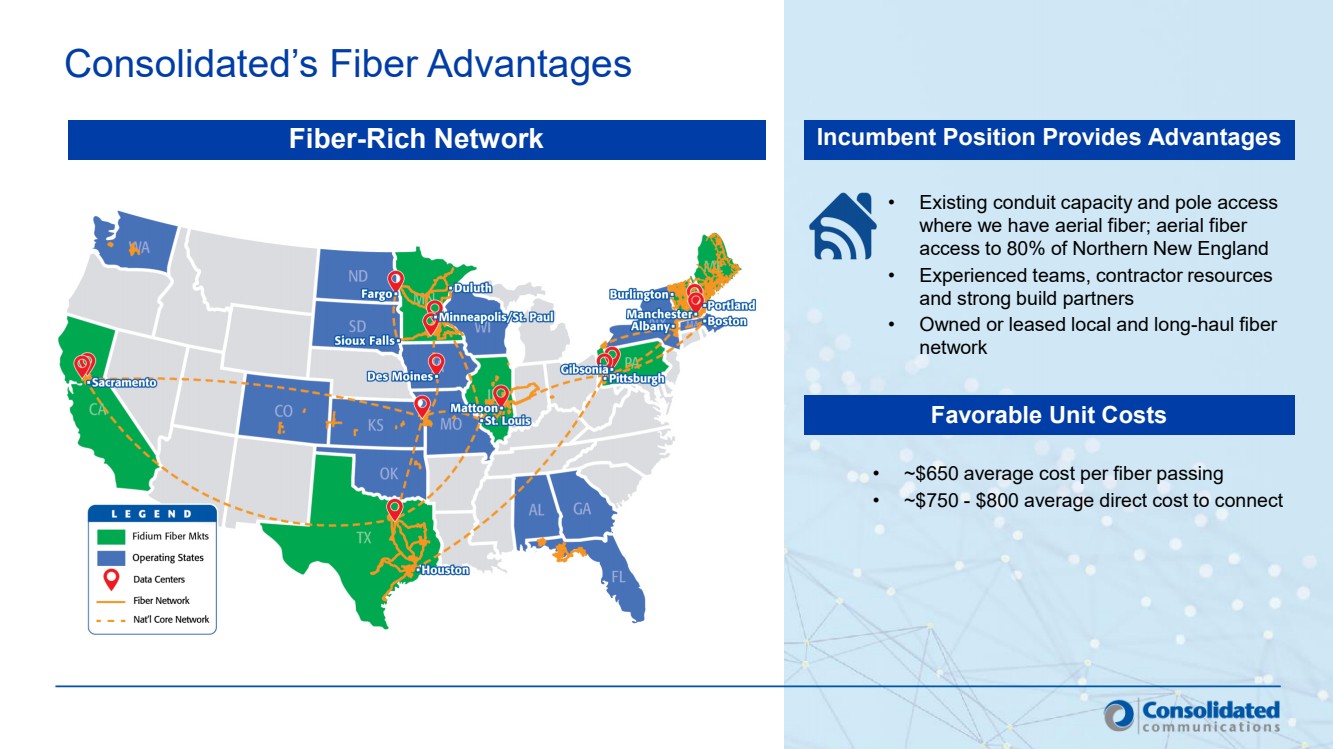
Consolidated Communications Holdings, Inc. (Nasdaq: CNSL) is dedicated to moving people, businesses and communities forward by delivering the most reliable fiber communications solutions. Consumers, businesses and wireless and wireline carriers depend on Consolidated for a wide range of high-speed internet, data, phone, security, cloud and wholesale carrier solutions. With a network spanning more than 57,865 fiber route miles, Consolidated is a top 10 U.S. fiber provider, turning technology into solutions that are backed by exceptional customer support. Learn more at consolidated.com.
Use of Non-GAAP Financial Measures
This press release, as well as the conference call, includes disclosures regarding “EBITDA,” “adjusted EBITDA,” “total net debt to last 12 month adjusted EBITDA ratio” or “Net debt leverage ratio,” “adjusted diluted net income (loss) per share,” and “Normalized revenue,” all of which are non-GAAP financial measures. Accordingly, they should not be construed as alternatives to net cash from operating or investing activities, cash and cash equivalents, cash flows from operations, net income or net income per share as defined by GAAP and are not, on their own, necessarily indicative of cash available to fund cash needs as determined in accordance with GAAP. In addition, not all companies use identical calculations, and the non-GAAP financial measures may not be comparable to other similarly titled measures of other companies. A reconciliation of these non-GAAP financial measures to the most directly comparable financial measures presented in accordance with GAAP is included in the tables that follow.
Adjusted EBITDA is comprised of EBITDA, adjusted for certain items as permitted or required by the lenders under our credit agreement in place at the end of each quarter in the periods presented. The tables that follow include an explanation of how adjusted EBITDA is calculated for each of the periods presented with the reconciliation to net income (loss) from continuing operations. EBITDA is defined as income (loss) from continuing operations before interest expense, income taxes, depreciation and amortization on a historical basis.
We present adjusted EBITDA for several reasons. Management believes adjusted EBITDA is useful as a means to evaluate our ability to fund our estimated uses of cash (including interest on our debt). In addition, we have presented adjusted EBITDA to investors in the past because it is frequently used by investors, securities analysts and other interested parties in the evaluation of companies in our industry, and management believes presenting it here provides a measure of consistency in our financial reporting. Adjusted EBITDA, referred to as Available Cash in our credit agreement, is also a component of the restrictive covenants and financial ratios contained in our credit agreement that requires us to maintain compliance with these covenants and limit certain activities, such as our ability to incur debt. The definitions in these covenants and ratios are based on Adjusted EBITDA after giving effect to specified charges. In addition, Adjusted EBITDA provides our board of directors with meaningful information, with other data, assumptions and considerations, to measure our ability to service and repay debt. We present the related “total net debt to last 12 month adjusted EBITDA ratio” or “Net debt leverage ratio” principally to help investors understand how we measure leverage and facilitate comparisons by investors, security analysts and others. Total net debt is defined as the current and long-term portions of debt and finance lease obligations less cash, cash equivalents and short-term investments, deferred debt issuance costs and discounts on debt. Our Net debt leverage ratio differs in certain respects from the similar ratio used in our credit agreement or against comparable measures of certain other companies in our industry. These measures differ in certain respects from the ratios used in our senior notes indenture.
Page 4 of 18
These non-GAAP financial measures have certain shortcomings. In particular, Adjusted EBITDA does not represent the residual cash flows available for discretionary expenditures, since items such as debt repayment and interest payments are not deducted from such measure. In addition, the ratio of total net debt to last 12-month adjusted EBITDA is subject to the risk that we may not be able to use the cash on the balance sheet to reduce our debt on a dollar-for-dollar basis. Management believes this ratio is useful as a means to evaluate our ability to incur additional indebtedness in the future.
We present the non-GAAP measure “adjusted diluted net income (loss) per share” because our net income (loss) and net income (loss) per share are regularly affected by items that occur at irregular intervals or are non-cash items. We believe that disclosing these measures assists investors, securities analysts and other interested parties in evaluating both our company over time and the relative performance of the companies in our industry.
Forward-Looking Statements
Certain statements in this communication are forward-looking statements and are made pursuant to the safe harbor provisions of the Private Securities Litigation Reform Act of 1995. These forward-looking statements reflect, among other things, our current expectations, plans, strategies, and anticipated financial results, including year over year revenue and EBITDA growth in 2024. There are a number of risks, uncertainties, and conditions that may cause our actual results to differ materially from those expressed or implied by these forward-looking statements. These risks and uncertainties include a number of factors related to our business, including the uncertainties relating to the impact of public health threats, including the novel coronavirus (COVID-19) pandemic, on the Company’s business, results of operations, cash flows and stock price; the possibility that any of the anticipated benefits of the strategic investment from Searchlight Capital Partners, L.P. or our refinancing of outstanding debt, including our senior secured credit facilities; the outcome of any legal proceedings that may be instituted against the Company or its directors; economic and financial market conditions generally and economic conditions in our service areas; various risks to the price and volatility of our common stock; changes in the valuation of pension plan assets; the substantial amount of debt and our ability to repay or refinance it or incur additional debt in the future; our need for a significant amount of cash to service and repay the debt restrictions contained in our debt agreements that limit the discretion of management in operating the business; our need for substantial capital expenditures for our operations; regulatory changes, including changes to subsidies, our need for continued receipt of support from various funds established under federal and state laws, such as network access and subsidies; rapid development and introduction of new technologies; intense competition in the telecommunications industry; shifts in our product mix; risks associated with our possible pursuit of or failure to consummate acquisitions or dispositions; disruptions in our networks and infrastructure; cyber-attacks, information or security breaches or technology failure of ours or of a third party; losses of large customers or government contracts; risks associated with the rights-of-way for the network; disruptions in the relationship with third party vendors or our ability to obtain necessary hardware, software and operational support from third party venders; losses of key management personnel and our ability to attract and retain highly qualified management and personnel in the future; our ability to enter into new, or renew existing, collective bargaining agreements with our employees; changes in the extensive governmental legislation and regulations governing telecommunications providers and the provision of telecommunications services; new or changing tax laws or regulations; telecommunications carriers disputing and/or avoiding their obligations to pay network access charges for use of our network; high costs of regulatory compliance; increasing video content costs; the competitive impact of legislation and regulatory changes in the telecommunications industry; liability and compliance costs regarding environmental regulations and environmental, social, and governance (ESG) initiatives; risks associated with discontinuing paying dividends on our common stock; and the potential for the rights of our series A preferred stock to negatively impact our cash flow. A detailed discussion of these and other risks and uncertainties that could cause actual results and events to differ materially from such forward-looking statements are discussed in more detail in our filings with the Securities and Exchange Commission (“SEC”), including our Form 10-K for the year ended December 31, 2021. Many of these circumstances are beyond our ability to control or predict. Moreover, forward-looking statements necessarily involve assumptions on our part. These forward-looking statements generally are identified by the words “believe,” “expect,” “anticipate,” “estimate,” “project,” “intend,” “plan,” “should,” “may,” “will,” “would,” “will be,” “will continue” or similar expressions. Such forward-looking statements involve known and unknown risks, uncertainties and other
Page 5 of 18
factors that may cause actual results, performance or achievements of the Company and its subsidiaries to be different from those expressed or implied in the forward-looking statements. All forward-looking statements attributable to us or persons acting on our behalf are expressly qualified in their entirety by the cautionary statements that appear throughout this communication. Furthermore, forward-looking statements speak only as of the date they are made. Except as required under the federal securities laws or the rules and regulations of the SEC, we disclaim any intention or obligation to update or revise publicly any forward-looking statements. You should not place undue reliance on forward-looking statements.
Investor and Media Contacts
Philip Kranz, Investor Relations
+1 217-238-8480
Philip.kranz@consolidated.com
Jennifer Spaude, Media Relations
+1 507-386-3765
Jennifer.spaude@consolidated.com
# # #
Page 6 of 18
Consolidated Communications Holdings, Inc.
Condensed Consolidated Balance Sheets
(Dollars in thousands, except share and per share amounts)
(Unaudited)
| | December 31, | | December 31, | ||
|
| 2022 |
| 2021 | ||
ASSETS | | | | | | |
Current assets: | | | | | | |
Cash and cash equivalents | | $ | 325,852 | | $ | 99,635 |
Short-term investments | | | 87,951 | | | 110,801 |
Accounts receivable, net | | | 119,675 | | | 133,362 |
Income tax receivable | | | 1,670 | | | 1,134 |
Prepaid expenses and other current assets | | | 62,996 | | | 56,831 |
Assets held for sale | | | — | | | 26,052 |
Total current assets | | | 598,144 | | | 427,815 |
| | | | | | |
Property, plant and equipment, net | | | 2,234,122 | | | 2,019,444 |
Investments | | | 10,297 | | | 10,799 |
Goodwill | | | 929,570 | | | 1,013,243 |
Customer relationships, net | | | 43,089 | | | 73,939 |
Other intangible assets | | | 10,557 | | | 10,557 |
Assets of discontinued operations | | | — | | | 98,779 |
Other assets | | | 61,315 | | | 58,116 |
Total assets | | $ | 3,887,094 | | $ | 3,712,692 |
| | | | | | |
LIABILITIES, MEZZANINE EQUITY AND SHAREHOLDERS' EQUITY | | | | | | |
Current liabilities: | | | | | | |
Accounts payable | | $ | 33,096 | | $ | 40,953 |
Advance billings and customer deposits | | | 46,664 | | | 53,028 |
Accrued compensation | | | 60,903 | | | 68,272 |
Accrued interest | | | 18,201 | | | 17,819 |
Accrued expense | | | 95,206 | | | 97,417 |
Current portion of long-term debt and finance lease obligations | | | 12,834 | | | 7,959 |
Liabilities held for sale | | | — | | | 97 |
Total current liabilities | | | 266,904 | | | 285,545 |
| | | | | | |
Long-term debt and finance lease obligations | | | 2,129,462 | | | 2,118,853 |
Deferred income taxes | | | 274,309 | | | 194,458 |
Pension and other post-retirement obligations | | | 123,644 | | | 214,671 |
Other long-term liabilities | | | 47,326 | | | 62,789 |
Total liabilities | | | 2,841,645 | | | 2,876,316 |
| | | | | | |
Series A Preferred Stock, par value $0.01 per share; 10,000,000 shares authorized, 456,343 and 434,266 shares outstanding as of December 31, 2022 and December 31, 2021, respectively; liquidation preference of $477,047 and $436,943 as of December 31, 2022 and December 31, 2021, respectively | | | 328,680 | | | 288,576 |
| | | | | | |
Shareholders' equity: | | | | | | |
Common stock, par value $0.01 per share; 150,000,000 shares authorized, 115,167,193 and 113,647,364 shares outstanding as of December 31, 2022 and December 31, 2021, respectively | | | 1,152 | | | 1,137 |
Additional paid-in capital | | | 720,442 | | | 740,746 |
Retained earnings (accumulated deficit) | | | (11,866) | | | (141,599) |
Accumulated other comprehensive loss, net | | | (610) | | | (59,571) |
Noncontrolling interest | | | 7,651 | | | 7,087 |
Total shareholders' equity | | | 716,769 | | | 547,800 |
Total liabilities, mezzanine equity and shareholders' equity | | $ | 3,887,094 | | $ | 3,712,692 |
Page 7 of 18
Consolidated Communications Holdings, Inc.
Condensed Consolidated Statements of Operations
(Dollars in thousands, except per share amounts)
(Unaudited)
| | Three Months Ended | | Year Ended | ||||||||
| | December 31, | | December 31, | ||||||||
|
| 2022 |
| 2021 |
| 2022 |
| 2021 | ||||
| | | | | | | | | | | | |
Net revenues | | $ | 295,976 | | $ | 318,480 | | $ | 1,191,263 | | $ | 1,282,233 |
Operating expenses: | | | | | | | | | | | | |
Cost of services and products | | | 133,652 | | | 137,832 | | | 546,661 | | | 569,629 |
Selling, general and administrative expenses | | | 80,035 | | | 71,177 | | | 301,667 | | | 271,125 |
Loss on impairment of assets held for sale | | | — | | | — | | | 131,698 | | | 5,704 |
Loss on disposal of assets | | | 23,396 | | | — | | | 4,233 | | | — |
Depreciation and amortization | | | 79,614 | | | 75,142 | | | 300,166 | | | 300,597 |
Income (loss) from operations | | | (20,721) | | | 34,329 | | | (93,162) | | | 135,178 |
Other income (expense): | | | | | | | | | | | | |
Interest expense, net of interest income | | | (33,236) | | | (38,173) | | | (124,978) | | | (175,195) |
Loss on extinguishment of debt | | | — | | | — | | | — | | | (17,101) |
Change in fair value of contingent payment rights | | | — | | | 13,143 | | | — | | | (86,476) |
Other income, net | | | 3,953 | | | (3,156) | | | 13,378 | | | 1,335 |
Income (loss) from continuing operations before income taxes | | | (50,004) | | | 6,143 | | | (204,762) | | | (142,259) |
Income tax benefit | | | (9,244) | | | (1,272) | | | (27,058) | | | (3,132) |
Income (loss) from continuing operations | | | (40,760) | | | 7,415 | | | (177,704) | | | (139,127) |
| | | | | | | | | | | | |
Discontinued operations: | | | | | | | | | | | | |
Income from discontinued operations | | | 839 | | | 10,030 | | | 23,467 | | | 41,845 |
Gain (loss) on sale of discontinued operations | | | (20) | | | — | | | 389,885 | | | — |
Income tax expense (benefit) | | | (4,974) | | | 2,485 | | | 94,999 | | | 9,411 |
Income from discontinued operations | | | 5,793 | | | 7,545 | | | 318,353 | | | 32,434 |
| | | | | | | | | | | | |
Net income (loss) | | | (34,967) | | | 14,960 | | | 140,649 | | | (106,693) |
Less: dividends on Series A preferred stock | | | 10,352 | | | 2,677 | | | 40,104 | | | 2,677 |
Less: net income (loss) attributable to noncontrolling interest | | | 171 | | | (131) | | | 564 | | | 392 |
Net income (loss) attributable to common shareholders | | $ | (45,490) | | $ | 12,414 | | $ | 99,981 | | $ | (109,762) |
| | | | | | | | | | | | |
Net income (loss) per common share - basic and diluted: | | | | | | | | | | | | |
Income (loss) from continuing operations | | $ | (0.46) | | $ | 0.05 | | $ | (1.90) | | $ | (1.63) |
Income from discontinued operations | | | 0.05 | | | 0.07 | | | 2.77 | | | 0.37 |
Net income (loss) per basic and diluted common shares attributable to common shareholders | | $ | (0.41) | | $ | 0.12 | | $ | 0.87 | | $ | (1.26) |
Page 8 of 18
Consolidated Communications Holdings, Inc.
Condensed Consolidated Statements of Cash Flows
(Dollars in thousands)
(Unaudited)
| | Three Months Ended | | Year Ended | ||||||||
| | December 31, | | December 31, | ||||||||
|
| 2022 |
| 2021 |
| 2022 |
| 2021 | ||||
OPERATING ACTIVITIES | | | | | | | | | | | | |
Net income (loss) | | $ | (34,967) | | $ | 14,960 | | $ | 140,649 | | $ | (106,693) |
Adjustments to reconcile net income (loss) to net cash provided by operating activities: | | | | | | | | | | | | |
Depreciation and amortization | | | 79,614 | | | 75,142 | | | 300,166 | | | 300,597 |
Deferred income taxes | | | (11,055) | | | 5,504 | | | 58,894 | | | 5,504 |
Cash distributions from wireless partnerships in excess of earnings | | | 79 | | | (150) | | | 5,697 | | | 1,195 |
Pension and post-retirement contributions in excess of expense | | | (5,214) | | | (3,240) | | | (29,205) | | | (33,208) |
Non-cash, stock-based compensation | | | 2,784 | | | 2,937 | | | 10,755 | | | 10,097 |
Amortization of deferred financing costs and discounts | | | 1,856 | | | 2,501 | | | 7,331 | | | 15,622 |
Non-cash interest expense on convertible security interest | | | — | | | 6,593 | | | — | | | 30,927 |
Loss on extinguishment of debt | | | — | | | — | | | — | | | 17,101 |
(Gain) loss on change in fair value of contingent payment rights | | | — | | | (13,143) | | | — | | | 86,476 |
Loss on impairment of assets held for sale | | | — | | | — | | | 131,698 | | | 5,704 |
(Gain) loss on sale of partnership interests | | | 20 | | | — | | | (389,885) | | | — |
Loss on disposal of assets | | | 23,396 | | | — | | | 4,233 | | | — |
Other adjustments, net | | | 191 | | | (406) | | | (367) | | | 3,226 |
Changes in operating assets and liabilities, net | | | (51,125) | | | (67,810) | | | (16,256) | | | (17,681) |
Net cash provided by operating activities | | | 5,579 | | | 22,888 | | | 223,710 | | | 318,867 |
INVESTING ACTIVITIES | | | | | | | | | | | | |
Purchase of property, plant and equipment, net | | | (123,022) | | | (140,858) | | | (619,981) | | | (480,346) |
Purchase of investments | | | (262,948) | | | (20,801) | | | (302,907) | | | (175,764) |
Proceeds from sale of assets | | | 1,661 | | | 3,343 | | | 22,918 | | | 3,469 |
Proceeds from business dispositions, net | | | 79,781 | | | — | | | 105,823 | | | — |
Proceeds from sale and maturity of investments | | | 175,859 | | | 65,000 | | | 327,419 | | | 66,198 |
Proceeds from sale of partnership interests, net | | | (6,601) | | | — | | | 482,966 | | | — |
Net cash provided by (used in) investing activities | | | (135,270) | | | (93,316) | | | 16,238 | | | (586,443) |
FINANCING ACTIVITIES | | | | | | | | | | | | |
Proceeds from bond offering | | | — | | | — | | | — | | | 400,000 |
Proceeds from issuance of long-term debt | | | — | | | — | | | — | | | 150,000 |
Proceeds from issuance of common stock | | | — | | | 75,000 | | | — | | | 75,000 |
Payment of finance lease obligations | | | (2,725) | | | (1,900) | | | (9,836) | | | (6,365) |
Payment on long-term debt | | | — | | | — | | | — | | | (397,000) |
Payment of financing costs | | | (2,603) | | | — | | | (2,603) | | | (8,266) |
Share repurchases for minimum tax withholding | | | (1,178) | | | (1,719) | | | (1,292) | | | (1,719) |
Net cash provided by (used in) financing activities | | | (6,506) | | | 71,381 | | | (13,731) | | | 211,650 |
Net change in cash and cash equivalents | | | (136,197) | | | 953 | | | 226,217 | | | (55,926) |
Cash and cash equivalents at beginning of period | | | 462,049 | | | 98,682 | | | 99,635 | | | 155,561 |
Cash and cash equivalents at end of period | | $ | 325,852 | | $ | 99,635 | | $ | 325,852 | | $ | 99,635 |
Page 9 of 18
Consolidated Communications Holdings, Inc.
Consolidated Revenue by Category
(Dollars in thousands)
(Unaudited)
| | Three Months Ended | | Year Ended | ||||||||
| | December 31, | | December 31, | ||||||||
|
| 2022 |
| 2021 |
| 2022 |
| 2021 | ||||
Consumer: | | | | | | | | | | | | |
Broadband (Data and VoIP) | | $ | 69,002 | | $ | 66,983 | | $ | 272,146 | | $ | 269,323 |
Voice services | | | 34,314 | | | 39,518 | | | 144,853 | | | 160,698 |
Video services | | | 11,876 | | | 15,371 | | | 54,153 | | | 65,114 |
| | | 115,192 | | | 121,872 | | | 471,152 | | | 495,135 |
Commercial: | | | | | | | | | | | | |
Data services (includes VoIP) | | | 56,662 | | | 57,444 | | | 228,466 | | | 228,931 |
Voice services | | | 34,676 | | | 37,303 | | | 142,274 | | | 154,567 |
Other | | | 10,320 | | | 11,408 | | | 43,100 | | | 40,032 |
| | | 101,658 | | | 106,155 | | | 413,840 | | | 423,530 |
Carrier: | | | | | | | | | | | | |
Data and transport services | | | 33,752 | | | 32,659 | | | 137,378 | | | 133,434 |
Voice services | | | 3,685 | | | 4,088 | | | 14,772 | | | 17,183 |
Other | | | 338 | | | 431 | | | 1,688 | | | 1,592 |
| | | 37,775 | | | 37,178 | | | 153,838 | | | 152,209 |
| | | | | | | | | | | | |
Subsidies | | | 13,078 | | | 17,671 | | | 33,382 | | | 69,739 |
Network access | | | 26,308 | | | 27,846 | | | 104,644 | | | 120,487 |
Other products and services | | | 1,965 | | | 7,758 | | | 14,407 | | | 21,133 |
Total operating revenue | | $ | 295,976 | | $ | 318,480 | | $ | 1,191,263 | | $ | 1,282,233 |
Page 10 of 18
Consolidated Communications Holdings, Inc.
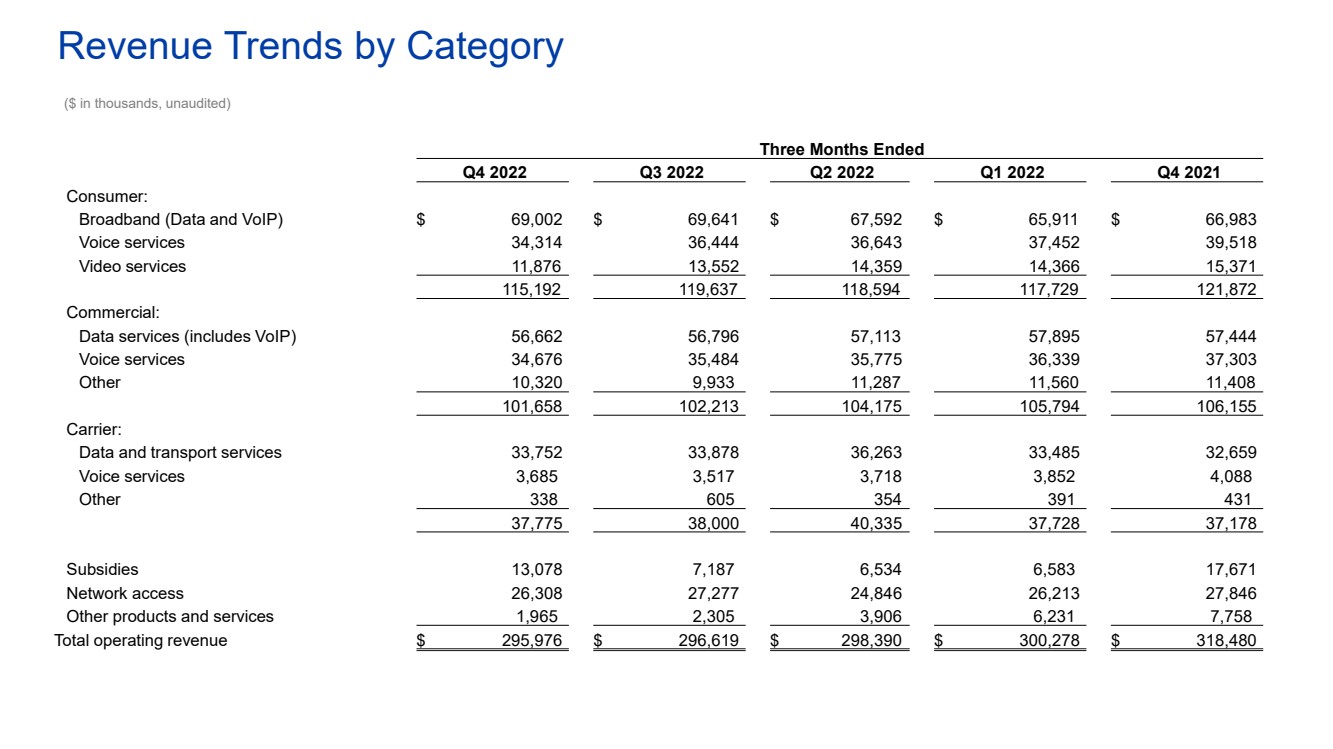
Consolidated Revenue Trend by Category
(Dollars in thousands)
(Unaudited)
| | Three Months Ended | |||||||||||||
|
| Q4 2022 |
| Q3 2022 |
| Q2 2022 |
| Q1 2022 |
| Q4 2021 | |||||
Consumer: | | | | | | | | | | | | | | | |
Broadband (Data and VoIP) | | $ | 69,002 | | $ | 69,641 | | $ | 67,592 | | $ | 65,911 | | $ | 66,983 |
Voice services | | | 34,314 | | | 36,444 | | | 36,643 | | | 37,452 | | | 39,518 |
Video services | | | 11,876 | | | 13,552 | | | 14,359 | | | 14,366 | | | 15,371 |
| | | 115,192 | | | 119,637 | | | 118,594 | | | 117,729 | | | 121,872 |
Commercial: | | | | | | | | | | | | | | | |
Data services (includes VoIP) | | | 56,662 | | | 56,796 | | | 57,113 | | | 57,895 | | | 57,444 |
Voice services | | | 34,676 | | | 35,484 | | | 35,775 | | | 36,339 | | | 37,303 |
Other | | | 10,320 | | | 9,933 | | | 11,287 | | | 11,560 | | | 11,408 |
| | | 101,658 | | | 102,213 | | | 104,175 | | | 105,794 | | | 106,155 |
Carrier: | | | | | | | | | | | | | | | |
Data and transport services | | | 33,752 | | | 33,878 | | | 36,263 | | | 33,485 | | | 32,659 |
Voice services | | | 3,685 | | | 3,517 | | | 3,718 | | | 3,852 | | | 4,088 |
Other | | | 338 | | | 605 | | | 354 | | | 391 | | | 431 |
| | | 37,775 | | | 38,000 | | | 40,335 | | | 37,728 | | | 37,178 |
| | | | | | | | | | | | | | | |
Subsidies | | | 13,078 | | | 7,187 | | | 6,534 | | | 6,583 | | | 17,671 |
Network access | | | 26,308 | | | 27,277 | | | 24,846 | | | 26,213 | | | 27,846 |
Other products and services | | | 1,965 | | | 2,305 | | | 3,906 | | | 6,231 | | | 7,758 |
Total operating revenue | | $ | 295,976 | | $ | 296,619 | | $ | 298,390 | | $ | 300,278 | | $ | 318,480 |
Page 11 of 18
Consolidated Communications Holdings, Inc.
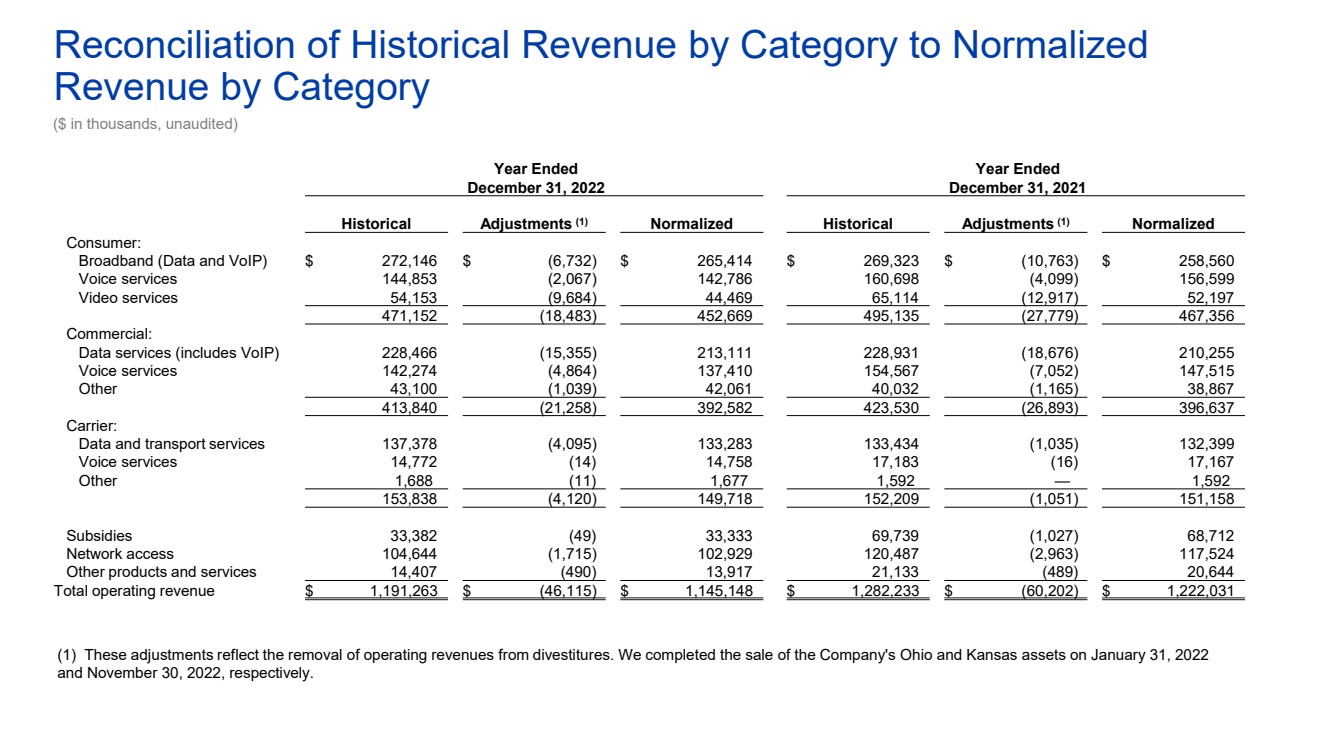
Reconciliation of Historical Revenue by Category to Normalized Revenue by Category
(Dollars in thousands)
(Unaudited)
| | | | | | | | | | | | | | | | | | |
| | Three Months Ended | | Three Months Ended | ||||||||||||||
| | December 31, 2022 | | December 31, 2021 | ||||||||||||||
|
| Historical |
| Adjustments (1) |
| Normalized |
| Historical | | Adjustments (1) | | Normalized | ||||||
Consumer: | | | | | | | | | | | | | | | | | | |
Broadband (Data and VoIP) | | $ | 69,002 | | $ | (1,138) | | $ | 67,864 | | $ | 66,983 | | $ | (2,554) | | $ | 64,429 |
Voice services | | | 34,314 | | | (328) | | | 33,986 | | | 39,518 | | | (972) | | | 38,546 |
Video services | | | 11,876 | | | (1,679) | | | 10,197 | | | 15,371 | | | (3,089) | | | 12,282 |
| | | 115,192 | | | (3,145) | | | 112,047 | | | 121,872 | | | (6,615) | | | 115,257 |
Commercial: | | | | | | | | | | | | | | | | | | |
Data services (includes VoIP) | | | 56,662 | | | (2,952) | | | 53,710 | | | 57,444 | | | (4,444) | | | 53,000 |
Voice services | | | 34,676 | | | (818) | | | 33,858 | | | 37,303 | | | (1,642) | | | 35,661 |
Other | | | 10,320 | | | (179) | | | 10,141 | | | 11,408 | | | (305) | | | 11,103 |
| | | 101,658 | | | (3,949) | | | 97,709 | | | 106,155 | | | (6,391) | | | 99,764 |
Carrier: | | | | | | | | | | | | | | | | | | |
Data and transport services | | | 33,752 | | | (171) | | | 33,581 | | | 32,659 | | | (278) | | | 32,381 |
Voice services | | | 3,685 | | | (2) | | | 3,683 | | | 4,088 | | | (5) | | | 4,083 |
Other | | | 338 | | | (3) | | | 335 | | | 431 | | | — | | | 431 |
| | | 37,775 | | | (176) | | | 37,599 | | | 37,178 | | | (283) | | | 36,895 |
| | | | | | | | | | | | | | | | | | |
Subsidies | | | 13,078 | | | — | | | 13,078 | | | 17,671 | | | (250) | | | 17,421 |
Network access | | | 26,308 | | | (303) | | | 26,005 | | | 27,846 | | | (680) | | | 27,166 |
Other products and services | | | 1,965 | | | (121) | | | 1,844 | | | 7,758 | | | (222) | | | 7,536 |
Total operating revenue | | $ | 295,976 | | $ | (7,694) | | $ | 288,282 | | $ | 318,480 | | $ | (14,441) | | $ | 304,039 |
Notes:
| (1) | These adjustments reflect the removal of operating revenues from divestitures. We completed the sale of the Company's Ohio and Kansas assets on January 31, 2022 and November 30, 2022, respectively. |
Page 12 of 18
Consolidated Communications Holdings, Inc.
Reconciliation of Historical Revenue by Category to Normalized Revenue by Category
(Dollars in thousands)
(Unaudited)
| | Year Ended | | Year Ended | ||||||||||||||
| | December 31, 2022 | | December 31, 2021 | ||||||||||||||
|
| Historical |
| Adjustments (1) |
| Normalized |
| Historical | | Adjustments (1) | | Normalized | ||||||
Consumer: | | | | | | | | | | | | | | | | | | |
Broadband (Data and VoIP) | | $ | 272,146 | | $ | (6,732) | | $ | 265,414 | | $ | 269,323 | | $ | (10,763) | | $ | 258,560 |
Voice services | | | 144,853 | | | (2,067) | | | 142,786 | | | 160,698 | | | (4,099) | | | 156,599 |
Video services | | | 54,153 | | | (9,684) | | | 44,469 | | | 65,114 | | | (12,917) | | | 52,197 |
| | | 471,152 | | | (18,483) | | | 452,669 | | | 495,135 | | | (27,779) | | | 467,356 |
Commercial: | | | | | | | | | | | | | | | | | | |
Data services (includes VoIP) | | | 228,466 | | | (15,355) | | | 213,111 | | | 228,931 | | | (18,676) | | | 210,255 |
Voice services | | | 142,274 | | | (4,864) | | | 137,410 | | | 154,567 | | | (7,052) | | | 147,515 |
Other | | | 43,100 | | | (1,039) | | | 42,061 | | | 40,032 | | | (1,165) | | | 38,867 |
| | | 413,840 | | | (21,258) | | | 392,582 | | | 423,530 | | | (26,893) | | | 396,637 |
Carrier: | | | | | | | | | | | | | | | | | | |
Data and transport services | | | 137,378 | | | (4,095) | | | 133,283 | | | 133,434 | | | (1,035) | | | 132,399 |
Voice services | | | 14,772 | | | (14) | | | 14,758 | | | 17,183 | | | (16) | | | 17,167 |
Other | | | 1,688 | | | (11) | | | 1,677 | | | 1,592 | | | — | | | 1,592 |
| | | 153,838 | | | (4,120) | | | 149,718 | | | 152,209 | | | (1,051) | | | 151,158 |
| | | | | | | | | | | | | | | | | | |
Subsidies | | | 33,382 | | | (49) | | | 33,333 | | | 69,739 | | | (1,027) | | | 68,712 |
Network access | | | 104,644 | | | (1,715) | | | 102,929 | | | 120,487 | | | (2,963) | | | 117,524 |
Other products and services | | | 14,407 | | | (490) | | | 13,917 | | | 21,133 | | | (489) | | | 20,644 |
Total operating revenue | | $ | 1,191,263 | | $ | (46,115) | | $ | 1,145,148 | | $ | 1,282,233 | | $ | (60,202) | | $ | 1,222,031 |
Notes:
| (1) | These adjustments reflect the removal of operating revenues from divestitures. We completed the sale of the Company's Ohio and Kansas assets on January 31, 2022 and November 30, 2022, respectively. |
Page 13 of 18
Consolidated Communications Holdings, Inc.
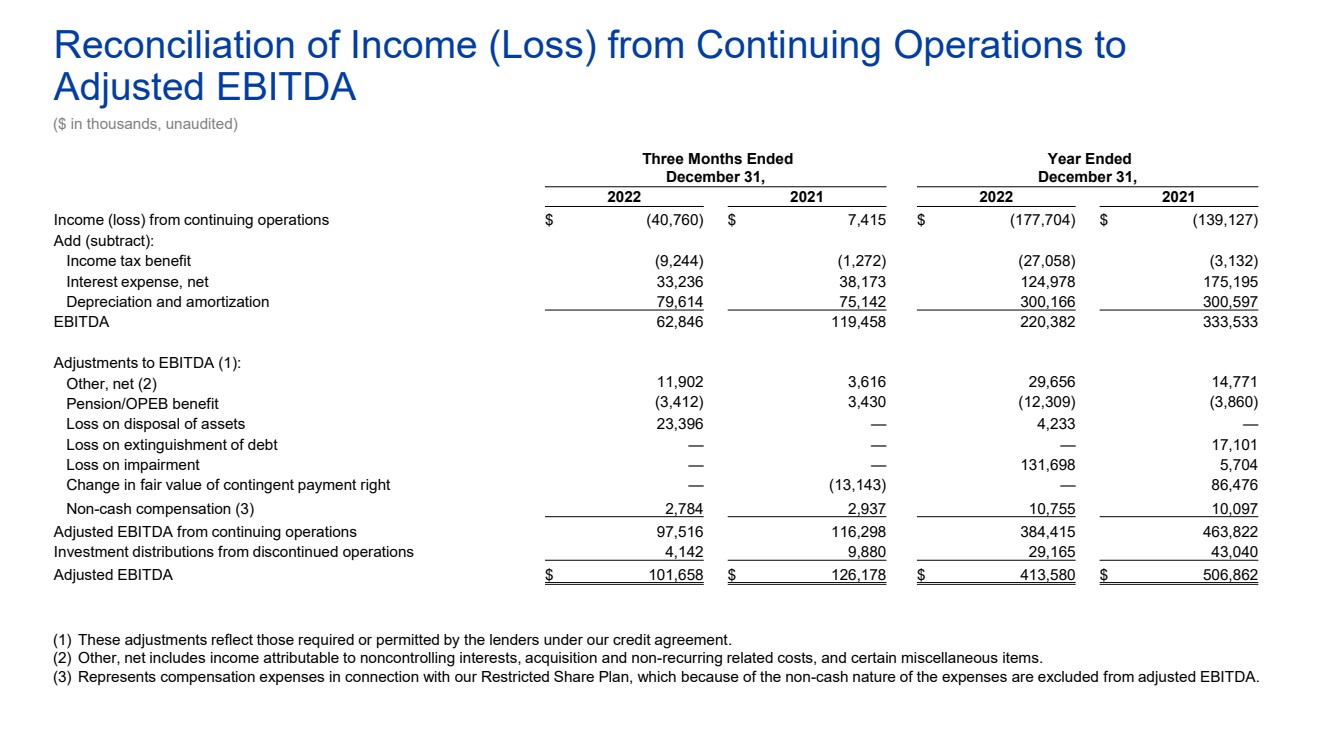
Reconciliation of Income (Loss) from Continuing Operations to Adjusted EBITDA
(Dollars in thousands)
(Unaudited)
| | Three Months Ended | | Year Ended | ||||||||
| | December 31, | | December 31, | ||||||||
|
| 2022 |
| 2021 |
| 2022 |
| 2021 | ||||
Income (loss) from continuing operations | | $ | (40,760) | | $ | 7,415 | | $ | (177,704) | | $ | (139,127) |
Add (subtract): | | | | | | | | | | | | |
Income tax benefit | | | (9,244) | | | (1,272) | | | (27,058) | | | (3,132) |
Interest expense, net | | | 33,236 | | | 38,173 | | | 124,978 | | | 175,195 |
Depreciation and amortization | | | 79,614 | | | 75,142 | | | 300,166 | | | 300,597 |
EBITDA | | | 62,846 | | | 119,458 | | | 220,382 | | | 333,533 |
| | | | | | | | | | | | |
Adjustments to EBITDA (1): | | | | | | | | | | | | |
Other, net (2) | | | 11,902 | | | 3,616 | | | 29,656 | | | 14,771 |
Pension/OPEB benefit | | | (3,412) | | | 3,430 | | | (12,309) | | | (3,860) |
Loss on disposal of assets | | | 23,396 | | | — | | | 4,233 | | | — |
Loss on extinguishment of debt | | | — | | | — | | | — | | | 17,101 |
Loss on impairment | | | — | | | — | | | 131,698 | | | 5,704 |
Change in fair value of contingent payment right | | | — | | | (13,143) | | | — | | | 86,476 |
Non-cash compensation (3) | | | 2,784 | | | 2,937 | | | 10,755 | | | 10,097 |
Adjusted EBITDA from continuing operations | | | 97,516 | | | 116,298 | | | 384,415 | | | 463,822 |
Investment distributions from discontinued operations | | | 4,142 | | | 9,880 | | | 29,165 | | | 43,040 |
Adjusted EBITDA | | $ | 101,658 | | $ | 126,178 | | $ | 413,580 | | $ | 506,862 |
Notes:
| (1) | These adjustments reflect those required or permitted by the lenders under our credit agreement. |
| (2) | Other, net includes income attributable to noncontrolling interests, acquisition and non-recurring related costs, and certain miscellaneous items. |
| (3) | Represents compensation expenses in connection with our Restricted Share Plan, which because of the non-cash nature of the expenses are excluded from adjusted EBITDA. |
Page 14 of 18
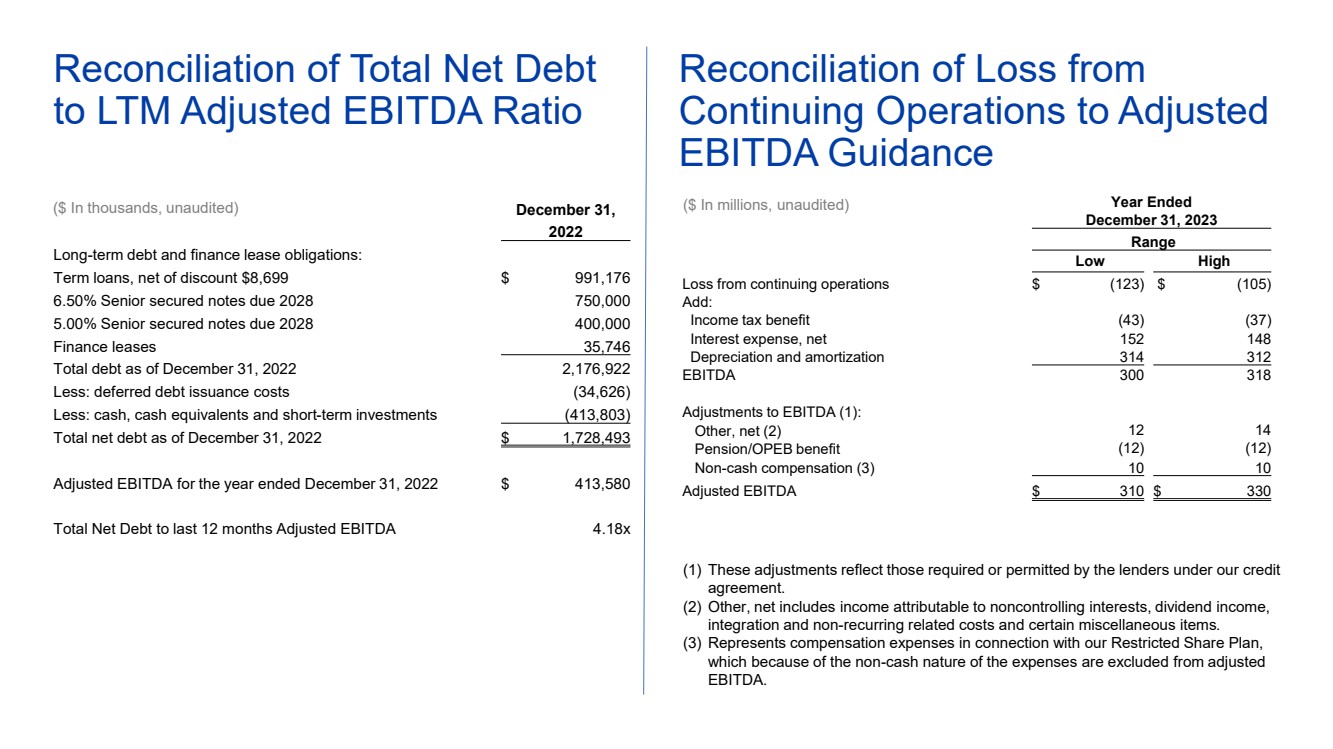
Consolidated Communications Holdings, Inc.
Reconciliation of Loss from Continuing Operations to Adjusted EBITDA Guidance
(Dollars in millions)
(Unaudited)
| Year Ended | | ||||
| December 31, 2023 | | ||||
| Range | | ||||
| Low | | High | | ||
Loss from continuing operations | $ | (123) | | $ | (105) | |
Add: | | | | | | |
Income tax benefit | | (43) | | | (37) | |
Interest expense, net | | 152 | | | 148 | |
Depreciation and amortization | | 314 | | | 312 | |
EBITDA | | 300 | | | 318 | |
| | | | | | |
Adjustments to EBITDA (1): | | | | | | |
Other, net (2) | | 12 | | | 14 | |
Pension/OPEB benefit | | (12) | | | (12) | |
Non-cash compensation (3) | | 10 | | | 10 | |
Adjusted EBITDA | $ | 310 | | $ | 330 | |
Notes:
| (1) | These adjustments reflect those required or permitted by the lenders under our credit agreement. |
| (2) | Other, net includes income attributable to noncontrolling interests, dividend income, and certain miscellaneous items. |
| (3) | Represents compensation expenses in connection with our Restricted Share Plan, which because of the non-cash nature of the expenses are excluded from adjusted EBITDA. |
Consolidated Communications Holdings, Inc.
Reconciliation of Total Net Debt to LTM Adjusted EBITDA Ratio
(Dollars in thousands)
(Unaudited)
| | December 31, | |
|
| 2022 | |
Long-term debt and finance lease obligations: | | | |
Term loans, net of discount $8,699 | | $ | 991,176 |
6.50% Senior secured notes due 2028 | | | 750,000 |
5.00% Senior secured notes due 2028 | | | 400,000 |
Finance leases | | | 35,746 |
Total debt as of December 31, 2022 | | | 2,176,922 |
Less: deferred debt issuance costs | | | (34,626) |
Less: cash, cash equivalents and short-term investments | | | (413,803) |
Total net debt as of December 31, 2022 | | $ | 1,728,493 |
| | | |
Adjusted EBITDA for the year ended December 31, 2022 | | $ | 413,580 |
| | | |
Total Net Debt to last 12 months Adjusted EBITDA | | | 4.18x |
| | | |
Page 15 of 18
Consolidated Communications Holdings, Inc.
Reconciliation of Income (Loss) Attributable to Common Shareholders from Continuing Operations to Adjusted Income (Loss) from Continuing Operations and Calculation of Adjusted Diluted Net Income (Loss) Per Common Share
(Dollars in thousands, except per share amounts)
(Unaudited)
| | Three Months Ended | | Year Ended | ||||||||||||||||
| | December 31, | | December 31, | ||||||||||||||||
|
| 2022 |
| 2021 |
| 2022 |
| 2021 | ||||||||||||
Income (loss) from continuing operations | | $ | (40,760) | | $ | 7,415 | | $ | (177,704) | | $ | (139,127) | ||||||||
Less: dividends on Series A preferred stock | | | 10,352 | | | 2,677 | | | 40,104 | | | 2,677 | ||||||||
Less: net income (loss) attributable to noncontrolling interest | |
| 171 | |
| (131) | |
| 564 | |
| 392 | ||||||||
Income (loss) attributable to common shareholders from continuing operations | |
| (51,283) | |
| 4,869 | |
| (218,372) | |
| (142,196) | ||||||||
| | | | | | | | | | | | | ||||||||
Adjustments to income (loss) attributable to common shareholders: | | | | | | | | | | | | | ||||||||
Dividends on Series A preferred stock | | | 10,352 | | | 2,677 | | | 40,104 | | | 2,677 | ||||||||
Integration and severance related costs, net of tax | | | 1,498 | | | 511 | | | 3,081 | | | 2,865 | ||||||||
Loss on impairment of assets held for sale | | | — | | | — | | | 131,698 | | | 5,704 | ||||||||
Loss on disposition of assets, net of tax | | | 17,354 | | | — | | | 3,140 | | | — | ||||||||
Loss on disposition of wireless spectrum licenses, net of tax | | | — | | | — | | | — | | | 2,643 | ||||||||
Loss on disposition of fixed wireless, net of tax | | | — | | | — | | | — | | | 3,087 | ||||||||
Loss on extinguishment of debt, net of tax | | | — | | | — | | | — | | | 12,648 | ||||||||
Change in fair value of contingent payment rights | | | — | | | (13,143) | | | — | | | 86,476 | ||||||||
Non-cash interest expense for Searchlight note including amortization of discount and fees | | | — | | | 7,317 | | | — | | | 39,323 | ||||||||
Non-cash interest expense for swaps, net of tax | | | (339) | | | (282) | | | (1,274) | | | (964) | ||||||||
Tax impact of non-deductible goodwill | | | 2,931 | | | — | | | (8,187) | | | — | ||||||||
Change in deferred tax rate | | | (2,417) | | | — | | | (3,062) | | | — | ||||||||
Other, tax | | | 622 | | | 1,663 | | | 622 | | | 1,663 | ||||||||
Non-cash stock compensation, net of tax | | | 2,065 | | | 2,172 | | | 7,977 | | | 7,468 | ||||||||
Adjusted net income (loss) from continuing operations | | $ | (19,217) | | $ | 5,784 | | $ | (44,273) | | $ | 21,394 | ||||||||
| | | | | | | | | | | | | ||||||||
Weighted average number of common shares outstanding | | | 111,929 | | | 100,024 | | | 111,754 | | | 87,293 | ||||||||
| | | | | | | | | | | | | ||||||||
Adjusted diluted net income (loss) per common share: | | | | | | | | | | | | | ||||||||
Adjusted net income (loss) from continuing operations | | $ | (0.17) | | $ | 0.06 | | $ | (0.40) | | $ | 0.25 | ||||||||
Adjusted income from discontinued operations excluding gain on sale of partnership interests, net of tax | | | 0.01 | | | 0.07 | | | 0.16 | | | 0.37 | ||||||||
| | $ | (0.16) | | $ | 0.13 | | $ | (0.24) | | $ | 0.62 | ||||||||
Notes:
Calculations above assume a 25.83% effective tax rate for the three months and year ended December 31, 2022 and 26.0% effective tax rate for the three months and year ended December 31, 2021.
Page 16 of 18
Consolidated Communications Holdings, Inc.
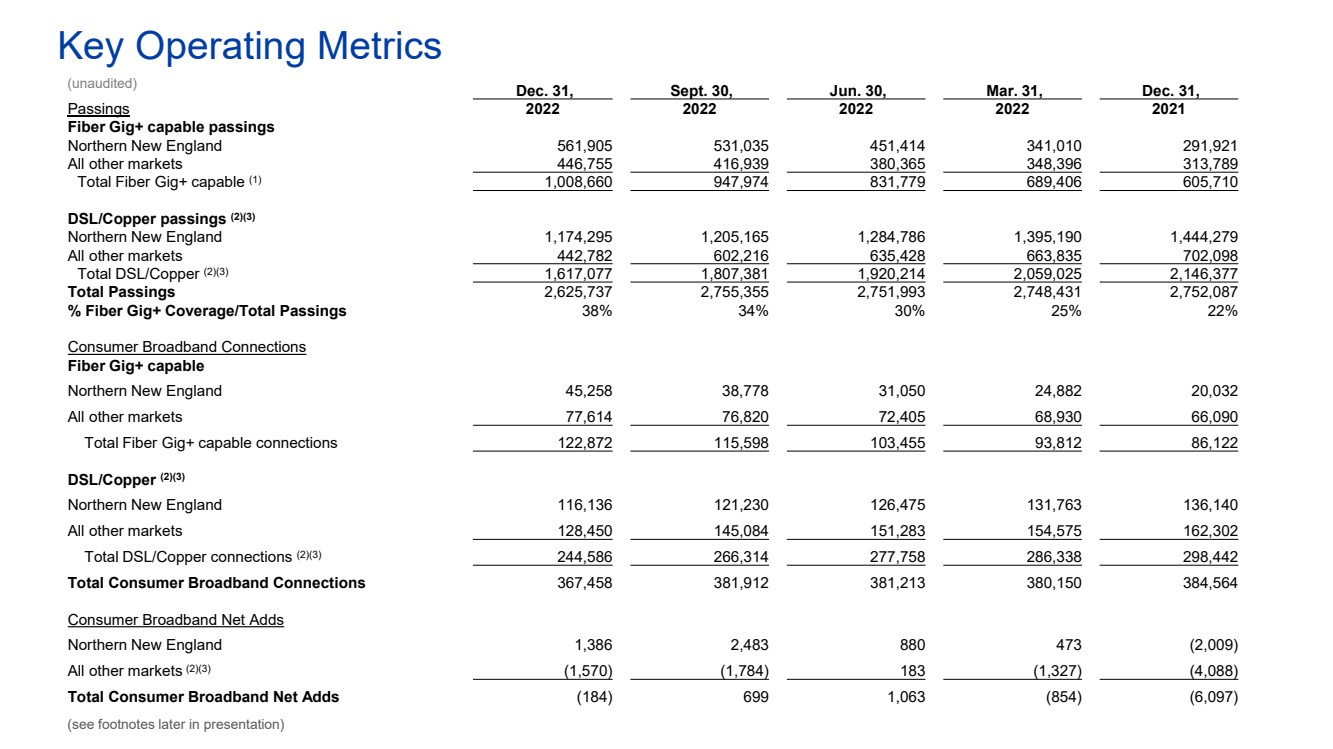
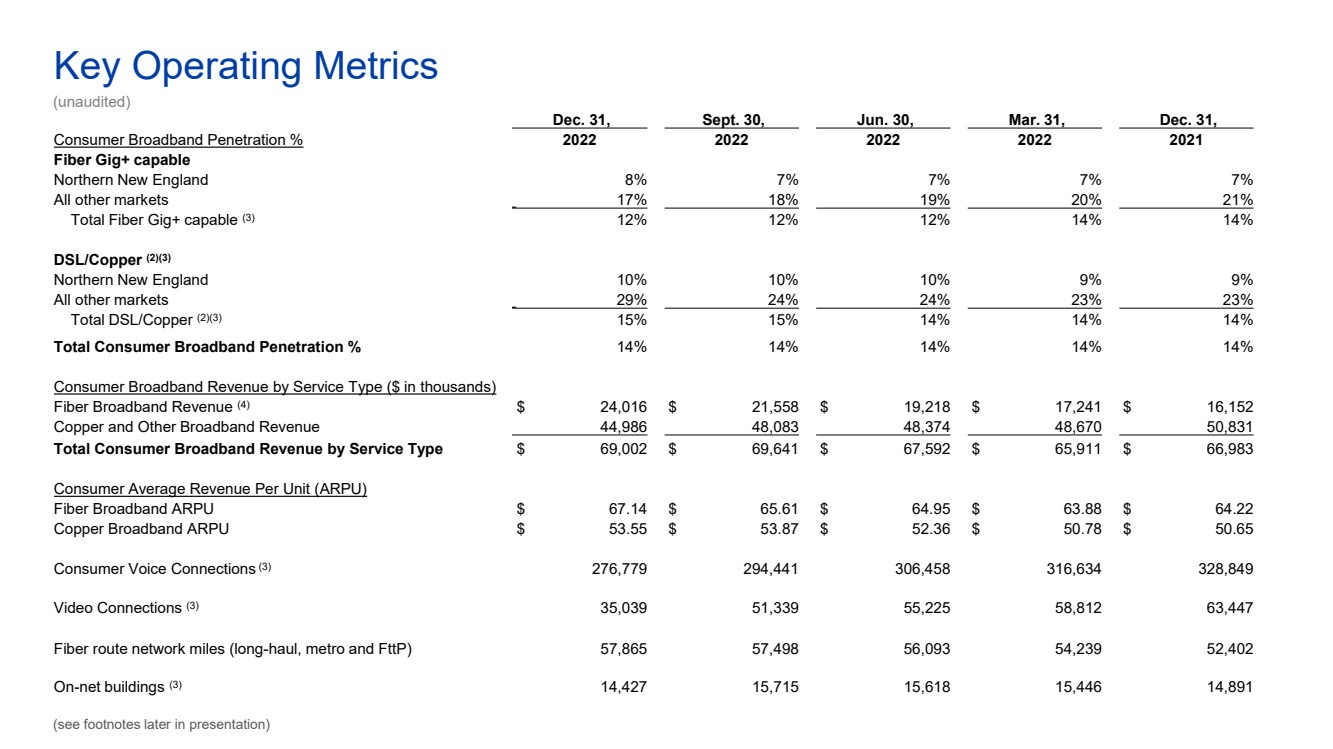
Key Operating Metrics
(Unaudited)
| | December 31, | | September 30, | | June 30, | | March 31, | | December 31, | | |||||
|
| 2022 |
| 2022 |
| 2022 |
| 2022 |
| 2021 |
| |||||
Passings | | | | | | | | | | | | | | | | |
Fiber Gig+ capable passings | | | | | | | | | | | | | | | | |
Northern New England | | | 561,905 | | | 531,035 | | | 451,414 | | | 341,010 | | | 291,921 | |
All other markets | | | 446,755 | | | 416,939 | | | 380,365 | | | 348,396 | | | 313,789 | |
Total Fiber Gig+ capable (1) | | | 1,008,660 | | | 947,974 | | | 831,779 | | | 689,406 | | | 605,710 | |
| | | | | | | | | | | | | | | | |
DSL/Copper passings (2)(3) | | | | | | | | | | | | | | | | |
Northern New England | | | 1,174,295 | | | 1,205,165 | | | 1,284,786 | | | 1,395,190 | | | 1,444,279 | |
All other markets | | | 442,782 | | | 602,216 | | | 635,428 | | | 663,835 | | | 702,098 | |
Total DSL/Copper (2)(3) | | | 1,617,077 | | | 1,807,381 | | | 1,920,214 | | | 2,059,025 | | | 2,146,377 | |
Total Passings | | | 2,625,737 | | | 2,755,355 | | | 2,751,993 | | | 2,748,431 | | | 2,752,087 | |
% Fiber Gig+ Coverage/Total Passings | | | 38% | | | 34% | | | 30% | | | 25% | | | 22% | |
| | | | | | | | | | | | | | | | |
Consumer Broadband Connections | | | | | | | | | | | | | | | | |
Fiber Gig+ capable | | | | | | | | | | | | | | | | |
Northern New England | | | 45,258 | | | 38,778 | | | 31,050 | | | 24,882 | | | 20,032 | |
All other markets | | | 77,614 | | | 76,820 | | | 72,405 | | | 68,930 | | | 66,090 | |
Total Fiber Gig+ capable connections | | | 122,872 | | | 115,598 | | | 103,455 | | | 93,812 | | | 86,122 | |
| | | | | | | | | | | | | | | | |
DSL/Copper (2)(3) | | | | | | | | | | | | | | | | |
Northern New England | | | 116,136 | | | 121,230 | | | 126,475 | | | 131,763 | | | 136,140 | |
All other markets | | | 128,450 | | | 145,084 | | | 151,283 | | | 154,575 | | | 162,302 | |
Total DSL/Copper connections (2)(3) | | | 244,586 | | | 266,314 | | | 277,758 | | | 286,338 | | | 298,442 | |
Total Consumer Broadband Connections | | | 367,458 | | | 381,912 | | | 381,213 | | | 380,150 | | | 384,564 | |
| | | | | | | | | | | | | | | | |
Consumer Broadband Net Adds | | | | | | | | | | | | | | | | |
Northern New England | | | 1,386 | | | 2,483 | | | 880 | | | 473 | | | (2,009) | |
All other markets (2)(3) | | | (1,570) | | | (1,784) | | | 183 | | | (1,327) | | | (4,088) | |
Total Consumer Broadband Net Adds | | | (184) | | | 699 | | | 1,063 | | | (854) | | | (6,097) | |
| | | | | | | | | | | | | | | | |
Consumer Broadband Penetration % | | | | | | | | | | | | | | | | |
Fiber Gig+ capable | | | | | | | | | | | | | | | | |
Northern New England | | | 8% | | | 7% | | | 7% | | | 7% | | | 7% | |
All other markets | | | 17% | | | 18% | | | 19% | | | 20% | | | 21% | |
Total Fiber Gig+ capable (3) | | | 12% | | | 12% | | | 12% | | | 14% | | | 14% | |
| | | | | | | | | | | | | | | | |
DSL/Copper (2)(3) | | | | | | | | | | | | | | | | |
Northern New England | | | 10% | | | 10% | | | 10% | | | 9% | | | 9% | |
All other markets | | | 29% | | | 24% | | | 24% | | | 23% | | | 23% | |
Total DSL/Copper (2)(3) | | | 15% | | | 15% | | | 14% | | | 14% | | | 14% | |
Total Consumer Broadband Penetration % | | | 14% | | | 14% | | | 14% | | | 14% | | | 14% | |
| | | | | | | | | | | | | | | | |
Consumer Broadband Revenue by Service Type ($ in thousands) | | | | | | | | | | | | | | | | |
Fiber Broadband Revenue (4) | | $ | 24,016 | | $ | 21,558 | | $ | 19,218 | | $ | 17,241 | | $ | 16,152 | |
Copper and Other Broadband Revenue | | | 44,986 | | | 48,083 | | | 48,374 | | | 48,670 | | | 50,831 | |
Total Consumer Broadband Revenue by Service Type | | $ | 69,002 | | $ | 69,641 | | $ | 67,592 | | $ | 65,911 | | $ | 66,983 | |
| | | | | | | | | | | | | | | | |
Consumer Average Revenue Per Unit (ARPU) | | | | | | | | | | | | | | | | |
Fiber Broadband ARPU | | $ | 67.14 | | $ | 65.61 | | $ | 64.95 | | $ | 63.88 | | $ | 64.22 | |
Copper Broadband ARPU | | $ | 53.55 | | $ | 53.87 | | $ | 52.36 | | $ | 50.78 | | $ | 50.65 | |
| | | | | | | | | | | | | | | | |
Consumer Voice Connections (3) | | | 276,779 | | | 294,441 | | | 306,458 | | | 316,634 | | | 328,849 | |
| | | | | | | | | | | | | | | | |
Video Connections (3) | | | 35,039 | | | 51,339 | | | 55,225 | | | 58,812 | | | 63,447 | |
Page 17 of 18
| | | | | | | | | | | | | | | | |
Fiber route network miles (long-haul, metro and FttP) | | | 57,865 | | | 57,498 | | | 56,093 | | | 54,239 | | | 52,402 | |
| | | | | | | | | | | | | | | | |
On-net buildings (3) | | | 14,427 | | | 15,715 | | | 15,618 | | | 15,446 | | | 14,891 | |
Notes:
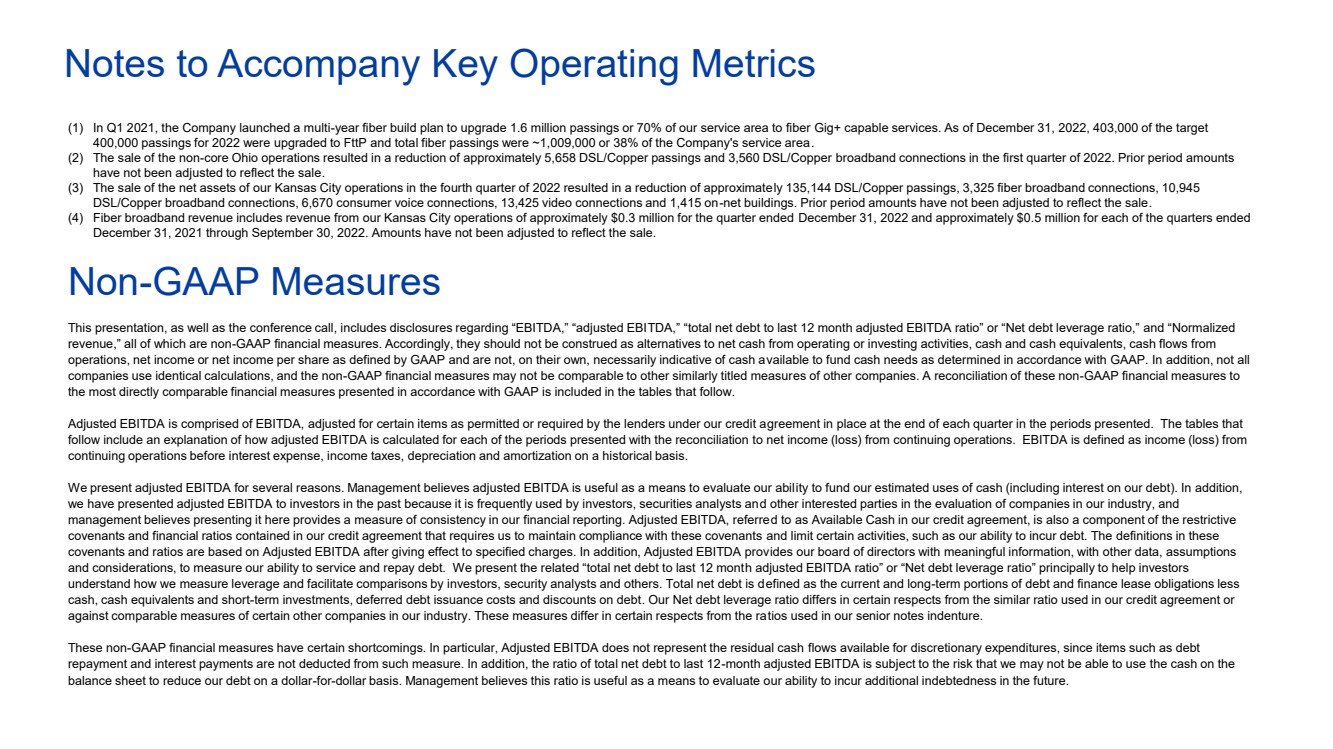
| (1) | In Q1 2021, the Company launched a multi-year fiber build plan to upgrade 1.6 million passings or 70% of our service area to fiber Gig+ capable services. As of December 31, 2022, 403,000 of the target 400,000 passings for 2022 were upgraded to FttP and total fiber passings were ~1,009,000 or 38% of the Company's service area. |
| (2) | The sale of the non-core Ohio operations resulted in a reduction of approximately 5,658 DSL/Copper passings and 3,560 DSL/Copper broadband connections in the first quarter of 2022. Prior period amounts have not been adjusted to reflect the sale. |
| (3) | The sale of the net assets of our Kansas City operations in the fourth quarter of 2022 resulted in a reduction of approximately 135,144 DSL/Copper passings, 3,325 fiber broadband connections, 10,945 DSL/Copper broadband connections, 6,670 consumer voice connections, 13,425 video connections and 1,415 on-net buildings. Prior period amounts have not been adjusted to reflect the sale. |
| (4) | Fiber broadband revenue includes revenue from our Kansas City operations of approximately $0.3 million for the quarter ended December 31, 2022 and approximately $0.5 million for each of the quarters ended December 31, 2021 through September 30, 2022. Amounts have not been adjusted to reflect the sale. |
Page 18 of 18