Exhibit 99.1

Consolidated Communications Reports First Quarter 2022 Results Including a Record Increase in Fiber Subscribers
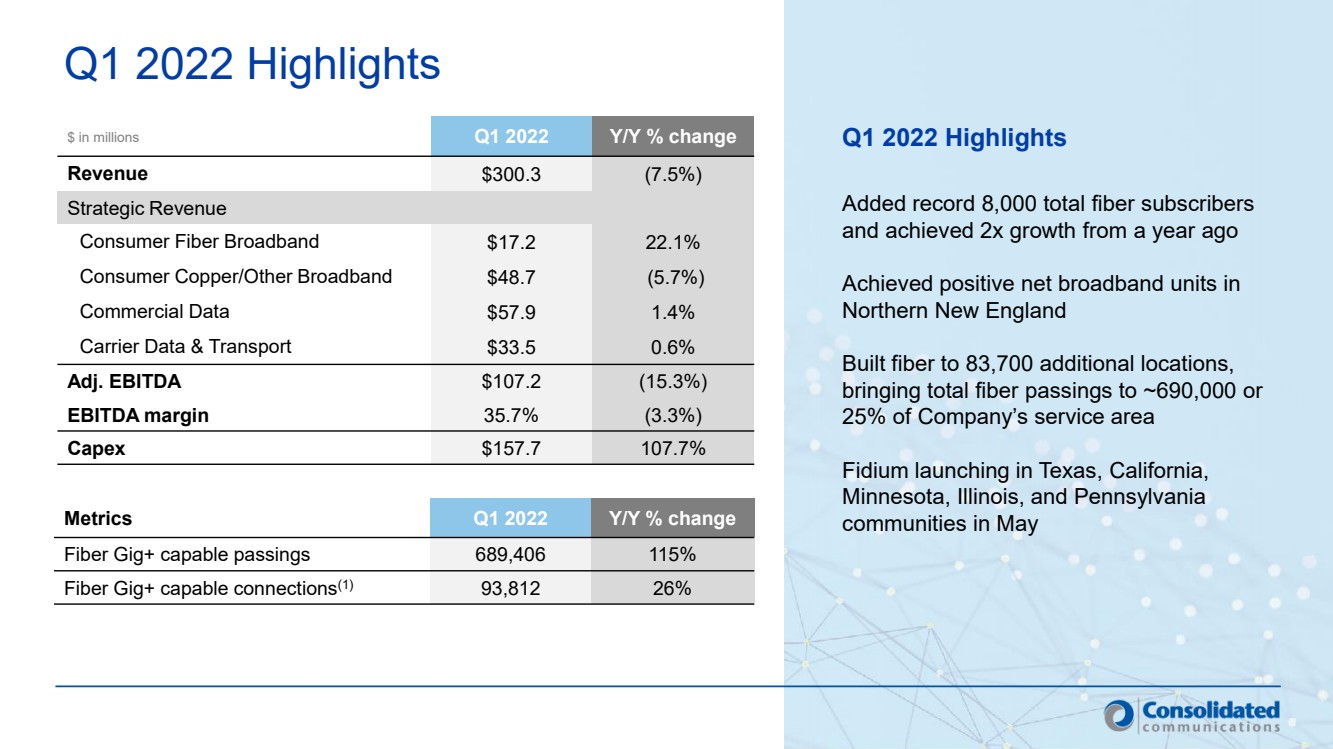
Added record 8,000 total fiber subscribers and achieved 2x growth from a year ago;
Achieved net positive broadband connections in Northern New England
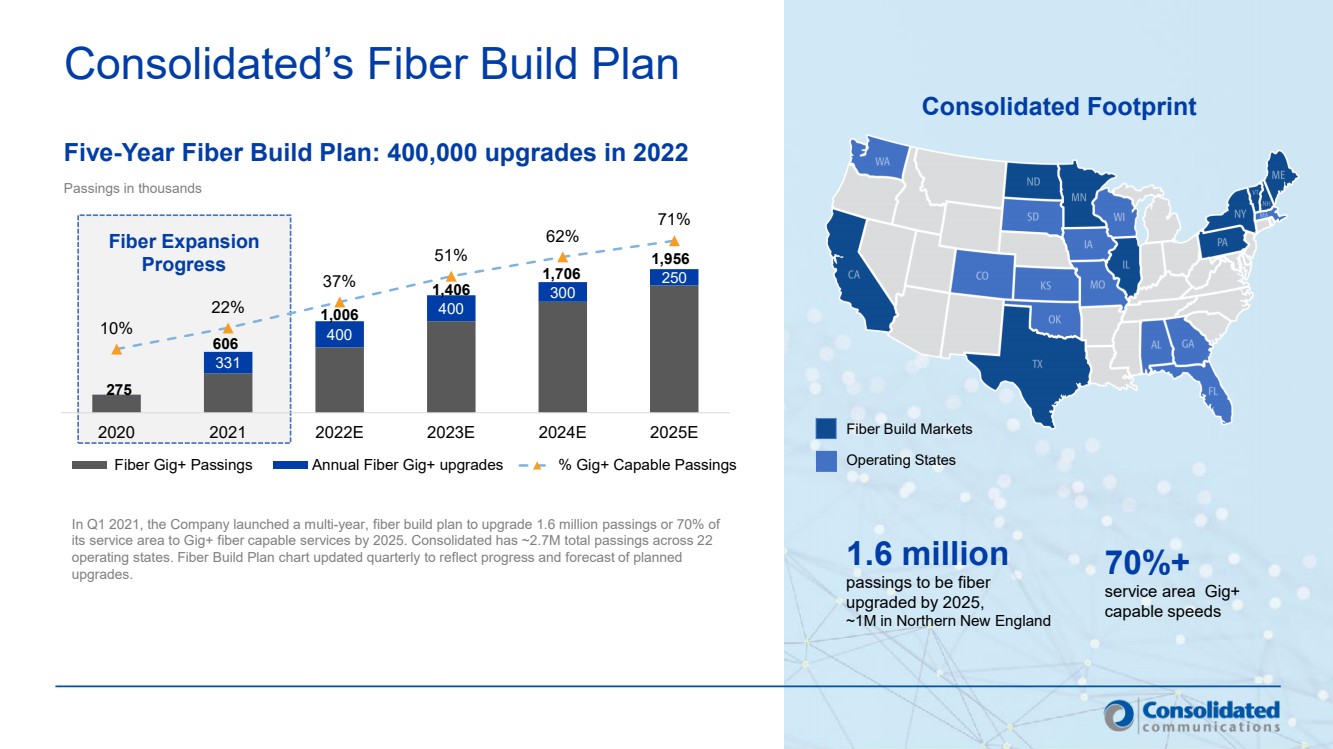
Built fiber to 83,700 additional locations, bringing total fiber passings to 690,000 or 25% of Company’s service area
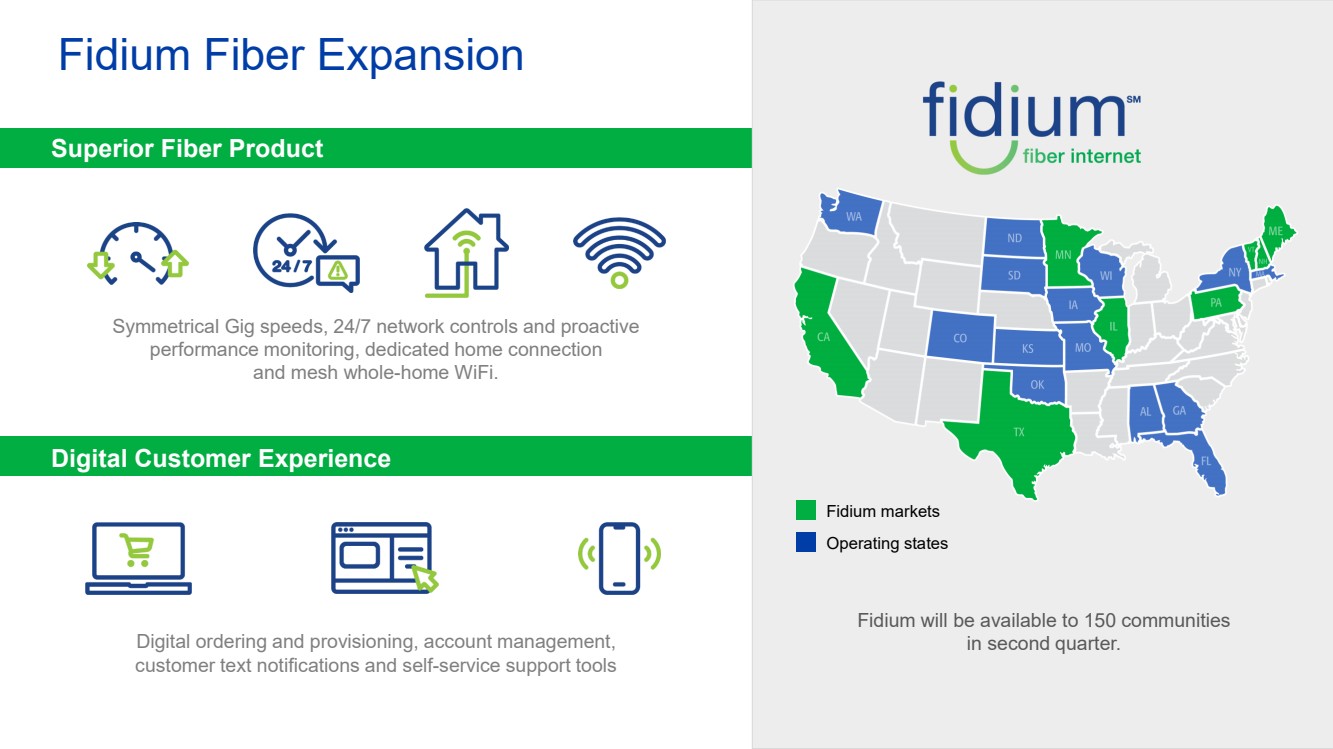
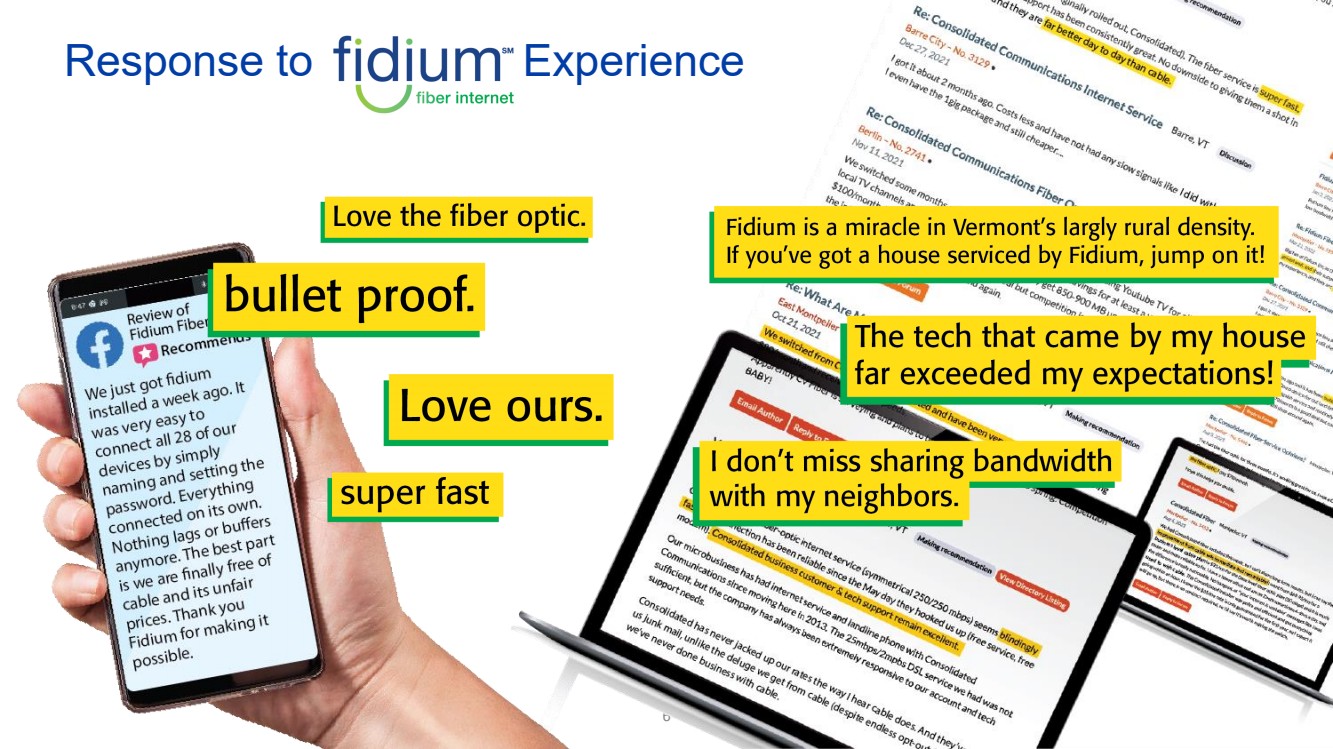
Fidium launching in Texas, California, Minnesota, Illinois, and Pennsylvania communities
Mattoon, Ill. – May 5, 2022 – Consolidated Communications Holdings, Inc. (Nasdaq: CNSL) (the “Company” or “Consolidated”), a top 10 fiber provider in the U.S., today reported results for the first quarter 2022.
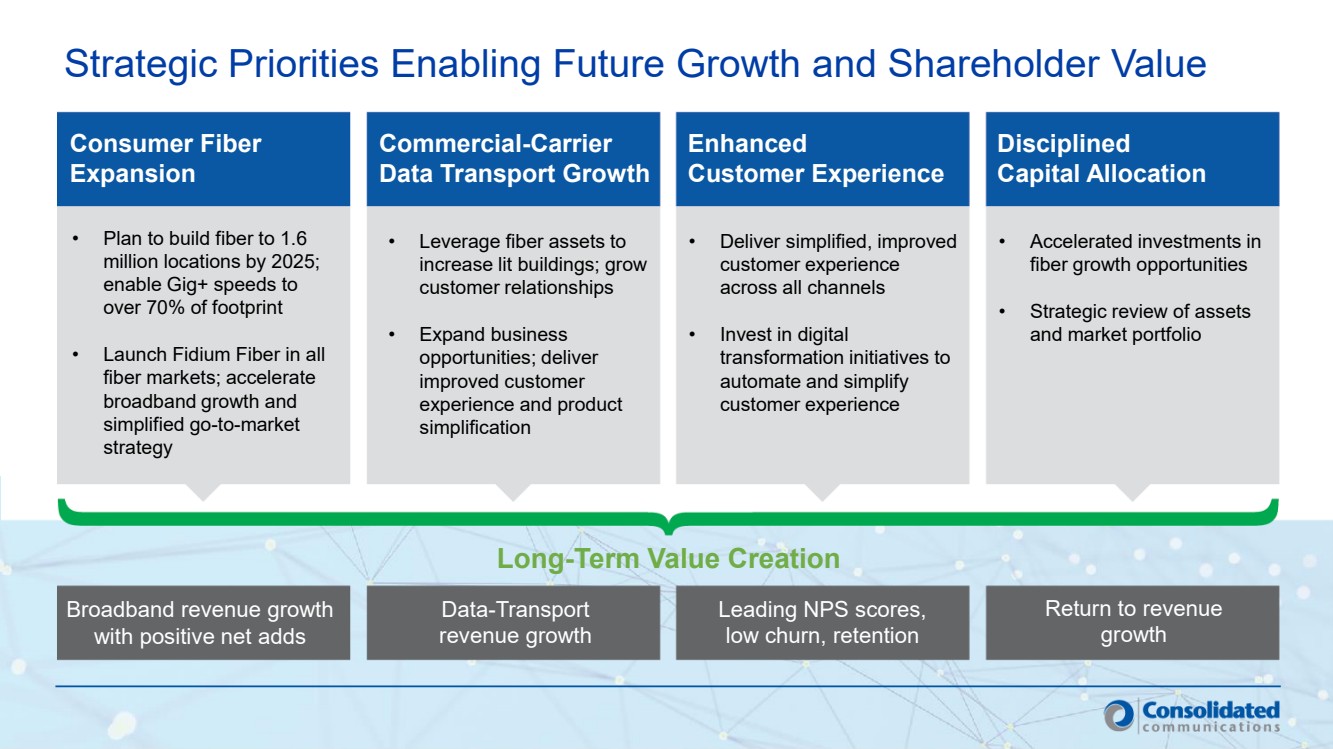
“Our first quarter results demonstrate the continued success of our fiber construction engine with 83,700 locations upgraded to fiber services with multi-gig capable speeds,” said Bob Udell, president and chief executive officer at Consolidated Communications. “We added a record 8,000 total fiber subscribers in the first quarter and achieved net positive adds in Northern New England. We are on track to build 400,000 fiber passings this year as part of our plan to bring FttP to 70% of our addressable market by 2025. We are building strong momentum to achieve sustained long-term growth and return to revenue growth in 2023.”
First Quarter 2022 Highlights and Results (compared to first quarter 2021)
| ● | Revenue totaled $300.3 million, generating Adjusted EBITDA of $107.2 million. |
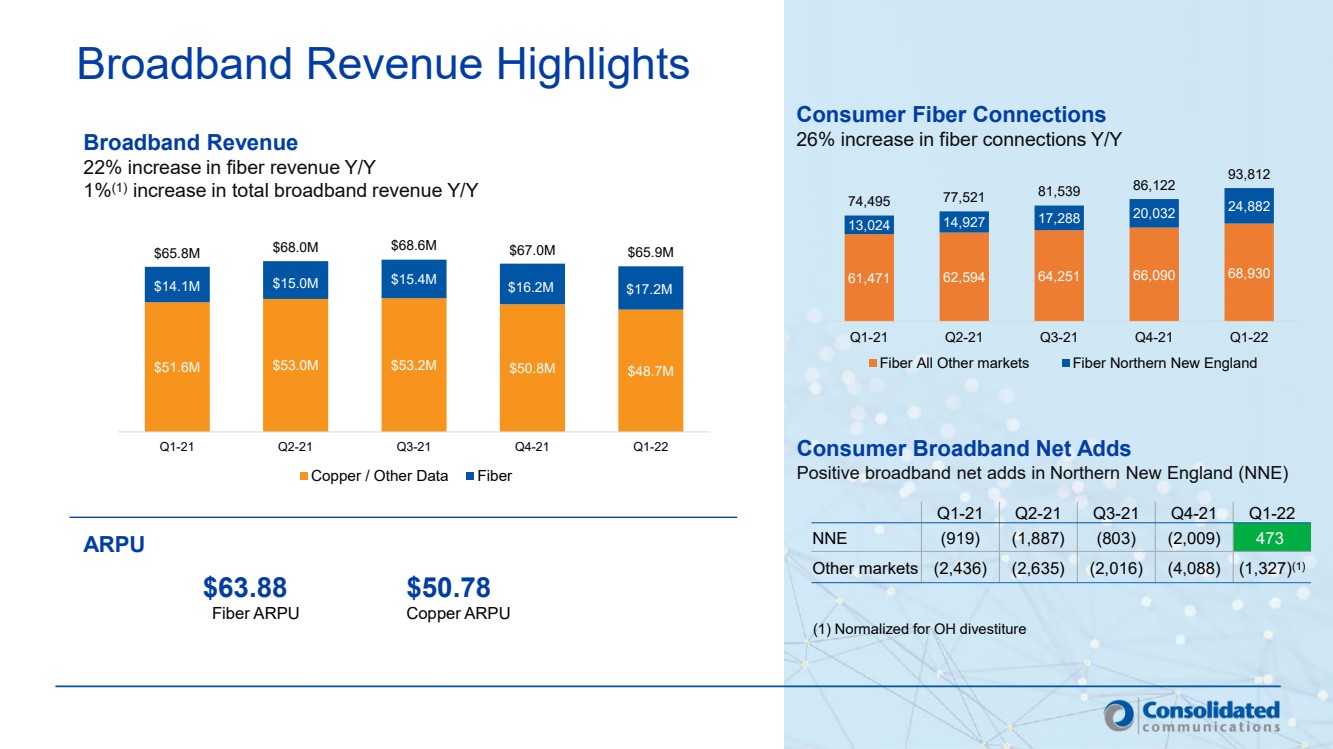
| ● | Consumer broadband revenue, normalized for the sale of our Ohio assets, grew 1%. |
| ● | Consumer fiber revenue grew 22%, driven by 2x consumer fiber net adds with positive net adds in Northern New England. |
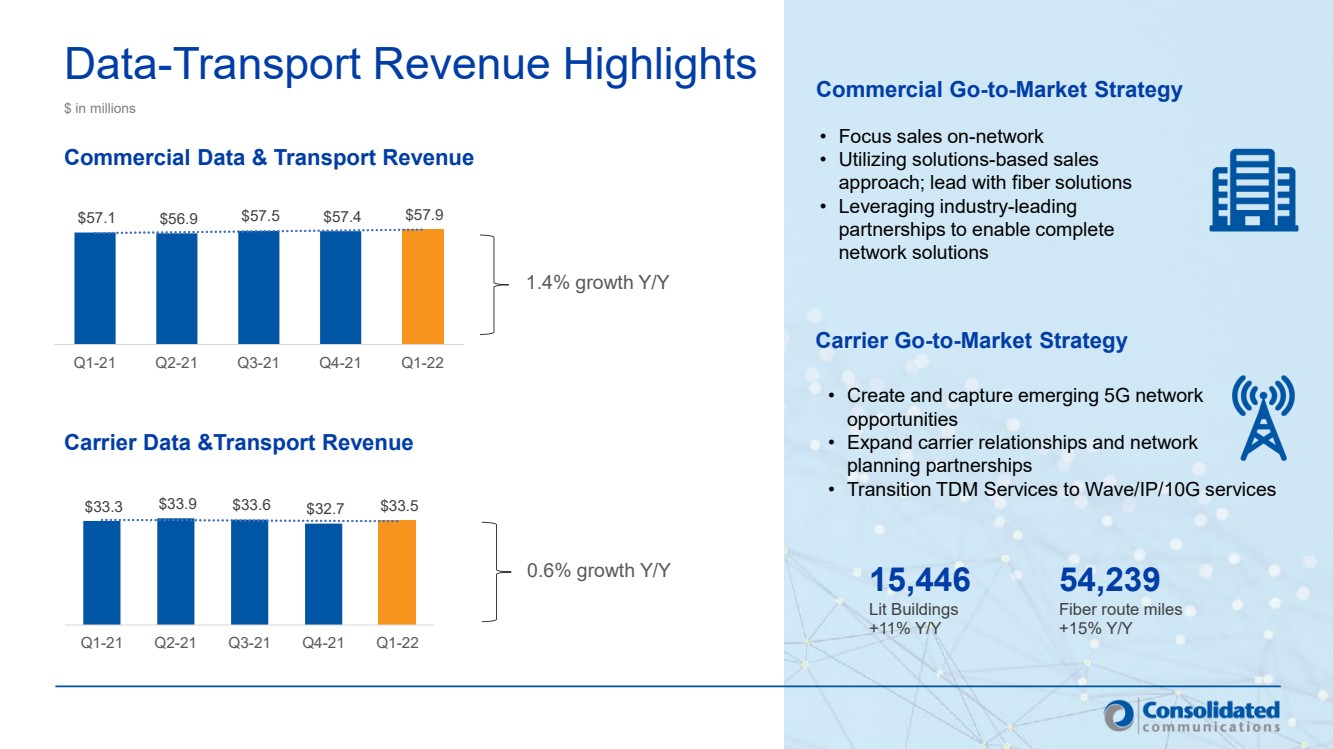
| ● | Commercial Data-Transport revenue was $57.9 million, up 1.4%. |
| ● | Subsidy revenue was $6.6 million, a decline of $10.8 million, primarily reflecting the expected transition to the Rural Digital Opportunity Fund (RDOF). |
| ● | Other Products and Services included revenue associated with public-private partnership network builds, was $4.5 million compared to $6.5 million a year ago. |
| ● | Upgraded 83,700 locations to fiber services with Gig+ capable speeds. |
| ● | Net cash from operating activities was $81.6 million. Cash and short-term investments totaled $159.9 million. |
| ● | Total committed capital expenditures were $157.7 million, primarily driven by the Company’s fiber build expansion plan. |
| ● | Operating expenses, excluding the loss on impairment of assets held for sale, were $209.2 million, down $1.6 million from a year ago. The primary drivers were lower expenses associated with public-private partnership builds and other product-related costs partially offset by increased marketing expenses. |
The Company recognized a non-cash impairment charge of $126.5 million in the recent quarter related to the Kansas City assets held for sale. This charge resulted in a loss from operations totaling ($107.7 million), compared to income from operations of $38.3 million a year ago. Excluding the non-cash impairment charge, income from operations for the quarter was $18.7 million, a year-over-year decrease of $19.6 million,
Page 1 of 14
primarily due to the decline in revenue of $24.5 million offset by a decline in depreciation and amortization expense of $3.3 million and slightly lower operating expenses.
Net interest expense was $29.5 million, a decrease of $18.9 million compared to a year ago primarily as a result of non-cash interest of $10.2 million on the Searchlight note, which was converted to perpetual preferred stock in conjunction with the second stage closing of the Searchlight investment in December 2021. The remaining reduction in interest expense was primarily the result of favorable repricing of the Company’s term loan in April 2021.
Cash distributions from the Company’s wireless partnerships totaled $8.2 million, compared to $9.4 million a year ago.
GAAP net loss was ($125.3 million) compared to a net loss of ($62.1 million) for the same period a year ago. GAAP net loss per share was ($1.12) compared to a net loss of ($0.80) in the prior year. Adjusted diluted net income per share excludes certain items as outlined in the table provided in this release. Adjusted diluted net income per share was $0.02 compared to $0.21 in the year ago quarter.
Adjusted EBITDA was $107.2 million, compared to $126.6 million in the prior year.
Asset Divestitures
As part of the Company’s ongoing market portfolio review and focus on its fiber expansion plans, the Company is providing an update on recent divestiture activities.
On Jan. 31, 2022, Consolidated closed on the sale of substantially all of its Ohio assets, for total cash proceeds of $26 million.
On Mar. 3, 2022, Consolidated announced an agreement to sell substantially all of its Kansas City assets. The Company currently expects net cash proceeds of approximately $90 million for the sale, subject to certain purchase price adjustments, closing conditions and customary regulatory approvals. The transaction is expected to close in the second half of 2022.
The Company intends to use proceeds from these asset sales to further support its fiber expansion plans.
2022 Outlook
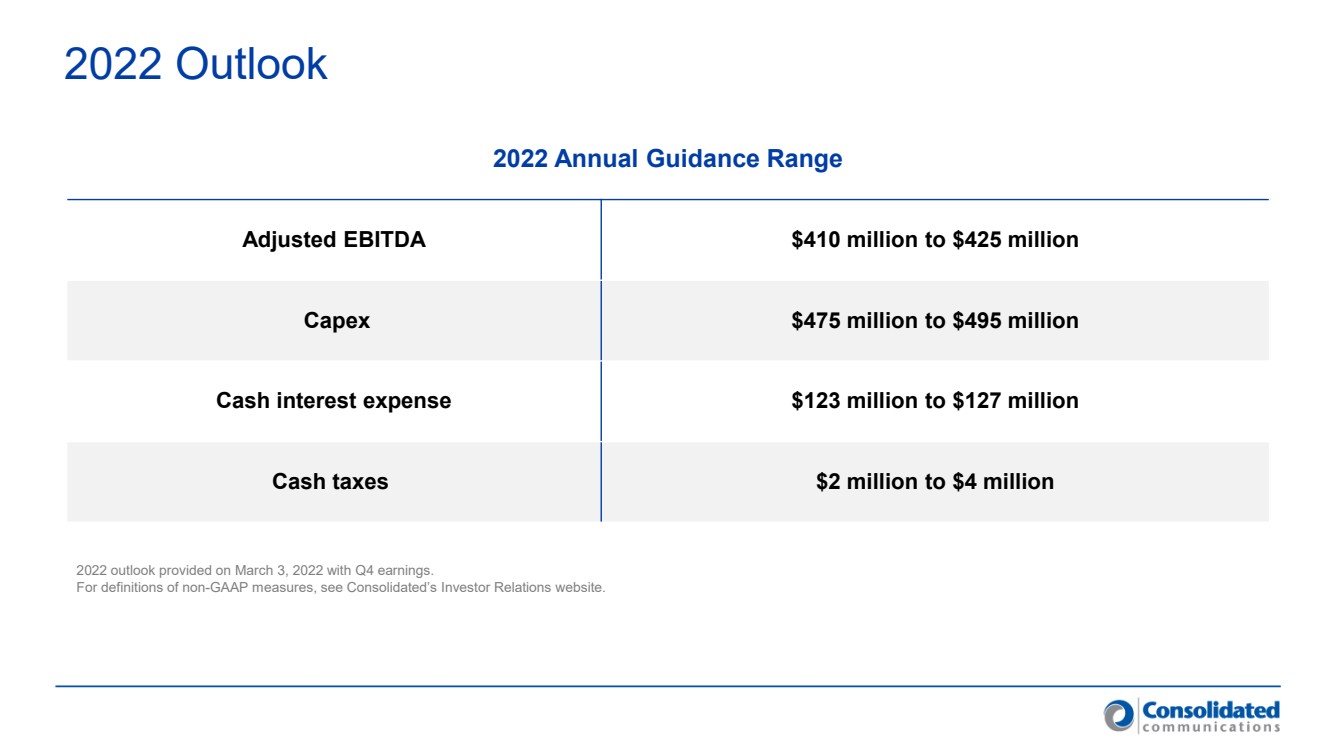
Consolidated Communications reaffirmed its previous guidance for the full-year 2022.
| ● | Adjusted EBITDA is expected to be in a range of $410 million to $425 million. |
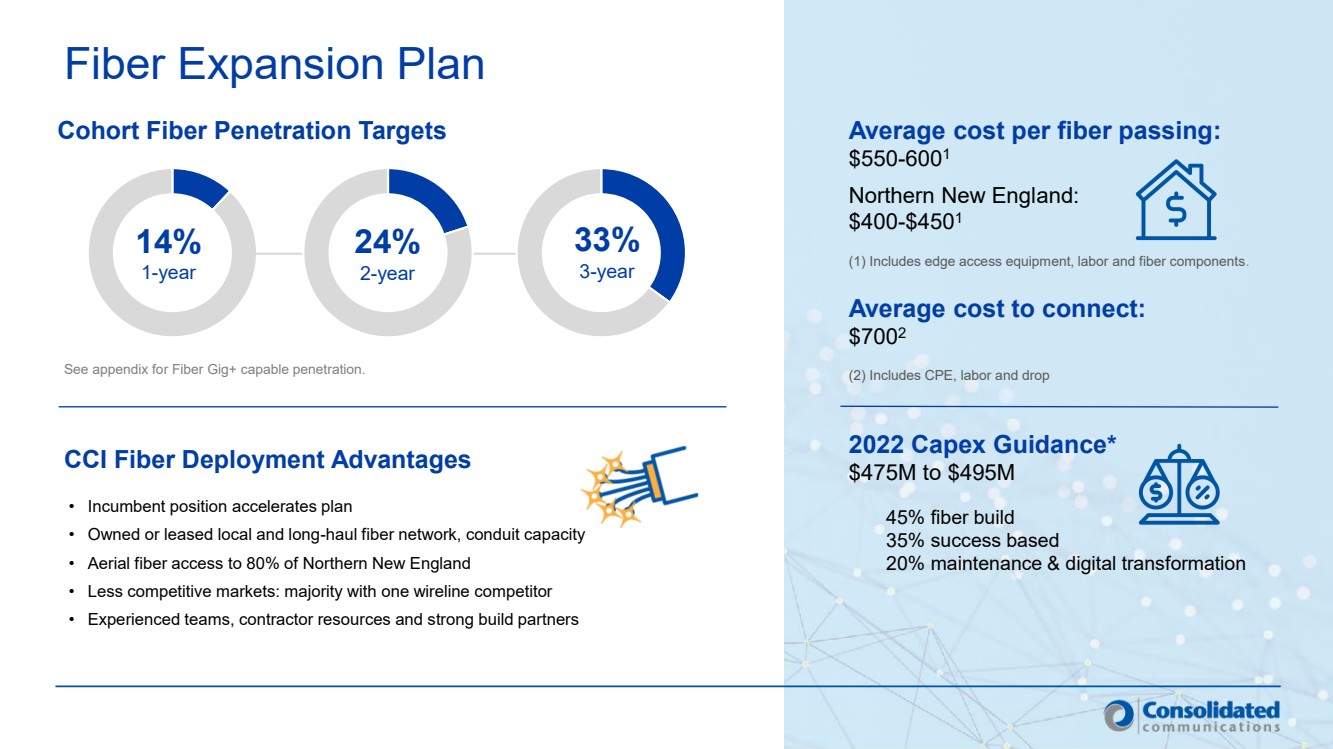
| ● | Capital expenditures are expected to be in a range of $475 million to $495 million. |
| ● | Cash interest expense is expected to be in a range of $123 million to $127 million. |
| ● | Cash income taxes are expected to be in a range of $2 million to $4 million. |
Conference Call
Consolidated’s first quarter 2022 earnings conference call will be webcast live today at 8:30 a.m. ET. The webcast and materials will be available on the Investor Relations section of the Company’s website at http://ir.consolidated.com. The live conference call dial-in number for analysts and investors is 888-440-5977, conference ID 8956400. A phone replay of the conference call will be available through May 16 by calling 800-770-2030, enter ID 8956400.
About Consolidated Communications
Consolidated Communications Holdings, Inc. (NASDAQ: CNSL) is dedicated to moving people, businesses and communities forward by delivering the latest reliable communications solutions. Consumers, businesses and wireless and wireline carriers depend on Consolidated for a wide range of high-speed internet, data, phone, security, cloud and wholesale carrier solutions. With a network spanning 50,000 fiber route miles, Consolidated is a top 10 U.S. fiber provider, turning technology into solutions that are backed by exceptional customer support. Learn more at consolidated.com.
Page 2 of 14
Use of Non-GAAP Financial Measures
This press release, as well as the conference call, includes disclosures regarding “EBITDA,” “adjusted EBITDA,” “total net debt to last 12 month adjusted EBITDA ratio” or “Net debt leverage ratio,” and “adjusted diluted net income (loss) per share,” all of which are non-GAAP financial measures and described in this section as not being in compliance with Regulation S-X. Accordingly, they should not be construed as alternatives to net cash from operating or investing activities, cash and cash equivalents, cash flows from operations, net income or net income per share as defined by GAAP and are not, on their own, necessarily indicative of cash available to fund cash needs as determined in accordance with GAAP. In addition, not all companies use identical calculations, and the non-GAAP financial measures may not be comparable to other similarly titled measures of other companies. A reconciliation of the differences between these non-GAAP financial measures and the most directly comparable financial measures presented in accordance with GAAP is included in the tables that follow.
Adjusted EBITDA is comprised of EBITDA, adjusted for certain items as permitted or required by the lenders under our credit agreement in place at the end of each quarter in the periods presented. The tables that follow include an explanation of how adjusted EBITDA is calculated for each of the periods presented with the reconciliation to net income. EBITDA is defined as net earnings before interest expense, income taxes, depreciation and amortization on a historical basis.
We present adjusted EBITDA for several reasons. Management believes adjusted EBITDA is useful as a means to evaluate our ability to fund our estimated uses of cash (including interest on our debt). In addition, we have presented adjusted EBITDA to investors in the past because it is frequently used by investors, securities analysts and other interested parties in the evaluation of companies in our industry, and management believes presenting it here provides a measure of consistency in our financial reporting. Adjusted EBITDA, referred to as Available Cash in our credit agreement, is also a component of the restrictive covenants and financial ratios contained in our credit agreement that requires us to maintain compliance with these covenants and limit certain activities, such as our ability to incur debt. The definitions in these covenants and ratios are based on adjusted EBITDA after giving effect to specified charges. In addition, adjusted EBITDA provides our board of directors with meaningful information, with other data, assumptions and considerations, to measure our ability to service and repay debt. We present the related “total net debt to last 12 month adjusted EBITDA ratio” or “Net debt leverage ratio” principally to help investors understand how we measure leverage and facilitate comparisons by investors, security analysts and others. This ratio differs in certain respects from the similar ratio used in our credit agreement against comparable measures of certain other companies in our industry. These measures differ in certain respects from the ratios used in our senior notes indenture.
These non-GAAP financial measures have certain shortcomings. In particular, adjusted EBITDA does not represent the residual cash flows available for discretionary expenditures, since items such as debt repayment and interest payments are not deducted from such measure. In addition, the ratio of total net debt to last 12-month adjusted EBITDA is subject to the risk that we may not be able to use the cash on the balance sheet to reduce our debt on a dollar-for-dollar basis. Management believes this ratio is useful as a means to evaluate our ability to incur additional indebtedness in the future.
We present the non-GAAP measure “adjusted diluted net income (loss) per share” because our net income (loss) and net income (loss) per share are regularly affected by items that occur at irregular intervals or are non-cash items. We believe that disclosing these measures assists investors, securities analysts and other interested parties in evaluating both our company over time and the relative performance of the companies in our industry.
Safe Harbor
Certain statements in this press release are forward-looking statements and are made pursuant to the safe harbor provisions of the Securities Litigation Reform Act of 1995. These forward-looking statements reflect, among other things, our current expectations, plans, strategies, and anticipated financial results. There are a number of risks, uncertainties, and conditions that may cause our actual results to differ materially from those expressed or implied by these forward-looking statements. These risks and uncertainties include a number of factors related to our business, including the uncertainties relating to the impact of the novel coronavirus (COVID-19) pandemic on the Company’s business, results of operations, cash flows, stock price and
Page 3 of 14
employees; the possibility that any of the anticipated benefits of the strategic investment from Searchlight or our refinancing of outstanding debt, including our senior secured credit facilities, will not be realized; the outcome of any legal proceedings that may be instituted against the Company or its directors; the anticipated use of proceeds of the strategic investment; economic and financial market conditions generally and economic conditions in our service areas; various risks to the price and volatility of our common stock; changes in the valuation of pension plan assets; the substantial amount of debt and our ability to repay or refinance it or incur additional debt in the future; our need for a significant amount of cash to service and repay the debt restrictions contained in our debt agreements that limit the discretion of management in operating the business; regulatory changes, including changes to subsidies, rapid development and introduction of new technologies and intense competition in the telecommunications industry; risks associated with our possible pursuit of or failure to consummate acquisitions or dispositions; system failures; cyber-attacks, information or security breaches or technology failure of ours or of a third party; losses of large customers or government contracts; risks associated with the rights-of-way for the network; disruptions in the relationship with third party vendors; losses of key management personnel and the inability to attract and retain highly qualified management and personnel in the future; changes in the extensive governmental legislation and regulations governing telecommunications providers and the provision of telecommunications services; new or changing tax laws or regulations; telecommunications carriers disputing and/or avoiding their obligations to pay network access charges for use of our network; high costs of regulatory compliance; the competitive impact of legislation and regulatory changes in the telecommunications industry; liability and compliance costs regarding environmental regulations; and risks associated with discontinuing paying dividends on our common stock; and the potential for the rights of our series A preferred stock to negatively impact our cash flow. A detailed discussion of these and other risks and uncertainties that could cause actual results and events to differ materially from such forward-looking statements are discussed in more detail in our filings with the SEC, including our reports on Form 10-K and Form 10-Q. Many of these circumstances are beyond our ability to control or predict. Moreover, forward-looking statements necessarily involve assumptions on our part. These forward-looking statements generally are identified by the words “believe,” “expect,” “anticipate,” “estimate,” “project,” “intend,” “plan,” “should,” “may,” “will,” “would,” “will be,” “will continue” or similar expressions. Such forward-looking statements involve known and unknown risks, uncertainties and other factors that may cause actual results, performance or achievements of the Company and its subsidiaries to be different from those expressed or implied in the forward-looking statements. All forward-looking statements attributable to us or persons acting on our behalf are expressly qualified in their entirety by the cautionary statements that appear throughout this press release. Furthermore, forward-looking statements speak only as of the date they are made. Except as required under the federal securities laws or the rules and regulations of the SEC, we disclaim any intention or obligation to update or revise publicly any forward-looking statements. You should not place undue reliance on forward-looking statements.
Investor and Media Contact
Jennifer Spaude, Consolidated Communications
Phone: 507-386-3765
jennifer.spaude@consolidated.com
Tag: [Consolidated-Communications-Earnings]
# # #
Page 4 of 14
Consolidated Communications Holdings, Inc.
Condensed Consolidated Balance Sheets
(Dollars in thousands, except share and per share amounts)
(Unaudited)
| | March 31, | | December 31, | ||
|
| 2022 |
| 2021 | ||
ASSETS | | | | | | |
Current assets: | | | | | | |
Cash and cash equivalents | | $ | 74,171 | | $ | 99,635 |
Short-term investments | | | 85,767 | | | 110,801 |
Accounts receivable, net | | | 118,596 | | | 133,362 |
Income tax receivable | | | 2,733 | | | 1,134 |
Prepaid expenses and other current assets | | | 61,319 | | | 56,831 |
Assets held for sale | | | 94,368 | | | 26,052 |
Total current assets | | | 436,954 | | | 427,815 |
| | | | | | |
Property, plant and equipment, net | | | 1,983,819 | | | 2,019,444 |
Investments | | | 109,034 | | | 109,578 |
Goodwill | | | 929,570 | | | 1,013,243 |
Customer relationships, net | | | 66,226 | | | 73,939 |
Other intangible assets | | | 10,557 | | | 10,557 |
Other assets | | | 59,288 | | | 58,116 |
Total assets | | $ | 3,595,448 | | $ | 3,712,692 |
| | | | | | |
LIABILITIES, MEZZANINE EQUITY AND SHAREHOLDERS' EQUITY | | | | | | |
Current liabilities: | | | | | | |
Accounts payable | | $ | 39,807 | | $ | 40,953 |
Advance billings and customer deposits | | | 53,002 | | | 53,028 |
Accrued compensation | | | 63,951 | | | 68,272 |
Accrued interest | | | 35,020 | | | 17,819 |
Accrued expense | | | 97,243 | | | 97,417 |
Current portion of long-term debt and finance lease obligations | | | 8,379 | | | 7,959 |
Liabilities held for sale | | | 5,021 | | | 97 |
Total current liabilities | | | 302,423 | | | 285,545 |
| | | | | | |
Long-term debt and finance lease obligations | | | 2,120,930 | | | 2,118,853 |
Deferred income taxes | | | 185,985 | | | 194,458 |
Pension and other post-retirement obligations | | | 205,350 | | | 214,671 |
Other long-term liabilities | | | 51,923 | | | 62,789 |
Total liabilities | | | 2,866,611 | | | 2,876,316 |
| | | | | | |
Series A Preferred Stock, par value $0.01 per share; 10,000,000 shares authorized, 436,943 and 434,266 shares outstanding as of March 31, 2022 and December 31, 2021, respectively; liquidation preference of $446,541 and $436,943 as of March 31, 2022 and December 31, 2021, respectively | | | 298,174 | | | 288,576 |
| | | | | | |
Shareholders' equity: | | | | | | |
Common stock, par value $0.01 per share; 150,000,000 shares authorized, 115,423,869 and 113,647,364 shares outstanding as of March 31, 2022 and December 31, 2021, respectively | | | 1,154 | | | 1,137 |
Additional paid-in capital | | | 733,216 | | | 740,746 |
Accumulated deficit | | | (257,263) | | | (141,599) |
Accumulated other comprehensive loss, net | | | (53,646) | | | (59,571) |
Noncontrolling interest | | | 7,202 | | | 7,087 |
Total shareholders' equity | | | 430,663 | | | 547,800 |
Total liabilities, mezzanine equity and shareholders' equity | | $ | 3,595,448 | | $ | 3,712,692 |
Page 5 of 14
Consolidated Communications Holdings, Inc.
Condensed Consolidated Statements of Operations
(Dollars in thousands, except per share amounts)
(Unaudited)
| | Three Months Ended | ||||
| | March 31, | ||||
|
| 2022 |
| 2021 | ||
| | | | | | |
Net revenues | | $ | 300,278 | | $ | 324,766 |
Operating expenses: | | | | | | |
Cost of services and products | | | 135,895 | | | 143,979 |
Selling, general and administrative expenses | | | 73,285 | | | 66,850 |
Loss on impairment of assets held for sale | | | 126,490 | | | — |
Depreciation and amortization | | | 72,350 | | | 75,611 |
Income (loss) from operations | | | (107,742) | | | 38,326 |
Other income (expense): | | | | | | |
Interest expense, net of interest income | | | (29,515) | | | (48,415) |
Loss on extinguishment of debt | | | — | | | (11,980) |
Change in fair value of contingent payment rights | | | — | | | (57,588) |
Other income, net | | | 11,405 | | | 12,274 |
Loss before income taxes | | | (125,852) | | | (67,383) |
Income tax benefit | | | (10,303) | | | (5,300) |
Net loss | | | (115,549) | | | (62,083) |
Less: dividends on Series A preferred stock | | | 9,598 | | | — |
Less: net income attributable to noncontrolling interest | | | 115 | | | 16 |
| | | | | | |
Net loss attributable to common shareholders | | $ | (125,262) | | $ | (62,099) |
| | | | | | |
Net loss per basic and diluted common shares attributable to common shareholders | | $ | (1.12) | | $ | (0.80) |
Page 6 of 14
Consolidated Communications Holdings, Inc.
Condensed Consolidated Statements of Cash Flows
(Dollars in thousands)
(Unaudited)
| | Three Months Ended | ||||
| | March 31, | ||||
|
| 2022 |
| 2021 | ||
OPERATING ACTIVITIES | | | | | | |
Net loss | | $ | (115,549) | | $ | (62,083) |
Adjustments to reconcile net loss to net cash provided by operating activities: | | | | | | |
Depreciation and amortization | | | 72,350 | | | 75,611 |
Cash distributions from wireless partnerships in excess of earnings | | | 153 | | | 11 |
Pension and post-retirement contributions in excess of expense | | | (9,342) | | | (8,770) |
Non-cash, stock-based compensation | | | 2,199 | | | 1,450 |
Amortization of deferred financing costs and discounts | | | 1,802 | | | 4,283 |
Non-cash interest expense on convertible security interest | | | — | | | 7,875 |
Loss on extinguishment of debt | | | — | | | 11,980 |
Loss on change in fair value of contingent payment rights | | | — | | | 57,588 |
Loss on impairment of assets held for sale | | | 126,490 | | | — |
Other adjustments, net | | | (189) | | | (368) |
Changes in operating assets and liabilities, net | | | 3,646 | | | 10,913 |
Net cash provided by operating activities | | | 81,560 | | | 98,490 |
INVESTING ACTIVITIES | | | | | | |
Purchase of property, plant and equipment, net | | | (156,480) | | | (75,960) |
Purchase of investments | | | (39,959) | | | — |
Proceeds from sale of assets | | | 74 | | | 24 |
Proceeds from business dispositions | | | 26,042 | | | — |
Proceeds from sale and maturity of investments | | | 65,754 | | | 1,198 |
Net cash used in investing activities | | | (104,569) | | | (74,738) |
FINANCING ACTIVITIES | | | | | | |
Proceeds from bond offering | | | — | | | 400,000 |
Proceeds from issuance of long-term debt | | | — | | | 150,000 |
Payment of finance lease obligations | | | (2,341) | | | (1,598) |
Payment on long-term debt | | | — | | | (397,000) |
Payment of financing costs | | | — | | | (5,573) |
Share repurchases for minimum tax withholding | | | (114) | | | — |
Net cash provided by (used in) financing activities | | | (2,455) | | | 145,829 |
Net change in cash and cash equivalents | | | (25,464) | | | 169,581 |
Cash and cash equivalents at beginning of period | | | 99,635 | | | 155,561 |
Cash and cash equivalents at end of period | | $ | 74,171 | | $ | 325,142 |
Page 7 of 14
Consolidated Communications Holdings, Inc.
Consolidated Revenue by Category
(Dollars in thousands)
(Unaudited)
| | Three Months Ended | ||||
| | March 31, | ||||
|
| 2022 |
| 2021 | ||
Consumer: | | | | | | |
Broadband (Data and VoIP) | | $ | 65,911 | | $ | 65,755 |
Voice services | | | 37,452 | | | 40,420 |
Video services | | | 14,366 | | | 16,781 |
| | | 117,729 | | | 122,956 |
Commercial: | | | | | | |
Data services (includes VoIP) | | | 57,895 | | | 57,071 |
Voice services | | | 36,339 | | | 39,753 |
Other | | | 11,560 | | | 9,328 |
| | | 105,794 | | | 106,152 |
Carrier: | | | | | | |
Data and transport services | | | 33,485 | | | 33,277 |
Voice services | | | 3,852 | | | 4,526 |
Other | | | 391 | | | 391 |
| | | 37,728 | | | 38,194 |
| | | | | | |
Subsidies | | | 6,583 | | | 17,339 |
Network access | | | 26,213 | | | 31,603 |
Other products and services | | | 6,231 | | | 8,522 |
Total operating revenue | | $ | 300,278 | | $ | 324,766 |
Page 8 of 14
Consolidated Communications Holdings, Inc.
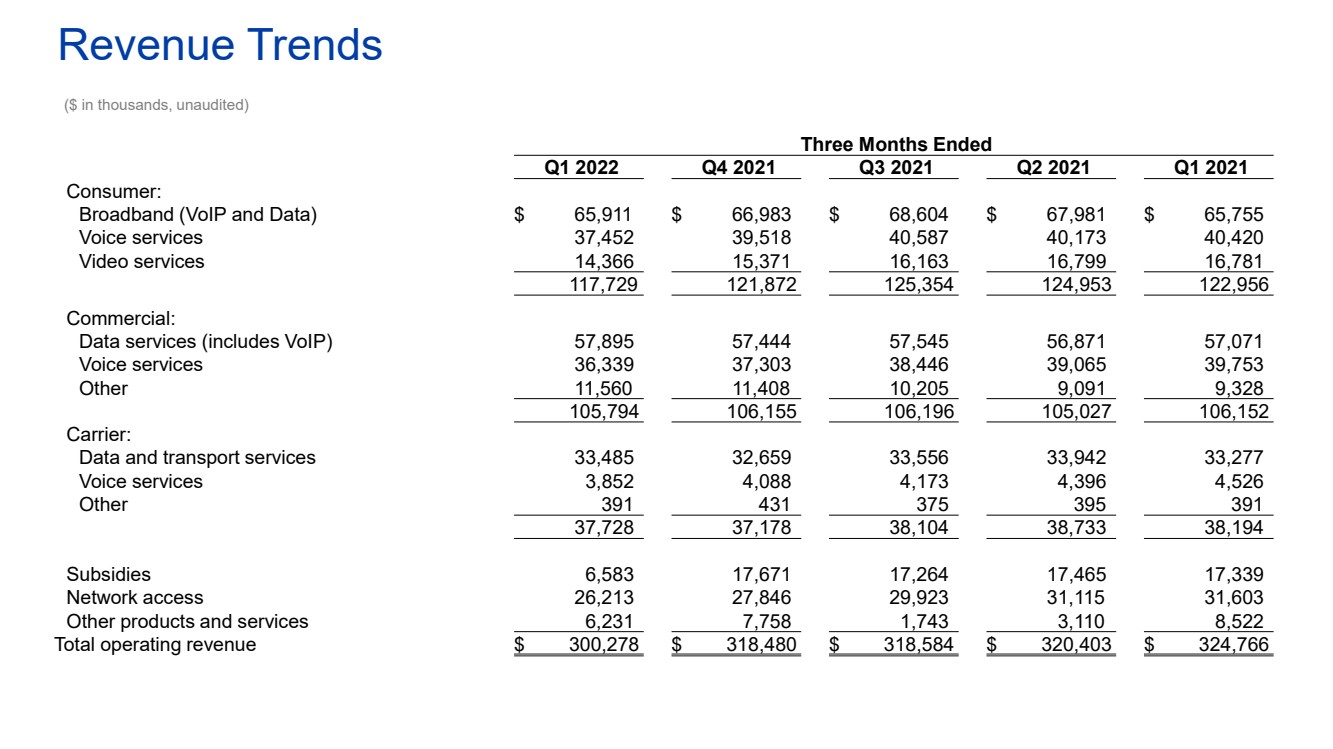
Consolidated Revenue Trend by Category
(Dollars in thousands)
(Unaudited)
| | Three Months Ended | |||||||||||||
|
| Q1 2022 |
| Q4 2021 |
| Q3 2021 |
| Q2 2021 |
| Q1 2021 | |||||
Consumer: | | | | | | | | | | | | | | | |
Broadband (Data and VoIP) | | $ | 65,911 | | $ | 66,983 | | $ | 68,604 | | $ | 67,981 | | $ | 65,755 |
Voice services | | | 37,452 | | | 39,518 | | | 40,587 | | | 40,173 | | | 40,420 |
Video services | | | 14,366 | | | 15,371 | | | 16,163 | | | 16,799 | | | 16,781 |
| | | 117,729 | | | 121,872 | | | 125,354 | | | 124,953 | | | 122,956 |
Commercial: | | | | | | | | | | | | | | | |
Data services (includes VoIP) | | | 57,895 | | | 57,444 | | | 57,545 | | | 56,871 | | | 57,071 |
Voice services | | | 36,339 | | | 37,303 | | | 38,446 | | | 39,065 | | | 39,753 |
Other | | | 11,560 | | | 11,408 | | | 10,205 | | | 9,091 | | | 9,328 |
| | | 105,794 | | | 106,155 | | | 106,196 | | | 105,027 | | | 106,152 |
Carrier: | | | | | | | | | | | | | | | |
Data and transport services | | | 33,485 | | | 32,659 | | | 33,556 | | | 33,942 | | | 33,277 |
Voice services | | | 3,852 | | | 4,088 | | | 4,173 | | | 4,396 | | | 4,526 |
Other | | | 391 | | | 431 | | | 375 | | | 395 | | | 391 |
| | | 37,728 | | | 37,178 | | | 38,104 | | | 38,733 | | | 38,194 |
| | | | | | | | | | | | | | | |
Subsidies | | | 6,583 | | | 17,671 | | | 17,264 | | | 17,465 | | | 17,339 |
Network access | | | 26,213 | | | 27,846 | | | 29,923 | | | 31,115 | | | 31,603 |
Other products and services | | | 6,231 | | | 7,758 | | | 1,743 | | | 3,110 | | | 8,522 |
Total operating revenue | | $ | 300,278 | | $ | 318,480 | | $ | 318,584 | | $ | 320,403 | | $ | 324,766 |
Page 9 of 14
Consolidated Communications Holdings, Inc.
Schedule of Adjusted EBITDA Calculation
(Dollars in thousands)
(Unaudited)
| | Three Months Ended | ||||
| | March 31, | ||||
|
| 2022 |
| 2021 | ||
Net loss | | $ | (115,549) | | $ | (62,083) |
Add (subtract): | | | | | | |
Income tax benefit | | | (10,303) | | | (5,300) |
Interest expense, net | | | 29,515 | | | 48,415 |
Depreciation and amortization | | | 72,350 | | | 75,611 |
EBITDA | | | (23,987) | | | 56,643 |
| | | | | | |
Adjustments to EBITDA (1): | | | | | | |
Other, net (2) | | | 5,510 | | | 1,688 |
Investment income (accrual basis) | | | (8,249) | | | (9,556) |
Investment distributions (cash basis) | | | 8,216 | | | 9,377 |
Pension/OPEB benefit | | | (2,983) | | | (2,541) |
Loss on extinguishment of debt | | | — | | | 11,980 |
Loss on impairment | | | 126,490 | | | — |
Change in fair value of contingent payment right | | | — | | | 57,588 |
Non-cash compensation (3) | | | 2,199 | | | 1,450 |
Adjusted EBITDA | | $ | 107,196 | | $ | 126,629 |
Notes:
| (1) | These adjustments reflect those required or permitted by the lenders under our credit agreement. |
| (2) | Other, net includes income attributable to noncontrolling interests, acquisition and non-recurring related costs, and certain miscellaneous items. |
| (3) | Represents compensation expenses in connection with our Restricted Share Plan, which because of the non-cash nature of the expenses are excluded from adjusted EBITDA. |
Page 10 of 14
Consolidated Communications Holdings, Inc.
Reconciliation of Net Income (Loss) to Adjusted EBITDA Guidance
(Dollars in millions)
(Unaudited)
| Year Ended | ||||
| December 31, 2022 | ||||
| Range | ||||
| Low | | High | ||
Net income (loss) | $ | (10) | | $ | 8 |
Add: | | | | | |
Income tax expense (benefit) | | (4) | | | 3 |
Interest expense, net | | 125 | | | 120 |
Depreciation and amortization | | 295 | | | 290 |
EBITDA | | 406 | | | 421 |
| | | | | |
Adjustments to EBITDA (1): | | | | | |
Other, net (2) | | 5 | | | 5 |
Pension/OPEB benefit | | (11) | | | (11) |
Non-cash compensation (3) | | 10 | | | 10 |
Adjusted EBITDA | $ | 410 | | $ | 425 |
Notes:
| (1) | These adjustments reflect those required or permitted by the lenders under our credit agreement. |
| (2) | Other, net includes income attributable to noncontrolling interests, cash distributions less equity earnings from our investments, dividend income, and certain miscellaneous items. |
| (3) | Represents compensation expenses in connection with our Restricted Share Plan, which because of the non-cash nature of the expenses are excluded from adjusted EBITDA. |
Consolidated Communications Holdings, Inc.
Total Net Debt to LTM Adjusted EBITDA Ratio
(Dollars in thousands)
(Unaudited)
| | March 31, | |
|
| 2022 | |
Summary of Outstanding Debt: | | | |
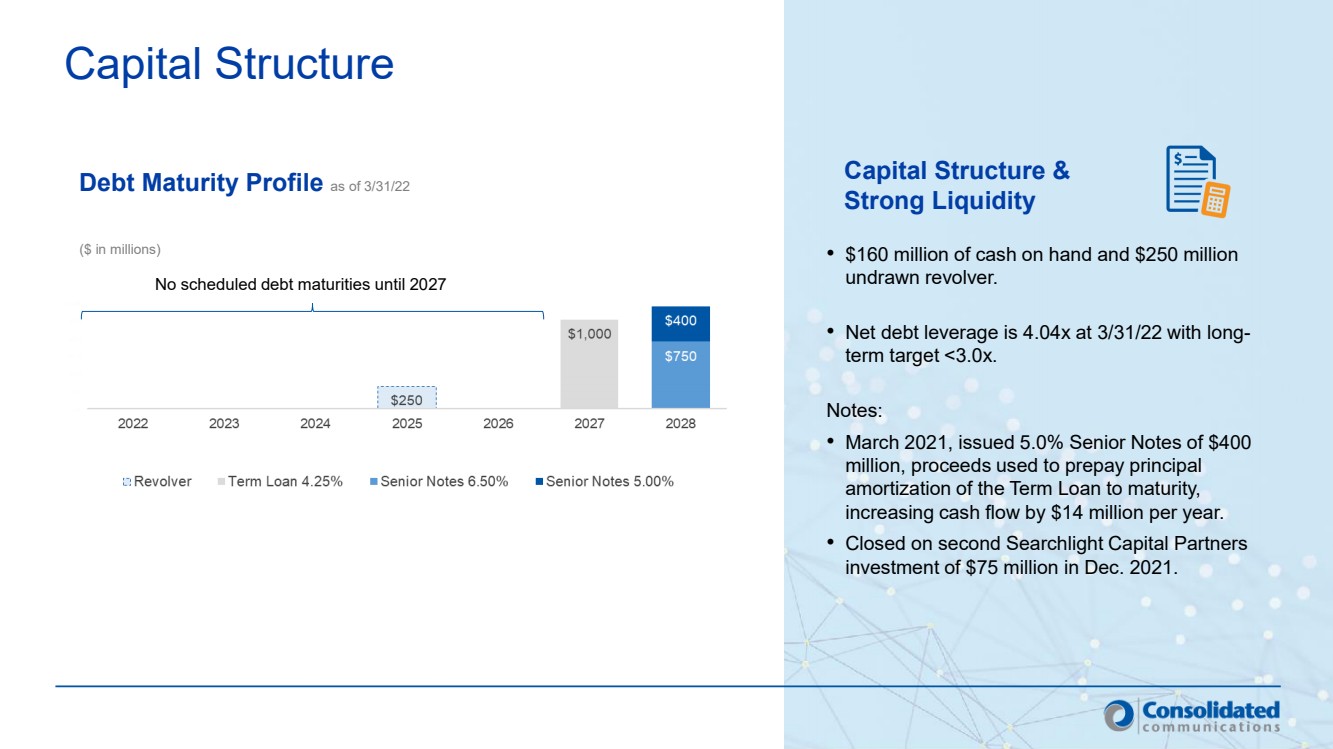
Term loans, net of discount $9,912 | | $ | 989,963 |
6.50% Senior secured notes due 2028 | | | 750,000 |
5.00% Senior secured notes due 2028 | | | 400,000 |
Finance leases | | | 25,685 |
Total debt as of March 31, 2022 | | | 2,165,648 |
Less deferred debt issuance costs | | | (36,339) |
Less cash on hand | | | (159,938) |
Total net debt as of March 31, 2022 | | $ | 1,969,371 |
| | | |
Adjusted EBITDA for the 12 months ended March 31, 2022 | | $ | 487,429 |
| | | |
Total Net Debt to last 12 months Adjusted EBITDA | | | 4.04x |
| | | |
Page 11 of 14
Consolidated Communications Holdings, Inc.
Adjusted Net Income and Net Income Per Share
(Dollars in thousands, except per share amounts)
(Unaudited)
| | Three Months Ended | ||||
| | March 31, | ||||
|
| 2022 |
| 2021 | ||
Net loss | | $ | (115,549) | | $ | (62,083) |
Integration and severance related costs, net of tax | | | 802 | | | 1,156 |
Loss on impairment of assets held for sale | | | 126,490 | | | — |
Loss on extinguishment of debt, net of tax | | | — | | | 8,743 |
Change in fair value of contingent payment rights | | | — | | | 57,588 |
Non-cash interest expense for Searchlight note including amortization of discount and fees | | | — | | | 10,201 |
Non-cash interest expense for swaps, net of tax | | | (295) | | | (182) |
Tax impact of non-deductible goodwill | | | (10,813) | | | — |
Non-cash stock compensation, net of tax | | | 1,626 | | | 1,058 |
Adjusted net income | | $ | 2,261 | | $ | 16,481 |
| | | | | | |
Weighted average number of shares outstanding | | | 111,691 | | | 78,029 |
Adjusted diluted net income per share | | $ | 0.02 | | $ | 0.21 |
Notes:
Calculations above assume a 26.1% and 27.0% effective tax rate for the three months ended March 31, 2022 and 2021, respectively.
Page 12 of 14
Consolidated Communications Holdings, Inc.
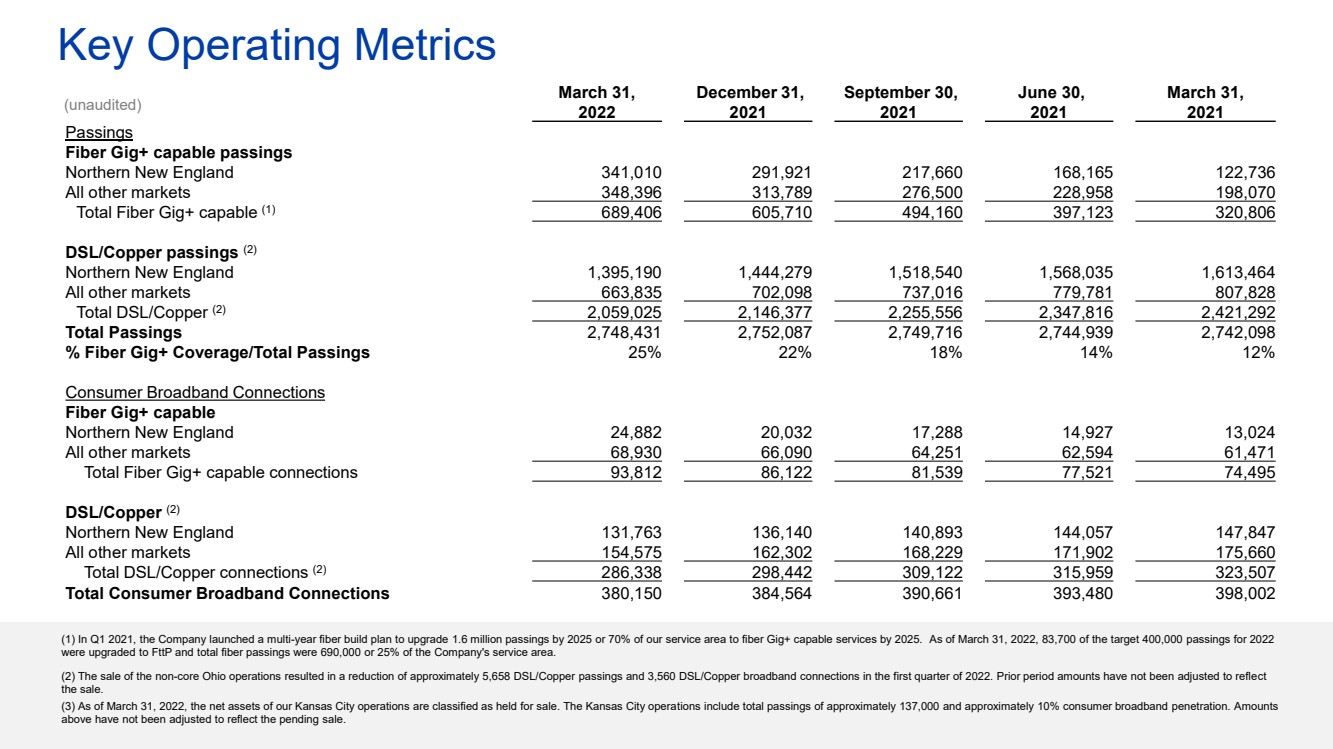
Key Operating Metrics
(Unaudited)
| | March 31, | | December 31, | | September 30, | | June 30, | | March 31, | | |||||
|
| 2022 |
| 2021 |
| 2021 |
| 2021 |
| 2021 |
| |||||
Passings | | | | | | | | | | | | | | | | |
Fiber Gig+ capable passings | | | | | | | | | | | | | | | | |
Northern New England | | | 341,010 | | | 291,921 | | | 217,660 | | | 168,165 | | | 122,736 | |
All other markets | | | 348,396 | | | 313,789 | | | 276,500 | | | 228,958 | | | 198,070 | |
Total Fiber Gig+ capable (1) | | | 689,406 | | | 605,710 | | | 494,160 | | | 397,123 | | | 320,806 | |
| | | | | | | | | | | | | | | | |
DSL/Copper passings (2) | | | | | | | | | | | | | | | | |
Northern New England | | | 1,395,190 | | | 1,444,279 | | | 1,518,540 | | | 1,568,035 | | | 1,613,464 | |
All other markets | | | 663,835 | | | 702,098 | | | 737,016 | | | 779,781 | | | 807,828 | |
Total DSL/Copper (2) | | | 2,059,025 | | | 2,146,377 | | | 2,255,556 | | | 2,347,816 | | | 2,421,292 | |
Total Passings | | | 2,748,431 | | | 2,752,087 | | | 2,749,716 | | | 2,744,939 | | | 2,742,098 | |
% Fiber Gig+ Coverage/Total Passings | | | 25% | | | 22% | | | 18% | | | 14% | | | 12% | |
| | | | | | | | | | | | | | | | |
Consumer Broadband Connections | | | | | | | | | | | | | | | | |
Fiber Gig+ capable | | | | | | | | | | | | | | | | |
Northern New England | | | 24,882 | | | 20,032 | | | 17,288 | | | 14,927 | | | 13,024 | |
All other markets | | | 68,930 | | | 66,090 | | | 64,251 | | | 62,594 | | | 61,471 | |
Total Fiber Gig+ capable connections | | | 93,812 | | | 86,122 | | | 81,539 | | | 77,521 | | | 74,495 | |
| | | | | | | | | | | | | | | | |
DSL/Copper (2) | | | | | | | | | | | | | | | | |
Northern New England | | | 131,763 | | | 136,140 | | | 140,893 | | | 144,057 | | | 147,847 | |
All other markets | | | 154,575 | | | 162,302 | | | 168,229 | | | 171,902 | | | 175,660 | |
Total DSL/Copper connections (2) | | | 286,338 | | | 298,442 | | | 309,122 | | | 315,959 | | | 323,507 | |
Total Consumer Broadband Connections | | | 380,150 | | | 384,564 | | | 390,661 | | | 393,480 | | | 398,002 | |
| | | | | | | | | | | | | | | | |
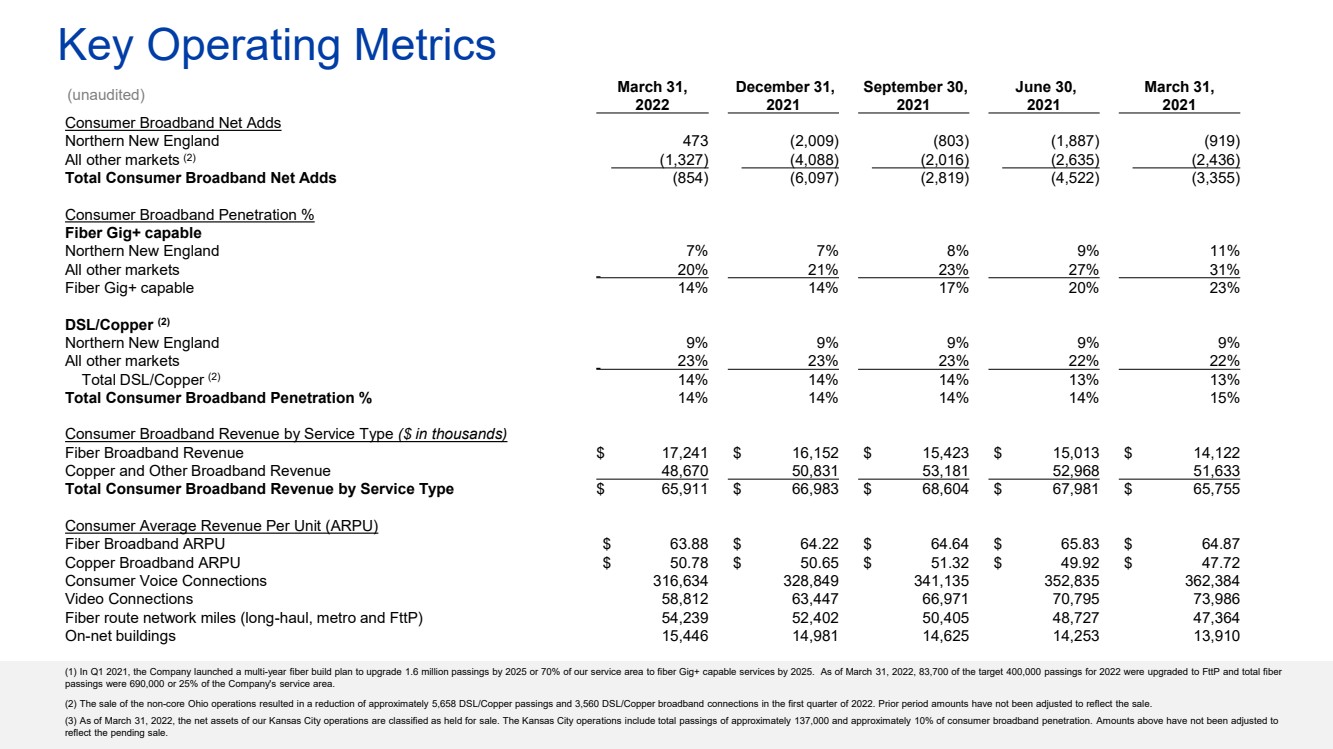
Consumer Broadband Net Adds | | | | | | | | | | | | | | | | |
Northern New England | | | 473 | | | (2,009) | | | (803) | | | (1,887) | | | (919) | |
All other markets (2) | | | (1,327) | | | (4,088) | | | (2,016) | | | (2,635) | | | (2,436) | |
Total Consumer Broadband Net Adds | | | (854) | | | (6,097) | | | (2,819) | | | (4,522) | | | (3,355) | |
| | | | | | | | | | | | | | | | |
Consumer Broadband Penetration % | | | | | | | | | | | | | | | | |
Fiber Gig+ capable | | | | | | | | | | | | | | | | |
Northern New England | | | 7% | | | 7% | | | 8% | | | 9% | | | 11% | |
All other markets | | | 20% | | | 21% | | | 23% | | | 27% | | | 31% | |
Fiber Gig+ capable | | | 14% | | | 14% | | | 17% | | | 20% | | | 23% | |
| | | | | | | | | | | | | | | | |
DSL/Copper (2) | | | | | | | | | | | | | | | | |
Northern New England | | | 9% | | | 9% | | | 9% | | | 9% | | | 9% | |
All other markets | | | 23% | | | 23% | | | 23% | | | 22% | | | 22% | |
Total DSL/Copper (2) | | | 14% | | | 14% | | | 14% | | | 13% | | | 13% | |
Total Consumer Broadband Penetration % | | | 14% | | | 14% | | | 14% | | | 14% | | | 15% | |
| | | | | | | | | | | | | | | | |
Consumer Broadband Revenue by Service Type ($ in thousands) | | | | | | | | | | | | | | | | |
Fiber Broadband Revenue | | $ | 17,241 | | $ | 16,152 | | $ | 15,423 | | $ | 15,013 | | $ | 14,122 | |
Copper and Other Broadband Revenue | | | 48,670 | | | 50,831 | | | 53,181 | | | 52,968 | | | 51,633 | |
Total Consumer Broadband Revenue by Service Type | | $ | 65,911 | | $ | 66,983 | | $ | 68,604 | | $ | 67,981 | | $ | 65,755 | |
| | | | | | | | | | | | | | | | |
Consumer Average Revenue Per Unit (ARPU) | | | | | | | | | | | | | | | | |
Fiber Broadband ARPU | | $ | 63.88 | | $ | 64.22 | | $ | 64.64 | | $ | 65.83 | | $ | 64.87 | |
Copper Broadband ARPU | | $ | 50.78 | | $ | 50.65 | | $ | 51.32 | | $ | 49.92 | | $ | 47.72 | |
| | | | | | | | | | | | | | | | |
Consumer Voice Connections | | | 316,634 | | | 328,849 | | | 341,135 | | | 352,835 | | | 362,384 | |
| | | | | | | | | | | | | | | | |
Video Connections | | | 58,812 | | | 63,447 | | | 66,971 | | | 70,795 | | | 73,986 | |
| | | | | | | | | | | | | | | | |
Fiber route network miles (long-haul, metro and FttP) | | | 54,239 | | | 52,402 | | | 50,405 | | | 48,727 | | | 47,364 | |
| | | | | | | | | | | | | | | | |
On-net buildings | | | 15,446 | | | 14,981 | | | 14,625 | | | 14,253 | | | 13,910 | |
Page 13 of 14
Notes:
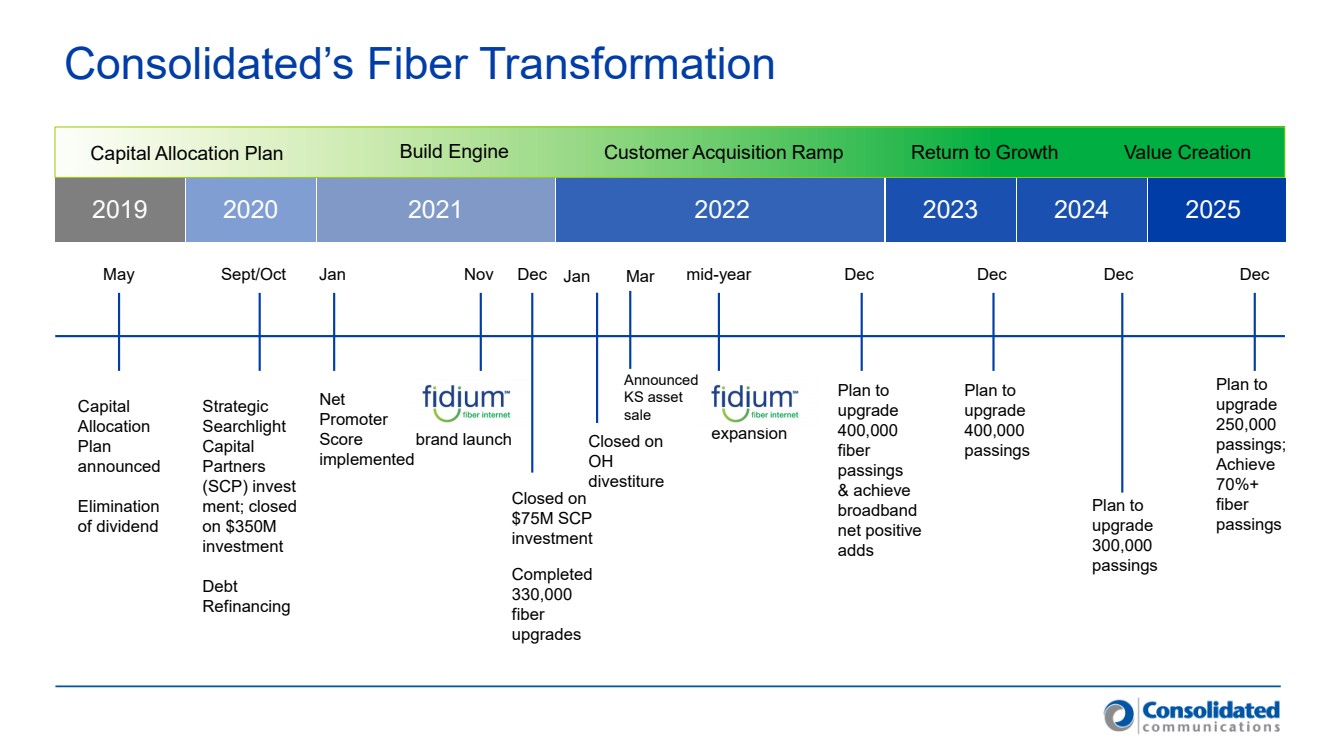
| (1) | In Q1 2021, the Company launched a multi-year fiber build plan to upgrade 1.6 million passings by 2025 or 70% of our service area to fiber Gig+ capable services by 2025. As of March 31, 2022, 83,700 of the target 400,000 passings for 2022 were upgraded to FttP and total fiber passings were ~690,000 or 25% of the Company's service area. |
| (2) | The sale of the non-core Ohio operations resulted in a reduction of approximately 5,658 DSL/Copper passings and 3,560 DSL/Copper broadband connections in the first quarter of 2022. Prior period amounts have not been adjusted to reflect the sale. |
| (3) | As of March 31, 2022, the net assets of our Kansas City operations are classified as held for sale. The Kansas City operations include total passings of approximately 137,000 and approximately 10% consumer broadband penetration. Amounts above have not been adjusted to reflect the pending sale. |
Page 14 of 14