Exhibit 99.1

Consolidated Communications Reports Fourth Quarter and Full Year 2020 Results
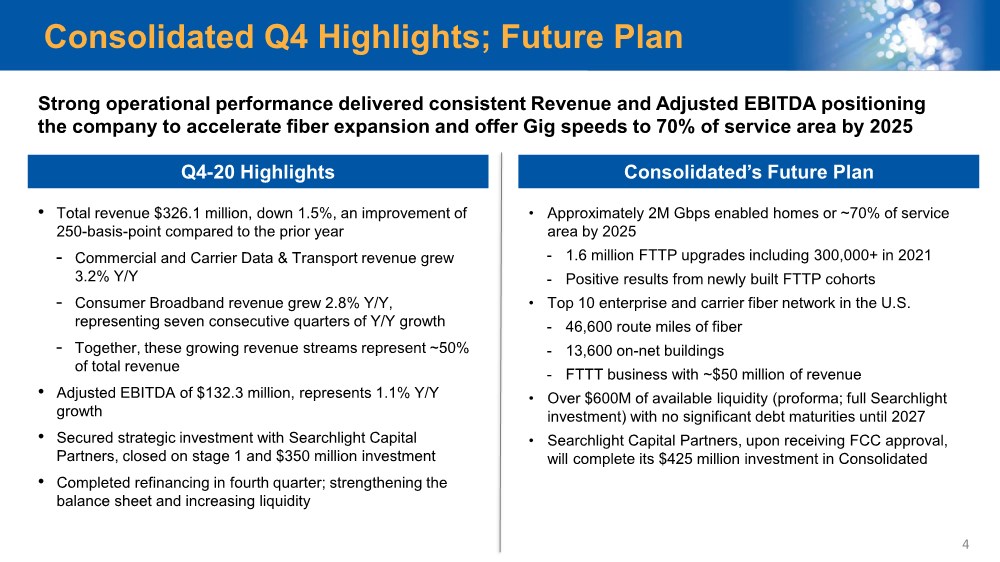
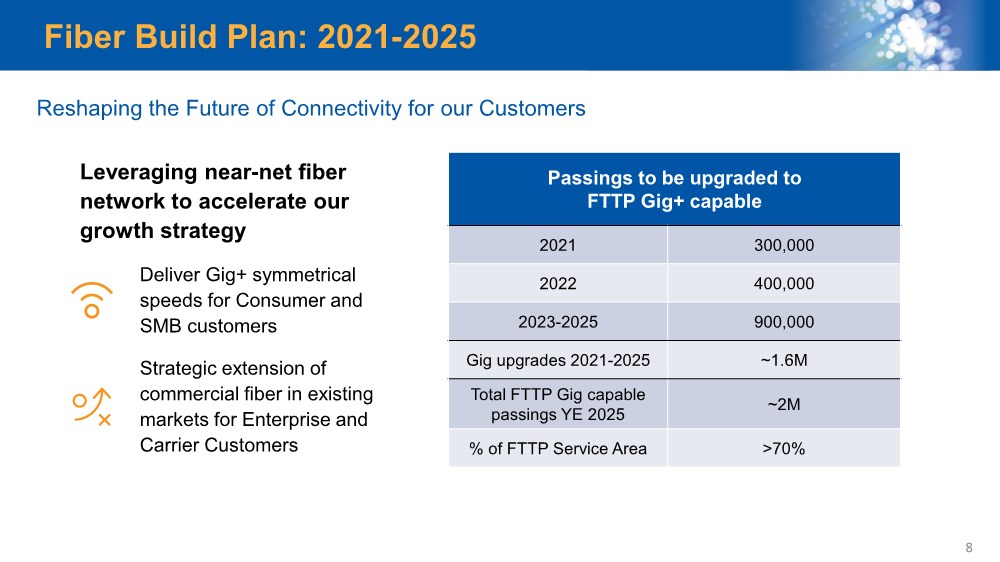
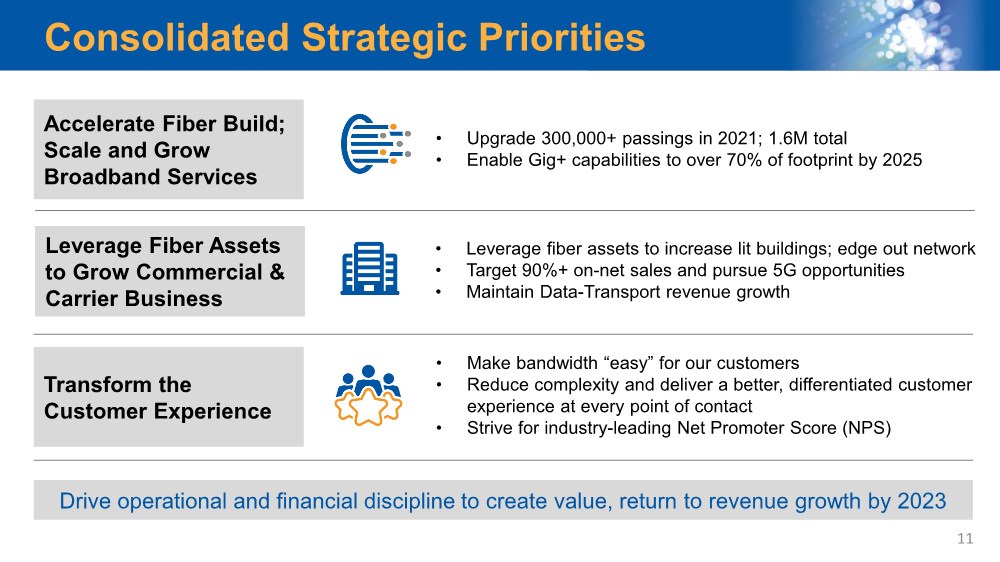
Strong operational performance delivered consistent Revenue and Adjusted EBITDA positioning the company to upgrade more than 300,000 locations to Gigabit speeds in 2021
Company to upgrade 1.6 million locations as part of its accelerated plan to extend fiber coverage to over 70% of its footprint by 2025
Global refinancing extends maturities, lowers leverage and increases liquidity
Fourth Quarter 2020 Highlights (compared to fourth quarter 2019)
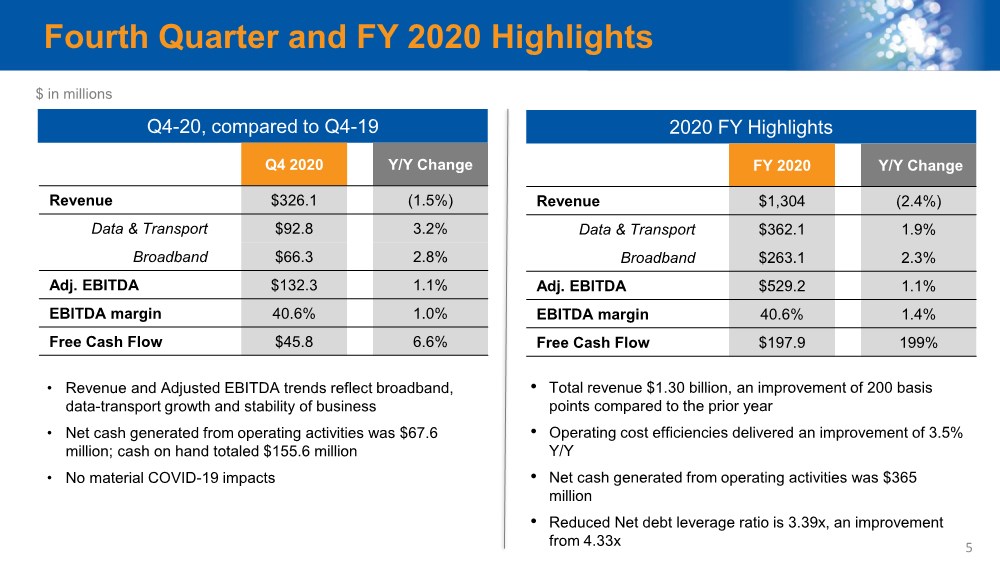
Revenue totaled $326.1 million, generating increased Adjusted EBITDA of $132.3 million, up 1.1%
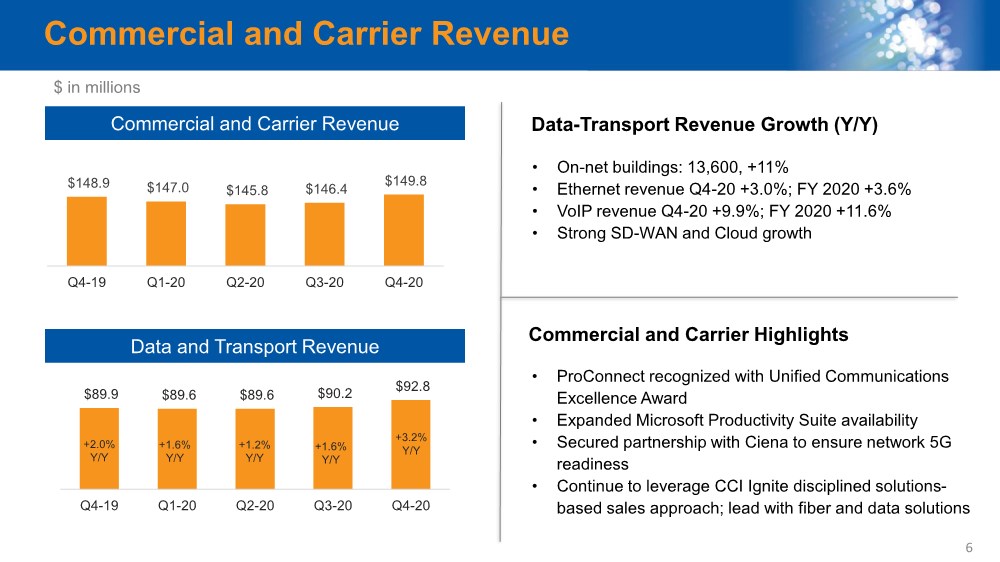
| ● | Commercial and carrier data-transport revenue grew 3.2% |
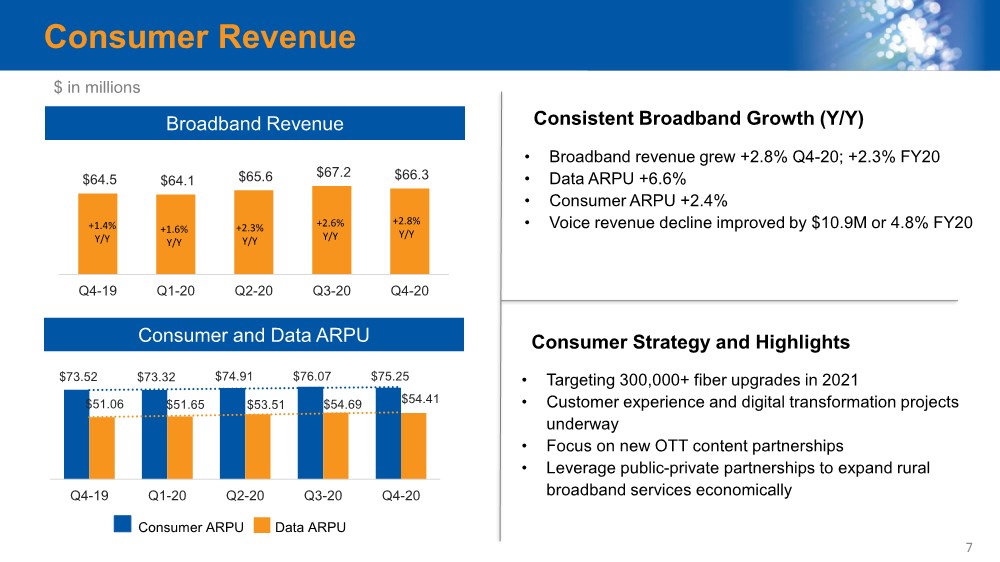
| ● | Consumer broadband revenue grew 2.8%, representing seven consecutive quarters of year over year growth |
| ● | Net cash from operating activities was $67.6 million; cash on hand totaled $155.6 million |
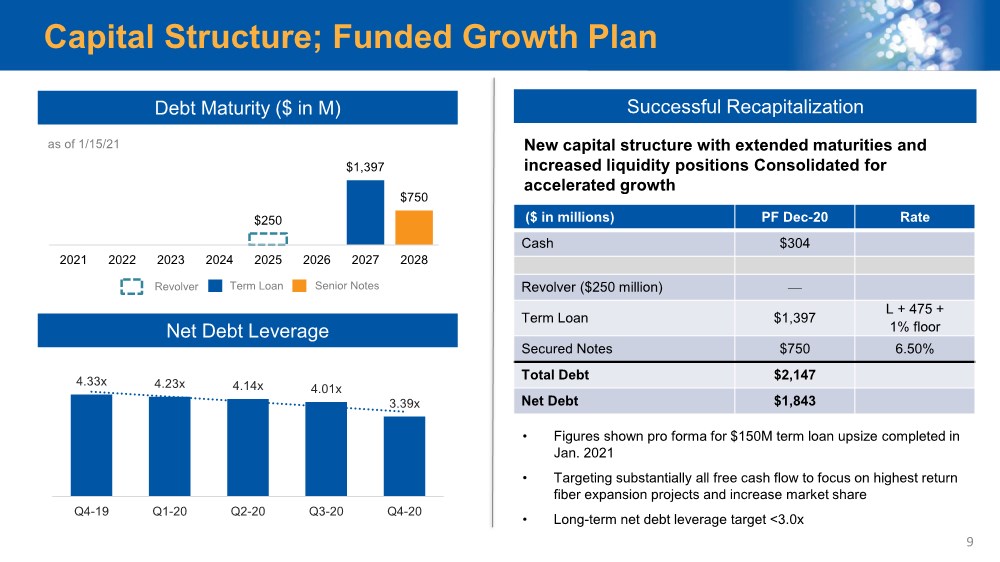
| ● | Net debt leverage improved to 3.39x, from 4.33x at Dec. 31, 2019 |
| ● | Capital expenditures totaled $65.3 million, reflecting an accelerated spend supporting preparations for the 2021 fiber network expansion |
Full-Year 2020 Highlights (compared to full-year 2019)
| ● | Revenue totaled $1.30 billion, a decline of 2.4% |
| ● | Adjusted EBITDA totaled $529.2 million, an improvement of 1.1% |
| ● | Commercial and carrier data-transport revenue grew 1.9% |
| ● | Consumer broadband revenue grew 2.3% |
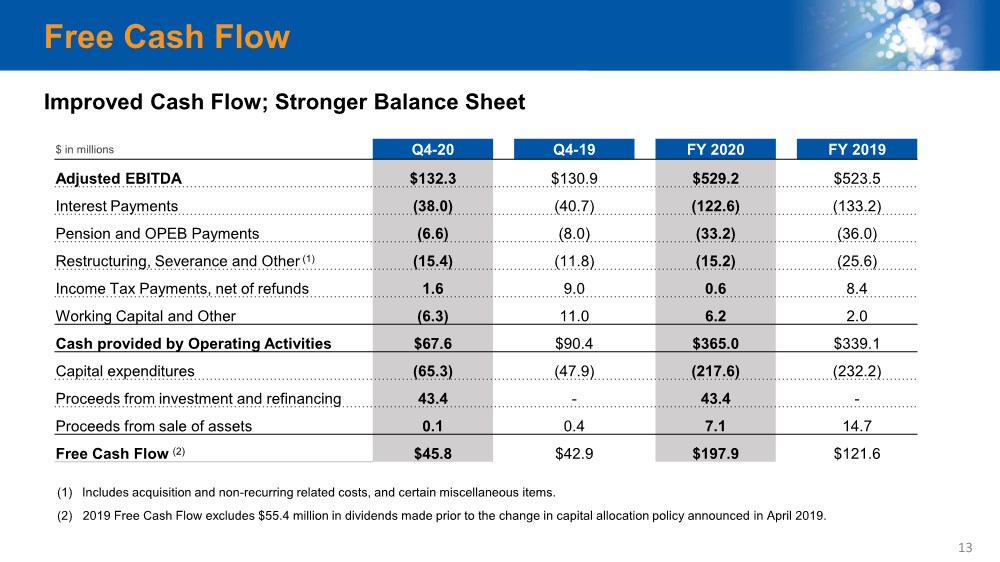
| ● | Free cash flow totaled $197.9 million, an increase of $131.7 million |
| ● | Fiber lit buildings increased 11% and more than 1,000 fiber-route miles were built |
| ● | Capital expenditures totaled $217.6 million supporting success-based, fiber projects and broadband network investments |
Mattoon, Ill. – Feb. 25, 2021 – Consolidated Communications Holdings, Inc. (Nasdaq: CNSL) (the “Company” or “Consolidated”) reported results for the fourth quarter and full-year 2020.
“We finished the year with strong performance which included growing consumer broadband revenue for the seventh consecutive quarter, and robust data-transport revenue growth of 3.2% in the fourth quarter,” said Bob Udell, president and chief executive officer at Consolidated Communications. “Our fiber build plans are well underway.”
“We are heading into 2021 with solid momentum,” added Udell. “We have a fully funded growth plan, which is supported by our robust capital structure and the strategic partnership we secured in the fourth quarter with
Page 1 of 14
Searchlight Capital. Our long-term outlook is very positive. We are confident in our ability to upgrade more than 300,000 passings in 2021 as we execute on our fiber build plan and bring highly competitive, gigabit broadband services to 70% of our footprint by 2025.”
Financial Results for the Fourth Quarter
| ● | Revenue totaled $326.1 million, a decline of 1.5% compared to the fourth quarter 2019. This reflects a 250 basis point improvement compared to the prior year. Data and transport service revenue increased 3.2% or $2.9 million. Broadband revenue increased 2.8% or $1.8 million. Voice services revenue rate of decline across all customer channels improved 1.4% or $1.7 million. Network access revenues declined $1.7 million primarily due to a decrease in special access. |
| ● | Income from operations totaled $21 million in the fourth quarter, a decline of $5.7 million. The year-over-year change was primarily due to a 1.5% revenue decline and transaction costs of $7.6 million related to the Searchlight investment. These costs were partially offset by a decrease of $10.8 million in depreciation and amortization expense where certain acquired assets became fully depreciated. |
| ● | Net interest expense was $48.4 million, an increase of $15 million, as a result of the recapitalization of the balance sheet associated with the Oct. 2, 2020 refinancing and the receipt of the $350 million Searchlight strategic investment. Interest expense increased $3.5 million due to the higher mix of 6.5% Senior notes in the Company’s external debt. Non-cash interest on the Searchlight note combined with amortization of deferred financing costs and the discount totaled $10.1 million. The Company expects to make Payment in Kind (PIK) interest payments on the Searchlight note through at least 2022. |
| ● | As part of the quarterly valuation of the Searchlight contingent payment right, the Company recognized a gain of $23.8 million in the fourth quarter related to a change in the fair value of contingent payment obligations as of Dec. 31, 2020. Upon receipt of all approvals and the completion of the second close which is expected in 2021, this contingent payment right will convert to common stock. |
| ● | Cash distributions from the Company’s wireless partnerships totaled $9.5 million, an increase of $2.5 million from a year ago. |
| ● | Other income, net was $12.2 million compared to expense of $286,000 one year ago. The change included a $2.5 million increase in investment income from the Company’s minority interest in wireless partnerships and a reduction in non-operating pension/OPEB expense of $8.8 million. The latter was the result of a non-cash pension settlement charge of $6.7 million in 2019. |
| ● | On a GAAP basis, net loss was $6.8 million, compared to a loss of $5.8 million for the same period a year ago. GAAP net loss per share was ($0.09). Adjusted diluted net income (loss) per share excludes certain items as outlined in the table provided in this release. Adjusted diluted net income per share was $0.12 in the fourth quarter of 2020, compared to $0.01 in the fourth quarter of 2019. |
| ● | Adjusted EBITDA was $132.3 million, an increase of 1.1% from the fourth quarter a year ago. |
| ● | The total net debt leverage ratio was 3.39x, an improvement from 4.33x at Dec. 31, 2019. |
| ● | Capital expenditures totaled $65.3 million in the fourth quarter driven by success-based opportunities across all customer channels as well as preparations for the 2021 fiber build expansion. |
Full Year 2020 Results
| ● | Operating revenue totaled $1.30 billion, down 2.4% from fiscal year 2019. This reflects an overall 200 basis point improvement compared to the prior year. |
| ● | Total operating expenses were reduced 3.5% or $30.4 million primarily driven by reduced labor costs, lower expense associated with integration efforts and continued operating efficiencies. |
| ● | Net cash from operating activities was $365 million. |
| ● | Adjusted EBITDA was $529.2 million. Adjusted diluted net income per share was $0.78. |
Page 2 of 14
| ● | Capital expenditures totaled $217.6 million in 2020 supporting success-based, fiber projects and broadband network investments. |
On Oct. 2, 2020, Consolidated closed on stage one of Searchlight’s investment and received $350 million of the aggregate $425 million. Concurrent with Searchlight’s investment, Consolidated completed a global refinancing in which it raised $2.25 billion in new secured debt at attractive rates, including a $250 million revolving credit facility. On Jan. 15, 2021 the Company secured an additional $150 million term loan financing on substantially the same terms as the October refinancing.
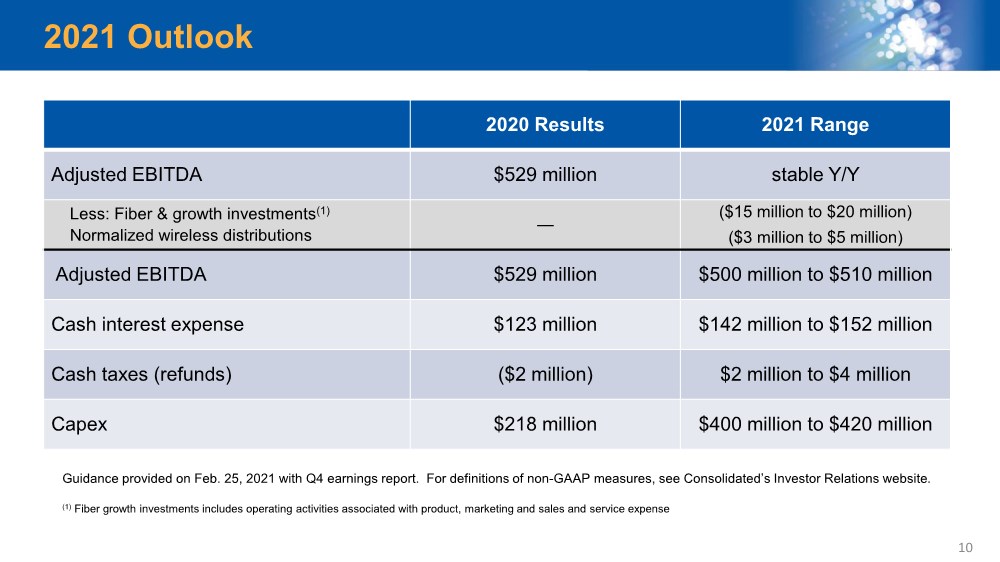
2021 Outlook
For 2021, Consolidated Communications is providing outlook based on the Company’s new fiber build plan and current capital structure.
| ● | Capital expenditures are expected to be in a range of $400 million to $420 million, reflecting a higher level of spending to support the build plan. |
| ● | Adjusted EBITDA is expected to be in a range of $500 million to $510 million, lower than 2020 primarily due to the start-up and acceleration of the fiber build expansion plan. |
| ● | Cash interest expense is expected to be in a range of $142 million to $152 million, reflecting the current debt structure. |
| ● | Cash income taxes are expected to be in a range of $2 million to $4 million. |
Conference Call
Consolidated’s fourth-quarter earnings conference call will be webcast today at 10 a.m. ET. The live webcast and materials will be available on the Investor Relations section of the Company’s website at http://ir.consolidated.com. The live conference call dial-in number for investors and analysts is 833-794-0898, conference ID 3278619. A telephonic replay of the conference call will be available through Mar. 4 and can be accessed by calling 800-585-8367, enter ID 3278619.
About Consolidated Communications
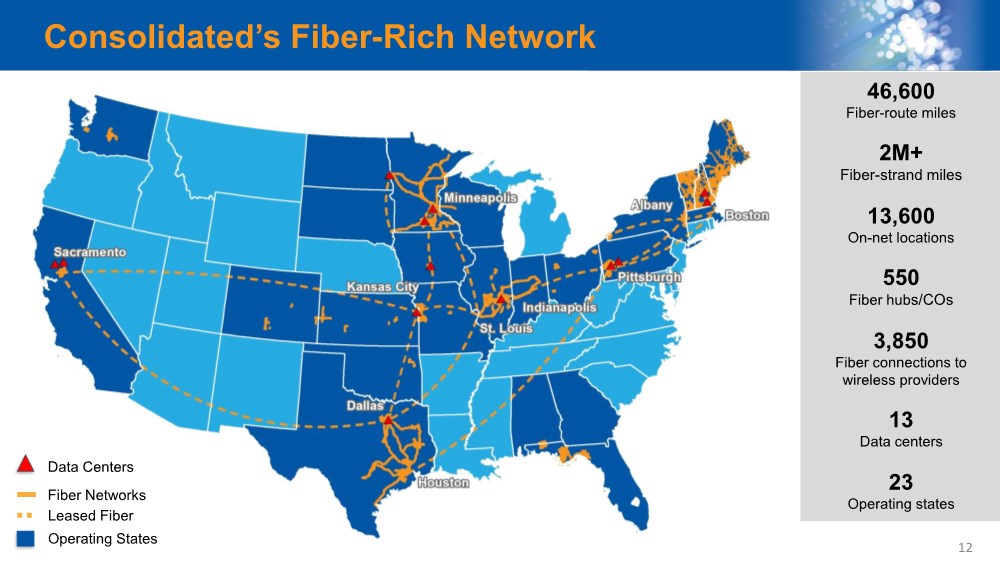
Consolidated Communications Holdings, Inc. (NASDAQ: CNSL) is a leading broadband and business communications provider serving consumers, businesses, and wireless and wireline carriers across rural and metro communities and a 23-state service area. Leveraging an advanced fiber network spanning 46,600 fiber route miles, Consolidated Communications offers a wide range of communications solutions, including: high-speed Internet, data, phone, security, managed services, cloud services and wholesale, carrier solutions. From our first connection 125 years ago, Consolidated is dedicated to turning technology into solutions, connecting people and enriching how they work and live. Visit www.consolidated.com for more information.
Use of Non-GAAP Financial Measures
This press release, as well as the conference call, includes disclosures regarding “EBITDA,” “adjusted EBITDA,” “total net debt to last 12 month adjusted EBITDA ratio” or “Net debt leverage ratio,” “free cash flow” and “adjusted diluted net income (loss) per share,” all of which are non-GAAP financial measures and described in this section as not being in compliance with Regulation S-X. Accordingly, they should not be construed as alternatives to net cash from operating or investing activities, cash and cash equivalents, cash flows from operations, net income or net income per share as defined by GAAP and are not, on their own, necessarily indicative of cash available to fund cash needs as determined in accordance with GAAP. In addition, not all companies use identical calculations, and the non-GAAP financial measures may not be comparable to other similarly titled measures of other companies. A reconciliation of the differences between these non-GAAP financial measures and the most directly comparable financial measures presented in accordance with GAAP is included in the tables that follow.
Adjusted EBITDA is comprised of EBITDA, adjusted for certain items as permitted or required by the lenders under our credit agreement in place at the end of each quarter in the periods presented. The tables that follow include an explanation of how adjusted EBITDA is calculated for each of the periods presented with the reconciliation to net income. EBITDA is defined as net earnings before interest expense, income taxes, depreciation and amortization on a historical basis.
Page 3 of 14
We present adjusted EBITDA for several reasons. Management believes adjusted EBITDA is useful as a means to evaluate our ability to fund our estimated uses of cash (including interest on our debt). In addition, we have presented adjusted EBITDA to investors in the past because it is frequently used by investors, securities analysts and other interested parties in the evaluation of companies in our industry, and management believes presenting it here provides a measure of consistency in our financial reporting. Adjusted EBITDA, referred to as Available Cash in our credit agreement, is also a component of the restrictive covenants and financial ratios contained in our credit agreement that requires us to maintain compliance with these covenants and limit certain activities, such as our ability to incur debt. The definitions in these covenants and ratios are based on adjusted EBITDA after giving effect to specified charges. In addition, adjusted EBITDA provides our board of directors with meaningful information, with other data, assumptions and considerations, to measure our ability to service and repay debt. We present the related “total net debt to last 12 month adjusted EBITDA ratio” or “Net debt leverage ratio” principally to put other non-GAAP measures in context and facilitate comparisons by investors, security analysts and others; this ratio differs in certain respects from the similar ratio used in our credit agreement. These measures differ in certain respects from the ratios used in our senior notes indenture.
These non-GAAP financial measures have certain shortcomings. In particular, adjusted EBITDA does not represent the residual cash flows available for discretionary expenditures, since items such as debt repayment and interest payments are not deducted from such measure. Because adjusted EBITDA is a component of the ratio of total net debt to last twelve month adjusted EBITDA, these measures are also subject to the material limitations discussed above. In addition, the ratio of total net debt to last twelve month adjusted EBITDA is subject to the risk that we may not be able to use the cash on the balance sheet to reduce our debt on a dollar-for-dollar basis. Management believes this ratio is useful as a means to evaluate our ability to incur additional indebtedness in the future.
Free cash flow represents net cash provided by operating activities adjusted for capital expenditures, cash dividends, and proceeds received from the sale of assets, refinancing and investment. Free cash flow is a measure of operating cash flows available for corporate purposes after providing sufficient fixed asset additions. The tables that follow include a calculation of free cash flow for each of the periods presented with a reconciliation to net cash provided by operating activities. Free cash flow provides useful information to investors in the evaluation of our operating performance and liquidity.
We present the non-GAAP measure “adjusted diluted net income (loss) per share” because our net income (loss) and net income (loss) per share are regularly affected by items that occur at irregular intervals or are non-cash items. We believe that disclosing these measures assists investors, securities analysts and other interested parties in evaluating both our company over time and the relative performance of the companies in our industry.
Safe Harbor
Certain statements in this press release are forward-looking statements and are made pursuant to the safe harbor provisions of the Securities Litigation Reform Act of 1995. These forward-looking statements reflect, among other things, our current expectations, plans, strategies, and anticipated financial results. There are a number of risks, uncertainties, and conditions that may cause our actual results to differ materially from those expressed or implied by these forward-looking statements. These risks and uncertainties include a number of factors related to our business, including the uncertainties relating to the impact of the novel coronavirus (COVID-19) pandemic on the Company’s business, results of operations, cash flows, stock price and employees; the possibility that any of the anticipated benefits of the strategic investment from Searchlight or our refinancing of outstanding debt, including our senior secured credit facilities, will not be realized; the outcome of any legal proceedings that may be instituted against the Company or its directors; the ability to obtain regulatory approvals and meet other closing conditions to the investment on a timely basis or at all, including the risk that regulatory approvals required for the investment are not obtained subject to conditions that are not anticipated or that could adversely affect the Company or the expected benefits of the investment; the anticipated use of proceeds of the strategic investment; economic and financial market conditions generally and economic conditions in our service areas; various risks to the price and volatility of our common stock; changes in the valuation of pension plan assets; the substantial amount of debt and our ability to repay or refinance it or incur additional debt in the future; our need for a significant amount of cash to service and repay the debt restrictions contained in our debt agreements that limit the discretion of management in operating the business; regulatory changes, including changes to subsidies, rapid development and introduction of new technologies and intense competition in the telecommunications industry; risks associated with our possible
Page 4 of 14
pursuit of acquisitions; system failures; cyber-attacks, information or security breaches or technology failure of ours or of a third party; losses of large customers or government contracts; risks associated with the rights-of-way for the network; disruptions in the relationship with third party vendors; losses of key management personnel and the inability to attract and retain highly qualified management and personnel in the future; changes in the extensive governmental legislation and regulations governing telecommunications providers and the provision of telecommunications services; new or changing tax laws or regulations; telecommunications carriers disputing and/or avoiding their obligations to pay network access charges for use of our network; high costs of regulatory compliance; the competitive impact of legislation and regulatory changes in the telecommunications industry; and liability and compliance costs regarding environmental regulations; and risks associated with discontinuing paying dividends on our common stock. A detailed discussion of these and other risks and uncertainties that could cause actual results and events to differ materially from such forward-looking statements are discussed in more detail in our filings with the SEC, including our reports on Form 10-K and Form 10-Q. Many of these circumstances are beyond our ability to control or predict. Moreover, forward-looking statements necessarily involve assumptions on our part. These forward-looking statements generally are identified by the words “believe,” “expect,” “anticipate,” “estimate,” “project,” “intend,” “plan,” “should,” “may,” “will,” “would,” “will be,” “will continue” or similar expressions. Such forward-looking statements involve known and unknown risks, uncertainties and other factors that may cause actual results, performance or achievements of the Company and its subsidiaries to be different from those expressed or implied in the forward-looking statements. All forward-looking statements attributable to us or persons acting on our behalf are expressly qualified in their entirety by the cautionary statements that appear throughout this press release. Furthermore, forward-looking statements speak only as of the date they are made. Except as required under the federal securities laws or the rules and regulations of the SEC, we disclaim any intention or obligation to update or revise publicly any forward-looking statements. You should not place undue reliance on forward-looking statements.
Investor and Media Contact
Jennifer Spaude, Consolidated Communications
Phone: 507-386-3765
jennifer.spaude@consolidated.com
Page 5 of 14
Consolidated Communications Holdings, Inc.
Condensed Consolidated Balance Sheets
(Dollars in thousands, except share and per share amounts)
(Unaudited)
| | December 31, | | December 31, | ||
|
| 2020 |
| 2019 | ||
| | | | | | |
ASSETS | | | | | | |
Current assets: | | | | | | |
Cash and cash equivalents | | $ | 155,561 | | $ | 12,395 |
Accounts receivable, net | | | 137,646 | | | 120,016 |
Income tax receivable | | | 1,072 | | | 2,669 |
Prepaid expenses and other current assets | | | 46,382 | | | 41,787 |
Total current assets | | | 340,661 | | | 176,867 |
| | | | | | |
Property, plant and equipment, net | | | 1,760,152 | | | 1,835,878 |
Investments | | | 111,665 | | | 112,717 |
Goodwill | | | 1,035,274 | | | 1,035,274 |
Customer relationships, net | | | 113,418 | | | 164,069 |
Other intangible assets | | | 10,557 | | | 10,557 |
Other assets | | | 135,573 | | | 54,915 |
Total assets | | $ | 3,507,300 | | $ | 3,390,277 |
| | | | | | |
LIABILITIES AND SHAREHOLDERS' EQUITY | | | | | | |
Current liabilities: | | | | | | |
Accounts payable | | $ | 25,283 | | $ | 30,936 |
Advance billings and customer deposits | | | 49,544 | | | 45,710 |
Accrued compensation | | | 74,957 | | | 57,069 |
Accrued interest | | | 21,194 | | | 7,874 |
Accrued expense | | | 81,931 | | | 75,406 |
Current portion of long-term debt and finance lease obligations | | | 17,561 | | | 27,301 |
Total current liabilities | | | 270,470 | | | 244,296 |
| | | | | | |
Long-term debt and finance lease obligations | | | 1,932,666 | | | 2,250,677 |
Deferred income taxes | | | 171,021 | | | 173,027 |
Pension and other post-retirement obligations | | | 300,373 | | | 302,296 |
Convertible security interest | | | 238,701 | | | — |
Contingent payment right | | | 123,241 | | | — |
Other long-term liabilities | | | 81,600 | | | 72,730 |
Total liabilities | | | 3,118,072 | | | 3,043,026 |
| | | | | | |
Shareholders' equity: | | | | | | |
Common stock, par value $0.01 per share; 100,000,000 shares authorized, 79,227,607 and 71,961,045, shares outstanding as of December 31, 2020 and December 31, 2019, respectively | | | 792 | | | 720 |
Additional paid-in capital | | | 525,673 | | | 492,246 |
Accumulated deficit | | | (34,514) | | | (71,217) |
Accumulated other comprehensive loss, net | | | (109,418) | | | (80,868) |
Noncontrolling interest | | | 6,695 | | | 6,370 |
Total shareholders' equity | | | 389,228 | | | 347,251 |
Total liabilities and shareholders' equity | | $ | 3,507,300 | | $ | 3,390,277 |
Page 6 of 14
Consolidated Communications Holdings, Inc.
Condensed Consolidated Statements of Operations
(Dollars in thousands, except per share amounts)
(Unaudited)
| | Three Months Ended | | Year Ended | ||||||||
| | December 31, | | December 31, | ||||||||
|
| 2020 |
| 2019 |
| 2020 |
| 2019 | ||||
| | | | | | | | | | | | |
Net revenues | | $ | 326,124 | | $ | 331,035 | | $ | 1,304,028 | | $ | 1,336,542 |
Operating expenses: | | | | | | | | | | | | |
Cost of services and products | | | 138,927 | | | 136,201 | | | 560,644 | | | 574,936 |
Selling, general and administrative expenses | | | 77,682 | | | 76,473 | | | 275,361 | | | 299,088 |
Acquisition and other transaction costs | | | 7,646 | | | — | | | 7,646 | | | — |
Depreciation and amortization | | | 80,840 | | | 91,642 | | | 324,864 | | | 381,237 |
Income from operations | | | 21,029 | | | 26,719 | | | 135,513 | | | 81,281 |
Other income (expense): | | | | | | | | | | | | |
Interest expense, net of interest income | | | (48,376) | | | (33,390) | | | (143,591) | | | (136,660) |
Gain (loss) on extinguishment of debt | | | (18,498) | | | 3,140 | | | (18,264) | | | 4,510 |
Change in fair value of contingent payment rights | | | 23,802 | | | — | | | 23,802 | | | — |
Other income, net | | | 12,249 | | | (286) | | | 50,778 | | | 27,224 |
Income (loss) before income taxes | | | (9,794) | | | (3,817) | | | 48,238 | | | (23,645) |
Income tax expense (benefit) | | | (2,956) | | | 2,005 | | | 10,936 | | | (3,714) |
Net income (loss) | | | (6,838) | | | (5,822) | | | 37,302 | | | (19,931) |
Less: net income attributable to noncontrolling interest | | | 82 | | | 166 | | | 325 | | | 452 |
| | | | | | | | | | | | |
Net income (loss) attributable to common shareholders | | $ | (6,920) | | $ | (5,988) | | $ | 36,977 | | $ | (20,383) |
| | | | | | | | | | | | |
Net income (loss) per basic and diluted common shares attributable to common shareholders | | $ | (0.09) | | $ | (0.08) | | $ | 0.47 | | $ | (0.29) |
Page 7 of 14
Consolidated Communications Holdings, Inc.
Condensed Consolidated Statements of Cash Flows
(Dollars in thousands)
(Unaudited)
| | Three Months Ended | | Year Ended | ||||||||||||||
| | December 31, | | December 31, | ||||||||||||||
|
| 2020 |
| 2019 |
| 2020 |
| 2019 | ||||||||||
OPERATING ACTIVITIES | | | | | | | | | | | | | ||||||
Net income (loss) | | $ | (6,838) | | $ | (5,822) | | $ | 37,302 | | $ | (19,931) | ||||||
Adjustments to reconcile net income (loss) to net cash provided by operating activities: | | | | | | | | | | | | | ||||||
Depreciation and amortization | | | 80,840 | | | 91,642 | | | 324,864 | | | 381,237 | ||||||
Deferred income taxes | | | 8,386 | | | (5,888) | | | 8,386 | | | (5,249) | ||||||
Cash distributions from wireless partnerships in excess of (less than) earnings | | | (157) | | | (340) | | | 844 | | | (1,901) | ||||||
Pension and post-retirement contributions in excess of expense | | | (7,635) | | | (246) | | | (37,301) | | | (24,507) | ||||||
Non-cash, stock-based compensation | | | 2,046 | | | 1,596 | | | 7,533 | | | 6,836 | ||||||
Amortization of deferred financing costs and discounts | | | 4,243 | | | 1,253 | | | 7,871 | | | 4,932 | ||||||
Loss (gain) on extinguishment of debt | | | 10,863 | | | (3,140) | | | 10,629 | | | (4,510) | ||||||
Gain on change in fair value of contingent payment rights | | | (23,802) | | | — | | | (23,802) | | | — | ||||||
Other adjustments, net | | | 9,859 | | | 696 | | | 5,374 | | | 1,487 | ||||||
Changes in operating assets and liabilities, net | | | (10,175) | | | 10,708 | | | 23,280 | | | 702 | ||||||
Net cash provided by operating activities | | | 67,630 | | | 90,459 | | | 364,980 | | | 339,096 | ||||||
INVESTING ACTIVITIES | | | | | | | | | | | | | ||||||
Purchase of property, plant and equipment, net | | | (65,348) | | | (47,860) | | | (217,563) | | | (232,203) | ||||||
Proceeds from sale of assets | | | 94 | | | 375 | | | 7,071 | | | 14,718 | ||||||
Proceeds from sale of investments | | | — | | | — | | | 426 | | | 329 | ||||||
Other | | | — | | | (213) | | | — | | | (663) | ||||||
Net cash used in investing activities | | | (65,254) | | | (47,698) | | | (210,066) | | | (217,819) | ||||||
FINANCING ACTIVITIES | | | | | | | | | | | | | ||||||
Proceeds on bond offering | | | 750,000 | | | — | | | 750,000 | | | — | ||||||
Proceeds from issuance of long-term debt | | | 1,231,250 | | | 43,000 | | | 1,271,250 | | | 195,000 | ||||||
Proceeds from issuance of common stock | | | 350,000 | | | — | | | 350,000 | | | — | ||||||
Payment of finance lease obligations | | | (1,777) | | | (2,776) | | | (9,020) | | | (12,519) | ||||||
Payment on long-term debt | | | (1,774,075) | | | (52,587) | | | (1,867,838) | | | (195,350) | ||||||
Retirement of senior notes | | | (440,509) | | | (23,818) | | | (444,717) | | | (49,804) | ||||||
Payment of financing costs | | | (59,139) | | | — | | | (59,139) | | | — | ||||||
Share repurchases for minimum tax withholding | | | (812) | | | (363) | | | (812) | | | (363) | ||||||
Dividends on common stock | | | — | | | — | | | — | | | (55,445) | ||||||
Other | | | (1,472) | | | — | | | (1,472) | | | — | ||||||
Net cash used in financing activities | | | 53,466 | | | (36,544) | | | (11,748) | | | (118,481) | ||||||
Net change in cash and cash equivalents | | | 55,842 | | | 6,217 | | | 143,166 | | | 2,796 | ||||||
Cash and cash equivalents at beginning of period | | | 99,719 | | | 6,178 | | | 12,395 | | | 9,599 | ||||||
Cash and cash equivalents at end of period | | $ | 155,561 | | $ | 12,395 | | $ | 155,561 | | $ | 12,395 | ||||||
Page 8 of 14
Consolidated Communications Holdings, Inc.
Consolidated Revenue by Category
(Dollars in thousands)
(Unaudited)
| | Three Months Ended | | Year Ended | ||||||||
| | December 31, | | December 31, | ||||||||
|
| 2020 |
| 2019 |
| 2020 |
| 2019 | ||||
Commercial and carrier: | | | | | | | | | | | | |
Data and transport services (includes VoIP) | | $ | 92,781 | | $ | 89,905 | | $ | 362,078 | | $ | 355,325 |
Voice services | | | 44,862 | | | 46,510 | | | 181,700 | | | 188,322 |
Other | | | 12,128 | | | 12,500 | | | 45,155 | | | 52,894 |
| | | 149,771 | | | 148,915 | | | 588,933 | | | 596,541 |
Consumer: | | | | | | | | | | | | |
Broadband (VoIP and Data) | | | 66,253 | | | 64,474 | | | 263,059 | | | 257,083 |
Video services | | | 17,547 | | | 19,838 | | | 74,343 | | | 81,378 |
Voice services | | | 41,431 | | | 44,238 | | | 170,503 | | | 180,839 |
| | | 125,231 | | | 128,550 | | | 507,905 | | | 519,300 |
| | | | | | | | | | | | |
Subsidies | | | 17,402 | | | 18,122 | | | 71,989 | | | 72,440 |
Network access | | | 31,314 | | | 33,056 | | | 125,261 | | | 138,056 |
Other products and services | | | 2,406 | | | 2,392 | | | 9,940 | | | 10,205 |
Total operating revenue | | $ | 326,124 | | $ | 331,035 | | $ | 1,304,028 | | $ | 1,336,542 |
Consolidated Communications Holdings, Inc.
Consolidated Revenue Trend by Category
(Dollars in thousands)
(Unaudited)
| | Three Months Ended | |||||||||||||
|
| Q4 2020 |
| Q3 2020 |
| Q2 2020 |
| Q1 2020 |
| Q4 2019 | |||||
Commercial and carrier: | | | | | | | | | | | | | | | |
Data and transport services (includes VoIP) | | $ | 92,781 | | $ | 90,153 | | $ | 89,572 | | $ | 89,572 | | $ | 89,905 |
Voice services | | | 44,862 | | | 45,343 | | | 45,775 | | | 45,720 | | | 46,510 |
Other | | | 12,128 | | | 10,909 | | | 10,406 | | | 11,712 | | | 12,500 |
| | | 149,771 | | | 146,405 | | | 145,753 | | | 147,004 | | | 148,915 |
Consumer: | | | | | | | | | | | | | | | |
Broadband (VoIP and Data) | | | 66,253 | | | 67,163 | | | 65,567 | | | 64,076 | | | 64,474 |
Video services | | | 17,547 | | | 18,452 | | | 19,213 | | | 19,131 | | | 19,838 |
Voice services | | | 41,431 | | | 42,775 | | | 43,121 | | | 43,176 | | | 44,238 |
| | | 125,231 | | | 128,390 | | | 127,901 | | | 126,383 | | | 128,550 |
| | | | | | | | | | | | | | | |
Subsidies | | | 17,402 | | | 18,064 | | | 18,069 | | | 18,454 | | | 18,122 |
Network access | | | 31,314 | | | 32,009 | | | 30,473 | | | 31,465 | | | 33,056 |
Other products and services | | | 2,406 | | | 2,198 | | | 2,980 | | | 2,356 | | | 2,392 |
Total operating revenue | | $ | 326,124 | | $ | 327,066 | | $ | 325,176 | | $ | 325,662 | | $ | 331,035 |
Page 9 of 14
Consolidated Communications Holdings, Inc.
Schedule of Adjusted EBITDA Calculation
(Dollars in thousands)
(Unaudited)
| | Three Months Ended | | Year Ended | ||||||||
| | December 31, | | December 31, | ||||||||
|
| 2020 |
| 2019 |
| 2020 |
| 2019 | ||||
Net income (loss) | | $ | (6,838) | | $ | (5,822) | | $ | 37,302 | | $ | (19,931) |
Add (subtract): | | | | | | | | | | | | |
Income tax expense (benefit) | | | (2,956) | | | 2,005 | | | 10,936 | | | (3,714) |
Interest expense, net | | | 48,376 | | | 33,390 | | | 143,591 | | | 136,660 |
Depreciation and amortization | | | 80,840 | | | 91,642 | | | 324,864 | | | 381,237 |
EBITDA | | | 119,422 | | | 121,215 | | | 516,693 | | | 494,252 |
| | | | | | | | | | | | |
Adjustments to EBITDA (1): | | | | | | | | | | | | |
Other, net (2) | | | 17,518 | | | 3,914 | | | 14,238 | | | 17,754 |
Investment income (accrual basis) | | | (9,793) | | | (7,483) | | | (41,062) | | | (38,088) |
Investment distributions (cash basis) | | | 9,483 | | | 6,986 | | | 41,529 | | | 35,809 |
Pension/OPEB expense (benefit) | | | (1,062) | | | 7,797 | | | (4,169) | | | 11,487 |
Loss (gain) on extinguishment of debt | | | 18,498 | | | (3,140) | | | 18,264 | | | (4,510) |
Change in fair value of contingent payment right | | | (23,802) | | | — | | | (23,802) | | | — |
Non-cash compensation (3) | | | 2,046 | | | 1,596 | | | 7,533 | | | 6,836 |
Adjusted EBITDA | | $ | 132,310 | | $ | 130,885 | | $ | 529,224 | | $ | 523,540 |
Notes:
| (1) | These adjustments reflect those required or permitted by the lenders under our credit agreement. |
| (2) | Other, net includes income attributable to noncontrolling interests, acquisition and non-recurring related costs, and certain miscellaneous items. |
| (3) | Represents compensation expenses in connection with our Restricted Share Plan, which because of the non-cash nature of the expenses are excluded from adjusted EBITDA. |
Page 10 of 14
Consolidated Communications Holdings, Inc.
Schedule of Free Cash Flow Calculation
(Dollars in thousands)
(Unaudited)
| | Three Months Ended | | Year Ended | ||||||||
| | December 31, | | December 31, | ||||||||
|
| 2020 |
| 2019 |
| 2020 |
| 2019 | ||||
Net cash provided by operating activities | | $ | 67,630 | | $ | 90,459 | | $ | 364,980 | | $ | 339,096 |
Add (subtract): | | | | | | | | | | | | |
Capital expenditures | | | (65,348) | | | (47,860) | | | (217,563) | | | (232,203) |
Dividends paid | | | — | | | — | | | — | | | (55,445) |
Proceeds from the sale of assets | | | 94 | | | 375 | | | 7,071 | | | 14,718 |
Net proceeds from refinancing and Searchlight investment | | | 43,420 | | | — | | | 43,420 | | | — |
Free cash flow | | $ | 45,796 | | $ | 42,974 | | $ | 197,908 | | $ | 66,166 |
Consolidated Communications Holdings, Inc.
Total Net Debt to LTM Adjusted EBITDA Ratio
(Dollars in thousands)
(Unaudited)
| | December 31, | |
|
| 2020 | |
Summary of Outstanding Debt: | | | |
Term loans, net of discount $18,181 | | $ | 1,228,694 |
Senior secured notes due 2028 | | | 750,000 |
Finance leases | | | 17,467 |
Total debt as of December 31, 2020 | | | 1,996,161 |
Less deferred debt issuance costs | | | (45,934) |
Less cash on hand | | | (155,561) |
Total net debt as of December 31, 2020 | | $ | 1,794,666 |
| | | |
Adjusted EBITDA for the twelve months ended December 31, 2020 | | $ | 529,224 |
| | | |
Total Net Debt to last twelve months | | | |
Adjusted EBITDA | | | 3.39x |
Page 11 of 14
Consolidated Communications Holdings, Inc.
Reconciliation of Net Income to Adjusted EBITDA Guidance
(Dollars in millions)
(Unaudited)
| Twelve Months Ended | | ||
| December 31, 2021 | | ||
| Range | | ||
| Low | | High | |
Net income | $ 31 | | $ 41 | |
Add: | | | | |
Income tax expense | 10 | | 20 | |
Interest expense, net | 150 | | 145 | |
Depreciation and amortization | 305 | | 300 | |
EBITDA | 496 | | 506 | |
| | | | |
Adjustments to EBITDA (1): | | | | |
Other, net (2) | 1 | | 1 | |
Pension/OPEB expense | (4) | | (4) | |
Non-cash compensation (3) | 7 | | 7 | |
Adjusted EBITDA | $ 500 | | $ 510 | |
Notes:
| (1) | These adjustments reflect those required or permitted by the lenders under our credit agreement. |
| (2) | Other, net includes income attributable to noncontrolling interests, cash distributions less equity earnings from our investments, dividend income, and certain miscellaneous items. |
| (3) | Represents compensation expenses in connection with our Restricted Share Plan, which because of the non-cash nature of the expenses are excluded from adjusted EBITDA. |
Page 12 of 14
Consolidated Communications Holdings, Inc.
Adjusted Net Income (Loss) and Net Income (Loss) Per Share
(Dollars in thousands, except per share amounts)
(Unaudited)
| | Three Months Ended | | Year Ended | ||||||||
| | December 31, | | December 31, | ||||||||
|
| 2020 |
| 2019 |
| 2020 |
| 2019 | ||||
Net income (loss) | | $ | (6,838) | | $ | (5,822) | | $ | 37,302 | | $ | (19,931) |
Integration and severance related costs, net of tax | | | 13,171 | | | 5,712 | | | 13,201 | | | 17,449 |
Storm costs (recoveries), net of tax | | | 172 | | | 105 | | | 71 | | | (171) |
Loss (gain) on extinguishment of debt, net of tax | | | 13,674 | | | (2,289) | | | 13,501 | | | (3,288) |
Change in fair value of contingent payment rights | | | (23,802) | | | — | | | (23,802) | | | — |
Non-cash interest expense for Searchlight note including amortization of discount and fees | | | 10,131 | | | — | | | 10,131 | | | — |
Non-cash interest expense for swaps, net of tax | | | (175) | | | (112) | | | (727) | | | (28) |
Change in deferred tax rate | | | (6) | | | 686 | | | (6) | | | 686 |
Other, tax | | | 1,346 | | | 1,227 | | | 1,346 | | | 1,865 |
Non-cash stock compensation, net of tax | | | 1,512 | | | 1,163 | | | 5,568 | | | 4,983 |
Adjusted net income (loss) | | $ | 9,185 | | $ | 670 | | $ | 56,585 | | $ | 1,565 |
| | | | | | | | | | | | |
Weighted average number of shares outstanding | | | 77,515 | | | 70,909 | | | 72,752 | | | 70,837 |
Adjusted diluted net income (loss) per share | | $ | 0.12 | | $ | 0.01 | | $ | 0.78 | | $ | 0.02 |
Notes:
Calculations above assume a 26.1% effective tax rate for the three months and year ended December 31, 2020 and 27.1% effective tax rate for the three months and year ended December 31, 2019.
Page 13 of 14
Consolidated Communications Holdings, Inc.
Key Operating Statistics
(Unaudited)
| | December 31, | | September 30, | | % Change | | December 31, | | % Change | |||
|
| 2020 |
| 2020 |
| in Qtr |
| 2019 |
| YOY | |||
| | | | | | | | | | | | | |
Voice Connections | | | 779,590 | | | 794,333 | | (1.9%) | | | 835,997 | | (6.7%) |
| | | | | | | | | | | | | |
Data and Internet Connections | | | 792,200 | | | 792,211 | | (0.0%) | | | 784,165 | | 1.0% |
| | | | | | | | | | | | | |
Video Connections | | | 76,041 | | | 77,854 | | (2.3%) | | | 84,171 | | (9.7%) |
| | | | | | | | | | | | | |
Business and Broadband as % of total revenue (1) | | | 76.5 | % | | 75.9 | % | 0.9% | | | 75.8 | % | 1.0% |
| | | | | | | | | | | | | |
Fiber route network miles (long-haul, metro and FTTH) (2) | | | 46,664 | | | 46,326 | | 0.7% | | | 37,511 | | 24.4% |
| | | | | | | | | | | | | |
On-net buildings | | | 13,564 | | | 13,202 | | 2.7% | | | 12,264 | | 10.6% |
| | | | | | | | | | | | | |
Consumer Customers | | | 554,763 | | | 562,587 | | (1.4%) | | | 582,818 | | (4.8%) |
| | | | | | | | | | | | | |
Consumer ARPU | | $ | 75.25 | | $ | 76.07 | | (1.1%) | | $ | 73.52 | | 2.4% |
Notes:
| (1) | Business and Broadband revenue % includes: commercial/carrier, equipment sales and service, directory, consumer broadband and special access. |
| (2) | FTTH miles added to fiber route network miles beginning in Q2 2020, which were previously not included. Prior period amounts have not been restated to the current period presentation. |
Page 14 of 14