UNITED STATES
SECURITIES AND EXCHANGE COMMISSION
Washington, D.C. 20549
FORM N-CSR
CERTIFIED SHAREHOLDER REPORT OF REGISTERED
MANAGEMENT INVESTMENT COMPANIES
Investment Company Act file number 811-21667
Fidelity Central Investment Portfolios LLC
(Exact name of registrant as specified in charter)
245 Summer St., Boston, MA 02210
(Address of principal executive offices) (Zip code)
William C. Coffey, Secretary
245 Summer St.
Boston, Massachusetts 02210
(Name and address of agent for service)
Registrant's telephone number, including area code:
617-563-7000
| Date of fiscal year end: | September 30 |
| | |
| Date of reporting period: | March 31, 2019 |
Item 1.
Reports to Stockholder
|
Fidelity® Emerging Markets Equity Central Fund Semi-Annual Report March 31, 2019 |
 |
Beginning on January 1, 2021, as permitted by regulations adopted by the Securities and Exchange Commission, paper copies of a fund’s shareholder reports will no longer be sent by mail, unless you specifically request paper copies of the reports from the fund or from your financial intermediary, such as a financial advisor, broker-dealer or bank. Instead, the reports will be made available on a website, and you will be notified by mail each time a report is posted and provided with a website link to access the report.
If you already elected to receive shareholder reports electronically, you will not be affected by this change and you need not take any action. You may elect to receive shareholder reports and other communications from a fund electronically, by contacting your financial intermediary. For Fidelity customers, visit Fidelity's web site or call Fidelity using the contact information listed below.
You may elect to receive all future reports in paper free of charge. If you wish to continue receiving paper copies of your shareholder reports, you may contact your financial intermediary or, if you are a Fidelity customer, visit Fidelity’s website, or call Fidelity at the applicable toll-free number listed below. Your election to receive reports in paper will apply to all funds held with the fund complex/your financial intermediary.
| Account Type | Website | Phone Number |
| Brokerage, Mutual Fund, or Annuity Contracts: | fidelity.com/mailpreferences | 1-800-343-3548 |
| Employer Provided Retirement Accounts: | netbenefits.fidelity.com/preferences (choose 'no' under Required Disclosures to continue to print) | 1-800-343-0860 |
| Advisor Sold Accounts Serviced Through Your Financial Intermediary: | Contact Your Financial Intermediary | Your Financial Intermediary's phone number |
| Advisor Sold Accounts Serviced by Fidelity: | institutional.fidelity.com | 1-877-208-0098 |
Contents
|
Board Approval of Investment Advisory Contracts and Management Fees |
To view a fund's proxy voting guidelines and proxy voting record for the 12-month period ended June 30, visit http://www.fidelity.com/proxyvotingresults or visit the Securities and Exchange Commission's (SEC) web site at http://www.sec.gov.
You may also call 1-800-544-8544 to request a free copy of the proxy voting guidelines.
Standard & Poor's, S&P and S&P 500 are registered service marks of The McGraw-Hill Companies, Inc. and have been licensed for use by Fidelity Distributors Corporation.
Other third-party marks appearing herein are the property of their respective owners.
All other marks appearing herein are registered or unregistered trademarks or service marks of FMR LLC or an affiliated company. © 2019 FMR LLC. All rights reserved.
A fund files its complete schedule of portfolio holdings with the SEC for the first and third quarters of each fiscal year on Form N-PORT. Forms N-PORT are available on the SEC’s web site at http://www.sec.gov. A fund's Forms N-PORT may be reviewed and copied at the SEC’s Public Reference Room in Washington, DC. Information regarding the operation of the SEC's Public Reference Room may be obtained by calling 1-800-SEC-0330.
Investment Summary (Unaudited)
Geographic Diversification (% of fund's net assets)
| As of March 31, 2019 | ||
| Cayman Islands | 18.5% | |
| Korea (South) | 10.6% | |
| China | 10.5% | |
| India | 9.8% | |
| Brazil | 7.1% | |
| Taiwan | 6.7% | |
| South Africa | 5.7% | |
| United States of America* | 5.1% | |
| Russia | 5.0% | |
| Other | 21.0% | |
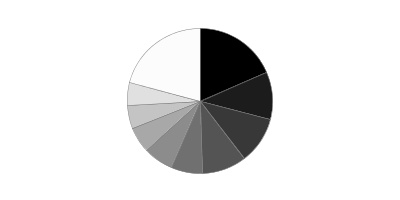
* Includes Short-Term investments and Net Other Assets (Liabilities).
Percentages are based on country or territory of incorporation and are adjusted for the effect of futures contracts, if applicable.
Asset Allocation as of March 31, 2019
| % of fund's net assets | |
| Stocks and Equity Futures | 96.5 |
| Short-Term Investments and Net Other Assets (Liabilities) | 3.5 |
Top Ten Stocks as of March 31, 2019
| % of fund's net assets | |
| Tencent Holdings Ltd. (Cayman Islands, Interactive Media & Services) | 5.3 |
| Taiwan Semiconductor Manufacturing Co. Ltd. (Taiwan, Semiconductors & Semiconductor Equipment) | 5.1 |
| Alibaba Group Holding Ltd. sponsored ADR (Cayman Islands, Internet & Direct Marketing Retail) | 3.5 |
| Industrial & Commercial Bank of China Ltd. (H Shares) (China, Banks) | 3.0 |
| Sberbank of Russia (Russia, Banks) | 2.2 |
| Naspers Ltd. Class N (South Africa, Internet & Direct Marketing Retail) | 2.2 |
| ICICI Bank Ltd. (India, Banks) | 1.6 |
| Meituan Dianping Class B (Cayman Islands, Internet & Direct Marketing Retail) | 1.5 |
| Samsung Electronics Co. Ltd. (Korea (South), Technology Hardware, Storage & Peripherals) | 1.4 |
| Reliance Industries Ltd. (India, Oil, Gas & Consumable Fuels) | 1.4 |
| 27.2 |
Top Market Sectors as of March 31, 2019
| % of fund's net assets | |
| Financials | 24.9 |
| Consumer Discretionary | 15.8 |
| Information Technology | 12.3 |
| Communication Services | 9.6 |
| Materials | 7.4 |
| Energy | 7.3 |
| Consumer Staples | 6.5 |
| Industrials | 4.7 |
| Real Estate | 3.2 |
| Health Care | 2.2 |
Schedule of Investments March 31, 2019 (Unaudited)
Showing Percentage of Net Assets
| Common Stocks - 91.2% | |||
| Shares | Value | ||
| Argentina - 0.6% | |||
| Banco Macro SA sponsored ADR | 7,569 | $346,357 | |
| BBVA Banco Frances SA sponsored ADR | 69,073 | 656,884 | |
| Bolsas y Mercados Argentinos SA | 35,590 | 265,100 | |
| Central Puerto SA sponsored ADR | 80,200 | 737,038 | |
| Grupo Financiero Galicia SA sponsored ADR | 87,956 | 2,244,637 | |
| Inversiones y Representaciones SA ADR (a) | 43,002 | 468,722 | |
| Loma Negra Compania Industrial Argentina SA ADR (a) | 46,214 | 506,043 | |
| Pampa Holding SA sponsored ADR (a)(b) | 27,765 | 765,481 | |
| YPF SA Class D sponsored ADR | 43,900 | 615,039 | |
| TOTAL ARGENTINA | 6,605,301 | ||
| Australia - 0.0% | |||
| Frontier Digital Ventures Ltd. (a) | 616,000 | 227,443 | |
| Bahrain - 0.0% | |||
| Ahli United Bank | 152,400 | 137,817 | |
| Bangladesh - 0.2% | |||
| BRAC Bank Ltd. | 579,798 | 531,338 | |
| Olympic Industries Ltd. | 102,216 | 281,988 | |
| Square Pharmaceuticals Ltd. | 261,275 | 830,443 | |
| The City Bank Ltd. | 576,312 | 181,058 | |
| TOTAL BANGLADESH | 1,824,827 | ||
| Bermuda - 1.4% | |||
| AGTech Holdings Ltd. (a) | 3,416,000 | 221,933 | |
| Central European Media Enterprises Ltd. Class A (a) | 110,071 | 438,083 | |
| Cosan Ltd. Class A | 82,000 | 950,380 | |
| Credicorp Ltd. (United States) | 25,232 | 6,054,418 | |
| GP Investments Ltd. Class A (depositary receipt) (a) | 88,607 | 100,028 | |
| Kunlun Energy Co. Ltd. | 514,000 | 536,921 | |
| Man Wah Holdings Ltd. | 236,600 | 138,645 | |
| Marvell Technology Group Ltd. | 33,600 | 668,304 | |
| Pacific Basin Shipping Ltd. | 5,990,000 | 1,289,575 | |
| Shangri-La Asia Ltd. | 3,170,000 | 4,506,678 | |
| TOTAL BERMUDA | 14,904,965 | ||
| Brazil - 3.6% | |||
| Azul SA sponsored ADR (a) | 92,800 | 2,710,688 | |
| B2W Companhia Global do Varejo (a) | 25,100 | 270,658 | |
| Banco do Brasil SA | 663,340 | 8,254,160 | |
| BR Malls Participacoes SA | 334,100 | 1,072,608 | |
| BTG Pactual Participations Ltd. unit | 332,700 | 3,076,032 | |
| Companhia de Saneamento de Minas Gerais | 180,230 | 2,811,153 | |
| Direcional Engenharia SA | 657,600 | 1,456,164 | |
| Localiza Rent A Car SA | 319,020 | 2,693,706 | |
| Natura Cosmeticos SA | 534,400 | 6,195,210 | |
| Notre Dame Intermedica Participacoes SA | 235,520 | 1,973,018 | |
| Petrobras Distribuidora SA | 363,200 | 2,147,466 | |
| Vale SA sponsored ADR | 437,315 | 5,711,334 | |
| TOTAL BRAZIL | 38,372,197 | ||
| British Virgin Islands - 0.2% | |||
| Mail.Ru Group Ltd. GDR (Reg. S) (a) | 94,900 | 2,349,724 | |
| Canada - 0.2% | |||
| OceanaGold Corp. | 89,300 | 280,660 | |
| Pan American Silver Corp. | 157,200 | 2,082,900 | |
| TOTAL CANADA | 2,363,560 | ||
| Cayman Islands - 18.5% | |||
| 58.com, Inc. ADR (a) | 16,645 | 1,093,244 | |
| Airtac International Group | 195,000 | 2,521,307 | |
| Alibaba Group Holding Ltd. sponsored ADR (a) | 200,922 | 36,658,219 | |
| Ant International Co. Ltd. Class C (c)(d) | 296,486 | 1,915,300 | |
| China Biologic Products Holdings, Inc. (a) | 13,976 | 1,275,310 | |
| China Literature Ltd. (a)(e) | 176,760 | 827,512 | |
| China Resources Land Ltd. | 891,000 | 3,995,338 | |
| China State Construction International Holdings Ltd. | 2,428,000 | 2,273,365 | |
| CStone Pharmaceuticals Co. Ltd. (a)(e) | 919,830 | 1,860,764 | |
| Ctrip.com International Ltd. ADR (a) | 18,809 | 821,765 | |
| ENN Energy Holdings Ltd. | 190,590 | 1,842,786 | |
| Eurocharm Holdings Co. Ltd. | 22,000 | 95,531 | |
| Haitian International Holdings Ltd. | 1,022,000 | 2,322,624 | |
| HUYA, Inc. ADR (b) | 81,700 | 2,298,221 | |
| JD.com, Inc. sponsored ADR (a) | 389,699 | 11,749,425 | |
| Kingdee International Software Group Co. Ltd. | 1,193,000 | 1,379,937 | |
| Kingsoft Corp. Ltd. | 3,782,000 | 9,616,459 | |
| Koolearn Technology Holding Ltd. (a)(e) | 1,016,000 | 1,312,396 | |
| LexinFintech Holdings Ltd. ADR (a) | 56,500 | 593,250 | |
| Meituan Dianping Class B (b) | 2,428,780 | 16,367,297 | |
| Momo, Inc. ADR | 148,000 | 5,659,520 | |
| NetEase, Inc. ADR | 37,900 | 9,150,955 | |
| PPDAI Group, Inc. ADR (a) | 94,600 | 357,588 | |
| Sea Ltd. ADR (a) | 139,800 | 3,288,096 | |
| Shenzhou International Group Holdings Ltd. | 715,300 | 9,585,992 | |
| Shimao Property Holdings Ltd. | 228,720 | 715,301 | |
| SITC International Holdings Co. Ltd. | 351,000 | 360,392 | |
| Sunny Optical Technology Group Co. Ltd. | 243,000 | 2,902,089 | |
| Tencent Holdings Ltd. | 1,216,300 | 55,934,952 | |
| Tencent Music Entertainment Group ADR (a) | 217 | 3,888 | |
| Uni-President China Holdings Ltd. | 4,799,400 | 4,707,722 | |
| Up Fintech Holdings Ltd. ADR (a)(b) | 19,100 | 247,154 | |
| Weidai Ltd. ADR | 26,100 | 301,716 | |
| Wise Talent Information Technology Co. Ltd. (a) | 372,141 | 1,097,467 | |
| Xinyi Solar Holdings Ltd. | 186,000 | 89,565 | |
| Zai Lab Ltd. ADR (a) | 30,700 | 905,957 | |
| TOTAL CAYMAN ISLANDS | 196,128,404 | ||
| Chile - 0.5% | |||
| Compania Cervecerias Unidas SA sponsored ADR | 56,200 | 1,655,652 | |
| Sociedad Matriz SAAM SA | 3,076,967 | 307,468 | |
| Vina Concha y Toro SA | 1,431,604 | 2,978,893 | |
| TOTAL CHILE | 4,942,013 | ||
| China - 10.5% | |||
| BBMG Corp. (H Shares) | 6,195,500 | 2,273,013 | |
| Beijing Sinnet Technology Co. Ltd. (A Shares) | 262,000 | 731,893 | |
| China Communications Construction Co. Ltd. (H Shares) | 1,246,000 | 1,288,864 | |
| China Life Insurance Co. Ltd. (H Shares) | 3,596,900 | 9,697,721 | |
| China Longyuan Power Grid Corp. Ltd. (H Shares) | 3,748,650 | 2,607,358 | |
| China Oilfield Services Ltd. (H Shares) | 2,784,000 | 3,007,448 | |
| China Pacific Insurance (Group) Co. Ltd. (H Shares) | 2,009,900 | 7,886,027 | |
| China Petroleum & Chemical Corp. (H Shares) | 7,782,000 | 6,176,307 | |
| Glodon Co. Ltd. (A Shares) | 178,300 | 791,878 | |
| Hangzhou Hikvision Digital Technology Co. Ltd. (A Shares) | 164,100 | 857,411 | |
| Hangzhou Tigermed Consulting Co. Ltd. (A Shares) | 269,950 | 2,666,501 | |
| Industrial & Commercial Bank of China Ltd. (H Shares) | 43,030,400 | 31,519,284 | |
| Jiangsu Hengrui Medicine Co. Ltd. (A Shares) | 259,821 | 2,532,384 | |
| PICC Property & Casualty Co. Ltd. (H Shares) | 2,798,900 | 3,180,426 | |
| Ping An Insurance (Group) Co. of China Ltd. (H Shares) | 1,038,000 | 11,686,031 | |
| Qingdao Haier Co. Ltd. (A Shares) | 4,193,902 | 10,690,871 | |
| SAIC Motor Corp. Ltd. (A Shares) | 30,200 | 117,299 | |
| Shanghai International Airport Co. Ltd. (A Shares) | 369,800 | 3,424,151 | |
| Shenzhen Mindray Bio-Medical Electronics Co. Ltd. (A Shares) (a) | 115,330 | 2,307,614 | |
| Shenzhen Sunway Communication Co. Ltd. (A Shares) | 149,400 | 641,489 | |
| Sinopec Engineering Group Co. Ltd. (H Shares) | 1,716,000 | 1,674,477 | |
| Sinopharm Group Co. Ltd. (H Shares) | 90,740 | 377,989 | |
| Tonghua Dongbao Pharmaceutical Co. Ltd. (A Shares) | 770,082 | 1,991,735 | |
| Tsingtao Brewery Co. Ltd. (H Shares) | 604,000 | 2,846,897 | |
| WuXi AppTec Co. Ltd. (H Shares) (a)(e) | 47,600 | 579,390 | |
| TOTAL CHINA | 111,554,458 | ||
| Colombia - 0.5% | |||
| Bancolombia SA | 3,020 | 37,513 | |
| Bancolombia SA sponsored ADR | 53,518 | 2,732,629 | |
| Ecopetrol SA | 1,312,774 | 1,406,236 | |
| Inversiones Argos SA | 130,737 | 742,258 | |
| TOTAL COLOMBIA | 4,918,636 | ||
| Egypt - 0.1% | |||
| EFG-Hermes Holding SAE (a) | 158,700 | 155,586 | |
| JUHAYNA Food Industries | 50,000 | 38,229 | |
| Six of October Development & Investment Co. (a) | 310,200 | 300,713 | |
| TOTAL EGYPT | 494,528 | ||
| Greece - 0.5% | |||
| Fourlis Holdings SA | 55,567 | 314,778 | |
| Titan Cement Co. SA (Reg.) | 209,900 | 4,534,870 | |
| TOTAL GREECE | 4,849,648 | ||
| Hong Kong - 3.0% | |||
| AIA Group Ltd. | 155,600 | 1,555,964 | |
| China Everbright International Ltd. | 1,804,000 | 1,833,887 | |
| China Overseas Land and Investment Ltd. | 1,962,460 | 7,449,896 | |
| China Resources Beer Holdings Co. Ltd. | 1,264,666 | 5,324,519 | |
| China Resources Power Holdings Co. Ltd. | 541,523 | 814,014 | |
| China Unicom Ltd. | 2,031,720 | 2,586,838 | |
| China Unicom Ltd. sponsored ADR (b) | 44,500 | 569,600 | |
| CNOOC Ltd. | 5,030,000 | 9,369,282 | |
| Far East Horizon Ltd. | 1,734,074 | 1,837,909 | |
| TOTAL HONG KONG | 31,341,909 | ||
| Hungary - 0.0% | |||
| OTP Bank PLC | 7,467 | 328,546 | |
| India - 9.8% | |||
| Adani Ports & Special Economic Zone Ltd. (a) | 659,296 | 3,603,567 | |
| Axis Bank Ltd. (a) | 683,143 | 7,674,682 | |
| Axis Bank Ltd. GDR (Reg. S) (a) | 6,940 | 387,946 | |
| Bharti Infratel Ltd. | 155,984 | 706,589 | |
| Embassy Office Parks (REIT) (a) | 34,000 | 147,431 | |
| Federal Bank Ltd. | 2,253,267 | 3,141,253 | |
| ICICI Bank Ltd. | 513,338 | 2,969,373 | |
| ICICI Bank Ltd. sponsored ADR | 1,267,180 | 14,521,883 | |
| IndoStar Capital Finance Ltd. (e) | 147,355 | 886,239 | |
| Indraprastha Gas Ltd. (a) | 639,320 | 2,822,581 | |
| ITC Ltd. | 1,826,487 | 7,847,413 | |
| JK Cement Ltd. (a) | 177,398 | 2,222,315 | |
| Larsen & Toubro Ltd. | 221,278 | 4,430,677 | |
| LIC Housing Finance Ltd. | 1,037,641 | 7,981,969 | |
| Mahindra & Mahindra Ltd. | 16,092 | 156,745 | |
| Manappuram General Finance & Leasing Ltd. | 1,922,479 | 3,481,775 | |
| NTPC Ltd. | 505,680 | 984,536 | |
| Oberoi Realty Ltd. | 336,763 | 2,571,539 | |
| Petronet LNG Ltd. | 556,168 | 2,022,173 | |
| Phoenix Mills Ltd. | 219,843 | 2,090,391 | |
| Power Grid Corp. of India Ltd. | 887,936 | 2,539,894 | |
| Reliance Industries Ltd. | 751,397 | 14,805,839 | |
| Shree Cement Ltd. | 12,200 | 3,291,831 | |
| Shriram Transport Finance Co. Ltd. | 157,400 | 2,906,161 | |
| SREI Infrastructure Finance Ltd. | 434,995 | 187,051 | |
| State Bank of India (a) | 1,494,500 | 6,928,682 | |
| Torrent Pharmaceuticals Ltd. | 116,002 | 3,269,132 | |
| TOTAL INDIA | 104,579,667 | ||
| Indonesia - 1.3% | |||
| PT Bank Mandiri (Persero) Tbk | 6,307,400 | 3,309,770 | |
| PT Bank Rakyat Indonesia Tbk | 33,348,900 | 9,683,200 | |
| PT Media Nusantara Citra Tbk | 16,048,900 | 845,272 | |
| TOTAL INDONESIA | 13,838,242 | ||
| Japan - 0.8% | |||
| Keyence Corp. | 2,600 | 1,617,992 | |
| LINE Corp. (a)(b) | 33,600 | 1,183,218 | |
| Nintendo Co. Ltd. | 6,800 | 1,949,499 | |
| SoftBank Corp. | 19,340 | 1,885,200 | |
| Square Enix Holdings Co. Ltd. | 24,700 | 864,712 | |
| Zozo, Inc. | 43,100 | 811,212 | |
| TOTAL JAPAN | 8,311,833 | ||
| Kenya - 0.2% | |||
| Safaricom Ltd. | 6,197,333 | 1,693,815 | |
| Korea (South) - 9.2% | |||
| AMOREPACIFIC Group, Inc. | 63,609 | 3,891,519 | |
| BS Financial Group, Inc. | 421,707 | 2,476,159 | |
| Cafe24 Corp. (a) | 4,500 | 427,196 | |
| Daou Technology, Inc. | 134,990 | 2,509,593 | |
| Hanon Systems | 228,912 | 2,283,788 | |
| Hyundai Fire & Marine Insurance Co. Ltd. | 67,468 | 2,247,648 | |
| Hyundai Mobis | 72,973 | 13,373,947 | |
| Iljin Materials Co. Ltd. | 30,452 | 993,073 | |
| Kakao Corp. | 9,940 | 904,312 | |
| KB Financial Group, Inc. | 158,486 | 5,851,183 | |
| Korea Electric Power Corp. | 55,539 | 1,457,466 | |
| Korea Electric Power Corp. sponsored ADR | 18,700 | 243,287 | |
| LG Chemical Ltd. | 9,050 | 2,911,528 | |
| LG Corp. | 59,765 | 4,071,364 | |
| LG Innotek Co. Ltd. | 11,200 | 1,156,771 | |
| NAVER Corp. | 12,600 | 1,373,357 | |
| NCSOFT Corp. | 7,006 | 3,054,521 | |
| Netmarble Corp. (e) | 8,470 | 930,647 | |
| POSCO | 29,491 | 6,558,452 | |
| S-Oil Corp. | 25,970 | 2,045,367 | |
| Samsung Electronics Co. Ltd. | 380,183 | 14,921,260 | |
| Samsung Life Insurance Co. Ltd. | 33,376 | 2,467,298 | |
| Samsung SDI Co. Ltd. | 22,012 | 4,150,287 | |
| Shinhan Financial Group Co. Ltd. | 134,410 | 4,979,752 | |
| SK Hynix, Inc. | 170,575 | 11,125,271 | |
| ViroMed Co. Ltd. (a) | 6,200 | 1,524,863 | |
| TOTAL KOREA (SOUTH) | 97,929,909 | ||
| Kuwait - 0.3% | |||
| Boubyan Bank KSC | 277,500 | 552,080 | |
| National Bank of Kuwait | 1,039,815 | 3,077,387 | |
| TOTAL KUWAIT | 3,629,467 | ||
| Luxembourg - 0.7% | |||
| Corp. America Airports SA (a) | 51,502 | 425,922 | |
| Samsonite International SA (e) | 2,279,100 | 7,301,876 | |
| Tenaris SA sponsored ADR (b) | 5,022 | 141,872 | |
| TOTAL LUXEMBOURG | 7,869,670 | ||
| Malaysia - 0.4% | |||
| British American Tobacco (Malaysia) Bhd | 243,700 | 2,157,334 | |
| IHH Healthcare Bhd | 1,433,000 | 2,025,330 | |
| TOTAL MALAYSIA | 4,182,664 | ||
| Mexico - 2.1% | |||
| America Movil S.A.B. de CV Series L sponsored ADR | 171,200 | 2,444,736 | |
| Fibra Uno Administracion SA de CV | 1,690,800 | 2,336,253 | |
| Gruma S.A.B. de CV Series B | 436,300 | 4,455,103 | |
| Grupo Aeroportuario del Pacifico S.A.B. de CV Series B | 250,796 | 2,226,513 | |
| Grupo Financiero Banorte S.A.B. de CV Series O | 543,732 | 2,956,452 | |
| Macquarie Mexican (REIT) (e) | 2,336,926 | 2,531,938 | |
| Wal-Mart de Mexico SA de CV Series V | 1,820,500 | 4,869,611 | |
| TOTAL MEXICO | 21,820,606 | ||
| Morocco - 0.1% | |||
| Attijariwafa Bank | 15,551 | 683,507 | |
| Netherlands - 0.3% | |||
| NXP Semiconductors NV | 15,000 | 1,325,850 | |
| Yandex NV Series A (a) | 66,814 | 2,294,393 | |
| TOTAL NETHERLANDS | 3,620,243 | ||
| Nigeria - 0.7% | |||
| Dangote Cement PLC | 1,287,610 | 681,256 | |
| Guaranty Trust Bank PLC | 21,530,720 | 2,150,090 | |
| Guaranty Trust Bank PLC GDR (Reg. S) | 187,574 | 956,627 | |
| Nigerian Breweries PLC | 2,525,631 | 466,997 | |
| Transnational Corp. of Nigeria PLC | 42,692,145 | 143,096 | |
| Zenith Bank PLC | 53,885,209 | 3,254,010 | |
| TOTAL NIGERIA | 7,652,076 | ||
| Pakistan - 0.2% | |||
| Habib Bank Ltd. | 850,500 | 800,588 | |
| Indus Motor Co. Ltd. | 21,577 | 200,041 | |
| Maple Leaf Cement Factory Ltd. | 728,817 | 193,920 | |
| United Bank Ltd. | 370,400 | 367,189 | |
| TOTAL PAKISTAN | 1,561,738 | ||
| Panama - 0.2% | |||
| Copa Holdings SA Class A | 30,400 | 2,450,544 | |
| Peru - 0.9% | |||
| Alicorp SA Class C | 116,159 | 379,885 | |
| Compania de Minas Buenaventura SA sponsored ADR | 527,590 | 9,116,755 | |
| Ferreycorp SAA | 326,923 | 243,395 | |
| TOTAL PERU | 9,740,035 | ||
| Philippines - 1.3% | |||
| Ayala Corp. | 87,075 | 1,553,730 | |
| BDO Unibank, Inc. | 446,433 | 1,133,879 | |
| International Container Terminal Services, Inc. | 355,217 | 881,300 | |
| Jollibee Food Corp. | 150,263 | 904,202 | |
| Metro Pacific Investments Corp. | 7,555,300 | 695,581 | |
| Metropolitan Bank & Trust Co. | 2,785,392 | 4,224,617 | |
| PUREGOLD Price Club, Inc. | 428,487 | 391,234 | |
| Robinsons Land Corp. | 4,600,970 | 2,139,783 | |
| SM Investments Corp. | 80,925 | 1,434,775 | |
| Universal Robina Corp. | 212,643 | 613,549 | |
| TOTAL PHILIPPINES | 13,972,650 | ||
| Poland - 0.2% | |||
| Dino Polska SA (a)(e) | 51,600 | 1,626,192 | |
| Globe Trade Centre SA | 138,157 | 324,576 | |
| Inter Cars SA | 3,491 | 193,672 | |
| TOTAL POLAND | 2,144,440 | ||
| Romania - 0.1% | |||
| Banca Transilvania SA | 1,737,268 | 846,990 | |
| BRD-Groupe Societe Generale | 214,326 | 654,653 | |
| TOTAL ROMANIA | 1,501,643 | ||
| Russia - 5.0% | |||
| Lukoil PJSC sponsored ADR | 133,200 | 11,934,720 | |
| MMC Norilsk Nickel PJSC sponsored ADR | 345,500 | 7,296,960 | |
| NOVATEK OAO GDR (Reg. S) | 33,700 | 5,776,180 | |
| Sberbank of Russia | 3,118,550 | 10,187,025 | |
| Sberbank of Russia sponsored ADR | 997,392 | 13,225,418 | |
| Tatneft PAO | 256,300 | 2,949,120 | |
| Unipro PJSC | 50,810,800 | 2,001,767 | |
| TOTAL RUSSIA | 53,371,190 | ||
| Saudi Arabia - 0.2% | |||
| Abdullah Al Othaim Markets Co. | 18,000 | 344,128 | |
| Al Rajhi Bank | 23,800 | 676,492 | |
| Aldrees Petroleum and Transport Services Co. | 24,360 | 176,675 | |
| Bupa Arabia for Cooperative Insurance Co. | 11,820 | 261,907 | |
| Mouwasat Medical Services Co. | 12,700 | 270,908 | |
| SABIC | 5,100 | 168,352 | |
| Saudi Co. for Hardware CJSC | 14,250 | 277,374 | |
| United International Transportation Co. | 45,500 | 392,477 | |
| TOTAL SAUDI ARABIA | 2,568,313 | ||
| Singapore - 0.2% | |||
| First Resources Ltd. | 1,987,200 | 2,404,728 | |
| Slovenia - 0.0% | |||
| Nova Ljubljanska banka d.d. unit | 9,200 | 125,905 | |
| South Africa - 5.7% | |||
| African Rainbow Minerals Ltd. | 34,200 | 402,234 | |
| Anglo American Platinum Ltd. | 3,500 | 178,569 | |
| AngloGold Ashanti Ltd. | 263,800 | 3,468,496 | |
| Barclays Africa Group Ltd. | 786,841 | 8,294,448 | |
| Bidvest Group Ltd. | 197,662 | 2,650,791 | |
| DRDGOLD Ltd. | 1,295,045 | 262,234 | |
| FirstRand Ltd. | 528,000 | 2,303,933 | |
| Impala Platinum Holdings Ltd. (a) | 1,184,900 | 5,009,367 | |
| Imperial Holdings Ltd. | 296,167 | 1,228,902 | |
| Mondi Ltd. | 183,600 | 4,056,346 | |
| Motus Holdings Ltd. | 215,900 | 1,224,287 | |
| Mr Price Group Ltd. | 231,600 | 3,042,040 | |
| MultiChoice Group Ltd. (a) | 11,600 | 97,037 | |
| Nampak Ltd. (a) | 424,210 | 329,872 | |
| Naspers Ltd. Class N | 99,600 | 23,210,949 | |
| Pick 'n Pay Stores Ltd. | 565,408 | 2,602,356 | |
| Pretoria Portland Cement Co. Ltd. (a) | 685,034 | 223,142 | |
| Sanlam Ltd. | 47,500 | 242,821 | |
| Sasol Ltd. | 46,000 | 1,434,307 | |
| Shoprite Holdings Ltd. | 27,516 | 302,473 | |
| Steinhoff Africa Retail Ltd. (e) | 212,700 | 259,449 | |
| TOTAL SOUTH AFRICA | 60,824,053 | ||
| Spain - 0.1% | |||
| Cemex Latam Holdings SA (a) | 133,579 | 201,121 | |
| Prosegur Cash SA (e) | 167,333 | 369,405 | |
| TOTAL SPAIN | 570,526 | ||
| Sri Lanka - 0.0% | |||
| Chevron Lubricants Lanka Ltd. | 2,815 | 1,004 | |
| Taiwan - 6.7% | |||
| Chroma ATE, Inc. | 227,000 | 1,077,660 | |
| Delta Electronics, Inc. | 308,000 | 1,586,960 | |
| King's Town Bank | 1,343,000 | 1,392,657 | |
| Largan Precision Co. Ltd. | 20,000 | 2,981,302 | |
| Nanya Technology Corp. | 1,443,000 | 2,871,130 | |
| PChome Online, Inc. (a) | 73,000 | 307,528 | |
| Taiwan Semiconductor Manufacturing Co. Ltd. | 6,355,869 | 50,841,021 | |
| Taiwan Semiconductor Manufacturing Co. Ltd. sponsored ADR | 90,080 | 3,689,677 | |
| Unified-President Enterprises Corp. | 2,455,000 | 5,950,744 | |
| United Microelectronics Corp. | 1,127,000 | 426,270 | |
| TOTAL TAIWAN | 71,124,949 | ||
| Thailand - 1.1% | |||
| PTT Global Chemical PCL (For. Reg.) | 1,952,200 | 4,137,581 | |
| PTT PCL (For. Reg.) | 215,900 | 326,606 | |
| Siam Cement PCL (For. Reg.) | 452,000 | 6,866,183 | |
| Thai Beverage PCL | 656,133 | 409,100 | |
| TOTAL THAILAND | 11,739,470 | ||
| Turkey - 0.7% | |||
| Aselsan A/S | 626,300 | 2,390,398 | |
| Enerjisa Enerji A/S (e) | 265,200 | 245,437 | |
| Tupras Turkiye Petrol Rafinerileri A/S | 169,758 | 3,799,802 | |
| Turkiye Garanti Bankasi A/S | 876,900 | 1,311,693 | |
| TOTAL TURKEY | 7,747,330 | ||
| United Arab Emirates - 0.8% | |||
| DP World Ltd. | 141,902 | 2,270,432 | |
| Dubai Financial Market PJSC | 1,385,094 | 277,912 | |
| Dubai Parks and Resorts PJSC (a) | 1,683,610 | 110,922 | |
| Emaar Properties PJSC | 2,946,033 | 3,753,572 | |
| National Bank of Abu Dhabi PJSC | 579,854 | 2,408,987 | |
| TOTAL UNITED ARAB EMIRATES | 8,821,825 | ||
| United Kingdom - 0.2% | |||
| Antofagasta PLC | 33,033 | 415,610 | |
| ASA International (a)(e) | 26,600 | 155,557 | |
| Georgia Capital PLC (a) | 19,500 | 276,836 | |
| NMC Health PLC | 5,647 | 167,987 | |
| Tonghua Dongbao Pharmaceutical Co. Ltd. ELS (UBS AG London Bank Warrant Program) A warrants 4/8/20 (a)(e) | 270,490 | 699,593 | |
| Tullow Oil PLC | 87,033 | 272,735 | |
| TOTAL UNITED KINGDOM | 1,988,318 | ||
| United States of America - 1.2% | |||
| Activision Blizzard, Inc. | 48,700 | 2,217,311 | |
| MercadoLibre, Inc. (a) | 17,036 | 8,649,688 | |
| NVIDIA Corp. | 8,000 | 1,436,480 | |
| TOTAL UNITED STATES OF AMERICA | 12,303,479 | ||
| Vietnam - 0.7% | |||
| Bank For Foreign Trade JSC | 213,280 | 618,589 | |
| Binh Minh Plastic JSC | 50,220 | 105,076 | |
| Ho Chi Minh City Securities Co. | 220,217 | 267,631 | |
| Ho Chi Minh City Securities Co. rights 4/19/19 (a) | 101,950 | 41,593 | |
| Petrolimex | 148,900 | 381,170 | |
| PetroVietnam Drilling & Well Services JSC (a) | 358,470 | 276,530 | |
| PetroVietnam Technical Services Corp. | 364,793 | 323,855 | |
| Saigon Securities, Inc. | 302,890 | 355,051 | |
| Vietjet Aviation JSC | 83,716 | 420,312 | |
| Vietnam Dairy Products Corp. | 331,556 | 1,926,123 | |
| Vietnam Engine & Agricultural Machinery Corp. | 70,000 | 158,680 | |
| Vietnam Technological & Commercial Joint Stock Bank (a) | 722,700 | 797,325 | |
| Vincom Retail JSC (a) | 691,100 | 1,030,515 | |
| Vingroup JSC (a) | 45,000 | 224,767 | |
| TOTAL VIETNAM | 6,927,217 | ||
| TOTAL COMMON STOCKS | |||
| (Cost $847,425,028) | 969,045,032 | ||
| Nonconvertible Preferred Stocks - 4.9% | |||
| Brazil - 3.5% | |||
| Ambev SA sponsored ADR | 812,800 | 3,495,040 | |
| Banco do Estado Rio Grande do Sul SA | 241,060 | 1,489,328 | |
| Companhia Paranaense de Energia-Copel: | |||
| (PN-B) | 5,860 | 54,479 | |
| (PN-B) sponsored ADR (b) | 318,707 | 2,957,601 | |
| Itau Unibanco Holding SA sponsored ADR | 1,599,179 | 14,088,767 | |
| Metalurgica Gerdau SA (PN) | 1,674,800 | 3,041,319 | |
| Petroleo Brasileiro SA - Petrobras (PN) sponsored ADR (non-vtg.) | 687,900 | 9,836,970 | |
| Telefonica Brasil SA | 139,380 | 1,690,922 | |
| TOTAL BRAZIL | 36,654,426 | ||
| Korea (South) - 1.4% | |||
| Hyundai Motor Co. Series 2 | 113,085 | 7,584,394 | |
| Samsung Electronics Co. Ltd. | 176,213 | 5,614,839 | |
| Samsung Fire & Marine Insurance Co. Ltd. | 10,286 | 1,844,455 | |
| TOTAL KOREA (SOUTH) | 15,043,688 | ||
| TOTAL NONCONVERTIBLE PREFERRED STOCKS | |||
| (Cost $41,683,005) | 51,698,114 | ||
| Principal Amount | Value | ||
| Government Obligations - 0.5% | |||
| United States of America - 0.5% | |||
| U.S. Treasury Bills, yield at date of purchase 2.37% to 2.38% 4/25/19 to 5/9/19 (f) | |||
| (Cost $5,027,511) | 5,040,000 | 5,027,487 | |
| Shares | Value | ||
| Money Market Funds - 3.9% | |||
| Fidelity Cash Central Fund, 2.48% (g) | 30,262,959 | 30,269,012 | |
| Fidelity Securities Lending Cash Central Fund 2.48% (g)(h) | 11,296,745 | 11,297,875 | |
| TOTAL MONEY MARKET FUNDS | |||
| (Cost $41,565,852) | 41,566,887 | ||
| TOTAL INVESTMENT IN SECURITIES - 100.5% | |||
| (Cost $935,701,396) | 1,067,337,520 | ||
| NET OTHER ASSETS (LIABILITIES) - (0.5)% | (4,855,422) | ||
| NET ASSETS - 100% | $1,062,482,098 |
| Futures Contracts | |||||
| Number of contracts | Expiration Date | Notional Amount | Value | Unrealized Appreciation/(Depreciation) | |
| Purchased | |||||
| Equity Index Contracts | |||||
| ICE E-mini MSCI Emerging Markets Index Contracts (United States) | 88 | June 2019 | $4,652,560 | $89,115 | $89,115 |
The notional amount of futures purchased as a percentage of Net Assets is 0.4%
Security Type Abbreviations
ELS – Equity-Linked Security
Categorizations in the Schedule of Investments are based on country or territory of incorporation.
Legend
(a) Non-income producing
(b) Security or a portion of the security is on loan at period end.
(c) Restricted securities - Investment in securities not registered under the Securities Act of 1933 (excluding 144A issues). At the end of the period, the value of restricted securities (excluding 144A issues) amounted to $1,915,300 or 0.2% of net assets.
(d) Level 3 security
(e) Security exempt from registration under Rule 144A of the Securities Act of 1933. These securities may be resold in transactions exempt from registration, normally to qualified institutional buyers. At the end of the period, the value of these securities amounted to $19,586,395 or 1.8% of net assets.
(f) Security or a portion of the security was pledged to cover margin requirements for futures contracts. At period end, the value of securities pledged amounted to $365,091.
(g) Affiliated fund that is generally available only to investment companies and other accounts managed by Fidelity Investments. The rate quoted is the annualized seven-day yield of the fund at period end. A complete unaudited listing of the fund's holdings as of its most recent quarter end is available upon request. In addition, each Fidelity Central Fund's financial statements are available on the SEC's website or upon request.
(h) Investment made with cash collateral received from securities on loan.
Additional information on each restricted holding is as follows:
| Security | Acquisition Date | Acquisition Cost |
| Ant International Co. Ltd. Class C | 5/16/18 | $1,663,286 |
Affiliated Central Funds
Information regarding fiscal year to date income earned by the Fund from investments in Fidelity Central Funds is as follows:
| Fund | Income earned |
| Fidelity Cash Central Fund | $305,921 |
| Fidelity Securities Lending Cash Central Fund | 26,867 |
| Total | $332,788 |
Amounts in the income column in the above table include any capital gain distributions from underlying funds, which are presented in the corresponding line-item in the Statement of Operations, if applicable.
Investment Valuation
The following is a summary of the inputs used, as of March 31, 2019, involving the Fund's assets and liabilities carried at fair value. The inputs or methodology used for valuing securities may not be an indication of the risk associated with investing in those securities. For more information on valuation inputs, and their aggregation into the levels used below, please refer to the Investment Valuation section in the accompanying Notes to Financial Statements.
| Valuation Inputs at Reporting Date: | ||||
| Description | Total | Level 1 | Level 2 | Level 3 |
| Investments in Securities: | ||||
| Equities: | ||||
| Communication Services | $100,890,773 | $37,351,066 | $63,539,707 | $-- |
| Consumer Discretionary | 169,252,990 | 146,042,041 | 23,210,949 | -- |
| Consumer Staples | 68,162,639 | 68,162,639 | -- | -- |
| Energy | 77,131,227 | 61,585,638 | 15,545,589 | -- |
| Financials | 264,177,498 | 203,516,293 | 60,661,205 | -- |
| Health Care | 24,559,325 | 24,559,325 | -- | -- |
| Industrials | 52,085,629 | 52,085,629 | -- | -- |
| Information Technology | 129,786,616 | 78,515,437 | 51,271,179 | -- |
| Materials | 78,599,832 | 73,434,795 | 5,165,037 | -- |
| Real Estate | 33,068,643 | 31,005,912 | 147,431 | 1,915,300 |
| Utilities | 23,027,974 | 21,570,508 | 1,457,466 | -- |
| Government Obligations | 5,027,487 | -- | 5,027,487 | -- |
| Money Market Funds | 41,566,887 | 41,566,887 | -- | -- |
| Total Investments in Securities: | $1,067,337,520 | $839,396,170 | $226,026,050 | $1,915,300 |
| Derivative Instruments: | ||||
| Assets | ||||
| Futures Contracts | $89,115 | $89,115 | $-- | $-- |
| Total Assets | $89,115 | $89,115 | $-- | $-- |
| Total Derivative Instruments: | $89,115 | $89,115 | $-- | $-- |
Value of Derivative Instruments
The following table is a summary of the Fund's value of derivative instruments by primary risk exposure as of March 31, 2019. For additional information on derivative instruments, please refer to the Derivative Instruments section in the accompanying Notes to Financial Statements.
| Primary Risk Exposure / Derivative Type | Value | |
| Asset | Liability | |
| Equity Risk | ||
| Futures Contracts(a) | $89,115 | $0 |
| Total Equity Risk | 89,115 | 0 |
| Total Value of Derivatives | $89,115 | $0 |
(a) Reflects gross cumulative appreciation (depreciation) on futures contracts as presented in the Schedule of Investments. In the Statement of Assets and Liabilities, the period end daily variation margin is included in receivable or payable for daily variation margin on futures contracts, and the net cumulative appreciation (depreciation) is included in distributable earnings.
See accompanying notes which are an integral part of the financial statements.
Financial Statements
Statement of Assets and Liabilities
| March 31, 2019 (Unaudited) | ||
| Assets | ||
| Investment in securities, at value (including securities loaned of $10,994,842) — See accompanying schedule: Unaffiliated issuers (cost $894,135,544) | $1,025,770,633 | |
| Fidelity Central Funds (cost $41,565,852) | 41,566,887 | |
| Total Investment in Securities (cost $935,701,396) | $1,067,337,520 | |
| Cash | 50,928 | |
| Foreign currency held at value (cost $671,142) | 669,587 | |
| Receivable for investments sold | 4,671,311 | |
| Receivable for fund shares sold | 460,363 | |
| Dividends receivable | 3,141,298 | |
| Distributions receivable from Fidelity Central Funds | 131,507 | |
| Receivable for daily variation margin on futures contracts | 44,000 | |
| Other receivables | 317,359 | |
| Total assets | 1,076,823,873 | |
| Liabilities | ||
| Payable for investments purchased | $1,846,066 | |
| Payable for fund shares redeemed | 868,074 | |
| Other payables and accrued expenses | 330,005 | |
| Collateral on securities loaned | 11,297,630 | |
| Total liabilities | 14,341,775 | |
| Net Assets | $1,062,482,098 | |
| Net Assets consist of: | ||
| Paid in capital | $957,825,942 | |
| Total distributable earnings (loss) | 104,656,156 | |
| Net Assets, for 4,982,268 shares outstanding | $1,062,482,098 | |
| Net Asset Value, offering price and redemption price per share ($1,062,482,098 ÷ 4,982,268 shares) | $213.25 |
See accompanying notes which are an integral part of the financial statements.
Statement of Operations
| Six months ended March 31, 2019 (Unaudited) | ||
| Investment Income | ||
| Dividends | $6,457,185 | |
| Interest | 19,375 | |
| Income from Fidelity Central Funds | 332,788 | |
| Income before foreign taxes withheld | 6,809,348 | |
| Less foreign taxes withheld | (724,764) | |
| Total income | 6,084,584 | |
| Expenses | ||
| Custodian fees and expenses | $249,038 | |
| Independent directors' fees and expenses | 1,949 | |
| Total expenses | 250,987 | |
| Net investment income (loss) | 5,833,597 | |
| Realized and Unrealized Gain (Loss) | ||
| Net realized gain (loss) on: | ||
| Investment securities: | ||
| Unaffiliated issuers | (20,060,751) | |
| Fidelity Central Funds | (566) | |
| Foreign currency transactions | (170,644) | |
| Futures contracts | (1,537,549) | |
| Total net realized gain (loss) | (21,769,510) | |
| Change in net unrealized appreciation (depreciation) on: | ||
| Investment securities: | ||
| Unaffiliated issuers (net of increase in deferred foreign taxes of $145,853) | 57,517,767 | |
| Fidelity Central Funds | 566 | |
| Assets and liabilities in foreign currencies | (4,457) | |
| Futures contracts | 57,171 | |
| Total change in net unrealized appreciation (depreciation) | 57,571,047 | |
| Net gain (loss) | 35,801,537 | |
| Net increase (decrease) in net assets resulting from operations | $41,635,134 |
See accompanying notes which are an integral part of the financial statements.
Statement of Changes in Net Assets
| Six months ended March 31, 2019 (Unaudited) | Year ended September 30, 2018 | |
| Increase (Decrease) in Net Assets | ||
| Operations | ||
| Net investment income (loss) | $5,833,597 | $15,716,138 |
| Net realized gain (loss) | (21,769,510) | 52,654,122 |
| Change in net unrealized appreciation (depreciation) | 57,571,047 | (84,579,697) |
| Net increase (decrease) in net assets resulting from operations | 41,635,134 | (16,209,437) |
| Distributions to shareholders | (48,728,742) | – |
| Distributions to shareholders from net investment income | – | (15,018,134) |
| Distributions to shareholders from net realized gain | – | (37,772,093) |
| Total distributions | (48,728,742) | (52,790,227) |
| Affiliated share transactions | ||
| Proceeds from sales of shares | 407,922,930 | 131,696,787 |
| Reinvestment of distributions | 48,728,742 | 52,167,267 |
| Cost of shares redeemed | (50,889,326) | (214,237,322) |
| Net increase (decrease) in net assets resulting from share transactions | 405,762,346 | (30,373,268) |
| Total increase (decrease) in net assets | 398,668,738 | (99,372,932) |
| Net Assets | ||
| Beginning of period | 663,813,360 | 763,186,292 |
| End of period | $1,062,482,098 | $663,813,360 |
| Other Information | ||
| Undistributed net investment income end of period | $1,675,537 | |
| Shares | ||
| Sold | 1,962,701 | 525,396 |
| Issued in reinvestment of distributions | 258,527 | 214,429 |
| Redeemed | (247,951) | (829,971) |
| Net increase (decrease) | 1,973,277 | (90,146) |
See accompanying notes which are an integral part of the financial statements.
Financial Highlights
Fidelity Emerging Markets Equity Central Fund
| Six months ended (Unaudited) March 31, | Years endedSeptember 30, | |||||
| 2019 | 2018 | 2017 | 2016 | 2015 | 2014 | |
| Selected Per–Share Data | ||||||
| Net asset value, beginning of period | $220.61 | $246.26 | $202.55 | $172.95 | $212.25 | $198.65 |
| Income from Investment Operations | ||||||
| Net investment income (loss)A | 1.68 | 5.11 | 4.65 | 4.05 | 3.47 | 4.39 |
| Net realized and unrealized gain (loss) | 7.26 | (14.13) | 44.19 | 29.35 | (39.58) | 12.94 |
| Total from investment operations | 8.94 | (9.02) | 48.84 | 33.40 | (36.11) | 17.33 |
| Distributions from net investment income | (1.54) | (4.95) | (4.06) | (3.80) | (3.19) | (3.73) |
| Distributions from net realized gain | (14.76) | (11.68) | (1.07) | – | – | – |
| Total distributions | (16.30) | (16.63) | (5.13) | (3.80) | (3.19) | (3.73) |
| Net asset value, end of period | $213.25 | $220.61 | $246.26 | $202.55 | $172.95 | $212.25 |
| Total ReturnB,C | 5.07% | (4.20)% | 24.55% | 19.51% | (17.12)% | 8.72% |
| Ratios to Average Net AssetsD,E | ||||||
| Expenses before reductions | .07%F | .07% | .07% | .09% | .15% | .15% |
| Expenses net of fee waivers, if any | .07%F | .07% | .07% | .09% | .15% | .15% |
| Expenses net of all reductions | .07%F | .07% | .07% | .09% | .15% | .15% |
| Net investment income (loss) | 1.63%F | 2.07% | 2.12% | 2.23% | 1.71% | 2.07% |
| Supplemental Data | ||||||
| Net assets, end of period (000 omitted) | $1,062,482 | $663,813 | $763,186 | $414,821 | $237,056 | $457,436 |
| Portfolio turnover rateG | 60%F | 65% | 59% | 52% | 141% | 84% |
A Calculated based on average shares outstanding during the period.
B Total returns for periods of less than one year are not annualized.
C Total returns would have been lower if certain expenses had not been reduced during the applicable periods shown.
D Fees and expenses of any underlying Fidelity Central Funds are not included in the Fund's expense ratio. The Fund indirectly bears its proportionate share of the expenses of any underlying Fidelity Central Funds.
E Expense ratios reflect operating expenses of the Fund. Expenses before reductions do not reflect amounts reimbursed by the investment adviser or reductions from expense offset arrangements and do not represent the amount paid by the Fund during periods when reimbursements or reductions occur. Expenses net of fee waivers reflect expenses after reimbursement by the investment adviser but prior to reductions from expense offset arrangements. Expenses net of all reductions represent the net expenses paid by the Fund.
F Annualized
G Amount does not include the portfolio activity of any underlying Fidelity Central Funds.
See accompanying notes which are an integral part of the financial statements.
Notes to Financial Statements (Unaudited)
For the period ended March 31, 2019
1. Organization.
Fidelity Emerging Markets Equity Central Fund (the Fund) is a fund of Fidelity Central Investment Portfolios LLC (the LLC) and is authorized to issue an unlimited number of shares. Shares of the Fund are only offered to other investment companies and accounts managed by Fidelity Management & Research Company (FMR), or its affiliates (the Investing Funds). The LLC is registered under the Investment Company Act of 1940, as amended (the 1940 Act), as an open-end management investment company organized as a Delaware Limited Liability Company. The Fund's investments in emerging markets can be subject to social, economic, regulatory, and political uncertainties and can be extremely volatile.
2. Investments in Fidelity Central Funds.
The Fund invests in Fidelity Central Funds, which are open-end investment companies generally available only to other investment companies and accounts managed by the investment adviser and its affiliates. The Fund's Schedule of Investments lists each of the Fidelity Central Funds held as of period end, if any, as an investment of the Fund, but does not include the underlying holdings of each Fidelity Central Fund. As an Investing Fund, the Fund indirectly bears its proportionate share of the expenses of the underlying Fidelity Central Funds.
The Money Market Central Funds seek preservation of capital and current income and are managed by Fidelity Investments Money Management, Inc. (FIMM), an affiliate of the investment adviser. Annualized expenses of the Money Market Central Funds as of their most recent shareholder report date are less than .005%.
A complete unaudited list of holdings for each Fidelity Central Fund is available upon request or at the Securities and Exchange Commission (the SEC) website at www.sec.gov. In addition, the financial statements of the Fidelity Central Funds are available on the SEC website or upon request.
3. Significant Accounting Policies.
The Fund is an investment company and applies the accounting and reporting guidance of the Financial Accounting Standards Board (FASB) Accounting Standards Codification Topic 946 Financial Services – Investments Companies. The financial statements have been prepared in conformity with accounting principles generally accepted in the United States of America (GAAP), which require management to make certain estimates and assumptions at the date of the financial statements. Actual results could differ from those estimates. Subsequent events, if any, through the date that the financial statements were issued have been evaluated in the preparation of the financial statements. The following summarizes the significant accounting policies of the Fund:
Investment Valuation. Investments are valued as of 4:00 p.m. Eastern time on the last calendar day of the period. The Board of Directors (the Board) has delegated the day to day responsibility for the valuation of the Fund's investments to the Fair Value Committee (the Committee) established by the Fund's investment adviser. In accordance with valuation policies and procedures approved by the Board, the Fund attempts to obtain prices from one or more third party pricing vendors or brokers to value its investments. When current market prices, quotations or currency exchange rates are not readily available or reliable, investments will be fair valued in good faith by the Committee, in accordance with procedures adopted by the Board. Factors used in determining fair value vary by investment type and may include market or investment specific events, changes in interest rates and credit quality. The frequency with which these procedures are used cannot be predicted and they may be utilized to a significant extent. The Committee oversees the Fund's valuation policies and procedures and reports to the Board on the Committee's activities and fair value determinations. The Board monitors the appropriateness of the procedures used in valuing the Fund's investments and ratifies the fair value determinations of the Committee.
The Fund categorizes the inputs to valuation techniques used to value its investments into a disclosure hierarchy consisting of three levels as shown below:
- Level 1 – quoted prices in active markets for identical investments
- Level 2 – other significant observable inputs (including quoted prices for similar investments, interest rates, prepayment speeds, etc.)
- Level 3 – unobservable inputs (including the Fund's own assumptions based on the best information available)
Valuation techniques used to value the Fund's investments by major category are as follows:
Equity securities, including restricted securities, for which market quotations are readily available, are valued at the last reported sale price or official closing price as reported by a third party pricing vendor on the primary market or exchange on which they are traded and are categorized as Level 1 in the hierarchy. In the event there were no sales during the day or closing prices are not available, securities are valued at the last quoted bid price or may be valued using the last available price and are generally categorized as Level 2 in the hierarchy. For foreign equity securities, when market or security specific events arise, comparisons to the valuation of American Depositary Receipts (ADRs), futures contracts, Exchange-Traded Funds (ETFs) and certain indexes as well as quoted prices for similar securities may be used and would be categorized as Level 2 in the hierarchy. For equity securities, including restricted securities, where observable inputs are limited, assumptions about market activity and risk are used and these securities may be categorized as Level 3 in the hierarchy.
Debt securities, including restricted securities, are valued based on evaluated prices received from third party pricing vendors or from brokers who make markets in such securities. U.S. government and government agency obligations are valued by pricing vendors who utilize matrix pricing which considers yield or price of bonds of comparable quality, coupon, maturity and type or by broker-supplied prices. When independent prices are unavailable or unreliable, debt securities may be valued utilizing pricing methodologies which consider similar factors that would be used by third party pricing vendors. Debt securities are generally categorized as Level 2 in the hierarchy but may be Level 3 depending on the circumstances.
Futures contracts are valued at the settlement price established each day by the board of trade or exchange on which they are traded and are categorized as Level 1 in the hierarchy. Investments in open-end mutual funds, including the Fidelity Central Funds, are valued at their closing net asset value (NAV) each business day and are categorized as Level 1 in the hierarchy.
Changes in valuation techniques may result in transfers in or out of an assigned level within the disclosure hierarchy. The aggregate value of investments by input level as of March 31, 2019 is included at the end of the Fund's Schedule of Investments.
Foreign Currency. The Fund may use foreign currency contracts to facilitate transactions in foreign-denominated securities. Gains and losses from these transactions may arise from changes in the value of the foreign currency or if the counterparties do not perform under the contracts' terms.
Foreign-denominated assets, including investment securities, and liabilities are translated into U.S. dollars at the exchange rates at period end. Purchases and sales of investment securities, income and dividends received and expenses denominated in foreign currencies are translated into U.S. dollars at the exchange rate in effect on the transaction date.
The effects of exchange rate fluctuations on investments are included with the net realized and unrealized gain (loss) on investment securities. Other foreign currency transactions resulting in realized and unrealized gain (loss) are disclosed separately.
Investment Transactions and Income. For financial reporting purposes, the Fund's investment holdings and NAV include trades executed through the end of the last business day of the period. The NAV per share for processing shareholder transactions is calculated as of the close of business of the New York Stock Exchange (NYSE), normally 4:00 p.m. Eastern time and includes trades executed through the end of the prior business day. Gains and losses on securities sold are determined on the basis of identified cost and include proceeds received from litigation. Dividend income is recorded on the ex-dividend date, except for certain dividends from foreign securities where the ex-dividend date may have passed, which are recorded as soon as the Fund is informed of the ex-dividend date. Non-cash dividends included in dividend income, if any, are recorded at the fair market value of the securities received. Income and capital gain distributions from Fidelity Central Funds, if any, are recorded on the ex-dividend date. Certain distributions received by the Fund represent a return of capital or capital gain. The Fund determines the components of these distributions subsequent to the ex-dividend date, based upon receipt of tax filings or other correspondence relating to the underlying investment. These distributions are recorded as a reduction of cost of investments and/or as a realized gain. Interest income is accrued as earned and includes coupon interest and amortization of premium and accretion of discount on debt securities as applicable. Investment income is recorded net of foreign taxes withheld where recovery of such taxes is uncertain.
Expenses. Expenses directly attributable to a fund are charged to that fund. Expenses attributable to more than one fund are allocated among the respective funds on the basis of relative net assets or other appropriate methods. Expense estimates are accrued in the period to which they relate and adjustments are made when actual amounts are known.
Income Tax Information and Distributions to Shareholders. Each year, the Fund intends to qualify as a regulated investment company under Subchapter M of the Internal Revenue Code, including distributing substantially all of its taxable income and realized gains. As a result, no provision for U.S. Federal income taxes is required. The Fund files a U.S. federal tax return, in addition to state and local tax returns as required. The Fund's federal income tax returns are subject to examination by the Internal Revenue Service (IRS) for a period of three fiscal years after they are filed. State and local tax returns may be subject to examination for an additional fiscal year depending on the jurisdiction. Foreign taxes are provided for based on the Fund's understanding of the tax rules and rates that exist in the foreign markets in which it invests. The Fund is subject to a tax imposed on capital gains by certain countries in which it invests. An estimated deferred tax liability for net unrealized appreciation on the applicable securities is included in Other payables and accrued expenses on the Statement of Assets & Liabilities.
Distributions are declared and recorded on the ex-dividend date. Income and capital gain distributions are determined in accordance with income tax regulations, which may differ from GAAP.
Capital accounts within the financial statements are adjusted for permanent book-tax differences. These adjustments have no impact on net assets or the results of operations. Capital accounts are not adjusted for temporary book-tax differences which will reverse in a subsequent period.
Book-tax differences are primarily due to futures contracts, foreign currency transactions, certain foreign taxes, passive foreign investment companies (PFIC), losses deferred due to wash sales and excise tax regulations.
As of period end, the cost and unrealized appreciation (depreciation) in securities, and derivatives if applicable, for federal income tax purposes were as follows:
| Gross unrealized appreciation | $167,644,221 |
| Gross unrealized depreciation | (42,207,389) |
| Net unrealized appreciation (depreciation) | $125,436,832 |
| Tax cost | $941,989,803 |
The Fund elected to defer to its next fiscal year approximately $609,449 of capital losses recognized during the period November 1, 2017 to September 30, 2018.
Restricted Securities. The Fund may invest in securities that are subject to legal or contractual restrictions on resale. These securities generally may be resold in transactions exempt from registration or to the public if the securities are registered. Disposal of these securities may involve time-consuming negotiations and expense, and prompt sale at an acceptable price may be difficult. Information regarding restricted securities is included at the end of the Fund's Schedule of Investments.
New Rule Issuance. During August 2018, the U.S. Securities and Exchange Commission issued Final Rule Release No. 33-10532, Disclosure Update and Simplification. This Final Rule includes amendments specific to registered investment companies that are intended to eliminate overlap in disclosure requirements between Regulation S-X and GAAP. In accordance with these amendments, certain line-items in the Fund's financial statements have been combined or removed for the current period as outlined in the table below.
| Financial Statement | Current Line-Item Presentation (As Applicable) | Prior Line-Item Presentation (As Applicable) |
| Statement of Assets and Liabilities | Total distributable earnings (loss) | Undistributed/Distributions in excess of/Accumulated net investment income (loss) Accumulated/Undistributed net realized gain (loss) Net unrealized appreciation (depreciation) |
| Statement of Changes in Net Assets | N/A - removed | Undistributed/Distributions in excess of/Accumulated net investment income (loss) end of period |
| Statement of Changes in Net Assets | Distributions to shareholders | Distributions to shareholders from net investment income Distributions to shareholders from net realized gain |
4. Derivative Instruments.
Risk Exposures and the Use of Derivative Instruments. The Fund's investment objective allows the Fund to enter into various types of derivative contracts, including futures contracts. Derivatives are investments whose value is primarily derived from underlying assets, indices or reference rates and may be transacted on an exchange or over-the-counter (OTC). Derivatives may involve a future commitment to buy or sell a specified asset based on specified terms, to exchange future cash flows at periodic intervals based on a notional principal amount, or for one party to make one or more payments upon the occurrence of specified events in exchange for periodic payments from the other party.
The Fund used derivatives to increase returns and to manage exposure to certain risks as defined below. The success of any strategy involving derivatives depends on analysis of numerous economic factors, and if the strategies for investment do not work as intended, the Fund may not achieve its objectives.
The Fund's use of derivatives increased or decreased its exposure to the following risk:
| Equity Risk | Equity risk relates to the fluctuations in the value of financial instruments as a result of changes in market prices (other than those arising from interest rate risk or foreign exchange risk), whether caused by factors specific to an individual investment, its issuer, or all factors affecting all instruments traded in a market or market segment. |
The Fund is also exposed to additional risks from investing in derivatives, such as liquidity risk and counterparty credit risk. Liquidity risk is the risk that the Fund will be unable to close out the derivative in the open market in a timely manner. Counterparty credit risk is the risk that the counterparty will not be able to fulfill its obligation to the Fund. Counterparty credit risk related to exchange-traded futures contracts may be mitigated by the protection provided by the exchange on which they trade.
Investing in derivatives may involve greater risks than investing in the underlying assets directly and, to varying degrees, may involve risk of loss in excess of any initial investment and collateral received and amounts recognized in the Statement of Assets and Liabilities. In addition, there may be the risk that the change in value of the derivative contract does not correspond to the change in value of the underlying instrument.
Futures Contracts. A futures contract is an agreement between two parties to buy or sell a specified underlying instrument for a fixed price at a specified future date. The Fund used futures contracts to manage its exposure to the stock market.
Upon entering into a futures contract, a fund is required to deposit either cash or securities (initial margin) with a clearing broker in an amount equal to a certain percentage of the face value of the contract. Futures contracts are marked-to-market daily and subsequent daily payments (variation margin) are made or received by a fund depending on the daily fluctuations in the value of the futures contracts and are recorded as unrealized appreciation or (depreciation). This receivable and/or payable, if any, is included in daily variation margin on futures contracts in the Statement of Assets and Liabilities. Realized gain or (loss) is recorded upon the expiration or closing of a futures contract. The net realized gain (loss) and change in net unrealized appreciation (depreciation) on futures contracts during the period is presented in the Statement of Operations.
Any open futures contracts at period end are presented in the Schedule of Investments under the caption "Futures Contracts". The notional amount at value reflects each contract's exposure to the underlying instrument or index at period end and is representative of volume of activity during the period. Securities deposited to meet initial margin requirements are identified in the Schedule of Investments.
5. Purchases and Sales of Investments.
Purchases and sales of securities, other than short-term securities, aggregated $557,770,919 and $212,114,216, respectively.
6. Fees and Other Transactions with Affiliates.
Management Fee and Expense Contract. FMR Co., Inc. (the investment adviser, an affiliate of FMR, provides the Fund with investment management services. The Fund does not pay any fees for these services. Pursuant to the Fund's management contract with the investment adviser, FMR pays the investment adviser a portion of the management fees it receives from the Investing Funds. In addition, under an expense contract, FMR also pays all other expenses of the Fund, excluding custody fees, the compensation of the independent Directors, and certain miscellaneous expenses such as proxy and shareholder meeting expenses.
Brokerage Commissions. The Fund placed a portion of its portfolio transactions with brokerage firms which are affiliates of the investment adviser. Brokerage commissions are included in net realized gain (loss) and change in net unrealized appreciation (depreciation) in the Statement of Operations. The commissions paid to these affiliated firms were $2,430 for the period.
Interfund Trades. The Fund may purchase from or sell securities to other Fidelity Funds under procedures adopted by the Board. The procedures have been designed to ensure these interfund trades are executed in accordance with Rule 17a-7 of the 1940 Act. Interfund trades are included within the respective purchases and sales amounts shown in the Purchases and Sales of Investments note.
7. Security Lending.
The Fund lends portfolio securities through a lending agent from time to time in order to earn additional income. For equity securities, a lending agent is used and may loan securities to certain qualified borrowers, including Fidelity Capital Markets (FCM), a broker-dealer affiliated with the Fund. On the settlement date of the loan, the Fund receives collateral (in the form of U.S. Treasury obligations, letters of credit and/or cash) against the loaned securities and maintains collateral in an amount not less than 100% of the market value of the loaned securities during the period of the loan. The market value of the loaned securities is determined at the close of business of the Fund and any additional required collateral is delivered to the Fund on the next business day. The Fund or borrower may terminate the loan at any time, and if the borrower defaults on its obligation to return the securities loaned because of insolvency or other reasons, the Fund may apply collateral received from the borrower against the obligation. The Fund may experience delays and costs in recovering the securities loaned. Any cash collateral received is invested in the Fidelity Securities Lending Cash Central Fund. The value of loaned securities and cash collateral at period end are disclosed on the Fund's Statement of Assets and Liabilities. Security lending income represents the income earned on investing cash collateral, less rebates paid to borrowers and any lending agent fees associated with the loan, plus any premium payments received for lending certain types of securities. Security lending income is presented in the Statement of Operations as a component of income from Fidelity Central Funds. Total security lending income during the period amounted to $26,867. During the period, there were no securities loaned to FCM.
8. Other.
The Fund's organizational documents provide former and current directors and officers with a limited indemnification against liabilities arising in connection with the performance of their duties to the Fund. In the normal course of business, the Fund may also enter into contracts that provide general indemnifications. The Fund's maximum exposure under these arrangements is unknown as this would be dependent on future claims that may be made against the Fund. The risk of material loss from such claims is considered remote.
At the end of the period, mutual funds managed by the investment adviser or its affiliates were the owners of record of all of the outstanding shares of the Fund.
Shareholder Expense Example
As a shareholder of the Fund, you incur two types of costs: (1) transaction costs and (2) ongoing costs, including other Fund expenses. This Example is intended to help you understand your ongoing costs (in dollars) of investing in the Fund and to compare these costs with the ongoing costs of investing in other mutual funds.
The Example is based on an investment of $1,000 invested at the beginning of the period and held for the entire period (October 1, 2018 to March 31, 2019).
Actual Expenses
The first line of the accompanying table provides information about actual account values and actual expenses. You may use the information in this line, together with the amount you invested, to estimate the expenses that you paid over the period. Simply divide your account value by $1,000.00 (for example, an $8,600 account value divided by $1,000.00 = 8.6), then multiply the result by the number in the first line under the heading entitled "Expenses Paid During Period" to estimate the expenses you paid on your account during this period. In addition, the Fund, as a shareholder in the underlying Fidelity Central Funds, will indirectly bear its pro-rata share of the fees and expenses incurred by the underlying Fidelity Central Funds. These fees and expenses are not included in the Fund's annualized expense ratio used to calculate the expense estimate in the table below.
Hypothetical Example for Comparison Purposes
The second line of the accompanying table provides information about hypothetical account values and hypothetical expenses based on the Fund's actual expense ratio and an assumed rate of return of 5% per year before expenses, which is not the Fund's actual return. The hypothetical account values and expenses may not be used to estimate the actual ending account balance or expenses you paid for the period. You may use this information to compare the ongoing costs of investing in the Fund and other funds. To do so, compare this 5% hypothetical example with the 5% hypothetical examples that appear in the shareholder reports of the other funds. In addition, the Fund, as a shareholder in the underlying Fidelity Central Funds, will indirectly bear its pro-rata share of the fees and expenses incurred by the underlying Fidelity Central Funds. These fees and expenses are not included in the Fund's annualized expense ratio used to calculate the expense estimate in the table below.
Please note that the expenses shown in the table are meant to highlight your ongoing costs only and do not reflect any transaction costs. Therefore, the second line of the table is useful in comparing ongoing costs only, and will not help you determine the relative total costs of owning different funds.
| Annualized Expense Ratio-A | Beginning Account Value October 1, 2018 | Ending Account Value March 31, 2019 | Expenses Paid During Period-B October 1, 2018 to March 31, 2019 |
|
| Actual | .0703% | $1,000.00 | $1,050.70 | $.36 |
| Hypothetical-C | $1,000.00 | $1,024.58 | $.35 |
A Annualized expense ratio reflects expenses net of applicable fee waivers.
B Expenses are equal to the Fund's annualized expense ratio, multiplied by the average account value over the period, multiplied by 182/365 (to reflect the one-half year period).
C 5% return per year before expenses
Board Approval of Investment Advisory Contracts and Management Fees
Fidelity Emerging Markets Equity Central Fund
Each year, the Board of Directors, including the Independent Directors (together, the Board), votes on the renewal of the management contract with FMR Co., Inc. (FMRC) and the sub-advisory agreements (together, the Advisory Contracts) for the fund. FMRC and the sub-advisers are referred to herein as the Investment Advisers. The Board, assisted by the advice of fund counsel and Independent Directors' counsel, requests and considers a broad range of information relevant to the renewal of the Advisory Contracts throughout the year.
The Board meets regularly and, at each of its meetings, covers an extensive agenda of topics and materials and considers factors that are relevant to its annual consideration of the renewal of the fund's Advisory Contracts, including the services and support provided to the fund and its shareholders. The Board has established various standing committees (Committees), each composed of and chaired by Independent Directors with varying backgrounds, to which the Board has assigned specific subject matter responsibilities in order to enhance effective decision-making by the Board. The Board, acting directly and through its Committees, requests and receives information concerning the annual consideration of the renewal of the fund's Advisory Contracts. The Board also meets as needed to review matters specifically related to the Board's annual consideration of the renewal of the Advisory Contracts. Members of the Board may also meet with trustees of other Fidelity funds through joint ad hoc committees to discuss certain matters relevant to all of the Fidelity funds.
At its January 2019 meeting, the Board unanimously determined to renew the fund's Advisory Contracts. In reaching its determination, the Board considered all factors it believed relevant and reached a determination, with the assistance of fund counsel and Independent Directors' counsel and through the exercise of its business judgment, that the renewal of the Advisory Contracts was in the best interests of the fund and its shareholders and the fact that no fee is payable under the management contract was fair and reasonable.
Nature, Extent, and Quality of Services Provided. The Board considered Fidelity's staffing as it relates to the fund, including the backgrounds of investment personnel of Fidelity, and also considered the fund's investment objective, strategies, and related investment philosophy. The Independent Directors also had discussions with senior management of Fidelity's investment operations and investment groups. The Board considered the structure of the investment personnel compensation program and whether this structure provides appropriate incentives to act in the best interests of the fund. Resources Dedicated to Investment Management and Support Services. The Board and the Fund Oversight and Research Committees reviewed the general qualifications and capabilities of Fidelity's investment staff, including its size, education, experience, and resources, as well as Fidelity's approach to recruiting, training, managing, and compensating investment personnel. The Board noted that Fidelity has continued to increase the resources devoted to non-U.S. offices, including expansion of Fidelity's global investment organization. The Board also noted that Fidelity's analysts have extensive resources, tools and capabilities that allow them to conduct sophisticated quantitative and fundamental analysis, as well as credit analysis of issuers, counterparties and guarantors. Further, the Board considered that Fidelity's investment professionals have sufficient access to global information and data so as to provide competitive investment results over time, and that those professionals also have access to sophisticated tools that permit them to assess portfolio construction and risk and performance attribution characteristics continuously, as well as to transmit new information and research conclusions rapidly around the world. Additionally, in its deliberations, the Board considered Fidelity's trading, risk management, compliance, and technology and operations capabilities and resources, which are integral parts of the investment management process. Administrative Services. The Board considered (i) the nature, extent, quality, and cost of advisory and administrative services performed by the Investment Advisers and their affiliates under the Advisory Contracts and under separate agreements covering transfer agency, pricing and bookkeeping, and securities lending services for the fund; (ii) the nature and extent of the supervision of third party service providers, principally custodians, subcustodians, and pricing vendors; and (iii) the resources devoted to, and the record of compliance with, the fund's compliance policies and procedures. The Board also reviewed the allocation of fund brokerage, including allocations to brokers affiliated with the Investment Advisers, and the use of "soft" commission dollars to pay for research services. Investment Performance. The Board considered whether the fund has operated in accordance with its investment objective, as well as its record of compliance with its investment restrictions. The Board reviewed the fund's absolute investment performance, as well as the fund's relative investment performance, but did not consider performance to be a material factor in its decision to renew the fund's Advisory Contracts, as the fund is not publicly offered as a stand-alone investment product. In this regard, the Board noted that the fund is designed to offer a liquid investment option for other investment companies managed by Fidelity and ultimately to enhance the performance of those investment companies.Based on its review, the Board concluded that the nature, extent, and quality of services provided to the fund under the Advisory Contracts should continue to benefit the shareholders of the fund. Competitiveness of Management Fee and Total Expense Ratio. The Board considered that while the fund does not pay a management fee, Fidelity Management & Research Company (FMR) pays a management fee on behalf of the fund and receives fees for providing services to funds that invest in the fund. The Board also noted that FMR bears all expenses of the fund with certain exceptions. Based on its review, the Board concluded that the management fee paid on behalf of the fund and the fund's total expense ratio were reasonable in light of the services that the fund and its shareholders receive and the other factors considered. Costs of the Services and Profitability. The Board considered the level of Fidelity's profits in respect of all the Fidelity funds, as well as the profitability of the funds that invest in the fund.PricewaterhouseCoopers LLP (PwC), auditor to Fidelity and certain Fidelity funds, has been engaged annually by the Board as part of the Board's assessment of Fidelity's profitability analysis. PwC's engagement includes the review and assessment of the methodologies used by Fidelity in determining the revenues and expenses attributable to Fidelity's mutual fund business, and completion of agreed-upon procedures in respect of the mathematical accuracy of the fund profitability information and its conformity to established allocation methodologies. After considering PwC's reports issued under the engagement and information provided by Fidelity, the Board concluded that while other allocation methods may also be reasonable, Fidelity's profitability methodologies are reasonable in all material respects.The Board also reviewed Fidelity's non-fund businesses and potential indirect benefits such businesses may have received as a result of their association with Fidelity's mutual fund business (i.e., fall-out benefits) as well as cases where Fidelity's affiliates may benefit from the fund's business. The Board noted that changes to fall-out benefits year-over-year reflect business developments at Fidelity's various businesses.The Board concluded that the costs of the services provided by and the profits realized by Fidelity in connection with the operation of the fund were not relevant to the renewal of the Advisory Contracts because the fund pays no advisory fees and FMR bears all expenses of the fund with certain exceptions. Economies of Scale. The Board concluded that because the fund pays no advisory fees and FMR bears all expenses of the fund with certain exceptions, the realization of economies of scale was not a material factor in the Board's decision to renew the fund's Advisory Contract. Additional Information Requested by the Board. In order to develop fully the factual basis for consideration of the Fidelity funds' advisory contracts, the Board requested and received additional information on certain topics, including: (i) fund performance trends, in particular the underperformance of certain funds, and Fidelity's long-term strategies for certain funds; (ii) Fidelity's fund profitability methodology, profitability trends for certain funds, and the impact of certain factors on fund profitability results; (iii) metrics for evaluating index fund and ETF performance and information about ETF trading characteristics; (iv) the methodology with respect to the evaluation of competitive fund data and peer group classifications and fee comparisons; (v) the expense structures for different funds and classes; (vi) information regarding other accounts managed by Fidelity, including collective investment trusts; and (vii) Fidelity's philosophies and strategies for evaluating funds and classes with lower or declining asset levels.Based on its evaluation of all of the conclusions noted above, and after considering all factors it believed relevant, the Board concluded that the advisory fee arrangements are fair and reasonable, and that the fund's Advisory Contracts should be renewed.
![]()
EMQ-SANN-0519
1.876936.110
|
Fidelity® Equity Sector Central Funds
Semi-Annual Report March 31, 2019 |
|
|
Beginning on January 1, 2021, as permitted by regulations adopted by the Securities and Exchange Commission, paper copies of a fund’s shareholder reports will no longer be sent by mail, unless you specifically request paper copies of the reports from the fund or from your financial intermediary, such as a financial advisor, broker-dealer or bank. Instead, the reports will be made available on a website, and you will be notified by mail each time a report is posted and provided with a website link to access the report.
If you already elected to receive shareholder reports electronically, you will not be affected by this change and you need not take any action. You may elect to receive shareholder reports and other communications from a fund electronically, by contacting your financial intermediary. For Fidelity customers, visit Fidelity's web site or call Fidelity using the contact information listed below.
You may elect to receive all future reports in paper free of charge. If you wish to continue receiving paper copies of your shareholder reports, you may contact your financial intermediary or, if you are a Fidelity customer, visit Fidelity’s website, or call Fidelity at the applicable toll-free number listed below. Your election to receive reports in paper will apply to all funds held with the fund complex/your financial intermediary.
| Account Type | Website | Phone Number |
| Brokerage, Mutual Fund, or Annuity Contracts: | fidelity.com/mailpreferences | 1-800-343-3548 |
| Employer Provided Retirement Accounts: | netbenefits.fidelity.com/preferences (choose 'no' under Required Disclosures to continue to print) | 1-800-343-0860 |
| Advisor Sold Accounts Serviced Through Your Financial Intermediary: | Contact Your Financial Intermediary | Your Financial Intermediary's phone number |
| Advisor Sold Accounts Serviced by Fidelity: | institutional.fidelity.com | 1-877-208-0098 |
Contents
|
Fidelity® Communication Services Central Fund | |
|
Fidelity® Consumer Discretionary Central Fund | |
|
Fidelity® Consumer Staples Central Fund | |
|
Fidelity® Energy Central Fund | |
|
Fidelity® Financials Central Fund | |
|
Fidelity® Health Care Central Fund | |
|
Fidelity® Industrials Central Fund | |
|
Fidelity® Information Technology Central Fund | |
|
Fidelity® Materials Central Fund | |
|
Fidelity® Real Estate Equity Central Fund | |
|
Fidelity® Utilities Central Fund | |
|
Board Approval of Investment Advisory Contracts and Management Fees |
To view a fund's proxy voting guidelines and proxy voting record for the 12-month period ended June 30, visit http://www.fidelity.com/proxyvotingresults or visit the Securities and Exchange Commission's (SEC) web site at http://www.sec.gov.
You may also call 1-800-544-8544 to request a free copy of the proxy voting guidelines.
Standard & Poor's, S&P and S&P 500 are registered service marks of The McGraw-Hill Companies, Inc. and have been licensed for use by Fidelity Distributors Corporation.
Other third-party marks appearing herein are the property of their respective owners.
All other marks appearing herein are registered or unregistered trademarks or service marks of FMR LLC or an affiliated company. © 2019 FMR LLC. All rights reserved.
A fund files its complete schedule of portfolio holdings with the SEC for the first and third quarters of each fiscal year on Form N-PORT. Forms N-PORT are available on the SEC’s web site at http://www.sec.gov. A fund's Forms N-PORT may be reviewed and copied at the SEC’s Public Reference Room in Washington, DC. Information regarding the operation of the SEC's Public Reference Room may be obtained by calling 1-800-SEC-0330.
Fidelity® Communication Services Central Fund
Investment Summary (Unaudited)
Top Ten Stocks as of March 31, 2019
| % of fund's net assets | |
| Alphabet, Inc. Class A | 24.7 |
| Facebook, Inc. Class A | 12.8 |
| The Walt Disney Co. | 6.8 |
| Comcast Corp. Class A | 5.0 |
| Netflix, Inc. | 4.8 |
| Activision Blizzard, Inc. | 4.5 |
| Electronic Arts, Inc. | 3.7 |
| T-Mobile U.S., Inc. | 3.1 |
| Verizon Communications, Inc. | 2.6 |
| Twitter, Inc. | 2.2 |
| 70.2 |
Top Industries (% of fund's net assets)
| As of March 31, 2019 | ||
| Interactive Media & Services | 42.5% | |
| Entertainment | 24.4% | |
| Media | 17.1% | |
| Diversified Telecommunication Services | 9.6% | |
| Wireless Telecommunication Services | 3.5% | |
| All Others* | 2.9% | |
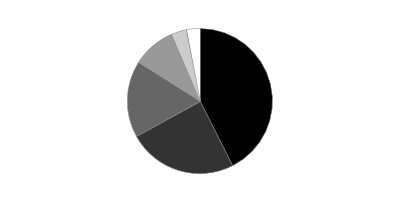
* Includes short-term investments and net other assets (liabilities).
Fidelity® Communication Services Central Fund
Schedule of Investments March 31, 2019 (Unaudited)
Showing Percentage of Net Assets
| Common Stocks - 99.7% | |||
| Shares | Value | ||
| Diversified Telecommunication Services - 9.6% | |||
| Alternative Carriers - 3.5% | |||
| CenturyLink, Inc. | 448,400 | $5,376,316 | |
| Cogent Communications Group, Inc. | 160,746 | 8,720,471 | |
| Iliad SA | 52,511 | 5,271,927 | |
| Iridium Communications, Inc. (a) | 749,914 | 19,827,726 | |
| ORBCOMM, Inc. (a) | 508,167 | 3,445,372 | |
| Vonage Holdings Corp. (a) | 776,241 | 7,793,460 | |
| Zayo Group Holdings, Inc. (a) | 236,626 | 6,724,911 | |
| 57,160,183 | |||
| Integrated Telecommunication Services - 6.1% | |||
| AT&T, Inc. | 1,092,348 | 34,256,033 | |
| Atn International, Inc. | 61,714 | 3,480,052 | |
| Cincinnati Bell, Inc. (a) | 405,263 | 3,866,209 | |
| Masmovil Ibercom SA (a) | 677,025 | 14,308,091 | |
| Verizon Communications, Inc. | 705,800 | 41,733,954 | |
| 97,644,339 | |||
| TOTAL DIVERSIFIED TELECOMMUNICATION SERVICES | 154,804,522 | ||
| Entertainment - 24.4% | |||
| Interactive Home Entertainment - 11.0% | |||
| Activision Blizzard, Inc. | 1,599,359 | 72,818,815 | |
| Electronic Arts, Inc. (a) | 584,115 | 59,363,607 | |
| Take-Two Interactive Software, Inc. (a) | 324,965 | 30,666,947 | |
| Zynga, Inc. (a) | 2,728,100 | 14,540,773 | |
| 177,390,142 | |||
| Movies & Entertainment - 13.4% | |||
| Lions Gate Entertainment Corp. Class B | 334,500 | 5,050,950 | |
| Live Nation Entertainment, Inc. (a) | 71,800 | 4,562,172 | |
| Netflix, Inc. (a) | 216,579 | 77,223,408 | |
| The Walt Disney Co. | 999,042 | 110,923,633 | |
| World Wrestling Entertainment, Inc. Class A | 227,644 | 19,754,946 | |
| 217,515,109 | |||
| TOTAL ENTERTAINMENT | 394,905,251 | ||
| Hotels, Restaurants & Leisure - 1.5% | |||
| Casinos & Gaming - 1.5% | |||
| Sea Ltd. ADR (a)(b) | 1,030,200 | 24,230,304 | |
| Interactive Media & Services - 42.5% | |||
| Interactive Media & Services - 42.5% | |||
| Alphabet, Inc. Class A (a) | 339,100 | 399,083,399 | |
| Facebook, Inc. Class A (a) | 1,246,875 | 207,841,594 | |
| Match Group, Inc. (b) | 111,800 | 6,328,998 | |
| Momo, Inc. ADR | 735,500 | 28,125,520 | |
| TripAdvisor, Inc. (a) | 125,200 | 6,441,540 | |
| Twitter, Inc. (a) | 1,073,000 | 35,280,240 | |
| Zillow Group, Inc. Class A (a) | 143,900 | 4,921,380 | |
| 688,022,671 | |||
| Internet & Direct Marketing Retail - 1.1% | |||
| Internet & Direct Marketing Retail - 1.1% | |||
| Alibaba Group Holding Ltd. sponsored ADR (a) | 101,000 | 18,427,450 | |
| Media - 17.1% | |||
| Broadcasting - 3.3% | |||
| Discovery Communications, Inc. Class C (non-vtg.) (a) | 647,900 | 16,469,618 | |
| Fox Corp. Class B (a) | 185,850 | 6,668,298 | |
| Liberty Media Corp.: | |||
| Liberty Media Class A (a) | 711,778 | 24,228,923 | |
| Liberty SiriusXM Series A (a) | 149,900 | 5,723,182 | |
| 53,090,021 | |||
| Cable & Satellite - 12.4% | |||
| Altice U.S.A., Inc. Class A | 303,572 | 6,520,727 | |
| Charter Communications, Inc. Class A (a) | 47,337 | 16,421,679 | |
| Comcast Corp. Class A | 2,015,771 | 80,590,525 | |
| DISH Network Corp. Class A (a) | 262,600 | 8,321,794 | |
| GCI Liberty, Inc. (a) | 396,103 | 22,027,288 | |
| Liberty Broadband Corp. Class A (a) | 359,700 | 32,962,908 | |
| Liberty Global PLC Class C (a) | 1,029,564 | 24,925,744 | |
| Liberty Latin America Ltd. Class C (a) | 345,897 | 6,727,697 | |
| Sirius XM Holdings, Inc. | 270,864 | 1,535,799 | |
| 200,034,161 | |||
| Publishing - 1.4% | |||
| The New York Times Co. Class A | 687,700 | 22,590,945 | |
| TOTAL MEDIA | 275,715,127 | ||
| Wireless Telecommunication Services - 3.5% | |||
| Wireless Telecommunication Services - 3.5% | |||
| Boingo Wireless, Inc. (a) | 297,800 | 6,932,784 | |
| T-Mobile U.S., Inc. (a) | 720,415 | 49,780,677 | |
| 56,713,461 | |||
| TOTAL COMMON STOCKS | |||
| (Cost $1,462,579,910) | 1,612,818,786 | ||
| Money Market Funds - 1.6% | |||
| Fidelity Cash Central Fund, 2.48% (c) | 5,837,530 | 5,838,697 | |
| Fidelity Securities Lending Cash Central Fund 2.48% (c)(d) | 19,962,997 | 19,964,993 | |
| TOTAL MONEY MARKET FUNDS | |||
| (Cost $25,803,690) | 25,803,690 | ||
| TOTAL INVESTMENT IN SECURITIES - 101.3% | |||
| (Cost $1,488,383,600) | 1,638,622,476 | ||
| NET OTHER ASSETS (LIABILITIES) - (1.3)% | (20,598,706) | ||
| NET ASSETS - 100% | $1,618,023,770 |
Legend
(a) Non-income producing
(b) Security or a portion of the security is on loan at period end.
(c) Affiliated fund that is generally available only to investment companies and other accounts managed by Fidelity Investments. The rate quoted is the annualized seven-day yield of the fund at period end. A complete unaudited listing of the fund's holdings as of its most recent quarter end is available upon request. In addition, each Fidelity Central Fund's financial statements are available on the SEC's website or upon request.
(d) Investment made with cash collateral received from securities on loan.
Affiliated Central Funds
Information regarding fiscal year to date income earned by the Fund from investments in Fidelity Central Funds is as follows:
| Fund | Income earned |
| Fidelity Cash Central Fund | $103,072 |
| Fidelity Securities Lending Cash Central Fund | 40,157 |
| Total | $143,229 |
Amounts in the income column in the above table include any capital gain distributions from underlying funds, which are presented in the corresponding line-item in the Statement of Operations, if applicable.
Investment Valuation
All investments are categorized as Level 1 under the Fair Value Hierarchy. The inputs or methodology used for valuing securities may not be an indication of the risk associated with investing in those securities. For more information on valuation inputs please refer to the Investment Valuation section in the accompanying Notes to Financial Statements.
See accompanying notes which are an integral part of the financial statements.
Fidelity® Communication Services Central Fund
Financial Statements
Statement of Assets and Liabilities
| March 31, 2019 (Unaudited) | ||
| Assets | ||
| Investment in securities, at value (including securities loaned of $19,508,106) — See accompanying schedule: Unaffiliated issuers (cost $1,462,579,910) | $1,612,818,786 | |
| Fidelity Central Funds (cost $25,803,690) | 25,803,690 | |
| Total Investment in Securities (cost $1,488,383,600) | $1,638,622,476 | |
| Receivable for fund shares sold | 193,420 | |
| Dividends receivable | 617,427 | |
| Distributions receivable from Fidelity Central Funds | 22,251 | |
| Total assets | 1,639,455,574 | |
| Liabilities | ||
| Payable for fund shares redeemed | $1,456,162 | |
| Other payables and accrued expenses | 10,649 | |
| Collateral on securities loaned | 19,964,993 | |
| Total liabilities | 21,431,804 | |
| Net Assets | $1,618,023,770 | |
| Net Assets consist of: | ||
| Paid in capital | $1,474,265,979 | |
| Total distributable earnings (loss) | 143,757,791 | |
| Net Assets, for 8,284,148 shares outstanding | $1,618,023,770 | |
| Net Asset Value, offering price and redemption price per share ($1,618,023,770 ÷ 8,284,148 shares) | $195.32 |
See accompanying notes which are an integral part of the financial statements.
Statement of Operations
| Six months ended March 31, 2019 (Unaudited) | ||
| Investment Income | ||
| Dividends | $6,189,328 | |
| Income from Fidelity Central Funds | 143,229 | |
| Total income | 6,332,557 | |
| Expenses | ||
| Custodian fees and expenses | $13,098 | |
| Independent directors' fees and expenses | 2,511 | |
| Interest | 7,343 | |
| Total expenses | 22,952 | |
| Net investment income (loss) | 6,309,605 | |
| Realized and Unrealized Gain (Loss) | ||
| Net realized gain (loss) on: | ||
| Investment securities: | ||
| Unaffiliated issuers | (1,091,658) | |
| Fidelity Central Funds | 1,216 | |
| Foreign currency transactions | (108,300) | |
| Total net realized gain (loss) | (1,198,742) | |
| Change in net unrealized appreciation (depreciation) on: | ||
| Investment securities: | ||
| Unaffiliated issuers | 94,939,068 | |
| Fidelity Central Funds | (702) | |
| Assets and liabilities in foreign currencies | 57 | |
| Total change in net unrealized appreciation (depreciation) | 94,938,423 | |
| Net gain (loss) | 93,739,681 | |
| Net increase (decrease) in net assets resulting from operations | $100,049,286 |
See accompanying notes which are an integral part of the financial statements.
Statement of Changes in Net Assets
| Six months ended March 31, 2019 (Unaudited) | Year ended September 30, 2018 | |
| Increase (Decrease) in Net Assets | ||
| Operations | ||
| Net investment income (loss) | $6,309,605 | $10,697,283 |
| Net realized gain (loss) | (1,198,742) | 35,399,047 |
| Change in net unrealized appreciation (depreciation) | 94,938,423 | (18,539,736) |
| Net increase (decrease) in net assets resulting from operations | 100,049,286 | 27,556,594 |
| Distributions to shareholders | (5,873,665) | – |
| Distributions to shareholders from net investment income | – | (12,286,003) |
| Distributions to shareholders from net realized gain | – | (31,019,369) |
| Total distributions | (5,873,665) | (43,305,372) |
| Affiliated share transactions | ||
| Proceeds from sales of shares | 1,195,261,593 | 136,943,118 |
| Reinvestment of distributions | 5,873,665 | 43,305,372 |
| Cost of shares redeemed | (84,682,507) | (136,671,112) |
| Net increase (decrease) in net assets resulting from share transactions | 1,116,452,751 | 43,577,378 |
| Total increase (decrease) in net assets | 1,210,628,372 | 27,828,600 |
| Net Assets | ||
| Beginning of period | 407,395,398 | 379,566,798 |
| End of period | $1,618,023,770 | $407,395,398 |
| Other Information | ||
| Shares | ||
| Sold | 6,547,551 | 777,149 |
| Issued in reinvestment of distributions | 33,262 | 239,963 |
| Redeemed | (458,055) | (763,009) |
| Net increase (decrease) | 6,122,758 | 254,103 |
See accompanying notes which are an integral part of the financial statements.
Financial Highlights
Fidelity Communication Services Central Fund
| Six months ended (Unaudited) March 31, | Years endedSeptember 30, | |||||
| 2019 | 2018 | 2017 | 2016 | 2015 | 2014 | |
| Selected Per–Share Data | ||||||
| Net asset value, beginning of period | $188.49 | $199.01 | $191.47 | $155.23 | $163.86 | $155.95 |
| Income from Investment Operations | ||||||
| Net investment income (loss)A | 1.01 | 5.12B | 4.88 | 4.49 | 3.75 | 7.09C |
| Net realized and unrealized gain (loss) | 7.28 | 7.10 | 9.03 | 36.05 | (8.58) | 7.91 |
| Total from investment operations | 8.29 | 12.22 | 13.91 | 40.54 | (4.83) | 15.00 |
| Distributions from net investment income | (1.39) | (5.99) | (4.62) | (4.30) | (3.80) | (7.09) |
| Distributions from net realized gain | (.07) | (16.75) | (1.76) | – | – | – |
| Total distributions | (1.46) | (22.74) | (6.37)D | (4.30) | (3.80) | (7.09) |
| Net asset value, end of period | $195.32 | $188.49 | $199.01 | $191.47 | $155.23 | $163.86 |
| Total ReturnE,F | 4.47% | 6.95% | 7.41% | 26.33% | (3.10)% | 9.75% |
| Ratios to Average Net AssetsG,H | ||||||
| Expenses before reductions | - %I,J | - %J | .01% | .01% | - %J | .01% |
| Expenses net of fee waivers, if any | - %I,J | - %J | .01% | .01% | - %J | .01% |
| Expenses net of all reductions | - %I,J | - %J | .01% | .01% | - %J | .01% |
| Net investment income (loss) | 1.11%I | 2.84%B | 2.48% | 2.51% | 2.24% | 4.35%C |
| Supplemental Data | ||||||
| Net assets, end of period (000 omitted) | $1,618,024 | $407,395 | $379,567 | $384,097 | $277,097 | $286,592 |
| Portfolio turnover rateK | 162%I,L | 75%L | 75%L | 68% | 58% | 97%L |
A Calculated based on average shares outstanding during the period.
B Net investment income per share reflects a large, non-recurring dividend which amounted to $1.20 per share. Excluding this non-recurring dividend, the ratio of net investment income (loss) to average net assets would have been 2.18%.
C Net investment income per share reflects a large, non-recurring dividend which amounted to $3.06 per share. Excluding this non-recurring dividend, the ratio of net investment income (loss) to average net assets would have been 2.51%.
D Total distributions of $6.37 per share is comprised of distributions from net investment income of $4.618 and distributions from net realized gain of $1.755 per share.
E Total returns for periods of less than one year are not annualized.
F Total returns would have been lower if certain expenses had not been reduced during the applicable periods shown.
G Fees and expenses of any underlying Fidelity Central Funds are not included in the Fund's expense ratio. The Fund indirectly bears its proportionate share of the expenses of any underlying Fidelity Central Funds.
H Expense ratios reflect operating expenses of the Fund. Expenses before reductions do not reflect amounts reimbursed by the investment adviser or reductions from expense offset arrangements and do not represent the amount paid by the Fund during periods when reimbursements or reductions occur. Expenses net of fee waivers reflect expenses after reimbursement by the investment adviser but prior to reductions from expense offset arrangements. Expenses net of all reductions represent the net expenses paid by the Fund.
I Annualized
J Amount represents less than .005%.
K Amount does not include the portfolio activity of any underlying Fidelity Central Funds.
L Portfolio turnover rate excludes securities received or delivered in-kind.
See accompanying notes which are an integral part of the financial statements.
Fidelity® Consumer Discretionary Central Fund
Investment Summary (Unaudited)
Top Ten Stocks as of March 31, 2019
| % of fund's net assets | |
| Amazon.com, Inc. | 24.3 |
| Home Depot, Inc. | 8.5 |
| McDonald's Corp. | 4.9 |
| Lowe's Companies, Inc. | 4.6 |
| TJX Companies, Inc. | 3.4 |
| The Booking Holdings, Inc. | 3.2 |
| Dollar Tree, Inc. | 3.1 |
| Burlington Stores, Inc. | 3.1 |
| Royal Caribbean Cruises Ltd. | 2.7 |
| Ross Stores, Inc. | 2.4 |
| 60.2 |
Top Industries (% of fund's net assets)
| As of March 31, 2019 | ||
| Specialty Retail | 28.3% | |
| Internet & Direct Marketing Retail | 27.7% | |
| Hotels, Restaurants & Leisure | 20.7% | |
| Textiles, Apparel & Luxury Goods | 7.3% | |
| Multiline Retail | 5.9% | |
| All Others* | 10.1% | |
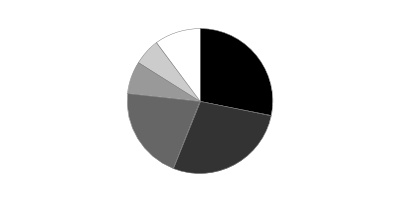
* Includes short-term investments and net other assets (liabilities).
Fidelity® Consumer Discretionary Central Fund
Schedule of Investments March 31, 2019 (Unaudited)
Showing Percentage of Net Assets
| Common Stocks - 98.5% | |||
| Shares | Value | ||
| Auto Components - 0.2% | |||
| Auto Parts & Equipment - 0.2% | |||
| Lear Corp. | 29,669 | $4,026,380 | |
| Automobiles - 0.2% | |||
| Automobile Manufacturers - 0.2% | |||
| Ferrari NV | 34,195 | 4,575,291 | |
| Beverages - 0.4% | |||
| Distillers & Vintners - 0.4% | |||
| Constellation Brands, Inc. Class A (sub. vtg.) | 40,635 | 7,124,535 | |
| Commercial Services & Supplies - 0.2% | |||
| Diversified Support Services - 0.2% | |||
| Copart, Inc. (a) | 70,200 | 4,253,418 | |
| Distributors - 0.6% | |||
| Distributors - 0.6% | |||
| LKQ Corp. (a) | 288,300 | 8,181,954 | |
| Pool Corp. | 23,000 | 3,794,310 | |
| 11,976,264 | |||
| Diversified Consumer Services - 1.2% | |||
| Education Services - 1.2% | |||
| Grand Canyon Education, Inc. (a) | 167,030 | 19,126,605 | |
| New Oriental Education & Technology Group, Inc. sponsored ADR (a) | 38,900 | 3,504,501 | |
| 22,631,106 | |||
| Entertainment - 0.4% | |||
| Movies & Entertainment - 0.4% | |||
| Live Nation Entertainment, Inc. (a) | 34,200 | 2,173,068 | |
| Netflix, Inc. (a) | 10,900 | 3,886,504 | |
| World Wrestling Entertainment, Inc. Class A | 23,400 | 2,030,652 | |
| 8,090,224 | |||
| Food & Staples Retailing - 1.2% | |||
| Food Distributors - 0.5% | |||
| Performance Food Group Co. (a) | 234,875 | 9,310,445 | |
| Hypermarkets & Super Centers - 0.7% | |||
| BJ's Wholesale Club Holdings, Inc. | 306,200 | 8,389,880 | |
| Walmart, Inc. | 48,400 | 4,720,452 | |
| 13,110,332 | |||
| TOTAL FOOD & STAPLES RETAILING | 22,420,777 | ||
| Hotels, Restaurants & Leisure - 20.7% | |||
| Casinos & Gaming - 1.0% | |||
| Boyd Gaming Corp. | 217,700 | 5,956,272 | |
| Churchill Downs, Inc. | 31,200 | 2,816,112 | |
| Eldorado Resorts, Inc. (a) | 235,483 | 10,994,701 | |
| 19,767,085 | |||
| Hotels, Resorts & Cruise Lines - 8.2% | |||
| Hilton Grand Vacations, Inc. (a) | 264,900 | 8,172,165 | |
| Hilton Worldwide Holdings, Inc. | 334,126 | 27,769,212 | |
| Marriott International, Inc. Class A | 300,508 | 37,590,546 | |
| Marriott Vacations Worldwide Corp. | 146,077 | 13,658,200 | |
| Royal Caribbean Cruises Ltd. | 455,128 | 52,166,771 | |
| Wyndham Destinations, Inc. | 228,458 | 9,250,264 | |
| Wyndham Hotels & Resorts, Inc. | 179,043 | 8,950,360 | |
| 157,557,518 | |||
| Leisure Facilities - 1.6% | |||
| Drive Shack, Inc. (a) | 524,417 | 2,354,632 | |
| Planet Fitness, Inc. (a) | 242,363 | 16,655,185 | |
| Vail Resorts, Inc. | 54,009 | 11,736,156 | |
| 30,745,973 | |||
| Restaurants - 9.9% | |||
| ARAMARK Holdings Corp. | 435,864 | 12,879,781 | |
| Chipotle Mexican Grill, Inc. (a) | 18,900 | 13,424,859 | |
| Darden Restaurants, Inc. | 36,900 | 4,482,243 | |
| Del Frisco's Restaurant Group, Inc. (a) | 120,800 | 774,328 | |
| Domino's Pizza, Inc. | 74,220 | 19,156,182 | |
| Dunkin' Brands Group, Inc. | 1,196 | 89,820 | |
| McDonald's Corp. | 502,130 | 95,354,487 | |
| Restaurant Brands International, Inc. | 166,400 | 10,825,619 | |
| U.S. Foods Holding Corp. (a) | 302,600 | 10,563,766 | |
| Yum! Brands, Inc. | 231,527 | 23,108,710 | |
| 190,659,795 | |||
| TOTAL HOTELS, RESTAURANTS & LEISURE | 398,730,371 | ||
| Household Durables - 2.6% | |||
| Homebuilding - 2.6% | |||
| Cavco Industries, Inc. (a) | 24,346 | 2,861,385 | |
| D.R. Horton, Inc. | 459,700 | 19,022,386 | |
| Lennar Corp. Class A | 306,550 | 15,048,540 | |
| NVR, Inc. (a) | 4,990 | 13,807,330 | |
| 50,739,641 | |||
| Interactive Media & Services - 0.7% | |||
| Interactive Media & Services - 0.7% | |||
| Alphabet, Inc. Class A (a) | 11,400 | 13,416,546 | |
| Internet & Direct Marketing Retail - 27.7% | |||
| Internet & Direct Marketing Retail - 27.7% | |||
| Amazon.com, Inc. (a) | 262,827 | 468,029,181 | |
| The Booking Holdings, Inc. (a) | 35,857 | 62,567,238 | |
| Wayfair LLC Class A (a) | 20,500 | 3,043,225 | |
| 533,639,644 | |||
| IT Services - 0.3% | |||
| Data Processing & Outsourced Services - 0.3% | |||
| PayPal Holdings, Inc. (a) | 53,900 | 5,596,976 | |
| Leisure Products - 0.1% | |||
| Leisure Products - 0.1% | |||
| OneSpaWorld Holdings Ltd. (a) | 179,239 | 2,448,405 | |
| Multiline Retail - 5.9% | |||
| General Merchandise Stores - 5.9% | |||
| B&M European Value Retail SA | 343,643 | 1,672,151 | |
| Dollar General Corp. | 369,380 | 44,067,034 | |
| Dollar Tree, Inc. (a) | 575,453 | 60,445,583 | |
| Ollie's Bargain Outlet Holdings, Inc. (a) | 100,100 | 8,541,533 | |
| 114,726,301 | |||
| Software - 0.3% | |||
| Application Software - 0.3% | |||
| 2U, Inc. (a) | 69,177 | 4,901,190 | |
| Specialty Retail - 28.3% | |||
| Apparel Retail - 9.6% | |||
| Burlington Stores, Inc. (a) | 380,619 | 59,635,385 | |
| Ross Stores, Inc. | 498,669 | 46,426,084 | |
| The Children's Place Retail Stores, Inc. | 125,476 | 12,206,305 | |
| TJX Companies, Inc. | 1,237,573 | 65,851,259 | |
| 184,119,033 | |||
| Automotive Retail - 2.9% | |||
| AutoZone, Inc. (a) | 21,074 | 21,582,305 | |
| Monro, Inc. | 71,500 | 6,186,180 | |
| O'Reilly Automotive, Inc. (a) | 73,168 | 28,411,134 | |
| 56,179,619 | |||
| Computer & Electronics Retail - 0.7% | |||
| Best Buy Co., Inc. | 198,300 | 14,091,198 | |
| Home Improvement Retail - 13.4% | |||
| Floor & Decor Holdings, Inc. Class A (a) | 142,944 | 5,892,152 | |
| Home Depot, Inc. | 856,741 | 164,400,030 | |
| Lowe's Companies, Inc. | 808,419 | 88,497,628 | |
| 258,789,810 | |||
| Specialty Stores - 1.7% | |||
| Dick's Sporting Goods, Inc. | 67,900 | 2,499,399 | |
| Five Below, Inc. (a) | 52,500 | 6,523,125 | |
| Ulta Beauty, Inc. (a) | 65,400 | 22,806,942 | |
| 31,829,466 | |||
| TOTAL SPECIALTY RETAIL | 545,009,126 | ||
| Technology Hardware, Storage & Peripherals - 0.2% | |||
| Technology Hardware, Storage & Peripherals - 0.2% | |||
| Apple, Inc. | 22,200 | 4,216,890 | |
| Textiles, Apparel & Luxury Goods - 7.3% | |||
| Apparel, Accessories & Luxury Goods - 5.2% | |||
| Canada Goose Holdings, Inc. (a) | 68,683 | 3,298,593 | |
| Capri Holdings Ltd. (a) | 264,825 | 12,115,744 | |
| Carter's, Inc. | 57,700 | 5,815,583 | |
| G-III Apparel Group Ltd. (a) | 42,643 | 1,704,014 | |
| Kering SA | 7,217 | 4,138,506 | |
| lululemon athletica, Inc. (a) | 11,900 | 1,950,053 | |
| LVMH Moet Hennessy - Louis Vuitton SA | 17,486 | 6,440,683 | |
| PVH Corp. | 264,805 | 32,292,970 | |
| Tapestry, Inc. | 537,130 | 17,451,354 | |
| VF Corp. | 172,700 | 15,009,357 | |
| 100,216,857 | |||
| Footwear - 2.1% | |||
| NIKE, Inc. Class B | 462,156 | 38,918,157 | |
| Puma AG | 3,309 | 1,919,037 | |
| 40,837,194 | |||
| TOTAL TEXTILES, APPAREL & LUXURY GOODS | 141,054,051 | ||
| TOTAL COMMON STOCKS | |||
| (Cost $1,363,344,330) | 1,899,577,136 | ||
| Money Market Funds - 1.0% | |||
| Fidelity Cash Central Fund, 2.48% (b) | 16,847,561 | 16,850,931 | |
| Fidelity Securities Lending Cash Central Fund 2.48% (b)(c) | 2,842,606 | 2,842,890 | |
| TOTAL MONEY MARKET FUNDS | |||
| (Cost $19,693,821) | 19,693,821 | ||
| TOTAL INVESTMENT IN SECURITIES - 99.5% | |||
| (Cost $1,383,038,151) | 1,919,270,957 | ||
| NET OTHER ASSETS (LIABILITIES) - 0.5% | 9,381,623 | ||
| NET ASSETS - 100% | $1,928,652,580 |
Legend
(a) Non-income producing
(b) Affiliated fund that is generally available only to investment companies and other accounts managed by Fidelity Investments. The rate quoted is the annualized seven-day yield of the fund at period end. A complete unaudited listing of the fund's holdings as of its most recent quarter end is available upon request. In addition, each Fidelity Central Fund's financial statements are available on the SEC's website or upon request.
(c) Investment made with cash collateral received from securities on loan.
Affiliated Central Funds
Information regarding fiscal year to date income earned by the Fund from investments in Fidelity Central Funds is as follows:
| Fund | Income earned |
| Fidelity Cash Central Fund | $39,134 |
| Fidelity Securities Lending Cash Central Fund | 39,486 |
| Total | $78,620 |
Amounts in the income column in the above table include any capital gain distributions from underlying funds, which are presented in the corresponding line-item in the Statement of Operations, if applicable.
Investment Valuation
The following is a summary of the inputs used, as of March 31, 2019, involving the Fund's assets and liabilities carried at fair value. The inputs or methodology used for valuing securities may not be an indication of the risk associated with investing in those securities. For more information on valuation inputs, and their aggregation into the levels used below, please refer to the Investment Valuation section in the accompanying Notes to Financial Statements.
| Valuation Inputs at Reporting Date: | ||||
| Description | Total | Level 1 | Level 2 | Level 3 |
| Investments in Securities: | ||||
| Common Stocks | $1,899,577,136 | $1,893,136,453 | $6,440,683 | $-- |
| Money Market Funds | 19,693,821 | 19,693,821 | -- | -- |
| Total Investments in Securities: | $1,919,270,957 | $1,912,830,274 | $6,440,683 | $-- |
See accompanying notes which are an integral part of the financial statements.
Fidelity® Consumer Discretionary Central Fund
Financial Statements
Statement of Assets and Liabilities
| March 31, 2019 (Unaudited) | ||
| Assets | ||
| Investment in securities, at value — See accompanying schedule: Unaffiliated issuers (cost $1,363,344,330) | $1,899,577,136 | |
| Fidelity Central Funds (cost $19,693,821) | 19,693,821 | |
| Total Investment in Securities (cost $1,383,038,151) | $1,919,270,957 | |
| Foreign currency held at value (cost $2,387) | 2,399 | |
| Receivable for investments sold | 21,444,105 | |
| Receivable for fund shares sold | 226,101 | |
| Dividends receivable | 974,161 | |
| Distributions receivable from Fidelity Central Funds | 16,024 | |
| Total assets | 1,941,933,747 | |
| Liabilities | ||
| Payable to custodian bank | $3,927,587 | |
| Payable for investments purchased | 4,926,666 | |
| Payable for fund shares redeemed | 1,573,490 | |
| Other payables and accrued expenses | 13,294 | |
| Collateral on securities loaned | 2,840,130 | |
| Total liabilities | 13,281,167 | |
| Net Assets | $1,928,652,580 | |
| Net Assets consist of: | ||
| Paid in capital | $1,268,402,495 | |
| Total distributable earnings (loss) | 660,250,085 | |
| Net Assets, for 5,880,804 shares outstanding | $1,928,652,580 | |
| Net Asset Value, offering price and redemption price per share ($1,928,652,580 ÷ 5,880,804 shares) | $327.96 |
See accompanying notes which are an integral part of the financial statements.
Statement of Operations
| Six months ended March 31, 2019 (Unaudited) | ||
| Investment Income | ||
| Dividends | $10,067,770 | |
| Income from Fidelity Central Funds | 78,620 | |
| Total income | 10,146,390 | |
| Expenses | ||
| Custodian fees and expenses | $21,053 | |
| Independent directors' fees and expenses | 6,198 | |
| Interest | 14,433 | |
| Total expenses | 41,684 | |
| Net investment income (loss) | 10,104,706 | |
| Realized and Unrealized Gain (Loss) | ||
| Net realized gain (loss) on: | ||
| Investment securities: | ||
| Unaffiliated issuers | 13,092,526 | |
| Redemptions in-kind with affiliated entities | 108,561,478 | |
| Fidelity Central Funds | 269 | |
| Foreign currency transactions | 22,148 | |
| Total net realized gain (loss) | 121,676,421 | |
| Change in net unrealized appreciation (depreciation) on: | ||
| Investment securities: | ||
| Unaffiliated issuers | (216,807,149) | |
| Assets and liabilities in foreign currencies | (664) | |
| Total change in net unrealized appreciation (depreciation) | (216,807,813) | |
| Net gain (loss) | (95,131,392) | |
| Net increase (decrease) in net assets resulting from operations | $(85,026,686) |
See accompanying notes which are an integral part of the financial statements.
Statement of Changes in Net Assets
| Six months ended March 31, 2019 (Unaudited) | Year ended September 30, 2018 | |
| Increase (Decrease) in Net Assets | ||
| Operations | ||
| Net investment income (loss) | $10,104,706 | $20,991,740 |
| Net realized gain (loss) | 121,676,421 | 253,197,582 |
| Change in net unrealized appreciation (depreciation) | (216,807,813) | 282,666,572 |
| Net increase (decrease) in net assets resulting from operations | (85,026,686) | 556,855,894 |
| Distributions to shareholders | (70,027,618) | – |
| Distributions to shareholders from net investment income | – | (19,605,261) |
| Distributions to shareholders from net realized gain | – | (92,369,304) |
| Total distributions | (70,027,618) | (111,974,565) |
| Affiliated share transactions | ||
| Proceeds from sales of shares | 60,013,671 | 836,759,194 |
| Reinvestment of distributions | 70,027,618 | 111,974,565 |
| Cost of shares redeemed | (461,252,142) | (560,440,844) |
| Net increase (decrease) in net assets resulting from share transactions | (331,210,853) | 388,292,915 |
| Total increase (decrease) in net assets | (486,265,157) | 833,174,244 |
| Net Assets | ||
| Beginning of period | 2,414,917,737 | 1,581,743,493 |
| End of period | $1,928,652,580 | $2,414,917,737 |
| Other Information | ||
| Undistributed net investment income end of period | $3,152,954 | |
| Shares | ||
| Sold | 193,572 | 2,718,976 |
| Issued in reinvestment of distributions | 245,599 | 373,136 |
| Redeemed | (1,446,455) | (1,778,344) |
| Net increase (decrease) | (1,007,284) | 1,313,768 |
See accompanying notes which are an integral part of the financial statements.
Financial Highlights
Fidelity Consumer Discretionary Central Fund
| Six months ended (Unaudited) March 31, | Years endedSeptember 30, | |||||
| 2019 | 2018 | 2017 | 2016 | 2015 | 2014 | |
| Selected Per–Share Data | ||||||
| Net asset value, beginning of period | $350.59 | $283.76 | $248.76 | $234.10 | $213.75 | $196.26 |
| Income from Investment Operations | ||||||
| Net investment income (loss)A | 1.60 | 3.24 | 3.14 | 3.75 | 3.36 | 2.23 |
| Net realized and unrealized gain (loss) | (12.44) | 82.54 | 34.62 | 14.67 | 20.24 | 17.43 |
| Total from investment operations | (10.84) | 85.78 | 37.76 | 18.42 | 23.60 | 19.66 |
| Distributions from net investment income | (1.55) | (3.08)B | (2.76) | (3.76) | (3.25) | (2.17) |
| Distributions from net realized gain | (10.23) | (15.86)B | – | – | – | – |
| Total distributions | (11.79)C | (18.95)D | (2.76) | (3.76) | (3.25) | (2.17) |
| Net asset value, end of period | $327.96 | $350.59 | $283.76 | $248.76 | $234.10 | $213.75 |
| Total ReturnE,F | (2.58)% | 31.42% | 15.25% | 7.91% | 11.01% | 10.03% |
| Ratios to Average Net AssetsG,H | ||||||
| Expenses before reductionsI | - %J | -% | -% | -% | -% | -% |
| Expenses net of fee waivers, if anyI | - %J | -% | -% | -% | -% | -% |
| Expenses net of all reductionsI | - %J | -% | -% | -% | -% | -% |
| Net investment income (loss) | 1.02%J | 1.02% | 1.17% | 1.54% | 1.41% | 1.06% |
| Supplemental Data | ||||||
| Net assets, end of period (000 omitted) | $1,928,653 | $2,414,918 | $1,581,743 | $1,579,033 | $1,487,901 | $1,431,901 |
| Portfolio turnover rateK | 52%J,L | 26%L | 40%L | 27% | 68% | 169%L |
A Calculated based on average shares outstanding during the period.
B The amounts shown reflect certain reclassifications related to book to tax differences that were made in the year shown.
C Total distributions of $11.79 per share is comprised of distributions from net investment income of $1.554 and distributions from net realized gain of $10.231 per share.
D Total distributions of $18.95 per share is comprised of distributions from net investment income of $3.081 and distributions from net realized gain of $15.864 per share.
E Total returns for periods of less than one year are not annualized.
F Total returns would have been lower if certain expenses had not been reduced during the applicable periods shown.
G Fees and expenses of any underlying Fidelity Central Funds are not included in the Fund's expense ratio. The Fund indirectly bears its proportionate share of the expenses of any underlying Fidelity Central Funds.
H Expense ratios reflect operating expenses of the Fund. Expenses before reductions do not reflect amounts reimbursed by the investment adviser or reductions from expense offset arrangements and do not represent the amount paid by the Fund during periods when reimbursements or reductions occur. Expenses net of fee waivers reflect expenses after reimbursement by the investment adviser but prior to reductions from expense offset arrangements. Expenses net of all reductions represent the net expenses paid by the Fund.
I Amount represents less than .005%.
J Annualized
K Amount does not include the portfolio activity of any underlying Fidelity Central Funds.
L Portfolio turnover rate excludes securities received or delivered in-kind.
See accompanying notes which are an integral part of the financial statements.
Fidelity® Consumer Staples Central Fund
Investment Summary (Unaudited)
Top Ten Stocks as of March 31, 2019
| % of fund's net assets | |
| Procter & Gamble Co. | 9.8 |
| The Coca-Cola Co. | 9.6 |
| Philip Morris International, Inc. | 7.4 |
| Altria Group, Inc. | 6.9 |
| PepsiCo, Inc. | 5.1 |
| Coty, Inc. Class A | 4.6 |
| Spectrum Brands Holdings, Inc. | 4.2 |
| Monster Beverage Corp. | 3.7 |
| Mondelez International, Inc. | 3.5 |
| Costco Wholesale Corp. | 3.2 |
| 58.0 |
Top Industries (% of fund's net assets)
| As of March 31, 2019 | ||
| Beverages | 24.2% | |
| Household Products | 19.4% | |
| Food Products | 18.7% | |
| Tobacco | 15.2% | |
| Personal Products | 9.4% | |
| All Others* | 13.1% | |
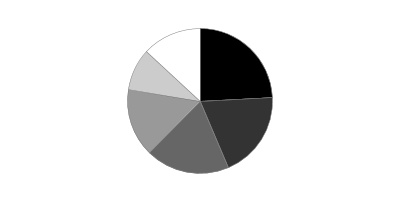
* Includes short-term investments and net other assets (liabilities).
Fidelity® Consumer Staples Central Fund
Schedule of Investments March 31, 2019 (Unaudited)
Showing Percentage of Net Assets
| Common Stocks - 99.0% | |||
| Shares | Value | ||
| Beverages - 24.2% | |||
| Brewers - 0.9% | |||
| Anheuser-Busch InBev SA NV | 62,500 | $5,246,510 | |
| Beijing Yanjing Brewery Co. Ltd. (A Shares) | 6,578,806 | 6,282,752 | |
| China Resources Beer Holdings Co. Ltd. | 85,210 | 358,753 | |
| 11,888,015 | |||
| Distillers & Vintners - 2.2% | |||
| Constellation Brands, Inc. Class A (sub. vtg.) | 155,766 | 27,310,453 | |
| Kweichow Moutai Co. Ltd. (A Shares) | 10,418 | 1,325,507 | |
| 28,635,960 | |||
| Soft Drinks - 21.1% | |||
| Coca-Cola Bottling Co. Consolidated | 23,987 | 6,904,178 | |
| Coca-Cola European Partners PLC | 105,358 | 5,451,223 | |
| Coca-Cola FEMSA S.A.B. de CV sponsored ADR | 61,900 | 4,085,400 | |
| Coca-Cola West Co. Ltd. | 38,000 | 963,800 | |
| Fever-Tree Drinks PLC | 1,844 | 72,508 | |
| Keurig Dr. Pepper, Inc. | 592,500 | 16,572,225 | |
| Monster Beverage Corp. (a) | 863,478 | 47,128,629 | |
| PepsiCo, Inc. | 532,700 | 65,282,385 | |
| The Coca-Cola Co. | 2,612,461 | 122,419,922 | |
| 268,880,270 | |||
| TOTAL BEVERAGES | 309,404,245 | ||
| Chemicals - 0.1% | |||
| Commodity Chemicals - 0.1% | |||
| SKSHU Paint Co. Ltd. (A Shares) | 140,400 | 1,227,863 | |
| Food & Staples Retailing - 9.3% | |||
| Drug Retail - 1.6% | |||
| Walgreens Boots Alliance, Inc. | 327,280 | 20,707,006 | |
| Food Distributors - 1.6% | |||
| Performance Food Group Co. (a) | 48,800 | 1,934,432 | |
| Sysco Corp. | 279,600 | 18,666,096 | |
| 20,600,528 | |||
| Food Retail - 1.3% | |||
| Kroger Co. | 512,823 | 12,615,446 | |
| Sprouts Farmers Market LLC (a) | 157,400 | 3,390,396 | |
| 16,005,842 | |||
| Hypermarkets & Super Centers - 4.8% | |||
| BJ's Wholesale Club Holdings, Inc. | 17,100 | 468,540 | |
| Costco Wholesale Corp. | 168,000 | 40,679,520 | |
| Walmart, Inc. | 206,200 | 20,110,686 | |
| 61,258,746 | |||
| TOTAL FOOD & STAPLES RETAILING | 118,572,122 | ||
| Food Products - 18.7% | |||
| Agricultural Products - 1.1% | |||
| Bunge Ltd. | 80,269 | 4,259,876 | |
| Darling International, Inc. (a) | 340,600 | 7,373,990 | |
| Ingredion, Inc. | 25,100 | 2,376,719 | |
| 14,010,585 | |||
| Packaged Foods & Meats - 17.6% | |||
| Conagra Brands, Inc. | 449,200 | 12,460,808 | |
| Danone SA | 265,812 | 20,467,779 | |
| Freshpet, Inc. (a) | 358,830 | 15,174,921 | |
| General Mills, Inc. | 408,200 | 21,124,350 | |
| JBS SA | 3,526,100 | 14,337,291 | |
| Kellogg Co. | 93,200 | 5,347,816 | |
| Mondelez International, Inc. | 883,312 | 44,094,935 | |
| Nomad Foods Ltd. (a) | 63,400 | 1,296,530 | |
| Post Holdings, Inc. (a) | 63,600 | 6,957,840 | |
| SunOpta, Inc. (a) | 268,400 | 928,664 | |
| The Hain Celestial Group, Inc. (a)(b) | 113,989 | 2,635,426 | |
| The J.M. Smucker Co. | 168,500 | 19,630,250 | |
| The Kraft Heinz Co. | 400,600 | 13,079,590 | |
| The Simply Good Foods Co. (a) | 378,400 | 7,791,256 | |
| TreeHouse Foods, Inc. (a) | 300,973 | 19,427,807 | |
| Tyson Foods, Inc. Class A | 284,200 | 19,732,006 | |
| 224,487,269 | |||
| TOTAL FOOD PRODUCTS | 238,497,854 | ||
| Hotels, Restaurants & Leisure - 0.8% | |||
| Restaurants - 0.8% | |||
| U.S. Foods Holding Corp. (a) | 282,808 | 9,872,827 | |
| Household Products - 19.4% | |||
| Household Products - 19.4% | |||
| Colgate-Palmolive Co. | 562,620 | 38,561,975 | |
| Energizer Holdings, Inc. | 108,100 | 4,856,933 | |
| Essity AB Class B | 782,200 | 22,555,776 | |
| Procter & Gamble Co. | 1,206,993 | 125,587,622 | |
| Reckitt Benckiser Group PLC | 30,547 | 2,542,202 | |
| Spectrum Brands Holdings, Inc. (b) | 974,988 | 53,409,843 | |
| 247,514,351 | |||
| Internet & Direct Marketing Retail - 0.6% | |||
| Internet & Direct Marketing Retail - 0.6% | |||
| Ocado Group PLC (a) | 302,000 | 5,390,723 | |
| The Honest Co., Inc. (a)(c)(d) | 171,220 | 1,765,278 | |
| 7,156,001 | |||
| Multiline Retail - 1.3% | |||
| General Merchandise Stores - 1.3% | |||
| Dollar General Corp. | 28,500 | 3,400,050 | |
| Dollar Tree, Inc. (a) | 121,900 | 12,804,376 | |
| 16,204,426 | |||
| Personal Products - 9.4% | |||
| Personal Products - 9.4% | |||
| Avon Products, Inc. (a) | 3,799,313 | 11,169,980 | |
| Coty, Inc. Class A | 5,113,478 | 58,804,997 | |
| Estee Lauder Companies, Inc. Class A | 48,367 | 8,007,157 | |
| Ontex Group NV | 548,900 | 12,351,515 | |
| Unilever NV (Certificaten Van Aandelen) (Bearer) | 520,854 | 30,366,528 | |
| 120,700,177 | |||
| Tobacco - 15.2% | |||
| Tobacco - 15.2% | |||
| Altria Group, Inc. | 1,542,767 | 88,601,109 | |
| British American Tobacco PLC sponsored ADR | 260,946 | 10,886,667 | |
| Philip Morris International, Inc. | 1,071,753 | 94,732,248 | |
| 194,220,024 | |||
| TOTAL COMMON STOCKS | |||
| (Cost $1,165,243,636) | 1,263,369,890 | ||
| Money Market Funds - 2.8% | |||
| Fidelity Cash Central Fund, 2.48% (e) | 8,376,236 | 8,377,911 | |
| Fidelity Securities Lending Cash Central Fund 2.48% (e)(f) | 27,982,002 | 27,984,800 | |
| TOTAL MONEY MARKET FUNDS | |||
| (Cost $36,362,711) | 36,362,711 | ||
| TOTAL INVESTMENT IN SECURITIES - 101.8% | |||
| (Cost $1,201,606,347) | 1,299,732,601 | ||
| NET OTHER ASSETS (LIABILITIES) - (1.8)% | (23,000,402) | ||
| NET ASSETS - 100% | $1,276,732,199 |
Legend
(a) Non-income producing
(b) Security or a portion of the security is on loan at period end.
(c) Restricted securities - Investment in securities not registered under the Securities Act of 1933 (excluding 144A issues). At the end of the period, the value of restricted securities (excluding 144A issues) amounted to $1,765,278 or 0.1% of net assets.
(d) Level 3 security
(e) Affiliated fund that is generally available only to investment companies and other accounts managed by Fidelity Investments. The rate quoted is the annualized seven-day yield of the fund at period end. A complete unaudited listing of the fund's holdings as of its most recent quarter end is available upon request. In addition, each Fidelity Central Fund's financial statements are available on the SEC's website or upon request.
(f) Investment made with cash collateral received from securities on loan.
Additional information on each restricted holding is as follows:
| Security | Acquisition Date | Acquisition Cost |
| The Honest Co., Inc. | 8/28/18 | $1,921,088 |
Affiliated Central Funds
Information regarding fiscal year to date income earned by the Fund from investments in Fidelity Central Funds is as follows:
| Fund | Income earned |
| Fidelity Cash Central Fund | $62,258 |
| Fidelity Securities Lending Cash Central Fund | 12,013 |
| Total | $74,271 |
Amounts in the income column in the above table include any capital gain distributions from underlying funds, which are presented in the corresponding line-item in the Statement of Operations, if applicable.
Investment Valuation
The following is a summary of the inputs used, as of March 31, 2019, involving the Fund's assets and liabilities carried at fair value. The inputs or methodology used for valuing securities may not be an indication of the risk associated with investing in those securities. For more information on valuation inputs, and their aggregation into the levels used below, please refer to the Investment Valuation section in the accompanying Notes to Financial Statements.
| Valuation Inputs at Reporting Date: | ||||
| Description | Total | Level 1 | Level 2 | Level 3 |
| Investments in Securities: | ||||
| Common Stocks | $1,263,369,890 | $1,202,981,593 | $58,623,019 | $1,765,278 |
| Money Market Funds | 36,362,711 | 36,362,711 | -- | -- |
| Total Investments in Securities: | $1,299,732,601 | $1,239,344,304 | $58,623,019 | $1,765,278 |
Other Information
Distribution of investments by country or territory of incorporation, as a percentage of Total Net Assets, is as follows (Unaudited):
| United States of America | 88.3% |
| Netherlands | 2.4% |
| United Kingdom | 1.9% |
| Sweden | 1.8% |
| France | 1.6% |
| Belgium | 1.3% |
| Brazil | 1.1% |
| Others (Individually Less Than 1%) | 1.6% |
| 100.0% |
See accompanying notes which are an integral part of the financial statements.
Fidelity® Consumer Staples Central Fund
Financial Statements
Statement of Assets and Liabilities
| March 31, 2019 (Unaudited) | ||
| Assets | ||
| Investment in securities, at value (including securities loaned of $27,356,274) — See accompanying schedule: Unaffiliated issuers (cost $1,165,243,636) | $1,263,369,890 | |
| Fidelity Central Funds (cost $36,362,711) | 36,362,711 | |
| Total Investment in Securities (cost $1,201,606,347) | $1,299,732,601 | |
| Receivable for investments sold | 1,231,680 | |
| Receivable for fund shares sold | 137,640 | |
| Dividends receivable | 4,709,308 | |
| Distributions receivable from Fidelity Central Funds | 14,760 | |
| Total assets | 1,305,825,989 | |
| Liabilities | ||
| Payable for fund shares redeemed | $1,099,284 | |
| Other payables and accrued expenses | 9,706 | |
| Collateral on securities loaned | 27,984,800 | |
| Total liabilities | 29,093,790 | |
| Net Assets | $1,276,732,199 | |
| Net Assets consist of: | ||
| Paid in capital | $1,218,751,044 | |
| Total distributable earnings (loss) | 57,981,155 | |
| Net Assets, for 6,545,440 shares outstanding | $1,276,732,199 | |
| Net Asset Value, offering price and redemption price per share ($1,276,732,199 ÷ 6,545,440 shares) | $195.06 |
See accompanying notes which are an integral part of the financial statements.
Statement of Operations
| Six months ended March 31, 2019 (Unaudited) | ||
| Investment Income | ||
| Dividends | $17,013,436 | |
| Income from Fidelity Central Funds | 74,271 | |
| Total income | 17,087,707 | |
| Expenses | ||
| Custodian fees and expenses | $13,053 | |
| Independent directors' fees and expenses | 3,713 | |
| Interest | 5,239 | |
| Total expenses before reductions | 22,005 | |
| Expense reductions | (860) | |
| Total expenses after reductions | 21,145 | |
| Net investment income (loss) | 17,066,562 | |
| Realized and Unrealized Gain (Loss) | ||
| Net realized gain (loss) on: | ||
| Investment securities: | ||
| Unaffiliated issuers | (12,696,393) | |
| Foreign currency transactions | (18,684) | |
| Total net realized gain (loss) | (12,715,077) | |
| Change in net unrealized appreciation (depreciation) on: | ||
| Investment securities: | ||
| Unaffiliated issuers | 58,558,502 | |
| Assets and liabilities in foreign currencies | (16,083) | |
| Total change in net unrealized appreciation (depreciation) | 58,542,419 | |
| Net gain (loss) | 45,827,342 | |
| Net increase (decrease) in net assets resulting from operations | $62,893,904 |
See accompanying notes which are an integral part of the financial statements.
Statement of Changes in Net Assets
| Six months ended March 31, 2019 (Unaudited) | Year ended September 30, 2018 | |
| Increase (Decrease) in Net Assets | ||
| Operations | ||
| Net investment income (loss) | $17,066,562 | $43,585,742 |
| Net realized gain (loss) | (12,715,077) | 150,161,220 |
| Change in net unrealized appreciation (depreciation) | 58,542,419 | (225,399,488) |
| Net increase (decrease) in net assets resulting from operations | 62,893,904 | (31,652,526) |
| Distributions to shareholders | (110,793,359) | – |
| Distributions to shareholders from net investment income | – | (41,880,818) |
| Distributions to shareholders from net realized gain | – | (97,894,284) |
| Total distributions | (110,793,359) | (139,775,102) |
| Affiliated share transactions | ||
| Proceeds from sales of shares | 35,542,206 | 510,816,792 |
| Reinvestment of distributions | 110,793,359 | 139,775,102 |
| Cost of shares redeemed | (127,131,508) | (356,818,908) |
| Net increase (decrease) in net assets resulting from share transactions | 19,204,057 | 293,772,986 |
| Total increase (decrease) in net assets | (28,695,398) | 122,345,358 |
| Net Assets | ||
| Beginning of period | 1,305,427,597 | 1,183,082,239 |
| End of period | $1,276,732,199 | $1,305,427,597 |
| Other Information | ||
| Undistributed net investment income end of period | $4,542,963 | |
| Shares | ||
| Sold | 189,313 | 2,421,167 |
| Issued in reinvestment of distributions | 647,121 | 643,591 |
| Redeemed | (670,304) | (1,761,742) |
| Net increase (decrease) | 166,130 | 1,303,016 |
See accompanying notes which are an integral part of the financial statements.
Financial Highlights
Fidelity Consumer Staples Central Fund
| Six months ended (Unaudited) March 31, | Years endedSeptember 30, | |||||
| 2019 | 2018 | 2017 | 2016 | 2015 | 2014 | |
| Selected Per–Share Data | ||||||
| Net asset value, beginning of period | $204.63 | $233.06 | $228.00 | $202.36 | $205.11 | $181.33 |
| Income from Investment Operations | ||||||
| Net investment income (loss)A | 2.61 | 7.25B | 6.10 | 5.30 | 5.31 | 5.20 |
| Net realized and unrealized gain (loss) | 5.60 | (10.43) | 7.65 | 25.50 | (2.84) | 23.75 |
| Total from investment operations | 8.21 | (3.18) | 13.75 | 30.80 | 2.47 | 28.95 |
| Distributions from net investment income | (2.27) | (6.98) | (5.62) | (5.16) | (5.22) | (5.17) |
| Distributions from net realized gain | (15.51) | (18.26) | (3.07) | – | – | – |
| Total distributions | (17.78) | (25.25)C | (8.69) | (5.16) | (5.22) | (5.17) |
| Net asset value, end of period | $195.06 | $204.63 | $233.06 | $228.00 | $202.36 | $205.11 |
| Total ReturnD,E | 5.28% | (1.76)% | 6.23% | 15.29% | 1.07% | 16.13% |
| Ratios to Average Net AssetsF,G | ||||||
| Expenses before reductions | - %H,I | - %I | - %I | - %I | - %I | .01% |
| Expenses net of fee waivers, if any | - %H,I | - %I | - %I | - %I | - %I | .01% |
| Expenses net of all reductions | - %H,I | - %I | - %I | - %I | - %I | .01% |
| Net investment income (loss) | 2.76%H | 3.42%B | 2.62% | 2.38% | 2.45% | 2.67% |
| Supplemental Data | ||||||
| Net assets, end of period (000 omitted) | $1,276,732 | $1,305,428 | $1,183,082 | $1,284,774 | $1,097,772 | $1,166,861 |
| Portfolio turnover rateJ | 41%H | 79%K | 54%K | 50% | 65% | 36%K |
A Calculated based on average shares outstanding during the period.
B Net investment income per share reflects a large, non-recurring dividend which amounted to $1.86 per share. Excluding this non-recurring dividend, the ratio of net investment income (loss) to average net assets would have been 2.55%.
C Total distributions of $25.25 per share is comprised of distributions from net investment income of $6.982 and distributions from net realized gain of $18.264 per share.
D Total returns for periods of less than one year are not annualized.
E Total returns would have been lower if certain expenses had not been reduced during the applicable periods shown.
F Fees and expenses of any underlying Fidelity Central Funds are not included in the Fund's expense ratio. The Fund indirectly bears its proportionate share of the expenses of any underlying Fidelity Central Funds.
G Expense ratios reflect operating expenses of the Fund. Expenses before reductions do not reflect amounts reimbursed by the investment adviser or reductions from expense offset arrangements and do not represent the amount paid by the Fund during periods when reimbursements or reductions occur. Expenses net of fee waivers reflect expenses after reimbursement by the investment adviser but prior to reductions from expense offset arrangements. Expenses net of all reductions represent the net expenses paid by the Fund.
H Annualized
I Amount represents less than .005%.
J Amount does not include the portfolio activity of any underlying Fidelity Central Funds.
K Portfolio turnover rate excludes securities received or delivered in-kind.
See accompanying notes which are an integral part of the financial statements.
Fidelity® Energy Central Fund
Investment Summary (Unaudited)
Top Ten Stocks as of March 31, 2019
| % of fund's net assets | |
| Chevron Corp. | 11.4 |
| EOG Resources, Inc. | 7.7 |
| Valero Energy Corp. | 5.3 |
| Diamondback Energy, Inc. | 4.4 |
| Phillips 66 Co. | 3.9 |
| Pioneer Natural Resources Co. | 3.9 |
| Exxon Mobil Corp. | 3.8 |
| Anadarko Petroleum Corp. | 3.7 |
| Cabot Oil & Gas Corp. | 2.8 |
| Marathon Petroleum Corp. | 2.8 |
| 49.7 |
Top Industries (% of fund's net assets)
| As of March 31, 2019 | ||
| Oil, Gas & Consumable Fuels | 89.3% | |
| Energy Equipment & Services | 8.6% | |
| Machinery | 1.0% | |
| Chemicals | 0.1% | |
| All Others* | 1.0% | |

* Includes short-term investments and net other assets (liabilities).
Fidelity® Energy Central Fund
Schedule of Investments March 31, 2019 (Unaudited)
Showing Percentage of Net Assets
| Common Stocks - 99.0% | |||
| Shares | Value | ||
| Chemicals - 0.1% | |||
| Commodity Chemicals - 0.1% | |||
| LG Chemical Ltd. | 3,873 | $1,246,005 | |
| Energy Equipment & Services - 8.6% | |||
| Oil & Gas Drilling - 1.8% | |||
| AKITA Drilling Ltd. Class A (non-vtg.) | 333,845 | 811,910 | |
| Nabors Industries Ltd. | 1,874,225 | 6,447,334 | |
| Odfjell Drilling Ltd. | 750,822 | 2,350,413 | |
| Precision Drilling Corp. (a) | 1,184,200 | 2,809,080 | |
| Shelf Drilling Ltd. (a)(b) | 865,488 | 4,304,887 | |
| 16,723,624 | |||
| Oil & Gas Equipment & Services - 6.8% | |||
| Baker Hughes, a GE Co. Class A | 551,036 | 15,274,718 | |
| Forum Energy Technologies, Inc. (a) | 494,700 | 2,527,917 | |
| Halliburton Co. | 319,617 | 9,364,778 | |
| Helix Energy Solutions Group, Inc. (a) | 131,600 | 1,040,956 | |
| Hunting PLC | 263,000 | 2,036,426 | |
| Liberty Oilfield Services, Inc. Class A (c) | 261,800 | 4,029,102 | |
| NCS Multistage Holdings, Inc. (a) | 148,500 | 769,230 | |
| RigNet, Inc. (a) | 280,275 | 2,738,287 | |
| Schlumberger Ltd. | 467,652 | 20,375,598 | |
| Smart Sand, Inc. (a) | 132,800 | 590,960 | |
| Solaris Oilfield Infrastructure, Inc. Class A | 337,700 | 5,551,788 | |
| 64,299,760 | |||
| TOTAL ENERGY EQUIPMENT & SERVICES | 81,023,384 | ||
| Machinery - 1.0% | |||
| Industrial Machinery - 1.0% | |||
| Apergy Corp. (a) | 27,600 | 1,133,256 | |
| Cactus, Inc. (a) | 71,100 | 2,531,160 | |
| Gardner Denver Holdings, Inc. (a) | 52,400 | 1,457,244 | |
| ProPetro Holding Corp. (a) | 181,500 | 4,091,010 | |
| 9,212,670 | |||
| Oil, Gas & Consumable Fuels - 89.3% | |||
| Coal & Consumable Fuels - 0.4% | |||
| Peabody Energy Corp. | 129,000 | 3,654,570 | |
| Integrated Oil & Gas - 18.4% | |||
| Chevron Corp. | 869,864 | 107,149,848 | |
| Exxon Mobil Corp. | 439,264 | 35,492,531 | |
| Occidental Petroleum Corp. | 215,600 | 14,272,720 | |
| Suncor Energy, Inc. | 499,800 | 16,198,105 | |
| 173,113,204 | |||
| Oil & Gas Exploration & Production - 51.5% | |||
| Anadarko Petroleum Corp. | 771,761 | 35,099,690 | |
| Antero Midstream GP LP | 71,200 | 981,136 | |
| Berry Petroleum Corp. | 873,800 | 10,083,652 | |
| Cabot Oil & Gas Corp. | 1,020,700 | 26,640,270 | |
| Canadian Natural Resources Ltd. | 341,800 | 9,384,250 | |
| Concho Resources, Inc. | 179,455 | 19,912,327 | |
| ConocoPhillips Co. | 230,442 | 15,379,699 | |
| Continental Resources, Inc. (a) | 433,619 | 19,413,123 | |
| Devon Energy Corp. | 759,781 | 23,978,688 | |
| Diamondback Energy, Inc. | 406,581 | 41,280,169 | |
| Encana Corp. | 2,980,200 | 21,587,410 | |
| EOG Resources, Inc. | 761,701 | 72,498,701 | |
| Gran Tierra Energy, Inc. (U.S.) (a) | 1,376,600 | 3,124,882 | |
| Hess Corp. | 336,565 | 20,271,310 | |
| Kosmos Energy Ltd. | 1,347,600 | 8,395,548 | |
| Lundin Petroleum AB | 219,000 | 7,415,185 | |
| Magnolia Oil & Gas Corp. | 530,000 | 6,360,000 | |
| Magnolia Oil & Gas Corp. Class A (a) | 657,000 | 7,884,000 | |
| National Energy Services Reunited Corp. (a) | 11,200 | 117,040 | |
| Noble Energy, Inc. | 794,300 | 19,643,039 | |
| Northern Oil & Gas, Inc. (a) | 1,185,200 | 3,247,448 | |
| Parex Resources, Inc. (a) | 839,200 | 13,137,325 | |
| Parsley Energy, Inc. Class A (a) | 604,132 | 11,659,748 | |
| PDC Energy, Inc. (a) | 250,080 | 10,173,254 | |
| Pioneer Natural Resources Co. | 241,793 | 36,820,238 | |
| Texas Pacific Land Trust (c) | 800 | 618,920 | |
| Viper Energy Partners LP | 649,100 | 21,524,156 | |
| W&T Offshore, Inc. (a) | 416,000 | 2,870,400 | |
| Whiting Petroleum Corp. (a) | 446,800 | 11,679,352 | |
| WPX Energy, Inc. (a) | 214,279 | 2,809,198 | |
| 483,990,158 | |||
| Oil & Gas Refining & Marketing - 14.6% | |||
| Delek U.S. Holdings, Inc. | 545,873 | 19,880,695 | |
| Marathon Petroleum Corp. | 435,597 | 26,070,480 | |
| Phillips 66 Co. | 388,185 | 36,943,566 | |
| Reliance Industries Ltd. | 255,898 | 5,042,321 | |
| Valero Energy Corp. | 585,000 | 49,625,550 | |
| 137,562,612 | |||
| Oil & Gas Storage & Transport - 4.4% | |||
| Cheniere Energy, Inc. (a) | 255,800 | 17,486,488 | |
| Enterprise Products Partners LP | 205,100 | 5,968,410 | |
| Euronav NV (c) | 596,527 | 4,861,695 | |
| Golar LNG Ltd. | 217,400 | 4,584,966 | |
| Noble Midstream Partners LP (a)(d) | 45,454 | 1,636,799 | |
| Teekay LNG Partners LP | 50,500 | 755,480 | |
| The Williams Companies, Inc. | 205,382 | 5,898,571 | |
| 41,192,409 | |||
| TOTAL OIL, GAS & CONSUMABLE FUELS | 839,512,953 | ||
| TOTAL COMMON STOCKS | |||
| (Cost $929,652,642) | 930,995,012 | ||
| Money Market Funds - 1.8% | |||
| Fidelity Cash Central Fund, 2.48% (e) | 9,794,919 | 9,796,878 | |
| Fidelity Securities Lending Cash Central Fund 2.48% (e)(f) | 6,732,912 | 6,733,585 | |
| TOTAL MONEY MARKET FUNDS | |||
| (Cost $16,530,463) | 16,530,463 | ||
| TOTAL INVESTMENT IN SECURITIES - 100.8% | |||
| (Cost $946,183,105) | 947,525,475 | ||
| NET OTHER ASSETS (LIABILITIES) - (0.8)% | (7,618,886) | ||
| NET ASSETS - 100% | $939,906,589 |
Legend
(a) Non-income producing
(b) Security exempt from registration under Rule 144A of the Securities Act of 1933. These securities may be resold in transactions exempt from registration, normally to qualified institutional buyers. At the end of the period, the value of these securities amounted to $4,304,887 or 0.5% of net assets.
(c) Security or a portion of the security is on loan at period end.
(d) Restricted securities - Investment in securities not registered under the Securities Act of 1933 (excluding 144A issues). At the end of the period, the value of restricted securities (excluding 144A issues) amounted to $1,636,799 or 0.2% of net assets.
(e) Affiliated fund that is generally available only to investment companies and other accounts managed by Fidelity Investments. The rate quoted is the annualized seven-day yield of the fund at period end. A complete unaudited listing of the fund's holdings as of its most recent quarter end is available upon request. In addition, each Fidelity Central Fund's financial statements are available on the SEC's website or upon request.
(f) Investment made with cash collateral received from securities on loan.
Additional information on each restricted holding is as follows:
| Security | Acquisition Date | Acquisition Cost |
| Noble Midstream Partners LP | 6/21/17 | $1,838,614 |
Affiliated Central Funds
Information regarding fiscal year to date income earned by the Fund from investments in Fidelity Central Funds is as follows:
| Fund | Income earned |
| Fidelity Cash Central Fund | $80,047 |
| Fidelity Securities Lending Cash Central Fund | 42,960 |
| Total | $123,007 |
Amounts in the income column in the above table include any capital gain distributions from underlying funds, which are presented in the corresponding line-item in the Statement of Operations, if applicable.
Investment Valuation
All investments are categorized as Level 1 under the Fair Value Hierarchy. The inputs or methodology used for valuing securities may not be an indication of the risk associated with investing in those securities. For more information on valuation inputs please refer to the Investment Valuation section in the accompanying Notes to Financial Statements.
Other Information
Distribution of investments by country or territory of incorporation, as a percentage of Total Net Assets, is as follows (Unaudited):
| United States of America | 86.9% |
| Canada | 6.8% |
| Curacao | 2.2% |
| Bermuda | 1.4% |
| Others (Individually Less Than 1%) | 2.7% |
| 100.0% |
See accompanying notes which are an integral part of the financial statements.
Fidelity® Energy Central Fund
Financial Statements
Statement of Assets and Liabilities
| March 31, 2019 (Unaudited) | ||
| Assets | ||
| Investment in securities, at value (including securities loaned of $6,545,293) — See accompanying schedule: Unaffiliated issuers (cost $929,652,642) | $930,995,012 | |
| Fidelity Central Funds (cost $16,530,463) | 16,530,463 | |
| Total Investment in Securities (cost $946,183,105) | $947,525,475 | |
| Cash | 10,463 | |
| Receivable for investments sold | 1,949,518 | |
| Receivable for fund shares sold | 111,152 | |
| Dividends receivable | 874,877 | |
| Distributions receivable from Fidelity Central Funds | 19,656 | |
| Other receivables | 16,298 | |
| Total assets | 950,507,439 | |
| Liabilities | ||
| Payable for investments purchased | $2,940,882 | |
| Payable for fund shares redeemed | 834,641 | |
| Other payables and accrued expenses | 97,027 | |
| Collateral on securities loaned | 6,728,300 | |
| Total liabilities | 10,600,850 | |
| Net Assets | $939,906,589 | |
| Net Assets consist of: | ||
| Paid in capital | $1,006,259,335 | |
| Total distributable earnings (loss) | (66,352,746) | |
| Net Assets, for 8,558,795 shares outstanding | $939,906,589 | |
| Net Asset Value, offering price and redemption price per share ($939,906,589 ÷ 8,558,795 shares) | $109.82 |
See accompanying notes which are an integral part of the financial statements.
Statement of Operations
| Six months ended March 31, 2019 (Unaudited) | ||
| Investment Income | ||
| Dividends | $10,955,956 | |
| Income from Fidelity Central Funds | 123,007 | |
| Total income | 11,078,963 | |
| Expenses | ||
| Custodian fees and expenses | $12,349 | |
| Independent directors' fees and expenses | 3,108 | |
| Total expenses before reductions | 15,457 | |
| Expense reductions | (726) | |
| Total expenses after reductions | 14,731 | |
| Net investment income (loss) | 11,064,232 | |
| Realized and Unrealized Gain (Loss) | ||
| Net realized gain (loss) on: | ||
| Investment securities: | ||
| Unaffiliated issuers | (48,721,172) | |
| Fidelity Central Funds | 2,237 | |
| Foreign currency transactions | (14,557) | |
| Total net realized gain (loss) | (48,733,492) | |
| Change in net unrealized appreciation (depreciation) on: | ||
| Investment securities: | ||
| Unaffiliated issuers (net of increase in deferred foreign taxes of $84,492) | (195,724,606) | |
| Assets and liabilities in foreign currencies | (3,844) | |
| Total change in net unrealized appreciation (depreciation) | (195,728,450) | |
| Net gain (loss) | (244,461,942) | |
| Net increase (decrease) in net assets resulting from operations | $(233,397,710) |
See accompanying notes which are an integral part of the financial statements.
Statement of Changes in Net Assets
| Six months ended March 31, 2019 (Unaudited) | Year ended September 30, 2018 | |
| Increase (Decrease) in Net Assets | ||
| Operations | ||
| Net investment income (loss) | $11,064,232 | $17,489,395 |
| Net realized gain (loss) | (48,733,492) | 61,227,627 |
| Change in net unrealized appreciation (depreciation) | (195,728,450) | 121,497,647 |
| Net increase (decrease) in net assets resulting from operations | (233,397,710) | 200,214,669 |
| Distributions to shareholders | (10,064,586) | – |
| Distributions to shareholders from net investment income | – | (20,361,801) |
| Distributions to shareholders from net realized gain | – | (10,516,702) |
| Total distributions | (10,064,586) | (30,878,503) |
| Affiliated share transactions | ||
| Proceeds from sales of shares | 26,401,817 | 428,772,992 |
| Reinvestment of distributions | 10,064,586 | 30,878,503 |
| Cost of shares redeemed | (93,647,958) | (328,763,579) |
| Net increase (decrease) in net assets resulting from share transactions | (57,181,555) | 130,887,916 |
| Total increase (decrease) in net assets | (300,643,851) | 300,224,082 |
| Net Assets | ||
| Beginning of period | 1,240,550,440 | 940,326,358 |
| End of period | $939,906,589 | $1,240,550,440 |
| Other Information | ||
| Distributions in excess of net investment income end of period | $(2,405,832) | |
| Shares | ||
| Sold | 245,885 | 3,357,137 |
| Issued in reinvestment of distributions | 96,441 | 245,845 |
| Redeemed | (845,542) | (2,493,997) |
| Net increase (decrease) | (503,216) | 1,108,985 |
See accompanying notes which are an integral part of the financial statements.
Financial Highlights
Fidelity Energy Central Fund
| Six months ended (Unaudited) March 31, | Years endedSeptember 30, | |||||
| 2019 | 2018 | 2017 | 2016 | 2015 | 2014 | |
| Selected Per–Share Data | ||||||
| Net asset value, beginning of period | $136.90 | $118.24 | $127.46 | $103.49 | $154.78 | $144.89 |
| Income from Investment Operations | ||||||
| Net investment income (loss)A | 1.26 | 2.00 | 2.84B | 1.72 | 2.32 | 2.37 |
| Net realized and unrealized gain (loss) | (27.19) | 20.29 | (9.52) | 23.93 | (51.31) | 9.87 |
| Total from investment operations | (25.93) | 22.29 | (6.68) | 25.65 | (48.99) | 12.24 |
| Distributions from net investment income | (1.05) | (2.36)C | (2.44) | (1.68) | (2.30) | (2.35) |
| Distributions from net realized gain | (.10) | (1.27)C | (.10) | – | – | – |
| Total distributions | (1.15) | (3.63) | (2.54) | (1.68) | (2.30) | (2.35) |
| Net asset value, end of period | $109.82 | $136.90 | $118.24 | $127.46 | $103.49 | $154.78 |
| Total ReturnD,E | (18.89)% | 19.16% | (5.20)% | 25.02% | (31.92)% | 8.44% |
| Ratios to Average Net AssetsF,G | ||||||
| Expenses before reductionsH | - %I | -% | -% | -% | -% | -% |
| Expenses net of fee waivers, if anyH | - %I | -% | -% | -% | -% | -% |
| Expenses net of all reductionsH | - %I | -% | -% | -% | -% | -% |
| Net investment income (loss) | 2.26%I | 1.55% | 2.32%B | 1.55% | 1.80% | 1.52% |
| Supplemental Data | ||||||
| Net assets, end of period (000 omitted) | $939,907 | $1,240,550 | $940,326 | $1,004,987 | $803,804 | $1,106,807 |
| Portfolio turnover rateJ | 38%I | 52%K | 82%K | 105% | 70% | 109%K |
A Calculated based on average shares outstanding during the period.
B Net investment income per share reflects a large, non-recurring dividend which amounted to $1.32 per share. Excluding this non-recurring dividend, the ratio of net investment income (loss) to average net assets would have been 1.25%.
C The amounts shown reflect certain reclassifications related to book to tax differences that were made in the year shown.
D Total returns for periods of less than one year are not annualized.
E Total returns would have been lower if certain expenses had not been reduced during the applicable periods shown.
F Fees and expenses of any underlying Fidelity Central Funds are not included in the Fund's expense ratio. The Fund indirectly bears its proportionate share of the expenses of any underlying Fidelity Central Funds.
G Expense ratios reflect operating expenses of the Fund. Expenses before reductions do not reflect amounts reimbursed by the investment adviser or reductions from expense offset arrangements and do not represent the amount paid by the Fund during periods when reimbursements or reductions occur. Expenses net of fee waivers reflect expenses after reimbursement by the investment adviser but prior to reductions from expense offset arrangements. Expenses net of all reductions represent the net expenses paid by the Fund.
H Amount represents less than .005%.
I Annualized
J Amount does not include the portfolio activity of any underlying Fidelity Central Funds.
K Portfolio turnover rate excludes securities received or delivered in-kind.
See accompanying notes which are an integral part of the financial statements.
Fidelity® Financials Central Fund
Investment Summary (Unaudited)
Top Ten Stocks as of March 31, 2019
| % of fund's net assets | |
| Bank of America Corp. | 5.1 |
| Citigroup, Inc. | 5.0 |
| JPMorgan Chase & Co. | 4.9 |
| Berkshire Hathaway, Inc. Class B | 4.9 |
| Wells Fargo & Co. | 4.4 |
| Hartford Financial Services Group, Inc. | 2.8 |
| Capital One Financial Corp. | 2.8 |
| Cboe Global Markets, Inc. | 2.6 |
| The Travelers Companies, Inc. | 2.5 |
| FNF Group | 2.3 |
| 37.3 |
Top Industries (% of fund's net assets)
| As of March 31, 2019 | ||
| Banks | 29.6% | |
| Equity Real Estate Investment Trusts (Reits) | 19.7% | |
| Insurance | 18.0% | |
| Capital Markets | 12.0% | |
| Consumer Finance | 7.1% | |
| All Others* | 13.6% | |
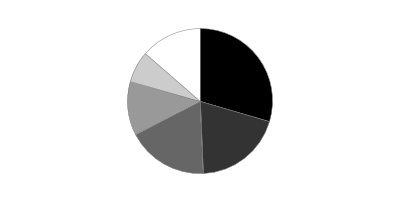
* Includes short-term investments and net other assets (liabilities).
Fidelity® Financials Central Fund
Schedule of Investments March 31, 2019 (Unaudited)
Showing Percentage of Net Assets
| Common Stocks - 98.4% | |||
| Shares | Value | ||
| Banks - 29.6% | |||
| Diversified Banks - 19.4% | |||
| Bank of America Corp. | 6,000,000 | $165,539,999 | |
| Citigroup, Inc. | 2,650,000 | 164,883,000 | |
| JPMorgan Chase & Co. | 1,600,000 | 161,968,000 | |
| Wells Fargo & Co. | 3,000,000 | 144,960,000 | |
| 637,350,999 | |||
| Regional Banks - 10.2% | |||
| BOK Financial Corp. | 125,000 | 10,193,750 | |
| First Citizens Bancshares, Inc. | 35,000 | 14,252,000 | |
| First Hawaiian, Inc. | 600,000 | 15,630,000 | |
| First Horizon National Corp. | 1,750,000 | 24,465,000 | |
| First Republic Bank | 150,000 | 15,069,000 | |
| Huntington Bancshares, Inc. | 5,000,000 | 63,400,000 | |
| KeyCorp | 1,600,000 | 25,200,000 | |
| M&T Bank Corp. | 185,000 | 29,048,700 | |
| PNC Financial Services Group, Inc. | 565,000 | 69,302,900 | |
| Signature Bank | 275,000 | 35,219,250 | |
| SunTrust Banks, Inc. | 550,000 | 32,587,500 | |
| 334,368,100 | |||
| TOTAL BANKS | 971,719,099 | ||
| Capital Markets - 12.0% | |||
| Asset Management & Custody Banks - 2.5% | |||
| Bank of New York Mellon Corp. | 1,150,000 | 57,994,500 | |
| Oaktree Capital Group LLC Class A | 500,000 | 24,825,000 | |
| 82,819,500 | |||
| Financial Exchanges & Data - 2.6% | |||
| Cboe Global Markets, Inc. | 900,000 | 85,896,000 | |
| Investment Banking & Brokerage - 6.9% | |||
| E*TRADE Financial Corp. | 1,350,000 | 62,680,500 | |
| Goldman Sachs Group, Inc. | 50,000 | 9,599,500 | |
| Hamilton Lane, Inc. Class A | 500,000 | 21,790,000 | |
| Morgan Stanley | 1,400,000 | 59,080,000 | |
| PJT Partners, Inc. | 225,000 | 9,405,000 | |
| TD Ameritrade Holding Corp. | 950,000 | 47,490,500 | |
| Virtu Financial, Inc. Class A | 600,000 | 14,250,000 | |
| 224,295,500 | |||
| TOTAL CAPITAL MARKETS | 393,011,000 | ||
| Consumer Finance - 7.1% | |||
| Consumer Finance - 7.1% | |||
| American Express Co. | 500,000 | 54,650,000 | |
| Capital One Financial Corp. | 1,125,400 | 91,933,926 | |
| OneMain Holdings, Inc. | 1,150,000 | 36,512,500 | |
| SLM Corp. | 5,000,000 | 49,550,000 | |
| 232,646,426 | |||
| Diversified Financial Services - 4.9% | |||
| Multi-Sector Holdings - 4.9% | |||
| Berkshire Hathaway, Inc. Class B (a) | 800,000 | 160,712,000 | |
| Equity Real Estate Investment Trusts (REITs) - 19.7% | |||
| Diversified REITs - 0.5% | |||
| VEREIT, Inc. | 1,082,124 | 9,057,378 | |
| Washington REIT (SBI) | 323,900 | 9,192,282 | |
| 18,249,660 | |||
| Health Care REITs - 1.8% | |||
| CareTrust (REIT), Inc. | 249,950 | 5,863,827 | |
| Healthcare Realty Trust, Inc. | 522,021 | 16,762,094 | |
| Ventas, Inc. | 347,892 | 22,198,989 | |
| Welltower, Inc. | 166,603 | 12,928,393 | |
| 57,753,303 | |||
| Hotel & Resort REITs - 0.6% | |||
| RLJ Lodging Trust | 723,400 | 12,710,138 | |
| Sunstone Hotel Investors, Inc. | 397,400 | 5,722,560 | |
| 18,432,698 | |||
| Industrial REITs - 2.0% | |||
| Americold Realty Trust | 201,700 | 6,153,867 | |
| Duke Realty Corp. | 332,400 | 10,164,792 | |
| Prologis, Inc. | 567,269 | 40,815,005 | |
| Terreno Realty Corp. | 210,300 | 8,841,012 | |
| 65,974,676 | |||
| Office REITs - 2.1% | |||
| Alexandria Real Estate Equities, Inc. | 179,900 | 25,646,544 | |
| Boston Properties, Inc. | 221,189 | 29,612,783 | |
| Highwoods Properties, Inc. (SBI) | 274,025 | 12,818,890 | |
| 68,078,217 | |||
| Residential REITs - 3.2% | |||
| AvalonBay Communities, Inc. | 133,194 | 26,736,032 | |
| Clipper Realty, Inc. | 460,600 | 6,167,434 | |
| Equity Lifestyle Properties, Inc. | 128,044 | 14,635,429 | |
| Equity Residential (SBI) | 76,025 | 5,726,203 | |
| Essex Property Trust, Inc. | 88,223 | 25,517,621 | |
| Invitation Homes, Inc. | 236,700 | 5,758,911 | |
| UDR, Inc. | 443,600 | 20,166,056 | |
| 104,707,686 | |||
| Retail REITs - 2.5% | |||
| Acadia Realty Trust (SBI) | 686,900 | 18,731,763 | |
| National Retail Properties, Inc. | 356,737 | 19,759,662 | |
| Simon Property Group, Inc. | 119,146 | 21,709,593 | |
| Spirit Realty Capital, Inc. | 212,940 | 8,460,106 | |
| Taubman Centers, Inc. | 268,325 | 14,189,026 | |
| 82,850,150 | |||
| Specialized REITs - 7.0% | |||
| American Tower Corp. | 309,988 | 61,086,235 | |
| Crown Castle International Corp. | 319,300 | 40,870,400 | |
| CubeSmart | 565,100 | 18,105,804 | |
| Digital Realty Trust, Inc. | 75,600 | 8,996,400 | |
| Equinix, Inc. | 83,452 | 37,817,108 | |
| Extra Space Storage, Inc. | 67,800 | 6,909,498 | |
| Four Corners Property Trust, Inc. | 319,900 | 9,469,040 | |
| Outfront Media, Inc. | 334,428 | 7,825,615 | |
| Public Storage | 21,274 | 4,633,052 | |
| VICI Properties, Inc. | 541,300 | 11,843,644 | |
| Weyerhaeuser Co. | 793,214 | 20,893,257 | |
| 228,450,053 | |||
| TOTAL EQUITY REAL ESTATE INVESTMENT TRUSTS (REITS) | 644,496,443 | ||
| Hotels, Restaurants & Leisure - 0.3% | |||
| Hotels, Resorts & Cruise Lines - 0.3% | |||
| Hilton Grand Vacations, Inc. (a) | 113,500 | 3,501,475 | |
| Hilton Worldwide Holdings, Inc. | 86,500 | 7,189,015 | |
| 10,690,490 | |||
| Household Durables - 0.6% | |||
| Homebuilding - 0.6% | |||
| D.R. Horton, Inc. | 500,000 | 20,690,000 | |
| Insurance - 18.0% | |||
| Insurance Brokers - 1.9% | |||
| Willis Group Holdings PLC | 350,000 | 61,477,500 | |
| Life & Health Insurance - 2.7% | |||
| MetLife, Inc. | 1,200,000 | 51,084,000 | |
| Torchmark Corp. | 450,000 | 36,877,500 | |
| 87,961,500 | |||
| Multi-Line Insurance - 4.6% | |||
| American International Group, Inc. | 1,250,000 | 53,825,000 | |
| Assurant, Inc. | 75,400 | 7,156,214 | |
| Hartford Financial Services Group, Inc. | 1,850,000 | 91,982,000 | |
| 152,963,214 | |||
| Property & Casualty Insurance - 6.8% | |||
| Axis Capital Holdings Ltd. | 500,000 | 27,390,000 | |
| Beazley PLC | 2,500,000 | 16,769,044 | |
| FNF Group | 2,029,162 | 74,165,871 | |
| Hiscox Ltd. | 750,000 | 15,238,665 | |
| RSA Insurance Group PLC | 1,100,000 | 7,275,225 | |
| The Travelers Companies, Inc. | 600,000 | 82,296,000 | |
| 223,134,805 | |||
| Reinsurance - 2.0% | |||
| Reinsurance Group of America, Inc. | 470,500 | 66,801,590 | |
| TOTAL INSURANCE | 592,338,609 | ||
| IT Services - 0.7% | |||
| Data Processing & Outsourced Services - 0.7% | |||
| Visa, Inc. Class A | 150,000 | 23,428,500 | |
| Mortgage Real Estate Investment Trusts - 2.4% | |||
| Mortgage REITs - 2.4% | |||
| AGNC Investment Corp. | 2,000,000 | 36,000,000 | |
| MFA Financial, Inc. | 6,000,000 | 43,620,000 | |
| 79,620,000 | |||
| Real Estate Management & Development - 0.8% | |||
| Real Estate Development - 0.2% | |||
| Howard Hughes Corp. (a) | 76,476 | 8,412,360 | |
| Real Estate Services - 0.6% | |||
| Jones Lang LaSalle, Inc. | 114,500 | 17,653,610 | |
| TOTAL REAL ESTATE MANAGEMENT & DEVELOPMENT | 26,065,970 | ||
| Software - 0.5% | |||
| Application Software - 0.5% | |||
| Black Knight, Inc. (a) | 288,370 | 15,716,165 | |
| Thrifts & Mortgage Finance - 1.8% | |||
| Thrifts & Mortgage Finance - 1.8% | |||
| Essent Group Ltd. (a) | 750,000 | 32,587,500 | |
| MGIC Investment Corp. (a) | 1,990,900 | 26,259,971 | |
| 58,847,471 | |||
| TOTAL COMMON STOCKS | |||
| (Cost $2,798,158,015) | 3,229,982,173 | ||
| Money Market Funds - 1.4% | |||
| Fidelity Cash Central Fund, 2.48% (b) | |||
| (Cost $47,774,063) | 47,764,661 | 47,774,214 | |
| TOTAL INVESTMENT IN SECURITIES - 99.8% | |||
| (Cost $2,845,932,078) | 3,277,756,387 | ||
| NET OTHER ASSETS (LIABILITIES) - 0.2% | 5,416,285 | ||
| NET ASSETS - 100% | $3,283,172,672 |
Legend
(a) Non-income producing
(b) Affiliated fund that is generally available only to investment companies and other accounts managed by Fidelity Investments. The rate quoted is the annualized seven-day yield of the fund at period end. A complete unaudited listing of the fund's holdings as of its most recent quarter end is available upon request. In addition, each Fidelity Central Fund's financial statements are available on the SEC's website or upon request.
Affiliated Central Funds
Information regarding fiscal year to date income earned by the Fund from investments in Fidelity Central Funds is as follows:
| Fund | Income earned |
| Fidelity Cash Central Fund | $792,591 |
| Fidelity Securities Lending Cash Central Fund | 420 |
| Total | $793,011 |
Amounts in the income column in the above table include any capital gain distributions from underlying funds, which are presented in the corresponding line-item in the Statement of Operations, if applicable.
Investment Valuation
All investments are categorized as Level 1 under the Fair Value Hierarchy. The inputs or methodology used for valuing securities may not be an indication of the risk associated with investing in those securities. For more information on valuation inputs please refer to the Investment Valuation section in the accompanying Notes to Financial Statements.
See accompanying notes which are an integral part of the financial statements.
Fidelity® Financials Central Fund
Financial Statements
Statement of Assets and Liabilities
| March 31, 2019 (Unaudited) | ||
| Assets | ||
| Investment in securities, at value — See accompanying schedule: Unaffiliated issuers (cost $2,798,158,015) | $3,229,982,173 | |
| Fidelity Central Funds (cost $47,774,063) | 47,774,214 | |
| Total Investment in Securities (cost $2,845,932,078) | $3,277,756,387 | |
| Foreign currency held at value (cost $8) | 8 | |
| Receivable for investments sold | 31,341,615 | |
| Receivable for fund shares sold | 409,250 | |
| Dividends receivable | 6,607,982 | |
| Distributions receivable from Fidelity Central Funds | 103,727 | |
| Total assets | 3,316,218,969 | |
| Liabilities | ||
| Payable to custodian bank | $17 | |
| Payable for investments purchased | 30,383,107 | |
| Payable for fund shares redeemed | 2,647,303 | |
| Other payables and accrued expenses | 15,870 | |
| Total liabilities | 33,046,297 | |
| Net Assets | $3,283,172,672 | |
| Net Assets consist of: | ||
| Paid in capital | $2,885,921,873 | |
| Total distributable earnings (loss) | 397,250,799 | |
| Net Assets, for 34,026,012 shares outstanding | $3,283,172,672 | |
| Net Asset Value, offering price and redemption price per share ($3,283,172,672 ÷ 34,026,012 shares) | $96.49 |
See accompanying notes which are an integral part of the financial statements.
Statement of Operations
| Six months ended March 31, 2019 (Unaudited) | ||
| Investment Income | ||
| Dividends | $41,554,351 | |
| Income from Fidelity Central Funds | 793,011 | |
| Total income | 42,347,362 | |
| Expenses | ||
| Custodian fees and expenses | $25,563 | |
| Independent directors' fees and expenses | 10,181 | |
| Total expenses | 35,744 | |
| Net investment income (loss) | 42,311,618 | |
| Realized and Unrealized Gain (Loss) | ||
| Net realized gain (loss) on: | ||
| Investment securities: | ||
| Unaffiliated issuers | (25,839,317) | |
| Fidelity Central Funds | (150) | |
| Foreign currency transactions | 6,951 | |
| Total net realized gain (loss) | (25,832,516) | |
| Change in net unrealized appreciation (depreciation) on: | ||
| Investment securities: | ||
| Unaffiliated issuers | (114,123,721) | |
| Fidelity Central Funds | 151 | |
| Assets and liabilities in foreign currencies | (2,090) | |
| Total change in net unrealized appreciation (depreciation) | (114,125,660) | |
| Net gain (loss) | (139,958,176) | |
| Net increase (decrease) in net assets resulting from operations | $(97,646,558) |
See accompanying notes which are an integral part of the financial statements.
Statement of Changes in Net Assets
| Six months ended March 31, 2019 (Unaudited) | Year ended September 30, 2018 | |
| Increase (Decrease) in Net Assets | ||
| Operations | ||
| Net investment income (loss) | $42,311,618 | $71,164,090 |
| Net realized gain (loss) | (25,832,516) | 360,758,594 |
| Change in net unrealized appreciation (depreciation) | (114,125,660) | (204,279,200) |
| Net increase (decrease) in net assets resulting from operations | (97,646,558) | 227,643,484 |
| Distributions to shareholders | (185,653,739) | – |
| Distributions to shareholders from net investment income | – | (61,092,879) |
| Distributions to shareholders from net realized gain | – | (190,098,519) |
| Total distributions | (185,653,739) | (251,191,398) |
| Affiliated share transactions | ||
| Proceeds from sales of shares | 84,045,215 | 1,316,467,001 |
| Reinvestment of distributions | 185,653,739 | 251,191,398 |
| Cost of shares redeemed | (340,446,803) | (936,975,564) |
| Net increase (decrease) in net assets resulting from share transactions | (70,747,849) | 630,682,835 |
| Total increase (decrease) in net assets | (354,048,146) | 607,134,921 |
| Net Assets | ||
| Beginning of period | 3,637,220,818 | 3,030,085,897 |
| End of period | $3,283,172,672 | $3,637,220,818 |
| Other Information | ||
| Undistributed net investment income end of period | $13,892,579 | |
| Shares | ||
| Sold | 886,057 | 12,423,667 |
| Issued in reinvestment of distributions | 2,119,304 | 2,355,378 |
| Redeemed | (3,490,433) | (8,820,676) |
| Net increase (decrease) | (485,072) | 5,958,369 |
See accompanying notes which are an integral part of the financial statements.
Financial Highlights
Fidelity Financials Central Fund
| Six months ended (Unaudited) March 31, | Years endedSeptember 30, | |||||
| 2019 | 2018 | 2017 | 2016 | 2015 | 2014 | |
| Selected Per–Share Data | ||||||
| Net asset value, beginning of period | $105.39 | $106.12 | $84.74 | $80.86 | $83.90 | $72.85 |
| Income from Investment Operations | ||||||
| Net investment income (loss)A | 1.23 | 2.18 | 1.70 | 1.59 | 1.57 | 1.54 |
| Net realized and unrealized gain (loss) | (4.60) | 5.49 | 21.29 | 3.79 | (3.30) | 10.84 |
| Total from investment operations | (3.37) | 7.67 | 22.99 | 5.38 | (1.73) | 12.38 |
| Distributions from net investment income | (1.19) | (1.90) | (1.50) | (1.50) | (1.31) | (1.33) |
| Distributions from net realized gain | (4.34) | (6.50) | (.12) | – | – | – |
| Total distributions | (5.53) | (8.40) | (1.61)B | (1.50) | (1.31) | (1.33) |
| Net asset value, end of period | $96.49 | $105.39 | $106.12 | $84.74 | $80.86 | $83.90 |
| Total ReturnC,D | (2.63)% | 7.23% | 27.34% | 6.68% | (2.18)% | 17.08% |
| Ratios to Average Net AssetsE,F | ||||||
| Expenses before reductionsG | - %H | -% | -% | -% | -% | -% |
| Expenses net of fee waivers, if anyG | - %H | -% | -% | -% | -% | -% |
| Expenses net of all reductionsG | - %H | -% | -% | -% | -% | -% |
| Net investment income (loss) | 2.54%H | 2.02% | 1.75% | 1.94% | 1.80% | 1.92% |
| Supplemental Data | ||||||
| Net assets, end of period (000 omitted) | $3,283,173 | $3,637,221 | $3,030,086 | $2,544,051 | $2,301,182 | $2,387,026 |
| Portfolio turnover rateI | 54%H | 48%J | 52%J | 57% | 40% | 43%J |
A Calculated based on average shares outstanding during the period.
B Total distributions of $1.61 per share is comprised of distributions from net investment income of $1.495 and distributions from net realized gain of $.119 per share.
C Total returns for periods of less than one year are not annualized.
D Total returns would have been lower if certain expenses had not been reduced during the applicable periods shown.
E Fees and expenses of any underlying Fidelity Central Funds are not included in the Fund's expense ratio. The Fund indirectly bears its proportionate share of the expenses of any underlying Fidelity Central Funds.
F Expense ratios reflect operating expenses of the Fund. Expenses before reductions do not reflect amounts reimbursed by the investment adviser or reductions from expense offset arrangements and do not represent the amount paid by the Fund during periods when reimbursements or reductions occur. Expenses net of fee waivers reflect expenses after reimbursement by the investment adviser but prior to reductions from expense offset arrangements. Expenses net of all reductions represent the net expenses paid by the Fund.
G Amount represents less than .005%.
H Annualized
I Amount does not include the portfolio activity of any underlying Fidelity Central Funds.
J Portfolio turnover rate excludes securities received or delivered in-kind.
See accompanying notes which are an integral part of the financial statements.
Fidelity® Health Care Central Fund
Investment Summary (Unaudited)
Top Ten Stocks as of March 31, 2019
| % of fund's net assets | |
| UnitedHealth Group, Inc. | 8.5 |
| Becton, Dickinson & Co. | 7.5 |
| Boston Scientific Corp. | 6.5 |
| Roche Holding AG (participation certificate) | 4.7 |
| AstraZeneca PLC (United Kingdom) | 4.3 |
| Humana, Inc. | 4.0 |
| Vertex Pharmaceuticals, Inc. | 3.7 |
| Cigna Corp. | 3.4 |
| Alexion Pharmaceuticals, Inc. | 3.0 |
| Sarepta Therapeutics, Inc. | 2.6 |
| 48.2 |
Top Industries (% of fund's net assets)
| As of March 31, 2019 | ||
| Health Care Equipment & Supplies | 28.2% | |
| Biotechnology | 26.1% | |
| Health Care Providers & Services | 25.1% | |
| Pharmaceuticals | 16.6% | |
| Software | 1.2% | |
| All Others* | 2.8% | |
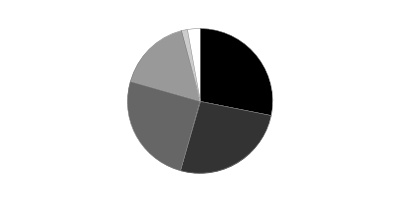
* Includes short-term investments and net other assets (liabilities).
Fidelity® Health Care Central Fund
Schedule of Investments March 31, 2019 (Unaudited)
Showing Percentage of Net Assets
| Common Stocks - 98.1% | |||
| Shares | Value | ||
| Biotechnology - 25.8% | |||
| Biotechnology - 25.8% | |||
| Abeona Therapeutics, Inc. (a)(b) | 760,000 | $5,593,600 | |
| Acceleron Pharma, Inc. (a) | 330,000 | 15,368,100 | |
| Acorda Therapeutics, Inc. (a) | 460,000 | 6,113,400 | |
| Alexion Pharmaceuticals, Inc. (a) | 640,000 | 86,515,200 | |
| Allakos, Inc. (a)(b) | 266,800 | 10,805,400 | |
| Allogene Therapeutics, Inc. (b) | 130,000 | 3,758,300 | |
| Alnylam Pharmaceuticals, Inc. (a) | 190,000 | 17,755,500 | |
| Amgen, Inc. | 194,000 | 36,856,120 | |
| Amicus Therapeutics, Inc. (a) | 760,000 | 10,336,000 | |
| AnaptysBio, Inc. (a) | 234,962 | 17,163,974 | |
| Argenx SE ADR (a) | 240,000 | 29,961,600 | |
| Array BioPharma, Inc. (a) | 1,080,000 | 26,330,400 | |
| Ascendis Pharma A/S sponsored ADR (a) | 300,000 | 35,310,000 | |
| Atara Biotherapeutics, Inc. (a) | 400,000 | 15,900,000 | |
| BeiGene Ltd. ADR (a)(b) | 160,000 | 21,120,000 | |
| BioMarin Pharmaceutical, Inc. (a) | 84,700 | 7,523,901 | |
| bluebird bio, Inc. (a) | 109,324 | 17,199,945 | |
| Blueprint Medicines Corp. (a) | 330,000 | 26,416,500 | |
| Cellectis SA sponsored ADR (a) | 201,500 | 3,695,510 | |
| FibroGen, Inc. (a) | 250,000 | 13,587,500 | |
| GlycoMimetics, Inc. (a) | 500,000 | 6,230,000 | |
| Gritstone Oncology, Inc. | 130,901 | 1,740,983 | |
| Immunomedics, Inc. (a)(b) | 900,000 | 17,289,000 | |
| Insmed, Inc. (a) | 1,000,000 | 29,070,000 | |
| Intercept Pharmaceuticals, Inc. (a)(b) | 140,000 | 15,660,400 | |
| La Jolla Pharmaceutical Co. (a)(b) | 250,000 | 1,607,500 | |
| Morphosys AG (a) | 80,000 | 7,282,401 | |
| Neurocrine Biosciences, Inc. (a) | 270,000 | 23,787,000 | |
| Principia Biopharma, Inc. | 240,000 | 8,160,000 | |
| Sage Therapeutics, Inc. (a) | 21,422 | 3,407,169 | |
| Sarepta Therapeutics, Inc. (a)(b) | 630,000 | 75,089,700 | |
| Scholar Rock Holding Corp. | 19,917 | 374,240 | |
| uniQure B.V. (a) | 200,000 | 11,930,000 | |
| Vertex Pharmaceuticals, Inc. (a) | 575,000 | 105,771,250 | |
| Viking Therapeutics, Inc. (a)(b) | 500,000 | 4,970,000 | |
| Xencor, Inc. (a) | 454,033 | 14,102,265 | |
| Zymeworks, Inc. (a) | 276,363 | 4,471,553 | |
| 738,254,411 | |||
| Diversified Consumer Services - 0.2% | |||
| Specialized Consumer Services - 0.2% | |||
| Carriage Services, Inc. | 240,000 | 4,620,000 | |
| Health Care Equipment & Supplies - 28.2% | |||
| Health Care Equipment - 27.9% | |||
| Atricure, Inc. (a) | 600,000 | 16,074,000 | |
| Becton, Dickinson & Co. | 860,000 | 214,767,800 | |
| Boston Scientific Corp. (a) | 4,800,000 | 184,224,000 | |
| Danaher Corp. | 290,000 | 38,285,800 | |
| Hologic, Inc. (a) | 560,000 | 27,104,000 | |
| Insulet Corp. (a) | 400,000 | 38,036,000 | |
| Integra LifeSciences Holdings Corp. (a) | 280,000 | 15,601,600 | |
| Intuitive Surgical, Inc. (a) | 120,000 | 68,469,600 | |
| Masimo Corp. (a) | 240,000 | 33,187,200 | |
| Penumbra, Inc. (a) | 228,000 | 33,518,280 | |
| Stryker Corp. | 370,000 | 73,082,400 | |
| Teleflex, Inc. | 80,000 | 24,172,800 | |
| Wright Medical Group NV (a) | 1,000,000 | 31,450,000 | |
| 797,973,480 | |||
| Health Care Supplies - 0.3% | |||
| Align Technology, Inc. (a) | 26,000 | 7,392,580 | |
| TOTAL HEALTH CARE EQUIPMENT & SUPPLIES | 805,366,060 | ||
| Health Care Providers & Services - 24.9% | |||
| Health Care Distributors & Services - 1.4% | |||
| AmerisourceBergen Corp. | 140,000 | 11,132,800 | |
| Covetrus, Inc. (a) | 420,000 | 13,377,000 | |
| EBOS Group Ltd. | 1,050,000 | 15,731,100 | |
| 40,240,900 | |||
| Health Care Facilities - 2.4% | |||
| HCA Holdings, Inc. | 528,000 | 68,840,640 | |
| Health Care Services - 3.9% | |||
| Cigna Corp. | 600,000 | 96,492,000 | |
| G1 Therapeutics, Inc. (a) | 370,000 | 6,142,000 | |
| Premier, Inc. (a) | 240,000 | 8,277,600 | |
| 110,911,600 | |||
| Managed Health Care - 17.2% | |||
| Centene Corp. (a) | 400,000 | 21,240,000 | |
| Humana, Inc. | 428,000 | 113,848,000 | |
| Molina Healthcare, Inc. (a) | 281,100 | 39,904,956 | |
| Notre Dame Intermedica Participacoes SA | 2,800,000 | 23,456,396 | |
| UnitedHealth Group, Inc. | 980,000 | 242,314,800 | |
| Wellcare Health Plans, Inc. (a) | 190,000 | 51,252,500 | |
| 492,016,652 | |||
| TOTAL HEALTH CARE PROVIDERS & SERVICES | 712,009,792 | ||
| Health Care Technology - 0.7% | |||
| Health Care Technology - 0.7% | |||
| Castlight Health, Inc. (a) | 700,500 | 2,626,875 | |
| Castlight Health, Inc. Class B (a) | 800,000 | 3,000,000 | |
| Teladoc Health, Inc. (a)(b) | 260,000 | 14,456,000 | |
| 20,082,875 | |||
| Life Sciences Tools & Services - 0.8% | |||
| Life Sciences Tools & Services - 0.8% | |||
| Lonza Group AG | 69,000 | 21,398,142 | |
| Pharmaceuticals - 16.5% | |||
| Pharmaceuticals - 16.5% | |||
| Allergan PLC | 220,000 | 32,210,200 | |
| Amneal Pharmaceuticals, Inc. (a) | 37,200 | 527,124 | |
| Amneal Pharmaceuticals, Inc. (c) | 540,541 | 7,659,466 | |
| AstraZeneca PLC (United Kingdom) | 1,529,700 | 122,102,868 | |
| Bristol-Myers Squibb Co. | 760,000 | 36,259,600 | |
| Dechra Pharmaceuticals PLC | 660,000 | 23,192,467 | |
| Eli Lilly & Co. | 200,000 | 25,952,000 | |
| Mylan NV (a) | 140,000 | 3,967,600 | |
| MyoKardia, Inc. (a) | 195,700 | 10,174,443 | |
| Nektar Therapeutics (a) | 580,000 | 19,488,000 | |
| Recordati SpA | 270,000 | 10,512,704 | |
| Roche Holding AG (participation certificate) | 490,000 | 135,021,892 | |
| RPI International Holdings LP (a)(c)(d) | 41,845 | 6,386,384 | |
| The Medicines Company (a)(b) | 400,000 | 11,180,000 | |
| Theravance Biopharma, Inc. (a)(b) | 500,000 | 11,335,000 | |
| Zogenix, Inc. (a) | 260,000 | 14,302,600 | |
| 470,272,348 | |||
| Software - 1.0% | |||
| Application Software - 1.0% | |||
| Benefitfocus, Inc. (a)(b) | 575,000 | 28,474,000 | |
| TOTAL COMMON STOCKS | |||
| (Cost $2,190,481,927) | 2,800,477,628 | ||
| Convertible Preferred Stocks - 0.8% | |||
| Biotechnology - 0.3% | |||
| Biotechnology - 0.3% | |||
| BioNTech AG: | |||
| Series A (a)(c)(d) | 25,477 | 7,255,020 | |
| Series A (d) | 6,787 | 1,932,717 | |
| Generation Bio Series B (a)(c)(d) | 49,800 | 452,682 | |
| 9,640,419 | |||
| Health Care Providers & Services - 0.2% | |||
| Health Care Services - 0.2% | |||
| 1Life Healthcare, Inc. Series G (a)(c)(d) | 438,101 | 5,445,595 | |
| Pharmaceuticals - 0.1% | |||
| Pharmaceuticals - 0.1% | |||
| Harmony Biosciences II, Inc. Series A (a)(c)(d) | 3,606,378 | 3,606,378 | |
| Software - 0.2% | |||
| Application Software - 0.2% | |||
| Outset Medical, Inc.: | |||
| Series C (a)(c)(d) | 997,101 | 3,100,984 | |
| Series D (c)(d) | 482,315 | 1,500,000 | |
| 4,600,984 | |||
| TOTAL CONVERTIBLE PREFERRED STOCKS | |||
| (Cost $18,562,247) | 23,293,376 | ||
| Money Market Funds - 6.0% | |||
| Fidelity Cash Central Fund, 2.48% (e) | 36,619,799 | 36,627,123 | |
| Fidelity Securities Lending Cash Central Fund 2.48% (e)(f) | 134,841,907 | 134,855,392 | |
| TOTAL MONEY MARKET FUNDS | |||
| (Cost $171,482,515) | 171,482,515 | ||
| TOTAL INVESTMENT IN SECURITIES - 104.9% | |||
| (Cost $2,380,526,689) | 2,995,253,519 | ||
| NET OTHER ASSETS (LIABILITIES) - (4.9)% | (138,993,022) | ||
| NET ASSETS - 100% | $2,856,260,497 |
Legend
(a) Non-income producing
(b) Security or a portion of the security is on loan at period end.
(c) Restricted securities - Investment in securities not registered under the Securities Act of 1933 (excluding 144A issues). At the end of the period, the value of restricted securities (excluding 144A issues) amounted to $35,406,510 or 1.2% of net assets.
(d) Level 3 security
(e) Affiliated fund that is generally available only to investment companies and other accounts managed by Fidelity Investments. The rate quoted is the annualized seven-day yield of the fund at period end. A complete unaudited listing of the fund's holdings as of its most recent quarter end is available upon request. In addition, each Fidelity Central Fund's financial statements are available on the SEC's website or upon request.
(f) Investment made with cash collateral received from securities on loan.
Additional information on each restricted holding is as follows:
| Security | Acquisition Date | Acquisition Cost |
| 1Life Healthcare, Inc. Series G | 4/10/14 | $2,885,246 |
| Amneal Pharmaceuticals, Inc. | 5/4/18 | $9,864,873 |
| BioNTech AG Series A | 12/29/17 | $5,579,683 |
| Generation Bio Series B | 2/21/18 | $455,456 |
| Harmony Biosciences II, Inc. Series A | 9/22/17 | $3,606,378 |
| Outset Medical, Inc. Series C | 4/19/17 | $2,583,987 |
| Outset Medical, Inc. Series D | 8/20/18 | $1,500,000 |
| RPI International Holdings LP | 5/21/15 - 3/23/16 | $5,567,439 |
Affiliated Central Funds
Information regarding fiscal year to date income earned by the Fund from investments in Fidelity Central Funds is as follows:
| Fund | Income earned |
| Fidelity Cash Central Fund | $284,777 |
| Fidelity Securities Lending Cash Central Fund | 145,056 |
| Total | $429,833 |
Amounts in the income column in the above table include any capital gain distributions from underlying funds, which are presented in the corresponding line-item in the Statement of Operations, if applicable.
Investment Valuation
The following is a summary of the inputs used, as of March 31, 2019, involving the Fund's assets and liabilities carried at fair value. The inputs or methodology used for valuing securities may not be an indication of the risk associated with investing in those securities. For more information on valuation inputs, and their aggregation into the levels used below, please refer to the Investment Valuation section in the accompanying Notes to Financial Statements.
| Valuation Inputs at Reporting Date: | ||||
| Description | Total | Level 1 | Level 2 | Level 3 |
| Investments in Securities: | ||||
| Common Stocks | $2,800,477,628 | $2,536,966,484 | $257,124,760 | $6,386,384 |
| Convertible Preferred Stocks | 23,293,376 | -- | -- | 23,293,376 |
| Money Market Funds | 171,482,515 | 171,482,515 | -- | -- |
| Total Investments in Securities: | $2,995,253,519 | $2,708,448,999 | $257,124,760 | $29,679,760 |
Other Information
Distribution of investments by country or territory of incorporation, as a percentage of Total Net Assets, is as follows (Unaudited):
| United States of America | 80.5% |
| Switzerland | 5.5% |
| United Kingdom | 5.1% |
| Netherlands | 2.7% |
| Cayman Islands | 1.3% |
| Denmark | 1.2% |
| Ireland | 1.1% |
| Others (Individually Less Than 1%) | 2.6% |
| 100.0% |
See accompanying notes which are an integral part of the financial statements.
Fidelity® Health Care Central Fund
Financial Statements
Statement of Assets and Liabilities
| March 31, 2019 (Unaudited) | ||
| Assets | ||
| Investment in securities, at value (including securities loaned of $134,768,567) — See accompanying schedule: Unaffiliated issuers (cost $2,209,044,174) | $2,823,771,004 | |
| Fidelity Central Funds (cost $171,482,515) | 171,482,515 | |
| Total Investment in Securities (cost $2,380,526,689) | $2,995,253,519 | |
| Cash | 104,614 | |
| Receivable for investments sold | 4,502,028 | |
| Receivable for fund shares sold | 325,948 | |
| Dividends receivable | 2,410,855 | |
| Distributions receivable from Fidelity Central Funds | 84,236 | |
| Other receivables | 126 | |
| Total assets | 3,002,681,326 | |
| Liabilities | ||
| Payable for investments purchased | $9,218,772 | |
| Payable for fund shares redeemed | 2,322,446 | |
| Other payables and accrued expenses | 28,130 | |
| Collateral on securities loaned | 134,851,481 | |
| Total liabilities | 146,420,829 | |
| Net Assets | $2,856,260,497 | |
| Net Assets consist of: | ||
| Paid in capital | $2,242,609,047 | |
| Total distributable earnings (loss) | 613,651,450 | |
| Net Assets, for 6,661,283 shares outstanding | $2,856,260,497 | |
| Net Asset Value, offering price and redemption price per share ($2,856,260,497 ÷ 6,661,283 shares) | $428.79 |
See accompanying notes which are an integral part of the financial statements.
Statement of Operations
| Six months ended March 31, 2019 (Unaudited) | ||
| Investment Income | ||
| Dividends | $13,929,116 | |
| Income from Fidelity Central Funds | 429,833 | |
| Total income | 14,358,949 | |
| Expenses | ||
| Custodian fees and expenses | $42,232 | |
| Independent directors' fees and expenses | 8,899 | |
| Interest | 1,385 | |
| Total expenses before reductions | 52,516 | |
| Expense reductions | (893) | |
| Total expenses after reductions | 51,623 | |
| Net investment income (loss) | 14,307,326 | |
| Realized and Unrealized Gain (Loss) | ||
| Net realized gain (loss) on: | ||
| Investment securities: | ||
| Unaffiliated issuers | 26,888,172 | |
| Fidelity Central Funds | (1,994) | |
| Foreign currency transactions | 56,495 | |
| Total net realized gain (loss) | 26,942,673 | |
| Change in net unrealized appreciation (depreciation) on: | ||
| Investment securities: | ||
| Unaffiliated issuers | (234,440,205) | |
| Assets and liabilities in foreign currencies | 2,563 | |
| Total change in net unrealized appreciation (depreciation) | (234,437,642) | |
| Net gain (loss) | (207,494,969) | |
| Net increase (decrease) in net assets resulting from operations | $(193,187,643) |
See accompanying notes which are an integral part of the financial statements.
Statement of Changes in Net Assets
| Six months ended March 31, 2019 (Unaudited) | Year ended September 30, 2018 | |
| Increase (Decrease) in Net Assets | ||
| Operations | ||
| Net investment income (loss) | $14,307,326 | $24,430,356 |
| Net realized gain (loss) | 26,942,673 | 358,697,839 |
| Change in net unrealized appreciation (depreciation) | (234,437,642) | 303,099,055 |
| Net increase (decrease) in net assets resulting from operations | (193,187,643) | 686,227,250 |
| Distributions to shareholders | (159,813,899) | – |
| Distributions to shareholders from net investment income | – | (23,298,937) |
| Distributions to shareholders from net realized gain | – | (75,390,756) |
| Total distributions | (159,813,899) | (98,689,693) |
| Affiliated share transactions | ||
| Proceeds from sales of shares | 69,849,822 | 1,130,407,533 |
| Reinvestment of distributions | 159,813,899 | 98,689,693 |
| Cost of shares redeemed | (366,985,567) | (805,149,604) |
| Net increase (decrease) in net assets resulting from share transactions | (137,321,846) | 423,947,622 |
| Total increase (decrease) in net assets | (490,323,388) | 1,011,485,179 |
| Net Assets | ||
| Beginning of period | 3,346,583,885 | 2,335,098,706 |
| End of period | $2,856,260,497 | $3,346,583,885 |
| Other Information | ||
| Undistributed net investment income end of period | $3,486,333 | |
| Shares | ||
| Sold | 167,527 | 2,775,832 |
| Issued in reinvestment of distributions | 415,856 | 253,161 |
| Redeemed | (846,998) | (1,940,103) |
| Net increase (decrease) | (263,615) | 1,088,890 |
See accompanying notes which are an integral part of the financial statements.
Financial Highlights
Fidelity Health Care Central Fund
| Six months ended (Unaudited) March 31, | Years endedSeptember 30, | |||||
| 2019 | 2018 | 2017 | 2016 | 2015 | 2014 | |
| Selected Per–Share Data | ||||||
| Net asset value, beginning of period | $483.27 | $400.12 | $348.64 | $326.12 | $309.84 | $222.42 |
| Income from Investment Operations | ||||||
| Net investment income (loss)A | 2.10 | 3.66 | 3.39 | 2.85 | 2.36 | 1.34 |
| Net realized and unrealized gain (loss) | (32.43) | 95.26 | 51.07 | 22.25 | 15.99 | 87.35 |
| Total from investment operations | (30.32) | 98.92 | 54.46 | 25.10 | 18.35 | 88.69 |
| Distributions from net investment income | (1.32) | (3.54) | (2.98) | (2.58) | (2.07) | (1.27) |
| Distributions from net realized gain | (22.83) | (12.23) | – | – | – | – |
| Total distributions | (24.16)B | (15.77) | (2.98) | (2.58) | (2.07) | (1.27) |
| Net asset value, end of period | $428.79 | $483.27 | $400.12 | $348.64 | $326.12 | $309.84 |
| Total ReturnC,D | (5.69)% | 25.71% | 15.72% | 7.73% | 5.85% | 39.95% |
| Ratios to Average Net AssetsE,F | ||||||
| Expenses before reductions | - %G,H | - %H | - %H | - %H | - %H | .01% |
| Expenses net of fee waivers, if any | - %G,H | - %H | - %H | - %H | - %H | .01% |
| Expenses net of all reductions | - %G,H | - %H | - %H | - %H | - %H | .01% |
| Net investment income (loss) | .98%G | .87% | .95% | .85% | .66% | .49% |
| Supplemental Data | ||||||
| Net assets, end of period (000 omitted) | $2,856,260 | $3,346,584 | $2,335,099 | $1,958,248 | $1,749,910 | $1,806,204 |
| Portfolio turnover rateI | 50%G | 75%J | 79%J | 68% | 97% | 131%J |
A Calculated based on average shares outstanding during the period.
B Total distributions of $24.16 per share is comprised of distributions from net investment income of $1.323 and distributions from net realized gain of $22.832 per share.
C Total returns for periods of less than one year are not annualized.
D Total returns would have been lower if certain expenses had not been reduced during the applicable periods shown.
E Fees and expenses of any underlying Fidelity Central Funds are not included in the Fund's expense ratio. The Fund indirectly bears its proportionate share of the expenses of any underlying Fidelity Central Funds.
F Expense ratios reflect operating expenses of the Fund. Expenses before reductions do not reflect amounts reimbursed by the investment adviser or reductions from expense offset arrangements and do not represent the amount paid by the Fund during periods when reimbursements or reductions occur. Expenses net of fee waivers reflect expenses after reimbursement by the investment adviser but prior to reductions from expense offset arrangements. Expenses net of all reductions represent the net expenses paid by the Fund.
G Annualized
H Amount represents less than .005%.
I Amount does not include the portfolio activity of any underlying Fidelity Central Funds.
J Portfolio turnover rate excludes securities received or delivered in-kind.
See accompanying notes which are an integral part of the financial statements.
Fidelity® Industrials Central Fund
Investment Summary (Unaudited)
Top Ten Stocks as of March 31, 2019
| % of fund's net assets | |
| The Boeing Co. | 11.8 |
| Emerson Electric Co. | 5.9 |
| Lockheed Martin Corp. | 5.8 |
| Ingersoll-Rand PLC | 5.6 |
| Union Pacific Corp. | 5.3 |
| Fortive Corp. | 5.3 |
| Honeywell International, Inc. | 4.9 |
| CSX Corp. | 4.9 |
| Caterpillar, Inc. | 4.0 |
| AMETEK, Inc. | 3.8 |
| 57.3 |
Top Industries (% of fund's net assets)
| As of March 31, 2019 | ||
| Aerospace & Defense | 23.0% | |
| Machinery | 17.6% | |
| Electrical Equipment | 15.0% | |
| Road & Rail | 14.6% | |
| Industrial Conglomerates | 9.1% | |
| All Others* | 20.7% | |
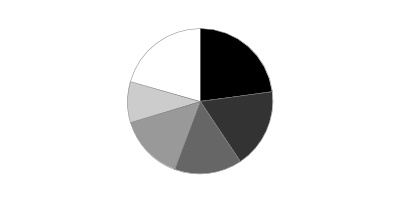
* Includes short-term investments and net other assets (liabilities).
Fidelity® Industrials Central Fund
Schedule of Investments March 31, 2019 (Unaudited)
Showing Percentage of Net Assets
| Common Stocks - 98.9% | |||
| Shares | Value | ||
| Aerospace & Defense - 23.0% | |||
| Aerospace & Defense - 23.0% | |||
| Curtiss-Wright Corp. | 81,900 | $9,282,546 | |
| HEICO Corp. Class A | 130,200 | 10,944,612 | |
| L3 Technologies, Inc. | 198,500 | 40,964,445 | |
| Lockheed Martin Corp. | 350,600 | 105,236,096 | |
| The Boeing Co. | 558,000 | 212,832,361 | |
| United Technologies Corp. | 271,285 | 34,965,924 | |
| 414,225,984 | |||
| Air Freight & Logistics - 3.6% | |||
| Air Freight & Logistics - 3.6% | |||
| C.H. Robinson Worldwide, Inc. | 196,800 | 17,119,632 | |
| FedEx Corp. | 265,600 | 48,182,496 | |
| 65,302,128 | |||
| Airlines - 4.4% | |||
| Airlines - 4.4% | |||
| Alaska Air Group, Inc. | 373,800 | 20,977,656 | |
| Delta Air Lines, Inc. | 918,800 | 47,456,020 | |
| Spirit Airlines, Inc. (a) | 193,000 | 10,201,980 | |
| 78,635,656 | |||
| Building Products - 1.3% | |||
| Building Products - 1.3% | |||
| Fortune Brands Home & Security, Inc. | 504,300 | 24,009,723 | |
| Commercial Services & Supplies - 4.7% | |||
| Diversified Support Services - 2.5% | |||
| Cintas Corp. | 190,200 | 38,441,322 | |
| Healthcare Services Group, Inc. (b) | 203,900 | 6,726,661 | |
| 45,167,983 | |||
| Environmental & Facility Services - 2.2% | |||
| Waste Connection, Inc. (United States) | 451,250 | 39,976,238 | |
| TOTAL COMMERCIAL SERVICES & SUPPLIES | 85,144,221 | ||
| Electrical Equipment - 15.0% | |||
| Electrical Components & Equipment - 15.0% | |||
| AMETEK, Inc. | 832,517 | 69,073,935 | |
| Emerson Electric Co. | 1,550,000 | 106,128,500 | |
| Fortive Corp. | 1,142,442 | 95,839,459 | |
| 271,041,894 | |||
| Industrial Conglomerates - 9.1% | |||
| Industrial Conglomerates - 9.1% | |||
| Carlisle Companies, Inc. | 170,400 | 20,894,448 | |
| General Electric Co. | 5,353,400 | 53,480,466 | |
| Honeywell International, Inc. | 559,412 | 88,901,755 | |
| 163,276,669 | |||
| Machinery - 17.6% | |||
| Construction Machinery & Heavy Trucks - 4.6% | |||
| Caterpillar, Inc. | 537,269 | 72,794,577 | |
| WABCO Holdings, Inc. (a) | 75,100 | 9,900,433 | |
| 82,695,010 | |||
| Industrial Machinery - 13.0% | |||
| Flowserve Corp. | 744,100 | 33,588,674 | |
| Gardner Denver Holdings, Inc. (a) | 1,810,500 | 50,350,005 | |
| IDEX Corp. | 323,706 | 49,119,148 | |
| Ingersoll-Rand PLC | 932,962 | 100,713,248 | |
| 233,771,075 | |||
| TOTAL MACHINERY | 316,466,085 | ||
| Professional Services - 3.5% | |||
| Research & Consulting Services - 3.5% | |||
| IHS Markit Ltd. (a) | 498,590 | 27,113,324 | |
| TransUnion Holding Co., Inc. | 551,500 | 36,862,260 | |
| 63,975,584 | |||
| Road & Rail - 14.6% | |||
| Railroads - 11.3% | |||
| CSX Corp. | 1,181,500 | 88,399,830 | |
| Genesee & Wyoming, Inc. Class A (a) | 219,500 | 19,127,230 | |
| Union Pacific Corp. | 575,600 | 96,240,320 | |
| 203,767,380 | |||
| Trucking - 3.3% | |||
| Landstar System, Inc. | 168,800 | 18,465,032 | |
| Lyft, Inc. | 10,500 | 822,045 | |
| Old Dominion Freight Lines, Inc. | 272,200 | 39,302,958 | |
| 58,590,035 | |||
| TOTAL ROAD & RAIL | 262,357,415 | ||
| Trading Companies & Distributors - 2.1% | |||
| Trading Companies & Distributors - 2.1% | |||
| HD Supply Holdings, Inc. (a) | 884,400 | 38,338,740 | |
| TOTAL COMMON STOCKS | |||
| (Cost $1,500,541,783) | 1,782,774,099 | ||
| Money Market Funds - 1.2% | |||
| Fidelity Cash Central Fund, 2.48% (c) | 20,810,953 | 20,815,115 | |
| Fidelity Securities Lending Cash Central Fund 2.48% (c)(d) | 20,098 | 20,100 | |
| TOTAL MONEY MARKET FUNDS | |||
| (Cost $20,835,115) | 20,835,215 | ||
| TOTAL INVESTMENT IN SECURITIES - 100.1% | |||
| (Cost $1,521,376,898) | 1,803,609,314 | ||
| NET OTHER ASSETS (LIABILITIES) - (0.1)% | (1,581,991) | ||
| NET ASSETS - 100% | $1,802,027,323 |
Legend
(a) Non-income producing
(b) Security or a portion of the security is on loan at period end.
(c) Affiliated fund that is generally available only to investment companies and other accounts managed by Fidelity Investments. The rate quoted is the annualized seven-day yield of the fund at period end. A complete unaudited listing of the fund's holdings as of its most recent quarter end is available upon request. In addition, each Fidelity Central Fund's financial statements are available on the SEC's website or upon request.
(d) Investment made with cash collateral received from securities on loan.
Affiliated Central Funds
Information regarding fiscal year to date income earned by the Fund from investments in Fidelity Central Funds is as follows:
| Fund | Income earned |
| Fidelity Cash Central Fund | $255,279 |
| Fidelity Securities Lending Cash Central Fund | 123,431 |
| Total | $378,710 |
Amounts in the income column in the above table include any capital gain distributions from underlying funds, which are presented in the corresponding line-item in the Statement of Operations, if applicable.
Investment Valuation
All investments are categorized as Level 1 under the Fair Value Hierarchy. The inputs or methodology used for valuing securities may not be an indication of the risk associated with investing in those securities. For more information on valuation inputs please refer to the Investment Valuation section in the accompanying Notes to Financial Statements.
See accompanying notes which are an integral part of the financial statements.
Fidelity® Industrials Central Fund
Financial Statements
Statement of Assets and Liabilities
| March 31, 2019 (Unaudited) | ||
| Assets | ||
| Investment in securities, at value (including securities loaned of $19,794) — See accompanying schedule: Unaffiliated issuers (cost $1,500,541,783) | $1,782,774,099 | |
| Fidelity Central Funds (cost $20,835,115) | 20,835,215 | |
| Total Investment in Securities (cost $1,521,376,898) | $1,803,609,314 | |
| Receivable for fund shares sold | 227,299 | |
| Dividends receivable | 462,548 | |
| Distributions receivable from Fidelity Central Funds | 24,304 | |
| Total assets | 1,804,323,465 | |
| Liabilities | ||
| Payable for investments purchased | $756,000 | |
| Payable for fund shares redeemed | 1,508,111 | |
| Other payables and accrued expenses | 11,931 | |
| Collateral on securities loaned | 20,100 | |
| Total liabilities | 2,296,142 | |
| Net Assets | $1,802,027,323 | |
| Net Assets consist of: | ||
| Paid in capital | $1,571,081,378 | |
| Total distributable earnings (loss) | 230,945,945 | |
| Net Assets, for 6,605,372 shares outstanding | $1,802,027,323 | |
| Net Asset Value, offering price and redemption price per share ($1,802,027,323 ÷ 6,605,372 shares) | $272.81 |
See accompanying notes which are an integral part of the financial statements.
Statement of Operations
| Six months ended March 31, 2019 (Unaudited) | ||
| Investment Income | ||
| Dividends | $16,400,984 | |
| Income from Fidelity Central Funds | 378,710 | |
| Total income | 16,779,694 | |
| Expenses | ||
| Custodian fees and expenses | $14,513 | |
| Independent directors' fees and expenses | 5,565 | |
| Interest | 2,666 | |
| Total expenses before reductions | 22,744 | |
| Expense reductions | (1,324) | |
| Total expenses after reductions | 21,420 | |
| Net investment income (loss) | 16,758,274 | |
| Realized and Unrealized Gain (Loss) | ||
| Net realized gain (loss) on: | ||
| Investment securities: | ||
| Unaffiliated issuers | (52,722,690) | |
| Foreign currency transactions | (69,123) | |
| Total net realized gain (loss) | (52,791,813) | |
| Change in net unrealized appreciation (depreciation) on: | ||
| Investment securities: | ||
| Unaffiliated issuers | (109,737,281) | |
| Fidelity Central Funds | 100 | |
| Assets and liabilities in foreign currencies | (943) | |
| Total change in net unrealized appreciation (depreciation) | (109,738,124) | |
| Net gain (loss) | (162,529,937) | |
| Net increase (decrease) in net assets resulting from operations | $(145,771,663) |
See accompanying notes which are an integral part of the financial statements.
Statement of Changes in Net Assets
| Six months ended March 31, 2019 (Unaudited) | Year ended September 30, 2018 | |
| Increase (Decrease) in Net Assets | ||
| Operations | ||
| Net investment income (loss) | $16,758,274 | $27,306,734 |
| Net realized gain (loss) | (52,791,813) | 215,387,204 |
| Change in net unrealized appreciation (depreciation) | (109,738,124) | 19,744,350 |
| Net increase (decrease) in net assets resulting from operations | (145,771,663) | 262,438,288 |
| Distributions to shareholders | (93,393,195) | – |
| Distributions to shareholders from net investment income | – | (25,966,468) |
| Distributions to shareholders from net realized gain | – | (84,959,878) |
| Total distributions | (93,393,195) | (110,926,346) |
| Affiliated share transactions | ||
| Proceeds from sales of shares | 43,684,566 | 805,879,787 |
| Reinvestment of distributions | 93,393,195 | 110,926,346 |
| Cost of shares redeemed | (249,952,284) | (522,860,800) |
| Net increase (decrease) in net assets resulting from share transactions | (112,874,523) | 393,945,333 |
| Total increase (decrease) in net assets | (352,039,381) | 545,457,275 |
| Net Assets | ||
| Beginning of period | 2,154,066,704 | 1,608,609,429 |
| End of period | $1,802,027,323 | $2,154,066,704 |
| Other Information | ||
| Undistributed net investment income end of period | $3,059,442 | |
| Shares | ||
| Sold | 169,248 | 2,758,582 |
| Issued in reinvestment of distributions | 395,808 | 378,216 |
| Redeemed | (913,610) | (1,774,639) |
| Net increase (decrease) | (348,554) | 1,362,159 |
See accompanying notes which are an integral part of the financial statements.
Financial Highlights
Fidelity Industrials Central Fund
| Six months ended (Unaudited) March 31, | Years endedSeptember 30, | |||||
| 2019 | 2018 | 2017 | 2016 | 2015 | 2014 | |
| Selected Per–Share Data | ||||||
| Net asset value, beginning of period | $309.76 | $287.67 | $242.21 | $209.67 | $216.95 | $198.24 |
| Income from Investment Operations | ||||||
| Net investment income (loss)A | 2.49 | 4.24 | 4.16 | 3.47 | 3.40 | 3.18 |
| Net realized and unrealized gain (loss) | (25.14) | 36.93 | 46.01 | 32.56 | (7.35) | 18.69 |
| Total from investment operations | (22.65) | 41.17 | 50.17 | 36.03 | (3.95) | 21.87 |
| Distributions from net investment income | (2.15) | (4.06) | (3.85) | (3.49) | (3.33) | (3.16) |
| Distributions from net realized gain | (12.15) | (15.02) | (.86) | – | – | – |
| Total distributions | (14.30) | (19.08) | (4.71) | (3.49) | (3.33) | (3.16) |
| Net asset value, end of period | $272.81 | $309.76 | $287.67 | $242.21 | $209.67 | $216.95 |
| Total ReturnB,C | (6.57)% | 14.76% | 20.91% | 17.24% | (1.95)% | 11.03% |
| Ratios to Average Net AssetsD,E | ||||||
| Expenses before reductionsF | - %G | -% | -% | -% | -% | -% |
| Expenses net of fee waivers, if anyF | - %G | -% | -% | -% | -% | -% |
| Expenses net of all reductionsF | - %G | -% | -% | -% | -% | -% |
| Net investment income (loss) | 1.86%G | 1.43% | 1.56% | 1.50% | 1.48% | 1.46% |
| Supplemental Data | ||||||
| Net assets, end of period (000 omitted) | $1,802,027 | $2,154,067 | $1,608,609 | $1,376,236 | $1,173,665 | $1,301,010 |
| Portfolio turnover rateH | 128%G | 65%I | 65%I | 60% | 83% | 77%I |
A Calculated based on average shares outstanding during the period.
B Total returns for periods of less than one year are not annualized.
C Total returns would have been lower if certain expenses had not been reduced during the applicable periods shown.
D Fees and expenses of any underlying Fidelity Central Funds are not included in the Fund's expense ratio. The Fund indirectly bears its proportionate share of the expenses of any underlying Fidelity Central Funds.
E Expense ratios reflect operating expenses of the Fund. Expenses before reductions do not reflect amounts reimbursed by the investment adviser or reductions from expense offset arrangements and do not represent the amount paid by the Fund during periods when reimbursements or reductions occur. Expenses net of fee waivers reflect expenses after reimbursement by the investment adviser but prior to reductions from expense offset arrangements. Expenses net of all reductions represent the net expenses paid by the Fund.
F Amount represents less than .005%.
G Annualized
H Amount does not include the portfolio activity of any underlying Fidelity Central Funds.
I Portfolio turnover rate excludes securities received or delivered in-kind.
See accompanying notes which are an integral part of the financial statements.
Fidelity® Information Technology Central Fund
Investment Summary (Unaudited)
Top Ten Stocks as of March 31, 2019
| % of fund's net assets | |
| Microsoft Corp. | 19.0 |
| Apple, Inc. | 18.8 |
| Adobe, Inc. | 5.2 |
| Salesforce.com, Inc. | 3.9 |
| NVIDIA Corp. | 3.8 |
| Analog Devices, Inc. | 3.5 |
| PayPal Holdings, Inc. | 2.9 |
| Citrix Systems, Inc. | 2.0 |
| Electronic Arts, Inc. | 1.9 |
| Cognizant Technology Solutions Corp. Class A | 1.8 |
| 62.8 |
Top Industries (% of fund's net assets)
| As of March 31, 2019 | ||
| Software | 37.6% | |
| Technology Hardware, Storage & Peripherals | 20.3% | |
| Semiconductors & Semiconductor Equipment | 15.3% | |
| IT Services | 13.3% | |
| Electronic Equipment & Components | 4.3% | |
| All Others* | 9.2% | |
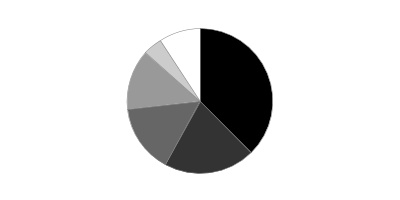
* Includes short-term investments and net other assets (liabilities).
Fidelity® Information Technology Central Fund
Schedule of Investments March 31, 2019 (Unaudited)
Showing Percentage of Net Assets
| Common Stocks - 95.9% | |||
| Shares | Value | ||
| Communications Equipment - 0.1% | |||
| Communications Equipment - 0.1% | |||
| CommScope Holding Co., Inc. (a) | 282,300 | $6,134,379 | |
| Electronic Equipment & Components - 4.3% | |||
| Electronic Components - 1.0% | |||
| Corning, Inc. | 1,235,181 | 40,884,491 | |
| Electronic Equipment & Instruments - 1.5% | |||
| Cognex Corp. | 373,051 | 18,973,374 | |
| Trimble, Inc. (a) | 1,066,979 | 43,105,952 | |
| 62,079,326 | |||
| Electronic Manufacturing Services - 1.8% | |||
| Jabil, Inc. | 522,300 | 13,887,957 | |
| TE Connectivity Ltd. | 798,639 | 64,490,099 | |
| 78,378,056 | |||
| TOTAL ELECTRONIC EQUIPMENT & COMPONENTS | 181,341,873 | ||
| Entertainment - 1.9% | |||
| Interactive Home Entertainment - 1.9% | |||
| Electronic Arts, Inc. (a) | 797,200 | 81,019,436 | |
| Equity Real Estate Investment Trusts (REITs) - 0.6% | |||
| Diversified REITs - 0.6% | |||
| Ant International Co. Ltd. Class C (b)(c) | 3,805,376 | 24,582,729 | |
| Interactive Media & Services - 1.0% | |||
| Interactive Media & Services - 1.0% | |||
| Alphabet, Inc. Class A (a) | 37,681 | 44,346,392 | |
| Internet & Direct Marketing Retail - 1.0% | |||
| Internet & Direct Marketing Retail - 1.0% | |||
| Meituan Dianping Class B | 6,251,571 | 42,128,689 | |
| IT Services - 13.3% | |||
| Data Processing & Outsourced Services - 7.7% | |||
| Alliance Data Systems Corp. | 186,130 | 32,569,027 | |
| Broadridge Financial Solutions, Inc. | 20,800 | 2,156,752 | |
| ExlService Holdings, Inc. (a) | 209,500 | 12,574,190 | |
| FleetCor Technologies, Inc. (a) | 157,600 | 38,862,584 | |
| MasterCard, Inc. Class A | 52,000 | 12,243,400 | |
| PayPal Holdings, Inc. (a) | 1,204,800 | 125,106,432 | |
| Total System Services, Inc. | 375,468 | 35,673,215 | |
| Visa, Inc. Class A | 432,600 | 67,567,794 | |
| 326,753,394 | |||
| Internet Services & Infrastructure - 1.2% | |||
| Akamai Technologies, Inc. (a) | 715,012 | 51,273,511 | |
| IT Consulting & Other Services - 4.4% | |||
| Accenture PLC Class A | 72,900 | 12,831,858 | |
| Capgemini SA | 574,400 | 69,652,419 | |
| Cognizant Technology Solutions Corp. Class A | 1,046,332 | 75,806,753 | |
| DXC Technology Co. | 168,700 | 10,849,097 | |
| Gartner, Inc. (a) | 129,100 | 19,581,888 | |
| 188,722,015 | |||
| TOTAL IT SERVICES | 566,748,920 | ||
| Life Sciences Tools & Services - 0.0% | |||
| Life Sciences Tools & Services - 0.0% | |||
| JHL Biotech, Inc. (a)(b) | 1,008,062 | 1,607,202 | |
| Road & Rail - 0.5% | |||
| Trucking - 0.5% | |||
| Lyft, Inc. | 303,270 | 21,368,707 | |
| Semiconductors & Semiconductor Equipment - 15.3% | |||
| Semiconductor Equipment - 2.9% | |||
| Applied Materials, Inc. | 1,735,910 | 68,846,191 | |
| Lam Research Corp. | 317,067 | 56,758,164 | |
| SunEdison, Inc. (a)(b) | 1,200 | 0 | |
| 125,604,355 | |||
| Semiconductors - 12.4% | |||
| Analog Devices, Inc. | 1,424,480 | 149,955,010 | |
| Broadcom, Inc. | 70,500 | 21,200,055 | |
| Marvell Technology Group Ltd. | 1,794,582 | 35,694,236 | |
| Microchip Technology, Inc. (d) | 581,038 | 48,202,912 | |
| Micron Technology, Inc. (a) | 1,778,500 | 73,505,405 | |
| NVIDIA Corp. | 906,850 | 162,833,986 | |
| Skyworks Solutions, Inc. | 418,075 | 34,482,826 | |
| 525,874,430 | |||
| TOTAL SEMICONDUCTORS & SEMICONDUCTOR EQUIPMENT | 651,478,785 | ||
| Software - 37.6% | |||
| Application Software - 16.4% | |||
| Adobe, Inc. (a) | 824,613 | 219,751,118 | |
| Autodesk, Inc. (a) | 309,940 | 48,294,851 | |
| BlackLine, Inc. (a) | 227,170 | 10,522,514 | |
| Box, Inc. Class A (a) | 642,403 | 12,404,802 | |
| Citrix Systems, Inc. | 851,957 | 84,906,035 | |
| Constellation Software, Inc. | 33,000 | 27,966,102 | |
| HubSpot, Inc. (a) | 30,900 | 5,135,889 | |
| Instructure, Inc. (a) | 262,653 | 12,376,209 | |
| Intuit, Inc. | 89,400 | 23,370,054 | |
| Pivotal Software, Inc. | 1,141,600 | 23,802,360 | |
| Salesforce.com, Inc. (a) | 1,038,709 | 164,500,344 | |
| Talend SA ADR (a) | 176,500 | 8,925,605 | |
| Ultimate Software Group, Inc. (a) | 72,370 | 23,891,508 | |
| Workday, Inc. Class A (a) | 160,651 | 30,981,545 | |
| 696,828,936 | |||
| Systems Software - 21.2% | |||
| Microsoft Corp. | 6,845,115 | 807,312,863 | |
| Palo Alto Networks, Inc. (a) | 113,049 | 27,457,341 | |
| Red Hat, Inc. (a) | 106,200 | 19,402,740 | |
| Symantec Corp. | 2,083,047 | 47,889,251 | |
| 902,062,195 | |||
| TOTAL SOFTWARE | 1,598,891,131 | ||
| Technology Hardware, Storage & Peripherals - 20.3% | |||
| Technology Hardware, Storage & Peripherals - 20.3% | |||
| Apple, Inc. | 4,218,683 | 801,338,836 | |
| Seagate Technology LLC | 455,754 | 21,826,059 | |
| Western Digital Corp. | 816,375 | 39,234,983 | |
| 862,399,878 | |||
| TOTAL COMMON STOCKS | |||
| (Cost $3,412,388,247) | 4,082,048,121 | ||
| Convertible Preferred Stocks - 0.5% | |||
| Road & Rail - 0.5% | |||
| Trucking - 0.5% | |||
| Uber Technologies, Inc. Series D, 8.00% (a)(b)(c) | |||
| (Cost $7,600,029) | 489,912 | 23,545,171 | |
| Money Market Funds - 4.4% | |||
| Fidelity Cash Central Fund, 2.48% (e) | 150,957,931 | 150,988,123 | |
| Fidelity Securities Lending Cash Central Fund 2.48% (e)(f) | 37,371,351 | 37,375,088 | |
| TOTAL MONEY MARKET FUNDS | |||
| (Cost $188,363,211) | 188,363,211 | ||
| TOTAL INVESTMENT IN SECURITIES - 100.8% | |||
| (Cost $3,608,351,487) | 4,293,956,503 | ||
| NET OTHER ASSETS (LIABILITIES) - (0.8)% | (36,176,939) | ||
| NET ASSETS - 100% | $4,257,779,564 |
Legend
(a) Non-income producing
(b) Level 3 security
(c) Restricted securities - Investment in securities not registered under the Securities Act of 1933 (excluding 144A issues). At the end of the period, the value of restricted securities (excluding 144A issues) amounted to $48,127,900 or 1.1% of net assets.
(d) Security or a portion of the security is on loan at period end.
(e) Affiliated fund that is generally available only to investment companies and other accounts managed by Fidelity Investments. The rate quoted is the annualized seven-day yield of the fund at period end. A complete unaudited listing of the fund's holdings as of its most recent quarter end is available upon request. In addition, each Fidelity Central Fund's financial statements are available on the SEC's website or upon request.
(f) Investment made with cash collateral received from securities on loan.
Additional information on each restricted holding is as follows:
| Security | Acquisition Date | Acquisition Cost |
| Ant International Co. Ltd. Class C | 5/16/18 | $21,348,159 |
| Uber Technologies, Inc. Series D, 8.00% | 6/6/14 | $7,600,029 |
Affiliated Central Funds
Information regarding fiscal year to date income earned by the Fund from investments in Fidelity Central Funds is as follows:
| Fund | Income earned |
| Fidelity Cash Central Fund | $1,563,897 |
| Fidelity Securities Lending Cash Central Fund | 216,951 |
| Total | $1,780,848 |
Amounts in the income column in the above table include any capital gain distributions from underlying funds, which are presented in the corresponding line-item in the Statement of Operations, if applicable.
Investment Valuation
The following is a summary of the inputs used, as of March 31, 2019, involving the Fund's assets and liabilities carried at fair value. The inputs or methodology used for valuing securities may not be an indication of the risk associated with investing in those securities. For more information on valuation inputs, and their aggregation into the levels used below, please refer to the Investment Valuation section in the accompanying Notes to Financial Statements.
| Valuation Inputs at Reporting Date: | ||||
| Description | Total | Level 1 | Level 2 | Level 3 |
| Investments in Securities: | ||||
| Common Stocks | $4,082,048,121 | $4,034,489,483 | $21,368,707 | $26,189,931 |
| Convertible Preferred Stocks | 23,545,171 | -- | -- | 23,545,171 |
| Money Market Funds | 188,363,211 | 188,363,211 | -- | -- |
| Total Investments in Securities: | $4,293,956,503 | $4,222,852,694 | $21,368,707 | $49,735,102 |
The following is a reconciliation of Investments in Securities and Derivative Instruments for which Level 3 inputs were used in determining value:
| Investments in Securities: | |
| Beginning Balance | $61,229,798 |
| Total Realized Gain (Loss) | -- |
| Total Unrealized Gain (Loss) | 2,866,321 |
| Cost of Purchases | -- |
| Proceeds of Sales | (14,361,017) |
| Amortization/Accretion | -- |
| Transfers in to Level 3 | -- |
| Transfers out of Level 3 | -- |
| Ending Balance | $49,735,102 |
| The change in unrealized gain (loss) for the period attributable to Level 3 securities held at March 31, 2019 | $2,866,321 |
The information used in the above reconciliation represents fiscal year to date activity for any Investments identified as using Level 3 inputs at either the beginning or the end of the current fiscal period. Transfers in or out of Level 3 represent the beginning value of any Security or Instrument where a change in the pricing level occurred from the beginning to the end of the period. The cost of purchases and the proceeds of sales may include securities received or delivered through corporate actions or exchanges. Realized and unrealized gains (losses) disclosed in the reconciliations are included in Net Gain (Loss) on the Fund's Statement of Operations.
See accompanying notes which are an integral part of the financial statements.
Fidelity® Information Technology Central Fund
Financial Statements
Statement of Assets and Liabilities
| March 31, 2019 (Unaudited) | ||
| Assets | ||
| Investment in securities, at value (including securities loaned of $37,365,184) — See accompanying schedule: Unaffiliated issuers (cost $3,419,988,276) | $4,105,593,292 | |
| Fidelity Central Funds (cost $188,363,211) | 188,363,211 | |
| Total Investment in Securities (cost $3,608,351,487) | $4,293,956,503 | |
| Foreign currency held at value (cost $129,641) | 127,109 | |
| Receivable for investments sold | 2,098,503 | |
| Receivable for fund shares sold | 483,749 | |
| Dividends receivable | 1,725,812 | |
| Distributions receivable from Fidelity Central Funds | 303,126 | |
| Other receivables | 18,176 | |
| Total assets | 4,298,712,978 | |
| Liabilities | ||
| Payable for fund shares redeemed | $3,519,064 | |
| Other payables and accrued expenses | 36,430 | |
| Collateral on securities loaned | 37,377,920 | |
| Total liabilities | 40,933,414 | |
| Net Assets | $4,257,779,564 | |
| Net Assets consist of: | ||
| Paid in capital | $3,551,280,056 | |
| Total distributable earnings (loss) | 706,499,508 | |
| Net Assets, for 11,402,107 shares outstanding | $4,257,779,564 | |
| Net Asset Value, offering price and redemption price per share ($4,257,779,564 ÷ 11,402,107 shares) | $373.42 |
See accompanying notes which are an integral part of the financial statements.
Statement of Operations
| Six months ended March 31, 2019 (Unaudited) | ||
| Investment Income | ||
| Dividends | $20,648,142 | |
| Income from Fidelity Central Funds | 1,780,848 | |
| Total income | 22,428,990 | |
| Expenses | ||
| Custodian fees and expenses | $52,104 | |
| Independent directors' fees and expenses | 14,161 | |
| Interest | 3,231 | |
| Total expenses before reductions | 69,496 | |
| Expense reductions | (1,968) | |
| Total expenses after reductions | 67,528 | |
| Net investment income (loss) | 22,361,462 | |
| Realized and Unrealized Gain (Loss) | ||
| Net realized gain (loss) on: | ||
| Investment securities: | ||
| Unaffiliated issuers | (7,554,555) | |
| Redemptions in-kind with affiliated entities | 26,854,351 | |
| Fidelity Central Funds | (616) | |
| Foreign currency transactions | (499,808) | |
| Total net realized gain (loss) | 18,799,372 | |
| Change in net unrealized appreciation (depreciation) on: | ||
| Investment securities: | ||
| Unaffiliated issuers | (531,630,753) | |
| Assets and liabilities in foreign currencies | (8,258) | |
| Total change in net unrealized appreciation (depreciation) | (531,639,011) | |
| Net gain (loss) | (512,839,639) | |
| Net increase (decrease) in net assets resulting from operations | $(490,478,177) |
See accompanying notes which are an integral part of the financial statements.
Statement of Changes in Net Assets
| Six months ended March 31, 2019 (Unaudited) | Year ended September 30, 2018 | |
| Increase (Decrease) in Net Assets | ||
| Operations | ||
| Net investment income (loss) | $22,361,462 | $39,535,366 |
| Net realized gain (loss) | 18,799,372 | 1,412,260,746 |
| Change in net unrealized appreciation (depreciation) | (531,639,011) | (303,948,832) |
| Net increase (decrease) in net assets resulting from operations | (490,478,177) | 1,147,847,280 |
| Distributions to shareholders | (751,170,530) | – |
| Distributions to shareholders from net investment income | – | (36,464,862) |
| Distributions to shareholders from net realized gain | – | (557,750,410) |
| Total distributions | (751,170,530) | (594,215,272) |
| Affiliated share transactions | ||
| Proceeds from sales of shares | 234,222,622 | 2,068,499,891 |
| Reinvestment of distributions | 751,170,530 | 594,215,272 |
| Cost of shares redeemed | (1,275,630,825) | (1,430,604,144) |
| Net increase (decrease) in net assets resulting from share transactions | (290,237,673) | 1,232,111,019 |
| Total increase (decrease) in net assets | (1,531,886,380) | 1,785,743,027 |
| Net Assets | ||
| Beginning of period | 5,789,665,944 | 4,003,922,917 |
| End of period | $4,257,779,564 | $5,789,665,944 |
| Other Information | ||
| Undistributed net investment income end of period | $3,504,985 | |
| Shares | ||
| Sold | 565,734 | 4,514,165 |
| Issued in reinvestment of distributions | 2,394,700 | 1,380,579 |
| Redeemed | (3,142,478) | (3,113,820) |
| Net increase (decrease) | (182,044) | 2,780,924 |
See accompanying notes which are an integral part of the financial statements.
Financial Highlights
Fidelity Information Technology Central Fund
| Six months ended (Unaudited) March 31, | Years endedSeptember 30, | |||||
| 2019 | 2018 | 2017 | 2016 | 2015 | 2014 | |
| Selected Per–Share Data | ||||||
| Net asset value, beginning of period | $499.79 | $454.82 | $330.24 | $260.71 | $262.98 | $222.50 |
| Income from Investment Operations | ||||||
| Net investment income (loss)A | 1.95 | 3.67 | 2.78 | 2.48 | 2.24B | 2.33 |
| Net realized and unrealized gain (loss) | (50.18) | 106.41 | 126.52 | 69.42 | (2.37) | 39.88 |
| Total from investment operations | (48.23) | 110.08 | 129.30 | 71.90 | (.13) | 42.21 |
| Distributions from net investment income | (2.03) | (3.34) | (2.67) | (2.37) | (2.14) | (1.73) |
| Distributions from net realized gain | (76.10) | (61.77) | (2.05) | – | – | – |
| Total distributions | (78.14)C | (65.11) | (4.72) | (2.37) | (2.14) | (1.73) |
| Net asset value, end of period | $373.42 | $499.79 | $454.82 | $330.24 | $260.71 | $262.98 |
| Total ReturnD,E | (6.62)% | 26.62% | 39.59% | 27.68% | (.11)% | 19.01% |
| Ratios to Average Net AssetsF,G | ||||||
| Expenses before reductions | - %H,I | .01% | .01% | .01% | .01% | .01% |
| Expenses net of fee waivers, if any | - %H,I | .01% | .01% | .01% | .01% | .01% |
| Expenses net of all reductions | - %H,I | .01% | .01% | .01% | .01% | .01% |
| Net investment income (loss) | 1.02%H | .78% | .73% | .86% | .81%B | .94% |
| Supplemental Data | ||||||
| Net assets, end of period (000 omitted) | $4,257,780 | $5,789,666 | $4,003,923 | $3,219,282 | $2,532,510 | $2,472,588 |
| Portfolio turnover rateJ | 85%H,K | 99%K | 70%K | 99% | 138% | 179%K |
A Calculated based on average shares outstanding during the period.
B Net investment income per share reflects a large, non-recurring dividend which amounted to $.43 per share. Excluding this non-recurring dividend, the ratio of net investment income (loss) to average net assets would have been .65%.
C Total distributions of $78.14 per share is comprised of distributions from net investment income of $2.032 and distributions from net realized gain of $76.103 per share.
D Total returns for periods of less than one year are not annualized.
E Total returns would have been lower if certain expenses had not been reduced during the applicable periods shown.
F Fees and expenses of any underlying Fidelity Central Funds are not included in the Fund's expense ratio. The Fund indirectly bears its proportionate share of the expenses of any underlying Fidelity Central Funds.
G Expense ratios reflect operating expenses of the Fund. Expenses before reductions do not reflect amounts reimbursed by the investment adviser or reductions from expense offset arrangements and do not represent the amount paid by the Fund during periods when reimbursements or reductions occur. Expenses net of fee waivers reflect expenses after reimbursement by the investment adviser but prior to reductions from expense offset arrangements. Expenses net of all reductions represent the net expenses paid by the Fund.
H Annualized
I Amount represents less than .005%.
J Amount does not include the portfolio activity of any underlying Fidelity Central Funds.
K Portfolio turnover rate excludes securities received or delivered in-kind.
See accompanying notes which are an integral part of the financial statements.
Fidelity® Materials Central Fund
Investment Summary (Unaudited)
Top Ten Stocks as of March 31, 2019
| % of fund's net assets | |
| DowDuPont, Inc. | 23.6 |
| Linde PLC | 10.2 |
| The Chemours Co. LLC | 7.3 |
| Olin Corp. | 6.3 |
| Air Products & Chemicals, Inc. | 4.9 |
| Sherwin-Williams Co. | 4.4 |
| Vulcan Materials Co. | 3.7 |
| Tronox Holdings PLC | 3.4 |
| Univar, Inc. | 3.1 |
| International Flavors & Fragrances, Inc. | 2.7 |
| 69.6 |
Top Industries (% of fund's net assets)
| As of March 31, 2019 | ||
| Chemicals | 75.6% | |
| Metals & Mining | 8.3% | |
| Containers & Packaging | 7.0% | |
| Construction Materials | 5.4% | |
| Trading Companies & Distributors | 3.1% | |
| All Others* | 0.6% | |

* Includes short-term investments and net other assets (liabilities).
Fidelity® Materials Central Fund
Schedule of Investments March 31, 2019 (Unaudited)
Showing Percentage of Net Assets
| Common Stocks - 99.7% | |||
| Shares | Value | ||
| Building Products - 0.2% | |||
| Building Products - 0.2% | |||
| GCP Applied Technologies, Inc. (a) | 39,400 | $1,166,240 | |
| Chemicals - 75.6% | |||
| Commodity Chemicals - 10.9% | |||
| Cabot Corp. | 82,601 | 3,438,680 | |
| Ciner Resources LP | 42,400 | 1,070,600 | |
| LyondellBasell Industries NV Class A | 78,555 | 6,604,904 | |
| Olin Corp. | 1,308,382 | 30,275,959 | |
| Orion Engineered Carbons SA | 249,073 | 4,729,896 | |
| Valvoline, Inc. | 25,493 | 473,150 | |
| Westlake Chemical Corp. | 82,043 | 5,567,438 | |
| 52,160,627 | |||
| Diversified Chemicals - 32.8% | |||
| DowDuPont, Inc. | 2,120,555 | 113,046,788 | |
| Eastman Chemical Co. | 37,051 | 2,811,430 | |
| Ingevity Corp. (a) | 59,200 | 6,252,112 | |
| The Chemours Co. LLC | 937,338 | 34,831,480 | |
| 156,941,810 | |||
| Fertilizers & Agricultural Chemicals - 2.2% | |||
| CF Industries Holdings, Inc. | 67,300 | 2,751,224 | |
| The Mosaic Co. | 288,800 | 7,887,128 | |
| 10,638,352 | |||
| Industrial Gases - 15.1% | |||
| Air Products & Chemicals, Inc. | 121,700 | 23,239,832 | |
| Linde PLC | 277,570 | 48,832,890 | |
| 72,072,722 | |||
| Specialty Chemicals - 14.6% | |||
| Celanese Corp. Class A | 40,000 | 3,944,400 | |
| Element Solutions, Inc. (a) | 861,200 | 8,698,120 | |
| International Flavors & Fragrances, Inc. (b) | 99,752 | 12,847,060 | |
| RPM International, Inc. | 73,100 | 4,242,724 | |
| Sherwin-Williams Co. | 49,100 | 21,147,861 | |
| Tronox Holdings PLC | 1,221,200 | 16,058,780 | |
| W.R. Grace & Co. | 36,300 | 2,832,852 | |
| 69,771,797 | |||
| TOTAL CHEMICALS | 361,585,308 | ||
| Construction Materials - 5.4% | |||
| Construction Materials - 5.4% | |||
| Martin Marietta Materials, Inc. | 34,200 | 6,880,356 | |
| Summit Materials, Inc. (a) | 70,200 | 1,114,074 | |
| Vulcan Materials Co. | 149,700 | 17,724,480 | |
| 25,718,910 | |||
| Containers & Packaging - 7.0% | |||
| Metal & Glass Containers - 5.8% | |||
| Aptargroup, Inc. | 83,000 | 8,830,370 | |
| Ball Corp. | 142,200 | 8,227,692 | |
| Crown Holdings, Inc. (a) | 163,800 | 8,938,566 | |
| Owens-Illinois, Inc. | 92,600 | 1,757,548 | |
| 27,754,176 | |||
| Paper Packaging - 1.2% | |||
| Avery Dennison Corp. | 49,400 | 5,582,200 | |
| TOTAL CONTAINERS & PACKAGING | 33,336,376 | ||
| Metals & Mining - 8.3% | |||
| Copper - 2.1% | |||
| Antofagasta PLC | 819,900 | 10,315,709 | |
| Diversified Metals & Mining - 1.4% | |||
| Alcoa Corp. (a) | 108,300 | 3,049,728 | |
| Livent Corp. | 280,828 | 3,448,568 | |
| 6,498,296 | |||
| Gold - 3.0% | |||
| Newmont Mining Corp. | 304,700 | 10,899,119 | |
| Royal Gold, Inc. | 36,800 | 3,346,224 | |
| 14,245,343 | |||
| Steel - 1.8% | |||
| AK Steel Holding Corp. (a)(b) | 177,700 | 488,675 | |
| Allegheny Technologies, Inc. (a) | 71,500 | 1,828,255 | |
| Cleveland-Cliffs, Inc. | 150,200 | 1,500,498 | |
| Steel Dynamics, Inc. | 135,000 | 4,761,450 | |
| 8,578,878 | |||
| TOTAL METALS & MINING | 39,638,226 | ||
| Oil, Gas & Consumable Fuels - 0.1% | |||
| Coal & Consumable Fuels - 0.1% | |||
| Arch Coal, Inc. | 6,500 | 593,255 | |
| Trading Companies & Distributors - 3.1% | |||
| Trading Companies & Distributors - 3.1% | |||
| Univar, Inc. (a) | 661,190 | 14,651,970 | |
| TOTAL COMMON STOCKS | |||
| (Cost $478,857,017) | 476,690,285 | ||
| Money Market Funds - 2.8% | |||
| Fidelity Securities Lending Cash Central Fund 2.48% (c)(d) | |||
| (Cost $13,185,837) | 13,184,519 | 13,185,837 | |
| TOTAL INVESTMENT IN SECURITIES - 102.5% | |||
| (Cost $492,042,854) | 489,876,122 | ||
| NET OTHER ASSETS (LIABILITIES) - (2.5)% | (11,827,476) | ||
| NET ASSETS - 100% | $478,048,646 |
Legend
(a) Non-income producing
(b) Security or a portion of the security is on loan at period end.
(c) Investment made with cash collateral received from securities on loan.
(d) Affiliated fund that is generally available only to investment companies and other accounts managed by Fidelity Investments. The rate quoted is the annualized seven-day yield of the fund at period end. A complete unaudited listing of the fund's holdings as of its most recent quarter end is available upon request. In addition, each Fidelity Central Fund's financial statements are available on the SEC's website or upon request.
Affiliated Central Funds
Information regarding fiscal year to date income earned by the Fund from investments in Fidelity Central Funds is as follows:
| Fund | Income earned |
| Fidelity Cash Central Fund | $54,005 |
| Fidelity Securities Lending Cash Central Fund | 44,536 |
| Total | $98,541 |
Amounts in the income column in the above table include any capital gain distributions from underlying funds, which are presented in the corresponding line-item in the Statement of Operations, if applicable.
Investment Valuation
All investments are categorized as Level 1 under the Fair Value Hierarchy. The inputs or methodology used for valuing securities may not be an indication of the risk associated with investing in those securities. For more information on valuation inputs please refer to the Investment Valuation section in the accompanying Notes to Financial Statements.
Other Information
Distribution of investments by country or territory of incorporation, as a percentage of Total Net Assets, is as follows (Unaudited):
| United States of America | 81.9% |
| Ireland | 10.2% |
| United Kingdom | 5.5% |
| Netherlands | 1.4% |
| Luxembourg | 1.0% |
| 100.0% |
See accompanying notes which are an integral part of the financial statements.
Fidelity® Materials Central Fund
Financial Statements
Statement of Assets and Liabilities
| March 31, 2019 (Unaudited) | ||
| Assets | ||
| Investment in securities, at value (including securities loaned of $12,794,535) — See accompanying schedule: Unaffiliated issuers (cost $478,857,017) | $476,690,285 | |
| Fidelity Central Funds (cost $13,185,837) | 13,185,837 | |
| Total Investment in Securities (cost $492,042,854) | $489,876,122 | |
| Foreign currency held at value (cost $3) | 3 | |
| Receivable for investments sold | 1,429,943 | |
| Receivable for fund shares sold | 66,155 | |
| Dividends receivable | 419,929 | |
| Distributions receivable from Fidelity Central Funds | 4,821 | |
| Total assets | 491,796,973 | |
| Liabilities | ||
| Payable to custodian bank | $134,873 | |
| Payable for fund shares redeemed | 422,612 | |
| Other payables and accrued expenses | 4,992 | |
| Collateral on securities loaned | 13,185,850 | |
| Total liabilities | 13,748,327 | |
| Net Assets | $478,048,646 | |
| Net Assets consist of: | ||
| Paid in capital | $504,462,360 | |
| Total distributable earnings (loss) | (26,413,714) | |
| Net Assets, for 2,380,460 shares outstanding | $478,048,646 | |
| Net Asset Value, offering price and redemption price per share ($478,048,646 ÷ 2,380,460 shares) | $200.82 |
See accompanying notes which are an integral part of the financial statements.
Statement of Operations
| Six months ended March 31, 2019 (Unaudited) | ||
| Investment Income | ||
| Dividends | $4,960,723 | |
| Income from Fidelity Central Funds | 98,541 | |
| Total income | 5,059,264 | |
| Expenses | ||
| Custodian fees and expenses | $7,635 | |
| Independent directors' fees and expenses | 1,510 | |
| Total expenses | 9,145 | |
| Net investment income (loss) | 5,050,119 | |
| Realized and Unrealized Gain (Loss) | ||
| Net realized gain (loss) on: | ||
| Investment securities: | ||
| Unaffiliated issuers | (18,778,613) | |
| Fidelity Central Funds | (13) | |
| Foreign currency transactions | 16,797 | |
| Total net realized gain (loss) | (18,761,829) | |
| Change in net unrealized appreciation (depreciation) on: | ||
| Investment securities: | ||
| Unaffiliated issuers | (26,275,246) | |
| Assets and liabilities in foreign currencies | (3,757) | |
| Total change in net unrealized appreciation (depreciation) | (26,279,003) | |
| Net gain (loss) | (45,040,832) | |
| Net increase (decrease) in net assets resulting from operations | $(39,990,713) |
See accompanying notes which are an integral part of the financial statements.
Statement of Changes in Net Assets
| Six months ended March 31, 2019 (Unaudited) | Year ended September 30, 2018 | |
| Increase (Decrease) in Net Assets | ||
| Operations | ||
| Net investment income (loss) | $5,050,119 | $10,599,756 |
| Net realized gain (loss) | (18,761,829) | 71,373,247 |
| Change in net unrealized appreciation (depreciation) | (26,279,003) | (93,940,563) |
| Net increase (decrease) in net assets resulting from operations | (39,990,713) | (11,967,560) |
| Distributions to shareholders | (40,748,514) | – |
| Distributions to shareholders from net investment income | – | (9,590,869) |
| Distributions to shareholders from net realized gain | – | (27,989,724) |
| Total distributions | (40,748,514) | (37,580,593) |
| Affiliated share transactions | ||
| Proceeds from sales of shares | 12,572,803 | 242,088,015 |
| Reinvestment of distributions | 40,748,514 | 37,580,593 |
| Cost of shares redeemed | (52,944,244) | (145,554,862) |
| Net increase (decrease) in net assets resulting from share transactions | 377,073 | 134,113,746 |
| Total increase (decrease) in net assets | (80,362,154) | 84,565,593 |
| Net Assets | ||
| Beginning of period | 558,410,800 | 473,845,207 |
| End of period | $478,048,646 | $558,410,800 |
| Other Information | ||
| Undistributed net investment income end of period | $1,692,230 | |
| Shares | ||
| Sold | 63,345 | 952,669 |
| Issued in reinvestment of distributions | 228,018 | 145,744 |
| Redeemed | (259,107) | (569,787) |
| Net increase (decrease) | 32,256 | 528,626 |
See accompanying notes which are an integral part of the financial statements.
Financial Highlights
Fidelity Materials Central Fund
| Six months ended (Unaudited) March 31, | Years endedSeptember 30, | |||||
| 2019 | 2018 | 2017 | 2016 | 2015 | 2014 | |
| Selected Per–Share Data | ||||||
| Net asset value, beginning of period | $237.80 | $260.41 | $213.34 | $188.48 | $229.95 | $207.20 |
| Income from Investment Operations | ||||||
| Net investment income (loss)A | 2.12 | 4.94 | 4.24 | 4.48 | 4.34 | 3.57 |
| Net realized and unrealized gain (loss) | (21.16) | (7.93) | 46.66 | 24.73 | (41.59) | 22.68 |
| Total from investment operations | (19.04) | (2.99) | 50.90 | 29.21 | (37.25) | 26.25 |
| Distributions from net investment income | (2.11) | (4.54) | (3.83) | (4.35) | (4.22) | (3.50) |
| Distributions from net realized gain | (15.83) | (15.08) | – | – | – | – |
| Total distributions | (17.94) | (19.62) | (3.83) | (4.35) | (4.22) | (3.50) |
| Net asset value, end of period | $200.82 | $237.80 | $260.41 | $213.34 | $188.48 | $229.95 |
| Total ReturnB,C | (7.03)% | (1.66)% | 24.05% | 15.62% | (16.46)% | 12.70% |
| Ratios to Average Net AssetsD,E | ||||||
| Expenses before reductions | - %F,G | - %G | .01% | - %G | - %G | .01% |
| Expenses net of fee waivers, if any | - %F,G | - %G | .01% | - %G | - %G | - %G |
| Expenses net of all reductions | - %F,G | - %G | .01% | - %G | - %G | - %G |
| Net investment income (loss) | 2.08%F | 1.92% | 1.80% | 2.21% | 1.95% | 1.57% |
| Supplemental Data | ||||||
| Net assets, end of period (000 omitted) | $478,049 | $558,411 | $473,845 | $400,862 | $358,642 | $482,472 |
| Portfolio turnover rateH | 79%F | 78%I | 54%I | 56% | 72% | 65%I |
A Calculated based on average shares outstanding during the period.
B Total returns for periods of less than one year are not annualized.
C Total returns would have been lower if certain expenses had not been reduced during the applicable periods shown.
D Fees and expenses of any underlying Fidelity Central Funds are not included in the Fund's expense ratio. The Fund indirectly bears its proportionate share of the expenses of any underlying Fidelity Central Funds.
E Expense ratios reflect operating expenses of the Fund. Expenses before reductions do not reflect amounts reimbursed by the investment adviser or reductions from expense offset arrangements and do not represent the amount paid by the Fund during periods when reimbursements or reductions occur. Expenses net of fee waivers reflect expenses after reimbursement by the investment adviser but prior to reductions from expense offset arrangements. Expenses net of all reductions represent the net expenses paid by the Fund.
F Annualized
G Amount represents less than .005%.
H Amount does not include the portfolio activity of any underlying Fidelity Central Funds.
I Portfolio turnover rate excludes securities received or delivered in-kind.
See accompanying notes which are an integral part of the financial statements.
Fidelity® Real Estate Equity Central Fund
Investment Summary (Unaudited)
Top Ten Stocks as of March 31, 2019
| % of fund's net assets | |
| Equinix, Inc. | 6.9 |
| Prologis, Inc. | 6.9 |
| Boston Properties, Inc. | 5.0 |
| AvalonBay Communities, Inc. | 4.8 |
| Simon Property Group, Inc. | 4.5 |
| Essex Property Trust, Inc. | 4.2 |
| Ventas, Inc. | 3.9 |
| Alexandria Real Estate Equities, Inc. | 3.4 |
| UDR, Inc. | 3.4 |
| National Retail Properties, Inc. | 3.0 |
| 46.0 |
Top Five REIT Sectors as of March 31, 2019
| % of fund's net assets | |
| REITs - Diversified | 16.6 |
| REITs - Apartments | 15.2 |
| REITs - Office Property | 13.5 |
| REITs - Health Care | 11.0 |
| REITs - Warehouse/Industrial | 9.3 |
Asset Allocation (% of fund's net assets)
| As of March 31, 2019 | ||
| Stocks | 98.4% | |
| Short-Term Investments and Net Other Assets (Liabilities) | 1.6% | |

Fidelity® Real Estate Equity Central Fund
Schedule of Investments March 31, 2019 (Unaudited)
Showing Percentage of Net Assets
| Common Stocks - 98.4% | |||
| Shares | Value | ||
| Equity Real Estate Investment Trusts (REITs) - 96.3% | |||
| REITs - Apartments - 15.2% | |||
| AvalonBay Communities, Inc. | 32,550 | $6,533,762 | |
| Equity Residential (SBI) | 29,500 | 2,221,940 | |
| Essex Property Trust, Inc. | 19,700 | 5,698,028 | |
| Invitation Homes, Inc. | 62,700 | 1,525,491 | |
| UDR, Inc. | 101,300 | 4,605,098 | |
| 20,584,319 | |||
| REITs - Diversified - 16.6% | |||
| Clipper Realty, Inc. | 60,100 | 804,739 | |
| Corrections Corp. of America | 29,800 | 579,610 | |
| Digital Realty Trust, Inc. | 18,400 | 2,189,600 | |
| Duke Realty Corp. | 102,500 | 3,134,450 | |
| Equinix, Inc. | 20,600 | 9,335,095 | |
| Outfront Media, Inc. | 78,200 | 1,829,880 | |
| VICI Properties, Inc. | 112,500 | 2,461,500 | |
| Washington REIT (SBI) | 74,900 | 2,125,662 | |
| 22,460,536 | |||
| REITs - Health Care - 11.0% | |||
| CareTrust (REIT), Inc. | 60,000 | 1,407,600 | |
| Healthcare Realty Trust, Inc. | 111,300 | 3,573,843 | |
| Sabra Health Care REIT, Inc. | 46,554 | 906,406 | |
| Ventas, Inc. | 83,400 | 5,321,754 | |
| Welltower, Inc. | 47,250 | 3,666,600 | |
| 14,876,203 | |||
| REITs - Hotels - 3.8% | |||
| Braemar Hotels & Resorts, Inc. | 23,900 | 291,819 | |
| Pebblebrook Hotel Trust | 31,600 | 981,496 | |
| RLJ Lodging Trust | 132,100 | 2,320,997 | |
| Sunstone Hotel Investors, Inc. | 108,000 | 1,555,200 | |
| 5,149,512 | |||
| REITs - Management/Investment - 4.3% | |||
| American Tower Corp. | 4,400 | 867,064 | |
| National Retail Properties, Inc. | 73,600 | 4,076,704 | |
| Weyerhaeuser Co. | 30,700 | 808,638 | |
| 5,752,406 | |||
| REITs - Manufactured Homes - 2.6% | |||
| Equity Lifestyle Properties, Inc. | 30,376 | 3,471,977 | |
| REITs - Office Property - 13.5% | |||
| Alexandria Real Estate Equities, Inc. | 32,400 | 4,618,944 | |
| Boston Properties, Inc. | 50,200 | 6,720,776 | |
| Douglas Emmett, Inc. | 48,600 | 1,964,412 | |
| Highwoods Properties, Inc. (SBI) | 57,600 | 2,694,528 | |
| VEREIT, Inc. | 263,700 | 2,207,169 | |
| 18,205,829 | |||
| REITs - Regional Malls - 6.8% | |||
| Simon Property Group, Inc. | 33,650 | 6,131,367 | |
| Taubman Centers, Inc. | 57,300 | 3,030,024 | |
| 9,161,391 | |||
| REITs - Shopping Centers - 4.0% | |||
| Acadia Realty Trust (SBI) | 60,038 | 1,637,236 | |
| Cedar Realty Trust, Inc. | 116,447 | 395,920 | |
| DDR Corp. | 105,550 | 1,437,591 | |
| Urban Edge Properties | 103,350 | 1,963,650 | |
| 5,434,397 | |||
| REITs - Single Tenant - 3.9% | |||
| Agree Realty Corp. | 21,000 | 1,456,140 | |
| Four Corners Property Trust, Inc. | 62,500 | 1,850,000 | |
| Spirit Realty Capital, Inc. | 48,160 | 1,913,397 | |
| 5,219,537 | |||
| REITs - Storage - 5.3% | |||
| CubeSmart | 115,500 | 3,700,620 | |
| Extra Space Storage, Inc. | 8,800 | 896,808 | |
| Public Storage | 12,000 | 2,613,360 | |
| 7,210,788 | |||
| REITs - Warehouse/Industrial - 9.3% | |||
| Americold Realty Trust | 39,900 | 1,217,349 | |
| Prologis, Inc. | 129,681 | 9,330,548 | |
| Terreno Realty Corp. | 46,563 | 1,957,509 | |
| 12,505,406 | |||
| TOTAL EQUITY REAL ESTATE INVESTMENT TRUSTS (REITS) | 130,032,301 | ||
| Hotels, Restaurants & Leisure - 1.5% | |||
| Hotels, Resorts & Cruise Lines - 1.5% | |||
| Hilton Grand Vacations, Inc. (a) | 20,800 | 641,680 | |
| Hilton Worldwide Holdings, Inc. | 16,700 | 1,387,937 | |
| 2,029,617 | |||
| Real Estate Management & Development - 0.6% | |||
| Real Estate Development - 0.6% | |||
| Howard Hughes Corp. (a) | 7,100 | 781,000 | |
| TOTAL COMMON STOCKS | |||
| (Cost $112,947,389) | 132,842,918 | ||
| Money Market Funds - 1.0% | |||
| Fidelity Cash Central Fund, 2.48% (b) | |||
| (Cost $1,287,406) | 1,287,253 | 1,287,510 | |
| TOTAL INVESTMENT IN SECURITIES - 99.4% | |||
| (Cost $114,234,795) | 134,130,428 | ||
| NET OTHER ASSETS (LIABILITIES) - 0.6% | 826,850 | ||
| NET ASSETS - 100% | $134,957,278 |
Legend
(a) Non-income producing
(b) Affiliated fund that is generally available only to investment companies and other accounts managed by Fidelity Investments. The rate quoted is the annualized seven-day yield of the fund at period end. A complete unaudited listing of the fund's holdings as of its most recent quarter end is available upon request. In addition, each Fidelity Central Fund's financial statements are available on the SEC's website or upon request.
Affiliated Central Funds
Information regarding fiscal year to date income earned by the Fund from investments in Fidelity Central Funds is as follows:
| Fund | Income earned |
| Fidelity Cash Central Fund | $15,097 |
| Fidelity Securities Lending Cash Central Fund | 642 |
| Total | $15,739 |
Amounts in the income column in the above table include any capital gain distributions from underlying funds, which are presented in the corresponding line-item in the Statement of Operations, if applicable.
Investment Valuation
All investments are categorized as Level 1 under the Fair Value Hierarchy. The inputs or methodology used for valuing securities may not be an indication of the risk associated with investing in those securities. For more information on valuation inputs please refer to the Investment Valuation section in the accompanying Notes to Financial Statements.
See accompanying notes which are an integral part of the financial statements.
Fidelity® Real Estate Equity Central Fund
Financial Statements
Statement of Assets and Liabilities
| March 31, 2019 (Unaudited) | ||
| Assets | ||
| Investment in securities, at value — See accompanying schedule: Unaffiliated issuers (cost $112,947,389) | $132,842,918 | |
| Fidelity Central Funds (cost $1,287,406) | 1,287,510 | |
| Total Investment in Securities (cost $114,234,795) | $134,130,428 | |
| Receivable for investments sold | 611,643 | |
| Receivable for fund shares sold | 23,698 | |
| Dividends receivable | 593,959 | |
| Distributions receivable from Fidelity Central Funds | 2,073 | |
| Total assets | 135,361,801 | |
| Liabilities | ||
| Payable for investments purchased | $349,399 | |
| Payable for fund shares redeemed | 49,634 | |
| Other payables and accrued expenses | 5,490 | |
| Total liabilities | 404,523 | |
| Net Assets | $134,957,278 | |
| Net Assets consist of: | ||
| Paid in capital | $116,201,463 | |
| Total distributable earnings (loss) | 18,755,815 | |
| Net Assets, for 1,183,806 shares outstanding | $134,957,278 | |
| Net Asset Value, offering price and redemption price per share ($134,957,278 ÷ 1,183,806 shares) | $114.00 |
See accompanying notes which are an integral part of the financial statements.
Statement of Operations
| Six months ended March 31, 2019 (Unaudited) | ||
| Investment Income | ||
| Dividends | $1,748,514 | |
| Income from Fidelity Central Funds | 15,739 | |
| Total income | 1,764,253 | |
| Expenses | ||
| Custodian fees and expenses | $6,871 | |
| Independent directors' fees and expenses | 368 | |
| Total expenses before reductions | 7,239 | |
| Expense reductions | (95) | |
| Total expenses after reductions | 7,144 | |
| Net investment income (loss) | 1,757,109 | |
| Realized and Unrealized Gain (Loss) | ||
| Net realized gain (loss) on: | ||
| Investment securities: | ||
| Unaffiliated issuers | 56,525 | |
| Fidelity Central Funds | (104) | |
| Foreign currency transactions | (22) | |
| Total net realized gain (loss) | 56,399 | |
| Change in net unrealized appreciation (depreciation) on: | ||
| Investment securities: | ||
| Unaffiliated issuers | 8,215,365 | |
| Fidelity Central Funds | 104 | |
| Total change in net unrealized appreciation (depreciation) | 8,215,469 | |
| Net gain (loss) | 8,271,868 | |
| Net increase (decrease) in net assets resulting from operations | $10,028,977 |
See accompanying notes which are an integral part of the financial statements.
Statement of Changes in Net Assets
| Six months ended March 31, 2019 (Unaudited) | Year ended September 30, 2018 | |
| Increase (Decrease) in Net Assets | ||
| Operations | ||
| Net investment income (loss) | $1,757,109 | $4,401,769 |
| Net realized gain (loss) | 56,399 | 1,135,082 |
| Change in net unrealized appreciation (depreciation) | 8,215,469 | (1,174,470) |
| Net increase (decrease) in net assets resulting from operations | 10,028,977 | 4,362,381 |
| Distributions to shareholders | (4,574,204) | – |
| Distributions to shareholders from net investment income | – | (3,610,543) |
| Distributions to shareholders from net realized gain | – | (4,488,742) |
| Total distributions | (4,574,204) | (8,099,285) |
| Affiliated share transactions | ||
| Proceeds from sales of shares | 2,846,826 | 14,225,887 |
| Reinvestment of distributions | 4,574,204 | 8,099,285 |
| Cost of shares redeemed | (4,622,190) | (19,031,721) |
| Net increase (decrease) in net assets resulting from share transactions | 2,798,840 | 3,293,451 |
| Total increase (decrease) in net assets | 8,253,613 | (443,453) |
| Net Assets | ||
| Beginning of period | 126,703,665 | 127,147,118 |
| End of period | $134,957,278 | $126,703,665 |
| Other Information | ||
| Undistributed net investment income end of period | $1,214,307 | |
| Shares | ||
| Sold | 27,333 | 134,471 |
| Issued in reinvestment of distributions | 45,189 | 75,088 |
| Redeemed | (43,403) | (181,813) |
| Net increase (decrease) | 29,119 | 27,746 |
See accompanying notes which are an integral part of the financial statements.
Financial Highlights
Fidelity Real Estate Equity Central Fund
| Six months ended (Unaudited) March 31, | Years endedSeptember 30, | ||||
| 2019 | 2018 | 2017 | 2016 | 2015 A | |
| Selected Per–Share Data | |||||
| Net asset value, beginning of period | $109.73 | $112.82 | $113.15 | $95.92 | $100.00 |
| Income from Investment Operations | |||||
| Net investment income (loss)B | 1.50 | 3.84 | 3.00 | 3.03 | 2.53 |
| Net realized and unrealized gain (loss) | 6.74 | .13 | (.91) | 17.03 | (4.24) |
| Total from investment operations | 8.24 | 3.97 | 2.09 | 20.06 | (1.71) |
| Distributions from net investment income | (2.06) | (3.16)C | (2.29) | (2.83) | (2.37) |
| Distributions from net realized gain | (1.91) | (3.90)C | (.12) | – | – |
| Total distributions | (3.97) | (7.06) | (2.42)D | (2.83) | (2.37) |
| Net asset value, end of period | $114.00 | $109.73 | $112.82 | $113.15 | $95.92 |
| Total ReturnE,F | 8.00% | 3.73% | 1.95% | 21.08% | (1.81)% |
| Ratios to Average Net AssetsG,H | |||||
| Expenses before reductions | .01%I | .01% | .01% | .01% | .01%I |
| Expenses net of fee waivers, if any | .01%I | .01% | .01% | .01% | .01%I |
| Expenses net of all reductions | .01%I | .01% | .01% | .01% | .01%I |
| Net investment income (loss) | 2.80%I | 3.59% | 2.72% | 2.86% | 2.71%I |
| Supplemental Data | |||||
| Net assets, end of period (000 omitted) | $134,957 | $126,704 | $127,147 | $173,787 | $251,215 |
| Portfolio turnover rateJ | 55%I | 47% | 64% | 69% | 62%I |
A For the period November 3, 2014 (commencement of operations) to September 30, 2015.
B Calculated based on average shares outstanding during the period.
C The amounts shown reflect certain reclassifications related to book to tax differences that were made in the year shown.
D Total distributions of $2.42 per share is comprised of distributions from net investment income of $2.294 and distributions from net realized gain of $.124 per share.
E Total returns for periods of less than one year are not annualized.
F Total returns would have been lower if certain expenses had not been reduced during the applicable periods shown.
G Fees and expenses of any underlying Fidelity Central Funds are not included in the Fund's expense ratio. The Fund indirectly bears its proportionate share of the expenses of any underlying Fidelity Central Funds.
H Expense ratios reflect operating expenses of the Fund. Expenses before reductions do not reflect amounts reimbursed by the investment adviser or reductions from expense offset arrangements and do not represent the amount paid by the Fund during periods when reimbursements or reductions occur. Expense ratios before reductions for start-up periods may not be representative of longer term operating periods. Expenses net of fee waivers reflect expenses after reimbursement by the investment adviser but prior to reductions from expense offset arrangements. Expenses net of all reductions represent the net expenses paid by the Fund.
I Annualized
J Amount does not include the portfolio activity of any underlying Fidelity Central Funds.
See accompanying notes which are an integral part of the financial statements.
Fidelity® Utilities Central Fund
Investment Summary (Unaudited)
Top Ten Stocks as of March 31, 2019
| % of fund's net assets | |
| Dominion Resources, Inc. | 11.5 |
| Exelon Corp. | 10.4 |
| Sempra Energy | 9.4 |
| Southern Co. | 8.8 |
| NextEra Energy, Inc. | 7.4 |
| FirstEnergy Corp. | 4.9 |
| Entergy Corp. | 4.8 |
| Public Service Enterprise Group, Inc. | 4.8 |
| Edison International | 4.7 |
| Vistra Energy Corp. | 4.2 |
| 70.9 |
Top Industries (% of fund's net assets)
| As of March 31, 2019 | ||
| Electric Utilities | 53.3% | |
| Multi-Utilities | 31.1% | |
| Gas Utilities | 5.0% | |
| Independent Power and Renewable Electricity Producers | 4.9% | |
| Oil, Gas & Consumable Fuels | 1.1% | |
| All Others* | 4.6% | |

* Includes short-term investments and net other assets (liabilities).
Fidelity® Utilities Central Fund
Schedule of Investments March 31, 2019 (Unaudited)
Showing Percentage of Net Assets
| Common Stocks - 97.0% | |||
| Shares | Value | ||
| Electric Utilities - 53.3% | |||
| Electric Utilities - 53.3% | |||
| Edison International | 472,484 | $29,256,209 | |
| Entergy Corp. | 312,600 | 29,893,938 | |
| Evergy, Inc. | 325,213 | 18,878,615 | |
| Exelon Corp. | 1,288,245 | 64,579,722 | |
| FirstEnergy Corp. | 729,602 | 30,358,739 | |
| NextEra Energy, Inc. | 236,465 | 45,713,414 | |
| PG&E Corp. (a) | 414,850 | 7,384,330 | |
| PPL Corp. | 731,474 | 23,216,985 | |
| Southern Co. | 1,054,500 | 54,496,560 | |
| Vistra Energy Corp. | 1,000,108 | 26,032,811 | |
| 329,811,323 | |||
| Gas Utilities - 5.0% | |||
| Gas Utilities - 5.0% | |||
| Atmos Energy Corp. | 145,115 | 14,936,687 | |
| Chesapeake Utilities Corp. | 17,444 | 1,591,067 | |
| South Jersey Industries, Inc. | 263,476 | 8,449,675 | |
| Southwest Gas Holdings, Inc. | 73,800 | 6,070,788 | |
| 31,048,217 | |||
| Independent Power and Renewable Electricity Producers - 4.9% | |||
| Independent Power Producers & Energy Traders - 2.1% | |||
| NRG Energy, Inc. | 195,843 | 8,319,411 | |
| NRG Yield, Inc. Class C | 27,282 | 412,231 | |
| The AES Corp. | 256,594 | 4,639,220 | |
| 13,370,862 | |||
| Renewable Electricity - 2.8% | |||
| Atlantica Yield PLC | 319,296 | 6,213,500 | |
| NextEra Energy Partners LP | 235,136 | 10,966,743 | |
| 17,180,243 | |||
| TOTAL INDEPENDENT POWER AND RENEWABLE ELECTRICITY PRODUCERS | 30,551,105 | ||
| Media - 1.0% | |||
| Cable & Satellite - 1.0% | |||
| Altice U.S.A., Inc. Class A | 287,618 | 6,178,035 | |
| Multi-Utilities - 31.1% | |||
| Multi-Utilities - 31.1% | |||
| Avangrid, Inc. | 282,299 | 14,213,755 | |
| CenterPoint Energy, Inc. | 519,900 | 15,960,930 | |
| Dominion Resources, Inc. | 928,151 | 71,152,054 | |
| Public Service Enterprise Group, Inc. | 501,300 | 29,782,233 | |
| RWE AG | 119,100 | 3,193,050 | |
| Sempra Energy | 461,123 | 58,036,941 | |
| 192,338,963 | |||
| Oil, Gas & Consumable Fuels - 1.1% | |||
| Oil & Gas Storage & Transport - 1.1% | |||
| Cheniere Energy, Inc. (a) | 103,032 | 7,043,268 | |
| Water Utilities - 0.6% | |||
| Water Utilities - 0.6% | |||
| SJW Corp. | 54,523 | 3,366,250 | |
| TOTAL COMMON STOCKS | |||
| (Cost $476,801,274) | 600,337,161 | ||
| TOTAL INVESTMENT IN SECURITIES - 97.0% | |||
| (Cost $476,801,274) | 600,337,161 | ||
| NET OTHER ASSETS (LIABILITIES) - 3.0% | 18,744,513 | ||
| NET ASSETS - 100% | $619,081,674 |
Legend
(a) Non-income producing
Affiliated Central Funds
Information regarding fiscal year to date income earned by the Fund from investments in Fidelity Central Funds is as follows:
| Fund | Income earned |
| Fidelity Cash Central Fund | $28,393 |
| Fidelity Securities Lending Cash Central Fund | 3,918 |
| Total | $32,311 |
Amounts in the income column in the above table include any capital gain distributions from underlying funds, which are presented in the corresponding line-item in the Statement of Operations, if applicable.
Investment Valuation
All investments are categorized as Level 1 under the Fair Value Hierarchy. The inputs or methodology used for valuing securities may not be an indication of the risk associated with investing in those securities. For more information on valuation inputs please refer to the Investment Valuation section in the accompanying Notes to Financial Statements.
See accompanying notes which are an integral part of the financial statements.
Fidelity® Utilities Central Fund
Financial Statements
Statement of Assets and Liabilities
| March 31, 2019 (Unaudited) | ||
| Assets | ||
| Investment in securities, at value — See accompanying schedule: Unaffiliated issuers (cost $476,801,274) | $600,337,161 | |
| Receivable for investments sold | 20,725,393 | |
| Receivable for fund shares sold | 71,729 | |
| Dividends receivable | 1,216,492 | |
| Distributions receivable from Fidelity Central Funds | 9,852 | |
| Other receivables | 722 | |
| Total assets | 622,361,349 | |
| Liabilities | ||
| Payable to custodian bank | $604,451 | |
| Payable for investments purchased | 2,153,956 | |
| Payable for fund shares redeemed | 517,994 | |
| Other payables and accrued expenses | 3,274 | |
| Total liabilities | 3,279,675 | |
| Net Assets | $619,081,674 | |
| Net Assets consist of: | ||
| Paid in capital | $498,811,179 | |
| Total distributable earnings (loss) | 120,270,495 | |
| Net Assets, for 3,314,094 shares outstanding | $619,081,674 | |
| Net Asset Value, offering price and redemption price per share ($619,081,674 ÷ 3,314,094 shares) | $186.80 |
See accompanying notes which are an integral part of the financial statements.
Statement of Operations
| Six months ended March 31, 2019 (Unaudited) | ||
| Investment Income | ||
| Dividends | $9,651,158 | |
| Income from Fidelity Central Funds | 32,311 | |
| Total income | 9,683,469 | |
| Expenses | ||
| Custodian fees and expenses | $6,452 | |
| Independent directors' fees and expenses | 1,811 | |
| Interest | 1,461 | |
| Total expenses | 9,724 | |
| Net investment income (loss) | 9,673,745 | |
| Realized and Unrealized Gain (Loss) | ||
| Net realized gain (loss) on: | ||
| Investment securities: | ||
| Unaffiliated issuers | 2,514,601 | |
| Fidelity Central Funds | 190 | |
| Foreign currency transactions | (2,467) | |
| Total net realized gain (loss) | 2,512,324 | |
| Change in net unrealized appreciation (depreciation) on: | ||
| Investment securities: | ||
| Unaffiliated issuers | 33,213,458 | |
| Assets and liabilities in foreign currencies | 33 | |
| Total change in net unrealized appreciation (depreciation) | 33,213,491 | |
| Net gain (loss) | 35,725,815 | |
| Net increase (decrease) in net assets resulting from operations | $45,399,560 |
See accompanying notes which are an integral part of the financial statements.
Statement of Changes in Net Assets
| Six months ended March 31, 2019 (Unaudited) | Year ended September 30, 2018 | |
| Increase (Decrease) in Net Assets | ||
| Operations | ||
| Net investment income (loss) | $9,673,745 | $16,627,429 |
| Net realized gain (loss) | 2,512,324 | 71,733,141 |
| Change in net unrealized appreciation (depreciation) | 33,213,491 | (17,662,873) |
| Net increase (decrease) in net assets resulting from operations | 45,399,560 | 70,697,697 |
| Distributions to shareholders | (53,835,715) | – |
| Distributions to shareholders from net investment income | – | (15,349,761) |
| Distributions to shareholders from net realized gain | – | (31,029,277) |
| Total distributions | (53,835,715) | (46,379,038) |
| Affiliated share transactions | ||
| Proceeds from sales of shares | 15,463,143 | 207,343,028 |
| Reinvestment of distributions | 53,835,715 | 46,379,038 |
| Cost of shares redeemed | (67,218,253) | (153,927,139) |
| Net increase (decrease) in net assets resulting from share transactions | 2,080,605 | 99,794,927 |
| Total increase (decrease) in net assets | (6,355,550) | 124,113,586 |
| Net Assets | ||
| Beginning of period | 625,437,224 | 501,323,638 |
| End of period | $619,081,674 | $625,437,224 |
| Other Information | ||
| Undistributed net investment income end of period | $2,669,884 | |
| Shares | ||
| Sold | 84,931 | 1,181,944 |
| Issued in reinvestment of distributions | 308,584 | 263,771 |
| Redeemed | (365,304) | (866,220) |
| Net increase (decrease) | 28,211 | 579,495 |
See accompanying notes which are an integral part of the financial statements.
Financial Highlights
Fidelity Utilities Central Fund
| Six months ended (Unaudited) March 31, | Years endedSeptember 30, | |||||
| 2019 | 2018 | 2017 | 2016 | 2015 | 2014 | |
| Selected Per–Share Data | ||||||
| Net asset value, beginning of period | $190.34 | $185.24 | $162.92 | $144.05 | $155.14 | $130.43 |
| Income from Investment Operations | ||||||
| Net investment income (loss)A | 2.91 | 5.36 | 5.08 | 4.73 | 4.36 | 4.11 |
| Net realized and unrealized gain (loss) | 10.51 | 16.04 | 21.62 | 18.44 | (11.35) | 24.33 |
| Total from investment operations | 13.42 | 21.40 | 26.70 | 23.17 | (6.99) | 28.44 |
| Distributions from net investment income | (2.88) | (5.04) | (4.38) | (4.30) | (4.10) | (3.73) |
| Distributions from net realized gain | (14.08) | (11.25) | – | – | – | – |
| Total distributions | (16.96) | (16.30)B | (4.38) | (4.30) | (4.10) | (3.73) |
| Net asset value, end of period | $186.80 | $190.34 | $185.24 | $162.92 | $144.05 | $155.14 |
| Total ReturnC,D | 7.75% | 12.46% | 16.66% | 16.23% | (4.66)% | 21.98% |
| Ratios to Average Net AssetsE,F | ||||||
| Expenses before reductionsG | - %H | -% | -% | -% | -% | -% |
| Expenses net of fee waivers, if anyG | - %H | -% | -% | -% | -% | -% |
| Expenses net of all reductionsG | - %H | -% | -% | -% | -% | -% |
| Net investment income (loss) | 3.18%H | 2.95% | 2.96% | 3.03% | 2.78% | 2.80% |
| Supplemental Data | ||||||
| Net assets, end of period (000 omitted) | $619,082 | $625,437 | $501,324 | $463,043 | $406,258 | $482,971 |
| Portfolio turnover rateI | 91%H | 112%J | 47%J | 76% | 110% | 121%J |
A Calculated based on average shares outstanding during the period.
B Total distributions of $16.30 per share is comprised of distributions from net investment income of $5.043 and distributions from net realized gain of $11.253 per share.
C Total returns for periods of less than one year are not annualized.
D Total returns would have been lower if certain expenses had not been reduced during the applicable periods shown.
E Fees and expenses of any underlying Fidelity Central Funds are not included in the Fund's expense ratio. The Fund indirectly bears its proportionate share of the expenses of any underlying Fidelity Central Funds.
F Expense ratios reflect operating expenses of the Fund. Expenses before reductions do not reflect amounts reimbursed by the investment adviser or reductions from expense offset arrangements and do not represent the amount paid by the Fund during periods when reimbursements or reductions occur. Expenses net of fee waivers reflect expenses after reimbursement by the investment adviser but prior to reductions from expense offset arrangements. Expenses net of all reductions represent the net expenses paid by the Fund.
G Amount represents less than .005%.
H Annualized
I Amount does not include the portfolio activity of any underlying Fidelity Central Funds.
J Portfolio turnover rate excludes securities received or delivered in-kind.
See accompanying notes which are an integral part of the financial statements.
Notes to Financial Statements (Unaudited)
For the period ended March 31, 2019
1. Organization.
Fidelity Communication Services Central Fund (Communication Services)(formerly Fidelity Telecom Services Central Fund), Fidelity Consumer Discretionary Central Fund (Consumer Discretionary), Fidelity Consumer Staples Central Fund (Consumer Staples), Fidelity Energy Central Fund (Energy), Fidelity Financials Central Fund (Financials), Fidelity Health Care Central Fund (Health Care), Fidelity Industrials Central Fund (Industrials), Fidelity Information Technology Central Fund (Information Technology), Fidelity Materials Central Fund (Materials), Fidelity Real Estate Equity Central Fund (Real Estate Equity), and Fidelity Utilities Central Fund (Utilities), collectively referred to as the Funds, are funds of Fidelity Central Investment Portfolios LLC (the LLC) and are authorized to issue an unlimited number of shares. The LLC is registered under the Investment Company Act of 1940, as amended (the 1940 Act), as an open-end management investment company organized as a Delaware Limited Liability Company. Shares of each Fund are only offered to other investment companies and accounts managed by Fidelity Management & Research Company (FMR), or its affiliates (the Investing Funds). All of the Funds are non-diversified, with the exception of Financials and Health Care. The Funds invest primarily in securities of companies whose principal business activities fall within specific industries. The Funds are referred to as Fidelity Central Funds and may also invest in other Fidelity Central Funds available only to investment companies and other accounts managed by FMR and its affiliates.
2. Investments in Fidelity Central Funds.
The Funds invest in Fidelity Central Funds, which are open-end investment companies generally available only to other investment companies and accounts managed by the investment adviser and its affiliates. The Funds' Schedules of Investments list each of the Fidelity Central Funds held as of period end, if any, as an investment of each Fund, but do not include the underlying holdings of each Fidelity Central Fund. As an Investing Fund, each Fund indirectly bears its proportionate share of the expenses of the underlying Fidelity Central Funds.
The Money Market Central Funds seek preservation of capital and current income and are managed by Fidelity Investments Money Management, Inc. (FIMM), an affiliate of the investment adviser. Annualized expenses of the Money Market Central Funds as of their most recent shareholder report date are less than .005%.
A complete unaudited list of holdings for each Fidelity Central Fund is available upon request or at the Securities and Exchange Commission (the SEC) website at www.sec.gov. In addition, the financial statements of the Fidelity Central Funds are available on the SEC website or upon request.
3. Significant Accounting Policies.
Each Fund is an investment company and applies the accounting and reporting guidance of the Financial Accounting Standards Board (FASB) Accounting Standards Codification Topic 946 Financial Services – Investments Companies. The financial statements have been prepared in conformity with accounting principles generally accepted in the United States of America (GAAP), which require management to make certain estimates and assumptions at the date of the financial statements. Actual results could differ from those estimates. Subsequent events, if any, through the date that the financial statements were issued have been evaluated in the preparation of the financial statements. The following summarizes the significant accounting policies of the Funds:
Investment Valuation. Investments are valued as of 4:00 p.m. Eastern time on the last calendar day of the period. The Board of Directors (the Board) has delegated the day to day responsibility for the valuation of each Fund's investments to the Fair Value Committee (the Committee) established by each Fund's investment adviser. In accordance with valuation policies and procedures approved by the Board, each Fund attempts to obtain prices from one or more third party pricing vendors or brokers to value its investments. When current market prices, quotations or currency exchange rates are not readily available or reliable, investments will be fair valued in good faith by the Committee, in accordance with procedures adopted by the Board. Factors used in determining fair value vary by investment type and may include market or investment specific events. The frequency with which these procedures are used cannot be predicted and they may be utilized to a significant extent. The Committee oversees each Fund's valuation policies and procedures and reports to the Board on the Committee's activities and fair value determinations. The Board monitors the appropriateness of the procedures used in valuing each Fund's investments and ratifies the fair value determinations of the Committee.
Each Fund categorizes the inputs to valuation techniques used to value its investments into a disclosure hierarchy consisting of three levels as shown below:
- Level 1 – quoted prices in active markets for identical investments
- Level 2 – other significant observable inputs (including quoted prices for similar investments, interest rates, prepayment speeds, etc.)
- Level 3 – unobservable inputs (including the Fund's own assumptions based on the best information available)
Valuation techniques used to value each Fund's investments by major category are as follows:
Equity securities, including restricted securities, for which market quotations are readily available, are valued at the last reported sale price or official closing price as reported by a third party pricing vendor on the primary market or exchange on which they are traded and are categorized as Level 1 in the hierarchy. In the event there were no sales during the day or closing prices are not available, securities are valued at the last quoted bid price or may be valued using the last available price and are generally categorized as Level 2 in the hierarchy. For foreign equity securities, when market or security specific events arise, comparisons to the valuation of American Depositary Receipts (ADRs), futures contracts, Exchange-Traded Funds (ETFs)and certain indexes as well as quoted prices for similar securities may be used and would be categorized as Level 2 in the hierarchy. For equity securities, including restricted securities, where observable inputs are limited, assumptions about market activity and risk are used and these securities may be categorized as Level 3 in the hierarchy. Equity securities, including restricted securities, for which observable inputs are not available are valued using alternate valuation approaches, including the market approach and the income approach and are categorized as Level 3 in the hierarchy. The market approach generally consists of using comparable market transactions while the income approach generally consists of using the net present value of estimated future cash flows, adjusted as appropriate for liquidity, credit, market and/or other risk factors.
Investments in open-end mutual funds, including the Fidelity Central Funds, are valued at their closing net asset value (NAV) each business day and are categorized as Level 1 in the hierarchy.
The following provides information on Level 3 securities held by Information Technology that were valued at period end based on unobservable inputs. These amounts exclude valuations provided by a broker.
| Asset Type | Fair Value | Valuation Technique(s) | Unobservable Input | Amount or Range/Weighted Average | Impact to Valuation from an Increase in Input(a) |
| Equities | $49,735,102 | Recovery value | Recovery value | 0.0% | Increase |
| Market comparable | Enterprise value/Sales multiple (EV/S) | 4.0 – 9.0/6.5 | Increase | ||
| Discount rate | 6.0% | Decrease | |||
| Discount for lack of marketability | 10.0% | Decrease | |||
| Market approach | Discount for lack of marketability | 20.00% | Decrease |
(a) Represents the directional change in the fair value of the Level 3 investments that could have resulted from an increase in the corresponding input as of period end. A decrease to the unobservable input would have had the opposite effect. Significant changes in these inputs may have resulted in a significantly higher or lower fair value measurement at period end.
Changes in valuation techniques may result in transfers in or out of an assigned level within the disclosure hierarchy. The aggregate value of investments by input level as of March 31, 2019, as well as a roll forward of level 3 investments, is included at the end of each applicable Fund's Schedule of Investments.
Foreign Currency. The Funds may use foreign currency contracts to facilitate transactions in foreign-denominated securities. Gains and losses from these transactions may arise from changes in the value of the foreign currency or if the counterparties do not perform under the contracts' terms.
Foreign-denominated assets, including investment securities, and liabilities are translated into U.S. dollars at the exchange rates at period end. Purchases and sales of investment securities, income and dividends received and expenses denominated in foreign currencies are translated into U.S. dollars at the exchange rate in effect on the transaction date.
The effects of exchange rate fluctuations on investments are included with the net realized and unrealized gain (loss) on investment securities. Other foreign currency transactions resulting in realized and unrealized gain (loss) are disclosed separately.
Investment Transactions and Income. For financial reporting purposes, the Funds' investment holdings and NAV include trades executed through the end of the last business day of the period. The NAV per share for processing shareholder transactions is calculated as of the close of business of the New York Stock Exchange (NYSE), normally 4:00 p.m. Eastern time and includes trades executed through the end of the prior business day. Gains and losses on securities sold are determined on the basis of identified cost and for certain Funds include proceeds received from litigation. Dividend income is recorded on the ex-dividend date, except for certain dividends from foreign securities where the ex-dividend date may have passed, which are recorded as soon as the Funds are informed of the ex-dividend date. Non-cash dividends included in dividend income, if any, are recorded at the fair market value of the securities received. Income and capital gain distributions from Fidelity Central Funds, if any, are recorded on the ex-dividend date. Certain distributions received by the Funds represent a return of capital or capital gain. The Funds determine the components of these distributions subsequent to the ex-dividend date, based upon receipt of tax filings or other correspondence relating to the underlying investment. These distributions are recorded as a reduction of cost of investments and/or as a realized gain. Investment income is recorded net of foreign taxes withheld where recovery of such taxes is uncertain.
Expenses. Expenses directly attributable to a fund are charged to that fund. Expenses attributable to more than one fund are allocated among the respective funds on the basis of relative net assets or other appropriate methods. Expense estimates are accrued in the period to which they relate and adjustments are made when actual amounts are known.
Income Tax Information and Distributions to Shareholders. Each year, each Fund intends to qualify as a regulated investment company under Subchapter M of the Internal Revenue Code, including distributing substantially all of its taxable income and realized gains. As a result, no provision for U.S. Federal income taxes is required. Each Fund files a U.S. federal tax return, in addition to state and local tax returns as required. Each Fund's federal income tax returns are subject to examination by the Internal Revenue Service (IRS) for a period of three fiscal years after they are filed. State and local tax returns may be subject to examination for an additional fiscal year depending on the jurisdiction. Foreign taxes are provided for based on each Fund's understanding of the tax rules and rates that exist in the foreign markets in which it invests. Energy is subject to a tax imposed on capital gains by certain countries in which it invests. An estimated deferred tax liability for net unrealized appreciation on the applicable securities is included in Other payables and accrued expenses on the Statement of Assets & Liabilities.
Distributions are declared and recorded on the ex-dividend date. Income and capital gain distributions are determined in accordance with income tax regulations, which may differ from GAAP. These differences resulted in distribution reclassifications for certain funds for the period ended September 30, 2018.
Capital accounts within the financial statements are adjusted for permanent book-tax differences. These adjustments have no impact on net assets or the results of operations. Capital accounts are not adjusted for temporary book-tax differences which will reverse in a subsequent period.
Book-tax differences are primarily due to the short-term gain distributions from the Underlying Funds, foreign currency transactions, passive foreign investment companies (PFIC), certain foreign taxes, partnerships, redemptions in kind, certain deemed distributions and losses deferred due to wash sales and excise tax regulations.
As of period end, the cost and unrealized appreciation (depreciation) in securities, and derivatives if applicable, for federal income tax purposes were as follows for each Fund:
| Tax cost | Gross unrealized appreciation | Gross unrealized depreciation | Net unrealized appreciation (depreciation) | |
| Communication Services | $1,494,170,626 | $179,562,690 | $(35,110,840) | $144,451,850 |
| Consumer Discretionary | 1,388,130,286 | 567,982,653 | (36,841,982) | 531,140,671 |
| Consumer Staples | 1,209,721,155 | 190,310,448 | (100,299,002) | 90,011,446 |
| Energy | 952,740,345 | 93,543,295 | (98,758,165) | (5,214,870) |
| Financials | 2,857,786,347 | 525,762,773 | (105,792,733) | 419,970,040 |
| Health Care | 2,385,507,153 | 703,641,108 | (93,894,742) | 609,746,366 |
| Industrials | 1,586,634,060 | 299,945,062 | (82,969,808) | 216,975,254 |
| Information Technology | 3,616,761,037 | 757,016,546 | (79,821,080) | 677,195,466 |
| Materials | 495,439,487 | 38,232,802 | (43,796,167) | (5,563,365) |
| Real Estate Equity | 114,803,875 | 22,219,740 | (2,893,187) | 19,326,553 |
| Utilities | 481,778,423 | 124,837,179 | (6,278,441) | 118,558,738 |
Capital loss carryforwards are only available to offset future capital gains of the Funds to the extent provided by regulations and may be limited. Under the Regulated Investment Company Modernization Act of 2010 (the Act), the Funds are permitted to carry forward capital losses incurred in taxable years beginning after December 22, 2010 for an unlimited period and such capital losses are required to be used prior to any losses that expire. The capital loss carryforward information presented below, including any applicable limitation, is estimated as of prior fiscal period end and is subject to adjustment.
| No expiration | |||
| Short-term | Long-term | Total capital loss carryforward | |
| Energy | (3,447,139) | (12,127,368) | (15,574,507) |
Certain of the Funds elected to defer to the next fiscal year capital losses recognized during the period November 1, 2017 to September 30, 2018. Loss deferrals were as follows:
| Capital losses | |
| Consumer Staples | (23,583,745) |
| Materials | (6,309,744) |
| Real Estate Equity | (1,132,863) |
Restricted Securities. The Funds may invest in securities that are subject to legal or contractual restrictions on resale. These securities generally may be resold in transactions exempt from registration or to the public if the securities are registered. Disposal of these securities may involve time-consuming negotiations and expense, and prompt sale at an acceptable price may be difficult. Information regarding restricted securities is included at the end of each applicable Fund's Schedule of Investments.
New Rule Issuance. During August 2018, the U.S. Securities and Exchange Commission issued Final Rule Release No. 33-10532, Disclosure Update and Simplification. This Final Rule includes amendments specific to registered investment companies that are intended to eliminate overlap in disclosure requirements between Regulation S-X and GAAP. In accordance with these amendments, certain line-items in the Funds' financial statements have been combined or removed for the current period as outlined in the table below.
| Financial Statement | Current Line-Item Presentation (As Applicable) | Prior Line-Item Presentation (As Applicable) |
| Statement of Assets and Liabilities | Total distributable earnings (loss) | Undistributed/Distributions in excess of/Accumulated net investment income (loss) Accumulated/Undistributed net realized gain (loss) Net unrealized appreciation (depreciation) |
| Statement of Changes in Net Assets | N/A - removed | Undistributed/Distributions in excess of/Accumulated net investment income (loss) end of period |
| Statement of Changes in Net Assets | Distributions to shareholders | Distributions to shareholders from net investment income Distributions to shareholders from net realized gain |
4. Purchases and Sales of Investments.
Purchases and sales of securities, other than short-term securities and in-kind transactions, are noted in the table below.
| Purchases ($) | Sales ($) | |
| Communication Services | 979,338,565 | 861,072,650 |
| Consumer Discretionary | 512,867,848 | 661,652,220 |
| Consumer Staples | 254,881,250 | 334,784,977 |
| Energy | 184,938,756 | 228,271,614 |
| Financials | 884,639,393 | 1,052,890,087 |
| Health Care | 728,596,506 | 997,812,256 |
| Industrials | 1,158,658,880 | 1,350,304,659 |
| Information Technology | 1,839,677,311 | 2,116,969,252 |
| Materials | 191,436,314 | 216,033,572 |
| Real Estate Equity | 35,527,450 | 34,045,724 |
| Utilities | 276,074,724 | 335,493,840 |
5. Fees and Other Transactions with Affiliates.
Management Fee and Expense Contract. FMR Co., Inc. (the investment adviser), an affiliate of FMR, provides each Fund with investment management services. The Funds do not pay any fees for these services. Pursuant to each Fund's management contract with the investment adviser, FMR pays the investment adviser a portion of the management fees it receives from the Investing Funds. In addition, under an expense contract FMR pays all other expenses of each Fund, excluding custody fees, the compensation of the independent Directors, and certain miscellaneous expenses such as proxy and shareholder meeting expenses.
Brokerage Commissions. Certain Funds placed a portion of their portfolio transactions with brokerage firms which are affiliates of the investment adviser. Brokerage commissions are included in net realized gain (loss) and change in net unrealized appreciation (depreciation) in the Statement of Operations. The commissions paid to these affiliated firms were as follows:
| Amount | |
| Communication Services | $38,705 |
| Consumer Discretionary | 8,536 |
| Consumer Staples | 11,850 |
| Energy | 9,092 |
| Financials | 19,487 |
| Healthcare | 18,796 |
| Industrials | 33,780 |
| Information Technology | 67,484 |
| Materials | 8,221 |
| Real Estate Equity | 261 |
| Utilities | 10,123 |
Interfund Lending Program. Pursuant to an Exemptive Order issued by the SEC, the Funds, along with other registered investment companies having management contracts with FMR or other affiliated entities of FMR, may participate in an interfund lending program. This program provides an alternative credit facility allowing the funds to borrow from, or lend money to, other participating affiliated funds. At period end, there were no interfund loans outstanding. Each applicable fund's activity in this program during the period for which loans were outstanding was as follows:
| Borrower or Lender | Average Loan Balance | Weighted Average Interest Rate | Interest Expense | |
| Communication Services | Borrower | $21,023,200 | 2.51% | $7,343 |
| Consumer Discretionary | Borrower | 8,972,909 | 2.63% | 14,433 |
| Consumer Staples | Borrower | 12,163,500 | 2.58% | 5,239 |
| Healthcare | Borrower | 6,796,000 | 2.45% | 1,385 |
| Industrials | Borrower | 6,444,167 | 2.48% | 2,666 |
| Information Technology | Borrower | 23,382,000 | 2.50% | 3,231 |
| Utilities | Borrower | 4,274,800 | 2.46% | 1,461 |
Interfund Trades. The Funds may purchase from or sell securities to other Fidelity Funds under procedures adopted by the Board. The procedures have been designed to ensure these interfund trades are executed in accordance with Rule 17a-7 of the 1940 Act. Interfund trades are included within the respective purchases and sales amounts shown in the Purchases and Sales of Investments note.
Affiliated Redemptions In-Kind. During the period, shares of each Fund were redeemed in-kind for investments as presented in the accompanying table. The net realized gain on investments delivered through in-kind redemptions is included in the accompanying Statement of Operations. The amount of the in-kind redemptions is included in share transactions in the accompanying Statement of Changes in Net Assets. Each Fund recognized no gain or loss for federal income tax purposes.
Details of the transactions are presented in the accompanying table:
| Fund | Value of Investments Delivered | Redeemed Number of Shares | Net Realized Gain |
| Consumer Discretionary Central Fund | $287,749,549 | 893,050 | $108,561,478 |
| Information Technology Central Fund | 723,452,667 | 1,696,454 | 26,854,351 |
Affiliated Exchanges In-Kind. During the period, Communication Services Central Fund received investments valued at $993,861,507 in exchange for 5,410,831 shares of the Fund. The amount of in-kind exchanges is included in share transactions in the accompanying Statement of Changes in Net Assets.
In addition, during the period, Consumer Discretionary Central Fund received investments valued at $17,340,708 in exchange for 53,818 shares of the Fund. The amount of the in-kind exchanges is included in share transactions in the accompanying Statement of Changes in Net Assets.
Prior Fiscal Year Redemptions In-Kind. During the prior period, Strategic Advisers Fidelity U.S. Total Stock Fund (the Investing Fund) completed redemption in-kind transactions with each Fund. The Funds delivered investments and cash, as presented in the accompanying table. The Funds had net realized gains on investments delivered through the in-kind redemptions. The amount of the in-kind redemptions is included in share transactions in the accompanying Statement of Changes in Net Assets. Each Fund recognized no gain or loss for federal income tax purposes.
Details of the transactions are presented in the accompanying table:
| Fund | Value of Investments and Cash Delivered | Redeemed Number of Shares | Net Realized Gain |
| Communication Services Central Fund | $76,741,721 | 436,231 | $29,760,814 |
| Consumer Discretionary Central Fund | 378,555,786 | 1,210,681 | 155,553,360 |
| Consumer Staples Central Fund | 252,919,327 | 1,264,850 | 65,011,527 |
| Energy Central Fund | 236,019,145 | 1,770,852 | 75,772,210 |
| Financials Central Fund | 648,125,061 | 6,136,967 | 211,708,985 |
| Health Care Central Fund | 540,969,646 | 1,316,740 | 219,905,327 |
| Industrials Central Fund | 351,576,852 | 1,193,404 | 111,073,545 |
| Information Technology Central Fund | 990,210,766 | 2,179,737 | 407,599,634 |
| Materials Central Fund | 95,285,035 | 374,592 | 31,881,334 |
| Utilities Central Fund | 105,225,234 | 598,211 | 23,415,877 |
Prior Fiscal Year Exchanges In-Kind. During the prior period, VIP FundsManager 20%, VIP FundsManager 50%, VIP FundsManager 60%, VIP FundsManager 70%, and VIP FundsManager 85% (the Investing Funds) completed exchange in-kind transactions with each Fund. The Funds received investments and cash, as presented in the accompanying table. The amount of the in-kind exchanges is included in share transactions in the accompanying Statement of Changes in Net Assets.
Details of the transactions are presented in the accompanying table:
| Fund | Value of Investments and Cash Delivered | Redeemed Number of Shares |
| Communication Services Central Fund | $67,398,250 | 388,507 |
| Consumer Discretionary Central Fund | 420,009,534 | 1,369,492 |
| Consumer Staples Central Fund | 278,330,010 | 1,338,189 |
| Energy Central Fund | 239,961,028 | 1,866,239 |
| Financials Central Fund | 575,771,740 | 5,505,563 |
| Health Care Central Fund | 541,001,090 | 1,323,939 |
| Industrials Central Fund | 278,038,031 | 959,678 |
| Information Technology Central Fund | 1,186,541,219 | 2,614,448 |
| Materials Central Fund | 126,544,324 | 506,522 |
| Utilities Central Fund | 117,288,521 | 673,607 |
Other. During the period, the investment advisor reimbursed the Funds for certain losses as follows:
| Amount | |
| Consumer Discretionary | $13,227 |
| Consumer Staples | 2,779 |
| Energy | 12,366 |
| Information Technology | 100,685 |
| Materials | 5,641 |
6. Security Lending.
Certain Funds lend portfolio securities through a lending agent from time to time in order to earn additional income. For equity securities, a lending agent is used and may loan securities to certain qualified borrowers, including Fidelity Capital Markets (FCM), a broker-dealer affiliated with the Funds. On the settlement date of the loan, each applicable Fund receives collateral (in the form of U.S. Treasury obligations, letters of credit and/or cash) against the loaned securities and maintains collateral in an amount not less than 100% of the market value of the loaned securities during the period of the loan. The market value of the loaned securities is determined at the close of business of the Funds and any additional required collateral is delivered to the Funds on the next business day. The Funds or borrower may terminate the loan at any time, and if the borrower defaults on its obligation to return the securities loaned because of insolvency or other reasons, the Funds may apply collateral received from the borrower against the obligation. The Funds may experience delays and costs in recovering the securities loaned. Any cash collateral received is invested in the Fidelity Securities Lending Cash Central Fund. The value of loaned securities and cash collateral at period end are disclosed on each applicable Fund's Statement of Assets and Liabilities. Security lending income represents the income earned on investing cash collateral, less rebates paid to borrowers and any lending agent fees associated with the loan, plus any premium payments received for lending certain types of securities. Security lending income is presented on each applicable Fund's Statement of Operations as a component of income from Fidelity Central Funds. Security lending activity was as follows:
| Total Security Lending Income | Security Lending Income From Securities Loaned to FCM | Value of Securities Loaned to FCM at Period End | |
| Communication Services | $40,157 | $– | $– |
| Consumer Discretionary | 39,486 | 896 | – |
| Consumer Staples | 12,013 | – | – |
| Energy | 42,960 | – | – |
| Financials | 420 | – | – |
| Health Care | 145,056 | 2,870 | 158,178 |
| Industrials | 123,431 | – | – |
| Information Technology | 216,951 | 359 | – |
| Materials | 44,536 | 15,726 | – |
| Real Estate Equity | 642 | – | – |
| Utilities | 3,918 | – | – |
7. Expense Reductions.
The investment adviser voluntarily agreed to reimburse a portion of each Fund's operating expenses. In addition, through arrangements with each applicable Fund's custodian, credits realized as a result of certain uninvested cash balances were used to reduce each applicable Fund's expenses. During the period, the reduction of expenses for each Fund is noted in the table below.
| Fund | Custody Earnings Credits |
| Consumer Staples | 860 |
| Energy | 726 |
| Health Care | 893 |
| Industrials | 1,324 |
| Information Technology | 1,968 |
| Real Estate Equity | 95 |
8. Other.
The Funds' organizational documents provide former and current directors and officers with a limited indemnification against liabilities arising in connection with the performance of their duties to the Funds. In the normal course of business, the Funds may also enter into contracts that provide general indemnifications. The Funds' maximum exposure under these arrangements is unknown as this would be dependent on future claims that may be made against the Funds. The risk of material loss from such claims is considered remote.
At the end of the period, mutual funds managed by FMR or its affiliates were the owners of record of all of the outstanding shares of the Funds.
Shareholder Expense Example
As a shareholder of a Fund, you incur two types of costs: (1) transaction costs and (2) ongoing costs, including other Fund expenses. This Example is intended to help you understand your ongoing costs (in dollars) of investing in the Funds and to compare these costs with the ongoing costs of investing in other mutual funds.
The Example is based on an investment of $1,000 invested at the beginning of the period and held for the entire period (October 1, 2018 to March 31, 2019).
Actual Expenses
The first line of the accompanying table for each fund provides information about actual account values and actual expenses. You may use the information in this line, together with the amount you invested, to estimate the expenses that you paid over the period. Simply divide your account value by $1,000.00 (for example, an $8,600 account value divided by $1,000.00 = 8.6), then multiply the result by the number in the first line for a fund under the heading entitled "Expenses Paid During Period" to estimate the expenses you paid on your account during this period. In addition, each Fund, as a shareholder in the underlying Fidelity Central Funds, will indirectly bear its pro-rata share of the fees and expenses incurred by the underlying Fidelity Central Funds. These fees and expenses are not included in the Fund's annualized expense ratio used to calculate the expense estimate in the table below.
Hypothetical Example for Comparison Purposes
The second line of the accompanying table for each fund provides information about hypothetical account values and hypothetical expenses based on a fund's actual expense ratio and an assumed rate of return of 5% per year before expenses, which is not the Fund's actual return. The hypothetical account values and expenses may not be used to estimate the actual ending account balance or expenses you paid for the period. You may use this information to compare the ongoing costs of investing in the Fund and other funds. To do so, compare this 5% hypothetical example with the 5% hypothetical examples that appear in the shareholder reports of the other funds. In addition, each Fund, as a shareholder in the underlying Fidelity Central Funds, will indirectly bear its pro-rata share of the fees and expenses incurred by the underlying Fidelity Central Funds. These fees and expenses are not included in the Fund's annualized expense ratio used to calculate the expense estimate in the table below.
Please note that the expenses shown in the table are meant to highlight your ongoing costs only and do not reflect any transaction costs. Therefore, the second line of the table is useful in comparing ongoing costs only, and will not help you determine the relative total costs of owning different funds.
| Annualized Expense Ratio-A | Beginning Account Value October 1, 2018 | Ending Account Value March 31, 2019 | Expenses Paid During Period-B October 1, 2018 to March 31, 2019 |
|
| Communication Services | .0040% | |||
| Actual | $1,000.00 | $1,044.70 | $.02 | |
| Hypothetical-C | $1,000.00 | $1,024.91 | $.02 | |
| Consumer Discretionary | .0042% | |||
| Actual | $1,000.00 | $974.20 | $.02 | |
| Hypothetical-C | $1,000.00 | $1,024.91 | $.02 | |
| Consumer Staples | .0036% | |||
| Actual | $1,000.00 | $1,052.80 | $.02 | |
| Hypothetical-C | $1,000.00 | $1,024.91 | $.02 | |
| Energy | .0032% | |||
| Actual | $1,000.00 | $811.10 | $.01 | |
| Hypothetical-C | $1,000.00 | $1,024.92 | $.02 | |
| Financials | .0021% | |||
| Actual | $1,000.00 | $973.70 | $.01 | |
| Hypothetical-C | $1,000.00 | $1,024.92 | $.01 | |
| Health Care | .0036% | |||
| Actual | $1,000.00 | $943.10 | $.02 | |
| Hypothetical-C | $1,000.00 | $1,024.91 | $.02 | |
| Industrials | .0025% | |||
| Actual | $1,000.00 | $934.30 | $.01 | |
| Hypothetical-C | $1,000.00 | $1,024.92 | $.01 | |
| Information Technology | .0032% | |||
| Actual | $1,000.00 | $933.80 | $.02 | |
| Hypothetical-C | $1,000.00 | $1,024.92 | $.02 | |
| Materials | .0038% | |||
| Actual | $1,000.00 | $929.70 | $.02 | |
| Hypothetical-C | $1,000.00 | $1,024.91 | $.02 | |
| Real Estate Equity | .0116% | |||
| Actual | $1,000.00 | $1,080.00 | $.06 | |
| Hypothetical-C | $1,000.00 | $1,024.87 | $.06 | |
| Utilities | .0032% | |||
| Actual | $1,000.00 | $1,077.50 | $.02 | |
| Hypothetical-C | $1,000.00 | $1,024.92 | $.02 |
A Annualized expense ratio reflects expenses net of applicable fee waivers.
B Expenses are equal to each Fund's annualized expense ratio, multiplied by the average account value over the period, multiplied by 182/ 365 (to reflect the one-half year period). The fees and expenses of the underlying Money Market Central Funds in which each Fund invests are not included in each Fund's annualized expense ratio.
C 5% return per year before expenses
Board Approval of Investment Advisory Contracts and Management Fees
Fidelity Communication Services Central Fund
Fidelity Consumer Discretionary Central Fund
Fidelity Consumer Staples Central Fund
Fidelity Energy Central Fund
Fidelity Financials Central Fund
Fidelity Health Care Central Fund
Fidelity Industrials Central Fund
Fidelity Information Technology Central Fund
Fidelity Materials Central Fund
Fidelity Real Estate Equity Central Fund
Fidelity Utilities Central Fund
Each year, the Board of Directors, including the Independent Directors (together, the Board), votes on the renewal of the management contract with FMR Co., Inc. (FMRC) and the sub-advisory agreements (together, the Advisory Contracts) for each fund. FMRC and the sub-advisers are referred to herein as the Investment Advisers. The Board, assisted by the advice of fund counsel and Independent Directors' counsel, requests and considers a broad range of information relevant to the renewal of the Advisory Contracts throughout the year.
The Board meets regularly and, at each of its meetings, covers an extensive agenda of topics and materials and considers factors that are relevant to its annual consideration of the renewal of each fund's Advisory Contracts, including the services and support provided to each fund and its shareholders. The Board has established various standing committees (Committees), each composed of and chaired by Independent Directors with varying backgrounds, to which the Board has assigned specific subject matter responsibilities in order to enhance effective decision-making by the Board. The Board, acting directly and through its Committees, requests and receives information concerning the annual consideration of the renewal of each fund's Advisory Contracts. The Board also meets as needed to review matters specifically related to the Board's annual consideration of the renewal of the Advisory Contracts. Members of the Board may also meet with trustees of other Fidelity funds through joint ad hoc committees to discuss certain matters relevant to all of the Fidelity funds.
At its January 2019 meeting, the Board unanimously determined to renew each fund's Advisory Contracts. In reaching its determination, the Board considered all factors it believed relevant and reached a determination, with the assistance of fund counsel and Independent Directors' counsel and through the exercise of its business judgment, that the renewal of the Advisory Contracts was in the best interests of each fund and its shareholders and the fact that no fee is payable under the management contracts was fair and reasonable.
Nature, Extent, and Quality of Services Provided. The Board considered Fidelity's staffing as it relates to the funds, including the backgrounds of investment personnel of Fidelity, and also considered the funds' investment objectives, strategies, and related investment philosophies. The Independent Directors also had discussions with senior management of Fidelity's investment operations and investment groups. The Board considered the structure of the investment personnel compensation program and whether this structure provides appropriate incentives to act in the best interests of each fund. Resources Dedicated to Investment Management and Support Services. The Board and the Fund Oversight and Research Committees reviewed the general qualifications and capabilities of Fidelity's investment staff, including its size, education, experience, and resources, as well as Fidelity's approach to recruiting, training, managing, and compensating investment personnel. The Board noted that Fidelity has continued to increase the resources devoted to non-U.S. offices, including expansion of Fidelity's global investment organization. The Board also noted that Fidelity's analysts have extensive resources, tools and capabilities that allow them to conduct sophisticated quantitative and fundamental analysis, as well as credit analysis of issuers, counterparties and guarantors. Further, the Board considered that Fidelity's investment professionals have sufficient access to global information and data so as to provide competitive investment results over time, and that those professionals also have access to sophisticated tools that permit them to assess portfolio construction and risk and performance attribution characteristics continuously, as well as to transmit new information and research conclusions rapidly around the world. Additionally, in its deliberations, the Board considered Fidelity's trading, risk management, compliance, and technology and operations capabilities and resources, which are integral parts of the investment management process. Administrative Services. The Board considered (i) the nature, extent, quality, and cost of advisory and administrative services performed by the Investment Advisers and their affiliates under the Advisory Contracts and under separate agreements covering transfer agency, pricing and bookkeeping, and securities lending services for each fund; (ii) the nature and extent of the supervision of third party service providers, principally custodians, subcustodians, and pricing vendors; and (iii) the resources devoted to, and the record of compliance with, each fund's compliance policies and procedures. The Board also reviewed the allocation of fund brokerage, including allocations to brokers affiliated with the Investment Advisers, and the use of "soft" commission dollars to pay for research services. Investment Performance. The Board considered whether each fund has operated in accordance with its investment objective, as well as its record of compliance with its investment restrictions. The Board reviewed each fund's absolute investment performance, as well as each fund's relative investment performance, but did not consider performance to be a material factor in its decision to renew each fund's Advisory Contracts, as the funds are not publicly offered as stand-alone investment products. In this regard, the Board noted that each fund is designed to offer a liquid investment option for other investment companies managed by Fidelity and ultimately to enhance the performance of those investment companies.Based on its review, the Board concluded that the nature, extent, and quality of services provided to each fund under the Advisory Contracts should continue to benefit the shareholders of each fund. Competitiveness of Management Fee and Total Expense Ratio. The Board considered that while each fund does not pay a management fee, Fidelity Management & Research Company (FMR) pays a management fee on behalf of each fund and receives fees for providing services to funds that invest in the funds. The Board also noted that FMR bears all expenses of each fund with certain exceptions. Based on its review, the Board concluded that the management fee paid on behalf of each fund and each fund's total expense ratio were reasonable in light of the services that the fund and its shareholders receive and the other factors considered. Costs of the Services and Profitability. The Board considered the level of Fidelity's profits in respect of all the Fidelity funds, as well as the profitability of the funds that invest in these funds.PricewaterhouseCoopers LLP (PwC), auditor to Fidelity and certain Fidelity funds, has been engaged annually by the Board as part of the Board's assessment of Fidelity's profitability analysis. PwC's engagement includes the review and assessment of the methodologies used by Fidelity in determining the revenues and expenses attributable to Fidelity's mutual fund business, and completion of agreed-upon procedures in respect of the mathematical accuracy of the fund profitability information and its conformity to established allocation methodologies. After considering PwC's reports issued under the engagement and information provided by Fidelity, the Board concluded that while other allocation methods may also be reasonable, Fidelity's profitability methodologies are reasonable in all material respects.The Board also reviewed Fidelity's non-fund businesses and potential indirect benefits such businesses may have received as a result of their association with Fidelity's mutual fund business (i.e., fall-out benefits) as well as cases where Fidelity's affiliates may benefit from the funds' business. The Board noted that changes to fall-out benefits year-over-year reflect business developments at Fidelity's various businesses.The Board concluded that the costs of the services provided by and the profits realized by Fidelity in connection with the operation of each fund were not relevant to the renewal of the Advisory Contracts because each fund pays no advisory fees and FMR bears all expenses of each fund with certain exceptions. Economies of Scale. The Board concluded that because each fund pays no advisory fees and FMR bears all expenses of each fund with certain exceptions, the realization of economies of scale was not a material factor in the Board's decision to renew each fund's Advisory Contract. Additional Information Requested by the Board. In order to develop fully the factual basis for consideration of the Fidelity funds' advisory contracts, the Board requested and received additional information on certain topics, including: (i) fund performance trends, in particular the underperformance of certain funds, and Fidelity's long-term strategies for certain funds; (ii) Fidelity's fund profitability methodology, profitability trends for certain funds, and the impact of certain factors on fund profitability results; (iii) metrics for evaluating index fund and ETF performance and information about ETF trading characteristics; (iv) the methodology with respect to the evaluation of competitive fund data and peer group classifications and fee comparisons; (v) the expense structures for different funds and classes; (vi) information regarding other accounts managed by Fidelity, including collective investment trusts; and (vii) Fidelity's philosophies and strategies for evaluating funds and classes with lower or declining asset levels.Based on its evaluation of all of the conclusions noted above, and after considering all factors it believed relevant, the Board concluded that the advisory fee arrangements are fair and reasonable, and that each fund's Advisory Contracts should be renewed.
![]()
ESCIP-SANN-0519
1.831586.112
|
Fidelity® Floating Rate Central Fund Semi-Annual Report March 31, 2019 |
|
|
Beginning on January 1, 2021, as permitted by regulations adopted by the Securities and Exchange Commission, paper copies of a fund’s shareholder reports will no longer be sent by mail, unless you specifically request paper copies of the reports from the fund or from your financial intermediary, such as a financial advisor, broker-dealer or bank. Instead, the reports will be made available on a website, and you will be notified by mail each time a report is posted and provided with a website link to access the report.
If you already elected to receive shareholder reports electronically, you will not be affected by this change and you need not take any action. You may elect to receive shareholder reports and other communications from a fund electronically, by contacting your financial intermediary. For Fidelity customers, visit Fidelity's web site or call Fidelity using the contact information listed below.
You may elect to receive all future reports in paper free of charge. If you wish to continue receiving paper copies of your shareholder reports, you may contact your financial intermediary or, if you are a Fidelity customer, visit Fidelity’s website, or call Fidelity at the applicable toll-free number listed below. Your election to receive reports in paper will apply to all funds held with the fund complex/your financial intermediary.
| Account Type | Website | Phone Number |
| Brokerage, Mutual Fund, or Annuity Contracts: | fidelity.com/mailpreferences | 1-800-343-3548 |
| Employer Provided Retirement Accounts: | netbenefits.fidelity.com/preferences (choose 'no' under Required Disclosures to continue to print) | 1-800-343-0860 |
| Advisor Sold Accounts Serviced Through Your Financial Intermediary: | Contact Your Financial Intermediary | Your Financial Intermediary's phone number |
| Advisor Sold Accounts Serviced by Fidelity: | institutional.fidelity.com | 1-877-208-0098 |
Contents
|
Board Approval of Investment Advisory Contracts and Management Fees |
To view a fund's proxy voting guidelines and proxy voting record for the 12-month period ended June 30, visit http://www.fidelity.com/proxyvotingresults or visit the Securities and Exchange Commission's (SEC) web site at http://www.sec.gov.
You may also call 1-800-544-8544 to request a free copy of the proxy voting guidelines.
Standard & Poor's, S&P and S&P 500 are registered service marks of The McGraw-Hill Companies, Inc. and have been licensed for use by Fidelity Distributors Corporation.
Other third-party marks appearing herein are the property of their respective owners.
All other marks appearing herein are registered or unregistered trademarks or service marks of FMR LLC or an affiliated company. © 2019 FMR LLC. All rights reserved.
A fund files its complete schedule of portfolio holdings with the SEC for the first and third quarters of each fiscal year on Form N-PORT. Forms N-PORT are available on the SEC’s web site at http://www.sec.gov. A fund's Forms N-PORT may be reviewed and copied at the SEC’s Public Reference Room in Washington, DC. Information regarding the operation of the SEC's Public Reference Room may be obtained by calling 1-800-SEC-0330.
Investment Summary (Unaudited)
Top Five Holdings as of March 31, 2019
| (by issuer, excluding cash equivalents) | % of fund's net assets |
| Bass Pro Shops LLC. | 2.5 |
| Intelsat Jackson Holdings SA | 2.2 |
| Asurion LLC | 1.8 |
| Frontier Communications Corp. | 1.5 |
| TransDigm, Inc. | 1.4 |
| 9.4 |
Top Five Market Sectors as of March 31, 2019
| % of fund's net assets | |
| Technology | 15.5 |
| Telecommunications | 8.3 |
| Gaming | 7.4 |
| Energy | 6.5 |
| Services | 6.2 |
Quality Diversification (% of fund's net assets)
| As of March 31, 2019 * | ||
| BBB | 3.3% | |
| BB | 31.2% | |
| B | 53.3% | |
| CCC,CC,C | 5.9% | |
| Not Rated | 2.4% | |
| Equities | 0.7% | |
| Short-Term Investments and Net Other Assets | 3.2% | |
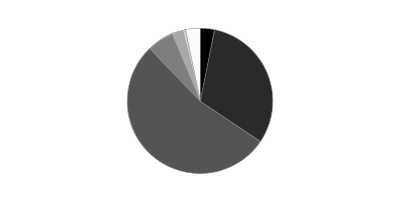
We have used ratings from Moody's Investors Service, Inc. Where Moody's® ratings are not available, we have used S&P® ratings. All ratings are as of the date indicated and do not reflect subsequent changes.
Asset Allocation (% of fund's net assets)
| As of March 31, 2019 * | ||
| Bank Loan Obligations | 92.2% | |
| Nonconvertible Bonds | 3.9% | |
| Common Stocks | 0.7% | |
| Short-Term Investments and Net Other Assets (Liabilities) | 3.2% | |

* Foreign investments - 12.3%
Schedule of Investments March 31, 2019 (Unaudited)
Showing Percentage of Net Assets
| Bank Loan Obligations - 92.2%(a) | |||
| Principal Amount | Value | ||
| Aerospace - 1.8% | |||
| DAE Aviation Holdings, Inc. Tranche B, term loan 3 month U.S. LIBOR + 3.750% 6.24% 7/7/22 (b)(c) | $3,342,886 | $3,344,992 | |
| TransDigm, Inc.: | |||
| Tranche E, term loan 3 month U.S. LIBOR + 2.500% 4.9986% 5/30/25 (b)(c) | 2,970,000 | 2,888,325 | |
| Tranche F, term loan 3 month U.S. LIBOR + 2.500% 4.9986% 6/9/23 (b)(c) | 16,616,491 | 16,213,541 | |
| Tranche G, term loan 3 month U.S. LIBOR + 2.500% 4.9986% 8/22/24 (b)(c) | 6,160,750 | 5,997,490 | |
| Wesco Aircraft Hardware Corp.: | |||
| Tranche A, term loan 3 month U.S. LIBOR + 3.000% 5.4986% 11/30/20 (b)(c) | 466,667 | 461,417 | |
| Tranche B, term loan 3 month U.S. LIBOR + 2.500% 5% 2/28/21 (b)(c) | 3,145,000 | 3,097,825 | |
| WP CPP Holdings LLC: | |||
| Tranche B 1LN, term loan 3 month U.S. LIBOR + 3.750% 6.5093% 4/30/25 (b)(c) | 4,228,750 | 4,191,748 | |
| Tranche B 2LN, term loan 3 month U.S. LIBOR + 7.750% 10.51% 4/30/26 (b)(c) | 1,000,000 | 988,330 | |
| TOTAL AEROSPACE | 37,183,668 | ||
| Air Transportation - 0.6% | |||
| Dynasty Acquisition Co., Inc.: | |||
| Tranche B 1LN, term loan 3 month U.S. LIBOR + 4.000% 1/24/26 (c)(d) | 3,957,378 | 3,956,270 | |
| Tranche B 2LN, term loan 3 month U.S. LIBOR + 4.000% 1/24/26 (c)(d) | 2,127,622 | 2,127,027 | |
| Transplace Holding, Inc. Tranche B 1LN, term loan 3 month U.S. LIBOR + 3.750% 6.2406% 10/5/24 (b)(c) | 3,456,337 | 3,434,735 | |
| XPO Logistics, Inc. Tranche B, term loan 3 month U.S. LIBOR + 2.000% 4.493% 2/23/25 (b)(c) | 2,245,000 | 2,204,882 | |
| TOTAL AIR TRANSPORTATION | 11,722,914 | ||
| Automotive & Auto Parts - 0.8% | |||
| Hertz Corp. Tranche B 1LN, term loan 3 month U.S. LIBOR + 2.750% 5.25% 6/30/23 (b)(c) | 5,032,744 | 4,933,700 | |
| North American Lifting Holdings, Inc.: | |||
| Tranche 1LN, term loan 3 month U.S. LIBOR + 4.500% 7.303% 11/27/20 (b)(c) | 6,409,606 | 5,982,278 | |
| Tranche 2LN, term loan 3 month U.S. LIBOR + 9.000% 11.803% 11/27/21 (b)(c) | 2,641,000 | 2,172,223 | |
| The Gates Corp. Tranche B 1LN, term loan 3 month U.S. LIBOR + 2.750% 5.2486% 3/31/24 (b)(c) | 635,415 | 626,563 | |
| UOS LLC Tranche B 1LN, term loan 3 month U.S. LIBOR + 5.500% 7.9975% 4/18/23 (b)(c) | 3,104,991 | 3,104,991 | |
| TOTAL AUTOMOTIVE & AUTO PARTS | 16,819,755 | ||
| Banks & Thrifts - 0.2% | |||
| Citadel Securities LP Tranche B, term loan 3 month U.S. LIBOR + 3.500% 5.9986% 2/22/26 (b)(c)(e) | 3,500,000 | 3,495,625 | |
| Broadcasting - 0.8% | |||
| AppLovin Corp. Tranche B, term loan 3 month U.S. LIBOR + 3.750% 6.2486% 8/15/25 (b)(c) | 4,488,750 | 4,466,306 | |
| CBS Radio, Inc. Tranche B 1LN, term loan 3 month U.S. LIBOR + 2.750% 5.243% 11/18/24 (b)(c) | 5,823,549 | 5,654,666 | |
| Clear Channel Communications, Inc. Tranche D, term loan 3 month U.S. LIBOR + 6.750% 0% 12/31/49 (c)(f) | 2,370,000 | 1,685,070 | |
| ION Media Networks, Inc. Tranche B, term loan 3 month U.S. LIBOR + 2.750% 5.25% 12/18/20 (b)(c) | 2,639,898 | 2,629,998 | |
| NEP/NCP Holdco, Inc.: | |||
| Tranche B 1LN, term loan 3 month U.S. LIBOR + 3.250% 5.7486% 10/19/25 (b)(c) | 1,346,625 | 1,333,495 | |
| Tranche B 2LN, term loan 3 month U.S. LIBOR + 7.000% 9.4955% 10/19/26 (b)(c) | 1,500,000 | 1,470,000 | |
| TOTAL BROADCASTING | 17,239,535 | ||
| Building Materials - 0.8% | |||
| ACProducts, Inc. Tranche B 1LN, term loan 3 month U.S. LIBOR + 5.500% 7.9986% 2/14/24 (b)(c)(e) | 2,125,000 | 2,018,750 | |
| GYP Holdings III Corp. Tranche B 1LN, term loan 3 month U.S. LIBOR + 2.750% 5.243% 6/1/25 (b)(c) | 2,898,138 | 2,802,731 | |
| Hamilton Holdco LLC Tranche B 1LN, term loan 3 month U.S. LIBOR + 2.000% 4.81% 7/2/25 (b)(c) | 2,976,256 | 2,946,494 | |
| HD Supply, Inc. Tranche B 5LN, term loan 3 month U.S. LIBOR + 1.750% 4.2486% 10/17/23 (b)(c) | 1,492,500 | 1,473,098 | |
| Traverse Midstream Partners Ll Tranche B, term loan 3 month U.S. LIBOR + 4.000% 6.5% 9/27/24 (b)(c) | 3,258,625 | 3,250,478 | |
| Ventia Deco LLC Tranche B, term loan 3 month U.S. LIBOR + 3.500% 6.303% 5/21/22 (b)(c) | 4,442,064 | 4,430,959 | |
| TOTAL BUILDING MATERIALS | 16,922,510 | ||
| Cable/Satellite TV - 2.7% | |||
| Cable One, Inc. Tranche B, term loan 3 month U.S. LIBOR + 1.750% 4.25% 5/1/24 (b)(c) | 1,247,775 | 1,242,322 | |
| Charter Communication Operating LLC Tranche B, term loan 3 month U.S. LIBOR + 2.000% 4.5% 4/30/25 (b)(c) | 27,117,720 | 26,914,337 | |
| CSC Holdings LLC: | |||
| Tranche B, term loan 3 month U.S. LIBOR + 2.500% 4.9838% 1/25/26 (b)(c) | 5,821,013 | 5,694,871 | |
| Tranche B3 1LN, term loan 3 month U.S. LIBOR + 2.250% 4.7338% 1/15/26 (b)(c) | 2,000,000 | 1,939,500 | |
| Tranche B4 1LN, term loan 3 month U.S. LIBOR + 3.000% 5.5905% 4/6/27 (b)(c) | 2,000,000 | 1,987,500 | |
| MCC Iowa LLC Tranche M, term loan 3 month U.S. LIBOR + 2.000% 4.41% 1/15/25 (b)(c) | 1,068,725 | 1,057,375 | |
| Virgin Media Bristol LLC Tranche B, term loan 3 month U.S. LIBOR + 2.500% 4.9838% 1/15/26 (b)(c) | 5,500,000 | 5,437,135 | |
| WideOpenWest Finance LLC Tranche B, term loan 3 month U.S. LIBOR + 3.250% 5.7406% 8/19/23 (b)(c) | 11,832,343 | 11,373,840 | |
| TOTAL CABLE/SATELLITE TV | 55,646,880 | ||
| Capital Goods - 0.5% | |||
| AECOM Tranche B, term loan 3 month U.S. LIBOR + 1.750% 4.2486% 3/13/25 (b)(c) | 1,816,151 | 1,778,121 | |
| Altra Industrial Motion Corp. Tranche B 1LN, term loan 3 month U.S. LIBOR + 2.000% 4.4986% 10/1/25 (b)(c) | 3,501,101 | 3,435,455 | |
| Apergy Corp. Tranche B, term loan 3 month U.S. LIBOR + 2.500% 5.029% 5/9/25 (b)(c) | 1,529,639 | 1,516,254 | |
| CPM Holdings, Inc.: | |||
| 2LN, term loan 3 month U.S. LIBOR + 8.250% 10.7486% 11/15/26 (b)(c) | 645,000 | 633,177 | |
| Tranche B 1LN, term loan 3 month U.S. LIBOR + 3.750% 6.2486% 11/15/25 (b)(c) | 2,129,663 | 2,108,366 | |
| TOTAL CAPITAL GOODS | 9,471,373 | ||
| Chemicals - 2.5% | |||
| ASP Chromaflo Intermediate Holdings, Inc. Tranche B 1LN, term loan 3 month U.S. LIBOR + 3.500% 5.9986% 11/18/23 (b)(c) | 1,077,389 | 1,065,268 | |
| Invictus U.S. Newco LLC: | |||
| Tranche 1LN, term loan 3 month U.S. LIBOR + 3.000% 5.5791% 3/28/25 (b)(c) | 1,984,951 | 1,963,871 | |
| Tranche 2LN, term loan 3 month U.S. LIBOR + 6.750% 9.3291% 3/28/26 (b)(c) | 1,500,000 | 1,485,000 | |
| MacDermid, Inc. Tranche B, term loan 3 month U.S. LIBOR + 2.250% 4.7486% 1/31/26 (b)(c) | 2,817,938 | 2,791,533 | |
| Messer Industries U.S.A., Inc. Tranche B 1LN, term loan 3 month U.S. LIBOR + 2.500% 9/28/25 (c)(d) | 6,500,000 | 6,357,845 | |
| OCI Partners LP Tranche B, term loan 3 month U.S. LIBOR + 4.000% 6.601% 3/13/25 (b)(c) | 5,936,269 | 5,914,008 | |
| Oxea Corp. Tranche B2, term loan 3 month U.S. LIBOR + 3.500% 6% 10/11/24 (b)(c) | 5,405,471 | 5,378,444 | |
| PQ Corp. Tranche B, term loan 3 month U.S. LIBOR + 2.500% 5.2444% 2/8/25 (b)(c) | 1,921,538 | 1,897,519 | |
| Starfruit U.S. Holdco LLC Tranche B, term loan 3 month U.S. LIBOR + 3.250% 5.7404% 10/1/25 (b)(c) | 9,915,000 | 9,760,128 | |
| The Chemours Co. LLC Tranche B 1LN, term loan 3 month U.S. LIBOR + 1.750% 4.25% 4/3/25 (b)(c) | 2,511,976 | 2,481,355 | |
| Trinseo Materials Operating SCA/Trinseo Materials Finance, Inc. term loan 3 month U.S. LIBOR + 2.000% 4.4989% 9/6/24 (b)(c) | 1,970,000 | 1,937,495 | |
| Tronox Blocked Borrower LLC Tranche B, term loan 3 month U.S. LIBOR + 3.000% 5.4986% 9/22/24 (b)(c) | 1,635,967 | 1,627,280 | |
| Tronox Finance LLC Tranche B, term loan 3 month U.S. LIBOR + 3.000% 5.4986% 9/22/24 (b)(c) | 3,533,179 | 3,514,418 | |
| Univar, Inc. Tranche B, term loan 3 month U.S. LIBOR + 2.250% 4.7486% 7/1/24 (b)(c) | 2,681,778 | 2,648,256 | |
| W. R. Grace & Co.-Conn.: | |||
| Tranche B 1LN, term loan 3 month U.S. LIBOR + 1.750% 4.351% 4/3/25 (b)(c) | 1,125,397 | 1,108,044 | |
| Tranche B 2LN, term loan 3 month U.S. LIBOR + 1.750% 4.351% 4/3/25 (b)(c) | 1,929,253 | 1,899,504 | |
| TOTAL CHEMICALS | 51,829,968 | ||
| Consumer Products - 1.0% | |||
| Coty, Inc. Tranche B 1LN, term loan 3 month U.S. LIBOR + 2.250% 4.7418% 4/5/25 (b)(c) | 2,711,341 | 2,619,833 | |
| CSM Bakery Supplies Tranche B 1LN, term loan 3 month U.S. LIBOR + 4.000% 6.8% 7/3/20 (b)(c) | 3,666,183 | 3,490,499 | |
| Owens & Minor Distribution, Inc. Tranche B, term loan 3 month U.S. LIBOR + 4.500% 6.9892% 4/30/25 (b)(c) | 4,477,500 | 3,358,125 | |
| Rodan & Fields LLC Tranche B, term loan 3 month U.S. LIBOR + 4.000% 6.4888% 6/15/25 (b)(c) | 1,826,200 | 1,579,663 | |
| Weight Watchers International, Inc. Tranche B, term loan 3 month U.S. LIBOR + 4.750% 7.56% 11/29/24 (b)(c) | 10,312,500 | 9,790,481 | |
| TOTAL CONSUMER PRODUCTS | 20,838,601 | ||
| Containers - 1.9% | |||
| Berlin Packaging, LLC Tranche B 1LN, term loan 3 month U.S. LIBOR + 3.000% 5.4951% 11/7/25 (b)(c) | 9,255,063 | 8,949,645 | |
| Berry Global, Inc.: | |||
| Tranche Q, term loan 3 month U.S. LIBOR + 2.000% 4.6101% 10/1/22 (b)(c) | 5,099,973 | 5,061,724 | |
| Tranche T, term loan 3 month U.S. LIBOR + 1.750% 4.2428% 1/6/21 (b)(c) | 7,384,667 | 7,352,396 | |
| BWAY Holding Co. Tranche B, term loan 3 month U.S. LIBOR + 3.250% 6.0325% 4/3/24 (b)(c) | 1,473,750 | 1,435,801 | |
| Charter Nex U.S., Inc. Tranche B 1LN, term loan 3 month U.S. LIBOR + 2.750% 5.2455% 5/16/24 (b)(c) | 1,331,288 | 1,291,069 | |
| Consolidated Container Co. Tranche B 1LN, term loan 3 month U.S. LIBOR + 2.750% 5.2486% 5/22/24 (b)(c) | 1,974,947 | 1,940,800 | |
| Crown Americas LLC Tranche B 1LN, term loan 3 month U.S. LIBOR + 2.000% 4.4838% 4/3/25 (b)(c) | 1,695,752 | 1,698,177 | |
| Hostess Brands LLC Tranche B, term loan 3 month U.S. LIBOR + 2.250% 4.8945% 8/3/22 (b)(c) | 366,105 | 355,305 | |
| Reynolds Group Holdings, Inc. Tranche B, term loan 3 month U.S. LIBOR + 2.750% 5.243% 2/5/23 (b)(c) | 9,143,629 | 9,029,333 | |
| Tank Holding Corp. Tranche B 1LN, term loan 3 month U.S. LIBOR + 4.000% 3/25/26 (c)(d) | 1,600,000 | 1,601,008 | |
| TOTAL CONTAINERS | 38,715,258 | ||
| Diversified Financial Services - 3.5% | |||
| AlixPartners LLP Tranche B, term loan 3 month U.S. LIBOR + 2.750% 5.2486% 4/4/24 (b)(c) | 2,912,514 | 2,889,214 | |
| Avolon TLB Borrower 1 (U.S.) LLC Tranche B3 1LN, term loan 3 month U.S. LIBOR + 2.000% 4.4878% 1/15/25 (b)(c) | 5,448,380 | 5,398,745 | |
| BCP Renaissance Parent LLC Tranche B, term loan 3 month U.S. LIBOR + 3.500% 6.2444% 10/31/24 (b)(c) | 3,487,394 | 3,469,957 | |
| Cypress Intermediate Holdings, Inc. Tranche B 1LN, term loan 3 month U.S. LIBOR + 3.000% 5.5% 4/27/24 (b)(c) | 2,947,500 | 2,890,407 | |
| Delos Finance SARL Tranche B, term loan 3 month U.S. LIBOR + 1.750% 4.553% 10/6/23 (b)(c) | 3,682,000 | 3,675,557 | |
| Financial & Risk U.S. Holdings, Inc. Tranche B, term loan 3 month U.S. LIBOR + 3.750% 6.243% 10/1/25 (b)(c) | 12,468,750 | 12,096,932 | |
| Finco I LLC Tranche B, term loan 3 month U.S. LIBOR + 2.000% 4.4986% 12/27/22 (b)(c) | 2,219,690 | 2,201,378 | |
| Fly Funding II SARL Tranche B, term loan 3 month U.S. LIBOR + 2.000% 4.7% 2/9/23 (b)(c) | 5,584,183 | 5,496,232 | |
| Flying Fortress Holdings, Inc. Tranche B, term loan 3 month U.S. LIBOR + 1.750% 4.351% 10/30/22 (b)(c) | 3,000,000 | 2,990,370 | |
| Focus Financial Partners LLC Tranche B 1LN, term loan 3 month U.S. LIBOR + 2.500% 4.993% 7/3/24 (b)(c) | 1,634,371 | 1,626,199 | |
| Franklin Square Holdings LP Tranche B, term loan 3 month U.S. LIBOR + 2.500% 5% 8/3/25 (b)(c) | 1,990,000 | 1,981,304 | |
| Greensky Holdings LLC Tranche B, term loan 3 month U.S. LIBOR + 3.250% 5.75% 3/29/25 (b)(c) | 2,108,700 | 2,088,941 | |
| HarbourVest Partners LLC Tranche B 1LN, term loan 3 month U.S. LIBOR + 2.250% 4.8489% 3/1/25 (b)(c) | 5,372,728 | 5,310,028 | |
| Kingpin Intermediate Holdings LLC Tranche B 1LN, term loan 3 month U.S. LIBOR + 3.500% 5.99% 7/3/24 (b)(c) | 975,050 | 968,351 | |
| NAB Holdings LLC Tranche B, term loan 3 month U.S. LIBOR + 3.000% 5.601% 6/30/24 (b)(c) | 1,891,296 | 1,829,829 | |
| Ocwen Loan Servicing LLC Tranche B, term loan 3 month U.S. LIBOR + 5.000% 7.4855% 12/5/20 (b)(c) | 2,737,265 | 2,723,579 | |
| Recess Holdings, Inc. Tranche B, term loan 3 month U.S. LIBOR + 3.750% 6.398% 9/29/24 (b)(c) | 854,156 | 832,093 | |
| SAI Global GP Tranche B, term loan 3 month U.S. LIBOR + 4.500% 6.993% 12/8/23 (b)(c) | 2,932,500 | 2,477,963 | |
| TransUnion LLC: | |||
| Tranche B 4LN, term loan 3 month U.S. LIBOR + 2.000% 4.493% 6/19/25 (b)(c) | 3,473,750 | 3,423,103 | |
| Tranche B, term loan 3 month U.S. LIBOR + 2.000% 4.493% 4/9/23 (b)(c) | 6,555,925 | 6,489,186 | |
| TOTAL DIVERSIFIED FINANCIAL SERVICES | 70,859,368 | ||
| Diversified Media - 0.1% | |||
| Lamar Media Corp. Tranche B, term loan 3 month U.S. LIBOR + 1.750% 4.25% 3/16/25 (b)(c) | 2,715,063 | 2,706,021 | |
| Energy - 5.6% | |||
| Arctic LNG Carriers Ltd. Tranche B 1LN, term loan 3 month U.S. LIBOR + 4.500% 6.9986% 5/18/23 (b)(c) | 5,565,018 | 5,384,155 | |
| BCP Raptor II LLC Tranche B, term loan 3 month U.S. LIBOR + 4.750% 7.3651% 11/3/25 (b)(c) | 5,000,000 | 4,715,000 | |
| BCP Raptor LLC Tranche B, term loan 3 month U.S. LIBOR + 4.250% 6.8789% 6/22/24 (b)(c) | 7,142,915 | 6,692,054 | |
| Brazos Delaware II LLC Tranche B, term loan 3 month U.S. LIBOR + 4.000% 6.4868% 5/21/25 (b)(c) | 2,764,113 | 2,617,615 | |
| California Resources Corp.: | |||
| Tranche 1LN, term loan 3 month U.S. LIBOR + 10.375% 12.8705% 12/31/21 (b)(c) | 12,435,000 | 13,095,672 | |
| Tranche B, term loan 3 month U.S. LIBOR + 4.750% 7.2455% 12/31/22 (b)(c) | 12,520,000 | 12,293,138 | |
| Citgo Petroleum Corp.: | |||
| Tranche B 1LN, term loan 3 month U.S. LIBOR + 5.000% 3/27/24 (c)(d) | 8,750,000 | 8,706,250 | |
| Tranche B, term loan 3 month U.S. LIBOR + 3.500% 8% 7/29/21 (b)(c) | 8,039,980 | 8,003,800 | |
| Consolidated Energy Finance SA Tranche B, term loan 3 month U.S. LIBOR + 2.500% 4.9886% 5/7/25 (b)(c) | 7,940,000 | 7,662,100 | |
| Delek U.S. Holdings, Inc. Tranche B 1LN, term loan 3 month U.S. LIBOR + 2.250% 4.75% 3/13/25 (b)(c) | 2,140,270 | 2,113,517 | |
| EG America LLC Tranche B 1LN, term loan 3 month U.S. LIBOR + 4.000% 6.8134% 2/6/25 (b)(c) | 696,484 | 679,421 | |
| Epic Crude Services LP Tranche B 1LN, term loan 3 month U.S. LIBOR + 5.000% 7.49% 3/1/26 (b)(c) | 5,000,000 | 4,935,950 | |
| Equitrans Midstream Corp. Tranche B, term loan 3 month U.S. LIBOR + 4.500% 7% 1/31/24 (b)(c) | 2,638,388 | 2,640,577 | |
| Foresight Energy LLC Tranche B 1LN, term loan 3 month U.S. LIBOR + 5.750% 8.3789% 3/28/22 (b)(c) | 1,345,049 | 1,312,539 | |
| FTS International, Inc. Tranche B, term loan 3 month U.S. LIBOR + 4.750% 7.2486% 4/16/21 (b)(c) | 1,043,173 | 1,040,242 | |
| Gavilan Resources LLC Tranche 2LN, term loan 3 month U.S. LIBOR + 6.000% 8.4855% 3/1/24 (b)(c) | 8,225,000 | 6,382,600 | |
| GIP III Stetson I LP Tranche B, term loan 3 month U.S. LIBOR + 4.250% 6.7318% 7/18/25 (b)(c) | 10,802,268 | 10,694,245 | |
| Gulf Finance LLC Tranche B 1LN, term loan 3 month U.S. LIBOR + 5.250% 7.8666% 8/25/23 (b)(c) | 3,987,481 | 3,165,063 | |
| Medallion Midland Acquisition Tranche B, term loan 3 month U.S. LIBOR + 3.250% 5.743% 10/30/24 (b)(c) | 3,647,835 | 3,547,520 | |
| Natgasoline LLC Tranche B, term loan 3 month U.S. LIBOR + 3.500% 6.125% 11/14/25 (b)(c) | 4,164,563 | 4,164,563 | |
| Terra-Gen Finance Co. LLC Tranche B, term loan 3 month U.S. LIBOR + 4.250% 6.7486% 12/9/21 (b)(c) | 3,643,749 | 3,261,156 | |
| TerraForm Power Operating LLC Tranche B, term loan 3 month U.S. LIBOR + 2.000% 4.4986% 11/8/22 (b)(c) | 1,046,750 | 1,019,273 | |
| TOTAL ENERGY | 114,126,450 | ||
| Entertainment/Film - 0.9% | |||
| AMC Entertainment Holdings, Inc.: | |||
| Tranche B 1LN, term loan 3 month U.S. LIBOR + 3.000% 3/14/26 (c)(d) | 4,000,000 | 3,968,000 | |
| Tranche B, term loan 3 month U.S. LIBOR + 2.250% 4.7338% 12/15/23 (b)(c) | 4,385,450 | 4,381,064 | |
| AMC Entertainment, Inc. Tranche B, term loan 3 month U.S. LIBOR + 2.250% 4.7338% 12/15/22 (b)(c) | 1,451,250 | 1,449,436 | |
| CDS U.S. Intermediate Holdings, Inc.: | |||
| Tranche B 1LN, term loan 3 month U.S. LIBOR + 3.750% 6.2958% 7/8/22 (b)(c) | 4,597,413 | 4,210,449 | |
| Tranche B 2LN, term loan 3 month U.S. LIBOR + 8.250% 10.8073% 7/8/23 (b)(c) | 760,000 | 675,450 | |
| SMG U.S. Midco 2, Inc. Tranche B 1LN, term loan 3 month U.S. LIBOR + 3.000% 5.4986% 1/23/25 (b)(c) | 2,821,500 | 2,781,519 | |
| TOTAL ENTERTAINMENT/FILM | 17,465,918 | ||
| Environmental - 0.3% | |||
| The Brickman Group, Ltd. Tranche B, term loan 3 month U.S. LIBOR + 2.500% 5% 8/15/25 (b)(c) | 1,983,756 | 1,968,045 | |
| Tunnel Hill Partners LP Tranche B 1LN, term loan 3 month U.S. LIBOR + 3.500% 5.9986% 2/8/26 (b)(c) | 1,315,000 | 1,303,494 | |
| WTG Holdings III Corp. Tranche B 1LN, term loan 3 month U.S. LIBOR + 3.000% 5.493% 12/20/24 (b)(c) | 2,242,410 | 2,214,379 | |
| TOTAL ENVIRONMENTAL | 5,485,918 | ||
| Food & Drug Retail - 3.2% | |||
| Agro Merchants Intermediate Ho Tranche B, term loan 3 month U.S. LIBOR + 3.750% 6.351% 12/6/24 (b)(c) | 2,884,514 | 2,846,669 | |
| Albertson's LLC: | |||
| Tranche B 7LN, term loan 3 month U.S. LIBOR + 3.000% 5.4986% 10/29/25 (b)(c) | 3,815,438 | 3,763,700 | |
| Tranche B, term loan 3 month U.S. LIBOR + 3.000% 5.6088% 12/21/22 (b)(c) | 2,664,534 | 2,641,593 | |
| BI-LO LLC Tranche B, term loan 3 month U.S. LIBOR + 8.000% 10.7108% 5/31/24 (b)(c) | 13,930,000 | 13,435,485 | |
| GOBP Holdings, Inc.: | |||
| 2LN, term loan 3 month U.S. LIBOR + 7.250% 10.053% 10/22/26 (b)(c) | 500,000 | 496,250 | |
| Tranche B 1LN, term loan 3 month U.S. LIBOR + 3.750% 6.553% 10/22/25 (b)(c) | 3,586,013 | 3,540,291 | |
| JBS USA Lux SA Tranche B, term loan 3 month U.S. LIBOR + 2.500% 4.9834% 10/30/22 (b)(c) | 13,523,065 | 13,416,639 | |
| JP Intermediate B LLC Tranche B, term loan 3 month U.S. LIBOR + 5.500% 8.2444% 11/20/25 (b)(c) | 1,797,250 | 1,683,430 | |
| Lannett Co., Inc.: | |||
| Tranche B, term loan 3 month U.S. LIBOR + 5.000% 7.493% 11/25/20 (b)(c) | 275,518 | 265,875 | |
| Tranche B, term loan 3 month U.S. LIBOR + 5.375% 7.868% 11/25/22 (b)(c) | 13,806,637 | 12,794,196 | |
| RPI Finance Trust Tranche B 6LN, term loan 3 month U.S. LIBOR + 2.000% 4.493% 3/27/23 (b)(c) | 4,247,044 | 4,220,500 | |
| Smart & Final, Inc. Tranche B, term loan 3 month U.S. LIBOR + 3.500% 6.1289% 11/15/22 (b)(c) | 5,721,971 | 5,440,622 | |
| TOTAL FOOD & DRUG RETAIL | 64,545,250 | ||
| Food/Beverage/Tobacco - 1.6% | |||
| 8th Avenue Food & Provisions, Inc.: | |||
| 2LN, term loan 3 month U.S. LIBOR + 7.750% 10.2404% 10/1/26 (b)(c) | 410,000 | 408,463 | |
| Tranche B 1LN, term loan 3 month U.S. LIBOR + 3.750% 6.2404% 10/1/25 (b)(c) | 1,197,000 | 1,195,803 | |
| Arterra Wines Canada, Inc. Tranche B, term loan 3 month U.S. LIBOR + 2.750% 5.3646% 12/16/23 (b)(c) | 1,946,295 | 1,909,802 | |
| Chobani LLC Tranche B, term loan 3 month U.S. LIBOR + 3.500% 5.9986% 10/7/23 (b)(c) | 9,710,527 | 9,285,692 | |
| Eg Finco Ltd. Tranche B, term loan 3 month U.S. LIBOR + 4.000% 6.601% 2/6/25 (b)(c) | 1,430,550 | 1,395,502 | |
| Post Holdings, Inc. Tranche B, term loan 3 month U.S. LIBOR + 2.000% 4.49% 5/24/24 (b)(c) | 5,618,981 | 5,563,690 | |
| Shearer's Foods, Inc.: | |||
| Tranche 2LN, term loan 3 month U.S. LIBOR + 6.750% 9.243% 6/30/22 (b)(c) | 4,741,187 | 4,563,392 | |
| Tranche B 1LN, term loan 3 month U.S. LIBOR + 4.250% 6.743% 6/30/21 (b)(c) | 3,456,183 | 3,396,771 | |
| U.S. Foods, Inc. Tranche B, term loan 3 month U.S. LIBOR + 2.000% 4.4986% 6/27/23 (b)(c) | 3,890,000 | 3,826,788 | |
| U.S. Salt LLC Tranche B 1LN, term loan 3 month U.S. LIBOR + 4.750% 7.2318% 1/16/26 (b)(c)(e) | 1,340,000 | 1,336,650 | |
| TOTAL FOOD/BEVERAGE/TOBACCO | 32,882,553 | ||
| Gaming - 7.1% | |||
| Affinity Gaming LLC Tranche B, term loan 3 month U.S. LIBOR + 3.250% 5.7486% 7/1/23 (b)(c) | 1,870,549 | 1,784,504 | |
| AP Gaming I LLC Tranche B, term loan 3 month U.S. LIBOR + 3.500% 5.9986% 2/15/24 (b)(c) | 2,253,274 | 2,241,444 | |
| Aristocrat Technologies, Inc. Tranche B 3LN, term loan 3 month U.S. LIBOR + 1.750% 4.5257% 10/19/24 (b)(c) | 6,293,118 | 6,169,017 | |
| Boyd Gaming Corp. Tranche B 1LN, term loan 3 month U.S. LIBOR + 2.250% 4.6576% 9/15/23 (b)(c) | 2,727,207 | 2,700,808 | |
| Caesars Resort Collection LLC Tranche B 1LN, term loan 3 month U.S. LIBOR + 2.750% 5.2486% 12/22/24 (b)(c) | 27,832,774 | 27,435,044 | |
| CityCenter Holdings LLC Tranche B, term loan 3 month U.S. LIBOR + 2.250% 4.743% 4/18/24 (b)(c) | 5,421,329 | 5,318,812 | |
| Eldorado Resorts, Inc. Tranche B, term loan 3 month U.S. LIBOR + 2.000% 4.875% 4/17/24 (b)(c) | 3,375,018 | 3,341,268 | |
| Gaming VC Holdings SA Tranche B2 1LN, term loan 3 month U.S. LIBOR + 2.500% 4.993% 3/15/24 (b)(c) | 4,041,663 | 3,999,548 | |
| Gateway Casinos & Entertainment Ltd. Tranche B 1LN, term loan 3 month U.S. LIBOR + 3.000% 5.601% 3/13/25 (b)(c) | 4,411,663 | 4,392,384 | |
| Golden Entertainment, Inc. Tranche B, term loan: | |||
| 3 month U.S. LIBOR + 3.000% 5.5% 10/20/24 (b)(c) | 8,865,113 | 8,776,462 | |
| 3 month U.S. LIBOR + 7.000% 9.5% 10/20/25 (b)(c) | 1,000,000 | 975,000 | |
| Golden Nugget, Inc. Tranche B 1LN, term loan 3 month U.S. LIBOR + 2.750% 5.2389% 10/4/23 (b)(c) | 16,070,257 | 15,897,019 | |
| Greektown Holdings LLC Tranche B, term loan 3 month U.S. LIBOR + 2.750% 5.243% 4/25/24 (b)(c) | 1,298,438 | 1,296,269 | |
| Las Vegas Sands LLC Tranche B, term loan 3 month U.S. LIBOR + 1.750% 4.2486% 3/27/25 (b)(c) | 7,663,794 | 7,520,864 | |
| Mohegan Tribal Gaming Authority Tranche B, term loan 3 month U.S. LIBOR + 4.000% 6.493% 10/14/23 (b)(c) | 2,380,546 | 2,249,616 | |
| Penn National Gaming, Inc. Tranche B, term loan 3 month U.S. LIBOR + 2.250% 4.7486% 10/15/25 (b)(c) | 4,488,750 | 4,438,252 | |
| Scientific Games Corp. Tranche B 5LN, term loan 3 month U.S. LIBOR + 2.750% 5.3123% 8/14/24 (b)(c) | 18,058,300 | 17,568,198 | |
| Stars Group Holdings BV Tranche B, term loan 3 month U.S. LIBOR + 3.500% 6.303% 7/10/25 (b)(c) | 13,498,557 | 13,461,706 | |
| Station Casinos LLC Tranche B, term loan 3 month U.S. LIBOR + 2.500% 5% 6/8/23 (b)(c) | 9,175,228 | 9,070,905 | |
| Wynn America LLC Tranche A 1LN, term loan 3 month U.S. LIBOR + 1.750% 4.25% 12/31/21 (b)(c) | 4,640,000 | 4,489,200 | |
| Wynn Resorts Ltd. Tranche B, term loan 3 month U.S. LIBOR + 2.250% 4.75% 10/30/24 (b)(c) | 1,250,000 | 1,222,463 | |
| TOTAL GAMING | 144,348,783 | ||
| Healthcare - 4.5% | |||
| American Renal Holdings, Inc. Tranche B, term loan 3 month U.S. LIBOR + 3.250% 5.7486% 6/22/24 (b)(c) | 3,856,537 | 3,658,889 | |
| CVS Holdings I LP: | |||
| Tranche 2LN, term loan 3 month U.S. LIBOR + 6.750% 9.25% 2/6/26 (b)(c) | 1,000,000 | 977,500 | |
| Tranche B 1LN, term loan 3 month U.S. LIBOR + 2.750% 5.25% 2/6/25 (b)(c) | 1,658,250 | 1,598,138 | |
| HCA Holdings, Inc.: | |||
| Tranche B 10LN, term loan 3 month U.S. LIBOR + 2.000% 4.4986% 3/13/25 (b)(c) | 10,890,000 | 10,873,012 | |
| Tranche B 11LN, term loan 3 month U.S. LIBOR + 1.750% 4.2486% 3/18/23 (b)(c) | 2,794,822 | 2,790,882 | |
| Innoviva, Inc. Tranche B, term loan 3 month U.S. LIBOR + 4.500% 7.1413% 8/18/22 (b)(c) | 154,275 | 151,190 | |
| MPH Acquisition Holdings LLC Tranche B, term loan 3 month U.S. LIBOR + 2.750% 5.553% 6/7/23 (b)(c) | 1,619,630 | 1,565,486 | |
| Ortho-Clinical Diagnostics, Inc. Tranche B 1LN, term loan 3 month U.S. LIBOR + 3.250% 5.7486% 6/30/25 (b)(c) | 6,261,458 | 6,024,024 | |
| PAREXEL International Corp. Tranche B, term loan 3 month U.S. LIBOR + 2.750% 5.2486% 9/27/24 (b)(c) | 5,368,200 | 5,166,893 | |
| Press Ganey Holdings, Inc. Tranche 1LN, term loan 3 month U.S. LIBOR + 2.750% 5.2486% 10/21/23 (b)(c) | 2,556,468 | 2,498,948 | |
| Prospect Medical Holdings, Inc. Tranche 1LN, term loan 3 month U.S. LIBOR + 5.500% 8% 2/22/24 (b)(c) | 3,220,663 | 2,922,751 | |
| RegionalCare Hospital Partners Holdings, Inc. Tranche B, term loan 3 month U.S. LIBOR + 4.500% 6.9818% 11/16/25 (b)(c) | 7,980,000 | 7,884,001 | |
| Tivity Health, Inc. Tranche B 1LN, term loan 3 month U.S. LIBOR + 5.250% 7.7486% 3/7/26 (b)(c) | 1,950,795 | 1,908,521 | |
| U.S. Anesthesia Partners, Inc. Tranche B, term loan 3 month U.S. LIBOR + 3.000% 5.4986% 6/23/24 (b)(c) | 3,111,702 | 3,075,139 | |
| U.S. Renal Care, Inc. Tranche B 1LN, term loan 3 month U.S. LIBOR + 4.250% 6.851% 12/31/22 (b)(c) | 5,800,914 | 5,788,848 | |
| Valeant Pharmaceuticals International, Inc.: | |||
| Tranche B 2LN, term loan 3 month U.S. LIBOR + 2.750% 5.2309% 11/27/25 (b)(c) | 4,750,000 | 4,691,385 | |
| Tranche B, term loan 3 month U.S. LIBOR + 3.000% 5.4809% 6/1/25 (b)(c) | 13,438,824 | 13,342,871 | |
| VVC Holding Corp. Tranche B 1LN, term loan 3 month U.S. LIBOR + 4.500% 7.197% 2/5/26 (b)(c) | 14,000,000 | 13,790,000 | |
| Wink Holdco, Inc. Tranche B, term loan 3 month U.S. LIBOR + 3.000% 5.4986% 12/1/24 (b)(c) | 3,695,663 | 3,572,486 | |
| TOTAL HEALTHCARE | 92,280,964 | ||
| Homebuilders/Real Estate - 2.0% | |||
| DTZ U.S. Borrower LLC Tranche B, term loan 3 month U.S. LIBOR + 3.250% 5.7486% 8/21/25 (b)(c) | 9,452,500 | 9,357,975 | |
| Forest City Enterprises LP Tranche B, term loan 3 month U.S. LIBOR + 4.000% 6.4809% 12/7/25 (b)(c) | 2,723,175 | 2,729,983 | |
| Lightstone Holdco LLC: | |||
| Tranche B 1LN, term loan 3 month U.S. LIBOR + 3.750% 6.243% 1/30/24 (b)(c) | 4,512,428 | 4,355,440 | |
| Tranche C 1LN, term loan 3 month U.S. LIBOR + 3.750% 6.243% 1/30/24 (b)(c) | 254,508 | 245,654 | |
| MGM Growth Properties Operating Partner LP Tranche B, term loan 3 month U.S. LIBOR + 2.000% 4.493% 3/23/25 (b)(c) | 4,227,665 | 4,165,772 | |
| Pisces Midco, Inc. Tranche B, term loan 3 month U.S. LIBOR + 3.750% 6.5469% 4/12/25 (b)(c) | 1,121,831 | 1,072,750 | |
| Realogy Group LLC Tranche B, term loan 3 month U.S. LIBOR + 2.250% 4.7318% 2/8/25 (b)(c) | 6,899,756 | 6,687,036 | |
| VICI Properties, LLC Tranche B 1LN, term loan 3 month U.S. LIBOR + 2.000% 4.4906% 12/22/24 (b)(c) | 12,500,682 | 12,266,294 | |
| TOTAL HOMEBUILDERS/REAL ESTATE | 40,880,904 | ||
| Hotels - 1.5% | |||
| Aimbridge Acquisition Co., Inc. Tranche B 1LN, term loan 3 month U.S. LIBOR + 3.750% 6.2392% 2/1/26 (b)(c) | 2,010,000 | 2,004,975 | |
| ESH Hospitality, Inc. Tranche B, term loan 3 month U.S. LIBOR + 2.000% 4.493% 8/30/23 (b)(c) | 2,616,347 | 2,596,724 | |
| Four Seasons Holdings, Inc. Tranche B, term loan 3 month U.S. LIBOR + 2.000% 4.4986% 11/30/23 (b)(c) | 7,056,966 | 6,993,735 | |
| Hilton Worldwide Finance LLC Tranche B 2LN, term loan 3 month U.S. LIBOR + 1.750% 4.2355% 10/25/23 (b)(c) | 2,792,849 | 2,785,867 | |
| Marriott Ownership Resorts, Inc. Tranche B, term loan 3 month U.S. LIBOR + 2.250% 4.743% 8/31/25 (b)(c) | 3,870,300 | 3,846,111 | |
| Travelport Finance Luxembourg SARL: | |||
| 1LN, term loan 3 month U.S. LIBOR + 5.000% 3/18/26 (c)(d) | 4,500,000 | 4,370,625 | |
| Tranche B 2LN, term loan 3 month U.S. LIBOR + 9.000% 3/18/27 (c)(d)(e) | 2,250,000 | 2,182,500 | |
| Wyndham Hotels & Resorts, Inc. Tranche B, term loan 3 month U.S. LIBOR + 1.750% 4.2486% 5/30/25 (b)(c) | 5,984,925 | 5,899,819 | |
| TOTAL HOTELS | 30,680,356 | ||
| Insurance - 3.7% | |||
| Acrisure LLC Tranche B, term loan 3 month U.S. LIBOR + 4.250% 6.8789% 11/22/23 (b)(c) | 3,971,775 | 3,941,152 | |
| Alliant Holdings Intermediate LLC Tranche B, term loan 3 month U.S. LIBOR + 2.750% 5.2318% 5/10/25 (b)(c) | 7,810,825 | 7,493,549 | |
| AmWINS Group, Inc. Tranche B 1LN, term loan 3 month U.S. LIBOR + 2.750% 5.2473% 1/25/24 (b)(c) | 4,434,702 | 4,368,181 | |
| Asurion LLC: | |||
| Tranche B 6LN, term loan 3 month U.S. LIBOR + 3.000% 5.4986% 11/3/23 (b)(c) | 6,167,520 | 6,132,859 | |
| Tranche B 7LN, term loan 3 month U.S. LIBOR + 3.000% 5.4986% 11/3/24 (b)(c) | 6,947,500 | 6,891,642 | |
| Tranche B, term loan: | |||
| 3 month U.S. LIBOR + 3.000% 5.4986% 8/4/22 (b)(c) | 11,081,435 | 11,014,171 | |
| 3 month U.S. LIBOR + 6.500% 8.9986% 8/4/25 (b)(c) | 14,390,000 | 14,563,831 | |
| HUB International Ltd. Tranche B, term loan 3 month U.S. LIBOR + 2.750% 5.5144% 4/25/25 (b)(c) | 12,922,300 | 12,480,745 | |
| USI, Inc. Tranche B, term loan 3 month U.S. LIBOR + 3.000% 5.601% 5/16/24 (b)(c) | 10,019,459 | 9,702,143 | |
| TOTAL INSURANCE | 76,588,273 | ||
| Leisure - 2.9% | |||
| Alterra Mountain Co. Tranche B 1LN, term loan 3 month U.S. LIBOR + 3.000% 5.493% 7/31/24 (b)(c) | 3,917,738 | 3,892,038 | |
| Callaway Golf Co. Tranche B, term loan 3 month U.S. LIBOR + 4.500% 6.9904% 12/14/25 (b)(c) | 2,967,563 | 2,987,356 | |
| Crown Finance U.S., Inc. Tranche B 1LN, term loan 3 month U.S. LIBOR + 2.500% 4.9986% 2/28/25 (b)(c) | 10,393,759 | 10,139,944 | |
| Delta 2 SARL Tranche B, term loan 3 month U.S. LIBOR + 2.500% 4.993% 2/1/24 (b)(c) | 16,554,747 | 15,921,528 | |
| Equinox Holdings, Inc.: | |||
| Tranche 2LN, term loan 3 month U.S. LIBOR + 7.000% 9.4986% 9/8/24 (b)(c) | 1,000,000 | 1,002,500 | |
| Tranche B-1, term loan 3 month U.S. LIBOR + 3.000% 5.493% 3/8/24 (b)(c) | 4,935,162 | 4,900,616 | |
| LTF Merger Sub, Inc. Tranche B, term loan 3 month U.S. LIBOR + 2.750% 5.3785% 6/10/22 (b)(c) | 5,835,583 | 5,759,487 | |
| NVA Holdings, Inc. Tranche B 3LN, term loan 3 month U.S. LIBOR + 2.750% 5.2486% 2/2/25 (b)(c) | 2,990,939 | 2,884,402 | |
| SeaWorld Parks & Entertainment, Inc. Tranche B 5LN, term loan 3 month U.S. LIBOR + 3.000% 5.493% 3/31/24 (b)(c) | 1,721,218 | 1,702,474 | |
| Seminole Tribe of Florida Tranche B, term loan 3 month U.S. LIBOR + 1.750% 4.243% 7/6/24 (b)(c) | 2,462,500 | 2,453,266 | |
| SP PF Buyer LLC Tranche B 1LN, term loan 3 month U.S. LIBOR + 4.500% 7.0581% 12/21/25 (b)(c) | 3,000,000 | 2,966,250 | |
| Varsity Brands Holding Co., Inc. Tranche B 1LN, term loan 3 month U.S. LIBOR + 3.500% 5.9986% 12/15/24 (b)(c) | 4,193,806 | 4,135,093 | |
| TOTAL LEISURE | 58,744,954 | ||
| Metals/Mining - 0.4% | |||
| American Rock Salt Co. LLC Tranche B, term loan 3 month U.S. LIBOR + 3.750% 6.2486% 3/21/25 (b)(c) | 3,375,900 | 3,359,021 | |
| Murray Energy Corp. Tranche B 2LN, term loan 3 month U.S. LIBOR + 7.250% 9.8789% 10/17/22 (b)(c) | 6,758,567 | 5,553,312 | |
| TOTAL METALS/MINING | 8,912,333 | ||
| Paper - 0.5% | |||
| Flex Acquisition Co., Inc.: | |||
| Tranche B 1LN, term loan 3 month U.S. LIBOR + 3.000% 5.6258% 12/29/23 (b)(c) | 5,214,625 | 5,042,959 | |
| Tranche B 1LN, term loan 3 month U.S. LIBOR + 3.250% 5.8758% 6/29/25 (b)(c) | 5,472,500 | 5,294,644 | |
| TOTAL PAPER | 10,337,603 | ||
| Publishing/Printing - 1.7% | |||
| Cengage Learning, Inc. Tranche B, term loan 3 month U.S. LIBOR + 4.250% 6.7355% 6/7/23 (b)(c) | 7,624,180 | 6,842,702 | |
| Getty Images, Inc. Tranche B 1LN, term loan 3 month U.S. LIBOR + 4.500% 7.0625% 2/12/26 (b)(c) | 1,995,000 | 1,977,544 | |
| Harland Clarke Holdings Corp. Tranche B 7LN, term loan 3 month U.S. LIBOR + 4.750% 7.351% 11/3/23 (b)(c) | 4,428,115 | 3,963,163 | |
| Houghton Mifflin Harcourt Publishing, Inc. Tranche B, term loan 3 month U.S. LIBOR + 3.000% 5.4986% 5/29/21 (b)(c) | 5,744,468 | 5,421,342 | |
| Learning Care Group (U.S.) No 2 Tranche B 1LN, term loan 3 month U.S. LIBOR + 3.250% 5.8157% 3/13/25 (b)(c) | 3,351,150 | 3,275,749 | |
| McGraw-Hill Global Education Holdings, LLC term loan 3 month U.S. LIBOR + 4.000% 6.493% 5/4/22 (b)(c) | 5,201,554 | 4,772,426 | |
| Proquest LLC Tranche B, term loan 3 month U.S. LIBOR + 3.250% 5.851% 10/24/21 (b)(c) | 3,305,953 | 3,286,680 | |
| Springer Science+Business Media Deutschland GmbH Tranche B 13LN, term loan 3 month U.S. LIBOR + 3.500% 5.993% 8/24/22 (b)(c) | 5,371,287 | 5,338,844 | |
| TOTAL PUBLISHING/PRINTING | 34,878,450 | ||
| Restaurants - 1.6% | |||
| Burger King Worldwide, Inc. Tranche B, term loan 3 month U.S. LIBOR + 2.250% 4.7486% 2/17/24 (b)(c) | 11,854,310 | 11,656,698 | |
| CEC Entertainment, Inc. Tranche B, term loan 3 month U.S. LIBOR + 3.250% 5.7486% 2/14/21 (b)(c) | 6,028,462 | 5,831,030 | |
| K-Mac Holdings Corp. Tranche B 1LN, term loan 3 month U.S. LIBOR + 3.250% 5.7355% 3/16/25 (b)(c) | 1,796,556 | 1,766,014 | |
| KFC Holding Co. Tranche B, term loan 3 month U.S. LIBOR + 1.750% 4.2318% 4/3/25 (b)(c) | 2,194,199 | 2,176,821 | |
| PFC Acquisition Corp. Tranche B 1LN, term loan 3 month U.S. LIBOR + 6.500% 8.9892% 3/1/26 (b)(c) | 3,625,000 | 3,570,625 | |
| Red Lobster Hospitality LLC Tranche B, term loan 3 month U.S. LIBOR + 5.250% 7.7486% 7/28/21 (b)(c) | 3,443,797 | 3,400,749 | |
| Restaurant Technologies, Inc.: | |||
| 1LN, term loan 3 month U.S. LIBOR + 3.250% 5.7486% 10/1/25 (b)(c) | 1,206,975 | 1,201,701 | |
| 2LN, term loan 3 month U.S. LIBOR + 6.500% 8.993% 10/1/26 (b)(c) | 500,000 | 497,500 | |
| Tacala Investment Corp. term loan 3 month U.S. LIBOR + 3.250% 5.7486% 2/1/25 (b)(c) | 1,759,688 | 1,733,838 | |
| TOTAL RESTAURANTS | 31,834,976 | ||
| Services - 6.1% | |||
| Acosta, Inc. Tranche B, term loan 3 month U.S. LIBOR + 3.250% 5.7486% 9/26/21 (b)(c) | 1,275,037 | 586,517 | |
| Almonde, Inc.: | |||
| Tranche 2LN, term loan 3 month U.S. LIBOR + 7.250% 9.851% 6/13/25 (b)(c) | 7,010,000 | 6,739,835 | |
| Tranche B 1LN, term loan 3 month U.S. LIBOR + 3.500% 6.303% 6/13/24 (b)(c) | 10,708,546 | 10,313,721 | |
| Ancestry.Com Operations, Inc. Tranche B 1LN, term loan 3 month U.S. LIBOR + 3.250% 5.75% 10/19/23 (b)(c) | 4,106,513 | 4,077,439 | |
| Aramark Services, Inc. Tranche B 3LN, term loan 3 month U.S. LIBOR + 1.750% 4.2486% 3/11/25 (b)(c) | 6,711,300 | 6,652,576 | |
| Avantor, Inc. Tranche B, term loan 3 month U.S. LIBOR + 3.750% 6.2486% 11/21/24 (b)(c) | 1,715,513 | 1,716,937 | |
| Brand Energy & Infrastructure Services, Inc. Tranche B, term loan 3 month U.S. LIBOR + 4.250% 6.9563% 6/21/24 (b)(c) | 5,881,170 | 5,622,222 | |
| Bright Horizons Family Solutions Tranche B, term loan 3 month U.S. LIBOR + 1.750% 4.2537% 11/7/23 (b)(c) | 1,719,684 | 1,707,870 | |
| Cast & Crew Payroll LLC Tranche B 1LN, term loan 3 month U.S. LIBOR + 4.000% 6.5% 2/7/26 (b)(c) | 2,125,000 | 2,131,375 | |
| Filtration Group Corp. Tranche B, term loan 3 month U.S. LIBOR + 3.000% 5.493% 3/29/25 (b)(c) | 2,376,000 | 2,358,679 | |
| Ion Trading Finance Ltd. Tranche B 1LN, term loan 3 month U.S. LIBOR + 4.000% 6.6336% 11/21/24 (b)(c) | 6,881,113 | 6,663,601 | |
| IRI Holdings, Inc. Tranche B 1LN, term loan 3 month U.S. LIBOR + 4.500% 7.1289% 11/30/25 (b)(c) | 997,500 | 981,789 | |
| KAR Auction Services, Inc. Tranche B, term loan 3 month U.S. LIBOR + 2.500% 5.125% 3/9/23 (b)(c) | 405,496 | 403,975 | |
| KUEHG Corp.: | |||
| Tranche B 2LN, term loan 3 month U.S. LIBOR + 8.250% 10.851% 8/22/25 (b)(c) | 1,000,000 | 990,000 | |
| Tranche B, term loan 3 month U.S. LIBOR + 3.750% 6.553% 2/21/25 (b)(c) | 8,017,979 | 7,906,048 | |
| Laureate Education, Inc. Tranche B 1LN, term loan 3 month U.S. LIBOR + 3.500% 5.9986% 4/26/24 (b)(c) | 18,563,992 | 18,533,918 | |
| Lineage Logistics Holdings, LLC. Tranche B, term loan 3 month U.S. LIBOR + 3.000% 5.493% 2/27/25 (b)(c) | 16,414,318 | 15,911,712 | |
| Qlik Technologies, Inc. Tranche B 1LN, term loan 3 month U.S. LIBOR + 4.250% 4/26/24 (c)(d) | 1,500,000 | 1,488,750 | |
| Sedgwick Claims Management Services, Inc. Tranche B, term loan 3 month U.S. LIBOR + 3.250% 5.7486% 12/31/25 (b)(c) | 1,790,513 | 1,750,602 | |
| Spin Holdco, Inc. Tranche B, term loan 3 month U.S. LIBOR + 3.250% 6.0289% 11/14/22 (b)(c) | 9,395,136 | 9,120,329 | |
| SuperMoose Borrower LLC Tranche B 1LN, term loan 3 month U.S. LIBOR + 3.750% 6.2486% 8/29/25 (b)(c) | 3,640,875 | 3,581,711 | |
| The GEO Group, Inc. Tranche B 1LN, term loan 3 month U.S. LIBOR + 2.000% 4.5% 3/23/24 (b)(c) | 871,845 | 830,798 | |
| Thomson Reuters IP&S Tranche B, term loan 3 month U.S. LIBOR + 3.250% 5.7468% 10/3/23 (b)(c) | 3,995,570 | 3,970,598 | |
| TMK Hawk Parent Corp. Tranche B, term loan 3 month U.S. LIBOR + 3.500% 5.9986% 9/26/24 (b)(c) | 1,512,139 | 1,332,572 | |
| WASH Multifamily Acquisition, Inc.: | |||
| Tranche B 1LN, term loan 3 month U.S. LIBOR + 3.250% 5.7486% 5/14/22 (b)(c) | 6,121,496 | 5,891,940 | |
| Tranche B 2LN, term loan 3 month U.S. LIBOR + 7.000% 9.4986% 5/14/23 (b)(c) | 645,000 | 619,200 | |
| Xerox Business Services LLC Tranche B, term loan 3 month U.S. LIBOR + 2.500% 4.9986% 12/7/23 (b)(c) | 2,073,712 | 2,060,751 | |
| TOTAL SERVICES | 123,945,465 | ||
| Steel - 0.1% | |||
| JMC Steel Group, Inc. Tranche B, term loan 3 month U.S. LIBOR + 2.250% 4.74% 6/14/21 (b)(c) | 2,183,551 | 2,160,624 | |
| Super Retail - 4.4% | |||
| Academy Ltd. Tranche B, term loan 3 month U.S. LIBOR + 4.000% 6.4896% 7/2/22 (b)(c) | 5,384,501 | 3,860,687 | |
| Bass Pro Shops LLC. Tranche B, term loan 3 month U.S. LIBOR + 5.000% 7.4986% 9/25/24 (b)(c) | 52,717,757 | 51,452,518 | |
| BJ's Wholesale Club, Inc. Tranche B 1LN, term loan 3 month U.S. LIBOR + 3.000% 5.4989% 2/3/24 (b)(c) | 11,670,157 | 11,629,078 | |
| Burlington Coat Factory Warehouse Corp. Tranche B, term loan 3 month U.S. LIBOR + 2.000% 4.5% 11/17/24 (b)(c) | 3,957,808 | 3,919,893 | |
| David's Bridal, Inc. term loan: | |||
| 3 month U.S. LIBOR + 7.500% 10.29% 7/18/23 (b)(c) | 116,629 | 117,796 | |
| 3 month U.S. LIBOR + 8.000% 10.79% 1/18/24 (b)(c) | 466,517 | 403,341 | |
| Harbor Freight Tools U.S.A., Inc. Tranche B, term loan 3 month U.S. LIBOR + 2.500% 4.993% 8/19/23 (b)(c) | 5,168,502 | 5,039,289 | |
| Party City Holdings, Inc. term loan 3 month U.S. LIBOR + 2.500% 4.9998% 8/19/22 (b)(c) | 3,971,858 | 3,937,660 | |
| PETCO Animal Supplies, Inc. Tranche B 1LN, term loan 3 month U.S. LIBOR + 3.250% 5.9944% 1/26/23 (b)(c) | 3,504,730 | 2,656,585 | |
| PetSmart, Inc. term loan 3 month U.S. LIBOR + 3.000% 5.49% 3/11/22 (b)(c) | 3,786,275 | 3,391,101 | |
| Sports Authority, Inc. Tranche B, term loan 3 month U.S. LIBOR + 6.000% 0% 11/16/17 (c)(e)(f) | 3,002,818 | 3,003 | |
| The Hillman Group, Inc. Tranche B, term loan 3 month U.S. LIBOR + 4.000% 6.4986% 5/31/25 (b)(c) | 4,303,321 | 4,098,913 | |
| TOTAL SUPER RETAIL | 90,509,864 | ||
| Technology - 15.1% | |||
| Anastasia Parent LLC Tranche B, term loan 3 month U.S. LIBOR + 3.750% 6.2486% 8/10/25 (b)(c) | 5,800,850 | 5,380,288 | |
| Aptean, Inc.: | |||
| 1LN, term loan 3 month U.S. LIBOR + 4.250% 3/29/26 (c)(d) | 2,000,000 | 1,997,500 | |
| Tranche 2LN, term loan 3 month U.S. LIBOR + 9.500% 12.11% 12/20/23 (b)(c) | 795,000 | 793,760 | |
| Tranche B 1LN, term loan 3 month U.S. LIBOR + 4.250% 6.86% 12/20/22 (b)(c) | 1,033,745 | 1,032,887 | |
| ATS Consolidated, Inc. Tranche B 1LN, term loan 3 month U.S. LIBOR + 3.750% 6.2486% 2/28/25 (b)(c) | 2,395,800 | 2,393,548 | |
| Bracket Intermediate Holding Corp. 1LN, term loan 3 month U.S. LIBOR + 4.250% 6.7319% 9/5/25 (b)(c) | 2,985,000 | 2,966,344 | |
| Brave Parent Holdings, Inc. Tranche B 1LN, term loan 3 month U.S. LIBOR + 4.000% 6.4986% 4/19/25 (b)(c) | 1,786,003 | 1,762,195 | |
| Cabot Microelectronics Corp. Tranche B, term loan 3 month U.S. LIBOR + 2.250% 4.75% 11/15/25 (b)(c) | 4,298,609 | 4,282,489 | |
| Ceridian HCM Holding, Inc. Tranche B, term loan 3 month U.S. LIBOR + 3.250% 5.743% 4/30/25 (b)(c) | 5,970,000 | 5,947,613 | |
| CommScope, Inc. Tranche B 1LN, term loan 3 month U.S. LIBOR + 3.250% 2/7/26 (c)(d) | 10,660,000 | 10,642,198 | |
| Compuware Corp. 1LN, term loan 3 month U.S. LIBOR + 3.500% 5.9986% 8/23/25 (b)(c) | 2,289,263 | 2,287,843 | |
| Cvent, Inc. Tranche B, term loan 3 month U.S. LIBOR + 3.750% 6.243% 11/29/24 (b)(c) | 2,967,513 | 2,900,744 | |
| Datto, Inc. 1LN, term loan 3 month U.S. LIBOR + 4.250% 3/29/26 (c)(d) | 2,000,000 | 2,000,000 | |
| Dell International LLC Tranche B, term loan 3 month U.S. LIBOR + 2.000% 4.5% 9/7/23 (b)(c) | 4,919,628 | 4,860,052 | |
| DG Investment Intermediate Holdings, Inc.: | |||
| Tranche B 1LN, term loan 3 month U.S. LIBOR + 3.000% 5.4986% 2/1/25 (b)(c) | 1,564,853 | 1,512,039 | |
| Tranche B 2LN, term loan 3 month U.S. LIBOR + 6.750% 9.2486% 2/1/26 (b)(c) | 600,000 | 576,000 | |
| Digicert Holdings, Inc. Tranche B, term loan: | |||
| 3 month U.S. LIBOR + 4.000% 6.4986% 10/31/24 (b)(c) | 9,676,807 | 9,483,271 | |
| 3 month U.S. LIBOR + 8.000% 10.4986% 10/31/25 (b)(c) | 2,148,276 | 2,091,883 | |
| Dynatrace LLC: | |||
| 2LN, term loan 3 month U.S. LIBOR + 7.000% 9.493% 8/23/26 (b)(c) | 332,794 | 330,508 | |
| Tranche B 1LN, term loan 3 month U.S. LIBOR + 3.250% 5.7486% 8/23/25 (b)(c) | 3,625,913 | 3,607,783 | |
| EagleView Technology Corp. Tranche B 1LN, term loan 3 month U.S. LIBOR + 3.500% 5.9818% 8/14/25 (b)(c) | 2,942,625 | 2,856,789 | |
| EIG Investors Corp. Tranche B, term loan 3 month U.S. LIBOR + 3.750% 6.3886% 2/9/23 (b)(c) | 4,392,349 | 4,364,897 | |
| Electro Rent Corp. Tranche B 1LN, term loan 3 month U.S. LIBOR + 5.000% 7.7792% 1/31/24 (b)(c) | 961,733 | 962,531 | |
| Epicor Software Corp. Tranche B, term loan 3 month U.S. LIBOR + 3.250% 5.75% 6/1/22 (b)(c) | 7,133,551 | 7,043,240 | |
| EPV Merger Sub, Inc.: | |||
| Tranche 2LN, term loan 3 month U.S. LIBOR + 7.250% 9.743% 3/8/26 (b)(c) | 545,000 | 525,925 | |
| Tranche B 1LN, term loan 3 month U.S. LIBOR + 3.250% 5.743% 3/8/25 (b)(c) | 3,493,600 | 3,317,837 | |
| EXC Holdings III Corp. Tranche B, term loan: | |||
| 3 month U.S. LIBOR + 3.500% 6.101% 12/2/24 (b)(c) | 1,562,688 | 1,552,921 | |
| 3 month U.S. LIBOR + 7.500% 10.3076% 12/1/25 (b)(c) | 1,000,000 | 997,500 | |
| First Data Corp. Tranche B, term loan: | |||
| 3 month U.S. LIBOR + 2.000% 4.4855% 7/10/22 (b)(c) | 12,839,203 | 12,806,848 | |
| 3 month U.S. LIBOR + 2.000% 4.4855% 4/26/24 (b)(c) | 5,213,560 | 5,197,190 | |
| Global Payments, Inc. Tranche B 3LN, term loan 3 month U.S. LIBOR + 1.750% 4.243% 4/22/23 (b)(c) | 1,518,322 | 1,501,241 | |
| Go Daddy Operating Co. LLC Tranche B, term loan 3 month U.S. LIBOR + 2.250% 4.743% 2/15/24 (b)(c) | 8,810,977 | 8,738,815 | |
| Hyland Software, Inc.: | |||
| Tranche 2LN, term loan 3 month U.S. LIBOR + 7.000% 9.493% 7/7/25 (b)(c) | 780,000 | 775,772 | |
| Tranche B 1LN, term loan 3 month U.S. LIBOR + 3.500% 5.9986% 7/1/24 (b)(c) | 2,787,271 | 2,779,718 | |
| Infor U.S., Inc. Tranche B 6LN, term loan 3 month U.S. LIBOR + 2.750% 5.243% 2/1/22 (b)(c) | 2,921,246 | 2,905,266 | |
| Kronos, Inc.: | |||
| 2LN, term loan 3 month U.S. LIBOR + 8.250% 10.9863% 11/1/24 (b)(c) | 8,490,000 | 8,601,474 | |
| Tranche B 1LN, term loan 3 month U.S. LIBOR + 3.000% 5.7363% 11/1/23 (b)(c) | 8,791,493 | 8,701,116 | |
| Landesk Group, Inc. term loan: | |||
| 3 month U.S. LIBOR + 4.250% 6.75% 1/20/24 (b)(c) | 7,226,162 | 7,167,486 | |
| 3 month U.S. LIBOR + 9.000% 11.5% 1/20/25 (b)(c) | 2,270,000 | 2,182,038 | |
| MA FinanceCo. LLC: | |||
| Tranche B 2LN, term loan 3 month U.S. LIBOR + 2.250% 4.743% 11/20/21 (b)(c) | 2,702,700 | 2,635,133 | |
| Tranche B 3LN, term loan: | |||
| 3 month U.S. LIBOR + 2.500% 4.993% 6/21/24 (b)(c) | 16,635,122 | 16,185,974 | |
| 3 month U.S. LIBOR + 2.500% 4.993% 6/21/24 (b)(c) | 2,654,043 | 2,582,384 | |
| McAfee LLC Tranche B, term loan: | |||
| 3 month U.S. LIBOR + 3.750% 6.243% 9/29/24 (b)(c) | 9,883,790 | 9,867,284 | |
| 3 month U.S. LIBOR + 8.500% 10.993% 9/29/25 (b)(c) | 3,166,667 | 3,185,667 | |
| MH Sub I LLC Tranche B, term loan 3 month U.S. LIBOR + 3.750% 6.2355% 9/15/24 (b)(c) | 1,203,889 | 1,185,843 | |
| Microchip Technology, Inc. Tranche B, term loan 3 month U.S. LIBOR + 2.000% 4.5% 5/29/25 (b)(c) | 4,110,680 | 4,060,325 | |
| NAVEX TopCo, Inc.: | |||
| 2LN, term loan 3 month U.S. LIBOR + 7.000% 9.5% 9/4/26 (b)(c) | 415,000 | 405,663 | |
| Tranche B 1LN, term loan 3 month U.S. LIBOR + 3.250% 5.75% 9/4/25 (b)(c) | 724,642 | 706,301 | |
| Renaissance Holding Corp.: | |||
| Tranche B 1LN, term loan 3 month U.S. LIBOR + 3.250% 5.743% 5/31/25 (b)(c) | 4,927,763 | 4,714,637 | |
| Tranche B 2LN, term loan 3 month U.S. LIBOR + 7.000% 9.493% 5/31/26 (b)(c) | 2,160,000 | 1,972,793 | |
| Severin Acquisition LLC Tranche B 1LN, term loan 3 month U.S. LIBOR + 3.250% 5.9885% 8/1/25 (b)(c) | 3,486,263 | 3,377,317 | |
| Solera LLC Tranche B, term loan 3 month U.S. LIBOR + 2.750% 5.2486% 3/3/23 (b)(c) | 6,024,385 | 5,967,937 | |
| Sophia L.P. term loan 3 month U.S. LIBOR + 3.250% 6.053% 9/30/22 (b)(c) | 6,139,337 | 6,092,003 | |
| SS&C Technologies, Inc.: | |||
| Tranche B 3LN, term loan 3 month U.S. LIBOR + 2.250% 4.7486% 4/16/25 (b)(c) | 5,982,912 | 5,927,630 | |
| Tranche B 4LN, term loan 3 month U.S. LIBOR + 2.250% 4.7486% 4/16/25 (b)(c) | 4,301,700 | 4,261,953 | |
| Tranche B 5LN, term loan 3 month U.S. LIBOR + 2.250% 4.7486% 4/16/25 (b)(c) | 8,272,747 | 8,194,487 | |
| Sybil Software LLC. Tranche B, term loan 3 month U.S. LIBOR + 2.500% 5.303% 9/30/23 (b)(c) | 1,654,378 | 1,651,020 | |
| Syniverse Holdings, Inc. Tranche B, term loan 3 month U.S. LIBOR + 5.000% 7.4838% 3/9/23 (b)(c) | 5,937,513 | 5,438,762 | |
| Tempo Acquisition LLC Tranche B, term loan 3 month U.S. LIBOR + 3.000% 5.4986% 5/1/24 (b)(c) | 7,837,501 | 7,757,167 | |
| TIBCO Software, Inc. Tranche B, term loan 3 month U.S. LIBOR + 3.500% 6% 12/4/20 (b)(c) | 834,052 | 829,882 | |
| TTM Technologies, Inc. Tranche B, term loan 3 month U.S. LIBOR + 2.500% 4.9893% 9/28/24 (b)(c) | 7,271,671 | 7,208,044 | |
| Uber Technologies, Inc. Tranche B, term loan 3 month U.S. LIBOR + 4.000% 6.4928% 4/4/25 (b)(c) | 8,436,250 | 8,434,141 | |
| Vantiv LLC Tranche B 4LN, term loan 3 month U.S. LIBOR + 1.750% 4.208% 8/9/24 (b)(c) | 4,950,000 | 4,936,437 | |
| Veritas U.S., Inc. Tranche B, term loan 3 month U.S. LIBOR + 4.500% 7.0211% 1/27/23 (b)(c) | 1,710,636 | 1,579,396 | |
| Verscend Holding Corp. Tranche B, term loan 3 month U.S. LIBOR + 4.500% 6.9986% 8/27/25 (b)(c) | 8,144,075 | 8,072,814 | |
| Vertafore, Inc.: | |||
| Tranche B 1LN, term loan 3 month U.S. LIBOR + 3.250% 6.053% 7/2/25 (b)(c) | 9,975,000 | 9,782,582 | |
| Tranche B 2LN, term loan 3 month U.S. LIBOR + 7.250% 9.7486% 7/2/26 (b)(c) | 3,500,000 | 3,447,500 | |
| VFH Parent LLC Tranche B 1LN, term loan 3 month U.S. LIBOR + 3.500% 6.1261% 3/1/26 (b)(c) | 7,000,000 | 7,008,750 | |
| Web.com Group, Inc.: | |||
| 2LN, term loan 3 month U.S. LIBOR + 7.750% 10.2428% 10/11/26 (b)(c) | 1,948,570 | 1,914,470 | |
| Tranche B 1LN, term loan 3 month U.S. LIBOR + 3.750% 6.2428% 10/11/25 (b)(c) | 4,761,461 | 4,693,039 | |
| WEX, Inc. Tranche B, term loan 3 month U.S. LIBOR + 2.250% 4.7486% 7/1/23 (b)(c) | 3,665,368 | 3,626,112 | |
| TOTAL TECHNOLOGY | 307,530,996 | ||
| Telecommunications - 7.6% | |||
| Altice Financing SA Tranche B, term loan: | |||
| 3 month U.S. LIBOR + 2.750% 5.2338% 7/15/25 (b)(c) | 5,422,292 | 5,157,956 | |
| 3 month U.S. LIBOR + 2.750% 5.2406% 1/31/26 (b)(c) | 3,456,250 | 3,288,622 | |
| Evo Payments International LLC Tranche B, term loan 3 month U.S. LIBOR + 3.250% 5.75% 12/22/23 (b)(c) | 2,940,300 | 2,932,949 | |
| Frontier Communications Corp. Tranche B 1LN, term loan 3 month U.S. LIBOR + 3.750% 6.25% 6/15/24 (b)(c) | 25,201,436 | 24,571,400 | |
| GTT Communications, Inc. Tranche B, term loan 3 month U.S. LIBOR + 2.750% 5.24% 5/31/25 (b)(c) | 4,466,250 | 4,199,392 | |
| Intelsat Jackson Holdings SA: | |||
| Tranche B, term loan 3 month U.S. LIBOR + 3.750% 6.2398% 11/27/23 (b)(c) | 34,275,000 | 33,728,657 | |
| Tranche B-4, term loan 3 month U.S. LIBOR + 4.500% 6.9898% 1/2/24 (b)(c) | 4,000,000 | 4,003,000 | |
| Tranche B-5, term loan 6.625% 1/2/24 | 6,205,000 | 6,194,141 | |
| Level 3 Financing, Inc. Tranche B, term loan 3 month U.S. LIBOR + 2.250% 4.7355% 2/22/24 (b)(c) | 9,090,000 | 8,974,466 | |
| Neptune Finco Corp. Tranche B, term loan 3 month U.S. LIBOR + 2.250% 4.7338% 7/17/25 (b)(c) | 4,864,662 | 4,719,597 | |
| Onvoy LLC Tranche B 1LN, term loan 3 month U.S. LIBOR + 4.500% 7.101% 2/10/24 (b)(c) | 2,940,000 | 2,609,250 | |
| Radiate Holdco LLC Tranche B, term loan 3 month U.S. LIBOR + 3.000% 5.493% 2/1/24 (b)(c) | 8,494,229 | 8,292,576 | |
| Sable International Finance Ltd. Tranche B 4LN, term loan 3 month U.S. LIBOR + 3.250% 5.7486% 2/2/26 (b)(c) | 10,750,000 | 10,703,023 | |
| SBA Senior Finance II, LLC Tranche B, term loan 3 month U.S. LIBOR + 2.000% 4.5% 4/11/25 (b)(c) | 4,466,250 | 4,367,189 | |
| Securus Technologies, Inc.: | |||
| Tranche B 1LN, term loan 3 month U.S. LIBOR + 4.500% 11/1/24 (c)(d) | 2,400,000 | 2,382,000 | |
| Tranche B, term loan: | |||
| 3 month U.S. LIBOR + 4.500% 6.993% 11/1/24 (b)(c) | 4,046,504 | 4,016,155 | |
| 3 month U.S. LIBOR + 8.250% 10.743% 11/1/25 (b)(c) | 3,000,000 | 2,934,990 | |
| SFR Group SA: | |||
| Tranche B 11LN, term loan 3 month U.S. LIBOR + 2.750% 5.243% 7/31/25 (b)(c) | 7,246,545 | 6,730,229 | |
| Tranche B 12LN, term loan 3 month U.S. LIBOR + 3.688% 6.1713% 1/31/26 (b)(c) | 1,019,154 | 964,119 | |
| Tranche B 13LN, term loan 3 month U.S. LIBOR + 4.000% 6.4838% 8/14/26 (b)(c) | 5,985,000 | 5,721,660 | |
| Sprint Communications, Inc.: | |||
| Tranche B 2LN, term loan 3 month U.S. LIBOR + 3.000% 5.5% 2/2/24 (b)(c) | 3,990,000 | 3,925,163 | |
| Tranche B, term loan 3 month U.S. LIBOR + 2.500% 5% 2/3/24 (b)(c) | 2,619,949 | 2,547,901 | |
| Windstream Services LLC 1LN, term loan 3 month U.S. LIBOR + 2.500% 2/26/21 (c)(d) | 3,000,000 | 2,991,570 | |
| TOTAL TELECOMMUNICATIONS | 155,956,005 | ||
| Textiles/Apparel - 0.1% | |||
| ABB Optical Group LLC Tranche B, term loan 3 month U.S. LIBOR + 5.000% 7.4863% 6/15/23 (b)(c) | 1,314,758 | 1,242,446 | |
| Transportation Ex Air/Rail - 0.6% | |||
| IBC Capital Ltd.: | |||
| 2LN, term loan 3 month U.S. LIBOR + 7.000% 9.6146% 9/11/24 (b)(c) | 670,000 | 609,700 | |
| Tranche B 1LN, term loan 3 month U.S. LIBOR + 3.750% 6.3646% 9/11/23 (b)(c) | 3,957,513 | 3,831,387 | |
| International Seaways Operating Corp. Tranche B, term loan 3 month U.S. LIBOR + 5.500% 8.5% 6/22/22 (b)(c) | 5,175,413 | 5,214,229 | |
| Navios Maritime Partners LP Tranche B, term loan 3 month U.S. LIBOR + 5.000% 7.6% 9/14/20 (b)(c) | 2,970,005 | 2,945,265 | |
| TOTAL TRANSPORTATION EX AIR/RAIL | 12,600,581 | ||
| Utilities - 3.5% | |||
| Brookfield WEC Holdings, Inc.: | |||
| 2LN, term loan 3 month U.S. LIBOR + 6.750% 9.2486% 8/1/26 (b)(c) | 2,375,000 | 2,372,625 | |
| Tranche B 1LN, term loan 3 month U.S. LIBOR + 3.750% 6.2486% 8/1/25 (b)(c) | 11,685,713 | 11,648,435 | |
| ExGen Renewables IV, LLC Tranche B, term loan 3 month U.S. LIBOR + 3.000% 5.63% 11/28/24 (b)(c) | 3,172,797 | 2,966,565 | |
| Green Energy Partners/Stonewall LLC Tranche B 1LN, term loan 3 month U.S. LIBOR + 5.500% 8.101% 11/13/21 (b)(c) | 3,992,205 | 3,942,302 | |
| Houston Fuel Oil Terminal Co. Tranche B 1LN, term loan 3 month U.S. LIBOR + 2.750% 5.25% 6/26/25 (b)(c) | 7,940,000 | 7,890,375 | |
| Invenergy Thermal Operating I LLC Tranche B, term loan 3 month U.S. LIBOR + 3.500% 6.303% 8/28/25 (b)(c) | 3,273,929 | 3,273,929 | |
| Limetree Bay Terminals LLC term loan 3 month U.S. LIBOR + 4.000% 6.493% 2/15/24 (b)(c) | 3,361,408 | 3,238,145 | |
| LMBE-MC HoldCo II LLC Tranche B, term loan 3 month U.S. LIBOR + 4.000% 6.61% 12/3/25 (b)(c) | 1,995,000 | 1,985,025 | |
| Moxie Patriot LLC Tranche B, term loan 3 month U.S. LIBOR + 5.750% 8.351% 12/19/20 (b)(c) | 7,205,178 | 6,799,887 | |
| Pike Corp. Tranche B, term loan 3 month U.S. LIBOR + 3.500% 6% 3/23/25 (b)(c) | 1,589,076 | 1,586,692 | |
| Tex Operations Co. LLC Tranche B, term loan 3 month U.S. LIBOR + 2.000% 4.4986% 8/4/23 (b)(c) | 8,403,428 | 8,299,477 | |
| Vertiv Group Corp. Tranche B, term loan 3 month U.S. LIBOR + 4.000% 6.6289% 11/30/23 (b)(c) | 4,260,468 | 3,994,189 | |
| Vistra Operations Co. LLC: | |||
| Tranche B 2LN, term loan 3 month U.S. LIBOR + 2.250% 4.7486% 12/14/23 (b)(c) | 3,421,250 | 3,392,272 | |
| Tranche B 3LN, term loan 3 month U.S. LIBOR + 2.000% 4.4862% 12/31/25 (b)(c) | 10,480,800 | 10,313,107 | |
| TOTAL UTILITIES | 71,703,025 | ||
| TOTAL BANK LOAN OBLIGATIONS | |||
| (Cost $1,921,467,022) | 1,883,094,167 | ||
| Nonconvertible Bonds - 3.9% | |||
| Aerospace - 0.2% | |||
| TransDigm, Inc. 6.25% 3/15/26 (g) | 4,000,000 | 4,150,000 | |
| Chemicals - 0.2% | |||
| OCI NV 6.625% 4/15/23 (g) | 1,000,000 | 1,037,000 | |
| TPC Group, Inc. 8.75% 12/15/20 (g) | 3,780,000 | 3,723,300 | |
| TOTAL CHEMICALS | 4,760,300 | ||
| Containers - 0.3% | |||
| Reynolds Group Issuer, Inc./Reynolds Group Issuer LLC/Reynolds Group Issuer (Luxembourg) SA 3 month U.S. LIBOR + 3.500% 6.2873% 7/15/21 (b)(c)(g) | 5,780,000 | 5,801,675 | |
| Diversified Financial Services - 0.1% | |||
| Transocean Poseidon Ltd. 6.875% 2/1/27 (g) | 1,140,000 | 1,185,600 | |
| Diversified Media - 0.1% | |||
| Clear Channel Worldwide Holdings, Inc. 9.25% 2/15/24 (g) | 2,200,000 | 2,332,000 | |
| Energy - 0.6% | |||
| Cheniere Corpus Christi Holdings LLC: | |||
| 5.125% 6/30/27 | 1,605,000 | 1,683,244 | |
| 7% 6/30/24 | 1,000,000 | 1,128,800 | |
| Chesapeake Energy Corp. 3 month U.S. LIBOR + 3.250% 6.0373% 4/15/19 (b)(c) | 1,420,000 | 1,418,580 | |
| Consolidated Energy Finance SA: | |||
| 3 month U.S. LIBOR + 3.750% 6.3609% 6/15/22 (b)(c)(g) | 4,500,000 | 4,484,603 | |
| 6.875% 6/15/25 (g) | 1,000,000 | 1,007,500 | |
| Denbury Resources, Inc.: | |||
| 9% 5/15/21 (g) | 730,000 | 709,925 | |
| 9.25% 3/31/22 (g) | 1,455,000 | 1,404,075 | |
| EP Energy LLC/Everest Acquisition Finance, Inc. 7.75% 5/15/26 (g) | 1,435,000 | 1,169,525 | |
| TOTAL ENERGY | 13,006,252 | ||
| Environmental - 0.0% | |||
| Tervita Escrow Corp. 7.625% 12/1/21 (g) | 670,000 | 664,975 | |
| Gaming - 0.3% | |||
| Scientific Games Corp. 5% 10/15/25 (g) | 3,060,000 | 2,998,800 | |
| Stars Group Holdings BV 7% 7/15/26 (g) | 2,000,000 | 2,085,000 | |
| Sugarhouse HSP Gaming Prop Mezz LP/Sugarhouse HSP Gaming Finance Corp. 5.875% 5/15/25 (g) | 1,367,000 | 1,350,767 | |
| TOTAL GAMING | 6,434,567 | ||
| Healthcare - 0.4% | |||
| Tenet Healthcare Corp.: | |||
| 4.625% 7/15/24 | 2,500,000 | 2,506,250 | |
| 5.125% 5/1/25 | 1,000,000 | 1,005,050 | |
| Valeant Pharmaceuticals International, Inc.: | |||
| 5.5% 11/1/25 (g) | 2,515,000 | 2,568,444 | |
| 9% 12/15/25 (g) | 1,275,000 | 1,385,033 | |
| TOTAL HEALTHCARE | 7,464,777 | ||
| Insurance - 0.1% | |||
| HUB International Ltd. 7% 5/1/26 (g) | 1,000,000 | 990,000 | |
| Leisure - 0.2% | |||
| Studio City Co. Ltd.: | |||
| 5.875% 11/30/19 (g) | 1,220,000 | 1,235,250 | |
| 7.25% 11/30/21 (g) | 2,000,000 | 2,068,980 | |
| TOTAL LEISURE | 3,304,230 | ||
| Paper - 0.1% | |||
| CommScope Finance LLC: | |||
| 5.5% 3/1/24 (g) | 1,100,000 | 1,125,069 | |
| 6% 3/1/26 (g) | 1,100,000 | 1,137,807 | |
| TOTAL PAPER | 2,262,876 | ||
| Services - 0.1% | |||
| APX Group, Inc. 7.625% 9/1/23 | 980,000 | 830,550 | |
| Brand Energy & Infrastructure Services, Inc. 8.5% 7/15/25 (g) | 2,395,000 | 2,149,513 | |
| TOTAL SERVICES | 2,980,063 | ||
| Technology - 0.4% | |||
| Diamond 1 Finance Corp./Diamond 2 Finance Corp. 4.42% 6/15/21 (g) | 3,030,000 | 3,109,133 | |
| NXP BV/NXP Funding LLC 4.125% 6/1/21 (g) | 2,665,000 | 2,714,995 | |
| Uber Technologies, Inc. 7.5% 11/1/23 (g) | 2,000,000 | 2,085,000 | |
| TOTAL TECHNOLOGY | 7,909,128 | ||
| Telecommunications - 0.7% | |||
| Altice Financing SA 7.5% 5/15/26 (g) | 3,095,000 | 3,054,765 | |
| Frontier Communications Corp. 8% 4/1/27 (g) | 5,400,000 | 5,575,500 | |
| SFR Group SA: | |||
| 6.25% 5/15/24 (g) | 1,930,000 | 1,944,475 | |
| 7.375% 5/1/26 (g) | 3,010,000 | 2,949,800 | |
| TOTAL TELECOMMUNICATIONS | 13,524,540 | ||
| Textiles/Apparel - 0.0% | |||
| Eagle Intermediate Global Holding BV 7.5% 5/1/25 (g) | 870,000 | 853,039 | |
| Transportation Ex Air/Rail - 0.1% | |||
| Avolon Holdings Funding Ltd. 5.125% 10/1/23 (g) | 2,255,000 | 2,294,463 | |
| TOTAL NONCONVERTIBLE BONDS | |||
| (Cost $79,523,534) | 79,918,485 | ||
| Shares | Value | ||
| Common Stocks - 0.7% | |||
| Chemicals - 0.2% | |||
| LyondellBasell Industries NV Class A | 52,192 | 4,388,303 | |
| Energy - 0.3% | |||
| Expro Holdings U.S., Inc. (e)(h) | 240,349 | 4,326,282 | |
| Expro Holdings U.S., Inc. (e)(g)(h) | 88,205 | 1,587,690 | |
| TOTAL ENERGY | 5,913,972 | ||
| Publishing/Printing - 0.0% | |||
| Cenveo Corp. (e) | 4,167 | 121,510 | |
| Super Retail - 0.0% | |||
| David's Bridal, Inc. (e) | 8,913 | 4,635 | |
| Utilities - 0.2% | |||
| TexGen Power LLC (e) | 85,051 | 3,342,504 | |
| TOTAL COMMON STOCKS | |||
| (Cost $12,091,878) | 13,770,924 | ||
| Other - 0.0% | |||
| Other - 0.0% | |||
| Tribune Co. Claim (e)(h) | |||
| (Cost $45,406) | 45,954 | 45,954 | |
| Money Market Funds - 4.9% | |||
| Fidelity Cash Central Fund, 2.48% (i) | |||
| (Cost $99,323,733) | 99,310,026 | 99,329,888 | |
| TOTAL INVESTMENT IN SECURITIES - 101.7% | |||
| (Cost $2,112,451,573) | 2,076,159,418 | ||
| NET OTHER ASSETS (LIABILITIES) - (1.7)% | (35,039,058) | ||
| NET ASSETS - 100% | $2,041,120,360 |
Legend
(a) Remaining maturities of bank loan obligations may be less than the stated maturities shown as a result of contractual or optional prepayments by the borrower. Such prepayments cannot be predicted with certainty.
(b) Coupon rates for floating and adjustable rate securities reflect the rates in effect at period end.
(c) Coupon is indexed to a floating interest rate which may be multiplied by a specified factor and/or subject to caps or floors.
(d) The coupon rate will be determined upon settlement of the loan after period end.
(e) Level 3 security
(f) Non-income producing - Security is in default.
(g) Security exempt from registration under Rule 144A of the Securities Act of 1933. These securities may be resold in transactions exempt from registration, normally to qualified institutional buyers. At the end of the period, the value of these securities amounted to $72,933,701 or 3.6% of net assets.
(h) Non-income producing
(i) Affiliated fund that is generally available only to investment companies and other accounts managed by Fidelity Investments. The rate quoted is the annualized seven-day yield of the fund at period end. A complete unaudited listing of the fund's holdings as of its most recent quarter end is available upon request. In addition, each Fidelity Central Fund's financial statements are available on the SEC's website or upon request.
Affiliated Central Funds
Information regarding fiscal year to date income earned by the Fund from investments in Fidelity Central Funds is as follows:
| Fund | Income earned |
| Fidelity Cash Central Fund | $1,141,698 |
| Total | $1,141,698 |
Amounts in the income column in the above table include any capital gain distributions from underlying funds, which are presented in the corresponding line-item in the Statement of Operations, if applicable.
Investment Valuation
The following is a summary of the inputs used, as of March 31, 2019, involving the Fund's assets and liabilities carried at fair value. The inputs or methodology used for valuing securities may not be an indication of the risk associated with investing in those securities. For more information on valuation inputs, and their aggregation into the levels used below, please refer to the Investment Valuation section in the accompanying Notes to Financial Statements.
| Valuation Inputs at Reporting Date: | ||||
| Description | Total | Level 1 | Level 2 | Level 3 |
| Investments in Securities: | ||||
| Equities: | ||||
| Consumer Discretionary | $4,635 | $-- | $-- | $4,635 |
| Energy | 5,913,972 | -- | -- | 5,913,972 |
| Industrials | 121,510 | -- | -- | 121,510 |
| Materials | 4,388,303 | 4,388,303 | -- | -- |
| Utilities | 3,342,504 | -- | -- | 3,342,504 |
| Bank Loan Obligations | 1,883,094,167 | -- | 1,874,057,639 | 9,036,528 |
| Corporate Bonds | 79,918,485 | -- | 79,918,485 | -- |
| Other | 45,954 | -- | -- | 45,954 |
| Money Market Funds | 99,329,888 | 99,329,888 | -- | -- |
| Total Investments in Securities: | $2,076,159,418 | $103,718,191 | $1,953,976,124 | $18,465,103 |
Other Information
Distribution of investments by country or territory of incorporation, as a percentage of Total Net Assets, is as follows (Unaudited):
| United States of America | 87.7% |
| Luxembourg | 5.9% |
| Canada | 1.5% |
| Netherlands | 1.1% |
| Cayman Islands | 1.0% |
| Others (Individually Less Than 1%) | 2.8% |
| 100.0% |
See accompanying notes which are an integral part of the financial statements.
Financial Statements
Statement of Assets and Liabilities
| March 31, 2019 (Unaudited) | ||
| Assets | ||
| Investment in securities, at value — See accompanying schedule: Unaffiliated issuers (cost $2,013,127,840) | $1,976,829,530 | |
| Fidelity Central Funds (cost $99,323,733) | 99,329,888 | |
| Total Investment in Securities (cost $2,112,451,573) | $2,076,159,418 | |
| Cash | 1,817,870 | |
| Receivable for investments sold | 9,805,333 | |
| Receivable for fund shares sold | 59,244 | |
| Interest receivable | 12,005,909 | |
| Distributions receivable from Fidelity Central Funds | 221,319 | |
| Total assets | 2,100,069,093 | |
| Liabilities | ||
| Payable for investments purchased | $56,862,417 | |
| Payable for fund shares redeemed | 1,425,112 | |
| Distributions payable | 645,792 | |
| Other payables and accrued expenses | 15,412 | |
| Total liabilities | 58,948,733 | |
| Net Assets | $2,041,120,360 | |
| Net Assets consist of: | ||
| Paid in capital | $2,089,001,428 | |
| Total distributable earnings (loss) | (47,881,068) | |
| Net Assets, for 20,168,047 shares outstanding | $2,041,120,360 | |
| Net Asset Value, offering price and redemption price per share ($2,041,120,360 ÷ 20,168,047 shares) | $101.21 |
See accompanying notes which are an integral part of the financial statements.
Statement of Operations
| Six months ended March 31, 2019 (Unaudited) | ||
| Investment Income | ||
| Dividends | $438,001 | |
| Interest | 60,362,361 | |
| Income from Fidelity Central Funds | 1,141,698 | |
| Total income | 61,942,060 | |
| Expenses | ||
| Custodian fees and expenses | $15,345 | |
| Independent directors' fees and expenses | 6,373 | |
| Legal | 22,826 | |
| Total expenses before reductions | 44,544 | |
| Expense reductions | (19,672) | |
| Total expenses after reductions | 24,872 | |
| Net investment income (loss) | 61,917,188 | |
| Realized and Unrealized Gain (Loss) | ||
| Net realized gain (loss) on: | ||
| Investment securities: | ||
| Unaffiliated issuers | (9,844,559) | |
| Fidelity Central Funds | 102 | |
| Total net realized gain (loss) | (9,844,457) | |
| Change in net unrealized appreciation (depreciation) on: | ||
| Investment securities: | ||
| Unaffiliated issuers | (33,574,453) | |
| Fidelity Central Funds | (102) | |
| Total change in net unrealized appreciation (depreciation) | (33,574,555) | |
| Net gain (loss) | (43,419,012) | |
| Net increase (decrease) in net assets resulting from operations | $18,498,176 |
See accompanying notes which are an integral part of the financial statements.
Statement of Changes in Net Assets
| Six months ended March 31, 2019 (Unaudited) | Year ended September 30, 2018 | |
| Increase (Decrease) in Net Assets | ||
| Operations | ||
| Net investment income (loss) | $61,917,188 | $108,427,622 |
| Net realized gain (loss) | (9,844,457) | (2,822,187) |
| Change in net unrealized appreciation (depreciation) | (33,574,555) | 9,369,188 |
| Net increase (decrease) in net assets resulting from operations | 18,498,176 | 114,974,623 |
| Distributions to shareholders | (62,232,283) | – |
| Distributions to shareholders from net investment income | – | (107,324,263) |
| Distributions to shareholders from net realized gain | – | (5,780,280) |
| Total distributions | (62,232,283) | (113,104,543) |
| Affiliated share transactions | ||
| Proceeds from sales of shares | 32,960,077 | 697,577,163 |
| Reinvestment of distributions | 58,458,063 | 106,258,937 |
| Cost of shares redeemed | (302,507,288) | (144,268,596) |
| Net increase (decrease) in net assets resulting from share transactions | (211,089,148) | 659,567,504 |
| Total increase (decrease) in net assets | (254,823,255) | 661,437,584 |
| Net Assets | ||
| Beginning of period | 2,295,943,615 | 1,634,506,031 |
| End of period | $2,041,120,360 | $2,295,943,615 |
| Other Information | ||
| Undistributed net investment income end of period | $1,735,079 | |
| Shares | ||
| Sold | 328,934 | 6,749,302 |
| Issued in reinvestment of distributions | 578,829 | 1,029,866 |
| Redeemed | (2,964,155) | (1,398,060) |
| Net increase (decrease) | (2,056,392) | 6,381,108 |
See accompanying notes which are an integral part of the financial statements.
Financial Highlights
Fidelity Floating Rate Central Fund
| Six months ended (Unaudited) March 31, | Years endedSeptember 30, | |||||
| 2019 | 2018 | 2017 | 2016 | 2015 | 2014 | |
| Selected Per–Share Data | ||||||
| Net asset value, beginning of period | $103.31 | $103.17 | $102.63 | $102.02 | $107.17 | $106.39 |
| Income from Investment Operations | ||||||
| Net investment income (loss)A | 3.003 | 5.279 | 5.268 | 5.424 | 5.449 | 5.658 |
| Net realized and unrealized gain (loss) | (2.081) | .401 | .545 | .357 | (5.445) | .412 |
| Total from investment operations | .922 | 5.680 | 5.813 | 5.781 | .004 | 6.070 |
| Distributions from net investment income | (3.022) | (5.215) | (5.223) | (5.171) | (5.154) | (5.290) |
| Distributions from net realized gain | – | (.325) | (.050) | – | – | – |
| Total distributions | (3.022) | (5.540) | (5.273) | (5.171) | (5.154) | (5.290) |
| Net asset value, end of period | $101.21 | $103.31 | $103.17 | $102.63 | $102.02 | $107.17 |
| Total ReturnB,C | .94% | 5.65% | 5.77% | 5.95% | (.03)% | 5.78% |
| Ratios to Average Net AssetsD,E | ||||||
| Expenses before reductions | - %F,G | - %G | .06% | - %G | - %G | - %G |
| Expenses net of fee waivers, if any | - %F,G | - %G | .06% | - %G | - %G | - %G |
| Expenses net of all reductions | - %F,G | - %G | .06% | - %G | - %G | - %G |
| Net investment income (loss) | 5.94%F | 5.12% | 5.09% | 5.45% | 5.15% | 5.25% |
| Supplemental Data | ||||||
| Net assets, end of period (000 omitted) | $2,041,120 | $2,295,944 | $1,634,506 | $1,614,419 | $1,597,788 | $1,653,285 |
| Portfolio turnover rateH | 30%F | 47% | 78% | 48% | 37%I | 66% |
A Calculated based on average shares outstanding during the period.
B Total returns for periods of less than one year are not annualized.
C Total returns would have been lower if certain expenses had not been reduced during the applicable periods shown.
D Fees and expenses of any underlying Fidelity Central Funds are not included in the Fund's expense ratio. The Fund indirectly bears its proportionate share of the expenses of any underlying Fidelity Central Funds.
E Expense ratios reflect operating expenses of the Fund. Expenses before reductions do not reflect amounts reimbursed by the investment adviser or reductions from expense offset arrangements and do not represent the amount paid by the Fund during periods when reimbursements or reductions occur. Expenses net of fee waivers reflect expenses after reimbursement by the investment adviser but prior to reductions from expense offset arrangements. Expenses net of all reductions represent the net expenses paid by the Fund.
F Annualized
G Amount represents less than .005%.
H Amount does not include the portfolio activity of any underlying Fidelity Central Funds.
I Portfolio turnover rate excludes securities received or delivered in-kind.
See accompanying notes which are an integral part of the financial statements.
Notes to Financial Statements (Unaudited)
For the period ended March 31, 2019
1. Organization.
Fidelity Floating Rate Central Fund (the Fund) is a fund of Fidelity Central Investment Portfolios LLC (the LLC) and is authorized to issue an unlimited number of shares. Shares of the Fund are only offered to other investment companies and accounts managed by Fidelity Management & Research Company (FMR), or its affiliates (the Investing Funds). The LLC is registered under the Investment Company Act of 1940, as amended (the 1940 Act), as an open-end management investment company organized as a Delaware Limited Liability Company.
2. Investments in Fidelity Central Funds.
The Fund invests in Fidelity Central Funds, which are open-end investment companies generally available only to other investment companies and accounts managed by the investment adviser and its affiliates. The Fund's Schedule of Investments lists each of the Fidelity Central Funds held as of period end, if any, as an investment of the Fund, but does not include the underlying holdings of each Fidelity Central Fund. As an Investing Fund, the Fund indirectly bears its proportionate share of the expenses of the underlying Fidelity Central Funds.
The Money Market Central Funds seek preservation of capital and current income and are managed by Fidelity Investments Money Management, Inc. (FIMM), an affiliate of the investment adviser. Annualized expenses of the Money Market Central Funds as of their most recent shareholder report date are less than .005%.
A complete unaudited list of holdings for each Fidelity Central Fund is available upon request or at the Securities and Exchange Commission (the SEC) website at www.sec.gov. In addition, the financial statements of the Fidelity Central Funds are available on the SEC website or upon request.
3. Significant Accounting Policies.
The Fund is an investment company and applies the accounting and reporting guidance of the Financial Accounting Standards Board (FASB) Accounting Standards Codification Topic 946 Financial Services – Investments Companies. The financial statements have been prepared in conformity with accounting principles generally accepted in the United States of America (GAAP), which require management to make certain estimates and assumptions at the date of the financial statements. Actual results could differ from those estimates. Subsequent events, if any, through the date that the financial statements were issued have been evaluated in the preparation of the financial statements. The following summarizes the significant accounting policies of the Fund:
Investment Valuation. Investments are valued as of 4:00 p.m. Eastern time on the last calendar day of the period. The Board of Directors (the Board) has delegated the day to day responsibility for the valuation of the Fund's investments to the Fair Value Committee (the Committee) established by the Fund's investment adviser. In accordance with valuation policies and procedures approved by the Board, the Fund attempts to obtain prices from one or more third party pricing vendors or brokers to value its investments. When current market prices, quotations or currency exchange rates are not readily available or reliable, investments will be fair valued in good faith by the Committee, in accordance with procedures adopted by the Board. Factors used in determining fair value vary by investment type and may include market or investment specific events, changes in interest rates and credit quality. The frequency with which these procedures are used cannot be predicted and they may be utilized to a significant extent. The Committee oversees the Fund's valuation policies and procedures and reports to the Board on the Committee's activities and fair value determinations. The Board monitors the appropriateness of the procedures used in valuing the Fund's investments and ratifies the fair value determinations of the Committee.
The Fund categorizes the inputs to valuation techniques used to value its investments into a disclosure hierarchy consisting of three levels as shown below:
- Level 1 – quoted prices in active markets for identical investments
- Level 2 – other significant observable inputs (including quoted prices for similar investments, interest rates, prepayment speeds, etc.)
- Level 3 – unobservable inputs (including the Fund's own assumptions based on the best information available)
Valuation techniques used to value the Fund's investments by major category are as follows:
Debt securities, including restricted securities, are valued based on evaluated prices received from third party pricing vendors or from brokers who make markets in such securities. Corporate bonds and bank loan obligations are valued by pricing vendors who utilize matrix pricing which considers yield or price of bonds of comparable quality, coupon, maturity and type or by broker-supplied prices. When independent prices are unavailable or unreliable, debt securities may be valued utilizing pricing methodologies which consider similar factors that would be used by third party pricing vendors. Debt securities are generally categorized as Level 2 in the hierarchy but may be Level 3 depending on the circumstances. The Fund invests a significant portion of its assets in below investment grade securities. The value of these securities can be more volatile due to changes in the credit quality of the issuer and is sensitive to changes in economic, market and regulatory conditions.
Equity securities, including restricted securities, for which market quotations are readily available, are valued at the last reported sale price or official closing price as reported by a third party pricing vendor on the primary market or exchange on which they are traded and are categorized as Level 1 in the hierarchy. In the event there were no sales during the day or closing prices are not available, securities are valued at the last quoted bid price or may be valued using the last available price and are generally categorized as Level 2 in the hierarchy. For foreign equity securities, when market or security specific events arise, comparisons to the valuation of American Depositary Receipts (ADRs), futures contracts, Exchange-Traded Funds (ETFs) and certain indexes as well as quoted prices for similar securities may be used and would be categorized as Level 2 in the hierarchy. For equity securities, including restricted securities, where observable inputs are limited, assumptions about market activity and risk are used and these securities may be categorized as Level 3 in the hierarchy.
Investments in open-end mutual funds, including the Fidelity Central Funds, are valued at their closing net asset value (NAV) each business day and are categorized as Level 1 in the hierarchy.
Changes in valuation techniques may result in transfers in or out of an assigned level within the disclosure hierarchy. The aggregate value of investments by input level as of March 31, 2019 is included at the end of the Fund's Schedule of Investments.
Investment Transactions and Income. For financial reporting purposes, the Fund's investment holdings and NAV include trades executed through the end of the last business day of the period. The NAV per share for processing shareholder transactions is calculated as of the close of business of the New York Stock Exchange (NYSE), normally 4:00 p.m. Eastern time and includes trades executed through the end of the prior business day. Gains and losses on securities sold are determined on the basis of identified cost. Dividend income is recorded on the ex-dividend date, except for certain dividends from foreign securities where the ex-dividend date may have passed, which are recorded as soon as the Fund is informed of the ex-dividend date. Non-cash dividends included in dividend income, if any, are recorded at the fair market value of the securities received. Income and capital gain distributions from Fidelity Central Funds, if any, are recorded on the ex-dividend date. Certain distributions received by the Fund represent a return of capital or capital gain. The Fund determines the components of these distributions subsequent to the ex-dividend date, based upon receipt of tax filings or other correspondence relating to the underlying investment. These distributions are recorded as a reduction of cost of investments and/or as a realized gain. Interest income is accrued as earned and includes coupon interest and amortization of premium and accretion of discount on debt securities as applicable. Debt obligations may be placed on non-accrual status and related interest income may be reduced by ceasing current accruals and writing off interest receivables when the collection of all or a portion of interest has become doubtful based on consistently applied procedures. A debt obligation is removed from non-accrual status when the issuer resumes interest payments or when collectability of interest is reasonably assured. The Fund earns certain fees in connection with its floating rate loan purchasing activities. These fees are in addition to interest payments earned and may include amendment fees, consent fees and prepayment fees. These fees are recorded as Interest in the accompanying financial statements.
Expenses. Expenses directly attributable to a fund are charged to that fund. Expenses attributable to more than one fund are allocated among the respective funds on the basis of relative net assets or other appropriate methods. Expense estimates are accrued in the period to which they relate and adjustments are made when actual amounts are known.
Income Tax Information and Distributions to Shareholders. Each year, the Fund intends to qualify as a regulated investment company under Subchapter M of the Internal Revenue Code, including distributing substantially all of its taxable income and realized gains. As a result, no provision for U.S. Federal income taxes is required. The Fund files a U.S. federal tax return, in addition to state and local tax returns as required. The Fund's federal income tax returns are subject to examination by the Internal Revenue Service (IRS) for a period of three fiscal years after they are filed. State and local tax returns may be subject to examination for an additional fiscal year depending on the jurisdiction.
Distributions are declared and recorded daily and paid monthly from net investment income. Distributions from realized gains, if any, are declared and recorded on the ex-dividend date. Income and capital gain distributions are determined in accordance with income tax regulations, which may differ from GAAP.
Capital accounts within the financial statements are adjusted for permanent book-tax differences. These adjustments have no impact on net assets or the results of operations. Capital accounts are not adjusted for temporary book-tax differences which will reverse in a subsequent period.
Book-tax differences are primarily due to capital loss carryforwards and losses deferred due to wash sales.
As of period end, the cost and unrealized appreciation (depreciation) in securities, and derivatives if applicable, for federal income tax purposes were as follows:
| Gross unrealized appreciation | $9,703,554 |
| Gross unrealized depreciation | (46,104,350) |
| Net unrealized appreciation (depreciation) | $(36,400,796) |
| Tax cost | $2,112,560,214 |
Capital loss carryforwards are only available to offset future capital gains of the Fund to the extent provided by regulations and may be limited. Under the Regulated Investment Company Modernization Act of 2010 (the Act), the Fund is permitted to carry forward capital losses incurred in taxable years beginning after December 22, 2010 for an unlimited period and such capital losses are required to be used prior to any losses that expire. The capital loss carryforward information presented below, including any applicable limitation, is estimated as of prior fiscal period end and is subject to adjustment.
| No expiration | |
| Long-term | $(4,438,277) |
| Total capital loss carryforward | $(4,438,277) |
Restricted Securities. The Fund may invest in securities that are subject to legal or contractual restrictions on resale. These securities generally may be resold in transactions exempt from registration or to the public if the securities are registered. Disposal of these securities may involve time-consuming negotiations and expense, and prompt sale at an acceptable price may be difficult. Information regarding restricted securities is included at the end of the Fund's Schedule of Investments.
Loans and Other Direct Debt Instruments. The Fund invests in direct debt instruments which are interests in amounts owed to lenders by corporate or other borrowers. These instruments may be in the form of loans, trade claims or other receivables and may include standby financing commitments such as revolving credit facilities that obligate the Fund to supply additional cash to the borrower on demand. Loans may be acquired through assignment or participation. The Fund did not have any unfunded loan commitments, which are contractual obligations for future funding, at period end.
New Rule Issuance. During August 2018, the U.S. Securities and Exchange Commission issued Final Rule Release No. 33-10532, Disclosure Update and Simplification. This Final Rule includes amendments specific to registered investment companies that are intended to eliminate overlap in disclosure requirements between Regulation S-X and GAAP. In accordance with these amendments, certain line-items in the Fund's financial statements have been combined or removed for the current period as outlined in the table below.
| Financial Statement | Current Line-Item Presentation (As Applicable) | Prior Line-Item Presentation (As Applicable) |
| Statement of Assets and Liabilities | Total distributable earnings (loss) | Undistributed/Distributions in excess of/Accumulated net investment income (loss) Accumulated/Undistributed net realized gain (loss) Net unrealized appreciation (depreciation) |
| Statement of Changes in Net Assets | N/A - removed | Undistributed/Distributions in excess of/Accumulated net investment income (loss) end of period |
| Statement of Changes in Net Assets | Distributions to shareholders | Distributions to shareholders from net investment income Distributions to shareholders from net realized gain |
4. Purchase and Sales of Investments.
Purchases and sales of securities (including principal repayments of bank loan obligations), other than short-term securities, aggregated $301,386,410 and $479,801,804, respectively.
5. Fees and Other Transactions with Affiliates.
Management Fee and Expense Contract. FMR Co., Inc. (the investment adviser), an affiliate of FMR, provides the Fund with investment management services. The Fund does not pay any fees for these services. Pursuant to the Fund's management contract with the investment adviser, FMR pays the investment adviser a portion of the management fees it receives from the Investing Funds. In addition, under an expense contract, FMR also pays all other expenses of the Fund, excluding custody fees, the compensation of the independent Directors, and certain miscellaneous expenses such as proxy and shareholder meeting expenses.
Brokerage Commissions. The Fund placed a portion of its portfolio transactions with brokerage firms which are affiliates of the investment adviser. Brokerage commissions are included in net realized gain (loss) and change in net unrealized appreciation (depreciation) in the Statement of Operations. The commissions paid to these affiliated firms were $1 for the period.
Interfund Trades. The Fund may purchase from or sell securities to other Fidelity Funds under procedures adopted by the Board. The procedures have been designed to ensure these interfund trades are executed in accordance with Rule 17a-7 of the 1940 Act. Interfund trades are included within the respective purchases and sales amounts shown in the Purchases and Sales of Investments note.
6. Expense Reductions.
Through arrangements with the Fund's custodian, credits realized as a result of certain uninvested cash balances were used to reduce the Fund's expenses. During the period, these credits reduced the Fund's custody expenses by $19,672.
7. Other.
The Fund's organizational documents provide former and current directors and officers with a limited indemnification against liabilities arising in connection with the performance of their duties to the Fund. In the normal course of business, the Fund may also enter into contracts that provide general indemnifications. The Fund's maximum exposure under these arrangements is unknown as this would be dependent on future claims that may be made against the Fund. The risk of material loss from such claims is considered remote.
At the end of the period, mutual funds managed by the investment adviser or its affiliates were the owners of record of all of the outstanding shares of the Fund.
8. Litigation.
The Fund and other entities managed by FMR or its affiliates were named as defendants in a lawsuit filed in the United States Bankruptcy Court for the Southern District of New York in 2009. The lawsuit was brought by creditors of Motors Liquidation Company (f/k/a General Motors), which went through Chapter 11 bankruptcy proceedings in 2009, and is captioned Official Committee of Unsecured Creditors of Motors Liquidation Company v. JPMorgan Chase Bank, N.A., et al., Adversary No. 09-00504 (REG). The plaintiffs are seeking an order that the Fund and other defendants return proceeds received in 2009 in full payment of the principal and interest on General Motors secured debt. The plaintiffs contend that the Fund and the other defendants were not secured creditors at the time of the 2009 payments and, thus, were not entitled to payment in full. In January 2015, the Court of Appeals ruled that JPMorgan, as administrative agent for all of the debtholders, released the security interest on certain collateral securing the debt prior to the 2009 payments. In September 2017, an opinion was issued in a trial intended to help determine the value of any remaining, unreleased collateral. In May 2019, the parties reached a settlement that remains subject to approval by the Bankruptcy Court. Given this contingency, Management cannot determine at this time the amount of loss that may be realized, but expects the amount to be less than the $32,518,731 received in 2009. The Fund is also incurring legal costs in defending the case.
Shareholder Expense Example
As a shareholder of the Fund, you incur two types of costs: (1) transaction costs and (2) ongoing costs, including other Fund expenses. This Example is intended to help you understand your ongoing costs (in dollars) of investing in the Fund and to compare these costs with the ongoing costs of investing in other mutual funds.
The Example is based on an investment of $1,000 invested at the beginning of the period and held for the entire period (October 1, 2018 to March 31, 2019).
Actual Expenses
The first line of the accompanying table provides information about actual account values and actual expenses. You may use the information in this line, together with the amount you invested, to estimate the expenses that you paid over the period. Simply divide your account value by $1,000.00 (for example, an $8,600 account value divided by $1,000.00 = 8.6), then multiply the result by the number in the first line under the heading entitled "Expenses Paid During Period" to estimate the expenses you paid on your account during this period. In addition, the Fund, as a shareholder in the underlying Fidelity Central Funds, will indirectly bear its pro-rata share of the fees and expenses incurred by the underlying Fidelity Central Funds. These fees and expenses are not included in the Fund's annualized expense ratio used to calculate the expense estimate in the table below.
Hypothetical Example for Comparison Purposes
The second line of the accompanying table provides information about hypothetical account values and hypothetical expenses based on the Fund's actual expense ratio and an assumed rate of return of 5% per year before expenses, which is not the Fund's actual return. The hypothetical account values and expenses may not be used to estimate the actual ending account balance or expenses you paid for the period. You may use this information to compare the ongoing costs of investing in the Fund and other funds. To do so, compare this 5% hypothetical example with the 5% hypothetical examples that appear in the shareholder reports of the other funds. In addition, the Fund, as a shareholder in the underlying Fidelity Central Funds, will indirectly bear its pro-rata share of the fees and expenses incurred by the underlying Fidelity Central Funds. These fees and expenses are not included in the Fund's annualized expense ratio used to calculate the expense estimate in the table below.
Please note that the expenses shown in the table are meant to highlight your ongoing costs only and do not reflect any transaction costs. Therefore, the second line of the table is useful in comparing ongoing costs only, and will not help you determine the relative total costs of owning different funds.
| Annualized Expense Ratio-A | Beginning Account Value October 1, 2018 | Ending Account Value March 31, 2019 | Expenses Paid During Period-B October 1, 2018 to March 31, 2019 |
|
| Actual | .0043% | $1,000.00 | $1,009.40 | $.02 |
| Hypothetical-C | $1,000.00 | $1,024.91 | $.02 |
A Annualized expense ratio reflects expenses net of applicable fee waivers.
B Expenses are equal to the Fund's annualized expense ratio, multiplied by the average account value over the period, multiplied by 182/365 (to reflect the one-half year period).
C 5% return per year before expenses
Board Approval of Investment Advisory Contracts and Management Fees
Fidelity Floating Rate Central Fund
Each year, the Board of Directors, including the Independent Directors (together, the Board), votes on the renewal of the management contract with FMR Co., Inc. (FMRC) and the sub-advisory agreements (together, the Advisory Contracts) for the fund. FMRC and the sub-advisers are referred to herein as the Investment Advisers. The Board, assisted by the advice of fund counsel and Independent Directors' counsel, requests and considers a broad range of information relevant to the renewal of the Advisory Contracts throughout the year.
The Board meets regularly and, at each of its meetings, covers an extensive agenda of topics and materials and considers factors that are relevant to its annual consideration of the renewal of the fund's Advisory Contracts, including the services and support provided to the fund and its shareholders. The Board has established various standing committees (Committees), each composed of and chaired by Independent Directors with varying backgrounds, to which the Board has assigned specific subject matter responsibilities in order to enhance effective decision-making by the Board. The Board, acting directly and through its Committees, requests and receives information concerning the annual consideration of the renewal of the fund's Advisory Contracts. The Board also meets as needed to review matters specifically related to the Board's annual consideration of the renewal of the Advisory Contracts. Members of the Board may also meet with trustees of other Fidelity funds through joint ad hoc committees to discuss certain matters relevant to all of the Fidelity funds.
At its January 2019 meeting, the Board unanimously determined to renew the fund's Advisory Contracts. In reaching its determination, the Board considered all factors it believed relevant and reached a determination, with the assistance of fund counsel and Independent Directors' counsel and through the exercise of its business judgment, that the renewal of the Advisory Contracts was in the best interests of the fund and its shareholders and the fact that no fee is payable under the management contract was fair and reasonable.
Nature, Extent, and Quality of Services Provided. The Board considered Fidelity's staffing as it relates to the fund, including the backgrounds of investment personnel of Fidelity, and also considered the fund's investment objective, strategies, and related investment philosophy. The Independent Directors also had discussions with senior management of Fidelity's investment operations and investment groups. The Board considered the structure of the investment personnel compensation program and whether this structure provides appropriate incentives to act in the best interests of the fund. Resources Dedicated to Investment Management and Support Services. The Board and the Fund Oversight and Research Committees reviewed the general qualifications and capabilities of Fidelity's investment staff, including its size, education, experience, and resources, as well as Fidelity's approach to recruiting, training, managing, and compensating investment personnel. The Board noted that Fidelity has continued to increase the resources devoted to non-U.S. offices, including expansion of Fidelity's global investment organization. The Board also noted that Fidelity's analysts have extensive resources, tools and capabilities that allow them to conduct sophisticated quantitative and fundamental analysis, as well as credit analysis of issuers, counterparties and guarantors. Further, the Board considered that Fidelity's investment professionals have sufficient access to global information and data so as to provide competitive investment results over time, and that those professionals also have access to sophisticated tools that permit them to assess portfolio construction and risk and performance attribution characteristics continuously, as well as to transmit new information and research conclusions rapidly around the world. Additionally, in its deliberations, the Board considered Fidelity's trading, risk management, compliance, and technology and operations capabilities and resources, which are integral parts of the investment management process. Administrative Services. The Board considered (i) the nature, extent, quality, and cost of advisory and administrative services performed by the Investment Advisers and their affiliates under the Advisory Contracts and under separate agreements covering transfer agency, pricing and bookkeeping, and securities lending services for the fund; (ii) the nature and extent of the supervision of third party service providers, principally custodians, subcustodians, and pricing vendors; and (iii) the resources devoted to, and the record of compliance with, the fund's compliance policies and procedures. The Board also reviewed the allocation of fund brokerage, including allocations to brokers affiliated with the Investment Advisers, and the use of "soft" commission dollars to pay for research services. Investment Performance. The Board considered whether the fund has operated in accordance with its investment objective, as well as its record of compliance with its investment restrictions. The Board reviewed the fund's absolute investment performance, as well as the fund's relative investment performance, but did not consider performance to be a material factor in its decision to renew the fund's Advisory Contracts, as the fund is not publicly offered as a stand-alone investment product. In this regard, the Board noted that the fund is designed to offer a liquid investment option for other investment companies managed by Fidelity and ultimately to enhance the performance of those investment companies.Based on its review, the Board concluded that the nature, extent, and quality of services provided to the fund under the Advisory Contracts should continue to benefit the shareholders of the fund. Competitiveness of Management Fee and Total Expense Ratio. The Board considered that while the fund does not pay a management fee, Fidelity Management & Research Company (FMR) pays a management fee on behalf of the fund and receives fees for providing services to funds that invest in the fund. The Board also noted that FMR bears all expenses of the fund with certain exceptions. Based on its review, the Board concluded that the management fee paid on behalf of the fund and the fund's total expense ratio were reasonable in light of the services that the fund and its shareholders receive and the other factors considered. Costs of the Services and Profitability. The Board considered the level of Fidelity's profits in respect of all the Fidelity funds, as well as the profitability of the funds that invest in the fund.PricewaterhouseCoopers LLP (PwC), auditor to Fidelity and certain Fidelity funds, has been engaged annually by the Board as part of the Board's assessment of Fidelity's profitability analysis. PwC's engagement includes the review and assessment of the methodologies used by Fidelity in determining the revenues and expenses attributable to Fidelity's mutual fund business, and completion of agreed-upon procedures in respect of the mathematical accuracy of the fund profitability information and its conformity to established allocation methodologies. After considering PwC's reports issued under the engagement and information provided by Fidelity, the Board concluded that while other allocation methods may also be reasonable, Fidelity's profitability methodologies are reasonable in all material respects.The Board also reviewed Fidelity's non-fund businesses and potential indirect benefits such businesses may have received as a result of their association with Fidelity's mutual fund business (i.e., fall-out benefits) as well as cases where Fidelity's affiliates may benefit from the fund's business. The Board noted that changes to fall-out benefits year-over-year reflect business developments at Fidelity's various businesses.The Board concluded that the costs of the services provided by and the profits realized by Fidelity in connection with the operation of the fund were not relevant to the renewal of the Advisory Contracts because the fund pays no advisory fees and FMR bears all expenses of the fund with certain exceptions. Economies of Scale. The Board concluded that because the fund pays no advisory fees and FMR bears all expenses of the fund with certain exceptions, the realization of economies of scale was not a material factor in the Board's decision to renew the fund's Advisory Contract. Additional Information Requested by the Board. In order to develop fully the factual basis for consideration of the Fidelity funds' advisory contracts, the Board requested and received additional information on certain topics, including: (i) fund performance trends, in particular the underperformance of certain funds, and Fidelity's long-term strategies for certain funds; (ii) Fidelity's fund profitability methodology, profitability trends for certain funds, and the impact of certain factors on fund profitability results; (iii) metrics for evaluating index fund and ETF performance and information about ETF trading characteristics; (iv) the methodology with respect to the evaluation of competitive fund data and peer group classifications and fee comparisons; (v) the expense structures for different funds and classes; (vi) information regarding other accounts managed by Fidelity, including collective investment trusts; and (vii) Fidelity's philosophies and strategies for evaluating funds and classes with lower or declining asset levels.Based on its evaluation of all of the conclusions noted above, and after considering all factors it believed relevant, the Board concluded that the advisory fee arrangements are fair and reasonable, and that the fund's Advisory Contracts should be renewed.
![]()
FR1-SANN-0519
1.814673.114
|
Fidelity® High Income Central Fund 1 Semi-Annual Report March 31, 2019 |
|
|
Beginning on January 1, 2021, as permitted by regulations adopted by the Securities and Exchange Commission, paper copies of a fund’s shareholder reports will no longer be sent by mail, unless you specifically request paper copies of the reports from the fund or from your financial intermediary, such as a financial advisor, broker-dealer or bank. Instead, the reports will be made available on a website, and you will be notified by mail each time a report is posted and provided with a website link to access the report.
If you already elected to receive shareholder reports electronically, you will not be affected by this change and you need not take any action. You may elect to receive shareholder reports and other communications from a fund electronically, by contacting your financial intermediary. For Fidelity customers, visit Fidelity's web site or call Fidelity using the contact information listed below.
You may elect to receive all future reports in paper free of charge. If you wish to continue receiving paper copies of your shareholder reports, you may contact your financial intermediary or, if you are a Fidelity customer, visit Fidelity’s website, or call Fidelity at the applicable toll-free number listed below. Your election to receive reports in paper will apply to all funds held with the fund complex/your financial intermediary.
| Account Type | Website | Phone Number |
| Brokerage, Mutual Fund, or Annuity Contracts: | fidelity.com/mailpreferences | 1-800-343-3548 |
| Employer Provided Retirement Accounts: | netbenefits.fidelity.com/preferences (choose 'no' under Required Disclosures to continue to print) | 1-800-343-0860 |
| Advisor Sold Accounts Serviced Through Your Financial Intermediary: | Contact Your Financial Intermediary | Your Financial Intermediary's phone number |
| Advisor Sold Accounts Serviced by Fidelity: | institutional.fidelity.com | 1-877-208-0098 |
Contents
|
Board Approval of Investment Advisory Contracts and Management Fees |
To view a fund's proxy voting guidelines and proxy voting record for the 12-month period ended June 30, visit http://www.fidelity.com/proxyvotingresults or visit the Securities and Exchange Commission's (SEC) web site at http://www.sec.gov.
You may also call 1-800-544-8544 to request a free copy of the proxy voting guidelines.
Standard & Poor's, S&P and S&P 500 are registered service marks of The McGraw-Hill Companies, Inc. and have been licensed for use by Fidelity Distributors Corporation.
Other third-party marks appearing herein are the property of their respective owners.
All other marks appearing herein are registered or unregistered trademarks or service marks of FMR LLC or an affiliated company. © 2019 FMR LLC. All rights reserved.
A fund files its complete schedule of portfolio holdings with the SEC for the first and third quarters of each fiscal year on Form N-PORT. Forms N-PORT are available on the SEC’s web site at http://www.sec.gov. A fund's Forms N-PORT may be reviewed and copied at the SEC’s Public Reference Room in Washington, DC. Information regarding the operation of the SEC's Public Reference Room may be obtained by calling 1-800-SEC-0330.
Investment Summary (Unaudited)
Top Five Holdings as of March 31, 2019
| (by issuer, excluding cash equivalents) | % of fund's net assets |
| CCO Holdings LLC/CCO Holdings Capital Corp. | 3.3 |
| Ally Financial, Inc. | 2.3 |
| Tenet Healthcare Corp. | 2.3 |
| Icahn Enterprises LP/Icahn Enterprises Finance Corp. | 2.1 |
| Community Health Systems, Inc. | 2.0 |
| 12.0 |
Top Five Market Sectors as of March 31, 2019
| % of fund's net assets | |
| Energy | 15.8 |
| Telecommunications | 9.3 |
| Healthcare | 9.1 |
| Cable/Satellite TV | 7.3 |
| Diversified Financial Services | 6.9 |
Quality Diversification (% of fund's net assets)
| As of March 31, 2019 | ||
| BBB | 2.9% | |
| BB | 44.1% | |
| B | 33.7% | |
| CCC,CC,C | 13.7% | |
| Not Rated | 0.3% | |
| Equities | 0.1% | |
| Short-Term Investments and Net Other Assets | 5.2% | |

We have used ratings from Moody's Investors Service, Inc. Where Moody's® ratings are not available, we have used S&P® ratings. All ratings are as of the date indicated and do not reflect subsequent changes.
Asset Allocation (% of fund's net assets)
| As of March 31, 2019 * | ||
| Nonconvertible Bonds | 90.0% | |
| Convertible Bonds, Preferred Stocks | 0.2% | |
| Common Stocks | 0.1% | |
| Bank Loan Obligations | 1.6% | |
| Other Investments | 2.9% | |
| Short-Term Investments and Net Other Assets (Liabilities) | 5.2% | |

* Foreign investments - 22.0%
Schedule of Investments March 31, 2019 (Unaudited)
Showing Percentage of Net Assets
| Corporate Bonds - 90.2% | |||
| Principal Amount | Value | ||
| Convertible Bonds - 0.2% | |||
| Broadcasting - 0.2% | |||
| DISH Network Corp.: | |||
| 2.375% 3/15/24 | $750,000 | $618,653 | |
| 3.375% 8/15/26 | 770,000 | 654,115 | |
| 1,272,768 | |||
| Nonconvertible Bonds - 90.0% | |||
| Aerospace - 3.3% | |||
| BBA U.S. Holdings, Inc. 5.375% 5/1/26 (a) | 2,405,000 | 2,477,150 | |
| Bombardier, Inc.: | |||
| 6.125% 1/15/23 (a) | 3,365,000 | 3,411,269 | |
| 7.5% 12/1/24 (a) | 1,350,000 | 1,402,313 | |
| 7.875% 4/15/27 (a) | 1,475,000 | 1,521,094 | |
| BWX Technologies, Inc. 5.375% 7/15/26 (a) | 2,280,000 | 2,314,200 | |
| TransDigm, Inc.: | |||
| 6% 7/15/22 | 1,900,000 | 1,930,552 | |
| 6.25% 3/15/26 (a) | 2,230,000 | 2,313,625 | |
| 6.375% 6/15/26 | 130,000 | 128,681 | |
| 6.5% 5/15/25 | 1,000,000 | 1,015,100 | |
| 16,513,984 | |||
| Air Transportation - 0.6% | |||
| Aercap Global Aviation Trust 6.5% 6/15/45 (a)(b) | 3,210,000 | 3,246,113 | |
| Banks & Thrifts - 2.3% | |||
| Ally Financial, Inc.: | |||
| 4.625% 3/30/25 | 660,000 | 671,550 | |
| 5.75% 11/20/25 | 7,745,000 | 8,249,250 | |
| 8% 11/1/31 | 2,385,000 | 2,960,381 | |
| 11,881,181 | |||
| Broadcasting - 1.5% | |||
| Sirius XM Radio, Inc.: | |||
| 3.875% 8/1/22 (a) | 1,330,000 | 1,320,025 | |
| 5% 8/1/27 (a) | 2,765,000 | 2,766,659 | |
| 5.375% 4/15/25 (a) | 1,751,040 | 1,797,005 | |
| 5.375% 7/15/26 (a) | 595,000 | 605,413 | |
| 6% 7/15/24 (a) | 1,300,000 | 1,347,125 | |
| 7,836,227 | |||
| Cable/Satellite TV - 7.3% | |||
| Altice SA 7.75% 5/15/22 (a) | 1,230,000 | 1,230,000 | |
| Cablevision Systems Corp. 5.875% 9/15/22 | 805,000 | 841,225 | |
| CCO Holdings LLC/CCO Holdings Capital Corp.: | |||
| 4% 3/1/23 (a) | 3,805,000 | 3,801,385 | |
| 5% 2/1/28 (a) | 2,135,000 | 2,110,981 | |
| 5.125% 5/1/27 (a) | 2,910,000 | 2,928,188 | |
| 5.375% 5/1/25 (a) | 1,600,000 | 1,652,000 | |
| 5.5% 5/1/26 (a) | 2,485,000 | 2,565,763 | |
| 5.75% 2/15/26 (a) | 1,915,000 | 2,005,963 | |
| 5.875% 5/1/27 (a) | 1,255,000 | 1,302,439 | |
| CSC Holdings LLC: | |||
| 5.375% 7/15/23 (a) | 2,125,000 | 2,164,844 | |
| 5.5% 5/15/26 (a) | 1,000,000 | 1,027,800 | |
| 5.5% 4/15/27 (a) | 925,000 | 944,564 | |
| 7.5% 4/1/28 (a) | 935,000 | 1,001,899 | |
| 7.75% 7/15/25 (a) | 2,200,000 | 2,359,500 | |
| DISH DBS Corp.: | |||
| 5.875% 11/15/24 | 3,260,000 | 2,738,400 | |
| 7.75% 7/1/26 | 1,870,000 | 1,626,900 | |
| Virgin Media Secured Finance PLC 5.5% 8/15/26 (a) | 2,140,000 | 2,177,450 | |
| Ziggo Bond Finance BV 5.875% 1/15/25 (a) | 2,205,000 | 2,177,438 | |
| Ziggo Secured Finance BV 5.5% 1/15/27 (a) | 2,440,000 | 2,409,500 | |
| 37,066,239 | |||
| Capital Goods - 0.8% | |||
| AECOM: | |||
| 5.125% 3/15/27 | 2,425,000 | 2,343,156 | |
| 5.875% 10/15/24 | 1,455,000 | 1,533,206 | |
| 3,876,362 | |||
| Chemicals - 2.8% | |||
| Element Solutions, Inc. 5.875% 12/1/25 (a) | 2,010,000 | 2,017,236 | |
| NOVA Chemicals Corp. 4.875% 6/1/24 (a) | 1,920,000 | 1,886,400 | |
| OCI NV 6.625% 4/15/23 (a) | 1,960,000 | 2,032,520 | |
| Olin Corp. 5.125% 9/15/27 | 1,725,000 | 1,744,406 | |
| The Chemours Co. LLC 5.375% 5/15/27 | 1,545,000 | 1,534,849 | |
| TPC Group, Inc. 8.75% 12/15/20 (a) | 2,800,000 | 2,758,000 | |
| Trinseo Materials Operating SCA/Trinseo Materials Finance, Inc. 5.375% 9/1/25 (a) | 1,175,000 | 1,113,313 | |
| Valvoline, Inc. 4.375% 8/15/25 | 970,000 | 928,775 | |
| 14,015,499 | |||
| Consumer Products - 0.1% | |||
| Prestige Brands, Inc. 6.375% 3/1/24 (a) | 370,000 | 376,475 | |
| Containers - 1.8% | |||
| Ard Securities Finance SARL 8.75% 1/31/23 pay-in-kind (a)(b) | 834,954 | 789,032 | |
| Ardagh Packaging Finance PLC/Ardagh MP Holdings U.S.A., Inc.: | |||
| 4.625% 5/15/23 (a) | 945,000 | 950,906 | |
| 6% 2/15/25 (a) | 2,350,000 | 2,350,000 | |
| Crown Americas LLC/Crown Americas Capital Corp. V 4.25% 9/30/26 | 1,930,000 | 1,867,275 | |
| OI European Group BV 4% 3/15/23 (a) | 1,380,000 | 1,354,125 | |
| Reynolds Group Issuer, Inc./Reynolds Group Issuer LLC/Reynolds Group Issuer (Luxembourg) SA: | |||
| 5.125% 7/15/23 (a) | 650,000 | 660,563 | |
| 7% 7/15/24 (a) | 950,000 | 978,619 | |
| 8,950,520 | |||
| Diversified Financial Services - 6.9% | |||
| Chobani LLC/Finance Corp., Inc. 7.5% 4/15/25 (a) | 760,000 | 681,150 | |
| Crown Americas LLC/Crown Americas Capital Corp. IV 4.75% 2/1/26 | 955,000 | 959,584 | |
| FLY Leasing Ltd. 5.25% 10/15/24 | 3,345,000 | 3,211,200 | |
| Icahn Enterprises LP/Icahn Enterprises Finance Corp.: | |||
| 5.875% 2/1/22 | 4,745,000 | 4,804,313 | |
| 6.25% 2/1/22 | 4,515,000 | 4,631,713 | |
| 6.375% 12/15/25 | 1,030,000 | 1,054,463 | |
| MSCI, Inc. 4.75% 8/1/26 (a) | 1,485,000 | 1,525,838 | |
| Navient Corp.: | |||
| 6.5% 6/15/22 | 2,235,000 | 2,330,077 | |
| 6.75% 6/15/26 | 1,030,000 | 986,225 | |
| 7.25% 9/25/23 | 2,505,000 | 2,645,906 | |
| Park Aerospace Holdings Ltd.: | |||
| 4.5% 3/15/23 (a) | 685,000 | 681,575 | |
| 5.25% 8/15/22 (a) | 1,090,000 | 1,117,141 | |
| 5.5% 2/15/24 (a) | 575,000 | 596,936 | |
| Quicken Loans, Inc. 5.25% 1/15/28 (a) | 1,710,000 | 1,600,988 | |
| Radiate Holdco LLC/Radiate Financial Service Ltd.: | |||
| 6.625% 2/15/25 (a) | 1,650,000 | 1,592,250 | |
| 6.875% 2/15/23 (a) | 515,000 | 509,850 | |
| SLM Corp.: | |||
| 5.5% 1/25/23 | 800,000 | 801,000 | |
| 6.125% 3/25/24 | 405,000 | 404,494 | |
| 7.25% 1/25/22 | 580,000 | 614,800 | |
| Springleaf Financial Corp.: | |||
| 6.875% 3/15/25 | 1,090,000 | 1,125,425 | |
| 7.125% 3/15/26 | 1,815,000 | 1,835,328 | |
| Tempo Acquisition LLC 6.75% 6/1/25 (a) | 1,385,000 | 1,395,388 | |
| 35,105,644 | |||
| Diversified Media - 0.8% | |||
| E.W. Scripps Co. 5.125% 5/15/25 (a) | 785,000 | 747,713 | |
| MDC Partners, Inc. 6.5% 5/1/24 (a) | 1,765,000 | 1,460,538 | |
| Nielsen Co. SARL (Luxembourg): | |||
| 5% 2/1/25 (a) | 775,000 | 744,969 | |
| 5.5% 10/1/21 (a) | 175,000 | 175,438 | |
| Nielsen Finance LLC/Nielsen Finance Co. 5% 4/15/22 (a) | 875,000 | 866,250 | |
| 3,994,908 | |||
| Energy - 15.3% | |||
| Archrock Partners LP / Archrock Partners Finance Corp. 6.875% 4/1/27 (a) | 700,000 | 713,790 | |
| California Resources Corp. 8% 12/15/22 (a) | 4,285,000 | 3,365,011 | |
| Cheniere Corpus Christi Holdings LLC: | |||
| 5.875% 3/31/25 | 1,615,000 | 1,756,313 | |
| 7% 6/30/24 | 3,100,000 | 3,499,280 | |
| Cheniere Energy Partners LP: | |||
| 5.25% 10/1/25 | 6,470,000 | 6,615,575 | |
| 5.625% 10/1/26 (a) | 470,000 | 481,750 | |
| Chesapeake Energy Corp.: | |||
| 8% 1/15/25 | 560,000 | 571,200 | |
| 8% 6/15/27 | 1,010,000 | 994,850 | |
| Citgo Petroleum Corp. 6.25% 8/15/22 (a) | 1,365,000 | 1,356,469 | |
| Comstock Escrow Corp. 9.75% 8/15/26 (a) | 1,675,000 | 1,541,000 | |
| Consolidated Energy Finance SA: | |||
| 3 month U.S. LIBOR + 3.750% 6.3609% 6/15/22 (a)(b)(c) | 3,330,000 | 3,318,606 | |
| 6.5% 5/15/26 (a) | 840,000 | 835,800 | |
| 6.875% 6/15/25 (a) | 945,000 | 952,088 | |
| Crestwood Midstream Partners LP/Crestwood Midstream Finance Corp.: | |||
| 5.75% 4/1/25 | 1,045,000 | 1,071,125 | |
| 6.25% 4/1/23 | 1,365,000 | 1,399,125 | |
| DCP Midstream Operating LP 5.375% 7/15/25 | 2,150,000 | 2,241,375 | |
| Denbury Resources, Inc.: | |||
| 9% 5/15/21 (a) | 355,000 | 345,238 | |
| 9.25% 3/31/22 (a) | 2,795,000 | 2,697,175 | |
| Endeavor Energy Resources LP/EER Finance, Inc.: | |||
| 5.5% 1/30/26 (a) | 220,000 | 226,050 | |
| 5.75% 1/30/28 (a) | 220,000 | 231,000 | |
| Ensco PLC 5.2% 3/15/25 | 1,900,000 | 1,473,070 | |
| EP Energy LLC/Everest Acquisition Finance, Inc.: | |||
| 7.75% 5/15/26 (a) | 850,000 | 692,750 | |
| 8% 11/29/24 (a) | 1,815,000 | 1,002,788 | |
| Hess Infrastructure Partners LP 5.625% 2/15/26 (a) | 2,910,000 | 2,960,925 | |
| Hilcorp Energy I LP/Hilcorp Finance Co.: | |||
| 5% 12/1/24 (a) | 1,040,000 | 1,011,712 | |
| 5.75% 10/1/25 (a) | 1,635,000 | 1,606,388 | |
| Indigo Natural Resources LLC 6.875% 2/15/26 (a) | 1,220,000 | 1,079,700 | |
| Jonah Energy LLC 7.25% 10/15/25 (a) | 2,560,000 | 1,356,800 | |
| Magnolia Oil & Gas Operating LLC 6% 8/1/26 (a) | 935,000 | 944,350 | |
| MEG Energy Corp. 7% 3/31/24 (a) | 1,160,000 | 1,081,700 | |
| Nabors Industries, Inc.: | |||
| 5.5% 1/15/23 | 880,000 | 839,960 | |
| 5.75% 2/1/25 | 625,000 | 560,144 | |
| NextEra Energy Partners LP: | |||
| 4.25% 9/15/24 (a) | 1,090,000 | 1,081,825 | |
| 4.5% 9/15/27 (a) | 235,000 | 229,125 | |
| Parsley Energy LLC/Parsley: | |||
| 5.25% 8/15/25 (a) | 200,000 | 197,375 | |
| 5.375% 1/15/25 (a) | 1,675,000 | 1,675,000 | |
| PBF Holding Co. LLC/PBF Finance Corp. 7% 11/15/23 | 1,000,000 | 1,028,500 | |
| PBF Logistics LP/PBF Logistics Finance, Inc. 6.875% 5/15/23 | 780,000 | 793,650 | |
| Rose Rock Midstream LP/Rose Rock Finance Corp. 5.625% 11/15/23 | 1,715,000 | 1,610,557 | |
| Sanchez Energy Corp. 7.25% 2/15/23 (a) | 3,115,000 | 2,507,575 | |
| SemGroup Corp.: | |||
| 6.375% 3/15/25 | 1,685,000 | 1,583,900 | |
| 7.25% 3/15/26 | 1,830,000 | 1,775,100 | |
| Summit Midstream Holdings LLC 5.75% 4/15/25 | 2,095,000 | 1,977,156 | |
| Sunoco LP/Sunoco Finance Corp.: | |||
| 4.875% 1/15/23 | 705,000 | 716,210 | |
| 5.5% 2/15/26 | 500,000 | 495,000 | |
| Targa Resources Partners LP/Targa Resources Partners Finance Corp.: | |||
| 4.25% 11/15/23 | 765,000 | 762,131 | |
| 5.125% 2/1/25 | 1,730,000 | 1,764,600 | |
| 5.25% 5/1/23 | 380,000 | 386,817 | |
| 5.875% 4/15/26 (a) | 1,130,000 | 1,194,410 | |
| 6.75% 3/15/24 | 510,000 | 534,225 | |
| Teine Energy Ltd. 6.875% 9/30/22 (a) | 765,000 | 774,563 | |
| TerraForm Power Operating LLC: | |||
| 4.25% 1/31/23 (a) | 195,000 | 192,658 | |
| 5% 1/31/28 (a) | 510,000 | 492,150 | |
| 6.625% 6/15/25 (a)(b) | 1,060,000 | 1,110,350 | |
| U.S.A. Compression Partners LP: | |||
| 6.875% 4/1/26 | 1,135,000 | 1,160,538 | |
| 6.875% 9/1/27 (a) | 390,000 | 396,338 | |
| Weatherford International Ltd.: | |||
| 5.95% 4/15/42 | 250,000 | 139,925 | |
| 6.5% 8/1/36 | 840,000 | 474,600 | |
| 7% 3/15/38 | 305,000 | 173,850 | |
| 9.875% 2/15/24 | 1,550,000 | 1,116,000 | |
| Weatherford International, Inc. 9.875% 3/1/25 | 2,800,000 | 1,981,000 | |
| 77,148,235 | |||
| Entertainment/Film - 0.3% | |||
| New Cotai LLC/New Cotai Capital Corp. 10.625% 5/1/19 pay-in-kind (a)(b) | 2,792,651 | 1,382,362 | |
| Environmental - 0.3% | |||
| LBC Tank Terminals Holding Netherlands BV 6.875% 5/15/23 (a) | 1,375,000 | 1,299,375 | |
| Tervita Escrow Corp. 7.625% 12/1/21 (a) | 180,000 | 178,650 | |
| 1,478,025 | |||
| Food/Beverage/Tobacco - 3.3% | |||
| C&S Group Enterprises LLC 5.375% 7/15/22 (a) | 1,205,000 | 1,209,519 | |
| JBS U.S.A. LLC/JBS U.S.A. Finance, Inc.: | |||
| 5.75% 6/15/25 (a) | 3,410,000 | 3,495,250 | |
| 5.875% 7/15/24 (a) | 6,250,000 | 6,421,875 | |
| Post Holdings, Inc.: | |||
| 5% 8/15/26 (a) | 1,395,000 | 1,356,638 | |
| 5.75% 3/1/27 (a) | 710,000 | 712,663 | |
| Vector Group Ltd. 6.125% 2/1/25 (a) | 4,040,000 | 3,586,712 | |
| 16,782,657 | |||
| Gaming - 5.3% | |||
| CRC Escrow Issuer LLC/CRC Finance LLC 5.25% 10/15/25 (a) | 4,710,000 | 4,545,150 | |
| Eldorado Resorts, Inc.: | |||
| 6% 4/1/25 | 1,405,000 | 1,422,563 | |
| 6% 9/15/26 | 190,000 | 192,850 | |
| GLP Capital LP/GLP Financing II, Inc. 5.25% 6/1/25 | 1,510,000 | 1,581,936 | |
| MCE Finance Ltd. 4.875% 6/6/25 (a) | 1,195,000 | 1,182,102 | |
| MGM Growth Properties Operating Partnership LP: | |||
| 4.5% 9/1/26 | 4,310,000 | 4,191,475 | |
| 5.75% 2/1/27 (a) | 460,000 | 476,100 | |
| Scientific Games Corp.: | |||
| 5% 10/15/25 (a) | 820,000 | 803,600 | |
| 6.625% 5/15/21 | 1,475,000 | 1,489,750 | |
| 10% 12/1/22 | 1,705,000 | 1,791,699 | |
| Stars Group Holdings BV 7% 7/15/26 (a) | 2,935,000 | 3,059,738 | |
| Station Casinos LLC 5% 10/1/25 (a) | 1,085,000 | 1,068,725 | |
| Wynn Las Vegas LLC/Wynn Las Vegas Capital Corp. 5.25% 5/15/27 (a) | 1,485,000 | 1,405,181 | |
| Wynn Macau Ltd.: | |||
| 4.875% 10/1/24 (a) | 2,095,000 | 2,034,731 | |
| 5.5% 10/1/27 (a) | 1,620,000 | 1,562,045 | |
| 26,807,645 | |||
| Healthcare - 9.1% | |||
| Catalent Pharma Solutions 4.875% 1/15/26 (a) | 655,000 | 648,450 | |
| Charles River Laboratories International, Inc. 5.5% 4/1/26 (a) | 640,000 | 664,000 | |
| Community Health Systems, Inc.: | |||
| 5.125% 8/1/21 | 1,000,000 | 983,100 | |
| 6.25% 3/31/23 | 7,730,000 | 7,256,538 | |
| 8% 3/15/26 (a) | 870,000 | 832,416 | |
| 8.625% 1/15/24 (a) | 1,105,000 | 1,106,381 | |
| HCA Holdings, Inc.: | |||
| 4.5% 2/15/27 | 2,350,000 | 2,415,263 | |
| 5% 3/15/24 | 2,450,000 | 2,594,284 | |
| Hologic, Inc.: | |||
| 4.375% 10/15/25 (a) | 960,000 | 955,008 | |
| 4.625% 2/1/28 (a) | 180,000 | 177,750 | |
| MPT Operating Partnership LP/MPT Finance Corp.: | |||
| 5% 10/15/27 | 565,000 | 574,888 | |
| 5.25% 8/1/26 | 1,860,000 | 1,913,475 | |
| 5.5% 5/1/24 | 660,000 | 676,500 | |
| 6.375% 3/1/24 | 1,000,000 | 1,046,250 | |
| Sabra Health Care LP/Sabra Capital Corp.: | |||
| 5.375% 6/1/23 | 1,390,000 | 1,405,638 | |
| 5.5% 2/1/21 | 730,000 | 738,213 | |
| Teleflex, Inc. 4.875% 6/1/26 | 2,200,000 | 2,241,250 | |
| Tenet Healthcare Corp.: | |||
| 4.375% 10/1/21 | 1,125,000 | 1,144,575 | |
| 4.625% 7/15/24 | 740,000 | 741,850 | |
| 5.125% 5/1/25 | 430,000 | 432,172 | |
| 6.25% 2/1/27 (a) | 805,000 | 835,188 | |
| 6.75% 6/15/23 | 2,240,000 | 2,307,200 | |
| 8.125% 4/1/22 | 5,385,000 | 5,793,452 | |
| THC Escrow Corp. III 7% 8/1/25 | 1,425,000 | 1,442,813 | |
| Valeant Pharmaceuticals International, Inc.: | |||
| 5.875% 5/15/23 (a) | 298,000 | 300,980 | |
| 7% 3/15/24 (a) | 3,300,000 | 3,491,400 | |
| Wellcare Health Plans, Inc.: | |||
| 5.25% 4/1/25 | 2,855,000 | 2,954,925 | |
| 5.375% 8/15/26 (a) | 260,000 | 272,025 | |
| 45,945,984 | |||
| Homebuilders/Real Estate - 0.4% | |||
| Howard Hughes Corp. 5.375% 3/15/25 (a) | 1,555,000 | 1,552,932 | |
| Starwood Property Trust, Inc. 4.75% 3/15/25 | 490,000 | 487,550 | |
| 2,040,482 | |||
| Hotels - 0.8% | |||
| Hilton Worldwide Finance LLC/Hilton Worldwide Finance Corp. 4.625% 4/1/25 | 3,000,000 | 3,030,000 | |
| Wyndham Hotels & Resorts, Inc. 5.375% 4/15/26 (a) | 995,000 | 1,009,925 | |
| 4,039,925 | |||
| Insurance - 0.5% | |||
| AmWINS Group, Inc. 7.75% 7/1/26 (a) | 1,210,000 | 1,210,000 | |
| USIS Merger Sub, Inc. 6.875% 5/1/25 (a) | 1,220,000 | 1,184,925 | |
| 2,394,925 | |||
| Leisure - 0.2% | |||
| Mattel, Inc. 6.75% 12/31/25 (a) | 1,235,000 | 1,214,931 | |
| Metals/Mining - 1.0% | |||
| First Quantum Minerals Ltd.: | |||
| 7.25% 5/15/22 (a) | 655,000 | 659,094 | |
| 7.25% 4/1/23 (a) | 1,075,000 | 1,050,813 | |
| Freeport-McMoRan, Inc.: | |||
| 3.875% 3/15/23 | 625,000 | 616,006 | |
| 4.55% 11/14/24 | 1,700,000 | 1,674,500 | |
| Nufarm Australia Ltd. 5.75% 4/30/26 (a) | 920,000 | 851,000 | |
| 4,851,413 | |||
| Paper - 0.3% | |||
| Flex Acquisition Co., Inc.: | |||
| 6.875% 1/15/25 (a) | 1,190,000 | 1,136,450 | |
| 7.875% 7/15/26 (a) | 275,000 | 265,375 | |
| 1,401,825 | |||
| Publishing/Printing - 0.2% | |||
| Multi-Color Corp. 4.875% 11/1/25 (a) | 1,185,000 | 1,223,513 | |
| Restaurants - 1.0% | |||
| 1011778 BC Unlimited Liability Co./New Red Finance, Inc.: | |||
| 4.25% 5/15/24 (a) | 920,000 | 910,800 | |
| 5% 10/15/25 (a) | 1,340,000 | 1,323,652 | |
| Golden Nugget, Inc. 6.75% 10/15/24 (a) | 2,565,000 | 2,577,825 | |
| 4,812,277 | |||
| Services - 2.9% | |||
| APX Group, Inc.: | |||
| 7.625% 9/1/23 | 1,295,000 | 1,097,513 | |
| 7.875% 12/1/22 | 1,045,000 | 1,047,508 | |
| 8.75% 12/1/20 | 1,581,000 | 1,557,285 | |
| Aramark Services, Inc. 4.75% 6/1/26 | 2,750,000 | 2,743,125 | |
| Avantor, Inc. 6% 10/1/24 (a) | 740,000 | 767,750 | |
| Brand Energy & Infrastructure Services, Inc. 8.5% 7/15/25 (a) | 1,505,000 | 1,350,738 | |
| CDK Global, Inc.: | |||
| 4.875% 6/1/27 | 460,000 | 459,425 | |
| 5.875% 6/15/26 | 755,000 | 788,975 | |
| Corrections Corp. of America: | |||
| 4.625% 5/1/23 | 255,000 | 246,075 | |
| 5% 10/15/22 | 725,000 | 714,125 | |
| Frontdoor, Inc. 6.75% 8/15/26 (a) | 705,000 | 720,863 | |
| Laureate Education, Inc. 8.25% 5/1/25 (a) | 1,950,000 | 2,115,750 | |
| Prime Security One MS, Inc. 4.875% 7/15/32 (a) | 1,075,000 | 870,750 | |
| 14,479,882 | |||
| Super Retail - 0.2% | |||
| The William Carter Co. 5.625% 3/15/27 (a) | 795,000 | 821,831 | |
| Technology - 4.6% | |||
| Ascend Learning LLC: | |||
| 6.875% 8/1/25 (a) | 110,000 | 109,175 | |
| 6.875% 8/1/25 (a) | 1,055,000 | 1,048,406 | |
| Ensemble S Merger Sub, Inc. 9% 9/30/23 (a) | 1,465,000 | 1,519,938 | |
| Fair Isaac Corp. 5.25% 5/15/26 (a) | 1,805,000 | 1,859,150 | |
| Gartner, Inc. 5.125% 4/1/25 (a) | 905,000 | 914,684 | |
| Micron Technology, Inc. 5.5% 2/1/25 | 555,000 | 572,266 | |
| Nuance Communications, Inc. 5.625% 12/15/26 | 1,035,000 | 1,060,875 | |
| Open Text Corp. 5.875% 6/1/26 (a) | 2,920,000 | 3,051,400 | |
| Qorvo, Inc. 5.5% 7/15/26 (a) | 840,000 | 867,384 | |
| Sensata Technologies BV 5% 10/1/25 (a) | 1,910,000 | 1,957,750 | |
| Solera LLC/Solera Finance, Inc. 10.5% 3/1/24 (a) | 3,970,000 | 4,303,162 | |
| SS&C Technologies, Inc. 5.5% 9/30/27 (a) | 1,045,000 | 1,055,450 | |
| Symantec Corp. 5% 4/15/25 (a) | 2,575,000 | 2,579,692 | |
| TTM Technologies, Inc. 5.625% 10/1/25 (a) | 2,495,000 | 2,398,319 | |
| 23,297,651 | |||
| Telecommunications - 8.5% | |||
| Altice Financing SA 7.5% 5/15/26 (a) | 4,210,000 | 4,155,270 | |
| C&W Senior Financing Designated Activity Co.: | |||
| 6.875% 9/15/27 (a) | 790,000 | 791,975 | |
| 7.5% 10/15/26 (a) | 1,880,000 | 1,936,400 | |
| Citizens Utilities Co. 7.05% 10/1/46 | 2,165,000 | 1,033,788 | |
| Frontier Communications Corp. 8% 4/1/27 (a) | 755,000 | 779,538 | |
| Intelsat Jackson Holdings SA 8.5% 10/15/24 (a) | 1,410,000 | 1,371,225 | |
| Level 3 Communications, Inc. 5.75% 12/1/22 | 955,000 | 964,837 | |
| Level 3 Financing, Inc.: | |||
| 5.125% 5/1/23 | 1,200,000 | 1,210,500 | |
| 5.375% 1/15/24 | 3,340,000 | 3,402,124 | |
| 5.375% 5/1/25 | 550,000 | 556,765 | |
| Millicom International Cellular SA: | |||
| 6% 3/15/25 (a) | 175,000 | 179,375 | |
| 6.625% 10/15/26 (a) | 2,290,000 | 2,398,134 | |
| Neptune Finco Corp. 6.625% 10/15/25 (a) | 2,680,000 | 2,840,800 | |
| Qwest Corp. 6.75% 12/1/21 | 500,000 | 532,025 | |
| SFR Group SA: | |||
| 6.25% 5/15/24 (a) | 1,045,000 | 1,052,838 | |
| 7.375% 5/1/26 (a) | 1,195,000 | 1,171,100 | |
| 8.125% 2/1/27 (a) | 1,150,000 | 1,162,938 | |
| Sprint Communications, Inc. 6% 11/15/22 | 2,375,000 | 2,393,525 | |
| Sprint Corp. 7.875% 9/15/23 | 5,750,000 | 6,037,500 | |
| T-Mobile U.S.A., Inc. 6.375% 3/1/25 | 2,200,000 | 2,290,860 | |
| Telecom Italia Capital SA: | |||
| 6% 9/30/34 | 510,000 | 471,750 | |
| 6.375% 11/15/33 | 285,000 | 275,025 | |
| Telecom Italia SpA 5.303% 5/30/24 (a) | 480,000 | 482,400 | |
| Telenet Finance Luxembourg Notes SARL 5.5% 3/1/28 (a) | 2,400,000 | 2,352,000 | |
| U.S. West Communications 7.25% 9/15/25 | 545,000 | 589,105 | |
| Zayo Group LLC/Zayo Capital, Inc. 6.375% 5/15/25 | 2,725,000 | 2,738,625 | |
| 43,170,422 | |||
| Transportation Ex Air/Rail - 1.2% | |||
| Avolon Holdings Funding Ltd.: | |||
| 5.125% 10/1/23 (a) | 4,705,000 | 4,787,338 | |
| 5.5% 1/15/23 (a) | 1,205,000 | 1,238,138 | |
| 6,025,476 | |||
| Utilities - 6.4% | |||
| Clearway Energy Operating LLC 5.75% 10/15/25 (a) | 680,000 | 682,550 | |
| Dolphin Subsidiary II, Inc. 7.25% 10/15/21 | 3,270,000 | 3,514,596 | |
| DPL, Inc. 6.75% 10/1/19 | 688,000 | 691,440 | |
| Dynegy, Inc. 7.625% 11/1/24 | 1,200,000 | 1,269,024 | |
| Global Partners LP/GLP Finance Corp.: | |||
| 6.25% 7/15/22 | 1,785,000 | 1,762,688 | |
| 7% 6/15/23 | 4,980,000 | 4,930,200 | |
| InterGen NV 7% 6/30/23 (a) | 2,385,000 | 2,152,463 | |
| NRG Yield Operating LLC 5% 9/15/26 | 970,000 | 923,925 | |
| NSG Holdings II LLC/NSG Holdings, Inc. 7.75% 12/15/25 (a) | 4,373,809 | 4,679,975 | |
| Talen Energy Supply LLC: | |||
| 6.5% 6/1/25 | 165,000 | 145,200 | |
| 10.5% 1/15/26 (a) | 3,305,000 | 3,443,810 | |
| The AES Corp. 4.875% 5/15/23 | 3,975,000 | 4,029,656 | |
| Vistra Operations Co. LLC 5.5% 9/1/26 (a) | 3,975,000 | 4,134,000 | |
| 32,359,527 | |||
| TOTAL NONCONVERTIBLE BONDS | 454,542,140 | ||
| TOTAL CORPORATE BONDS | |||
| (Cost $455,481,020) | 455,814,908 | ||
| Shares | Value | ||
| Common Stocks - 0.1% | |||
| Energy - 0.1% | |||
| Forbes Energy Services Ltd. (d) | 72,087 | 234,283 | |
| Telecommunications - 0.0% | |||
| CUI Acquisition Corp. Class E (d)(e) | 0 | 16,065 | |
| TOTAL COMMON STOCKS | |||
| (Cost $4,026,301) | 250,348 | ||
| Principal Amount | Value | ||
| Bank Loan Obligations - 1.6% | |||
| Energy - 0.1% | |||
| California Resources Corp. Tranche B, term loan 3 month U.S. LIBOR + 4.750% 7.2455% 12/31/22 (b)(c) | 450,000 | 441,846 | |
| Gaming - 0.4% | |||
| Golden Entertainment, Inc. Tranche B, term loan: | |||
| 3 month U.S. LIBOR + 3.000% 5.5% 10/20/24 (b)(c) | 1,273,875 | 1,261,136 | |
| 3 month U.S. LIBOR + 7.000% 9.5% 10/20/25 (b)(c) | 430,000 | 419,250 | |
| Scientific Games Corp. Tranche B 5LN, term loan 3 month U.S. LIBOR + 2.750% 5.3123% 8/14/24 (b)(c) | 429,796 | 418,131 | |
| TOTAL GAMING | 2,098,517 | ||
| Publishing/Printing - 0.2% | |||
| Springer Science+Business Media Deutschland GmbH Tranche B 13LN, term loan 3 month U.S. LIBOR + 3.500% 5.993% 8/24/22 (b)(c) | 1,268,890 | 1,261,226 | |
| Services - 0.1% | |||
| Almonde, Inc.: | |||
| Tranche 2LN, term loan 3 month U.S. LIBOR + 7.250% 9.851% 6/13/25 (b)(c) | 65,000 | 62,495 | |
| Tranche B 1LN, term loan 3 month U.S. LIBOR + 3.500% 6.303% 6/13/24 (b)(c) | 285,494 | 274,968 | |
| TOTAL SERVICES | 337,463 | ||
| Telecommunications - 0.8% | |||
| Frontier Communications Corp. Tranche B 1LN, term loan 3 month U.S. LIBOR + 3.750% 6.25% 6/15/24 (b)(c) | 2,353,025 | 2,294,200 | |
| Radiate Holdco LLC Tranche B, term loan 3 month U.S. LIBOR + 3.000% 5.493% 2/1/24 (b)(c) | 1,651,300 | 1,612,098 | |
| TOTAL TELECOMMUNICATIONS | 3,906,298 | ||
| TOTAL BANK LOAN OBLIGATIONS | |||
| (Cost $8,014,647) | 8,045,350 | ||
| Preferred Securities - 2.9% | |||
| Banks & Thrifts - 2.6% | |||
| Bank of America Corp.: | |||
| 6.1% (b)(f) | 2,010,000 | 2,131,799 | |
| 6.25% (b)(f) | 2,310,000 | 2,459,193 | |
| Barclays PLC 7.875% (Reg. S) (b)(f) | 3,745,000 | 3,883,580 | |
| Royal Bank of Scotland Group PLC 7.5% (b)(f) | 2,595,000 | 2,644,720 | |
| Wells Fargo & Co. 5.9% (b)(f) | 1,955,000 | 2,033,774 | |
| TOTAL BANKS & THRIFTS | 13,153,066 | ||
| Energy - 0.3% | |||
| Andeavor Logistics LP 6.875% (b)(f) | 1,270,000 | 1,274,262 | |
| TOTAL PREFERRED SECURITIES | |||
| (Cost $14,106,628) | 14,427,328 | ||
| Shares | Value | ||
| Money Market Funds - 3.7% | |||
| Fidelity Cash Central Fund, 2.48% (g) | |||
| (Cost $18,926,093) | 18,922,432 | 18,926,217 | |
| TOTAL INVESTMENT IN SECURITIES - 98.5% | |||
| (Cost $500,554,689) | 497,464,151 | ||
| NET OTHER ASSETS (LIABILITIES) - 1.5% | 7,743,303 | ||
| NET ASSETS - 100% | $505,207,454 |
Amounts shown as 0 in the Schedule of Investments may represent less than 1 share.
Legend
(a) Security exempt from registration under Rule 144A of the Securities Act of 1933. These securities may be resold in transactions exempt from registration, normally to qualified institutional buyers. At the end of the period, the value of these securities amounted to $256,337,085 or 50.7% of net assets.
(b) Coupon rates for floating and adjustable rate securities reflect the rates in effect at period end.
(c) Coupon is indexed to a floating interest rate which may be multiplied by a specified factor and/or subject to caps or floors.
(d) Non-income producing
(e) Level 3 security
(f) Security is perpetual in nature with no stated maturity date.
(g) Affiliated fund that is generally available only to investment companies and other accounts managed by Fidelity Investments. The rate quoted is the annualized seven-day yield of the fund at period end. A complete unaudited listing of the fund's holdings as of its most recent quarter end is available upon request. In addition, each Fidelity Central Fund's financial statements are available on the SEC's website or upon request.
Affiliated Central Funds
Information regarding fiscal year to date income earned by the Fund from investments in Fidelity Central Funds is as follows:
| Fund | Income earned |
| Fidelity Cash Central Fund | $235,894 |
| Total | $235,894 |
Amounts in the income column in the above table include any capital gain distributions from underlying funds, which are presented in the corresponding line-item in the Statement of Operations, if applicable.
Investment Valuation
The following is a summary of the inputs used, as of March 31, 2019, involving the Fund's assets and liabilities carried at fair value. The inputs or methodology used for valuing securities may not be an indication of the risk associated with investing in those securities. For more information on valuation inputs, and their aggregation into the levels used below, please refer to the Investment Valuation section in the accompanying Notes to Financial Statements.
| Valuation Inputs at Reporting Date: | ||||
| Description | Total | Level 1 | Level 2 | Level 3 |
| Investments in Securities: | ||||
| Equities: | ||||
| Communication Services | $16,065 | $-- | $-- | $16,065 |
| Energy | 234,283 | 234,283 | -- | -- |
| Corporate Bonds | 455,814,908 | -- | 455,814,908 | -- |
| Bank Loan Obligations | 8,045,350 | -- | 8,045,350 | -- |
| Preferred Securities | 14,427,328 | -- | 14,427,328 | -- |
| Money Market Funds | 18,926,217 | 18,926,217 | -- | -- |
| Total Investments in Securities: | $497,464,151 | $19,160,500 | $478,287,586 | $16,065 |
Other Information
Distribution of investments by country or territory of incorporation, as a percentage of Total Net Assets, is as follows (Unaudited):
| United States of America | 78.0% |
| Canada | 4.6% |
| Luxembourg | 4.0% |
| Netherlands | 3.3% |
| Cayman Islands | 2.5% |
| Multi-National | 2.3% |
| United Kingdom | 2.0% |
| Ireland | 1.3% |
| Others (Individually Less Than 1%) | 2.0% |
| 100.0% |
See accompanying notes which are an integral part of the financial statements.
Financial Statements
Statement of Assets and Liabilities
| March 31, 2019 (Unaudited) | ||
| Assets | ||
| Investment in securities, at value — See accompanying schedule: Unaffiliated issuers (cost $481,628,596) | $478,537,934 | |
| Fidelity Central Funds (cost $18,926,093) | 18,926,217 | |
| Total Investment in Securities (cost $500,554,689) | $497,464,151 | |
| Receivable for investments sold | 19,430 | |
| Receivable for fund shares sold | 88,866 | |
| Interest receivable | 8,156,001 | |
| Distributions receivable from Fidelity Central Funds | 45,298 | |
| Total assets | 505,773,746 | |
| Liabilities | ||
| Payable for investments purchased | $377,438 | |
| Payable for fund shares redeemed | 186,127 | |
| Other payables and accrued expenses | 2,727 | |
| Total liabilities | 566,292 | |
| Net Assets | $505,207,454 | |
| Net Assets consist of: | ||
| Paid in capital | $510,958,802 | |
| Total distributable earnings (loss) | (5,751,348) | |
| Net Assets, for 5,407,183 shares outstanding | $505,207,454 | |
| Net Asset Value, offering price and redemption price per share ($505,207,454 ÷ 5,407,183 shares) | $93.43 |
See accompanying notes which are an integral part of the financial statements.
Statement of Operations
| Six months ended March 31, 2019 (Unaudited) | ||
| Investment Income | ||
| Dividends | $441,156 | |
| Interest | 14,246,558 | |
| Income from Fidelity Central Funds | 235,894 | |
| Total income | 14,923,608 | |
| Expenses | ||
| Custodian fees and expenses | $3,805 | |
| Independent directors' fees and expenses | 1,334 | |
| Legal | 5 | |
| Total expenses before reductions | 5,144 | |
| Expense reductions | (4,523) | |
| Total expenses after reductions | 621 | |
| Net investment income (loss) | 14,922,987 | |
| Realized and Unrealized Gain (Loss) | ||
| Net realized gain (loss) on: | ||
| Investment securities: | ||
| Unaffiliated issuers | (2,218,055) | |
| Fidelity Central Funds | (124) | |
| Total net realized gain (loss) | (2,218,179) | |
| Change in net unrealized appreciation (depreciation) on: | ||
| Investment securities: | ||
| Unaffiliated issuers | (364,090) | |
| Fidelity Central Funds | 124 | |
| Total change in net unrealized appreciation (depreciation) | (363,966) | |
| Net gain (loss) | (2,582,145) | |
| Net increase (decrease) in net assets resulting from operations | $12,340,842 |
See accompanying notes which are an integral part of the financial statements.
Statement of Changes in Net Assets
| Six months ended March 31, 2019 (Unaudited) | Year ended September 30, 2018 | |
| Increase (Decrease) in Net Assets | ||
| Operations | ||
| Net investment income (loss) | $14,922,987 | $26,853,621 |
| Net realized gain (loss) | (2,218,179) | 1,534,341 |
| Change in net unrealized appreciation (depreciation) | (363,966) | (17,609,200) |
| Net increase (decrease) in net assets resulting from operations | 12,340,842 | 10,778,762 |
| Distributions to shareholders | (15,181,604) | – |
| Distributions to shareholders from net investment income | – | (26,805,868) |
| Distributions to shareholders from net realized gain | – | (16,090,994) |
| Total distributions | (15,181,604) | (42,896,862) |
| Affiliated share transactions | ||
| Proceeds from sales of shares | 98,404,061 | 56,102,680 |
| Reinvestment of distributions | 15,181,604 | 42,889,583 |
| Cost of shares redeemed | (17,891,018) | (156,983,876) |
| Net increase (decrease) in net assets resulting from share transactions | 95,694,647 | (57,991,613) |
| Total increase (decrease) in net assets | 92,853,885 | (90,109,713) |
| Net Assets | ||
| Beginning of period | 412,353,569 | 502,463,282 |
| End of period | $505,207,454 | $412,353,569 |
| Other Information | ||
| Distributions in excess of net investment income end of period | $(415,531) | |
| Shares | ||
| Sold | 1,063,738 | 584,125 |
| Issued in reinvestment of distributions | 165,733 | 446,524 |
| Redeemed | (195,241) | (1,647,007) |
| Net increase (decrease) | 1,034,230 | (616,358) |
See accompanying notes which are an integral part of the financial statements.
Financial Highlights
Fidelity High Income Central Fund 1
| Six months ended (Unaudited) March 31, | Years endedSeptember 30, | |||||
| 2019 | 2018 | 2017 | 2016 | 2015 | 2014 | |
| Selected Per–Share Data | ||||||
| Net asset value, beginning of period | $94.30 | $100.71 | $98.03 | $93.94 | $102.00 | $101.40 |
| Income from Investment Operations | ||||||
| Net investment income (loss)A | 2.913 | 5.772 | 6.145 | 6.453 | 6.303 | 6.317 |
| Net realized and unrealized gain (loss) | (.818) | (3.258) | 2.919 | 3.688 | (8.196) | .503 |
| Total from investment operations | 2.095 | 2.514 | 9.064 | 10.141 | (1.893) | 6.820 |
| Distributions from net investment income | (2.914) | (5.750) | (6.169) | (6.051) | (6.167) | (6.220) |
| Distributions from net realized gain | (.051) | (3.174) | (.215) | – | – | – |
| Total distributions | (2.965) | (8.924) | (6.384) | (6.051) | (6.167) | (6.220) |
| Net asset value, end of period | $93.43 | $94.30 | $100.71 | $98.03 | $93.94 | $102.00 |
| Total ReturnB,C | 2.33% | 2.69% | 9.54% | 11.32% | (2.06)% | 6.77% |
| Ratios to Average Net AssetsD,E | ||||||
| Expenses before reductionsF | - %G | -% | -% | -% | -% | -% |
| Expenses net of fee waivers, if anyF | - %G | -% | -% | -% | -% | -% |
| Expenses net of all reductions | - %G | -% | -% | -% | -% | -% |
| Net investment income (loss)F | 6.37%G | 6.01% | 6.18% | 6.92% | 6.31% | 6.07% |
| Supplemental Data | ||||||
| Net assets, end of period (000 omitted) | $505,207 | $412,354 | $502,463 | $794,989 | $1,012,111 | $457,907 |
| Portfolio turnover rateH | 32%G | 69% | 58% | 59% | 57% | 74% |
A Calculated based on average shares outstanding during the period.
B Total returns for periods of less than one year are not annualized.
C Total returns would have been lower if certain expenses had not been reduced during the applicable periods shown.
D Fees and expenses of any underlying Fidelity Central Funds are not included in the Fund's expense ratio. The Fund indirectly bears its proportionate share of the expenses of any underlying Fidelity Central Funds.
E Expense ratios reflect operating expenses of the Fund. Expenses before reductions do not reflect amounts reimbursed by the investment adviser or reductions from expense offset arrangements and do not represent the amount paid by the Fund during periods when reimbursements or reductions occur. Expenses net of fee waivers reflect expenses after reimbursement by the investment adviser but prior to reductions from expense offset arrangements. Expenses net of all reductions represent the net expenses paid by the Fund.
F Amount represents less than .005%.
G Annualized
H Amount does not include the portfolio activity of any underlying Fidelity Central Funds.
See accompanying notes which are an integral part of the financial statements.
Notes to Financial Statements (Unaudited)
For the period ended March 31, 2019
1. Organization.
Fidelity High Income Central Fund 1 (the Fund) is a fund of Fidelity Central Investment Portfolios LLC (the LLC) and is authorized to issue an unlimited number of shares. Shares of the Fund are only offered to other investment companies and accounts managed by Fidelity Management & Research Company (FMR), or its affiliates (the Investing Funds). The LLC is registered under the Investment Company Act of 1940, as amended (the 1940 Act), as an open-end management investment company organized as a Delaware Limited Liability Company.
2. Investments in Fidelity Central Funds.
The Fund invests in Fidelity Central Funds, which are open-end investment companies generally available only to other investment companies and accounts managed by the investment adviser and its affiliates. The Fund's Schedule of Investments lists each of the Fidelity Central Funds held as of period end, if any, as an investment of the Fund, but does not include the underlying holdings of each Fidelity Central Fund. As an Investing Fund, the Fund indirectly bears its proportionate share of the expenses of the underlying Fidelity Central Funds.
The Money Market Central Funds seek preservation of capital and current income and are managed by Fidelity Investments Money Management, Inc. (FIMM), an affiliate of the investment adviser. Annualized expenses of the Money Market Central Funds as of their most recent shareholder report date are less than .005%.
A complete unaudited list of holdings for each Fidelity Central Fund is available upon request or at the Securities and Exchange Commission (the SEC) website at www.sec.gov. In addition, the financial statements of the Fidelity Central Funds are available on the SEC website or upon request.
3. Significant Accounting Policies.
The Fund is an investment company and applies the accounting and reporting guidance of the Financial Accounting Standards Board (FASB) Accounting Standards Codification Topic 946 Financial Services – Investments Companies. The financial statements have been prepared in conformity with accounting principles generally accepted in the United States of America (GAAP), which require management to make certain estimates and assumptions at the date of the financial statements. Actual results could differ from those estimates. Subsequent events, if any, through the date that the financial statements were issued have been evaluated in the preparation of the financial statements. The following summarizes the significant accounting policies of the Fund:
Investment Valuation. Investments are valued as of 4:00 p.m. Eastern time on the last calendar day of the period. The Board of Directors (the Board) has delegated the day to day responsibility for the valuation of the Fund's investments to the Fair Value Committee (the Committee) established by the Fund's investment adviser. In accordance with valuation policies and procedures approved by the Board, the Fund attempts to obtain prices from one or more third party pricing vendors or brokers to value its investments. When current market prices, quotations or currency exchange rates are not readily available or reliable, investments will be fair valued in good faith by the Committee, in accordance with procedures adopted by the Board. Factors used in determining fair value vary by investment type and may include market or investment specific events, changes in interest rates and credit quality. The frequency with which these procedures are used cannot be predicted and they may be utilized to a significant extent. The Committee oversees the Fund's valuation policies and procedures and reports to the Board on the Committee's activities and fair value determinations. The Board monitors the appropriateness of the procedures used in valuing the Fund's investments and ratifies the fair value determinations of the Committee.
The Fund categorizes the inputs to valuation techniques used to value its investments into a disclosure hierarchy consisting of three levels as shown below:
- Level 1 – quoted prices in active markets for identical investments
- Level 2 – other significant observable inputs (including quoted prices for similar investments, interest rates, prepayment speeds, etc.)
- Level 3 – unobservable inputs (including the Fund's own assumptions based on the best information available)
Valuation techniques used to value the Fund's investments by major category are as follows:
Debt securities, including restricted securities, are valued based on evaluated prices received from third party pricing vendors or from brokers who make markets in such securities. Corporate bonds, bank loan obligations and preferred securities are valued by pricing vendors who utilize matrix pricing which considers yield or price of bonds of comparable quality, coupon, maturity and type or by broker-supplied prices. When independent prices are unavailable or unreliable, debt securities may be valued utilizing pricing methodologies which consider similar factors that would be used by third party pricing vendors. Debt securities are generally categorized as Level 2 in the hierarchy but may be Level 3 depending on the circumstances. The Fund invests a significant portion of its assets in below investment grade securities. The value of these securities can be more volatile due to changes in the credit quality of the issuer and is sensitive to changes in economic, market and regulatory conditions.
Equity securities, including restricted securities, for which market quotations are readily available, are valued at the last reported sale price or official closing price as reported by a third party pricing vendor on the primary market or exchange on which they are traded and are categorized as Level 1 in the hierarchy. In the event there were no sales during the day or closing prices are not available, securities are valued at the last quoted bid price or may be valued using the last available price and are generally categorized as Level 2 in the hierarchy. For equity securities, including restricted securities, where observable inputs are limited, assumptions about market activity and risk are used and these securities may be categorized as Level 3 in the hierarchy.
Investments in open-end mutual funds, including the Fidelity Central Funds, are valued at their closing net asset value (NAV) each business day and are categorized as Level 1 in the hierarchy.
Changes in valuation techniques may result in transfers in or out of an assigned level within the disclosure hierarchy. The aggregate value of investments by input level as of March 31, 2019 is included at the end of the Fund's Schedule of Investments.
Investment Transactions and Income. For financial reporting purposes, the Fund's investment holdings and NAV include trades executed through the end of the last business day of the period. The NAV per share for processing shareholder transactions is calculated as of the close of business of the New York Stock Exchange (NYSE), normally 4:00 p.m. Eastern time and includes trades executed through the end of the prior business day. Gains and losses on securities sold are determined on the basis of identified cost. Dividend income is recorded on the ex-dividend date. Income and capital gain distributions from Fidelity Central Funds, if any, are recorded on the ex-dividend date. Interest income is accrued as earned and includes coupon interest and amortization of premium and accretion of discount on debt securities as applicable. Paid in Kind (PIK) income is recorded at the fair market value of the securities received. Debt obligations may be placed on non-accrual status and related interest income may be reduced by ceasing current accruals and writing off interest receivables when the collection of all or a portion of interest has become doubtful based on consistently applied procedures. A debt obligation is removed from non-accrual status when the issuer resumes interest payments or when collectability of interest is reasonably assured.
Expenses. Expenses directly attributable to a fund are charged to that fund. Expenses attributable to more than one fund are allocated among the respective funds on the basis of relative net assets or other appropriate methods. Expense estimates are accrued in the period to which they relate and adjustments are made when actual amounts are known.
Income Tax Information and Distributions to Shareholders. Each year, the Fund intends to qualify as a regulated investment company under Subchapter M of the Internal Revenue Code, including distributing substantially all of its taxable income and realized gains. As a result, no provision for U.S. Federal income taxes is required. The Fund files a U.S. federal tax return, in addition to state and local tax returns as required. The Fund's federal income tax returns are subject to examination by the Internal Revenue Service (IRS) for a period of three fiscal years after they are filed. State and local tax returns may be subject to examination for an additional fiscal year depending on the jurisdiction.
Distributions are declared and recorded daily and paid monthly from net investment income. Distributions from realized gains, if any, are declared and recorded on the ex-dividend date. Income and capital gain distributions are determined in accordance with income tax regulations, which may differ from GAAP.
Capital accounts within the financial statements are adjusted for permanent book-tax differences. These adjustments have no impact on net assets or the results of operations. Capital accounts are not adjusted for temporary book-tax differences which will reverse in a subsequent period.
Book-tax differences are primarily due to partnerships and losses deferred due to wash sales.
As of period end, the cost and unrealized appreciation (depreciation) in securities, and derivatives if applicable, for federal income tax purposes were as follows:
| Gross unrealized appreciation | $10,308,440 |
| Gross unrealized depreciation | (13,405,134) |
| Net unrealized appreciation (depreciation) | $(3,096,694) |
| Tax cost | $500,560,845 |
Restricted Securities. The Fund may invest in securities that are subject to legal or contractual restrictions on resale. These securities generally may be resold in transactions exempt from registration or to the public if the securities are registered. Disposal of these securities may involve time-consuming negotiations and expense, and prompt sale at an acceptable price may be difficult. Information regarding restricted securities is included at the end of the Fund's Schedule of Investments.
Loans and Other Direct Debt Instruments. The Fund invests in direct debt instruments which are interests in amounts owed to lenders by corporate or other borrowers. These instruments may be in the form of loans, trade claims or other receivables and may include standby financing commitments such as revolving credit facilities that obligate the Fund to supply additional cash to the borrower on demand. Loans may be acquired through assignment or participation. The Fund did not have any unfunded loan commitments, which are contractual obligations for future funding, at period end.
New Rule Issuance. During August 2018, the U.S. Securities and Exchange Commission issued Final Rule Release No. 33-10532, Disclosure Update and Simplification. This Final Rule includes amendments specific to registered investment companies that are intended to eliminate overlap in disclosure requirements between Regulation S-X and GAAP. In accordance with these amendments, certain line-items in the Fund's financial statements have been combined or removed for the current period as outlined in the table below.
| Financial Statement | Current Line-Item Presentation (As Applicable) | Prior Line-Item Presentation (As Applicable) |
| Statement of Assets and Liabilities | Total distributable earnings (loss) | Undistributed/Distributions in excess of/Accumulated net investment income (loss) Accumulated/Undistributed net realized gain (loss) Net unrealized appreciation (depreciation) |
| Statement of Changes in Net Assets | N/A - removed | Undistributed/Distributions in excess of/Accumulated net investment income (loss) end of period |
| Statement of Changes in Net Assets | Distributions to shareholders | Distributions to shareholders from net investment income Distributions to shareholders from net realized gain |
4. Purchases and Sales of Investments.
Purchases and sales of securities, other than short-term securities, aggregated $159,448,012 and $70,393,256, respectively.
5. Fees and Other Transactions with Affiliates.
Management Fee and Expense Contract. FMR Co., Inc. (the investment adviser), an affiliate of FMR, provides the Fund with investment management services. The Fund does not pay any fees for these services. Pursuant to the Fund's management contract with the investment adviser, FMR pays the investment adviser a portion of the management fees it receives from the Investing Funds. In addition, under an expense contract, FMR also pays all other expenses of the Fund, excluding custody fees, the compensation of the independent Directors, and certain miscellaneous expenses such as proxy and shareholder meeting expenses.
Interfund Trades. The Fund may purchase from or sell securities to other Fidelity Funds under procedures adopted by the Board. The procedures have been designed to ensure these interfund trades are executed in accordance with Rule 17a-7 of the 1940 Act. Interfund trades are included within the respective purchases and sales amounts shown in the Purchases and Sales of Investments note.
6. Expense Reductions.
Through arrangements with the Fund's custodian, credits realized as a result of certain uninvested cash balances were used to reduce the Fund's expenses. During the period, these credits reduced the Fund's custody expenses by $4,523.
7. Other.
The Fund's organizational documents provide former and current directors and officers with a limited indemnification against liabilities arising in connection with the performance of their duties to the Fund. In the normal course of business, the Fund may also enter into contracts that provide general indemnifications. The Fund's maximum exposure under these arrangements is unknown as this would be dependent on future claims that may be made against the Fund. The risk of material loss from such claims is considered remote.
At the end of the period, mutual funds managed by the investment adviser or its affiliates were the owners of record of all of the outstanding shares of the Fund.
8. Proposed Reorganization.
The Board of Trustees of the Fund approved an Agreement and Plan of Reorganization (the Agreement) between the Fund and Fidelity High Income Central Fund 2. The Agreement provides for the transfer of all the assets and the assumption of all the liabilities of the Fund in exchange for shares of Fidelity High Income Central Fund 2 equal in value to the net assets of the Fund on the day the reorganization is effective. The reorganization does not require shareholder approval and is expected to become effective in May 2019. The reorganization is expected to qualify as a tax-free transaction for federal income tax purposes with no gain or loss recognized by the funds or their shareholders.
Shareholder Expense Example
As a shareholder of the Fund, you incur two types of costs: (1) transaction costs and (2) ongoing costs, including other Fund expenses. This Example is intended to help you understand your ongoing costs (in dollars) of investing in the Fund and to compare these costs with the ongoing costs of investing in other mutual funds.
The Example is based on an investment of $1,000 invested at the beginning of the period and held for the entire period (October 1, 2018 to March 31, 2019).
Actual Expenses
The first line of the accompanying table provides information about actual account values and actual expenses. You may use the information in this line, together with the amount you invested, to estimate the expenses that you paid over the period. Simply divide your account value by $1,000.00 (for example, an $8,600 account value divided by $1,000.00 = 8.6), then multiply the result by the number in the first line under the heading entitled "Expenses Paid During Period" to estimate the expenses you paid on your account during this period. In addition, the Fund, as a shareholder in the underlying Fidelity Central Funds, will indirectly bear its pro-rata share of the fees and expenses incurred by the underlying Fidelity Central Funds. These fees and expenses are not included in the Fund's annualized expense ratio used to calculate the expense estimate in the table below.
Hypothetical Example for Comparison Purposes
The second line of the accompanying table provides information about hypothetical account values and hypothetical expenses based on the Fund's actual expense ratio and an assumed rate of return of 5% per year before expenses, which is not the Fund's actual return. The hypothetical account values and expenses may not be used to estimate the actual ending account balance or expenses you paid for the period. You may use this information to compare the ongoing costs of investing in the Fund and other funds. To do so, compare this 5% hypothetical example with the 5% hypothetical examples that appear in the shareholder reports of the other funds. In addition, the Fund, as a shareholder in the underlying Fidelity Central Funds, will indirectly bear its pro-rata share of the fees and expenses incurred by the underlying Fidelity Central Funds. These fees and expenses are not included in the Fund's annualized expense ratio used to calculate the expense estimate in the table below.
Please note that the expenses shown in the table are meant to highlight your ongoing costs only and do not reflect any transaction costs. Therefore, the second line of the table is useful in comparing ongoing costs only, and will not help you determine the relative total costs of owning different funds.
| Annualized Expense Ratio-A | Beginning Account Value October 1, 2018 | Ending Account Value March 31, 2019 | Expenses Paid During Period-B October 1, 2018 to March 31, 2019 |
|
| Actual | .0022% | $1,000.00 | $1,023.30 | $.01 |
| Hypothetical-C | $1,000.00 | $1,024.92 | $.01 |
A Annualized expense ratio reflects expenses net of applicable fee waivers.
B Expenses are equal to the Fund's annualized expense ratio, multiplied by the average account value over the period, multiplied by 182/365 (to reflect the one-half year period).
C 5% return per year before expenses
Board Approval of Investment Advisory Contracts and Management Fees
Fidelity High Income Central Fund 1
Each year, the Board of Directors, including the Independent Directors (together, the Board), votes on the renewal of the management contract with FMR Co., Inc. (FMRC) and the sub-advisory agreements (together, the Advisory Contracts) for the fund. FMRC and the sub-advisers are referred to herein as the Investment Advisers. The Board, assisted by the advice of fund counsel and Independent Directors' counsel, requests and considers a broad range of information relevant to the renewal of the Advisory Contracts throughout the year.
The Board meets regularly and, at each of its meetings, covers an extensive agenda of topics and materials and considers factors that are relevant to its annual consideration of the renewal of the fund's Advisory Contracts, including the services and support provided to the fund and its shareholders. The Board has established various standing committees (Committees), each composed of and chaired by Independent Directors with varying backgrounds, to which the Board has assigned specific subject matter responsibilities in order to enhance effective decision-making by the Board. The Board, acting directly and through its Committees, requests and receives information concerning the annual consideration of the renewal of the fund's Advisory Contracts. The Board also meets as needed to review matters specifically related to the Board's annual consideration of the renewal of the Advisory Contracts. Members of the Board may also meet with trustees of other Fidelity funds through joint ad hoc committees to discuss certain matters relevant to all of the Fidelity funds.
At its January 2019 meeting, the Board unanimously determined to renew the fund's Advisory Contracts. In reaching its determination, the Board considered all factors it believed relevant and reached a determination, with the assistance of fund counsel and Independent Directors' counsel and through the exercise of its business judgment, that the renewal of the Advisory Contracts was in the best interests of the fund and its shareholders and the fact that no fee is payable under the management contract was fair and reasonable.
Nature, Extent, and Quality of Services Provided. The Board considered Fidelity's staffing as it relates to the fund, including the backgrounds of investment personnel of Fidelity, and also considered the fund's investment objective, strategies, and related investment philosophy. The Independent Directors also had discussions with senior management of Fidelity's investment operations and investment groups. The Board considered the structure of the investment personnel compensation program and whether this structure provides appropriate incentives to act in the best interests of the fund. Resources Dedicated to Investment Management and Support Services. The Board and the Fund Oversight and Research Committees reviewed the general qualifications and capabilities of Fidelity's investment staff, including its size, education, experience, and resources, as well as Fidelity's approach to recruiting, training, managing, and compensating investment personnel. The Board noted that Fidelity has continued to increase the resources devoted to non-U.S. offices, including expansion of Fidelity's global investment organization. The Board also noted that Fidelity's analysts have extensive resources, tools and capabilities that allow them to conduct sophisticated quantitative and fundamental analysis, as well as credit analysis of issuers, counterparties and guarantors. Further, the Board considered that Fidelity's investment professionals have sufficient access to global information and data so as to provide competitive investment results over time, and that those professionals also have access to sophisticated tools that permit them to assess portfolio construction and risk and performance attribution characteristics continuously, as well as to transmit new information and research conclusions rapidly around the world. Additionally, in its deliberations, the Board considered Fidelity's trading, risk management, compliance, and technology and operations capabilities and resources, which are integral parts of the investment management process. Administrative Services. The Board considered (i) the nature, extent, quality, and cost of advisory and administrative services performed by the Investment Advisers and their affiliates under the Advisory Contracts and under separate agreements covering transfer agency, pricing and bookkeeping, and securities lending services for the fund; (ii) the nature and extent of the supervision of third party service providers, principally custodians, subcustodians, and pricing vendors; and (iii) the resources devoted to, and the record of compliance with, the fund's compliance policies and procedures. The Board also reviewed the allocation of fund brokerage, including allocations to brokers affiliated with the Investment Advisers, and the use of "soft" commission dollars to pay for research services. Investment Performance. The Board considered whether the fund has operated in accordance with its investment objective, as well as its record of compliance with its investment restrictions. The Board reviewed the fund's absolute investment performance, as well as the fund's relative investment performance, but did not consider performance to be a material factor in its decision to renew the fund's Advisory Contracts, as the fund is not publicly offered as a stand-alone investment product. In this regard, the Board noted that the fund is designed to offer a liquid investment option for other investment companies managed by Fidelity and ultimately to enhance the performance of those investment companies.Based on its review, the Board concluded that the nature, extent, and quality of services provided to the fund under the Advisory Contracts should continue to benefit the shareholders of the fund. Competitiveness of Management Fee and Total Expense Ratio. The Board considered that while the fund does not pay a management fee, Fidelity Management & Research Company (FMR) pays a management fee on behalf of the fund and receives fees for providing services to funds that invest in the fund. The Board also noted that FMR bears all expenses of the fund with certain exceptions. Based on its review, the Board concluded that the management fee paid on behalf of the fund and the fund's total expense ratio were reasonable in light of the services that the fund and its shareholders receive and the other factors considered. Costs of the Services and Profitability. The Board considered the level of Fidelity's profits in respect of all the Fidelity funds, as well as the profitability of the funds that invest in the fund.PricewaterhouseCoopers LLP (PwC), auditor to Fidelity and certain Fidelity funds, has been engaged annually by the Board as part of the Board's assessment of Fidelity's profitability analysis. PwC's engagement includes the review and assessment of the methodologies used by Fidelity in determining the revenues and expenses attributable to Fidelity's mutual fund business, and completion of agreed-upon procedures in respect of the mathematical accuracy of the fund profitability information and its conformity to established allocation methodologies. After considering PwC's reports issued under the engagement and information provided by Fidelity, the Board concluded that while other allocation methods may also be reasonable, Fidelity's profitability methodologies are reasonable in all material respects.The Board also reviewed Fidelity's non-fund businesses and potential indirect benefits such businesses may have received as a result of their association with Fidelity's mutual fund business (i.e., fall-out benefits) as well as cases where Fidelity's affiliates may benefit from the fund's business. The Board noted that changes to fall-out benefits year-over-year reflect business developments at Fidelity's various businesses.The Board concluded that the costs of the services provided by and the profits realized by Fidelity in connection with the operation of the fund were not relevant to the renewal of the Advisory Contracts because the fund pays no advisory fees and FMR bears all expenses of the fund with certain exceptions. Economies of Scale. The Board concluded that because the fund pays no advisory fees and FMR bears all expenses of the fund with certain exceptions, the realization of economies of scale was not a material factor in the Board's decision to renew the fund's Advisory Contract. Additional Information Requested by the Board. In order to develop fully the factual basis for consideration of the Fidelity funds' advisory contracts, the Board requested and received additional information on certain topics, including: (i) fund performance trends, in particular the underperformance of certain funds, and Fidelity's long-term strategies for certain funds; (ii) Fidelity's fund profitability methodology, profitability trends for certain funds, and the impact of certain factors on fund profitability results; (iii) metrics for evaluating index fund and ETF performance and information about ETF trading characteristics; (iv) the methodology with respect to the evaluation of competitive fund data and peer group classifications and fee comparisons; (v) the expense structures for different funds and classes; (vi) information regarding other accounts managed by Fidelity, including collective investment trusts; and (vii) Fidelity's philosophies and strategies for evaluating funds and classes with lower or declining asset levels.Based on its evaluation of all of the conclusions noted above, and after considering all factors it believed relevant, the Board concluded that the advisory fee arrangements are fair and reasonable, and that the fund's Advisory Contracts should be renewed.
![]()
HP1-SANN-0519
1.807410.114
|
Fidelity® International Equity Central Fund Semi-Annual Report March 31, 2019 |
|
|
Beginning on January 1, 2021, as permitted by regulations adopted by the Securities and Exchange Commission, paper copies of a fund’s shareholder reports will no longer be sent by mail, unless you specifically request paper copies of the reports from the fund or from your financial intermediary, such as a financial advisor, broker-dealer or bank. Instead, the reports will be made available on a website, and you will be notified by mail each time a report is posted and provided with a website link to access the report.
If you already elected to receive shareholder reports electronically, you will not be affected by this change and you need not take any action. You may elect to receive shareholder reports and other communications from a fund electronically, by contacting your financial intermediary. For Fidelity customers, visit Fidelity's web site or call Fidelity using the contact information listed below.
You may elect to receive all future reports in paper free of charge. If you wish to continue receiving paper copies of your shareholder reports, you may contact your financial intermediary or, if you are a Fidelity customer, visit Fidelity’s website, or call Fidelity at the applicable toll-free number listed below. Your election to receive reports in paper will apply to all funds held with the fund complex/your financial intermediary.
| Account Type | Website | Phone Number |
| Brokerage, Mutual Fund, or Annuity Contracts: | fidelity.com/mailpreferences | 1-800-343-3548 |
| Employer Provided Retirement Accounts: | netbenefits.fidelity.com/preferences (choose 'no' under Required Disclosures to continue to print) | 1-800-343-0860 |
| Advisor Sold Accounts Serviced Through Your Financial Intermediary: | Contact Your Financial Intermediary | Your Financial Intermediary's phone number |
| Advisor Sold Accounts Serviced by Fidelity: | institutional.fidelity.com | 1-877-208-0098 |
Contents
|
Board Approval of Investment Advisory Contracts and Management Fees |
To view a fund's proxy voting guidelines and proxy voting record for the 12-month period ended June 30, visit http://www.fidelity.com/proxyvotingresults or visit the Securities and Exchange Commission's (SEC) web site at http://www.sec.gov.
You may also call 1-800-544-8544 to request a free copy of the proxy voting guidelines.
Standard & Poor's, S&P and S&P 500 are registered service marks of The McGraw-Hill Companies, Inc. and have been licensed for use by Fidelity Distributors Corporation.
Other third-party marks appearing herein are the property of their respective owners.
All other marks appearing herein are registered or unregistered trademarks or service marks of FMR LLC or an affiliated company. © 2019 FMR LLC. All rights reserved.
A fund files its complete schedule of portfolio holdings with the SEC for the first and third quarters of each fiscal year on Form N-PORT. Forms N-PORT are available on the SEC’s web site at http://www.sec.gov. A fund's Forms N-PORT may be reviewed and copied at the SEC’s Public Reference Room in Washington, DC. Information regarding the operation of the SEC's Public Reference Room may be obtained by calling 1-800-SEC-0330.
Investment Summary (Unaudited)
Geographic Diversification (% of fund's net assets)
| As of March 31, 2019 | ||
| Japan | 20.1% | |
| United Kingdom | 14.2% | |
| France | 9.4% | |
| Germany | 8.4% | |
| Switzerland | 7.0% | |
| Canada | 6.2% | |
| United States of America* | 5.8% | |
| Netherlands | 5.6% | |
| Australia | 3.6% | |
| Other | 19.7% | |
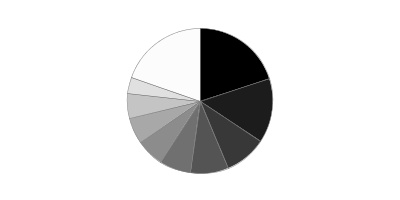
* Includes Short-Term investments and Net Other Assets (Liabilities).
Percentages are based on country or territory of incorporation and are adjusted for the effect of futures contracts, if applicable.
Asset Allocation as of March 31, 2019
| % of fund's net assets | |
| Stocks and Equity Futures | 96.8 |
| Short-Term Investments and Net Other Assets (Liabilities) | 3.2 |
Top Ten Stocks as of March 31, 2019
| % of fund's net assets | |
| Nestle SA (Reg. S) (Switzerland, Food Products) | 2.5 |
| Roche Holding AG (participation certificate) (Switzerland, Pharmaceuticals) | 2.3 |
| The Toronto-Dominion Bank (Canada, Banks) | 1.9 |
| AstraZeneca PLC (United Kingdom) (United Kingdom, Pharmaceuticals) | 1.6 |
| BP PLC (United Kingdom, Oil, Gas & Consumable Fuels) | 1.5 |
| Zurich Insurance Group Ltd. (Switzerland, Insurance) | 1.5 |
| Diageo PLC (United Kingdom, Beverages) | 1.3 |
| Sanofi SA (France, Pharmaceuticals) | 1.3 |
| KBC Groep NV (Belgium, Banks) | 1.2 |
| Glencore Xstrata PLC (Bailiwick of Jersey, Metals & Mining) | 1.2 |
| 16.3 |
Top Market Sectors as of March 31, 2019
| % of fund's net assets | |
| Financials | 19.8 |
| Industrials | 14.7 |
| Consumer Staples | 10.8 |
| Health Care | 11.0 |
| Consumer Discretionary | 9.7 |
| Energy | 7.2 |
| Materials | 6.9 |
| Information Technology | 5.1 |
| Communication Services | 4.6 |
| Real Estate | 3.4 |
Schedule of Investments March 31, 2019 (Unaudited)
Showing Percentage of Net Assets
| Common Stocks - 95.8% | |||
| Shares | Value | ||
| Australia - 3.6% | |||
| Abacus Property Group unit | 2,565,173 | $6,775,612 | |
| AGL Energy Ltd. | 434,197 | 6,711,725 | |
| Aub Group Ltd. | 549,247 | 5,105,006 | |
| Australia & New Zealand Banking Group Ltd. | 502,222 | 9,282,369 | |
| Coles Group Ltd. (a) | 826,245 | 6,952,102 | |
| Commonwealth Bank of Australia | 501,036 | 25,130,930 | |
| CSL Ltd. | 74,000 | 10,242,869 | |
| Inghams Group Ltd. (b) | 2,793,451 | 8,667,851 | |
| Woodside Petroleum Ltd. | 366,315 | 9,004,730 | |
| TOTAL AUSTRALIA | 87,873,194 | ||
| Austria - 1.2% | |||
| Erste Group Bank AG | 776,791 | 28,545,927 | |
| Bailiwick of Jersey - 2.3% | |||
| Experian PLC | 995,300 | 26,938,170 | |
| Glencore Xstrata PLC | 7,348,181 | 30,452,046 | |
| TOTAL BAILIWICK OF JERSEY | 57,390,216 | ||
| Belgium - 2.1% | |||
| KBC Groep NV | 442,885 | 30,941,093 | |
| Umicore SA | 488,564 | 21,697,168 | |
| TOTAL BELGIUM | 52,638,261 | ||
| Brazil - 0.1% | |||
| Notre Dame Intermedica Participacoes SA | 275,000 | 2,303,753 | |
| Canada - 6.2% | |||
| ATCO Ltd. Class I (non-vtg.) | 117,000 | 3,939,836 | |
| Barrick Gold Corp. (Canada) | 793,409 | 10,876,831 | |
| Canadian Natural Resources Ltd. | 394,900 | 10,842,130 | |
| Cenovus Energy, Inc. (Canada) | 1,190,800 | 10,336,574 | |
| Hydro One Ltd. (c) | 303,300 | 4,711,721 | |
| Intact Financial Corp. | 243,900 | 20,638,464 | |
| Lundin Mining Corp. | 3,431,100 | 15,918,599 | |
| Pembina Pipeline Corp. | 244,000 | 8,963,191 | |
| Suncor Energy, Inc. | 651,100 | 21,101,613 | |
| The Toronto-Dominion Bank | 856,900 | 46,501,581 | |
| TOTAL CANADA | 153,830,540 | ||
| Cayman Islands - 0.0% | |||
| CStone Pharmaceuticals Co. Ltd. (a)(c) | 400,000 | 809,177 | |
| China - 0.2% | |||
| PICC Property & Casualty Co. Ltd. (H Shares) | 5,079,000 | 5,771,334 | |
| Denmark - 1.0% | |||
| A.P. Moller - Maersk A/S Series B | 19,200 | 24,342,687 | |
| France - 9.4% | |||
| Amundi SA (c) | 233,700 | 14,706,782 | |
| Capgemini SA | 61,700 | 7,481,815 | |
| EDF SA | 490,100 | 6,701,692 | |
| ENGIE | 651,280 | 9,702,014 | |
| Ipsen SA | 67,000 | 9,184,216 | |
| LVMH Moet Hennessy - Louis Vuitton SA | 57,245 | 21,085,264 | |
| Maisons du Monde SA (c) | 408,600 | 7,892,736 | |
| Orange SA | 508,700 | 8,293,362 | |
| Pernod Ricard SA | 95,100 | 17,068,548 | |
| Sanofi SA | 350,255 | 30,971,004 | |
| SMCP S.A.S. (a)(c) | 402,800 | 7,003,534 | |
| SR Teleperformance SA | 93,300 | 16,766,416 | |
| Total SA | 534,903 | 29,766,988 | |
| Total SA rights (a)(b)(d) | 534,903 | 384,018 | |
| VINCI SA | 311,594 | 30,318,660 | |
| Vivendi SA | 446,840 | 12,949,455 | |
| TOTAL FRANCE | 230,276,504 | ||
| Germany - 7.6% | |||
| adidas AG | 31,800 | 7,726,479 | |
| BASF AG | 248,347 | 18,314,799 | |
| Bayer AG | 62,738 | 4,039,820 | |
| Daimler AG (Germany) | 347,900 | 20,390,919 | |
| Delivery Hero AG (a)(c) | 133,900 | 4,836,515 | |
| Deutsche Borse AG | 109,450 | 14,033,638 | |
| Deutsche Post AG | 764,631 | 24,883,348 | |
| Deutsche Telekom AG | 915,030 | 15,186,104 | |
| E.ON AG | 861,968 | 9,592,184 | |
| LEG Immobilien AG | 68,059 | 8,355,980 | |
| Linde PLC | 107,812 | 18,866,345 | |
| Morphosys AG sponsored ADR | 115,000 | 2,610,500 | |
| RWE AG | 236,830 | 6,349,371 | |
| SAP SE | 220,559 | 25,497,618 | |
| Uniper SE | 157,500 | 4,750,808 | |
| Wirecard AG (b) | 22,600 | 2,831,768 | |
| TOTAL GERMANY | 188,266,196 | ||
| Hong Kong - 2.0% | |||
| AIA Group Ltd. | 2,584,600 | 25,845,406 | |
| Dah Sing Banking Group Ltd. | 2,595,200 | 4,873,056 | |
| Dah Sing Financial Holdings Ltd. | 899,600 | 4,715,768 | |
| Hysan Development Co. Ltd. | 1,167,000 | 6,251,295 | |
| Sino Land Ltd. | 3,625,774 | 7,011,414 | |
| TOTAL HONG KONG | 48,696,939 | ||
| Hungary - 0.5% | |||
| OTP Bank PLC | 303,800 | 13,367,132 | |
| India - 0.6% | |||
| Axis Bank Ltd. (a) | 1,181,397 | 13,272,253 | |
| Embassy Office Parks (REIT) (a) | 465,200 | 2,017,200 | |
| TOTAL INDIA | 15,289,453 | ||
| Indonesia - 0.3% | |||
| PT Bank Danamon Indonesia Tbk Series A | 5,126,800 | 3,348,261 | |
| PT Bank Rakyat Indonesia Tbk | 15,355,500 | 4,458,629 | |
| TOTAL INDONESIA | 7,806,890 | ||
| Ireland - 2.2% | |||
| Greencore Group PLC | 1,314,176 | 3,457,530 | |
| Irish Residential Properties REIT PLC | 3,970,500 | 7,081,714 | |
| James Hardie Industries PLC CDI | 884,467 | 11,392,207 | |
| Kerry Group PLC Class A | 76,200 | 8,504,996 | |
| Ryanair Holdings PLC sponsored ADR (a) | 330,380 | 24,758,677 | |
| TOTAL IRELAND | 55,195,124 | ||
| Italy - 1.6% | |||
| Banca Generali SpA | 439,584 | 10,937,032 | |
| Davide Campari-Milano SpA | 1,321,300 | 12,968,972 | |
| Enel SpA | 2,271,736 | 14,556,849 | |
| TOTAL ITALY | 38,462,853 | ||
| Japan - 20.1% | |||
| A Dot Co. Ltd. (a) | 3,300 | 33,051 | |
| Advance Residence Investment Corp. | 2,891 | 8,047,221 | |
| AEON Financial Service Co. Ltd. | 317,100 | 6,446,145 | |
| Bandai Namco Holdings, Inc. | 271,800 | 12,727,980 | |
| Chugai Pharmaceutical Co. Ltd. | 163,300 | 11,247,944 | |
| Electric Power Development Co. Ltd. | 184,600 | 4,490,495 | |
| Fanuc Corp. | 154,900 | 26,490,018 | |
| Fast Retailing Co. Ltd. | 19,300 | 9,089,549 | |
| Hitachi High-Technologies Corp. | 125,800 | 5,147,550 | |
| Hoshizaki Corp. | 304,300 | 18,835,135 | |
| Hoya Corp. | 377,500 | 24,895,313 | |
| Isuzu Motors Ltd. | 727,600 | 9,586,037 | |
| JSR Corp. | 1,101,200 | 17,050,069 | |
| Kansai Electric Power Co., Inc. | 501,300 | 7,392,726 | |
| Kao Corp. | 196,200 | 15,485,410 | |
| Keyence Corp. | 26,450 | 16,459,952 | |
| Makita Corp. | 702,900 | 24,448,971 | |
| Minebea Mitsumi, Inc. | 669,200 | 10,101,226 | |
| Mitsubishi Estate Co. Ltd. | 606,500 | 11,004,896 | |
| Mitsubishi UFJ Financial Group, Inc. | 3,176,300 | 15,709,326 | |
| Money Forward, Inc. (a) | 191,900 | 8,008,098 | |
| Nidec Corp. | 52,800 | 6,681,584 | |
| Nintendo Co. Ltd. | 37,600 | 10,779,582 | |
| Nippon Telegraph & Telephone Corp. | 212,500 | 9,059,107 | |
| Nitori Holdings Co. Ltd. | 38,700 | 4,993,323 | |
| Oracle Corp. Japan | 61,100 | 4,096,120 | |
| ORIX Corp. | 919,400 | 13,185,837 | |
| Recruit Holdings Co. Ltd. | 956,500 | 27,423,299 | |
| Ryohin Keikaku Co. Ltd. | 19,400 | 4,908,202 | |
| Shimadzu Corp. | 192,400 | 5,555,175 | |
| SMC Corp. | 64,800 | 24,281,729 | |
| SoftBank Corp. | 230,090 | 22,428,417 | |
| Sony Corp. | 236,700 | 9,993,761 | |
| Sony Financial Holdings, Inc. | 226,100 | 4,266,932 | |
| Subaru Corp. | 287,400 | 6,562,114 | |
| Taiheiyo Cement Corp. | 180,200 | 6,018,487 | |
| Takeda Pharmaceutical Co. Ltd. | 221,795 | 9,083,003 | |
| Temp Holdings Co., Ltd. | 266,500 | 4,309,014 | |
| Terumo Corp. | 438,600 | 13,423,657 | |
| Tokio Marine Holdings, Inc. | 205,500 | 9,955,793 | |
| Toyota Motor Corp. | 390,500 | 23,004,667 | |
| Tsuruha Holdings, Inc. | 78,900 | 6,407,110 | |
| Welby, Inc. (a) | 400 | 18,767 | |
| Yahoo! Japan Corp. | 2,515,700 | 6,170,135 | |
| TOTAL JAPAN | 495,302,927 | ||
| Luxembourg - 0.8% | |||
| B&M European Value Retail SA | 2,885,976 | 14,043,024 | |
| Tenaris SA | 328,700 | 4,630,410 | |
| TOTAL LUXEMBOURG | 18,673,434 | ||
| Malta - 0.1% | |||
| Kambi Group PLC (a) | 184,400 | 3,149,594 | |
| Multi-National - 0.4% | |||
| HKT Trust/HKT Ltd. unit | 6,053,000 | 9,731,127 | |
| Netherlands - 5.6% | |||
| AerCap Holdings NV (a) | 74,068 | 3,447,125 | |
| ASML Holding NV (Netherlands) | 104,578 | 19,655,406 | |
| Basic-Fit NV (a)(c) | 332,900 | 11,202,917 | |
| Ferrari NV | 108,200 | 14,504,115 | |
| Heineken NV (Bearer) | 133,300 | 14,067,714 | |
| Koninklijke Philips Electronics NV | 350,585 | 14,324,053 | |
| NIBC Holding NV (c) | 1,137,836 | 10,420,265 | |
| NXP Semiconductors NV | 111,700 | 9,873,163 | |
| Takeaway.com Holding BV (a)(c) | 90,400 | 6,865,200 | |
| Unilever NV: | |||
| (Certificaten Van Aandelen) (Bearer) | 432,725 | 25,228,482 | |
| (NY Reg.) | 143,400 | 8,358,786 | |
| TOTAL NETHERLANDS | 137,947,226 | ||
| Norway - 0.5% | |||
| Aker Bp ASA | 134,400 | 4,783,889 | |
| Schibsted ASA (B Shares) | 187,100 | 6,703,100 | |
| TOTAL NORWAY | 11,486,989 | ||
| Portugal - 0.2% | |||
| Galp Energia SGPS SA Class B | 298,224 | 4,777,128 | |
| Singapore - 1.2% | |||
| Parkway Life REIT | 4,815,800 | 10,376,046 | |
| United Overseas Bank Ltd. | 657,013 | 12,211,885 | |
| UOL Group Ltd. | 1,227,000 | 6,292,308 | |
| TOTAL SINGAPORE | 28,880,239 | ||
| Spain - 1.4% | |||
| CaixaBank SA | 6,164,574 | 19,277,741 | |
| Cellnex Telecom SA (c) | 305,668 | 8,969,821 | |
| Masmovil Ibercom SA (a) | 275,670 | 5,825,946 | |
| Melia Hotels International SA | 113,593 | 1,054,425 | |
| TOTAL SPAIN | 35,127,933 | ||
| Sweden - 1.0% | |||
| D. Carnegie & Co. AB (a) | 398,300 | 7,711,271 | |
| Lundin Petroleum AB | 143,373 | 4,854,508 | |
| Telefonaktiebolaget LM Ericsson (B Shares) | 1,252,839 | 11,510,601 | |
| TOTAL SWEDEN | 24,076,380 | ||
| Switzerland - 7.0% | |||
| Lonza Group AG | 31,000 | 9,613,658 | |
| Nestle SA (Reg. S) | 629,188 | 59,993,338 | |
| Roche Holding AG (participation certificate) | 207,950 | 57,301,637 | |
| Sonova Holding AG Class B | 35,000 | 6,924,429 | |
| Zurich Insurance Group Ltd. | 113,046 | 37,418,992 | |
| TOTAL SWITZERLAND | 171,252,054 | ||
| United Kingdom - 14.2% | |||
| AstraZeneca PLC (United Kingdom) | 486,600 | 38,841,116 | |
| Beazley PLC | 1,615,700 | 10,837,498 | |
| BP PLC | 5,249,156 | 38,116,628 | |
| British American Tobacco PLC (United Kingdom) | 284,181 | 11,855,416 | |
| Bunzl PLC | 753,714 | 24,856,006 | |
| Centrica PLC | 3,859,200 | 5,748,656 | |
| Cranswick PLC | 103,800 | 3,679,989 | |
| Dechra Pharmaceuticals PLC | 175,000 | 6,149,518 | |
| Diageo PLC | 767,157 | 31,393,645 | |
| Great Portland Estates PLC | 351,840 | 3,420,866 | |
| Hotel Chocolat Group Ltd. (b) | 1,096,800 | 4,785,566 | |
| HSBC Holdings PLC (United Kingdom) | 1,150,100 | 9,345,549 | |
| John David Group PLC | 1,686,900 | 11,042,639 | |
| Melrose Industries PLC | 23,920 | 57,060 | |
| Micro Focus International PLC | 338,430 | 8,798,985 | |
| Moneysupermarket.com Group PLC | 1,437,200 | 6,965,270 | |
| Prudential PLC | 1,507,243 | 30,182,796 | |
| Rolls-Royce Holdings PLC | 1,485,275 | 17,491,490 | |
| Rotork PLC | 6,568,700 | 24,194,681 | |
| Royal Dutch Shell PLC: | |||
| Class A (United Kingdom) | 489,823 | 15,393,142 | |
| Class B (United Kingdom) | 330,623 | 10,449,534 | |
| Smith & Nephew PLC | 444,000 | 8,817,421 | |
| Standard Chartered PLC (United Kingdom) | 2,051,835 | 15,801,975 | |
| Standard Life PLC | 3,550,524 | 12,206,051 | |
| TOTAL UNITED KINGDOM | 350,431,497 | ||
| United States of America - 2.4% | |||
| Altria Group, Inc. | 168,900 | 9,699,927 | |
| Boston Beer Co., Inc. Class A (a) | 13,100 | 3,860,963 | |
| Constellation Brands, Inc. Class A (sub. vtg.) | 30,400 | 5,330,032 | |
| International Flavors & Fragrances, Inc. (b) | 175,900 | 22,654,161 | |
| Kosmos Energy Ltd. | 595,427 | 3,709,510 | |
| Philip Morris International, Inc. | 94,600 | 8,361,694 | |
| QIAGEN NV (a) | 102,000 | 4,149,360 | |
| TOTAL UNITED STATES OF AMERICA | 57,765,647 | ||
| TOTAL COMMON STOCKS | |||
| (Cost $2,152,524,309) | 2,359,468,355 | ||
| Nonconvertible Preferred Stocks - 0.8% | |||
| Germany - 0.8% | |||
| Porsche Automobil Holding SE (Germany) | |||
| (Cost $16,632,132) | 305,400 | 19,164,599 | |
| Principal Amount | Value | ||
| Government Obligations - 0.0% | |||
| United States of America - 0.0% | |||
| U.S. Treasury Bills, yield at date of purchase 2.38% to 2.41% 4/4/19 to 6/27/19(e) | |||
| (Cost $408,798) | 410,000 | 408,813 | |
| Shares | Value | ||
| Money Market Funds - 3.7% | |||
| Fidelity Cash Central Fund, 2.48% (f) | 60,535,298 | 60,547,405 | |
| Fidelity Securities Lending Cash Central Fund 2.48% (f)(g) | 30,721,033 | 30,724,105 | |
| TOTAL MONEY MARKET FUNDS | |||
| (Cost $91,271,115) | 91,271,510 | ||
| TOTAL INVESTMENT IN SECURITIES - 100.3% | |||
| (Cost $2,260,836,354) | 2,470,313,277 | ||
| NET OTHER ASSETS (LIABILITIES) - (0.3)% | (6,733,248) | ||
| NET ASSETS - 100% | $2,463,580,029 |
| Futures Contracts | |||||
| Number of contracts | Expiration Date | Notional Amount | Value | Unrealized Appreciation/(Depreciation) | |
| Purchased | |||||
| Equity Index Contracts | |||||
| ICE E-mini MSCI EAFE Index Contracts (United States) | 55 | June 2019 | $5,132,600 | $111,528 | $111,528 |
| TME S&P/TSX 60 Index Contracts (Canada) | 3 | June 2019 | 429,723 | 3,991 | 3,991 |
| TOTAL FUTURES CONTRACTS | $115,519 |
The notional amount of futures purchased as a percentage of Net Assets is 0.2%
Categorizations in the Schedule of Investments are based on country or territory of incorporation.
Legend
(a) Non-income producing
(b) Security or a portion of the security is on loan at period end.
(c) Security exempt from registration under Rule 144A of the Securities Act of 1933. These securities may be resold in transactions exempt from registration, normally to qualified institutional buyers. At the end of the period, the value of these securities amounted to $77,418,668 or 3.1% of net assets.
(d) Security or a portion of the security purchased on a delayed delivery or when-issued basis.
(e) Security or a portion of the security was pledged to cover margin requirements for futures contracts. At period end, the value of securities pledged amounted to $408,813.
(f) Affiliated fund that is generally available only to investment companies and other accounts managed by Fidelity Investments. The rate quoted is the annualized seven-day yield of the fund at period end. A complete unaudited listing of the fund's holdings as of its most recent quarter end is available upon request. In addition, each Fidelity Central Fund's financial statements are available on the SEC's website or upon request.
(g) Investment made with cash collateral received from securities on loan.
Affiliated Central Funds
Information regarding fiscal year to date income earned by the Fund from investments in Fidelity Central Funds is as follows:
| Fund | Income earned |
| Fidelity Cash Central Fund | $640,090 |
| Fidelity Securities Lending Cash Central Fund | 227,774 |
| Total | $867,864 |
Amounts in the income column in the above table include any capital gain distributions from underlying funds, which are presented in the corresponding line-item in the Statement of Operations, if applicable.
Investment Valuation
The following is a summary of the inputs used, as of March 31, 2019, involving the Fund's assets and liabilities carried at fair value. The inputs or methodology used for valuing securities may not be an indication of the risk associated with investing in those securities. For more information on valuation inputs, and their aggregation into the levels used below, please refer to the Investment Valuation section in the accompanying Notes to Financial Statements.
| Valuation Inputs at Reporting Date: | ||||
| Description | Total | Level 1 | Level 2 | Level 3 |
| Investments in Securities: | ||||
| Equities: | ||||
| Communication Services | $116,129,207 | $46,416,098 | $69,713,109 | $-- |
| Consumer Discretionary | 237,792,863 | 139,306,872 | 98,485,991 | -- |
| Consumer Staples | 266,128,071 | 122,171,780 | 143,956,291 | -- |
| Energy | 177,113,993 | 78,757,291 | 98,356,702 | -- |
| Financials | 493,492,254 | 390,599,240 | 102,893,014 | -- |
| Health Care | 264,932,448 | 76,882,793 | 188,049,655 | -- |
| Industrials | 360,625,296 | 172,636,398 | 187,988,898 | -- |
| Information Technology | 124,935,018 | 70,964,242 | 53,970,776 | -- |
| Materials | 173,240,712 | 118,455,380 | 54,785,332 | -- |
| Real Estate | 84,345,823 | 71,323,727 | 13,022,096 | -- |
| Utilities | 79,897,269 | 42,606,854 | 37,290,415 | -- |
| Government Obligations | 408,813 | -- | 408,813 | -- |
| Money Market Funds | 91,271,510 | 91,271,510 | -- | -- |
| Total Investments in Securities: | $2,470,313,277 | $1,421,392,185 | $1,048,921,092 | $-- |
| Derivative Instruments: | ||||
| Assets | ||||
| Futures Contracts | $115,519 | $115,519 | $-- | $-- |
| Total Assets | $115,519 | $115,519 | $-- | $-- |
| Total Derivative Instruments: | $115,519 | $115,519 | $-- | $-- |
Value of Derivative Instruments
The following table is a summary of the Fund's value of derivative instruments by primary risk exposure as of March 31, 2019. For additional information on derivative instruments, please refer to the Derivative Instruments section in the accompanying Notes to Financial Statements.
| Primary Risk Exposure / Derivative Type | Value | |
| Asset | Liability | |
| Equity Risk | ||
| Futures Contracts(a) | $115,519 | $0 |
| Total Equity Risk | 115,519 | 0 |
| Total Value of Derivatives | $115,519 | $0 |
(a) Reflects gross cumulative appreciation (depreciation) on futures contracts as presented in the Schedule of Investments. In the Statement of Assets and Liabilities, the period end daily variation margin is included in receivable or payable for daily variation margin on futures contracts, and the net cumulative appreciation (depreciation) is included in distributable earnings.
See accompanying notes which are an integral part of the financial statements.
Financial Statements
Statement of Assets and Liabilities
| March 31, 2019 (Unaudited) | ||
| Assets | ||
| Investment in securities, at value (including securities loaned of $29,436,334) — See accompanying schedule: Unaffiliated issuers (cost $2,169,565,239) | $2,379,041,767 | |
| Fidelity Central Funds (cost $91,271,115) | 91,271,510 | |
| Total Investment in Securities (cost $2,260,836,354) | $2,470,313,277 | |
| Foreign currency held at value (cost $508) | 500 | |
| Receivable for investments sold | 22,203,924 | |
| Receivable for fund shares sold | 879,423 | |
| Dividends receivable | 17,086,637 | |
| Distributions receivable from Fidelity Central Funds | 176,118 | |
| Receivable for daily variation margin on futures contracts | 23,086 | |
| Other receivables | 41,175 | |
| Total assets | 2,510,724,140 | |
| Liabilities | ||
| Payable to custodian bank | $2,797,835 | |
| Payable for investments purchased | ||
| Regular delivery | 11,238,482 | |
| Delayed delivery | 384,018 | |
| Payable for fund shares redeemed | 1,522,258 | |
| Other payables and accrued expenses | 477,413 | |
| Collateral on securities loaned | 30,724,105 | |
| Total liabilities | 47,144,111 | |
| Net Assets | $2,463,580,029 | |
| Net Assets consist of: | ||
| Paid in capital | $2,314,685,256 | |
| Total distributable earnings (loss) | 148,894,773 | |
| Net Assets, for 32,444,828 shares outstanding | $2,463,580,029 | |
| Net Asset Value, offering price and redemption price per share ($2,463,580,029 ÷ 32,444,828 shares) | $75.93 |
See accompanying notes which are an integral part of the financial statements.
Statement of Operations
| Six months ended March 31, 2019 (Unaudited) | ||
| Investment Income | ||
| Dividends | $27,748,760 | |
| Interest | 5,992 | |
| Income from Fidelity Central Funds | 867,864 | |
| Income before foreign taxes withheld | 28,622,616 | |
| Less foreign taxes withheld | (2,517,030) | |
| Total income | 26,105,586 | |
| Expenses | ||
| Custodian fees and expenses | $140,385 | |
| Independent directors' fees and expenses | 7,268 | |
| Interest | 22,792 | |
| Total expenses | 170,445 | |
| Net investment income (loss) | 25,935,141 | |
| Realized and Unrealized Gain (Loss) | ||
| Net realized gain (loss) on: | ||
| Investment securities: | ||
| Unaffiliated issuers (net of foreign taxes of $6,360) | (65,137,708) | |
| Fidelity Central Funds | (1,211) | |
| Foreign currency transactions | (64,857) | |
| Futures contracts | 356,975 | |
| Total net realized gain (loss) | (64,846,801) | |
| Change in net unrealized appreciation (depreciation) on: | ||
| Investment securities: | ||
| Unaffiliated issuers (net of increase in deferred foreign taxes of $368,358) | (87,081,610) | |
| Fidelity Central Funds | 214 | |
| Assets and liabilities in foreign currencies | (142,659) | |
| Futures contracts | 26,114 | |
| Total change in net unrealized appreciation (depreciation) | (87,197,941) | |
| Net gain (loss) | (152,044,742) | |
| Net increase (decrease) in net assets resulting from operations | $(126,109,601) |
See accompanying notes which are an integral part of the financial statements.
Statement of Changes in Net Assets
| Six months ended March 31, 2019 (Unaudited) | Year ended September 30, 2018 | |
| Increase (Decrease) in Net Assets | ||
| Operations | ||
| Net investment income (loss) | $25,935,141 | $76,845,009 |
| Net realized gain (loss) | (64,846,801) | 162,484,178 |
| Change in net unrealized appreciation (depreciation) | (87,197,941) | (160,419,767) |
| Net increase (decrease) in net assets resulting from operations | (126,109,601) | 78,909,420 |
| Distributions to shareholders | (129,850,863) | – |
| Distributions to shareholders from net investment income | – | (77,089,559) |
| Distributions to shareholders from net realized gain | – | (90,648,501) |
| Total distributions | (129,850,863) | (167,738,060) |
| Affiliated share transactions | ||
| Proceeds from sales of shares | 75,871,852 | 371,362,580 |
| Reinvestment of distributions | 129,850,863 | 167,738,059 |
| Cost of shares redeemed | (131,243,426) | (899,594,488) |
| Net increase (decrease) in net assets resulting from share transactions | 74,479,289 | (360,493,849) |
| Total increase (decrease) in net assets | (181,481,175) | (449,322,489) |
| Net Assets | ||
| Beginning of period | 2,645,061,204 | 3,094,383,693 |
| End of period | $2,463,580,029 | $2,645,061,204 |
| Other Information | ||
| Undistributed net investment income end of period | $3,625,716 | |
| Shares | ||
| Sold | 1,037,658 | 4,209,064 |
| Issued in reinvestment of distributions | 1,880,560 | 1,939,830 |
| Redeemed | (1,757,348) | (10,247,744) |
| Net increase (decrease) | 1,160,870 | (4,098,850) |
See accompanying notes which are an integral part of the financial statements.
Financial Highlights
Fidelity International Equity Central Fund
| Six months ended (Unaudited) March 31, | Years endedSeptember 30, | |||||
| 2019 | 2018 | 2017 | 2016 | 2015 | 2014 | |
| Selected Per–Share Data | ||||||
| Net asset value, beginning of period | $84.55 | $87.45 | $74.96 | $71.96 | $79.13 | $78.06 |
| Income from Investment Operations | ||||||
| Net investment income (loss)A | .81 | 2.30 | 2.18 | 2.09 | 2.13 | 2.74B |
| Net realized and unrealized gain (loss) | (5.23) | (.27)C | 12.27 | 2.87 | (7.28) | .64 |
| Total from investment operations | (4.42) | 2.03 | 14.45 | 4.96 | (5.15) | 3.38 |
| Distributions from net investment income | (.56) | (2.34) | (1.92) | (1.96) | (2.02) | (2.31) |
| Distributions from net realized gain | (3.65) | (2.60) | (.03) | – | – | – |
| Total distributions | (4.20)D | (4.93)E | (1.96)F | (1.96) | (2.02) | (2.31) |
| Net asset value, end of period | $75.93 | $84.55 | $87.45 | $74.96 | $71.96 | $79.13 |
| Total ReturnG,H | (4.71)% | 2.30% | 19.54% | 6.95% | (6.78)% | 4.24% |
| Ratios to Average Net AssetsI,J | ||||||
| Expenses before reductions | .01%K | .01% | .01% | .01% | .01% | .01% |
| Expenses net of fee waivers, if any | .01%K | .01% | .01% | .01% | .01% | .01% |
| Expenses net of all reductions | .01%K | .01% | .01% | .01% | .01% | .01% |
| Net investment income (loss) | 2.17%K | 2.63% | 2.74% | 2.87% | 2.67% | 3.34%B |
| Supplemental Data | ||||||
| Net assets, end of period (000 omitted) | $2,463,580 | $2,645,061 | $3,094,384 | $2,138,296 | $2,104,932 | $2,841,400 |
| Portfolio turnover rateL | 87%K | 53% | 61% | 59% | 81% | 67% |
A Calculated based on average shares outstanding during the period.
B Net investment income per share reflects a large, non-recurring dividend which amounted to $.69 per share. Excluding this non-recurring dividend, the ratio of net investment income (loss) to average net assets would have been 2.50%.
C The amount shown for a share outstanding does not correspond with the aggregate net gain (loss) on investments for the period due to the timing of sales and repurchases of shares in relation to fluctuating market values of the investments of the Fund.
D Total distributions of $4.20 per share is comprised of distributions from net investment income of $.555 and distributions from net realized gain of $3.649 per share.
E Total distributions of $4.93 per share is comprised of distributions from net investment income of $2.338 and distributions from net realized gain of $2.595 per share.
F Total distributions of $1.96 per share is comprised of distributions from net investment income of $1.921 and distributions from net realized gain of $.034 per share.
G Total returns for periods of less than one year are not annualized.
H Total returns would have been lower if certain expenses had not been reduced during the applicable periods shown.
I Fees and expenses of any underlying Fidelity Central Funds are not included in the Fund's expense ratio. The Fund indirectly bears its proportionate share of the expenses of any underlying Fidelity Central Funds.
J Expense ratios reflect operating expenses of the Fund. Expenses before reductions do not reflect amounts reimbursed by the investment adviser or reductions from expense offset arrangements and do not represent the amount paid by the Fund during periods when reimbursements or reductions occur. Expenses net of fee waivers reflect expenses after reimbursement by the investment adviser but prior to reductions from expense offset arrangements. Expenses net of all reductions represent the net expenses paid by the Fund.
K Annualized
L Amount does not include the portfolio activity of any underlying Fidelity Central Funds.
See accompanying notes which are an integral part of the financial statements.
Notes to Financial Statements (Unaudited)
For the period ended March 31, 2019
1. Organization.
Fidelity International Equity Central Fund (the Fund) is a fund of Fidelity Central Investment Portfolios LLC (the LLC) and is authorized to issue an unlimited number of shares. Shares of the Fund are only offered to other investment companies and accounts managed by Fidelity Management & Research Company (FMR), or its affiliates (the Investing Funds). The LLC is registered under the Investment Company Act of 1940, as amended (the 1940 Act), as an open-end management investment company organized as a Delaware Limited Liability Company.
2. Investments in Fidelity Central Funds.
The Fund invests in Fidelity Central Funds, which are open-end investment companies generally available only to other investment companies and accounts managed by the investment adviser and its affiliates. The Fund's Schedule of Investments lists each of the Fidelity Central Funds held as of period end, if any, as an investment of the Fund, but does not include the underlying holdings of each Fidelity Central Fund. As an Investing Fund, the Fund indirectly bears its proportionate share of the expenses of the underlying Fidelity Central Funds.
The Money Market Central Funds seek preservation of capital and current income and are managed by Fidelity Investments Money Management, Inc. (FIMM), an affiliate of the investment adviser. Annualized expenses of the Money Market Central Funds as of their most recent shareholder report date are less than .005%.
A complete unaudited list of holdings for each Fidelity Central Fund is available upon request or at the Securities and Exchange Commission (the SEC) website at www.sec.gov. In addition, the financial statements of the Fidelity Central Funds are available on the SEC website or upon request.
3. Significant Accounting Policies.
The Fund is an investment company and applies the accounting and reporting guidance of the Financial Accounting Standards Board (FASB) Accounting Standards Codification Topic 946 Financial Services – Investments Companies. The financial statements have been prepared in conformity with accounting principles generally accepted in the United States of America (GAAP), which require management to make certain estimates and assumptions at the date of the financial statements. Actual results could differ from those estimates. Subsequent events, if any, through the date that the financial statements were issued have been evaluated in the preparation of the financial statements. The following summarizes the significant accounting policies of the Fund:
Investment Valuation. Investments are valued as of 4:00 p.m. Eastern time on the last calendar day of the period. The Board of Directors (the Board) has delegated the day to day responsibility for the valuation of the Fund's investments to the Fair Value Committee (the Committee) established by the Fund's investment adviser. In accordance with valuation policies and procedures approved by the Board, the Fund attempts to obtain prices from one or more third party pricing vendors or brokers to value its investments. When current market prices, quotations or currency exchange rates are not readily available or reliable, investments will be fair valued in good faith by the Committee, in accordance with procedures adopted by the Board. Factors used in determining fair value vary by investment type and may include market or investment specific events, changes in interest rates and credit quality. The frequency with which these procedures are used cannot be predicted and they may be utilized to a significant extent. The Committee oversees the Fund's valuation policies and procedures and reports to the Board on the Committee's activities and fair value determinations. The Board monitors the appropriateness of the procedures used in valuing the Fund's investments and ratifies the fair value determinations of the Committee.
The Fund categorizes the inputs to valuation techniques used to value its investments into a disclosure hierarchy consisting of three levels as shown below:
- Level 1 – quoted prices in active markets for identical investments
- Level 2 – other significant observable inputs (including quoted prices for similar investments, interest rates, prepayment speeds, etc.)
- Level 3 – unobservable inputs (including the Fund's own assumptions based on the best information available)
Valuation techniques used to value the Fund's investments by major category are as follows:
Equity securities, including restricted securities, for which market quotations are readily available, are valued at the last reported sale price or official closing price as reported by a third party pricing vendor on the primary market or exchange on which they are traded and are categorized as Level 1 in the hierarchy. In the event there were no sales during the day or closing prices are not available, securities are valued at the last quoted bid price or may be valued using the last available price and are generally categorized as Level 2 in the hierarchy. For foreign equity securities, when market or security specific events arise, comparisons to the valuation of American Depositary Receipts (ADRs), futures contracts, Exchange-Traded Funds (ETFs) and certain indexes as well as quoted prices for similar securities may be used and would be categorized as Level 2 in the hierarchy. For equity securities, including restricted securities, where observable inputs are limited, assumptions about market activity and risk are used and these securities may be categorized as Level 3 in the hierarchy.
Debt securities, including restricted securities, are valued based on evaluated prices received from third party pricing vendors or from brokers who make markets in such securities. U.S. government and government agency obligations are valued by pricing vendors who utilize matrix pricing which considers yield or price of bonds of comparable quality, coupon, maturity and type or by broker-supplied prices. When independent prices are unavailable or unreliable, debt securities may be valued utilizing pricing methodologies which consider similar factors that would be used by third party pricing vendors. Debt securities are generally categorized as Level 2 in the hierarchy but may be Level 3 depending on the circumstances.
Futures contracts are valued at the settlement price established each day by the board of trade or exchange on which they are traded and are categorized as Level 1 in the hierarchy. Investments in open-end mutual funds, including the Fidelity Central Funds, are valued at their closing net asset value (NAV) each business day and are categorized as Level 1 in the hierarchy.
Changes in valuation techniques may result in transfers in or out of an assigned level within the disclosure hierarchy. The aggregate value of investments by input level as of March 31, 2019 is included at the end of the Fund's Schedule of Investments.
Foreign Currency. The Fund may use foreign currency contracts to facilitate transactions in foreign-denominated securities. Gains and losses from these transactions may arise from changes in the value of the foreign currency or if the counterparties do not perform under the contracts' terms.
Foreign-denominated assets, including investment securities, and liabilities are translated into U.S. dollars at the exchange rates at period end. Purchases and sales of investment securities, income and dividends received and expenses denominated in foreign currencies are translated into U.S. dollars at the exchange rate in effect on the transaction date.
The effects of exchange rate fluctuations on investments are included with the net realized and unrealized gain (loss) on investment securities. Other foreign currency transactions resulting in realized and unrealized gain (loss) are disclosed separately.
Investment Transactions and Income. For financial reporting purposes, the Fund's investment holdings and NAV include trades executed through the end of the last business day of the period. The NAV per share for processing shareholder transactions is calculated as of the close of business of the New York Stock Exchange (NYSE), normally 4:00 p.m. Eastern time and includes trades executed through the end of the prior business day. Gains and losses on securities sold are determined on the basis of identified cost and include proceeds received from litigation. Dividend income is recorded on the ex-dividend date, except for certain dividends from foreign securities where the ex-dividend date may have passed, which are recorded as soon as the Fund is informed of the ex-dividend date. Non-cash dividends included in dividend income, if any, are recorded at the fair market value of the securities received. Income and capital gain distributions from Fidelity Central Funds, if any, are recorded on the ex-dividend date. Certain distributions received by the Fund represent a return of capital or capital gain. The Fund determines the components of these distributions subsequent to the ex-dividend date, based upon receipt of tax filings or other correspondence relating to the underlying investment. These distributions are recorded as a reduction of cost of investments and/or as a realized gain. Interest income is accrued as earned and includes coupon interest and amortization of premium and accretion of discount on debt securities as applicable. Investment income is recorded net of foreign taxes withheld where recovery of such taxes is uncertain.
Expenses. Expenses directly attributable to a fund are charged to that fund. Expenses attributable to more than one fund are allocated among the respective funds on the basis of relative net assets or other appropriate methods. Expense estimates are accrued in the period to which they relate and adjustments are made when actual amounts are known.
Income Tax Information and Distributions to Shareholders. Each year, the Fund intends to qualify as a regulated investment company under Subchapter M of the Internal Revenue Code, including distributing substantially all of its taxable income and realized gains. As a result, no provision for U.S. Federal income taxes is required. The Fund files a U.S. federal tax return, in addition to state and local tax returns as required. The Fund's federal income tax returns are subject to examination by the Internal Revenue Service (IRS) for a period of three fiscal years after they are filed. State and local tax returns may be subject to examination for an additional fiscal year depending on the jurisdiction. Foreign taxes are provided for based on the Fund's understanding of the tax rules and rates that exist in the foreign markets in which it invests. The Fund is subject to a tax imposed on capital gains by certain countries in which it invests. An estimated deferred tax liability for net unrealized appreciation on the applicable securities is included in Other payables and accrued expenses on the Statement of Assets & Liabilities.
Distributions are declared and recorded on the ex-dividend date. Income and capital gain distributions are determined in accordance with income tax regulations, which may differ from GAAP.
Capital accounts within the financial statements are adjusted for permanent book-tax differences. These adjustments have no impact on net assets or the results of operations. Capital accounts are not adjusted for temporary book-tax differences which will reverse in a subsequent period.
Book-tax differences are primarily due to futures contracts, foreign currency transactions, passive foreign investment companies (PFIC), partnership and losses deferred due to wash sales.
As of period end, the cost and unrealized appreciation (depreciation) in securities, and derivatives if applicable, for federal income tax purposes were as follows:
| Gross unrealized appreciation | $310,554,551 |
| Gross unrealized depreciation | (109,808,126) |
| Net unrealized appreciation (depreciation) | $200,746,425 |
| Tax cost | $2,269,682,371 |
Delayed Delivery Transactions and When-Issued Securities. During the period, the Fund transacted in securities on a delayed delivery or when-issued basis. Payment and delivery may take place after the customary settlement period for that security. The price of the underlying securities and the date when the securities will be delivered and paid for are fixed at the time the transaction is negotiated. The securities purchased on a delayed delivery or when-issued basis are identified as such in the Fund's Schedule of Investments. Losses may arise due to changes in the value of the underlying securities or if the counterparty does not perform under the contract's terms, or if the issuer does not issue the securities due to political, economic, or other factors.
Restricted Securities. The Fund may invest in securities that are subject to legal or contractual restrictions on resale. These securities generally may be resold in transactions exempt from registration or to the public if the securities are registered. Disposal of these securities may involve time-consuming negotiations and expense, and prompt sale at an acceptable price may be difficult. Information regarding restricted securities is included at the end of the Fund's Schedule of Investments.
New Rule Issuance. During August 2018, the U.S. Securities and Exchange Commission issued Final Rule Release No. 33-10532, Disclosure Update and Simplification. This Final Rule includes amendments specific to registered investment companies that are intended to eliminate overlap in disclosure requirements between Regulation S-X and GAAP. In accordance with these amendments, certain line-items in the Fund's financial statements have been combined or removed for the current period as outlined in the table below.
| Financial Statement | Current Line-Item Presentation (As Applicable) | Prior Line-Item Presentation (As Applicable) |
| Statement of Assets and Liabilities | Total distributable earnings (loss) | Undistributed/Distributions in excess of/Accumulated net investment income (loss) Accumulated/Undistributed net realized gain (loss) Net unrealized appreciation (depreciation) |
| Statement of Changes in Net Assets | N/A - removed | Undistributed/Distributions in excess of/Accumulated net investment income (loss) end of period |
| Statement of Changes in Net Assets | Distributions to shareholders | Distributions to shareholders from net investment income Distributions to shareholders from net realized gain |
4. Derivative Instruments.
Risk Exposures and the Use of Derivative Instruments. The Fund's investment objective allows the Fund to enter into various types of derivative contracts, including futures contracts. Derivatives are investments whose value is primarily derived from underlying assets, indices or reference rates and may be transacted on an exchange or over-the-counter (OTC). Derivatives may involve a future commitment to buy or sell a specified asset based on specified terms, to exchange future cash flows at periodic intervals based on a notional principal amount, or for one party to make one or more payments upon the occurrence of specified events in exchange for periodic payments from the other party.
The Fund used derivatives to increase returns and to manage exposure to certain risks as defined below. The success of any strategy involving derivatives depends on analysis of numerous economic factors, and if the strategies for investment do not work as intended, the Fund may not achieve its objectives.
The Fund's use of derivatives increased or decreased its exposure to the following risk:
| Equity Risk | Equity risk relates to the fluctuations in the value of financial instruments as a result of changes in market prices (other than those arising from interest rate risk or foreign exchange risk), whether caused by factors specific to an individual investment, its issuer, or all factors affecting all instruments traded in a market or market segment. |
The Fund is also exposed to additional risks from investing in derivatives, such as liquidity risk and counterparty credit risk. Liquidity risk is the risk that the Fund will be unable to close out the derivative in the open market in a timely manner. Counterparty credit risk is the risk that the counterparty will not be able to fulfill its obligation to the Fund. Counterparty credit risk related to exchange-traded futures contracts may be mitigated by the protection provided by the exchange on which they trade.
Investing in derivatives may involve greater risks than investing in the underlying assets directly and, to varying degrees, may involve risk of loss in excess of any initial investment and collateral received and amounts recognized in the Statement of Assets and Liabilities. In addition, there may be the risk that the change in value of the derivative contract does not correspond to the change in value of the underlying instrument.
Futures Contracts. A futures contract is an agreement between two parties to buy or sell a specified underlying instrument for a fixed price at a specified future date. The Fund used futures contracts to manage its exposure to the stock market.
Upon entering into a futures contract, a fund is required to deposit either cash or securities (initial margin) with a clearing broker in an amount equal to a certain percentage of the face value of the contract. Futures contracts are marked-to-market daily and subsequent daily payments (variation margin) are made or received by a fund depending on the daily fluctuations in the value of the futures contracts and are recorded as unrealized appreciation or (depreciation). This receivable and/or payable, if any, is included in daily variation margin on futures contracts in the Statement of Assets and Liabilities. Realized gain or (loss) is recorded upon the expiration or closing of a futures contract. The net realized gain (loss) and change in net unrealized appreciation (depreciation) on futures contracts during the period is presented in the Statement of Operations.
Any open futures contracts at period end are presented in the Schedule of Investments under the caption "Futures Contracts". The notional amount at value reflects each contract's exposure to the underlying instrument or index at period end and is representative of volume of activity during the period. Securities deposited to meet initial margin requirements are identified in the Schedule of Investments.
5. Purchases and Sales of Investments.
Purchases and sales of securities, other than short-term securities, aggregated $1,025,226,489 and $1,065,512,677, respectively.
6. Fees and Other Transactions with Affiliates.
Management Fee and Expense Contract. FMR Co., Inc. (the investment adviser), an affiliate of FMR, provides the Fund with investment management services. The Fund does not pay any fees for these services. Pursuant to the Fund's management contract with the investment adviser, FMR pays the investment adviser a portion of the management fees it receives from the Investing Funds. In addition, under an expense contract, FMR also pays all other expenses of the Fund, excluding custody fees, the compensation of the independent Directors, and certain miscellaneous expenses such as proxy and shareholder meeting expenses.
Brokerage Commissions. The Fund placed a portion of its portfolio transactions with brokerage firms which are affiliates of the investment adviser. Brokerage commissions are included in net realized gain (loss) and change in net unrealized appreciation (depreciation) in the Statement of Operations. The commissions paid to these affiliated firms were $4,635 for the period.
Interfund Lending Program. Pursuant to an Exemptive Order issued by the SEC, the Fund, along with other registered investment companies having management contracts with FMR or other affiliated entities of FMR, may participate in an interfund lending program. This program provides an alternative credit facility allowing the funds to borrow from, or lend money to, other participating affiliated funds. At period end, there were no interfund loans outstanding. The Fund's activity in this program during the period for which loans were outstanding was as follows:
| Borrower or Lender | Average Loan Balance | Weighted Average Interest Rate | Interest Expense |
| Borrower | $83,897,000 | 2.45% | $22,792 |
Interfund Trades. The Fund may purchase from or sell securities to other Fidelity Funds under procedures adopted by the Board. The procedures have been designed to ensure these interfund trades are executed in accordance with Rule 17a-7 of the 1940 Act. Interfund trades are included within the respective purchases and sales amounts shown in the Purchases and Sales of Investments note.
7. Security Lending.
The Fund lends portfolio securities through a lending agent from time to time in order to earn additional income. For equity securities, a lending agent is used and may loan securities to certain qualified borrowers, including Fidelity Capital Markets (FCM), a broker-dealer affiliated with the Fund. On the settlement date of the loan, the Fund receives collateral (in the form of U.S. Treasury obligations, letters of credit and/or cash) against the loaned securities and maintains collateral in an amount not less than 100% of the market value of the loaned securities during the period of the loan. The market value of the loaned securities is determined at the close of business of the Fund and any additional required collateral is delivered to the Fund on the next business day. The Fund or borrower may terminate the loan at any time, and if the borrower defaults on its obligation to return the securities loaned because of insolvency or other reasons, the Fund may apply collateral received from the borrower against the obligation. The Fund may experience delays and costs in recovering the securities loaned. Any cash collateral received is invested in the Fidelity Securities Lending Cash Central Fund. The value of loaned securities and cash collateral at period end are disclosed on the Fund's Statement of Assets and Liabilities. Security lending income represents the income earned on investing cash collateral, less rebates paid to borrowers and any lending agent fees associated with the loan, plus any premium payments received for lending certain types of securities. Security lending income is presented in the Statement of Operations as a component of income from Fidelity Central Funds. Total security lending income during the period amounted to $227,774. During the period, there were no securities loaned to FCM.
8. Other.
The Fund's organizational documents provide former and current directors and officers with a limited indemnification against liabilities arising in connection with the performance of their duties to the Fund. In the normal course of business, the Fund may also enter into contracts that provide general indemnifications. The Fund's maximum exposure under these arrangements is unknown as this would be dependent on future claims that may be made against the Fund. The risk of material loss from such claims is considered remote.
At the end of the period, mutual funds managed by the investment adviser or its affiliates were the owners of record of all of the outstanding shares of the Fund.
Shareholder Expense Example
As a shareholder of the Fund, you incur two types of costs: (1) transaction costs and (2) ongoing costs, including other Fund expenses. This Example is intended to help you understand your ongoing costs (in dollars) of investing in the Fund and to compare these costs with the ongoing costs of investing in other mutual funds.
The Example is based on an investment of $1,000 invested at the beginning of the period and held for the entire period (October 1, 2018 to March 31, 2019).
Actual Expenses
The first line of the accompanying table provides information about actual account values and actual expenses. You may use the information in this line, together with the amount you invested, to estimate the expenses that you paid over the period. Simply divide your account value by $1,000.00 (for example, an $8,600 account value divided by $1,000.00 = 8.6), then multiply the result by the number in the first line under the heading entitled "Expenses Paid During Period" to estimate the expenses you paid on your account during this period. In addition, the Fund, as a shareholder in the underlying Fidelity Central Funds, will indirectly bear its pro-rata share of the fees and expenses incurred by the underlying Fidelity Central Funds. These fees and expenses are not included in the Fund's annualized expense ratio used to calculate the expense estimate in the table below.
Hypothetical Example for Comparison Purposes
The second line of the accompanying table provides information about hypothetical account values and hypothetical expenses based on the Fund's actual expense ratio and an assumed rate of return of 5% per year before expenses, which is not the Fund's actual return. The hypothetical account values and expenses may not be used to estimate the actual ending account balance or expenses you paid for the period. You may use this information to compare the ongoing costs of investing in the Fund and other funds. To do so, compare this 5% hypothetical example with the 5% hypothetical examples that appear in the shareholder reports of the other funds. In addition, the Fund, as a shareholder in the underlying Fidelity Central Funds, will indirectly bear its pro-rata share of the fees and expenses incurred by the underlying Fidelity Central Funds. These fees and expenses are not included in the Fund's annualized expense ratio used to calculate the expense estimate in the table below.
Please note that the expenses shown in the table are meant to highlight your ongoing costs only and do not reflect any transaction costs. Therefore, the second line of the table is useful in comparing ongoing costs only, and will not help you determine the relative total costs of owning different funds.
| Annualized Expense Ratio-A | Beginning Account Value October 1, 2018 | Ending Account Value March 31, 2019 | Expenses Paid During Period-B October 1, 2018 to March 31, 2019 |
|
| Actual | .0142% | $1,000.00 | $952.90 | $.07 |
| Hypothetical-C | $1,000.00 | $1,024.86 | $.07 |
A Annualized expense ratio reflects expenses net of applicable fee waivers.
B Expenses are equal to the Fund's annualized expense ratio, multiplied by the average account value over the period, multiplied by 182/365 (to reflect the one-half year period).
C 5% return per year before expenses
Board Approval of Investment Advisory Contracts and Management Fees
Fidelity International Equity Central Fund
Each year, the Board of Directors, including the Independent Directors (together, the Board), votes on the renewal of the management contract with FMR Co., Inc. (FMRC) and the sub-advisory agreements (together, the Advisory Contracts) for the fund. FMRC and the sub-advisers are referred to herein as the Investment Advisers. The Board, assisted by the advice of fund counsel and Independent Directors' counsel, requests and considers a broad range of information relevant to the renewal of the Advisory Contracts throughout the year.
The Board meets regularly and, at each of its meetings, covers an extensive agenda of topics and materials and considers factors that are relevant to its annual consideration of the renewal of the fund's Advisory Contracts, including the services and support provided to the fund and its shareholders. The Board has established various standing committees (Committees), each composed of and chaired by Independent Directors with varying backgrounds, to which the Board has assigned specific subject matter responsibilities in order to enhance effective decision-making by the Board. The Board, acting directly and through its Committees, requests and receives information concerning the annual consideration of the renewal of the fund's Advisory Contracts. The Board also meets as needed to review matters specifically related to the Board's annual consideration of the renewal of the Advisory Contracts. Members of the Board may also meet with trustees of other Fidelity funds through joint ad hoc committees to discuss certain matters relevant to all of the Fidelity funds.
At its January 2019 meeting, the Board unanimously determined to renew the fund's Advisory Contracts. In reaching its determination, the Board considered all factors it believed relevant and reached a determination, with the assistance of fund counsel and Independent Directors' counsel and through the exercise of its business judgment, that the renewal of the Advisory Contracts was in the best interests of the fund and its shareholders and the fact that no fee is payable under the management contract was fair and reasonable.
Nature, Extent, and Quality of Services Provided. The Board considered Fidelity's staffing as it relates to the fund, including the backgrounds of investment personnel of Fidelity, and also considered the fund's investment objective, strategies, and related investment philosophy. The Independent Directors also had discussions with senior management of Fidelity's investment operations and investment groups. The Board considered the structure of the investment personnel compensation program and whether this structure provides appropriate incentives to act in the best interests of the fund. Resources Dedicated to Investment Management and Support Services. The Board and the Fund Oversight and Research Committees reviewed the general qualifications and capabilities of Fidelity's investment staff, including its size, education, experience, and resources, as well as Fidelity's approach to recruiting, training, managing, and compensating investment personnel. The Board noted that Fidelity has continued to increase the resources devoted to non-U.S. offices, including expansion of Fidelity's global investment organization. The Board also noted that Fidelity's analysts have extensive resources, tools and capabilities that allow them to conduct sophisticated quantitative and fundamental analysis, as well as credit analysis of issuers, counterparties and guarantors. Further, the Board considered that Fidelity's investment professionals have sufficient access to global information and data so as to provide competitive investment results over time, and that those professionals also have access to sophisticated tools that permit them to assess portfolio construction and risk and performance attribution characteristics continuously, as well as to transmit new information and research conclusions rapidly around the world. Additionally, in its deliberations, the Board considered Fidelity's trading, risk management, compliance, and technology and operations capabilities and resources, which are integral parts of the investment management process. Administrative Services. The Board considered (i) the nature, extent, quality, and cost of advisory and administrative services performed by the Investment Advisers and their affiliates under the Advisory Contracts and under separate agreements covering transfer agency, pricing and bookkeeping, and securities lending services for the fund; (ii) the nature and extent of the supervision of third party service providers, principally custodians, subcustodians, and pricing vendors; and (iii) the resources devoted to, and the record of compliance with, the fund's compliance policies and procedures. The Board also reviewed the allocation of fund brokerage, including allocations to brokers affiliated with the Investment Advisers, and the use of "soft" commission dollars to pay for research services. Investment Performance. The Board considered whether the fund has operated in accordance with its investment objective, as well as its record of compliance with its investment restrictions. The Board reviewed the fund's absolute investment performance, as well as the fund's relative investment performance, but did not consider performance to be a material factor in its decision to renew the fund's Advisory Contracts, as the fund is not publicly offered as a stand-alone investment product. In this regard, the Board noted that the fund is designed to offer a liquid investment option for other investment companies managed by Fidelity and ultimately to enhance the performance of those investment companies.Based on its review, the Board concluded that the nature, extent, and quality of services provided to the fund under the Advisory Contracts should continue to benefit the shareholders of the fund. Competitiveness of Management Fee and Total Expense Ratio. The Board considered that while the fund does not pay a management fee, Fidelity Management & Research Company (FMR) pays a management fee on behalf of the fund and receives fees for providing services to funds that invest in the fund. The Board also noted that FMR bears all expenses of the fund with certain exceptions. Based on its review, the Board concluded that the management fee paid on behalf of the fund and the fund's total expense ratio were reasonable in light of the services that the fund and its shareholders receive and the other factors considered. Costs of the Services and Profitability. The Board considered the level of Fidelity's profits in respect of all the Fidelity funds, as well as the profitability of the funds that invest in the fund.PricewaterhouseCoopers LLP (PwC), auditor to Fidelity and certain Fidelity funds, has been engaged annually by the Board as part of the Board's assessment of Fidelity's profitability analysis. PwC's engagement includes the review and assessment of the methodologies used by Fidelity in determining the revenues and expenses attributable to Fidelity's mutual fund business, and completion of agreed-upon procedures in respect of the mathematical accuracy of the fund profitability information and its conformity to established allocation methodologies. After considering PwC's reports issued under the engagement and information provided by Fidelity, the Board concluded that while other allocation methods may also be reasonable, Fidelity's profitability methodologies are reasonable in all material respects.The Board also reviewed Fidelity's non-fund businesses and potential indirect benefits such businesses may have received as a result of their association with Fidelity's mutual fund business (i.e., fall-out benefits) as well as cases where Fidelity's affiliates may benefit from the fund's business. The Board noted that changes to fall-out benefits year-over-year reflect business developments at Fidelity's various businesses.The Board concluded that the costs of the services provided by and the profits realized by Fidelity in connection with the operation of the fund were not relevant to the renewal of the Advisory Contracts because the fund pays no advisory fees and FMR bears all expenses of the fund with certain exceptions. Economies of Scale. The Board concluded that because the fund pays no advisory fees and FMR bears all expenses of the fund with certain exceptions, the realization of economies of scale was not a material factor in the Board's decision to renew the fund's Advisory Contract. Additional Information Requested by the Board. In order to develop fully the factual basis for consideration of the Fidelity funds' advisory contracts, the Board requested and received additional information on certain topics, including: (i) fund performance trends, in particular the underperformance of certain funds, and Fidelity's long-term strategies for certain funds; (ii) Fidelity's fund profitability methodology, profitability trends for certain funds, and the impact of certain factors on fund profitability results; (iii) metrics for evaluating index fund and ETF performance and information about ETF trading characteristics; (iv) the methodology with respect to the evaluation of competitive fund data and peer group classifications and fee comparisons; (v) the expense structures for different funds and classes; (vi) information regarding other accounts managed by Fidelity, including collective investment trusts; and (vii) Fidelity's philosophies and strategies for evaluating funds and classes with lower or declining asset levels.Based on its evaluation of all of the conclusions noted above, and after considering all factors it believed relevant, the Board concluded that the advisory fee arrangements are fair and reasonable, and that the fund's Advisory Contracts should be renewed.
![]()
INTCEN-SANN-0519
1.859211.111
Item 2.
Code of Ethics
Not applicable.
Item 3.
Audit Committee Financial Expert
Not applicable.
Item 4.
Principal Accountant Fees and Services
Not applicable.
Item 5.
Audit Committee of Listed Registrants
Not applicable.
Item 6.
Investments
(a)
Not applicable.
(b)
Not applicable
Item 7.
Disclosure of Proxy Voting Policies and Procedures for Closed-End Management Investment Companies
Not applicable.
Item 8.
Portfolio Managers of Closed-End Management Investment Companies
Not applicable.
Item 9.
Purchase of Equity Securities by Closed-End Management Investment Company and Affiliated Purchasers
Not applicable.
Item 10.
Submission of Matters to a Vote of Security Holders
There were no material changes to the procedures by which shareholders may recommend nominees to the Fidelity Central Investment Portfolios LLC’s Board of Trustees.
Item 11.
Controls and Procedures
(a)(i) The President and Treasurer and the Chief Financial Officer have concluded that the Fidelity Central Investment Portfolios LLC’s (the “Trust”) disclosure controls and
procedures (as defined in Rule 30a-3(c) under the Investment Company Act) provide reasonable assurances that material information relating to the Trust is made known to them by the appropriate persons, based on their evaluation of these controls and procedures as of a date within 90 days of the filing date of this report.
(a)(ii) There was no change in the Trust’s internal control over financial reporting (as defined in Rule 30a-3(d) under the Investment Company Act) that occurred during the period covered by this report that has materially affected, or is reasonably likely to materially affect, the Trust’s internal control over financial reporting.
Item 12.
Disclosure of Securities Lending Activities for Closed-End Management
Investment Companies
Not applicable.
Item 13.
Exhibits
(a) | (1) | Not applicable. |
(a) | (2) | Certification pursuant to Rule 30a-2(a) under the Investment Company Act of 1940 (17 CFR 270.30a-2(a)) is filed and attached hereto as Exhibit 99.CERT. |
(a) | (3) | Not applicable. |
(b) | Certification pursuant to Rule 30a-2(b) under the Investment Company Act of 1940 (17 CFR 270.30a-2(b)) is furnished and attached hereto as Exhibit 99.906CERT. |
SIGNATURES
Pursuant to the requirements of the Securities Exchange Act of 1934 and the Investment Company Act of 1940, the registrant has duly caused this report to be signed on its behalf by the undersigned, thereunto duly authorized.
Fidelity Central Investment Portfolios LLC
By: | /s/Stacie M. Smith |
Stacie M. Smith | |
President and Treasurer | |
Date: | May 24, 2019 |
Pursuant to the requirements of the Securities Exchange Act of 1934 and the Investment Company Act of 1940, this report has been signed below by the following persons on behalf of the registrant and in the capacities and on the dates indicated.
By: | /s/Stacie M. Smith |
Stacie M. Smith | |
President and Treasurer | |
Date: | May 24, 2019 |
By: | /s/John J. Burke III |
John J. Burke III | |
Chief Financial Officer | |
Date: | May 24, 2019 |